JEFFERIES FINANCIAL GROUP INC.
10-Ks and 10-Qs
|
|
|
|
|
|
|
|
|
|
|
|
|
|
|
|
|
|
|
|
|
|
|
|
|
|
|
|
|
|
|
|
|
|
|
|
|
|
|
|
|
|
|
|
|
|
|
|
|
|
SECURITIES AND EXCHANGE COMMISSION
WASHINGTON, D.C. 20549
______________________
FORM 10-K
|
[x]
|
ANNUAL REPORT PURSUANT TO SECTION 13 OR 15(d) OF THE SECURITIES EXCHANGE ACT OF 1934
|
|
|
For the fiscal year ended December 31, 2009
|
or
|
[_]
|
TRANSITION REPORT PURSUANT TO SECTION 13 OR 15(d) OF THE SECURITIES EXCHANGE ACT OF 1934
|
|
|
For the transition period from ___________ to ___________
|
Commission file number: 1-5721
LEUCADIA NATIONAL CORPORATION
(Exact Name of Registrant as Specified in its Charter)
|
New York
|
13-2615557
|
|
(State or Other Jurisdiction of Incorporation or Organization)
|
(I.R.S. Employer Identification No.)
|
315 Park Avenue South, N
ew York, New York 10010
(212) 460-1900
(Address, Including Zip Code, and Telephone Number, Including Area Code, of Registrant’s Principal Executive Offices)
Securities registered pursuant to Section 12(b) of the Act:
|
Title of Each Class
|
Name of Each Exchange on Which Registered
|
|
Common Shares, par value $1 per share
|
New York Stock Exchange
|
|
7-3/4% Senior Notes due August 15, 2013
|
New York Stock Exchange
|
Securities registered pursuant to Section 12(g) of the Act:
None.
(Title of Class)
Indicate by check mark if the registrant is a well-known seasoned issuer, as defined in Rule 405 of the Securities Act. Yes [x] No [ ]
Indicate by check mark if the registrant is not required to file reports pursuant to Section 13 or Section 15(d) of the Act. Yes [ ] No [x]
Indicate by check mark whether the registrant: (1) has filed all reports required to be filed by Section 13 or 15(d) of the Securities Exchange Act of 1934 during the preceding 12 months (or for such shorter period that the registrant was required to file such reports), and (2) has been subject to such filing requirements for the past 90 days. Yes [x] No [ ]
Indicate by check mark whether the registrant has submitted electronically and posted on its corporate Web site, if any, every Interactive Data File required to be submitted and posted pursuant to Rule 405 of Regulation S-T (§ 232.405 of this chapter) during the preceding 12 months (or for such shorter period that the registrant was required
to submit and post such files).Yes [x] No [ ]
Indicate by check mark if disclosure of delinquent filers pursuant to Item 405 of Regulation S-K is not contained herein, and will not be contained, to the best of registrant’s knowledge, in definitive proxy or information statement incorporated by reference in Part III of this Form 10-K or any amendment to this Form 10-K. [x]
Indicate by check mark whether the registrant is a large accelerated filer, an accelerated filer, a non-accelerated filer, or a smaller reporting company. See definitions of “large accelerated filer," "accelerated filer,” and "smaller reporting company" in Rule 12b-2 of the Exchange Act. (Check one):
|
Large accelerated filer [x]
|
Accelerated filer [ ]
|
|
Non-accelerated filer [ ]
|
Smaller reporting company [ ]
|
Indicate by check mark whether the registrant is a shell company (as defined in Rule 12b-2 of the Exchange Act). Yes [ ] No [x]
Aggregate market value of the voting stock of the registrant held by non-affiliates of the registrant at June 30, 2009 (computed by reference to the last reported closing sale price of the Common Shares on the New York Stock Exchange on such date): $4,063,021,000.
On February 16, 2010, the registrant had outstanding 243,288,154 Common Shares.
DOCUMENTS INCORPORATED BY REFERENCE:
Certain portions of the registrant’s definitive proxy statement pursuant to Regulation 14A of the Securities Exchange Act of 1934 in connection with the 2010 annual meeting of shareholders of the registrant are incorporated by reference into Part III of this Report.
1
The Company
The Company is a diversified holding company engaged in a variety of businesses, including manufacturing, telecommunications, land based contract oil and gas drilling, property management and services, gaming entertainment, real estate activities, medical product development and winery operations. The Company also has significant
investments in the common stock of two public companies that are accounted for at fair value, one of which is a full service investment bank and the other an independent auto finance company. The Company also owns equity interests in operating businesses and investment partnerships which are accounted for under the equity method of accounting, including a broker-dealer engaged in making markets and trading of high yield and special situation securities and an operating copper mine in Spain. The
Company concentrates on return on investment and cash flow to maximize long-term shareholder value. Additionally, the Company continuously evaluates the retention and disposition of its existing operations and investigates possible acquisitions of new businesses. In identifying possible acquisitions, the Company tends to seek assets and companies that are out of favor or troubled and, as a result, are selling substantially below the values the Company believes to be present.
The worldwide recession, turmoil in public securities markets and lack of liquidity in the credit markets have put a strain on many businesses and caused great uncertainty about asset values in nearly all industry sectors. If these economic and market conditions continue for some time, the Company expects that some extraordinary
investment opportunities will be available. However, it also expects that financing these investment opportunities may be difficult. The Company has available liquidity on its balance sheet and could dispose of existing businesses or investments if additional internal liquidity is needed to take advantage of investment opportunities. Although no assurance can be given that the Company will be successful in acquiring new businesses, making new investments or in raising sufficient
capital for any such opportunities, the Company does intend to pursue those opportunities that it considers to be the most compelling.
Shareholders’ equity has grown from a deficit of $7,700,000 at December 31, 1978 (prior to the acquisition of a controlling interest in the Company by the Company’s Chairman and President), to a positive shareholders’ equity of $4,361,600,000 at December 31, 2009, equal to a book value per common share of the Company
(a “common share”) of negative $.04 at December 31, 1978 and $17.93 at December 31, 2009. Shareholders’ equity and book value per share amounts have been reduced by the $811,900,000 special cash dividend paid in 1999.
In December 2009, Berkadia Commercial Mortgage LLC (“Berkadia”), a joint venture between Berkshire Hathaway Inc. (“Berkshire Hathaway”) and the Company, acquired the North American commercial mortgage origination and servicing business of Capmark Financial Group Inc. (“Capmark”). The Company
and Berkshire Hathaway each have a 50% equity interest in Berkadia, and each party contributed $217,200,000 of equity capital.
The Company’s manufacturing operations are conducted through Idaho Timber, LLC (“Idaho Timber”) and Conwed Plastics, LLC (“Conwed Plastics”). Acquired in May 2005, Idaho Timber is headquartered in Boise, Idaho and primarily remanufactures dimension lumber and remanufactures, packages and/or produces
other specialized wood products. Conwed Plastics manufactures and markets lightweight plastic netting used for a variety of purposes including, among other things, building and construction, erosion control, packaging, agricultural, carpet padding, filtration and consumer products.
2
The Company’s telecommunications operations are conducted through its 75% owned subsidiary, STi Prepaid, LLC (“STi Prepaid”), which acquired the assets of Telco Group, Inc. and its affiliates (“Telco”) in March 2007. STi Prepaid is a provider of international prepaid phone cards and other telecommunications
services in the U.S.
The Company’s
land based
contract oil and gas drilling
operations are conducted by Keen Energy Services, LLC (“Keen”), formerly known as Goober Drilling, LLC. In November 2009,
the Company acquired the remaining equity interests in Keen that it did not previously own and Keen became a consolidated subsidiary.
The Company’s property management and services operations are conducted through ResortQuest International, Inc. (“ResortQuest”). Acquired in June 2007, ResortQuest is engaged in offering property management and other services to vacation properties in beach and mountain resort locations in the continental U.S.
The Company’s gaming entertainment operations are conducted through its controlling interest in Premier Entertainment Biloxi, LLC (“Premier”), which is the owner of the Hard Rock Hotel & Casino Biloxi (“Hard Rock Biloxi”), located in Biloxi, Mississippi.
The Company’s domestic real estate operations include a mixture of commercial properties, residential land development projects and other unimproved land, all in various stages of development.
The Company’s medical product development operation is conducted through Sangart, Inc. (“Sangart”), which became a majority-owned subsidiary in 2005. Sangart is developing a product called MP4OX, formerly known as Hemospan®, which is a solution of cell-free hemoglobin administered intravenously to provide
rapid oxygen delivery to oxygen deprived tissues.
The Company’s winery operations consist of Pine Ridge Vineyards in Napa Valley, California, Archery Summit in the Willamette Valley of Oregon, Chamisal Vineyards in the Edna Valley of California and a vineyard development project in the Columbia Valley of Washington. The wineries primarily produce and sell wines in the
premium, ultra premium and luxury segments of the premium table wine market.
The Company owns approximately 25% of the outstanding common shares of AmeriCredit Corp. (“ACF”), a company listed on the New York Stock Exchange, Inc. (“NYSE”) (Symbol: ACF). ACF is an independent auto finance company that is in the business of purchasing and servicing automobile sales finance contracts,
historically for consumers who are typically unable to obtain financing from other sources. The Company accounts for its investment in ACF at fair value, which was $639,800,000 at December 31, 2009 market prices; unrealized gains or losses are reflected in the Company’s consolidated statements of operations.
The Company owns approximately 29% of the outstanding common shares of Jefferies Group, Inc. (“Jefferies”), a company listed on the NYSE (Symbol: JEF). Jefferies is a full-service global investment bank and institutional securities firm serving companies and their investors. The Company accounts for its investment
in Jefferies at fair value, which was $1,152,900,000 at December 31, 2009 market prices; unrealized gains or losses are reflected in the Company’s consolidated statements of operations.
In 2007, the Company and Jefferies expanded and restructured the Company’s equity investment in Jefferies Partners Opportunity Fund II, LLC (“JPOF II”) and formed Jefferies High Yield Holdings, LLC (“JHYH”). Through its wholly-owned subsidiary, JHYH makes markets in high yield and special situation
securities and provides research coverage on these types of securities.
3
The Company owns 30% of Cobre Las Cruces, S.A. (“CLC”), a former subsidiary of the Company that owns the Las Cruces copper mine in the Pyrite Belt of Spain. During 2005, the Company sold a 70% interest in CLC to Inmet Mining Corporation (“Inmet”), a Canadian-based global mining company, in exchange for
5,600,000 newly issued Inmet common shares, representing approximately 9.98% of Inmet’s current outstanding common shares. CLC is currently producing copper cathode and expects to reach commercial production (approximately 60% of design capacity) in May 2010. The market value of the Inmet common shares was $339,100,000 at December 31, 2009.
In August 2006, pursuant to a subscription agreement with Fortescue Metals Group Ltd (“Fortescue”) and its subsidiary, FMG Chichester Pty Ltd (“FMG”), the Company invested in Fortescue’s Pilbara iron ore and infrastructure project in Western Australia. Fortescue is a publicly traded company on the
Australian Stock Exchange (Symbol: FMG); after considering the sale of 30,000,000 common shares for net cash proceeds of $121,500,000 during the first quarter of 2010, the Company currently owns 247,986,000 common shares of Fortescue (approximately 8% of the outstanding shares). The Company also owns a $100,000,000 note of FMG that matures in August 2019; interest on the note is calculated as 4% of the revenue, net of government royalties, invoiced from the iron ore produced from two specified
project areas. The market value of the Fortescue common shares was $1,108,000,000 at December 31, 2009, including the shares sold in 2010.
The Company and certain of its subsidiaries have substantial federal net operating loss carryforwards (“NOLs”) of approximately $5,985,000,000 at December 31, 2009. The Company has recorded a valuation allowance to fully reserve for substantially all of its net deferred tax asset, which includes the NOLs.
As used herein, the term “Company” refers to Leucadia National Corporation, a New York corporation organized in 1968, and its subsidiaries, except as the context otherwise may require.
Investor Information
The Company is subject to the informational requirements of the Securities Exchange Act of 1934 (the “Exchange Act”). Accordingly, the Company files periodic reports, proxy statements and other information with the Securities and Exchange Commission (the “SEC”). Such reports, proxy statements
and other information may be obtained by visiting the Public Reference Room of the SEC at 100 F Street, N.E., Washington, D.C. 20549 or by calling the SEC at 1-800-SEC-0330. In addition, the SEC maintains an Internet site
(
www.sec.gov)
that contains reports, proxy and information statements and other information regarding the Company and other issuers that file electronically. Material
filed by the Company can also be inspected at the offices of the NYSE, 20 Broad Street, New York, NY 10005, on which the Company’s common shares are listed. The Company has submitted to the NYSE a certificate of the Chief Executive Officer of the Company, dated May 11, 2009, certifying that he is not aware of any violations by the Company of NYSE corporate governance listing standards.
The Company’s website address is
www.leucadia.com
. The Company makes available, without charge through its website, copies of its annual report on Form 10-K, quarterly reports on Form 10-Q, current reports on Form 8-K and amendments to those reports filed
or furnished pursuant to Section 13(a) or 15(d) of the Exchange Act, as soon as reasonably practicable after such reports are filed with or furnished to the SEC.
Cautionary Statement for Forward-Looking Information
4
Statements included in this Report may contain forward-looking statements. Such statements may relate, but are not limited, to projections of revenues, income or loss, development expenditures, plans for growth and future operations, competition and regulation, as well as assumptions relating to the foregoing. Such
forward-looking statements are made pursuant to the safe-harbor provisions of the Private Securities Litigation Reform Act of 1995.
Forward-looking statements are inherently subject to risks and uncertainties, many of which cannot be predicted or quantified. When used in this Report, the words “estimates,” “expects,” “anticipates,” “believes,” “plans,” “intends” and variations of such
words and similar expressions are intended to identify forward-looking statements that involve risks and uncertainties. Future events and actual results could differ materially from those set forth in, contemplated by or underlying the forward-looking statements.
Factors that could cause actual results to differ materially from any results projected, forecasted, estimated or budgeted or may materially and adversely affect the Company’s actual results include, but are not limited to, those set forth in Item 1A. Risk Factors and elsewhere in this Report and in the Company’s other public
filings with the SEC.
Undue reliance should not be placed on these forward-looking statements, which are applicable only as of the date hereof. The Company undertakes no obligation to revise or update these forward-looking statements to reflect events or circumstances that arise after the date of this Report or to reflect the occurrence of unanticipated
events.
Financial Information about Segments
The Company’s reportable segments consist of the consolidated operating units identified above, which offer different products and services and are managed separately. While in bankruptcy, Premier was deconsolidated and classified as an investment in an associated company from September 2006 until August 2007. Premier
was once again consolidated upon its emergence from bankruptcy and has been reported as an operating segment since that date. Prior to its consolidation in November 2009, the Company’s investment in Keen was classified as an investment in an associated company. Other operations primarily consist of the Company’s wineries and energy projects.
Associated companies include equity interests in other entities that the Company accounts for under the equity method of accounting. Investments in associated companies that are accounted for under the equity method of accounting include HomeFed Corporation (“HomeFed”), a corporation engaged in real estate activities,
JHYH, Berkadia and CLC. In the past the Company has made non-controlling investments in investment partnerships that are engaged in investing and/or securities transactions activities which were accounted for under the equity method of accounting; however, the only remaining material investment of this kind is the Company’s interest in Pershing Square IV, L.P. (“Pershing Square”). Associated companies also include the Company’s investments in ACF and Jefferies, which
are accounted for at fair value rather than under the equity method of accounting.
Corporate assets primarily consist of investments and cash and cash equivalents and corporate revenues primarily consist of investment and other income and securities gains and losses. Corporate assets include the Company’s investment in Fortescue. Corporate assets, revenues, overhead expenses and interest
expense are not allocated to the operating units.
5
Conwed Plastics has manufacturing facilities located in Belgium and Mexico, and STi Prepaid has a customer care unit located in the Dominican Republic. These are the only foreign operations with non-U.S. revenue or assets that the Company consolidates, and are not material. Unconsolidated non-U.S. based investments
include 39% of Light and Power Holdings Ltd., the parent company of the principal electric utility in Barbados, a small Caribbean-based telecommunications provider, the 30% ownership in CLC and the investments in Fortescue and Inmet. From time to time the Company invests in the securities of non-U.S. entities or in investment partnerships that invest in non-U.S. securities.
Certain information concerning the Company’s segments is presented in the following table. Consolidated subsidiaries are reflected as of the date a majority controlling interest was acquired, which was November 2009 for Keen, June 2007 for ResortQuest and March 2007 for STi Prepaid. As discussed above, Premier
was deconsolidated in September 2006; Premier once again became a consolidated subsidiary in August 2007. Associated Companies are not considered to be a reportable segment, but are reflected in the table below under income (loss) from continuing operations before income taxes and identifiable assets employed.
|
2009
|
2008
|
2007
|
||||||||||
|
(In millions)
|
||||||||||||
|
Revenues and other income (a):
|
||||||||||||
|
Manufacturing:
|
||||||||||||
|
Idaho Timber
|
$ | 142.7 | $ | 235.3 | $ | 292.2 | ||||||
|
Conwed Plastics
|
82.1 | 106.0 | 105.4 | |||||||||
|
Telecommunications
|
426.1 | 452.4 | 363.2 | |||||||||
|
Oil and Gas Drilling Services
|
60.5 | – | – | |||||||||
|
Property Management and Services
|
117.2 | 142.0 | 81.5 | |||||||||
|
Gaming Entertainment
|
103.6 | 119.1 | 38.5 | |||||||||
|
Domestic Real Estate
|
30.6 | 15.1 | 13.4 | |||||||||
|
Medical Product Development
|
5.1 | .7 | 2.1 | |||||||||
|
Other Operations (b)
|
53.3 | 53.4 | 53.6 | |||||||||
|
Corporate (c)
|
97.8 | (43.3 | ) | 205.0 | ||||||||
|
Total consolidated revenues and other income
|
$ | 1,119.0 | $ | 1,080.7 | $ | 1,154.9 | ||||||
|
Income (loss) from continuing operations before income taxes:
|
||||||||||||
|
Manufacturing:
|
||||||||||||
|
Idaho Timber
|
$ | (12.7 | ) | $ | .8 | $ | 9.1 | |||||
|
Conwed Plastics
|
11.6 | 14.0 | 17.4 | |||||||||
|
Telecommunications
|
.4 | 11.9 | 18.4 | |||||||||
|
Oil and Gas Drilling Services
|
46.7 | – | – | |||||||||
|
Property Management and Services
|
.8 | (1.9 | ) | (6.5 | ) | |||||||
|
Gaming Entertainment
|
2.4 | 1.0 | (9.3 | ) | ||||||||
|
Domestic Real Estate
|
(71.3 | ) | (14.7 | ) | (8.3 | ) | ||||||
|
Medical Product Development
|
(23.8 | ) | (36.6 | ) | (36.5 | ) | ||||||
|
Other Operations (b)
|
(36.4 | ) | (40.4 | ) | (17.6 | ) | ||||||
|
Income (loss) related to Associated Companies
|
805.8 | (536.8 | ) | (31.2 | ) | |||||||
|
Corporate (c)
|
(168.7 | ) | (302.1 | ) | (27.9 | ) | ||||||
|
Total consolidated income (loss) from continuing operations
|
||||||||||||
|
before income taxes
|
$ | 554.8 | $ | (904.8 | ) | $ | (92.4 | ) | ||||
|
|
||||||||||||
|
Identifiable assets employed:
|
||||||||||||
|
Manufacturing:
|
||||||||||||
|
Idaho Timber
|
$ | 94.2 | $ | 118.3 | $ | 129.5 | ||||||
|
Conwed Plastics
|
67.9 | 78.5 | 88.8 | |||||||||
|
Telecommunications
|
92.0 | 107.7 | 81.9 | |||||||||
|
Oil and Gas Drilling Services
|
257.1 | – | – | |||||||||
|
Property Management and Services
|
49.8 | 55.2 | 62.8 | |||||||||
|
Gaming Entertainment
|
267.0 | 281.6 | 300.6 | |||||||||
|
Domestic Real Estate
|
311.6 | 409.7 | 306.3 | |||||||||
|
Medical Product Development
|
26.7 | 21.2 | 36.5 | |||||||||
|
Other Operations
|
517.9 | 290.1 | 255.5 | |||||||||
|
Investments in Associated Companies
|
2,764.9 | 2,006.6 | 1,362.9 | |||||||||
|
Corporate (d)
|
2,313.3 | 1,829.6 | 5,501.8 | |||||||||
|
Total consolidated assets
|
$ | 6,762.4 | $ | 5,198.5 | $ | 8,126.6 | ||||||
6
|
(a)
|
Revenues and other income for each segment include amounts for services rendered and products sold, as well as segment reported amounts classified as investment and other income and net securities gains (losses) in the Company’s consolidated statements of operations.
|
|
|
(b)
|
Other operations include pre-tax losses of $25,300,000, $33,300,000 and $12,300,000 for the years ended December 31, 2009, 2008 and 2007, respectively, for investigation and evaluation of various energy related projects. There were no material operating revenues or identifiable assets associated with these activities in any period; however, other income includes $8,500,000 in 2007 related to the termination
of a joint development agreement with another party.
|
|
(c)
|
Net securities gains (losses) for Corporate aggregated $(21,100,000), $(144,500,000) and $92,700,000 during 2009, 2008 and 2007, respectively. Corporate net securities gains (losses) are net of impairment charges of $31,400,000, $143,400,000 and $36,800,000 during 2009, 2008 and 2007, respectively. In 2007, security gains include a gain of $37,800,000 from the sale of Eastman Chemical Company.
|
|
(d)
|
During the year ended December 31, 2008, the Company increased its deferred tax valuation allowance by $1,672,100,000 to reserve for substantially all of the net deferred tax asset.
|
|
(e)
|
For the years ended December 31, 2009, 2008 and 2007, income (loss) from continuing operations reflects depreciation and amortization expenses of $81,000,000, $70,500,000 and $51,200,000, respectively; such amounts are primarily comprised of Corporate ($18,400,000, $13,600,000 and $9,700,000, respectively), manufacturing ($17,100,000, $17,300,000 and $18,000,000, respectively, including amounts classified as cost
of sales), gaming entertainment ($16,500,000, $17,000,000 and $6,300,000, respectively), domestic real estate ($8,400,000, $7,600,000 and $3,800,000, respectively), property management and services ($3,600,000, $4,600,000 and $3,100,000, respectively), telecommunications ($4,100,000, $1,400,000 and $500,000, respectively), other operations ($8,900,000, $8,300,000 and $9,000,000, respectively, including amounts classified as cost of sales), and oil and gas drilling services ($3,100,000 in 2009). Depreciation
and amortization expenses for the other segment are not material.
|
|
(f)
|
For the years ended December 31, 2009, 2008 and 2007, income (loss) from continuing operations reflects interest expense of $128,800,000, $145,500,000 and $111,500,000, respectively; such amounts are primarily comprised of Corporate ($125,700,000, $140,000,000 and $110,800,000, respectively), domestic real estate ($2,300,000 and $4,400,000 in 2009 and 2008, respectively) and gaming entertainment ($500,000, $900,000
and $500,000, respectively). Interest expense for other segments is not material.
|
At December 31, 2009, the Company and its consolidated subsidiaries had 3,340 full-time employees.
Manufacturing
Idaho Timber
Business Description
Idaho Timber, which was acquired in May 2005, is headquartered in Boise, Idaho and is engaged in the manufacture and/or distribution of various wood products. Idaho Timber’s principal product lines include remanufacturing dimension lumber; remanufacturing, bundling and bar coding of home center boards for large retailers;
and production of 5/4” radius-edge, pine decking. Idaho Timber also manufactures and/or distributes a number of other specialty wood products. Idaho Timber has over 30 years of operating experience in its industry. The net book value of the Company’s investment in Idaho Timber was $88,100,000 at December 31, 2009.
7
Remanufactured dimension lumber is Idaho Timber’s largest product line. Dimension lumber is used for general construction and home improvement, remodeling and repair projects, the demand for which is normally a function of housing starts and home size. All dimension lumber is assigned a quality grade, based
on the imperfections in the wood, and higher-grade lumber is sold at a higher price than lower-grade lumber. Idaho Timber purchases low-grade dimension lumber from sawmills located in North America and Europe and upgrades it into higher-grade dimension lumber products. The remanufacturing process includes ripping, trimming and planing lumber to reduce imperfections and produce a variety of lumber sizes. These products are produced at plants located in Florida, North Carolina,
Texas, Idaho and New Mexico. Each plant distributes its product primarily by truck to lumber yards and contractors within a 300 mile shipping radius from the plant site.
Home center board products are principally sold to large home improvement retailers. Idaho Timber purchases high-grade boards from sawmills in the western U.S., South America and New Zealand (primarily pine but other wood species are also used), performs minor re-work on those boards to upgrade the quality, and then packages
and bar codes those boards according to customer specifications. Production takes place in an owned plant in Idaho. Idaho Timber also operates a sawmill in Arkansas to produce its 5/4” radius-edge, pine decking products. Idaho Timber performs traditional sawmill processes (cutting, drying and planing) to manufacture these products.
Idaho Timber owns and operates seven plants, one sawmill that principally produces decking products and one sawmill that produces split-rail fencing. These nine facilities in the aggregate have approximately 746,000 square feet of manufacturing and office space, covering approximately 154 acres. One plant is principally
dedicated to home center board products and the remaining plants principally produce remanufactured dimension lumber products. All plant locations can produce and distribute specialty wood products. Idaho Timber has the capacity to ship approximately 62 million board feet per month on a one shift basis; during 2009 actual shipments averaged approximately 31 million board feet per month.
Sales and Marketing
Idaho Timber primarily markets to local, regional and national lumber retailers for its dimension lumber products, home improvement centers for its home center board products and decking treaters for its sawmill product, and other resellers of home construction materials. Its success in attracting and retaining customers depends
in large part on its ability to provide quicker delivery of specified customer products than its competitors. For dimension lumber products, sales are primarily generated at each of the plants, with a dedicated sales force located in the same geographic region as the customers the plant serves. Board and decking products are sold and managed centrally. Sales of home center board product were heavily dependent on national home center chains which accounted for approximately 87%
of product revenues and 21% of Idaho Timber’s total revenue for the year ended December 31, 2009.
The customer base for the dimension lumber business is much less concentrated; no customer accounts for more than 10% of revenue. Idaho Timber’s sales are somewhat concentrated in regions where its facilities are located, with the largest being Florida, 16%; North Carolina, 14%; and Texas, 11%.
8
Competition
Idaho Timber sells commodity products, and operates in an industry that is currently oversupplied and very competitive. Idaho Timber competes against domestic and foreign sawmills and intermediate distributors for its dimension lumber and decking products. In some cases, Idaho Timber competes on a limited basis with
the same sawmills that are a source of supply of low-grade dimension lumber. The home center board business has many competitors, and suppliers to large home centers are always under pressure to reduce prices.
Idaho Timber also competes for raw material purchases needed for its remanufactured dimension lumber and home center board products, and in the past the availability and pricing of certain raw materials has been adversely affected by export charges (tariffs) imposed on Canadian exports, the largest source of these supplies. A
decades old trade dispute between the U.S. and Canada resurfaced with the expiration of the Softwood Lumber Agreement in 2001. In October 2006, the trade dispute was resolved and a new Softwood Lumber Agreement between Canada and the U.S. became effective. The agreement has a seven year term and may be extended for an additional two years. Currently, restrictions on Canadian exports are not significantly adversely affecting Idaho Timber’s operations; however, if tariffs
continue beyond the current term of the Softwood Lumber Agreement or further import limitations are imposed in the future, it is possible that raw material costs could increase or supplies could be constrained. During 2009, the export charge was at the maximum level for the entire year. Idaho Timber is examining alternative sources of supply to increase its raw material purchasing flexibility.
Government Regulation
Lumber and decking are identified at Idaho Timber facilities with a grade stamp that shows the grade, moisture content, mill number, species and grading agency. All lumber is graded in compliance with the National Grading Rule for Dimension Lumber, which is published by the U.S. Department of Commerce. Idaho Timber
facilities are subject to regular inspection by agencies approved by the American Lumber Standards Committee. Idaho Timber believes that its procedure for grading lumber is highly accurate; however, Idaho Timber could be exposed to product liability claims if it can be demonstrated its products are inappropriately rated.
Since Idaho Timber’s sawmills do not treat its wood with chemicals, and since timber deeds purchased from private land owners do not impose a re-planting obligation, Idaho Timber does not have any unusual environmental compliance issues.
Plastics Manufacturing
Business Description
Through Conwed Plastics, which was acquired in March 1985, the Company manufactures and markets lightweight plastic netting used for a variety of purposes including, among other things, building and construction, erosion control, packaging, agricultural, carpet padding, filtration and consumer products. These products are primarily
used for containment purposes, reinforcement of other products, packaging for produce and meats, various types of filtration and erosion prevention. Conwed Plastics believes it is a market leader in netting products used in carpet cushion, turf reinforcement, erosion control and packaging. Agricultural, erosion control and building and construction markets tend to be seasonal, with peak periods in the second and third quarters of the calendar year. Packaging is seasonal with the
second quarter being the slowest period in this market. Carpet padding, filtration and consumer product markets are not usually subject to seasonal fluctuations resulting in sales that tend to be evenly spread throughout the year. The net book value of the Company’s investment in Conwed Plastics was $59,200,000 at December 31, 2009.
9
Certain products of Conwed Plastics are proprietary, protected by patents and/or trade secrets. The Company holds patents on certain improvements to the basic manufacturing processes it uses and on applications thereof. The Company believes that the expiration of these patents, individually or in the aggregate, is
unlikely to have a material effect on its operations.
Sales and Marketing
Products are marketed both domestically and internationally, with approximately 22% of 2009 revenues generated by customers from Europe, Latin America, Japan and Australia. Products are sold primarily through an employee sales force, located in the U.S. and Europe. Conwed Plastics emphasizes development of new products
and new applications of existing products to grow its revenues. New product development focuses on market niches where proprietary technology and expertise can lead to sustainable competitive economic advantages. Conwed Plastics has completed eight acquisitions since 2004 and continues to look for additional acquisition opportunities. These acquisitions have provided synergies with existing customers, manufacturing capacity, an expanded customer base and/or product lines.
Approximately half of Conwed Plastics’ revenues are generated on a make to order basis. The remainder of Conwed Plastics’ sales requires a more substantial investment in inventory that is stored at various locations to service customers with short lead time requirements. In the aggregate, inventory is
turned over between 6 and 8 times per year. The top 10 customers with multiple locations typically represent approximately 30% - 37% of total sales. The largest single customer typically represents 5% - 8% of total sales; for the year ended December 31, 2009, the largest single customer represented approximately 6% of total sales. Order backlog generally ranges from 6% - 12% of annual sales throughout the year.
Competition
Conwed Plastics is subject to domestic and international competition, generally on the basis of price, service and quality. Conwed Plastics has 3 to 5 competitors in most of its market segments but the size and type of its competition varies by market segment. Additionally, certain products are dependent on cyclical
industries, including the construction industry. The cost of the principal raw material used in its products, polypropylene, has increased by approximately 42% from 2002. Conwed Plastics has been able to raise prices to its customers during this period to offset some of the increase in raw material costs. The volatility of oil and natural gas prices along with current general economic conditions worldwide make it difficult to predict future raw material costs. Historically,
declining oil and natural gas prices combined with reduced demand have usually resulted in reduced raw material costs.
|
Telecommunications
|
Business Description
STi Prepaid purchased 75% of the assets of Telco in March 2007; the remaining Telco assets were contributed to STi Prepaid by the former owner in exchange for a 25% interest in STi Prepaid. At December 31, 2009, STi Prepaid’s consolidated liabilities exceeded its consolidated assets; as a result, the Company has a negative
net investment in STi Prepaid of $21,100,000.
STi Prepaid, headquartered in New York, New York, is a facilities-based provider of long-distance wireline and wireless telecommunications services. STi Prepaid’s principal product line is prepaid international long distance calling cards; STi Prepaid also generates revenues by providing carrier wholesale services and
selling prepaid wireless products and related services.
10
For the year ended December 31, 2009, prepaid calling card sales accounted for approximately 87% of STi Prepaid’s revenues. Consumers located in the U.S. who make international phone calls often use calling cards because they provide lower rates than those offered by traditional long distance providers. Through
its portfolio of calling cards, STi Prepaid provides international service to over 200 destinations. STi Prepaid currently offers over 500 different calling cards in various denominations that are sold through a wide variety of retail stores and on the Internet, targeted to appeal to a wide variety of consumers. STi Prepaid’s calling cards are primarily marketed to ethnic communities in urban areas.
To activate a card and initiate a call, a card customer will dial either a local access or toll-free telephone number that accesses STi Prepaid’s interactive voice response unit on its network. Once a card is activated, calls are routed to one of STi Prepaid’s termination vendors, then ultimately to the consumer’s
dialed party. STi Prepaid’s switching network currently handles almost 60 million outbound calls and over 600 million minutes per month. STi Prepaid operates a customer care center in the Dominican Republic with over 100 operators to support its prepaid business.
Carrier wholesale, which is a business-to-business service, accounted for approximately 12% of STi Prepaid’s revenues in 2009. STi Prepaid enters into wholesale service agreements with other telecommunication service providers pursuant to which STi Prepaid becomes the terminating vendor for international calls. Services
provided to other carriers are highly automated and do not require much support labor since calls simply pass through STi Prepaid’s switches and utilize excess capacity.
STi Prepaid operates its prepaid mobile business as a Mobile Virtual Network Operator (“MVNO”). MVNOs are entities that do not own their own wireless network; rather they enter into agreements to resell minutes from an established facilities based wireless carrier such as Sprint or Verizon Wireless. However,
unlike wireless resellers that simply earn commissions for selling the products of large facilities based wireless companies, MVNO operators have their own brand name and directly maintain customer relationships including activities related to rate plans, billing, and general customer service. STi Prepaid’s brand name for this product is STi Mobile.
Sales and Marketing
STi Prepaid primarily distributes its prepaid calling cards primarily through distributors who resell the cards to retailers throughout the U.S. A significant portion of the calling cards are marketed to ethnic communities that shop at small retailers or smaller chains that do not receive attention from large telecommunication
providers. STi Prepaid’s relationships with its distributors are critical to serving these market segments and maintaining and growing prepaid calling card market share. In 2008, STi Prepaid completed the acquisition of Sprint’s prepaid card division, providing it with a distribution channel into retail stores nationwide. STi Prepaid also sells prepaid calling cards through its websites,
www.stiprepaid.com
and
www.stiphonecard.com
.
The carrier wholesale business sales group focuses on establishing relationships with leading telecommunication carriers. STi Prepaid markets its STi Mobile wireless products and services through national, regional and local retail outlets in the U.S., internet resellers and the division’s website,
www.stimobile.com
. STi
Mobile provides prepaid wireless services to consumers who may not have the credit rating required to qualify for a post-paid plan, prefer to pay as they go in order to control expenses or do not use sufficient minutes to justify the cost of a post-paid plan.
Competition
11
Prepaid calling cards are marketed by a wide range of telecommunication providers from large national inter-exchange carriers to small local and regional resellers. STi Prepaid’s calling card products compete in markets where consumers’ decisions are primarily based on price and service quality. The emergence
and growth of wholesale carriers using voice over internet protocol, privatization and deregulation has contributed to a decline in international call pricing which is likely to continue. STi Prepaid will need to rely on its network operation expertise and quality of service to compete in the markets it serves.
Government Regulation
STi Prepaid is subject to significant federal, state and local laws, regulations and orders that affect the rates, terms and conditions of certain of its service offerings, its costs and other aspects of its operations. Regulation of the telecommunications industry varies from state to state and it changes regularly in response
to technological developments, competition, government policies and judicial proceedings. The Company cannot predict the impact, nor give any assurances about the materiality of any potential impact, that any adverse changes may have on STi Prepaid’s business or results of operations, nor can it be sure that regulatory authorities will not take action against STi Prepaid regarding its compliance with applicable laws and regulations.
The Federal Communications Commission (“FCC”) has jurisdiction over STi Prepaid’s facilities and services to the extent those facilities are used in the provision of interstate telecommunications services (services that originate and terminate in different states). State regulatory commissions generally have
jurisdiction over facilities and services to the extent the facilities are used in intrastate telecommunications services.
The Communications Act of 1934.
The Communications Act of 1934, as amended (the “Communications Act”) grants the FCC authority to regulate interstate and foreign communications by wire or radio. The Telecommunications Act of 1996 (the “1996
Act”) establishes a framework for fostering competition in the provision of local and long distance telecommunications services. STi Prepaid is regulated by the FCC as a non-dominant interstate and international telecommunication provider and is therefore subject to less comprehensive regulation than dominant carriers under the Communications Act. The FCC reviews its rules and regulations from time to time, and STi Prepaid may be subject to those new or changed rules.
STi Prepaid has registered with the FCC as a provider of domestic interstate long distance services. STi Prepaid believes that it is in material compliance with applicable federal laws and regulations, but cannot be sure that the FCC or third parties will not raise issues regarding its compliance with applicable laws or regulations.
Universal Service.
Pursuant to the 1996 Act, in 1997 the FCC established a significantly expanded universal service regime to subsidize the cost of telecommunications services to high-cost areas, to low income customers, and to qualifying schools, libraries and rural health
care providers. Providers of interstate and international telecommunications services, and certain other entities, must pay for these programs by contributing to a Universal Service Fund (the “Fund’’). The rules concerning which services are considered when determining how much an entity is obligated to contribute to the Fund are complex; however, many of the services sold by STi Prepaid are included in the calculation. Current rules require contributors to make
quarterly and annual filings reporting their revenues, and the Universal Service Administrative Company issues monthly bills for the required contribution amounts, based on a quarterly contribution factor approved by the FCC. STi Prepaid also contributes to other funds mandated by the FCC including Interstate Telecommunication Service Provider Regulatory Fees, Telecommunication Relay Service and Local Number Portability. STi Prepaid and other contributors to the Fund may recover their contribution
costs through their end-user rates or a billing line item.
12
Customer Propriety Network Information (“CPNI”).
CPNI is defined as information that relates to the quantity, technical configuration, type, destination, location, and amount of use of a telecommunications service subscribed to by any customer of a telecommunications
carrier, and that is made available to the carrier by the customer solely by virtue of the carrier-customer relationship. Section 222 of the 1996 Act requires telecommunications carriers to take specific steps to ensure that CPNI is adequately protected from unauthorized disclosure. In 2007, the FCC issued its Report and Order and Further Notice of Proposed Rulemaking strengthening these privacy rules by adopting additional safeguards to protect customers’ CPNI. STi Prepaid
believes that it has developed policies that meet the FCC’s requirements to protect CPNI.
State Regulation of Telecommunications Services
. STi Prepaid is certified to provide telecommunication services in 50 states. State public utility commissions (“PUCs”) are permitted to regulate STi Prepaid’s telecommunication services to the
extent that such services originate and terminate within the same state. The PUCs may also impose tariff and filing requirements, consumer protection measures and obligations to contribute to state universal service and other funds.
For a description of certain litigation involving STi Prepaid, see Item 3, Legal Proceedings in this Report.
Oil and Gas Drilling Services
Acquisition
During 2006, the Company acquired a 30% limited liability company interest in Keen for aggregate consideration of $60,000,000, excluding expenses, and agreed to lend to Keen, on a senior secured basis, up to $126,000,000 to finance new rig equipment purchases and construction costs and to repay existing debt. During 2007, the
Company increased its equity interest to 50% for additional payments aggregating $45,000,000. In addition, the credit facility was amended to increase the borrowing capacity to $138,500,000, and the Company provided Keen with two additional secured credit facilities aggregating $60,000,000. When the Company increased its investment in Keen to 50%, the terms of the limited liability agreement were amended to provide that in the event of a dissolution, liquidation or termination of Keen, available
cash or assets would first be used to pay all of Keen’s debts (including loans made by the Company), then distributed to the Company as a liquidation preference until it had received a return of its equity investment ($105,000,000), before any payments were made to the other equity owner of Keen.
During 2009, the Company believes it became apparent to the other equity owner of Keen that Keen would not be able to make scheduled debt payments to the Company, and that the resulting payment default could result in a liquidation of Keen. In that event, the Company’s liquidation preference over equity distributions would
result in very little, if any, distributions to the other equity owner of Keen. In November 2009, the Company purchased the other 50% equity interest that it did not own plus a secured note payable to the other equity owner of Keen for aggregate cash consideration of $15,000,000. The Company believes it was able to acquire the remaining 50% equity interest at this distressed price because of the expected payment default on Keen’s senior secured debt owed to the Company and the Company’s
$105,000,000 preferred equity distribution in the event Keen was liquidated. At December 31, 2009, the Company owns all of Keen’s equity interests and the net book value of its investment in Keen’s debt and equity securities aggregated $231,500,000.
13
When the Company acquired the controlling interest in Keen in November 2009 it became a consolidated subsidiary; prior to that time the investment in Keen was classified as an investment in an associated company. Under generally accepted accounting principles (“GAAP”), upon consolidation the Company is required to
record Keen’s assets and liabilities at fair value, and is required to adjust the carrying value of the Company’s equity investment immediately prior to the acquisition to fair value. Due to the unique circumstances surrounding the Company’s 2009 acquisition described above, the fair value of the net assets acquired exceeded the amount paid by $49,300,000; the bargain purchase was recognized as a gain on the date of acquisition and included in investment and other income. However,
the fair value of the Company’s equity interest immediately prior to the acquisition was less than its carrying value ($85,900,000); accordingly the Company included a charge of $36,500,000 in income (losses) related to associated companies to write down the pre-acquisition carrying value of its investment in Keen to fair value.
Business Description
Keen is a land based contract oil and gas drilling company based in Stillwater, Oklahoma that provides drilling services to independent oil and natural gas exploration and production companies in the Mid-Continent Region of the U.S. Keen currently operates drilling rigs in Oklahoma, Texas and Arkansas. Keen, which
has been in business since 1991, typically generates revenues through drilling contracts based on daily rates (daywork contracts), footage (charged by depth of the well) or based on a turnkey contract (fixed price to drill a well). Keen supplies the drilling rig, all ancillary equipment and drilling personnel. The majority of wells drilled by Keen are natural gas wells in unconventional basins that are characterized by complex geological formations often requiring higher horsepower, premium
rigs and/or experienced crews to reach targeted depths. In 2009, the majority of drilling services were performed pursuant to daywork contracts.
Each of Keen’s drilling rigs consists of engines, drawworks, a mast, pumps, blowout preventers, a drill string and ancillary equipment. Keen’s drilling rigs can operate 24 hours a day, seven days a week and are generally staffed with crews of four to six persons. Once Keen has drilled a well for a customer,
the drilling rig will be moved off of the well and another service provider will use a service rig (a smaller rig) that is built for completions, which brings the well into production. Keen does not provide completion services. The intended well depth and the geological formation of the drilling site are the principal factors that determine the size and type of rig most suitable for a particular drilling job. All of Keen’s rigs are capable of drilling horizontal and
directional wells.
At December 31, 2009, Keen has 38 drilling rigs in its fleet that have rated maximum depth capabilities ranging from 6,500 feet to 22,000 feet. Keen’s employees perform periodic maintenance and routine repair work on the drilling rigs; the bulk of major repair and overhaul work is done by various oilfield service companies. Keen
also owns and operates a fleet of trucks, trailers and other construction equipment used to transport its rigs and to construct or take down its rigs at drilling locations. By owning its own equipment, Keen believes it is able to better manage the cost of moving its rigs, reduce the downtime between moves and minimize the general wear and tear on drilling rigs. Keen’s customers are not required to use Keen’s equipment or trucks to move Keen’s drilling rigs.
14
Keen’s revenue volume and profitability are significantly affected by the actual and anticipated price of natural gas and levels of natural gas in storage. The natural gas exploration and production industry is cyclical and the level of exploration and production activity has historically been very volatile. During
periods of lower levels of drilling activity, price competition for drilling services tends to increase, which may result in reduced revenues and profitability; conversely, during periods of increased drilling activity drilling rigs are in demand often resulting in higher prices and contractual commitments from customers to obtain exclusive use of a particular rig for a longer term. During 2009, Keen experienced a period of low natural gas prices and rising levels of natural gas storage, which adversely
impacted Keen’s revenues and profitability. Seasonality does not significantly impact Keen’s business or operations.
Additionally, the drilling activity of oil and natural gas exploration and production companies is strongly affected by their ability to access the capital markets. Beginning the second half of 2008 there was a substantial reduction of liquidity in the capital markets due to the deteriorating global economic environment. Many
of Keen’s customers reduced their spending plans for exploration, production and development activities resulting in decreased demand for Keen’s rigs. Decreases in drilling activity and spending for any sustained period of time causes a reduction in Keen’s daily rates, utilization rates and profitability.
Sales and Marketing
Keen markets its drilling rigs to a number of independent oil and gas companies. Most of Keen’s contracts are with established customers on a competitive bid or negotiated basis and may cover one well, a multi-well project or are entered into for a specified period of time. At December 31, 2009, Keen has 4 drilling
rigs under contract for a remaining term of 1 to 3 years, 2 rigs are operating under term contracts that will expire within the next 12 months, 7 are under well-to-well contracts with specific customers, and 25 are not currently under contract.
Keen’s business is fairly concentrated with its top five customers accounting for over 75% of 2009 drilling revenues. One customer accounted for over 30% of 2009 drilling revenues and 3 other customers each exceeded 10% of 2009 drilling revenues. Since Keen only became a consolidated subsidiary of the Company
in November 2009, its revenues for 2009 are only reflected in the consolidated financial statements from the date of acquisition.
Competition
Customers award contracts to contract drillers based on factors such as price, rig availability, quality of service, proximity to the well site, experience with the specific geological formation, condition and type of equipment, reputation, safety of operations and customer relationships. Contracts for drilling services may
be awarded based solely on price. There is currently an oversupply of drilling rigs in the market, and at such times price is the primary determinant by which customers award contracts. Although contract drilling companies generally compete on a regional basis, drilling rigs can be moved from one market to another in response to market conditions which can have the effect of increasing competition.
Property Management and Services
Business Description
15
ResortQuest, which was acquired in June 2007, is headquartered in Fort Walton Beach, Florida and provides vacation rental management services to vacation properties in beach and mountain resort locations, homeowner association management to resort communities and real estate brokerage services for the residential property market in resort
locations. The net book value of the Company’s investment in the property management and services segment was $23,500,000 at December 31, 2009.
Vacation rental management service for homeowners is ResortQuest’s largest service offering representing 96% of ResortQuest’s 2009 revenue. ResortQuest contracts with each property owner to market and manage the rental of their vacation property, generally for a percentage of the rent and/or fees collected. Services
provided include marketing to potential guests, performing routine maintenance, providing housekeeping services and providing guests access to additional activities such as golf, watersports, tennis or skiing. ResortQuest provides services in Northwest Florida, Delaware, South Carolina, Colorado, Idaho and Utah. ResortQuest’s rental management services are somewhat geographically concentrated in the Northwest Florida market, which accounts for 44% of its rental management services
revenue.
ResortQuest’s business is seasonal with beach areas reaching their peak in the summer months and ski areas reaching their peak in the winter months. Since ResortQuest’s properties are in markets that guests must travel to get to, high fuel prices, airline flight availability, less disposable income and poor weather
conditions can have an unfavorable impact on its business.
ResortQuest provides real estate brokerage services in the Northwest Florida and Delaware beach markets. ResortQuest provides real estate brokerage services to resort developers on new construction projects, and also represents other sellers and buyers in the resort and residential resale market. ResortQuest’s
revenues from these activities tend to be cyclical, and experience the same volatility that residential real estate and new construction markets experience. Since acquisition, the residential real estate markets in Northwest Florida and Delaware, like elsewhere in the U.S., have suffered from oversupply and declining prices that have adversely affected ResortQuest’s business.
ResortQuest is in the services business with minimal working capital needs, minimal investment in property, plant and equipment and relatively little expenditures required for technology. The vast majority of ResortQuest’s expenses relates to employees’ compensation and benefits, or to service providers when ResortQuest
chooses to outsource to a vendor.
Sales and Marketing
ResortQuest serves five types of customers: owners of individual vacation rental homes, guests staying in those homes, owners selling their homes, clients buying homes and homeowner association boards. ResortQuest markets homeowner properties via the internet, direct mail and publications. Marketing includes promoting
ResortQuest as a provider of quality management services and promoting the homeowners’ properties as attractive places to vacation. Marketing to rental property guests and potential home buyers occurs at local, regional and national levels depending on the location. Community presence and reputation are also an important part of ResortQuest’s marketing programs.
16
Competition
ResortQuest’s competition is fragmented and varies by service and location. Vacation rental management competitors include other homeowner vacation rental management companies similar to ResortQuest, developers that manage their own resort properties and homeowners that market their property directly to the consumer. When
residential real estate market conditions change, the composition of ResortQuest’s competition can also change. In some locations developers have opted out of the vacation rental business, providing greater opportunities for ResortQuest. In other locations, market conditions have encouraged new competitors to enter the market, including the direct homeowner rental management business, which allows homeowners to market their own homes on websites. These types of websites
provide a low cost of entry to market rental properties and relative ease in handling a potential guest. Real estate brokerage service competitors are national, regional and local real estate brokerage companies and developers that market their own projects.
Gaming Entertainment
Acquisition
Acquired during 2006, the Company owns approximately 61% of Premier’s common units and all of Premier’s preferred units, which accrue an annual preferred return of 17%. The Company also acquired Premier’s junior subordinated note due August 2012 during 2006, and during 2007 provided Premier with a $180,000,000
senior secured credit facility to partially fund Premier’s bankruptcy plan of reorganization (discussed below). At December 31, 2009, the net book value of the Company’s aggregate investment in Premier was $236,700,000. At acquisition, the Company consolidated Premier as a result of its controlling voting interest; during the pendency of bankruptcy proceedings Premier was deconsolidated and accounted for under the equity method of accounting.
Plan of Reorganization
Premier owns the Hard Rock Hotel & Casino Biloxi, located in Biloxi, Mississippi, which opened to the public on June 30, 2007. The Hard Rock Biloxi was scheduled to open to the public on August 31, 2005; however, two days prior to opening, Hurricane Katrina hit the Mississippi Gulf Coast and severely damaged the hotel and
related structures and completely destroyed the casino. On September 19, 2006, Premier and its subsidiary filed voluntary petitions for reorganization under chapter 11 of title 11 of the United States Bankruptcy Code. Premier filed its petitions in order to seek the court’s assistance in gaining access to Hurricane Katrina-related insurance proceeds (an aggregate of $161,200,000) which had been denied to Premier by its pre-petition secured bondholders.
Premier filed an amended disclosure statement and plan of reorganization on February 22, 2007, which provided for the payment in full of all of Premier's creditors, including payment of principal and accrued interest due to the holders of Premier's 10 3/4% senior secured notes at par (the “Premier Notes”). On July 30,
2007, the court entered an order confirming the plan, subject to a modification which Premier filed on August 1, 2007; Premier emerged from bankruptcy and once again became a consolidated subsidiary of the Company on August 10, 2007. The plan was funded in part with the $180,000,000 senior secured credit facility provided by a subsidiary of the Company. The credit facility matures on February 1, 2012, bears interest at 10 3/4%, is prepayable at any time without penalty, and contains other
covenants, terms and conditions similar to those contained in the indenture governing the Premier Notes.
17
The former holders of the Premier Notes argued that they were entitled to liquidated damages under the indenture governing the Premier Notes, and as such are entitled to more than the principal amount of the notes plus accrued interest that was paid to them at emergence. Although the Company does not agree with the position
taken by the Premier noteholders, in order to have the plan confirmed so that Premier could complete reconstruction of its property and open its business without further delay, the Company agreed to fund an escrow account to cover the Premier noteholders’ claim for additional damages in the amount of $13,700,000, and a second escrow account for the trustee’s reasonable legal fees and expenses in the amount of $1,000,000. The trial before the bankruptcy court to determine entitlement to
the escrowed funds has been scheduled to commence on March 16, 2010. The Company believes it is probable that the court will approve payment of legal fees and expenses and has fully reserved for that contingency. The Company believes it is reasonably possible that the bankruptcy court will find in favor of the Premier noteholders with respect to the additional damages escrow; however, any potential loss can not be reasonably estimated. Accordingly, the Company has not accrued
a loss for the additional damages contingency.
Business Description
The Hard Rock Hotel & Casino is located on an 8.5 acre site on the Mississippi Gulf Coast and has approximately 1,215 slot machines, 52 table games, six live poker tables, five restaurants (including a Hard Rock Café and Ruth’s Chris Steakhouse), a full service spa, a 5,200 square foot pool area, 3,000 square feet of retail
space, an eleven-story hotel with 318 rooms and suites and a Hard Rock Live! entertainment venue with a capacity of 1,500 persons.
Premier’s marketing strategy is to position the resort as a full service gaming, boutique hotel and entertainment resort catering to the Mississippi Gulf Coast marketplace and the southern region of the U.S. The Mississippi Gulf Coast region is located along the Interstate 10 corridor and is within a ninety minute drive
from the New Orleans metropolitan area, Mobile, Alabama and the Florida panhandle. Premier’s primary means of marketing utilizes its database of customers for direct mail campaigns and promotional giveaways designed to reward customers and generate loyalty and repeat visits. In addition, Premier benefits from the “Hard Rock” brand name which appeals to a broad range of customers and from its superior location, which is within walking distance of the Beau Rivage, an MGM
Mirage property and the largest hotel and casino in the Mississippi Gulf Coast market.
Premier’s current insurance policy provides up to $235,000,000 in coverage for damage to real and personal property including business interruption coverage. The coverage is provided by a panel of insurers based out of the U.S., Bermuda, and London and is comprised of a $50,000,000 primary layer and three excess layers.
The coverage is syndicated through several insurance carriers, each with an A.M. Best Rating of A- (Excellent) or better. Although the insurance policy is an all risk policy, any loss resulting from a weather catastrophe occurrence, which is defined to include damage caused by a named storm, is sublimited to $100,000,000 with a deductible of $5,000,000.
Competition
Premier faces significant competition primarily from nine other gaming operations in the Mississippi Gulf Coast gaming market and secondarily from gaming operations in Baton Rouge and New Orleans, Louisiana as well as from a Native American casino in Atmore, Alabama. Other competition comes from gaming operations in Lake Charles,
Bossier City and Shreveport, Louisiana; Tunica and Philadelphia, Mississippi; Montgomery, Alabama; Tampa and Hollywood, Florida and other states. Such competition may increase if gaming operations grow in these markets or if legalized gaming expands to nearby states. Many of Premier’s competitors are larger and have greater marketing and financial resources.
18
The gaming industry in Mississippi is highly regulated. Premier, its ownership and management are subject to findings of suitability reviews by the Mississippi Gaming Commission. In addition, the laws, rules and regulations of state and local governments in Mississippi require Premier to hold various licenses, registrations
and permits and to obtain various approvals for a variety of matters. In order to continue operating, Premier must remain in compliance with all laws, rules and regulations and pay gaming taxes on its gross gaming revenues. Failure to maintain such approvals or obtain renewals when due, or failure to comply with new laws or regulations or changes to existing laws and regulations would have an adverse effect on Premier’s business. Premier believes it is in compliance
with all governmental rules and regulations.
Domestic Real Estate
At December 31, 2009, the Company’s aggregate net investment in all domestic real estate projects was $202,200,000. The real estate operations include a mixture of commercial properties, residential land development projects and other unimproved land, all in various stages of development. Certain of the Company’s
real estate investments and their respective book values as of December 31, 2009 include: approximately 60 acres of land used by the automobile dealership joint venture, Garcadia, which is described below ($50,500,000); approximately 76 acres of land located on the island of Islesboro, Maine (approved for 13 residential waterfront lots) and 46 fully developed residential lots on approximately 120 acres of land located in Rockport, Maine on Penobscot Bay, ($43,400,000 in the aggregate); a 15 acre, unentitled air
rights parcel above the train tracks behind Union Station in Washington, D.C. ($11,300,000); and an operating shopping center on Long Island, New York that has 71,000 square feet of retail space ($12,700,000). None of these projects are secured by any indebtedness.
One of the Company’s real estate subsidiaries (MB1) is the owner and developer of a 12 acre mixed use real estate project located in Myrtle Beach, South Carolina. The project is comprised of a retail center with approximately 346,000 square feet of retail space, 41,000 square feet of office space and 195 residential apartment
rental units. The acquisition and construction costs were funded by capital contributed by the Company and nonrecourse indebtedness with a balance of $100,500,000 at December 31, 2009, that is collateralized by the real estate. If MB1 is unable to make debt service or principal payments on the loan the Company is under no obligation to make those payments.
Current economic conditions have adversely impacted the majority of the retail tenants at the retail center. Over 20 retail tenants have requested reductions in rent payments, some of which have been granted; certain other tenants are not paying the full amount of rent due while their leases are being renegotiated. During
the second quarter of 2009, MB1 was unable to make scheduled payments under its interest rate swap agreement and received several default notices under its bank loan. These events constituted a change in circumstances that caused the Company to conclude that the carrying amount of MB1’s real estate asset was not recoverable; accordingly, the Company recorded an impairment charge of $67,800,000 (classified as selling, general and other expenses), which reduced the carrying amount of MB1’s
real estate to its fair value. Although MB1’s bank loan matured in October 2009, it was not repaid since MB1 did not have sufficient funds and the Company is under no obligation and has no intention to provide the funds to pay off the loan. MB1 received an additional default notice for failure to repay the bank loan but its lenders have not commenced foreclosure proceedings. If MB1’s bank lenders foreclose in the future, the Company would record a gain equal to the
excess of the loan balance over the then book value of the real estate. At December 31, 2009, the carrying value of MB1’s real estate was $69,400,000.
19
The Company also owns 46 acres of land adjacent to the Myrtle Beach project which is planned for 1,151 residential units, including a mixture of single family homes, townhouses and condominium units, and a 15 acre parcel that is planned for 181,000 square feet of retail space (aggregate book value of $14,700,000). The land and
the residential units are not collateral for MB1’s indebtedness.
Residential property sales volume, prices and new building starts have declined significantly in many U.S. markets, including markets in which the Company has real estate projects in various stages of development. The slowdown in residential sales has been exacerbated by the turmoil in the mortgage lending and credit markets,
which has resulted in stricter lending standards and reduced liquidity for prospective home buyers. The Company is not actively soliciting bids for developed and undeveloped lots in Maine, and has deferred its development plans for certain other projects as well. The Company intends to wait for market conditions to improve before marketing certain of its projects for sale.
In October 2007, the Company entered into an agreement with the Panama City-Bay County Airport and Industrial District of Panama City, Florida to purchase approximately 708 acres of land which currently houses the Panama City-Bay County International Airport. The Company has placed $56,500,000 into escrow; the transaction will close
and title to the land will pass only after the city completes construction of a new airport and moves the airport operations to its new location. Prior to closing, all interest earned on the escrow account is for the benefit of the Company and may be withdrawn at any time. Construction on the new airport has begun; the Company has the right to terminate the agreement and receive a full refund of the escrowed funds if the closing hasn’t occurred by April 2012. If the transaction
closes, the Company intends to develop the property into a mixed use community with residential, retail, commercial, educational and office sites.
The Company owns approximately 31.4% of the outstanding common stock of HomeFed. In addition, as a result of a 1998 distribution to all of the Company’s shareholders, approximately 7.8% and 9.4% of HomeFed is owned by the Company’s Chairman and President, respectively. HomeFed is currently engaged, directly
and through subsidiaries, in the investment in and development of residential real estate projects in California. Its current development projects consist of two master-planned communities located in San Diego County, California: San Elijo Hills and a portion of the larger Otay Ranch planning area. The Company accounts for its investment in HomeFed under the equity method of accounting. At December 31, 2009, its investment had a carrying value of $45,000,000, which
is included in investments in associated companies. HomeFed is a public company traded on the NASD OTC Bulletin Board (Symbol: HOFD).
The real estate development industry is subject to substantial environmental, building, construction, zoning and real estate regulations that are imposed by various federal, state and local authorities. In order to develop its properties, the Company must obtain the approval of numerous governmental agencies regarding such matters
as permitted land uses, density, the installation of utility services (such as water, sewer, gas, electric, telephone and cable television) and the dedication of acreage for various community purposes. Furthermore, changes in prevailing local circumstances or applicable laws may require additional approvals or modifications of approvals previously obtained. Delays in obtaining required approvals and authorizations could adversely affect the profitability of the Company’s projects.
Medical Product Development
Business
20
At December 31, 2009, the Company owned approximately 92% of Sangart, a biopharmaceutical company principally engaged in developing medicines designed to enhance the oxygenation of oxygen deprived tissues through targeted oxygen delivery. From 2003 through December 31, 2009, the Company invested an aggregate of $146,200,000
in Sangart, principally to help fund Sangart’s ongoing product development activities (as a development stage company, Sangart does not have any revenues from product sales). Since inception, the Company has recorded Sangart losses of $128,000,000, resulting from product development expenses and Sangart’s overhead costs. Sangart became a consolidated subsidiary in 2005; the net book value of the Company’s investment in Sangart was $17,600,000 at December 31, 2009.
In 2002, Sangart commenced human clinical trials of MP4OX, a solution of cell-free hemoglobin administered intravenously to provide rapid oxygen delivery to ischemic (oxygen deprived) tissues. The basis for Sangart’s technology is the result of more than 20 years of research in the understanding of how hemoglobin (the
oxygen carrier in red blood cells) functions outside of red blood cells in a cell-free environment and how it can be used in conjunction with normal red blood cells to enhance oxygen delivery to organ tissue. MP4 products are made from purified human hemoglobin that is extracted from fully screened and tested outdated human blood obtained from accredited blood centers, which is then bound to polyethylene glycol molecules using Sangart’s proprietary processes. Sangart’s manufacturing
process is able to generate approximately four units of MP4OX using a single unit of blood. Sangart owns or exclusively licenses sixteen U.S. patents and has more than thirty applications pending worldwide covering product composition, manufacturing or methods of use. Patents applicable to the MP4 technology do not begin to expire until 2017.
Sangart has previously completed six Phase I and Phase II human clinical studies designed to assess product safety and gather preliminary indications of the product’s effectiveness. In 2007 and 2008, Sangart conducted two Phase III clinical trials that involved a total of 850 hip replacement surgery patients in Europe. These
studies demonstrated MP4OX’s effectiveness in preventing and treating low blood pressure during orthopedic hip replacement surgeries without significant safety concerns being identified, though in one of the Phase III studies there was a slightly higher incidence of adverse events in the MP4OX-treated patients than in the control group. However, because these Phase III trials were conducted in a patient population having a relatively low incidence of medical complications, Sangart has decided
not to apply for marketing approval to use MP4OX in orthopedic hip replacement surgeries at this time.
Sangart is currently conducting a Phase II proof of concept clinical trial of MP4OX in trauma patients in Europe and South Africa, which is expected to complete enrollment by the third quarter of 2010. If this study is successful, Sangart plans to conduct a larger Phase II clinical study and then a Phase III clinical study in
trauma patients. These trauma studies will take several years to complete at substantial cost. Until these Phase II and Phase III studies are successfully completed, Sangart will not be able to request marketing approval and generate revenues from sales in the trauma market.
Sangart is also exploring the application of the MP4 technology in additional therapeutic areas. One area of interest is sickle cell disease, for which Sangart’s MP4CO product was recently granted orphan drug designation by the European Commission. This designation will provide MP4CO with ten years of market
exclusivity in the European Union if Sangart is able to successfully obtain marketing approval. Multiple human clinical trials demonstrating the safety and efficacy of MP4CO in the treatment of sickle cell disease would need to be successfully completed before marketing approval can be obtained and revenues from MP4CO sales can be generated. Such studies would take several years to complete at substantial cost.
Substantially all of the funding needed for MP4 development has come from sales of Sangart’s equity securities. Sangart’s existing cash reserves are expected to provide Sangart with sufficient capital to fund activities into the third quarter of 2010. Thereafter, significant additional funding will be
needed for product development and clinical trial activities prior to regulatory approval and commercial launch; the source of such funding has not as yet been determined.
21
Competitive Environment
MP4 products are intended to be used as oxygen therapeutic agents in clinical and trauma situations where tissues are at risk of inadequate blood flow and oxygenation. Currently there are no similar products approved for sale in the U.S. or the European Union; however, other companies are developing products that could potentially
compete with MP4.
Any successful commercialization of MP4 products will depend on an adequate supply of raw materials, principally human red blood cells and polyethylene glycol, at an acceptable quality, quantity and price. Sangart has contracted for commercial launch quantities of human red blood cells, though commitments for commercial-scale
quantities of polyethylene glycol have not yet been secured. Sangart leases a 56,700 square foot combination office and manufacturing facility that currently produces MP4 products for its clinical trials. Sangart believes that its current manufacturing facility would have adequate capacity to support a commercial launch, but significant capital improvements would be required or an alternative manufacturing site would need to be acquired for commercial production. In addition to
obtaining requisite regulatory approvals and increasing manufacturing capacity for the manufacture and sale of MP4 products, Sangart would have to create sales, marketing and distribution capabilities prior to any commercial launch of this product, either directly or in partnership with a service provider.
Government Regulation
As a product intended for medical use, clinical trials, marketing approval, manufacturing and distribution of MP4 is highly regulated. An application for marketing approval may only be made after the safety and effectiveness of the product has been demonstrated, including through human clinical trial data. In the
U.S., the U.S. Food and Drug Administration regulates medical products, including the category known as “biologics”, which includes MP4 products. The Federal Food, Drug and Cosmetic Act and the Public Health Service Act govern the testing, manufacture, safety, effectiveness, labeling, storage, record keeping, approval, advertising and promotion of MP4 products.
In Europe, each country has its own agency that regulates clinical trials. However, the Committee for Medicinal Products for Human Use (“CHMP”), which is administered by the European Agency for the Evaluation of Medicinal Products, is an EU-wide regulatory body. Following completion of clinical trials,
marketing approval can be granted either by a centralized application through CHMP, or on a decentralized basis by one or more selected countries.
Other Operations
Wineries
22
The Company’s winery operations are managed under the umbrella name, Crimson Wine Group (“Crimson”). Crimson is engaged in the production and sale of premium, ultra premium and luxury wines (i.e., wines that retail for $10 - $14, $14 - $25 and over $25 per 750ml bottle, respectively). Crimson is
headquartered in Napa, California and owns three wineries, Pine Ridge Vineyards in Napa Valley, California, Archery Summit in the Willamette Valley of Oregon and Chamisal Vineyards in the Edna Valley of California. Pine Ridge was acquired in 1991 and has been conducting operations since 1978, the Company started Archery Summit in 1993 and Chamisal Vineyards was acquired during 2008 and has been conducting operations since 1973. The Company’s investment in Crimson has grown, principally
to fund the acquisition of land for vineyard development, construct and develop Archery Summit, acquire Chamisal Vineyards, launch new brands and increase production capacity and storage facilities at the wineries. Crimson controls approximately 204 acres of vineyards in Napa Valley, California, 119 acres of vineyards in the Willamette Valley of Oregon and 97 acres of vineyards in the Edna Valley of California, substantially all of which are owned and producing grapes. Crimson believes that
its vineyards are located in some of the most highly regarded appellations and areas of the Napa, Willamette and Edna Valleys. At December 31, 2009, the net book value of the Company’s aggregate investment in Crimson was $87,300,000. Crimson sold approximately 92,000 9-liter equivalent cases of wine generating revenues of $19,800,000 during 2009 and 90,000 9-liter equivalent cases of wine generating revenues of $20,900,000 during 2008. Additionally, in 2005 and 2006, the Company acquired
an aggregate of 611 acres of land in the Horse Heaven Hills of Washington’s Columbia Valley, of which approximately 85 acres have been developed into producing vineyards. At December 31, 2009, the net book value of the Company’s investment in the Washington vineyard property was $7,500,000.
Crimson is expanding its product offerings in the premium and ultra premium segments of the very competitive premium table wine market, including developing new brands at lower price points. The combination of the competitive economic environment and many lower priced wines will require Crimson to increase its promotional expenditures,
which will include various sales and marketing efforts to reach new customers and expand distribution of its products. Crimson’s wines are primarily sold to distributors, who then sell to retailers and restaurants. As permitted under federal and local regulations, Crimson has also been placing increasing emphasis on sales direct to consumers, which they are able to do through the internet, wine clubs and at the wineries’ tasting rooms. During 2009, direct sales to
consumers represented 24% of case sales and 56% of wine revenues. Wholesale sales of the Company’s wines in California (excluding direct sales to consumers) amounted to approximately 24% of 2009 wholesale wine revenues.
Crimson’s wines compete with small and large producers in the U.S., as well as with imported wines, and the ultimate consumer has many choices. Demand for wine in the premium, ultra premium and luxury market segments can rise and fall with general economic conditions, and is also significantly affected by grape supply. The
demand for Crimson’s products is also affected by the ratings given the wines in industry and consumer publications. In the current economic climate, consumer demand has shifted away from the higher-priced luxury segment to wines in the lower-priced premium and ultra premium categories. While Crimson’s current vineyard holdings in the Napa, Willamette and Edna valleys continue to be a substantial source for its wine products, Crimson has and will continue to acquire more purchased
fruit as it shifts its product offerings to the lower-priced wine segments.
The wineries’ production, sales and distribution activities are subject to regulation by agencies of both federal and state governments. State regulations that prohibited or restricted sales of wine direct to consumers by producers that are located in another state continue to be amended or overturned to permit increased
direct sales to consumers in other states. For the year ended December 31, 2009, the Company sold wine direct to consumers in 43 states across the U.S.
23
Energy Projects
During the past few years, the Company has been incurring costs to investigate and evaluate the development of a number of large scale domestic energy projects. Certain of the large scale projects employ gasification technology to convert different types of low grade fossil fuels into clean energy products. The Company
has also invested in certain energy projects that do not employ gasification technologies, one of which is described below. The Company has expensed costs to investigate, evaluate and obtain various permits and approvals for its various energy projects of $25,300,000, $33,400,000 and $20,800,000 during the years ended December 31, 2009, 2008 and 2007, respectively.
Although there are a number of large scale projects the Company is currently investigating, the Company is not obligated to develop any of the projects, and no assurance can be given that the Company will be successful in fully developing any of these projects. Any project that the Company might develop would likely require
a significant equity investment, which the Company presently does not intend to fund by itself, the acquisition of substantial non-recourse borrowings to build the projects (total development costs for these types of projects range from $1 billion to $3 billion), the procurement of purchase commitments for long-term supplies of feedstock, long-term commitments from purchasers of the output, and significant technological and engineering expertise to implement. The investigation, evaluation and financing
of these large scale projects will take years to complete.
The Company is currently evaluating a gasification project, which would be built in Louisiana. In April 2008, the Lake Charles Harbor and Terminal District of Lake Charles, Louisiana sold $1,000,000,000 in tax exempt bonds to support the development of a $1,900,000,000 petroleum coke gasification plant project by the Company’s
wholly-owned subsidiary, Lake Charles Cogeneration LLC (“LCC”). The bond proceeds were initially escrowed and held by the bond trustee; however, during the first quarter of 2009 the bond trustee used the escrowed funds to fully redeem the bonds. Pursuant to LCC’s agreements with the local municipality, upon the completion of pending permitting, regulatory approval, design engineering and the satisfaction of certain other conditions of the financing agreements, the bonds
will be marketed on a long-term basis and the proceeds will be released to LCC to use for the payment of development and construction costs for the project. The Company is not obligated to make equity contributions to LCC until it completes its investigation and the project is approved by the Company’s board of directors. The Lake Charles Cogeneration project is a new chemical manufacturing project that plans to use quench gasification technology to produce energy products from low
grade solid fuel sources such as petroleum coke. LCC is evaluating the primary product options to be produced by the Lake Charles Cogeneration project including substitute natural gas, methanol and hydrogen.
In July 2009, two of the Company’s other prospective gasification projects were selected by the U.S. Department of Energy (“DOE”) to proceed to detailed due diligence and negotiations of terms and conditions necessary for the DOE to issue conditional commitments for loan guarantees aggregating up to $3,600,000,000. While
these commitments represent important milestones in the selection process, the guarantees are subject to detailed and extensive due diligence by the DOE and no assurance can be given that a loan guaranty for either project will ultimately be given. As discussed above, construction of these projects is also subject to obtaining third-party equity and debt financing.
24
A subsidiary of the Company has acquired a leasehold interest and certain permits to construct and operate an onshore liquefied natural gas (“LNG”) receiving terminal and associated facilities on the Skipanon Peninsula near the confluence of the Skipanon and Columbia Rivers in Warrenton, Clatsop County, Oregon. The
project includes construction of an offshore dock and berth for offloading LNG carriers, onshore facilities to receive and store up to 480,000 cubic meters of LNG and vaporizers to regasify LNG at a baseload rate of 1 billion standard cubic feet per day (“bscfd”) with a peak rate of 1.5 bscfd. The current plan includes construction of an approximate 121 mile long 36-inch diameter natural gas pipeline to transport regasified natural gas to the U.S. natural gas transmission grid, which in
turn will interconnect with other natural gas pipelines, including the interstate transmission system of Williams Northwest Pipeline at the Molalla Gate Station in Molalla, Oregon. In addition, a new 10 mile long 24-inch diameter lateral pipeline will be constructed to connect the pipeline to a local storage facility. Numerous regulatory permits and approvals and acquisitions of rights of way for the pipeline will be required before project construction can commence; construction of the
receiving terminal and associated facilities is expected to begin in the third quarter of 2012 and construction of the pipeline is expected to begin in the third quarter of 2014. Completion of the project is also subject to obtaining significant financing from third parties, which has not been arranged; the current estimated project cost is $1,300,000,000.
Other Investments
Berkadia
In December 2009, Berkadia, a joint venture between Berkshire Hathaway and the Company, acquired the North American commercial mortgage origination and servicing business of Capmark. The Company and Berkshire Hathaway each have a 50% equity interest in Berkadia, and each party contributed $217,200,000 of equity capital to fund
the acquisition. In addition, a subsidiary of Berkshire Hathaway provided Berkadia with a five-year, $1 billion secured credit facility, which was used to purchase outstanding mortgage loans and servicer advances from Capmark. The credit facility may be used to fund mortgage loans and servicer advances, to purchase mortgage servicing rights and for working capital needs. The Company has guaranteed Berkadia’s repayment of 50% of the credit facility when due.
Berkadia acquired the commercial mortgage origination and servicing business from Capmark pursuant to an Asset Put Agreement (“APA”) entered into between Berkadia and certain Capmark entities in September 2009. Capmark paid Berkadia $40,000,000 for the right to require Berkadia to purchase the commercial mortgage
origination and mortgage servicing business pursuant to the terms of the APA. Capmark subsequently filed for bankruptcy protection under chapter 11 of title 11 of the United States Bankruptcy Code and exercised the put option. Although there were other parties interested in purchasing portions of the commercial mortgage origination and servicing business, Berkadia’s offer was the only offer for the entire business, which eliminated Capmark’s risk of disposing of the remaining
business. In addition, Berkadia’s offer included a provision to hire the Capmark employees operating the business, thereby saving Capmark material employment related expenses.
The Company accounts for Berkadia as an investment in an associated company and applies the equity method of accounting. Berkadia applied the acquisition method to account for the purchase of the commercial mortgage origination and servicing business and recorded the assets and liabilities acquired at fair value, which were
principally mortgage servicing rights, mortgage loans and servicer advances. The fair values of the net assets acquired exceeded the amount paid, principally due to the amount received as a put premium and the reasons identified above. This excess is treated as a bargain purchase that is recognized as a gain on the date of acquisition and included in Berkadia’s results of operations. For the period ended December 31, 2009, the Company recorded income from Berkadia of $20,800,000
under the equity method of accounting, of which $24,400,000 represented the Company’s share of the bargain purchase. At December 31, 2009, the carrying amount of the Company’s investment in Berkadia was $240,000,000.
25
The commercial mortgage servicing business provides primary, master and special servicing activities for commercial mortgage-backed securities (“CMBS”). In addition, Berkadia carries out servicing activities on a contracted basis for third parties such as insurance companies, banks and other financial institutions. Berkadia
is an approved servicer of loans for Fannie Mae, Freddie Mac, Ginnie Mae and the FHA, and is one of the largest servicers of commercial real estate loans in the U.S. As of December 31, 2009, Berkadia had a servicing portfolio of approximately 33,000 loans with an unpaid principal balance of $236.7 billion summarized as follows (dollars in thousands):
|
Number of
Loans
|
Unpaid Principal Balance
|
|||||||
|
CMBS
|
15,826 | $ | 125,799,533 | |||||
|
Fee-for-service
|
7,773 | 51,903,121 | ||||||
|
Agency
|
5,543 | 34,429,649 | ||||||
|
Special serviced (1)
|
2,443 | 16,264,688 | ||||||
|
Other
|
1,262 | 8,274,827 | ||||||
|
Total
|
32,847 | $ | 236,671,818 | |||||
|
|
(1)
|
Represents loans where Berkadia provides special servicing only. Berkadia is also the named special servicer on $27.6 billion of loans for which it also acts as the primary or master servicer.
|
A primary servicer of a loan is the primary contact with the borrower and is generally responsible for carrying out all cash management functions relating to the loan, including providing monthly billing statements to the borrower and collecting and applying payments on the loan; administering reserve and escrow funds for repairs, tenant
improvements, taxes and insurance; obtaining and analyzing operating and financial statements of the borrower and performing periodic property inspections; preparing and providing periodic reports and remittances to the master servicer or other designated persons; administering lien filings; and other specified functions.
A master servicer is responsible for administration of a pool of loans that is transferred to a trust or other special purpose entity in connection with a securitization transaction pursuant to a pooling and servicing agreement. A master servicer is responsible for ensuring that primary servicers act in a diligent manner when
carrying out their collection and administration activities, and is also required to handle all remittance and reporting activities required by the pooling and servicing agreement. While some master servicer functions may be sub-contracted and performed by a primary servicer, as a master servicer Berkadia is ultimately responsible for the performance of any functions that have been sub-contracted to a primary servicer.
Master servicers are generally required to advance funds to cover any delinquent payments on the securitized loans and any taxes and insurance premiums not covered by borrowers’ escrow funds if it is determined that the advances will be recoverable in the future. These “servicing advances,” along with accrued
interest, are treated as having priority over the rights of other investors in the securitization. In certain circumstances, Berkadia may have similar obligations to advance funds in connection with loans under which it is a primary servicer.
26
A special servicer is a specialist in dealing with defaulted loans and is usually selected by the holder of the subordinated interest in a securitization vehicle. Typically, a loan may be transferred from the master servicer to a special servicer if it is more than 60 days delinquent, a borrower files for bankruptcy or the master
servicer determines a default is imminent. Once a loan is transferred to special servicing, asset managers take steps to bring the account to a performing status or exercise other remedies, including loan modification, foreclosure, a negotiated pay-off or a sale of the loan. Special servicers are generally paid higher monthly servicing fees and resolution fees in connection with the loans that they service.
Fee-for-service customers generally require the same type of collection, monitoring and reporting services as other programs; however, since the customer retains ownership of the loan there are no third party bondholders or investors. In addition, the mortgage servicing rights are not purchased, instead the customer contracts
with Berkadia to service its loans. The contract usually has a defined term and may be terminated on short notice.
As a servicer, Berkadia is frequently responsible for managing, on behalf of its investors, the balances that are maintained in custodial accounts for the purposes of collecting and distributing principal and interest and for funding repairs, tenant improvements, taxes and insurance related to the mortgaged properties it services. Berkadia
derives certain economic benefits associated with a portion of these balances. Such balances totaled in excess of $4 billion as of December 31, 2009.
Berkadia originates commercial real estate loans for Fannie Mae, Freddie Mac, Ginnie Mae and the FHA using their underwriting guidelines, and will typically sell the loan shortly after it is funded. Provided Berkadia adheres to the underwriting guidelines, these government related entities must purchase the loan at the face
amount plus accrued interest; Berkadia retains the mortgage servicing rights. In addition, as a condition to Fannie Mae’s delegation of responsibility for underwriting, originating and servicing of loans, Berkadia assumes a limited first-dollar loss position throughout the term of each loan sold to Fannie Mae.
Berkadia is required under its servicing agreements to maintain certain minimum servicer ratings or qualifications from the rating agencies. A downgrade below a certain level may give rise to the right of a customer or trustee of a securitized transaction to terminate Berkadia as servicer. Berkadia currently maintains
approvals or ratings from Moody’s Investors Service, Fitch Ratings, Standard & Poor’s and Dominion Bond Rating Services. These ratings currently exceed the minimum ratings required by the related servicing agreements. Ratings issued by the rating agencies can be withdrawn or lowered at any time. In addition, Fannie Mae and Freddie Mac retain broad discretion to terminate Berkadia as a seller/servicer without cause upon notice.
ACF
As of December 31, 2009, the Company had acquired approximately 25% of the outstanding common shares of ACF for aggregate cash consideration of $418,600,000. ACF is an independent auto finance company that is in the business of purchasing and servicing automobile sales finance contracts, historically for consumers who are typically
unable to obtain financing from other sources. The Company’s investment in ACF is classified as an investment in an associated company and carried at fair value, which was $639,800,000 at December 31, 2009 market prices.
The Company has entered into a standstill agreement with ACF for the two year period ending March 3, 2010, pursuant to which the Company has agreed not to sell its shares if the buyer would own more than 4.9% of the outstanding shares, unless the buyer agreed to be bound by terms of the standstill agreement, to not increase its ownership
interest to more than 30% of the outstanding ACF common shares, and received the right to nominate two directors to the board of directors of ACF. The Company and ACF have entered into a registration rights agreement covering all of the ACF shares of common stock owned by the Company.
27
As permitted under GAAP, the Company is permitted to choose to measure many financial instruments and certain other items at fair value (the “fair value option”), and to report unrealized gains and losses on items for which the fair value option is elected in earnings. The Company elected the fair value option for
its investment in ACF, rather than apply the equity method of accounting. Income (losses) related to associated companies includes unrealized gains (losses) resulting from changes in the fair value of ACF of $376,500,000 in 2009 and $(155,300,000) in 2008.
Jefferies
In April 2008, the Company sold to Jefferies 10,000,000 of the Company’s common shares, and received 26,585,310 shares of common stock of Jefferies and $100,021,000 in cash. The Jefferies common shares were valued based on the closing price of the Jefferies common stock on April 18, 2008, the last trading date prior to
the acquisition ($398,248,000 in the aggregate). Including shares acquired in open market purchases during 2008, as of December 31, 2009, the Company owns an aggregate of 48,585,385 Jefferies common shares (approximately 29% of the Jefferies outstanding common shares) for a total investment of $794,400,000. The Company’s investment in Jefferies is classified as an investment in an associated company and is carried at fair value, which was $1,152,900,000 at December 31, 2009 market
prices. The Company elected the fair value option to account for its investment in Jefferies rather than the equity method of accounting; income (losses) related to associated companies includes unrealized gains (losses) resulting from changes in the fair value of Jefferies of $469,800,000 in 2009 and $(111,200,000) in 2008. Jefferies is a full-service global investment bank and institutional securities firm serving companies and their investors.
The Company has entered into a standstill agreement with Jefferies, pursuant to which for the two year period ending April 21, 2010, the Company agreed, subject to certain provisions, to limit its investment in Jefferies to not more than 30% of the outstanding Jefferies common shares and to not sell its investment, and received the right
to nominate two directors to the board of directors of Jefferies. Jefferies also agreed to enter into a registration rights agreement covering all of the Jefferies shares of common stock owned by the Company.
JHYH
During 2007, the Company and Jefferies formed JHYH and each initially committed to invest $600,000,000. The Company invested $250,000,000 in cash plus its $100,000,000 investment in JPOF II during 2007; any request for additional capital contributions from the Company will now require the consent of the Company’s designees
to the Jefferies board. The Company does not anticipate making additional capital contributions in the near future. JHYH owns Jefferies High Yield Trading, LLC (“JHYT”), a registered broker-dealer that is engaged in the secondary sales and trading of high yield securities and special situation securities, including bank debt, post-reorganization equity, public and private equity, equity derivatives, credit default swaps and other financial instruments. JHYT makes markets
in high yield and distressed securities and provides research coverage on these types of securities. JHYT does not invest or make markets in sub-prime residential mortgage securities.
28
Jefferies and the Company each have the right to nominate two of a total of four directors to JHYH’s board, and each own 50% of the voting securities. The organizational documents also permit passive investors to invest up to $800,000,000 in JHYH. Jefferies also received additional JHYH securities entitling
it to 20% of the profits. The voting and non-voting interests are entitled to a pro rata share of the balance of the profits of JHYH, and are mandatorily redeemable in 2013, with an option to extend up to three additional one-year periods. JHYH is considered a variable interest entity that is consolidated by Jefferies, since Jefferies is the primary beneficiary. For the years ended December 31, 2009, 2008 and 2007, the Company recorded pre-tax income (losses) from this investment
of $37,200,000, $(69,100,000) and $4,300,000, respectively, under the equity method of accounting; at December 31, 2009, the Company’s investment in JHYH was $318,000,000.
For the period from January 1, 2007 through March 31, 2007, the Company recorded income under the equity method of accounting from its investment in JPOF II of $3,000,000, which was distributed to the Company shortly after the end of the period. Over the seven years the Company had its investment in JPOF II, the weighted average
return on investment was approximately 20% per year.
Fortescue
The Company invested an aggregate of $452,200,000 in Fortescue’s Pilbara iron ore and infrastructure project in Western Australia, including expenses. In exchange for its cash investment, the Company received 277,986,000 common shares of Fortescue, and a $100,000,000 note of FMG that matures in August 2019. In
the first quarter of 2010, the Company sold 30,000,000 common shares for net cash proceeds of $121,500,000, reducing its interest in Fortescue to approximately 8% of the outstanding shares. Interest on the note is calculated as 4% of the revenue, net of government royalties, invoiced from the iron ore produced from the project’s Cloud Break and Christmas Creek areas. The note is unsecured and subordinate to the project’s senior secured debt referred to below. Fortescue
is a publicly traded company on the Australian Stock Exchange, and the shares acquired by the Company may be sold without restriction on the Australian Stock Exchange or in accordance with applicable securities laws. The Company’s investment in the Fortescue common shares is classified as a non-current available for sale investment and carried at market value as of each balance sheet date. At December 31, 2009, the market value of the Fortescue common shares was $1,108,000,000, including
the shares sold in 2010.
For accounting purposes, the Company allocated its initial Fortescue investment to the common shares acquired (based on the market value at acquisition), a 13 year zero-coupon note and a prepaid mining interest. The zero-coupon note was recorded at an estimated initial fair value of $21,600,000, representing the present value
of the principal amount discounted at 12.5%. The prepaid mining interest of $184,300,000 was initially classified with other non-current assets, and is being amortized to expense as the 4% of revenue is earned. The prepaid mining interest balance was $174,300,000 at December 31, 2009. Interest is payable semi-annually within 30 days of June 30
th
and December 31
st
of
each year; however, cash interest payments on the note are currently being deferred due to covenants contained in the project’s senior secured debt. Any interest payment that is deferred earns simple interest at an annual rate of 9.5%; the aggregate accrued interest receivable balance was $106,500,000 at December 31, 2009. The ultimate value of the note will depend on the volume of iron ore shipped and iron ore prices over the remaining term of the note, which can fluctuate widely.
29
The project information presented in the paragraphs below was obtained from Fortescue’s website, (
http://www.fmgl.com.au/
), which contains substantial additional information about Fortescue, its operating activities and the project. Fortescue shipped its
first iron ore in May 2008 and announced Project Completion on July 18, 2008, a milestone defined in its debt agreements that includes mining, railing, and shipping a minimum of 2 million metric tons of product within a four week period. For the year ending December 31, 2009, Fortescue mined 34.9 million metric tons of iron ore, processed 33.9 million metric tons and shipped 32.8 million metric tons. Fortescue’s total revenue from iron ore sales for the year ending December 31, 2009
was $1,696,500,000 or $51.72 per metric ton shipped.
Fortescue announced reserve estimates for the Cloud Break and Christmas Creek areas include 143 million metric tons of proved iron ore reserves and 1.48 billion metric tons of probable iron ore reserves, in accordance with the Australasian Joint Ore Reserves Committee code. This reserve estimate is solely for these two areas,
which cover an area of approximately 770 square kilometers. Fortescue has additional tenements in the Pilbara region of Western Australia and has since announced reserve estimates for some of its other tenements. Although Fortescue has received all major approvals required under the various governmental, environmental, and native title processes for the Cloud Break and Christmas Creek tenements, it does not possess all of the approvals or financing necessary for mining activities at its
other tenements. Mining revenues derived from tenements other than Cloud Break and Christmas Creek do not increase the interest payable to the Company on the FMG note.
Fortescue’s initial feasibility study was commissioned to identify a quantity and quality of iron ore that would support an initial mine plan that produces 45 million metric tons per annum (“mtpa”) for a 20 year period. Fortescue has since launched a self-funded expansion program to increase its base mining
plan to 55 million mtpa. Fortescue has announced agreements with third parties, including relationships with the largest Chinese steel mills, which intend to purchase all of Fortescue’s production volume. Historically, the pricing for these agreements was based on the first negotiated benchmark price between the world’s largest steel mills and the world’s three largest iron ore producers. However, in 2009 these parties failed to announce a benchmark price and
Fortescue independently negotiated prices directly with its customers.
In addition to the Company’s investment and equity investments from other parties, Fortescue raised $2,051,000,000 of senior secured debt to fund the construction of its infrastructure, which includes a 260 kilometer railroad, port and related port infrastructure at Port Hedland, Australia, as well as a crushing and screening plant,
access roads and other infrastructure at the mine site.
CLC
CLC is a Spanish company that holds the exploration and mineral rights to the Las Cruces copper deposit in the Pyrite Belt of Spain. It was a consolidated subsidiary of the Company from its acquisition in September 1999 until August 2005, at which time the Company sold a 70% interest to Inmet, a Canadian-based global mining
company traded on the Toronto stock exchange (Symbol: IMN). Inmet acquired the interest in CLC in exchange for 5,600,000 newly issued Inmet common shares, representing approximately 9.98% of Inmet’s current outstanding common shares. The Inmet shares have registration rights and may be sold without restriction in accordance with applicable securities laws. The Inmet shares are reflected on the Company’s consolidated balance sheet at fair value, which was approximately
$339,100,000 at December 31, 2009 market prices. The Company retains a 30% interest in CLC.
30
Inmet has reported that the Las Cruces deposit contains approximately 8.1 million metric tons of proven reserves and 8.4 million metric tons of probable reserves of copper ore at an average grade of 6.3% copper. The reserve estimates are for the entire deposit, not just the Company’s share, assume a copper price of $2.00
per pound, an exchange rate €1.00 = U.S.$1.28, incorporate losses for mining dilution and recovery, an open pit cut-off grade of 1 percent copper and an underground cut-off grade of 3 percent copper. The capital costs to build the project were €504,000,000 ($694,000,000 at exchange rates in effect on February 16, 2010). Cash operating costs per pound of copper produced over the life of the mine are expected to average €0.48 per pound ($0.66 per pound) of copper produced. The
project’s capital and operating costs are paid for in euros, while copper revenues during the life of the mine are currently based on the U.S. dollar.
During 2009 CLC processed approximately 107,000 metric tons of copper ore and produced 5,600 metric tons of copper cathode and expects to reach commercial production (approximately 60% of design capacity) in May 2010. CLC also repaid all its indebtedness under its senior secured credit facilities, through funds received from
an intercompany loan by Inmet. The Company has guaranteed 30% of this intercompany U.S. dollar denominated loan, which had a balance of $240,100,000 at December 31, 2009. The Company has also loaned CLC €100,200,000 as of December 31, 2009 ($138,000,000 at exchange rates in effect on February 16, 2010). It is expected that CLC will require additional loans from Inmet and the Company; however, the amount and timing of the Company’s commitment has not yet been determined. Assuming
CLC achieves its mining plan, the Company expects to begin to receive cash flow distributions in 2010. At December 31, 2009, the book value of the Company’s equity investment and loans to CLC was $211,600,000.
Garcadia
The Company has entered into a joint venture agreement with Garff Enterprises, Inc. (“Garff”) pursuant to which the joint venture has acquired various automobile dealerships (“Garcadia”). The joint venture agreement specifies that the Company and Garff shall have equal board representation and equal votes
on all matters affecting Garcadia, and that all cash flows from the joint venture will be allocated 65% to the Company and 35% to Garff, which reflects that the Company made a larger equity investment. Garcadia’s strategy is to acquire automobile dealerships in secondary market locations meeting its specified return criteria. As of December 31, 2009, Garcadia owned 15 dealerships comprised of domestic and foreign automobile makers. The Company has received cash distributions
of fees and earnings aggregating $6,100,000, $6,500,000 and $4,900,000 for the years ended December 31, 2009, 2008 and 2007, respectively. In addition, the Company owns the land for certain dealerships and leases it to the dealerships for rent aggregating $5,000,000, $3,800,000 and $1,800,000 for the years ended December 31, 2009, 2008 and 2007, respectively. At December 31, 2009, the Company’s investment in Garcadia (excluding the land) was classified as an investment in associated
company with a carrying value of $35,400,000.
During 2009, the Company’s equity in losses of Garcadia includes impairment charges for goodwill and other intangible assets aggregating $32,300,000. Garcadia’s automobile dealerships have been adversely impacted by general economic conditions, and the bankruptcy filings by two of the three largest U.S. automobile
manufacturers was a change in circumstances that caused Garcadia to evaluate the recoverability of its goodwill and other intangible assets. None of Garcadia’s automobile dealerships are expected to close as a result of the restructuring of the U.S. automobile manufacturers.
Other
31
In June 2007, the Company invested $200,000,000 to acquire a 10% limited partnership interest in Pershing Square, a newly-formed private investment partnership whose investment decisions are at the sole discretion of Pershing Square’s general partner. The stated objective of Pershing Square is to create significant capital
appreciation by investing in Target Corporation. The Company recorded losses under the equity method of accounting from this investment of $3,200,000, $77,700,000 and $85,500,000 in 2009, 2008 and 2007, respectively, principally resulting from declines in the market value of Target Corporation’s common stock. At December 31, 2009, the book value of the Company’s investment in Pershing Square was $33,500,000.
The Company owns approximately 39% of the common stock of Light & Power Holdings Ltd., the parent company of The Barbados Light and Power Company Limited, the primary generator and distributor of electricity in Barbados. At December 31, 2009, the Company’s investment of $18,800,000 was accounted for on the cost method
of accounting, due to currency exchange restrictions and stock transfer restrictions.
The Company beneficially owns equity interests representing more than 5% of the outstanding capital stock of each of the following domestic public companies at February 16, 2010 (determined in accordance with Rule 13d-3 of the Securities Exchange Act of 1934): Jefferies (29.3%), ACF (25.1%), HomeFed (31.4%), International Assets
Holding Corporation (7.9%), Essex Rental Corp. (7.9%) and Rand Logistics, Inc. (5.8%). In addition to the Company’s equity interests in Fortescue and Inmet discussed above, the Company also owns a 7.0% equity interest in JZ Capital Partners Limited, a British company traded on the London Stock Exchange.
For further information about the Company’s business, including the Company’s investments, reference is made to Item 7, Management’s Discussion and Analysis of Financial Condition and Results of Operations of this Report and Notes to Consolidated Financial Statements.
Our business is subject to a number of risks. You should carefully consider the following risk factors, together with all of the other information included or incorporated by reference in this Report, before you decide whether to purchase our common stock. The risks set out below are not the only risks we face. If
any of the following risks occur, our business, financial condition and results of operations could be materially adversely affected. In such case, the trading price of our common stock could decline, and you may lose all or part of your investment.
Future acquisitions and dispositions of our operations and investments are possible, changing the components of our assets and liabilities, and if unsuccessful could reduce the value of our common shares.
Any future acquisitions or dispositions may result in significant
changes in the composition of our assets and liabilities. Consequently, our financial condition, results of operations and the trading price of our common shares may be affected by factors different from those affecting our financial condition, results of operations and trading price at the present time.
We are dependent on certain key personnel.
We are dependent on the services of Ian M. Cumming and Joseph S. Steinberg, our Chairman of the Board and President, respectively. Messrs. Cumming’s and Steinberg’s employment agreements with us expire
June 30, 2015. These individuals are also significant shareholders of our Company. As of February 16, 2010, Messrs. Cumming and Steinberg and trusts for the benefit of their respective families (excluding certain private charitable foundations) beneficially owned approximately 9.8% and 11.1% of our outstanding common shares, respectively. Accordingly, Messrs. Cumming and Steinberg exert significant influence over all matters requiring approval by our shareholders, including the
election or removal of directors and the approval of mergers or other business combination transactions.
32
We operate in a variety of industries and market sectors, all of which are very competitive and susceptible to economic downturns and are adversely affected by the current recession.
A worsening of general economic or market conditions may result in lower valuations for
our businesses or investments or have a negative impact on the credit quality of our assets. The current economic recession has adversely affected operating results in the manufacturing, telecommunications, oil and gas drilling services, property management and services, gaming entertainment and domestic real estate segments, which is likely to continue until the economy recovers.
Declines in the U.S. housing market have reduced revenues and profitability of the manufacturing businesses and may continue to do so.
Our manufacturing operations, in particular Idaho Timber, have generated significant revenues when the U.S. housing market was strong. The
weak U.S. housing market during the last few years has resulted in fewer new housing starts, which has adversely impacted revenues and profitability at Idaho Timber. Idaho Timber does not expect to return to prior levels of profitability until the U.S. housing market recovers.
The prices and availability of key raw materials affects the profitability of our manufacturing operations, and also impacts Sangart’s ability to conduct its clinical trials.
Although the Company’s operating subsidiaries are not currently experiencing any shortage
of raw materials, if the subsidiaries experience shortages, revenues and profitability of the manufacturing subsidiaries would decline. Sangart has access to sufficient raw materials to conduct its clinical trials; however, it has not secured commitments for sufficient raw materials for a commercial launch, which would also require additional investments in manufacturing capacity. In addition, the cost of the principal raw material used by Conwed Plastics, polypropylene, has increased by
approximately 42% from 2002, principally driven by the volatility of oil and natural gas prices.
Pricing on STi Prepaid’s prepaid phone card business is highly sensitive to price declines and subject to intense competition.
We believe in some instances our competitors offer or appear to offer rates to consumers that are below their cost in order to gain market
share. In addition, the emergence of competition using voice over internet protocol has further increased competition and reduced prices. The impact of lower pricing and new competitors has had and may continue to have an adverse effect on our revenues and profits.
STi Prepaid primarily relies on independent distributors to generate revenues, who may not devote sufficient efforts to promote and sell our products rather than the products of our competitors.
STi Prepaid primarily relies on independent distributors to generate revenues. Should
distributors promote other products at the expense of STi Prepaid’s products, revenues and profitability would decline.
ResortQuest’s vacation rental management services revenues have been adversely impacted by current economic conditions and its real estate brokerage revenues have declined as a result of the depressed real estate development market.
Poor general economic conditions
have caused a decrease in ResortQuest’s advance reservations, as its customers reduce amounts spent on discretionary items. ResortQuest has had to provide discounts to customers and has exited certain unprofitable locations. Its real estate brokerage business has experienced significant declines in revenues, which reflect the depressed real estate market. Until general economic conditions and the real estate market improve, ResortQuest could continue to experience declines
in revenues and profitability.
33
Increases in mortgage interest rate levels, the lack of available consumer credit and the depressed real estate market have reduced and may continue to reduce consumer demand for certain of our real estate development projects and result in impairment charges.
Due to current
depressed economic conditions in the national real estate market, most of the Company’s real estate development projects are not being marketed for sale. If the Company begins to market its development projects in the future, the ability to successfully attract customers will be highly dependent upon consumers’ ability to finance real estate purchases with affordable loans. If the Company is unable to realize its projected cash flows for its development projects, impairment charges
are likely.
Sangart is subject to extensive government regulation, cannot generate any revenue without regulatory approval of its products and is also subject to all of the risks inherent in establishing a new business.
The Company has invested approximately $146,200,000 in Sangart,
principally to help fund Sangart’s product development activities. While these funds are generally expensed by Sangart when spent, the Company cannot be assured that it will ever receive a return on its investment due to the risky nature of Sangart’s development activities. Clinical trials of Sangart’s product candidates are not complete, the products have not been approved for sale by regulatory authorities and there is a risk that its products may never prove effective
or be approved.
There are other companies developing products for the same market that Sangart is targeting, and if they are successful in bringing their product to market before Sangart it may significantly impair Sangart’s ability to compete in the same market segment.
Even if
Sangart is successful in obtaining regulatory approval to sell its products, competitors may receive approval prior to Sangart and/or have more effective products which could reduce demand for Sangart’s products.
Sangart’s success depends on its ability to obtain, maintain and defend patent protection for its products and technologies, preserve trade secrets and operate without infringing the intellectual property rights of others.
The patent positions of biopharmaceutical companies,
such as Sangart, are generally uncertain and involve complex legal and factual questions. If Sangart’s intellectual property positions are challenged, invalidated, circumvented or expire, or if Sangart fails to maintain its third-party intellectual property licenses in good standing, its ability to successfully bring MP4 products to market would be adversely affected, it could incur monetary liabilities or be required to cease using the technology or product in dispute.
Sangart will require significant additional funding for product development and clinical trial activities prior to regulatory approval and commercial launch; the source of such funding has not been identified.
Sangart’s existing cash reserves are expected to be sufficient
to fund activities into the third quarter of 2010. Sangart has had discussions with third-party investors; however, no agreements have been reached and if such agreements are entered into it would likely result in significant dilution of the Company’s interest. The Company has not determined if it will provide additional funds to Sangart. If Sangart is not provided with additional funds from either the Company or other sources when needed, it is unlikely that the Company
will ever realize a full return of its invested capital.
Keen’s revenues and profitability are impacted by natural gas supplies and prices and the supply of drilling rigs in the marketplace.
During periods of decreased demand for natural gas, Keen’s rig utilization will decline and its competitors may also have
excess capacity in the marketplace, which adversely impacts Keen’s revenues and profitability. Although there has been recent improvement in natural gas prices, Keen’s profitability will not significantly improve without increased natural gas demand to sustain the rise in natural gas prices. Increased industrial demand for natural gas, which is tied to achieving economic recovery, is required to significantly improve demand.
34
The lack of liquidity in the capital markets has and could continue to adversely affect exploration, production and development activities of Keen’s customers, which causes a reduction in Keen’s rig utilization and profitability.
The combination of low oil and
natural gas prices and the lack of liquidity in the capital markets has forced Keen’s customers to reduce drilling programs, impaired their ability to sustain their current level of operations and could adversely impact their ability to meet their cash obligations. In addition to reduced rig utilization and profitability, which could result in impairment charges for certain rigs, the difficulties being experienced by Keen’s customers could increase Keen’s bad debt expense.
The nature of Keen’s operating activities can be hazardous, and accidents can cause personal injury or death, damage to Keen’s equipment and/or environmental damage.
These hazards are inherent in the contract drilling business, and if Keen is not fully
protected through insurance coverage or indemnification from its customers any such accidents could adversely impact Keen’s profitability. Keen maintains insurance coverage and has indemnification agreements with many of its customers; however, there is no assurance that such insurance or indemnification agreements would adequately protect Keen against liability or loss from all consequences of any accidents. Additionally, there can be no assurance that adequate insurance can be purchased
economically.
New technologies could cause Keen’s drilling equipment and methods to become less competitive, resulting in reduced profitability or a requirement to make significant capital investments to remain competitive.
Improvements in drilling technology could cause Keen to
become less competitive, lose business, suffer reduced profitability or result in impairment charges to its drilling equipment.
When drilling pursuant to footage or turnkey contracts, Keen could incur unexpected cost overruns which could negatively impact Keen’s profitability.
Keen typically provides contract drilling services under daywork contracts under which Keen’s customers assume
most of the risks associated with drilling operations. If Keen enters footage or turnkey contracts, Keen is paid a fixed amount, regardless of the time required or operational problems encountered. Keen typically pays more of the out-of-pocket operating costs on a footage or turnkey contract versus daywork contract.
If Berkadia does not maintain certain specified ratings from the credit rating agencies it could lose its mortgage servicing rights.
Berkadia is required to maintain specified ratings from the credit rating agencies, and failure to do so would give its customers the right
to terminate their mortgage servicing agreements. If mortgage servicing agreements were terminated as a result of a credit ratings downgrade, the Company could lose its entire equity investment and may be exposed to loss for some or all of its guaranty on the Berkshire credit facility.
When Berkadia originates loans for Fannie Mae, it is often required to share in the losses on such loans, which could be in excess of reserved amounts.
Berkadia carries a reserve on its balance sheet for contingent losses on loans originated for Fannie Mae that have loss
sharing requirements. If actual losses exceed amounts reserved, Berkadia’s profitability will be reduced.
35
The loss of or changes in Berkadia’s relationships with U.S. Government-Sponsored Enterprises (“GSEs”) and federal agencies would have an adverse effect on Berkadia’s business.
Berkadia’s status as an approved seller/servicer for Fannie Mae
and Freddie Mac and its status as an FHA-approved mortgagee and issuer of Ginnie Mae mortgage-backed securities afford Berkadia a number of advantages. Berkadia’s failure to comply with the applicable GSE or agency standards (financial and otherwise) may result in its termination as an approved seller/servicer, mortgagee or issuer. The loss of any such status could have a material adverse impact on Berkadia’s results of operations, could result in a loss of similar approvals
from other GSEs or federal agencies and could have other adverse consequences to the business. Fannie Mae and Freddie Mac retain broad discretion to terminate Berkadia as a seller/servicer without cause upon notice.
Changes in existing government-sponsored and federal mortgage programs could negatively affect Berkadia’s business.
Berkadia’s ability to generate income through mortgage sales to institutional investors depends in part on programs sponsored by Fannie Mae, Freddie
Mac and the FHA, which facilitate the issuance of mortgage-backed securities in the secondary market. These programs have been reduced in recent periods due to current economic conditions. Any discontinuation of, or significant reduction in, the operation of those programs could have a material adverse effect on Berkadia’s loan origination and servicing business and results of operations. Also, any significant adverse change in the level of activity in the secondary market
or the underwriting criteria of these entities could negatively impact Berkadia’s results of operations and cash flow.
Berkadia’s business is significantly affected by general economic conditions, particularly in the commercial real estate industry, and could be harmed in the event of a continued prolonged economic slowdown or recession or a market downturn or disruption.
Berkadia’s
business and earnings are sensitive to changes in government policies and regulations, changes in interest rates, inflation, deflation, oversupply of real estate properties, fluctuations in the real estate and debt capital markets and developments in national and local economies. Unfavorable economic conditions could have an adverse effect on Berkadia’s business, including decreasing the demand for new loans and the servicing of loans originated by third parties.
The Company has a substantial investment in Jefferies, an investment banking and securities firm whose operating results are greatly affected by the economy and financial markets.
Although Jefferies’ operating results showed great improvement in 2009, during 2008,
turmoil in the equity and credit markets had an adverse effect on the volume and size of transactions Jefferies executed for its customers, resulting in reduced revenues and profitability in its investment banking, asset management and trading activities, as well as losses in its principal trading activities. Future declines in Jefferies operating results caused by these or other conditions could adversely affect the value of the Company’s investment.
The Company has a substantial investment in ACF, a company that purchases automobile loans made to sub-prime and other borrowers, whose operating results are greatly affected by the economy and financial markets.
If ACF’s loan losses increase as its borrowers
experience economic hardships, or if its ability to acquire new loans and grow its business is impaired, particularly due to the turmoil in the credit markets that ACF needs to access to fund its operating activities, its revenues and profits would decline, adversely affecting the value of the Company’s investment.
From time to time the Company may invest in illiquid securities that are subject to standstill agreements or otherwise restricted.
The Company’s investment in ACF is subject to a standstill agreement that expires in March 2010, and the Company’s investment in
Jefferies is subject to a standstill agreement that expires in April 2010. Should the Company need to generate liquidity quickly, the standstill agreements would limit the Company’s ability to dispose of these investments while the agreements are effective.
36
The Company has significant investments in publicly traded securities and in entities that invest in publicly traded securities, and changes in the market prices of these securities, particularly during times of increased volatility in security prices, can have a material impact on the Company’s
investment portfolio, equity and, for certain investments, on results of operations.
The Company has significant investments in publicly traded securities (principally Fortescue, Jefferies, ACF and Inmet) and in investment partnerships or other entities that invest in publicly traded securities (including JHYH). Changes in the market values of publicly traded available for sale securities, such as Fortescue and Inmet, are reflected in other comprehensive income (loss) and equity but
not in the consolidated statement of operations. However, changes in the market prices of investments for which the Company has elected the fair value option (Jefferies and ACF), and declines in the fair values of public and non-public securities that the Company deems to be other than temporary are reflected in the consolidated statements of operations and equity. Profits or losses related to the Company’s share of its investments in investment partnerships or other entities that
are accounted for under the equity method of accounting are reflected in the consolidated statement of operations. Changes in market values of these entities’ investments are reflected in their earnings, which increases the Company’s exposure to volatility in the public securities markets. Global securities markets have been highly volatile, and continued volatility may have a material negative impact on the Company’s consolidated financial position and results of operations.
Current economic conditions have adversely affected most of the Company’s operations and investments. A worsening of current economic conditions or a prolonged recession could cause a decline in estimated future cash flows expected to be generated by certain of the Company’s
operations and investments, potentially resulting in impairment charges for long-lived assets.
Certain of the Company’s operating businesses and investments have significant investments in long-lived assets, in particular manufacturing, oil and gas drilling services and gaming entertainment. Current economic conditions have resulted in declining revenues for these operations and their property and equipment is not being fully utilized. The Company has reviewed certain
of these assets and investments for potential impairment, and except as otherwise disclosed has concluded that the book values of these long-lived assets are recoverable. If the operating revenues of these businesses deteriorate in the future, and/or the Company lowers its estimates of future cash flows, impairment charges might have to be recorded.
The Company has incurred costs to investigate and evaluate the development of a number of large scale energy projects; however, development of these projects is subject to obtaining significant third-party debt and equity financing and regulatory approvals.
Although the
Company has spent material amounts in the investigation of large scale energy projects, it will not be able to develop these projects without financing from other sources and various regulatory approvals. The timing of the commencement of construction of any project is also dependent upon the receipt of financing and regulatory approvals. If the Company is unable to obtain such financing or approvals, it will not be able to recover its investment.
The Company has substantial investments in Fortescue, Inmet and CLC, entities which are engaged in the mining of base metals (principally iron ore and copper), the prices of which have been volatile and can reduce the value of the Company’s investments.
The value
of the Company’s investment in the base mining sector rise and fall with the changes in the underlying base metal prices. In addition, mining operations are often subject to delay and regulatory scrutiny, which can increase costs or delay bringing mines into full production. Pricing changes and mining delays have a direct impact on the value of the Company’s investments, and could adversely impact results of operations and equity.
37
We could experience significant increases in operating costs and reduced profitability due to competition for skilled management and staff employees in our operating businesses.
The Company competes with many other entities for skilled management and staff employees, including
entities that operate in different market sectors than the Company. Costs to recruit and retain adequate personnel could adversely affect results of operations.
From time to time we are subject to litigation, for which we may be unable to accurately assess our level of exposure and which if adversely determined, may have a material adverse effect on our consolidated financial condition or results of operations.
The Company and
its subsidiaries are or may become parties to legal proceedings that are considered to be either ordinary, routine litigation incidental to their business or not material to the Company’s consolidated financial position or liquidity. However, adverse determinations in specific legal matters could have a material adverse impact on the Company’s consolidated financial position or results of operations.
We may not be able to generate sufficient taxable income to fully utilize our NOLs.
At December 31, 2009, the Company has recorded a valuation allowance against substantially all of the net deferred tax asset due to the uncertainty about its ability to generate future taxable
income to utilize that asset.
We may not be able to insure certain risks economically.
We cannot be certain that we will be able to insure all risks that we desire to insure economically or that all of our insurers or reinsurers will be financially viable if we make a claim. If an uninsured
loss or a loss in excess of insured limits should occur, or if the Company is required to pay a deductible for an insured loss, results of operations could be adversely affected. Premier has been severely damaged by hurricanes in the past, and it is possible that storms could cause significant damage in the future. Damages from storms could result in Premier closing its facility to make repairs, resulting in lost business and adversely affecting results of operations.
We did not pay dividends on our common shares in 2009 or 2008 and the payment of dividends in the future is subject to the discretion of our Board of Directors.
Our common shares are subject to transfer restrictions.
We and certain of our subsidiaries have significant NOLs and other tax attributes, the amount and availability of which are subject to certain qualifications, limitations and uncertainties. In order to reduce
the possibility that certain changes in ownership could result in limitations on the use of the tax attributes, our certificate of incorporation contains provisions that generally restrict the ability of a person or entity from acquiring ownership (including through attribution under the tax law) of 5% or more of our common shares and the ability of persons or entities now owning 5% or more of our common shares from acquiring additional common shares. The restriction will remain until the earliest
of (a) December 31, 2024, (b) the repeal of Section 382 of the Internal Revenue Code (or any comparable successor provision) and (c) the beginning of our taxable year to which these tax attributes may no longer be carried forward. The restriction may be waived by our Board of Directors. Shareholders are advised to carefully monitor their ownership of our common shares and consult their own legal advisors and/or us to determine whether their ownership of our common shares approaches the proscribed level.
38
|
|
Not applicable.
|
|
Real estate investments that are part of the Company’s Domestic Real Estate segment are described in Item 1 of this Report. Idaho Timber’s plants and sawmills, which are the principal properties used in its business are described in Item 1 of this Report.
Through its various subsidiaries, the Company owns and utilizes facilities in Salt Lake City, Utah for corporate office space and other activities (totaling approximately 21,800 square feet). Subsidiaries of the Company own facilities primarily used for plastics manufacturing located in Georgia, Virginia and Genk, Belgium (totaling
approximately 457,300 square feet), facilities and land in California, Oregon and Washington used for winery operations (totaling approximately 160,300 square feet and 1,138 acres, respectively), facilities and land in Florida, South Carolina and Colorado used for property management and services (totaling approximately 60,800 square feet and 13 acres, respectively), and facilities and land in Oklahoma used for oil and gas drilling services (totaling approximately 33,100 square feet and 36 acres, respectively).
Premier’s Hard Rock Hotel & Casino facility is approximately 592,000 square feet and is located on an 8.5 acre site which includes land that is owned by Premier and adjacent water bottom which is leased from the State of Mississippi.
The Company and its subsidiaries lease numerous manufacturing, warehousing, office and headquarters facilities. The facilities vary in size and have leases expiring at various times, subject, in certain instances, to renewal options. A subsidiary of the Company also leases space in New York, New York for corporate
and other activities (approximately 32,600 square feet). See Notes to Consolidated Financial Statements.
|
|
The Company and its subsidiaries are parties to legal proceedings that are considered to be either ordinary, routine litigation incidental to their business or not material to the Company’s consolidated financial position or liquidity.
Reference is made to the disclosure of certain legal proceedings contained in the Company’s Annual Report to Shareholders on Form 10-K for the year ended December 31, 2008 (the “2008 Form 10-K”) and in the Company’s Form 10-Qs for the quarters ending March 31, 2009, June 30, 2009 and September 30, 2009.
The previously disclosed action, IDT Telecom and Union Telecard Alliance, LLC v. CVT Prepaid Solutions, Inc., et al., (No. 07-1076, D.N.J.), pending in the District of New Jersey federal court is currently scheduled to go to trial on March 1, 2010. On December 28, 2009, the court granted the summary judgment motion of STi Prepaid,
LLC, the Company’s majority controlled subsidiary. As a result, all claims asserted against STi Prepaid have been dismissed. On January 11, 2010, Plaintiffs in this action moved to have the Court certify its summary judgment motion decision for appeal. This motion was subsequently withdrawn without prejudice.
39
STi Prepaid is also a defendant in a class action entitled Ramirez et al. v. STi Prepaid, LLC et al., Civ. No. 08-1089 (SDW) (MCA) (D.N.J.). The Company believes that the material allegations in this action, which arise out of conduct similar to conduct underlying the IDT action, are without merit and is defending this action vigorously.
The parties have been discussing a settlement of this action and on January 8, 2010, the plaintiffs filed a motion to enforce the purported settlement and for preliminary approval of the settlement. The parties are continuing settlement negotiations while the motion is being briefed. If the action does not settle, the Company believes that it is reasonably possible that a loss that could be material could be incurred; however, any potential loss can not be reasonably estimated. Another
class action entitled, Soto v. STi Prepaid, LLC et al. was settled on terms that did not involve any material payment by the Company or its subsidiaries.
The Company and its subsidiaries are also parties to legal proceedings that are considered to be either ordinary, routine litigation incidental to their business or not material to the Company's consolidated financial position or liquidity.
|
|
Not applicable.
|
|
All executive officers of the Company are elected at the organizational meeting of the Board of Directors of the Company held annually and serve at the pleasure of the Board of Directors. As of February 16, 2010, the executive officers of the Company, their ages, the positions held by them and the periods during which they have
served in such positions were as follows:
|
Name
|
Age
|
Position with Leucadia
|
Office Held Since
|
|
Ian M. Cumming
|
69
|
Chairman of the Board
|
June 1978
|
|
Joseph S. Steinberg
|
66
|
President
|
January 1979
|
|
Thomas E. Mara
|
64
|
Executive Vice President
|
May 1980
|
|
Joseph A. Orlando
|
54
|
Vice President and
|
January 1994;
|
|
Chief Financial Officer
|
April 1996
|
||
|
Barbara L. Lowenthal
|
55
|
Vice President and
|
April 1996
|
|
Comptroller
|
|||
|
Justin R. Wheeler
|
37
|
Vice President
|
October 2006
|
|
Joseph M. O’Connor
|
34
|
Vice President
|
May 2007
|
|
Rocco J. Nittoli
|
51
|
Vice President and
|
September 2007;
|
|
Treasurer
|
May 2007
|
Mr. Cumming has served as a director and Chairman of the Board of the Company since June 1978. Mr. Cumming has also been a director of Skywest, Inc., a Utah-based regional air carrier, since June 1986 and a director of HomeFed since May 1999. Mr. Cumming has been a director of ACF since March 2008 and a director of
Jefferies since April 2008. Mr. Cumming has been a director of Fortescue since August 2009. Since August 2001, Mr. Cumming served as a director and Chairman of the Board of The FINOVA Group Inc. (“FINOVA”), formerly a middle market lender that was dissolved in November 2009.
40
Mr. Steinberg has served as a director of the Company since December 1978 and as President of the Company since January 1979. In addition, he has served as a director of HomeFed since August 1998 (Chairman since December 1999) and Jefferies since April 2008. Mr. Steinberg was a director of Fortescue from August 2006
to August 2009 and is an alternate director of Fortescue should Mr. Cumming be unavailable to vote on Fortescue board matters. Since August 2001, Mr. Steinberg served as a director of FINOVA.
Mr. Mara joined the Company in April 1977 and was elected Vice President of the Company in May 1977. He has served as Executive Vice President of the Company since May 1980 and as Treasurer of the Company from January 1993 to May 2007. In addition, he has served as a director of Inmet since August 2005 and as a director
and Chief Executive Officer of FINOVA since September 2002.
Mr. Orlando, a certified public accountant, has served as Chief Financial Officer of the Company since April 1996 and as Vice President of the Company since January 1994.
Ms. Lowenthal, a certified public accountant, has served as Vice President and Comptroller of the Company since April 1996.
Mr. Wheeler joined the Company in March 2000, and has served in a variety of capacities in the Company’s subsidiaries and as Vice President of the Company since October 2006. In addition, he has served as a director of ACF since March 2008 and as a director of International Assets Holding Corporation since November 2004.
Mr. O’Connor joined the Company in August 2001 and has served as Vice President of the Company since May 2007.
Mr. Nittoli joined the Company in September 1997, and has served in a variety of capacities in the Company’s subsidiaries and as Treasurer of the Company since May 2007, and as Vice President of the Company since September 2007.
|
Item 5.
|
Market for Registrant’s Common Equity, Related Stockholder Matters and Issuer Purchases of Equity Securities
.
|
The common shares of the Company are traded on the NYSE under the symbol LUK. The following table sets forth, for the calendar periods indicated, the high and low sales price per common share on the consolidated transaction reporting system, as reported by the Bloomberg Professional Service provided by Bloomberg L.P.
41
|
Common Share
|
||||||||
|
High
|
Low
|
|||||||
|
2008
|
||||||||
|
First Quarter
|
$ | 47.92 | $ | 39.53 | ||||
|
Second Quarter
|
56.90 | 45.72 | ||||||
|
Third Quarter
|
48.85 | 35.72 | ||||||
|
Fourth Quarter
|
45.00 | 12.19 | ||||||
|
2009
|
||||||||
|
First Quarter
|
$ | 22.99 | $ | 10.26 | ||||
|
Second Quarter
|
26.31 | 14.20 | ||||||
|
Third Quarter
|
26.47 | 18.00 | ||||||
|
Fourth Quarter
|
26.17 | 21.01 | ||||||
|
2010
|
||||||||
|
First Quarter (through February 16, 2010)
|
$ | 26.06 | $ | 21.30 | ||||
As of February 16, 2010, there were approximately 2,284 record holders of the common shares.
The Company did not pay any cash dividends in 2009 or 2008 and paid cash dividends of $0.25 per common share in 2007. The payment of dividends in the future is subject to the discretion of the Board of Directors and will depend upon general business conditions, legal and contractual restrictions on the payment of dividends and
other factors that the Board of Directors may deem to be relevant.
Certain subsidiaries of the Company have significant NOLs and other tax attributes, the amount and availability of which are subject to certain qualifications, limitations and uncertainties. In order to reduce the possibility that certain changes in ownership could result in limitations on the use of the Company’s tax
attributes, the Company's certificate of incorporation contains provisions which generally restrict the ability of a person or entity from acquiring ownership (including through attribution under the tax law) of five percent or more of the common shares and the ability of persons or entities now owning five percent or more of the common shares from acquiring additional common shares. The restrictions will remain in effect until the earliest of (a) December 31, 2024, (b) the repeal of Section 382 of
the Internal Revenue Code (or any comparable successor provision) or (c) the beginning of a taxable year of the Company to which certain tax benefits may no longer be carried forward.
The Company did not purchase any of its common shares during the fourth quarter of 2009.
The Board of Directors from time to time has authorized acquisitions of the Company’s common shares. At December 31, 2009, the Company is authorized to purchase 11,992,829 common shares.
42
Stockholder Return Performance Graph
Set forth below is a graph comparing the cumulative total stockholder return on our common shares against the cumulative total return of the Standard & Poor’s 500 Stock Index and the Standard & Poor’s 1500 Industrial Conglomerates Index for the period commencing December 31, 2004 to December 31, 2009. Index
data was furnished by Standard & Poor’s Capital IQ. The graph assumes that $100 was invested on December 31, 2004 in each of our common stock, the S&P 500 Index, and the S&P 1500 Industrial Conglomerates Index and that all dividends were reinvested.
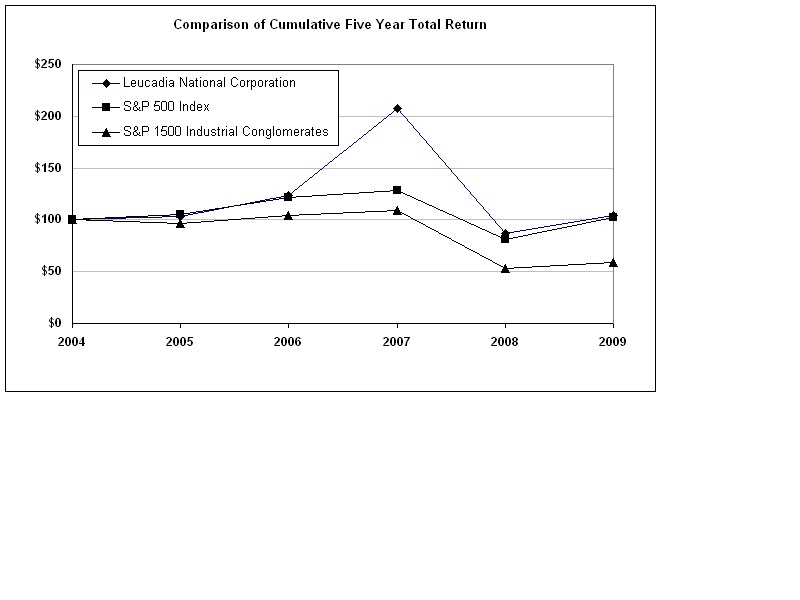
43
|
|
|
The following selected financial data have been summarized from the Company’s consolidated financial statements and are qualified in their entirety by reference to, and should be read in conjunction with, such consolidated financial statements and Item 7, Management’s Discussion and Analysis of Financial Condition and Results of Operations of this Report.
|
|
Year Ended December 31,
|
||||||||||||||||||||
|
2009
|
2008
|
2007
|
2006
|
2005
|
||||||||||||||||
|
(In thousands, except per share amounts)
|
||||||||||||||||||||
|
SELECTED INCOME STATEMENT DATA: (a)
|
||||||||||||||||||||
|
Revenues and other income (b)
|
$ | 1,119,002 | $ | 1,080,653 | $ | 1,154,895 | $ | 862,672 | $ | 689,883 | ||||||||||
|
Expenses
|
1,369,975 | 1,448,608 | 1,216,138 | 721,978 | 554,709 | |||||||||||||||
|
Income (loss) from continuing operations before income taxes and income (losses) related to associated companies
|
(250,973 | ) | (367,955 | ) | (61,243 | ) | 140,694 | 135,174 | ||||||||||||
|
Income (loss) from continuing operations before income (losses) related to associated companies
|
(258,116 | ) | (2,041,630 | ) | 498,528 | 98,923 | 1,266,212 | |||||||||||||
|
Income (losses) related to associated companies, net of taxes
|
780,236 | (539,068 | ) | (21,875 | ) | 37,720 | (45,133 | ) | ||||||||||||
|
Income (loss) from continuing operations (c)
|
522,120 | (2,580,698 | ) | 476,653 | 136,643 | 1,221,079 | ||||||||||||||
|
Income from discontinued operations, including gain (loss) on disposal, net of taxes
|
26,475 | 43,886 | 3,619 | 59,630 | 415,701 | |||||||||||||||
|
Net income (loss) attributable to Leucadia National
|
||||||||||||||||||||
|
Corporation common shareholders
|
550,280 | (2,535,425 | ) | 484,294 | 189,399 | 1,636,041 | ||||||||||||||
|
Per share:
|
||||||||||||||||||||
|
Basic earnings (loss) per common share attributable
|
||||||||||||||||||||
|
to Leucadia National Corporation common
|
||||||||||||||||||||
|
shareholders:
|
||||||||||||||||||||
|
Income (loss) from continuing operations
|
$ | 2.17 | $ | (11.19 | ) | $ | 2.20 | $ | .60 | $ | 5.66 | |||||||||
|
Income from discontinued operations, including gain (loss) on disposal
|
.11 | .19 | .02 | .28 | 1.93 | |||||||||||||||
|
Net income (loss)
|
$ | 2.28 | $ | (11.00 | ) | $ | 2.22 | $ | .88 | $ | 7.59 | |||||||||
|
Diluted earnings (loss) per common share attributable
|
||||||||||||||||||||
|
to Leucadia National Corporation common
|
||||||||||||||||||||
|
shareholders:
|
||||||||||||||||||||
|
Income (loss) from continuing operations
|
$ | 2.14 | $ | (11.19 | ) | $ | 2.09 | $ | .60 | $ | 5.34 | |||||||||
|
Income from discontinued operations, including gain (loss) on disposal
|
. 11 | .19 | .01 | .25 | 1.80 | |||||||||||||||
|
Net income (loss)
|
$ | 2.25 | $ | (11.00 | ) | $ | 2.10 | $ | .85 | $ | 7.14 | |||||||||
|
At December 31,
|
||||||||||||||||||||
|
2009
|
2008
|
2007
|
2006
|
2005
|
||||||||||||||||
|
(In thousands, except per share amounts)
|
||||||||||||||||||||
|
SELECTED BALANCE SHEET DATA: (a)
|
||||||||||||||||||||
|
Cash and investments
|
$ | 2,367,073 | $ | 1,631,979 | $ | 4,216,690 | $ | 2,657,021 | $ | 2,687,846 | ||||||||||
|
Total assets
|
6,762,364 | 5,198,493 | 8,126,622 | 5,303,824 | 5,260,884 | |||||||||||||||
|
Debt, including current maturities
|
1,970,371 | 2,081,456 | 2,136,550 | 1,159,461 | 1,162,382 | |||||||||||||||
|
Shareholders’ equity
|
4,361,647 | 2,676,797 | 5,570,492 | 3,893,275 | 3,661,914 | |||||||||||||||
|
Book value per common share
|
$ | 17.93 | $ | 11.22 | $ | 25.03 | $ | 18.00 | $ | 16.95 | ||||||||||
|
Cash dividends per common share
|
$ | – | $ | – | $ | .25 | $ | .25 | $ | .13 | ||||||||||
|
(a)
|
Subsidiaries are reflected above as consolidated entities from the date of acquisition as follows: Keen, November 2009; ResortQuest, June 2007; STi Prepaid, March 2007; Sangart, November 2005; and Idaho Timber, May 2005. For the periods prior to the acquisition, the Company accounted for its equity interest in Keen under the equity method of
accounting. As discussed above, Premier is reflected as a consolidated subsidiary from May 2006 until it was deconsolidated in September 2006; it once again became a consolidated subsidiary in August 2007. For additional information, see Note 3 of Notes to Consolidated Financial Statements.
|
44
|
(b)
|
Includes net securities gains (losses) of $(21,106,000), $(144,542,000), $95,641,000, $117,159,000 and $208,816,000 for the years ended December 31, 2009, 2008, 2007, 2006 and 2005, respectively. Net securities gains (losses) are net of impairment charges of $31,400,000, $143,400,000, $36,800,000, $12,900,000 and $12,200,000 for the years ended
December 31, 2009, 2008, 2007, 2006 and 2005, respectively.
|
|
(c)
|
During 2008, the Company recorded a charge to income tax expense of $1,672,100,000 to reserve for substantially all of its net deferred tax asset due to the uncertainty about the Company’s ability to generate sufficient taxable income to realize the deferred tax asset. During 2007 and 2005,
the Company concluded that it was more likely than not that it would be able to realize a portion of the net deferred tax asset; accordingly, $542,700,000 in 2007 and $1,135,100,000 in 2005 of the deferred tax valuation allowance was reversed as a credit to income tax expense.
|
|
|
The purpose of this section is to discuss and analyze the Company’s consolidated financial condition, liquidity and capital resources and results of operations. This analysis should be read in conjunction with the consolidated financial statements, related footnote disclosures and “Cautionary Statement for Forward-Looking
Information,” which appear elsewhere in this Report.
Liquidity and Capital Resources
General
The Company’s investment portfolio, equity and results of operations can be significantly impacted by the changes in market values of certain securities, particularly during times of increased volatility in security prices. Changes in the market values of publicly traded available for sale securities are reflected in other
comprehensive income (loss) and equity. However, changes in the market prices of investments for which the Company has elected the fair value option, declines in the fair values of equity securities that the Company deems to be other than temporary and declines in the fair values of debt securities related to credit losses are reflected in the consolidated statements of operations and equity. The Company also has non-controlling investments in entities that are engaged in investing and/or
securities transactions activities that are accounted for on the equity method of accounting (classified as investments in associated companies), for which the Company records its share of the entities’ profits or losses in its consolidated statements of operations. These entities typically invest in public securities, with changes in market values reflected in their earnings, which increases the Company’s exposure to volatility in the public securities markets.
The Company’s largest publicly traded available for sale equity securities with changes in market values reflected in other comprehensive income (loss) are Fortescue and Inmet. During the year ended December 31, 2009, the market value of the Company’s investment in the common shares of Fortescue increased from $377,000,000
to $1,108,000,000, and the market value of the Company’s investment in Inmet increased from $90,000,000 to $339,100,000. The market values of the Company’s investments in ACF and Jefferies, for which the fair value option was elected, increased during the year with unrealized gains reflected in operations as a component of income related to associated companies. During the year ended December 31, 2009, the Company recognized unrealized gains related to its investments in ACF
and Jefferies of $376,500,000 and $469,800,000, respectively. During 2009, the Company also recorded impairment losses for declines in value of securities deemed to be other than temporary in its consolidated statement of operations of $31,400,000, reflected as a component of net securities gains (losses).
Liquidity
Leucadia National Corporation (the “Parent”) is a holding company whose assets principally consist of the stock of its direct subsidiaries, cash and cash equivalents and other non-controlling investments in debt and equity securities. The Parent continuously evaluates the retention and disposition of its existing
operations and investments and investigates possible acquisitions of new businesses in order to maximize shareholder value. Accordingly, further acquisitions, divestitures, investments and changes in capital structure are possible. Its principal sources of funds are its available cash resources, liquid investments, public and private capital market transactions, repayment of subsidiary advances, funds distributed from its subsidiaries as tax sharing payments, management and other fees, and
borrowings and dividends from its subsidiaries, as well as dispositions of existing businesses and investments.
In addition to cash and cash equivalents, the Company also considers investments classified as current assets and investments classified as non-current assets on the face of its consolidated balance sheet as being generally available to meet its liquidity needs. Securities classified as current and non-current investments
are not as liquid as cash and cash equivalents, but they are generally easily convertible into cash within a relatively short period of time. As of December 31, 2009, the sum of these amounts aggregated $2,367,100,000. However, since $484,500,000 of this amount is pledged as collateral pursuant to various agreements, represents investments in non-public securities or is held by subsidiaries that are party to agreements that restrict the Company’s ability to use the funds for other
purposes, the Company does not consider those amounts to be available to meet the Parent’s liquidity needs. The $1,882,600,000 that is available is comprised of cash and short-term bonds and notes of the U.S. Government and its agencies, U.S. Government-Sponsored Enterprises and other publicly traded debt and equity securities (including the Fortescue common shares of $1,108,000,000 and the Inmet common shares of $339,100,000). The Parent’s available liquidity, and the investment
income realized from the Parent’s cash, cash equivalents and marketable securities is used to meet the Parent company’s short-term recurring cash requirements, which are principally the payment of interest on its debt and corporate overhead expenses.
45
The Parent’s only long-term cash requirement is to make principal payments on its long-term debt ($1,628,700,000 principal outstanding as of December 31, 2009), of which $439,400,000 is due in 2013, $97,600,000 is due in 2014, $500,000,000 is due in 2015, $500,000,000 is due in 2017 and $91,700,000 is due in 2027. Historically,
the Parent has used its available liquidity to make acquisitions of new businesses and other investments, but, except as disclosed in this Report, the timing of any future investments and the cost can not be predicted.
From time to time in the past, the Company has accessed public and private credit markets and raised capital in underwritten bond financings. The funds raised have been used by the Company for general corporate purposes, including for its existing businesses and new investment opportunities. However, given the recent
illiquidity in the credit markets, if the Company were to try to raise funds through an underwritten bond offering it may be at a higher interest rate than in the past, or with terms that the Company may not find acceptable. The Company has no current intention to seek additional bond financing, and will rely on its existing liquidity to fund corporate overhead expenses and corporate interest payments and, to fund new investing opportunities, it may also dispose of existing businesses and investments. The
Parent’s senior debt obligations are rated two levels below investment grade by Moody’s Investors Services and one level below investment grade by Standard & Poor’s and Fitch Ratings. Ratings issued by bond rating agencies are subject to change at any time.
In February 2009, the Board of Directors authorized the Company, from time to time, to purchase its outstanding debt securities through cash purchases in open market transactions, privately negotiated transactions or otherwise. Such repurchases, if any, depend upon prevailing market conditions, the Company’s liquidity
requirements and other factors; such purchases may be commenced or suspended at any time without notice. During 2009, the Company repurchased $35,600,000 principal amount of its 7% Senior Notes due 2013 and $6,500,000 principal amount of its 8.65% Junior Subordinated Deferrable Interest Debentures due 2027.
During 2009, the Company issued 5,378,606 common shares upon the conversion of $123,529,000 principal amount of the Company’s 3¾% Convertible Senior Subordinated Notes due 2014, pursuant to privately negotiated transactions to induce conversion. The number of common shares issued was in accordance with the terms
of the notes; however, the Company paid the former noteholders $26,000,000 to induce conversion. The additional cash payments were recorded as selling, general and other expenses.
In the first quarter of 2009, the Company invested an additional $28,500,000 in Sangart upon the exercise of its remaining warrants, which increased its ownership interest to approximately 92%. Exercising the warrants resulted in the acquisition of a portion of the noncontrolling interest; accordingly, a reduction to the noncontrolling
interest of $1,900,000 was recorded. The additional investment along with Sangart’s existing cash resources is expected to provide Sangart with sufficient capital to fund activities into the third quarter of 2010. Thereafter, significant additional funding will be needed for product development and clinical trial activities prior to regulatory approval and commercial launch; the source of such funding has not as yet been determined.
In April 2009, the Company’s real estate subsidiary, MB1, received several notices of default with respect to nonrecourse indebtedness ($100,500,000 at December 31, 2009) that is collateralized by its real estate project. Although MB1’s bank loan matured in October 2009, it was not repaid since MB1 did not have sufficient
funds to do so and the Company is under no obligation and has no intention to contribute additional capital to MB1 to pay off the loan. MB1 received an additional default notice for failure to repay the bank loan but its lenders have not commenced foreclosure proceedings. The loan has been classified as a current liability as of December 31, 2009 and 2008.
In June 2009, the Company terminated its $100,000,000 bank credit facility; no amounts were outstanding under this facility.
In November 2009, the Company purchased the other 50% equity interest in Keen that it did not own plus a secured note payable to the other equity owner of Keen for aggregate cash consideration of $15,000,000. When the Company acquired the controlling interest in Keen in November 2009 it became a consolidated subsidiary; prior
to that time the investment in Keen was classified as an investment in an associated company.
In December 2009, Berkadia acquired the North American commercial mortgage origination and servicing business of Capmark. The Company and Berkshire Hathaway each have a 50% equity interest in Berkadia, and each party contributed $217,200,000 of equity capital to fund the acquisition. In addition, a subsidiary of Berkshire
Hathaway provided Berkadia with a five-year $1 billion secured credit facility, which was used to purchase outstanding mortgage loans and servicer advances from Capmark. The credit facility may be used to fund mortgage loans and servicer advances, to purchase mortgage servicing rights and for working capital needs. The Company has guaranteed Berkadia’s repayment of 50% of the credit facility when due ($580,500,000 was outstanding under the facility at December 31, 2009).
As of December 31, 2009, the Company had acquired approximately 25% of the outstanding common shares of ACF for aggregate cash consideration of $418,600,000. The Company’s investment in ACF is classified as an investment in an associated company and carried at fair value, which was $639,800,000 at December 31, 2009 market
prices. As of December 31, 2009, the Company had acquired approximately 29% of the outstanding common shares of Jefferies for cash and common shares of the Company aggregating $794,400,000. The Company’s investment in Jefferies is classified as an investment in an associated company and carried at fair value, which was $1,152,900,000 at December 31, 2009 market prices. The Company’s investment in ACF is subject to a standstill agreement which expires in March 2010
and its investment in Jefferies is subject to a standstill agreement which expires in April 2010.
46
During the years ended December 31, 2009 and 2008, the Company received distributions totaling $11,300,000 and $44,900,000, respectively, from its subsidiary, Empire Insurance Company (“Empire”), which has been undergoing a voluntary liquidation since 2001. The Company had classified Empire as a discontinued operation
in 2001 and fully wrote-off its remaining book value based on its expected future cash flows at that time. Although Empire no longer writes any insurance business, its orderly liquidation over the years has resulted in reductions to its estimated claim reserves that enabled Empire to pay the distributions, with the approval of the New York Insurance Department. Since future distributions from Empire, if any, are subject to New York insurance law or the approval of the New York Insurance Department,
income will only be recognized when received.
In February 2010, the Company sold 30,000,000 common shares of Fortescue for net cash proceeds of $121,500,000, which will result in the recognition of a net securities gain of $94,900,000 in the first quarter of 2010.
In March 2007, the Board of Directors increased the number of the Company’s common shares that the Company is authorized to purchase. Such purchases may be made from time to time in the open market, through block trades or otherwise. Depending on market conditions and other factors, such purchases may be commenced
or suspended at any time without notice. During the three year period ended December 31, 2009, the only common shares acquired by the Company were in connection with the exercise of stock options. As of February 16, 2010, the Company is authorized to repurchase 11,992,829 common shares.
The Company and certain of its subsidiaries have substantial NOLs and other tax attributes. The amount and availability of the NOLs and other tax attributes are subject to certain qualifications, limitations and uncertainties. In order to reduce the possibility that certain changes in ownership could impose limitations
on the use of the NOLs, the Company’s certificate of incorporation contains provisions which generally restrict the ability of a person or entity from acquiring ownership (including through attribution under the tax law) of five percent or more of the common shares and the ability of persons or entities now owning five percent or more of the common shares from acquiring additional common shares. The restrictions will remain in effect until the earliest of (a) December 31, 2024, (b) the repeal
of Section 382 of the Internal Revenue Code (or any comparable successor provision) or (c) the beginning of a taxable year of the Company to which certain tax benefits may no longer be carried forward. For more information about the NOLs and other tax attributes, see Note 17 of Notes to Consolidated Financial Statements.
Consolidated Statements of Cash Flows
As discussed above, the Company relies on the Parent’s available liquidity to meet its short-term and long-term needs, and to make acquisitions of new businesses and investments. Except as otherwise disclosed herein, the Company’s operating businesses do not generally require material funds from the Parent to support
their operating activities, and the Parent does not depend on positive cash flow from its operating segments to meet its liquidity needs. The components of the Company’s operating businesses and investments change frequently as a result of acquisitions or divestitures, the timing of which is impossible to predict but which often have a material impact on the Company’s consolidated statements of cash flows in any one period. Further, the timing and amounts of distributions from
certain of the Company’s investments in partnerships accounted for under the equity method are generally outside the control of the Company. As a result, reported cash flows from operating, investing and financing activities do not generally follow any particular pattern or trend, and reported results in the most recent period should not be expected to recur in any subsequent period.
47
Net cash of $133,400,000 was used for operating activities in 2009 as compared to $8,800,000 of net cash provided by operating activities in 2008. The change in operating cash flows reflects decreased funds generated from activity in the trading portfolio and decreased distributions of earnings from associated companies. STi
Prepaid’s telecommunications operations generated funds from operating activities of $3,400,000 during 2009 as compared to $5,900,000 generated during 2008. The funds used by the Company’s property management and services segment during 2009 were not material and were $7,800,000 during 2008, primarily reflecting reduced receivables; Premier generated funds of $21,900,000 and $13,300,000 during 2009 and 2008, respectively, primarily reflecting increased operating results; Keen used funds
of $5,400,000 during the period from acquisition through December 31, 2009; and the Company’s manufacturing segments generated funds from operating activities of $30,300,000 and $36,900,000 in 2009 and 2008, respectively, primarily reflecting decreased operating results. Funds used by Sangart, a development stage company, decreased to $20,300,000 during 2009 from $35,000,000 during 2008. In 2009, distributions from associated companies principally include earnings distributed by HFH
ShortPLUS Fund, L.P. (“Shortplus”) ($14,500,000), Keen ($8,400,000) and Garcadia ($11,100,000). Funds provided by operating activities include $11,300,000 and $44,900,000 in 2009 and 2008, respectively, from funds distributed by Empire, a discontinued operation. In 2008, distributions from associated companies principally include earnings distributed by Shortplus ($50,000,000), JHYH ($4,300,000), Jefferies ($5,500,000), Keen ($16,100,000) and Garcadia ($10,300,000).
Net cash of $8,800,000 was provided by operating activities in 2008 as compared to $18,400,000 of net cash used for operating activities in 2007. The change reflects increased funds generated from the trading portfolio, increased distributions of earnings from associated companies and a use of funds for increased interest expense
payments. Funds used for operating activities during 2008 include the results of companies acquired during 2007, STi Prepaid and ResortQuest, and the results of Premier following its reconsolidation in the third quarter of 2007. STi Prepaid’s telecommunications operations generated funds from operating activities of $5,900,000 and $26,700,000 during the 2008 and 2007, respectively, the Company’s property management and services segment used funds of $7,800,000 in 2008 and generated
funds from operating activities of $4,000,000 in 2007, Premier generated funds of $13,300,000 in 2008 and used funds of $30,100,000 in 2007 and the Company’s manufacturing segments generated funds of $36,900,000 and $30,400,000 in 2008 and 2007, respectively. The decrease in funds generated by STi Prepaid principally reflects reduced operating profits and additional investments in net working capital of acquired businesses. The reduction in Premier’s use of funds principally
reflects cash used in 2007 for bankruptcy and reconstruction related items. The decrease in operating cash flows at the property management and services segment principally results from the net change in restricted cash at ResortQuest. Funds used by Sangart increased to $35,000,000 during 2008 from $24,800,000 during 2007. Funds provided by operating activities in 2008 also include $44,900,000 of funds distributed by Empire. In 2007, distributions from associated companies
principally include earnings distributed by JPOF II ($29,200,000), EagleRock Capital Partners (QP), LP (“EagleRock”) ($15,000,000) and Garcadia ($6,700,000).
Net cash of $72,000,000 was provided by investing activities in 2009 as compared to net cash flows used for investing activities of $403,000,000 in 2008 and $957,400,000 in 2007. During 2008, funds used for acquisitions of and capital expenditures for real estate investments principally relate to the Myrtle Beach project ($67,000,000),
land used by certain Garcadia dealerships ($20,400,000) and the real estate development projects in Maine ($7,500,000). During 2007, funds provided by the disposal of real estate, property and equipment and other assets include the sale of the former headquarters building of WilTel Communications Group, LLC (“WilTel”) for $53,500,000. WilTel was sold in 2005 but the headquarters building was not included in the sale. During 2008, acquisitions, net of cash acquired
principally include an acquisition by the wineries ($19,200,000) and various small acquisitions by STi Prepaid. During 2007, acquisitions, net of cash acquired principally include assets acquired by STi Prepaid from Telco ($85,400,000) and ResortQuest ($9,700,000) and cash acquired upon the reconsolidation of Premier ($17,300,000). During 2007, the change in restricted cash principally results from the $56,500,000 escrow deposit made in connection with the Panama City real estate project.
48
Investments in associated companies include CLC ($43,300,000), ACF ($13,300,000) and Berkadia ($217,200,000) in 2009, Jefferies ($396,100,000), ACF ($335,200,000), IFIS Limited (“IFIS”) ($83,900,000), CLC ($56,700,000) and Garcadia ($34,000,000) in 2008, JHYH ($250,000,000), Pershing Square ($200,000,000), Keen ($108,000,000),
RCG Ambrose, L.P. (“Ambrose”) ($75,000,000), Highland Opportunity Fund, L.P. (“Highland Opportunity”) ($74,000,000), Shortplus ($25,000,000), CLC ($53,500,000) and Premier ($160,500,000) in 2007. Capital distributions from associated companies include Keen ($28,300,000), Wintergreen Partners Fund, L.P. (“Wintergreen”) ($39,000,000), Shortplus ($24,900,000) and Starboard Value Opportunity Partners, LP ($11,500,000) in 2009, Safe Harbor Domestic Partners
L.P. (“Safe Harbor”) ($19,300,000), Keen ($36,000,000), Highland Opportunity ($40,000,000), Ambrose ($72,900,000) and EagleRock ($12,500,000) in 2008 and Keen ($33,200,000) and Safe Harbor ($25,000,000) in 2007.
Net cash of $21,900,000 was used for financing activities in 2009 as compared to net cash provided by financing activities of $174,800,000 in 2008 and $1,145,500,000 in 2007. Issuance of long-term debt for 2009 and 2008 primarily reflects the increase in repurchase agreements (discussed below) of $47,500,000 and $26,100,000,
respectively, and $2,600,000 and $62,400,000, respectively, for MB1’s debt obligation. During 2007, issuance of debt, net of expenses, includes $500,000,000 principal amount of 7 1/8% Senior Notes and $500,000,000 principal amount of 8 1/8% Senior Notes. Reduction of debt for 2009 includes $29,600,000 for the buyback of $35,600,000 principal amount of the 7% Senior Notes and $5,800,000 for the buyback of $6,500,000 principal amount of the 8.65% Junior Subordinated Deferrable Interest
Debentures. Reduction of debt in 2008 includes the termination of a capital lease obligation upon the Company’s exercise of its right to purchase corporate aircraft secured by a capital lease ($8,200,000). The reduction of debt during 2007 principally relates to the repurchase agreements. Issuance of common shares for 2008 principally reflects cash consideration received on the sale of common shares to Jefferies. Issuance of common shares for 2007 principally
reflects the issuance and sale of 5,500,000 of the Company’s common shares. In addition, issuance of common shares reflects the exercise of employee stock options for all periods.
Debt due within one year includes $198,600,000 and $151,100,000 as of December 31, 2009 and 2008, respectively, relating to repurchase agreements of one of the Company’s subsidiaries. These fixed rate repurchase agreements have a weighted average interest rate of approximately 0.3%, mature in January 2010 and are secured
by non-current investments with a carrying value of $210,400,000 at December 31, 2009. Debt due within one year also includes $100,500,000 related to MB1’s debt obligation, discussed above.
During 2001, a subsidiary of the Company borrowed $53,100,000 secured by certain of its corporate aircraft, of which $35,000,000 is currently outstanding. The Parent company has guaranteed this financing.
The Company’s senior note indentures contain covenants that restrict its ability to incur more Indebtedness or issue Preferred Stock of Subsidiaries unless, at the time of such incurrence or issuance, the Company meets a specified ratio of Consolidated Debt to Consolidated Tangible Net Worth, limit the ability of the Company and
Material Subsidiaries to incur, in certain circumstances, Liens, limit the ability of Material Subsidiaries to incur Funded Debt in certain circumstances, and contain other terms and restrictions all as defined in the senior note indentures. The Company has the ability to incur substantial additional indebtedness or make distributions to its shareholders and still remain in compliance with these restrictions. If the Company is unable to meet the specified ratio, the Company would not be
able to issue additional Indebtedness or Preferred Stock, but the Company’s inability to meet the applicable ratio would not result in a default under its senior note indentures. Certain of the debt instruments of subsidiaries of the Company require that collateral be provided to the lender; principally as a result of such requirements, the assets of subsidiaries which are subject to limitations on transfer of funds to the Company were approximately $328,600,000 at December 31, 2009. For
more information, see Note 13 of Notes to Consolidated Financial Statements.
49
As shown below, at December 31, 2009, the Company’s contractual cash obligations totaled $2,999,810,000.
|
Payments Due by Period (in thousands)
|
||||||||||||||||||||
|
Contractual Cash Obligations
|
Total
|
Less than 1
Year
|
1-3 Years
|
4-5 Years
|
After 5 Years
|
|||||||||||||||
|
Debt, including current maturities
|
$ | 1,976,699 | $ | 312,592 | $ | 34,249 | $ | 538,132 | $ | 1,091,726 | ||||||||||
|
Estimated interest expense on debt
|
759,532 | 123,735 | 239,578 | 193,253 | 202,966 | |||||||||||||||
|
Estimated payments related to derivative
|
||||||||||||||||||||
|
financial instruments
|
2,613 | 2,082 | 531 | – | – | |||||||||||||||
|
Planned funding of pension and
|
||||||||||||||||||||
|
postretirement obligations
|
69,457 | 16,820 | 52,098 | 182 | 357 | |||||||||||||||
|
Operating leases, net of sublease income
|
144,082 | 13,745 | 25,556 | 20,433 | 84,348 | |||||||||||||||
|
Asset purchase obligations
|
20,901 | 16,630 | 1,978 | 1,606 | 687 | |||||||||||||||
|
Other
|
26,526 | 1,767 | 3,009 | 3,000 | 18,750 | |||||||||||||||
|
Total Contractual Cash Obligations
|
$ | 2,999,810 | $ | 487,371 | $ | 356,999 | $ | 756,606 | $ | 1,398,834 | ||||||||||
The estimated interest expense on debt includes interest related to variable rate debt which the Company determined using rates in effect at December 31, 2009. Estimated payments related to a currency swap agreement are based on the currency rate in effect at December 31, 2009. Amounts related to the Company’s
consolidated pension liability ($68,200,000) are included in the table in the less than 1 year period ($16,500,000) and the remainder in the 1-3 year period; however, the exact timing of those cash payments is uncertain. The above amounts do not include liabilities for unrecognized tax benefits as the timing of payments, if any, is uncertain. Such amounts aggregated $9,600,000 at December 31, 2009; for more information, see Note 17 of Notes to Consolidated Financial Statements.
The Company maintained defined benefit pension plans covering certain operating units prior to 1999, and WilTel also maintained defined benefit pension plans that were not transferred in connection with the sale of WilTel. At December 31, 2009, the Company had recorded a liability of $68,200,000 on its consolidated balance sheet
for its unfunded defined benefit pension plan obligations. This amount represents the difference between the present value of amounts owed to current and former employees (referred to as the projected benefit obligation) and the market value of plan assets set aside in segregated trust accounts. Since the benefits in these plans have been frozen, future changes to the unfunded benefit obligation are expected to principally result from benefit payments, changes in the market value of plan assets,
differences between actuarial assumptions and actual experience and interest rates.
The Company is in the process of seeking approval from various government entities to terminate the Company’s (not WilTel’s) frozen defined benefit pension plan; the Company anticipates it will terminate this plan in the fourth quarter of 2010. If terminated, the Company expects it will have to contribute an additional
$10,500,000 to the plan. The Company also expects to make substantial contributions to the segregated trust account for the WilTel defined benefit pension plan in the future to reduce its plan liabilities and reduce administrative and insurance costs associated with the plan. The Company expects to contribute $6,000,000 to WilTel’s defined benefit pension plan in 2010. The tax deductibility of these contributions is not a primary consideration, principally due to the availability
of the Company’s NOLs to otherwise reduce taxable income. Other than these aggregate $16,500,000 expected 2010 contributions, the timing and amount of additional contributions are uncertain.
As of December 31, 2009, certain amounts for these plans are reflected separately in the table below (dollars in thousands):
50
|
The Company’s
Plan
|
WilTel’s
Plan
|
|||||||
|
Projected benefit obligation
|
$ | 51,157 | $ | 184,689 | ||||
|
Funded status – balance sheet liability at December 31, 2009
|
9,189 | 59,005 | ||||||
|
Deferred losses included in other comprehensive income (loss)
|
17,075 | 46,887 | ||||||
|
Discount rate used to determine the projected benefit obligation
|
4.35 | % | 6.00 | % | ||||
Calculations of pension expense and projected benefit obligations are prepared by actuaries based on assumptions provided by management. These assumptions are reviewed on an annual basis, including assumptions about discount rates, interest credit rates and expected long-term rates of return on plan assets. For the
Company’s plan, a discount rate was selected to result in an estimated projected benefit obligation on a plan termination basis, using current rates for annuity settlements and lump sum payments weighted for the assumed elections of participants. For the WilTel plan, the timing of expected future benefit payments was used in conjunction with the Citigroup Pension Discount Curve to develop a discount rate that is representative of the high quality corporate bond market.
These discount rates will be used to determine pension expense in 2010. Holding all other assumptions constant, a 0.25% change in these discount rates would affect aggregate pension expense by $500,000 and the aggregate benefit obligation by $8,000,000.
The deferred losses in other comprehensive income (loss) primarily result from differences between the actual and assumed return on plan assets and changes in actuarial assumptions, including changes in discount rates and changes in interest credit rates. Deferred losses are amortized to expense if they exceed 10% of the greater
of the projected benefit obligation or the market value of plan assets as of the beginning of the year; such amount aggregated $27,800,000 at December 31, 2009 for all plans. A portion of these excess deferred losses will be amortized to expense during 2010 based on an amortization period of twelve years.
The assumed long-term rates of return on plan assets are based on the investment objectives of the specific plan, which are more fully discussed in Note 18 of Notes to Consolidated Financial Statements. Prior to 2008, differences between the actual and expected rates of return on plan assets have not been material. During
2008, the fair value of the WilTel plan assets declined significantly due to the decline in securities markets worldwide. This decline is the reason for the significant increase in the balance sheet liability for the WilTel plan during 2008.
Off-Balance Sheet Arrangements
At December 31, 2009, the Company’s off-balance sheet arrangements consist of guarantees and letters of credit aggregating $387,500,000. Pursuant to an agreement that was entered into before the Company sold CDS Holding Corporation ("CDS") to HomeFed in 2002, the Company agreed to provide project improvement bonds for
the San Elijo Hills project. These bonds, which are for the benefit of the City of San Marcos, California and other government agencies, are required prior to the commencement of any development at the project. CDS is responsible for paying all third party fees related to obtaining the bonds. Should the City or others draw on the bonds for any reason, CDS and one of its subsidiaries would be obligated to reimburse the Company for the amount drawn. At December 31, 2009,
the amount of outstanding bonds was $5,000,000, almost all of which expires in 2010. Subsidiaries of the Company have outstanding letters of credit aggregating $20,200,000 at December 31, 2009, principally to secure various obligations. Substantially all of these letters of credit expire before 2012.
51
As discussed above, the Company has also guaranteed 30% of the amounts outstanding under CLC’s intercompany loan from Inmet. At December 31, 2009, $240,100,000 was outstanding under the intercompany loan; accordingly, the Company’s outstanding guaranty at that date was $72,000,000.
As discussed above the Company has also guaranteed Berkadia’s repayment of 50% of the five-year credit facility issued by a subsidiary of Berkshire Hathaway. At December 31, 2009, the amount outstanding under the facility was $580,500,000; accordingly, the Company’s outstanding guaranty at that date was $290,300,000.
Critical Accounting Estimates
The Company’s discussion and analysis of its financial condition and results of operations are based upon its consolidated financial statements, which have been prepared in accordance with GAAP. The preparation of these financial statements requires the Company to make estimates and assumptions that affect the reported
amounts in the financial statements and disclosures of contingent assets and liabilities. On an on-going basis, the Company evaluates all of these estimates and assumptions. The following areas have been identified as critical accounting estimates because they have the potential to have a material impact on the Company's financial statements, and because they are based on assumptions which are used in the accounting records to reflect, at a specific point in time, events whose ultimate outcome
won’t be known until a later date. Actual results could differ from these estimates.
Income Taxes –
At December 31, 2009, the Company’s valuation allowance for its net deferred tax asset fully reserved for all of the potential future tax savings from federal NOLs and for a substantial portion of its state NOLs. In accordance with GAAP, the
Company records a valuation allowance to reduce its deferred tax asset to the net amount that is more likely than not to be realized. The amount of any valuation allowance recorded does not in any way adversely affect the Company’s ability to use its NOLs to offset taxable income in the future. If in the future the Company determines that it is more likely than not that the Company will be able to realize its net deferred tax asset in excess of its net recorded amount, an adjustment
to increase the net deferred tax asset would increase income in such period. If in the future the Company were to determine that it would not be able to realize all or part of its net recorded deferred tax asset, an adjustment to decrease the net deferred tax asset would be charged to income in such period. The Company is required to consider all available evidence, both positive and negative, and to weight the evidence when determining whether a valuation allowance is required. Generally,
greater weight is required to be placed on objectively verifiable evidence when making this assessment, in particular on recent historical operating results.
During the second half of 2008 the Company recorded significant unrealized losses on many of its largest investments, recognized other than temporary impairments for a number of other investments and reported reduced profitability from substantially all of its operating businesses, all of which contributed to the recognition of a pre-tax
loss of $859,500,000 in the consolidated statement of operations and a pre-tax loss in other comprehensive income (loss) of $1,579,200,000 for the year ended December 31, 2008. The worldwide economic downturn has adversely affected many of the Company’s operating businesses and investments, and the nature of the current economic difficulties make it impossible to reliably project how long the downturn will last. Additionally, the 2008 losses recognized by the Company resulted in a cumulative
loss in total comprehensive income (loss) during the three year period ending December 31, 2008. In assessing the realizability of the net deferred tax asset at December 31, 2008, the Company concluded that its recent operating loss and the then current economic conditions worldwide be given more weight than its projections of future taxable income during the period that it has NOLs available (until 2030), and be given more weight than the Company’s long track record of generating taxable income. As
a result, the Company concluded that a valuation allowance was required against substantially all of the net deferred tax asset, and increased its valuation allowance in 2008 by $1,672,100,000 with a corresponding charge to income tax expense.
52
Prior to 2008, the Company’s long track record of generating taxable income, its cumulative taxable income for the then recent prior periods and its projections of future taxable income were the most heavily weighted factors considered when determining how much of the net deferred tax asset was more likely than not to be realizable. As
a result, during 2005 the Company concluded that it was more likely than not that it would have future taxable income sufficient to realize a portion of the Company’s net deferred tax asset; accordingly, $1,135,100,000 of the deferred tax valuation allowance was reversed as a credit to income tax expense. An additional $542,700,000 of the valuation allowance was reversed as a credit to income tax expense in 2007. The Company’s estimate of future taxable income considered all
available evidence, both positive and negative, about its operating businesses and investments, included an aggregation of individual projections for each material operating business and investment, estimated apportionment factors for state and local taxing jurisdictions and included all future years that the Company estimated it would have available NOLs.
The Company will continue to evaluate the realizability of its net deferred tax asset in future periods. However, before the Company would reverse any portion of its valuation allowance in excess of taxes recorded on reported income, it will need positive evidence that it has historical positive cumulative taxable income over
a period of time which is likely to continue in future periods. At that time, any decrease to the valuation allowance would be based upon the Company’s projections of future taxable income, which are inherently uncertain.
The Company also records reserves for contingent tax liabilities based on the Company’s assessment of the probability of successfully sustaining its tax filing positions.
Impairment of Long-Lived Assets -
The Company evaluates its long-lived assets for impairment whenever events or changes in circumstances indicate, in management’s judgment, that the carrying value of such assets may not be recoverable. When testing for impairment,
the Company groups its long-lived assets with other assets and liabilities at the lowest level for which identifiable cash flows are largely independent of the cash flows of other assets and liabilities (or asset group). The determination of whether an asset group is recoverable is based on management’s estimate of undiscounted future cash flows directly attributable to the asset group as compared to its carrying value. If the carrying amount of the asset group is greater than the
undiscounted cash flows, an impairment loss would be recognized for the amount by which the carrying amount of the asset group exceeds its estimated fair value.
One of the Company’s real estate subsidiaries (MB1) is the owner and developer of a mixed use real estate project located in Myrtle Beach, South Carolina. The project is comprised of a retail center with approximately 346,000 square feet of retail space, 41,000 square feet of office space and 195 residential apartment
rental units. The retail center is approximately 90% leased and the office space is approximately 25% leased. Certain of the apartment units are allocated for long-term rental (114 units) and are substantially leased; the remaining apartment units are marketed as vacation rentals. The acquisition and construction costs were funded by capital contributed by the Company and nonrecourse indebtedness with a balance of $100,500,000 at December 31, 2009, that is collateralized by the
real estate. If MB1 is unable to make debt service or principal payments on the loan the Company is under no obligation to make those payments.
53
Current economic conditions have adversely impacted the majority of the retail tenants at the retail center. Over 20 retail tenants have requested reductions in rent payments, some of which have been granted; certain other tenants are not paying the full amount of rent due while their leases are being renegotiated. During
the second quarter of 2009, MB1 was unable to make scheduled payments under its interest rate swap agreement and received several default notices under its bank loan. These events constituted a change in circumstances that caused the Company to evaluate whether the carrying amount of MB1’s real estate asset was recoverable. Based on the assumptions discussed below the Company concluded that the carrying amount was not recoverable; accordingly, the Company recorded an impairment charge
of $67,800,000, (classified as selling, general and other expenses) which reduced the carrying amount of MB1’s real estate to its fair value of $71,300,000 at June 30, 2009.
The Company prepared cash flow models and utilized a discounted cash flow technique to determine the fair value of MB1’s real estate. Although the retail center has a remaining useful life of 38 years, the Company prepared cash flow models assuming it would operate the retail center over periods of 7, 10 or 20 years
and then sell the retail center at the end of those periods. The most significant assumptions in the Company’s cash flow models were the discount rate (11%) and the capitalization rate used to estimate the selling price of the retail center (9%); these rates were selected based on published reports of market conditions for similar properties. The Company assumed that requested reductions in rent would continue through 2012 before returning to pre-abatement levels. Projected
net cash flow before debt service included assumptions for vacancies, rent renewal rates, expense increases and allowances for tenant improvements for new tenants. The Company also prepared an additional model that assumed the bank lenders foreclose on their loan and take title to MB1’s real estate. Although the Company would not receive any cash flow in the event the lenders foreclose on the mortgaged property, since the Company’s debt obligation of $100,500,000 is without recourse
to the Company, the impairment loss would be limited to the excess, if any, of the book value of the real estate over the debt obligation. The Company calculated the fair value of MB1’s real estate by probability-weighting the present values of the various possible outcomes.
The cash flow projections assume some recovery in the local and national economy over the next few years. If economic conditions do not improve and the bank lenders do not foreclose, it is possible that MB1 will have to continue to provide rent reductions for its properties which could result in further impairment charges
to the carrying value of the real estate. Although MB1’s bank loan matured in October 2009, it was not repaid since MB1 did not have sufficient funds and the Company is under no obligation and has no intention to provide the funds to MB1 to pay off the loan. MB1 received an additional default notice for failure to repay the bank loan but its lenders have not commenced foreclosure proceedings. If MB1’s bank lenders foreclose in the future, the Company would record a
gain equal to the excess of the loan balance over the then book value of the real estate. At December 31, 2009, the carrying value of MB1’s real estate was $69,400,000.
In addition to the MB1 impairment, during 2009 the Company recorded impairment losses on long-lived assets aggregating $6,200,000, classified as selling, general and other expenses. Of this amount, $2,600,000 related to its manufacturing segment (primarily Idaho Timber) and $3,600,000 related to its real estate segment. During
2009, Idaho Timber discontinued remanufacturing of dimension lumber and experienced declining sales of certain specialty wood products at one of its plants, and as a result decided to close the plant. Idaho Timber evaluated for impairment the plant’s long-lived assets, comprised of buildings, machinery and equipment, and customer relationships intangibles. The carrying values of long-lived assets held and used and intangible assets were written down to their fair values, determined
using the present value of expected future cash flows. The Company wrote down certain real estate properties that are held for sale for which the fair values were primarily based on appraisals or prices for similar assets. The Company also wrote down a real estate property that under GAAP is considered to be held and used, but which the Company has recently decided to sell. The Company wrote down this real estate property to fair value primarily using market information for similar
assets.
54
During 2008, the Company recorded impairment losses on long-lived assets aggregating $3,200,000, of which $800,000 related to its gaming entertainment segment, $1,300,000 related to its real estate segment and $1,100,000 related to its other operations segment. There were no impairment losses recorded during 2007.
Current economic conditions have adversely affected most of the Company’s operations and investments. A worsening of current economic conditions or a prolonged recession could cause a decline in estimated future cash flows expected to be generated by the Company’s operations and investments. If future
undiscounted cash flows are estimated to be less than the carrying amounts of the asset groups used to generate those cash flows in subsequent reporting periods, particularly for those with large investments in property and equipment (for example, manufacturing, gaming entertainment, land based oil and gas drilling operations, real estate and certain associated company investments), impairment charges would have to be recorded.
Impairment of Securities -
Declines in the fair values of equity securities considered to be other than temporary and declines in the fair values of debt securities related to credit losses are reflected in the consolidated statements of operations. The Company evaluates
its investments for impairment on a quarterly basis.
The Company’s determination of whether a security is other than temporarily impaired incorporates both quantitative and qualitative information; GAAP requires the exercise of judgment in making this assessment, rather than the application of fixed mathematical criteria. The various factors that the Company considers
in making its determination are specific to each investment. For publicly traded debt and equity securities, the Company considers a number of factors including, but not limited to, the length of time and the extent to which the fair value has been less than cost, the financial condition and near term prospects of the issuer, the reason for the decline in fair value, changes in fair value subsequent to the balance sheet date, the ability and intent to hold investments to maturity, and other factors
specific to the individual investment. For investments in private equity funds and non-public securities, the Company bases its determination upon financial statements, net asset values and/or other information obtained from fund managers or investee companies.
The Company has a portfolio of non-agency mortgage-backed bond securitizations, which were acquired at significant discounts to face amounts and are accounted for as acquisitions of impaired loans. The Company estimates the future cash flows for these securities to determine the accretable yield; increases in estimated cash
flows are accounted for as a yield adjustment on a prospective basis but decreases in estimated cash flows below amortized cost due to credit losses are recognized as impairments in the consolidated statements of operations. Contractual cash flows in excess of estimated cash flows are not part of the accretable yield. The market for these securities is highly illiquid and they rarely trade. On a regular basis, the Company re-estimates the future cash flows of these securities
and records impairment charges if appropriate. The fair values for these securities are primarily determined using an income valuation model to calculate the present value of expected future cash flows, which incorporates assumptions regarding potential future rates of delinquency, prepayments, defaults, collateral losses and interest rates.
55
The Company recorded the following impairment charges for securities in the consolidated statement of operations for the three years in the period ended December 31, 2009 (in thousands):
|
2009
|
2008
|
2007
|
||||||||||
|
Publicly traded securities
|
$ | 14,400 | $ | 99,600 | $ | 1,800 | ||||||
|
Non-public securities and private equity funds
|
2,200 | 29,700 | 35,000 | |||||||||
|
Non-agency mortgage-backed bond securitizations
|
14,800 | 14,100 | – | |||||||||
|
Totals
|
$ | 31,400 | $ | 143,400 | $ | 36,800 | ||||||
Impairment of Equity Method Investments –
The Company evaluates equity method investments for impairment when operating losses or other factors may indicate a decrease in value which is other than temporary. For investments in investment partnerships that are accounted
for under the equity method, the Company obtains from the investment partnership financial statements, net asset values and other information on a quarterly basis and annual audited financial statements. On a quarterly basis, the Company also makes inquiries and discusses with investment managers whether there were significant procedural, valuation, composition and other changes at the investee. Since these investment partnerships record their underlying investments at fair value, after
application of the equity method the carrying value of the Company’s investment is equal to its share of the investees’ underlying net assets at their fair values. Absent any unusual circumstances or restrictions concerning these investments, which would be separately evaluated, it is unlikely that any additional impairment charge would be required.
For equity method investments in operating businesses, the Company considers a variety of factors including economic conditions nationally and in their geographic areas of operation, adverse changes in the industry in which they operate, declines in business prospects, deterioration in earnings, increasing costs of operations and other
relevant factors specific to the investee. Whenever the Company believes conditions or events indicate that one of these investments might be materially impaired, the Company will obtain from such investee updated cash flow projections and impairment analyses of the investee assets. The Company will use this information and, together with discussions with the investee’s management, evaluate if the book value of its investment exceeds its fair value, and if so and the situation is deemed
other than temporary, record an impairment charge.
During the second quarter of 2009, the Company’s equity in losses of Garcadia included impairment charges for goodwill and other intangible assets aggregating $32,300,000. Garcadia’s automobile dealerships have been adversely impacted by general economic conditions, and the bankruptcy filings by two of the three largest U.S.
automobile manufacturers was a change in circumstances that caused Garcadia to evaluate the recoverability of its goodwill and other intangible assets. Garcadia prepared discounted cash flow projections for each of its dealerships and concluded that the carrying amount of its goodwill and other intangible assets was impaired. Garcadia’s cash flow projections assume that new car sales at their foreign car dealerships remain flat with 2009 sale levels through 2011 and project growth
thereafter. Cash flow projections at dealerships that sell domestic cars are projected to continue to decline through 2012 or 2013 with projected growth thereafter. None of Garcadia’s automobile dealerships are currently expected to close as a result of the restructuring of the U.S. automobile manufacturers. However, if new vehicle sales at Garcadia’s automobile dealerships are less than projected amounts or dealerships are closed, further impairment charges are likely.
56
During 2008, the Company’s equity in losses of IFIS includes impairment charges of $63,300,000. IFIS is a private Argentine company that owns a variety of investments, and its largest investment is ownership of common shares of Cresud Sociedad Anonima Comercial, Inmobiliaria, Financiera y Agropecuaria (“Cresud”),
an agricultural company primarily based in Argentina. As a result of significant declines in quoted market prices for Cresud and other investments of IFIS, combined with declines in worldwide food commodity prices, the global mortgage and real estate crisis and political and financial conditions in Argentina, the Company determined that its investment in IFIS was impaired. The fair value of the Company’s investment in IFIS was principally determined using quoted market prices of IFIS’s
investments. In January 2009, IFIS raised a significant amount of new equity in a rights offering in which the Company did not participate. As a result, the Company’s ownership interest in IFIS was reduced to 8% and the Company no longer applies the equity method of accounting for this investment. At December 31, 2009, the Company’s investment in IFIS was classified as a non-current investment.
Business Combinations -
At acquisition, the Company allocates the cost of a business acquisition to the specific tangible and intangible assets acquired and liabilities assumed based upon their fair values. Significant judgments and estimates are often made to determine
these values, and may include the use of appraisals, consider market quotes for similar transactions, employ discounted cash flow techniques or consider other information the Company believes to be relevant. The finalization of the purchase price allocation will typically take a number of months to complete, and if final values are materially different from initially recorded amounts adjustments are recorded. Any excess of the cost of a business acquisition over the fair values of the net
assets and liabilities acquired is recorded as goodwill, which is not amortized to expense. Recorded goodwill of a reporting unit is required to be tested for impairment on an annual basis, and between annual testing dates if events or circumstances change that would more likely than not reduce the fair value of a reporting unit below its net book value. At December 31, 2009, the book value of goodwill was $9,300,000. If the fair values of the net assets and liabilities acquired
are greater than the purchase price, the excess is treated as a bargain purchase and recognized in income.
Subsequent to the finalization of the purchase price allocation, any adjustments to the recorded values of acquired assets and liabilities would be reflected in the Company’s consolidated statement of operations. Once final, the Company is not permitted to revise the allocation of the original purchase price, even if
subsequent events or circumstances prove the Company’s original judgments and estimates to be incorrect. In addition, long-lived assets recorded in a business combination like property and equipment, amortizable intangibles and goodwill may be deemed to be impaired in the future resulting in the recognition of an impairment loss. The assumptions and judgments made by the Company when recording business combinations will have an impact on reported results of operations for many years
into the future.
During 2006, the Company acquired a 30% limited liability company interest in Keen for aggregate consideration of $60,000,000, excluding expenses, and agreed to lend to Keen, on a senior secured basis, up to $126,000,000 to finance new rig equipment purchases and construction costs and to repay existing debt. During 2007, the
Company increased its equity interest to 50% for additional payments aggregating $45,000,000. In addition, the credit facility was amended to increase the borrowing capacity to $138,500,000, and the Company provided Keen with two additional secured credit facilities aggregating $60,000,000. When the Company increased its investment in Keen to 50%, the terms of the limited liability agreement were amended to provide that in the event of a dissolution, liquidation or termination of Keen, available
cash or assets would first be used to pay all of Keen’s debts (including loans made by the Company), then distributed to the Company as a liquidation preference until it had received a return of its equity investment ($105,000,000), before any payments were made to the other equity owner of Keen.
57
During 2009, the Company believes it became apparent to the other equity owner of Keen that Keen would not be able to make scheduled debt payments to the Company, and that the resulting payment default could result in a liquidation of Keen. In that event, the Company’s liquidation preference over equity distributions would
result in very little, if any, distributions to the other equity owner of Keen. In November 2009, the Company purchased the other 50% equity interest that it did not own plus a secured note payable to the other equity owner of Keen for aggregate cash consideration of $15,000,000. The Company believes it was able to acquire the remaining 50% equity interest at this distressed price because of the expected payment default on Keen’s senior secured debt owed to the Company and the Company’s
$105,000,000 preferred equity distribution in the event Keen was liquidated.
When the Company acquired the controlling interest in Keen in November 2009 it became a consolidated subsidiary; prior to that time the investment in Keen was classified as an investment in an associated company. Under GAAP, upon consolidation the Company was required to record Keen’s assets and liabilities at fair value,
and was required to adjust the carrying value of the Company’s equity investment immediately prior to the acquisition to fair value. Due to the unique circumstances surrounding the Company’s 2009 acquisition described above, the fair value of the net assets acquired exceeded the amount paid by $49,300,000; the bargain purchase was recognized as a gain on the date of acquisition and included in investment and other income. However, the fair value of the Company’s equity
interest immediately prior to the acquisition was less than its carrying value ($85,900,000); accordingly the Company included a charge of $36,500,000 in income (losses) related to associated companies to write down the pre-acquisition carrying value of its investment in Keen to fair value.
As of the date of acquisition, Keen’s assets principally consisted of cash and other current assets and property and equipment. The Company engaged an independent valuation and appraisal firm to assist in its determination of the fair value of Keen’s property and equipment, identifiable intangible assets, if any,
and corresponding equity value; the fair values of cash and working capital were $20,700,000, property and equipment were $221,200,000 and Keen’s other assets and liabilities were not material. The methods used to determine the fair values included estimating Keen’s business enterprise value, utilizing both discounted cash flow and market comparable based approaches. Property and equipment asset valuations included an analysis of depreciated replacement cost and current market
prices. The Company considered several factors to determine the fair value of property and equipment, including local market conditions, recent market transactions, the size, age, condition, utility and character of the property, the estimated cost to acquire replacement property, an estimate of depreciation from use and functional obsolescence and the remaining expected useful life of the assets. Excluding intercompany loans, Keen’s liabilities principally consisted of trade payables
which were recorded at face value.
The most significant estimate made in recording the acquisition of Keen was the amount recorded for property and equipment, principally drilling rigs and related equipment. During 2009, Keen’s revenue volume and profitability were adversely affected by the expiration of term contracts during a time of low gas prices,
high levels of natural gas in storage and generally adverse economic conditions that have reduced the drilling activity of Keen’s customers. If these trends continue and Keen’s revenues remain depressed, it is possible that the fair values of Keen’s property and equipment may decline, resulting in the recording of impairment charges in the future.
Use of Fair Value Estimates -
Under GAAP, fair value is defined as the price that would be received to sell an asset or paid to transfer a liability in an orderly transaction between market participants at the measurement date. Further, a fair value hierarchy prioritizes
inputs to valuation techniques into three broad levels. The fair value hierarchy gives the highest priority to unadjusted quoted prices in active markets for identical assets or liabilities (Level 1), the next priority to inputs that don’t qualify as Level 1 inputs but are nonetheless observable, either directly or indirectly, for the particular asset or liability (Level 2), and the lowest priority to unobservable inputs (Level 3).
58
Over 90% of the Company’s investment portfolio is classified as available for sale securities, which are carried at estimated fair value in the Company’s consolidated balance sheet. The estimated fair values are principally based on publicly quoted market prices (Level 1 inputs), which can rise or fall in reaction
to a wide variety of factors or events, and as such are subject to market-related risks and uncertainties. The Company has a segregated portfolio of mortgage pass-through certificates issued by U.S. Government-Sponsored Enterprises (FHLMC or FNMA), which are carried on the balance sheet at their estimated fair value of $358,200,000 at December 31, 2009. Although the markets that these types of securities trade in are generally active, market prices are not always available for the identical
security. The fair value of these investments are based on observable market data including benchmark yields, reported trades, issuer spreads, benchmark securities, bids and offers. These estimates of fair value are considered to be Level 2 inputs, and the amounts realized from the disposition of these investments has not been materially different from their estimated fair values.
The fair values of the Company’s portfolio of non-agency mortgage-backed bond securitizations, which are primarily determined using an income valuation model to calculate the present value of expected future cash flows, are considered to be Level 3 inputs.
Contingencies
- The Company accrues for contingent losses when the contingent loss is probable and the amount of loss can be reasonably estimated. Estimates of the likelihood that a loss will be incurred and of contingent loss amounts normally require significant judgment
by management, can be highly subjective and are subject to material change with the passage of time as more information becomes available. Estimating the ultimate impact of litigation matters is inherently uncertain, in particular because the ultimate outcome will rest on events and decisions of others that may not be within the power of the Company to control. The Company does not believe that any of its current litigation will have a material adverse effect on its consolidated financial
position, results of operations or liquidity; however, if amounts paid at the resolution of litigation are in excess of recorded reserve amounts, the excess could be material to results of operations for that period. As of December 31, 2009, the Company’s accrual for contingent losses was not material.
Results of Operations
Substantially all of the Company’s operating businesses sell products or services that are impacted by general economic conditions in the U.S. and to a lesser extent internationally. Poor general economic conditions have reduced the demand for products or services sold by the Company’s operating subsidiaries and/or
resulted in reduced pricing for products or services. Troubled industry sectors, like the residential real estate market, have had an adverse direct impact not only on the Company’s real estate and property management and services segments, but have also had an adverse indirect impact on some of the Company’s other operating segments, including manufacturing and gaming entertainment. The discussions below concerning revenue and profitability by segment consider current economic
conditions and the impact such conditions have had and may continue to have on each segment; however, should general economic conditions worsen and/or if the country experiences a prolonged recession, the Company believes that all of its businesses would be adversely impacted.
A summary of results of continuing operations for the Company for the three years in the period ended December 31, 2009 is as follows (in thousands):
59
|
2009
|
2008
|
2007
|
||||||||||
|
Income (loss) from continuing operations before
|
||||||||||||
|
income taxes and income (losses) related to
|
||||||||||||
|
associated companies:
|
||||||||||||
|
Manufacturing:
|
||||||||||||
|
Idaho Timber
|
$ | (12,680 | ) | $ | 769 | $ | 9,097 | |||||
|
Conwed Plastics
|
11,578 | 13,985 | 17,364 | |||||||||
|
Telecommunications
|
354 | 11,884 | 18,440 | |||||||||
|
Oil and Gas Drilling Services
|
46,738 | – | – | |||||||||
|
Property Management and Services
|
827 | (1,885 | ) | (6,522 | ) | |||||||
|
Gaming Entertainment
|
2,379 | 975 | (9,280 | ) | ||||||||
|
Domestic Real Estate
|
(71,298 | ) | (14,695 | ) | (8,276 | ) | ||||||
|
Medical Product Development
|
(23,818 | ) | (36,586 | ) | (36,548 | ) | ||||||
|
Other Operations
|
(36,393 | ) | (40,378 | ) | (17,640 | ) | ||||||
|
Corporate
|
(168,660 | ) | (302,024 | ) | (27,878 | ) | ||||||
|
Total consolidated loss from continuing
|
||||||||||||
|
operations before income taxes and income
|
||||||||||||
|
(losses) related to associated companies
|
(250,973 | ) | (367,955 | ) | (61,243 | ) | ||||||
|
Income (losses) related to associated companies
|
||||||||||||
|
before income taxes
|
805,803 | (536,816 | ) | (31,218 | ) | |||||||
|
Total consolidated income (loss) from
|
||||||||||||
|
continuing operations before income taxes
|
554,830 | (904,771 | ) | (92,461 | ) | |||||||
|
Income taxes:
|
||||||||||||
|
Loss from continuing operations before
|
||||||||||||
|
income (losses) related to associated companies
|
(7,143 | ) | (1,673,675 | ) | 559,771 | |||||||
|
Associated companies
|
(25,567 | ) | (2,252 | ) | 9,343 | |||||||
|
Total income taxes
|
(32,710 | ) | (1,675,927 | ) | 569,114 | |||||||
|
Income (loss) from continuing operations
|
$ | 522,120 | $ | (2,580,698 | ) | $ | 476,653 | |||||
Manufacturing – Idaho Timber
A summary of results of operations for Idaho Timber for the three years in the period ended December 31, 2009 is as follows (in thousands):
60
|
2009
|
2008
|
2007
|
||||||||||
|
Revenues and other income
|
$ | 142,709 | $ | 235,260 | $ | 292,195 | ||||||
|
Expenses:
|
||||||||||||
|
Cost of sales
|
140,428 | 219,206 | 266,564 | |||||||||
|
Salaries and incentive compensation
|
5,575 | 6,397 | 7,837 | |||||||||
|
Depreciation and amortization
|
4,317 | 4,411 | 4,635 | |||||||||
|
Selling, general and other expenses
|
5,069 | 4,477 | 4,062 | |||||||||
| 155,389 | 234,491 | 283,098 | ||||||||||
|
|
||||||||||||
|
Income (loss) before income taxes
|
$ | (12,680 | ) | $ | 769 | $ | 9,097 | |||||
Idaho Timber’s revenues for 2009 continued to reflect the weak demand resulting from reductions in housing starts and the excess supply of high-grade lumber in the marketplace. Shipment volume and average selling prices decreased approximately 32% and 9%, respectively, in 2009 as compared to 2008. Idaho Timber
expects that the abundance of existing homes available for sale in the market will continue to negatively impact housing starts and Idaho Timber’s revenues during 2010. Until housing starts begin to increase, annual dimension lumber shipping volume may remain flat or could decline further. Curtailment of production at primary sawmills due to their operating losses could reduce excess supply to some degree; however, spread (as discussed below) may not improve since price pressure for
low-grade lumber may increase if supplies are further reduced. Idaho Timber’s revenues for 2009 also reflect the loss of a large home center board customer, which discontinued purchasing pine boards through its vendor managed inventory program effective July 1, 2008. Revenues from this customer pursuant to this program were $8,000,000 during 2008. Idaho Timber’s 2008 revenues and other income include $4,200,000 from the settlement of an insurance claim.
The weak demand resulting from reductions in housing starts and the abundant supply of high-grade lumber in the marketplace also impacted Idaho Timber’s revenues for 2008. Shipment volume in 2008 declined by 20% as compared to 2007; average selling prices did not significantly change in 2008 as compared to 2007.
Raw material costs, the largest component of cost of sales (approximately 77% of cost of sales), declined for 2009 as compared to 2008, principally due to the same market conditions that negatively impacted revenues. Raw material cost per thousand board feet decreased approximately 9% in 2009 as compared to 2008. The
difference between Idaho Timber’s selling price and raw material cost per thousand board feet (spread) is closely monitored, and the rate of change in pricing and cost is not necessarily the same. The difference between Idaho Timber’s selling price and raw material cost per thousand board feet for 2009 was lower than 2008. Cost of sales during 2009 also includes charges of $1,400,000 to reduce the carrying value of certain timber deed contracts. The reduced spread
combined with low shipment volume resulted in negative gross profit for the fourth quarter of 2009. If shipment volume remains depressed and cost of raw material remains high relative to selling price, Idaho Timber could experience negative gross profit in future quarters.
While raw material costs declined for 2008 as compared to 2007, principally due to the same market conditions that negatively impacted revenues, raw material cost per thousand board feet did not significantly change for 2008 as compared to 2007. The spread for 2008 declined by 14% as compared to 2007.
61
Salaries and incentive compensation expense declined in 2009 as compared to 2008 and in 2008 as compared to 2007 principally due to a decrease in estimated incentive bonus expense. Selling, general and other expenses for 2009 reflect impairment losses on long-lived assets related to one of Idaho Timber’s plants of $2,100,000. During
2009, Idaho Timber discontinued remanufacturing of dimension lumber and experienced declining sales of certain specialty wood products at that plant, and as a result has decided to close this plant.
Manufacturing – Conwed Plastics
A summary of results of operations for Conwed Plastics for the three years in the period ended December 31, 2009 is as follows (in thousands):
|
2009
|
2008
|
2007
|
||||||||||
|
Revenues and other income
|
$ | 82,094 | $ | 106,004 | $ | 105,418 | ||||||
|
Expenses:
|
||||||||||||
|
Cost of sales
|
56,539 | 75,994 | 74,139 | |||||||||
|
Salaries and incentive compensation
|
6,740 | 7,834 | 6,701 | |||||||||
|
Depreciation and amortization
|
318 | 183 | 171 | |||||||||
|
Selling, general and other expenses
|
6,919 | 8,008 | 7,043 | |||||||||
| 70,516 | 92,019 | 88,054 | ||||||||||
|
|
||||||||||||
|
Income before income taxes
|
$ | 11,578 | $ | 13,985 | $ | 17,364 | ||||||
Revenues declined in substantially all of Conwed Plastics’ markets in 2009 as compared to 2008. Conwed Plastics’ revenues in 2009 were particularly adversely impacted in those markets related to the housing industry, which include the carpet cushion, building and construction, erosion control and turf reinforcement
markets. In addition, revenues from the erosion control, packaging and carpet cushion markets declined in 2009 as some business was lost to competitors. Conwed Plastics expects revenues to continue to be adversely impacted in those markets related to housing, and also expects that the poor domestic and international economic conditions will continue to adversely affect its other markets.
While Conwed Plastics’ revenues from the packaging and filtration markets increased during 2008 largely due to acquisitions made in 2007, and in the European markets due to an acquisition in 2007, new customers and the impact of foreign exchange, its business continued to be adversely impacted in those markets related to the housing
industry.
The primary raw material in Conwed Plastics’ products is a polypropylene resin, which is a byproduct of the oil refining process, whose price tends to fluctuate with the price of oil. Prices for polypropylene declined in 2009 as compared to 2008 improving gross margins; prices for polypropylene resin were higher in 2008
than 2007. The volatility of oil and natural gas prices along with current general economic conditions worldwide make it difficult to predict future raw material costs. In addition to managing resin purchases, Conwed Plastics has improved its ability to reduce and/or reuse scrap and continues to seek further improvements in order to increase raw material utilization.
Gross margins improved in 2009 as compared to 2008 primarily due to decreased raw material costs and lower labor costs due to headcount reductions. Gross margins declined in 2008 as compared to 2007 principally due to product mix and raw material cost increases.
62
Pre-tax results for 2009 reflect a decline in salaries and incentive compensation expense principally due to a decrease in headcount and a related reduction in estimated incentive bonus expense, and a decline in selling, general and other expenses primarily due to lower professional and legal fees. Selling, general and other
expenses for 2009 also reflect impairment losses on long-lived assets of $400,000. Pre-tax results for 2008 reflect $1,100,000 of higher salaries and incentive compensation expense as compared to 2007 principally due to an increase in estimated incentive bonus expense and greater headcount related to acquisitions.
Telecommunications
A summary of results of operations for STi Prepaid for the two years in the period ended December 31, 2009 and for the period from the date of acquisition (March 2007) through December 31, 2007 is as follows (in thousands):
|
2009
|
2008
|
2007
|
||||||||||
|
Revenues and other income
|
$ | 426,068 | $ | 452,422 | $ | 363,218 | ||||||
|
Expenses:
|
||||||||||||
|
Cost of sales
|
363,885 | 392,469 | 309,045 | |||||||||
|
Interest
|
49 | 81 | 140 | |||||||||
|
Salaries and incentive compensation
|
12,150 | 10,649 | 8,143 | |||||||||
|
Depreciation and amortization
|
4,090 | 1,416 | 491 | |||||||||
|
Selling, general and other expenses
|
45,540 | 35,923 | 26,959 | |||||||||
| 425,714 | 440,538 | 344,778 | ||||||||||
|
|
||||||||||||
|
Income before income taxes
|
$ | 354 | $ | 11,884 | $ | 18,440 | ||||||
Prepaid calling card revenue, which increased from $342,600,000 in 2008 to $369,100,000 in 2009, includes $91,900,000 of revenues from acquisitions. STi Prepaid believes that the decline in prepaid calling card revenues in 2009 (exclusive of the revenues from acquisitions) as compared to 2008 reflects poor economic conditions
in the markets that STi Prepaid operates, strong industry competition and the growth of wireless service providers and software applications that use voice over internet protocol for international long distance calls. Gross margins did not significantly change in 2009 as compared to 2008. Carrier wholesale service business, which has lower gross margins than the prepaid calling card business, decreased from $79,800,000 in 2008 to $51,700,000 in 2009 primarily due to reduced business from
a large customer during the current year and the loss of a large customer in the second quarter of 2008. Salaries and incentive compensation expense declined in 2009 (exclusive of amounts related to businesses acquired) principally due to a reduction in estimated incentive bonus expense. Salaries and incentive compensation expense for 2009 includes $4,100,000 related to businesses acquired. The increase in selling, general and other expenses for 2009 principally reflects $7,600,000
related to businesses acquired and greater regulatory fees of $5,500,000.
63
Prepaid calling card revenue, which increased from $316,700,000 for the 2007 period to $342,600,000 for the year ended December 31, 2008, includes $18,800,000 of revenues from acquisitions made by STi Prepaid during 2008. While prepaid calling card revenues either declined or were largely flat throughout most of 2008 (exclusive
of the revenues from acquisitions), and declined compared to those for the fourth quarter of 2007, gross margins improved principally due to fewer launches of new prepaid calling cards with low introductory rates and a reduction in certain unprofitable prepaid calling card business. Carrier wholesale service business increased from $29,700,000 for the 2007 period to $79,800,000 for the year ended December 31, 2008. Pre-tax results for 2008 also reflect $2,900,000 of higher selling, general
and other expenses and $1,100,000 of higher salaries and incentive compensation expense from the acquisitions.
Keen
A summary of results of operations for Keen for the period from the date of acquisition (November 2009) through December 31, 2009 is as follows (in thousands). As more fully discussed above, prior to the date of acquisition Keen was accounted for under the equity method of accounting.
|
Revenues and other income
|
$ | 60,459 | ||
|
Expenses:
|
||||
|
Interest
|
188 | |||
|
Salaries and incentive compensation
|
4,336 | |||
|
Depreciation and amortization
|
3,103 | |||
|
Selling, general and other expenses
|
6,094 | |||
| 13,721 | ||||
|
|
||||
|
Income before income taxes
|
$ | 46,738 |
As more fully discussed above, other income includes a gain of $49,300,000 resulting from the bargain purchase. Keen’s revenue volume and profitability are significantly affected by the actual and anticipated price of natural gas and levels of natural gas in storage. The natural gas exploration and production
industry is cyclical and the level of exploration and production activity has historically been very volatile. During periods of lower levels of drilling activity, price competition for drilling services tends to increase which may result in reduced revenues and profitability; conversely, during periods of increased drilling activity drilling rigs are in demand often resulting in higher prices and contractual commitments from customers to obtain exclusive use of a particular rig for a longer term. During
2009, low natural gas prices, rising levels of natural gas storage and tight credit markets forced many of Keen’s customers to make significant reductions in their drilling programs, which adversely impacted Keen’s revenues and profitability. Although there has been recent improvement in natural gas prices, Keen’s profitability will not significantly improve without increased natural gas demand to sustain the rise in natural gas prices. Increased industrial demand for natural
gas, which is tied to achieving economic recovery, is required to significantly improve demand. In the short term, a colder than average winter can also impact demand for natural gas.
Property Management and Services
A summary of results of operations for the property management and services segment for the two years in the period ended December 31, 2009 and for the period from the date of acquisition (June 2007) through December 31, 2007 is as follows (in thousands):
64
|
2009
|
2008
|
2007
|
||||||||||
|
Revenues and other income
|
$ | 117,190 | $ | 142,006 | $ | 81,528 | ||||||
|
Expenses:
|
||||||||||||
|
Direct operating expenses
|
92,421 | 113,768 | 65,992 | |||||||||
|
Salaries and incentive compensation
|
4,630 | 5,639 | 3,996 | |||||||||
|
Depreciation and amortization
|
3,611 | 4,592 | 3,145 | |||||||||
|
Selling, general and other expenses
|
15,701 | 19,892 | 14,917 | |||||||||
| 116,363 | 143,891 | 88,050 | ||||||||||
|
|
||||||||||||
|
Income (loss) before income taxes
|
$ | 827 | $ | (1,885 | ) | $ | (6,522 | ) | ||||
The decline in ResortQuest’s revenues and other income in 2009 as compared to 2008 primarily reflects lower average daily rates (“ADR”) and the exiting of certain rental management locations. ResortQuest’s ADR declined approximately 13% in 2009 as compared to 2008, principally due to discounts given in
all markets due to competition and excess availability, fewer reservations for its ski locations, which typically have higher ADRs than beach locations and a decrease in ResortQuest’s rental management properties in certain locations that typically have higher ADRs. ResortQuest’s occupancy percentage for 2009 was moderately lower as compared to 2008. Subsequent to year-end, ResortQuest has continued to see a decline in advance reservations for its ski locations and many of its
beach locations. ResortQuest believes that the decline in advance reservations is largely due to the adverse economic conditions and with respect to its fly to markets, fewer scheduled flights at increased fares.
ResortQuest’s net real estate brokerage revenues were $4,000,000 in 2009 and $8,700,000 in 2008. The 2008 revenue was principally recorded upon the completion of certain large development projects. Its real estate brokerage services, which are concentrated in Northwest Florida and Delaware, tend to be cyclical,
and experience the same volatility that residential real estate and new construction markets experience. Since acquisition, its real estate brokerage business has been and will continue to be negatively impacted by the depressed real estate market.
While ResortQuest’s occupancy percentage for the year ended December 31, 2008 did not significantly change as compared to that for 2007 (inclusive of the pre-acquisition period), its occupancy percentage for the fourth quarter of 2008 declined as compared to the fourth quarter of 2007. In addition, ADRs for 2008, particularly
those for the fourth quarter, declined compared to those for the same periods in 2007. The declines in occupancy and ADRs primarily reflect fewer reservations for its ski locations, an increase in available properties in certain beach locations, as well as rate discounts given on properties due to competition and excess availability. Reservations did increase at beach and golf locations but not enough to offset the overall decline in occupancy percentage.
The decline in direct operating expenses in 2009 as compared to 2008 principally reflects workforce reductions and other related cost saving initiatives, and the exiting of certain rental management locations. The reduction in selling, general and other expenses in 2009 primarily reflects lower advertising costs.
Gaming Entertainment
65
As more fully discussed above, Premier was accounted for as a consolidated subsidiary when acquired during 2006; however, while in bankruptcy proceedings from September 19, 2006 to emergence on August 10, 2007, Premier was accounted for under the equity method of accounting. Upon emergence from bankruptcy, Premier was once again
consolidated by the Company. Premier’s casino and hotel operations opened to the public on June 30, 2007; prior to opening, Premier’s activities principally consisted of rebuilding and repairing the hotel and casino facilities that were severely damaged by Hurricane Katrina, and its bankruptcy proceedings.
A summary of results of operations for Premier for the two years in the period ended December 31, 2009 and for the period from emergence from bankruptcy (date of reconsolidation) through December 31, 2007 is as follows (in thousands):
|
2009
|
2008
|
2007
|
||||||||||
|
Revenues and other income
|
$ | 103,583 | $ | 119,090 | $ | 38,463 | ||||||
|
Expenses:
|
||||||||||||
|
Direct operating expenses
|
79,452 | 93,987 | 37,772 | |||||||||
|
Interest
|
489 | 899 | 530 | |||||||||
|
Salaries and incentive compensation
|
1,977 | 2,451 | 1,359 | |||||||||
|
Depreciation and amortization
|
16,532 | 16,956 | 6,271 | |||||||||
|
Selling, general and other expenses
|
2,754 | 3,822 | 1,811 | |||||||||
| 101,204 | 118,115 | 47,743 | ||||||||||
|
|
||||||||||||
|
Income (loss) before income taxes
|
$ | 2,379 | $ | 975 | $ | (9,280 | ) | |||||
Premier’s gaming revenues for 2009 were largely unchanged as compared to 2008, while the local gaming market declined substantially. Premier has established a strong customer database and customer loyalty programs resulting in growth in market share of the local gaming market. Revenues from non-casino operations
decreased in 2009 primarily due to Premier offering more of its hotel rooms complementary to its casino customers and lower ticket prices and fewer tickets sold for concerts. Premier believes that current adverse economic conditions are likely to continue to have a negative impact on the local gaming market in 2010 and could encourage expansion of legalized gaming in nearby states as governments look for ways to generate revenues. As a result, competition could escalate. Many
of Premier’s competitors are larger and have greater marketing and financial resources.
Gaming revenues increased in each quarter of 2008 as compared to the fourth quarter of 2007. However, gaming revenues for the fourth quarter of 2008 declined compared to the prior quarters of 2008 reflecting seasonality in the Gulf Coast gaming market and unfavorable economic conditions. Premier’s revenues
for 2008 were adversely impacted by multiple hurricanes that threatened the Mississippi Gulf Coast, one of which caused Premier’s closure over the Labor Day weekend, resulting in lost business.
Revenues and other income for 2008 include a $7,300,000 gain from the settlement and collection of Premier’s remaining insurance claim relating to Hurricane Katrina, and $5,600,000 resulting from capital contributions from the noncontrolling interest. In prior periods, the Company recorded 100% of the losses after cumulative
loss allocations to the noncontrolling interest (classified as minority interest prior to January 1, 2009) had reduced the noncontrolling interest to zero. Since the noncontrolling interest remained at zero after considering the capital contributions, the entire capital contribution was recorded as income, effectively reimbursing the Company for a portion of the noncontrolling interest losses that were not previously allocated to the noncontrolling interest.
66
The decrease in direct operating expenses in 2009 as compared to 2008 reflects reductions in workforce and other cost reductions implemented by Premier during the fourth quarter of 2008. Selling, general and other expenses for 2008 include $1,100,000 of charges relating to Hurricane Gustav, primarily to write off damaged assets,
for which there will not be any insurance recovery, and a charge of $800,000 to write down certain gaming assets that will not be used.
Domestic Real Estate
A summary of results of operations for the domestic real estate segment for the three years in the period ended December 31, 2009 is as follows (in thousands):
|
2009
|
2008
|
2007
|
||||||||||
|
Revenues and other income
|
$ | 30,637 | $ | 15,091 | $ | 13,436 | ||||||
|
Expenses:
|
||||||||||||
|
Interest
|
2,322 | 4,408 | – | |||||||||
|
Depreciation and amortization
|
8,408 | 7,607 | 3,816 | |||||||||
|
Other operating expenses, including impairment
|
||||||||||||
|
charges described below
|
91,205 | 17,771 | 17,896 | |||||||||
| 101,935 | 29,786 | 21,712 | ||||||||||
|
Loss before income taxes
|
$ | (71,298 | ) | $ | (14,695 | ) | $ | (8,276 | ) | |||
Pre-tax results for the domestic real estate segment are largely dependent upon the performance of the segment’s operating properties, the current status of the Company’s real estate development projects and non-recurring gains or losses recognized when real estate assets are sold. As a result, pre-tax results for
this segment for any particular period are not predictable and do not follow any consistent pattern.
Revenues and other income for 2009 and 2007 include real estate sales of $12,400,000 and $10,700,000, respectively; the Company did not have any major real estate sales during 2008. Real estate revenues and other income for 2008 include income of $3,700,000 from the favorable settlement of a lawsuit. Real estate revenues
and other income include $1,000,000, $(4,600,000) and $(3,900,000) for the years ended December 31, 2009, 2008 and 2007, respectively, of income (charges) related to the accounting for the mark-to-market value of an interest rate derivative (which was terminated during the second quarter of 2009) relating to MB1’s debt obligation.
As discussed above, during the second quarter of 2009, the Company determined that the carrying amount of MB1’s mixed use real estate project located in Myrtle Beach, South Carolina was not fully recoverable and recorded an impairment charge of $67,800,000, which is included in other operating expenses. In addition, other
operating expenses for 2009 include impairment charges aggregating $3,600,000 for certain other real estate properties and a charge of $1,400,000 representing the net book value of land and buildings that was contributed to a local municipality. Other operating expenses for 2008 include an impairment charge of $1,300,000 for certain real estate properties held for sale. Pre-tax results for 2007 include $1,600,000 of incentive compensation accruals related to the Myrtle Beach project.
67
Residential property sales volume, prices and new building starts have declined significantly in many U.S. markets, including markets in which the Company has real estate operations in various stages of development. The slowdown in residential sales has been exacerbated by the turmoil in the mortgage lending and credit markets
during the past two years, which has resulted in stricter lending standards and reduced liquidity for prospective home buyers. The Company has deferred its development plans for certain of its real estate development projects, and is not actively soliciting bids for its fully developed projects. The Company intends to wait for market conditions to improve before marketing certain of its projects for sale.
Medical Product Development
A summary of results of operations for Sangart for the three years in the period ended December 31, 2009 is as follows (in thousands):
|
2009
|
2008
|
2007
|
||||||||||
|
Revenues and other income
|
$ | 5,147 | $ | 654 | $ | 2,078 | ||||||
|
Expenses:
|
||||||||||||
|
Salaries and incentive compensation
|
9,641 | 13,058 | 8,773 | |||||||||
|
Depreciation and amortization
|
836 | 756 | 759 | |||||||||
|
Selling, general and other expenses
|
18,488 | 23,426 | 29,094 | |||||||||
| 28,965 | 37,240 | 38,626 | ||||||||||
|
|
||||||||||||
|
Loss before income taxes
|
$ | (23,818 | ) | $ | (36,586 | ) | $ | (36,548 | ) | |||
Revenues and other income for 2009 include $5,000,000 of insurance proceeds received upon the death of Sangart’s former chief executive officer. Sangart’s losses reflect research and development costs (which are included in selling, general and other expenses) of $3,500,000, $13,900,000 and $22,100,000 for the
years ended December 31, 2009, 2008 and 2007, respectively (including acquired research and development of $2,100,000 and $4,100,000 for 2008 and 2007, respectively, which was expensed under prior GAAP). Research and development costs declined in 2009 primarily due to the completion during 2008 of two Phase III clinical trials of MP4OX, Sangart’s current medical product candidate. Selling, general and other expenses in 2009 also reflects $3,100,000 of charges related to share-based
awards previously granted to a former officer (such charges were included in salaries and compensation expense in prior periods during the course of his employment); $1,900,000 of charges for manufacturing facility design costs that Sangart does not expect to use; $1,600,000 of greater royalty expenses; $700,000 of increased professional fees; and $800,000 of lower severance costs. The decrease in salaries and incentive compensation expense in 2009 as compared to 2008 principally reflects headcount
reductions. Salaries and incentive compensation expense for 2008 also included share-based compensation expense for the former officer during the course of his employment.
The increase in salaries and incentive compensation in 2008 as compared to 2007 was principally due to increased headcount in connection with the Phase III trials and development efforts, greater share-based compensation expense, and compensation costs for a newly hired officer. Pre-tax results for 2008 also reflect $1,600,000
of severance expense relating to a former officer and headcount reductions.
68
Sangart is a development stage company that does not have any revenues from product sales. As more fully discussed above, Sangart has decided not to pursue marketing approval at this time to use MP4OX in orthopedic hip surgeries (the patient group tested in the Phase III clinical trials) but is currently conducting a Phase
II clinical study of MP4OX in trauma patients and plans to conduct additional clinical trials of MP4OX in other therapeutic areas that may better demonstrate its clinical benefit and strengthen the likelihood of regulatory approval. Such studies will take several years to complete at substantial cost, and until they are successfully completed, if ever, Sangart will not be able to request marketing approval and generate revenues from MP4OX sales. The Company is unable to predict when, if
ever, it will report operating profits for this segment.
Other Operations
A summary of results of operations for other operations for the three years in the period ended December 31, 2009 is as follows (in thousands):
|
2009
|
2008
|
2007
|
||||||||||
|
Revenues and other income
|
$ | 53,341 | $ | 53,465 | $ | 53,564 | ||||||
|
Expenses:
|
||||||||||||
|
Interest
|
31 | 81 | 28 | |||||||||
|
Salaries and incentive compensation
|
8,314 | 10,957 | 9,721 | |||||||||
|
Depreciation and amortization
|
5,577 | 5,309 | 6,280 | |||||||||
|
Selling, general and other expenses
|
75,812 | 77,496 | 55,175 | |||||||||
| 89,734 | 93,843 | 71,204 | ||||||||||
|
|
||||||||||||
|
Loss before income taxes
|
$ | (36,393 | ) | $ | (40,378 | ) | $ | (17,640 | ) | |||
Revenues and other income for 2009 reflect $4,600,000 of greater revenues from a power production facility that burns waste biomass to produce electricity, which commenced operations in the fourth quarter of 2008, and $3,900,000 less income from purchased delinquent credit card receivables. Salaries and incentive compensation
declined during 2009 primarily due to workforce and compensation reductions and lower estimated incentive bonus expense. The change in selling, general and other expenses in 2009 as compared to 2008 reflects expenses (largely professional fees and other costs) related to the investigation and evaluation of energy projects ($23,500,000 and $30,800,000 for 2009 and 2008, respectively); greater operating expenses incurred by the power production facility of $7,200,000; charges at winery operations during
2009 to reduce the carrying amount of wine inventory that is expected to be sold as bulk wine or used in lower value bottled wine products of $4,700,000; and a loss in 2008 from asset disposals and write-downs of $5,200,000.
Revenues and other income for 2008 reflect an increase of $7,500,000 in income from purchased delinquent credit card receivables as compared to 2007. For 2007, revenues and other income include $8,500,000 related to the termination of a joint development agreement with another party. This amount substantially reimbursed
the Company for its prior expenditures, which were fully expensed as incurred. The increase in selling, general and other expenses in 2008 as compared to 2007 primarily reflects expenses (largely professional fees and other costs) related to the investigation and evaluation of energy projects ($30,800,000 and $18,200,000 for 2008 and 2007, respectively); the loss in 2008 from asset disposals and write-downs of $5,200,000; and greater operating expenses incurred by the power production facility of $3,200,000.
69
Corporate
A summary of results of operations for corporate for the three years in the period ended December 31, 2009 is as follows (in thousands):
|
2009
|
2008
|
2007
|
||||||||||
|
Investment and other income (including net
|
||||||||||||
|
securities gains (losses))
|
$ | 97,774 | $ | (43,339 | ) | $ | 204,995 | |||||
|
Expenses:
|
||||||||||||
|
Interest
|
125,724 | 140,002 | 110,839 | |||||||||
|
Salaries and incentive compensation
|
45,659 | 26,395 | 36,773 | |||||||||
|
Depreciation and amortization
|
18,441 | 12,903 | 9,655 | |||||||||
|
Selling, general and other expenses
|
76,610 | 79,385 | 75,606 | |||||||||
| 266,434 | 258,685 | 232,873 | ||||||||||
|
|
||||||||||||
|
Loss before income taxes
|
$ | (168,660 | ) | $ | (302,024 | ) | $ | (27,878 | ) | |||
Investment and other income increased $17,700,000 in 2009 as compared to 2008. Of this amount, investment income declined $23,200,000 in 2009 principally due to lower interest rates on a lower amount of fixed income securities, while other income increased $40,900,000 in 2009. Other income includes $66,100,000 and
$40,500,000 for 2009 and 2008, respectively, related to Fortescue’s Pilbara iron ore and infrastructure project in Western Australia. The Company is entitled to receive 4% of the revenue, net of government royalties, invoiced from certain areas of Fortescue’s project, which commenced production in May 2008. Amounts are payable semi-annually within thirty days of June 30
th
and December 31
st
of
each year subject to restricted payment provisions of Fortescue’s debt agreements; payments are currently being deferred by FMG pursuant to those agreements. Depreciation and amortization expenses include prepaid mining interest amortization of $7,300,000 and $2,800,000 for 2009 and 2008, respectively, which is being amortized over time in proportion to the amount of ore produced. Other income in 2009 also reflects a gain from a legal settlement of $10,500,000 and gains of $6,700,000
on the repurchase of $35,600,000 principal amount of the Company’s 7% Senior Notes and $6,500,000 principal amount of the Company’s 8.65% Junior Subordinated Deferrable Interest Debentures. In addition, investment and other income reflects income (charges) of $1,300,000, $(1,800,000) and $(1,900,000) for the years ended December 31, 2009, 2008 and 2007, respectively, related to the accounting for mark-to-market values of Corporate derivatives. Investment and other income in 2008
includes $2,500,000 of foreign exchange gains.
Investment and other income decreased in 2008 as compared to 2007. Investment income declined $41,000,000 in 2008 principally due to lower interest rates on a reduced amount of fixed income securities. Other income, which increased $29,900,000 in 2008, includes $40,500,000 of income related to Fortescue’s
Pilbara iron ore and infrastructure project in Western Australia. Investment and other income for 2007 includes the receipt of escrowed proceeds from the sale of an associated company in 2006 of $11,400,000 that had not been previously recognized.
Net securities gains (losses) for Corporate aggregated $(21,100,000), $(144,500,000) and $92,700,000 for the years ended December 31, 2009, 2008 and 2007, respectively. Net securities gains (losses) are net of impairment charges of $31,400,000, $143,400,000 and $36,800,000 during 2009, 2008 and 2007, respectively. The
Company’s decision to sell securities and realize security gains or losses is generally based on its evaluation of an individual security’s value at the time and the prospect for changes in its value in the future. The decision could also be influenced by the status of the Company’s tax attributes. The timing of realized security gains or losses is not predictable and does not follow any pattern from year to year.
70
The decrease in interest expense during 2009 as compared to 2008 primarily reflects decreased interest expense related to the 3¾% Convertible Senior Subordinated Notes, $128,900,000 of which were converted in the fourth quarter of 2008 and $123,500,000 of which were converted principally in the second quarter of 2009, decreased
interest expense related to the repurchased 7% Senior Notes and decreased interest expense related to the fixed rate repurchase agreements. The increase in interest expense during 2008 as compared to 2007 primarily reflects interest expense relating to the 8 1/8% Senior Notes issued in September 2007 and the 7 1/8% Senior Notes issued in March 2007. Interest expense for 2008 also reflects decreased interest expense related to the fixed rate repurchase agreements and the converted 3¾%
Convertible Senior Subordinated Notes.
Salaries and incentive compensation expense increased in 2009 as compared to 2008 principally due to greater accrued incentive bonus expense related to the Company’s Senior Executive Annual Incentive Bonus Plan. Bonus accruals under this plan are based on a percentage of pre-tax profits as defined in the plan. Principally
due to reductions in incentive bonus expense and less share-based compensation expense, salaries and incentive compensation expense decreased by $10,400,000 in 2008 as compared to 2007. The Company recorded share-based compensation expense relating to grants made under the Company’s senior executive warrant plan and the fixed stock option plan of $10,900,000 in 2009, $9,600,000 in 2008 and $10,800,000 in 2007. Share-based compensation expense in 2007 reflected increased expenses relating
to the stock option plan due to the accelerated vesting of stock options of an officer of the Company who resigned.
The decrease in selling, general and other expenses in 2009 as compared to 2008 principally reflects lower legal and other professional fees of $7,100,000, lower corporate aircraft expense of $5,100,000, primarily resulting from less usage and lower fuel costs, and lower severance expense of $4,700,000. Selling, general and
other expenses for 2009 also reflect an increase as compared to 2008 of $12,100,000 for expenses incurred relating to the induced conversion of the Company’s 3¾% Convertible Senior Subordinated Notes, as discussed above ($28,300,000 was expensed in 2009), and $2,600,000 of greater pension expense.
The increase in selling, general and other expenses in 2008 as compared to 2007 primarily reflects $16,200,000 of expenses incurred relating to the induced conversion of $128,887,000 principal amount of the Company’s 3¾% Convertible Senior Subordinated Notes during the fourth quarter of 2008 and $6,100,000 of severance expense. Selling,
general and other expenses for 2007 include a charge of $7,500,000 for the settlement of litigation related to MK Resources Company, greater legal fees, including those incurred in connection with that litigation, and higher professional fees.
As of December 31, 2009, the Company has a full valuation allowance against its net federal deferred tax asset, including its available NOLs. As a result, the Company did not record any regular federal income tax expense for the year ended December 31, 2009. However, the Company has material unrealized security gains
reflected in accumulated other comprehensive income and in income related to associated companies. If these gains were realized, the Company would be able to use its NOLs to fully offset the federal income taxes that would be due, but the Company would have to pay federal minimum taxes. Although the payment of federal minimum taxes generates a minimum tax credit carryover, it would be fully reserved for in the net deferred tax asset valuation allowance. Accordingly, for the year
ended December 31, 2009, the Company recorded provisions for deferred federal minimum taxes payable of $22,700,000 and $11,600,000 in accumulated other comprehensive income and income related to associated companies, respectively. In addition, income tax expense for the year ended December 31, 2009 includes state and foreign income taxes.
71
As more fully discussed above, during 2008 the Company concluded that a valuation allowance was required against substantially all of the net deferred tax asset, and increased its valuation allowance by $1,672,100,000 with a corresponding charge to income tax expense. During 2007 the Company’s revised projections of future
taxable income enabled it to conclude that it was more likely than not that it will have future taxable income sufficient to realize a portion of the Company’s net deferred tax asset; accordingly, $542,700,000 of the deferred tax valuation allowance was reversed as a credit to income tax expense. The income tax provision reflects the reversal of tax reserves aggregating $2,000,000, $4,100,000 and $2,300,000 for the years ended December 31, 2009, 2008 and 2007, respectively, as a result of the
expiration of the applicable statute of limitations and the favorable resolution of various state and federal income tax contingencies.
Associated Companies
Income (losses) related to associated companies includes the following for the years ended December 31, 2009, 2008 and 2007 (in thousands):
|
2009
|
2008
|
2007
|
||||||||||
|
ACF
|
$ | 376,500 | $ | (155,300 | ) | $ | – | |||||
|
Jefferies
|
469,800 | (105,700 | ) | – | ||||||||
|
Berkadia
|
20,800 | – | – | |||||||||
|
Garcadia
|
(25,700 | ) | 3,300 | 6,600 | ||||||||
|
IFIS
|
(1,900 | ) | (71,700 | ) | – | |||||||
|
Pershing Square
|
(3,200 | ) | (77,700 | ) | (85,500 | ) | ||||||
|
Shortplus
|
(400 | ) | 10,500 | 54,500 | ||||||||
|
Highland Opportunity
|
– | (17,200 | ) | (17,600 | ) | |||||||
|
Wintergreen
|
1,100 | (32,600 | ) | 14,000 | ||||||||
|
EagleRock
|
– | (19,000 | ) | (11,800 | ) | |||||||
|
Keen
|
(45,500 | ) | 24,900 | 13,600 | ||||||||
|
HomeFed
|
900 | (3,100 | ) | 1,500 | ||||||||
|
JPOF II
|
– | – | 3,000 | |||||||||
|
JHYH
|
37,200 | (69,100 | ) | 4,300 | ||||||||
|
Ambrose
|
– | (1,000 | ) | (1,100 | ) | |||||||
|
Premier
|
– | – | (22,300 | ) | ||||||||
|
Safe Harbor
|
– | – | 1,800 | |||||||||
|
CLC
|
1,000 | (5,900 | ) | 4,000 | ||||||||
|
Other
|
(24,800 | ) | (17,200 | ) | 3,800 | |||||||
|
Income (losses) related to associated
|
||||||||||||
|
companies before income taxes
|
805,800 | (536,800 | ) | (31,200 | ) | |||||||
|
Income tax (expense) benefit
|
(25,600 | ) | (2,300 | ) | 9,300 | |||||||
|
Income (losses) related to associated
|
||||||||||||
|
companies, net of taxes
|
$ | 780,200 | $ | (539,100 | ) | $ | (21,900 | ) | ||||
As discussed above, the Company elected the fair value option to account for its investments in Jefferies and ACF, resulting in the recognition of unrealized gains in 2009 and unrealized losses in 2008.
As discussed above, the Company’s equity in earnings of Berkadia include its share of a bargain purchase gain of $24,400,000.
As discussed above, during 2009, the Company’s equity in losses of Garcadia includes impairment charges for goodwill and other intangible assets aggregating $32,300,000.
As discussed above, during 2009, the Company’s equity in losses of Keen includes impairment charges of $36,500,000. Keen became a consolidated subsidiary in November 2009.
72
The Company’s share of IFIS’s losses in 2008 includes an impairment charge of $63,300,000. In January 2009, IFIS raised a significant amount of new equity in a rights offering in which the Company did not participate. As a result, the Company’s ownership interest in IFIS was reduced to 8% and the
Company no longer applies the equity method of accounting for this investment.
In June 2007, the Company acquired a 10% limited partnership interest in Pershing Square, a newly-formed private investment partnership whose investment decisions are at the sole discretion of Pershing Square’s general partner. The stated objective of Pershing Square is to create capital appreciation by investing in Target
Corporation. Losses recorded by Pershing Square principally result from a decline in the market value of Target Corporation’s common stock.
Shortplus, Highland Opportunity, Wintergreen, EagleRock, Ambrose and Safe Harbor are investment partnerships or limited liability corporations whose investment decisions are at the sole discretions of their respective general partners or managing members. These entities invest in a variety of debt and equity securities. The
Company has redeemed its interests in these entities.
The Company owns approximately 31.4% of HomeFed, a California real estate development company, which it acquired in 2002. The Company’s share of HomeFed’s reported earnings fluctuates with the level of real estate sales activity at HomeFed’s development projects.
In April 2007, the Company and Jefferies expanded and restructured the Company’s equity investment in JPOF II, and formed JHYH. The Company contributed $250,000,000 to JHYH along with its investment in JPOF II. The Company’s share of JPOF II’s earnings was distributed to the Company shortly after
the end of each period.
The Company accounted for Premier under the equity method of accounting while it was in bankruptcy (September 2006 to August 2007).
Discontinued Operations
WilTel
The Company sold WilTel in December 2005. During 2009, the Company received 636,300 of its common shares in connection with the resolution of a lawsuit related to WilTel and recorded income from discontinued operations of $15,200,000 based on the market value of the common shares. These shares were originally issued
in connection with the acquisition of WilTel in 2003, and had been held in a fund for certain claims made against WilTel prior to the Company’s ownership. The resolution of the lawsuit found that the claimants were not entitled to the shares and they were returned to the Company. Gain on disposal of discontinued operations for 2007 includes a pre-tax gain of $800,000 ($500,000 after tax) from the resolution of sale-related contingencies.
Empire
As discussed above, during the years ended December 31, 2009 and 2008, the Company received distributions totaling $11,300,000 and $44,900,000, respectively, from Empire, a subsidiary of the Company that had been classified as a discontinued operation in 2001 and fully written-off. For income tax purposes, the payments are treated
as non-taxable distributions paid by a subsidiary.
73
Other
Gain on disposal of discontinued operations for 2007 includes a pre-tax gain of $4,000,000 ($2,800,000 after tax) related to the collection of additional amounts from the sale of the Company’s interest in an Argentine shoe manufacturer in 2005 that had not been previously recognized (collectibility was uncertain).
Losses of $1,100,000 in 2008 relate to an indemnification obligation to the purchaser of a former subsidiary.
Recently Issued Accounting Standards
In June 2009, the Financial Accounting Standards Board (“FASB”) issued guidance for the accounting for transfers of financial assets, which is effective for fiscal years beginning after November 15, 2009, that eliminates the concept of a qualifying special-purpose entity, establishes specific conditions that must be met for
transfers of portions of financial assets to be eligible for sale accounting, clarifies and amends the derecognition criteria for a transfer to be accounted for as a sale, changes the amount of recognized gain/loss on a transfer accounted for as a sale under certain circumstances, and requires enhanced disclosures. The Company does not expect that the adoption of this guidance will have a material impact on its consolidated financial statements.
In June 2009, the FASB issued guidance effective for fiscal years beginning after November 15, 2009, that requires an enterprise to qualitatively determine whether the enterprise’s variable interest or interests give it a controlling financial interest in a variable interest entity (“VIE”), which would result in the
enterprise being the primary beneficiary of the VIE. This determination of the primary beneficiary is based upon the enterprise that has both the power to direct the activities of a VIE that most significantly impact the VIE’s economic performance, and has the obligation to absorb losses or the right to receive benefits of the VIE that could potentially be significant to the VIE. It also requires ongoing reassessment of whether an enterprise is the primary beneficiary of a VIE and
enhanced disclosures. The Company does not expect that the adoption of this guidance will have a material impact on its consolidated financial statements.
|
|
The following includes “forward-looking statements” that involve risk and uncertainties. Actual results could differ materially from those projected in the forward-looking statements.
The Company’s market risk arises principally from interest rate risk related to its investment portfolio and its borrowing activities and equity price risk.
The Company’s investment portfolio is primarily classified as available for sale, and consequently, is recorded on the balance sheet at fair value with unrealized gains and losses reflected in equity. Included in the Company’s available for sale investment portfolio are fixed income securities, which comprised approximately 22% of the Company’s
total investment portfolio at December 31, 2009. These fixed income securities are primarily rated “investment grade” or are U.S. governmental agency issued or U.S. Government-Sponsored Enterprises. The estimated weighted average remaining life of these fixed income securities was approximately 2.7 years at December 31, 2009. The Company’s fixed income securities, like all fixed income instruments, are subject to interest rate risk and will fall in value if market
interest rates increase. At December 31, 2008, fixed income securities comprised approximately 47% of the Company’s total investment portfolio and had an estimated weighted average remaining life of 1.6 years.
74
Also included in the Company’s available for sale investment portfolio are equity securities, which are recorded on the balance sheet at an aggregate fair value of $1,557,100,000 (aggregate cost of $379,000,000) and which comprised approximately 70% of the Company’s total investment portfolio at December 31, 2009. The
majority of this amount consists of two publicly traded securities; the investment in Fortescue common shares, which is carried at fair value of $1,108,000,000, and the investment in Inmet, which is carried at fair value of $339,100,000. The Company evaluates its investments for impairment on a quarterly basis.
The Company is also subject to price risk related to its investments in ACF and Jefferies, for which it has elected the fair value option. At December 31, 2009, these investments are classified as investments in associated companies and carried at fair values of $639,800,000 and $1,152,900,000, respectively.
At December 31, 2009 and 2008, the Company’s portfolio of trading securities was not material to the total investment portfolio.
The Company is subject to interest rate risk on its long-term fixed interest rate debt. Generally, the fair market value of debt securities with a fixed interest rate will increase as interest rates fall, and the fair market value will decrease as interest rates rise.
The following table provides information about the Company’s financial instruments used for purposes other than trading that are primarily sensitive to changes in interest rates. For investment securities and debt obligations, the table presents principal cash flows by expected maturity dates. For the variable rate borrowings, the weighted
average interest rates are based on implied forward rates in the yield curve at the reporting date. Included in variable interest rate borrowings is the MB1 debt whose fair value is the value of its collateral. For securities and liabilities with contractual maturities, the table presents contractual principal cash flows adjusted for the Company’s historical experience and prepayments of mortgage-backed securities.
For additional information, see Notes 6, 13 and 22 of Notes to Consolidated Financial Statements.
75
|
|
Expected Maturity Date
|
|||||||||||||||||||||||||||||||
|
2010
|
2011
|
2012
|
2013
|
2014
|
Thereafter
|
Total
|
Fair Value
|
|||||||||||||||||||||||||
|
(Dollars in thousands)
|
||||||||||||||||||||||||||||||||
|
Rate Sensitive Assets:
|
||||||||||||||||||||||||||||||||
|
Available for Sale Fixed Income Securities:
|
||||||||||||||||||||||||||||||||
|
U.S. Government and agencies
|
$ | 80,419 | $ | 25,791 | $ | - | $ | - | $ | - | $ | - | $ | 106,210 | $ | 106,210 | ||||||||||||||||
|
Weighted Average
Interest Rate
|
.75 | % | .84 | % | - | - | - | - | ||||||||||||||||||||||||
|
U.S. Government-
Sponsored Enterprises
|
$ | 55,849 | $ | 50,595 | $ | 41,534 | $ | 34,458 | $ | 28,880 | $ | 146,904 | $ | 358,220 | $ | 358,220 | ||||||||||||||||
|
Weighted Average
Interest Rate
|
3.57 | % | 3.59 | % | 3.56 | % | 3.54 | % | 3.52 | % | 3.52 | % | ||||||||||||||||||||
|
Other Fixed Maturities:
|
||||||||||||||||||||||||||||||||
|
Rated Investment Grade
|
$ | 9,950 | $ | 969 | $ | - | $ | - | $ | - | $ | - | $ | 10,919 | $ | 10,919 | ||||||||||||||||
|
Weighted Average
Interest Rate
|
1.02 | % | 6.04 | % | - | - | - | - | ||||||||||||||||||||||||
|
Rated Less Than Investment Grade/Not Rated
|
$ | 386 | $ | 4,827 | $ | 4,245 | $ | 2,416 | $ | 777 | $ | - | $ | 12,651 | $ | 12,651 | ||||||||||||||||
|
Weighted Average Interest Rate
|
9.38 | % | 8.17 | % | 7.47 | % | 8.18 | % | 8.63 | % | - | |||||||||||||||||||||
|
Rate Sensitive Liabilities:
|
||||||||||||||||||||||||||||||||
|
Fixed Interest Rate Borrowings
|
$ | 199,651 | $ | 682 | $ | 634 | $ | 440,078 | $ | 98,054 | $ | 1,091,726 | $ | 1,830,825 | $ | 1,819,334 | ||||||||||||||||
|
Weighted Average
Interest Rate
|
.30 | % | 2.16 | % | 1.79 | % | 7.34 | % | 7.55 | % | 7.71 | % | ||||||||||||||||||||
|
Variable Interest Rate Borrowings
|
$ | 112,941 | $ | 32,909 | $ | 24 | $ | - | $ | - | $ | - | $ | 145,874 | $ | 114,763 | ||||||||||||||||
|
Weighted Average
Interest Rate
|
2.93 | % | 5.77 | % | 3.30 | % | - | - | - | |||||||||||||||||||||||
|
Rate Sensitive Derivative
Financial Instruments:
|
||||||||||||||||||||||||||||||||
|
Euro currency swap
|
$ | 522 | $ | - | $ | - | $ | - | $ | - | $ | - | $ | 522 | $ | (314 | ) | |||||||||||||||
|
Average Pay Rate
|
5.89 | % | - | - | - | - | - | |||||||||||||||||||||||||
|
Average Receive Rate
|
7.60 | % | - | - | - | - | - | |||||||||||||||||||||||||
|
Pay Fixed/Receive Variable
|
||||||||||||||||||||||||||||||||
|
Interest Rate Swap
|
$ | 2,114 | $ | 32,879 | $ | - | $ | - | $ | - | $ | - | $ | 34,993 | $ | (1,935 | ) | |||||||||||||||
|
Average Pay Rate
|
5.01 | % | 5.01 | % | - | - | - | - | ||||||||||||||||||||||||
|
Average Receive Rate
|
1.42 | % | 1.77 | % | - | - | - | - | ||||||||||||||||||||||||
|
|
Financial Statements and supplementary data required by this Item 8 are set forth at the pages indicated in Item 15(a) below.
76
|
|
None.
|
|
|
Evaluation of disclosure controls and procedures
|
(a) The Company's management evaluated, with the participation of the Company's principal executive and principal financial officers, the effectiveness of the Company's disclosure controls and procedures (as defined in Rules 13a-15(e) and 15d-15(e) under the Securities Exchange Act of 1934, as amended (the “Exchange
Act”)), as of December 31, 2009. Based on their evaluation, the Company's principal executive and principal financial officers concluded that the Company's disclosure controls and procedures were effective as of December 31, 2009.
|
|
Changes in internal control over financial reporting
|
(b) There has been no change in the Company's internal control over financial reporting (as defined in Rules 13a-15(f) and 15d-15(f) under the Exchange Act) that occurred during the Company's fiscal quarter ended December 31, 2009, that has materially affected, or is reasonably likely to materially affect, the Company's
internal control over financial reporting.
Management’s Report on Internal Control Over Financial Reporting
Management of the Company is responsible for establishing and maintaining adequate internal control over financial reporting as defined in Rules 13a-15(f) or 15d-15(f) promulgated under the Securities Exchange Act of 1934. Internal control over financial reporting is a process designed to provide reasonable assurance regarding
the reliability of financial reporting and the preparation of financial statements for external purposes in accordance with generally accepted accounting principles and includes those policies and procedures that:
|
·
|
Pertain to the maintenance of records that, in reasonable detail, accurately and fairly reflect the transactions and disposition of the assets of the Company;
|
|
·
|
Provide reasonable assurance that transactions are recorded as necessary to permit preparation of financial statements in accordance with generally accepted accounting principles, and that receipts and expenditures of the Company are being made only in accordance with authorizations of management and directors of the Company; and
|
|
·
|
Provide reasonable assurance regarding prevention or timely detection of unauthorized acquisition, use or disposition of the Company’s assets that could have a material effect on the consolidated financial statements.
|
Because of its inherent limitations, internal control over financial reporting may not prevent or detect misstatements. Also, projections of any evaluation of effectiveness to future periods are subject to the risk that controls may become inadequate because of changes in conditions, or that the degree of compliance with the
policies or procedures may deteriorate.
The Company’s management assessed the effectiveness of the Company’s internal control over financial reporting as of December 31, 2009. In making this assessment, the Company’s management used the criteria established in
Internal Control-Integrated Framework
issued
by the Committee of Sponsoring Organizations of the Treadway Commission (COSO).
77
Based on our assessment and those criteria, management concluded that, as of December 31, 2009, the Company’s internal control over financial reporting was effective.
The effectiveness of the Company’s internal control over financial reporting as of December 31, 2009 has been audited by PricewaterhouseCoopers LLP, an independent registered public accounting firm, as stated in their report which appears herein.
Not applicable.
The information to be included under the caption “Election of Directors” and “Information Concerning the Board and Board Committees” in the Company’s definitive proxy statement to be filed with the Commission pursuant to Regulation 14A of the Exchange Act in connection with the 2010 annual meeting of shareholders
of the Company (the “Proxy Statement”) is incorporated herein by reference. In addition, reference is made to Item 10 in Part I of this Report.
The information to be included under the caption “Executive Compensation” in the Proxy Statement is incorporated herein by reference.
The information to be included under the caption “Information on Stock Ownership” in the Proxy Statement is incorporated herein by reference.
The information to be included under the caption “Executive Compensation - Certain Relationships and Related Transactions” in the Proxy Statement is incorporated herein by reference.
The information to be included under the caption “Independent Accounting Firm Fees” in the Proxy Statement is incorporated herein by reference.
78
(a)(1)(2) Financial Statements and Schedule.
|
Report of Independent Registered Public Accounting Firm
|
F-1
|
|
Financial Statements:
|
|
|
Consolidated Balance Sheets at December 31, 2009 and 2008
|
F-2
|
|
Consolidated Statements of Operations for the years ended December 31, 2009,
|
|
|
2008 and 2007
|
F-3
|
|
Consolidated Statements of Cash Flows for the years ended December 31, 2009,
|
|
|
2008 and 2007
|
F-5
|
|
Consolidated Statements of Changes in Equity for the years ended
|
|
|
December 31, 2009, 2008 and 2007
|
F-7
|
|
Notes to Consolidated Financial Statements
|
F-9
|
|
Financial Statement Schedule:
|
|
|
Schedule II – Valuation and Qualifying Accounts
|
F-58
|
|
|
|
|
(3)
|
Executive Compensation Plans and Arrangements. See Item 15(b) below for a complete list of Exhibits to this Report.
|
1999 Stock Option Plan as Amended and Restated, effective May 11, 2009 (filed as Annex A to the Company’s Proxy Statement dated April 10, 2009 (the “2009 Proxy Statement”)).
|
|
Form of Grant Letter for the 1999 Stock Option Plan (filed as Exhibit 10.4 to the Company’s Annual Report on Form 10-K for the fiscal year ended December 31, 2004 (the “2004 10-K”)).
|
Amended and Restated Shareholders Agreement dated as of June 30, 2003 among the Company, Ian M. Cumming and Joseph S. Steinberg (filed as Exhibit 10.5 to the Company’s Annual Report on Form 10-K for the fiscal year ended December 31, 2003 (the “2003 10-K”)).
Form of Amendment No. 1 to the Amended and Restated Shareholders Agreement dated as of June 30, 2003 (filed as Exhibit 10.6 to the Company’s Quarterly Report on Form 10-Q for the fiscal quarter ended June 30, 2006 (the “2nd Quarter 2006 10-Q”)).
Leucadia National Corporation 2003 Senior Executive Annual Incentive Bonus Plan, as amended May 16, 2006 (filed as Annex A to the Company’s Proxy Statement dated April 17, 2006 (the “2006 Proxy Statement”)).
Leucadia National Corporation 2006 Senior Executive Warrant Plan (filed as Annex B to the 2006 Proxy Statement).
Employment Agreement made as of June 30, 2005 by and between the Company and Ian M. Cumming (filed as Exhibit 99.1 to the Company's Current Report on Form 8-K dated July 13, 2005 (the “July 13, 2005 8-K”)).
Employment Agreement made as of June 30, 2005 by and between the Company and Joseph S. Steinberg (filed as Exhibit 99.2 to the July 13, 2005 8-K).
79
|
|
Deferred Compensation and Salary Continuation Agreement, dated March 2, 1977 by and between Terracor, a Utah Corporation and Ian M. Cumming (filed as Exhibit 10.1 to the Company’s Quarterly Report on Form 10-Q for the quarter ended March 31, 2009 (the “1st Quarter 2009 10-Q”)).*
|
|
|
First Amendment to Deferred Compensation and Salary Continuation Agreement, dated May 24, 1996 by and between the Company, as successor to Terracor, and Ian M. Cumming (filed as Exhibit 10.2 to the 1st Quarter 2009 10-Q).*
|
(b) Exhibits.
We will furnish any exhibit upon request made to our Corporate Secretary, 315 Park Avenue South, New York, NY 10010. We charge $.50 per page to cover expenses of copying and mailing.
All documents referenced below were filed pursuant to the Securities Exchange Act of 1934 by the Company, file number 1-5721, unless otherwise indicated.
|
|
3.1
|
Restated Certificate of Incorporation (filed as Exhibit 5.1 to the Company’s Current Report on Form 8-K dated July 14, 1993).*
|
|
|
3.2
|
Certificate of Amendment of the Certificate of Incorporation dated as of May 14, 2002 (filed as Exhibit 3.2 to the 2003 10-K).*
|
|
|
3.3
|
Certificate of Amendment of the Certificate of Incorporation dated as of December 23, 2002 (filed as Exhibit 3.2 to the Company’s Annual Report on Form 10-K for the fiscal year ended December 31, 2002 (the “2002 10-K”)).*
|
|
|
3.4
|
Amended and Restated By-laws as amended through March 2, 2009 (filed as Exhibit 3.1 to the Company’s Current Report on Form 8-K dated March 3, 2009).*
|
|
|
3.5
|
Certificate of Amendment of the Certificate of Incorporation dated as of May 13, 2004 (filed as Exhibit 3.5 to the Company’s 2004 10-K).*
|
|
|
3.6
|
Certificate of Amendment of the Certificate of Incorporation dated as of May 17, 2005 (filed as Exhibit 3.6 to the Company’s Annual Report on Form 10-K for the fiscal year ended December 31, 2005 (the “2005 10-K”)).*
|
|
|
3.7
|
Certificate of Amendment of the Certificate of Incorporation dated as of May 23, 2007 (filed as Exhibit 4.7 to the Company’s Registration Statement on Form S-8 (No. 333-143770)).*
|
|
|
4.1
|
The Company undertakes to furnish the Securities and Exchange Commission, upon written request, a copy of all instruments with respect to long-term debt not filed herewith.
|
|
|
10.1
|
1999 Stock Option Plan as Amended and Restated, effective May 11, 2009 (filed as Annex A to the 2009 Proxy Statement).*
|
|
|
10.2
|
Form of Grant Letter for the 1999 Stock Option Plan (filed as Exhibit 10.4 to the Company’s 2004 10-K).*
|
80
|
|
10.3
|
Amended and Restated Shareholders Agreement dated as of June 30, 2003 among the Company, Ian M. Cumming and Joseph S. Steinberg (filed as Exhibit 10.5 to the 2003 10-K).*
|
|
|
10.4
|
Services Agreement, dated as of January 1, 2004, between the Company and Ian M. Cumming (filed as Exhibit 10.37 to the 2005 10-K).*
|
|
|
10.5
|
Services Agreement, dated as of January 1, 2004, between the Company and Joseph S. Steinberg (filed as Exhibit 10.38 to the 2005 10-K).*
|
|
|
10.6
|
Leucadia National Corporation 2003 Senior Executive Annual Incentive Bonus Plan, as amended May 16, 2006 (filed as Annex A to the 2006 Proxy Statement).*
|
|
|
10.7
|
Employment Agreement made as of June 30, 2005 by and between the Company and Ian M. Cumming (filed as Exhibit 99.1 to the July 13, 2005 8-K).*
|
|
|
10.8
|
Employment Agreement made as of June 30, 2005 by and between the Company and Joseph S. Steinberg (filed as Exhibit 99.2 to the July 13, 2005 8-K).*
|
|
|
10.9
|
Tax Cooperation Agreement between Williams Communications Group, Inc. (“WCG”) and the Williams Companies Inc. dated July 26, 2002, filed with the Bankruptcy Court as Exhibit 7 to the Settlement Agreement (filed as Exhibit 99.9 to the Current Report on Form 8-K of WCG dated July 31, 2002).*
|
|
|
10.10
|
Exhibit 1 to the Agreement and Plan of Reorganization between the Company and TLC Associates, dated February 23, 1989 (filed as Exhibit 3 to Amendment No. 12 to the Schedule 13D dated December 29, 2004 of Ian M. Cumming and Joseph S. Steinberg with respect to the Company).*
|
|
|
10.11
|
Information Concerning Executive Compensation (filed as Exhibit 10.1 to the Company’s Current Report on Form 8-K dated January 24, 2008).*
|
|
|
10.12
|
Form of Unit Purchase Agreement, dated as of April 6, 2006, by and among GAR, LLC, the Company, AA Capital Equity Fund, L.P., AA Capital Biloxi Co-Investment Fund, L.P. and HRHC Holdings, LLC (filed as Exhibit 10.1 to the 2nd Quarter 2006 10-Q).*
|
|
|
10.13
|
Form of Loan Agreement, dated as of April 6, 2006, by and among Goober Drilling, LLC, the Subsidiaries of Goober Drilling, LLC from time to time signatory thereto and the Company (filed as Exhibit 10.2 to the 2nd Quarter 2006 10-Q).*
|
|
|
10.14
|
Form of First Amendment to Loan Agreement, dated as of June 15, 2006, between Goober Drilling, LLC, the Subsidiaries of Goober Drilling, LLC from time to time signatory thereto and the Company (filed as Exhibit 10.3 to the 2nd Quarter 2006 10-Q).*
|
|
|
10.15
|
Form of First Amended and Restated Limited Liability Company Agreement of Goober Drilling, LLC, dated as of June 15, 2006, by and among Goober Holdings, LLC, Baldwin Enterprises, Inc., the Persons that become Members from time to time, John Special, Chris McCutchen, Jim Eden, Mike Brown and Goober Drilling Corporation (filed as Exhibit 10.4 to the 2nd Quarter 2006 10-Q).*
|
81
|
|
10.16
|
Form of Amendment No. 1, dated as of May 16, 2006, to the Amended and Restated Shareholders Agreement dated as of June 30, 2003, by and among Ian M. Cumming, Joseph S. Steinberg and the Company (filed as Exhibit 10.6 to the 2nd Quarter 2006 10-Q).*
|
|
|
10.17
|
Form of Subscription Agreement, dated as of July 15, 2006, by and among FMG Chichester Pty Ltd, the Company, and Fortescue Metals Group Ltd (filed as Exhibit 10.1 to the Company’s Quarterly Report on Form 10-Q for the quarterly period ended September 30, 2006 (the “3rd Quarter 2006 10-Q”)).*
|
|
|
10.18
|
Form of Amending Agreement, dated as of August 18, 2006, by and among FMG Chichester Pty Ltd, the Company and Fortescue Metals Group Ltd (filed as Exhibit 10.2 to the 3rd Quarter 2006 10-Q).*
|
|
|
10.19
|
Compensation Information Concerning Non-Employee Directors (filed under Item 1.01 of the Company’s Current Report on Form 8-K dated May 22, 2006).*
|
|
|
10.20
|
Leucadia National Corporation 2006 Senior Executive Warrant Plan (filed as Annex B to the 2006 Proxy Statement).*
|
|
|
10.21
|
Asset Purchase and Contribution Agreement, dated as of January 23, 2007, by and among Baldwin Enterprises, Inc., STi Prepaid, LLC, Samer Tawfik, Telco Group, Inc., STi Phonecard Inc., Dialaround Enterprises Inc., STi Mobile Inc., Phonecard Enterprises Inc.,VOIP Enterprises Inc., STi PCS, LLC, Tawfik & Partners, SNC, STiPrepaid & Co., STi Prepaid Distributors & Co. and ST Finance, LLC (filed
as Exhibit 10.1 to the Company’s Quarterly Report on Form 10-Q for the quarterly period ended March 31, 2007 (the “1st Quarter 2007 10-Q”)).*
|
|
|
10.22
|
Registration Rights Agreement, dated as of March 8, 2007, among STi Prepaid, LLC and ST Finance, LLC (filed as Exhibit 10.2 to the 1st Quarter 2007 10-Q).*
|
|
|
10.23
|
Amended and Restated Limited Liability Company Agreement, dated as of March 8, 2007, by and among STi Prepaid, LLC, BEI Prepaid, LLC and ST Finance, LLC (filed as Exhibit 10.3 to the 1st Quarter 2007 10-Q).*
|
|
|
10.24
|
Master Agreement for the Formation of a Limited Liability Company dated as of February 28, 2007, among Jefferies Group, Inc., Jefferies & Company, Inc. and Leucadia National Corporation (filed as Exhibit 10.4 to the 1st Quarter 2007 10-Q).*
|
|
|
10.25
|
Amended and Restated Limited Liability Company Agreement of Jefferies High Yield Holdings, LLC, dated as of April 2, 2007, by and among Jefferies Group, Inc., Jefferies & Company, Inc., Leucadia National Corporation, Jefferies High Yield Partners, LLC, Jefferies Employees Opportunity Fund LLC and Jefferies High Yield Holdings, LLC (filed as Exhibit 10.5 to the 1st Quarter 2007 10-Q).*
|
|
|
10.26
|
Investment Agreement dated as of April 20, 2008, by and between Leucadia National Corporation and Jefferies Group, Inc. (filed as Exhibit 10.1 to the Company's Current Report on Form 8-K filed on April 21, 2008).*
|
|
|
10.27
|
Letter Agreement dated April 20, 2008, between Leucadia National Corporation and Jefferies Group, Inc. (filed as Exhibit 10.2 to the Company's Current Report on Form 8-K filed on April 21, 2008).*
|
|
|
10.28
|
Share Forward Transaction Agreement, dated January 11, 2008 (filed as Exhibit 1 to the Company's schedule 13D dated January 10, 2008 with respect to AmeriCredit Corp.).*
|
82
|
|
10.29
|
Deferred Compensation and Salary Continuation Agreement, dated March 2, 1977 by and between Terracor, a Utah Corporation and Ian M. Cumming (filed as Exhibit 10.1 to the 1st Quarter 2009 10-Q).*
|
|
|
10.30
|
First Amendment to Deferred Compensation and Salary Continuation Agreement, dated May 24, 1996 by and between the Company, as successor to Terracor, and Ian M. Cumming (filed as Exhibit 10.2 to the 1st Quarter 2009 10-Q).*
|
|
|
10.31
|
Asset Put Agreement, dated September 2, 2009, among Berkadia III, LLC, Capmark Financial Group, Inc., Capmark Finance Inc. and Capmark Capital Inc., and solely with respect to Sections 2.5, 10.5, 10.7, 10.11, 10.16 and 10.17, Berkshire Hathaway Inc. and Leucadia National Corporation (filed as Exhibit 10.1 to the Company’s Current Report on Form 8-K filed on September 3, 2009).*
|
|
|
10.32
|
Guaranty, dated as of December 10, 2009, by Leucadia National Corporation in favor of BH Finance LLC, in its own capacity as the lender under the Credit Agreement, dated as of December 10, 2009, among Berkadia Commercial Mortgage LLC and BH Finance LLC, and on behalf of each of the other Secured Parties under (and as defined in) the Credit Agreement (filed as Exhibit 10.1 to the Company’s Current Report on
Form 8-K filed on December 14, 2009).*
|
|
|
21
|
Subsidiaries of the registrant.
|
|
|
23.1
|
Consent of PricewaterhouseCoopers LLP with respect to the incorporation by reference into the Company’s Registration Statements on Form S-8 (No. 333-51494), Form S-8 (No. 333-143770), and Form S-3 (No. 333-145668).
|
|
|
23.2
|
Consent of independent auditors from Ernst & Young LLP, with respect to the inclusion in this Annual Report on Form 10-K of the financial statements of Pershing Square IV, L.P. and with respect to the incorporation by reference in the Company’s Registration Statements on Form S-8 (No. 333-51494), Form S-8 (No. 333-143770), and Form S-3 (No. 333-145668).
|
|
|
23.3
|
Consent of independent auditors from Ernst & Young, with respect to the inclusion in this Annual Report on Form 10-K of the financial statements of Pershing Square IV, L.P. and with respect to the incorporation by reference in the Company’s Registration Statements on Form S-8 (No. 333-51494), Form S-8 (No. 333-143770), and Form S-3 (No. 333-145668).
|
|
|
23.4
|
Consent of independent auditors from PricewaterhouseCoopers LLP, with respect to the inclusion in this Annual Report on Form 10-K of the financial statements of Premier Entertainment Biloxi, LLC and with respect to the incorporation by reference in the Company’s Registration Statements on Form S-8 (No. 333-51494), Form S-8 (No. 333-143770), and Form S-3 (No. 333-145668).
|
|
|
23.5
|
Consent of independent auditors from PricewaterhouseCoopers LLP, with respect to the inclusion in this Annual Report on Form 10-K of the financial statements of HFH ShortPLUS Fund, L.P. and HFH ShortPLUS Master Fund, Ltd. and with respect to the incorporation by reference in the Company’s Registration Statements on Form S-8 (No. 333-51494), Form S-8 (No. 333-143770), and Form S-3 (No. 333-145668).
|
83
|
|
23.6
|
Consent of independent auditors from Deloitte & Touche LLP, with respect to the inclusion in this Annual Report on Form 10-K of the financial statements of AmeriCredit Corp. and with respect to the incorporation by reference in the Company’s Registration Statements on Form S-8 (No. 333-51494), Form S-8 (No. 333-143770), and Form S-3 (No. 333-145668).
|
|
|
23.7
|
Consent of independent auditors from KPMG LLP with respect to the inclusion in this Annual Report on Form 10-K of the financial statements of Jefferies Group, Inc. and with respect to the incorporation by reference in the Company’s Registration Statements on Form S-8 (No. 333-51494), Form S-8 (No. 333-143770), and Form S-3 (No. 333-145668).
|
|
|
31.1
|
Certification of Chairman of the Board and Chief Executive Officer pursuant to Section 302 of the Sarbanes-Oxley Act of 2002.
|
|
|
31.2
|
Certification of President pursuant to Section 302 of the Sarbanes-Oxley Act of 2002.
|
|
|
31.3
|
Certification of Chief Financial Officer pursuant to Section 302 of the Sarbanes-Oxley Act of 2002.
|
|
|
32.1
|
Certification of Chairman of the Board and Chief Executive Officer pursuant to Section 906 of the Sarbanes-Oxley Act of 2002.**
|
|
|
32.2
|
Certification of President pursuant to Section 906 of the Sarbanes-Oxley Act of 2002.**
|
|
|
32.3
|
Certification of Principal Financial Officer pursuant to Section 906 of the Sarbanes-Oxley Act of 2002.**
|
|
|
101
|
Financial statements from the Annual Report on Form 10-K of Leucadia National Corporation for the year ended December 31, 2009, formatted in Extensible Business Reporting Language (XBRL): (i) the Consolidated Balance Sheets, (ii) the Consolidated Statements of Operations, (iii) the Consolidated Statements of Cash Flows, (iv) the Consolidated Statements of Changes in Shareholders Equity, (v) the Notes to
Consolidated Financial Statements and (vi) Financial Statement Schedule II – Valuation and Qualifying Accounts, tagged as blocks of text.
|
|
|
(c)
|
Financial statement schedules.
|
|
|
(1)
|
Pershing Square IV, L.P. financial statements as of and for the years ended December 31, 2009 (unaudited), and as of and for the years ended December 31, 2008 and 2007 (audited).
|
|
|
(2)
|
AmeriCredit Corp. financial statements as of and for the years ended June 30, 2009 and 2008.
|
|
|
(3)
|
Jefferies Group, Inc. financial statements as of and for the years ended December 31, 2009 and 2008.
|
|
|
(4)
|
HFH Highland ShortPLUS Fund, L.P. financial statements as of and for the period ended March 31, 2009 (unaudited), as of and for the year ended December 31, 2008 (unaudited) and as of and for the year ended December 31, 2007 (audited), and HFH ShortPLUS Master Fund, Ltd. financial statements as of and for the period ended March 31, 2009 (unaudited), as of and for the year ended December 31, 2008 (unaudited) and as
of and for the year ended December 31, 2007 (audited).
|
|
|
(5)
|
Premier Entertainment Biloxi, LLC financial statements as of August 9, 2007 and for the period from January 1, 2007 through August 9, 2007 (audited).
|
____________________________
|
*
|
Incorporated by reference.
|
|
**
|
Furnished herewith pursuant to item 601(b) (32) of Regulation S-K.
|
84
|
|
SIGNATURES
|
Pursuant to the requirements of Section 13 or 15(d) of the Securities Exchange Act of 1934, the registrant has duly caused this report to be signed on its behalf by the undersigned, thereunto duly authorized.
| Leucadia National Corporation | |||
|
Date: February 26, 2010
|
By:
|
/s/ Barbara L. Lowenthal | |
| Name: Barbara L. Lowenthal | |||
| Title: Vice President and Comptroller | |||
Pursuant to the requirements of the Securities Exchange Act of 1934, this report has been signed below by the following persons on behalf of the registrant and in the capacities indicated, on the date set forth below.
|
Date
|
Signature
|
Title
|
|
|
February 26, 2010
|
By:
|
/s/ Ian M. Cumming
|
Chairman of the Board
|
|
Ian M. Cumming
|
(Principal Executive Officer)
|
||
|
February 26, 2010
|
By:
|
/s/ Joseph S. Steinberg
|
President and Director
|
|
Joseph S. Steinberg
|
(Principal Executive Officer)
|
||
|
February 26, 2010
|
By:
|
/s/ Joseph A. Orlando
|
Vice President and Chief Financial Officer
|
|
Joseph A. Orlando
|
(Principal Financial Officer)
|
||
|
February 26, 2010
|
By:
|
/s/ Barbara L. Lowenthal
|
Vice President and Comptroller
|
|
Barbara L. Lowenthal
|
(Principal Accounting Officer)
|
||
|
February 26, 2010
|
By:
|
/s/ Paul M. Dougan
|
Director
|
|
Paul M. Dougan
|
|||
|
February 26, 2010
|
By:
|
/s/ Alan J. Hirschfield
|
Director
|
|
Alan J. Hirschfield
|
|||
|
February 26, 2010
|
By:
|
/s/ James E. Jordan
|
Director
|
|
James E. Jordan
|
|||
|
February 26, 2010
|
By:
|
/s/ Jeffrey C. Keil
|
Director
|
|
Jeffrey C. Keil
|
|||
|
February 26, 2010
|
By:
|
/s/ Jesse Clyde Nichols, III
|
Director
|
|
Jesse Clyde Nichols, III
|
|||
|
February 26, 2010
|
By:
|
/s/ Michael Sorkin
|
Director
|
|
Michael Sorkin
|
85
Report of Independent Registered Public Accounting Firm
To
the Board of Directors and
Shareholders of Leucadia National Corporation:
In our opinion, the consolidated financial statements listed in the index appearing under Item 15(a)(1)(2) present fairly, in all material respects, the financial position of Leucadia National Corporation and its subsidiaries at December 31, 2009 and 2008, and the results of their operations and their cash flows for each of the three years
in the period ended December 31, 2009 in conformity with accounting principles generally accepted in the United States of America. In addition, in our opinion, the financial statement schedule listed in the index appearing under Item 15(a)(1)(2) presents fairly, in all material respects, the information set forth therein when read in conjunction with the related consolidated financial statements. Also in our opinion, the Company maintained, in all material respects, effective internal control
over financial reporting as of December 31, 2009, based on criteria established in
Internal Control - Integrated Framework
issued by the Committee of Sponsoring Organizations of the Treadway Commission (COSO). The Company's management is responsible for these financial statements and financial statement schedule, for maintaining effective internal control over financial reporting and for its assessment of the effectiveness of internal control
over financial reporting, included in "Management's Report on Internal Control over Financial Reporting" appearing under Item 9A. Our responsibility is to express opinions on these financial statements, on the financial statement schedule, and on the Company's internal control over financial reporting based on our integrated audits. We conducted our audits in accordance with the standards of the Public Company Accounting Oversight Board (United States). Those standards require
that we plan and perform the audits to obtain reasonable assurance about whether the financial statements are free of material misstatement and whether effective internal control over financial reporting was maintained in all material respects. Our audits of the financial statements included examining, on a test basis, evidence supporting the amounts and disclosures in the financial statements, assessing the accounting principles used and significant estimates made by management, and evaluating the
overall financial statement presentation. Our audit of internal control over financial reporting included obtaining an understanding of internal control over financial reporting, assessing the risk that a material weakness exists, and testing and evaluating the design and operating effectiveness of internal control based on the assessed risk. Our audits also included performing such other procedures as we considered necessary in the circumstances. We believe that our audits provide a reasonable
basis for our opinion.
As discussed in Note 2 to the consolidated financial statements, the Company changed the manner in which it accounts for business combinations in 2009.
A company’s internal control over financial reporting is a process designed to provide reasonable assurance regarding the reliability of financial reporting and the preparation of financial statements for external purposes in accordance with generally accepted accounting principles. A company’s internal control over
financial reporting includes those policies and procedures that (i) pertain to the maintenance of records that, in reasonable detail, accurately and fairly reflect the transactions and dispositions of the assets of the company; (ii) provide reasonable assurance that transactions are recorded as necessary to permit preparation of financial statements in accordance with generally accepted accounting principles, and that receipts and expenditures of the company are being made only in accordance with authorizations
of management and directors of the company; and (iii) provide reasonable assurance regarding prevention or timely detection of unauthorized acquisition, use, or disposition of the company’s assets that could have a material effect on the financial statements.
Because of its inherent limitations, internal control over financial reporting may not prevent or detect misstatements. Also, projections of any evaluation of effectiveness to future periods are subject to the risk that controls may become inadequate because of changes in conditions, or that the degree of compliance with the
policies or procedures may deteriorate.
/s/ PricewaterhouseCoopers LLP
PricewaterhouseCoopers LLP
New York, New York
February 26, 2010
F-1
LEUCADIA NATIONAL CORPORATION AND SUBSIDIARIES
CONSOLIDATED BALANCE SHEETS
December 31, 2009 and 2008
(Dollars in thousands, except par value)
|
2009
|
2008
|
|||||||
|
ASSETS
|
||||||||
|
Current assets:
|
||||||||
|
Cash and cash equivalents
|
$ | 154,128 | $ | 237,503 | ||||
|
Investments
|
84,707 | 366,464 | ||||||
|
Trade, notes and other receivables, net
|
207,090 | 138,363 | ||||||
|
Prepaids and other current assets
|
105,549 | 124,308 | ||||||
|
Total current assets
|
551,474 | 866,638 | ||||||
|
Non-current investments ($210,364 and $164,675 collateralizing current liabilities)
|
2,128,238 | 1,028,012 | ||||||
|
Notes and other receivables, net
|
7,294 | 17,756 | ||||||
|
Intangible assets, net and goodwill
|
75,023 | 84,848 | ||||||
|
Deferred tax asset, net
|
– | 40,235 | ||||||
|
Other assets
|
520,202 | 619,790 | ||||||
|
Property, equipment and leasehold improvements, net
|
715,248 | 534,640 | ||||||
|
Investments in associated companies ($1,792,683 and $933,057 measured
|
||||||||
|
using fair value option)
|
2,764,885 | 2,006,574 | ||||||
|
Total
|
$ | 6,762,364 | $ | 5,198,493 | ||||
|
LIABILITIES
|
||||||||
|
Current liabilities:
|
||||||||
|
Trade payables and expense accruals
|
$ | 197,897 | $ | 205,870 | ||||
|
Deferred revenue
|
82,000 | 98,453 | ||||||
|
Other current liabilities
|
32,492 | 9,880 | ||||||
|
Debt due within one year
|
312,592 | 248,713 | ||||||
|
Total current liabilities
|
624,981 | 562,916 | ||||||
|
Other non-current liabilities
|
105,107 | 107,443 | ||||||
|
Long-term debt
|
1,657,779 | 1,832,743 | ||||||
|
Total liabilities
|
2,387,867 | 2,503,102 | ||||||
|
Commitments and contingencies
|
||||||||
|
EQUITY
|
||||||||
|
Common shares, par value $1 per share, authorized 600,000,000
|
||||||||
|
shares; 243,288,154 and 238,498,598 shares issued and
|
||||||||
|
outstanding, after deducting 47,524,960 and 46,888,660 shares
|
||||||||
|
held in treasury
|
243,288 | 238,499 | ||||||
|
Additional paid-in capital
|
1,529,064 | 1,413,595 | ||||||
|
Accumulated other comprehensive income (loss)
|
985,032 | (29,280 | ) | |||||
|
Retained earnings
|
1,604,263 | 1,053,983 | ||||||
|
Total Leucadia National Corporation shareholders’ equity
|
4,361,647 | 2,676,797 | ||||||
|
Noncontrolling interest
|
12,850 | 18,594 | ||||||
|
Total equity
|
4,374,497 | 2,695,391 | ||||||
|
Total
|
$ | 6,762,364 | $ | 5,198,493 | ||||
The accompanying notes are an integral part of these consolidated financial statements.
F-2
LEUCADIA NATIONAL CORPORATION AND SUBSIDIARIES
CONSOLIDATED STATEMENTS OF OPERATIONS
For the years ended December 31, 2009, 2008 and 2007
(In thousands, except per share amounts)
|
2009
|
2008
|
2007
|
||||||||||
|
REVENUES AND OTHER INCOME
:
|
||||||||||||
|
Manufacturing
|
$ | 224,460 | $ | 336,833 | $ | 397,113 | ||||||
|
Telecommunications
|
426,027 | 451,864 | 361,742 | |||||||||
|
Oil and gas drilling services
|
11,102 | – | – | |||||||||
|
Property management and service fees
|
117,148 | 141,605 | 80,892 | |||||||||
|
Gaming entertainment
|
103,495 | 105,842 | 38,042 | |||||||||
|
Investment and other income
|
257,876 | 189,051 | 181,465 | |||||||||
|
Net securities gains (losses)
|
(21,106 | ) | (144,542 | ) | 95,641 | |||||||
| 1,119,002 | 1,080,653 | 1,154,895 | ||||||||||
|
EXPENSES
:
|
||||||||||||
|
Cost of sales:
|
||||||||||||
|
Manufacturing
|
196,967 | 295,200 | 340,703 | |||||||||
|
Telecommunications
|
363,885 | 392,469 | 309,045 | |||||||||
|
Direct operating expenses:
|
||||||||||||
|
Property management and services
|
92,421 | 113,768 | 65,992 | |||||||||
|
Gaming entertainment
|
79,452 | 93,987 | 37,772 | |||||||||
|
Interest
|
128,803 | 145,471 | 111,537 | |||||||||
|
Salaries and incentive compensation
|
100,530 | 87,569 | 88,269 | |||||||||
|
Depreciation and amortization
|
65,233 | 54,133 | 35,238 | |||||||||
|
Selling, general and other expenses
|
342,684 | 266,011 | 227,582 | |||||||||
| 1,369,975 | 1,448,608 | 1,216,138 | ||||||||||
|
Loss from continuing operations before income taxes and
|
||||||||||||
|
income (losses) related to associated companies
|
(250,973 | ) | (367,955 | ) | (61,243 | ) | ||||||
|
Income tax provision (benefit):
|
||||||||||||
|
Current
|
7,143 | 1,568 | 155 | |||||||||
|
Deferred
|
– | 1,672,107 | (559,926 | ) | ||||||||
| 7,143 | 1,673,675 | (559,771 | ) | |||||||||
|
Income (loss) from continuing operations before income (losses)
|
||||||||||||
|
related to associated companies
|
(258,116 | ) | (2,041,630 | ) | 498,528 | |||||||
|
Income (losses) related to associated companies, net of income tax
|
||||||||||||
|
provision (benefit) of $25,567, $2,252 and $(9,343)
|
780,236 | (539,068 | ) | (21,875 | ) | |||||||
|
Income (loss) from continuing operations
|
522,120 | (2,580,698 | ) | 476,653 | ||||||||
|
Income from discontinued operations, net of income tax provision
|
||||||||||||
|
of $0, $0 and $68
|
26,475 | 44,904 | 292 | |||||||||
|
Gain (loss) on disposal of discontinued operations, net of income
|
||||||||||||
|
tax provision of $0, $0 and $1,421
|
– | (1,018 | ) | 3,327 | ||||||||
|
Net income (loss)
|
548,595 | (2,536,812 | ) | 480,272 | ||||||||
|
Net loss attributable to the noncontrolling interest
|
1,685 | 1,387 | 4,022 | |||||||||
|
Net income (loss) attributable to Leucadia National
|
||||||||||||
|
Corporation common shareholders
|
$ | 550,280 | $ | (2,535,425 | ) | $ | 484,294 | |||||
(continued)
The accompanying notes are an integral part of these consolidated financial statements.
F-3
LEUCADIA NATIONAL CORPORATION AND SUBSIDIARIES
CONSOLIDATED STATEMENTS OF OPERATIONS, continued
For the years ended December 31, 2009, 2008 and 2007
(In thousands, except per share amounts)
|
2009
|
2008
|
2007
|
||||||||||
|
Basic earnings (loss) per common share attributable to Leucadia
|
||||||||||||
|
National Corporation common shareholders:
|
||||||||||||
|
Income (loss) from continuing operations
|
$ | 2.17 | $ | (11.19 | ) | $ | 2.20 | |||||
|
Income from discontinued operations
|
.11 | .19 | – | |||||||||
|
Gain (loss) on disposal of discontinued operations
|
– | – | .02 | |||||||||
|
Net income (loss)
|
$ | 2.28 | $ | (11.00 | ) | $ | 2.22 | |||||
|
Diluted earnings (loss) per common share attributable to Leucadia
|
||||||||||||
|
National Corporation common shareholders:
|
||||||||||||
|
Income (loss) from continuing operations
|
$ | 2.14 | $ | (11.19 | ) | $ | 2.09 | |||||
|
Income from discontinued operations
|
.11 | .19 | – | |||||||||
|
Gain (loss) on disposal of discontinued operations
|
– | – | .01 | |||||||||
|
Net income (loss)
|
$ | 2.25 | $ | (11.00 | ) | $ | 2.10 | |||||
|
Amounts attributable to Leucadia National Corporation common
|
||||||||||||
|
shareholders:
|
||||||||||||
|
Income (loss) from continuing operations, net of taxes
|
$ | 523,805 | $ | (2,579,311 | ) | $ | 480,808 | |||||
|
Income from discontinued operations, net of taxes
|
26,475 | 44,904 | 159 | |||||||||
|
Gain (loss) on disposal of discontinued operations, net of taxes
|
– | (1,018 | ) | 3,327 | ||||||||
|
Net income (loss)
|
$ | 550,280 | $ | (2,535,425 | ) | $ | 484,294 | |||||
The accompanying notes are an integral part of these consolidated financial statements.
F-4
LEUCADIA NATIONAL CORPORATION AND SUBSIDIARIES
CONSOLIDATED STATEMENTS OF CASH FLOWS
For the years ended December 31, 2009, 2008 and 2007
(In thousands)
|
2009
|
2008
|
2007
|
||||||||||
|
Net cash flows from operating activities
:
|
||||||||||||
|
Net income (loss)
|
$ | 548,595 | $ | (2,536,812 | ) | $ | 480,272 | |||||
|
Adjustments to reconcile net income (loss) to net cash provided by
|
||||||||||||
|
(used for) operations:
|
||||||||||||
|
Deferred income tax provision (benefit)
|
19,612 | 1,672,063 | (567,864 | ) | ||||||||
|
Depreciation and amortization of property, equipment and leasehold improvements
|
61,946 | 56,060 | 41,216 | |||||||||
|
Other amortization
|
24,431 | 16,223 | 1,227 | |||||||||
|
Share-based compensation
|
11,106 | 12,183 | 11,176 | |||||||||
|
Excess tax benefit from exercise of stock options
|
(15 | ) | (1,828 | ) | (4,022 | ) | ||||||
|
Provision for doubtful accounts
|
2,615 | 2,386 | 566 | |||||||||
|
Net securities (gains) losses
|
21,106 | 144,542 | (95,641 | ) | ||||||||
|
(Income) losses related to associated companies
|
(805,803 | ) | 536,816 | 31,218 | ||||||||
|
Distributions from associated companies
|
36,692 | 87,211 | 55,769 | |||||||||
|
Net (gains) losses related to real estate, property and equipment, and other assets
|
46,074 | (29,244 | ) | (30,040 | ) | |||||||
|
Income related to Fortescue’s Pilbara project
|
(66,079 | ) | (40,467 | ) | – | |||||||
|
Bargain purchase gain related to Keen
|
(49,345 | ) | – | – | ||||||||
|
Common shares received in connection with lawsuit resolution
|
(15,222 | ) | – | – | ||||||||
|
Gain on buyback of debt
|
(6,693 | ) | – | – | ||||||||
|
Loss on debt conversion
|
25,990 | 16,239 | – | |||||||||
|
(Gain) loss on disposal of discontinued operations
|
– | 1,018 | (4,748 | ) | ||||||||
|
Investments classified as trading, net
|
(1,132 | ) | 90,929 | 45,128 | ||||||||
|
Net change in:
|
||||||||||||
|
Restricted cash
|
(115 | ) | 3,321 | 22,799 | ||||||||
|
Trade, notes and other receivables
|
14,222 | 6,445 | 11,989 | |||||||||
|
Prepaids and other assets
|
11,679 | 3,838 | (588 | ) | ||||||||
|
Trade payables and expense accruals
|
(13,778 | ) | (19,228 | ) | 835 | |||||||
|
Other liabilities
|
358 | (3,836 | ) | (1,267 | ) | |||||||
|
Deferred revenue
|
(16,670 | ) | (10,594 | ) | (16,356 | ) | ||||||
|
Income taxes payable
|
17,462 | 713 | (10,834 | ) | ||||||||
|
Other
|
(460 | ) | 834 | 10,796 | ||||||||
|
Net cash provided by (used for) operating activities
|
(133,424 | ) | 8,812 | (18,369 | ) | |||||||
|
Net cash flows from investing activities
:
|
||||||||||||
|
Acquisition of property, equipment and leasehold improvements
|
(23,566 | ) | (76,066 | ) | (37,700 | ) | ||||||
|
Acquisitions of and capital expenditures for real estate investments
|
(10,095 | ) | (108,082 | ) | (97,393 | ) | ||||||
|
Proceeds from disposals of real estate, property and equipment, and other assets
|
26,158 | 13,106 | 81,247 | |||||||||
|
Proceeds from (payments related to) disposal of discontinued operations,
|
||||||||||||
|
net of expenses and cash of operations sold
|
– | (1,018 | ) | 4,245 | ||||||||
|
Acquisitions, net of cash acquired
|
(3,134 | ) | (20,659 | ) | (90,269 | ) | ||||||
|
Settlement of lawsuit
|
9,500 | – | – | |||||||||
|
Collection of insurance proceeds
|
272 | 15,289 | – | |||||||||
|
Net change in restricted cash
|
655 | 139 | (65,715 | ) | ||||||||
|
Advances on notes and other receivables
|
(4,172 | ) | (18,119 | ) | (20,172 | ) | ||||||
|
Collections on notes, loans and other receivables
|
28,835 | 35,242 | 38,868 | |||||||||
|
Investments in associated companies
|
(282,271 | ) | (955,633 | ) | (1,010,211 | ) | ||||||
|
Capital distributions from associated companies
|
105,735 | 184,244 | 69,543 | |||||||||
|
Investment in Fortescue Metals Group Ltd
|
– | – | (44,217 | ) | ||||||||
|
Purchases of investments (other than short-term)
|
(2,235,140 | ) | (4,409,391 | ) | (5,759,504 | ) | ||||||
|
Proceeds from maturities of investments
|
344,724 | 439,595 | 688,355 | |||||||||
|
Proceeds from sales of investments
|
2,114,177 | 4,498,386 | 5,286,321 | |||||||||
|
Other
|
293 | (64 | ) | (757 | ) | |||||||
|
Net cash provided by (used for) investing activities
|
71,971 | (403,031 | ) | (957,359 | ) | |||||||
(continued)
The accompanying notes are an integral part of these consolidated financial statements.
F-5
LEUCADIA NATIONAL CORPORATION AND SUBSIDIARIES
CONSOLIDATED STATEMENTS OF CASH FLOWS, continued
For the years ended December 31, 2009, 2008 and 2007
(In thousands)
|
2009
|
2008
|
2007
|
||||||||||
|
Net cash flows from financing activities
:
|
||||||||||||
|
Issuance of debt, net of issuance costs
|
$ | 50,122 | $ | 88,657 | $ | 1,017,852 | ||||||
|
Reduction of debt
|
(42,966 | ) | (15,862 | ) | (75,509 | ) | ||||||
|
Premium paid on debt conversion
|
(25,990 | ) | (12,232 | ) | – | |||||||
|
Issuance of common shares
|
958 | 106,324 | 253,441 | |||||||||
|
Purchase of common shares for treasury
|
– | (122 | ) | (163 | ) | |||||||
|
Excess tax benefit from exercise of stock options
|
15 | 1,828 | 4,022 | |||||||||
|
Dividends paid
|
– | – | (55,644 | ) | ||||||||
|
Other
|
(4,087 | ) | 6,225 | 1,461 | ||||||||
|
Net cash provided by (used for) financing activities
|
(21,948 | ) | 174,818 | 1,145,460 | ||||||||
|
Effect of foreign exchange rate changes on cash
|
26 | (66 | ) | 39 | ||||||||
|
Net increase (decrease) in cash and cash equivalents
|
(83,375 | ) | (219,467 | ) | 169,771 | |||||||
|
Cash and cash equivalents at January 1,
|
237,503 | 456,970 | 287,199 | |||||||||
|
Cash and cash equivalents at December 31,
|
$ | 154,128 | $ | 237,503 | $ | 456,970 | ||||||
|
Supplemental disclosures of cash flow information
:
|
||||||||||||
|
Cash paid during the year for:
|
||||||||||||
|
Interest
|
$ | 129,598 | $ | 144,319 | $ | 90,640 | ||||||
|
Income tax payments (refunds), net
|
$ | (4,364 | ) | $ | 3,152 | $ | 11,078 | |||||
|
Non-cash investing activities
:
|
||||||||||||
|
Common stock issued for acquisition of Jefferies Group, Inc. common shares
|
$ | – | $ | 398,248 | $ | – | ||||||
|
Non-cash financing activities
:
|
||||||||||||
|
Issuance of common shares for debt conversion
|
$ | 123,529 | $ | 128,890 | $ | – | ||||||
The accompanying notes are an integral part of these consolidated financial statements.
F-6
LEUCADIA NATIONAL CORPORATION AND SUBSIDIARIES
CONSOLIDATED STATEMENTS OF CHANGES IN EQUITY
For the years ended December 31, 2009, 2008 and 2007
(In thousands, except par value and per share amounts)
|
Leucadia National Corporation Common Shareholders
|
||||||||||||||||||||||||||||
|
Common
|
Accumulated
|
|||||||||||||||||||||||||||
|
Shares
|
Additional
|
Other
|
||||||||||||||||||||||||||
|
$1 Par
|
Paid-In
|
Comprehensive
|
Retained
|
Noncontrolling
|
||||||||||||||||||||||||
|
Value
|
Capital
|
Income (Loss)
|
Earnings
|
Subtotal
|
Interest
|
Total
|
||||||||||||||||||||||
|
Balance, January 1, 2007
|
$ | 216,351 | $ | 520,892 | $ | (4,726 | ) | $ | 3,160,758 | $ | 3,893,275 | $ | 18,982 | $ | 3,912,257 | |||||||||||||
|
Comprehensive income:
|
||||||||||||||||||||||||||||
|
Net change in unrealized gain (loss) on
|
||||||||||||||||||||||||||||
|
investments, net of taxes of $549,415
|
959,872 | 959,872 | 959,872 | |||||||||||||||||||||||||
|
Net change in unrealized foreign
|
||||||||||||||||||||||||||||
|
exchange gain (loss), net of taxes
|
||||||||||||||||||||||||||||
|
of $3,512
|
6,126 | 6,126 | 6,126 | |||||||||||||||||||||||||
|
Net change in unrealized gain (loss)
|
||||||||||||||||||||||||||||
|
on derivative instruments, net of taxes
|
||||||||||||||||||||||||||||
|
of $87
|
168 | 168 | 168 | |||||||||||||||||||||||||
|
Net change in pension liability and
|
||||||||||||||||||||||||||||
|
postretirement benefits, net of taxes
|
||||||||||||||||||||||||||||
|
of $7,843
|
13,925 | 13,925 | 13,925 | |||||||||||||||||||||||||
|
Net income
|
484,294 | 484,294 | (4,022 | ) | 480,272 | |||||||||||||||||||||||
|
Comprehensive income
|
1,464,385 | (4,022 | ) | 1,460,363 | ||||||||||||||||||||||||
|
Contributions from noncontrolling interests
|
10,683 | 10,683 | ||||||||||||||||||||||||||
|
Distributions to noncontrolling interests
|
(4,669 | ) | (4,669 | ) | ||||||||||||||||||||||||
|
Share-based compensation expense
|
11,176 | 11,176 | 11,176 | |||||||||||||||||||||||||
|
Issuance of common shares
|
5,500 | 236,500 | 242,000 | 242,000 | ||||||||||||||||||||||||
|
Exercise of options to purchase common
|
||||||||||||||||||||||||||||
|
shares, including excess tax benefit
|
728 | 14,735 | 15,463 | 15,463 | ||||||||||||||||||||||||
|
Purchase of common shares for treasury
|
(5 | ) | (158 | ) | (163 | ) | (163 | ) | ||||||||||||||||||||
|
Dividends ($.25 per common share)
|
(55,644 | ) | (55,644 | ) | (55,644 | ) | ||||||||||||||||||||||
|
Balance, December 31, 2007
|
222,574 | 783,145 | 975,365 | 3,589,408 | 5,570,492 | 20,974 | 5,591,466 | |||||||||||||||||||||
|
Comprehensive loss:
|
||||||||||||||||||||||||||||
|
Net change in unrealized gain (loss) on
|
||||||||||||||||||||||||||||
|
investments, net of taxes of $556,853
|
(973,676 | ) | (973,676 | ) | (973,676 | ) | ||||||||||||||||||||||
|
Net change in unrealized foreign
|
||||||||||||||||||||||||||||
|
exchange gain (loss), net of taxes
|
||||||||||||||||||||||||||||
|
of $3,764
|
(6,582 | ) | (6,582 | ) | (6,582 | ) | ||||||||||||||||||||||
|
Net change in unrealized gain (loss)
|
||||||||||||||||||||||||||||
|
on derivative instruments, net of taxes
|
||||||||||||||||||||||||||||
|
of $540
|
944 | 944 | 944 | |||||||||||||||||||||||||
|
Net change in pension liability and
|
||||||||||||||||||||||||||||
|
postretirement benefits, net of taxes
|
||||||||||||||||||||||||||||
|
of $14,488
|
(25,331 | ) | (25,331 | ) | (25,331 | ) | ||||||||||||||||||||||
|
Net loss
|
(2,535,425 | ) | (2,535,425 | ) | (1,387 | ) | (2,536,812 | ) | ||||||||||||||||||||
|
Comprehensive loss
|
(3,540,070 | ) | (1,387 | ) | (3,541,457 | ) | ||||||||||||||||||||||
|
Contributions from noncontrolling interests
|
11,987 | 11,987 | ||||||||||||||||||||||||||
|
Distributions to noncontrolling interests
|
(12,980 | ) | (12,980 | ) | ||||||||||||||||||||||||
|
Share-based compensation expense
|
11,207 | 11,207 | 11,207 | |||||||||||||||||||||||||
|
Sale of common shares to Jefferies Group, Inc.
|
10,000 | 488,269 | 498,269 | 498,269 | ||||||||||||||||||||||||
|
Issuance of common shares for debt
|
||||||||||||||||||||||||||||
|
conversion
|
5,612 | 123,278 | 128,890 | 128,890 | ||||||||||||||||||||||||
|
Exercise of options to purchase common
|
||||||||||||||||||||||||||||
|
shares, including excess tax benefit
|
315 | 7,816 | 8,131 | 8,131 | ||||||||||||||||||||||||
|
Purchase of common shares for treasury
|
(2 | ) | (120 | ) | (122 | ) | (122 | ) | ||||||||||||||||||||
(continued)
The accompanying notes are an integral part of these consolidated financial statements.
F-7
LEUCADIA NATIONAL CORPORATION AND SUBSIDIARIES
CONSOLIDATED STATEMENTS OF CHANGES IN EQUITY, continued
For the years ended December 31, 2009, 2008 and 2007
(In thousands, except par value and per share amounts)
|
Leucadia National Corporation Common Shareholders
|
||||||||||||||||||||||||||||
|
Common
|
Accumulated
|
|||||||||||||||||||||||||||
|
Shares
|
Additional
|
Other
|
||||||||||||||||||||||||||
|
$1 Par
|
Paid-In
|
Comprehensive
|
Retained
|
Noncontrolling
|
||||||||||||||||||||||||
|
Value
|
Capital
|
Income (Loss)
|
Earnings
|
Subtotal
|
Interest
|
Total
|
||||||||||||||||||||||
|
Balance, December 31, 2008
|
$ | 238,499 | $ | 1,413,595 | $ | (29,280 | ) | $ | 1,053,983 | $ | 2,676,797 | $ | 18,594 | $ | 2,695,391 | |||||||||||||
|
Comprehensive income:
|
||||||||||||||||||||||||||||
|
Net change in unrealized gain (loss) on
|
||||||||||||||||||||||||||||
|
investments, net of taxes of $36,348
|
1,010,162 | 1,010,162 | 1,010,162 | |||||||||||||||||||||||||
|
Net change in unrealized foreign
|
||||||||||||||||||||||||||||
|
exchange gain (loss), net of taxes
|
||||||||||||||||||||||||||||
|
of $51
|
3,602 | 3,602 | 3,602 | |||||||||||||||||||||||||
|
Net change in unrealized gain (loss)
|
||||||||||||||||||||||||||||
|
on derivative instruments, net of taxes
|
||||||||||||||||||||||||||||
|
of $16
|
1,125 | 1,125 | 1,125 | |||||||||||||||||||||||||
|
Net change in pension liability and
|
||||||||||||||||||||||||||||
|
postretirement benefits, net of taxes
|
||||||||||||||||||||||||||||
|
of $8
|
(577 | ) | (577 | ) | (577 | ) | ||||||||||||||||||||||
|
Net income
|
550,280 | 550,280 | (1,685 | ) | 548,595 | |||||||||||||||||||||||
|
Comprehensive income
|
1,564,592 | (1,685 | ) | 1,562,907 | ||||||||||||||||||||||||
|
Contributions from noncontrolling interests
|
899 | 899 | ||||||||||||||||||||||||||
|
Distributions to noncontrolling interests
|
(4,986 | ) | (4,986 | ) | ||||||||||||||||||||||||
|
Change in interest in consolidated subsidiary
|
(28 | ) | (28 | ) | 28 | – | ||||||||||||||||||||||
|
Share-based compensation expense
|
11,106 | 11,106 | 11,106 | |||||||||||||||||||||||||
|
Issuance of common shares for debt
|
||||||||||||||||||||||||||||
|
conversion
|
5,378 | 118,151 | 123,529 | 123,529 | ||||||||||||||||||||||||
|
Common shares received from lawsuit
|
||||||||||||||||||||||||||||
|
resolution
|
(636 | ) | (14,686 | ) | (15,322 | ) | (15,322 | ) | ||||||||||||||||||||
|
Exercise of options to purchase common
|
||||||||||||||||||||||||||||
|
s
hares, including excess tax benefit
|
47 | 926 | 973 | 973 | ||||||||||||||||||||||||
|
Balance, December 31, 2009
|
$ | 243,288 | $ | 1,529,064 | $ | 985,032 | $ | 1,604,263 | $ | 4,361,647 | $ | 12,850 | $ | 4,374,497 | ||||||||||||||
The accompanying notes are an integral part of these consolidated financial statements.
F-8
L
EUCADIA NATIONAL CORPORATION AND SUBSIDIARIES
Notes to Consolidated Financial Statements
|
1.
|
Nature of Operations
:
|
The Company is a diversified holding company engaged in a variety of businesses, including manufacturing, telecommunications, land based contract oil and gas drilling, property management and services, gaming entertainment, real estate activities, medical product development and winery operations. The Company also has significant
investments in the common stock of two public companies that are accounted for at fair value, one of which is a full service investment bank and the other an independent auto finance company. The Company also owns equity interests in operating businesses and investment partnerships which are accounted for under the equity method of accounting, including a broker-dealer engaged in making markets and trading of high yield and special situation securities and an operating copper mine in Spain. The
Company continuously evaluates the retention and disposition of its existing operations and investments and frequently investigates the acquisition of new businesses. Changes in the mix of the Company’s owned businesses and investments should be expected.
The manufacturing operations are conducted through Idaho Timber, LLC (“Idaho Timber”) and Conwed Plastics, LLC (“Conwed Plastics”). Idaho Timber’s principal product lines include remanufacturing dimension lumber; remanufacturing, bundling and bar coding of home center boards for large retailers;
and production of 5/4” radius-edge, pine decking. Idaho Timber also manufactures and/or distributes a number of other specialty wood products. Idaho Timber operates nine facilities located throughout the U.S.
Conwed Plastics manufactures and markets lightweight plastic netting used for a variety of purposes including, among other things, building and construction, erosion control, packaging, agricultural, carpet padding, filtration and consumer products. Conwed Plastics manufacturing segment has four domestic manufacturing facilities,
and it owns and operates manufacturing and sales facilities in Belgium and Mexico.
The telecommunications business is conducted by the Company’s 75% owned subsidiary, STi Prepaid, LLC (“STi Prepaid”). STi Prepaid is a provider of international prepaid phone cards and other telecommunications services in the U.S.
The Company’s land based contract oil and gas drilling operations are conducted by Keen Energy Services, LLC (“Keen”), formerly known as Goober Drilling, LLC. Keen is based in Stillwater, Oklahoma and provides drilling services to independent oil and natural gas exploration and production companies in the
Mid-Continent Region of the U.S. The majority of wells drilled are natural gas wells.
The property management and services business is conducted through ResortQuest International, Inc. (“ResortQuest”). ResortQuest is engaged in offering management services to vacation properties in beach and mountain resort locations in the continental U.S., as well as in real estate brokerage services and other
rental and property owner services in resort locations.
The gaming entertainment business is conducted through Premier Entertainment Biloxi, LLC (“Premier”). Premier owns the Hard Rock Hotel & Casino Biloxi (“Hard Rock Biloxi”) located in Biloxi, Mississippi.
The domestic real estate operations include a mixture of commercial properties, residential land development projects and other unimproved land, all in various stages of development.
The Company’s medical product development operations are conducted through its majority-owned subsidiary, Sangart, Inc. (“Sangart”). Sangart is developing a product called MP4OX, formerly known as Hemospan®, which is a solution of cell-free hemoglobin administered intravenously to provide rapid oxygen
delivery to oxygen deprived tissues.
F-9
The winery operations consist of three wineries, Pine Ridge Vineyards in Napa Valley, California, Archery Summit in the Willamette Valley of Oregon and Chamisal Vineyards in the Edna Valley of California, and a vineyard development project in the Columbia Valley of Washington. The wineries primarily produce and sell wines in
the premium, ultra premium and luxury segments of the premium table wine market.
Certain amounts for prior periods have been reclassified to be consistent with the 2009 presentation.
|
2.
|
Significant Accounting Policies
:
|
In June 2009, the Financial Accounting Standards Board (“FASB”) approved the FASB Financial Accounting Standards Codification (“Codification”) as the single source of authoritative nongovernmental accounting principles generally accepted in the United States (“GAAP”). The Company must use
the Codification for periods beginning July 1, 2009, and all other accounting literature excluded from the Codification will be considered nonauthoritative, other than guidance issued by the Securities and Exchange Commission. The Codification does not change GAAP; however, references to previously issued accounting rules or pronouncements are no longer permitted. New FASB guidance will be issued as Accounting Standards Updates, which will be incorporated into the Codification.
Effective January 1, 2009, the Company adopted new FASB guidance with respect to accounting for business combinations. Had this guidance been in effect in 2007, the Company would have recognized a reduction to the deferred tax valuation allowance in connection with the acquisition of STi Prepaid through the Company's income tax
provision, and not as a component of the purchase price allocation as discussed in Note 3.
(a)
Critical Accounting Estimates
: The preparation of financial statements in conformity with GAAP requires the Company to make estimates and assumptions that affect the reported amounts in the financial statements and disclosures
of contingent assets and liabilities. On an on-going basis, the Company evaluates all of these estimates and assumptions. The following areas have been identified as critical accounting estimates because they have the potential to have a material impact on the Company’s financial statements, and because they are based on assumptions which are used in the accounting records to reflect, at a specific point in time, events whose ultimate outcome won’t be known until a later date. Actual
results could differ from these estimates.
Income Taxes -
At December 31, 2009, the Company’s valuation allowance for its net deferred tax asset fully reserved for all of the potential future tax savings from federal net operating loss carryforwards (“NOLs”) and for a substantial portion of its state NOLs. In
accordance with GAAP, the Company records a valuation allowance to reduce its deferred tax asset to the net amount that is more likely than not to be realized. The amount of any valuation allowance recorded does not in any way adversely affect the Company’s ability to use its NOLs to offset taxable income in the future. If in the future the Company determines that it is more likely than not that the Company will be able to realize its deferred tax asset in excess of its net recorded
amount, an adjustment to increase the net deferred tax asset would increase income in such period. If in the future the Company were to determine that it would not be able to realize all or part of its net recorded deferred tax asset, an adjustment to decrease the net deferred tax asset would be charged to income in such period. The Company is required to consider all available evidence, both positive and negative, and to weight the evidence when determining whether a valuation allowance
is required. Generally, greater weight is required to be placed on objectively verifiable evidence when making this assessment, in particular on recent historical operating results.
During the second half of 2008, the Company recorded significant unrealized losses on many of its largest investments, recognized other than temporary impairments for a number of other investments and reported reduced profitability from substantially all of its operating businesses, all of which contributed to the recognition of a pre-tax
loss of $859,500,000 in the consolidated statement of operations and a pre-tax loss in other comprehensive income (loss) of $1,579,200,000 for the year ended December 31, 2008. The worldwide economic downturn has adversely affected many of the Company’s operating businesses and investments, and the nature of the current economic difficulties make it impossible to reliably project how long the downturn will last. Additionally, the 2008 losses recognized by the Company resulted in a
cumulative loss in total comprehensive income (loss) during the three year period ending December 31, 2008. In assessing the realizability of the net deferred tax asset at December 31, 2008, the Company concluded that its recent operating losses and the then current economic conditions worldwide be given more weight than its projections of future taxable income during the period that it has NOLs available (until 2030), and be given more weight than the Company’s long track record of generating
taxable income. As a result, the Company concluded that a valuation allowance is required against substantially all of the net deferred tax asset.
F-10
Prior to 2008, the Company’s long track record of generating taxable income, its cumulative taxable income for the then recent prior periods and its projections of future taxable income were the most heavily weighted factors considered when determining how much of the net deferred tax asset was more likely than not to be realizable. During
2007, the Company concluded that it was more likely than not that it would have future taxable income sufficient to realize a portion of the Company’s net deferred tax asset; accordingly, $542,700,000 of the deferred tax valuation allowance was reversed as a credit to income tax expense. The Company’s estimate of future taxable income considered all available evidence, both positive and negative, about its operating businesses and investments, included an aggregation of individual projections
for each material operating business and investment, estimated apportionment factors for state and local taxing jurisdictions and included all future years that the Company estimated it would have available NOLs.
The Company will continue to evaluate the realizability of its net deferred tax asset in future periods. However, before the Company would reverse any portion of its valuation allowance in excess of taxes recorded on reported income, it will need positive evidence that it has historical positive cumulative taxable income over
a period of time which is likely to continue in future periods. At that time, any decrease to the valuation allowance would be based upon the Company’s projections of future taxable income, which are inherently uncertain.
The Company also records reserves for contingent tax liabilities based on the Company’s assessment of the probability of successfully sustaining its tax filing positions.
Impairment of Long-Lived Assets -
The Company evaluates its long-lived assets for impairment whenever events or changes in circumstances indicate, in management’s judgment, that the carrying value of such assets may not be recoverable. When testing for impairment,
the Company groups its long-lived assets with other assets and liabilities at the lowest level for which identifiable cash flows are largely independent of the cash flows of other assets and liabilities (or asset group). The determination of whether an asset group is recoverable is based on management’s estimate of undiscounted future cash flows directly attributable to the asset group as compared to its carrying value. If the carrying amount of the asset group is greater than the
undiscounted cash flows, an impairment loss would be recognized for the amount by which the carrying amount of the asset group exceeds its estimated fair value.
One of the Company’s real estate subsidiaries (MB1) is the owner and developer of a mixed use real estate project located in Myrtle Beach, South Carolina. The project is comprised of a retail center with approximately 346,000 square feet of retail space, 41,000 square feet of office space and 195 residential apartment
rental units. The retail center is approximately 90% leased and the office space is approximately 25% leased. Certain of the apartment units are allocated for long-term rental (114 units) and are substantially leased; the remaining apartment units are marketed as vacation rentals. The acquisition and construction costs were funded by capital contributed by the Company and nonrecourse indebtedness with a balance of $100,500,000 at December 31, 2009, that is collateralized by the
real estate. If MB1 is unable to make debt service or principal payments on the loan the Company is under no obligation to make those payments.
Current economic conditions have adversely impacted the majority of the retail tenants at the retail center. Over 20 retail tenants have requested reductions in rent payments, some of which have been granted; certain other tenants are not paying the full amount of rent due while their leases are being renegotiated. During
the second quarter of 2009, MB1 was unable to make scheduled payments under its interest rate swap agreement and received several default notices under its bank loan. These events constituted a change in circumstances that caused the Company to evaluate whether the carrying amount of MB1’s real estate asset was recoverable. Based on the assumptions discussed below the Company concluded that the carrying amount was not recoverable; accordingly, the Company recorded an impairment charge
of $67,800,000 during the second quarter of 2009 (classified as selling, general and other expenses), which reduced the carrying amount of MB1’s real estate to its fair value of $71,300,000 at June 30, 2009.
The Company prepared cash flow models and utilized a discounted cash flow technique to determine the fair value of MB1’s real estate. Although the retail center has a remaining useful life of 38 years, the Company prepared cash flow models assuming it would operate the retail center over periods of 7, 10 or 20 years and
then sell the retail center at the end of those periods. The most significant assumptions in the Company’s cash flow models were the discount rate (11%) and the capitalization rate used to estimate the selling price of the retail center (9%); these rates were selected based on published reports of market conditions for similar properties. The Company assumed that requested reductions in rent would continue through 2012 before returning to pre-abatement levels. Projected
net cash flow before debt service included assumptions for vacancies, rent renewal rates, expense increases and allowances for tenant improvements for new tenants. The Company also prepared an additional model that assumed the bank lenders foreclose on their loan and take title to MB1’s real estate. Although the Company would not receive any cash flow in the event the lenders foreclose on the mortgaged property, since the Company’s debt obligation is without recourse to the Company,
the impairment loss would be limited to the excess of the book value of the real estate over the debt obligation. The Company calculated the fair value of MB1’s real estate by probability-weighting the present values of the various possible outcomes.
F-11
The cash flow projections assume some recovery in the local and national economy over the next few years. If economic conditions do not improve and the bank lenders do not foreclose, it is possible that MB1 will have to continue to provide rent reductions for its properties which could result in further impairment charges to
the carrying value of the real estate. Although MB1’s bank loan matured in October 2009, it was not repaid since MB1 did not have sufficient funds and the Company is under no obligation and has no intention to provide the funds to MB1 to pay off the loan. MB1 received an additional default notice for failure to repay the bank loan but its lenders have not commenced foreclosure proceedings. If MB1’s bank lenders foreclose in the future, the Company would record a gain
equal to the excess of the loan balance over the then book value of the real estate. At December 31, 2009, the carrying value of MB1’s real estate was $69,400,000.
In addition to the MB1 impairment, during 2009 the Company recorded impairment losses on long-lived assets aggregating $6,200,000, classified as selling, general and other expenses. Of this amount, $2,600,000 related to its manufacturing segment (primarily Idaho Timber) and $3,600,000 related to its real estate segment. During
2009, Idaho Timber discontinued remanufacturing of dimension lumber and experienced declining sales of certain specialty wood products at one of its plants, and as a result decided to close the plant. Idaho Timber evaluated for impairment the plant’s long-lived assets, comprised of buildings, machinery and equipment, and customer relationships intangibles. The carrying values of long-lived assets held and used and intangible assets were written down to their fair values, determined
using the present value of expected future cash flows. The Company wrote down certain real estate properties that are held for sale for which the fair values were primarily based on appraisals or prices for similar assets. The Company also wrote down a real estate property that under GAAP is considered to be held and used, but which the Company has recently decided to sell. The Company wrote down this real estate property to fair value primarily using market information for similar
assets.
During 2008, the Company recorded impairment losses on long-lived assets aggregating $3,200,000, of which $800,000 related to its gaming entertainment segment, $1,300,000 related to its real estate segment and $1,100,000 related to its other operations segment. There were no impairment losses recorded during 2007.
Current economic conditions have adversely affected most of the Company’s operations and investments. A worsening of current economic conditions or a prolonged recession could cause a decline in estimated future cash flows expected to be generated by the Company’s operations and investments. If future undiscounted
cash flows are estimated to be less than the carrying amounts of the asset groups used to generate those cash flows in subsequent reporting periods, particularly for those with large investments in property and equipment (for example, manufacturing, gaming entertainment, land based contract oil and gas drilling operations, real estate and certain associated company investments), impairment charges would have to be recorded.
Impairment of Securities -
Declines in the fair value of equity securities considered to be other than temporary and declines in the fair values of debt securities related to credit losses are reflected in net securities gains (losses) in the consolidated statements of operations. The
Company evaluates its investments for impairment on a quarterly basis.
The Company’s determination of whether a security is other than temporarily impaired incorporates both quantitative and qualitative information; GAAP requires the exercise of judgment in making this assessment, rather than the application of fixed mathematical criteria. The various factors that the Company considers in
making its determination are specific to each investment. For publicly traded debt and equity securities, the Company considers a number of factors including, but not limited to, the length of time and the extent to which the fair value has been less than cost, the financial condition and near term prospects of the issuer, the reason for the decline in fair value, changes in fair value subsequent to the balance sheet date, the ability and intent to hold investments to maturity, and other factors specific to the
individual investment. For investments in private equity funds and non-public securities, the Company bases its determination upon financial statements, net asset values and/or other information obtained from fund managers or investee companies.
The Company has a portfolio of non-agency mortgage-backed bond securitizations, which were acquired at significant discounts to face amounts and are accounted for as acquisitions of impaired loans. The Company estimates the future cash flows for these securities to determine the accretable yield; increases in estimated cash
flows are accounted for as a yield adjustment on a prospective basis but decreases in estimated cash flows below amortized cost due to credit losses are recognized as impairments in the consolidated statements of operations. Contractual cash flows in excess of estimated cash flows are not part of the accretable yield. The market for these securities is highly illiquid and they rarely trade. On a regular basis, the Company re-estimates the future cash flows of these securities
and records impairment charges if appropriate. The fair values for these securities are primarily determined using an income valuation model to calculate the present value of expected future cash flows, which incorporates assumptions regarding potential future rates of delinquency, prepayments, defaults, collateral losses and interest rates.
F-12
The Company recorded the following impairment charges for securities in the consolidated statement of operations during the three year period ended December 31, 2009 (in thousands):
|
2009
|
2008
|
2007
|
||||||||||
|
Publicly traded securities
|
$ | 14,400 | $ | 99,600 | $ | 1,800 | ||||||
|
Non-public securities and private equity funds
|
2,200 | 29,700 | 35,000 | |||||||||
|
Non-agency mortgage-backed bond securitizations
|
14,800 | 14,100 | – | |||||||||
|
Totals
|
$ | 31,400 | $ | 143,400 | $ | 36,800 | ||||||
The Company’s assessment involves a high degree of judgment and accordingly, actual results may differ materially from the Company’s estimates and judgments.
Impairment of Equity Method Investments –
The Company evaluates equity method investments for impairment when operating losses or other factors may indicate a decrease in value which is other than temporary. For investments in investment partnerships that are accounted
for under the equity method, the Company obtains from the investment partnership financial statements, net asset values and other information on a quarterly basis and annual audited financial statements. On a quarterly basis, the Company also makes inquiries and discusses with investment managers whether there were significant procedural, valuation, composition and other changes at the investee. Since these investment partnerships record their underlying investments at fair value, after
application of the equity method the carrying value of the Company’s investment is equal to its share of the investees’ underlying net assets at their fair values. Absent any unusual circumstances or restrictions concerning these investments, which would be separately evaluated, it is unlikely that any additional impairment charge would be required.
For equity method investments in operating businesses, the Company considers a variety of factors including economic conditions nationally and in their geographic areas of operation, adverse changes in the industry in which they operate, declines in business prospects, deterioration in earnings, increasing costs of operations and other
relevant factors specific to the investee. Whenever the Company believes conditions or events indicate that one of these investments might be materially impaired, the Company will obtain from such investee updated cash flow projections and impairment analyses of the investee assets. The Company will use this information and, together with discussions with the investee’s management, evaluate if the book value of its investment exceeds its fair value, and if so and the situation is deemed
other than temporary, record an impairment charge.
The Company has a joint venture agreement with Garff Enterprises, Inc., pursuant to which the joint venture has acquired various automobile dealerships (“Garcadia”). During the second quarter of 2009, the Company’s equity in losses of Garcadia included impairment charges for goodwill and other intangible assets
aggregating $32,300,000. Garcadia’s automobile dealerships have been adversely impacted by general economic conditions, and the bankruptcy filings by two of the three largest U.S. automobile manufacturers was a change in circumstances that caused Garcadia to evaluate the recoverability of its goodwill and other intangible assets. Garcadia prepared discounted cash flow projections for each of its dealerships and concluded that the carrying amount of its goodwill and other intangible
assets was impaired. Garcadia’s cash flow projections assume that new car sales at their foreign car dealerships remain flat with 2009 sale levels through 2011 and project growth thereafter. Cash flow projections at dealerships that sell domestic cars are projected to continue to decline through 2012 or 2013 with projected growth thereafter. None of Garcadia’s automobile dealerships are currently expected to close as a result of the restructuring of the U.S. automobile
manufacturers. However, if new vehicle sales at Garcadia’s automobile dealerships are less than projected amounts or dealerships are closed, further impairment charges are likely.
For the year ended December 31, 2008, the Company’s equity in losses of IFIS Limited (“IFIS”) includes impairment charges of $63,300,000. IFIS is a private Argentine company that owns a variety of investments, and its largest investment is ownership of common shares of Cresud Sociedad Anonima Comercial, Inmobiliaria,
Financiera y Agropecuaria (“Cresud”), an agricultural company primarily based in Argentina. During 2008, as a result of significant declines in quoted market prices for Cresud and other investments of IFIS, combined with declines in worldwide food commodity prices, the global mortgage and real estate crisis and political and financial conditions in Argentina, the Company determined that its investment in IFIS was impaired. The fair value of the Company’s investment in IFIS
was primarily based upon the quoted market prices of IFIS’s investments.
F-13
Business Combinations -
At acquisition, the Company allocates the cost of a business acquisition to the specific tangible and intangible assets acquired and liabilities assumed based upon their fair values. Significant judgments and estimates are often made to determine
these values, and may include the use of appraisals, consider market quotes for similar transactions, employ discounted cash flow techniques or consider other information the Company believes to be relevant. The finalization of the purchase price allocation will typically take a number of months to complete, and if final values are materially different from initially recorded amounts adjustments are recorded. Any excess of the cost of a business acquisition over the fair values of the net
assets and liabilities acquired is recorded as goodwill, which is not amortized to expense. Recorded goodwill of a reporting unit is required to be tested for impairment on an annual basis, and between annual testing dates if events or circumstances change that would more likely than not reduce the fair value of a reporting unit below its net book value. At December 31, 2009, the book value of goodwill was $9,300,000. If the fair values of the net assets and liabilities acquired
are greater than the purchase price, the excess is treated as a bargain purchase and recognized in income.
Subsequent to the finalization of the purchase price allocation, any adjustments to the recorded values of acquired assets and liabilities would be reflected in the Company’s consolidated statement of operations. Once final, the Company is not permitted to revise the allocation of the original purchase price, even if
subsequent events or circumstances prove the Company’s original judgments and estimates to be incorrect. In addition, long-lived assets recorded in a business combination like property and equipment, amortizable intangibles and goodwill may be deemed to be impaired in the future resulting in the recognition of an impairment loss. The assumptions and judgments made by the Company when recording business combinations will have an impact on reported results of operations for many years
into the future.
Use of Fair Value Estimates -
Under GAAP, fair value is defined as the price that would be received to sell an asset or paid to transfer a liability in an orderly transaction between market participants at the measurement date. Further, a fair value hierarchy prioritizes
inputs to valuation techniques into three broad levels. The fair value hierarchy gives the highest priority to unadjusted quoted prices in active markets for identical assets or liabilities (Level 1), the next priority to inputs that don’t qualify as Level 1 inputs but are nonetheless observable, either directly or indirectly, for the particular asset or liability (Level 2), and the lowest priority to unobservable inputs (Level 3).
Over 90% of the Company’s investment portfolio is classified as available for sale securities, which are carried at estimated fair value in the Company’s consolidated balance sheet. The estimated fair values are principally based on publicly quoted market prices (Level 1 inputs), which can rise or fall in reaction
to a wide variety of factors or events, and as such are subject to market-related risks and uncertainties. The Company has a segregated portfolio of mortgage pass-through certificates issued by U.S. Government-Sponsored Enterprises (FHLMC or FNMA), which are carried on the balance sheet at their estimated fair value of $358,200,000 at December 31, 2009. Although the markets that these types of securities trade in are generally active, market prices are not always available for the identical
security. The fair value of these investments are based on observable market data including benchmark yields, reported trades, issuer spreads, benchmark securities, bids and offers. These estimates of fair value are considered to be Level 2 inputs, and the amounts realized from the disposition of these investments has not been materially different from their estimated fair values.
The fair values of the Company’s portfolio of non-agency mortgage-backed bond securitizations, which are primarily determined using an income valuation model to calculate the present value of expected future cash flows, are considered to be Level 3 inputs.
Contingencies
- The Company accrues for contingent losses when the contingent loss is probable and the amount of loss can be reasonably estimated. Estimates of the likelihood that a loss will be incurred and of contingent loss amounts normally require significant judgment
by management, can be highly subjective and are subject to material change with the passage of time as more information becomes available. Estimating the ultimate impact of litigation matters is inherently uncertain, in particular because the ultimate outcome will rest on events and decisions of others that may not be within the power of the Company to control. The Company does not believe that any of its current litigation will have a material adverse effect on its consolidated financial
position, results of operations or liquidity; however, if amounts paid at the resolution of litigation are in excess of recorded reserve amounts, the excess could be material to results of operations for that period. As of December 31, 2009, the Company’s accrual for contingent losses was not material.
F-14
(b)
Consolidation Policy
: The consolidated financial statements include the accounts of the Company, all variable interest entities of which the Company or a subsidiary is the primary beneficiary, and all majority-controlled
entities that are not variable interest entities. The Company considers special allocations of cash flows and preferences, if any, to determine amounts allocable to noncontrolling interests. All intercompany transactions and balances are eliminated in consolidation.
Associated companies include equity interests in other entities that are accounted for under the equity method of accounting. These include investments in corporations that the Company does not control but has the ability to exercise significant influence and investments in limited partnerships in which the Company’s
interest is more than minor.
(c)
Cash Equivalents
: The Company considers short-term investments, which have maturities of less than three months at the time of acquisition, to be cash equivalents. Cash and cash equivalents include short-term investments
of $26,200,000 and $42,100,000 at December 31, 2009 and 2008, respectively.
(d)
Investments
: At acquisition, marketable debt and equity securities are designated as either i) held to maturity, which are carried at amortized cost, ii) trading, which are carried at estimated fair value with unrealized
gains and losses reflected in results of operations, or iii) available for sale, which are carried at estimated fair value with unrealized gains and losses reflected as a separate component of equity, net of taxes. Equity securities that do not have readily determinable fair values are carried at cost. The cost of securities sold is based on average cost. Held to maturity investments are made with the intention of holding such securities to maturity, which the Company has the
ability to do.
(e)
Property, Equipment and Leasehold Improvements
: Property, equipment and leasehold improvements are stated at cost, net of accumulated depreciation and amortization. Depreciation and amortization are provided principally
on the straight-line method over the estimated useful lives of the assets or, if less, the term of the underlying lease.
(f)
Revenue Recognition
: Revenues are recognized when the following conditions are met: (1) collectibility is reasonably assured; (2) title to the product has passed or the service has been rendered and earned; (3) persuasive evidence of
an arrangement exists; and (4) there is a fixed or determinable price. Manufacturing revenues are recognized when title passes, which for Idaho Timber is generally upon the customer’s receipt of the goods and for Conwed Plastics upon shipment of goods. Revenues from sales of prepaid phone cards are deferred when the cards are initially sold and are recognized when the cards are used by the consumer and/or administrative fees are charged in accordance with the cards’ terms, resulting
in a reduction of the outstanding obligation to the customer. ResortQuest typically receives cash deposits on advance bookings of its vacation properties that are recorded as deferred revenue. Property management revenues are recognized ratably over the rental period based on ResortQuest’s proportionate share of the total rental price of the property. Real estate brokerage revenues are recorded when the transactions are complete. Gaming entertainment revenues
consist of casino gaming, hotel, food and beverage, and entertainment revenues. Casino gaming revenue is the aggregate of gaming wins and losses, reduced for the cash value of rewards earned by customers based on their level of play on slot machines. Hotel, food and beverage, and entertainment revenues are recognized as services are performed. Revenue from the sale of real estate is generally recognized when title passes; however, if the Company is obligated to make improvements
to the real estate subsequent to closing, a portion of revenues are deferred and recognized under the percentage of completion method of accounting. Drilling revenues from daywork contracts are recognized based on the days completed at the dayrate specified by the contracts.
(g)
Cost of Sales
: Manufacturing inventories are stated at the lower of cost or market, with cost principally determined under the first-in-first-out method. Manufacturing cost of sales principally includes product and manufacturing
costs, inbound and outbound shipping costs and handling costs. STi Prepaid’s cost of sales primarily consists of origination, transport and termination of telecommunications traffic, and connectivity costs paid to underlying service providers.
Direct operating expenses for property management and services include expenses relating to housekeeping, maintenance, reservations, marketing, and other costs associated with rental and management. Direct operating expenses also include the cost of sales and operating expenses related to food and beverage sales. Direct
operating expenses for gaming entertainment include expenses relating to casino gaming, hotel, food and beverage, and entertainment, which primarily consists of employees’ compensation and benefits, cost of sales related to food and beverage sales, marketing and advertising, gaming taxes, insurance, supplies, license fees and royalties.
F-15
(h)
Research and Development Costs
: Research and development costs are expensed as incurred.
(i)
Income Taxes
: The Company provides for income taxes using the liability method. The Company records interest and penalties, if any, with respect to uncertain tax positions as components of income tax expense.
(j)
Derivative Financial Instruments
: The Company reflects its derivative financial instruments in its balance sheet at fair value. The Company has utilized derivative financial instruments to manage the impact of
changes in interest rates on certain debt obligations, hedge net investments in foreign subsidiaries and manage foreign currency risk on certain available for sale securities. Although the Company believes that these derivative financial instruments are practical economic hedges of the Company’s risks, except for the hedge of the net investment in foreign subsidiaries, they do not meet the effectiveness criteria under GAAP, and therefore are not accounted for as hedges. At December
31, 2009, the Company’s derivative instruments, which are not designated as hedges, are interest rate swap contracts that are included in other non-current liabilities at aggregate fair value of $1,900,000. The total notional amount of these pay fixed/receive variable interest rate swaps was $35,500,000. Amounts recorded as income (charges) in investment and other income for changes in the fair values of derivatives were $2,200,000, $(6,400,000) and $(5,800,000) for the years ended
December 31, 2009, 2008 and 2007, respectively; net unrealized gains (losses) were $1,000,000 and $(100,000) at December 31, 2009 and 2008, respectively.
(k)
Translation of Foreign Currency
: Foreign currency denominated investments and financial statements are translated into U.S. dollars at current exchange rates, except that revenues and expenses are translated at average exchange
rates during each reporting period; resulting translation adjustments are reported as a component of shareholders’ equity. Net foreign exchange transaction gains (losses) were $(300,000) for 2009, $2,300,000 for 2008 and $4,100,000 for 2007. Net unrealized foreign exchange translation gains were $4,000,000, $400,000 and $7,000,000 at December 31, 2009, 2008 and 2007, respectively.
(l)
Share-Based Compensation
: The cost of all share-based payments to employees, including grants of employee stock options and warrants, is recognized in the financial statements based on their fair values. The
cost is recognized as an expense over the vesting period of the award. The fair value of each award is estimated at the date of grant using the Black-Scholes option pricing model.
(m)
Recently Issued Accounting Standards
: As of January 1, 2009, the Company adopted FASB guidance that significantly changes the accounting and reporting for minority interests, and requires retrospective application of its presentation
and disclosure requirements for all periods presented. Minority interests have been reclassified as noncontrolling interests and included as a component of net worth; previously minority interests were separately classified on the consolidated balance sheet and not included as a component of consolidated net worth.
In June 2009, the FASB issued guidance for the accounting for transfers of financial assets, which is effective for fiscal years beginning after November 15, 2009, that eliminates the concept of a qualifying special-purpose entity, establishes specific conditions that must be met for transfers of portions of financial assets to be eligible for sale accounting, clarifies and amends the derecognition criteria for a transfer to be accounted for as a sale, changes the amount of recognized gain/loss on a transfer accounted for as a sale under certain circumstances, and requires enhanced disclosures. The Company does not expect that the adoption of this guidance will have a material impact on its consolidated financial statements.
In June 2009, the FASB issued guidance effective for fiscal years beginning after November 15, 2009, that requires an enterprise to qualitatively determine whether the enterprise’s variable interest or interests give it a controlling financial interest in a variable interest entity (“VIE”), which would result in the
enterprise being the primary beneficiary of the VIE. This determination of the primary beneficiary is based upon the enterprise that has both the power to direct the activities of a VIE that most significantly impact the VIE’s economic performance, and has the obligation to absorb losses or the right to receive benefits of the VIE that could potentially be significant to the VIE. It also requires ongoing reassessment of whether an enterprise is the primary beneficiary of a VIE and
enhanced disclosures. The Company does not expect that the adoption of this guidance will have a material impact on its consolidated financial statements.
F-16
3.
Acquisitions
:
Keen
During 2006, the Company acquired a 30% limited liability company interest in Keen for aggregate consideration of $60,000,000, excluding expenses, and agreed to lend to Keen, on a senior secured basis, up to $126,000,000 to finance new rig equipment purchases and construction costs and to repay existing debt. During 2007, the
Company increased its equity interest to 50% for additional payments aggregating $45,000,000. In addition, the credit facility was amended to increase the borrowing capacity to $138,500,000, and the Company provided Keen with two additional secured credit facilities aggregating $60,000,000. When the Company increased its investment in Keen to 50%, the terms of the limited liability agreement were amended to provide that in the event of a dissolution, liquidation or termination of Keen, available
cash or assets would first be used to pay all of Keen’s debts (including loans made by the Company), then distributed to the Company as a liquidation preference until it had received a return of its equity investment ($105,000,000), before any payments were made to the other equity owner of Keen.
During 2009, the Company believes it became apparent to the other equity owner of Keen that Keen would not be able to make scheduled debt payments to the Company, and that the resulting payment default could result in a liquidation of Keen. In that event, the Company’s liquidation preference over equity distributions
would result in very little, if any, distributions to the other equity owner of Keen. On November 17, 2009, the Company purchased the other 50% equity interest that it did not own plus a secured note payable to the other equity owner of Keen for aggregate cash consideration of $15,000,000. The Company believes it was able to acquire the remaining 50% equity interest at this distressed price because of the expected payment default on Keen’s senior secured debt owed to the Company and
the Company’s $105,000,000 preferred equity distribution in the event Keen was liquidated.
When the Company acquired the controlling interest in Keen in November 2009 it became a consolidated subsidiary; prior to that time the investment in Keen was classified as an investment in an associated company. Under GAAP, upon consolidation the Company is required to record Keen’s assets and liabilities at fair value,
and is required to adjust the carrying value of the Company’s equity investment immediately prior to the acquisition to fair value. Due to the unique circumstances surrounding the Company’s 2009 acquisition described above, the fair value of the net assets acquired exceeded the amount paid by $49,300,000; the bargain purchase was recognized as a gain on the date of acquisition and included in investment and other income. However, the fair value of the Company’s equity interest
immediately prior to the acquisition was less than its carrying value ($85,900,000); accordingly the Company included a charge of $36,500,000 in income (losses) related to associated companies to write down the pre-acquisition carrying value of its investment in Keen to fair value.
The Company engaged an independent valuation and appraisal firm to assist in its determination of the fair value of Keen’s property and equipment, identifiable intangible assets, if any, and corresponding equity value. The methods used to determine the fair values included estimating Keen’s business enterprise value,
utilizing both discounted cash flow and market comparable based approaches. Property and equipment asset valuations included an analysis of depreciated replacement cost and current market prices. The Company considered several factors to determine the fair value of property and equipment, including local market conditions, recent market transactions, the size, age, condition, utility and character of the property, the estimated cost to acquire replacement property, an estimate of depreciation
from use and functional obsolescence and the remaining expected useful life of the assets. Excluding intercompany loans, Keen’s liabilities principally consisted of trade payables, which were recorded at face value.
F-17
The allocation of the cost of the acquisition to the assets acquired and liabilities assumed based upon their fair values is as follows (in thousands):
|
As of
November 17, 2009
|
||||
|
Assets:
|
||||
|
Current assets:
|
||||
|
Cash and cash equivalents
|
$ | 12,866 | ||
|
Trade, notes and other receivables
|
18,189 | |||
|
Prepaids and other current assets
|
2,810 | |||
|
Total current assets
|
33,865 | |||
|
Restricted cash
|
6,206 | |||
|
Property and equipment
|
221,245 | |||
|
Total assets
|
261,316 | |||
|
Liabilities:
|
||||
|
Current liabilities
|
13,140 | |||
|
Other non-current liabilities
|
11,083 | |||
|
Intercompany loans
|
135,849 | |||
|
Long-term debt
|
2,554 | |||
|
Total liabilities
|
162,626 | |||
|
Net assets acquired
|
$ | 98,690 | ||
For the period from acquisition to December 31, 2009, the Company’s consolidated statement of operations includes revenues and pre-tax income from Keen of $60,500,000 and $46,700,000, respectively, including a gain of $49,300,000 resulting from the bargain purchase. Acquisition related costs were expensed and were not material.
Unaudited pro forma operating results for the Company, assuming the acquisition of 100% of Keen had occurred as of the beginning of each year presented below are as follows (in thousands):
|
2009
|
2008
|
|||||||
|
Revenues and other income
|
$ | 1,163,400 | $ | 1,331,800 | ||||
|
Net income (loss)
|
$ | 550,700 | $ | (2,486,600 | ) | |||
Pro forma adjustments principally reflect the elimination of the Company’s equity income (loss) related to Keen, a decrease to depreciation and amortization expense related to the adjustment to fair value of property and equipment and, for 2009, the elimination of the gain resulting from the bargain purchase.
The unaudited pro forma data is not indicative of future results of operations or what would have resulted if the acquisition had actually occurred as of the beginning of the periods presented.
STi Prepaid
In March 2007, STi Prepaid purchased 75% of the assets of Telco Group, Inc. and its affiliates (collectively, “Telco”) for an aggregate purchase price of $121,800,000 in cash, including expenses. The remaining Telco assets were contributed to STi Prepaid by the former owner in exchange for a 25% interest in STi
Prepaid.
The acquisition cost was principally allocated to components of working capital and to deferred tax assets. In connection with the acquisition, the Company revised its projections of future taxable income and reassessed the required amount of its deferred tax valuation allowance, which was required under prior GAAP. As
a result of the reassessment, the Company concluded that it was more likely than not that it could realize additional deferred tax assets in the future; accordingly, a reduction to the deferred tax valuation allowance of $98,600,000 was recognized in the purchase price allocation (in addition to certain acquired deferred tax assets). Based upon its allocation of the purchase price, the Company recorded STi Prepaid intangible assets of $4,400,000.
F-18
ResortQuest
In June 2007, the Company completed the acquisition of ResortQuest for $11,900,000, including expenses and working capital adjustments finalized subsequent to the closing date.
Premier
During 2006, the Company indirectly acquired a controlling voting interest in Premier for an aggregate purchase price of $90,800,000, excluding expenses. The Company owns approximately 61% of the common units of Premier and all of Premier’s preferred units, which accrue an annual preferred return of 17%. The
Company also acquired Premier’s junior subordinated note due August 2012, and during 2007 provided Premier with a $180,000,000 senior secured credit facility to partially fund Premier’s bankruptcy plan of reorganization (discussed below). At acquisition, the Company consolidated Premier as a result of its controlling voting interest; during the pendency of bankruptcy proceedings Premier was deconsolidated and accounted for under the equity method of accounting.
Premier owns the Hard Rock Biloxi, which opened to the public on June 30, 2007. The Hard Rock Biloxi was scheduled to open to the public on August 31, 2005; however, two days prior to opening, Hurricane Katrina hit the Mississippi Gulf Coast and severely damaged the hotel and related structures and completely destroyed the casino. On
September 19, 2006, Premier and its subsidiary filed voluntary petitions for reorganization under the bankruptcy code, before the United States Bankruptcy Court for the Southern District of Mississippi, Southern Division. Premier filed its petitions in order to seek the court’s assistance in gaining access to Hurricane Katrina-related insurance proceeds (an aggregate of $161,200,000) which had been denied to Premier by its pre-petition secured bondholders.
Premier filed an amended disclosure statement and plan of reorganization on February 22, 2007 which provided for the payment in full of all of Premier's creditors, including payment of principal and accrued interest due to the holders of Premier's 10 3/4% senior secured notes at par (the “Premier Notes”). On July 30, 2007,
the court entered an order confirming the plan, subject to a modification which Premier filed on August 1, 2007; Premier emerged from bankruptcy and once again became a consolidated subsidiary of the Company on August 10, 2007. The plan was funded in part with the $180,000,000 senior secured credit facility provided by a subsidiary of the Company. The credit facility matures on February 1, 2012, bears interest at 10 3/4%, is prepayable at any time without penalty, and contains other covenants,
terms and conditions similar to those contained in the indenture governing the Premier Notes. Since the plan did not result in any change in ownership of the voting interests in Premier, the Company did not apply “fresh start” accounting and did not treat the reconsolidation of Premier as the acquisition of a business that, under GAAP, requires the measurement of assets and liabilities at fair value. Accordingly, the Company reconsolidated the assets and liabilities of Premier
upon its emergence from bankruptcy using its historical basis in Premier’s assets and liabilities.
See Note 19 for information concerning contingencies related to Premier.
4.
Investments in Associated Companies
:
|
A summary of investments in associated companies at December 31, 2009 and 2008 is as follows:
|
F-19
|
2009
|
2008
|
|||||||
|
(In thousands)
|
||||||||
|
Investments in associated companies accounted for
|
||||||||
|
under the equity method of accounting (a):
|
||||||||
|
Jefferies High Yield Holdings, LLC (“JHYH”)
|
$ | 318,047 | $ | 280,923 | ||||
|
Keen
|
– | 252,362 | ||||||
|
Cobre Las Cruces, S.A. (“CLC”)
|
211,645 | 165,227 | ||||||
|
Garcadia
|
35,359 | 72,135 | ||||||
|
HomeFed Corporation (“HomeFed”)
|
44,975 | 44,093 | ||||||
|
Pershing Square IV, L.P. (“Pershing Square”)
|
33,538 | 36,731 | ||||||
|
Brooklyn Renaissance Plaza
|
29,875 | 31,217 | ||||||
|
Berkadia Commercial Mortgage LLC (“Berkadia”)
|
240,030 | – | ||||||
|
Wintergreen Partners Fund, L.P. (“Wintergreen”)
|
– | 42,895 | ||||||
|
HFH ShortPLUS Fund L.P. (“Shortplus”)
|
– | 39,942 | ||||||
|
IFIS
|
– | 14,590 | ||||||
|
Other
|
58,733 | 93,402 | ||||||
|
Total accounted for under the equity method of accounting
|
972,202 | 1,073,517 | ||||||
|
Investments in associated companies carried at fair value (b):
|
||||||||
|
Jefferies Group, Inc. (“Jefferies”)
|
1,152,931 | 683,111 | ||||||
|
AmeriCredit Corp. (“ACF”)
|
639,752 | 249,946 | ||||||
|
Total accounted for at fair value
|
1,792,683 | 933,057 | ||||||
|
Total investments in associated companies
|
$ | 2,764,885 | $ | 2,006,574 | ||||
|
(a)
|
Investments accounted for under the equity method of accounting are initially recorded at their original cost and subsequently increased for the Company's share of the investees’ earnings, decreased for the Company's share of the investees’ losses, reduced for dividends received and impairment charges recorded, if any, and increased for any
additional investment of capital.
|
|
(b)
|
As more fully discussed below, during 2008 the Company elected to account for its investments in Jefferies and ACF at fair value commencing on the dates these investments became subject to the equity method of accounting.
|
In accordance with GAAP, the Company is allowed to choose, at specified election dates, to measure many financial instruments and certain other items at fair value (the “fair value option”) that would not otherwise be required to be measured at fair value. If the fair value option is elected for a particular financial
instrument or other item, the Company is required to report unrealized gains and losses on those items in earnings. The Company’s investments in ACF and Jefferies are the only eligible items for which the fair value option was elected, commencing on the date the investments became subject to the equity method of accounting. If these investments were accounted for under the equity method, the Company would have to record its share of their results of operations employing a quarterly
reporting lag because of the investees’ public reporting requirements. In addition, electing the fair value option eliminates some of the uncertainty involved with impairment considerations, since quoted market prices for these investments provides a readily determinable fair value at each balance sheet date. The Company’s investment in HomeFed is the only other investment in an associated company that is also a publicly traded company but for which the Company did not elect
the fair value option. HomeFed’s common stock is not listed on any stock exchange, and price information for the common stock is not regularly quoted on any automated quotation system. It is traded in the over-the-counter market with high and low bid prices published by the National Association of Securities Dealers OTC Bulletin Board Service; however, trading volume is minimal. For these reasons the Company did not elect the fair value option for HomeFed.
F-20
ACF
As of December 31, 2009, the Company had acquired approximately 25% of the outstanding common shares of ACF, a company listed on the New York Stock Exchange (“NYSE”) (Symbol: ACF), for aggregate cash consideration of $418,600,000 ($405,300,000 was invested as of December 31, 2008). ACF is an independent auto finance
company that is in the business of purchasing and servicing automobile sales finance contracts, historically to consumers who are typically unable to obtain financing from other sources. The Company has entered into a standstill agreement with ACF for the two year period ending March 3, 2010, pursuant to which the Company has agreed not to sell its shares if the buyer would own more than 4.9% of the outstanding shares, unless the buyer agreed to be bound by terms of the standstill agreement, to not
increase its ownership interest to more than 30% of the outstanding ACF common shares, and received the right to nominate two directors to the board of directors of ACF. The Company and ACF have entered into a registration rights agreement covering all of the ACF shares of common stock owned by the Company. Income (losses) related to associated companies includes unrealized gains (losses) resulting from changes in the fair value of ACF of $376,500,000 and $(155,300,000) for the years ended
December 31, 2009 and 2008, respectively.
Jefferies
In April 2008, the Company sold to Jefferies 10,000,000 of the Company’s common shares, and received 26,585,310 shares of common stock of Jefferies and $100,021,000 in cash. The Jefferies common shares were valued based on the closing price of the Jefferies common stock on April 18, 2008, the last trading date prior to
the acquisition ($398,248,000 in the aggregate). Including shares acquired in open market purchases during 2008, as of December 31, 2009 the Company owns an aggregate of 48,585,385 Jefferies common shares (approximately 29% of the Jefferies outstanding common shares) for a total investment of $794,400,000. Income (losses) related to associated companies includes unrealized gains (losses) resulting from changes in the fair value of Jefferies of $469,800,000 and $(111,200,000) for the years
ended December 31, 2009 and 2008, respectively. Jefferies, a company listed on the NYSE (Symbol: JEF), is a full-service global investment bank and institutional securities firm serving companies and their investors.
In connection with its investment in Jefferies, the Company entered into a standstill agreement, pursuant to which for the two year period ending April 21, 2010, the Company agreed, subject to certain provisions, to limit its investment in Jefferies to not more than 30% of the outstanding Jefferies common shares and to not sell its investment,
and received the right to nominate two directors to the board of directors of Jefferies. Jefferies also agreed to enter into a registration rights agreement covering all of the Jefferies shares of common stock owned by the Company.
Berkadia
In December 2009, Berkadia, a joint venture between Berkshire Hathaway Inc. (“Berkshire Hathaway”) and the Company, acquired the North American commercial mortgage origination and servicing business of Capmark Financial Group Inc. (“Capmark”). The Company and Berkshire Hathaway each have a 50% equity
interest in Berkadia, and each party contributed $217,200,000 of equity capital to fund the acquisition. In addition, a subsidiary of Berkshire Hathaway provided Berkadia with a five-year, $1 billion secured credit facility, which was used to purchase outstanding mortgage loans and servicer advances from Capmark. The credit facility may be used to fund mortgage loans and servicer advances, to purchase mortgage servicing rights and for working capital needs. The Company has guaranteed
Berkadia’s repayment of 50% of the credit facility when due ($580,500,000 was outstanding under the facility at December 31, 2009).
Berkadia acquired the commercial mortgage origination and servicing business from Capmark pursuant to an Asset Put Agreement (“APA”) entered into between Berkadia and certain Capmark entities in September 2009. Capmark paid Berkadia $40,000,000 for the right to require Berkadia to purchase the commercial mortgage
origination and mortgage servicing business pursuant to the terms of the APA. Capmark subsequently filed for bankruptcy protection under chapter 11 of title 11 of the United States Bankruptcy Code and exercised the put option. Although there were other parties interested in purchasing portions of the commercial mortgage origination and servicing business, Berkadia’s offer was the only offer for the entire business, which eliminated Capmark’s risk of disposing of the remaining
business. In addition, Berkadia’s offer included a provision to hire the Capmark employees operating the business, thereby saving Capmark material employment related expenses.
F-21
Berkadia applied the acquisition method to account for the purchase of the commercial mortgage origination and servicing business and recorded the assets and liabilities acquired at fair value, which were principally mortgage servicing rights, mortgage loans and servicer advances. The fair values of the net assets acquired
exceeded the amount paid, principally due to the amount received as a put premium and the reasons identified above. This excess is treated as a bargain purchase that is recognized as a gain on the date of acquisition and included in Berkadia’s results of operations. For the period ended December 31, 2009, the Company recorded income from Berkadia of $20,800,000 under the equity method of accounting, of which $24,400,000 represented the Company’s share of the bargain purchase.
IFIS
In March 2008, the Company increased its equity investment in the common shares of IFIS, a private company that primarily invests in operating businesses in Argentina, from approximately 3% to 26% for an additional cash investment of $83,900,000. IFIS owns a variety of investments, and its largest investment is approximately
32% of the outstanding common shares of Cresud. Cresud is a publicly traded Argentine agricultural company involved in a range of activities including crop production, cattle raising and milk production. When the Company acquired its additional interest in IFIS in 2008, it was classified as an investment in an associated company and accounted for under the equity method of accounting due to the size of the Company’s voting interest. In January 2009, IFIS raised a significant
amount of new equity in a rights offering in which the Company did not participate. As a result, the Company’s ownership interest in IFIS was reduced to 8% and the Company no longer applies the equity method of accounting for this investment. At December 31, 2009, the Company’s investment in IFIS was classified as a non-current investment.
During 2008, the Company also acquired a direct equity interest in Cresud for an aggregate cash investment of $54,300,000. At December 31, 2008, the Company owned 3,364,174 Cresud American Depository Shares or ADSs (each of which represents ten common shares), and warrants to purchase 11,213,914 Cresud common shares (or 1,121,391
Cresud ADSs) at an exercise price of $1.68 per share. The Company’s direct investment in Cresud was classified as a non-current available for sale investment and carried at fair value at December 31, 2008.
As a result of significant declines in quoted market prices for Cresud and other investments of IFIS, combined with declines in worldwide food commodity prices, the global mortgage and real estate crisis and political and financial conditions in Argentina, the Company determined that its investments in IFIS and Cresud ADSs and warrants
at December 31, 2008 were impaired. Accordingly, for the year ended December 31, 2008, the Company recorded an impairment charge of $63,300,000 relating to its investment in IFIS and $23,200,000 relating to the Company’s direct investment in Cresud ADSs and warrants. The Company sold all of the Cresud ADSs and warrants in 2009 and recognized a loss of $5,700,000.
CLC
CLC is a Spanish company that holds the exploration and mineral rights to the Las Cruces copper deposit in the Pyrite Belt of Spain. It was a consolidated subsidiary of the Company from its acquisition in September 1999 until August 2005, at which time the Company sold a 70% interest to Inmet Mining Corporation (“Inmet”),
a Canadian-based global mining company traded on the Toronto stock exchange (Symbol: IMN). Inmet acquired the interest in CLC in exchange for 5,600,000 newly issued Inmet common shares, representing approximately 9.98% of Inmet’s current outstanding common shares. For more information on the Inmet shares, see Note 6. The Company retains a 30% interest in CLC.
During 2009, CLC repaid all its indebtedness under its senior secured credit facilities, through funds received from an intercompany loan by Inmet. The Company has guaranteed 30% of this intercompany U.S. dollar denominated loan, which had a balance of $240,100,000 at December 31, 2009. The Company has also loaned
CLC €100,200,000 as of December 31, 2009 ($138,000,000 at exchange rates in effect on February 16, 2010). For the years ended December 31, 2009, 2008 and 2007, the Company recorded pre-tax income (losses) of $1,000,000, $(5,900,000) and $4,000,000, respectively, from this investment under the equity method of accounting.
F-22
HomeFed
During 2002, the Company sold one of its real estate subsidiaries, CDS Holding Corporation (“CDS”), to HomeFed for a purchase price of $25,000,000, consisting of $1,000,000 in cash and 2,474,226 shares of HomeFed’s common stock. At December 31, 2009, the Company owns approximately 31.4% of HomeFed’s
outstanding common stock. For the years ended December 31, 2009, 2008 and 2007, the Company recorded $900,000, $(3,100,000) and $1,500,000, respectively, of pre-tax income (losses) from this investment under the equity method of accounting. HomeFed is engaged, directly and through subsidiaries, in the investment in and development of residential real estate projects in California. HomeFed is a public company traded on the NASD OTC Bulletin Board (Symbol: HOFD).
As a result of a 1998 distribution to all of the Company’s shareholders, approximately 7.8% and 9.4% of HomeFed is owned by the Company’s Chairman and President, respectively. Both are also directors of HomeFed and the Company’s President serves as HomeFed’s Chairman.
JHYH
During 2007, the Company and Jefferies formed JHYH and each initially committed to invest $600,000,000. The Company invested $250,000,000 in cash plus its $100,000,000 investment in Jefferies Partners Opportunity Fund II, LLC during 2007; any request for additional capital contributions from the Company will now require the consent
of the Company’s designees to the Jefferies board. The Company does not anticipate making additional capital contributions in the near future. JHYH owns Jefferies High Yield Trading, LLC (“JHYT”), a registered broker-dealer that is engaged in the secondary sales and trading of high yield securities and special situation securities formerly conducted by Jefferies, including bank debt, post-reorganization equity, public and private equity, equity derivatives, credit default
swaps and other financial instruments. JHYT makes markets in high yield and distressed securities and provides research coverage on these types of securities. JHYT does not invest or make markets in sub-prime residential mortgage securities.
Jefferies and the Company each have the right to nominate two of a total of four directors to JHYH’s board, and each own 50% of the voting securities. The organizational documents also permit passive investors to invest up to $800,000,000. Jefferies also received additional JHYH securities entitling it to 20%
of the profits. The voting and non-voting interests are entitled to a pro rata share of the profits of JHYH, and are mandatorily redeemable in 2013, with an option to extend up to three additional one-year periods. Under GAAP, JHYH is considered a variable interest entity that is consolidated by Jefferies, since Jefferies is the primary beneficiary. The Company owns less than 50% of JHYH’s capital, including its indirect interest through its investment in Jefferies, and
will not absorb a majority of its expected losses or receive a majority of its expected residual returns.
For the years ended December 31, 2009, 2008 and 2007, the Company recorded pre-tax income (losses) from this investment of $37,200,000, $(69,100,000) and $4,300,000, respectively, under the equity method of accounting. During 2008, the Company received distributions of $4,300,000 from JHYH. The Company has not provided
any guarantees, nor is it contingently liable for any of JHYH’s liabilities, all of which are non-recourse to the Company. The Company’s maximum exposure to loss as a result of its investment in JHYH is limited to the book value of its investment ($318,000,000 at December 31, 2009) plus any additional capital it decides to invest.
Wintergreen
The Company had invested an aggregate of $50,000,000 in Wintergreen, a limited partnership that invests in domestic and foreign debt and equity securities. For the years ended December 31, 2009, 2008 and 2007, the Company recorded $1,100,000, $(32,600,000) and $14,000,000, respectively, of pre-tax income (losses) from this
investment under the equity method of accounting. During 2009, the Company redeemed its investment in Wintergreen and received distributions of $39,000,000.
F-23
Shortplus
In January 2007, the Company invested $25,000,000 in Shortplus, a limited partnership which principally invests through a master fund in a short-term based portfolio of asset-backed securities. For the years ended December 31, 2009, 2008 and 2007, the Company recorded pre-tax income (losses) of $(400,000), $10,500,000 and $54,500,000,
respectively, from this investment under the equity method of accounting. During 2008, the Company received distributions of $50,000,000 from Shortplus. During 2009, the Company redeemed its investment in Shortplus and received distributions of $39,300,000.
Pershing Square
In June 2007, the Company invested $200,000,000 to acquire a 10% limited partnership interest in Pershing Square, a newly-formed private investment partnership whose investment decisions are at the sole discretion of Pershing Square’s general partner. The stated objective of Pershing Square is to create significant capital
appreciation by investing in Target Corporation. For the years ended December 31, 2009, 2008 and 2007, the Company recorded $3,200,000, $77,700,000 and $85,500,000, respectively, of pre-tax losses from this investment under the equity method of accounting, principally resulting from declines in the market value of Target Corporation’s common stock.
The following table provides summarized data with respect to the Associated Companies accounted for on the equity method of accounting included in results of operations for the three years ended December 31, 2009. (Amounts are in thousands.)
|
2009
|
2008
|
|||||||||||
|
Assets
|
$ | 5,792,300 | $ | 5,076,600 | ||||||||
|
Liabilities
|
3,265,500 | 1,808,900 | ||||||||||
|
Net assets
|
$ | 2,526,800 | $ | 3,267,700 | ||||||||
|
The Company’s portion of the reported net assets
|
$ | 841,100 | $ | 894,200 | ||||||||
| 2009 | 2008 | 2007 | ||||||||||
|
Total revenues (including securities gains (losses))
|
$ | 690,200 | $ | (482,400 | ) | $ | 158,900 | |||||
|
Loss from continuing operations before extraordinary items
|
$ | (294,700 | ) | $ | (1,460,700 | ) | $ | (625,100 | ) | |||
|
Net loss
|
$ | (294,700 | ) | $ | (1,460,700 | ) | $ | (625,100 | ) | |||
|
The Company’s equity in net loss
|
$ | (40,500 | ) | $ | (275,800 | ) | $ | (31,200 | ) | |||
As discussed above, the Company elected the fair value option for two of its associated companies investments, ACF and Jefferies, rather than apply the equity method of accounting. The Company’s annual report on Form 10-K for 2009 includes separate financial statements for ACF and Jefferies for 2009 and 2008.
Except for its investments in Berkadia and CLC, the Company has not provided any guarantees, nor is it contingently liable for any of the liabilities reflected in the above tables. All such liabilities are non-recourse to the Company. The Company’s exposure to adverse events at the investee companies is limited
to the book value of its investment.
Included in consolidated retained earnings at December 31, 2009 is approximately $49,000,000 of undistributed earnings of the associated companies accounted for under the equity method of accounting.
5.
Discontinued Operations
:
ATX Communications, Inc. (“ATX”)
In September 2006, the Company sold ATX. Losses of $1,100,000 in 2008 relate to an indemnification obligation to the purchaser.
F-24
WilTel Communications Group, LLC (“WilTel”)
In December 2005, the Company sold WilTel to Level 3 Communications, Inc. Gain on disposal of discontinued operations for 2007 includes a pre-tax gain of $800,000 ($500,000 after tax) from the resolution of sale-related contingencies.
During 2007, WilTel’s former headquarters building, which was not included in the 2005 sale and was retained by the Company, was sold for net cash proceeds of $53,500,000 resulting in a small gain.
During 2009, the Company received 636,300 of its common shares in connection with the resolution of a lawsuit related to WilTel and recorded income from discontinued operations of $15,200,000 based on the market value of the common shares. These shares were originally issued in connection with the acquisition of WilTel in 2003,
and had been held in a fund for certain claims made against WilTel prior to the Company’s ownership. The resolution of the lawsuit found that the claimants were not entitled to the shares and they were returned to the Company.
Other
During 2009 and 2008, the Company received distributions totaling $11,300,000 and $44,900,000, respectively, from its subsidiary, Empire Insurance Company (“Empire”), which has been undergoing a voluntary liquidation since 2001. The Company had classified Empire as a discontinued operation in 2001 and fully wrote-off its
remaining book value based on its expected future cash flows at that time. Although Empire no longer writes any insurance business, its orderly liquidation over the years has resulted in reductions to its estimated claim reserves that enabled Empire to pay the distributions, with the approval of the New York Insurance Department. The distributions were recognized as income from discontinued operations; for income tax purposes, the payments are treated as non-taxable distributions paid by a subsidiary. Since
future distributions from Empire, if any, are subject to New York insurance law or the approval of the New York Insurance Department, income will only be recognized when received.
Gain on disposal of discontinued operations for 2007 includes a pre-tax gain of $4,000,000 ($2,800,000 after tax) related to the collection of additional amounts from the sale of the Company’s interest in an Argentine shoe manufacturer in 2005 that had not been previously recognized (collectibility was uncertain).
Results of discontinued operations for 2009, 2008 and 2007 were not material.
6.
Investments
:
A summary of investments classified as current assets at December 31, 2009 and 2008 is as follows (in thousands):
|
2009
|
2008
|
|||||||||||||||
|
Carrying Value
|
Carrying Value
|
|||||||||||||||
|
Amortized
|
and
Estimated
|
Amortized
|
and
Estimated
|
|||||||||||||
|
Cost
|
Fair Value
|
Cost
|
Fair Value
|
|||||||||||||
|
Investments available for sale
|
$ | 80,788 | $ | 80,805 | $ | 360,814 | $ | 362,628 | ||||||||
|
Other investments, including accrued interest income
|
4,034 | 3,902 | 3,966 | 3,836 | ||||||||||||
|
Total current investments
|
$ | 84,822 | $ | 84,707 | $ | 364,780 | $ | 366,464 | ||||||||
The amortized cost, gross unrealized gains and losses and estimated fair value of available for sale investments classified as current assets at December 31, 2009 and 2008 are as follows (in thousands):
F-25
|
Gross
|
Gross
|
Estimated
|
||||||||||||||
|
Amortized
|
Unrealized
|
Unrealized
|
Fair
|
|||||||||||||
|
Cost
|
Gains
|
Losses
|
Value
|
|||||||||||||
|
2009
|
||||||||||||||||
|
Bonds and notes:
|
||||||||||||||||
|
U.S. Government and agencies
|
$ | 80,404 | $ | 26 | $ | 11 | $ | 80,419 | ||||||||
|
All other corporates
|
384 | 2 | – | 386 | ||||||||||||
|
Total fixed maturities
|
$ | 80,788 | $ | 28 | $ | 11 | $ | 80,805 | ||||||||
|
2008
|
||||||||||||||||
|
Bonds and notes:
|
||||||||||||||||
|
U.S. Government and agencies
|
$ | 251,895 | $ | 925 | $ | – | $ | 252,820 | ||||||||
|
U.S. Government-Sponsored Enterprises
|
72,273 | 46 | – | 72,319 | ||||||||||||
|
All other corporates
|
36,646 | 1,263 | 420 | 37,489 | ||||||||||||
|
Total fixed maturities
|
$ | 360,814 | $ | 2,234 | $ | 420 | $ | 362,628 | ||||||||
A summary of non-current investments at December 31, 2009 and 2008 is as follows (in thousands):
|
2009
|
2008
|
|||||||||||||||
|
Carrying Value
|
Carrying Value
|
|||||||||||||||
|
Amortized
|
and Estimated
|
Amortized
|
and Estimated
|
|||||||||||||
|
Cost
|
Fair Value
|
Cost
|
Fair Value
|
|||||||||||||
|
Investments available for sale
|
$ | 780,048 | $ | 1,964,268 | $ | 723,222 | $ | 859,122 | ||||||||
|
Other investments
|
163,983 | 163,970 | 168,890 | 168,890 | ||||||||||||
|
Total non-current investments
|
$ | 944,031 | $ | 2,128,238 | $ | 892,112 | $ | 1,028,012 | ||||||||
Non-current investments include 5,600,000 common shares of Inmet, which have a cost of $78,000,000 and carrying values of $339,100,000 and $90,000,000 at December 31, 2009 and 2008, respectively. The Inmet shares have registration rights and may be sold without restriction in accordance with applicable securities laws.
In August 2006, pursuant to a subscription agreement with Fortescue Metals Group Ltd (“Fortescue”) and its subsidiary, FMG Chichester Pty Ltd (“FMG”), the Company invested an aggregate of $408,000,000, including expenses, in Fortescue’s Pilbara iron ore and infrastructure project in Western Australia. In
exchange for its cash investment, the Company received 264,000,000 common shares of Fortescue, and a $100,000,000 note of FMG that matures in August 2019. In July 2007, Fortescue sold new common shares in an underwritten public offering to raise additional capital for its mining project and to fund future growth. In connection with this offering, the Company exercised its pre-emptive rights to maintain its ownership position and acquired an additional 13,986,000 common shares of Fortescue
for $44,200,000. In April 2009, the Company’s interest was reduced to 9% upon the closing of a transaction in which Fortescue sold 260,000,000 new common shares to Hunan Valin Iron & Steel Company Ltd, a Chinese company. Non-current available for sale investments include 277,986,000 common shares of Fortescue, representing approximately 9% of the outstanding Fortescue common stock at December 31, 2009. Fortescue is a publicly traded company on the Australian Stock Exchange
(Symbol: FMG), and the shares acquired by the Company may be sold without restriction on the Australian Stock Exchange or in accordance with applicable securities laws. The Fortescue shares have a cost of $246,300,000 and market values of $1,108,000,000 and $377,000,000 at December 31, 2009 and 2008, respectively.
In February 2010, the Company sold 30,000,000 common shares of Fortescue for net cash proceeds of $121,500,000, which will result in the recognition of a net securities gain of $94,900,000 in the first quarter of 2010. After considering this sale the Company owns approximately 8% of Fortescue’s outstanding common shares.
F-26
Interest on the FMG note is calculated as 4% of the revenue, net of government royalties, invoiced from the iron ore produced from the project’s Cloud Break and Christmas Creek areas, which commenced production in May 2008. The note is unsecured and subordinate to the project’s senior secured debt. Interest
is payable semi-annually within 30 days of June 30
th
and December 31
st
of each year; however, cash interest payments on the note are currently being deferred by FMG due to covenants contained in the project’s senior secured debt. Any interest payment that is deferred earns simple interest at an annual rate of 9.5%; the aggregate accrued
interest receivable balance was $106,500,000 and $40,500,000 at December 31, 2009 and 2008, respectively. For accounting purposes, the Company allocated its initial Fortescue investment to the common shares acquired (based on the market value at acquisition), a 13 year zero-coupon note and a prepaid mining interest. The zero-coupon note was recorded at an estimated initial fair value of $21,600,000, representing the present value of the principal amount discounted at 12.5%. The
prepaid mining interest of $184,300,000 was initially classified with other non-current assets and is being amortized to expense as the 4% of revenue is earned. Depreciation and amortization expense for the years ended December 31, 2009 and 2008 includes prepaid mining interest amortization of $7,300,000 and $2,800,000, respectively; the prepaid mining interest balance was $174,300,000 and $181,600,000 at December 31, 2009 and 2008, respectively.
At December 31, 2009 and 2008, other non-current investments include investments in private equity funds where the Company’s voting interest isn’t large enough to apply the equity method of accounting ($52,800,000 and $52,100,000, respectively), a portfolio of non-agency mortgage-backed bond securitizations where the underlying
assets are various individual mortgage loans ($14,000,000 and $43,200,000, respectively), the zero coupon note payable by FMG discussed above ($32,200,000 and $28,700,000, respectively), a stock interest in Light and Power Holdings, Ltd., the electric utility in Barbados (“LPH”), ($18,800,000 in both periods), the investment in IFIS discussed above ($11,200,000 and $0, respectively) and various other non-publicly traded interests in equity and debt securities ($35,000,000 and $26,200,000, respectively). The
investments in bond securitizations are acquisitions of impaired loans, generally at a significant discount to face amounts. The Company estimates the future cash flows for the securitization interests to determine the accretable yield; increases in estimated cash flows are accounted for as a yield adjustment on a prospective basis but decreases in estimated cash flows below amortized cost are recognized as impairments. Contractual cash flows in excess of estimated cash flows are not part
of the accretable yield. The market for these securities is highly illiquid and they rarely trade. On a regular basis the Company re-estimates future cash flows and records impairment charges if appropriate. The remaining other investments are accounted for under the cost method of accounting, reduced for impairment charges when appropriate.
The amortized cost, gross unrealized gains and losses and estimated fair value of non-current investments classified as available for sale at December 31, 2009 and 2008 are as follows (in thousands):
F-27
|
Gross
|
Gross
|
Estimated
|
||||||||||||||
|
Amortized
|
Unrealized
|
Unrealized
|
Fair
|
|||||||||||||
|
Cost
|
Gains
|
Losses
|
Value
|
|||||||||||||
|
2009
|
||||||||||||||||
|
Bonds and notes:
|
||||||||||||||||
|
U.S. Government and agencies
|
$ | 25,858 | $ | – | $ | 67 | $ | 25,791 | ||||||||
|
U.S. Government-Sponsored Enterprises
|
352,251 | 6,391 | 422 | 358,220 | ||||||||||||
|
All other corporates
|
22,969 | 228 | 13 | 23,184 | ||||||||||||
|
Total fixed maturities
|
401,078 | 6,619 | 502 | 407,195 | ||||||||||||
|
Equity securities:
|
||||||||||||||||
|
Common stocks:
|
||||||||||||||||
|
Banks, trusts and insurance companies
|
16,340 | 14,925 | – | 31,265 | ||||||||||||
|
Industrial, miscellaneous and all other
|
362,630 | 1,163,255 | 77 | 1,525,808 | ||||||||||||
|
Total equity securities
|
378,970 | 1,178,180 | 77 | 1,557,073 | ||||||||||||
| $ | 780,048 | $ | 1,184,799 | $ | 579 | $ | 1,964,268 | |||||||||
|
2008
|
||||||||||||||||
|
Bonds and notes:
|
||||||||||||||||
|
U.S. Government and agencies
|
$ | 11,839 | $ | – | $ | 394 | $ | 11,445 | ||||||||
|
U.S. Government-Sponsored Enterprises
|
284,696 | 753 | 3,704 | 281,745 | ||||||||||||
|
All other corporates
|
4,648 | 87 | 234 | 4,501 | ||||||||||||
|
Total fixed maturities
|
301,183 | 840 | 4,332 | 297,691 | ||||||||||||
|
Equity securities:
|
||||||||||||||||
|
Common stocks:
|
||||||||||||||||
|
Banks, trusts and insurance companies
|
13,750 | 2,890 | – | 16,640 | ||||||||||||
|
Industrial, miscellaneous and all other
|
408,289 | 143,067 | 6,565 | 544,791 | ||||||||||||
|
Total equity securities
|
422,039 | 145,957 | 6,565 | 561,431 | ||||||||||||
| $ | 723,222 | $ | 146,797 | $ | 10,897 | $ | 859,122 | |||||||||
The amortized cost and estimated fair value of non-current investments classified as available for sale at December 31, 2009, by contractual maturity, are shown below. Expected maturities are likely to differ from contractual maturities because borrowers may have the right to call or prepay obligations with or without call
or prepayment penalties.
|
Estimated
|
||||||||
|
Amortized
|
Fair
|
|||||||
|
Cost
|
Value
|
|||||||
|
(In thousands)
|
||||||||
|
Due after one year through five years
|
$ | 38,880 | $ | 39,026 | ||||
|
Due after five years through ten years
|
– | – | ||||||
|
Due after ten years
|
– | – | ||||||
| 38,880 | 39,026 | |||||||
|
Mortgage-backed and asset-backed securities
|
362,198 | 368,169 | ||||||
| $ | 401,078 | $ | 407,195 | |||||
Net unrealized gains on investments were $1,034,200,000, $24,000,000 and $997,700,000 at December 31, 2009, 2008 and 2007, respectively. Reclassification adjustments included in comprehensive income (loss) for the three year period ended December 31, 2009 are as follows (in thousands):
F-28
|
2009
|
2008
|
2007
|
||||||||||
|
Net unrealized holding gains (losses) arising during the period, net of
|
||||||||||||
|
taxes of $36,348, $536,981 and $561,743
|
$ | 1,001,651 | $ | (938,930 | ) | $ | 981,411 | |||||
|
Less: reclassification adjustment for net (gains) losses included in net
|
||||||||||||
|
income (loss), net of taxes of $0, $19,872 and $12,328
|
8,511 | (34,746 | ) | (21,539 | ) | |||||||
|
Net change in unrealized gains (losses) on investments, net of taxes
|
||||||||||||
|
of $36,348, $556,853 and $549,415
|
$ | 1,010,162 | $ | (973,676 | ) | $ | 959,872 | |||||
The following table shows the Company’s investments’ gross unrealized losses and fair value, aggregated by investment category, all of which have been in a continuous unrealized loss position for less than 12 months, at December 31, 2009 (in thousands):
|
Unrealized
|
||||||||
|
Description of Securities
|
Fair Value
|
Losses
|
||||||
|
U.S. Government and agencies securities
|
$ | 37,304 | $ | 78 | ||||
|
Mortgage-backed and asset-backed securities
|
67,386 | 426 | ||||||
|
Corporate bonds
|
2,872 | 7 | ||||||
|
Marketable equity securities
|
1,656 | 77 | ||||||
|
Total temporarily impaired securities
|
$ | 109,218 | $ | 588 | ||||
The unrealized losses on the mortgage-backed and asset-backed securities (substantially all of which are issued by U.S. Government-Sponsored Enterprises) relate to 15 securities substantially all of which were purchased in 2009. The unrealized losses related to the U.S. government and agencies securities, corporate bonds and
marketable equity securities are not considered to be an other than temporary impairment. This determination is based on a number of factors including, but not limited to, the length of time and extent to which the fair value has been less than cost, the financial condition and near term prospects of the issuer, the reason for the decline in the fair value, changes in fair value subsequent to the balance sheet date, the ability and intent to hold investments to maturity or recovery, and other factors
specific to the individual investment.
At December 31, 2009, the Company’s investments which have been in a continuous unrealized loss position for 12 months or longer were not material.
Securities with book values of $8,800,000 and $8,100,000 at December 31, 2009 and 2008, respectively, collateralized certain swap agreements and a letter of credit.
7.
Trade, Notes and Other Receivables, Net
:
A summary of current trade, notes and other receivables, net at December 31, 2009 and 2008 is as follows (in thousands):
|
2009
|
2008
|
|||||||
|
Trade receivables
|
$ | 84,888 | $ | 79,462 | ||||
|
Accrued interest on FMG note
|
106,546 | 40,467 | ||||||
|
Receivables related to securities
|
3,515 | 4,512 | ||||||
|
Receivables related to associated companies
|
6,084 | 1,126 | ||||||
|
Receivables relating to real estate activities
|
2,550 | 1,000 | ||||||
|
Other
|
8,787 | 15,506 | ||||||
| 212,370 | 142,073 | |||||||
|
Allowance for doubtful accounts
|
(5,280 | ) | (3,710 | ) | ||||
|
Total current trade, notes and other receivables, net
|
$ | 207,090 | $ | 138,363 | ||||
F-29
8.
Inventory
:
A summary of inventory (which is included in the caption, prepaids and other current assets) at December 31, 2009 and 2008 is as follows (in thousands):
|
2009
|
2008
|
|||||||
|
Raw materials
|
$ | 5,396 | $ | 9,148 | ||||
|
Work in process
|
12,352 | 15,436 | ||||||
|
Finished goods
|
43,461 | 52,319 | ||||||
| $ | 61,209 | $ | 76,903 | |||||
9.
Intangible Assets, Net and Goodwill
:
A summary of these assets at December 31, 2009 and 2008 is as follows (in thousands):
|
2009
|
2008
|
|||||||
|
Intangibles:
|
||||||||
|
Customer relationships, net of accumulated amortization of $37,349
|
||||||||
|
and $27,473
|
$ | 45,732 | $ | 55,670 | ||||
|
Licenses, net of accumulated amortization of $1,730 and $991
|
10,318 | 10,947 | ||||||
|
Trademarks and tradename, net of accumulated amortization of
|
||||||||
|
$1,123 and $593
|
5,066 | 3,689 | ||||||
|
Patents, net of accumulated amortization of $769 and $611
|
1,591 | 1,749 | ||||||
|
Other, net of accumulated amortization of $2,711 and $2,344
|
3,000 | 3,477 | ||||||
|
Goodwill
|
9,316 | 9,316 | ||||||
| $ | 75,023 | $ | 84,848 | |||||
Trademarks and tradename increased by $1,900,000 during 2009 due to an acquisition by STi Prepaid; the asset is being amortized on a straight line basis over its estimated useful life of ten years. During 2009, Idaho Timber impaired certain long-lived assets, including $1,200,000 of customer relationships intangibles; for further
information, see Note 2.
|
The goodwill in the above table relates to Conwed Plastics ($8,100,000) and STi Prepaid ($1,200,000).
|
Amortization expense on intangible assets was $10,400,000, $9,300,000 and $8,600,000 for the years ended December 31, 2009, 2008 and 2007, respectively. The estimated aggregate future amortization expense for the intangible assets for each of the next five years is as follows: 2010 - $9,900,000; 2011 - $9,400,000;
2012 - $8,900,000; 2013 - $8,700,000; and 2014 - $8,200,000.
10.
Other Assets
:
A summary of non-current other assets at December 31, 2009 and 2008 is as follows (in thousands):
F-30
|
2009
|
2008
|
|||||||
|
Real Estate
|
$ | 228,769 | $ | 320,729 | ||||
|
Unamortized debt expense
|
20,631 | 26,915 | ||||||
|
Restricted cash
|
98,080 | 90,752 | ||||||
|
Prepaid mining interest
|
164,874 | 173,165 | ||||||
|
Other
|
7,848 | 8,229 | ||||||
| $ | 520,202 | $ | 619,790 | |||||
In October 2007, the Company entered into an agreement with the Panama City-Bay County Airport and Industrial District of Panama City, Florida to purchase approximately 708 acres of land which currently houses the Panama City-Bay County International Airport. At December 31, 2009 and 2008, restricted cash included $56,500,000 that
has been placed into escrow pursuant to this agreement; the transaction will close and title to the property will pass only after the city completes construction of a new airport and moves the airport operations to its new location within specified timeframes. In addition, restricted cash at December 31, 2009 and 2008 includes $14,900,000 of escrowed funds relating to the Premier noteholders’ claims; see Note 19 for further information.
|
The Company’s prepaid mining interest relates to its investment in Fortescue, which is more fully explained in Note 6.
|
11.
Property, Equipment and Leasehold Improvements, Net
:
A summary of property, equipment and leasehold improvements, net at December 31, 2009 and 2008 is as follows (in thousands):
|
Depreciable
|
||||||||||||
|
Lives
|
||||||||||||
|
(in years)
|
2009
|
2008
|
||||||||||
|
Land, buildings and leasehold improvements
|
3-45 | $ | 406,521 | $ | 403,186 | |||||||
|
Machinery and equipment
|
3-40 | 182,976 | 180,836 | |||||||||
|
Oil and gas drilling services machinery and equipment
|
7-15 | 210,621 | – | |||||||||
|
Network equipment
|
5-15 | 18,550 | 16,597 | |||||||||
|
Corporate aircraft
|
5-10 | 100,242 | 100,021 | |||||||||
|
Computer equipment and software
|
2-7 | 24,719 | 17,009 | |||||||||
|
Furniture and fixtures
|
2-10 | 23,425 | 25,383 | |||||||||
|
Construction in progress
|
N/A | 1,918 | 3,836 | |||||||||
|
Other
|
3-7 | 9,356 | 3,459 | |||||||||
| 978,328 | 750,327 | |||||||||||
|
Accumulated depreciation and amortization
|
(263,080 | ) | (215,687 | ) | ||||||||
| $ | 715,248 | $ | 534,640 | |||||||||
12.
Trade Payables and Expense Accruals
:
A summary of trade payables and expense accruals at December 31, 2009 and 2008 is as follows (in thousands):
F-31
|
2009
|
2008
|
|||||||
|
Trade payables
|
$ | 40,431 | $ | 35,104 | ||||
|
Due to telecommunication carriers and accrued carrier costs
|
27,313 | 32,270 | ||||||
|
Payables related to securities
|
1,185 | 3,885 | ||||||
|
Accrued compensation, severance and other employee benefits
|
41,561 | 44,752 | ||||||
|
Accrued legal and professional fees
|
6,918 | 9,484 | ||||||
|
Accrued clinical trial expenses
|
120 | 2,003 | ||||||
|
Taxes other than income
|
6,908 | 7,363 | ||||||
|
Accrued interest payable
|
40,179 | 41,779 | ||||||
|
Other
|
33,282 | 29,230 | ||||||
| $ | 197,897 | $ | 205,870 | |||||
13.
Indebtedness
:
The principal amount, stated interest rate and maturity date of outstanding debt at December 31, 2009 and 2008 are as follows (dollars in thousands):
|
2009
|
2008
|
|||||||
|
Parent Company Debt:
|
||||||||
|
Senior Notes:
|
||||||||
|
7 ¾% Senior Notes due 2013, less debt discount of $217 and $267
|
$ | 99,783 | $ | 99,733 | ||||
|
7% Senior Notes due 2013, net of debt premium of $494 and $673
|
339,939 | 375,673 | ||||||
|
7 1/8% Senior Notes due 2017
|
500,000 | 500,000 | ||||||
|
8 1/8% Senior Notes due 2015, less debt discount of $6,605 and $7,470
|
493,395 | 492,530 | ||||||
|
Subordinated Notes:
|
||||||||
|
3 ¾% Convertible Senior Subordinated Notes due 2014
|
97,581 | 221,110 | ||||||
|
8.65% Junior Subordinated Deferrable Interest Debentures due 2027
|
91,700 | 98,200 | ||||||
|
Subsidiary Debt:
|
||||||||
|
Repurchase agreements
|
198,582 | 151,088 | ||||||
|
Aircraft financing
|
34,994 | 37,108 | ||||||
|
Capital leases due 2010 through 2015 with a weighted average
|
||||||||
|
interest rate of 2.1%
|
3,231 | 927 | ||||||
|
Other due 2010 through 2011 with a weighted average interest
|
||||||||
|
rate of 2.1%
|
111,166 | 105,087 | ||||||
|
Total debt
|
1,970,371 | 2,081,456 | ||||||
|
Less: current maturities
|
(312,592 | ) | (248,713 | ) | ||||
|
Long-term debt
|
$ | 1,657,779 | $ | 1,832,743 | ||||
Parent Company Debt
:
In June 2009, the Company terminated its $100,000,000 bank credit facility; no amounts were outstanding under this bank credit facility.
The Board of Directors has authorized the Company, from time to time, to purchase its outstanding debt securities through cash purchases in open market transactions, privately negotiated transactions or otherwise. Such repurchases, if any, depend upon prevailing market conditions, the Company’s liquidity requirements and other
factors; such purchases may be commenced or suspended at any time without notice. During 2009, the Company repurchased $35,600,000 principal amount of its 7% Senior Notes due 2013 and $6,500,000 principal amount of its 8.65% Junior Subordinated Deferrable Interest Debentures due 2027 and recognized aggregate pre-tax gains of $6,700,000, which are reflected in investment and other income.
F-32
In April 2004, the Company sold $350,000,000 principal amount of its 3¾% Convertible Senior Subordinated Notes due 2014 in a private placement transaction. The notes are convertible into the Company’s common shares at $22.97 per share at any time before their maturity, subject to certain restrictions contained in
the notes, at a conversion rate of 43.5414 shares per each $1,000 principal amount of notes subject to adjustment (an aggregate of 15,239,490 shares). During 2009, the Company issued 5,378,606 common shares upon the conversion of $123,529,000 principal amount of the notes and during 2008, the Company issued 5,611,913 common shares upon the conversion of $128,887,000 principal amount of the notes, pursuant to privately negotiated transactions to induce conversion. The number of common shares
issued was in accordance with the terms of the notes; however, the Company paid the former noteholders $26,000,000 in 2009 and $12,200,000 in 2008 to induce conversion. The additional cash payments were recorded as selling, general and other expenses. Separately, another bondholder converted $3,000 principal amount of the convertible notes into common shares during 2008.
The Company’s senior note indentures contain covenants that restrict its ability to incur more Indebtedness or issue Preferred Stock of Subsidiaries unless, at the time of such incurrence or issuance, the Company meets a specified ratio of Consolidated Debt to Consolidated Tangible Net Worth, limit the ability of the Company and Material
Subsidiaries to incur, in certain circumstances, Liens, limit the ability of Material Subsidiaries to incur Funded Debt in certain circumstances, and contain other terms and restrictions all as defined in the senior note indentures. The Company has the ability to incur substantial additional indebtedness or make distributions to its shareholders and still remain in compliance with these restrictions. If the Company is unable to meet the specified ratio, the Company would not be able to issue
additional Indebtedness or Preferred Stock, but the Company’s inability to meet the applicable ratio would not result in a default under its senior note indentures. The senior note indentures do not restrict the payment of dividends.
Subsidiary Debt
:
Debt due within one year includes $198,600,000 and $151,100,000 as of December 31, 2009 and 2008, respectively, relating to repurchase agreements. At December 31, 2009, these fixed rate repurchase agreements have a weighted average interest rate of approximately 0.3%, mature in January 2010 and are collateralized by non-current
investments with a carrying value of $210,400,000.
During 2001, a subsidiary of the Company borrowed $53,100,000 collateralized by certain of its corporate aircraft. This debt bears interest based on a floating rate, requires monthly payments of principal and interest and matures in ten years. The interest rate at December 31, 2009 was 4.2%. The subsidiary
has entered into an interest rate swap agreement for this financing, which fixed the interest rate at approximately 5.7%. The subsidiary would have paid $1,900,000 and $3,300,000 at December 31, 2009 and 2008, respectively, if the swap were terminated. Changes in interest rates in the future will change the amounts to be received under the agreement, as well as interest to be paid under the related variable debt obligation. The Parent company has guaranteed this financing.
Other subsidiary debt at December 31, 2009 and 2008 principally includes Premier’s equipment financing ($10,200,000 and $14,700,000, respectively) and debt secured by MB1’s real estate development project ($100,500,000 and $90,200,000, respectively). Although MB1’s bank loan matured in October 2009, it was not
repaid since MB1 did not have sufficient funds and the Company is under no obligation and has no intention to provide the funds to pay off the loan. MB1 received a default notice for failure to repay the bank loan but its lenders have not commenced foreclosure proceedings. The loan has been classified as a current liability as of December 31, 2009 and 2008. MB1 had entered into an interest rate swap agreement, which fixed the interest rate at approximately 5.1%. MB1
would have paid $8,500,000 at December 31, 2008 if the swap were terminated; the fair value of the swap was added to the loan balance and the swap was terminated in 2009.
At December 31, 2009, $328,600,000 of other assets (primarily investments, real estate and property) are pledged for indebtedness aggregating $348,000,000.
Counterparties to interest rate and currency swap agreements are major financial institutions, that management believes are able to fulfill their obligations. Management believes any losses due to default by the counterparties are likely to be immaterial.
F-33
The aggregate annual mandatory redemptions of debt during the five year period ending December 31, 2014 are as follows: 2010 - $312,600,000; 2011 - $33,600,000; 2012 - $700,000; 2013 - $440,100,000; and 2014 - $98,100,000.
The weighted average interest rate on short-term borrowings (consisting of repurchase agreements) was 0.3% and 2.3% at December 31, 2009 and 2008, respectively.
14.
Common Shares, Stock Options and Preferred Shares
:
During 2009, the Company received 636,300 of its common shares in connection with the resolution of a lawsuit related to its former subsidiary, WilTel, and recorded income from discontinued operations of $15,200,000 based on the market value of the common shares. These shares were originally issued in connection with the acquisition
of WilTel in 2003, and had been held in a fund for certain claims made against WilTel prior to the Company’s ownership. The resolution of the lawsuit found that the claimants were not entitled to the shares and they were returned to the Company.
In April 2008, the Company sold to Jefferies 10,000,000 of the Company’s common shares, and received 26,585,310 shares of common stock of Jefferies and $100,021,000 in cash. In September 2007, the Company completed the issuance and sale of 5,500,000 of its common shares at a net price of $45.50 per share. Net
proceeds after payment of underwriting fees were $242,000,000.
The Board of Directors from time to time has authorized acquisitions of the Company’s common shares. During the three year period ended December 31, 2009, the Company acquired 7,171 common shares at an average price of $39.70 per common share, all in connection with stock option exercises. At December 31, 2009,
the Company is authorized to repurchase 11,992,829 common shares.
Salaries and incentive compensation expense included $10,900,000, $10,100,000 and $11,000,000 for the years ended December 31, 2009, 2008 and 2007, respectively, for share-based compensation expense relating to grants previously made under the Company’s senior executive warrant plan and fixed stock option plan. Net income
decreased by $10,900,000 and $7,900,000 for 2009 and 2007, respectively, and net loss increased by $10,100,000 for 2008 as a result of the share-based compensation expense. As of December 31, 2009, total unrecognized compensation cost related to nonvested share-based compensation plans was $8,700,000; this cost is expected to be recognized over a weighted-average period of 1.5 years.
As of December 31, 2009, the Company has two share-based plans: a fixed stock option plan and a senior executive warrant plan. The fixed stock option plan provides for grants of options or rights to non-employee directors and certain employees up to a maximum grant of 450,000 shares to any individual in a given taxable year. The
plan provides for the issuance of stock options and stock appreciation rights at not less than the fair market value of the underlying stock at the date of grant. Options granted to employees under this plan are intended to qualify as incentive stock options to the extent permitted under the Internal Revenue Code and become exercisable in five equal annual instalments starting one year from date of grant. Options granted to non-employee directors become exercisable in four equal annual instalments
starting one year from date of grant. No stock appreciation rights have been granted. As of December 31, 2009, 1,888,650 shares were available for grant under the plan.
The senior executive warrant plan provides for the issuance, subject to shareholder approval, of warrants to purchase up to 2,000,000 common shares to each of the Company’s Chairman and President at an exercise price equal to 105% of the closing price per share of a common share on the date of grant. On March 6, 2006,
the Company’s Board of Directors approved, subject to shareholder approval, the grant of warrants to purchase 2,000,000 common shares to each of the Company’s Chairman and President at an exercise price equal to $28.515 per share (105% of the closing price per share of a common share on that date). In May 2006, shareholder approval was received and the warrants were issued. The warrants expire in 2011 and vest in five equal tranches with 20% vesting on the date shareholder approval
was received and an additional 20% vesting in each subsequent year. At December 31, 2009, 4,000,000 warrants were outstanding and 3,200,000 were exercisable; since the exercise price exceeds the market price the warrants have no aggregate intrinsic value. Both the outstanding and exercisable warrants had a weighted-average remaining contractual term of 1.2 years. No warrants were exercised or forfeited during 2009.
F-34
A summary of activity with respect to the Company’s stock options for the three years ended December 31, 2009 is as follows:
|
Common
|
Weighted-
|
Weighted-Average
|
|||||||||||
|
Shares
|
Average
|
Remaining
|
Aggregate
|
||||||||||
|
Subject
|
Exercise
|
Contractual
|
Intrinsic
|
||||||||||
|
to Option
|
Prices
|
Term
|
Value
|
||||||||||
|
Balance at December 31, 2006
|
2,658,250 | $ | 21.90 | ||||||||||
|
Granted
|
12,000 | $ | 33.50 | ||||||||||
|
Exercised
|
(727,689 | ) | $ | 15.72 | $ | 18,400,000 | |||||||
|
Cancelled
|
(63,200 | ) | $ | 23.52 | |||||||||
|
Balance at December 31, 2007
|
1,879,361 | $ | 24.31 | ||||||||||
|
Granted
|
879,500 | $ | 28.23 | ||||||||||
|
Exercised
|
(314,571 | ) | $ | 20.04 | $ | 9,300,000 | |||||||
|
Cancelled
|
(144,000 | ) | $ | 25.94 | |||||||||
|
Balance at December 31, 2008
|
2,300,290 | $ | 26.29 | ||||||||||
|
Granted
|
12,000 | $ | 24.44 | ||||||||||
|
Exercised
|
(47,250 | ) | $ | 20.28 | $ | 200,000 | |||||||
|
Cancelled
|
(68,800 | ) | $ | 26.38 | |||||||||
|
Balance at December 31, 2009
|
2,196,240 | $ | 26.40 |
3.2 years
|
$ | 1,100,000 | |||||||
|
Exercisable at December 31, 2009
|
819,740 | $ | 25.30 |
2.5 years
|
$ | 700,000 | |||||||
The following summary presents the weighted-average assumptions used for grants made during each of the three years in the period ended December 31, 2009:
|
2009
|
2008
|
2007
|
||||||||||
|
Options
|
Options
|
Options
|
||||||||||
|
Risk free interest rate
|
1.99 | % | 2.34 | % | 4.57 | % | ||||||
|
Expected volatility
|
44.12 | % | 38.46 | % | 21.71 | % | ||||||
|
Expected dividend yield
|
.51 | % | .45 | % | .75 | % | ||||||
|
Expected life
|
4.3 years
|
4.0 years
|
4.3 years
|
|||||||||
|
Weighted-average fair value per grant
|
$ | 8.80 | $ | 8.94 | $ | 8.03 | ||||||
The expected life assumptions were based on historical behavior and incorporated post-vesting forfeitures for each type of award and population identified. The expected volatility was based on the historical behavior of the Company’s stock price.
At December 31, 2009 and 2008, 4,084,890 and 3,132,140, respectively, of the Company’s common shares were reserved for stock options, 4,248,841 and 9,627,447, respectively, of the Company’s common shares were reserved for the 3¾% Convertible Senior Subordinated Notes and 4,000,000 of the Company’s common shares
were reserved for warrants.
At December 31, 2009 and 2008, 6,000,000 of preferred shares (redeemable and non-redeemable), par value $1 per share, were authorized and not issued.
One of the Company’s subsidiaries maintains a stock option plan for its employees that provides for the granting of stock options that are exercisable into common shares of the subsidiary; however, amounts related to this plan have not been material. Salaries and incentive compensation expense include amounts for this plan
of $200,000, $1,100,000 and $200,000 for the years ended December 31, 2009, 2008 and 2007, respectively.
F-35
The subsidiary also granted stock appreciation rights to an executive officer that have a seven year term and become exercisable only upon the occurrence of certain events. The rights are payable in cash unless the subsidiary’s shares are publicly listed, in which case the subsidiary may elect to settle the rights in stock. Because
management has determined that the occurrence of the events required for the stock appreciation rights to become exercisable was not probable as of December 31, 2009, no expense or liability relating to the rights has been recorded. Stock appreciation rights were also granted to a former executive officer; amounts expensed related to these rights were $3,100,000, $1,000,000 and $100,000 for the years ended December 31, 2009, 2008 and 2007, respectively.
15.
Net Securities Gains (Losses)
:
The following summarizes net securities gains (losses) for each of the three years in the period ended December 31, 2009 (in thousands):
|
2009
|
2008
|
2007
|
||||||||||
|
Net realized gains on securities
|
$ | 10,440 | $ | 23,383 | $ | 109,356 | ||||||
|
Write-down of investments (a)
|
(31,420 | ) | (143,417 | ) | (36,834 | ) | ||||||
|
Net unrealized gains (losses) on trading securities
|
(126 | ) | (24,508 | ) | 23,119 | |||||||
| $ | (21,106 | ) | $ | (144,542 | ) | $ | 95,641 | |||||
|
(a)
|
Consists of provisions to write down investments resulting from declines in fair values believed to be other than temporary.
|
During 2007, the Company sold all of its common stock holdings in Eastman Chemical Company and recognized a net security gain of $37,800,000.
Proceeds from sales of investments classified as available for sale were $2,112,600,000, $4,485,200,000 and $5,286,100,000 during 2009, 2008 and 2007, respectively. Gross gains of $18,700,000, $22,400,000 and $99,000,000 and gross losses of $21,700,000, $44,000,000 and $5,500,000 were realized on these sales during 2009, 2008
and 2007, respectively.
16.
Other Results of Operations Information
:
Investment and other income for each of the three years in the period ended December 31, 2009 consists of the following (in thousands):
|
2009
|
2008
|
2007
|
||||||||||
|
Interest on short-term investments
|
$ | 461 | $ | 4,053 | $ | 18,121 | ||||||
|
Dividend income
|
3,945 | 8,180 | 13,290 | |||||||||
|
Interest on fixed maturity investments
|
26,784 | 41,555 | 64,787 | |||||||||
|
Other investment income
|
945 | 3,974 | 4,075 | |||||||||
|
Income related to Fortescue’s Pilbara project (see Note 6)
|
66,079 | 40,467 | – | |||||||||
|
Bargain purchase related to Keen (see Note 3)
|
49,345 | – | – | |||||||||
|
Gains on sale of real estate and other assets, net of costs
|
12,767 | 3,395 | 11,607 | |||||||||
|
Reimbursement for minority interest losses
|
– | 5,551 | – | |||||||||
|
Income related to settlement of insurance claims
|
5,272 | 11,546 | – | |||||||||
|
Income related to sale of associated companies
|
– | – | 11,441 | |||||||||
|
Gain from legal settlement
|
10,453 | – | – | |||||||||
|
Gain on buyback of debt
|
6,693 | – | – | |||||||||
|
Income on termination of joint development agreement
|
– | – | 8,490 | |||||||||
|
Rental income
|
14,149 | 8,617 | 5,723 | |||||||||
|
Winery revenues
|
20,735 | 22,102 | 20,091 | |||||||||
|
Other
|
40,248 | 39,611 | 23,840 | |||||||||
| $ | 257,876 | $ | 189,051 | $ | 181,465 | |||||||
F-36
For 2008, other income for the gaming entertainment segment includes a $7,300,000 gain from the settlement of an insurance claim and $5,600,000 resulting from capital contributions from the noncontrolling interest. In prior periods, the Company recorded 100% of the losses from this segment after cumulative loss allocations
to the noncontrolling interest (classified as minority interest prior to January 1, 2009) had reduced the noncontrolling interest liability to zero. Since the noncontrolling interest liability remained at zero after considering the capital contributions, the entire capital contribution was recorded as income, effectively reimbursing the Company for a portion of the noncontrolling interest losses that were not previously allocated to the noncontrolling interest. For 2008, manufacturing other
income includes a $4,200,000 gain from the settlement of an insurance claim relating to Idaho Timber.
Taxes, other than income or payroll, amounted to $22,400,000, $21,300,000 and $10,400,000 for the years ended December 31, 2009, 2008 and 2007, respectively.
Advertising costs amounted to $16,000,000, $25,000,000 and $9,700,000 for the years ended December 31, 2009, 2008 and 2007, respectively.
Research and development costs charged to expense were $3,500,000, $14,000,000 and $22,300,000 for the years ended December 31, 2009, 2008 and 2007, respectively.
17.
Income Taxes
:
The principal components of deferred taxes at December 31, 2009 and 2008 are as follows (in thousands):
|
2009
|
2008
|
|||||||
|
Deferred Tax Asset:
|
||||||||
|
Securities valuation reserves
|
$ | 92,091 | $ | 235,498 | ||||
|
Other assets
|
154,220 | 61,696 | ||||||
|
NOL carryover
|
2,165,839 | 2,090,031 | ||||||
|
Other liabilities
|
45,001 | 47,850 | ||||||
| 2,457,151 | 2,435,075 | |||||||
|
Valuation allowance
|
(1,835,161 | ) | (2,307,281 | ) | ||||
| 621,990 | 127,794 | |||||||
|
Deferred Tax Liability:
|
||||||||
|
Unrealized gains on investments
|
(613,622 | ) | (51,799 | ) | ||||
|
Depreciation
|
(9,178 | ) | (12,715 | ) | ||||
|
Other
|
(14,959 | ) | (23,045 | ) | ||||
| (637,759 | ) | (87,559 | ) | |||||
|
Net deferred tax asset (liability)
|
$ | (15,769 | ) | $ | 40,235 | |||
As of December 31, 2009, the Company had consolidated federal NOLs of $1,242,000,000, none of which expire prior to 2023, that may be used to offset the taxable income of any member of the Company’s consolidated tax group. In addition, the Company has $4,743,000,000 of federal NOLs that are only available to offset the
taxable income of certain subsidiaries. Except for $3,941,000 that expire in 2012, none of the other NOLs expire prior to 2017. The Company has capital loss carryforwards of $197,400,000, of which $60,600,000 expire in 2013 and the balance in 2014. The Company also has various state NOLs that expire at different times, which are reflected in the above table to the extent the Company estimates its future taxable income will be apportioned to those states. Uncertainties
that may affect the utilization of the Company’s tax attributes include future operating results, tax law changes, rulings by taxing authorities regarding whether certain transactions are taxable or deductible and expiration of carryforward periods.
As more fully discussed in Note 2, during 2008 the Company concluded that a valuation allowance was required against substantially all of the net deferred tax asset, and increased its valuation allowance by $1,672,100,000 with a corresponding charge to income tax expense. During 2007, the Company concluded that it was more likely
than not that it would have future taxable income sufficient to realize a portion of the Company’s net deferred tax asset; accordingly, $542,700,000 of the deferred tax valuation allowance was reversed as a credit to income tax expense.
Under certain circumstances, the ability to use the NOLs and future deductions could be substantially reduced if certain changes in ownership were to occur. In order to reduce this possibility, the Company’s certificate of incorporation includes a charter restriction that prohibits transfers of the Company’s common
stock under certain circumstances.
F-37
The provision (benefit) for income taxes for each of the three years in the period ended December 31, 2009 was as follows, excluding amounts allocated to income (losses) related to associated companies and discontinued operations (in thousands):
|
2009
|
2008
|
2007
|
||||||||||
|
State income taxes
|
$ | (1,855 | ) | $ | 3,266 | $ | 4,176 | |||||
|
Resolution of state tax contingencies
|
(2,025 | ) | (254 | ) | (1,475 | ) | ||||||
|
Federal income taxes:
|
||||||||||||
|
Current
|
- | (116 | ) | (1,958 | ) | |||||||
|
Deferred
|
- | (1,420 | ) | (17,925 | ) | |||||||
|
Increase (decrease) in valuation allowance
|
- | 1,672,138 | (542,686 | ) | ||||||||
|
Foreign income taxes
|
11,023 | 61 | 97 | |||||||||
| $ | 7,143 | $ | 1,673,675 | $ | (559,771 | ) | ||||||
As of December 31, 2009 and 2008, the Company has a full valuation allowance against its net federal deferred tax asset, including its available NOLs. As a result, the Company did not record any regular federal income tax expense for 2009. However, the Company has material unrealized security gains reflected in accumulated
other comprehensive income and in income related to associated companies. If these gains were realized, the Company would be able to use its NOLs to fully offset the federal income taxes that would be due, but the Company would have to pay federal minimum taxes. Although the payment of federal minimum taxes generates a minimum tax credit carryover, it would be fully reserved for in the net deferred tax asset valuation allowance. Accordingly, for the year ended December 31, 2009,
the Company recorded provisions for deferred federal minimum taxes payable of $22,700,000 and $11,600,000 in accumulated other comprehensive income and income related to associated companies, respectively.
The table below reconciles the expected statutory federal income tax to the actual income tax provision (benefit) (in thousands):
|
2009
|
2008
|
2007
|
||||||||||
|
Expected federal income tax
|
$ | (87,841 | ) | $ | (128,784 | ) | $ | (21,435 | ) | |||
|
State income taxes, net of federal income tax benefit
|
(1,855 | ) | 3,266 | 2,714 | ||||||||
|
Increase (decrease) in valuation allowance
|
- | 1,672,138 | (542,686 | ) | ||||||||
|
Tax benefit of current year losses fully reserved in valuation allowance
|
105,364 | 129,076 | - | |||||||||
|
Resolution of tax contingencies
|
(2,025 | ) | (1,669 | ) | (1,475 | ) | ||||||
|
Permanent differences
|
(17,523 | ) | (292 | ) | 824 | |||||||
|
Foreign taxes
|
11,023 | 61 | 97 | |||||||||
|
Other
|
- | (121 | ) | 2,190 | ||||||||
|
Actual income tax provision (benefit)
|
$ | 7,143 | $ | 1,673,675 | $ | (559,771 | ) | |||||
Reflected above as resolution of tax contingencies are reductions to the Company’s income tax provision for the expiration of the applicable statute of limitations and the favorable resolution of certain federal and state income tax contingencies.
Effective January 1, 2007, the Company adopted GAAP guidance, which prescribes the accounting for and disclosure of uncertainty in income tax positions. This guidance specifies a recognition threshold that must be met before any part of the benefit of a tax position can be recognized in the financial statements, specifies measurement
criteria and provides guidance for classification and disclosure. The Company was not required to record an adjustment to its financial statements upon this adoption.
The following table reconciles the total amount of unrecognized tax benefits as of the beginning and end of the periods presented (in thousands):
F-38
|
Unrecognized
|
||||||||||||
|
Tax Benefits
|
Interest
|
Total
|
||||||||||
|
As of January 1, 2007
|
$ | 10,500 | $ | 3,500 | $ | 14,000 | ||||||
|
Additions to unrecognized tax benefits
|
400 | 100 | 500 | |||||||||
|
Additional interest expense recognized
|
- | 800 | 800 | |||||||||
|
Audit payments
|
(300 | ) | (200 | ) | (500 | ) | ||||||
|
Reductions as a result of the lapse of the statute of
|
||||||||||||
|
limitations and completion of audits
|
(1,000 | ) | (500 | ) | (1,500 | ) | ||||||
|
Balance, December 31, 2007
|
9,600 | 3,700 | 13,300 | |||||||||
|
Additions to unrecognized tax benefits
|
1,200 | - | 1,200 | |||||||||
|
Additional interest expense recognized
|
- | 800 | 800 | |||||||||
|
Audit payments
|
- | - | - | |||||||||
|
Reductions as a result of the lapse of the statute of
|
||||||||||||
|
limitations and completion of audits
|
(2,900 | ) | (1,300 | ) | (4,200 | ) | ||||||
|
Balance, December 31, 2008
|
7,900 | 3,200 | 11,100 | |||||||||
|
Additions to unrecognized tax benefits
|
200 | - | 200 | |||||||||
|
Additional interest expense recognized
|
- | 600 | 600 | |||||||||
|
Audit payments
|
(200 | ) | (100 | ) | (300 | ) | ||||||
|
Reductions as a result of the lapse of the statute of
|
||||||||||||
|
limitations and completion of audits
|
(1,200 | ) | (800 | ) | (2,000 | ) | ||||||
|
Balance, December 31, 2009
|
$ | 6,700 | $ | 2,900 | $ | 9,600 | ||||||
If recognized, the total amount of unrecognized tax benefits reflected in the table above would lower the Company’s effective income tax rate. Over the next twelve months, the Company believes it is reasonably possible that the aggregate amount of unrecognized tax benefits related to uncertain tax positions will decrease
by approximately $900,000 upon the resolution of certain assessments. The statute of limitations with respect to the Company’s federal income tax returns has expired for all years through 2005. The Company’s New York State and New York City income tax returns are currently being audited for the 2003 to 2005 period.
Prior to May 2001, WilTel was included in the consolidated federal income tax return of its former parent, The Williams Companies Inc. (“Williams”). Pursuant to a tax settlement agreement between WilTel and Williams, the Company has no liability for any audit adjustments made to Williams’ consolidated tax returns;
however, adjustments to Williams’ prior years tax returns could affect certain of the Company’s tax attributes that impact the calculation of alternative minimum taxable income.
18.
Pension Plans and Postretirement Benefits
:
The information presented below for defined benefit pension plans is presented separately for the Company’s plan and the plan formerly administered by WilTel. Pursuant to the WilTel sale agreement the responsibility for WilTel’s defined benefit pension plan was retained by the Company. The Company presents
the information separately since the WilTel plan’s investment strategies, assumptions and results are significantly different than those of the Company.
The Company
:
Prior to 1999, the Company maintained defined benefit pension plans covering employees of certain units who also met age and service requirements. Effective December 31, 1998, the Company froze its defined benefit pension plan. The Company is in the process of seeking approval from various government entities to terminate
this frozen defined benefit pension plan; the Company anticipates it will terminate this plan in the fourth quarter of 2010. A summary of activity with respect to the Company’s defined benefit pension plan for 2009 and 2008 is as follows (in thousands):
F-39
|
2009
|
2008
|
|||||||
|
Projected Benefit Obligation:
|
||||||||
|
Projected benefit obligation at January 1,
|
$ | 50,628 | $ | 51,759 | ||||
|
Interest cost (a)
|
2,491 | 2,555 | ||||||
|
Actuarial (gain) loss
|
3,262 | (53 | ) | |||||
|
Benefits paid
|
(5,224 | ) | (3,633 | ) | ||||
|
Projected benefit obligation at December 31,
|
$ | 51,157 | $ | 50,628 | ||||
|
Change in Plan Assets:
|
||||||||
|
Fair value of plan assets at January 1,
|
$ | 48,005 | $ | 47,203 | ||||
|
Actual return on plan assets
|
(690 | ) | 4,706 | |||||
|
Employer contributions
|
- | - | ||||||
|
Benefits paid
|
(5,224 | ) | (3,633 | ) | ||||
|
Administrative expenses
|
(123 | ) | (271 | ) | ||||
|
Fair value of plan assets at December 31,
|
$ | 41,968 | $ | 48,005 | ||||
|
Funded Status at end of year
|
$ | (9,189 | ) | $ | (2,623 | ) | ||
(a) Includes charges to expense of $700,000 for each of 2009 and 2008, relating to discontinued operations obligations.
As of December 31, 2009 and 2008, $17,100,000 and $11,300,000, respectively, of the net amount recognized in the consolidated balance sheet was reflected as a charge to accumulated other comprehensive income (loss) and $9,200,000 and $2,600,000, respectively, was reflected as accrued pension cost. If the plan is terminated
during 2010, the Company expects it will have to contribute an additional $10,500,000 to the plan.
Pension expense related to the defined benefit pension plan charged to operations included the following components (in thousands):
|
2009
|
2008
|
2007
|
||||||||||
|
Interest cost
|
$ | 1,782 | $ | 1,836 | $ | 1,838 | ||||||
|
Expected return on plan assets
|
(1,517 | ) | (1,470 | ) | (1,238 | ) | ||||||
|
Actuarial loss
|
366 | 563 | 813 | |||||||||
|
Amortization of prior service cost
|
3 | 3 | 3 | |||||||||
|
Net pension expense
|
$ | 634 | $ | 932 | $ | 1,416 | ||||||
At December 31, 2009, the plan’s assets at fair value consisted of the following (in thousands):
|
Fair Value Measurements Using
|
||||||||||||
|
Total
Fair Value
Measurements
|
Quoted Prices in Active
Markets for Identical
Assets or Liabilities
(Level 1)
|
Significant Other
Observable Inputs
(Level 2)
|
||||||||||
|
Cash and cash equivalents
|
$ | 475 | $ | 475 | $ | – | ||||||
|
Bonds and notes:
|
||||||||||||
|
U.S. Government and agencies
|
7,811 | 7,727 | 84 | |||||||||
|
U.S. Government-Sponsored Enterprises
|
15,686 | – | 15,686 | |||||||||
|
All other corporates
|
17,693 | – | 17,693 | |||||||||
|
Other
|
303 | 303 | – | |||||||||
|
Total
|
$ | 41,968 | $ | 8,505 | $ | 33,463 | ||||||
F-40
The estimated fair values for securities measured using Level 1 inputs are determined using publicly quoted market prices in active markets. Certain of the corporate bonds are measured using Level 2 inputs. Although these bonds trade in brokered markets, the market for certain bonds is sometimes inactive. The fair
values of these investments are based on reported trading prices, bid and ask prices and quotes obtained from independent market makers in the securities. At December 31, 2009, the plan did not have any fair value measurements using unobservable inputs (Level 3).
At December 31, 2008, the plan’s assets consisted of U.S. Government and agencies bonds (19%), U.S. Government-Sponsored Enterprises (49%), investment grade bonds (30%) and cash equivalents (2%).
The defined benefit pension plan assets are invested in investment grade fixed income investments with an average duration that matches the pension liability. This investment strategy provides the Company with more flexibility in managing the plan should interest rates change.
To develop the assumption for the expected long-term rate of return on plan assets, the Company considered the following underlying assumptions: 2.5% current expected inflation, 2.0% real rate of return for risk-free investments (primarily U.S. government and agency bonds) for the target duration, 0.25% inflation risk premium and 0.45% default risk premium for the portion of the portfolio invested in non-U.S. government and agency bonds. The combination of these underlying assumptions resulted in the selection of the 5.2% expected long-term rate of return assumption for 2009. Because pension expense includes the cost of expected plan administrative expenses, the 5.2% assumption is not reduced for such expenses.
Several subsidiaries provide certain health care and other benefits to certain retired employees under plans which are currently unfunded. The Company pays the cost of postretirement benefits as they are incurred. Amounts charged to expense were not material in each of the three years ended December 31, 2009.
A summary of activity with respect to the Company’s postretirement plans for 2009 and 2008 is as follows (in thousands):
|
2009
|
2008
|
|||||||
|
Accumulated postretirement benefit obligation at January 1,
|
$ | 3,937 | $ | 4,083 | ||||
|
Interest cost
|
153 | 239 | ||||||
|
Plan amendments
|
(2,345 | ) | – | |||||
|
Contributions by plan participants
|
164 | 120 | ||||||
|
Actuarial (gain) loss
|
(80 | ) | 14 | |||||
|
Benefits paid
|
(521 | ) | (519 | ) | ||||
|
Accumulated postretirement benefit obligation at December 31,
|
$ | 1,308 | $ | 3,937 | ||||
The Company expects to spend $300,000 on postretirement benefits during 2010. At December 31, 2009, the assumed health care cost trend rate for 2010 used in measuring the accumulated postretirement benefit obligation is 8.25% and, at December 31, 2008, such rate for 2009 was 9.0%. At December 31, 2009 and 2008, the
assumed health care cost trend rates were assumed to decline to an ultimate rate of 4.5% by 2027 and 5% by 2018, respectively. If the health care cost trend rates were increased or decreased by 1%, the change in the accumulated postretirement obligation as of December 31, 2009 and change in interest cost for 2009 would not be material.
At December 31, 2009 and 2008, the amounts in accumulated other comprehensive income (loss) relating to the Company’s defined benefit pension plan and other benefits plans that have not yet been recognized in net periodic benefit cost are as follows (in thousands):
F-41
|
2009
|
2008
|
|||||||||||||||
|
Other
|
Other
|
|||||||||||||||
|
Pension Plan
|
Benefits Plans
|
Pension Plan
|
Benefits Plans
|
|||||||||||||
|
Net loss (gain)
|
$ | 17,037 | $ | (848 | ) | $ | 11,278 | $ | (862 | ) | ||||||
|
Prior service cost (credit)
|
38 | (2,357 | ) | 40 | (205 | ) | ||||||||||
| $ | 17,075 | $ | (3,205 | ) | $ | 11,318 | $ | (1,067 | ) | |||||||
Changes in the Company’s plan assets and benefit obligations recognized in other comprehensive income (loss) for the years ended December 31, 2009 and 2008 are as follows (in thousands):
|
2009
|
2008
|
|||||||||||||||
|
Other
|
Other
|
|||||||||||||||
|
Pension Plan
|
Benefits Plans
|
Pension Plan
|
Benefits Plans
|
|||||||||||||
|
Net gain (loss) arising during
|
||||||||||||||||
|
period
|
$ | (6,271 | ) | $ | 80 | $ | 2,364 | $ | (13 | ) | ||||||
|
Prior service credit arising
during the period
|
– | 2,345 | – | – | ||||||||||||
|
Recognition of amortization in
net periodic benefit cost:
|
||||||||||||||||
|
Prior service cost (credit)
|
3 | (193 | ) | 3 | (59 | ) | ||||||||||
|
Actuarial loss (gain)
|
511 | (94 | ) | 783 | (71 | ) | ||||||||||
|
Total
|
$ | (5,757 | ) | $ | 2,138 | $ | 3,150 | $ | (143 | ) | ||||||
The estimated net loss for the defined benefit pension plan that will be amortized from accumulated other comprehensive income (loss) into net periodic benefit cost in 2010 is $500,000; such amount for the prior service cost is not material. The estimated net gain and prior service credit for the other benefits plans that will
be amortized from accumulated other comprehensive income (loss) into net periodic benefit cost in 2010 are $100,000 and $300,000, respectively.
The Company uses a December 31 measurement date for its plans. The assumptions used relating to the defined benefit plan and postretirement plans are as follows:
|
Pension Benefits
|
Other Benefits
|
|||||||||||||||
|
2009
|
2008
|
2009
|
2008
|
|||||||||||||
|
Discount rate used to determine benefit
|
||||||||||||||||
|
obligation at December 31,
|
4.35 | % | 5.25 | % | 4.70 | % | 6.30 | % | ||||||||
|
Weighted-average assumptions used to determine
|
||||||||||||||||
|
net cost for years ended December 31,:
|
||||||||||||||||
|
Discount rate
|
5.25 | % | 5.20 | % | 6.30 | % | 6.10 | % | ||||||||
|
Expected long-term return on plan assets
|
5.20 | % | 5.10 | % | N/A | N/A | ||||||||||
The discount rate for pension benefits was selected to result in an estimated projected benefit obligation on a plan termination basis, using current rates for annuity settlements and lump sum payments weighted for the assumed elections of participants. The discount rate for other benefits was based on the expected future benefit
payments in conjunction with the Citigroup Pension Discount Curve.
The following benefit payments are expected to be paid (in thousands):
F-42
|
Pension Benefits
|
Other Benefits
|
|||||||
|
2010
|
$ | 51,157 | $ | 320 | ||||
|
2011
|
– | 304 | ||||||
|
2012
|
– | 100 | ||||||
|
2013
|
– | 94 | ||||||
|
2014
|
– | 88 | ||||||
|
2015 – 2019
|
– | 357 | ||||||
WilTel:
Effective on the date of sale, the Company froze WilTel’s defined benefit pension plans. A summary of activity with respect to the plans for 2009 and 2008 is as follows (in thousands):
|
2009
|
2008
|
|||||||
|
Projected Benefit Obligation:
|
||||||||
|
Projected benefit obligation at beginning of period
|
$ | 172,613 | $ | 168,541 | ||||
|
Interest cost
|
10,651 | 10,492 | ||||||
|
Actuarial loss
|
7,570 | 2,301 | ||||||
|
Settlement payment
|
– | (4,250 | ) | |||||
|
Benefits paid
|
(6,145 | ) | (4,471 | ) | ||||
|
Projected benefit obligation at December 31,
|
$ | 184,689 | $ | 172,613 | ||||
|
Change in Plan Assets:
|
||||||||
|
Fair value of plan assets at beginning of period
|
$ | 112,987 | $ | 150,738 | ||||
|
Actual return on plan assets
|
16,345 | (31,584 | ) | |||||
|
Employer contributions
|
4,000 | 4,365 | ||||||
|
Settlement payment
|
– | (4,250 | ) | |||||
|
Benefits paid
|
(6,145 | ) | (4,471 | ) | ||||
|
Administrative expenses
|
(1,503 | ) | (1,811 | ) | ||||
|
Fair value of plan assets at December 31,
|
$ | 125,684 | $ | 112,987 | ||||
|
Funded Status at end of year
|
$ | (59,005 | ) | $ | (59,626 | ) | ||
As of December 31, 2009 and 2008, $46,900,000 and $49,900,000, respectively, of the net amount recognized in the consolidated balance sheet was reflected as a charge to accumulated other comprehensive income (loss) and $59,000,000 and $59,600,000, respectively, was reflected as accrued pension cost.
The Company funded and distributed the benefits of WilTel’s supplemental employee retirement plan in 2008 and recognized a settlement loss of $1,900,000.
Employer contributions expected to be paid to the WilTel plan in 2010 are $6,000,000.
Pension expense for the WilTel plans charged to results of continuing operations included the following components (in thousands):
|
2009
|
2008
|
2007
|
||||||||||
|
Interest cost
|
$ | 10,651 | $ | 10,492 | $ | 10,163 | ||||||
|
Expected return on plan assets
|
(6,162 | ) | (9,177 | ) | (9,363 | ) | ||||||
|
Actuarial loss
|
1,924 | 110 | 1,136 | |||||||||
|
Net pension expense
|
$ | 6,413 | $ | 1,425 | $ | 1,936 | ||||||
F-43
At December 31, 2009, the plan’s assets at fair value consisted of the following (in thousands):
|
Fair Value Measurements Using
|
||||||||||||
|
Total
Fair Value
Measurements
|
Quoted Prices in Active
Markets for Identical
Assets or Liabilities
(Level 1)
|
Significant Other
Observable Inputs
(Level 2)
|
||||||||||
|
Cash and cash equivalents
|
$ | 3,413 | $ | 3,413 | $ | – | ||||||
|
Bonds and notes:
|
||||||||||||
|
U.S. Government and agencies
|
11,718 | 11,718 | – | |||||||||
|
U.S. Government-Sponsored Enterprises
|
2,997 | 2,997 | – | |||||||||
|
States, municipalities and political subdivisions
|
141 | 141 | – | |||||||||
|
All other corporates
|
57,350 | 57,166 | 184 | |||||||||
|
Equity securities:
|
||||||||||||
|
Common stocks:
|
||||||||||||
|
Banks, trusts and insurance companies
|
7,958 | 7,958 | – | |||||||||
|
Industrial, miscellaneous and all other
|
42,107 | 42,107 | – | |||||||||
|
Total
|
$ | 125,684 | $ | 125,500 | $ | 184 | ||||||
The estimated fair values for securities measured using Level 1 inputs are determined using publicly quoted market prices in active markets. One of the corporate bonds is measured using Level 2 inputs. Although this bond trades in brokered markets, the market is sometimes inactive; the fair value is based on reported trading
prices. At December 31, 2009, the plan did not have any fair value measurements using unobservable inputs (Level 3).
At December 31, 2008, the plans’ assets consisted of equity securities (43%), debt securities (51%) and cash equivalents (6%).
Historically, the investment objectives of the plans have emphasized long-term capital appreciation as a primary source of return and current income as a supplementary source. The target allocations and investment objectives of the plan are as follows:
|
Target
|
||||
|
Equity securities:
|
||||
|
Large cap stocks
|
25 | % | ||
|
Small cap stocks
|
4 | % | ||
|
International stocks
|
11 | % | ||
|
Total equity securities
|
40 | % | ||
|
Fixed income/bonds
|
60 | % | ||
|
Total
|
100 | % | ||
Investment performance objectives are based upon a benchmark index or mix of indices over a market cycle. The investment strategy designates certain investment restrictions for domestic equities, international equities and fixed income securities. These restrictions include the following:
|
·
|
For domestic equities, there will generally be no more than 5% of any manager’s portfolio at market in any one company and no more than 150% of any one sector of the appropriate index for any manager’s portfolio. Restrictions are also designated on outstanding market value of any one company at 5% for large to medium equities and
8% for small to medium equities.
|
|
·
|
For international equities, there will be no more than 8% in any one company in a manager’s portfolio, no fewer than three countries in a manager’s portfolio, no more than 10% of the portfolio in countries not represented in the EAFE index, no more than 150% of any one sector of the appropriate index and no currency hedging is permitted.
|
|
·
|
Fixed income securities will all be rated BBB- or better at the time of purchase, there will be no more than 8% at market in any one security (U.S. government and agency positions excluded), no more than a 30-year maturity in any one security and investments in standard collateralized mortgage obligations
are limited to securities that are currently paying interest, receiving principal, do not contain leverage and are limited to 10% of the market value of the portfolio.
|
F-44
To develop the assumption for the expected long-term rate of return on plan assets, the Company considered the following underlying assumptions: 2.5% current expected inflation, 1.5% to 1.7% real rate of return for short duration risk-free investments, 0.2% inflation risk premium, 0.75% default risk premium for the portion
of the portfolio invested in corporate bonds, and 3.7% to 4.0% in equity risk premium (depending on asset class) in excess of short duration government bond returns. The Company then weighted these assumptions by the long-term target allocations and assumed that investment expenses were offset by expected returns in excess of benchmarks, which resulted in the selection of the 6.0% expected long-term rate of return assumption for 2009.
At December 31, 2009 and 2008, the accumulated other comprehensive income (loss) relating to WilTel’s plans that has not yet been recognized in net periodic benefit cost consists of cumulative losses of $46,900,000 and $49,900,000, respectively.
Changes in plan assets and benefit obligations recognized in other comprehensive income (loss) related to WilTel’s pension plans for the years ended December 31, 2009 and 2008 are as follows (in thousands):
|
2009
|
2008
|
|||||||
|
Net gain (loss) arising during period
|
$ | 1,110 | $ | (44,873 | ) | |||
|
Recognition of amortization of actuarial loss in
|
||||||||
|
net periodic benefit cost
|
1,924 | 2,048 | ||||||
|
Total
|
$ | 3,034 | $ | (42,825 | ) | |||
The estimated net loss for the defined benefit pension plan that will be amortized from accumulated other comprehensive income (loss) into net periodic benefit cost in 2010 is $1,300,000.
The measurement date for WilTel’s plans is December 31. The assumptions used for 2009 and 2008 are as follows:
|
Pension Benefits
|
||||||||
|
2009
|
2008
|
|||||||
|
Weighted-average assumptions used to determine
|
||||||||
|
benefit obligation at December 31,:
|
||||||||
|
Discount rate
|
6.00 | % | 6.20 | % | ||||
|
Weighted-average assumptions used to determine
|
||||||||
|
net cost for the period ended December 31,:
|
||||||||
|
Discount rate
|
6.20 | % | 6.30 | % | ||||
|
Expected long-term return on plan assets
|
6.00 | % | 6.85 | % | ||||
The timing of expected future benefit payments was used in conjunction with the Citigroup Pension Discount Curve to develop a discount rate that is representative of the high quality corporate bond market.
The following pension benefit payments are expected to be paid (in thousands):
|
2010
|
$ | 2,938 | ||
|
2011
|
3,719 | |||
|
2012
|
3,671 | |||
|
2013
|
4,347 | |||
|
2014
|
5,345 | |||
|
2015 – 2019
|
48,678 |
The Company and its consolidated subsidiaries have defined contribution pension plans covering certain employees. Contributions and costs are a percent of each covered employee’s salary. Amounts charged to expense related to such plans were $2,300,000, $3,700,000 and $2,900,000 for the years ended December 31,
2009, 2008 and 2007, respectively.
F-45
19.
Commitments and Contingencies
:
The Company and its subsidiaries rent office space and office equipment under noncancellable operating leases with terms varying principally from one to thirty years. Rental expense (net of sublease rental income) was $21,200,000 in 2009, $21,900,000 in 2008 and $12,900,000 in 2007. Future minimum annual rentals (exclusive
of month-to-month leases, real estate taxes, maintenance and certain other charges) under these leases at December 31, 2009 are as follows (in thousands):
|
2010
|
$ | 13,776 | ||
|
2011
|
13,501 | |||
|
2012
|
12,055 | |||
|
2013
|
10,456 | |||
|
2014
|
9,977 | |||
|
Thereafter
|
84,348 | |||
| 144,113 | ||||
|
Less: sublease income
|
(31 | ) | ||
| $ | 144,082 |
Pursuant to an agreement that was entered into before the Company sold CDS to HomeFed in 2002, the Company agreed to obtain project improvement bonds for the San Elijo Hills project. These bonds, which are for the benefit of the City of San Marcos, California and other government agencies, are required prior to the commencement
of any development at the project. CDS is responsible for paying all third party fees related to obtaining the bonds. Should the City or others draw on the bonds for any reason, CDS and one of its subsidiaries would be obligated to reimburse the Company for the amount drawn. At December 31, 2009, $5,000,000 was outstanding under these bonds, $4,900,000 of which expires in 2010.
As more fully discussed in Note 4, the Company has guaranteed 30% of the amounts outstanding under CLC’s intercompany loan from Inmet. At December 31, 2009, $240,100,000 was outstanding under the intercompany loan; accordingly, the Company’s outstanding guaranty at that date was $72,000,000.
As more fully discussed in Note 4, the Company has also guaranteed Berkadia’s repayment of 50% of the five-year credit facility issued by a subsidiary of Berkshire Hathaway. At December 31, 2009, the amount outstanding under the facility was $580,500,000; accordingly, the Company’s outstanding guaranty at that date
was $290,300,000.
The former holders of the Premier Notes argued that they were entitled to liquidated damages under the indenture governing the Premier Notes, and as such are entitled to more than the principal amount of the notes plus accrued interest that was paid to them at emergence. Although the Company does not agree with the position
taken by the Premier noteholders, in order to have Premier’s bankruptcy plan confirmed so that Premier could complete reconstruction of its property and open its business without further delay, the Company agreed to fund an escrow account to cover the Premier noteholders’ claim for additional damages in the amount of $13,700,000, and a second escrow account for the trustee’s reasonable legal fees and expenses in the amount of $1,000,000. The trial before the bankruptcy court to determine
entitlement to the escrowed funds has been scheduled to commence on March 16, 2010. The Company believes it is probable that the court will approve payment of legal fees and expenses and has fully reserved for that contingency. The Company believes it is reasonably possible that the bankruptcy court will find in favor of the Premier noteholders with respect to the additional damages escrow; however, any potential loss can not be reasonably estimated. Accordingly, the Company has
not accrued a loss for the additional damages contingency.
Hurricane Katrina completely destroyed the Hard Rock Biloxi’s casino, which was a facility built on floating barges, and caused significant damage to the hotel and related structures. The new casino was constructed over water on concrete pilings that greatly improved the structural integrity of the facility; however,
the threat of hurricanes remains a risk to the repaired and rebuilt facilities. Premier’s current insurance policy provides up to $235,000,000 in coverage for damage to real and personal property including business interruption coverage. The coverage is provided by a panel of insurers based out of the U.S., Bermuda and London and is comprised of a $50,000,000 primary layer and three excess layers. The coverage is syndicated through several insurance carriers, each with an
A.M. Best Rating of A- (Excellent) or better. Although the insurance policy is an all risk policy, any loss resulting from a weather catastrophe occurrence, which is defined to include damage caused by a named storm, is sublimited to $100,000,000 with a deductible of $5,000,000.
F-46
20.
Litigation
:
The Company and its subsidiaries are parties to legal proceedings that are considered to be either ordinary, routine litigation incidental to their business or not material to the Company’s consolidated financial position. The Company does not believe that any of the foregoing actions will have a material adverse effect
on its consolidated financial position or liquidity, but any amounts paid could be material to results of operations for the period.
IDT Telecom, Inc. and Union Telecard Alliance, LLC filed a federal court action pending in the District of New Jersey entitled,
IDT Telecom and Union Telecard Alliance, LLC
v.
CVT Prepaid Solutions, Inc., et al.
,
alleging that STi Prepaid unlawfully violated the consumer protection laws of several states as a result of their alleged participation in allegedly fraudulent marketing activities of the Telco Group, from which STi Prepaid acquired the assets of the business now conducted by STi Prepaid, as well as alleging that STi Prepaid’s current business practices violate the federal Lanham Act and consumer protection laws. Plaintiffs are seeking equitable relief and monetary damages in an unspecified amount
from STi Prepaid for allegedly wrongful conduct from March 8, 2007 (the date STi Prepaid commenced business operations), as well as on a theory of successor liability for the conduct of the Telco Group prior to March 8, 2007. The trial is currently scheduled to commence on March 1, 2010. On December 28, 2009, the court granted the summary judgment motion of STi Prepaid, LLC, the Company’s majority controlled subsidiary. As a result, all claims asserted against STi Prepaid
have been dismissed. On January 11, 2010, Plaintiffs in this action moved to have the Court certify its summary motion decision for appeal. This motion was subsequently withdrawn without prejudice.
STi Prepaid is also a defendant in a class action entitled,
Ramirez et al.
v.
STi Prepaid, LLC et al.,
arising out of similar conduct underlying the IDT action. The Company believes that the material allegations
in this action are without merit and intends to defend this action vigorously. The Company believes that it is reasonably possible that a loss that could be material could be incurred; however, any potential loss can not be reasonably estimated.
21.
Earnings (Loss) Per Common Share
:
Basic and diluted earnings (loss) per share amounts were calculated by dividing net income (loss) by the weighted average number of common shares outstanding. The numerators and denominators used to calculate basic and diluted earnings (loss) per share for the three year periods ended December 31, 2009, 2008 and 2007 are as
follows (in thousands):
|
2009
|
2008
(c)
|
2007
|
||||||||||
|
Numerator for earnings (loss) per share:
|
||||||||||||
|
Net income (loss) attributable to Leucadia National
|
||||||||||||
|
Corporation common shareholders for basic
|
||||||||||||
|
earnings (loss) per share
|
$ | 550,280 | $ | (2,535,425 | ) | $ | 484,294 | |||||
|
Interest on 3¾% Convertible Notes
|
7,199 | – | 8,810 | |||||||||
|
Net income (loss) attributable to Leucadia National
|
||||||||||||
|
Corporation common shareholders for diluted
|
||||||||||||
|
earnings (loss) per share
|
$ | 557,479 | $ | (2,535,425 | ) | $ | 493,104 | |||||
|
Denominator for earnings (loss) per share:
|
||||||||||||
|
Denominator for basic earnings (loss) per share –
|
||||||||||||
|
weighted average shares
|
241,437 | 230,494 | 218,361 | |||||||||
|
Stock options (a)
|
2 | – | 586 | |||||||||
|
Warrants (b)
|
– | – | 467 | |||||||||
|
3¾% Convertible Notes
|
6,410 | – | 15,239 | |||||||||
|
Denominator for diluted earnings (loss) per share
|
247,849 | 230,494 | 234,653 | |||||||||
F-47
|
|
(a)
|
Options to purchase 2,247,590 weighted average shares of common stock were outstanding during the year ended December 31, 2009, but were not included in the computation of diluted earnings per share because the options’ exercise price was greater than the average market price of the common shares.
|
|
(b)
|
Warrants to purchase 4,000,000 shares of common stock at $28.515 per share were outstanding during the year ended December 31, 2009, but were not included in the computation of diluted earnings per share because the warrants’ exercise price was greater than the average market price of the common shares.
|
|
(c)
|
For 2008, options to purchase 405,000 shares, warrants to purchase 804,000 shares and 14,429,000 shares related to the 3¾% Convertible Notes were not included in the computation of diluted loss per share as the effect was antidilutive due to the Company’s operating loss.
|
|
(d)
|
Outstanding stock options and stock appreciation rights of a subsidiary are not included above since the subsidiary operates at a net loss and the effect is antidilutive.
|
22.
Fair Value of Financial Instruments
:
Aggregate information concerning assets and liabilities at December 31, 2009 and 2008 that are measured at fair value on a recurring basis is presented below (dollars in thousands):
|
December 31, 2009
|
||||||||||||
|
Fair Value Measurements Using
|
||||||||||||
|
Total
Fair Value
Measurements
|
Quoted Prices in Active
Markets for Identical
Assets or Liabilities
(Level 1)
|
Significant Other
Observable Inputs
(Level 2)
|
||||||||||
|
Investments classified as current assets:
|
||||||||||||
|
Investments available for sale:
|
|
|||||||||||
|
Bonds and notes:
|
||||||||||||
|
U.S. Government and agencies
|
$ | 80,419 | $ | 80,419 | $ | – | ||||||
|
All other corporates
|
386 | 386 | – | |||||||||
|
Non-current investments:
|
||||||||||||
|
Investments available for sale:
|
||||||||||||
|
Bonds and notes:
|
||||||||||||
|
U.S. Government and agencies
|
25,791 | 25,791 | – | |||||||||
|
U.S. Government-Sponsored Enterprises
|
358,220 | – | 358,220 | |||||||||
|
All other corporates
|
23,184 | 22,998 | 186 | |||||||||
|
Equity securities:
|
||||||||||||
|
Common stocks:
|
||||||||||||
|
Banks, trusts and insurance companies
|
31,265 | 31,265 | – | |||||||||
|
Industrial, miscellaneous and all other
|
1,525,808 | 1,525,808 | – | |||||||||
|
Investments in associated companies
|
1,792,683 | 1,792,683 | – | |||||||||
|
Total
|
$ | 3,837,756 | $ | 3,479,350 | $ | 358,406 | ||||||
|
Other current liabilities
|
$ | (1,428 | ) | $ | (1,114 | ) | $ | (314 | ) | |||
|
Other non-current liabilities
|
(1,935 | ) | – | (1,935 | ) | |||||||
|
Total
|
$ | (3,363 | ) | $ | (1,114 | ) | $ | (2,249 | ) | |||
F-48
|
December 31, 2008
|
||||||||||||
|
Fair Value Measurements Using
|
||||||||||||
|
Total Fair Value
Measurements
|
Quoted Prices in Active
Markets for Identical
Assets or Liabilities
(Level 1)
|
Significant Other
Observable Inputs
(Level 2)
|
||||||||||
|
Current investments :
|
||||||||||||
|
Investments available for sale
|
$ | 362,628 | $ | 329,317 | $ | 33,311 | ||||||
|
Non-current investments:
|
||||||||||||
|
Investments available for sale
|
859,122 | 564,903 | 294,219 | |||||||||
|
Investments in associated companies
|
933,057 | 933,057 | – | |||||||||
|
Total
|
$ | 2,154,807 | $ | 1,827,277 | $ | 327,530 | ||||||
|
Other current liabilities
|
$ | (259 | ) | $ | (259 | ) | $ | – | ||||
|
Other non-current liabilities
|
(13,132 | ) | – | (13,132 | ) | |||||||
|
Total
|
$ | (13,391 | ) | $ | (259 | ) | $ | (13,132 | ) | |||
At December 31, 2009 and 2008, the Company did not have material fair value measurements using unobservable inputs (Level 3) for assets and liabilities measured at fair value on a recurring basis.
The estimated fair values for securities measured using Level 1 inputs are determined using publicly quoted market prices in active markets. The Company has a segregated portfolio of mortgage pass-through certificates issued by U.S. Government agencies (GNMA) and by U.S. Government-Sponsored Enterprises (FHLMC or FNMA) which
are carried on the balance sheet at their estimated fair value. Although the markets that these types of securities trade in are generally active, market prices are not always available for the identical security. The fair value of these investments are based on observable market data including benchmark yields, reported trades, issuer spreads, benchmark securities, bids and offers. At December 31, 2008, the Company also had a portfolio of corporate bonds, which are carried on
the balance sheet at their estimated fair value. Although these bonds trade in brokered markets, the market for certain bonds is sometimes inactive. The fair values of these investments are based on reported trading prices, bid and ask prices and quotes obtained from independent market makers in the securities. The estimates of fair value of the portfolios of mortgage pass-through certificates and corporate bonds are considered to be based on Level 2 inputs.
Aggregate information concerning assets and liabilities at December 31, 2009 and 2008 that are measured at fair value on a nonrecurring basis is presented below (in thousands):
|
December 31, 2009
|
||||||||||||||||
|
Fair Value Measurements Using
|
||||||||||||||||
|
Total Fair Value
Measurements
|
Quoted Prices in
Active Markets for
Identical Assets
(Level 1)
|
Significant Other
Observable Inputs
(Level 2)
|
Significant
Unobservable
Inputs
(Level 3)
|
|||||||||||||
|
Long-lived assets held and used (a)
|
$ | 2,900 | $ | – | $ | – | $ | 2,900 | ||||||||
|
Other non-current investments (b)
|
2,300 | – | – | 2,300 | ||||||||||||
|
Long-lived assets held for sale (c)
|
2,200 | – | 2,200 | – | ||||||||||||
F-49
|
December 31, 2008
|
||||||||||||||||
|
Fair Value Measurements Using
|
||||||||||||||||
|
Total Fair Value
Measurements
|
Quoted Prices in
Active Markets for
Identical Assets
(Level 1)
|
Significant Other
Observable Inputs
(Level 2)
|
Significant
Unobservable
Inputs
(Level 3)
|
|||||||||||||
|
Long-lived assets held and used (a)
|
$ | 1,400 | $ | – | $ | – | $ | 1,400 | ||||||||
|
Other non-current investments (b)
|
56,000 | – | – | 56,000 | ||||||||||||
|
Investments in associated companies (d)
|
14,600 | – | 14,600 | – | ||||||||||||
|
|
(a)
|
As more fully discussed in Note 2, Idaho Timber decided to close one of its plants. Idaho Timber evaluated for impairment the plant’s long-lived assets, comprised of buildings, machinery and equipment, and customer relationships intangibles. As of December 31, 2009, the carrying values of these long-lived assets held and used and intangible assets were written down to fair values. The
carrying values of long-lived assets held and used and intangible assets of $1,000,000 and $800,000, respectively, were written down to fair values of $700,000 and $0, respectively, resulting in an aggregate impairment charge during the fourth quarter of $1,100,000, which is included in selling, general and other expenses. The fair values were determined using the present value of expected future cash flows. As of December 31, 2009, the Company also wrote down a real estate property that
under GAAP is considered to be held and used, but which the Company has recently decided to sell. The Company wrote down this real estate property to fair value of $2,200,000 (resulting in an impairment charge included in selling, general and other expenses of $2,500,000), primarily using market information for similar assets.
|
As of December 31, 2008, the Company evaluated for impairment principally within its other operations segment certain long-lived assets (wine futures contracts) as events or changes in circumstances indicated that the carrying amount for these assets may not have been recoverable. The fair values for these assets were primarily
based upon information obtained from market participants concerning sales of bottled wine of other vintages for similar types of wine.
|
|
(b)
|
At December 31, 2009, represents investments aggregating $2,300,000 in non-agency mortgage-backed bond securitizations. At December 31, 2008, includes $11,000,000 in non-agency mortgage-backed bond securitizations, $44,600,000 of investments in private equity funds and a non-public security. The investments in non-agency mortgage-backed bond securitizations are acquisitions of impaired loans,
generally at a significant discount to face amounts. The market for these securities is highly illiquid and they rarely trade. The fair values were primarily determined using an income valuation model to calculate the present value of expected future cash flows, which incorporated assumptions regarding potential future rates of delinquency, prepayments, defaults, collateral losses and interest rates. The investments in private equity funds and non-public equity securities are
accounted for under the cost method of accounting for which the Company primarily reviewed issuer financial statements to determine their fair values. The private equity funds account for their underlying investments at fair value, which are principally based on Level 2 or Level 3 inputs.
|
|
|
(c)
|
Consists of real estate properties for which the fair values were primarily based on appraisals or prices for similar assets. The Company recognized $1,100,000 of impairment losses for these properties, which is included in selling, general and other expenses.
|
|
|
(d)
|
Consists of the Company’s investment in IFIS. As more fully discussed in Note 4, the Company recorded impairment charges related to this investment in 2008, primarily based upon the quoted market prices of IFIS’s investments.
|
F-50
The information in the tables above includes assets that are measured at fair value on a non-recurring basis as of the indicated balance sheet dates. However, prior to year-end the Company recorded impairment charges for assets that resulted in write-downs to fair value in earlier periods. For the year ended December
31, 2009, net securities gains (losses) include impairment charges for investments aggregating $31,400,000 (which included $14,800,000 for non-agency mortgage-backed bond securitizations and $2,200,000 for non-public equity securities and a private equity fund). For the year ended December 31, 2008, net securities gains (losses) include impairment charges for investments aggregating $143,400,000 (which included $14,100,000 for non-agency mortgage-backed bond securitizations and $29,700,000 for non-public
equity securities and private equity funds).
During 2009, the Company recorded impairment charges for other assets and investments in associated companies aggregating $139,000,000, which were principally classified as selling, general and other expenses and losses related to associated companies. This amount primarily consisted of $68,800,000 related to long-lived assets,
principally with respect to MB1, $36,500,000 related to the Company’s investment in Keen (while it was classified as an associated company) and $32,300,000 related to the Company’s investment in Garcadia (an associated company); see Notes 2 and 3 for further information.
The following table presents fair value information about certain financial instruments, whether or not recognized on the balance sheet. Fair values are determined as described below. These techniques are significantly affected by the assumptions used, including the discount rate and estimates of future cash flows. The
fair value amounts presented do not purport to represent and should not be considered representative of the underlying “market” or franchise value of the Company. The methods and assumptions used to estimate the fair values of each class of the financial instruments described below are as follows:
|
|
(a)
|
Investments: The fair values of marketable equity securities and fixed maturity securities (which include securities sold not owned) are substantially based on quoted market prices, as disclosed in Note 6.
|
Other non-current investments which do not trade publicly include private equity fund investments where the Company’s voting interest isn’t large enough to apply the equity method of accounting, a portfolio of non-agency mortgage-backed bond securitizations where the underlying assets are various individual mortgage loans,
the FMG note, the stock interest in LPH, the stock interest in IFIS and various other non-publicly traded interests in equity and debt securities. For the investments in private equity funds, IFIS and the FMG note, the Company has concluded that the carrying amount approximates the fair value of these investments based primarily on reviews of issuer financial statements or statements of net asset value. For the bond securitization portfolio, future cash flows are re-estimated on a regular
basis for each security to determine if impairment charges are required; accordingly the Company has concluded that the carrying amount of these securities approximates their fair values. Although LPH trades publicly in Barbados, the volume is too low for the market to be considered active. The fair value of the investment in LPH is also not practicable to estimate because of transfer restrictions and currency exchange restrictions. However, the Company believes the fair value
of the investment in LPH is at least equal to its carrying amount, which is reflected in the table below. The fair values of the Company’s other non-publicly traded interests in equity and debt securities that are accounted for under the cost method (aggregating $35,000,000 and $26,200,000 at December 31, 2009 and 2008, respectively) were assumed to be at least equal to the carrying amount. For these non-publicly traded interests in equity and debt securities, the Company reviews cash
flows and/or other information obtained from investee companies on a regular basis to determine if impairment charges are required.
|
|
(b)
|
Cash and cash equivalents: For cash equivalents, the carrying amount approximates fair value.
|
|
|
(c)
|
Notes receivable: The fair values of variable rate notes receivable are estimated to be the carrying amount. The fair value of fixed rate convertible debt is based on the market value of the common stock that would be received assuming conversion.
|
|
|
(d)
|
Long-term and other indebtedness: The fair values of non-variable rate debt are estimated using quoted market prices and estimated rates that would be available to the Company for debt with similar terms. The fair value of variable rate debt is estimated to be the carrying amount. The fair value of the MB1 debt is the value of its collateral.
|
F-51
|
|
(e)
|
Swap agreements: The fair values of the interest rate swap and currency rate swap agreements are based on rates currently available for similar agreements.
|
The carrying amounts and estimated fair values of the Company’s financial instruments at December 31, 2009 and 2008 are as follows (in thousands):
|
2009
|
2008
|
|||||||||||||||
|
Carrying
|
Fair
|
Carrying
|
Fair
|
|||||||||||||
|
Amount
|
Value
|
Amount
|
Value
|
|||||||||||||
|
Financial Assets:
|
||||||||||||||||
|
Investments:
|
||||||||||||||||
|
Current
|
$ | 84,707 | $ | 84,707 | $ | 366,464 | $ | 366,464 | ||||||||
|
Non-current
|
2,128,238 | 2,128,238 | 1,028,012 | 1,028,012 | ||||||||||||
|
Cash and cash equivalents
|
154,128 | 154,128 | 237,503 | 237,503 | ||||||||||||
|
Notes receivable:
|
||||||||||||||||
|
Current
|
906 | 906 | 65 | 65 | ||||||||||||
|
Non-current
|
2,618 | 2,618 | 6,100 | 7,129 | ||||||||||||
|
Financial Liabilities:
|
||||||||||||||||
|
Debt:
|
||||||||||||||||
|
Current
|
312,592 | 281,481 | 248,713 | 248,716 | ||||||||||||
|
Non-current
|
1,657,779 | 1,652,616 | 1,832,743 | 1,459,892 | ||||||||||||
|
Securities sold not owned
|
1,114 | 1,114 | 259 | 259 | ||||||||||||
|
Swap agreements:
|
||||||||||||||||
|
Interest rate swaps
|
(1,935 | ) | (1,935 | ) | (11,708 | ) | (11,708 | ) | ||||||||
|
Foreign currency swaps
|
(314 | ) | (314 | ) | (1,424 | ) | (1,424 | ) | ||||||||
23.
Segment Information
:
The Company’s reportable segments consist of its operating units, which offer different products and services and are managed separately. Idaho Timber primarily remanufactures, manufactures and/or distributes wood products. Conwed Plastics manufactures and markets lightweight plastic netting used for a variety
of purposes. The Company’s telecommunications segment is conducted through STi Prepaid, a provider of international prepaid phone cards and other telecommunications services in the U.S. The Company’s land based contract oil and gas drilling operations segment is conducted through Keen, a provider of drilling services to oil and natural gas exploration and production companies in the Mid-Continent Region of the U.S. The property management and services business is conducted
through ResortQuest, which offers management services to vacation properties in beach and mountain resort locations in the continental U.S., as well as real estate brokerage services and other rental and property owner services. The Company’s gaming entertainment segment is conducted through Premier, which owns the Hard Rock Biloxi. The Company’s domestic real estate operations consist of a variety of commercial properties, residential land development projects and other unimproved
land, all in various stages of development. The Company’s medical product development segment is conducted through Sangart. Other operations primarily consist of the Company’s wineries and energy projects.
While in bankruptcy, Premier was deconsolidated and classified as an investment in an associated company from September 2006 until August 2007. Upon its emergence from bankruptcy, Premier was once again consolidated and has been reported as an operating segment since that date. Prior to its consolidation in November
2009, the Company’s investment in Keen was classified as an investment in an associated company.
F-52
Associated companies include equity interests in other entities that the Company accounts for under the equity method of accounting. Investments in associated companies that are accounted for under the equity method of accounting include HomeFed, JHYH, Berkadia and CLC. In the past the Company has made non-controlling
investments in investment partnerships that are engaged in investing and/or securities transactions activities which were accounted for under the equity method of accounting; however, the only remaining material investment of this kind is the Company’s interest in Pershing Square. Associated companies also include the Company’s investments in ACF and Jefferies, which are accounted for at fair value rather than the equity method of accounting.
Corporate assets primarily consist of investments and cash and cash equivalents and corporate revenues primarily consist of investment and other income and securities gains and losses. Corporate assets include the Company’s investment in Fortescue. Corporate assets, revenues, overhead expenses and interest
expense are not allocated to the operating units.
Conwed Plastics has manufacturing facilities located in Belgium and Mexico and STi Prepaid has a customer care unit located in the Dominican Republic. These are the only foreign operations with non-U.S. revenue or assets that the Company consolidates, and are not material. Unconsolidated non-U.S. based investments
include 39% of LPH, a small Caribbean-based telecommunications provider, the 30% ownership interest in CLC and the investments in Fortescue and Inmet. From time to time the Company invests in the securities of non-U.S. entities or in investment partnerships that invest in non-U.S. securities.
Certain information concerning the Company’s segments is presented in the following table. Consolidated subsidiaries are reflected as of the date a majority controlling interest was acquired, which was November 2009 for Keen, June 2007 for ResortQuest and March 2007 for STi Prepaid. As discussed above, Premier
was deconsolidated in September 2006; Premier once again became a consolidated subsidiary in August 2007. Associated Companies are not considered to be a reportable segment, but are reflected in the table below under income (loss) from continuing operations before income taxes and identifiable assets employed.
F-53
|
2009
|
2008
|
2007
|
||||||||||
|
(In millions)
|
||||||||||||
|
Revenues and other income (a):
|
||||||||||||
|
Manufacturing:
|
||||||||||||
|
Idaho Timber
|
$ | 142.7 | $ | 235.3 | $ | 292.2 | ||||||
|
Conwed Plastics
|
82.1 | 106.0 | 105.4 | |||||||||
|
Telecommunications
|
426.1 | 452.4 | 363.2 | |||||||||
|
Oil and Gas Drilling Services
|
60.5 | – | – | |||||||||
|
Property Management and Services
|
117.2 | 142.0 | 81.5 | |||||||||
|
Gaming Entertainment
|
103.6 | 119.1 | 38.5 | |||||||||
|
Domestic Real Estate
|
30.6 | 15.1 | 13.4 | |||||||||
|
Medical Product Development
|
5.1 | .7 | 2.1 | |||||||||
|
Other Operations (b)
|
53.3 | 53.4 | 53.6 | |||||||||
|
Corporate (c)
|
97.8 | (43.3 | ) | 205.0 | ||||||||
|
Total consolidated revenues and other income
|
$ | 1,119.0 | $ | 1,080.7 | $ | 1,154.9 | ||||||
|
Income (loss) from continuing operations before income taxes:
|
||||||||||||
|
Manufacturing:
|
||||||||||||
|
Idaho Timber
|
$ | (12.7 | ) | $ | .8 | $ | 9.1 | |||||
|
Conwed Plastics
|
11.6 | 14.0 | 17.4 | |||||||||
|
Telecommunications
|
.4 | 11.9 | 18.4 | |||||||||
|
Oil and Gas Drilling Services
|
46.7 | – | – | |||||||||
|
Property Management and Services
|
.8 | (1.9 | ) | (6.5 | ) | |||||||
|
Gaming Entertainment
|
2.4 | 1.0 | (9.3 | ) | ||||||||
|
Domestic Real Estate
|
(71.3 | ) | (14.7 | ) | (8.3 | ) | ||||||
|
Medical Product Development
|
(23.8 | ) | (36.6 | ) | (36.5 | ) | ||||||
|
Other Operations (b)
|
(36.4 | ) | (40.4 | ) | (17.6 | ) | ||||||
|
Income (loss) related to Associated Companies
|
805.8 | (536.8 | ) | (31.2 | ) | |||||||
|
Corporate (c)
|
(168.7 | ) | (302.1 | ) | (27.9 | ) | ||||||
|
Total consolidated income (loss) from continuing
|
||||||||||||
|
operations before income taxes
|
$ | 554.8 | $ | (904.8 | ) | $ | (92.4 | ) | ||||
|
Identifiable assets employed:
|
||||||||||||
|
Manufacturing:
|
||||||||||||
|
Idaho Timber
|
$ | 94.2 | $ | 118.3 | $ | 129.5 | ||||||
|
Conwed Plastics
|
67.9 | 78.5 | 88.8 | |||||||||
|
Telecommunications
|
92.0 | 107.7 | 81.9 | |||||||||
|
Oil and Gas Drilling Services
|
257.1 | – | – | |||||||||
|
Property Management and Services
|
49.8 | 55.2 | 62.8 | |||||||||
|
Gaming Entertainment
|
267.0 | 281.6 | 300.6 | |||||||||
|
Domestic Real Estate
|
311.6 | 409.7 | 306.3 | |||||||||
|
Medical Product Development
|
26.7 | 21.2 | 36.5 | |||||||||
|
Other Operations
|
517.9 | 290.1 | 255.5 | |||||||||
|
Investments in Associated Companies
|
2,764.9 | 2,006.6 | 1,362.9 | |||||||||
|
Corporate (d)
|
2,313.3 | 1,829.6 | 5,501.8 | |||||||||
|
Total consolidated assets
|
$ | 6,762.4 | $ | 5,198.5 | $ | 8,126.6 | ||||||
|
(a)
|
Revenues and other income for each segment include amounts for services rendered and products sold, as well as segment reported amounts classified as investment and other income and net securities gains (losses) in the Company’s consolidated statements of operations.
|
F-54
|
(b)
|
Other operations includes pre-tax losses of $25,300,000, $33,300,000 and $12,300,000 for the years ended December 31, 2009, 2008 and 2007, respectively, for investigation and evaluation of various energy related projects. There were no material operating revenues or identifiable assets associated with these activities in any period; however, other income includes $8,500,000 in 2007 related to the termination
of a joint development agreement with another party.
|
|
(c)
|
Net securities gains (losses) for Corporate aggregated $(21,100,000), $(144,500,000) and $92,700,000 during 2009, 2008 and 2007, respectively. Corporate net securities gains (losses) are net of impairment charges of $31,400,000, $143,400,000 and $36,800,000 during 2009, 2008 and 2007, respectively. In 2007, security gains include a gain of $37,800,000 from the sale of Eastman Chemical Company.
|
|
(d)
|
As more fully discussed above, during 2008 the Company increased its deferred tax valuation allowance by $1,672,100,000 to reserve for substantially all of the net deferred tax asset.
|
|
(e)
|
For the years ended December 31, 2009, 2008 and 2007, income (loss) from continuing operations reflects depreciation and amortization expenses of $81,000,000, $70,500,000 and $51,200,000, respectively; such amounts are primarily comprised of Corporate ($18,400,000, $13,600,000 and $9,700,000, respectively), manufacturing ($17,100,000, $17,300,000 and $18,000,000, respectively, including amounts classified as cost
of sales), gaming entertainment ($16,500,000, $17,000,000 and $6,300,000, respectively), domestic real estate ($8,400,000, $7,600,000 and $3,800,000, respectively), property management and services ($3,600,000, $4,600,000 and $3,100,000, respectively), telecommunications ($4,100,000, $1,400,000 and $500,000, respectively), other operations ($8,900,000, $8,300,000 and $9,000,000, respectively, including amounts classified as cost of sales), and oil and gas drilling services ($3,100,000 in 2009). Depreciation
and amortization expenses for the other segment are not material.
|
|
(f)
|
For the years ended December 31, 2009, 2008 and 2007, income (loss) from continuing operations reflects interest expense of $128,800,000, $145,500,000 and $111,500,000, respectively; such amounts are primarily comprised of Corporate ($125,700,000, $140,000,000 and $110,800,000, respectively), domestic real estate ($2,300,000 and $4,400,000 in 2009 and 2008, respectively) and gaming entertainment ($500,000, $900,000
and $500,000, respectively). Interest expense for other segments is not material.
|
F-55
24.
Selected Quarterly Financial Data (Unaudited)
:
|
First
|
Second
|
Third
|
Fourth
|
|||||||||||||
|
Quarter
|
Quarter
|
Quarter
|
Quarter
|
|||||||||||||
|
(In thousands, except per share amounts)
|
||||||||||||||||
|
2009
|
||||||||||||||||
|
Revenues and other income
|
$ | 250,343 | $ | 284,323 | $ | 280,801 | $ | 303,535 | ||||||||
|
Income (loss) from continuing operations
|
$ | (140,133 | ) | $ | 410,984 | $ | 345,775 | $ | (94,506 | ) | ||||||
|
Income from discontinued operations, net of taxes
|
$ | - | $ | - | $ | 23,805 | $ | 2,670 | ||||||||
|
Net loss attributable to the noncontrolling interest
|
$ | 126 | $ | 39 | $ | 619 | $ | 901 | ||||||||
|
Net income (loss)
|
$ | (140,007 | ) | $ | 411,023 | $ | 370,199 | $ | (90,935 | ) | ||||||
|
Basic earnings (loss) per common share attributable to
|
||||||||||||||||
|
Leucadia National Corporation common shareholders:
|
||||||||||||||||
|
Income (loss) from continuing operations
|
$ | (.59 | ) | $ | 1.70 | $ | 1.42 | $ | (.38 | ) | ||||||
|
Income from discontinued operations
|
- | - | .10 | .01 | ||||||||||||
|
Net income (loss)
|
$ | (.59 | ) | $ | 1.70 | $ | 1.52 | $ | (.37 | ) | ||||||
|
Number of shares used in calculation
|
238,499 | 241,095 | 243,238 | 243,170 | ||||||||||||
|
Diluted earnings (loss) per common share attributable to
|
||||||||||||||||
|
Leucadia National Corporation common shareholders:
|
||||||||||||||||
|
Income (loss) from continuing operations
|
$ | (.59 | ) | $ | 1.67 | $ | 1.40 | $ | (.38 | ) | ||||||
|
Income from discontinued operations
|
- | - | .10 | .01 | ||||||||||||
|
Net income (loss)
|
$ | (.59 | ) | $ | 1.67 | $ | 1.50 | $ | (.37 | ) | ||||||
|
Number of shares used in calculation
|
238,499 | 248,135 | 247,711 | 243,170 | ||||||||||||
|
2008
|
||||||||||||||||
|
Revenues and other income
|
$ | 324,849 | $ | 337,554 | $ | 251,616 | $ | 166,634 | ||||||||
|
Income (loss) from continuing operations
|
$ | (95,989 | ) | $ | 186,826 | $ | 89,348 | $ | (2,760,883 | ) | ||||||
|
Income from discontinued operations, net of taxes
|
$ | - | $ | - | $ | - | $ | 44,904 | ||||||||
|
Loss on disposal of discontinued operations, net of taxes
|
$ | - | $ | - | $ | - | $ | (1,018 | ) | |||||||
|
Net loss attributable to the noncontrolling interest
|
$ | 165 | $ | (48 | ) | $ | 114 | $ | 1,156 | |||||||
|
Net income (loss)
|
$ | (95,824 | ) | $ | 186,778 | $ | 89,462 | $ | (2,715,841 | ) | ||||||
|
Basic earnings (loss) per common share attributable to
|
||||||||||||||||
|
Leucadia National Corporation common shareholders:
|
||||||||||||||||
|
Income (loss) from continuing operations
|
$ | (.43 | ) | $ | .81 | $ | .38 | $ | (11.72 | ) | ||||||
|
Income from discontinued operations
|
- | - | - | .19 | ||||||||||||
|
Loss on disposal of discontinued operations
|
- | - | - | - | ||||||||||||
|
Net income (loss)
|
$ | (.43 | ) | $ | .81 | $ | .38 | $ | (11.53 | ) | ||||||
|
Number of shares used in calculation
|
222,584 | 230,235 | 232,849 | 235,521 | ||||||||||||
|
Diluted earnings (loss) per common share attributable to
|
||||||||||||||||
|
Leucadia National Corporation common shareholders:
|
||||||||||||||||
|
Income (loss) from continuing operations
|
$ | (.43 | ) | $ | .76 | $ | .37 | $ | (11.72 | ) | ||||||
|
Income from discontinued operations
|
- | - | - | .19 | ||||||||||||
|
Loss on disposal of discontinued operations
|
- | - | - | - | ||||||||||||
|
Net income (loss)
|
$ | (.43 | ) | $ | .76 | $ | .37 | $ | (11.53 | ) | ||||||
|
Number of shares used in calculation
|
222,584 | 247,234 | 249,452 | 235,521 | ||||||||||||
Income (loss) from continuing operations includes a charge to income tax expense in the fourth quarter of 2008 in order to reserve for substantially all of the net deferred tax asset. Income (loss) from continuing operations includes a credit to income tax expense of $222,200,000 in the second quarter of 2008, resulting from
the reversal of a portion of the deferred tax valuation allowance. Income (loss) from continuing operations also includes a credit to income tax expense of $12,500,000 in the second quarter of 2008, resulting from the recognition of additional state and local net operating loss carryforwards. See Note 2 for more information.
F-56
In 2009 and 2008, the totals of quarterly per share amounts do not equal annual per share amounts because of changes in outstanding shares during the year.
F-57
|
Schedule II – Valuation and Qualifying Accounts
|
LEUCADIA NATIONAL CORPORATION AND SUBSIDIARIES
For the years ended December 31, 2009, 2008 and 2007
(In thousands)
|
Additions
|
Deductions
|
|||||||||||||||||||||||||||||||
|
Charged
|
||||||||||||||||||||||||||||||||
|
Balance at
|
to Costs
|
Balance
|
||||||||||||||||||||||||||||||
|
Beginning
|
and
|
Write
|
Sale of
|
at End
|
||||||||||||||||||||||||||||
|
Description
|
of Period
|
Expenses
|
Recoveries
|
Other
|
Offs
|
Receivables
|
Other
|
of Period
|
||||||||||||||||||||||||
|
2009
|
||||||||||||||||||||||||||||||||
|
Allowance for
|
||||||||||||||||||||||||||||||||
|
doubtful accounts
|
$ | 3,732 | $ | 2,615 | $ | 12 | $ | - | $ | 1,077 | $ | - | $ | - | $ | 5,282 | ||||||||||||||||
|
Deferred tax asset
|
||||||||||||||||||||||||||||||||
|
valuation allowance
|
$ | 2,307,281 | $ | - | $ | - | $ | 109,156 | (b) | $ | - | $ | - | $ | 581,276 | (d) | $ | 1,835,161 | ||||||||||||||
|
2008
|
||||||||||||||||||||||||||||||||
|
Allowance for
|
||||||||||||||||||||||||||||||||
|
doubtful accounts
|
$ | 2,079 | $ | 2,386 | $ | 355 | $ | - | $ | 1,088 | $ | - | $ | - | $ | 3,732 | ||||||||||||||||
|
Deferred tax asset
|
||||||||||||||||||||||||||||||||
|
valuation allowance
|
$ | 299,775 | $ | 1,672,138 | (a) | $ | - | $ | 335,368 | (b) | $ | - | $ | - | $ | - | $ | 2,307,281 | ||||||||||||||
|
2007
|
||||||||||||||||||||||||||||||||
|
Allowance for
|
||||||||||||||||||||||||||||||||
|
doubtful accounts
|
$ | 1,773 | $ | 566 | $ | 147 | $ | - | $ | 407 | $ | - | $ | - | $ | 2,079 | ||||||||||||||||
|
Deferred tax asset
|
||||||||||||||||||||||||||||||||
|
valuation allowance
|
$ | 911,777 | $ | - | $ | - | $ | 29,311 | (c) | $ | - | $ | - | $ | 641,313 | (e) | $ | 299,775 | ||||||||||||||
|
|
(a)
|
During 2008 the Company concluded that a valuation allowance was required against substantially all of the net deferred tax asset, and increased its valuation allowance by $1,672,100,000 with a corresponding charge to income tax expense. See Note 2 of Notes to Consolidated Financial Statements for more information.
|
|
|
(b)
|
Represents the tax effect of losses during 2009 and 2008, which were reserved for in the deferred tax asset valuation allowance.
|
|
|
(c)
|
In connection with the filing of the 2006 income tax return and with a subsidiary joining the Company’s consolidated income tax return during 2007, additional deferred tax assets were recognized but were fully reserved.
|
|
|
(d)
|
Primarily represents the tax effect of the change in unrealized gains (losses) on investments.
|
|
|
(e)
|
During 2007, the Company’s revised projections of future taxable income enabled it to conclude that it was more likely than not that it will have future taxable income sufficient to realize a portion of the Company’s net deferred tax asset; accordingly, $542,700,000 of the deferred tax valuation allowance was reversed as a credit to income tax expense. Also reflects the allocation of the purchase
price for STi Prepaid in the amount of $98,600,000.
|
F-58
|
Consolidated Financial Statements
Pershing Square IV, L.P. and Subsidiary
Year Ended December 31, 2009
(Unaudited)
|
Pershing Square IV, L.P. and Subsidiary
Consolidated Statement of Assets, Liabilities and Partners’ Capital
December 31, 2009
(Unaudited)
|
Assets
|
||||
|
Due from broker
|
$ | 15,872,175 | ||
|
Investment in securities, at fair value (cost $54,108,914)
|
61,081,152 | |||
|
Total assets
|
$ | 76,953,327 | ||
|
Liabilities and partners’ capital
|
||||
|
Capital withdrawals payable
|
$ | 31,256,293 | ||
|
Interest payable
|
43 | |||
|
Accrued expenses
|
106,702 | |||
|
Total liabilities
|
31,363,038 | |||
|
Partners’ capital
|
45,590,289 | |||
|
Total liabilities and partners’ capital
|
$ | 76,953,327 | ||
|
|
The accompanying notes and attached consolidated financial statements of Pershing Square IV A, L.P. (In Liquidation) are an integral part of the consolidated financial statements.
|
2
Pershing Square IV, L.P. and Subsidiary
Consolidated Condensed Schedule of Investments
December 31, 2009
(Unaudited)
|
Shares
|
Description/Name
|
Fair Value
|
Percentage
of Partners’ Capital
|
||||||
|
Investments in Securities
|
|||||||||
|
Equity Securities
|
|||||||||
|
United States:
|
|||||||||
|
Retail
|
|||||||||
|
1,262,790
|
Target Corp.
|
$ | 61,081,152 | 133.98 | % | ||||
|
Total Equity Securities
(cost $54,108,914)
|
61,081,152 | 133.98 | |||||||
|
Total Investments in Securities
(cost $54,108,914)
|
$ | 61,081,152 | 133.98 | % | |||||
|
|
The accompanying notes and attached consolidated financial statements of Pershing Square IV A, L.P. (In Liquidation) are an integral part of the consolidated financial statements.
|
|
|
.
|
3
Pershing Square IV, L.P. and Subsidiary
Consolidated Statement of Operations
Year Ended December 31, 2009
(Unaudited)
|
Net realized and unrealized loss allocated from
investment in Pershing Square IV A, L.P.
|
||||||||
|
Net realized loss from investments in securities
|
$ | (422,836,313 | ) | |||||
|
Net change in unrealized gain/loss from investments in securities
|
263,827,079 | |||||||
|
Net realized gain on derivative contracts
|
4,772,473 | |||||||
|
Net change in unrealized gain/loss on derivative contracts
|
(4,436,022 | ) | ||||||
|
Net realized and unrealized loss allocated from investment in Pershing Square IV A, L.P.
|
(158,672,783 | ) | ||||||
|
Net realized and unrealized gain from investments in securities
|
||||||||
|
Net realized gain from investments in securities
|
3,768,157 | |||||||
|
Net change in unrealized gain/loss from investments in securities
|
6,972,238 | |||||||
|
Net realized loss on derivative contracts
|
(354,766 | ) | ||||||
|
Net gain from investment in securities
|
10,385,629 | |||||||
|
Net realized and unrealized gain/loss allocated from investment in Pershing Square IV A, L.P. and investments
in securities
|
$ | (148,287,154 | ) | |||||
|
Net investment loss allocated from investment in
Pershing Square IV A, L.P.
|
||||||||
|
Investment income
|
||||||||
|
Dividends
|
3,906 | |||||||
|
Interest
|
1,179 | |||||||
|
Total expenses
|
(208,499 | ) | ||||||
|
Net investment loss allocated from investment in
Pershing Square IV A, L.P.
|
(203,414 | ) | ||||||
|
Partnership investment loss
|
||||||||
|
Dividend income
|
596,625 | |||||||
|
Interest expense
|
(26,506 | ) | ||||||
|
Professional fees
|
(876,669 | ) | ||||||
|
Net Partnership investment loss
|
(306,550 | ) | ||||||
|
Net investment loss
|
(509,964 | ) | ||||||
|
Net loss
|
$ | (148,797,118 | ) | |||||
|
|
The accompanying notes and attached consolidated financial statements of Pershing Square IV A, L.P. (In Liquidation) are an integral part of the consolidated financial statements.
|
4
Pershing Square IV, L.P. and Subsidiary
Consolidated Statement of Changes in Partners’ Capital
Year Ended December 31, 2009
(Unaudited)
|
Total
|
Limited
Partners
|
General
Partner *
|
||||||||||
|
Partners’ capital at beginning of year
|
$ | 373,490,155 | $ | 373,490,155 | $ | − | ||||||
|
Capital contributions
|
3,143,888 | 3,045,199 | 98,689 | |||||||||
|
Capital withdrawals
|
(182,246,636 | ) | (182,246,636 | ) | − | |||||||
|
Net gain/loss
|
(148,797,118 | ) | (148,848,786 | ) | 51,668 | |||||||
|
Partners’ capital at end of year
|
$ | 45,590,289 | $ | 45,439,932 | $ | 150,357 | ||||||
* As a result of the restructuring of Pershing Square IV A, L.P. (see Note 1) on January 31, 2009, the General Partner withdrew its investment in Pershing Square IV A, L.P. and reinvested the amount into Pershing Square IV, L.P. and Pershing Square IV-I, L.P. on February 1, 2009.
|
|
The accompanying notes and attached consolidated financial statements of Pershing Square IV A, L.P. (In Liquidation) are an integral part of the consolidated financial statements.
|
5
Pershing Square IV, L.P. and Subsidiary
Consolidated Statement of Cash Flows
Year Ended December 31, 2009
(Unaudited)
|
Cash flows from operating activities
|
||||
|
Net loss
|
$ | (148,797,118 | ) | |
|
Adjustments to reconcile net loss to net cash provided by operating activities:
|
||||
|
Net realized gain from investments in securities
|
(3,768,157 | ) | ||
|
Net change in unrealized gain/loss from investments in securities
|
(6,972,238 | ) | ||
|
Purchases of investments
|
(228,836,009 | ) | ||
|
Purchases to cover short positions
|
(14,825,163 | ) | ||
|
Proceeds from investments sold
|
161,175,901 | |||
|
Proceeds from short sales
|
32,144,514 | |||
|
Decrease in investment in Pershing Square IV A, L.P.
|
373,490,155 | |||
|
Increase in due from broker
|
(15,872,175 | ) | ||
|
Increase in interest payable
|
43 | |||
|
Increase in accrued expenses
|
106,702 | |||
|
Net cash provided by operating activities
|
147,846,455 | |||
|
Cash flows from financing activities
|
||||
|
Capital contributions
|
3,143,888 | |||
|
Capital withdrawals, net of capital withdrawals payable
|
(150,990,343 | ) | ||
|
Net cash used in financing activities
|
(147,846,455 | ) | ||
|
Net change in cash and cash equivalents
|
− | |||
|
Cash and cash equivalents at beginning of year
|
− | |||
|
Cash and cash equivalents at end of year
|
$ | − | ||
|
Supplemental disclosure of cash flow information
|
||||
|
Cash paid during the year for interest
|
$ | 26,463 | ||
|
|
The accompanying notes and attached consolidated financial statements of Pershing Square IV A, L.P. (In Liquidation) are an integral part of the consolidated financial statements.
|
6
Pershing Square IV, L.P. and Subsidiary
Notes to Consolidated Financial Statements
December 31, 2009
(Unaudited)
1. Organization
Pershing Square IV, L.P. (the “Partnership”) was organized as a limited partnership under the laws of the state of Delaware on May 22, 2007 and commenced operations on June 1, 2007. The investment objective of the Partnership is to create significant capital appreciation by investing in stock, total return swaps and/or call
options of Target Corporation. The Partnership attempts this by investing all of its assets in Pershing Square IV A, L.P. (the “Subsidiary Partnership”) and its wholly owned subsidiary, Pershing Square IV Trade-Co, L.P. (“PSIV TradeCo LP”). The Subsidiary Partnership is an exempted limited partnership formed under the limited liability partnership laws of the Cayman Islands on May 31, 2007 and commenced operations on June 1, 2007. PSIV TradeCo LP is a Delaware
limited partnership formed on January 13, 2009 and commenced operations on February 1, 2009. The Partnership, the Subsidiary Partnership and PSIV TradeCo LP (collectively, the “PSIV Partnerships”) share the same investment objective.
For the period from June 30, 2008 to January 31, 2009, the Partnership was a “master” fund in a “master-feeder” structure whereby Pershing Square International IV, Ltd. (the “Fund”) invested all of its assets in the Partnership. On January 31, 2009, the Partnership and the Fund were restructured whereby
the Partnership was no longer considered a “master” fund as the Fund withdrew its entire investment in the Partnership and subsequently subscribed its investment on February 1, 2009 as a limited partner into the Subsidiary Partnership.
On February 1, 2009, the Partnership withdrew a majority of its investment in the Subsidiary Partnership and re-invested its capital into PSIV TradeCo LP on February 1, 2009.
Effective May 1, 2009, the General Partner, as defined below, distributed all of the Subsidiary Partnership’s remaining assets to its limited partners. The General Partner liquidated all securities of the Subsidiary Partnership and the resulting gains/losses have been allocated to its limited partners. As of December 31,
2009, the Partnership does not hold an investment in the Subsidiary Partnership.
Pershing Square Holdings GP, LLC, a limited liability company organized under the laws of the state of Delaware and registered as a foreign company under the laws of the Cayman Islands, serves as the “General Partner” to the PSIV Partnerships. The General Partner is responsible for making all investment decisions on behalf of
the PSIV Partnerships and is solely responsible for the development and implementation of the PSIV Partnerships’ investment policy and strategy. William A. Ackman is the managing member of the General Partner and is primarily responsible for managing the PSIV Partnerships.
See attached consolidated financial statements of Pershing Square IV A, L.P. (In Liquidation)
7
Pershing Square IV, L.P. and Subsidiary
Notes to Consolidated Financial Statements (continued)
1. Organization (continued)
The General Partner delegates administrative functions relating to the management of the PSIV Partnerships to Pershing Square Capital Management, L.P. (“PSCM”), a limited partnership organized under the laws of the state of Delaware. William A. Ackman is the managing member of PS Management GP, LLC, the general partner of PSCM.
Pursuant to an Administration Agreement dated May 2007, Goldman Sachs (Cayman) Trust, Limited (the “Administrator”) has been appointed as the administrator to the PSIV Partnerships. The Administrator provides certain administrative and accounting services and receives customary fees, plus out of pocket expenses, based on the
nature and extent of services provided.
2. Significant Accounting Policies
Basis of Presentation
The consolidated financial statements of the Partnership have been prepared in accordance with accounting principles generally accepted in the United States. The following is a summary of the significant accounting and reporting policies used in preparing the consolidated financial statements.
Basis of Consolidation
The Partnership’s policy is to consolidate all subsidiaries that are wholly owned. The consolidated financial statements include the results of the Partnership and its subsidiary, PSIV TradeCo LP. Intercompany transactions have been eliminated in consolidation.
Investment Transactions and Related Investment Income
The Partnership records its securities transactions and the related revenue and expenses on a trade date basis. Generally, realized gains and losses from security transactions are calculated on a highest cost relief method. Dividends are recorded on the ex-dividend date, net of any applicable withholding taxes. Interest is recorded on the
accrual basis. The Partnership also records its proportionate share of the Subsidiary Partnership’s income, expenses and realized and unrealized gains and losses.
See attached consolidated financial statements of Pershing Square IV A, L.P. (In Liquidation)
8
Pershing Square IV, L.P. and Subsidiary
Notes to Consolidated Financial Statements (continued)
2. Significant Accounting Policies (continued)
Valuation of Investments and Investment in the Subsidiary Partnership (continued)
In general, the Partnership values investments at their last sales price on the date of determination. If no sales occurred on such date, such investments are valued at the mean of the last “bid” and “ask” price on the last business day such investments were traded. Investments for which no such market prices are
available are valued at fair value by the General Partner based upon counterparty and independent third-party prices. All unrealized gains and losses are reflected on the consolidated statement of operations.
The Partnership held an investment in the Subsidiary Partnership during the year ended December 31, 2009 and therefore attached to these consolidated financial statements are the audited consolidated financial statements of the Subsidiary Partnership, including significant accounting and reporting policies, which are an integral part of
these consolidated financial statements. As of December 31, 2009, the Partnership no longer held an investment in the Subsidiary Partnership as discussed in Note 1.
Fair Value of Financial Instruments
The fair value of the Partnership’s assets and liabilities, which qualify as financial instruments under ASC 825 (formerly, Statement of Financial Accounting Standards No. 107, “Disclosures About Fair Value of Financial Instruments”), approximates the carrying amounts presented in the consolidated statement of assets,
liabilities and partners’ capital.
Use of Estimates
The preparation of the consolidated financial statements in conformity with accounting principles generally accepted in the United States requires management to make estimates and assumptions that affect the amounts reported in the consolidated financial statements and accompanying notes. Actual results could differ from those estimates.
Taxation
No Federal, state or local income taxes have been provided on income or loss of the Partnership since the partners are individually liable for the taxes on their share of the Partnership’s income or loss. The only taxes payable by the Partnership on its income are withholding taxes applicable to certain investment income. As a result,
no income tax liability or expense has been recorded in the accompanying consolidated financial statements.
See attached consolidated financial statements of Pershing Square IV A, L.P. (In Liquidation)
9
Pershing Square IV, L.P. and Subsidiary
Notes to Consolidated Financial Statements (continued)
3. Fair Value Measurement
The Partnership measures fair value in accordance with ASC 820 (formerly, Financial Accounting Standards No. 157, “Fair Value Measurements”). ASC 820 establishes a framework for measuring fair value and requires additional disclosures about the use of fair value measurements. ASC 820 requires a categorization of assets and liabilities
stated at fair value based upon an assessment of the valuation inputs and techniques used by the Partnership. There are three levels of categorization under ASC 820 as follows:
|
|
Level 1 –
|
Inputs are unadjusted quoted prices in active markets at the measurement date. The assets and liabilities in this category will generally include equities listed in active markets, treasuries (“on the run”) and listed options.
|
|
|
Level 2 –
|
Inputs (other than quoted prices included in Level 1) are obtained directly or indirectly from observable market data at the measurement date. The assets and liabilities in this category will generally include OTC equity options, credit default swaps, total return swaps and certain other derivatives.
|
|
|
Level 3 –
|
Inputs reflect the Partnership’s best estimate of what market participants would use in pricing the assets and liabilities at the measurement date. The assets and liabilities in this category will generally include private investments and certain derivatives.
|
The Partnership’s assets and liabilities measured at fair value as of December 31, 2009 are categorized in the below table:
|
Fair Value Measurements at December 31, 2009
|
||||||||||||||||
|
Description
|
Level 1
|
Level 2
|
Level 3
|
Total
|
||||||||||||
|
Assets:
|
||||||||||||||||
|
Equity securities
|
$ | 61,081,152 | $ | − | $ | − | $ | 61,081,152 | ||||||||
|
Total Assets
|
$ | 61,081,152 | $ | − | $ | − | $ | 61,081,152 | ||||||||
See attached consolidated financial statements of Pershing Square IV A, L.P. (In Liquidation)
10
Pershing Square IV, L.P. and Subsidiary
Notes to Consolidated Financial Statements (continued)
|
4. Due from/to Broker
|
At December 31, 2009, due from/to broker include cash balances held at the Partnership’s clearing broker and amounts receivable for securities transactions that have not settled during the year ended December 31, 2009. Investment in securities are partially pledged to the clearing broker to the extent of the margin debt
balance.
|
5. Derivative Contracts and Financial Instruments with Off-Balance Sheet Risk
|
or Concentrations of Credit Risk
In the normal course of business, the Partnership enters into derivative contracts for investment purposes. Typically, derivative contracts serve as components of the Partnership’s investment strategy and are utilized primarily to structure the portfolio to economically match the investment objectives of the Partnership. These instruments
are subject to various risks similar to non-derivative instruments, including market, credit, liquidity, and operational risks. The Partnership manages these risks on an aggregate basis along with the risks associated with its investing activities as part of its overall risk management policies.
The Partnership’s derivative trading activities are primarily the purchase and sale of OTC equity options, credit default swaps and total return swaps. All derivatives are reported at fair value (as described in Note 2) in the consolidated statement of assets, liabilities and partners’ capital and changes in fair value are reflected
in the consolidated statement of operations.
Total return swaps represent agreements between two parties to make payments based upon the performance of certain underlying assets. The Partnership is obligated to pay, or entitled to receive as the case may be, the net difference in the value determined at the onset of the swap versus the value determined at the termination or reset
date of the swap. Therefore, the amounts required for the future satisfaction of the swaps may be greater or less than the amounts recorded on the consolidated statement of assets, liabilities and partners’ capital. The ultimate gain or loss depends upon the prices at which the underlying financial instruments of the swaps are valued on the settlement date. At December 31, 2009, the Partnership held no total return swaps.
See attached consolidated financial statements of Pershing Square IV A, L.P. (In Liquidation)
11
Pershing Square IV, L.P. and Subsidiary
Notes to Consolidated Financial Statements (continued)
|
5. Derivative Contracts and Financial Instruments with Off-Balance Sheet Risk
|
or Concentrations of Credit Risk (continued)
A credit default swap contract represents an agreement in which one party, the protection buyer, pays a fixed fee, the premium, in return for a payment by the other party, the protection seller, contingent upon a specified credit event relating to an underlying reference asset. While there is no credit event, the protection buyer pays the
protection seller the periodic premium. If a specified credit event occurs, there is an exchange of cash flows and/or securities designed so that the net payment to the protection buyer reflects the loss incurred by creditors of the reference asset in the event of its default. The nature of the credit event is established by the buyer and the seller at the inception of the transaction and such events include bankruptcy, insolvency and failure to meet payment obligations when due. At December 31, 2009, the Partnership
held no credit default swaps.
The Partnership clears all of its securities transactions through major U.S.-registered broker dealers, pursuant to broker agreements. At December 31, 2009, all investments and due from/to broker are positions with and amounts due from UBS Securities LLC. The Partnership had all of its counterparty concentration with this broker and its
affiliates.
The following table summarizes the gains or losses from derivative trading activities for the year ended December 31, 2009:
|
Derivatives Type
|
Net Gain/(Loss)
|
Location on Consolidated
|
|||
|
OTC equity options
|
$ | 1,760,467 |
Net realized and unrealized gain/loss from investments in securities
|
||
|
Credit default swaps
|
$ | (354,766 | ) |
Net realized and unrealized gain/loss on derivative contracts
|
|
6. Related Party Transactions
The Partnership is not charged a management fee nor performance allocation at the Partnership level. Management fees and performance allocation are charged indirectly through the Partnership’s investment in the Subsidiary Partnership. Effective January 1, 2009, the General Partner has decided to waive all future management fees and
any performance allocation for all partners.
See attached consolidated financial statements of Pershing Square IV A, L.P. (In Liquidation)
12
Pershing Square IV, L.P. and Subsidiary
Notes to Consolidated Financial Statements (continued)
6. Related Party Transactions (continued)
On January 31, 2009, Pershing Square, L.P. (“PSLP”), an affiliated investment fund managed by PSCM, withdrew its capital balance of $4,785,419 in the Partnership and subsequently contributed $4,785,419 to Pershing Square IV-I, L.P. (“PSIV-I LP”), an affiliated investment fund managed by PSCM, on February 1, 2009.
At December 31, 2009, PSLP no longer held a limited partner interest in the Partnership.
The General Partner also withdrew its capital balance of $98,689 from the Subsidiary Partnership as of January 31, 2009 and subsequently contributed $98,689 to the Partnership on February 1, 2009.
On March 1, 2009, the Partnership opened for new and additional capital contributions. Total contributions received on March 1, 2009 by the Partnership were $1,175,000 of which $850,000 were received from certain PSCM employees and advisory board members.
7. Guarantees
The Partnership enters into contracts that contain a variety of indemnifications. The Partnership’s maximum exposure under these arrangements is unknown. However, the Partnership has not had prior claims or losses pursuant to these contracts and expects the risk of loss to be remote.
8. Allocation of Net Income/(Loss)
In accordance with the Partnership Agreement (the “Agreement”), net income or loss is allocated as of the last business day of each Fiscal Period, as defined, to all partners in proportion to each partner’s capital account at the time of such allocation.
9. Partner’s Capital
In accordance with the Agreement, a limited partner commits capital until December 31, 2009 (the “Lock-Up Date”). The General Partner, in its sole discretion, may advance or extend the Lock-Up Date for up to one year beyond December 31, 2009 if the General Partner believes it is in the best interest of the Partnership to do
so.
See attached consolidated financial statements of Pershing Square IV A, L.P. (In Liquidation)
13
Pershing Square IV, L.P. and Subsidiary
Notes to Consolidated Financial Statements (continued)
9. Partner’s Capital (continued)
On February 8, 2009, the General Partner waived the lock-up and permitted investors to withdraw on February 28, 2009 from the Partnership. Any investor that elected not to withdraw on February 28, 2009 was committed until the Lock-Up Date. In addition, the General Partner also permitted investors in the Partnership to apply a high water
mark adjustment to their existing, or new, investments in any affiliated entities managed by PSCM to compensate for losses incurred through February 28, 2009 in the Partnership. Investors without an account with an affiliated entity may apply a high water mark adjustment to a new investment made before December 31, 2012.
As of December 31, 2009, the General Partner has not extended the Lock-Up Date of the Partnership and will allow withdrawals from the Partnership effective December 31, 2009. A limited partner will also be allowed to withdraw its capital from the Partnership on a quarterly basis thereafter.
10. Financial Highlights
The following represents the ratios to average limited partners’ capital and total return information for the year ended December 31, 2009:
|
Ratios to average limited partners’ capital:
|
||||
|
Expenses
|
1.26 | % | ||
|
Net investment loss
|
(0.62 | )% | ||
|
Total return
|
(8.69 | )% | ||
The above ratios and total return are calculated for all limited partners taken as a whole. Individual partner’s ratios and returns may vary from the above based on timing of capital transactions.
See attached consolidated financial statements of Pershing Square IV A, L.P. (In Liquidation)
14
|
Consolidated Financial Statements
Pershing Square IV A, L.P. (In Liquidation)
Year Ended December 31, 2009
(Unaudited)
|
Pershing Square IV A, L.P. (In Liquidation)
Consolidated Statement of Assets, Liabilities and Partners’ Capital
(Stated in United States Dollars)
December 31, 2009
(Unaudited)
|
Assets
|
||||
|
Total assets
|
$ | − | ||
|
Liabilities and partners’ capital
|
||||
|
Total liabilities and partners’ capital
|
$ | − | ||
The accompanying notes are an integral part of the consolidated financial statements.
2
Pershing Square IV A, L.P. (In Liquidation)
Consolidated Statement of Operations
(Stated in United States Dollars)
Year Ended December 31, 2009
(Unaudited)
|
Net realized and unrealized loss from investments
|
||||||||
|
Net realized loss from investments in securities
|
$ | (840,761,925 | ) | |||||
|
Net change in unrealized gain/loss from investments in securities
|
660,773,369 | |||||||
|
Net realized gain on derivative contracts
|
5,107,983 | |||||||
|
Net change in unrealized gain/loss on derivative contracts
|
(4,933,441 | ) | ||||||
|
Net loss from investments
|
$ | (179,814,014 | ) | |||||
|
Investment income
|
||||||||
|
Dividends
|
6,244 | |||||||
|
Interest
|
1,589 | |||||||
|
Total investment income
|
7,833 | |||||||
|
Subsidiary Partnership expenses
|
||||||||
|
Professional fees
|
365,829 | |||||||
|
Net investment loss
|
(357,996 | ) | ||||||
|
Net loss
|
$ | (180,172,010 | ) | |||||
The accompanying notes are an integral part of the consolidated financial statements.
3
Pershing Square IV A, L.P. (In Liquidation)
Consolidated Statement of Changes in Partners’ Capital
(Stated in United States Dollars)
Year Ended December 31, 2009
(Unaudited)
|
Total
|
Limited
Partners
|
General
Partner *
|
||||||||||
|
Partners’ capital at beginning of year
|
$ | 406,977,547 | $ | 406,793,023 | $ | 184,524 | ||||||
|
Capital contributions
|
123,795,028 | 123,795,028 | − | |||||||||
|
Capital withdrawals
|
(350,600,565 | ) | (350,489,978 | ) | (110,587 | ) | ||||||
|
Net loss
|
(180,172,010 | ) | (180,098,073 | ) | (73,937 | ) | ||||||
|
Partners’ capital at end of year
|
$ | − | $ | − | $ | − | ||||||
* As of January 31, 2009, the General Partner withdrew its investment in the Subsidiary Partnership and reinvested its investment into Pershing Square IV, L.P. and Pershing Square IV-I, L.P. on February 1, 2009 due to the restructuring of the Subsidiary Partnership as discussed further in Note 1.
The accompanying notes are an integral part of the consolidated financial statements.
4
Pershing Square IV A, L.P. (In Liquidation)
Consolidated Statement of Cash Flows
(Stated in United States Dollars)
Year Ended December 31, 2009
(Unaudited)
|
Cash flows from operating activities
|
||||
|
Net loss
|
$ | (180,172,010 | ) | |
|
Adjustments to reconcile net loss to net cash provided by operating activities:
|
||||
|
Net realized loss from investments in securities
|
840,761,925 | |||
|
Net change in unrealized gain/loss from investments in securities
|
(660,773,369 | ) | ||
|
Net change in unrealized gain/loss on derivative contracts
|
4,933,441 | |||
|
Proceeds from investments sold
|
209,256,516 | |||
|
Decrease in due from brokers
|
38,494,447 | |||
|
Decrease in interest and dividends receivable
|
5,674 | |||
|
Decrease in due to brokers
|
(32,389,275 | ) | ||
|
Decrease in accrued expenses and other liabilities
|
(811,812 | ) | ||
|
Net cash provided by operating activities
|
219,305,537 | |||
|
Cash flows from financing activities
|
||||
|
Capital contributions
|
123,795,028 | |||
|
Capital withdrawals
|
(350,600,565 | ) | ||
|
Net cash used in financing activities
|
(226,805,537 | ) | ||
|
Net change in cash and cash equivalents
|
(7,500,000 | ) | ||
|
Cash and cash equivalents at beginning of year
|
7,500,000 | |||
|
Cash and cash equivalents at end of year
|
$ | − | ||
The accompanying notes are an integral part of the consolidated financial statements.
5
Pershing Square IV A, L.P. (In Liquidation)
Notes to Consolidated Financial Statements
December 31, 2009
(Unaudited)
1. Organization
Pershing Square IV A, L.P. (In Liquidation) (the “Subsidiary Partnership”) is an exempted limited partnership formed under the limited liability partnership laws of the Cayman Islands on May 31, 2007 and commenced operations on June 1, 2007. The investment objective of the Subsidiary Partnership is to create significant capital
appreciation by investing in stock, total return swaps and call options of Target Corporation.
The Subsidiary Partnership acted as the master fund in a “master-feeder” structure whereby Pershing Square IV, L.P. (“PSIV LP”) and Pershing Square IV-I, L.P. (“PSIV-I LP”) invested all of their capital in the Subsidiary Partnership. PSIV LP and PSIV-I LP (collectively, the “Partnerships”)
were organized as limited partnerships under the laws of the state of Delaware on May 22, 2007 and June 27, 2008, respectively, and commenced operations on June 1, 2007 and June 30, 2008, respectively. The Partnerships were also “master” funds in a “master-feeder” structure whereby Pershing Square International IV, Ltd. (“PSIV Ltd”) invested all of its assets in PSIV LP and Pershing Square International IV-I, Ltd. (“PSIV-I Ltd”) invested all of its assets in PSIV-I
LP. PSIV Ltd and PSIV-I Ltd (collectively, the “Funds”) are exempted companies formed under the limited liability laws of the Cayman Islands on May 15, 2007 and May 23, 2008, respectively, and are registered under the Cayman Islands Mutual Funds Law.
On January 31, 2009, the Partnerships and the Funds were restructured so that the Partnerships were no longer considered “master” funds in a “master-feeder” structure. PSIV Ltd and PSIV-I Ltd redeemed their entire investment in PSIV LP and PSIV-I LP, respectively, on January 31, 2009 and subsequently subscribed their
entire investment on February 1, 2009 as limited partners into the Subsidiary Partnership. As of February 1, 2009, the Subsidiary Partnership was entirely owned by the Partnerships and the Funds.
Effective February 1, 2009, the Subsidiary Partnership no longer held a majority of the Partnerships’ and the Funds’ capital. The Partnerships and the Funds invested a majority of their capital into newly formed subsidiaries. These subsidiaries are Pershing Square IV Trade-Co, L.P. (“PSIV TradeCo LP”), Pershing Square
IV-I Trade-Co, L.P. (“PSIV-I TradeCo LP”), Pershing Square International IV Trade-Co, Ltd. (“PSIV TradeCo Ltd”) and Pershing Square International IV-I Trade-Co, Ltd. (“PSIV-I TradeCo Ltd”) (collectively, the “TradeCos”). PSIV TradeCo LP and PSIV-I TradeCo LP are Delaware limited partnerships formed on January 13, 2009 and commenced operations on February 1, 2009. PSIV TradeCo LP and PSIV-I TradeCo LP are wholly owned subsidiaries of PSIV LP and PS IV-I
LP, respectively. PSIV TradeCo Ltd and PSIV-I TradeCo Ltd were incorporated as exempted companies on January 8, 2009 under the laws of the Cayman Islands. PSIV TradeCo Ltd and PSIV-I TradeCo Ltd are wholly owned subsidiaries of PSIV Ltd and PSIV-I Ltd, respectively. The TradeCos may invest in stock, total return swaps and/or call options of Target Corporation.
6
Pershing Square IV A, L.P. (In Liquidation)
Notes to Consolidated Financial Statements (continued)
1. Organization (continued)
On May 1, 2009, the General Partner, as defined below, distributed all of the Subsidiary Partnership’s remaining assets to its limited partners, the Partnerships and the Funds. Accordingly, the General Partner liquidated all securities and the resulting gains/(losses) have been allocated to the Partnerships and the Funds. The Subsidiary
Partnership holds no assets as of December 31, 2009.
Pershing Square IV B, L.P. (the “PSIV B”) is a wholly owned subsidiary of the Subsidiary Partnership and was incorporated on July 17, 2007 under the laws of the state of Delaware. Since inception there has been no activity in PSIV B and PSIV B did not hold any assets on behalf of the Subsidiary Partnership at December 31, 2009.
Pershing Square Holdings GP, LLC, a limited liability company organized under the laws of the state of Delaware and registered as a foreign company under the laws of the Cayman Islands, serves as the “General Partner” to the Subsidiary Partnership and the Partnerships (collectively, the “PSIV Partnerships”). The
General Partner is responsible for making all investment decisions on behalf of the PSIV Partnerships and is solely responsible for the development and implementation of the PSIV Partnerships’ investment policy and strategy. William A. Ackman is the managing member of the General Partner and is primarily responsible for managing the PSIV Partnerships.
The General Partner delegates administrative functions relating to the management of the PSIV Partnerships to Pershing Square Capital Management, L.P. (“PSCM”), a limited partnership organized under the laws of the state of Delaware. William A. Ackman is the managing member of PS Management GP, LLC, the general partner of PSCM.
Pursuant to an Administration Agreement dated May 2007, Goldman Sachs (Cayman) Trust, Limited (the “Administrator”) has been appointed as the administrator to the Subsidiary Partnership, Partnerships and Funds. The Administrator provides certain administrative and accounting services and receives customary fees, plus out of
pocket expenses, based on the nature and extent of services provided.
2. Significant Accounting Policies
Basis of Presentation
The Subsidiary Partnership’s consolidated financial statements and the following significant accounting policies have been prepared in accordance with accounting principles generally accepted in the United States of America applied on a liquidation basis and are stated in United States dollars. The following is a summary of the significant
accounting and reporting policies used in preparing the consolidated financial statements.
7
Pershing Square IV A, L.P. (In Liquidation)
Notes to Consolidated Financial Statements (continued)
2. Significant Accounting Policies (continued)
Basis of Consolidation
The Subsidiary Partnership’s policy is to consolidate all subsidiaries that are wholly owned. The consolidated financial statements include the results of the Subsidiary Partnership and its subsidiary, PSIV B. Intercompany transactions have been eliminated in consolidation.
Investment Transactions and Related Investment Income
The Subsidiary Partnership records its securities transactions and the related revenue and expenses on a trade date basis. Generally, realized gains and losses from security transactions are calculated on a highest cost relief method. Dividends are recorded on the ex-dividend date, net of any applicable withholding taxes. Interest is recorded
on the accrual basis.
Valuation of Investments
In general, the Subsidiary Partnership values investments at their last sales price on the date of determination. If no sales occurred on such date, such investments are valued at the mean of the last “bid” and “ask” price on the last business day such investments were traded. Investments for which no such market
prices are available are valued at fair value by the General Partner based upon counterparty and independent third-party prices. All unrealized gains and losses are reflected on the consolidated statement of operations.
Fair Value of Financial Instruments
The fair value of the Partnership’s assets and liabilities, which qualify as financial instruments under ASC 825 (formerly, Statement of Financial Accounting Standards No. 107, “Disclosures About Fair Value of Financial Instruments”), approximates the carrying amounts presented in the consolidated statement of assets,
liabilities and partners’ capital.
Use of Estimates
The preparation of consolidated financial statements in conformity with accounting principles generally accepted in the United States of America requires management to make estimates and assumptions that affect the amounts reported in the consolidated financial statements and accompanying notes. Actual results could differ from those estimates.
Income Taxes
The Subsidiary Partnership is not subject to any income or capital gains taxes in the Cayman Islands since the partners are individually liable for the taxes on their share of the Subsidiary Partnership’s income or loss. The only taxes payable by the Subsidiary Partnership on its income are withholding taxes applicable
to dividend income. As a result, no income tax liability or expense has been recorded in the accompanying consolidated financial statements.
8
Pershing Square IV A, L.P. (In Liquidation)
Notes to Consolidated Financial Statements (continued)
3. Fair Value Measurement
The Partnership measures fair value in accordance with ASC 820 (formerly, Financial Accounting Standards No. 157, “Fair Value Measurements”). ASC 820 establishes a framework for measuring fair value and requires additional disclosures about the use of fair value measurements. ASC 820 requires a categorization of assets and liabilities
stated at fair value based upon an assessment of the valuation inputs and techniques used by the Partnership. There are three levels of categorization under ASC 820 as follows:
|
|
Level 1 –
|
Inputs are unadjusted quoted prices in active markets at the measurement date. The assets and liabilities in this category will generally include equities listed in active markets, treasuries (“on the run”) and listed options.
|
|
|
Level 2 –
|
Inputs (other than quoted prices included in Level 1) are obtained directly or indirectly from observable market data at the measurement date. The assets and liabilities in this category will generally include OTC equity options, credit default swaps, total return swaps and certain derivatives.
|
|
|
Level 3 –
|
Inputs reflect the Subsidiary Partnership’s best estimate of what market participants would use in pricing the assets and liabilities at the measurement date. The assets and liabilities in this category will generally include private investments and certain other derivatives.
|
The Subsidiary Partnership had no investments as of December 31, 2009 and did not hold any Level 3 securities for the year ended December 31, 2009.
|
4. Derivative Contracts and Financial Instruments with Off-Balance Sheet Risk
|
or Concentrations of Credit Risk
In the normal course of business, the Subsidiary Partnership enters into derivative contracts for investment purposes. Typically, derivative contracts serve as components of the Subsidiary Partnership’s investment strategy and are utilized primarily to structure the portfolio to economically match the investment objectives of the
Subsidiary Partnership. These instruments are subject to various risks similar to non-derivative instruments, including market, credit, liquidity, and operational risks. The Subsidiary Partnership manages these risks on an aggregate basis along with the risks associated with its investing activities as part of its overall risk management policies.
9
Pershing Square IV A, L.P. (In Liquidation)
Notes to Consolidated Financial Statements (continued)
|
4. Derivative Contracts and Financial Instruments with Off-Balance Sheet Risk
|
or Concentrations of Credit Risk (continued)
The Subsidiary Partnership’s derivative trading activities are primarily the purchase and sale of OTC equity options, credit default swaps and total return swaps. At December 31, 2009, the Subsidiary Partnership did not hold any derivative contracts.
Total return swaps represent agreements between two parties to make payments based upon the performance of certain underlying assets. The Subsidiary Partnership is obligated to pay, or entitled to receive as the case may be, the net difference in the value determined at the onset of the swap versus the value determined at the termination
or reset date of the swap. The ultimate gain or loss depends upon the prices at which the underlying financial instruments of the swaps are valued on the settlement date. At December 31, 2009, the Subsidiary Partnership did not hold any total return swaps.
A credit default swap contract represents an agreement in which one party, the protection buyer, pays a fixed fee, the premium, in return for a payment by the other party, the protection seller, contingent upon a specified credit event relating to an underlying reference asset. While there is no credit event, the protection buyer pays the
protection seller the periodic premium. If a specified credit event occurs, there is an exchange of cash flows and/or securities designed so that the net payment to the protection buyer reflects the loss incurred by creditors of the reference asset in the event of its default. The nature of the credit event is established by the buyer and the seller at the inception of the transaction and such events include bankruptcy, insolvency and failure to meet payment obligations when due. At December 31, 2009, the Subsidiary
Partnership did not hold any credit default swaps.
The Subsidiary Partnership clears all of its securities transactions through major U.S.-registered broker dealers, pursuant to broker agreements.
The following table summarizes the gains or losses from derivative trading activities for the year ended December 31, 2009:
|
Derivatives Type
|
Net Gain/(Loss)
|
Location on Consolidated
Statement of Operations
|
|||
|
OTC Options
|
$ | (173,476,794 | ) |
Net realized and unrealized gain/loss from investments in securities
|
|
|
Credit default swaps
|
$ | 174,542 |
Net realized and unrealized gain/loss from derivatives contracts
|
||
10
Pershing Square IV A, L.P. (In Liquidation)
Notes to Consolidated Financial Statements (continued)
5. Related Party Transactions
In accordance with the Partnership Agreement (the “Agreement”), PSCM provides management and administrative services to the Subsidiary Partnership. As compensation for such services, PSCM receives a quarterly management fee in advance equal to 0.0625% (0.25% on an annual basis) of the balance in the limited partners’ capital
account as of the last business day of the previous calendar quarter, taking into account contributions made on the first day of such calendar quarter. The General Partner may, in its sole discretion, elect to waive the management fee with respect to any limited partner. Effective January 1, 2009, the General Partner has decided to waive all future management fees for all partners.
On February 8, 2009, the General Partner decided to waive the lock-up date (see Note 8) and permitted investors to withdraw on February 28, 2009. The General Partner allowed investors in the Partnerships and the Funds to apply a high water mark adjustment to their existing, or new, investments with any affiliated entities managed by PSCM
to compensate for losses incurred in the Partnerships or in the Funds. Investors without an account with an affiliated entity may apply a high water mark adjustment to a new investment made before December 31, 2012.
6. Guarantees
The Subsidiary Partnership enters into contracts that contain a variety of indemnifications. The Subsidiary Partnership’s maximum exposure under these arrangements is unknown. However, the Subsidiary Partnership has not had prior claims or losses pursuant to these contracts and expects the risk of loss to be remote.
7. Allocation of Net Income/(Loss)
In accordance with the Agreement, net income or loss is allocated as of the last business day of each Fiscal Period, as defined, to all partners in proportion to each partner’s capital account at the time of such allocation.
At the end of each fiscal year or upon a limited partner’s full withdrawal, for each limited partner’s capital account that has been allocated net income, there shall be allocated to the capital accounts of the General Partner, 20% of the excess of the net income allocated to such limited partner’s capital account
above the loss carryforward (the “Performance Allocation”), if any, and the management fee with respect to the limited partner’s capital account. The General Partner in its sole discretion has reduced the Performance Allocation to 10% for those limited partners that made initial contributions of at least $100 million.
11
Pershing Square IV A, L.P. (In Liquidation)
Notes to Consolidated Financial Statements (continued)
7. Allocation of Net Income/(Loss) (continued)
The General Partner may, in its sole discretion, elect to waive or reduce the Performance Allocation with respect to any limited partner.
Effective January 1, 2009, the General Partner has waived any future Performance Allocation for all investors.
8. Partners’ Capital
In accordance with the Agreement, a limited partner commits capital until December 31, 2009 (the “Lock-Up Date”). The General Partner, in its sole discretion, may advance or extend the Lock-Up Date for up to one year beyond December 31, 2009 if the General Partner believes it is in the best interest of the Subsidiary Partnership
to do so.
On February 8, 2009, the General Partner waived the lock-up and permitted investors to withdraw on February 28, 2009 from the Partnerships and the Funds. Any investor that elected not to withdraw on February 28, 2009 will be committed until the extended Lock-Up Date.
As discussed in Note 1, on May 1, 2009, the General Partner decided to liquidate the Subsidiary Partnership and the remaining assets were distributed to its limited partners. As of December 31, 2009, there were no remaining partners in the Subsidiary Partnership.
9. Financial Highlights
The following represents the ratios to average limited partners’ capital and total return information for the year ended December 31, 2009.
|
Ratios to average limited partners’ capital:
|
||||
|
Expenses
|
0.32 | % | ||
|
Net investment loss
|
(0.32 | )% | ||
|
Total return
|
117.61 | % | ||
The above ratios and total return are calculated for all limited partners taken as a whole. Individual partner’s ratios and returns may vary from the above based on the timing of capital transactions.
12
|
Financial Statements
Pershing Square IV, L.P.
Year Ended December 31, 2008
With Report of Independent Auditors
|
Pershing Square IV, L.P.
Financial Statements
Year Ended December 31, 2008
Contents
|
Financial Statements
|
|
|
Report of Independent Auditors
|
1
|
|
Statement of Assets, Liabilities and Partners’ Capital
|
2
|
|
Statement of Operations
|
3
|
|
Statement of Changes in Partners’ Capital
|
4
|
|
Statement of Cash Flow
|
5
|
|
Notes to Financial Statements
|
6
|
|
Consolidated Financial Statements of Pershing Square IV A, L.P.
|
Report of Independent Auditors
To the General Partner and Limited Partners of
Pershing Square IV, L.P.
We have audited the accompanying statement of assets, liabilities and partners’ capital of Pershing Square IV, L.P. (the “Partnership”) as of December 31, 2008, and the related statements of operations, changes in partners’ capital, and cash flows for the year then ended. These financial statements are the responsibility
of the Partnership’s management. Our responsibility is to express an opinion on these financial statements based on our audit.
We conducted our audit in accordance with auditing standards generally accepted in the United States. Those standards require that we plan and perform the audit to obtain reasonable assurance about whether the financial statements are free of material misstatement. We were not engaged to perform an audit of the Partnership’s internal
control over financial reporting. Our audit included consideration of internal control over financial reporting as a basis for designing audit procedures that are appropriate in the circumstances, but not for the purpose of expressing an opinion on the effectiveness of the Partnership’s internal control over financial reporting. Accordingly, we express no such opinion. An audit also includes examining, on a test basis, evidence supporting the amounts and disclosures in the financial statements, assessing
the accounting principles used and significant estimates made by management, and evaluating the overall financial statement presentation. We believe that our audit provides a reasonable basis for our opinion.
In our opinion, the financial statements referred to above present fairly, in all material respects, the financial position of Pershing Square IV, L.P. as of December 31, 2008, and the results of its operations, changes in its partners’ capital and its cash flows for the year then ended in conformity with accounting principles generally
accepted in the United States.
/s/ Ernst & Young LLP
March 27, 2009
1
Pershing Square IV, L.P.
Statement of Assets, Liabilities and Partners’ Capital
December 31, 2008
|
Assets
|
||||
|
Investment in Pershing Square IV A, L.P.
|
$ | 373,490,155 | ||
|
Total assets
|
$ | 373,490,155 | ||
|
Partners’ capital
|
||||
|
Partners’ capital
|
$ | 373,490,155 | ||
|
Total partners’ capital
|
$ | 373,490,155 | ||
|
|
The accompanying notes and attached consolidated financial statements of Pershing Square IV A, L.P. are an integral part of the financial statements.
|
2
Pershing Square IV, L.P.
Statement of Operations
Year Ended December 31, 2008
|
Net realized and unrealized losses allocated from
investment in Pershing Square IV A, L.P.
|
||||||||
|
Net realized loss from investments in securities
|
$ | (587,544,670 | ) | |||||
|
Net change in unrealized loss from investments in securities
|
66,417,787 | |||||||
|
Net realized loss on derivative contracts
|
(257,867,878 | ) | ||||||
|
Net change in unrealized loss on derivative contracts
|
(971,357 | ) | ||||||
|
Net realized and unrealized loss allocated from investment in Pershing Square IV A, L.P.
|
$ | (779,966,118 | ) | |||||
|
Net investment loss allocated from investment in
Pershing Square IV A, L.P.
|
||||||||
|
Investment income
|
||||||||
|
Dividends (net of withholding $303,349)
|
2,762,841 | |||||||
|
Interest
|
2,097,657 | |||||||
|
Total expenses
|
(7,078,899 | ) | ||||||
|
Net investment loss allocated from investment in Pershing Square IV A, L.P.
|
(2,218,401 | ) | ||||||
|
Partnership investment income
|
||||||||
|
Reimbursement of expenses
|
64,831 | |||||||
|
Net investment loss
|
(2,153,570 | ) | ||||||
|
Net loss
|
$ | (782,119,688 | ) | |||||
|
|
The accompanying notes and attached consolidated financial statements of Pershing Square IV A, L.P. are an integral part of the financial statements.
|
3
Pershing Square IV, L.P.
Statement of Changes in Partners’ Capital
Year Ended December 31, 2008
|
Partners’ capital at beginning of year
|
$ | 1,127,609,843 | ||
|
Limited partners capital contributions
|
28,000,000 | |||
|
Net loss
|
(782,119,688 | ) | ||
|
Partners’ capital at end of year
|
$ | 373,490,155 |
|
|
The accompanying notes and attached consolidated financial statements of Pershing Square IV A, L.P. are an integral part of the financial statements.
|
4
Pershing Square IV, L.P.
Statement of Cash Flows
Year Ended December 31, 2008
|
Cash flows from operating activities
|
||||
|
Net loss
|
$ | (782,119,688 | ) | |
|
Adjustments to reconcile net loss to net cash used in operating activities:
|
||||
|
Decrease in investment in Pershing Square IV A, L.P.
|
754,184,519 | |||
|
Decrease in accrued expenses
|
(44,961 | ) | ||
|
Decrease in withholding tax payable
|
(19,870 | ) | ||
|
Net cash used in operating activities
|
(28,000,000 | ) | ||
|
Cash flows from financing activities
|
||||
|
Capital contributions
|
28,000,000 | |||
|
Net change in cash and cash equivalents
|
− | |||
|
Cash and cash equivalents at beginning of year
|
− | |||
|
Cash and cash equivalents at end of year
|
$ | − | ||
|
|
The accompanying notes and attached consolidated financial statements of Pershing Square IV A, L.P. are an integral part of the financial statements
|
5
Pershing Square IV, L.P.
Notes to Financial Statements
December 31, 2008
1. Organization
Pershing Square IV, L.P. (the “Partnership”) was organized as a limited partnership under the laws of the state of Delaware on May 22, 2007 and commenced operations on June 1, 2007. The objective of the Partnership is to invest all of its assets in Pershing Square IV A, L.P. (the “Subsidiary Partnership”).
The Subsidiary Partnership is an exempted limited partnership formed under the limited liability partnership laws of the Cayman Islands on May 31, 2007 and commenced operations on June 1, 2007. The investment objective of the Partnership and the Subsidiary Partnership (collectively, the “PSIV Partnerships”) is to create significant capital appreciation by investing in stock, total return swaps and call options of Target Corporation.
The Partnership is a “master” fund in a “master-feeder” structure whereby Pershing Square International IV, Ltd. (the “Fund”) invests all of its assets in the Partnership. The Partnership is also a “feeder” fund in a “master-feeder” structure as the Partnership invests all of its
assets in the Subsidiary Partnership.
Pershing Square Holdings GP, LLC, a limited liability company organized under the laws of the state of Delaware and registered as a foreign company under the laws of the Cayman Islands, serves as the “General Partner” to the PSIV Partnerships. The General Partner is responsible for making all investment decisions
on behalf of the PSIV Partnerships and is solely responsible for the development and implementation of the PSIV Partnerships’ investment policy and strategy. William A. Ackman is the managing member of the General Partner and is primarily responsible for managing the PSIV Partnerships.
The General Partner delegates administrative functions relating to the management of the PSIV Partnerships to Pershing Square Capital Management, L.P. (“PSCM”), a limited partnership organized under the laws of the state of Delaware. William A. Ackman is the managing member of PS Management GP, LLC, the general partner of PSCM.
Pursuant to an Administration Agreement dated May 2007, Goldman Sachs (Cayman) Trust, Limited (the “Administrator”) has been appointed administrator to the PSIV Partnerships. The Administrator provides certain administrative and accounting services and receives customary fees, plus out of pocket expenses, based on the nature
and extent of services provided.
6
Pershing Square IV, L.P.
Notes to Financial Statements (continued)
2. Significant Accounting Policies
Basis of Presentation
The financial statements of the Partnership have been prepared in accordance with accounting principles generally accepted in the United States. The following is a summary of the significant accounting and reporting policies used in preparing the financial statements.
Valuation of Investment in the Subsidiary Partnership
The Partnership’s investment in the Subsidiary Partnership is valued at fair value, which represents the Partnership’s proportionate interest in the partners’ capital of the Subsidiary Partnership at December 31, 2008. The limited partners’ interests of the Subsidiary Partnership are entirely owned by the Partnership
and Pershing Square IV-I, L.P. (“PSIV-I”), an affiliated entity managed by PSCM. The performance of the Partnership is directly affected by the performance of the Subsidiary Partnership. Attached to these financial statements are the audited consolidated financial statements of the Subsidiary Partnership, including the consolidated condensed schedule of investments and significant accounting and reporting policies, which are an integral part of these financial statements. Valuation of the investment
held by the Partnership is discussed in the notes of the Subsidiary Partnership’s financial statements. As of December 31, 2008, the Partnership has approximately 91.77% ownership interest in the Subsidiary Partnership.
Fair Value of Financial Instruments
The fair value of the Partnership’s assets and liabilities, which qualify as financial instruments under Statement of Financial Accounting Standards No. 107, “Disclosures About Fair Value of Financial Instruments,” approximates the carrying amounts presented in the statement of assets, liabilities and partners’ capital.
Investment Transactions and Related Investment Income
The Partnership records its proportionate share of the Subsidiary Partnership’s income, expenses and realized and unrealized gains and losses. The Partnership accounts for its own income and expenses on an accrual basis.
Use of Estimates
The preparation of the financial statements in conformity with accounting principles generally accepted in the United States requires management to make estimates and assumptions that affect the amounts reported in the financial statements and accompanying notes. Actual results could differ from those estimates.
7
Pershing Square IV, L.P.
Notes to Financial Statements (continued)
2. Significant Accounting Policies (continued)
Taxation
No Federal, state or local income taxes have been provided on income or loss of the Partnership since the partners are individually liable for the taxes on their share of the Partnership’s income or loss. The only taxes payable by the Partnership on its income are withholding taxes applicable to certain investment income. As a result,
no income tax liability or expense has been recorded in the accompanying financial statements.
3. Guarantees
The Partnership enters into contracts that contain a variety of indemnifications. The Partnership’s maximum exposure under these arrangements is unknown. However, the Partnership has not had prior claims or losses pursuant to these contracts and expects the risk of loss to be remote.
4. Related Party Transactions
The Partnership is not charged a management fee nor performance allocation at the Partnership level. Management fees and performance allocation are charged indirectly through the Partnership’s investment in the Subsidiary Partnership.
During the year ended December 31, 2008, Pershing Square, L.P. (“PSLP”), an affiliated investment fund managed by PSCM, had an investment in the Partnership. PSLP was not charged a management fee nor performance allocation by PSCM in relation to its investment in the Partnership and indirectly through its investment in the Subsidiary
Partnership. At December 31, 2008, PSLP owned 2.14% of the total partners’ capital of the Partnership.
On June 30, 2008, the Fund and the Partnership were re-opened to allow an additional contribution in the Fund of $28,000,000 made by Pershing Square International Ltd., an affiliated fund managed by PSCM.
5. Allocation of Net Income/(Loss)
In accordance with the Partnership Agreement (the “Agreement”), net income or loss is allocated as of the last business day of each Fiscal Period, as defined, to all partners in proportion to each partner’s capital account at the time of such allocation.
8
Pershing Square IV, L.P.
Notes to Financial Statements (continued)
6. Partner’s Capital
In accordance with the Agreement, a limited partner commits capital until December 31, 2009 (the “Lock-Up Date”). The General Partner, in its sole discretion, may advance or extend the Lock-Up Date for up to one year beyond December 31, 2009 if the General Partner believes it is in the best interest of the Partnership to do
so. The General Partner has extended the Lock-Up Date for up to one year beyond December 31, 2009 of the Partnership and the Subsidiary Partnership.
7. Financial Highlights
The following represents the ratios to average limited partners’ capital and total return information for the year ended December 31, 2008:
|
Ratios to average limited partners’ capital:
|
||||
|
Expenses
|
0.73 | % | ||
|
Net investment loss
|
(0.22 | )% | ||
|
Total return
|
(67.91 | )% | ||
The above ratios and total return are calculated for all limited partners taken as a whole. Individual partner’s ratios and returns may vary from the above based on different management fee and performance allocation arrangements and timing of capital transactions.
8. Subsequent Events
Effective January 1, 2009, the General Partner elected to waive all future management fees and the performance allocation for all investors in the Partnership. During the period from January 1, 2009 to March 27, 2009, performance for the Partnership was (41%).
On January 31, 2009, the Fund withdrew its entire investment in the Partnership and subsequently subscribed its entire investment into the Subsidiary Partnership. Pershing Square IV Trade-Co, L.P. (“PSIV TradeCo LP”), a Delaware Limited Partnership, was formed on January 13, 2009. PSIV TradeCo LP is a wholly
owned subsidiary of the Partnership. PSIV TradeCo LP, may invest in stock, total return swaps and/or call options of Target Corporation.
9
Pershing Square IV, L.P.
Notes to Financial Statements (continued)
8. Subsequent Events (continued)
On February 8, 2009, the General Partner decided to waive the lock-up and permitted investors to withdraw on February 28, 2009 from the Partnership. Any investor that elected not to withdraw on February 28, 2009 will be committed until the Lock-Up Date. Withdrawals on February 28, 2009 for the Partnership totaled approximately
$51,490,000. In addition, the General Partner will also permit investors in the Partnership to apply a highwater mark adjustment to their existing, or new, investments in any affiliated entities managed by PSCM to compensate for losses incurred in the Partnership.
On March 1, 2009, the PSIV Partnerships, the Fund, PSIV-I and Pershing Square International IV-I, Ltd., an affiliated entity managed by PSCM, (collectively the “PSIV entities”), opened for new and additional capital contributions. Total contributions received on March 1, 2009 by the PSIV entities were $68,997,000. Contributions
from William A. Ackman, affiliated entities managed by PSCM, certain employees and advisory board members represented $67,672,000 of the total contributions received. Total contributions received on March 1, 2009 by the Partnership were $1,175,000. Contributions from certain employees and advisory board members represented $850,000 of the total contributions received by the Partnership.
10
|
Consolidated Financial Statements
Pershing Square IV A, L.P.
Year Ended December 31, 2008
With Report of Independent Auditors
|
1
Pershing Square IV A, L.P.
Consolidated Financial Statements
Year Ended December 31, 2008
Contents
|
Consolidated Financial Statements
|
|
|
Report of Independent Auditors
|
1
|
|
Consolidated Statement of Assets, Liabilities and Partners’ Capital
|
2
|
|
Consolidated Condensed Schedule of Investments
|
3
|
|
Consolidated Statement of Operations
|
4
|
|
Consolidated Statement of Changes in Partners’ Capital
|
5
|
|
Consolidated Statement of Cash Flows
|
6
|
|
Notes to Consolidated Financial Statements
|
7
|
2
Report of Independent Auditors
To the General Partner and Limited Partners of
Pershing Square IV A, L.P.
We have audited the accompanying consolidated statement of assets, liabilities and partners’ capital of Pershing Square IVA, L.P. (the “Subsidiary Partnership”), including the consolidated condensed schedule of investments, as of December 31, 2008, and the related consolidated statements of operations, changes in partners’
capital, and cash flows for the year then ended. These financial statements are the responsibility of the Subsidiary Partnership’s management. Our responsibility is to express an opinion on these financial statements based on our audit.
We conducted our audit in accordance with auditing standards generally accepted in the United States. Those standards require that we plan and perform the audit to obtain reasonable assurance about whether the financial statements are free of material misstatement. We were not engaged to perform an audit of the Subsidiary Partnership’s
internal control over financial reporting. Our audit included consideration of internal control over financial reporting as a basis for designing audit procedures that are appropriate in the circumstances, but not for the purpose of expressing an opinion on the effectiveness of the Subsidiary Partnership’s internal control over financial reporting. Accordingly, we express no such opinion. An audit also includes examining, on a test basis, evidence supporting the amounts and disclosures in the financial
statements, assessing the accounting principles used and significant estimates made by management, and evaluating the overall financial statement presentation. We believe that our audit provides a reasonable basis for our opinion.
In our opinion, the financial statements referred to above present fairly, in all material respects, the consolidated financial position of Pershing Square IV A, L.P. as of December 31, 2008, and the consolidated results of their operations, changes in their partners’ capital and their cash flows for the year then ended in conformity
with accounting principles generally accepted in the United States.
/s/ Ernst & Young
March 27, 2009
3
Pershing Square IV A, L.P.
Consolidated Statement of Assets, Liabilities and Partners’ Capital
(Stated in United States Dollars)
December 31, 2008
|
Assets
|
||||
|
Cash and cash equivalents
|
$ | 7,500,000 | ||
|
Due from brokers
|
38,494,447 | |||
|
Investments in securities, at fair value (cost $1,050,018,441)
|
389,245,072 | |||
|
Net unrealized gain on swap contracts
|
5,068,275 | |||
|
Dividend receivable
|
4,778 | |||
|
Interest receivable
|
896 | |||
|
Total assets
|
$ | 440,313,468 | ||
|
Liabilities and partners’ capital
|
||||
|
Due to broker
|
$ | 32,389,275 | ||
|
Net unrealized loss on swap contracts
|
134,834 | |||
|
Accrued expenses and other liabilities
|
811,812 | |||
|
Total liabilities
|
33,335,921 | |||
|
Partners’ capital
|
406,977,547 | |||
|
Total liabilities and partners’ capital
|
$ | 440,313,468 | ||
The accompanying notes are an integral part of the consolidated financial statements.
4
Pershing Square IV A, L.P.
Consolidated Condensed Schedule of Investments
(Stated in United States Dollars)
December 31, 2008
|
Shares /
Contracts
|
Description/Name
|
Fair Value
|
Percentage
of Partners’ Capital
|
||||||
|
Investments in Securities
|
|||||||||
|
Equity Securities
|
|||||||||
|
United States:
|
|||||||||
|
Retail
|
|||||||||
|
2,601,875
|
Target Corp.
|
$ | 89,842,744 | 22.07 | % | ||||
|
Total Equity Securities (cost $80,646,000)
|
89,842,744 | 22.07 | |||||||
|
Equity Option Contracts
|
|||||||||
|
United States:
|
|||||||||
|
Retail
|
|||||||||
|
58,925,962
|
Target Corp., Calls, Strike Prices $40.00 - $51.04, 04/02/09 – 03/19/10
|
299,402,328 | 73.57 | ||||||
|
Total Equity Option Contracts
(cost $969,372,441)
|
299,402,328 | 73.57 | |||||||
|
Total Investments in Securities
(cost $1,050,018,441)
|
$ | 389,245,072 | 95.64 | % | |||||
|
Derivative Contracts
|
|||||||||
|
Credit Default Swaps, buy protection
|
|||||||||
|
United States:
|
|||||||||
|
Banking
|
$ | (134,834 | ) | (0.03 | )% | ||||
|
Total Return Swaps, long exposure
|
|||||||||
|
United States:
|
|||||||||
|
Banking
|
5,068,275 | 1.24 | |||||||
|
Total Derivative Contracts
|
$ | 4,933,441 | 1.21 | % | |||||
The accompanying notes are an integral part of the consolidated financial statements.
5
Pershing Square IV A, L.P.
Consolidated Statement of Operations
(Stated in United States Dollars)
Year Ended December 31, 2008
|
Net realized and unrealized loss from investments
|
||||||||
|
Net realized loss from investments in securities
|
$ | (613,261,514 | ) | |||||
|
Net change in unrealized loss from investments in securities
|
61,609,793 | |||||||
|
Net realized loss on derivative contracts
|
(280,816,758 | ) | ||||||
|
Net change in unrealized loss on derivative contracts
|
5,451,528 | |||||||
|
Net loss from investments
|
$ | (827,016,951 | ) | |||||
|
Investment income
|
||||||||
|
Dividends (net of withholding taxes of $303,349)
|
2,865,077 | |||||||
|
Interest
|
2,165,567 | |||||||
|
Total investment income
|
5,030,644 | |||||||
|
Partnership expenses
|
||||||||
|
Management fee
|
2,299,475 | |||||||
|
Professional fees
|
4,899,706 | |||||||
|
Interest
|
267,389 | |||||||
|
Withholding tax
|
67,505 | |||||||
|
Total expenses
|
7,534,075 | |||||||
|
Net investment loss
|
(2,503,431 | ) | ||||||
|
Net loss
|
$ | (829,520,382 | ) | |||||
The accompanying notes are an integral part of the consolidated financial statements.
6
Pershing Square IV A, L.P.
Consolidated Statement of Changes in Partners’ Capital
(Stated in United States Dollars)
Year Ended December 31, 2008
|
Total
|
Limited
Partners
|
General
Partner
|
||||||||||
|
Partners’ capital at beginning of year
|
$ | 1,128,247,929 | $ | 1,127,674,674 | $ | 573,255 | ||||||
|
Capital contributions
|
108,250,000 | 108,250,000 | * | − | ||||||||
|
Net loss
|
(829,520,382 | ) | (829,131,651 | ) | (388,731 | ) | ||||||
|
Partners’ capital at end of year
|
$ | 406,977,547 | $ | 406,793,023 | $ | 184,524 | ||||||
|
|
* William A. Ackman contributed $5,000,000 as a limited partner through his investment in Pershing Square International IV-I Ltd.
|
The accompanying notes are an integral part of the consolidated financial statements.
7
Pershing Square IV A, L.P.
Consolidated Statement of Cash Flows
(Stated in United States Dollars)
Year Ended December 31, 2008
|
Cash flows from operating activities
|
||||
|
Net loss
|
$ | (829,520,382 | ) | |
|
Adjustments to reconcile net loss to net cash used in operating activities:
|
||||
|
Net realized loss from investments in securities
|
613,261,514 | |||
|
Net change in unrealized loss from investments in securities
|
(61,609,793 | ) | ||
|
Net change in unrealized loss on derivative contracts
|
(5,451,528 | ) | ||
|
Purchases of investments
|
(528,548,589 | ) | ||
|
Proceeds from investments sold
|
646,993,967 | |||
|
Increase in due from/to brokers
|
(5,773,222 | ) | ||
|
Increase in dividend receivable
|
(4,778 | ) | ||
|
Decrease in interest receivable
|
629,581 | |||
|
Increase in accrued expenses and other liabilities
|
568,132 | |||
|
Net cash used in operating activities
|
(169,455,098 | ) | ||
|
Cash flows from financing activities
|
||||
|
Capital contributions
|
108,250,000 | |||
|
Net change in cash and cash equivalents
|
(61,205,098 | ) | ||
|
Cash and cash equivalents at beginning of year
|
68,705,098 | |||
|
Cash and cash equivalents at end of year
|
$ | 7,500,000 | ||
|
Supplemental disclosure of cash flow information
|
||||
|
Cash paid during the year for interest
|
$ | 267,389 | ||
The accompanying notes are an integral part of the consolidated financial statements.
8
Pershing Square IV A, L.P.
Notes to Consolidated Financial Statements
December 31, 2008
1. Organization
Pershing Square IV A, L.P. (the “Subsidiary Partnership”) is an exempted limited partnership formed under the limited liability partnership laws of the Cayman Islands on May 31, 2007 and commenced operations on June 1, 2007. The investment objective of the Subsidiary Partnership is to create significant capital appreciation
by investing in stock, total return swaps and call options of Target Corporation.
The Subsidiary Partnership acts as the master fund in a “master-feeder” structure whereby Pershing Square IV, L.P. (“PSIV LP”) and Pershing Square IV-I, L.P. (“PSIV-I LP”) invest all of their capital in the Subsidiary Partnership. PSIV LP and PSIV-I LP (collectively, the “Partnerships”) were
organized as limited partnerships under the laws of the state of Delaware on May 22, 2007 and June 27, 2008, respectively, and commenced operations on June 1, 2007 and June 30, 2008, respectively. The Partnerships are also “master” funds in a “master-feeder” structure whereby Pershing Square International IV, Ltd. (“PSIV Ltd”) invests all of its assets in PSIV LP and Pershing Square International IV-I, Ltd (“PSIV-I Ltd”) invests all of its assets in PSIV-I LP. PSIV
Ltd and PSIV-I Ltd (collectively, the “Funds”) are exempted companies formed under the limited liability laws of the Cayman Islands on May 15, 2007 and May 23, 2008, respectively, and are registered under the Cayman Islands Mutual Funds Law.
Pershing Square IV B, L.P. (the “PSIV B”) is a wholly owned subsidiary of the Subsidiary Partnership and was incorporated on July 17, 2007 under the laws of the state of Delaware. Since inception there has been no activity in PSIV B and PSIV B did not hold any assets on behalf of the Subsidiary Partnership at December 31, 2008.
Pershing Square Holdings GP, LLC, a limited liability company organized under the laws of the state of Delaware and registered as a foreign company under the laws of the Cayman Islands, serves as the “General Partner” to the Subsidiary Partnership and the Partnerships (collectively, the “PSIV Partnerships”). The
General Partner is responsible for making all investment decisions on behalf of the PSIV Partnerships and is solely responsible for the development and implementation of the PSIV Partnerships’ investment policy and strategy. William A. Ackman is the managing member of the General Partner and is primarily responsible for managing the PSIV Partnerships.
The General Partner delegates administrative functions relating to the management of the PSIV Partnerships to Pershing Square Capital Management, L.P. (“PSCM”), a limited partnership organized under the laws of the state of Delaware. William A. Ackman is the managing member of PS Management GP, LLC, the general partner of PSCM.
9
Pershing Square IV A, L.P.
Notes to Consolidated Financial Statements (continued)
1. Organization (continued)
Pursuant to an Administration Agreement dated May 2007, Goldman Sachs (Cayman) Trust, Limited (the “Administrator”) has been appointed administrator to the PSIV Partnerships and Funds. The Administrator provides certain administrative and accounting services and receives customary fees, plus out of pocket expenses, based on
the nature and extent of services provided.
2. Significant Accounting Policies
Basis of Presentation
The Subsidiary Partnership’s consolidated financial statements and the following significant accounting policies have been prepared in accordance with accounting principles generally accepted in the United States of America and are stated in United States dollars. The following is a summary of the significant accounting and reporting
policies used in preparing the consolidated financial statements.
Basis of Consolidation
The Subsidiary Partnership’s policy is to consolidate all subsidiaries that are wholly owned. The consolidated financial statements include the results of the Subsidiary Partnership and its subsidiary, PSIV B. Intercompany transactions have been eliminated on consolidation.
Investment Transactions and Related Investment Income
The Subsidiary Partnership records its securities transactions and the related revenue and expenses on a trade date basis. Generally, realized gains and losses from security transactions are calculated on a highest cost relief method. Dividends are recorded on the ex-dividend date, net of any applicable foreign withholding taxes. Interest
is recorded on the accrual basis.
Valuation of Investments
In general, the Subsidiary Partnership values investments at their last sales price on the date of determination. If no sales occurred on such date, such investments are valued at the mean of the last “bid” and “ask” price on the last business day such investments were traded. Investments for which no such market
prices are available are valued at fair value by the General Partner based upon counterparty and independent third party prices. All unrealized gains and losses are reflected on the consolidated statement of operations.
10
Pershing Square IV A, L.P.
Notes to Consolidated Financial Statements (continued)
2. Significant Accounting Policies (continued)
Cash and Cash Equivalents
The Subsidiary Partnership considers all highly liquid financial instruments with a maturity of three months or less to be cash equivalents. As of December 31, 2008, cash and cash equivalents consist of a money market fund invested in U.S. Treasury securities and are held with an affiliate of the Administrator.
Fair Value of Financial Instruments
The fair value of the Subsidiary Partnership’s assets and liabilities which qualify as financial instruments under Statement of Financial Accounting Standards No. 107, “Disclosures About Fair Value of Financial Instruments,” approximates the carrying amounts presented in the consolidated statement of assets, liabilities
and partners’ capital.
Use of Estimates
The preparation of consolidated financial statements in conformity with accounting principles generally accepted in the United States of America requires management to make estimates and assumptions that affect the amounts reported in the consolidated financial statements and accompanying notes. Actual results could differ from those estimates.
Income Taxes
The Subsidiary Partnership is not subject to any income or capital gains taxes in the Cayman Islands since the partners are individually liable for the taxes on their share of the Subsidiary Partnership’s income or loss. The only taxes payable by the Subsidiary Partnership on its income are withholding taxes applicable
to dividend income. As a result, no income tax liability or expense has been recorded in the accompanying consolidated financial statements.
11
Pershing Square IV A, L.P.
Notes to Consolidated Financial Statements (continued)
2. Significant Accounting Policies (continued)
New Accounting Pronouncements
On July 13, 2006, the Financial Accounting Standards Board (“FASB”) released FASB Interpretation No. 48 “Accounting for Uncertainty in Income Taxes” (FIN 48). FIN 48 provides guidance for how uncertain tax positions should be recognized, measured, presented and disclosed in the consolidated financial statements.
FIN 48 requires the evaluation of tax positions taken or expected to be taken in the course of preparing the Subsidiary Partnership’s tax returns to determine whether the tax positions are “more-likely-than-not” of being sustained by the applicable tax authority. Tax positions not deemed to meet the more-likely-than-not threshold would be recorded as a tax benefit or expense in the current year. Adoption of FIN 48 was deferred to fiscal years beginning after December 15, 2008 and is to be applied
to all open tax years as of the effective date. At this time, the Subsidiary Partnership is evaluating the implications of FIN 48 and its impact on the consolidated financial statements, if any, has not yet been determined. The Subsidiary Partnership elected to defer adoption of FIN 48, allowable under FASB Staff Position (“FSP”) FIN 48-3, and will adopt for the fiscal year ending December 31, 2009, as required.
In March 2008, the FASB released Statement No. 161, “Disclosures about Derivative Instruments and Hedging Activities - an amendment of FASB Statement No. 133” (“FAS 161”). FAS 161 requires enhanced disclosure about an entity’s derivative and hedging activities, thereby improving the transparency of financial
reporting. FAS 161 is effective for financial statements issued for fiscal years and interim periods beginning after November 15, 2008. The Subsidiary Partnership believes the implications of FAS 161 would have no impact to partners’ capital.
3. Fair Value Measurement
In September 2006, the Financial Accounting Standards Board (“FASB”) issued Statement on Financial Accounting Standards No. 157, “Fair Value Measurements” (“FAS 157”). This standard clarifies the definition of fair value for financial reporting, establishes a framework for measuring fair value and requires
additional disclosures about the use of fair value measurements. FAS 157 is effective for financial statements issued for fiscal years beginning after November 15, 2007 and interim periods within those fiscal years. FAS 157 requires a categorization of assets and liabilities stated at fair value based upon an assessment of the valuation inputs and techniques used by the Subsidiary Partnership. There are three levels of categorization under FAS 157 as follows:
12
Pershing Square IV A, L.P.
Notes to Consolidated Financial Statements (continued)
3. Fair Value Measurement (continued)
|
|
Level 1 –
|
Inputs are unadjusted quoted prices in active markets at the measurement date. The assets and liabilities in this category will generally include equities listed in active markets, treasuries (“on the run”) and listed options.
|
|
|
Level 2 –
|
Inputs (other than quoted prices included in Level 1) are obtained directly or indirectly from observable market data at the measurement date. The assets and liabilities in this category will generally include OTC equity options, credit default swaps, total return swaps and certain derivatives.
|
|
|
Level 3 –
|
Inputs reflect the Subsidiary Partnership’s best estimate of what market participants would use in pricing the assets and liabilities at the measurement date. The assets and liabilities in this category will generally include private investments and certain derivatives.
|
The Subsidiary Partnership’s assets and liabilities measured at fair value as of December 31, 2008 are categorized in the below table:
|
Fair Value Measurements at December 31, 2008
|
||||||||||||||||
|
Description
|
Level 1
|
Level 2
|
Level 3
|
Total
|
||||||||||||
|
Assets:
|
||||||||||||||||
|
Investments in securities
|
$ | 89,842,744 | $ | 299,402,328 | ± | $ | − | $ | 389,245,072 | |||||||
|
Derivative contracts
|
− |
5,068,275
|
^ | − | 5,068,275 | |||||||||||
|
Total Assets
|
$ | 89,842,744 | $ | 304,470,603 | $ | − | $ | 394,313,347 | ||||||||
|
Liabilities:
|
||||||||||||||||
|
Derivative contracts
|
$ | − |
$
(134,834)
|
^ | $ | − | $ | (134,834 | ) | |||||||
|
Total Liabilities
|
$ | − | $ | (134,834 | ) | $ | − | $ | (134,834 | ) | ||||||
|
|
±
Level 2 investments in securities include OTC call options which are fair valued by the General Partner using prices obtained from four different brokers.
|
|
|
^
Level 2 derivative contracts include credit default swaps and total return swaps, which are valued by the General Partner based upon independent third party prices.
|
13
Pershing Square IV A, L.P.
Notes to Consolidated Financial Statements (continued)
4. Due from/to Brokers
Due from brokers include cash balances held at the Subsidiary Partnership’s clearing broker and cash collateral pledged to counterparties. Due to brokers include cash collateral received from counterparties.
The Subsidiary Partnership has agreements with its counterparties whereby the Subsidiary Partnership receives and is required to pledge collateral. As of December 31, 2008, the Subsidiary Partnership had pledged $5,680,000 of cash collateral in connection with its derivative trading activities. Due to broker consists of cash
received from one broker to collateralize the Subsidiary Partnership’s OTC call options purchased from that broker.
|
5. Derivative Contracts and Financial Instruments with Off-Balance Sheet Risk
|
or Concentrations of Credit Risk
In the normal course of business, the Subsidiary Partnership enters into derivative contracts for investment purposes. Typically, derivative contracts serve as components of the Subsidiary Partnership’s investment strategy and are utilized primarily to structure the portfolio to economically match the investment objectives of the
Subsidiary Partnership. These instruments are subject to various risks similar to non-derivative instruments, including market, credit, liquidity, and operational risks. The Subsidiary Partnership manages these risks on an aggregate basis along with the risks associated with its investing activities as part of its overall risk management policies.
The Subsidiary Partnership’s derivative trading activities are primarily the purchase and sale of OTC equity options, credit default swaps and total return swaps. All derivatives are reported at fair value (as described in Note 2) in the consolidated statement of assets, liabilities and partners’ capital and changes in fair
value are reflected in the consolidated statement of operations.
Total return swaps represent agreements between two parties to make payments based upon the performance of certain underlying assets. The Subsidiary Partnership is obligated to pay, or entitled to receive as the case may be, the net difference in the value determined at the onset of the swap versus the value determined at the termination
or reset date of the swap. Therefore, the amounts required for the future satisfaction of the swaps may be greater or less than the amounts recorded on the consolidated statement of assets, liabilities and partners’ capital. The ultimate gain or loss depends upon the prices at which the underlying financial instruments of the swaps are valued on the settlement date. At December 31, 2008, the Subsidiary Partnership holds total return swaps with affiliated entities (see Note 6).
14
Pershing Square IV A, L.P.
Notes to Consolidated Financial Statements (continued)
|
5. Derivative Contracts and Financial Instruments with Off-Balance Sheet Risk
|
or Concentrations of Credit Risk (continued)
A credit default swap contract represents an agreement in which one party, the protection buyer, pays a fixed fee, the premium, in return for a payment by the other party, the protection seller, contingent upon a specified credit event relating to an underlying reference asset. While there is no credit event, the protection buyer pays the
protection seller the periodic premium. If a specified credit event occurs, there is an exchange of cash flows and/or securities designed so that the net payment to the protection buyer reflects the loss incurred by creditors of the reference asset in the event of its default. The nature of the credit event is established by the buyer and the seller at the inception of the transaction and such events include bankruptcy, insolvency, rating agency downgrade and failure to meet payment obligations when due.
The Subsidiary Partnership clears all of its securities transactions through major U.S.-registered broker dealers, primarily through Goldman Sachs & Co., pursuant to broker agreements. At December 31, 2008, substantially all investments, derivative contracts and amounts due from brokers are positions with and amounts due from six brokers.
The Subsidiary Partnership had substantially all its counterparty concentration with these brokers and their affiliates.
Receivables and payables on derivative contracts are reported net by counterparty on the consolidated statement of assets, liabilities and partners’ capital, provided the legal right of offset exists.
At December 31, 2008, the following derivative contracts were included in the Subsidiary Partnership’s consolidated statement of assets, liabilities and partners’ capital:
|
Assets
|
Liabilities
|
|||||||
|
OTC equity options
|
$ | 299,402,328 | $ | – | ||||
|
Swaps
|
6,727,838 | 1,794,397 | ||||||
|
Total
|
$ | 306,130,166 | $ | 1,794,397 | ||||
15
Pershing Square IV A, L.P.
Notes to Consolidated Financial Statements (continued)
|
5. Derivative Contracts and Financial Instruments with Off-Balance Sheet Risk
|
or Concentrations of Credit Risk (continued)
The swaps and OTC equity options balances above represent the Subsidiary Partnership’s assets and liabilities from OTC derivative contracts by brokers and are not representative of the outstanding credit risk to the Subsidiary Partnership due to the existence of netting agreements. After taking into effect the offsetting permitted
under Financial Accounting Standards Board Interpretation No. 39, Offsetting of Amounts Related to Certain Contracts, the Subsidiary Partnership views its credit exposure to be $277,626,494 at December 31, 2008, representing the fair value of derivative contracts in net asset position net of derivative contracts in net liability position and any collateral received or pledged to counterparties.
The Subsidiary Partnership receives and pledges collateral from/to certain of its counterparties in accordance with bilateral collateral agreements. The Subsidiary Partnership’s credit exposure is net of cash collateral of $32,389,275 that the Subsidiary Partnership received from one counterparty at December 31, 2008. The Subsidiary
Partnership pledged cash collateral of $5,680,000 to one counterparty to cover margin requirements for certain derivative positions at December 31, 2008. The Subsidiary Partnership has purchased credit default swap contracts to hedge against the Subsidiary Partnership’s credit exposure to certain option contract counterparties (see Note 6). At December 31, 2008, the Subsidiary Partnership has purchased credit default swap contracts on these counterparties with notional values of $425,000,000
on Deutsche Bank AG, $386,471,000 on Credit Suisse Group AG, $88,927,000 on Citigroup Inc. and $62,480,000 on BNP Paribas.
6. Related Party Transactions
In accordance with the Partnership Agreement (the “Agreement”), PSCM provides management and administrative services to the Subsidiary Partnership. As compensation for such services, PSCM receives a quarterly management fee in advance equal to 0.0625% (0.25% on an annual basis) of the balance in the limited partners’ capital
account as of the last business day of the previous calendar quarter, taking into account contributions made on the first day of such calendar quarter. The management fee for the year ended December 31, 2008 was $2,299,475. The General Partner may, in its sole discretion, elect to waive the management fee with respect to any limited partner. Subsequent to year end the General Partner decided to waive all future fees for all investors (see Note 11).
16
Pershing Square IV A, L.P.
Notes to Consolidated Financial Statements (continued)
6. Related Party Transactions (continued)
As of December 31, 2008, the Subsidiary Partnership had unrealized gain on swap contracts with an affiliated entity managed by PSCM of $5,068,275. This amount relates to total return swap contracts with the affiliated entity whereby the Subsidiary Partnership has economic exposure to various credit default swaps held by the affiliated
entity. The credit default swap contracts were purchased for the purpose of hedging the Subsidiary Partnership’s credit exposure to certain option contract counterparties. The Subsidiary Partnership has the same terms and economic attributes as if it were the direct buyer of these credit default swap contracts and therefore all income and loss associated with these swap contracts are reflected in the Subsidiary Partnership’s consolidated statement of operations.
During the year ended December 31, 2008, Pershing Square, L.P. (“PSLP”) and Pershing Square International Ltd. (“PSINTL”), affiliated investment funds managed by PSCM, had an investment in the Partnerships and the Funds, respectively. PSLP and PSINTL were not charged a management fee nor a performance allocation.
On June 30, 2008, PSIV Ltd and PSIV LP were re-opened to allow an additional contribution of $28,000,000 made by PSINTL. PSIV-I Ltd and PSIV-I LP also commenced operations on June 30, 2008 and accepted contributions of $32,521,000 and $39,479,000, respectively, which were made by PSINTL and PSLP, respectively. William A. Ackman
made a contribution of $5,000,000 on July 9, 2008 in PSIV-I Ltd. when PSIV-I Ltd. was re-opened.
7. Guarantees
The Subsidiary Partnership enters into contracts that contain a variety of indemnifications. The Subsidiary Partnership’s maximum exposure under these arrangements is unknown. However, the Subsidiary Partnership has not had prior claims or losses pursuant to these contracts and expects the risk of loss to be remote.
8. Allocation of Net Income/(Loss)
In accordance with the Agreement, net income or loss is allocated as of the last business day of each Fiscal Period, as defined, to all partners in proportion to each partner’s capital account at the time of such allocation.
17
Pershing Square IV A, L.P.
Notes to Consolidated Financial Statements (continued)
8. Allocation of Net Income/(Loss) (continued)
At the end of each fiscal year or upon a limited partner’s full withdrawal, for each limited partner’s capital account which has been allocated net income, there shall be allocated to the capital accounts of the General Partner, 20% of the excess of the net income allocated to such limited partner’s capital account above
the loss carryforward (the “Performance Allocation”), if any, and the management fee with respect to the limited partner’s capital account. The General Partner in its sole discretion has reduced the Performance Allocation to 10% for those limited partners that made initial contributions of at least $100 million. For the year ended December 31, 2008, there was no Performance Allocation.
The General Partner may, in its sole discretion, elect to waive or reduce the Performance Allocation with respect to any limited partner.
Subsequent to year end the General Partner decided to waive all future Performance Allocation for all investors (see Note 11).
9. Partners’ Capital
In accordance with the Agreement, a limited partner commits capital until December 31, 2009 (the “Lock-Up Date”). The General Partner, in its sole discretion, may advance or extend the Lock-Up Date for up to one year beyond December 31, 2009 if the General Partner believes it is in the best interest of the Subsidiary Partnership
to do so. The General Partner has extended the Lock-Up Date for up to one year beyond December 31, 2009 of the Subsidiary Partnership.
10. Financial Highlights
The following represents the ratios to average limited partners’ capital and total return information for the year ended December 31, 2008.
|
Ratios to average limited partners’ capital:
|
||||
|
Expenses
|
0.75 | % | ||
|
Net investment loss
|
(0.25 | )% | ||
|
Total return
|
(67.91 | )% | ||
The above ratios and total return are calculated for all limited partners taken as a whole. Individual partner’s ratios and returns may vary from the above based on different management fee and Performance Allocation arrangements and the timing of capital transactions.
18
Pershing Square IV A, L.P.
Notes to Consolidated Financial Statements (continued)
11. Subsequent Events
Effective January 1, 2009, the General Partner elected to waive all future management fees and the performance allocation for all investors in the Partnerships and the Funds. During the period from January 1, 2009 to March 27, 2009, consolidated performance for the Subsidiary Partnership was (41%).
On January 31, 2009, PSIV Ltd and PSIV-I Ltd withdrew their entire investment in PSIV LP and PSIV-I LP, respectively, and subsequently subscribed their entire investment into the Subsidiary Partnership. Pershing Square IV Trade-Co, L.P. (“PSIV TradeCo LP”), a Delaware Limited Partnership, was formed on January 13, 2009. PSIV
TradeCo LP is a wholly owned subsidiary of Pershing Square IV, L.P. Pershing Square IV-I Trade-Co, L.P. (“PSIV-I TradeCo LP”), a Delaware Limited Partnership, was formed on January 13, 2009. PSIV-I TradeCo LP is a wholly owned subsidiary of Pershing Square IV-I, L.P. Pershing Square International IV Trade-Co, Ltd. (“PSIV TradeCo Ltd”), was incorporated as an exempted company on January 8, 2009 under the laws of the Cayman Islands. PSIV TradeCo
Ltd is a wholly owned subsidiary of Pershing Square International IV, Ltd. Pershing Square International IV-I Trade-Co, Ltd. (“PSIV-I TradeCo Ltd”), was incorporated as an exempted company on January 8, 2009 under the laws of the Cayman Islands. PSIV-I TradeCo Ltd is a wholly owned subsidiary of Pershing Square International IV-I, Ltd. These newly formed entities, (collectively, the “TradeCos”), may invest in stock, total return swaps and/or call options
of Target Corporation.
On February 8, 2009, the General Partner decided to waive the lock-up and permitted investors to withdraw on February 28, 2009 from the Partnerships and the Funds. Any investor that elected not to withdraw on February 28, 2009 will be committed until the Lock-Up Date. Withdrawals on February 28, 2009 totaled approximately
$88,550,000. In addition, the General Partner will also permit investors in the Partnerships or the Funds to apply a highwater mark adjustment to their existing, or new, investments with any affiliated entities managed by PSCM to compensate for losses incurred in the Partnerships or in the Funds.
On March 1, 2009, the Partnerships and the Funds opened for new and additional capital contributions. Total contributions received on March 1, 2009 by the Partnerships and the Funds collectively were $68,997,000. Contributions from William A. Ackman, affiliates of the General Partner, affiliated entities managed by
PSCM, certain employees and advisory board members represented $67,672,000 of the total contributions received.
19
Financial Statements
Pershing Square IV, L.P.
Period from June 1, 2007 (commencement of operations) to December 31, 2007
with Report of Independent Registered Public Accounting Firm
Pershing Square IV, L.P.
Financial Statements
Period from June 1, 2007 (commencement of operations) to December 31, 2007
Contents
|
Audited Financial Statement Schedules Index
|
|
|
Report of Independent Registered Public Accounting Firm
|
1
|
|
Statement of Assets, Liabilities and Partners’ Capital
|
2
|
|
Statement of Operations
|
3
|
|
Statement of Changes in Partners’ Capital
|
4
|
|
Statement of Cash Flows
|
5
|
|
Notes to Financial Statements
|
6
|
|
Financial Statements of Pershing Square IV A, L.P.
|
Report of Independent Registered Public Accounting Firm
The General Partner
Pershing Square IV, L.P.
We have audited the accompanying statement of asset, liabilities and partners’ capital of Pershing Square IV, L.P. (the “Partnership”), as of December 31, 2007, and the related statements of operations, changes in partners’ capital and cash flows for the period from June 1, 2007 (commencement of operations)
to December 31, 2007. These financial statements are the responsibility of the Partnership’s management. Our responsibility is to express an opinion on these financial statements based on our audit.
We conducted our audit in accordance with auditing standards generally accepted in the United States of America. Those standards require that we plan and perform the audit to obtain reasonable assurance about whether the financial statements are free of material misstatement. We were not engaged to perform an audit
of the Partnership’s internal control over financial reporting. Our audit included consideration of internal control over financial reporting as a basis for designing audit procedures that are appropriate in the circumstances, but not for the purpose of expressing an opinion on the effectiveness of the Partnership’s internal control over financial reporting. Accordingly, we express no such opinion. An audit also includes examining, on a test basis, evidence supporting
the amounts and disclosures in the financial statements, assessing the accounting principles used and significant estimates made by management, and evaluating the overall financial statement presentation. We believe that our audit provides a reasonable basis for our opinion.
In our opinion, the financial statements referred to above present fairly, in all material respects, the financial position of Pershing Square IV, L.P. at December 31, 2007, and the results of its operations, the changes in its partners’ capital and its cash flows for the period from June 1, 2007 (commencement of operations)
to December 31, 2007, in conformity with accounting principles generally accepted in the United States of America.
/s/ Ernst & Young
March 19, 2008
1
Pershing Square IV, L.P.
Statement of Assets, Liabilities and Partners’ Capital
(Stated in United States Dollars)
December 31, 2007
|
Assets
|
||||
|
Investment in Pershing Square IV A, L.P.
|
$ | 1,127,674,674 | ||
|
Total assets
|
$ | 1,127,674,674 | ||
|
Liabilities and partners’ capital
|
||||
|
Accrued expenses
|
$ | 44,961 | ||
|
Withholding tax payable
|
19,870 | |||
|
Total liabilities
|
64,831 | |||
|
Partners’ capital
|
1,127,609,843 | |||
|
Total liabilities and partners’ capital
|
$ | 1,127,674,674 | ||
|
|
The accompanying notes and attached consolidated financial statements of Pershing Square IV A, L.P. are an integral part of the financial statements.
|
2
Pershing Square IV, L.P.
Statement of Operations
(Stated in United States Dollars)
Period from June 1, 2007 (commencement of operations) to December 31, 2007
|
Net realized and unrealized losses allocated from
investment in Pershing Square IV A, L.P.
|
||||||||
|
Net realized loss from investments in securities
|
$ | (40,790,512 | ) | |||||
|
Net change in unrealized loss from investments in securities
|
(722,016,297 | ) | ||||||
|
Net realized loss on derivative contracts
|
(93,937,016 | ) | ||||||
|
Net change in unrealized loss on derivative contracts
|
(517,824 | ) | ||||||
|
Net loss allocated from investment in Pershing
Square IV A, L.P.
|
$ | (857,261,649 | ) | |||||
|
Net investment income allocated from investment in
Pershing Square IV A, L.P.
|
||||||||
|
Investment income
|
||||||||
|
Interest
|
18,557,238 | |||||||
|
Dividends
|
383,405 | |||||||
|
Total expenses
|
(4,104,320 | ) | ||||||
|
Net investment income allocated from investment in Pershing Square IV A, L.P.
|
14,836,323 | |||||||
|
Partnership expenses
|
||||||||
|
Professional fees
|
(44,961 | ) | ||||||
|
Withholding tax
|
(19,870 | ) | ||||||
|
Total expenses
|
(64,831 | ) | ||||||
|
Net investment income
|
14,771,492 | |||||||
|
Net loss
|
$ | (842,490,157 | ) | |||||
|
|
The accompanying notes and attached consolidated financial statements of Pershing Square IV A, L.P. are an integral part of the financial statements.
|
3
Pershing Square IV, L.P.
Statement of Changes in Partners’ Capital
(Stated in United States Dollars)
Period from June 1, 2007 (commencement of operations) to December 31, 2007
|
Limited partners capital contributions
|
$ | 1,970,100,000 | ||
|
Net loss
|
(842,490,157 | ) | ||
|
Partners’ capital at end of period
|
$ | 1,127,609,843 |
|
|
The accompanying notes and attached consolidated financial statements of Pershing Square IV A, L.P. are an integral part of the financial statements.
|
4
Pershing Square IV, L.P.
Statement of Cash Flows
(Stated in United States Dollars)
Period from June 1, 2007 (commencement of operations) to December 31, 2007
|
Cash flows from operating activities
|
||||
|
Net loss
|
$ | (842,490,157 | ) | |
|
Adjustments to reconcile net loss to net cash used in operating activities:
|
||||
|
Increase in investment in Pershing Square IV A, L.P.
|
(1,127,674,674 | ) | ||
|
Increase in accrued expenses
|
44,961 | |||
|
Increase in withholding tax payable
|
19,870 | |||
|
Net cash used in operating activities
|
(1,970,100,000 | ) | ||
|
Cash flows from financing activities
|
||||
|
Capital contributions
|
1,970,100,000 | |||
|
Net change in cash and cash equivalents
|
− | |||
|
Cash and cash equivalents at beginning of period
|
− | |||
|
Cash and cash equivalents at end of period
|
$ | − | ||
|
|
The accompanying notes and attached consolidated financial statements of Pershing Square IV A, L.P. are an integral part of the financial statements.
|
5
Pershing Square IV, L.P.
Notes to Financial Statements
December 31, 2007
1. Organization
Pershing Square IV, L.P. (the “Partnership”) is organized as a limited partnership under the laws of the state of Delaware on May 22, 2007 and commenced operations on June 1, 2007. The objective of the Partnership is to invest all of its assets in Pershing Square IV A, L.P. (the “Subsidiary Partnership”).
The Subsidiary Partnership is an exempted limited partnership formed under the limited liability partnership laws of the Cayman Islands on May 31, 2007 and commenced operations on June 1, 2007. The investment objective of the Partnership and the Subsidiary Partnership (collectively, the “PSIV Partnerships”) is to create significant capital appreciation by investing in stock, total return swaps and call options of Target Corporation.
The Partnership is a “master” fund in a “master-feeder” structure whereby Pershing Square International IV, Ltd. (the “Fund”) invests all of its assets in the Partnership. The Partnership is also a “feeder” fund in a “master-feeder” structure as the Partnership invests all of its
assets in the Subsidiary Partnership.
Pershing Square Holdings GP, LLC, a limited liability company organized under the laws of the state of Delaware and registered as a foreign company under the laws of the Cayman Islands, will serve as the “General Partner” to the PSIV Partnerships. The General Partner is responsible for making all investment decisions
on behalf of the PSIV Partnerships and is solely responsible for the development and implementation of the PSIV Partnerships’ investment policy and strategy. William A. Ackman is the managing member of the General Partner and is primarily responsible for managing the PSIV Partnerships.
The General Partner delegates administrative functions relating to the management of the PSIV Partnerships to Pershing Square Capital Management, L.P. (“PSCM”), a limited partnership organized under the laws of the state of Delaware. William A. Ackman is the managing member of the general partner of PSCM.
Pursuant to an Administration Agreement entered into in May 2007, Goldman Sachs (Cayman) Trust, Limited (the “Administrator”) has been appointed administrator to the PSIV Partnerships. The Administrator is compensated for its services in accordance with the fees stated in this Administration Agreement.
6
Pershing Square IV, L.P.
Notes to Financial Statements (continued)
2. Significant Accounting Policies
Basis of Presentation
The financial statements of the Partnership have been prepared in accordance with accounting principles generally accepted in the United States of America and are stated in United States dollars. The following is a summary of the significant accounting and reporting policies used in preparing the financial statements.
Cash and Cash Equivalents
The Partnership considers all highly liquid financial instruments with a maturity of three months or less to be cash equivalents.
Valuation of Investment in the Subsidiary Partnership
The Partnership’s investment in the Subsidiary Partnership is valued at fair value, which represents the Partnership’s proportionate interest in the partners’ capital of the Subsidiary Partnership at December 31, 2007, determined from audited financial statements prepared in accordance with accounting principles generally
accepted in the United States. The performance of the Partnership is directly affected by the performance of the Subsidiary Partnership. Attached are the audited financial statements of the Subsidiary Partnership, including the consolidated condensed schedule of investments and significant accounting and reporting policies, which are an integral part of these financial statements. Valuation of the investment held by the Partnership is discussed in the notes of the Subsidiary Partnership’s financial statements.
As of December 31, 2007, the Partnership has approximately 99.95% ownership interest in the Subsidiary Partnership.
Fair Value of Financial Instruments
The fair value of the Partnership’s assets and liabilities, which qualify as financial instruments under Statement of Financial Accounting Standards No. 107, “Disclosures About Fair Value of Financial Instruments,” approximates the carrying amounts presented in the statement of assets, liabilities and partners’ capital.
Investment Transactions and Related Investment Income
The Partnership records its investment transactions and the related revenue and expenses on a trade-date basis. All unrealized gains and losses from the Partnership’s investment in the Subsidiary Partnership are reflected in the statement of operations.
7
Pershing Square IV, L.P.
Notes to Financial Statements (continued)
2. Significant Accounting Policies (continued)
Use of Estimates
The preparation of the financial statements in conformity with accounting principles generally accepted in the United States of America requires management to make estimates and assumptions that affect the amounts reported in the financial statements and accompanying notes. Actual results could differ from those estimates.
Taxation
No Federal, state or local income taxes have been provided on income or loss of the Partnership since the partners are individually liable for the taxes on their share of the Partnership’s income or loss. The only taxes payable by the Partnership on its income are withholding taxes applicable to certain investment income. As a result,
no income tax liability or expense has been recorded in the accompanying financial statements.
New Accounting Pronouncements
On July 13, 2006, the Financial Accounting Standards Board (“FASB”) released FASB Interpretation No. 48 “Accounting for Uncertainty in Income Taxes” (FIN 48). FIN 48 provides guidance for how uncertain tax positions should be recognized, measured, presented and disclosed in the financial statements. FIN 48 requires
the evaluation of tax positions taken or expected to be taken in the course of preparing the Partnership’s tax returns to determine whether the tax positions are “more-likely-than-not” of being sustained by the applicable tax authority. Tax positions not deemed to meet the more-likely-than-not threshold would be recorded as a tax benefit or expense in the current year. Adoption of FIN 48 was deferred to fiscal years beginning after December 15, 2007 and is to be applied to all open tax years
as of the effective date. At this time, the Partnership is evaluating the implications of FIN 48 and its impact on the financial statements has not yet been determined.
In September 2006, the FASB issued Statement on Financial Accounting Standards No. 157, “Fair Value Measurements” (“FAS 157”). This standard clarifies the definition of fair value for financial reporting, establishes a framework for measuring fair value and requires additional disclosures about the use of fair value
measurements. FAS 157 is effective for financial statements issued for fiscal years beginning after November 15, 2007 and interim periods within those fiscal years. The Partnership does not believe that adoption of FAS 157 will impact the amounts reported in the financial statements. However, once adopted, additional disclosures will be required about the inputs used to develop the measurements of fair value and the effect of these fair value measurements on earnings reported in the statement of operations.
8
Pershing Square IV, L.P.
Notes to Financial Statements (continued)
3. Guarantees
The Partnership enters into contracts that contain a variety of indemnifications. The Partnership’s maximum exposure under these arrangements is unknown. However, the Partnership has not had prior claims or losses pursuant to these contracts and expects the risk of loss to be remote.
4. Related Party Transactions
The Partnership is not charged a management fee nor performance allocation at the Partnership level. Management fees and performance allocation are charged indirectly through the Partnership’s investment in the Subsidiary Partnership.
During the period from June 1, 2007 (commencement of operations) to December 31, 2007, Pershing Square, L.P. (“PSLP”), an affiliated investment fund managed by PSCM, had an investment in the Partnership. PSLP was not charged a management fee nor performance allocation by PSCM in relation to its investment in the Partnership
and indirectly through its investment in the Subsidiary Partnership. At December 31, 2007, PSLP owned 2.20% of the total partners’ capital of the Partnership.
5. Allocation of Net Income/(Loss)
In accordance with the Partnership Agreement (the “Agreement”), net income or loss is allocated as of the last business day of each Fiscal period, as defined, to all partners in proportion to each partner’s capital account at the time of such allocation.
6. Partner’s Capital
In accordance with the Agreement, a Limited Partner commits capital until December 31, 2009 (the “Lock-Up Date”). The General Partner, in its sole discretion, may advance or extend the Lock-Up Date for up to one year beyond December 31, 2009 if the General Partner believes it is in the best interest of the Partnership to do
so and has also extended the Lock-Up Date for up to one year beyond December 31, 2009 of the Subsidiary Partnership and the Fund.
9
Pershing Square IV, L.P.
Notes to Financial Statements (continued)
7. Financial Highlights
The following represents the ratios to average limited partners’ capital and total return information for the financial highlights for the period from June 1, 2007 (commencement of operations) to December 31, 2007:
|
Ratios to average limited partners’ capital:
|
||||
|
Expenses
|
0.24 | % | ||
|
Net investment income
|
0.83 | % | ||
|
Total return
|
(42.77 | )% | ||
The above ratios and total return are calculated for all limited partners taken as a whole and have not been annualized. Individual partner’s ratios or returns may vary from the above based on different management fee and performance allocation arrangements.
10
Consolidated Financial Statements
Pershing Square IV A, L.P.
Period from June 1, 2007 (commencement of operations) to December 31, 2007
with Report of Independent Registered Public Accounting Firm
Pershing Square IV A, L.P.
Consolidated Financial Statements
Period from June 1, 2007 (commencement of operations) to December 31, 2007
Contents
|
Audited Consolidated Financial Statement Schedules Index
|
|
|
Report of Independent Registered Public Accounting Firm
|
1
|
|
Consolidated Statement of Assets, Liabilities and Partners’ Capital
|
2
|
|
Consolidated Condensed Schedule of Investments
|
3
|
|
Consolidated Statement of Operations
|
4
|
|
Consolidated Statement of Changes in Partners’ Capital
|
5
|
|
Consolidated Statement of Cash Flows
|
6
|
|
Notes to Consolidated Financial Statements
|
7
|
Report of Independent Registered Public Accounting Firm
The General Partner
Pershing Square IV A, L.P.
We have audited the accompanying consolidated statement of assets, liabilities and partners’ capital of Pershing Square IV A, L.P. (the “Subsidiary Partnership”), including the consolidated condensed schedule of investments, as of December 31, 2007, and the related consolidated statements of operations, changes
in partners’ capital and cash flows for the period from June 1, 2007 (commencement of operations) to December 31, 2007. These financial statements are the responsibility of the Subsidiary Partnership’s management. Our responsibility is to express an opinion on these financial statements based on our audit.
We conducted our audit in accordance with auditing standards generally accepted in the United States of America. Those standards require that we plan and perform the audit to obtain reasonable assurance about whether the consolidated financial statements are free of material misstatement. We were not engaged to perform
an audit of the Subsidiary Partnership’s internal control over financial reporting. Our audit included consideration of internal control over financial reporting as a basis for designing audit procedures that are appropriate in the circumstances, but not for the purpose of expressing an opinion on the effectiveness of the Subsidiary Partnership’s internal control over financial reporting. Accordingly, we express no such opinion. An audit also includes examining, on
a test basis, evidence supporting the amounts and disclosures in the consolidated financial statements, assessing the accounting principles used and significant estimates made by management, and evaluating the overall financial statement presentation. We believe that our audit provides a reasonable basis for our opinion.
In our opinion, the consolidated financial statements referred to above present fairly, in all material respects, the financial position of Pershing Square IV A, L.P. at December 31, 2007, and the results of its operations, the changes in its partners’ capital and its cash flows for the period from June 1, 2007 (commencement
of operations) to December 31, 2007, in conformity with accounting principles generally accepted in the United States of America.
/s/ Ernst & Young
March 19, 2008
1
Pershing Square IV A, L.P.
Statement of Consolidated Assets, Liabilities and Partners’ Capital
(Stated in United States Dollars)
December 31, 2007
|
Assets
|
||||
|
Cash and cash equivalents
|
$ | 68,705,098 | ||
|
Due from brokers
|
109,158,091 | |||
|
Investments in securities, at fair value (cost $1,781,725,333)
|
1,059,342,171 | |||
|
Interest receivable
|
630,477 | |||
|
Total assets
|
$ | 1,237,835,837 | ||
|
Liabilities and partners’ capital
|
||||
|
Collateral received
|
$ | 108,826,141 | ||
|
Net unrealized loss on swap contracts
|
518,087 | |||
|
Accrued expenses and other liabilities
|
243,680 | |||
|
Total liabilities
|
109,587,908 | |||
|
Partners’ capital
|
1,128,247,929 | |||
|
Total liabilities and partners’ capital
|
$ | 1,237,835,837 | ||
The accompanying notes are an integral part of the consolidated financial statements.
2
Pershing Square IV A, L.P.
Consolidated Condensed Schedule of Investments
(Stated in United States Dollars)
December 31, 2007
|
Shares /
Contracts
|
Description/Name
|
Fair Value
|
Percentage
of Partners’ Capital
|
||||||
|
Investments in Securities
|
|||||||||
|
Equity Securities
|
|||||||||
|
United States:
|
|||||||||
|
Retail
|
|||||||||
|
5,884,200
|
Target Corp.
|
$ | 294,210,000 | 26.08 | % | ||||
|
Total Equity Securities (cost $347,082,231)
|
294,210,000 | 26.08 | |||||||
|
Equity Option Contracts
|
|||||||||
|
United States:
|
|||||||||
|
Retail
|
|||||||||
|
75,717,131
|
Target Corp., Calls, Strike Prices $41.62 -$53.12, 10/02/08 - 01/15/10
|
765,132,171 | 67.82 | ||||||
|
Total Equity Option Contracts
(cost $1,434,643,102)
|
765,132,171 | 67.82 | |||||||
|
Total Investments in Securities
(cost $1,781,725,333)
|
$ | 1,059,342,171 | 93.90 | % | |||||
|
Derivative Contracts
|
|||||||||
|
Total Return Swaps
|
|||||||||
|
United States:
|
|||||||||
|
Banking
|
$ | (518,087 | ) | (0.05 | )% | ||||
|
Total Derivative Contracts
|
$ | (518,087 | ) | (0.05 | )% | ||||
The accompanying notes are an integral part of the consolidated financial statements.
3
Pershing Square IV A, L.P.
Consolidated Statement of Operations
(Stated in United States Dollars)
Period from June 1, 2007 (commencement of operations) to December 31, 2007
|
Net realized and unrealized loss from investments
|
||||||||
|
Net realized loss from investments in securities
|
$ | (40,811,094 | ) | |||||
|
Net change in unrealized loss from investments in securities
|
(722,383,162 | ) | ||||||
|
Net realized loss on derivative contracts
|
(93,984,727 | ) | ||||||
|
Net change in unrealized loss on derivative contracts
|
(518,087 | ) | ||||||
|
Net loss from investments
|
$ | (857,697,070 | ) | |||||
|
Investment income
|
||||||||
|
Interest
|
18,566,663 | |||||||
|
Dividends
|
383,600 | |||||||
|
Total investment income
|
18,950,263 | |||||||
|
Partnership expenses
|
||||||||
|
Management fee
|
2,651,777 | |||||||
|
Professional fees
|
1,173,267 | |||||||
|
Other
|
280,051 | |||||||
|
Interest
|
169 | |||||||
|
Total expenses
|
4,105,264 | |||||||
|
Net investment income
|
14,844,999 | |||||||
|
Net loss
|
$ | (842,852,071 | ) | |||||
The accompanying notes are an integral part of the consolidated financial statements.
4
Pershing Square IV A, L.P.
Consolidated Statement of Changes in Partners’ Capital
(Stated in United States Dollars)
Period from June 1, 2007 (commencement of operations) to December 31, 2007
|
Total
|
Limited
Partners
|
General
Partner
|
||||||||||
|
Capital contributions
|
$ | 1,971,100,000 | $ | 1,970,100,000 | $ | 1,000,000 | ||||||
|
Net Loss
|
(842,852,071 | ) | (842,425,326 | ) | (426,745 | ) | ||||||
|
Partners’ capital at end of period
|
$ | 1,128,247,929 | $ | 1,127,674,674 | $ | 573,255 | ||||||
The accompanying notes are an integral part of the consolidated financial statements.
5
Pershing Square IV A, L.P.
Consolidated Statement of Cash Flows
(Stated in United States Dollars)
Period from June 1, 2007 (commencement of operations) to December 31, 2007
|
Cash flows from operating activities
|
||||
|
Net loss
|
$ | (842,852,071 | ) | |
|
Adjustments to reconcile net loss to net cash used in operating activities:
|
||||
|
Net realized loss from investments in securities
|
40,811,094 | |||
|
Net change in unrealized loss from investments in securities
|
722,383,162 | |||
|
Net change in unrealized loss on swap contracts
|
518,087 | |||
|
Purchases of investments
|
(2,834,455,274 | ) | ||
|
Proceeds from investments sold
|
1,011,918,847 | |||
|
Increase in due from brokers
|
(109,158,091 | ) | ||
|
Increase in interest receivable
|
(630,477 | ) | ||
|
Increase in collateral received
|
108,826,141 | |||
|
Increase in accrued expenses and other liabilities
|
243,680 | |||
|
Net cash used in operating activities
|
(1,902,394,902 | ) | ||
|
Cash flows from financing activities
|
||||
|
Capital contributions
|
1,971,100,000 | |||
|
Net change in cash and cash equivalents
|
68,705,098 | |||
|
Cash and cash equivalents at beginning of period
|
− | |||
|
Cash and cash equivalents at end of period
|
$ | 68,705,098 | ||
|
Supplemental disclosure of cash flow information
|
||||
|
Cash paid during the period for interest
|
$ | 169 | ||
The accompanying notes are an integral part of the consolidated financial statements.
6
Pershing Square IV A, L.P.
Notes to Consolidated Financial Statements
December 31, 2007
1. Organization
Pershing Square IV A, L.P. (the “Subsidiary Partnership”) is an exempted limited partnership formed under the limited liability partnership laws of the Cayman Islands on May 31, 2007 and commenced operations on June 1, 2007. The investment objective the Subsidiary Partnership is to create significant capital appreciation by
investing in stock, total return swaps and call options of Target Corporation.
The Subsidiary Partnership acts as the master fund in a “master-feeder” structure whereby Pershing Square IV, L.P. invests all of its capital in the Subsidiary Partnership. Pershing Square IV, L.P. (the “Partnership”) is organized as a limited partnership under the laws of the state of Delaware on May 22, 2007 and
commenced operations on June 1, 2007. The Partnership is also a “master” fund in a “master-feeder” structure whereby Pershing Square International IV, Ltd. invests all of its assets in the Partnership. Pershing Square International IV, Ltd. (the “Fund”) is an exempted company formed under the limited liability laws of the Cayman Islands on May 15, 2007 and is registered under the Cayman Islands Mutual Funds Law.
Pershing Square IV B, L.P. (the “PSIV B”) is a wholly owned subsidiary of the Subsidiary Partnership and was incorporated on July 17, 2007 under the laws of the state of Delaware. At December 31, 2007, PSIV B did not hold any assets on behalf of the Subsidiary Partnership.
Pershing Square Holdings GP, LLC, a limited liability company organized under the laws of the state of Delaware and registered as a foreign company under the laws of the Cayman Islands, will serve as the “General Partner” to the Subsidiary Partnership and the Partnership (collectively, the “PSIV Partnerships”). The
General Partner is responsible for making all investment decisions on behalf of the PSIV Partnerships and is solely responsible for the development and implementation of the PSIV Partnerships’ investment policy and strategy. William A. Ackman is the managing member of the General Partner and is primarily responsible for managing the PSIV Partnerships.
The General Partner delegates administrative functions relating to the management of the PSIV Partnerships to Pershing Square Capital Management, L.P. (“PSCM”), a limited partnership organized under the laws of the state of Delaware. William A. Ackman is the managing member of the general partner of PSCM.
Pursuant to an Administration Agreement entered into in May 2007, Goldman Sachs (Cayman) Trust, Limited (the “Administrator”) has been appointed administrator to the PSIV Partnerships. The Administrator is compensated for its services in accordance with the fees stated in this Administration Agreement.
7
Pershing Square IV A, L.P.
Notes to Consolidated Financial Statements (continued)
2. Significant Accounting Policies
Basis of Presentation
The Subsidiary Partnership’s consolidated financial statements have been prepared in accordance with accounting principles generally accepted in the United States of America and are stated in United States dollars. The following is a summary of the significant accounting and reporting policies used in preparing the consolidated financial
statements.
Basis of Consolidation
The consolidated financial statements include the results of the Subsidiary Partnership and its subsidiary, PSIV B. Intercompany transactions have been eliminated on consolidation.
Investment Transactions and Related Investment Income
The Subsidiary Partnership records its securities transactions and the related revenue and expenses on a trade date basis. Dividends are recorded on the ex-dividend date, net of any applicable foreign withholding taxes. Interest is recorded on the accrual basis.
Valuation of Investments
In general, the Subsidiary Partnership values investments at their last sales price on the date of determination. If no sales occurred on such date, such investments are valued at the mean of the last “bid” and “ask” price on the last business day such investments were traded. Investments for which no such market
prices are available are valued at fair value by the General Partner based upon counterparty and independent third party prices. At December 31, 2007, such investments consisted of over-the-counter (“OTC”) options with a value of $765,132,171, and total return swap contracts with a value of ($518,087). All unrealized gains and losses are reflected on the consolidated statement of operations.
Cash and Cash Equivalents
The Subsidiary Partnership considers all highly liquid financial instruments with a maturity of three months or less to be cash equivalents. As of December 31, 2007, all cash and cash equivalents are held with an affiliate of the Administrator.
Fair Value of Financial Instruments
The fair value of the Subsidiary Partnership’s assets and liabilities which qualify as financial instruments under Statement of Financial Accounting Standards No. 107, “Disclosures About Fair Value of Financial Instruments,” approximates the carrying amounts presented in the consolidated statement of assets, liabilities
and partners’ capital.
8
Pershing Square IV A, L.P.
Notes to Consolidated Financial Statements (continued)
2. Significant Accounting Policies (continued)
Use of Estimates
The preparation of consolidated financial statements in conformity with accounting principles generally accepted in the United States of America requires management to make estimates and assumptions that affect the amounts reported in the consolidated financial statements and accompanying notes. Actual results could differ from those estimates.
Income Taxes
The Subsidiary Partnership is not subject to any income or capital gains taxes in the Cayman Islands since the partners are individually liable for the taxes on their share of the Subsidiary Partnership’s income or loss. The only taxes payable by the Subsidiary Partnership on its income are withholding taxes applicable
to dividend income. As a result, no income tax liability or expense has been recorded in the accompanying consolidated financial statements.
New Accounting Pronouncements
On July 13, 2006, the Financial Accounting Standards Board (“FASB”) released FASB Interpretation No. 48 “Accounting for Uncertainty in Income Taxes” (FIN 48). FIN 48 provides guidance for how uncertain tax positions should be recognized, measured, presented and disclosed in the consolidated financial statements.
FIN 48 requires the evaluation of tax positions taken or expected to be taken in the course of preparing the Subsidiary Partnership’s tax returns to determine whether the tax positions are “more-likely-than-not” of being sustained by the applicable tax authority. Tax positions not deemed to meet the more-likely-than-not threshold would be recorded as a tax benefit or expense in the current year. Adoption of FIN 48 was deferred to fiscal years beginning after December 15, 2007 and is to be applied
to all open tax years as of the effective date. At this time, the Subsidiary Partnership is evaluating the implications of FIN 48 and its impact on the consolidated financial statements has not yet been determined.
In September 2006, the FASB issued Statement on Financial Accounting Standards No. 157, “Fair Value Measurements” (“FAS 157”). This standard clarifies the definition of fair value for financial reporting, establishes a framework for measuring fair value and requires additional disclosures about the use of fair value
measurements. FAS 157 is effective for financial statements issued for fiscal years beginning after November 15, 2007 and interim periods within those fiscal years. The Subsidiary Partnership does not believe that adoption of FAS 157 will impact the amounts reported in the consolidated financial statements. However, once adopted, additional disclosures will be required about the inputs used to develop the measurements of fair value and the effect of these fair value measurements on earnings reported in the consolidated
statement of operations.
9
Pershing Square IV A, L.P.
Notes to Consolidated Financial Statements (continued)
3. Due from Brokers
Due from brokers include cash balances held at the Subsidiary Partnership’s clearing broker and cash collateral received.
|
4. Derivative Contracts and Financial Instruments with Off-Balance Sheet Risk
|
or Concentrations of Credit Risk
In the normal course of business, the Subsidiary Partnership enters into derivative contracts for investment purposes. Typically, derivative contracts serve as components of the Subsidiary Partnership’s investment strategies and are utilized primarily to structure the portfolio to economically match the investment objectives of the
Subsidiary Partnership. These instruments are subject to various risks similar to non-derivative instruments, including market, credit, liquidity, and operational risks. The Subsidiary Partnership manages these risks on an aggregate basis along with the risks associated with its investing activities as part of its overall risk management policies.
The Subsidiary Partnership’s derivative trading activities are primarily the purchase and sale of OTC options, credit default swaps and total return swaps. All derivatives are reported at fair value (as described in Note 2) in the consolidated statement of assets, liabilities and partners’ capital and changes in fair value are
reflected in the consolidated statement of operations.
Total return swaps represent agreements between two parties to make payments based upon the performance of certain underlying assets. The Subsidiary Partnership is obligated to pay, or entitled to receive as the case may be, the net difference in the value determined at the onset of the swap versus the value determined at the termination
or reset date of the swap. Therefore, the amounts required for the future satisfaction of the swaps may be greater or less than the amounts recorded on the consolidated statement of assets, liabilities and partners’ capital. The ultimate gain or loss depends upon the prices at which the underlying financial instruments of the swaps are valued on the settlement date. At December 31, 2007, the Subsidiary Partnership holds total return swaps with affiliated entities (see Note 5).
The Subsidiary Partnership clears all of its securities transactions through major U.S.-registered broker dealers pursuant to customer agreements. At December 31, 2007, substantially all investments, derivative contracts and amounts due from broker are positions with and amounts due from these brokers. The Subsidiary Partnership had substantially
all its counterparty concentration with these brokers.
10
Pershing Square IV A, L.P.
Notes to Consolidated Financial Statements (continued)
|
4. Derivative Contracts and Financial Instruments with Off-Balance Sheet Risk
|
or Concentrations of Credit Risk (continued)
Collateral received consists of cash received from one broker to collateralize the Subsidiary Partnership’s OTC call options purchased from that broker. At December 31, 2007, collateral received by the Subsidiary Partnership represents 103.58% of the fair value of OTC call options purchased from that broker. The Subsidiary Partnership
is restricted in its use of the collateral and may use up to 50% of the value of the collateral received. No collateral has been sold or repledged as of December 31, 2007.
5. Related Party Transactions
In accordance with the Partnership Agreement (the “Agreement”), PSCM provides management and administrative services to the Subsidiary Partnership. As compensation for such services, PSCM receives a quarterly management fee in advance equal to 0.0625% (0.25% on an annual basis) of the balance in the limited partners’ capital
account as of the last business day of the previous calendar quarter, taking into account contributions made on the first day of such calendar quarter. The management fee for the period from June 1, 2007 (commencement of operations) to December 31, 2007 was $2,651,777. The General Partner may, in its sole discretion, elect to waive the management fee with respect to any limited partner.
As of December 31, 2007, the Subsidiary Partnership had unrealized loss on swap contracts with affiliated entities managed by PSCM of $518,087. This amount relates to total return swap contracts with the affiliated entities whereby the Subsidiary Partnership has economic exposure to various credit default swaps held by the affiliated
entities. The credit default swap contracts were purchased for the purpose of hedging the Subsidiary Partnership’s credit exposure to certain option contract counterparties. The Subsidiary Partnership has the same terms and economic attributes as if it were the direct buyer of these credit default swap contracts and therefore all income and loss associated with these swap contracts are reflected in the Subsidiary Partnership’s consolidated statement of operations.
During the period from June 1, 2007 (commencement of operations) to December 31, 2007, Pershing Square, L.P. (“PSLP”) and Pershing Square International Ltd. (“PSINTL”), affiliated investment funds managed by PSCM, had an investment in the Partnership and the Fund, respectively. PSLP and PSINTL were not charged a
management fee nor a performance allocation.
11
Pershing Square IV A, L.P.
Notes to Consolidated Financial Statements (continued)
6. Guarantees
The Subsidiary Partnership enters into contracts that contain a variety of indemnifications. The Subsidiary Partnership’s maximum exposure under these arrangements is unknown. However, the Subsidiary Partnership has not had prior claims or losses pursuant to these contracts and expects the risk of loss to be remote.
7. Allocation of Net Income/(Loss)
In accordance with the Agreement, net income or loss is allocated as of the last business day of each Fiscal Period, as defined, to all partners in proportion to each partner’s capital account at the time of such allocation.
At the end of each fiscal year or upon a limited partners’ full redemption, for each limited partner’s capital account which has been allocated net income, there shall be allocated to the capital accounts of the General Partner, 20% of the excess of the net income allocated to such limited partner’s capital account above
the loss carryforward, if any, and the management fee with respect to the limited partner’s capital account. The General Partner in its sole discretion has reduced the performance allocation to 10% for those limited partners that made initial contributions of at least $100 million. For the period from June 1, 2007 (commencement of operations) to December 31, 2007, there was no performance allocation.
The General Partner may, in its sole discretion, elect to waive or reduce the performance allocation with respect to any limited partner.
8. Partners’ Capital
In accordance with the Agreement, a limited partner commits capital until December 31, 2009 (the “Lock-Up Date”). The General Partner, in its sole discretion, may advance or extend the Lock-Up Date for up to one year beyond December 31, 2009 if the General Partner believes it is in the best interest of the Subsidiary Partnership
to do so.
12
Pershing Square IV A, L.P.
Notes to Consolidated Financial Statements (continued)
9. Financial Highlights
The following represents the ratios to average limited partners’ capital and total return information for the financial highlights for the period from June 1, 2007 (commencement of operations) to December 31, 2007.
|
Ratios to average limited partners’ capital:
|
||||
|
Expenses
|
0.24 | % | ||
|
Net investment income
|
0.83 | % | ||
|
Total return
|
(42.77 | )% | ||
The above ratios and total return are calculated for all limited partners taken as a whole and have not been annualized. Individual partner’s ratios or returns may vary from the above based on different management fee and performance allocation arrangements.
13
AMERICREDIT CORP.
(dollars in thousands)
| June 30, | ||||||||
|
2009
(a)
(Revised) |
2008
(a)
(Revised) |
|||||||
|
Assets
|
||||||||
|
Cash and cash equivalents
|
$ | 193,287 | $ | 433,493 | ||||
|
Finance receivables, net
|
10,037,329 | 14,030,299 | ||||||
|
Restricted cash—securitization notes payable
|
851,606 | 982,670 | ||||||
|
Restricted cash—credit facilities
|
195,079 | 259,699 | ||||||
|
Property and equipment, net
|
44,195 | 55,471 | ||||||
|
Leased vehicles, net
|
156,387 | 210,857 | ||||||
|
Deferred income taxes
|
75,782 | 280,755 | ||||||
|
Income tax receivable
|
197,579 | 22,897 | ||||||
|
Other assets
|
207,083 | 232,060 | ||||||
|
Total assets
|
$ | 11,958,327 | $ | 16,508,201 | ||||
|
Liabilities and Shareholders’ Equity
|
||||||||
|
Liabilities:
|
||||||||
|
Credit facilities
|
$ | 1,630,133 | $ | 2,928,161 | ||||
|
Securitization notes payable
|
7,426,687 | 10,420,327 | ||||||
|
Senior notes
|
91,620 | 200,000 | ||||||
|
Convertible senior notes
|
392,514 | 642,599 | ||||||
|
Accrued taxes and expenses
|
157,640 | 237,906 | ||||||
|
Interest rate swap agreements
|
131,885 | 72,697 | ||||||
|
Other liabilities
|
20,540 | 41,249 | ||||||
|
Total liabilities
|
9,851,019 | 14,542,939 | ||||||
|
Commitments and contingencies (Note 11)
|
||||||||
|
Shareholders’ equity:
|
||||||||
|
Preferred stock, $.01 par value per share, 20,000,000 shares authorized; none issued
|
||||||||
|
Common stock, $.01 par value per share, 350,000,000 shares authorized; 134,977,812 and 118,766,250 shares issued
|
1,350 | 1,188 | ||||||
|
Additional paid-in capital
|
284,961 | 134,064 | ||||||
|
Accumulated other comprehensive loss
|
(21,099 | ) | (6,404 | ) | ||||
|
Retained earnings
|
1,878,459 | 1,889,348 | ||||||
| 2,143,671 | 2,018,196 | |||||||
|
Treasury stock, at cost (1,806,446 and 2,454,534 shares)
|
(36,363 | ) | (52,934 | ) | ||||
|
Total shareholders’ equity
|
2,107,308 | 1,965,262 | ||||||
|
Total liabilities and shareholders’ equity
|
$ | 11,958,327 | $ | 16,508,201 | ||||
| (a) | Revised for the Financial Accounting Standards Board (“FASB”) issuance of FASB Staff Position (“FSP”) Accounting Principles Board (“APB”) 14-1, Accounting for Convertible Debt Instruments That May be Settled in Cash upon Conversion (Including Partial Cash Settlement) (“FSP APB 14-1”) (Accounting Standards Codification “ASC” 470 20 65-1). See Note 1 – “Summary of Significant Accounting Policies – Adoption of New Accounting Standards” and Note 8 – “Senior Notes and Convertible Senior Notes” for additional information. |
The accompanying notes are an integral part of these consolidated financial statements.
1
AMERICREDIT CORP.
CONSOLIDATED STATEMENTS OF OPERATIONS AND COMPREHENSIVE OPERATIONS
(dollars in thousands, except per share data)
| Years Ended June 30, | ||||||||
|
2009
(a)
(Revised) |
2008
(a)
(Revised) |
|||||||
|
Revenue
|
||||||||
|
Finance charge income
|
$ | 1,902,684 | $ | 2,382,484 | ||||
|
Other income
|
116,488 | 160,598 | ||||||
|
Gain on retirement of debt
|
48,152 | |||||||
| 2,067,324 | 2,543,082 | |||||||
|
Costs and expenses
|
||||||||
|
Operating expenses
|
308,803 | 397,814 | ||||||
|
Lease depreciation
|
47,880 | 36,362 | ||||||
|
Provision for loan losses
|
972,381 | 1,130,962 | ||||||
|
Impairment of goodwill
|
212,595 | |||||||
|
Interest expense
|
726,560 | 858,874 | ||||||
|
Restructuring charges, net
|
11,847 | 20,116 | ||||||
| 2,067,471 | 2,656,723 | |||||||
|
Loss before income taxes
|
(147 | ) | (113,641 | ) | ||||
|
Income tax provision (benefit)
|
10,742 | (31,272 | ) | |||||
|
Net loss
|
(10,889 | ) | (82,369 | ) | ||||
|
Other comprehensive loss
|
||||||||
|
Unrealized losses on cash flow hedges
|
(26,871 | ) | (84,404 | ) | ||||
|
Foreign currency translation adjustment
|
750 | 5,855 | ||||||
|
Unrealized losses on credit enhancement assets
|
(232 | ) | ||||||
|
Income tax benefit
|
11,426 | 26,683 | ||||||
|
Other comprehensive loss
|
(14,695 | ) | (52,098 | ) | ||||
|
Comprehensive loss
|
$ | (25,584 | ) | $ | (134,467 | ) | ||
|
Loss per share
|
||||||||
|
Basic
|
$ | (0.09 | ) | $ | (0.72 | ) | ||
|
Diluted
|
$ | (0.09 | ) | $ | (0.72 | ) | ||
|
Weighted average shares
|
||||||||
|
Basic
|
125,239,241 | 114,962,241 | ||||||
|
Diluted
|
125,239,241 | 114,962,241 | ||||||
| (a) | Revised for FSP APB 14-1 (ASC 470 20 65-1), Accounting for Convertible Debt Instruments That May be Settled in Cash upon Conversion (Including Partial Cash Settlement). See Note 1 – “Summary of Significant Accounting Policies – Adoption of New Accounting Standards” and Note 8 – “Senior Notes and Convertible Senior Notes” for additional information. |
The accompanying notes are an integral part of these consolidated financial statements.
2
AMERICREDIT CORP.
CONSOLIDATED STATEMENTS OF SHAREHOLDERS’ EQUITY
(dollars in thousands)
| Common Stock |
Additional
Paid-in Capital (a) (Revised) |
Accumulated
Other Comprehensive Income (loss) |
Retained
Earnings (a) (Revised) |
Treasury Stock | ||||||||||||||||||||||
| Shares | Amount | Shares | Amount | |||||||||||||||||||||||
|
Balance at July 1, 2007
|
120,590,473 | $ | 1,206 | $ | 163,051 | $ | 45,694 | $ | 1,989,780 | 1,934,061 | $ | (43,139 | ) | |||||||||||||
|
Common stock issued on exercise of options
|
1,138,691 | 11 | 12,561 | |||||||||||||||||||||||
|
Common stock issued on exercise of warrants
|
1,065,047 | 11 | 8,581 | |||||||||||||||||||||||
|
FIN 48 tax liability adjustment
|
(463 | ) | ||||||||||||||||||||||||
|
Income tax benefit from exercise of options and amortization of convertible note hedges
|
13,443 | |||||||||||||||||||||||||
|
Common stock cancelled—restricted stock
|
(15,050 | ) | ||||||||||||||||||||||||
|
Common stock issued for employee benefit plans
|
987,089 | 10 | 2,140 | (214,377 | ) | 6,606 | ||||||||||||||||||||
|
Stock based compensation expense
|
17,945 | |||||||||||||||||||||||||
|
Repurchase of common stock
|
5,734,850 | (127,901 | ) | |||||||||||||||||||||||
|
Amortization of warrant costs
|
10,193 | |||||||||||||||||||||||||
|
Retirement of treasury stock
|
(5,000,000 | ) | (50 | ) | (93,850 | ) | (17,600 | ) | (5,000,000 | ) | 111,500 | |||||||||||||||
|
Other comprehensive loss, net of income tax benefit of $26,683
|
(52,098 | ) | ||||||||||||||||||||||||
|
Net loss
|
(82,369 | ) | ||||||||||||||||||||||||
|
Balance at June 30, 2008
|
118,766,250 | 1,188 | 134,064 | (6,404 | ) | 1,889,348 | 2,454,534 | (52,934 | ) | |||||||||||||||||
|
Common stock issued on exercise of options
|
131,654 | 1 | 1,053 | |||||||||||||||||||||||
|
Common stock issued relating to retirement of debt
|
15,122,670 | 151 | 90,830 | |||||||||||||||||||||||
|
Income tax benefit from exercise of options and amortization of convertible note hedges
|
10,678 | |||||||||||||||||||||||||
|
Common stock cancelled—restricted stock
|
(47,000 | ) | ||||||||||||||||||||||||
|
Common stock issued for employee benefit plans
|
1,004,238 | 10 | (11,029 | ) | (648,088 | ) | 16,571 | |||||||||||||||||||
|
Stock based compensation expense
|
14,264 | |||||||||||||||||||||||||
|
Amortization of warrant costs
|
45,101 | |||||||||||||||||||||||||
|
Other comprehensive loss, net of income tax benefit of $11,426
|
(14,695 | ) | ||||||||||||||||||||||||
|
Net loss
|
(10,889 | ) | ||||||||||||||||||||||||
|
Balance at June 30, 2009
|
134,977,812 | $ | 1,350 | $ | 284,961 | $ | (21,099 | ) | $ | 1,878,459 | 1,806,446 | $ | (36,363 | ) | ||||||||||||
| (a) | Revised for FSP APB 14-1 (ASC 470 20 65-1), Accounting for Convertible Debt Instruments That May be Settled in Cash upon Conversion (Including Partial Cash Settlement). See Note 1 – “Summary of Significant Accounting Policies – Adoption of New Accounting Standards” and Note 8 – “Senior Notes and Convertible Senior Notes” for additional information. |
The accompanying notes are an integral part of these consolidated financial statements.
3
AMERICREDIT CORP.
(in thousands)
| Years Ended June 30, | ||||||||
|
2009
(a)
(Revised) |
2008
(a)
(Revised) |
|||||||
|
Cash flows from operating activities
|
||||||||
|
Net loss
|
$ | (10,889 | ) | $ | (82,369 | ) | ||
|
Adjustments to reconcile net loss to net cash provided by operating activities:
|
||||||||
|
Depreciation and amortization
|
109,008 | 86,879 | ||||||
|
Provision for loan losses
|
972,381 | 1,130,962 | ||||||
|
Deferred income taxes
|
226,783 | (146,361 | ) | |||||
|
Stock based compensation expense
|
14,264 | 17,945 | ||||||
|
Amortization of warrant costs
|
45,101 | 10,193 | ||||||
|
Gain on retirement of debt
|
(48,907 | ) | ||||||
|
Impairment of goodwill
|
212,595 | |||||||
|
Non-cash interest charges on convertible debt
|
22,506 | 22,062 | ||||||
|
Accretion and amortization of loan fees
|
19,094 | 29,435 | ||||||
|
Other
|
2,773 | 6,126 | ||||||
|
Changes in assets and liabilities, net of assets and liabilities acquired:
|
||||||||
|
Income tax receivable
|
(174,682 | ) | (22,897 | ) | ||||
|
Other assets
|
(6,704 | ) | (15,627 | ) | ||||
|
Accrued taxes and expenses
|
(52,113 | ) | 11,018 | |||||
|
Net cash provided by operating activities
|
1,118,615 | 1,259,961 | ||||||
|
Cash flows from investing activities
|
||||||||
|
Purchases of receivables
|
(1,280,291 | ) | (6,260,198 | ) | ||||
|
Principal collections and recoveries on receivables
|
4,257,637 | 6,108,690 | ||||||
|
Distributions from gain on sale Trusts
|
7,466 | |||||||
|
Purchases of property and equipment
|
(1,003 | ) | (8,463 | ) | ||||
|
Net purchases of leased vehicles
|
(198,826 | ) | ||||||
|
Investment in money market fund
|
(115,821 | ) | ||||||
|
Proceeds from money market fund
|
104,319 | |||||||
|
Change in restricted cash—securitization notes payable
|
131,064 | 31,683 | ||||||
|
Change in restricted cash—credit facilities
|
63,180 | (92,754 | ) | |||||
|
Change in other assets
|
12,960 | (41,731 | ) | |||||
|
Net cash provided (used) by investing activities
|
3,172,045 | (454,133 | ) | |||||
|
Cash flows from financing activities
|
||||||||
|
Net change in credit facilities
|
(1,278,117 | ) | 385,611 | |||||
|
Issuance of securitization notes payable
|
1,000,000 | 4,250,000 | ||||||
|
Payments on securitization notes payable
|
(3,987,424 | ) | (5,774,035 | ) | ||||
|
Retirement of convertible debt
|
(238,617 | ) | ||||||
|
Debt issuance costs
|
(32,609 | ) | (39,347 | ) | ||||
|
Repurchase of common stock
|
(127,901 | ) | ||||||
|
Net proceeds from issuance of common stock
|
3,741 | 25,174 | ||||||
|
Other net changes
|
(603 | ) | 323 | |||||
|
Net cash used by financing activities
|
(4,533,629 | ) | (1,280,175 | ) | ||||
|
Net decrease in cash and cash equivalents
|
(242,969 | ) | (474,347 | ) | ||||
|
Effect of Canadian exchange rate changes on cash and cash equivalents
|
2,763 | (2,464 | ) | |||||
|
Cash and cash equivalents at beginning of year
|
433,493 | 910,304 | ||||||
|
Cash and cash equivalents at end of year
|
$ | 193,287 | $ | 433,493 | ||||
| (a) | Revised for FSP APB 14-1 (ASC 470 20 65-1), Accounting for Convertible Debt Instruments That May be Settled in Cash upon Conversion (Including Partial Cash Settlement). See Note 1 – “Summary of Significant Accounting Policies – Adoption of New Accounting Standards” and Note 8 – “Senior Notes and Convertible Senior Notes” for additional information. |
The accompanying notes are an integral part of these consolidated financial statements.
4
AMERICREDIT CORP.
NOTES TO CONSOLIDATED FINANCIAL STATEMENTS
| 1. | Summary of Significant Accounting Policies |
History and Operations
We were formed on August 1, 1986, and, since September 1992, have been in the business of purchasing and servicing automobile sales finance contracts. From January 2007 through May 2008, we also originated leases on automobiles.
Basis of Presentation
The consolidated financial statements include our accounts and the accounts of our wholly-owned subsidiaries, including certain special purpose financing trusts utilized in securitization transactions (“Trusts”) which are considered variable interest entities. All intercompany transactions and accounts have been eliminated in consolidation. Certain prior year amounts have been reclassified
to conform to the current year presentation.
The preparation of financial statements in conformity with accounting principles generally accepted in the United States of America requires management to make estimates and assumptions which affect the reported amounts of assets and liabilities and the disclosures of contingent assets and liabilities as of the date of the financial statements and the amount of revenue and costs and expenses
during the reporting periods. Actual results could differ from those estimates and those differences may be material. These estimates include, among other things, the determination of the allowance for loan losses on finance receivables, stock based compensation and income taxes.
Recent Market Developments
We anticipate a number of factors will continue to adversely impact our liquidity in fiscal 2010: (i) higher credit enhancement levels in our credit facilities and in any securitization transactions we may execute, (ii) unprecedented disruptions in the capital markets making the availability of credit facilities and execution of securitization transactions more challenging and expensive,
and (iii) decreasing cash distributions from our securitization Trusts due to weaker credit performance.
Throughout calendar 2008 and the first half of calendar 2009, we continually revised our operating plans in an effort to preserve and strengthen our capital and liquidity position and to maintain sufficient capacity on our credit facilities to fund new loan originations until capital market conditions improve for securitization transactions. Under these revised plans, we increased the minimum
credit score requirements and tightened loan structures for new loan originations, decreased our originations infrastructure by closing and consolidating credit center locations, selectively decreased the number of dealers from whom we purchase loans and reduced originations and support function headcount. We have discontinued new originations in our direct lending, leasing and specialty prime platforms, certain partner relationships, and in Canada. Our origination levels were reduced to $175 million for the
three months ended June 30, 2009, compared to $780 million for the three months ended June 30, 2008. We completed a securitization transaction in July 2009 and used the proceeds primarily to repay borrowings under our credit facilities. As a result, we have greater unused borrowing capacity on our credit facilities and we are seeking to modestly increase origination levels in fiscal 2010 from our annualized originations levels for the three months ended June 30, 2009.
We believe we have sufficient liquidity and warehouse capacity to operate through fiscal 2010. With the amendment of our master warehouse facility, execution of our AMCAR 2009-1 securitization and our current targeted level of new loan originations we do not anticipate having to access the securitization market again until the second half of fiscal 2010. However, if we are unable to renew our
master warehouse facility at a sufficient
5
size at maturity in March 2010 or if the asset-backed securities market is not accessible on reasonable terms in the second half of fiscal 2010, we may need to curtail or even suspend origination activities to sustain adequate liquidity.
Cash Equivalents
Investments in highly liquid securities with original maturities of 90 days or less are included in cash and cash equivalents.
Finance Receivables
Finance receivables are carried at amortized cost, net of allowance for loan losses.
Allowance for Loan Losses
Provisions for loan losses are charged to operations in amounts sufficient to maintain the allowance for loan losses at a level considered adequate to cover probable credit losses inherent in our finance receivables.
The allowance for loan losses is established systematically based on the determination of the amount of probable credit losses inherent in the finance receivables as of the reporting date. We review charge-off experience factors, delinquency reports, historical collection rates, estimates of the value of the underlying collateral, economic trends, such as unemployment rates, and other information
in order to make the necessary judgments as to probable credit losses. We also use historical charge-off experience to determine a loss confirmation period, which is defined as the time between when an event, such as delinquency status, giving rise to a probable credit loss occurs with respect to a specific account and when such account is charged off. This loss confirmation period is applied to the forecasted probable credit losses to determine the amount of losses inherent in finance receivables at the reporting
date. Assumptions regarding probable credit losses and loss confirmation periods are reviewed periodically and may be impacted by actual performance of finance receivables and changes in any of the factors discussed above.
Charge-off Policy
Our policy is to charge off an account in the month in which the account becomes 120 days contractually delinquent if we have not repossessed the related vehicle. We charge off accounts in repossession when the automobile is repossessed and legally available for disposition. A charge-off generally represents the difference between the estimated net sales proceeds and the amount of the delinquent
contract, including accrued interest. Accounts in repossession that have been charged off have been removed from finance receivables and the related repossessed automobiles, aggregating $20.4 million and $39.7 million at June 30, 2009 and 2008, respectively, are included in other assets on the consolidated balance sheets pending sale.
Securitization
The structure of our securitization transactions does not qualify under the accounting criteria for sales of finance receivables and, accordingly, such securitization transactions have been accounted for as secured financings. Therefore, following a securitization, the finance receivables and the related securitization notes payable remain on the consolidated balance sheets. We recognize finance
charge and fee income on the receivables and interest expense on the securities issued in the securitization transaction, and record a provision for loan losses to recognize probable loan losses inherent in the finance receivables. Cash pledged to support the securitization transaction is deposited to a restricted account and recorded on our consolidated balance sheets as restricted cash—securitization notes payable, which is invested in highly liquid securities with original maturities of 90 days or less
or in highly rated guaranteed investment contracts.
6
Prior to October 1, 2002, we structured our securitization transactions to meet the accounting criteria for sales of finance receivables. We also acquired two securitization Trusts which were accounted for as sales of receivables. Such securitization transactions are referred to herein as gain on sale Trusts. We had no gain on sale Trusts outstanding as of June 30, 2009.
Property and Equipment
Property and equipment are carried at cost less accumulated depreciation. Depreciation is generally provided on a straight-line basis over the estimated useful lives of the assets, which ranges from three to 25 years. The cost of assets sold or retired and the related accumulated depreciation are removed from the accounts at the time of disposition and any resulting gain or loss is included in
operations. Maintenance, repairs and minor replacements are charged to operations as incurred; major replacements and betterments are capitalized.
Leased Vehicles
Leased vehicles consist of automobiles leased to consumers. These assets are reported at cost, less accumulated depreciation. Depreciation expense is recorded on a straight-line basis over the term of the lease. Leased vehicles are depreciated to the estimated residual value at the end of the lease term. Residual values of operating leases are evaluated individually for impairment
under Statement of Financial Accounting Standards (“SFAS”) No. 144,
Accounting for the Impairment or Disposal of Long-Lived Assets
(“SFAS 144”) (Accounting Standards Codification
TM
(“ASC”) 360 10 55). Under SFAS 144 (ASC 360 10 55), when
aggregate future cash flows from the operating lease, including the expected realizable fair value of the leased asset at the end of the lease, are less than the book value of the lease, an immediate impairment write-down is recognized if the difference is deemed not recoverable. Otherwise, reductions in the expected residual value result in additional depreciation of the leased asset over the remaining term of the lease. Upon disposition, a gain or loss is recorded for any difference between the net book value
of the lease and the proceeds from the disposition of the asset, including any insurance proceeds.
Goodwill
Under the purchase method of accounting, the net assets of entities acquired by us are recorded at their estimated fair value at the date of acquisition. The excess cost of the acquisition over the fair value is recorded as goodwill. Goodwill with an indefinite life is subject to impairment testing. Goodwill impairment is determined using a two-step process. The first step of the goodwill impairment
test is to identify potential impairment by comparing the fair value of the reporting unit with its carrying amount, including goodwill. We have determined that we have only one reporting unit. If the fair value of a reporting unit exceeds its carrying amount, goodwill of the reporting unit is considered not impaired and the second step of the impairment test is not required. If the carrying amount of a reporting unit exceeds its fair value, the second step of the goodwill impairment test is performed to measure
the amount of the impairment loss, if any. The second step of the goodwill impairment test compares the implied fair value (i.e., the fair value of reporting unit less the fair value of the unit’s assets and liabilities, including identifiable intangible assets) of the reporting unit’s goodwill with the carrying amount of that goodwill. If the carrying value of goodwill exceeds its implied fair value, the excess is required to be recorded as an impairment charge in earnings. Our annual goodwill impairment
analysis performed during the fourth quarter of the year ended June 30, 2008 resulted in the determination that the goodwill was fully impaired.
Derivative Financial Instruments
We recognize all of our derivative financial instruments as either assets or liabilities on our consolidated balance sheets at fair value. The accounting for changes in the fair value of each derivative financial instrument depends on whether it has been designated and qualifies as an accounting hedge, as well as the type of hedging relationship identified.
7
Our special purpose finance subsidiaries are contractually required to purchase derivative instruments as credit enhancement in connection with securitization transactions and credit facilities.
Interest Rate Swap Agreements
We utilize interest rate swap agreements to convert floating rate exposures on securities issued in securitization transactions to fixed rates, thereby hedging the variability in interest expense paid. Our interest rate swap agreements are designated as cash flow hedges on the floating rate debt of our securitization notes payable and may qualify for hedge accounting treatment, while others do
not qualify and are marked to market through interest expense in our consolidated statements of operations. Cash flows from derivatives used to manage interest rate risk are classified as operating activities.
For interest rate swap agreements designated as hedges, we formally document all relationships between the interest rate swap agreement and the underlying asset, liability or cash flows being hedged, as well as our risk management objective and strategy for undertaking the hedge transactions. At hedge inception and at least quarterly, we also formally assess whether the interest rate swap agreements
that are used in hedging transactions have been highly effective in offsetting changes in the cash flows or fair value of the hedged items and whether those interest rate swap agreements may be expected to remain highly effective in future periods. In addition, we also assess the continued probability that the hedged cash flows will be realized.
We use regression analysis to assess hedge effectiveness of our cash flow hedges on a prospective and retrospective basis. A derivative financial instrument is deemed to be effective if the X-coefficient from the regression analysis is between a range of 0.80 and 1.25. At June 30, 2009, all of our interest rate swap agreements designated as cash flow hedges fall within this range and are
deemed to be effective hedges for accounting purposes. We use the hypothetical derivative method to measure the amount of ineffectiveness and a net earnings impact occurs when the change in the value of a derivative instrument does not offset the change in the value of the underlying hedged item. Ineffectiveness of our hedges is not material.
The effective portion of the changes in the fair value of the interest rate swaps qualifying as cash flow hedges are included as a component of accumulated other comprehensive loss as an unrealized gain or loss on cash flow hedges. These unrealized gains or losses are recognized as adjustments to income over the same period in which cash flows from the related hedged item affect earnings. However,
if we expect the continued reporting of a loss in accumulated other comprehensive income would lead to recognizing a net loss on the combination of the interest rate swap agreements and the hedged item, the loss is reclassified to earnings for the amount that is not expected to be recovered. Additionally, to the extent that any of these contracts are not considered to be perfectly effective in offsetting the change in the value of the cash flows being hedged, any changes in fair value relating to the ineffective
portion of these contracts are recognized in interest expense on our consolidated statements of operations and comprehensive operations. We discontinue hedge accounting prospectively when it is determined that an interest rate swap agreement has ceased to be effective as an accounting hedge or if the underlying hedged cash flow is no longer probable of occurring.
Interest Rate Cap Agreements
Generally, we purchase interest rate cap agreements to limit floating rate exposures on securities issued in our credit facilities. As part of our interest rate risk management strategy and when economically feasible, we may simultaneously sell a corresponding interest rate cap agreement in order to offset the premium paid to purchase the interest rate cap agreement and thus retain the interest
rate risk. The fair value of our interest rate cap agreements purchased by our special purpose finance subsidiaries is included in other assets on the consolidated balance sheets. The fair value of our interest rate cap agreements sold by us is included in other liabilities on the consolidated balance sheets. Because the interest rate cap agreements entered into by us or our special purpose finance subsidiaries do not qualify for hedge accounting, changes in the fair value of interest rate cap agreements purchased
by the special purpose finance subsidiaries and interest rate cap agreements sold by us are recorded in interest expense on our consolidated statements of operations and comprehensive operations.
8
We do not use derivative instruments for trading or speculative purposes.
Interest rate risk management contracts are generally expressed in notional principal or contract amounts that are much larger than the amounts potentially at risk for nonpayment by counterparties. Therefore, in the event of nonperformance by the counterparties, our credit exposure is limited to the uncollected interest and the market value related to the contracts that have become favorable
to us. We manage the credit risk of such contracts by using highly rated counterparties, establishing risk limits and monitoring the credit ratings of the counterparties.
We maintain a policy of requiring that all derivative contracts be governed by an International Swaps and Derivatives Association Master Agreement. We enter into arrangements with individual counterparties that we believe are creditworthy and generally settle on a net basis. In addition, we perform a quarterly assessment of our counterparty credit risk, including a review of credit ratings, credit
default swap rates and potential nonperformance of the counterparty. Based on our most recent quarterly assessment of our counterparty credit risk, we consider this risk to be low.
Income Taxes
Deferred income taxes are provided in accordance with the asset and liability method of accounting for income taxes to recognize the tax effects of tax credits and temporary differences between financial statement and income tax accounting. A valuation allowance is recognized if it is more likely than not that some portion or the entire deferred tax asset will not be realized.
Since July 1, 2007, we have accounted for uncertainty in income taxes recognized in the financial statements in accordance with FIN No. 48 (“FIN 48”) (ASC 740 10 65-1),
Accounting for Uncertainty in Income Taxes—an interpretation of FASB Statement 109
. See Note 15 – “Income Taxes” for a discussion
of the impact of implementing FIN 48 (ASC 740 10 65-1).
Revenue Recognition
Finance Charge Income
Finance charge income related to finance receivables is recognized using the interest method. Accrual of finance charge income is suspended on accounts that are more than 60 days delinquent, accounts in bankruptcy, and accounts in repossession. Fees and commissions received and direct costs of originating loans are deferred and amortized over the term of the related finance receivables using the
interest method and are removed from the consolidated balance sheets when the related finance receivables are sold, charged off or paid in full.
Operating Leases – deferred origination fees or costs
Net deferred origination fees or costs are amortized on a straight-line basis over the life of the lease to other income.
Stock Based Compensation
We account for stock based compensation under SFAS No. 123(R),
Share-Based Payment, Revised 2004
(“SFAS 123R”) (ASC 718 10 30), as interpreted by Securities and Exchange Commission Staff Accounting Bulletin No. 107 (“SAB 107”) (ASC 718 10 30), which requires that the cost resulting from all share-based payment
transactions be measured at fair value and recognized in the financial statements. For the years ended June 30, 2009 and 2008, we have recorded total stock based compensation expense of $14.3 million ($9.2 million net of tax) and $17.9 million ($13.5 million net of tax), respectively.
The excess tax benefit of the stock based compensation expense related to the exercise of stock options of $1.3 million for the year ended June 30, 2008 has been included in other net changes as a cash inflow from financing activities on the consolidated statements of cash flows.
9
The fair value of each option granted or modified was estimated using an option-pricing model with the following weighted average assumptions:
|
Years Ended June 30,
|
2009 | 2008 | ||||
|
Expected dividends
|
0 | 0 | ||||
|
Expected volatility
|
92.1 | % | 60.8 | % | ||
|
Risk-free interest rate
|
1.7 | % | 3.3 | % | ||
|
Expected life
|
2.0 years | 1.2 years |
We have not paid out dividends historically, thus the dividend yields are estimated at zero percent.
Expected volatility reflects an average of the implied and historical volatility rates. Management believes that a combination of market-based measures is currently the best available indicator of expected volatility.
The risk-free interest rate is the implied yield available for zero-coupon U.S. government issues with a remaining term equal to the expected life of the options.
The expected lives of options are determined based on our historical option exercise experience and the term of the option.
Assumptions are reviewed each time there is a new grant or modification of a previous grant and may be impacted by actual fluctuation in our stock price, movements in market interest rates and option terms. The use of different assumptions produces a different fair value for the options granted or modified and impacts the amount of compensation expense recognized on the consolidated statements
of operations and comprehensive operations.
Subsequent Events
In July 2009, we completed a $725 million senior subordinated securitization, AMCAR 2009-1, that had initial cash deposit and overcollateralization requirements of 28.1% and a weighted average all-in cost of 7.5%. The triple-A rated notes issued in this transaction were eligible for investors to borrow under the Federal Reserve’s Term Asset-Backed Securities Facility (“TALF”)
program, which provides for loans of up to $200 billion against triple-A rated asset-backed securities collateralized by among other asset classes, auto loans. We used the proceeds of this securitization to paydown the outstanding balance of our master warehouse facility leaving unused capacity of approximately $1.0 billion.
As of and subsequent to June 30, 2009, we were in violation of a covenant relating to a required interest rate hedge contained in our prime/near prime facility and such violation was cured and waived by the lenders in August 2009.
During September and October 2009, we received the $198 million income tax refund.
In October 2009, the lease warehouse facility was repaid in full.
In November 2009, we completed a $227.5 million senior subordinated securitization, AmeriCredit Prime Automobile Receivables Trust (“APART”) 2009-1, that had initial cash deposit and overcollateralization requirements of 23.8% and a weighted average all – in cost of 2.7%. The proceeds from this securitization were used to repay borrowings and retire our prime/near
prime credit facility.
Adoption of New Accounting Standards
As of July 1, 2009, we adopted FSP APB 14-1 (ASC 470 20 65-1), Accounting for Convertible Debt Instruments That May be Settled in Cash upon Conversion (Including Partial Cash Settlement). FSP APB 14-1
10
(ASC 470 20 65-1) specifies that when issuers of convertible debt instruments with cash settlement features recognize interest cost in subsequent periods, they should separately account for the liability and equity components of the instrument in a manner that will reflect the entity’s borrowing rate at the time of issuance for similar unsecured senior debt without an equity conversion feature. FSP APB 14-1
(ASC 470 20 65-1) is effective for fiscal years beginning after December 15, 2008, and interim periods within those fiscal years. The transition provision requires that entities retrospectively apply FSP APB 14-1 (ASC 470 20 65-1) for all periods presented. Our convertible senior notes due in September 2011 and September 2013 are affected by the adoption of this FSP. See Note 8 – “Senior Notes and Convertible Senior Notes” for further discussion.
The following table presents balance sheet data as reported, as revised and the cumulative effect of adoption for the retrospective adoption of FSP APB 14-1 (ASC 470 20 65-1) (in thousands):
| June 30, 2009 | June 30, 2008 | |||||||||||||||||||
|
As
Reported |
As
Revised |
Cumulative
Effect of Adoption |
As
Reported |
As
Revised |
Cumulative
Effect of Adoption |
|||||||||||||||
|
Deferred income taxes
|
$ | 100,139 | $ | 75,782 | $ | (24,357 | ) | $ | 317,319 | $ | 280,755 | $ | (36,564 | ) | ||||||
|
Other assets
|
208,613 | 207,083 | (1,530 | ) | 234,505 | 232,060 | (2,445 | ) | ||||||||||||
|
Convertible senior notes
|
462,017 | 392,514 | (69,503 | ) | 750,000 | 642,599 | (107,401 | ) | ||||||||||||
|
Additional paid-in capital
|
193,233 | 284,961 | 91,728 | 42,336 | 134,064 | 91,728 | ||||||||||||||
|
Retained earnings
|
1,926,571 | 1,878,459 | (48,112 | ) | 1,912,684 | 1,889,348 | (23,336 | ) | ||||||||||||
The following table presents consolidated statements of operations and comprehensive operations data as reported and as revised for the retrospective adoption of FSP APB 14-1 (ASC 470 20 65-1) (dollars in thousands, except for share data):
|
Year ended
June 30, 2009 |
Year ended
June 30, 2008 |
||||||||||||||
|
As
Reported |
As
Revised |
As
Reported |
As
Revised |
||||||||||||
|
Gain on retirement of debt
|
$ | 63,195 | $ | 48,152 | |||||||||||
|
Interest Expense
|
704,620 | 726,560 | $ | 837,412 | $ | 858,874 | |||||||||
|
Income (loss) before income taxes
|
36,836 | (147 | ) | (92,179 | ) | (113,641 | ) | ||||||||
|
Income tax provision
|
|||||||||||||||
|
(benefit)
|
22,949 | 10,742 | (22,860 | ) | (31,272 | ) | |||||||||
|
Net income (loss)
|
13,887 | (10,889 | ) | (69,319 | ) | (82,369 | ) | ||||||||
|
Earnings (loss) per share:
|
|||||||||||||||
|
Basic
|
$ | 0.11 | $ | (0.09 | ) | $ | (0.60 | ) | $ | (0.72 | ) | ||||
|
Diluted
|
$ | 0.11 | $ | (0.09 | ) | $ | (0.60 | ) | $ | (0.72 | ) | ||||
|
Weighted average shares—Diluted
|
129,381,343 | 125,239,241 | |||||||||||||
The following table presents consolidated statement of cash flows data as reported and as revised for the retrospective adoption of FSP APB 14-1 (ASC 470 20 65-1) (in thousands):
|
Year ended
June 30, 2009 |
Year ended
June 30, 2008 |
|||||||||||||||
|
As
Reported |
As
Revised |
As
Reported |
As
Revised |
|||||||||||||
|
Net income (loss)
|
$ | 13,887 | $ | (10,889 | ) | $ | (69,319 | ) | $ | (82,369 | ) | |||||
|
Depreciation and amortization
|
109,574 | 109,008 | 87,479 | 86,879 | ||||||||||||
|
Deferred income taxes
|
238,990 | 226,783 | (137,949 | ) | (146,361 | ) | ||||||||||
|
Non-cash interest charges on convertible debt
|
22,506 | 22,062 | ||||||||||||||
|
Gain on retirement of debt
|
(63,950 | ) | (48,907 | ) | ||||||||||||
11
Recently Issued Accounting Pronouncements
Statement of Financial Accounting Standards No. 141R
In December 2007, the FASB issued Statement of Financial Accounting Standards (“SFAS”) No. 141R,
Business Combinations
(“SFAS 141R”) (ASC 805 10 65-1), which replaces Statement of Financial Accounting Standards No. 141,
Business Combinations
. SFAS
141R (ASC 805 10 65-1) establishes principles and requirements for determining how an enterprise recognizes and measures the fair value of certain assets and liabilities acquired in a business combination, including noncontrolling interests, contingent consideration and certain acquired contingencies. SFAS 141R also requires acquisition-related transaction expenses and restructuring costs be expensed as incurred rather than capitalized as a component of the business combination. SFAS 141R (ASC 805 10 65-1) will
be applicable prospectively to business combinations beginning in our 2010 fiscal year. We do not anticipate the adoption of SFAS 141R (ASC 805 10 65-1) to have an impact on our consolidated financial position, results of operations or cash flows.
Statement of Financial Accounting Standards No. 166
In June 2009, the FASB issued SFAS No. 166,
Accounting for Transfers of
Financial Assets – an amendment of FASB Statement No. 140
, (“SFAS 166”) (ASC 860 10 65-2). SFAS 166 (ASC 860 10 65-2) limits the circumstances in which a financial asset
should be derecognized when the transferor has not transferred the entire financial asset by taking into consideration the transferor’s continuing involvement. The standard requires that a transferor recognize and initially measure at fair value all assets obtained (including a transferor’s beneficial interest) and liabilities incurred as a result of a transfer of financial assets accounted for as a sale. The concept of a qualifying special-purpose entity is removed from SFAS No. 140,
Accounting
for Transfers and Servicing of Financial Assets and Extinguishments of Liabilities
along with the exception from applying Financial Accounting Standards Board Interpretation (“FIN”) 46(R)
Consolidation of Variable Interest Entities
(“FIN 46(R)”) (ASC 810 10 25-20). The standard is effective for us beginning with the first quarter in fiscal 2011. We are currently evaluating the impact that SFAS 166 (ASC 860 10 65-2) will
have on our consolidated financial position, results of operations or cash flows.
Statement of Financial Accounting Standards No. 167
In June 2009, the FASB issued SFAS No. 167,
Amendments to FASB Interpretation No. 46(R
), (“SFAS 167”) (ASC 810 10 25-20). The standard amends FIN 46(R) (ASC 810 10 25-20) to require a company to analyze whether its interest in a variable interest entity (“VIE”) gives it a controlling financial interest. A
company must assess whether it has an implicit financial responsibility to ensure that the VIE operates as designed when determining whether it has the power to direct the activities of the VIE that significantly impact its economic performance. Ongoing reassessment of whether a company is the primary beneficiary is also required by the standard. SFAS 167 (ASC 810 10 25-20) amends the criteria to qualify as a primary beneficiary as well as how to determine the existence of a VIE. The standard also
eliminates certain exceptions that were available under FIN 46(R) (810 10 25-20). SFAS 167 (ASC 810 10 25-20) is effective for us beginning with the first quarter in fiscal 2011. Comparative disclosures will be required for periods after the effective date. We are currently evaluating the impact that SFAS 167 (ASC 810 10 25-20) will have on our consolidated financial position, results of operations or cash flows.
Statement of Financial Accounting Standards No. 168
In June 2009, the FASB issued SFAS No. 168
The FASB Accounting Standards Codification
TM
and
the
Hierarchy of Generally Accepted
Accounting Principles – a replacement of FASB Statement No. 162
(“SFAS 168”) (ASC 105 10 65-1). SFAS 168 (ASC 105 10 65-1) establishes the FASB Accounting Standards Codification
TM
(“Codification”)
as the source of authoritative generally accepted accounting principles for nongovernmental entities. SFAS 168 (ASC 105 10 65-1) is effective for interim and annual periods ending after September 15, 2009 and is not expected to have any impact on our consolidated financial statements. Between now and adoption, we have included the ASC references in parenthesis.
12
| 2. | Finance Receivables |
Finance receivables consist of the following (in thousands):
|
June 30,
|
2009 | 2008 | ||||||
|
Finance receivables unsecuritized, net of fees
|
$ | 2,534,158 | $ | 3,572,214 | ||||
|
Finance receivables securitized, net of fees
|
8,393,811 | 11,409,198 | ||||||
|
Less nonaccretable acquisition fees
|
(12,100 | ) | (42,802 | ) | ||||
|
Less allowance for loan losses
|
(878,540 | ) | (908,311 | ) | ||||
| $ | 10,037,329 | $ | 14,030,299 | |||||
Finance receivables securitized represent receivables transferred to our special purpose finance subsidiaries in securitization transactions accounted for as secured financings. Finance receivables unsecuritized include $2,037.6 million and $3,327.3 million pledged under our credit facilities as of June 30, 2009 and 2008, respectively.
Finance receivables are collateralized by vehicle titles and we have the right to repossess the vehicle in the event the consumer defaults on the payment terms of the contract.
The accrual of finance charge income has been suspended on $667.3 million and $728.8 million of delinquent finance receivables as of June 30, 2009 and 2008, respectively.
Finance contracts are purchased by us from auto dealers without recourse, and accordingly, the dealer has no liability to us if the consumer defaults on the contract. Depending upon the contract structure and consumer credit attributes, we may pay dealers a participation fee or we may charge dealers a non-refundable acquisition fee when purchasing individual finance contracts. We record the amortization
of participation fees to finance charge income using the effective interest method. We record the accretion of acquisition fees on loans purchased subsequent to June 30, 2004, to finance charge income using the effective interest method. We recorded acquisition fees on loans purchased prior to July 1, 2004, as nonaccretable fees available to cover losses inherent in the loan portfolio. Additionally, we recorded a discount on finance receivables repurchased upon the exercise of a clean-up call option
from our gain on sale securitization transactions and accounted for such discounts as nonaccretable discounts.
A summary of nonaccretable acquisition fees is as follows (in thousands):
|
Years Ended June 30,
|
2009 | 2008 | ||||||
|
Balance at beginning of year
|
$ | 42,802 | $ | 120,425 | ||||
|
Repurchase of receivables
|
109 | |||||||
|
Net charge-offs
|
(30,702 | ) | (77,732 | ) | ||||
|
Balance at end of year
|
$ | 12,100 | $ | 42,802 | ||||
A summary of the allowance for loan losses is as follows (in thousands):
|
Years ended June 30,
|
2009 | 2008 | ||||||
|
Balance at beginning of year
|
$ | 908,311 | $ | 699,663 | ||||
|
Acquisition of LBAC
|
||||||||
|
Provision for loan losses
|
972,381 | 1,130,962 | ||||||
|
Net charge-offs
|
(1,002,152 | ) | (922,314 | ) | ||||
|
Balance at end of year
|
$ | 878,540 | $ | 908,311 | ||||
13
| 3. | Securitizations |
A summary of our securitization activity and cash flows from special purpose entities used for securitizations is as follows (in thousands):
|
Years ended June 30,
|
2009 | 2008 | ||||
|
Receivables securitized
|
$ | 1,289,082 | $ | 4,634,083 | ||
|
Net proceeds from securitization
|
1,000,000 | 4,250,000 | ||||
|
Servicing fees:
|
||||||
|
Sold
|
28 | 168 | ||||
|
Secured financing
(a)
|
237,471 | 306,949 | ||||
|
Distributions from Trusts:
|
||||||
|
Sold
|
7,466 | |||||
|
Secured financing
|
429,457 | 668,510 | ||||
| (a) | Servicing fees earned on securitizations accounted for as secured financings are included in finance charge income on the consolidated statements of operations and comprehensive operations. |
We retain servicing responsibilities for receivables transferred to the Trusts. We earn a monthly base servicing fee on the outstanding principal balance of our securitized receivables and supplemental fees (such as late charges) for servicing the receivables. We believe that servicing fees received on our securitization pools represent adequate compensation based on the amount currently demanded
by the marketplace. Additionally, these fees are the same as would fairly compensate a substitute servicer should one be required and, thus, we record neither a servicing asset nor a servicing liability.
As of June 30, 2009 and 2008, we were servicing $8.4 billion and $11.4 billion, respectively, of finance receivables that have been transferred to securitization Trusts.
In April 2008, we entered into a one year, $2 billion forward purchase commitment agreement with Deutsche. Under this agreement and subject to certain terms, Deutsche committed to purchase triple-A rated asset-backed securities issued by our sub-prime AMCAR securitization platform in registered public offerings. We paid $20.0 million of upfront commitment fees and issued a warrant to purchase
up to 7.5 million shares of our common stock valued at $48.9 million in connection with the agreement. We utilized $752.8 million of the commitment in conjunction with the execution of our AMCAR 2008-1 and 2008-2 transactions. Unamortized warrant costs of $38.7 million and unamortized commitment fees of $15.8 million, as of June 30, 2008, are included in other assets on the consolidated balance sheets. Effective December 19, 2008, we executed a letter agreement with Deutsche whereby the parties
mutually agreed to terminate the forward purchase commitment agreement. The remaining unamortized warrant costs of $14.3 million and unamortized commitment fees of $5.8 million at the termination date were charged to interest expense during the year ended June 30, 2009. See Note 12 – “Common Stock and Warrants” for a discussion of warrants issued by us in connection with this transaction.
In September 2008, we entered into agreements with Wachovia Capital Markets, LLC and Wachovia Bank, National Association (together, “Wachovia”), to establish two funding facilities under which Wachovia would provide total funding of $117.7 million, during the one year term of the facilities, secured by asset-backed securities as collateral. In conjunction with our AMCAR 2008-1 transaction,
we obtained funding under these facilities of $48.9 million by pledging double-A rated asset-backed securities (the “Class B Notes”) as collateral and $68.8 million by pledging single-A rated asset-backed securities (the “Class C Notes”) as collateral. Under these funding facilities, we retained the Class B Notes and the Class C Notes issued in the transaction and then sold the retained notes to a special purpose subsidiary, which in turn pledged such retained notes as collateral to secure
the funding under the two facilities. Currently, the facilities are fully utilized. At the end of the one year term, the facilities, if not renewed, will amortize in accordance with the securitization transaction until paid off. We paid $1.9 million of upfront commitment fees and issued a warrant to purchase up to 1.0 million shares of
14
our common stock valued at $8.3 million in connection with these facilities, which are being amortized to interest expense over the one year term of the facilities. Unamortized warrant costs of $2.0 million and unamortized commitment fees of $0.5 million, as of June 30, 2009, are included in other assets on the consolidated balance sheets. See Note 12 – “Common Stock and Warrants” for a
discussion of warrants issued by us in connection with this transaction.
We have analyzed the warrant transactions under Emerging Issues Task Force Issue No. 00-19,
Accounting for Derivative Financial Instruments Indexed to and Potentially Settled In a Company’s Own Stock
(ASC 815 10 65-3), and determined they meet the criteria for classification as equity transactions. As a result, amortization of the
warrant costs is reflected in additional paid-in capital on our consolidated balance sheets, and we will not recognize subsequent changes in their fair value.
In November 2008, we entered into a purchase agreement with Fairholme under which Fairholme purchased $123.2 million of asset-backed securities, consisting of $50.6 million of Class B Notes and $72.6 million of Class C Notes in the AMCAR 2008-2 transaction. See Note 8 – “Senior Notes and Convertible Senior Notes” for discussion of other transactions with Fairholme.
| 4. | Investment in Money Market Fund |
We had an investment of $115.8 million in the Reserve Primary Money Market Fund (“the Reserve Fund”), a money market fund which has suspended redemptions and is in the process of liquidating its portfolio of investments. In mid-September 2008, the net asset value of the Reserve Fund decreased below $1 per share as a result of the trustees of the Reserve Fund valuing their investments
in Lehman Brothers Holdings Inc. (“LBHI”) debt securities held by the Reserve Fund at zero. Because redemptions of the fund have been suspended and are not readily convertible to cash, we reclassified this investment on our balance sheet from cash equivalents to other assets. We recognized an other-than-temporary impairment of $3.5 million, at September 30, 2008, by valuing the asset at the estimated net asset value of $0.97 per share as published by the Reserve Fund. As each security
in the portfolio matures or additional liquidity becomes available within the fund, the Reserve Fund has been making interim distributions to the investors in the fund on a pro rata basis. Changes in market conditions could result in further adjustments to the fair value of this investment. We have received $104.3 million as of June 30, 2009 as a partial distribution from the Reserve Fund and have a balance of $8.0 million included in other assets on our consolidated balance sheets.
| 5. | Goodwill Impairment |
On January 1, 2007, we acquired the stock of Long Beach Acceptance Corporation (“LBAC”). The total consideration in the all-cash transaction, including transaction costs, was approximately $287.7 million. We initially recorded goodwill of approximately $196.8 million, all of which is deductible for federal income tax purposes. On May 1, 2006, we acquired the stock of Bay
View Acceptance Corporation (“BVAC”). The total consideration in the all-cash transaction, including transaction costs, was approximately $64.6 million. We initially recorded goodwill of approximately $14.4 million, which is not deductible for federal income tax purposes. The operations of LBAC and BVAC have been integrated into our activities and we provide auto finance products solely under the AmeriCredit Financial Services, Inc. name.
We performed goodwill impairment testing at June 30, 2008, in accordance with the policy described in Note 1 – “Summary of Significant Accounting Policies – Goodwill”. Based on this testing, we fully impaired our goodwill balance and took a $212.6 million goodwill impairment charge for the year ended June 30, 2008.
The primary cause of the goodwill impairment was the decline in our market capitalization, which fell to $1,002.6 million at June 30, 2008. The decline, which was consistent with market capitalization declines experienced by other financial services companies over the same time period, was caused primarily by investor concerns over external factors, including capital markets dislocations
and the impact of weakening economic conditions on consumer loan portfolios.
15
In determining fair value of our assets and liabilities for the impairment testing, we used the book value as fair value except for the items described below. The fair value of finance receivables was estimated by discounting future cash flows expected to be collected using current rates at which similar loans would be made to borrowers with similar credit ratings and for the same remaining maturities.
The allowance for loan losses associated with the finance receivables was considered a reduction of fair value. Lastly, on the senior notes, convertible senior notes and securitization notes payable, we obtained current market quotes to determine fair value.
A summary of changes to goodwill is as follows (in thousands):
|
Year ended June 30,
|
2008 | |||
|
Balance at beginning of year
|
$ | 208,435 | ||
|
Acquisitions
|
||||
|
Adjustments to goodwill
|
4,160 | |||
|
Impairment
|
(212,595 | ) | ||
|
Balance at end of year
|
$ | |||
| 6. | Credit Facilities |
Amounts outstanding under our credit facilities are as follows (in thousands):
|
June 30,
|
2009 | 2008 | ||||
|
Master warehouse facility
|
$ | 569,756 | $ | 1,470,335 | ||
|
Medium term note facility
|
750,000 | 750,000 | ||||
|
Prime/Near prime facility
|
250,377 | 424,669 | ||||
|
Lease warehouse facility
|
60,000 | |||||
|
Call facility
|
156,945 | |||||
|
Canadian credit facility
|
126,212 | |||||
| $ | 1,630,133 | $ | 2,928,161 | |||
Further detail regarding terms and availability of the credit facilities as of June 30, 2009, follows (in thousands):
|
Maturity
(a)
|
Facility
Amount |
Advances
Outstanding |
Assets
Pledged (c) |
Restricted
Cash Pledged (d) |
||||||||
|
Master warehouse facility:
March 2010 |
$ | 1,090,399 | $ | 569,756 | $ | 729,547 | $ | 55,527 | ||||
|
Medium term note facility:
October 2009 (b) |
750,000 | 750,000 | 836,506 | 66,632 | ||||||||
|
Prime/Near Prime facility:
(e)
|
250,377 | 333,933 | 5,068 | |||||||||
|
Lease warehouse facility:
(f)
|
60,000 | 137,593 | 1,234 | |||||||||
| $ | 1,840,399 | $ | 1,630,133 | $ | 2,037,579 | $ | 128,461 | |||||
| (a) | Because the facilities are non-recourse to us, the outstanding debt balance at maturity will generally be repaid over time based on the amortization of receivables pledged. |
| (b) | This facility is a revolving facility through the date stated above. During the revolving period, we have the ability to substitute receivables for cash, or vice versa. |
| (c) | The warehouse facilities are collateralized by finance receivables, while the leasing facility is collateralized by leased assets. |
16
| (d) | These amounts do not include cash collected on finance receivables pledged of $66.6 million which is also included in restricted cash—credit facilities on the consolidated balance sheets. |
| (e) | In April 2009, the prime/near prime facility was amended to end the revolving period and the outstanding debt balance will be repaid over time based on the amortization of the receivables pledged. |
| (f) | In June 2009, the lease warehouse facility was amended to end the revolving period and to provide for quarterly payments of approximately $20.0 million until April 2010 when the facility will be repaid in full. |
Generally, our credit facilities are administered by agents on behalf of institutionally managed commercial paper or medium term note conduits. Under these funding agreements, we transfer finance receivables to our special purpose finance subsidiaries. These subsidiaries, in turn, issue notes to the agents, collateralized by such finance receivables and cash. The agents provide funding under
the notes to the subsidiaries pursuant to an advance formula, and the subsidiaries forward the funds to us in consideration for the transfer of finance receivables. While these subsidiaries are included in our consolidated financial statements, these subsidiaries are separate legal entities and the finance receivables and other assets held by these subsidiaries are legally owned by these subsidiaries and are not available to our creditors or our other subsidiaries. Advances under the funding agreements bear interest
at commercial paper, London Interbank Offered Rates (“LIBOR”) or prime rates plus a credit spread and specified fees depending upon the source of funds provided by the agents.
We are required to hold certain funds in restricted cash accounts to provide additional collateral for borrowings under certain of the facilities. Additionally, certain funding agreements contain various covenants requiring minimum financial ratios, asset quality and portfolio performance ratios (portfolio net loss and delinquency ratios, and pool level cumulative net loss ratios) as well as
limits on deferment levels. Failure to meet any of these covenants could result in an event of default under these agreements. If an event of default occurs under these agreements, the lenders could elect to declare all amounts outstanding under these agreements to be immediately due and payable, enforce their interests against collateral pledged under these agreements or restrict our ability to obtain additional borrowings under these agreements. As of and subsequent to June 30, 2009, we were in violation
of a covenant relating to a required interest rate hedge contained in our prime/near prime facility and such violation was cured and waived by the lenders in August 2009.
In March 2009, we amended and extended our master warehouse facility. The amendment, which was approved by all ten active lenders in the facility, reduced the size of the facility to $1,110.4 million from $2,245.0 million, and extended the revolving period to March 2010 from October 2009. In March 2010 when the revolving period ends, the outstanding balance will be repaid over time based on the
amortization of the receivables pledged until April 2011 when the remaining balance will be due and payable. We also amended certain covenants under the facility, including: (i) increasing the maximum rolling six-month annualized portfolio net loss ratio to 10.0% through October 2009, 12.0% through December 2009, 12.25% through March 2010 and 12.0% thereafter, (ii) removing the 364-day aging limitation on pledged receivables and (iii) lowering the minimum interest coverage requirement to 1.05 times
earnings before interest, taxes, depreciation and amortization, except for the September 2009, December 2009 and March 2010 quarters, when it is 0.75 times earnings before interest, taxes, depreciation and amortization. In conjunction with the amendment, the advance rate on the master warehouse facility declined immediately from approximately 85% to approximately 80% and will gradually decrease to approximately 68% by February 2010. In May 2009, we reduced the facility size to $1,090.4 million from $1,110.4
million and we further reduced the facility size in July 2009 to $1,000.0 million to align our borrowing capacity with our origination levels.
Also in March 2009, we amended the rolling six-month annualized portfolio net loss ratio covenant in our medium term note facility to levels consistent with changes in the master warehouse facility. In October 2009, when the revolving period ends, the outstanding balance will be repaid over time based on the amortization of the receivables pledged until October 2016 when any remaining amount
will be due and payable.
The call facility matured in August 2008 and was paid off in October 2008. Additionally, the Canadian facility was paid off in February 2009.
17
Debt issuance costs are being amortized to interest expense over the expected term of the credit facilities. Unamortized costs of $16.1 million and $6.0 million, as of June 30, 2009 and 2008, respectively, are included in other assets on the consolidated balance sheets.
| 7. | Securitization Notes Payable |
Securitization notes payable represents debt issued by us in securitization transactions. Debt issuance costs are being amortized over the expected term of the securitizations on an effective yield basis. Unamortized costs of $13.9 million and $19.3 million as of June 30, 2009 and 2008, respectively, are included in other assets on the consolidated balance sheets.
Securitization notes payable consists of the following (dollars in thousands):
|
Transaction
|
Maturity Date (b) |
Original
Note Amount |
Original
Weighted Average Interest Rate |
Receivables
Pledged at June 30, 2009 |
Note
Balance at June 30, 2009 |
Note
Balance at June 30, 2008 |
|||||||||||
|
2004-1
|
July 2010 | $ | 575,000 | 3.7 | % | $ | 50,021 | ||||||||||
|
2004-C-A
|
May 2011 | 800,000 | 3.2 | % | 99,661 | ||||||||||||
|
2004-D-F
|
July 2011 | 750,000 | 3.1 | % | $ | 52,412 | $ | 48,301 | 109,454 | ||||||||
|
2005-A-X
|
October 2011 | 900,000 | 3.7 | % | 79,824 | 72,264 | 151,411 | ||||||||||
|
2005-1
|
May 2011 | 750,000 | 4.5 | % | 78,216 | 57,059 | 113,814 | ||||||||||
|
2005-B-M
|
May 2012 | 1,350,000 | 4.1 | % | 181,403 | 159,428 | 296,382 | ||||||||||
|
2005-C-F
|
June 2012 | 1,100,000 | 4.5 | % | 179,442 | 160,112 | 285,458 | ||||||||||
|
2005-D-A
|
November 2012 | 1,400,000 | 4.9 | % | 273,615 | 245,084 | 421,117 | ||||||||||
|
2006-1
|
May 2013 | 945,000 | 5.3 | % | 210,883 | 162,775 | 270,935 | ||||||||||
|
2006-R-M
|
January 2014 | 1,200,000 | 5.4 | % | 504,996 | 452,604 | 715,365 | ||||||||||
|
2006-A-F
|
September 2013 | 1,350,000 | 5.6 | % | 413,020 | 371,300 | 588,536 | ||||||||||
|
2006-B-G
|
September 2013 | 1,200,000 | 5.2 | % | 426,749 | 386,480 | 595,651 | ||||||||||
|
2007-A-X
|
October 2013 | 1,200,000 | 5.2 | % | 490,888 | 447,945 | 672,867 | ||||||||||
|
2007-B-F
|
December 2013 | 1,500,000 | 5.2 | % | 714,178 | 650,889 | 951,863 | ||||||||||
|
2007-1
|
March 2016 | 1,000,000 | 5.4 | % | 432,416 | 430,801 | 645,013 | ||||||||||
|
2007-C-M
|
April 2014 | 1,500,000 | 5.5 | % | 814,717 | 742,002 | 1,071,037 | ||||||||||
|
2007-D-F
|
June 2014 | 1,000,000 | 5.5 | % | 590,417 | 539,020 | 759,468 | ||||||||||
|
2007-2-M
|
March 2016 | 1,000,000 | 5.3 | % | 564,692 | 535,200 | 765,260 | ||||||||||
|
2008-A-F
|
October 2014 | 750,000 | 6.0 | % | 652,465 | 518,835 | 742,073 | ||||||||||
|
2008-1
|
January 2015 | 500,000 | 8.7 | % | 528,438 | 388,355 | |||||||||||
|
2008-2
|
April 2015 | 500,000 | 10.5 | % | 556,940 | 400,108 | |||||||||||
|
BV2005-LJ-1
(a)
|
May 2012 | 232,100 | 5.1 | % | 25,631 | 26,800 | 49,736 | ||||||||||
|
BV2005-LJ-2
(a)
|
February 2014 | 185,596 | 4.6 | % | 25,844 | 26,668 | 46,981 | ||||||||||
|
BV2005-3
(a)
|
June 2014 | 220,107 | 5.1 | % | 41,560 | 43,065 | 71,883 | ||||||||||
|
LB2004-B
(a)
|
April 2011 | 250,000 | 3.5 | % | 26,417 | ||||||||||||
|
LB2004-C
(a)
|
July 2011 | 350,000 | 3.5 | % | 24,920 | 23,543 | 53,905 | ||||||||||
|
LB2005-A
(a)
|
April 2012 | 350,000 | 4.1 | % | 39,495 | 41,040 | 77,108 | ||||||||||
|
LB2005-B
(a)
|
June 2012 | 350,000 | 4.4 | % | 54,824 | 53,157 | 94,243 | ||||||||||
|
LB2006-A
(a)
|
May 2013 | 450,000 | 5.4 | % | 103,186 | 97,058 | 161,445 | ||||||||||
|
LB2006-B
(a)
|
September 2013 | 500,000 | 5.2 | % | 144,144 | 148,167 | 237,033 | ||||||||||
|
LB2007-A
|
January 2014 | 486,000 | 5.0 | % | 188,496 | 198,627 | 296,190 | ||||||||||
| $ | 24,643,803 | $ | 8,393,811 | $ | 7,426,687 | $ | 10,420,327 | ||||||||||
| (a) | Transactions relate to securitization Trusts acquired by us. |
18
| (b) | Maturity date represents final legal maturity of securitization notes payable. Securitization notes payable are expected to be paid based on amortization of the finance receivables pledged to the Trusts. Expected principal payments are $3,221.4 million in fiscal 2010, $2,280.4 million in fiscal 2011, $1,698.3 million in fiscal 2012 and $233.8 million in fiscal 2013. |
At the time of securitization of finance receivables, we are required to pledge assets equal to a specified percentage of the securitization pool to support the securitization transaction. Typically, the assets pledged consist of cash deposited to a restricted account and additional receivables delivered to the Trust, which create overcollateralization. The securitization transactions require
the percentage of assets pledged to support the transaction to increase until a specified level is attained. Excess cash flows generated by the Trusts are added to the restricted cash account or used to pay down outstanding debt in the Trusts, creating overcollateralization until the targeted percentage level of assets has been reached. Once the targeted percentage level of assets is reached and maintained, excess cash flows generated by the Trusts are released to us as distributions from Trusts. Additionally,
as the balance of the securitization pool declines, the amount of pledged assets needed to maintain the required percentage level is reduced. Assets in excess of the required percentage are also released to us as distributions from Trusts.
With respect to our securitization transactions covered by a financial guaranty insurance policy, agreements with the insurers provide that if portfolio performance ratios (delinquency, cumulative default or cumulative net loss) in a Trust’s pool of receivables exceed certain targets, the specified credit enhancement levels would be increased.
The securitization transactions insured by some of our financial guaranty insurance providers are cross-collateralized to a limited extent. In the event of a shortfall in the original target credit enhancement requirement for any of these securitization Trusts after a certain period of time, excess cash flows from other transactions insured by the same insurance provider would be used to satisfy
the shortfall amount.
During fiscal 2008 and 2009, three securitizations (LB2006-A, LB2006-B and LB2007-A) had delinquency ratios in excess of the targeted levels. Two of these LBAC securitizations (LB2006-B and LB2007-A) also had cumulative net loss and cumulative default ratios in excess of the targeted levels. As part of an arrangement with the insurer of these transactions, the excess cash flows from our other
securitizations insured by this insurer were used to fund higher credit enhancement requirements in the LBAC Trusts which exceeded the portfolio performance ratios. The higher required credit enhancement levels in these three LBAC Trusts were reached as of June 30, 2008. Two other LBAC securitizations (LB2005-A and LB2005-B) had delinquency ratios in excess of their targeted levels as of June 30, 2009. Excess cash flows from these Trusts are being used to build higher credit enhancement in each respective
Trust instead of being distributed to us.
During fiscal 2008, we entered into an agreement with an insurer to increase the portfolio performance ratios in the 2007-2-M securitization. In return for higher portfolio performance ratios, we agreed to use excess cash flow from other securitizations insured by this insurer to fund the higher credit enhancement requirement for the 2007-2-M Trust. As of June 30, 2008, we had reached the
higher required credit enhancement in this Trust. During fiscal 2009, we amended certain other portfolio performance ratios in this securitization. In return for higher portfolio performance ratios, we agreed to increase the restricted cash account in this securitization by approximately $5 million.
Agreements with our financial guaranty insurance providers contain additional specified targeted portfolio performance ratios that are higher than those described in the preceding paragraph. If, at any measurement date, the targeted portfolio performance ratios with respect to any insured Trust were to exceed these higher levels, provisions of the agreements permit our financial guaranty insurance
providers to declare the occurrence of an event of default and terminate our servicing rights to the receivables transferred to that Trust.
19
| 8. | Senior Notes and Convertible Senior Notes |
Senior notes and convertible senior notes consist of the following (in thousands):
|
June 30,
2009 (a) (Revised) |
June 30,
2008 (a) (Revised) |
|||||||
|
8.5% Senior Notes (due June 2015)
|
$ | 91,620 | $ | 200,000 | ||||
|
0.75% Convertible Senior Notes
(due in September 2011) |
247,000 | 275,000 | ||||||
|
Debt discount on 0.75% Convertible Senior Notes
(due in September 2011) |
(31,088 | ) | (48,600 | ) | ||||
|
2.125% Convertible Senior Notes
(due in September 2013) |
215,017 | 275,000 | ||||||
|
Debt discount on 2.125% Convertible Senior Notes
(due in September 2013) |
(38,415 | ) | (58,801 | ) | ||||
|
1.75% Contingently Convertible Senior Notes
(due in September 2023) |
200,000 | |||||||
| $ | 392,514 | $ | 642,599 | |||||
| (a) | Revised for FSP APB 14-1 (ASC 470 20 65-1), Accounting for Convertible Debt Instruments That May be Settled in Cash upon Conversion (Including Partial Cash Settlement). See Note 1 – “Summary of Significant Accounting Policies – Adoption of New Accounting Standards” for additional information. |
For the years ended June 30, 2009 and 2008, total interest expense related to the convertible senior notes due in September 2011 and 2013 was $29.8 million and $30.0 million, respectively, which included $7.3 million and $7.9 million, respectively, of contractual interest and $22.5 million and $22.1 million, respectively, of discount amortization.
Debt issuance costs related to the senior notes and the convertible senior notes are being amortized to interest expense over the expected term of the notes; unamortized costs of $1.4 million and $3.6 million related to the senior notes and $4.2 million and $6.8 million related to the convertible senior notes are included in other assets on the consolidated balance sheets as of June 30,
2009 and 2008, respectively. In accordance with FSP APB 14-1 (ASC 470 20 65-1), debt issuance costs of approximately $3.5 million directly related to the issuance of the convertible senior notes have been allocated to the equity component in proportion to the allocation of proceeds.
Senior Notes
Interest on the senior notes is payable semiannually. The notes will be redeemable, at our option, in whole or in part, at any time on or after July 1, 2011, at specific redemption prices. The indenture pursuant to which the senior notes were issued contains certain restrictions including limitations on our ability to incur additional indebtedness, other than certain collateralized indebtedness,
pay cash dividends and repurchase common stock.
In November 2008, we issued 15,122,670 shares of our common stock to Fairholme Funds Inc (“Fairholme”), in a non-cash transaction, in exchange for $108.4 million of our senior notes due 2015, held by Fairholme, at a price of $840 per $1,000 principal amount of the notes. We recognized a gain of $14.7 million, net of transaction costs on retirement of debt in the exchange. Fairholme
and its affiliates held approximately 19.8% of our outstanding common stock prior to the issuance of these shares.
Convertible Senior Notes
Interest on the convertible senior notes is payable semiannually. Subject to certain conditions, the notes, which are uncollateralized, may be converted prior to maturity into shares of our common stock at an initial
20
conversion price of $28.07 per share and $30.51 per share for the notes due in 2011 and 2013, respectively. Upon conversion, the conversion value will be paid in: 1) cash equal to the principal amount of the notes and 2) to the extent the conversion value exceeds the principal amount of the notes, shares of our common stock. The notes are convertible only in the following circumstances: 1) if the closing sale
price of our common stock exceeds 130% of the conversion price during specified periods set forth in the indentures under which the notes were issued, 2) if the average trading price per $1,000 principal amount of the notes is less than or equal to 98% of the average conversion value of the notes during specified periods set forth in the indentures under which the notes were issued or 3) upon the occurrence of specific corporate transactions set forth in the indentures under which the notes were issued. At June 30,
2009 and 2008, the if-converted value did not exceed the principal amount of the convertible senior notes.
In connection with the issuance of the convertible senior notes due in 2011 and 2013, we used net proceeds of $246.8 million to purchase 10,109,500 shares of our common stock.
Additionally, we purchased call options that entitle us to purchase shares of our common stock in an amount equal to the number of shares issued upon conversion of the notes at $28.07 per share and $30.51 per share for the notes due in 2011 and 2013, respectively. These call options are expected to allow us to offset the dilution of our shares if the conversion feature of the convertible senior
notes is exercised.
We also sold warrants to purchase 9,796,408 shares of our common stock at $35.00 per share and 9,012,713 shares of our common stock at $40 per share for the notes due in 2011 and 2013, respectively. In no event are we required to deliver a number of shares in connection with the exercise of these warrants in excess of twice the aggregate number of shares initially issuable upon the exercise of
the warrants.
We have analyzed the conversion feature, call option and warrant transactions under Emerging Issues Task Force Issue No. 00-19,
Accounting for Derivative Financial Instruments Indexed to and Potentially Settled In a Company’s Own Stock
(ASC 815 10 65-3), and determined they meet the criteria for classification as equity transactions.
As a result, both the cost of the call options and the proceeds of the warrants are reflected in additional paid-in capital on our consolidated balance sheets, and we will not recognize subsequent changes in their fair value.
As a result of adopting FSP APB 14-1 (ASC 470 20 65-1) on July 1, 2009, we have separately accounted for the liability and equity components of the convertible senior notes due in September 2011 and 2013, retrospectively, based on our nonconvertible debt borrowing rate on the issuance date of approximately 7%. At issuance, the liability and equity components were $404.3 million and
$145.7 million ($91.7 million net of deferred taxes), respectively. The debt discount is being amortized to interest expense over the expected term of the notes based on the effective interest method. The net book value as of June 30, 2009 was $392.5 million (net of debt discount of $69.5 million).
During fiscal 2009, we repurchased on the open market $28.0 par value million of our convertible senior notes due in 2011 at an average price of 44.2% of the principal amount of the notes repurchased. We also repurchased $60.0 par value million of our convertible senior notes due in 2013 at an average price of 44.1% of the principal amount of the notes repurchased. In connection with these repurchases,
we recorded a gain on retirement of debt of $32.7 million, which reflects a $15.0 million adjustment related to the retrospective adoption of FSP APB 14-1 (ASC 470 20 65-1). See Note 1 – “Summary of Significant Accounting Policies – Adoption of New Accounting Standards” of these consolidated financial statements for further discussion.
During fiscal 2009, we repurchased and retired all $200.0 million of our convertible notes due in November 2023 at an average price equal to 99.5% of the principal amount of notes redeemed. We recorded a gain on retirement of debt of $0.8 million.
21
| 9. | Derivative Financial Instruments and Hedging Activities |
We are exposed to market risks arising from adverse changes in interest rates due to floating interest rate exposure on our credit facilities and on certain securitization notes payable. See Note 1 – “Summary of Significant Accounting Policies – Derivative Financial Instruments” for more information regarding our derivative financial instruments and
hedging activities.
As of June 30, 2009 and 2008, we had interest rate swap agreements with underlying notional amounts of $2.6 billion and $3.2 billion, respectively. The fair value of interest rate swap agreements designated as hedges of $131.9 million and $72.7 million as of June 30, 2009 and 2008, respectively, is included in liabilities on the consolidated balance sheets. These interest rate swap
agreements had unrealized losses of approximately $62.5 million, net of tax and $44.7 million, net of tax included in accumulated other comprehensive loss as of June 30, 2009 and 2008, respectively. The ineffectiveness related to the interest rate swap agreements designated as hedges was $0.8 million for the year ended June 30, 2009 and was not material for the year ended June 30, 2008. We estimate approximately $74.2 million of unrealized losses included in accumulated other comprehensive loss
related to interest rate swap agreements will be reclassified into earnings within the next twelve months. As of June 30, 2009, we also have interest rate swap agreements that are not designated as hedges with fair values of $24.3 million included in other assets on the consolidated balance sheets. The change in fair value on these interest rate swap agreements that are not designated as hedges resulted in a $22.7 million gain for the year ended June 30, 2009 and is included in interest expense on the
consolidated statements of operations.
As of June 30, 2009, and 2008, our special purpose finance subsidiaries purchased interest rate cap agreements with underlying notional amounts of $1.9 billion and $3.2 billion, respectively. As of June 30, 2009, and 2008, we had sold interest rate cap agreements with underlying notional amounts of $1.7 billion and $3.0 billion, respectively. The fair value of interest rate cap agreements
purchased by our special purpose finance subsidiaries of $15.9 million and $36.5 million as of June 30, 2009, and 2008, respectively, are included in other assets on the consolidated balance sheets. The fair value of interest rate cap agreements sold by us of $16.6 million and $36.4 million as of June 30, 2009, and 2008, respectively, are included in other liabilities on the consolidated balance sheets.
Under the terms of our derivative financial instruments, we are required to pledge certain funds to be held in restricted cash accounts as collateral for the outstanding derivative transactions. As of June 30, 2009 and 2008, these restricted cash accounts totaled $45.7 million and $52.8 million, respectively, and are included in other assets on the consolidated balance sheets.
On September 15, 2008, LBHI and 16 additional affiliates of LBHI (together with LBHI, “Lehman”), filed petitions in bankruptcy court. Lehman was the hedge counterparty on interest rate swaps with notional amounts of $1.1 billion. In November 2008, we replaced Lehman as the counterparty on these interest rate swaps. Upon replacement we designated these new swaps as hedges. From
July 1, 2008 until the hedge designation date of the replacement swaps, the change in fair value on these swap agreements resulted in a $34.1 million loss for the year ended June 30, 2009, and is included in interest expense in the consolidated statements of operations.
22
The following tables present information on the effect of derivative instruments on the Consolidated Statements of Operations and Comprehensive Operations for the years ended June 30, 2009 and 2008, respectively (in thousands):
|
Losses Recognized
In Income (a) |
Losses Recognized in
Accumulated Other Comprehensive Income |
Losses Reclassified
From Accumulated Other Comprehensive Income into Income (b) |
||||||||||||||||
| 2009 | 2008 | 2009 | 2008 | 2009 | 2008 | |||||||||||||
|
Non-Designated Hedges:
|
||||||||||||||||||
|
Interest rate contracts
|
$ | 12,463 | $ | 6,891 | ||||||||||||||
|
Total
|
$ | 12,463 | $ | 6,891 | ||||||||||||||
|
Designated Hedges:
|
||||||||||||||||||
|
Interest rate contracts
|
$ | 781 | $ | $ | 109,115 | $ | 109,039 | $ | 82,244 | $ | 24,635 | |||||||
|
Total
|
$ | 781 | $ | $ | 109,115 | $ | 109,039 | $ | 82,244 | $ | 24,635 | |||||||
| (a) | Losses recognized in income are located in interest expense. |
| (b) | Losses reclassified from AOCI into income for effective and ineffective portions are located in interest expense. |
| 10. | Fair Values of Assets and Liabilities |
Effective July 1, 2008, we adopted SFAS No. 157,
Fair Value Measurements
, (“FAS 157”) (ASC 820 10 65) which provides a framework for measuring fair value under GAAP. SFAS 157 (ASC 820 10 65) defines fair value as the exchange price that would be received for an asset or paid to transfer a liability (an exit price) in
the principal or most advantageous market for the asset or liability in an orderly transaction between market participants on the measurement date. SFAS 157 (ASC 820 10 65) requires that valuation techniques maximize the use of observable inputs and minimize the use of unobservable inputs. SFAS 157 (ASC 820 10 65) also establishes a fair value hierarchy which prioritizes the valuation inputs into three broad levels.
There are three general valuation techniques that may be used to measure fair value, as described below:
| A. | Market approach – Uses prices and other relevant information generated by market transactions involving identical or comparable assets or liabilities. Prices may be indicated by pricing guides, sale transactions, market trades, or other sources; |
| B. | Cost approach – Based on the amount that currently would be required to replace the service capacity of an asset (replacement cost); and |
| C. | Income approach – Uses valuation techniques to convert future amounts to a single present amount based on current market expectations about the future amounts (includes present value techniques and option-pricing models). Net present value is an income approach where a stream of expected cash flows is discounted at an appropriate market interest rate. |
23
Assets and liabilities itemized below were measured at fair value:
| June 30, 2009 (in thousands) | ||||||||||||
| Fair Value Measurements Using | ||||||||||||
|
Level 1
Quoted Prices In Active Markets Identical Assets |
Level 2
Significant Other Observable Inputs |
Level 3
Significant Unobservable Inputs |
Assets/
Liabilities At Fair Value |
|||||||||
|
Assets
|
||||||||||||
|
Investment in Money Market Fund (A)
|
$ | 8,027 | $ | 8,027 | ||||||||
|
Derivatives not designated as hedging instruments under FAS 133:
|
||||||||||||
|
Interest Rate Caps (A)
|
$ | 15,858 | 15,858 | |||||||||
|
Interest Rate Swaps (C)
|
24,267 | 24,267 | ||||||||||
|
Total Assets
|
$ | $ | 15,858 | $ | 32,294 | $ | 48,152 | |||||
|
Liabilities
|
||||||||||||
|
Derivatives designated as hedging instruments under FAS 133:
|
||||||||||||
|
Interest Rate Swaps (C)
|
$ | 131,885 | $ | 131,885 | ||||||||
|
Derivatives not designated as hedging instruments under FAS 133:
|
||||||||||||
|
Interest Rate Caps (A)
|
$ | 16,644 | 16,644 | |||||||||
|
Total Liabilities
|
$ | $ | 16,644 | $ | 131,885 | $ | 148,529 | |||||
Financial instruments are considered Level 1 when quoted prices are available in active markets for identical assets or liabilities as of the reporting date. Active markets are those in which transactions for the asset or liability occur in sufficient frequency and volume to provide pricing information on an ongoing basis.
Financial instruments are considered Level 2 when inputs other than quoted prices are observable for the asset or liability, either directly or indirectly. These include quoted prices for similar assets or liabilities in active markets and quoted prices for identical or similar assets or liabilities in markets that are not active.
Financial instruments are considered Level 3 when their values are determined using price models, discounted cash flow methodologies or similar techniques and at least one significant model assumption or input is unobservable. Level 3 financial instruments also include those for which the determination of fair value requires significant management judgment or estimation. A brief description of
the valuation techniques used for our Level 3 assets and liabilities is provided below and in Note 4 – “Investment in Money Market Fund”.
24
The table below presents a reconciliation for all assets and liabilities measured at fair value on a recurring basis using significant unobservable inputs (Level 3) (in thousands):
| Assets | Liabilities | |||||||||||
|
Interest Rate
Swap Agreements |
Investment in
Money Market Fund |
Interest Rate
Swap Agreements |
||||||||||
|
Balance at July 1, 2008
|
$ | 3,572 | $ | (76,269 | ) | |||||||
|
Transfers into Level 3
|
$ | 115,821 | ||||||||||
|
Total realized and unrealized gains (losses)
|
||||||||||||
|
Included in earnings
|
22,700 | (3,475 | ) | (34,926 | ) | |||||||
|
Included in other comprehensive income
|
(109,115 | ) | ||||||||||
|
Payments/(Receipts)
|
(2,005 | ) | (104,319 | ) | 88,425 | |||||||
|
Balance at June 30, 2009
|
$ | 24,267 | $ | 8,027 | $ | (131,885 | ) | |||||
Derivatives
The fair values of our interest rate caps are valued based on quoted market prices received from bank counterparties and are classified as Level 2.
Our interest rate swaps are not exchange traded but instead traded in over-the-counter markets where quoted market prices are not readily available. The fair value of derivatives is derived using models that use primarily market observable inputs, such as interest rate yield curves and credit curves. Any derivative fair value measurements using significant assumptions that are unobservable are
classified as Level 3, which include interest rate swaps whose remaining terms extend beyond market observable interest rate yield curves. The impacts of our and the counterparties’ non-performance risk to the derivative trades is considered when measuring the fair value of derivative liabilities.
| 11. | Commitments and Contingencies |
Leases
Our credit centers are generally leased for terms of up to five years with certain rights to extend for additional periods. We also lease space for our administrative offices and loan servicing activities under leases with terms up to twelve years with renewal options. Certain leases contain lease escalation clauses for real estate taxes and other operating expenses and renewal option clauses
calling for increased rents. Lease expense was $15.6 million and $18.5 million for the years ended June 30, 2009 and 2008, respectively.
Operating lease commitments for years ending June 30 are as follows (in thousands):
|
2010
|
$ | 13,873 | |
|
2011
|
11,884 | ||
|
2012
|
9,046 | ||
|
2013
|
8,924 | ||
|
2014
|
5,640 | ||
|
Thereafter
|
20,614 | ||
| $ | 69,981 | ||
Concentrations of Credit Risk
Financial instruments which potentially subject us to concentrations of credit risk are primarily cash equivalents, restricted cash, derivative financial instruments and finance receivables. Our cash equivalents and
25
restricted cash represent investments in highly rated securities placed through various major financial institutions and highly rated investments in guaranteed investment contracts. The counterparties to our derivative financial instruments are various major financial institutions. Finance receivables represent contracts with consumers residing throughout the United States and, to a limited extent, in Canada,
with borrowers located in Texas and California each accounting for 12% and 10%, respectively, of the finance receivables portfolio as of June 30, 2009. No other state accounted for more than 10% of finance receivables.
Limited Corporate Guarantees of Indebtedness
We guaranteed the timely payment of interest and ultimate payment of principal on the Class B and Class C asset-backed securities issued in our AMCAR 2008-2 securitization transaction, up to a maximum of $50.0 million in the aggregate.
Guarantees of Indebtedness
The payments of principal and interest on our senior notes and convertible senior notes are guaranteed by certain of our subsidiaries. As of June 30, 2009 and 2008, the par value of the senior notes and convertible senior notes was $553.6 million and $950.0 million, respectively. See Note 22 – “Guarantor Consolidating Financial Statements”.
Legal Proceedings
As a consumer finance company, we are subject to various consumer claims and litigation seeking damages and statutory penalties, based upon, among other things, usury, disclosure inaccuracies, wrongful repossession, violations of bankruptcy stay provisions, certificate of title disputes, fraud, breach of contract and discriminatory treatment of credit applicants. Some litigation against us could
take the form of class action complaints by consumers and/or shareholders. As the assignee of finance contracts originated by dealers, we may also be named as a co-defendant in lawsuits filed by consumers principally against dealers. The damages and penalties claimed by consumers in these types of matters can be substantial. The relief requested by the plaintiffs varies but can include requests for compensatory, statutory and punitive damages. We believe that we have taken prudent steps to address and mitigate
the litigation risks associated with our business activities. In the opinion of management, the ultimate aggregate liability, if any, arising out of any such pending or threatened litigation will not be material to our consolidated financial position or our results of operations and cash flows.
| 12. | Common Stock and Warrants |
The following summarizes share repurchase activity:
|
Year Ended June 30,
|
2008 | ||
|
Number of shares
|
5,734,850 | ||
|
Average price per share
|
$ | 22.30 | |
We have repurchased $1,374.8 million of our common stock since inception of our share repurchase program in April 2004, and we have remaining authorization to repurchase $172.0 million of our common stock. Covenants in our indentures entered into with respect to our senior notes and convertible senior notes limit our ability to repurchase stock. Currently, we are not eligible to repurchase shares
under the indenture limits and do not anticipate pursuing repurchase activity for the foreseeable future.
In October 2007 and January 2007, 5.0 million and 53.6 million, respectively, of treasury shares were cancelled and were restored to the status of authorized but unissued shares. Our outstanding common stock was not impacted by this action.
26
In connection with the forward purchase commitment agreement with Deutsche (See Note 3 – “Securitizations”), we issued a warrant to an affiliate of Deutsche under which it may purchase up to 7.5 million shares of our common stock. The warrant may be exercised on or before April 15, 2015 at an exercise price of $12.01 per share.
In connection with the closing of the Wachovia funding facilities (See Note 3 – “Securitizations”), we issued a warrant to Wachovia under which they may purchase up to 1.0 million shares of common stock. The warrant may be exercised on or before September 24, 2015 at an exercise price of $13.55 per share.
In September 2002, we issued five-year warrants to purchase 1,287,691 shares of our common stock at $9.00 per share. In April 2005, 36,695 warrants were exercised, which resulted in a net settlement of 24,431 shares of our common stock. In July 2006, we repurchased 17,687 shares of these warrants for approximately $334,000. In September 2007, 1,185,225 warrants were exercised, which resulted
in a net settlement of 1,065,047 shares of our common stock for approximately $8.6 million. The remaining outstanding warrants have expired.
| 13. | Stock Based Compensation |
General
We have certain stock based compensation plans for employees, non-employee directors and key executive officers.
A total of 25,000,000 shares have been authorized for grants of options and other stock based awards under the employee plans, of which 19,000,000 shares were available for grants to non-employee directors as well as employees. As of June 30, 2009, 9,369,355 shares remain available for future grants. The exercise price of each equity grant must equal the market price of our stock on the
date of grant, and the maximum term of each equity grant is ten years. The vesting period is typically three to four years, although grants with other vesting periods or grants that vest upon the achievement of specified performance criteria may be authorized under certain employee plans. A committee of our Board of Directors establishes policies and procedures for equity grants, vesting periods and the term of each grant.
Total unamortized stock based compensation was $16.6 million as of June 30, 2009, and will be recognized over a weighted average life of 1.6 years.
Stock Options
Compensation expense recognized for stock options was $2.1 million and $1.0 million for the years ended June 30, 2009 and 2008, respectively. As of June 30, 2009 and 2008, unamortized compensation expense related to stock options was $2.2 million and $1.0 million, respectively.
27
Employee Plans
A summary of stock option activity under our employee plans is as follows (shares in thousands):
|
Years Ended June 30,
|
2009 | 2008 | ||||||||||
| Shares |
Weighted
Average Exercise Price |
Shares |
Weighted
Average Exercise Price |
|||||||||
|
Outstanding at beginning of year
|
2,127 | $ | 23.48 | 3,499 | $ | 18.83 | ||||||
|
Granted
|
942 | 8.03 | ||||||||||
|
Exercised
|
(132 | ) | 8.01 | (1,119 | ) | 9.01 | ||||||
|
Canceled/forfeited
|
(831 | ) | 22.26 | (253 | ) | 23.21 | ||||||
|
Outstanding at end of year
|
2,106 | $ | 18.02 | 2,127 | $ | 23.48 | ||||||
|
Options exercisable at end of year
|
1,563 | $ | 21.33 | 2,055 | $ | 23.34 | ||||||
|
Weighted average fair Value of options granted during year
|
$ | 4.50 | ||||||||||
Cash received from exercise of options for the years ended June 30, 2009 and 2008 was $1.1 million and $10.1 million, respectively. The total intrinsic value of options exercised during the years ended June 30, 2009 and 2008, was $0.4 million and $6.4 million, respectively.
A summary of options outstanding under our employee plans as of June 30, 2009, is as follows (shares in thousands):
| Options Outstanding | Options Exercisable | |||||||||
|
Range of Exercise Prices
|
Number
Outstanding |
Weighted
Average Years of Remaining Contractual Life |
Weighted
Average Exercise Price |
Number
Outstanding |
Weighted
Average Exercise Price |
|||||
|
$6.80 to 10.00
|
770 | 3.66 | 7.96 | 242 | 7.79 | |||||
|
$10.01 to 15.00
|
109 | 3.25 | 13.83 | 109 | 13.83 | |||||
|
$15.01 to 17.00
|
339 | 2.11 | 16.13 | 339 | 16.13 | |||||
|
$17.01 to 19.00
|
163 | 0.80 | 18.11 | 163 | 18.11 | |||||
|
$19.01 to 21.00
|
161 | 3.71 | 20.11 | 161 | 20.11 | |||||
|
$21.01 to 30.00
|
323 | 3.35 | 25.46 | 308 | 25.49 | |||||
|
$30.01 to 50.00
|
229 | 1.75 | 42.73 | 229 | 42.73 | |||||
|
$50.01 to 55.00
|
12 | 2.02 | 54.14 | 12 | 54.14 | |||||
| 2,106 | 1,563 | |||||||||
Non-Employee Director Plans
A summary of stock option activity under our non-employee director plans is as follows (shares in thousands):
|
Years Ended June 30,
|
2009 | 2008 | ||||||||||
| Shares |
Weighted
Average Exercise Price |
Shares |
Weighted
Average Exercise Price |
|||||||||
|
Outstanding at beginning of year
|
160 | $ | 16.35 | 220 | $ | 15.88 | ||||||
|
Exercised
|
(20 | ) | 14.63 | |||||||||
|
Canceled/forfeited
|
(80 | ) | 14.88 | (40 | ) | 14.63 | ||||||
|
Outstanding and exercisable at end of year
|
80 | $ | 17.81 | 160 | $ | 16.35 | ||||||
28
Cash received from exercise of options for the year ended June 30, 2008 was $0.3 million. The total intrinsic value of options exercised during the year ended June 30, 2008 was $0.1 million.
A summary of options outstanding under our non-employee director plans as of June 30, 2009, is as follows (shares in thousands):
| Options Outstanding and Exercisable | |||||||
|
Range of Exercise Prices
|
Number
Outstanding |
Weighted
Average Years of Remaining Contractual Life |
Weighted
Average Exercise Price |
||||
|
$17.01 to $19.00
|
80 | 0.35 | $ | 17.81 | |||
Restricted Stock Based Grants
Restricted stock grants totaling 5,181,300 shares with an approximate aggregate market value of $97.9 million at the time of grant have been issued under the employee plans. The market value of these restricted shares at the date of grant is being amortized into expense over a period that approximates the service period of three years.
A total of 2,586,400 shares of restricted stock granted to employees vest in annual increments through March 2011.
A total of 2,373,500 shares of restricted stock granted to key executive officers may vest depending on achievement of specific financial results on the date when the Compensation Committee of our Board of Directors certifies these results for years ending through June 30, 2012. Subsequent to year end, the Compensation Committee met and determined that the financial targets for the year
ended June 30, 2009 were not achieved and 277,000 shares were forfeited.
Of the total 221,400 shares of restricted stock granted to non-employee directors, 94,000 shares vested 50% at the date of grant and 50% after a six-month service period. The remaining 127,400 shares vested 50% after a six-month service period and 50% will vest after a one year service period.
Compensation expense recognized for restricted stock grants was $9.8 million and $11.9 million for the years ended June 30, 2009 and 2008, respectively. As of June 30, 2009 and 2008, unamortized compensation expense related to the restricted stock awards was $12.4 million and $9.3 million respectively. A summary of the status of non-vested restricted stock for the years ended June 30,
2009 and 2008, is presented below (shares in thousands):
|
Years Ended June 30,
|
2009 | 2008 | ||||
|
Nonvested at beginning of year
|
1,301 | 2,421 | ||||
|
Granted
|
2,143 | 61 | ||||
|
Vested
|
(545 | ) | (847 | ) | ||
|
Forfeited
|
(646 | ) | (334 | ) | ||
|
Nonvested at end of year
|
2,253 | 1,301 | ||||
Stock Appreciation Rights
Stock appreciation rights with respect to 680,600 shares with an approximate aggregate market value of $9.7 million at the time of grant have been issued under the employee plans. The market value of these rights at the date of grant is being amortized into expense over a period that approximates the service period of three years. Compensation expense recognized for stock appreciation rights was
$2.5 million for the year ended June 30, 2008. As of June 30, 2009 and 2008, respectively, there was no unamortized compensation expense remaining.
29
A summary of the status of non-vested stock appreciation rights for the year ended June 30, 2008, is presented below (shares in thousands):
|
Year ended June 30,
|
2008 | ||
|
Nonvested at beginning of year
|
337 | ||
|
Vested
|
(337 | ) | |
|
Forfeited
|
|||
|
Nonvested at end of year
|
|||
A summary of stock appreciation rights outstanding as of June 30, 2009, is as follows (shares in thousands)
:
| SARs Outstanding | SARs Exercisable | |||||||||||
|
Range of Exercise Prices
|
Number
Outstanding |
Weighted
Average Years of Remaining Contractual Life |
Weighted
Average Exercise Price |
Number
Outstanding |
Weighted
Average Exercise Price |
|||||||
|
$24.00 to 26.00
|
509 | 0.7 | $ | 24.09 | 509 | $ | 24.09 | |||||
| 14. | Employee Benefit Plans |
We have a defined contribution retirement plan covering substantially all employees. We recognized $2.7 million and $5.6 million in compensation expense for the years ended June 30, 2009 and 2008, respectively, for contributions of our common stock to the plan.
We also have an employee stock purchase plan that allows participating employees to purchase, through payroll deductions, shares of our common stock at 85% of the market value at specified dates. A total of 8,000,000 shares have been reserved for issuance under the plan. As of June 30, 2009, 2,863,308 shares remain available for issuance under the plan. Shares issued under the plan were
483,334 and 570,813 for the years ended June 30, 2009 and 2008, respectively. We recognized $2.4 million and $2.6 million in compensation expense for the years ended June 30, 2009 and 2008, respectively, related to this plan. As of June 30, 2009 and 2008, unamortized compensation expense related to the employee stock purchase plan was $2.0 million and $1.6 million, respectively.
| 15. | Income Taxes |
The income tax provision consists of the following (in thousands):
|
Years Ended June 30,
|
2009
(a)
(Revised) |
2008
(a)
(Revised) |
||||||
|
Current
|
$ | (216,041 | ) | $ | 115,089 | |||
|
Deferred
|
226,783 | (146,361 | ) | |||||
| $ | 10,742 | $ | (31,272 | ) | ||||
| (a) | Revised for FSP APB 14-1 (ASC 470 20 65-1), Accounting for Convertible Debt Instruments That May be Settled in Cash upon Conversion (Including Partial Cash Settlement). See Note 1 – “Summary of Significant Accounting Policies – Adoption of New Accounting Standards” and Note 8 – “Senior Notes and Convertible Senior Notes” for additional information. |
30
Our effective income tax rate on income before income taxes differs from the U.S. statutory tax rate as follows:
|
Years Ended June 30,
|
2009 (a) (b) | 2008 (a) | ||||
| (As Adjusted) | (As Adjusted) | |||||
|
U.S. statutory tax rate
|
35.0 | % | 35.0 | % | ||
|
State and other income taxes
|
N/M | 1.1 | ||||
|
Deferred tax rate change
|
N/M | 11.4 | ||||
|
FIN 48 uncertain tax positions
|
N/M | (6.0 | ) | |||
|
Valuation allowance
|
N/M | |||||
|
State net operating losses limited under Section 382
|
N/M | |||||
|
Tax exempt interest
|
1.6 | |||||
|
Investment in Canadian subsidiaries
|
(12.4 | ) | ||||
|
Non-deductible impairment of goodwill
|
(2.6 | ) | ||||
|
Tax contingency resolutions
|
||||||
|
Other
|
N/M | (0.6 | ) | |||
| N/M | 27.5 | % | ||||
| (a) | Revised for FSP APB 14-1 (ASC 470 20 65-1), Accounting for Convertible Debt Instruments That May be Settled in Cash upon Conversion (Including Partial Cash Settlement). See Note 1 – “Summary of Significant Accounting Policies – Adoption of New Accounting Standards” and Note 8 – “Senior Notes and Convertible Senior Notes” for additional information. |
| (b) | N/M = Not meaningful, because the retrospective adoption of FSP APB 14-1 (ASC 470 20 65-1) resulted in a loss before income taxes of $0.1 million and we recorded an income tax provision of $10.7 million, the effective income tax rate and the effect on such rate of the listed reconciling items is not meaningful. |
The fiscal 2009 effective tax rate was negatively impacted by state and other income tax items of $4.0 million, deferred tax rate change of $3.3 million, state net operating losses limited under Section 382 of $2.1 million and other items of $0.9 million.
31
The tax effects of temporary differences that give rise to deferred tax liabilities and assets are as follows (in thousands):
|
June 30,
|
2009
(a)
(Revised) |
2008
(a)
(Revised) |
||||||
|
Deferred tax liabilities:
|
||||||||
|
Market value difference of loan portfolio
|
$ | (104,984 | ) | |||||
|
Capitalized direct loan origination costs
|
(10,084 | ) | $ | (18,393 | ) | |||
|
Other, including contingencies
|
(52,998 | ) | (41,172 | ) | ||||
| (168,066 | ) | (59,565 | ) | |||||
|
Deferred tax assets:
|
||||||||
|
Allowance for loan losses
|
212,923 | |||||||
|
Net operating loss carryforward–Canada
|
3,229 | 6,065 | ||||||
|
Net operating loss carryforward–U. S.
|
73,589 | |||||||
|
Net operating loss carryforward–state
|
9,685 | 425 | ||||||
|
Alternative minimum tax credit carryforward
|
12,131 | |||||||
|
Unrealized gain/loss on other comprehensive income
|
31,745 | |||||||
|
Impairment of goodwill and other intangible amortization
|
62,748 | 71,494 | ||||||
|
Unrecognized income tax benefits from uncertain tax positions
|
19,586 | 37,557 | ||||||
|
Other
|
31,869 | 11,856 | ||||||
| 244,582 | 340,320 | |||||||
|
Valuation allowance
|
(734 | ) | ||||||
|
Net deferred tax asset
|
$ | 75,782 | $ | 280,755 | ||||
| (a) | Revised for FSP APB 14-1 (ASC 470 20 65-1), Accounting for Convertible Debt Instruments That May be Settled in Cash upon Conversion (Including Partial Cash Settlement). See Note 1 – “Summary of Significant Accounting Policies – Adoption of New Accounting Standards” and Note 8 – “Senior Notes and Convertible Senior Notes” for additional information. |
Tax Accounting Change
During the year ended June 30, 2009, we filed an application for a change of accounting method for tax purposes under Internal Revenue Code (“IRC”) Section 475. We believe that, as a result of our business activities, certain assets must be marked-to-market for income tax purposes. As a result of this change of accounting, we expect a taxable loss for the year ended June 30,
2009 of approximately $800 million. Approximately $600 million of this loss is available to be carried back to the prior two fiscal years to offset federal taxable income recognized in those years, resulting in an income tax refund receivable of approximately $198 million. Although this method change requires consent from the Internal Revenue Service (“IRS”), which is still pending, this change to a permissible method of accounting is generally considered to be perfunctory and should be granted. Therefore,
management believes it is proper to record the effects of this tax accounting change during the year ended June 30, 2009.
Deferred Tax Assets
As a part of our financial reporting process, we must assess the likelihood that our deferred tax assets can be recovered. Unless recovery is more likely than not, the income tax provision must be increased by recording a valuation allowance.
In evaluating the need for a valuation allowance, all available evidence, both positive and negative, is considered to determine whether, based on the weight of that evidence, a valuation allowance is needed. Future
32
realization of the deferred tax assets depends in part on the existence of sufficient taxable income within the carryback and carryforward period available under the tax law. Other criteria which are considered in evaluating the need for a valuation allowance include the existence of deferred tax liabilities that can be used to realize deferred tax assets.
We have U.S. federal and Canadian net operating loss (“NOL”) carryforwards for income tax reporting purposes of approximately $207.0 million and $10.4 million, respectively. We have recorded a deferred tax asset of $73.6 million and $3.2 million, respectively, to reflect these benefits. The U.S. NOL carryforward expires if not used by June 30, 2019. The Canadian NOL carryforward
expires in varying amounts between June 30, 2010 and June 30, 2017. We have recorded a deferred tax asset of $12.1 million for the alternative minimum tax credit, which has an unlimited carryforward period.
We have state NOL carryforwards resulting in a deferred tax asset of approximately $9.7 million which have carryforward periods ranging from 5 years to 20 years. Management has determined based upon the positive and negative evidence in existence at June 30, 2009 that a valuation allowance in the amount of $0.7 million is necessary for these state deferred tax assets.
Based upon our review of all negative and positive evidence in existence at June 30, 2009, management believes it is more likely than not that all other deferred tax assets will be fully realized. Accordingly, no valuation allowance has been provided on deferred tax assets other than the state deferred tax assets relating to our state NOL carryforwards.
Uncertain tax positions
We adopted the provisions of FIN 48 (ASC 740 10 65-1) on July 1, 2007. The adoption of FIN 48 (ASC 740 10 65-1), resulted in a decrease to retained earnings of $0.5 million, an increase in deferred income taxes of $53.1 million and an increase in accrued taxes of $53.6 million. Upon implementation, gross unrecognized tax benefits were $42.3 million.
On June 30, 2008, the amount of gross unrecognized tax benefits and the amount that would affect the effective income tax rate in future periods were $57.7 million and $21.7 million, respectively. As of June 30, 2009, the amount of gross unrecognized tax benefits and the amount that would affect the effective income tax rate in future periods were $35.0 million and $18.0 million, respectively.
A reconciliation of the beginning and ending balances of the total amounts of gross unrecognized tax benefits is as follows (in thousands):
|
Year ended June 30,
|
2009 | 2008 | ||||||
|
Gross unrecognized tax benefits at beginning of year
|
$ | 57,728 | $ | 42,312 | ||||
|
Increases in tax positions for prior years
|
2,761 | 4,621 | ||||||
|
Decrease in tax positions for prior years
|
(24,254 | ) | (14,536 | ) | ||||
|
Increase in tax positions for current year
|
1,402 | 25,938 | ||||||
|
Lapse of statute of limitations
|
(245 | ) | (420 | ) | ||||
|
Settlements
|
(2,421 | ) | (187 | ) | ||||
|
Gross unrecognized tax benefits at end of year
|
$ | 34,971 | $ | 57,728 | ||||
At June 30, 2009, we believe that it is reasonably possible that the balance of the gross unrecognized tax benefits could decrease by $0.8 million to $13.1 million in the next twelve months due to ongoing activities with various taxing jurisdictions that we expect may give rise to settlements or the expiration of statute of limitations. We continually evaluate expiring statutes of limitations,
audits, proposed settlements, changes in tax law and new authoritative rulings.
33
We recognize accrued interest and penalties associated with uncertain tax positions as part of the income tax provision. As of July 1, 2007, accrued interest and penalties associated with uncertain tax positions were $5.6 million and $6.9 million, respectively. For the year ended June 30, 2008, accrued interest and accrued penalties associated with uncertain tax positions increased by
$3.9 million and $0.6 million, respectively. For the year ended June 30, 2009, accrued interest and accrued penalties associated with uncertain tax positions increased by $0.8 million and $0.5 million, respectively.
We file income tax returns in the U.S. and various state, local, and foreign jurisdictions. The IRS completed its examination of our fiscal years 2004 and 2005 consolidated federal income tax returns in the second quarter of fiscal year 2008. The returns for those years are subject to an appeals proceeding, which we anticipate will be concluded by the end of calendar year 2009. We expect the
outcome of the appeals proceeding will not result in a material change to our financial position or results of operations. Our federal income tax returns prior to fiscal year 2004 are closed. Foreign and state jurisdictions have statutes of limitations that generally range from three to five years. Our tax returns are currently under examination for various years for federal and state tax jurisdictions.
| 16. | Restructuring Charges |
We recognized restructuring charges of $11.8 million and $20.1 million for the years ended June 30, 2009 and 2008, respectively, related to the implementation of our revised operating plans. See Note 1 – “Summary of Significant Accounting Policies – Recent Market Developments”.
A summary of the liabilities, which are included in accrued taxes and expenses on the consolidated balance sheets, for restructuring charges for the years ended June 30, 2009 and 2008, is as follows (in thousands):
|
Personnel-
Related Costs |
Contract
Termination Costs |
Other
Associated Costs |
Total | |||||||||||||
|
Balance at July 1, 2007
|
$ | 122 | $ | 4,175 | $ | 1,973 | $ | 6,270 | ||||||||
|
Additions
|
18,099 | 2,243 | 434 | 20,776 | ||||||||||||
|
Cash settlements
|
(14,860 | ) | (2,278 | ) | (457 | ) | (17,595 | ) | ||||||||
|
Non-cash settlements
|
(65 | ) | (336 | ) | (401 | ) | ||||||||||
|
Adjustments
|
(154 | ) | (334 | ) | (172 | ) | (660 | ) | ||||||||
|
Balance at June 30, 2008
|
3,207 | 3,741 | 1,442 | 8,390 | ||||||||||||
|
Additions
|
9,287 | 2,068 | 372 | 11,727 | ||||||||||||
|
Cash settlements
|
(11,482 | ) | (2,980 | ) | (77 | ) | (14,539 | ) | ||||||||
|
Non-cash settlements
|
(106 | ) | 432 | (390 | ) | (64 | ) | |||||||||
|
Adjustments
|
(43 | ) | 1,510 | (1,347 | ) | 120 | ||||||||||
|
Balance at June 30, 2009
|
$ | 863 | $ | 4,771 | $ | $ | 5,634 | |||||||||
34
| 17. | Earnings per Share |
A reconciliation of weighted average shares used to compute basic and diluted earnings per share is as follows (dollars in thousands, except per share data):
|
Years Ended June 30,
|
2009
(a)
(Revised) |
2008
(a)
(Revised) |
||||||
|
Net loss
|
$ | (10,889 | ) | $ | (82,369 | ) | ||
|
Basic weighted average shares
|
125,239,241 | 114,962,241 | ||||||
|
Diluted weighted average shares
|
125,239,241 | 114,962,241 | ||||||
|
Loss per share:
|
||||||||
|
Basic
|
$ | (0.09 | ) | $ | (0.72 | ) | ||
|
Diluted
|
$ | (0.09 | ) | $ | (0.72 | ) | ||
| (a) | Revised for FSP APB 14-1 (ASC 470 20 65-1), Accounting for Convertible Debt Instruments That May be Settled in Cash upon Conversion (Including Partial Cash Settlement). See Note 1 – “Summary of Significant Accounting Policies – Adoption of New Accounting Standards” and Note 8 – “Senior Notes and Convertible Senior Notes” for additional information. |
Basic loss per share have been computed by dividing net loss by weighted average shares outstanding.
Diluted loss per share has been computed by dividing net loss by the diluted weighted average shares, assuming no incremental shares because all potentially dilutive common stock equivalents are anti-dilutive.
| 18. | Supplemental Cash Flow Information |
Cash payments for interest costs and income taxes consist of the following (in thousands):
|
Years Ended June 30,
|
2009 | 2008 | ||||
|
Interest costs (none capitalized)
|
$ | 645,386 | $ | 835,698 | ||
|
Income taxes
|
2,501 | 79,926 | ||||
Non-cash investing and financing activities, not otherwise disclosed, during the years ended June 30, 2009 and 2008, included $3.8 million and $5.8 million, respectively, of common stock issued for employee benefit plans.
We did not enter into any significant capital lease agreements for property and equipment during the years ended June 30, 2009 or 2008.
35
| 19. | Supplemental Disclosure for Accumulated Other Comprehensive Loss |
A summary of changes in accumulated other comprehensive loss is as follows (in thousands):
|
Years Ended June 30,
|
2009 | 2008 | ||||||
|
Unrealized (losses) gains on cash flow hedges:
|
||||||||
|
Balance at beginning of year
|
$ | (44,676 | ) | $ | 8,345 | |||
|
Change in fair value associated with current period hedging activities, net of taxes of $(39,818) and $(40,595), respectively
|
(69,297 | ) | (68,444 | ) | ||||
|
Reclassification into earnings, net of taxes of $30,780 and $9,212, respectively
|
51,464 | 15,423 | ||||||
|
Balance at end of year
|
(62,509 | ) | (44,676 | ) | ||||
|
Accumulated foreign currency translation adjustment:
|
||||||||
|
Balance at beginning of year
|
38,272 | 37,114 | ||||||
|
Translation gain net of taxes of $(2,388) and $4,697, respectively
|
3,138 | 1,158 | ||||||
|
Balance at end of year
|
41,410 | 38,272 | ||||||
|
Net unrealized gains on credit enhancement assets:
|
||||||||
|
Balance at beginning of year
|
235 | |||||||
|
Unrealized losses, net of taxes of $54
|
(114 | ) | ||||||
|
Reclassification into earnings, net of taxes of $(51)
|
(121 | ) | ||||||
|
Balance at end of year
|
||||||||
|
Total accumulated other comprehensive loss
|
$ | (21,099 | ) | $ | (6,404 | ) | ||
| 20. | Fair Value of Financial Instruments |
Statement of Financial Accounting Standards No. 107,
Disclosures about Fair Value of Financial Instruments
(“SFAS 107”) (ASC 825 10 65-1), requires disclosure of fair value information about financial instruments, whether recognized or not in our consolidated balance sheets. Fair values are based on estimates using present
value or other valuation techniques in cases where quoted market prices are not available. Those techniques are significantly affected by the assumptions used, including the discount rate and the estimated timing and amount of future cash flows. Therefore, the estimates of fair value may differ substantially from amounts that ultimately may be realized or paid at settlement or maturity of the financial instruments and those differences may be material. SFAS 107 (ASC 825 10 65-1) excludes certain financial instruments
and all non-financial instruments from our disclosure requirements. Accordingly, the aggregate fair value amounts presented do not represent the underlying value of our Company.
36
Estimated fair values, carrying values and various methods and assumptions used in valuing our financial instruments are set forth below (in thousands):
|
June 30,
|
2009 | 2008 | ||||||||||
|
Carrying
Value (f) (Revised) |
Estimated
Fair Value |
Carrying
Value (f) (Revised) |
Estimated
Fair Value |
|||||||||
|
Financial assets:
|
||||||||||||
|
Cash and cash equivalents
(a)
|
$ | 193,287 | $ | 193,287 | $ | 433,493 | $ | 433,493 | ||||
|
Finance receivables, net
(b)
|
10,037,329 | 9,717,655 | 14,030,299 | 13,826,318 | ||||||||
|
Restricted cash—securitization notes payable
(a)
|
851,606 | 851,606 | 982,670 | 982,670 | ||||||||
|
Restricted cash—credit facilities
(a)
|
195,079 | 195,079 | 259,699 | 259,699 | ||||||||
|
Restricted cash—other
(a)
|
46,905 | 46,905 | 54,173 | 54,173 | ||||||||
|
Interest rate swap agreements
(d)
|
24,267 | 24,267 | ||||||||||
|
Interest rate cap agreements purchased
(d)
|
15,858 | 15,858 | 36,471 | 36,471 | ||||||||
|
Investment in money market fund
(d)
|
8,027 | 8,027 | ||||||||||
|
Financial liabilities:
|
||||||||||||
|
Credit facilities
(c)
|
1,630,133 | 1,630,133 | 2,928,161 | 2,928,161 | ||||||||
|
Securitization notes payable
(d)
|
7,426,687 | 6,879,245 | 10,420,327 | 10,006,738 | ||||||||
|
Senior notes
(d)
|
91,620 | 85,207 | 200,000 | 160,500 | ||||||||
|
Convertible senior notes
(d)
|
392,514 | 328,396 | 642,599 | 519,813 | ||||||||
|
Other notes payable
(e)
|
600 | 600 | 1,203 | 1,203 | ||||||||
|
Interest rate swap agreements
(d)
|
131,885 | 131,885 | 72,697 | 72,697 | ||||||||
|
Interest rate cap agreements sold
(d)
|
16,644 | 16,644 | 36,381 | 36,381 | ||||||||
| (a) | The carrying value of cash and cash equivalents, restricted cash—securitization notes payable, restricted cash—credit facilities and restricted cash—other is considered to be a reasonable estimate of fair value since these investments bear interest at market rates and have maturities of less than 90 days. |
| (b) | The fair value of finance receivables is estimated by discounting future cash flows expected to be collected using current rates at which similar loans would be made to borrowers with similar credit ratings and the same remaining maturities. |
| (c) | Credit facilities have variable rates of interest and maturities of three years or less. Therefore, carrying value is considered to be a reasonable estimate of fair value. |
| (d) | The fair values of the interest rate cap and swap agreements, investment in money market fund, securitization notes payable, senior notes and convertible senior notes are based on quoted market prices, when available. If quoted market prices are not available, the market value is estimated by discounting future net cash flows expected to be settled using a current risk-adjusted rate. |
| (e) | The fair value of other notes payable is estimated based on rates currently available for debt with similar terms and remaining maturities. |
| (f) | Revised for FSP APB 14-1 (ASC 470 20 65-1), Accounting for Convertible Debt Instruments That May be Settled in Cash upon Conversion (Including Partial Cash Settlement). See Note 1 – “Summary of Significant Accounting Policies – Adoption of New Accounting Standards” and Note 8 – “Senior Notes and Convertible Senior Notes” for additional information. |
37
| 21. | Quarterly Financial Data (unaudited) |
The following is a summary of quarterly financial results (dollars in thousands, except per share data):
|
First
Quarter (a) (Revised) |
Second
Quarter (a) (Revised) |
Third
Quarter (a) (Revised) |
Fourth
Quarter (a) (Revised) |
|||||||||||||
|
Year ended June 30, 2009
|
||||||||||||||||
|
Total revenue
|
$ | 566,043 | $ | 558,597 | $ | 492,425 | $ | 450,259 | ||||||||
|
Income (loss) before income taxes
|
(5,196 | ) | (52,805 | ) | 11,590 | 46,264 | ||||||||||
|
Net income (loss)
|
(5,274 | ) | (35,002 | ) | (2,406 | ) | 31,793 | |||||||||
|
Basic earnings (loss) per share
|
(0.05 | ) | (0.29 | ) | (0.02 | ) | 0.24 | |||||||||
|
Diluted earnings (loss) per share
|
(0.05 | ) | (0.29 | ) | (0.02 | ) | 0.24 | |||||||||
|
Diluted weighted average shares
|
116,271,119 | 120,106,666 | 131,914,885 | 133,523,867 | ||||||||||||
|
Year ended June 30, 2008
|
||||||||||||||||
|
Total revenue
|
$ | 652,674 | $ | 653,254 | $ | 638,742 | $ | 598,412 | ||||||||
|
Income (loss) before income taxes
|
81,125 | (34,378 | ) | 55,742 | (216,130 | ) | ||||||||||
|
Net income (loss)
|
57,562 | (21,664 | ) | 37,742 | (156,009 | ) | ||||||||||
|
Basic earnings (loss) per share
|
0.50 | (0.19 | ) | 0.33 | (1.35 | ) | ||||||||||
|
Diluted earnings (loss) per share
|
0.46 | (0.19 | ) | 0.30 | (1.35 | ) | ||||||||||
|
Diluted weighted average shares
|
128,111,826 | 114,253,706 | 126,728,797 | 115,299,234 | ||||||||||||
| (a) | Revised for FSP APB 14-1 (ASC 470 20 65-1), Accounting for Convertible Debt Instruments That May be Settled in Cash upon Conversion (Including Partial Cash Settlement). See Note 1 – “Summary of Significant Accounting Policies – Adoption of New Accounting Standards” and Note 8 – “Senior Notes and Convertible Senior Notes” for additional information. |
| 22. | Guarantor Consolidating Financial Statements |
The payment of principal and interest on our senior notes and convertible senior notes are guaranteed by certain of our subsidiaries (the “Subsidiary Guarantors”). The separate financial statements of the Subsidiary Guarantors are not included herein because the Subsidiary Guarantors are our wholly-owned consolidated subsidiaries and are jointly, severally, fully and unconditionally
liable for the obligations represented by the convertible senior notes. We believe that the consolidating financial information for AmeriCredit Corp., the combined Subsidiary Guarantors and the combined Non-Guarantor Subsidiaries provide information that is more meaningful in understanding the financial position of the Subsidiary Guarantors than separate financial statements of the Subsidiary Guarantors.
The consolidating financial statements present consolidating financial data for (i) AmeriCredit Corp. (on a parent only basis), (ii) the combined Subsidiary Guarantors, (iii) the combined Non-Guarantor Subsidiaries, (iv) an elimination column for adjustments to arrive at the information for the parent company and our subsidiaries on a consolidated basis and (v) the parent company and
our subsidiaries on a consolidated basis as of June 30, 2009 and 2008 and for each of the two years in the period ended June 30, 2009.
Investments in subsidiaries are accounted for by the parent company using the equity method for purposes of this presentation. Results of operations of subsidiaries are therefore reflected in the parent company’s investment accounts and earnings. The principal elimination entries set forth below eliminate investments in subsidiaries and intercompany balances and transactions.
38
AMERICREDIT CORP.
CONSOLIDATING BALANCE SHEET
June 30, 2009
(in thousands)
|
AmeriCredit
Corp. (a) (Revised) |
Guarantors |
Non-
Guarantors |
Eliminations |
Consolidated
(a)
(Revised) |
|||||||||||||||
| ASSETS | |||||||||||||||||||
|
Cash and cash equivalents
|
$ | 186,564 | $ | 6,723 | $ | 193,287 | |||||||||||||
|
Finance receivables, net
|
580,420 | 9,456,909 | 10,037,329 | ||||||||||||||||
|
Restricted cash - securitization notes payable
|
851,606 | 851,606 | |||||||||||||||||
|
Restricted cash - credit facilities
|
195,079 | 195,079 | |||||||||||||||||
|
Property and equipment, net
|
$ | 5,527 | 38,668 | 44,195 | |||||||||||||||
|
Leased vehicles, net
|
5,319 | 151,068 | 156,387 | ||||||||||||||||
|
Deferred income taxes
|
97,657 | 243,803 | (265,678 | ) | 75,782 | ||||||||||||||
|
Income tax receivable
|
162,036 | 35,543 | 197,579 | ||||||||||||||||
|
Other assets
|
5,682 | 132,485 | 68,916 | 207,083 | |||||||||||||||
|
Due from affiliates
|
404,943 | 4,059,841 | $ | (4,464,784 | ) | ||||||||||||||
|
Investment in affiliates
|
1,976,793 | 5,558,924 | 603,680 | (8,139,397 | ) | ||||||||||||||
|
Total assets
|
$ | 2,652,638 | $ | 6,781,726 | $ | 15,128,144 | $ | (12,604,181 | ) | $ | 11,958,327 | ||||||||
| LIABILITIES AND SHAREHOLDERS’ EQUITY | |||||||||||||||||||
|
Liabilities:
|
|||||||||||||||||||
|
Credit facilities
|
$ | 1,630,133 | $ | 1,630,133 | |||||||||||||||
|
Securitization notes payable
|
7,426,687 | 7,426,687 | |||||||||||||||||
|
Senior notes
|
$ | 91,620 | 91,620 | ||||||||||||||||
|
Convertible senior notes
|
392,514 | 392,514 | |||||||||||||||||
|
Accrued taxes and expenses
|
60,596 | $ | 44,371 | 52,673 | 157,640 | ||||||||||||||
|
Interest rate swap agreements
|
525 | 131,360 | 131,885 | ||||||||||||||||
|
Other liabilities
|
600 | 19,940 | 20,540 | ||||||||||||||||
|
Due to affiliates
|
4,464,784 | $ | (4,464,784 | ) | |||||||||||||||
|
Total liabilities
|
545,330 | 4,529,620 | 9,240,853 | (4,464,784 | ) | 9,851,019 | |||||||||||||
|
Shareholders’ equity:
|
|||||||||||||||||||
|
Common stock
|
1,350 | 172,368 | (172,368 | ) | 1,350 | ||||||||||||||
|
Additional paid-in capital
|
284,961 | 75,878 | 3,177,841 | (3,253,719 | ) | 284,961 | |||||||||||||
|
Accumulated other comprehensive (loss) income
|
(21,099 | ) | 26,009 | (62,508 | ) | 36,499 | (21,099 | ) | |||||||||||
|
Retained earnings
|
1,878,459 | 1,977,851 | 2,771,958 | (4,749,809 | ) | 1,878,459 | |||||||||||||
| 2,143,671 | 2,252,106 | 5,887,291 | (8,139,397 | ) | 2,143,671 | ||||||||||||||
|
Treasury stock
|
(36,363 | ) | (36,363 | ) | |||||||||||||||
|
Total shareholders’ equity
|
2,107,308 | 2,252,106 | 5,887,291 | (8,139,397 | ) | 2,107,308 | |||||||||||||
|
Total liabilities and shareholders’ equity
|
$ | 2,652,638 | $ | 6,781,726 | $ | 15,128,144 | $ | (12,604,181 | ) | $ | 11,958,327 | ||||||||
| (a) | Revised for FSP APB 14-1 (ASC 470 20 65-1), Accounting for Convertible Debt Instruments That May be Settled in Cash upon Conversion (Including Partial Cash Settlement). See Note 1 – “Summary of Significant Accounting Policies – Adoption of New Accounting Standards” and Note 8 – “Senior Notes and Convertible Senior Notes” for additional information. |
39
AMERICREDIT CORP.
CONSOLIDATING BALANCE SHEET
June 30, 2008
(in thousands)
|
AmeriCredit
Corp. (a) (Revised) |
Guarantors |
Non-
Guarantors |
Eliminations |
Consolidated
(a)
(Revised) |
||||||||||||||||
| ASSETS | ||||||||||||||||||||
|
Cash and cash equivalents
|
$ | 361,352 | $ | 72,141 | $ | 433,493 | ||||||||||||||
|
Finance receivables, net
|
173,077 | 13,857,222 | 14,030,299 | |||||||||||||||||
|
Restricted cash–securitization notes payable
|
982,670 | 982,670 | ||||||||||||||||||
|
Restricted cash–credit facilities
|
259,699 | 259,699 | ||||||||||||||||||
|
Property and equipment, net
|
$ | 5,860 | 49,611 | 55,471 | ||||||||||||||||
|
Leased vehicles, net
|
106,689 | 104,168 | 210,857 | |||||||||||||||||
|
Deferred income taxes
|
(17,320 | ) | 311,761 | (13,686 | ) | 280,755 | ||||||||||||||
|
Income tax receivable
|
34,705 | (11,808 | ) | 22,897 | ||||||||||||||||
|
Other assets
|
(1,073 | ) | 159,267 | 73,866 | 232,060 | |||||||||||||||
|
Due from affiliates
|
941,157 | 3,911,745 | $ | (4,852,902 | ) | |||||||||||||||
|
Investment in affiliates
|
1,967,775 | 5,908,573 | 544,169 | (8,420,517 | ) | |||||||||||||||
|
Total assets
|
$ | 2,896,399 | $ | 7,105,035 | $ | 19,780,186 | $ | (13,273,419 | ) | $ | 16,508,201 | |||||||||
| LIABILITIES AND SHAREHOLDERS’ EQUITY | ||||||||||||||||||||
|
Liabilities:
|
||||||||||||||||||||
|
Credit facilities
|
$ | 2,928,161 | $ | 2,928,161 | ||||||||||||||||
|
Securitization notes payable
|
10,420,327 | 10,420,327 | ||||||||||||||||||
|
Senior notes
|
$ | 200,000 | 200,000 | |||||||||||||||||
|
Convertible senior notes
|
642,599 | 642,599 | ||||||||||||||||||
|
Accrued taxes and expenses
|
87,335 | $ | 77,222 | 73,349 | 237,906 | |||||||||||||||
|
Interest rate swap agreements
|
72,697 | 72,697 | ||||||||||||||||||
|
Other liabilities
|
1,203 | 40,046 | 41,249 | |||||||||||||||||
|
Due to affiliates
|
4,852,902 | $ | (4,852,902 | ) | ||||||||||||||||
|
Total liabilities
|
931,137 | 5,042,867 | 13,421,837 | (4,852,902 | ) | 14,542,939 | ||||||||||||||
|
Shareholders’ equity:
|
||||||||||||||||||||
|
Common stock
|
1,188 | 50,775 | 30,627 | (81,402 | ) | 1,188 | ||||||||||||||
|
Additional paid-in capital
|
134,064 | 75,878 | 3,659,102 | (3,734,980 | ) | 134,064 | ||||||||||||||
|
Accumulated other comprehensive (loss) income
|
(6,404 | ) | (21,801 | ) | 40,602 | (18,801 | ) | (6,404 | ) | |||||||||||
|
Retained earnings
|
1,889,348 | 1,957,316 | 2,628,018 | (4,585,334 | ) | 1,889,348 | ||||||||||||||
| 2,018,196 | 2,062,168 | 6,358,349 | (8,420,517 | ) | 2,018,196 | |||||||||||||||
|
Treasury stock
|
(52,934 | ) | (52,934 | ) | ||||||||||||||||
|
Total shareholders’ equity
|
1,965,262 | 2,062,168 | 6,358,349 | (8,420,517 | ) | 1,965,262 | ||||||||||||||
|
Total liabilities and shareholders’ equity
|
$ | 2,896,399 | $ | 7,105,035 | $ | 19,780,186 | $ | (13,273,419 | ) | $ | 16,508,201 | |||||||||
| (a) | Revised for FSP APB 14-1 (ASC 470 20 65-1), Accounting for Convertible Debt Instruments That May be Settled in Cash upon Conversion (Including Partial Cash Settlement). See Note 1 – “Summary of Significant Accounting Policies – Adoption of New Accounting Standards” and Note 8 – “Senior Notes and Convertible Senior Notes” for additional information. |
40
AMERICREDIT CORP.
CONSOLIDATING STATEMENT OF OPERATIONS
Year Ended June 30, 2009
(in thousands)
|
AmeriCredit
Corp. (a) (Revised) |
Guarantors |
Non-
Guarantors |
Eliminations |
Consolidated
(a)
(Revised) |
|||||||||||||||
|
Revenue
|
|||||||||||||||||||
|
Finance charge income
|
$ | 74,562 | $ | 1,828,122 | $ | 1,902,684 | |||||||||||||
|
Other income
|
$ | 38,193 | 892,546 | 1,762,638 | $ | (2,576,889 | ) | 116,488 | |||||||||||
|
Gain on retirement of debt
|
48,152 | 48,152 | |||||||||||||||||
|
Equity in income of affiliates
|
20,535 | 143,940 | (164,475 | ) | |||||||||||||||
| 106,880 | 1,111,048 | 3,590,760 | (2,741,364 | ) | 2,067,324 | ||||||||||||||
|
Costs and expenses
|
|||||||||||||||||||
|
Operating expenses
|
32,701 | 29,914 | 246,188 | 308,803 | |||||||||||||||
|
Lease depreciation
|
4,955 | 42,925 | 47,880 | ||||||||||||||||
|
Provision for loan losses
|
105,919 | 866,462 | 972,381 | ||||||||||||||||
|
Interest expense
|
100,228 | 992,563 | 2,210,658 | (2,576,889 | ) | 726,560 | |||||||||||||
|
Restructuring charges
|
11,847 | 11,847 | |||||||||||||||||
| 132,929 | 1,145,198 | 3,366,233 | (2,576,889 | ) | 2,067,471 | ||||||||||||||
|
(Loss) income before income taxes
|
(26,049 | ) | (34,150 | ) | 224,527 | (164,475 | ) | (147 | ) | ||||||||||
|
Income tax (benefit) provision
|
(15,160 | ) | (54,685 | ) | 80,587 | 10,742 | |||||||||||||
|
Net (loss) income
|
$ | (10,889 | ) | $ | 20,535 | $ | 143,940 | $ | (164,475 | ) | $ | (10,889 | ) | ||||||
| (a) | Revised for FSP APB 14-1 (ASC 470 20 65-1), Accounting for Convertible Debt Instruments That May be Settled in Cash upon Conversion (Including Partial Cash Settlement). See Note 1 – “Summary of Significant Accounting Policies – Adoption of New Accounting Standards” and Note 8 – “Senior Notes and Convertible Senior Notes” for additional information. |
41
AMERICREDIT CORP.
CONSOLIDATING STATEMENT OF OPERATIONS
Year Ended June 30, 2008
(in thousands)
|
AmeriCredit
Corp. (a) (Revised) |
Guarantors |
Non-
Guarantors |
Eliminations |
Consolidated
(a)
(Revised) |
|||||||||||||||
|
Revenue
|
|||||||||||||||||||
|
Finance charge income
|
$ | 83,321 | $ | 2,299,163 | $ | 2,382,484 | |||||||||||||
|
Other income
|
$ | 39,232 | 1,347,530 | 2,918,238 | $ | (4,144,402 | ) | 160,598 | |||||||||||
|
Equity in income of affiliates
|
(57,110 | ) | 267,141 | (210,031 | ) | ||||||||||||||
| (17,878 | ) | 1,697,992 | 5,217,401 | (4,354,433 | ) | 2,543,082 | |||||||||||||
|
Costs and expenses
|
|||||||||||||||||||
|
Operating expenses
|
23,167 | 56,895 | 317,752 | 397,814 | |||||||||||||||
|
Lease depreciation
|
35,993 | 369 | 36,362 | ||||||||||||||||
|
Provision for loan losses
|
103,852 | 1,027,110 | 1,130,962 | ||||||||||||||||
|
Impairment of goodwill
|
212,595 | 212,595 | |||||||||||||||||
|
Interest expense
|
53,762 | 1,434,144 | 3,515,370 | (4,144,402 | ) | 858,874 | |||||||||||||
|
Restructuring charges
|
20,116 | 20,116 | |||||||||||||||||
| 76,929 | 1,863,595 | 4,860,601 | (4,144,402 | ) | 2,656,723 | ||||||||||||||
|
(Loss) income before income taxes
|
(94,807 | ) | (165,603 | ) | 356,800 | (210,031 | ) | (113,641 | ) | ||||||||||
|
Income tax (benefit) provision
|
(12,438 | ) | (108,493 | ) | 89,659 | (31,272 | ) | ||||||||||||
|
Net (loss) income
|
$ | (82,369 | ) | $ | (57,110 | ) | $ | 267,141 | $ | (210,031 | ) | $ | (82,369 | ) | |||||
| (a) | Revised for FSP APB 14-1 (ASC 470 20 65-1), Accounting for Convertible Debt Instruments That May be Settled in Cash upon Conversion (Including Partial Cash Settlement). See Note 1 – “Summary of Significant Accounting Policies – Adoption of New Accounting Standards” and Note 8 – “Senior Notes and Convertible Senior Notes” for additional information. |
42
AMERICREDIT CORP.
CONSOLIDATING STATEMENT OF CASH FLOWS
Year Ended June 30, 2009
(in thousands)
|
AmeriCredit
Corp. (a) (Revised) |
Guarantors |
Non-
Guarantors |
Eliminations |
Consolidated
(a)
(Revised) |
||||||||||||||||
|
Cash flows from operating activities:
|
||||||||||||||||||||
|
Net (loss) income
|
$ | (10,889 | ) | $ | 20,535 | $ | 143,940 | $ | (164,475 | ) | $ | (10,889 | ) | |||||||
|
Adjustments to reconcile net (loss) income to net cash (used) provided by operating activities:
|
||||||||||||||||||||
|
Depreciation and amortization
|
2,634 | 33,878 | 72,496 | 109,008 | ||||||||||||||||
|
Provision for loan losses
|
105,919 | 866,462 | 972,381 | |||||||||||||||||
|
Deferred income taxes
|
(100,156 | ) | 31,977 | 294,962 | 226,783 | |||||||||||||||
|
Stock based compensation expense
|
14,264 | 14,264 | ||||||||||||||||||
|
Amortization of warrant costs
|
45,101 | 45,101 | ||||||||||||||||||
|
Non-cash interest charges on convertible debt
|
22,506 | 22,506 | ||||||||||||||||||
|
Gain on retirement of debt
|
(48,907 | ) | (48,907 | ) | ||||||||||||||||
|
Accretion and amortization of loan fees
|
903 | 18,191 | 19,094 | |||||||||||||||||
|
Other
|
(16,603 | ) | 19,376 | 2,773 | ||||||||||||||||
|
Equity in income of affiliates
|
(20,535 | ) | (143,940 | ) | 164,475 | |||||||||||||||
|
Changes in assets and liabilities, net of assets and liabilities acquired:
|
||||||||||||||||||||
|
Income tax receivable
|
(173,844 | ) | (838 | ) | (174,682 | ) | ||||||||||||||
|
Other assets
|
(1,901 | ) | 12,169 | (16,972 | ) | (6,704 | ) | |||||||||||||
|
Accrued taxes and expenses
|
(23,386 | ) | (9,700 | ) | (19,027 | ) | (52,113 | ) | ||||||||||||
|
Net cash (used) provided by operating activities
|
(295,113 | ) | 34,300 | 1,379,428 | 1,118,615 | |||||||||||||||
|
Cash flows from investing activities:
|
||||||||||||||||||||
|
Purchases of receivables
|
(1,280,291 | ) | (535,526 | ) | 535,526 | (1,280,291 | ) | |||||||||||||
|
Principal collections and recoveries on receivables
|
217,414 | 4,040,223 | 4,257,637 | |||||||||||||||||
|
Net proceeds from sale of receivables
|
535,526 | (535,526 | ) | |||||||||||||||||
|
Purchases of property and equipment
|
(1,003 | ) | (1,003 | ) | ||||||||||||||||
|
Investment in money market fund
|
(115,821 | ) | (115,821 | ) | ||||||||||||||||
|
Proceeds from money market fund
|
104,319 | 104,319 | ||||||||||||||||||
|
Change in restricted cash - securitization notes payable
|
131,064 | 131,064 | ||||||||||||||||||
|
Change in restricted cash - credit facilities
|
63,180 | 63,180 | ||||||||||||||||||
|
Change in other assets
|
103,179 | (90,219 | ) | 12,960 | ||||||||||||||||
|
Net change in investment in affiliates
|
(6,317 | ) | 480,377 | (36,469 | ) | (437,591 | ) | |||||||||||||
|
Net cash (used) provided by investing activities
|
(6,317 | ) | 43,700 | 3,572,253 | (437,591 | ) | 3,172,045 | |||||||||||||
|
Cash flows from financing activities:
|
||||||||||||||||||||
|
Net change in credit facilities
|
(1,278,117 | ) | (1,278,117 | ) | ||||||||||||||||
|
Issuance of securitization notes payable
|
1,000,000 | 1,000,000 | ||||||||||||||||||
|
Payments on securitization notes payable
|
(3,987,424 | ) | (3,987,424 | ) | ||||||||||||||||
|
Retirement of convertible debt
|
(238,617 | ) | (238,617 | ) | ||||||||||||||||
|
Debt issuance costs
|
(56 | ) | (2,163 | ) | (30,390 | ) | (32,609 | ) | ||||||||||||
|
Net proceeds from issuance of common stock
|
3,741 | 121,593 | (535,315 | ) | 413,722 | 3,741 | ||||||||||||||
|
Other net changes
|
(603 | ) | (603 | ) | ||||||||||||||||
|
Net change in due (to) from affiliates
|
536,214 | (371,011 | ) | (185,918 | ) | 20,715 | ||||||||||||||
|
Net cash provided (used) by financing activities
|
300,679 | (251,581 | ) | (5,017,164 | ) | 434,437 | (4,533,629 | ) | ||||||||||||
|
Net decrease in cash and cash equivalents
|
(751 | ) | (173,581 | ) | (65,483 | ) | (3,154 | ) | (242,969 | ) | ||||||||||
|
Effect of Canadian exchange rate changes on cash and cash equivalents
|
751 | (1,207 | ) | 65 | 3,154 | 2,763 | ||||||||||||||
|
Cash and cash equivalents at Beginning of year
|
361,352 | 72,141 | 433,493 | |||||||||||||||||
|
Cash and cash equivalents at end of year
|
$ | $ | 186,564 | $ | 6,723 | $ | $ | 193,287 | ||||||||||||
| (a) | Revised for FSP APB 14-1 (ASC 470 20 65-1), Accounting for Convertible Debt Instruments That May be Settled in Cash upon Conversion (Including Partial Cash Settlement). See Note 1 – “Summary of Significant Accounting Policies – Adoption of New Accounting Standards” and Note 8 – “Senior Notes and Convertible Senior Notes” for additional information. |
43
AMERICREDIT CORP.
CONSOLIDATING STATEMENT OF CASH FLOWS
Year Ended June 30, 2008
(in thousands)
|
AmeriCredit
Corp. (a) (Revised) |
Guarantors |
Non-
Guarantors |
Eliminations |
Consolidated
(a)
(Revised) |
||||||||||||||||
|
Cash flows from operating activities:
|
||||||||||||||||||||
|
Net (loss) income
|
$ | (82,369 | ) | $ | (57,110 | ) | $ | 267,141 | $ | (210,031 | ) | $ | (82,369 | ) | ||||||
|
Adjustments to reconcile net (loss) income to net cash provided (used) by operating activities:
|
||||||||||||||||||||
|
Depreciation and amortization
|
(266 | ) | 50,086 | 37,059 | 86,879 | |||||||||||||||
|
Provision for loan losses
|
103,852 | 1,027,110 | 1,130,962 | |||||||||||||||||
|
Deferred income taxes
|
(64,561 | ) | (160,193 | ) | 78,393 | (146,361 | ) | |||||||||||||
|
Stock based compensation expense
|
17,945 | 17,945 | ||||||||||||||||||
|
Amortization of warrant costs
|
10,193 | 10,193 | ||||||||||||||||||
|
Non-cash interest charges on convertible debt
|
22,062 | 22,062 | ||||||||||||||||||
|
Impairment of goodwill
|
212,595 | 212,595 | ||||||||||||||||||
|
Accretion and amortization of loan fees
|
8,529 | 20,906 | 29,435 | |||||||||||||||||
|
Other
|
6,915 | (789 | ) | 6,126 | ||||||||||||||||
|
Equity in income of affiliates
|
57,110 | (267,141 | ) | 210,031 | ||||||||||||||||
|
Changes in assets and liabilities, net of assets and liabilities acquired:
|
||||||||||||||||||||
|
Income tax receivable
|
11,808 | (34,705 | ) | (22,897 | ) | |||||||||||||||
|
Other assets
|
13,977 | (39,299 | ) | 9,695 | (15,627 | ) | ||||||||||||||
|
Accrued taxes and expenses
|
33,104 | (12,244 | ) | (9,842 | ) | 11,018 | ||||||||||||||
|
Net cash provided (used) by operating activities
|
19,003 | (188,715 | ) | 1,429,673 | 1,259,961 | |||||||||||||||
|
Cash flows from investing activities:
|
||||||||||||||||||||
|
Purchases of receivables
|
(6,260,198 | ) | (5,992,951 | ) | 5,992,951 | (6,260,198 | ) | |||||||||||||
|
Principal collections and recoveries on receivables
|
119,528 | 5,989,162 | 6,108,690 | |||||||||||||||||
|
Net proceeds from sale of receivables
|
5,992,951 | (5,992,951 | ) | |||||||||||||||||
|
Distributions from gain on sale Trusts
|
7,466 | 7,466 | ||||||||||||||||||
|
Purchases of property and equipment
|
1,412 | (9,875 | ) | (8,463 | ) | |||||||||||||||
|
Net purchases of leased vehicles
|
(103,904 | ) | (94,922 | ) | (198,826 | ) | ||||||||||||||
|
Change in restricted cash - securitization notes payable
|
(10 | ) | 31,693 | 31,683 | ||||||||||||||||
|
Change in restricted cash - credit facilities
|
(92,754 | ) | (92,754 | ) | ||||||||||||||||
|
Change in other assets
|
(42,912 | ) | 1,181 | (41,731 | ) | |||||||||||||||
|
Net change in investment in affiliates
|
(7,457 | ) | (1,589,195 | ) | (14,822 | ) | 1,611,474 | |||||||||||||
|
Net cash used by investing activities
|
(6,045 | ) | (1,893,615 | ) | (165,947 | ) | 1,611,474 | (454,133 | ) | |||||||||||
|
Cash flows from financing activities:
|
||||||||||||||||||||
|
Net change in credit facilities
|
385,611 | 385,611 | ||||||||||||||||||
|
Issuance of securitization notes payable
|
4,250,000 | 4,250,000 | ||||||||||||||||||
|
Payments on securitization notes payable
|
(5,774,035 | ) | (5,774,035 | ) | ||||||||||||||||
|
Debt issuance costs
|
(39,347 | ) | (39,347 | ) | ||||||||||||||||
|
Repurchase of common stock
|
(127,901 | ) | (127,901 | ) | ||||||||||||||||
|
Net proceeds from issuance of common stock
|
25,174 | 12 | 1,610,217 | (1,610,229 | ) | 25,174 | ||||||||||||||
|
Other net changes
|
324 | (1 | ) | 323 | ||||||||||||||||
|
Net change in due (to) from affiliates
|
88,287 | 1,543,437 | (1,634,952 | ) | 3,228 | |||||||||||||||
|
Net cash (used) provided by financing activities
|
(14,116 | ) | 1,543,448 | (1,202,506 | ) | (1,607,001 | ) | (1,280,175 | ) | |||||||||||
|
Net (decrease) increase in cash and cash equivalents
|
(1,158 | ) | (538,882 | ) | 61,220 | 4,473 | (474,347 | ) | ||||||||||||
|
Effect of Canadian exchange rate changes on cash and cash equivalents
|
1,158 | 848 | 3 | (4,473 | ) | (2,464 | ) | |||||||||||||
|
Cash and cash equivalents at Beginning of year
|
899,386 | 10,918 | 910,304 | |||||||||||||||||
|
Cash and cash equivalents at end of year
|
$ | $ | 361,352 | $ | 72,141 | $ | $ | 433,493 | ||||||||||||
| (a) | Revised for FSP APB 14-1 (ASC 470 20 65-1), Accounting for Convertible Debt Instruments That May be Settled in Cash upon Conversion (Including Partial Cash Settlement). See Note 1 –“Summary of Significant Accounting Policies – Adoption of New Accounting Standards” and Note 8 – “Senior Notes and Convertible Senior Notes” for additional information. |
44
REPORT OF INDEPENDENT REGISTERED PUBLIC ACCOUNTING FIRM
To the Board of Directors and Shareholders of
AmeriCredit Corp.:
We have audited the accompanying consolidated balance sheets of AmeriCredit Corp. and subsidiaries (the “Company”) as of June 30, 2009 and 2008, and the related consolidated statements of operations and comprehensive operations, shareholders’ equity, and cash flows for each of the two years in the period ended June 30, 2009. These financial statements are the responsibility of
the Company’s management. Our responsibility is to express an opinion on the financial statements based on our audits.
We conducted our audits in accordance with the standards of the Public Company Accounting Oversight Board (United States). Those standards require that we plan and perform the audit to obtain reasonable assurance about whether the financial statements are free of material misstatement. An audit includes examining, on a test basis, evidence supporting the amounts and disclosures in the financial
statements. An audit also includes assessing the accounting principles used and significant estimates made by management, as well as evaluating the overall financial statement presentation. We believe that our audits provide a reasonable basis for our opinion.
In our opinion, such consolidated financial statements present fairly, in all material respects, the financial position of AmeriCredit Corp. and subsidiaries at June 30, 2009 and 2008, and the results of their operations and their cash flows for each of the two years in the period ended June 30, 2009, in conformity with accounting principles generally accepted in the United States of America.
As discussed in Note 1 to the consolidated financial statements, effective July 1, 2007, the Company adopted Financial Accounting Standards Board Interpretation No. 48,
Accounting for Uncertainty in Income Taxes – an interpretation of FASB Statement No. 109
(Accounting Standards Codification “ASC” 710, Income Taxes), which
established new accounting and reporting standards for uncertainty in income taxes recognized in financial statements.
/s/ DELOITTE & TOUCHE LLP
Dallas, Texas
August 28, 2009 (November 16, 2009, as to the effects of the retrospective adoption of Financial Accounting Standards Board Staff Position No. APB 14-1,
Accounting for Convertible Debt Instruments that May be Settled in Cash Upon Conversion
(ASC 470 20,
Debt with Conversion and Other Options)
as disclosed
in Notes 1, 9, 16, 18, 21, and 23)
45
INDEX TO CONSOLIDATED FINANCIAL STATEMENTS
| Page | ||||
| 2 | ||||
| 3 | ||||
| 5 | ||||
| 6 | ||||
| 7 | ||||
| 8 | ||||
| 11 | ||||
1
Report of Independent Registered Public Accounting Firm
The Board of Directors and Stockholders
Jefferies Group, Inc.:
Jefferies Group, Inc.:
We have audited the accompanying consolidated statements of financial condition of Jefferies Group, Inc. and subsidiaries (the Company) as of December 31, 2009 and 2008, and the related consolidated statements of earnings, changes in stockholders’ equity, comprehensive income, and cash flows for each of the years in the two-year period ended December 31, 2009. These consolidated financial statements are the responsibility of the Company’s
management. Our responsibility is to express an opinion on these consolidated financial statements based on our audits.
We conducted our audits in accordance with the standards of the Public Company Accounting Oversight Board (United States). Those standards require that we plan and perform the audit to obtain reasonable assurance about whether the financial statements are free of material misstatement. An audit includes examining, on a test basis, evidence supporting the amounts and disclosures in the financial statements. An audit also includes assessing the accounting
principles used and significant estimates made by management, as well as evaluating the overall financial statement presentation. We believe that our audits provide a reasonable basis for our opinion.
In our opinion, the consolidated financial statements referred to above present fairly, in all material respects, the financial position of Jefferies Group, Inc. and subsidiaries as of December 31, 2009 and 2008, and the results of their operations and their cash flows for each of the years in the two-year period ended December 31, 2009, in conformity with U.S. generally accepted accounting principles.
As discussed in Note 1 to the consolidated financial statements, in 2009 the Company retrospectively changed its method of accounting for noncontrolling interests in subsidiaries and earnings per share due to the adoption of new accounting requirements issued by the FASB.
/s/ KPMG LLP
New York, New York
February 26, 2010
February 26, 2010
2
JEFFERIES GROUP, INC.
AND SUBSIDIARIES
AND SUBSIDIARIES
Consolidated Statements of Financial Condition
December 31, 2009 and 2008
(Dollars in thousands, except per share amounts)
(Dollars in thousands, except per share amounts)
| December 31, | ||||||||
| 2009 | 2008 | |||||||
|
ASSETS
|
||||||||
|
Cash and cash equivalents
|
$ | 1,853,167 | $ | 1,294,329 | ||||
|
Cash and securities segregated and on deposit for regulatory purposes or deposited with clearing and depository organizations
|
1,089,803 | 1,151,522 | ||||||
|
Financial instruments owned, at fair value, including securities pledged to creditors of $5,623,345 and $361,765 in 2009 and 2008, respectively:
|
||||||||
|
Corporate equity securities
|
1,500,042 | 945,747 | ||||||
|
Corporate debt securities
|
2,421,704 | 1,851,216 | ||||||
|
Government, federal agency and other sovereign obligations
|
1,762,643 | 447,233 | ||||||
|
Mortgage- and asset-backed securities
|
3,079,865 | 1,035,996 | ||||||
|
Loans and other receivables
|
591,208 | 34,407 | ||||||
|
Derivatives
|
62,117 | 298,144 | ||||||
|
Investments, at fair value
|
70,156 | 75,059 | ||||||
|
|
||||||||
|
Total financial instruments owned, at fair value
|
9,487,735 | 4,687,802 | ||||||
|
Investments in managed funds
|
115,774 | 100,245 | ||||||
|
Other investments
|
193,628 | 140,012 | ||||||
|
Securities borrowed
|
8,237,998 | 9,011,903 | ||||||
|
Securities purchased under agreements to resell
|
3,515,247 | 1,247,002 | ||||||
|
Securities received as collateral
|
68,494 | — | ||||||
|
Receivables:
|
||||||||
|
Brokers, dealers and clearing organizations
|
1,504,480 | 732,073 | ||||||
|
Customers
|
1,020,480 | 507,292 | ||||||
|
Fees, interest and other
|
108,749 | 87,151 | ||||||
|
Premises and equipment
|
140,132 | 139,390 | ||||||
|
Goodwill
|
364,795 | 358,837 | ||||||
|
Other assets
|
488,789 | 521,127 | ||||||
|
|
||||||||
|
Total assets
|
$ | 28,189,271 | $ | 19,978,685 | ||||
|
|
||||||||
Continued on next page.
3
JEFFERIES GROUP, INC.
AND SUBSIDIARIES
AND SUBSIDIARIES
Consolidated Statements of Financial Condition – (Continued)
December 31, 2009 and 2008
(Dollars in thousands, except per share amounts)
December 31, 2009 and 2008
(Dollars in thousands, except per share amounts)
| December 31, | ||||||||
| 2009 | 2008 | |||||||
|
LIABILITIES AND STOCKHOLDERS’ EQUITY
|
||||||||
|
|
||||||||
|
Financial instruments sold, not yet purchased, at fair value:
|
||||||||
|
Corporate equity securities
|
$ | 1,360,528 | $ | 739,166 | ||||
|
Corporate debt securities
|
1,909,781 | 1,578,395 | ||||||
|
Government, federal agency and other sovereign obligations
|
1,735,861 | 211,045 | ||||||
|
Mortgage- and asset-backed securities
|
21,474 | — | ||||||
|
Loans
|
363,080 | — | ||||||
|
Derivatives
|
18,427 | 220,738 | ||||||
|
Other
|
— | 223 | ||||||
|
|
||||||||
|
Total financial instruments sold, not yet purchased, at fair value
|
5,409,151 | 2,749,567 | ||||||
|
Securities loaned
|
3,592,836 | 3,259,575 | ||||||
|
Securities sold under agreements to repurchase
|
8,239,117 | 6,727,390 | ||||||
|
Obligation to return securities received as collateral
|
68,494 | — | ||||||
|
Payables:
|
||||||||
|
Brokers, dealers and clearing organizations
|
889,687 | 383,363 | ||||||
|
Customers
|
3,246,485 | 1,736,971 | ||||||
|
Accrued expenses and other liabilities
|
941,210 | 542,546 | ||||||
|
|
||||||||
|
|
22,386,980 | 15,399,412 | ||||||
|
Long-term debt
|
2,729,117 | 1,764,274 | ||||||
|
Mandatorily redeemable convertible preferred stock
|
125,000 | 125,000 | ||||||
|
Mandatorily redeemable preferred interest of consolidated subsidiaries
|
318,047 | 280,923 | ||||||
|
|
||||||||
|
Total liabilities
|
25,559,144 | 17,569,609 | ||||||
|
|
||||||||
|
|
||||||||
|
STOCKHOLDERS’ EQUITY
|
||||||||
|
Common stock, $.0001 par value. Authorized 500,000,000 shares; issued 187,855,347 shares in 2009 and 171,167,666 shares in 2008
|
19 | 17 | ||||||
|
Additional paid-in capital
|
2,036,087 | 1,870,120 | ||||||
|
Retained earnings
|
698,488 | 418,445 | ||||||
|
Less:
|
||||||||
|
Treasury stock, at cost, 22,217,793 shares in 2009 and 7,951,628 shares in 2008
|
(384,379 | ) | (115,190 | ) | ||||
|
Accumulated other comprehensive loss:
|
||||||||
|
Currency translation adjustments
|
(34,369 | ) | (43,675 | ) | ||||
|
Additional minimum pension liability
|
(7,257 | ) | (8,446 | ) | ||||
|
|
||||||||
|
Total accumulated other comprehensive loss
|
(41,626 | ) | (52,121 | ) | ||||
|
|
||||||||
|
Total common stockholders’ equity
|
2,308,589 | 2,121,271 | ||||||
|
Noncontrolling interests
|
321,538 | 287,805 | ||||||
|
|
||||||||
|
Total stockholders’ equity
|
2,630,127 | 2,409,076 | ||||||
|
|
||||||||
|
Total liabilities and stockholders’ equity
|
$ | 28,189,271 | $ | 19,978,685 | ||||
|
|
||||||||
See accompanying notes to Consolidated Financial Statements.
4
JEFFERIES GROUP, INC.
AND SUBSIDIARIES
AND SUBSIDIARIES
Consolidated Statements of Earnings
For each of the years in the two-year period ended December 31, 2009
(In thousands, except per share amounts)
| Year Ended December 31, | ||||||||
| 2009 | 2008 | |||||||
|
Revenues:
|
||||||||
|
Commissions
|
$ | 512,293 | $ | 611,823 | ||||
|
Principal transactions
|
843,851 | (80,192 | ) | |||||
|
Investment banking
|
474,315 | 425,887 | ||||||
|
Asset management fees and investment income (loss) from managed funds
|
35,887 | (52,929 | ) | |||||
|
Interest
|
567,438 | 749,577 | ||||||
|
Other
|
38,918 | 28,573 | ||||||
|
|
||||||||
|
Total revenues
|
2,472,702 | 1,682,739 | ||||||
|
Interest expense
|
301,925 | 660,964 | ||||||
|
|
||||||||
|
Net revenues
|
2,170,777 | 1,021,775 | ||||||
|
Interest on mandatorily redeemable preferred interest of consolidated subsidiaries
|
37,248 | (69,077 | ) | |||||
|
|
||||||||
|
Net revenues, less mandatorily redeemable preferred interest
|
2,133,529 | 1,090,852 | ||||||
|
|
||||||||
|
Non-interest expenses:
|
||||||||
|
Compensation and benefits
|
1,195,971 | 1,522,157 | ||||||
|
Floor brokerage and clearing fees
|
89,337 | 69,444 | ||||||
|
Technology and communications
|
141,233 | 127,357 | ||||||
|
Occupancy and equipment rental
|
72,824 | 76,255 | ||||||
|
Business development
|
37,614 | 49,376 | ||||||
|
Other
|
80,929 | 126,524 | ||||||
|
|
||||||||
|
Total non-interest expenses
|
1,617,908 | 1,971,113 | ||||||
|
|
||||||||
|
Earnings (loss) before income taxes
|
515,621 | (880,261 | ) | |||||
|
Income tax expense (benefit)
|
199,041 | (290,249 | ) | |||||
|
|
||||||||
|
Net earnings (loss)
|
316,580 | (590,012 | ) | |||||
|
Net earnings (loss) to noncontrolling interests
|
36,537 | (53,884 | ) | |||||
|
|
||||||||
|
Net earnings (loss) to common shareholders
|
$ | 280,043 | $ | (536,128 | ) | |||
|
|
||||||||
|
|
||||||||
|
Earnings (loss) per common share:
|
||||||||
|
Basic
|
$ | 1.39 | $ | (3.27 | ) | |||
|
Diluted
|
$ | 1.38 | $ | (3.27 | ) | |||
|
|
||||||||
|
Weighted average common shares:
|
||||||||
|
Basic
|
200,446 | 166,163 | ||||||
|
Diluted
|
204,572 | 166,163 | ||||||
See accompanying notes to Consolidated Financial Statements.
5
JEFFERIES GROUP, INC.
AND SUBSIDIARIES
AND SUBSIDIARIES
Consolidated Statements of Changes in Stockholders’ Equity
For each of the years in the two-year period ended December 31, 2009
(Dollars in thousands, except per share amounts)
| Year ended December 31, | ||||||||
| 2009 | 2008 | |||||||
|
Common stock, par value $0.0001 per share
|
||||||||
|
Balance, beginning of year
|
$ | 17 | $ | 16 | ||||
|
Issued
|
2 | 1 | ||||||
|
|
||||||||
|
Balance, end of year
|
19 | 17 | ||||||
|
|
||||||||
|
|
||||||||
|
Additional paid-in capital
|
||||||||
|
Balance, beginning of year
|
1,870,120 | 1,115,011 | ||||||
|
Benefit plan share activity (1)
|
16,499 | 52,912 | ||||||
|
Share-based expense, net of forfeitures and clawbacks
|
125,127 | 561,661 | ||||||
|
Proceeds from exercise of stock options
|
69 | 840 | ||||||
|
Acquisitions and contingent consideration
|
(2,710 | ) | 5,647 | |||||
|
Tax (deficiency) benefit for issuance of share-based awards
|
(14,606 | ) | 6,233 | |||||
|
Equity component of convertible debt issuance, net of tax
|
41,588 | — | ||||||
|
Issuance of treasury stock
|
— | 90,160 | ||||||
|
Dividend equivalents on restricted stock units
|
— | 37,656 | ||||||
|
|
||||||||
|
Balance, end of year
|
2,036,087 | 1,870,120 | ||||||
|
|
||||||||
|
|
||||||||
|
Retained earnings
|
||||||||
|
Balance, beginning of year
|
418,445 | 1,031,764 | ||||||
|
Cumulative effect of change in accounting principle
|
— | — | ||||||
|
Net earnings (loss) to common shareholders
|
280,043 | (536,128 | ) | |||||
|
Dividends
|
— | (76,477 | ) | |||||
|
Acquisition adjustments
|
— | (714 | ) | |||||
|
|
||||||||
|
Balance, end of year
|
698,488 | 418,445 | ||||||
|
|
||||||||
|
|
||||||||
|
Treasury stock, at cost
|
||||||||
|
Balance, beginning of year
|
(115,190 | ) | (394,406 | ) | ||||
|
Purchases
|
(263,794 | ) | (21,765 | ) | ||||
|
Returns / forfeitures
|
(8,105 | ) | (42,438 | ) | ||||
|
Issued
|
2,710 | 343,419 | ||||||
|
|
||||||||
|
Balance, end of year
|
(384,379 | ) | (115,190 | ) | ||||
|
|
||||||||
|
|
||||||||
|
Accumulated other comprehensive (loss) income
|
||||||||
|
Balance, beginning of year
|
(52,121 | ) | 9,159 | |||||
|
Currency adjustment
|
9,306 | (54,661 | ) | |||||
|
Pension adjustment, net of tax
|
1,189 | (6,619 | ) | |||||
|
|
||||||||
|
Balance, end of year
|
(41,626 | ) | (52,121 | ) | ||||
|
|
||||||||
|
|
||||||||
|
Total common stockholders’ equity
|
2,308,589 | 2,121,271 | ||||||
|
|
||||||||
|
|
||||||||
|
Noncontrolling interests
|
||||||||
|
Balance, beginning of year
|
287,805 | 249,380 | ||||||
|
Net earnings (loss) to noncontrolling interests
|
36,537 | (53,884 | ) | |||||
|
Contributions
|
2,860 | 99,725 | ||||||
|
Distributions
|
(5,664 | ) | (11,553 | ) | ||||
|
Consolidation of asset management entity
|
— | 4,137 | ||||||
|
|
||||||||
|
Balance, end of year
|
321,538 | 287,805 | ||||||
|
|
||||||||
|
|
||||||||
|
Total stockholders’ equity
|
$ | 2,630,127 | $ | 2,409,076 | ||||
|
|
||||||||
| (1) | Includes grants related to the Incentive Plan, Deferred Compensation Plan, and Director Plan. |
See accompanying notes to Consolidated Financial Statements.
6
JEFFERIES GROUP, INC.
AND SUBSIDIARIES
AND SUBSIDIARIES
Consolidated Statements of Comprehensive Income
For each of the years in the two-year period ended December 31, 2009
(Dollars in thousands)
| Year Ended December 31, | ||||||||
| 2009 | 2008 | |||||||
|
Net earnings (loss) to common shareholders
|
$ | 280,043 | $ | (536,128 | ) | |||
|
|
||||||||
|
Other comprehensive earnings (loss) net of tax:
|
||||||||
|
Currency translation adjustments
|
9,306 | (54,661 | ) | |||||
|
Minimum pension liability adjustments, net of tax (1)
|
1,189 | (6,619 | ) | |||||
|
|
||||||||
|
Total other comprehensive earnings (loss), net of tax (2)
|
10,495 | (61,280 | ) | |||||
|
|
||||||||
|
|
||||||||
|
Comprehensive income (loss)
|
$ | 290,538 | $ | (597,408 | ) | |||
|
|
||||||||
| (1) | Includes income tax expense (benefit) of $0.8 million and $(4.3) million for the years ended December 31, 2009 and 2008, respectively. | |
| (2) | Total other comprehensive income, net of tax, is attributable to Jefferies Group. No other comprehensive income is attributable to noncontrolling interests. |
See accompanying notes to Consolidated Financial Statements.
7
JEFFERIES GROUP, INC.
AND SUBSIDIARIES
AND SUBSIDIARIES
Consolidated Statements of Cash Flows
Two years ended December 31, 2009
(Dollars in thousands)
| Year Ended December 31, | ||||||||
| 2009 | 2008 | |||||||
|
Cash flows from operating activities:
|
||||||||
|
Net earnings (loss)
|
$ | 316,580 | $ | (590,012 | ) | |||
|
|
||||||||
|
Adjustments to reconcile net earnings (loss) to net cash (used in) provided by operating activities:
|
||||||||
|
Depreciation and amortization
|
40,662 | 29,482 | ||||||
|
Gain on repurchase of long-term debt
|
(7,673 | ) | — | |||||
|
Interest on mandatorily redeemable preferred interests of consolidated subsidiaries
|
37,248 | (69,077 | ) | |||||
|
Accruals related to various benefit plans, stock issuances, net of forfeitures
|
133,523 | 572,136 | ||||||
|
Deferred income taxes
|
10,393 | (180,706 | ) | |||||
|
Decrease (increase) in cash and securities segregated and on deposit for regulatory purposes or deposited with clearing and depository organizations
|
61,620 | (535,091 | ) | |||||
|
(Increase) decrease in receivables:
|
||||||||
|
Brokers, dealers and clearing organizations
|
(752,108 | ) | (248,967 | ) | ||||
|
Customers
|
(474,181 | ) | 256,920 | |||||
|
Fees, interest and other
|
(21,566 | ) | 66,118 | |||||
|
Decrease (increase) in securities borrowed
|
764,577 | 7,395,756 | ||||||
|
(Increase) decrease in financial instruments owned
|
(4,781,858 | ) | 987,021 | |||||
|
Increase in other investments
|
(53,616 | ) | (61,297 | ) | ||||
|
(Increase) decrease in investments in managed funds
|
(15,529 | ) | 196,691 | |||||
|
(Increase) decrease in securities purchased under agreements to resell
|
(2,268,338 | ) | 2,125,292 | |||||
|
Decrease (increase) in other assets
|
22,516 | 169,348 | ||||||
|
Increase (decrease) in payables:
|
||||||||
|
Brokers, dealers and clearing organizations
|
498,232 | (478,815 | ) | |||||
|
Customers
|
1,476,096 | 337,771 | ||||||
|
Increase (decrease) in securities loaned
|
333,261 | (4,421,889 | ) | |||||
|
Increase (decrease) in financial instruments sold, not yet purchased
|
2,664,934 | (567,777 | ) | |||||
|
Increase (decrease) in securities sold under agreements to repurchase
|
1,511,871 | (4,598,172 | ) | |||||
|
Increase (decrease) in accrued expenses and other liabilities
|
376,436 | (37,104 | ) | |||||
|
|
||||||||
|
Net cash (used in) provided by operating activities
|
(126,920 | ) | 347,628 | |||||
|
|
||||||||
|
|
||||||||
|
Cash flows from investing activities:
|
||||||||
|
Purchase of premises and equipment
|
(37,483 | ) | (35,957 | ) | ||||
|
Deconsolidation of asset management entity
|
— | (63,665 | ) | |||||
|
Business acquisition
|
(38,760 | ) | — | |||||
|
Purchase of mortgage servicing rights
|
(8,628 | ) | — | |||||
|
Cash paid for contingent consideration
|
(28,653 | ) | (37,670 | ) | ||||
|
|
||||||||
|
Net cash used in investing activities
|
(113,524 | ) | (137,292 | ) | ||||
|
|
||||||||
Continued on next page.
8
JEFFERIES GROUP, INC.
AND SUBSIDIARIES
AND SUBSIDIARIES
Consolidated Statements of Cash Flows – (Continued)
Two years ended December 31, 2009
(Dollars in thousands)
Two years ended December 31, 2009
(Dollars in thousands)
| Year Ended December 31, | ||||||||
| 2009 | 2008 | |||||||
|
Cash flows from financing activities:
|
||||||||
|
Excess tax benefits from the issuance of share-based awards
|
$ | 12,408 | $ | 11,887 | ||||
|
Proceeds from reorganization of high yield secondary market trading
|
— | — | ||||||
|
Redemptions and distributions related to our reorganization of high yield secondary market trading
|
— | — | ||||||
|
Net proceeds from (payments on):
|
||||||||
|
Equity financing
|
— | 433,579 | ||||||
|
Issuance of senior notes, net of issuance costs
|
1,053,092 | — | ||||||
|
Repayment of long-term debt
|
— | — | ||||||
|
Repurchase of long-term debt
|
(12,796 | ) | — | |||||
|
Bank loans
|
— | (283,033 | ) | |||||
|
Termination of interest rate swaps
|
— | — | ||||||
|
Mandatorily redeemable preferred interest of consolidated subsidiaries
|
(124 | ) | (4,257 | ) | ||||
|
Noncontrolling interest
|
(2,804 | ) | 89,540 | |||||
|
Repurchase of treasury stock
|
(263,794 | ) | (21,765 | ) | ||||
|
Dividends
|
— | (38,821 | ) | |||||
|
Exercise of stock options, not including tax benefits
|
69 | 840 | ||||||
|
|
||||||||
|
Net cash provided by financing activities
|
786,051 | 187,970 | ||||||
|
|
||||||||
|
Effect of foreign currency translation on cash and cash equivalents
|
13,231 | (1,849 | ) | |||||
|
|
||||||||
|
Net increase in cash and cash equivalents
|
558,838 | 396,457 | ||||||
|
Cash and cash equivalents at beginning of year
|
1,294,329 | 897,872 | ||||||
|
|
||||||||
|
Cash and cash equivalents at end of period
|
$ | 1,853,167 | $ | 1,294,329 | ||||
|
|
||||||||
|
|
||||||||
|
Supplemental disclosures of cash flow information:
|
||||||||
|
Cash paid (received) during the year for:
|
||||||||
|
Interest
|
$ | 268,854 | $ | 695,177 | ||||
|
Income taxes, net
|
(27,106 | ) | (23,753 | ) | ||||
|
Acquisitions:
|
||||||||
|
Fair value of assets acquired, including goodwill
|
53,104 | |||||||
|
Liabilities assumed
|
(14,344 | ) | ||||||
|
Stock issued
|
— | |||||||
|
|
||||||||
|
Cash paid for acquisition
|
38,760 | |||||||
|
Supplemental disclosure of non-cash financing activities:
|
||||||||
|
Non-cash proceeds from reorganization of high yield secondary market trading
|
— | — | ||||||
Continued on next page.
9
JEFFERIES GROUP, INC.
AND SUBSIDIARIES
AND SUBSIDIARIES
Consolidated Statements of Cash Flows – (Continued)
Two years ended December 31, 2009
(Dollars in thousands)
Two years ended December 31, 2009
(Dollars in thousands)
In 2009, the additional minimum pension liability included in stockholders’ equity of $7,257 resulted from a decrease of $1,189 to accrued expenses and other liabilities and an offsetting increase in stockholders’ equity. In 2008, the additional minimum pension liability included in stockholders’ equity of $8,446 resulted from an increase of $6,619 to accrued expenses and other liabilities and an offsetting
decrease in stockholders’ equity.
On April 21, 2008, we issued 26,585,310 shares of common stock and made a cash payment to Leucadia National Corporation (“Leucadia”) of approximately $100 million. In exchange, we received from Leucadia 10,000,000 common shares of Leucadia. During 2008, we sold the 10,000,000 common shares of Leucadia and thus realized approximately $433.6 million in net cash from the issuance of our shares.
In September 2008, we deconsolidated an entity related to our asset management activities due to changes in the nature and level of our investment in the entity. Prior to deconsolidation, total assets (including cash and cash equivalents) and total liabilities of the entity were $79.6 million and $22.8 million, respectively, and noncontrolling interest related to the entity was $0.7 million. Upon deconsolidation,
we recorded an investment in this entity of $56.1 million, which is included in investments in managed funds on our Consolidated Statements of Financial Condition.
See accompanying notes to Consolidated Financial Statements.
10
JEFFERIES GROUP, INC.
AND SUBSIDIARIES
AND SUBSIDIARIES
Notes to Consolidated Financial Statements
December 31, 2009 and 2008
Index
| Note | Page | |||
|
(1) Organization and Summary of Significant Accounting Policies
|
12 | |||
|
(2) Cash, Cash Equivalents, and Short-Term Investments
|
22 | |||
|
(3) Financial Instruments
|
23 | |||
|
(4) Derivative Financial Instruments
|
29 | |||
|
(5) Securitization Activities and Variable Interest Entities (“VIEs”)
|
33 | |||
|
(6) Jefferies Finance LLC
|
37 | |||
|
(7) Acquisitions
|
37 | |||
|
(8) Short-Term Borrowings
|
39 | |||
|
(9) Long-Term Debt
|
39 | |||
|
(10) Mandatorily Redeemable Convertible Preferred Stock
|
40 | |||
|
(11) Noncontrolling Interest and Mandatorily Redeemable Preferred Interests of Consolidated Subsidiaries
|
40 | |||
|
(12) Benefit Plans
|
41 | |||
|
(13) Compensation Plans
|
44 | |||
|
(14) Earnings Per Share
|
48 | |||
|
(15) Income Taxes
|
49 | |||
|
(16) Commitments, Contingencies and Guarantees
|
52 | |||
|
(17) Net Capital Requirements
|
54 | |||
|
(18) Segment Reporting
|
54 | |||
|
(19) Related Party Transactions
|
55 | |||
|
(20) Selected Quarterly Financial Data (Unaudited)
|
56 | |||
|
(21) Subsequent Events
|
56 | |||
11
JEFFERIES GROUP, INC.
AND SUBSIDIARIES
AND SUBSIDIARIES
Notes to Consolidated Financial Statements – (Continued)
December 31, 2009 and 2008
December 31, 2009 and 2008
(1) Organization and Summary of Significant Accounting Policies
Organization
The accompanying audited Consolidated Financial Statements include the accounts of Jefferies Group, Inc. and all its subsidiaries (together, “we” or “us”), including Jefferies & Company, Inc. (“Jefferies”), Jefferies Execution Services, Inc., (“Jefferies Execution”), Jefferies International Limited, Jefferies Asset Management, LLC, Jefferies Financial Products, LLC and all
other entities in which we have a controlling financial interest or are the “primary beneficiary”, including Jefferies High Yield Holdings, LLC (“JHYH”), Jefferies Special Opportunities Partners, LLC and Jefferies Employees Special Opportunities Partners, LLC. The accompanying Consolidated Financial Statements have been prepared in accordance with U.S. generally accepted accounting principles (“GAAP”) for financial information and with the instructions to Form 10-K.
On April 21, 2008, we issued 26,585,310 shares of common stock and made a cash payment of approximately $100 million to Leucadia National Corporation (“Leucadia”). In exchange, we received from Leucadia 10,000,000 common shares of Leucadia. During the second quarter of 2008, we sold the 10,000,000 common shares of Leucadia and thus realized approximately $433.6 million in net cash from the issuance
of our shares.
Reclassifications
Certain reclassifications have been made to previously reported balances to conform to the current presentation. As of the quarter ended September 30, 2009, we classified certain amounts within Receivables on the Consolidated Statements of Financial Condition that previously were classified within Other assets. Approximately $117.0 million has been reclassified from Other assets to Receivables at December 31,
2008 to conform with the current presentation.
Prior to October 1, 2009, commissions and commission equivalents earned on certain over-the-counter equity securities trades were reported within Principal transactions revenue. As of October 1, 2009, these revenues are included within Commission revenue on the Consolidated Statements of Earnings. Previously presented financial statements have been adjusted to change these revenues from Principal transactions revenue
to Commissions revenue. The impact of these changes is to increase Commissions revenue for the nine months ended September 30, 2009 by $96.5 million from $298.6 million to $395.1 million and conversely to decrease Principal transactions by $96.5 million from $807.6 million to $711.1 million for transactions during the nine month period ended September 30, 2009 previously presented in our Quarterly Report on Form 10-Q, as filed on November 5, 2009. Additionally, these changes
increased Commissions revenue for the year ended December 31, 2008 by $167.5 million from $444.3 million to $611.8 million and conversely decreased Principal transactions revenue by $167.5 million from $87.3 million to $(80.2) million. There was no impact on Total revenues, Net revenues, Net earnings (loss) or Earnings (loss) per share for the years ended December 31, 2009 or 2008 due to these changes.
Impact of Adoption of Accounting Pronouncements on Prior Periods
Prior to January 1, 2009, we reported minority interest within liabilities on our Consolidated Statements of Financial Condition and in earnings (loss) of consolidated subsidiaries in the determination of net earnings (loss). We now present noncontrolling interests within stockholders’ equity, separately from our own equity. We have recast certain prior financial statements to retrospectively reflect noncontrolling
interest within stockholders’ equity and to allocate net (earnings) loss to noncontrolling interests and to common shareholders’. See Note 11 for further discussion.
In addition, as of January 1, 2009, net earnings are allocated among common shareholders and participating securities based on their right to share in earnings. These financial statements have been recast to retrospectively apply this accounting policy. This reduced previously reported Basic and Diluted EPS. See Note 14 to these financial statements for an explanation of the calculation of earnings per share.
12
JEFFERIES GROUP, INC.
AND SUBSIDIARIES
AND SUBSIDIARIES
Notes to Consolidated Financial Statements – (Continued)
December 31, 2009 and 2008
December 31, 2009 and 2008
Summary of Significant Accounting Policies
Accounting Standards Codification
The FASB established the Accounting Standards Codification™ (“ASC”) on July 1, 2009 as the single source of authoritative GAAP to be applied by nongovernmental entities. The ASC supersedes all existing non-SEC accounting and reporting standards. All other nongrandfathered, non-SEC accounting literature not included in the ASC is no longer authoritative.
Following the ASC, the FASB no longer issues new standards in the form of Statements, FASB Staff Positions or Emerging Issues Task Force Abstracts. Instead, it issues Accounting Standards Updates, which serve to update the ASC, provide background information about the guidance and provide the basis for conclusions on the changes to the ASC. GAAP was not changed as a result of the FASB’s codification project, but the
codification project changes the way the guidance is organized and presented. As a result, these changes have a significant impact on how we reference GAAP in our financial statements and in our accounting policies for financial statements issued for interim and annual periods.
Principles of Consolidation
Our policy is to consolidate all entities in which we own more than 50% of the outstanding voting stock and have control. In addition, we consolidate entities which lack characteristics of an operating entity or business for which we are the primary beneficiary. The primary beneficiary is the party that absorbs a majority of the entity’s expected losses, receives a majority of its expected residual returns, or both,
as a result of holding variable interests, direct or implied. In situations where we have significant influence but not control of an entity that does not qualify as a variable interest entity, we apply the equity method of accounting or fair value accounting. We also have formed nonconsolidated investment vehicles with third-party investors that are typically organized as partnerships or limited liability companies. We act as general partner or managing member for these investment vehicles and have generally
provided the third-party investors with termination or “kick-out” rights.
All material intercompany accounts and transactions are eliminated in consolidation.
Revenue Recognition Policies
Commissions.
All customer securities transactions are reported on the Consolidated Statements of Financial Condition on a settlement date basis with related income reported on a trade-date basis. Under clearing agreements, we clear trades for unaffiliated correspondent brokers and retain a portion of commissions as a fee for our services. Correspondent clearing revenues
are included in Other revenue. We permit institutional customers to allocate a portion of their gross commissions to pay for research products and other services provided by third parties. The amounts allocated for those purposes are commonly referred to as soft dollar arrangements. Soft dollar expenses amounted to $32.5 million and $42.9 million for 2009 and 2008, respectively. We account for the cost of these arrangements on an accrual basis. As we are not the primary obligor for these arrangements,
expenses relating to soft dollars are netted against the commission revenues.
Principal Transactions.
Financial instruments owned and Financial instruments sold, but not yet purchased (all of which are recorded on a trade-date basis) are carried at fair value with unrealized gains and losses reflected in Principal transactions in the Consolidated Statements of Earnings on a trade date basis, except for unrealized gains and losses on financial
instruments held by consolidated asset management entities, which are presented in Asset management fees and investment income (loss) from managed funds.
13
JEFFERIES GROUP, INC.
AND SUBSIDIARIES
AND SUBSIDIARIES
Notes to Consolidated Financial Statements – (Continued)
December 31, 2009 and 2008
December 31, 2009 and 2008
Investment Banking.
Underwriting revenues and fees from mergers and acquisitions, restructuring and other investment banking advisory assignments are recorded when the services related to the underlying transaction are completed under the terms of the assignment or engagement. Expenses associated with such assignments are deferred until reimbursed by the client, the
related revenue is recognized or the engagement is otherwise concluded. Expenses are recorded net of client reimbursements. Revenues are presented net of related unreimbursed expenses. Unreimbursed expenses with no related revenues are included in business development in the Consolidated Statements of Earnings. Reimbursed expenses totaled approximately $12.2 million and $14.3 million for the years ended December 31, 2009 and 2008, respectively.
Asset Management Fees and Investment Income (Loss) From Managed Funds.
Asset management fees and investment income (loss) from managed funds include revenues we receive from management, administrative and performance fees from funds managed by us, revenues from management and performance fees we receive from third-party managed funds and investment income (loss) from
our investments in these funds. We receive fees in connection with management and investment advisory services performed for various funds and managed accounts. These fees are based on the value of assets under management and may include performance fees based upon the performance of the funds. Management and administrative fees are generally recognized over the period that the related service is provided based upon the beginning or ending net asset value of the relevant period. Generally, performance fees are
earned when the return on assets under management exceeds certain benchmark returns, “high-water marks” or other performance targets. Performance fees are accrued on a monthly basis based on measuring performance to date versus the performance benchmark in the management agreement.
Interest Revenue and Expense.
We recognize contractual interest on financial instruments owned and financial instruments sold, but not yet purchased, on an accrual basis as a component of interest revenue and expense. Interest flows on derivative trading transactions and dividends are included as part of the fair valuation of these contracts in Principal transactions
in the Consolidated Statements of Earnings and are not recognized as a component of interest revenue or expense. We account for our short-term, long-term borrowings and our mandatorily redeemable convertible preferred stock on an accrual basis with related interest recorded as Interest expense. In addition, we recognize interest revenue related to our securities borrowed and securities purchased under agreements to resell activities and interest expense related to our securities loaned and securities sold under
agreements to repurchase activities on an accrual basis.
Cash Equivalents
Cash equivalents include highly liquid investments not held for resale with original maturities of three months or less.
Cash and Securities Segregated and on Deposit for Regulatory Purposes or Deposited With Clearing
and Depository Organizations
In accordance with Rule 15c3-3 of the Securities Exchange Act of 1934, Jefferies & Company, Inc., as a broker-dealer carrying client accounts, is subject to requirements related to maintaining cash or qualified securities in a segregated reserve account for the exclusive benefit of its clients. In addition, certain financial instruments used for initial and variation margin purposes with clearing and depository organizations
are recorded in this caption.
Foreign Currency Translation
Assets and liabilities of foreign subsidiaries having non-U.S. dollar functional currencies are translated at exchange rates at the end of a period. Revenues and expenses are translated at average exchange rates during the period. The gains or losses resulting from translating foreign currency financial statements into U.S. dollars, net of hedging gains or losses and taxes, if any, are included in Other comprehensive income
(loss). Gains or losses resulting from foreign currency transactions are included in Principal transactions in the Consolidated Statements of Earnings.
14
JEFFERIES GROUP, INC.
AND SUBSIDIARIES
AND SUBSIDIARIES
Notes to Consolidated Financial Statements – (Continued)
December 31, 2009 and 2008
December 31, 2009 and 2008
Financial Instruments
Financial instruments owned and Financial instruments sold, not yet purchased are recorded at fair value, either through the fair value option election or as required by other accounting pronouncements. These instruments primarily represent our trading activities and include both cash and derivative products. Realized and unrealized gains and losses are recognized in Principal transactions in our Consolidated Statements of
Earnings. The fair value of a financial instrument is the amount that would be received to sell an asset or paid to transfer a liability in an orderly transaction between market participants at the measurement date (the exit price).
Fair Value Hierarchy
In determining fair value, we maximize the use of observable inputs and minimize the use of unobservable inputs by requiring that observable inputs be used when available. Observable inputs are inputs that market participants would use in pricing the asset or liability based on market data obtained from independent sources. Unobservable inputs reflect our assumptions that market participants would use in pricing the asset
or liability developed based on the best information available in the circumstances. We apply a hierarchy to categorize our fair value measurements broken down into three levels based on the transparency of inputs as follows:
|
Level 1:
|
Quoted prices are available in active markets for identical assets or liabilities as of the reported date. | |
|
|
||
|
Level 2:
|
Pricing inputs are other than quoted prices in active markets, which are either directly or indirectly observable as of the reported date. The nature of these financial instruments include cash instruments for which quoted prices are available but traded less frequently, derivative instruments whose fair value have been derived using a model where inputs to the model are directly observable in the market, or can be derived principally from or corroborated by observable market data, and instruments that are fair valued using other financial instruments, the parameters of which can be directly observed. | |
|
|
||
|
Level 3:
|
Instruments that have little to no pricing observability as of the reported date. These financial instruments are measured using management’s best estimate of fair value, where the inputs into the determination of fair value require significant management judgment or estimation. |
Valuation Process for Financial Instruments
Financial instruments are valued at quoted market prices, if available. For financial instruments that do not have readily determinable fair values through quoted market prices, the determination of fair value is based upon consideration of available information, including types of financial instruments, current financial information, restrictions on dispositions, fair values of underlying financial instruments and quotations
for similar instruments. Certain financial instruments have bid and ask prices that can be observed in the marketplace. For financial instruments whose inputs are based on bid-ask prices, mid-market pricing is applied and adjusted to the point within the bid-ask range that meets our best estimate of fair value. For offsetting positions in the same financial instrument, the same price within the bid-ask spread is used to measure both the long and short positions.
The valuation process for financial instruments may include the use of valuation models and other techniques. Adjustments to valuations (such as counterparty, credit, concentration or liquidity) derived from valuation models may be made when, in management’s judgment, either the size of the position in the financial instrument in a nonactive market or other features of the financial instrument such as its complexity,
or the market in which the financial instrument is traded require that an adjustment be made to the value derived from the models. An adjustment may be made if a financial instrument is subject to sales restrictions that would result in a price less than the quoted market price. Adjustments from the price derived from a valuation model reflect management’s judgment that other participants in the market for the financial instrument being measured at fair value would also consider in valuing that same financial
instrument and are adjusted for assumptions about risk uncertainties and
15
JEFFERIES GROUP, INC.
AND SUBSIDIARIES
AND SUBSIDIARIES
Notes to Consolidated Financial Statements – (Continued)
December 31, 2009 and 2008
December 31, 2009 and 2008
market conditions. Results from valuation models and valuation techniques in one period may not be indicative of future period fair value measurements.
Cash products — Where quoted prices are available in an active market, cash products are classified in Level 1 of the fair value hierarchy and valued based on the quoted price, primarily quoted exchange prices. Level 1 cash products are highly liquid instruments and include listed equity and money market securities and G-7 government and agency securities. Cash products classified within Level 2 of the fair value hierarchy
are based primarily on broker quotations, pricing service data from external providers and prices for actual executed market transactions. If quoted market prices are not available for the specific security then fair values are estimated by using pricing models, quoted prices of cash products with similar characteristics or discounted cash flow models. Examples of cash products classified within Level 2 of the fair value hierarchy are corporate, convertible and municipal bonds, agency and non-agency mortgage-backed
securities and to-be-announced (“TBA”) securities. If there is limited transaction activity or less transparency to observe market-based inputs to valuation models, cash products presented at fair value are classified in Level 3 of the fair value hierarchy. Fair values of cash products classified in Level 3 are generally based on an assessment of each underlying investment, cash flow models, market data of any recent comparable company transactions and trading multiples of companies considered comparable
to the instrument being valued and incorporate assumptions regarding market outlook, among other factors. Additionally, investments in entities that have the characteristics of an investment company are valued based on the investment’s net asset value calculated based on the fair value of an entity’s underlying assets and liabilities unless the investment is held in a trading portfolio. Cash products in this category include illiquid equity securities, equity interests in private companies, auction
rate securities, commercial loans, private equity and hedge fund investments, distressed debt instruments and Alt-A and subprime non-agency mortgage-backed securities as little external price information is currently available for these products. For distressed debt instruments, commercial loans and loan commitments, loss assumptions must be made based on default scenarios and market liquidity and prepayment assumptions must be made for mortgage-backed securities.
Derivative products – Exchange-traded derivatives are valued using quoted market prices and are classified within Level 1 of the fair value hierarchy. Over-the-counter (“OTC”) derivative products are generally valued using models, whose inputs reflect assumptions that we believe market participants would use in valuing the derivative in a current period transaction. Inputs to valuation models are appropriately
calibrated to market data, including but not limited to yield curves, interest rates, volatilities, equity, debt and commodity prices and credit curves. Fair value can be modeled using a series of techniques, including the Black-Scholes option pricing model and simulation models. For certain OTC derivative contracts, inputs to valuation models do not involve a high degree of subjectivity as the valuation model inputs are readily observable or can be derived from actively quoted markets. OTC derivative contracts
thus classified in Level 2 include certain credit default swaps, interest rate swaps, commodity swaps, and debt and equity option contracts. Derivative products that are valued based on models with significant unobservable market inputs are classified within Level 3 of the fair value hierarchy. Level 3 derivative products include total return swaps and equity warrant and option contracts where the volatility of the underlying equity securities are not observable due to the terms of the contracts and correlation
sensitivity to market indices is not transparent for the term of the derivatives.
Investments in Managed Funds
Investments in managed funds include our investments in funds managed by us and our investments in third-party managed funds in which we are entitled to a portion of the management and/or performance fees. Investments in nonconsolidated managed funds are accounted for on the equity method. Gains or losses on our investments in managed funds are included in Asset management fees and investment income (loss) from managed
funds in the Consolidated Statements of Earnings.
16
JEFFERIES GROUP, INC.
AND SUBSIDIARIES
AND SUBSIDIARIES
Notes to Consolidated Financial Statements – (Continued)
December 31, 2009 and 2008
December 31, 2009 and 2008
Other Investments
Other investments includes investments entered into where we exercise significant influence over operating and capital decisions in private equity and other operating entities in connection with our capital market activities and loans issued in connection with such activities. Other investments are accounted for on the equity method or at cost, as appropriate.
Receivable from, and Payable to, Customers
Receivable from and Payable to customers includes amounts receivable and payable on cash and margin transactions. Securities owned by customers and held as collateral for these receivables are not reflected in the accompanying consolidated financial statements.
Securities Borrowed and Securities Loaned
Securities borrowed and Securities loaned are carried at cost. In connection with both trading and brokerage activities, we borrow securities to cover short sales and to complete transactions in which customers have failed to deliver securities by the required settlement date, and lend securities to other brokers and dealers for similar purposes. We have an active securities borrowed and lending matched book business in which
we borrow securities from one party and lend them to another party. When we borrow securities, we generally provide cash to the lender as collateral, which is reflected in our Consolidated Statements of Financial Condition as Securities borrowed. We earn interest revenues on this cash collateral. Similarly, when we lend securities to another party, that party generally provides cash to us as collateral, which is reflected in our Consolidated Statements of Financial Condition as Securities loaned. We pay interest
expense on the cash collateral received from the party borrowing the securities. A substantial portion of our interest revenues and interest expenses results from this matched book activity. The initial collateral advanced or received approximates or is greater than the fair value of the securities borrowed or loaned. We monitor the fair value of the securities borrowed and loaned on a daily basis and request additional collateral or return excess collateral, as appropriate.
Securities Purchased Under Agreements to Resell and Securities Sold Under Agreements to Repurchase
Securities purchased under agreements to resell and Securities sold under agreements to repurchase (collectively “repos”) are accounted for as collateralized financing transactions and are recorded at their contracted repurchase amount. Such amounts include accrued interest and the net interest revenues from this activity are reflected in our Consolidated Statements of Earnings.
We monitor the fair value of the underlying securities daily versus the related receivable or payable balances. Should the fair value of the underlying securities decline or increase, additional collateral is requested or excess collateral is returned, as appropriate. We carry repos on a net basis by counterparty, when appropriate.
Premises and Equipment
Premises and equipment are depreciated using the straight-line method over the estimated useful lives of the related assets (generally three to ten years). Leasehold improvements are amortized using the straight-line method over the term of the related leases or the estimated useful lives of the assets, whichever is shorter. As of December 31, 2009 and 2008 furniture, fixtures and equipment amounted to $245.4 million
and $218.8 million, respectively, and leasehold improvements amounted to $108.3 million and $104.7 million, respectively. Accumulated depreciation and amortization was $213.5 million and $184.1 million as of December 31, 2009 and 2008, respectively.
Depreciation and amortization expense amounted to $39.8 million and $29.3 million for the years ended December 31, 2009 and 2008, respectively.
17
JEFFERIES GROUP, INC.
AND SUBSIDIARIES
AND SUBSIDIARIES
Notes to Consolidated Financial Statements – (Continued)
December 31, 2009 and 2008
December 31, 2009 and 2008
Goodwill
At least annually, and more frequently if warranted, we assess whether goodwill has been impaired by comparing the estimated fair value, calculated based on earnings and book value multiples, of each reporting unit with its estimated net book value, by estimating the amount of stockholders’ equity required to support each reporting unit. We have two reporting units, Capital Markets and Asset Management. Periodically
estimating the fair value of a reporting unit requires significant judgment and often involves the use of significant estimates and assumptions. These estimates and assumptions could have a significant effect on whether or not an impairment charge is recorded and the magnitude of such a charge. We completed our annual assessment of goodwill as of September 30, 2009 and no impairment has been identified.
Income Taxes
We file a consolidated U.S. federal income tax return, which includes all of our qualifying subsidiaries. We also are subject to income tax in various states and municipalities and those foreign jurisdictions in which we operate. Amounts provided for income taxes are based on income reported for financial statement purposes and do not necessarily represent amounts currently payable. Deferred tax assets and liabilities are
recognized for the future tax consequences attributable to differences between the financial statement carrying amounts of existing assets and liabilities and their respective tax bases and for tax loss carry-forwards. Deferred tax assets and liabilities are measured using enacted tax rates expected to apply to taxable income in the years in which those temporary differences are expected to be recovered or settled. The effect on deferred tax assets and liabilities of a change in tax rates is recognized in income
in the period that includes the enactment date. Deferred income taxes are provided for temporary differences in reporting certain items, principally, share-based compensation, deferred compensation, unrealized gains and losses on investments and tax amortization on intangible assets. The realization of deferred tax assets is assessed and a valuation allowance is recorded to the extent that it is more likely than not that any portion of the deferred tax asset will not be realized.
The tax benefit related to dividends and dividend equivalents paid on nonvested share based payment awards and outstanding equity options is recognized as an increase to Additional paid in capital. Prior to January 1, 2008, such income tax benefit was recognized as a reduction of Income tax expense. These amounts are included in tax benefits for issuance of share-based awards on the Consolidated Statement of Changes
in Stockholders’ Equity.
Legal Reserves
We recognize a liability for a contingency when it is probable that a liability has been incurred and when the amount of loss can be reasonably estimated. When a range of probable loss can be estimated, we accrue the most likely amount of such loss, and if such amount is not determinable, then we accrue the minimum of the range of probable loss.
We record reserves related to legal proceedings in Accrued expenses and other liabilities to the extent such losses are probable and can be estimated. The determination of these reserve amounts requires significant judgment on the part of management. We consider many factors including, but not limited to: the amount of the claim; the basis and validity of the claim; previous results in similar cases; and legal precedents
and case law. Each legal proceeding is reviewed with counsel in each accounting period and the reserve is adjusted as deemed appropriate by management.
Share-based Compensation
Share-based awards are measured based on the grant-date fair value of the award and recognized over the period from the service inception date through the date the employee is no longer required to provide service to earn the award. Expected forfeitures are included in determining share-based compensation expense.
18
JEFFERIES GROUP, INC.
AND SUBSIDIARIES
AND SUBSIDIARIES
Notes to Consolidated Financial Statements – (Continued)
December 31, 2009 and 2008
December 31, 2009 and 2008
Earnings per Common Share
Basic earnings per share (“EPS”) is computed by dividing Net earnings (loss) available to common shareholders by the weighted average number of common shares outstanding and certain other shares committed to be, but not yet issued. Net earnings (loss) available to common shareholders represent Net earnings (loss) to common shareholders reduced by the allocation of earnings to participating securities.
Losses are not allocated to participating securities. Common shares outstanding and certain other shares committed to be, but not yet issued, include restricted stock and restricted stock units for which no future service is required. Diluted EPS is computed by dividing net earnings available to common shareholders plus dividends on dilutive mandatorily redeemable convertible preferred stock by the weighted average number of common shares outstanding and certain other shares committed to be, but not yet issued,
plus all dilutive common stock equivalents outstanding during the period.
As of January 1, 2009, unvested share-based payment awards that contain nonforfeitable rights to dividends or dividend equivalents (whether paid or unpaid) are participating securities and, therefore, are included in the earnings allocation in computing earnings per share under the two-class method of earning per share. We grant restricted stock and restricted stock units as part of our share-based compensation that
contain nonforfeitable rights to dividends and dividend equivalents, respectively, and therefore, prior to the requisite service being rendered for the right to retain the award, restricted stock and restricted stock units meet the definition of a participating security. As such, we calculate Basic and Diluted earnings per share under the two-class method. All prior-period earnings per share data presented have been adjusted to include participating securities in the earnings per share computation using the two-class
method.
Securitization Activities
We engage in securitization activities related to residential and commercial mortgage-backed securities. Such transfers of financial assets are accounted for as sales when we have relinquished control over the transferred assets. The gain or loss on sale of such financial assets depends, in part, on the previous carrying amount of the assets involved in the transfer allocated between the assets sold and the retained interests,
if any, based upon their respective fair values at the date of sale. We may retain interests in the securitized financial assets as one or more tranches of the securitization. These retained interests are included with Mortgage- and asset-backed securities in the Consolidated Statement of Financial Condition at fair value. Any changes in the fair value of such retained interests are recognized in the Consolidated Statement of Earnings.
Accounting and Regulatory Developments
The following is a summary of ASC Topics that have impacted or will impact our disclosures and/or accounting policies for financial statements issued for interim and annual periods:
Earnings per Share
We adopted accounting changes described in ASC 260, Earnings per Share Topic, on January 1, 2009 which addresses whether instruments granted in share-based payment transactions are participating securities prior to vesting and, therefore, are included in the earnings allocation in computing earnings per share under the two-class method described in ASC 260. Unvested share-based payment awards that contain nonforfeitable
rights to dividends or dividend equivalents (whether paid or unpaid) are participating securities and shall be included in the computation of EPS pursuant to the two-class method. Accordingly, all prior-period EPS data presented has been adjusted to comply with the provisions of ASC 260. The adoption of accounting changes described in ASC 260 reduced previously reported Basic and Diluted EPS from a loss of $3.23 to a loss of $3.27 for the year ended December 31, 2008.
19
JEFFERIES GROUP, INC.
AND SUBSIDIARIES
AND SUBSIDIARIES
Notes to Consolidated Financial Statements — (Continued)
December 31, 2009 and 2008
December 31, 2009 and 2008
Debt
We apply the provisions of accounting updates described in ASC 470, Debt Topic, effective January 1, 2009, which clarifies that convertible debt instruments that may be settled in cash upon conversion (including partial cash settlement) were not previously addressed ASC 470 and specifies that issuers of such instruments should separately account for the liability and equity components in a manner that will reflect the
entity’s nonconvertible debt borrowing rate when interest cost is recognized in subsequent periods. This is effective for fiscal years and interim periods beginning after December 31, 2008. Adoption of this accounting update did not affect our financial condition, results of operations or cash flows.
Business Combinations
We apply the provisions of accounting described in ASC 805, Business Combinations Topic, to business combinations occurring after January 1, 2009. This requires an entity to recognize the assets acquired, liabilities assumed, contractual contingencies and contingent consideration measured at their fair value at the acquisition date for any business combination consummated after the effective date. It further requires
that acquisition-related costs are to be recognized separately from the acquisition and expensed as incurred. Adoption of this accounting change did not affect our financial condition, results of operations or cash flows, but may have an effect on accounting for future business combinations.
Consolidation
We adopted the provisions of accounting described in ASC 810, Consolidation Topic, on January 1, 2009, which requires an entity to clearly identify and present ownership interests in subsidiaries held by parties other than the entity in the consolidated financial statements within the equity section but separate from the entity’s equity. It also requires the amount of consolidated net income attributable to the parent
and to the noncontrolling interest be clearly identified and presented on the face of the consolidated statement of income; changes in ownership interest be accounted for similarly, as equity transactions; and when a subsidiary is deconsolidated, any retained noncontrolling equity investment in the former subsidiary and the gain or loss on the deconsolidation of the subsidiary be measured at fair value. Refer to Note 11 for further discussion on the adoption of the changes described in ASC 810.
We have adopted further accounting changes described in ASC 810, Consolidation Topic, as of January 1, 2010, which require that the party who has the power to direct the activities of a variable interest entity that most significantly impact the entity’s economic performance and who has an obligation to absorb losses of the entity or a right to receive benefits from the entity that could potentially be significant
to the entity consolidate the variable interest entity. The changes to ASC 810, effective as of January 1, 2010, eliminate the quantitative approach previously applied to assessing the consolidation of a variable interest entity and require ongoing reassessments for consolidation. Upon adoption of these accounting changes on January 1, 2010, we consolidated certain CLOs and other investment vehicles. The consolidation of these entities resulted in an increase in total assets of $1,606.8 million,
an increase in total liabilities of $1,603.8 million and an increase to total stockholders’ equity of $3.0 million on January 1, 2010. In January 2010, we sold and assigned our management agreements for the CLOs to a third party; thus we no longer have the power to direct the most significant activities of the CLOs. Upon the assignment of the management agreements in the first quarter of 2010, we deconsolidated the CLOs and account for our remaining interests in the CLOs at fair value.
Derivatives and Hedging
We adopted certain accounting disclosures described in ASC 815, Derivative and Hedging Topic, for our year end consolidated financial statements as of December 31, 2008. This requires enhanced disclosures by sellers of credit derivatives, including credit derivatives embedded in a hybrid instrument, and require additional disclosure about the current status of the payment/performance risk of a guarantee. The adoption
did not have an effect on our financial condition, results of operations or cash flows.
20
JEFFERIES GROUP, INC.
AND SUBSIDIARIES
AND SUBSIDIARIES
Notes to Consolidated Financial Statements — (Continued)
December 31, 2009 and 2008
December 31, 2009 and 2008
We adopted accounting changes described in ASC 815, Derivative and Hedging Topic, effective January 1, 2009, requiring qualitative disclosures about objectives and strategies for using derivatives, quantitative disclosures about fair values and amounts of gains and losses on derivative contracts and disclosures about credit-risk-related contingent features in derivative agreements. Since changes required as of January 1,
2009 required only additional disclosures concerning derivatives and hedging activities, adoption did not affect our financial condition, results of operations or cash flows.
Fair Value Measurements and Disclosures
We adopted accounting updates included in ASC 820, Fair Value Measurements and Disclosures Topic, as of April 1, 2009, which provide additional guidance for estimating fair value when the volume and level of activity for the asset or liability have significantly decreased. ASC 820 also includes guidance on identifying circumstances that indicate a transaction is not orderly. The adoption of these updates did not have
a material effect on our financial condition, results of operations and cash flows.
In August 2009, the FASB issued accounting updates to ASC 820, Fair Value Measurements and Disclosures Topic — Measuring Liabilities at Fair Value, which provides clarifying guidance for determining the fair value of a liability. We adopted this accounting update on October 1, 2009, which did not have a material effect on our financial condition, results of operations or cash flows.
On October 1, 2009, we adopted the accounting updates to ASC 820, Fair Value Measurements and Disclosures Topic — Investments in Certain Entities That Calculate Net Asset Value per Share (or Its Equivalent). Accordingly, investments in entities that have the characteristics of an investment company and have no readily determinable fair value are measured based on the net asset value per share of the investment.
The accounting updates also require disclosure by major category of investment about the attributes of the investment, the nature of any redemption restrictions on the investment, any unfunded commitments we have pertaining to the investment and the investment strategies of the underlying investees. There was no material effect on our financial condition, results of operations or cash flows as a result of this adoption.
Subsequent Events
We adopted accounting described in ASC 855, Subsequent Events Topic, as of our financial period ended June 30, 2009, requiring that management evaluate events and transactions that may occur for potential recognition or disclosure in the financial statements after the balance sheet date through the date the financial statements are issued and determining the circumstances under which such events or transactions must
be recognized in the financial statements. The adoption did not have an effect on our financial condition, results of operations or cash flows.
Transfers and Servicing
We adopted accounting updates included in ASC 860, Transfers and Servicing Topic, effective January 1, 2009, which require an initial transfer of a financial asset and a repurchase financing that was entered into contemporaneously or in contemplation of the initial transfer to be evaluated as a linked transaction unless certain criteria are met. The updates to ASC 860 are to be applied prospectively for new transactions
entered into after the adoption date. The adoption did not have a material effect on financial condition, cash flows or results of operations.
We adopted further accounting changes described in ASC 860, Transfers and Servicing Topic, as of January 1, 2010, which eliminate the concept of a qualifying special purpose entity, require that a transferor consider all arrangements made contemporaneously with, or in contemplation of, a transfer of assets when determining whether derecognition of a financial asset is appropriate, clarify the requirement that a transferred
financial asset be legally isolated from the transferor and any of its consolidated affiliates, stipulate that constraints on a transferee’s ability to freely pledge or exchange transferred assets causes the transfer to fail sale accounting, and define participating interests and provides guidance on derecognizing participating interests. The adoption did not have an effect on our financial condition, results of operations or cash flows.
21
JEFFERIES GROUP, INC.
AND SUBSIDIARIES
AND SUBSIDIARIES
Notes to Consolidated Financial Statements — (Continued)
December 31, 2009 and 2008
December 31, 2009 and 2008
Use of Estimates
Our management has made a number of estimates and assumptions relating to the reporting of assets and liabilities and the disclosure of contingent assets and liabilities to prepare these financial statements in conformity with U.S. generally accepted accounting principles. The most important of these estimates and assumptions relate to fair value measurements and compensation and benefits. Although these and other estimates
and assumptions are based on the best available information, actual results could be materially different from these estimates. Current economic conditions increased the risks and complexity of the judgments in these estimates.
(2) Cash, Cash Equivalents, and Short-Term Investments
We generally invest our excess cash in money market funds and other short-term investments. Cash equivalents include highly liquid investments not held for resale with original maturities of three months or less. The following are financial instruments that are cash and cash equivalents or are deemed by us to be generally readily convertible into cash as of December 31, 2009 and 2008 (in thousands of dollars):
| December 31, | ||||||||
| 2009 | 2008 | |||||||
|
Cash and cash equivalents:
|
||||||||
|
Cash in banks
|
$ | 196,189 | $ | 765,056 | ||||
|
Money market investments
|
1,656,978 | 529,273 | ||||||
|
|
||||||||
|
Total cash and cash equivalents
|
1,853,167 | 1,294,329 | ||||||
|
Cash and securities segregated (1)
|
1,089,803 | 1,151,522 | ||||||
|
|
||||||||
|
|
$ | 2,942,970 | $ | 2,445,851 | ||||
|
|
||||||||
| (1) | Consists of deposits at exchanges and clearing organizations, as well as deposits in accordance with Rule 15c3-3 of the Securities Exchange Act of 1934, which subjects Jefferies, as a broker dealer carrying client accounts, to requirements related to maintaining cash or qualified securities in a segregated reserve account for the exclusive benefit of its clients. |
22
JEFFERIES GROUP, INC.
AND SUBSIDIARIES
AND SUBSIDIARIES
Notes to Consolidated Financial Statements — (Continued)
December 31, 2009 and 2008
December 31, 2009 and 2008
(3) Financial Instruments
The following is a summary of the fair value of major categories of financial instruments owned and financial instruments sold, not yet purchased, as of December 31, 2009 and 2008 (in thousands of dollars):
| December 31, 2009 | December 31, 2008 | |||||||||||||||
| Financial | Financial | |||||||||||||||
| Instruments | Instruments | |||||||||||||||
| Financial | Sold, | Financial | Sold, | |||||||||||||
| Instruments | Not Yet | Instruments | Not Yet | |||||||||||||
| Owned | Purchased | Owned | Purchased | |||||||||||||
|
Corporate equity securities
|
$ | 1,500,042 | $ | 1,360,528 | $ | 945,747 | $ | 739,166 | ||||||||
|
Corporate debt securities
|
2,421,704 | 1,909,781 | 1,851,216 | 1,578,395 | ||||||||||||
|
Government, federal agency and other sovereign obligations
|
1,762,643 | 1,735,861 | 447,233 | 211,045 | ||||||||||||
|
Mortgage- and asset-backed securities
|
3,079,865 | 21,474 | 1,035,996 | — | ||||||||||||
|
Loans and other receivables
|
591,208 | 363,080 | 34,407 | — | ||||||||||||
|
Derivatives
|
62,117 | 18,427 | 298,144 | 220,738 | ||||||||||||
|
Investments
|
70,156 | — | 75,059 | — | ||||||||||||
|
Other
|
— | — | — | 223 | ||||||||||||
|
|
||||||||||||||||
|
|
$ | 9,487,735 | $ | 5,409,151 | $ | 4,687,802 | $ | 2,749,567 | ||||||||
|
|
||||||||||||||||
We elected to apply the fair value option to loans and loan commitments made in connection with our investment banking and sales and trading activities and certain investments held by subsidiaries that are not registered broker-dealers. Loans and investments at fair value are included in financial instruments owned and loan commitments are included in financial instruments sold, not yet purchased — derivatives on the
Consolidated Statements of Financial Condition. The fair value option was elected for loans and loan commitments and investments held by subsidiaries that are not registered broker-dealers because they are risk managed by us on a fair value basis.
Cash and cash equivalents, the cash component of cash and securities segregated and on deposit for regulatory purposes or deposited with clearing and depository organizations, receivables - brokers, dealings and clearing organizations, receivables — customers, receivables — fees, interest and other, payables — brokers, dealers and clearing organizations and payables — customers, are not accounted for
at fair value; however, the recorded amounts approximate fair value due to their liquid or short-term nature.
Financial instruments owned includes securities pledged to creditors. The following is a summary of the fair value of major categories of securities pledged to creditors as of December 31, 2009 and 2008 (in thousands):
| December 31, | ||||||||
| 2009 | 2008 | |||||||
|
Equity securities
|
$ | 658,959 | $ | 360,356 | ||||
|
Fixed income securities
|
4,964,386 | 1,409 | ||||||
|
|
||||||||
|
|
$ | 5,623,345 | $ | 361,765 | ||||
|
|
||||||||
Counterparties generally have the right to sell or repledge the collateral. Additionally, we receive securities as collateral in connection with certain securities for securities transactions in which we are the lender of other securities. In instances where we are permitted to sell or repledge these securities, we report the fair value of the collateral received and the related obligation to return the collateral in the
Consolidated Statements of Financial
23
JEFFERIES GROUP, INC.
AND SUBSIDIARIES
AND SUBSIDIARIES
Notes to Consolidated Financial Statements — (Continued)
December 31, 2009 and 2008
December 31, 2009 and 2008
Condition. At December 31, 2009 and 2008, $68.5 million and $-0-, respectively, were reported as Securities received as collateral and as Obligation to return securities received as collateral.
At December 31, 2009 and 2008, the approximate fair value of collateral received by us that may be sold or repledged by us was $11.6 billion and $9.7 billion, respectively. This collateral was received in connection with resale agreements and securities borrowings. At December 31, 2009 and 2008, a substantial portion of this collateral received by us had been sold or repledged.
24
JEFFERIES GROUP, INC.
AND SUBSIDIARIES
AND SUBSIDIARIES
Notes to Consolidated Financial Statements — (Continued)
December 31, 2009 and 2008
December 31, 2009 and 2008
The following is a summary of our financial assets and liabilities that are accounted for at fair value on a recurring basis as of December 31, 2009 and 2008 by level within the fair value hierarchy (in thousands):
| As of December 31, 2009 | ||||||||||||||||||||
| Counterparty | ||||||||||||||||||||
| and Cash | ||||||||||||||||||||
| Collateral | ||||||||||||||||||||
| Level 1 | Level 2 | Level 3 | Netting | Total | ||||||||||||||||
|
Assets:
|
||||||||||||||||||||
|
Financial instruments owned:
|
||||||||||||||||||||
|
Corporate equity securities
|
$ | 1,419,019 | $ | 37,981 | $ | 43,042 | $ | — | $ | 1,500,042 | ||||||||||
|
Corporate debt securities
|
— | 2,295,486 | 116,648 | — | 2,412,134 | |||||||||||||||
|
Collateralized debt obligations
|
— | — | 9,570 | — | 9,570 | |||||||||||||||
|
U.S. government and federal agency securities
|
821,323 | 367,642 | — | — | 1,188,965 | |||||||||||||||
|
U.S. issued municipal securities
|
— | 127,346 | 420 | — | 127,766 | |||||||||||||||
|
Foreign government issued securities
|
71,199 | 374,517 | 196 | — | 445,912 | |||||||||||||||
|
Residential mortgage-backed securities
|
— | 2,578,796 | 136,496 | — | 2,715,292 | |||||||||||||||
|
Commercial mortgage-backed securities
|
— | 307,068 | 3,215 | — | 310,283 | |||||||||||||||
|
Other asset-backed securities
|
— | 54,180 | 110 | — | 54,290 | |||||||||||||||
|
Loans and other receivables
|
— | 84,666 | 506,542 | — | 591,208 | |||||||||||||||
|
Derivatives
|
219,067 | 102,357 | 1,909 | (261,216 | ) | 62,117 | ||||||||||||||
|
Investments at fair value
|
— | 4,592 | 65,564 | — | 70,156 | |||||||||||||||
|
|
||||||||||||||||||||
|
Total financial instruments owned
|
$ | 2,530,608 | $ | 6,334,631 | 883,712 | $ | (261,216 | ) | $ | 9,487,735 | ||||||||||
|
|
||||||||||||||||||||
|
Level 3 assets for which the firm does not bear economic exposure (1)
|
(379,153 | ) | ||||||||||||||||||
|
|
||||||||||||||||||||
|
Level 3 assets for which the firm bears economic exposure
|
$ | 504,559 | ||||||||||||||||||
|
|
||||||||||||||||||||
|
|
||||||||||||||||||||
|
Liabilities:
|
||||||||||||||||||||
|
Financial instruments sold, not yet purchased:
|
||||||||||||||||||||
|
Corporate equity securities
|
$ | 1,350,125 | $ | 10,403 | $ | — | $ | — | $ | 1,360,528 | ||||||||||
|
Corporate debt securities
|
— | 1,909,781 | — | — | 1,909,781 | |||||||||||||||
|
U.S. government and federal agency securities
|
1,350,155 | 1,911 | — | — | 1,352,066 | |||||||||||||||
|
U.S. issued municipal securities
|
— | 10 | — | — | 10 | |||||||||||||||
|
Foreign government issued securities
|
150,684 | 233,101 | — | — | 383,785 | |||||||||||||||
|
Residential mortgage-backed securities
|
— | 21,474 | — | — | 21,474 | |||||||||||||||
|
Loans
|
— | 10,660 | 352,420 | — | 363,080 | |||||||||||||||
|
Derivatives
|
225,203 | 100,731 | 4,926 | (312,433 | ) | 18,427 | ||||||||||||||
|
|
||||||||||||||||||||
|
Total financial instruments sold, not yet purchased
|
$ | 3,076,167 | $ | 2,288,071 | $ | 357,346 | $ | (312,433 | ) | $ | 5,409,151 | |||||||||
|
|
||||||||||||||||||||
| (1) | Consists of Level 3 assets which are attributable to third party and employee noncontrolling interests in certain consolidated entities. |
25
JEFFERIES GROUP, INC.
AND SUBSIDIARIES
AND SUBSIDIARIES
Notes to Consolidated Financial Statements — (Continued)
December 31, 2009 and 2008
December 31, 2009 and 2008
| As of December 31, 2008 | ||||||||||||||||||||
| Counterparty | ||||||||||||||||||||
| and Cash | ||||||||||||||||||||
| Collateral | ||||||||||||||||||||
| Level 1 | Level 2 | Level 3 | Netting | Total | ||||||||||||||||
|
Assets:
|
||||||||||||||||||||
|
Financial instruments owned:
|
||||||||||||||||||||
|
Securities
|
$ | 1,125,752 | $ | 2,782,707 | $ | 286,287 | — | $ | 4,194,746 | |||||||||||
|
Loans
|
— | 11,824 | 108,029 | — | 119,853 | |||||||||||||||
|
Derivative instruments
|
258,827 | 920,687 | — | (881,370 | ) | 298,144 | ||||||||||||||
|
Investments
|
— | — | 75,059 | — | 75,059 | |||||||||||||||
|
|
||||||||||||||||||||
|
Total financial instruments owned
|
$ | 1,384,579 | $ | 3,715,218 | 469,375 | $ | (881,370 | ) | $ | 4,687,802 | ||||||||||
|
|
||||||||||||||||||||
|
Level 3 assets for which the firm does not bear economic exposure (1)
|
(146,244 | ) | ||||||||||||||||||
|
|
||||||||||||||||||||
|
Level 3 assets for which the firm bears economic exposure
|
$ | 323,131 | ||||||||||||||||||
|
|
||||||||||||||||||||
|
|
||||||||||||||||||||
|
Liabilities:
|
||||||||||||||||||||
|
Financial instruments sold, not yet purchased:
|
||||||||||||||||||||
|
Securities
|
$ | 757,260 | $ | 1,768,054 | $ | 3,515 | — | $ | 2,528,829 | |||||||||||
|
Derivative instruments
|
187,806 | 491,876 | 8,197 | (467,141 | ) | 220,738 | ||||||||||||||
|
|
||||||||||||||||||||
|
Total financial instruments sold, not yet purchased
|
$ | 945,066 | $ | 2,259,930 | $ | 11,712 | $ | (467,141 | ) | $ | 2,749,567 | |||||||||
|
|
||||||||||||||||||||
| (1) | Consists of Level 3 assets which are attributable to third party and employee noncontrolling interests in certain consolidated entities. |
26
JEFFERIES GROUP, INC.
AND SUBSIDIARIES
AND SUBSIDIARIES
Notes to Consolidated Financial Statements — (Continued)
December 31, 2009 and 2008
December 31, 2009 and 2008
The following is a summary of changes in fair value of our financial assets and liabilities that have been classified as Level 3 for the year ended December 31, 2009 and 2008 (in thousands of dollars):
| Year Ended December 31, 2009 | ||||||||||||||||||||||||||||
| Change in | ||||||||||||||||||||||||||||
| Purchases, | unrealized gains/ | |||||||||||||||||||||||||||
| Total gains/ | sales, | (losses) relating to | ||||||||||||||||||||||||||
| Balance, | losses (realized | settlements, | Transfers | Transfers out | Balance, | instruments still | ||||||||||||||||||||||
| December | and unrealized) | and | into | of | December | held at December | ||||||||||||||||||||||
| 31, 2008 | (1) | issuances | Level 3 | Level 3 | 31, 2009 | 31, 2009 (1) | ||||||||||||||||||||||
|
Assets:
|
||||||||||||||||||||||||||||
|
Financial instruments owned:
|
||||||||||||||||||||||||||||
|
Corporate equity securities
|
$ | 41,351 | $ | (17,010 | ) | $ | 18,430 | $ | 7,179 | $ | (6,908 | ) | $ | 43,042 | $ | (13,704 | ) | |||||||||||
|
Corporate debt securities
|
177,603 | (44,975 | )(2) | 20,183 | 38,424 | (74,587 | ) | 116,648 | (37,140 | ) | ||||||||||||||||||
|
Collateralized debt obligations
|
2,179 | 7,391 | — | — | — | 9,570 | 7,391 | |||||||||||||||||||||
|
U.S. issued municipal securities
|
— | (63 | )(2) | 483 | — | — | 420 | (14 | ) | |||||||||||||||||||
|
Foreign government issued securities
|
— | 112 | 107 | 123 | (146 | ) | 196 | 33 | ||||||||||||||||||||
|
Residential mortgage-backed securities
|
63,065 | 75,161 | (77,047 | ) | 97,082 | (21,765 | ) | 136,496 | 4,010 | |||||||||||||||||||
|
Commercial mortgage-backed securities
|
— | (125 | ) | 2,737 | 925 | (322 | ) | 3,215 | (19 | ) | ||||||||||||||||||
|
Other asset-backed securities
|
2,089 | (583 | ) | 485 | — | (1,881 | ) | 110 | — | |||||||||||||||||||
|
Derivatives
|
— | 10,065 | (8,156 | ) | — | — | 1,909 | 4,342 | ||||||||||||||||||||
|
Loans and other receivables
|
108,029 | 15,215 | 395,745 | 15 | (12,462 | ) | 506,542 | (5,641 | ) | |||||||||||||||||||
|
Investments at fair value
|
75,059 | (1,871 | )(3) | 387 | 6 | (8,017 | ) | 65,564 | (2,243 | ) | ||||||||||||||||||
|
|
||||||||||||||||||||||||||||
|
|
$ | 469,375 | $ | 43,317 | $ | 353,354 | $ | 143,754 | $ | (126,088 | ) | $ | 883,712 | $ | (42,985 | ) | ||||||||||||
|
|
||||||||||||||||||||||||||||
|
|
||||||||||||||||||||||||||||
|
Liabilities:
|
||||||||||||||||||||||||||||
|
Financial instruments sold, not yet purchased:
|
||||||||||||||||||||||||||||
|
Corporate equity securities
|
$ | — | $ | — | $ | — | $ | 38 | $ | (38 | ) | $ | — | $ | — | |||||||||||||
|
Corporate debt securities
|
3,515 | 739 | (2,104 | ) | 2,952 | (5,102 | ) | — | — | |||||||||||||||||||
|
Derivatives
|
8,197 | (3,271 | ) | — | — | — | 4,926 | (839 | ) | |||||||||||||||||||
|
Loans
|
— | — | 352,420 | — | — | 352,420 | — | |||||||||||||||||||||
|
Other
|
— | 225 | (225 | ) | — | — | — | — | ||||||||||||||||||||
|
|
||||||||||||||||||||||||||||
|
|
$ | 11,712 | $ | (2,307 | ) | $ | 350,091 | $ | 2,990 | $ | (5,140 | ) | $ | 357,346 | $ | (839 | ) | |||||||||||
|
|
||||||||||||||||||||||||||||
| (1) | Realized and unrealized gains/ (losses) are reported in Principal transactions in the Consolidated Statements of Earnings. | |
| (2) | During the quarter ended June 30, 2009, we changed our valuation methodology for auction rate securities, which are included within corporate debt securities and U.S. issued municipal securities. Previously, auction rate securities were valued based on an internal model based on projected cash flows for the securities discounted for lack of liquidity. As of June 30, 2009, auction rate securities are valued using a valuation technique that benchmarks the securities to transactions and market prices of comparable securities, adjusting for projected cash flows and security structure, where appropriate. | |
| (3) | Prior to the fourth quarter of 2009, net asset values of investments used for determining fair value were adjusted for redemption restrictions, where appropriate. As of October 1, 2009, in connection with the adoption of ASU 2009-12, no adjustments were made to reported net asset values for these investments. |
27
JEFFERIES GROUP, INC.
AND SUBSIDIARIES
AND SUBSIDIARIES
Notes to Consolidated Financial Statements — (Continued)
December 31, 2009 and 2008
December 31, 2009 and 2008
| Year Ended December 31, 2008 | ||||||||||||||||||||
| Non-derivative | Non-derivative | Derivative | Derivative | |||||||||||||||||
| instruments | instruments - | instruments - | instruments - | |||||||||||||||||
| - Assets | Liabilities | Assets | Liabilities | Investments | ||||||||||||||||
|
Balance, December 31, 2007
|
$ | 248,397 | $ | 8,703 | $ | — | $ | 12,929 | $ | 104,199 | ||||||||||
|
Total gains/ (losses) (realized and unrealized) (1)
|
(102,313 | ) | (1,610 | ) | 184 | (18,635 | ) | (21,133 | ) | |||||||||||
|
Purchases, sales, settlements, and issuances
|
169,892 | (2,049 | ) | (727 | ) | (8,577 | ) | (8,007 | ) | |||||||||||
|
Net transfers into Level 3
|
221,866 | 63 | 543 | 22,480 | — | |||||||||||||||
|
Net transfers out of Level 3
|
(143,526 | ) | (1,592 | ) | — | — | — | |||||||||||||
|
|
||||||||||||||||||||
|
Balance, December 31, 2008
|
$ | 394,316 | $ | 3,515 | $ | — | $ | 8,197 | $ | 75,059 | ||||||||||
|
|
||||||||||||||||||||
|
|
||||||||||||||||||||
|
Change in unrealized gains/ (losses) relating to instruments still held at December 31, 2008 (1)
|
$ | (89,235 | ) | $ | 1,187 | $ | — | $ | 14,592 | $ | (16,283 | ) | ||||||||
| (1) | Realized and unrealized gains/ (losses) are reported in Principal transactions in the Consolidated Statements of Earnings. |
Level 3 cash instruments are frequently hedged with instruments classified within Level 1 and Level 2, and accordingly, gains or losses that have been reported in Level 3 are frequently offset by gains or losses attributable to instruments classified within Level 1 or Level 2 or by gains or losses on derivative contracts classified in Level 3 of the fair value hierarchy.
Of our investments at fair value at December 31, 2009, approximately $47.4 million represents investments in entities that have the characteristics of an investment company. The following table provides further information about those investments at December 31, 2009:
| December 31, 2009 | ||||||||||||||
| Unfunded | Redemption Frequency | |||||||||||||
| (in thousands) | Fair Value | Commitments | (if currently eligible) | |||||||||||
|
Equity Long/Short Hedge Funds
(a) (i)
|
$ | 16,210 | $ | — | Quarterly, Semiannually | |||||||||
|
Equity Long/Short Hedge Funds — International
(b) (i)
|
71 | — | ||||||||||||
|
High Yield Hedge Funds
(c) (i)
|
1,022 | — | ||||||||||||
|
High Yield Hedge Funds — International
(d) (i)
|
1,114 | — | At Will | |||||||||||
|
Fund of Funds
(e) (i)
|
6,497 | 166 | Annually, GP Consent Required | |||||||||||
|
Private Equity Funds
(f) (i)
|
10,407 | 3,150 | ||||||||||||
|
Private Equity Funds — International
(g)
|
6,979 | 5,081 | ||||||||||||
|
Other Investments
(h)
|
5,113 | — | At Will | |||||||||||
|
|
||||||||||||||
|
Total
(j)
|
$ | 47,413 | $ | 8,397 | ||||||||||
|
|
||||||||||||||
| (a) | This category includes investments in hedge funds that invest in both long and short equity securities in both domestic and international markets. These hedge funds may invest in securities in both public and private sectors. Investments representing approximately 2% of fair value cannot be redeemed as they are in liquidation and distributions will be received through the liquidation of the underlying assets of the funds. We are unable to estimate when the underlying assets will be liquidated. Investments representing approximately 31% of fair value cannot be redeemed until the lock-up period expires |
28
JEFFERIES GROUP, INC.
AND SUBSIDIARIES
AND SUBSIDIARIES
Notes to Consolidated Financial Statements — (Continued)
December 31, 2009 and 2008
December 31, 2009 and 2008
| on December 31, 2010. Investments representing approximately 67% of the fair value in this category are redeemable with 60 — 90 days prior written notice. | ||
| (b) | This category includes an investment in a hedge fund that invests in foreign technology equity securities, which has no redemption provisions. Distributions are received through the liquidation of the underlying assets of the fund, which is estimated to be within one to two years. | |
| (c) | This category includes investments in funds that invest in U.S. public high yield debt, private high yield investments, senior bank loans, public leveraged equities, distressed debt, private equity investments and emerging markets debt. There are no redemption provisions and distributions are received through the liquidation of the underlying assets of the funds. These funds are currently in liquidation; however, we are unable to estimate when the underlying assets will be fully liquidated. | |
| (d) | This category includes an investment in a hedge fund that invests in Russian fixed income instruments. The fair value of this investment was measured based on recent observable transaction prices as this investment is part of a management trading strategy. | |
| (e) | This category includes investments in funds of funds that invest in various private equity funds. Approximately 40% of the fair value of the investments is managed by Jefferies and has no redemption provisions. Distributions are received through the liquidation of the underlying assets of the fund of funds, which are estimated to be liquidated in one to three years. Investments representing approximately 60% of the fair value of the investments in this category have been approved for redemption and the funds’ net asset value is expected to be received within the first quarter of 2010. | |
| (f) | This category includes investments in private equity funds that invest in the equity of various U.S. private companies in the energy, technology, internet service and telecommunication service industries including acquired or restructured companies. These investments can never be redeemed; distributions are received through the liquidation of the underlying assets of the funds. Investments representing approximately 94% of fair value are expected to liquidate in one to eleven years. An investment representing approximately 6% of the total fair value in this category is currently in liquidation; however, we are unable to estimate when the underlying assets will be fully liquidated. | |
| (g) | This category includes investments in private equity funds that invest in the equity of foreign private companies. Investments representing approximately 74% of fair value are Israeli private equity funds that invest in service companies. The fair values of these investments have been estimated using the net asset value derived from each of the funds’ partner capital statements. These investments can never be redeemed; distributions are received through the liquidation of the underlying assets of the fund, which are estimated to be liquidated in two to five years. The fair value of investments representing approximately 26% of the fair value are private equity funds that invest in Croatian and Vietnamese companies. The fair values of these investments were measured based on recent observable transaction prices as these investments are part of a management trading strategy. | |
| (h) | Investments representing approximately 67% of the fair value of investments are held on behalf of a Jefferies’ deferred compensation plan measured at net asset value. Investments representing approximately 33% of fair value are closed-ended funds that invest in Vietnamese equity and debt instruments and are measured based on recent observable transaction prices as these investments are part of a management trading strategy. | |
| (i) | Fair value has been estimated using the net asset value derived from each of the funds’ partner capital statements. | |
| (j) | The Investments line item in the Consolidated Statement of Financial Condition includes $22.7 million of direct investments which are not investment companies and therefore are not part of this disclosure table. |
(4) Derivative Financial Instruments
Off-Balance Sheet Risk
We have contractual commitments arising in the ordinary course of business for securities loaned or purchased under agreements to resell, repurchase agreements, future purchases and sales of foreign currencies, securities transactions on a when-issued basis and underwriting. Each of these financial instruments and activities contains varying degrees of off-balance sheet risk whereby the fair values of the securities underlying
the financial instruments may be in excess of, or less than, the contract amount. The settlement of these transactions is not expected to have a material effect upon our consolidated financial statements.
29
JEFFERIES GROUP, INC.
AND SUBSIDIARIES
AND SUBSIDIARIES
Notes to Consolidated Financial Statements — (Continued)
December 31, 2009 and 2008
December 31, 2009 and 2008
Derivative Financial Instruments
Our derivative activities are recorded at fair value in the Consolidated Statements of Financial Condition, with realized and unrealized gains and losses recognized in Principal transactions in the Consolidated Statements of Earnings on a trade date basis and as a component of cash flows from operating activities in the Consolidated Statements of Cash Flows. Acting in a trading capacity, we may enter into derivative transactions
to satisfy the needs of our clients and to manage our own exposure to market and credit risks resulting from our trading activities.
Derivatives are subject to various risks similar to other financial instruments, including market, credit and operational risk. In addition, we may be exposed to legal risks related to derivative activities. The risks of derivatives should not be viewed in isolation, but rather should be considered on an aggregate basis along with our other trading-related activities. We manage the risks associated with derivatives on an
aggregate basis along with the risks associated with proprietary trading as part of our firmwide risk management policies. In connection with our derivative activities, we may enter into master netting agreements and collateral arrangements with counterparties. These agreements provide us with the ability to offset a counterparty’s rights and obligations, request additional collateral when necessary or liquidate the collateral in the event of counterparty default.
A portion of our derivative activities are performed by Jefferies Financial Products, LLC (“JFP”). JFP is a market maker in commodity index products and a trader in commodity futures and options. Where appropriate, JFP utilizes various credit enhancements, including guarantees, collateral, margin and master netting agreements to mitigate the credit exposure relating to these swaps and options. JFP establishes
credit limits based on, among other things, the creditworthiness of the counterparties, the transaction’s size and tenor, and estimated potential exposure. JFP maintains a credit intermediation facility with a highly rated European bank (the “Bank”), which allow JFP customers that require a counterparty with a high credit rating for commodity index transactions to transact with the Banks. The Banks simultaneously enter into offsetting transactions with JFP and receive a fee from JFP for providing
credit support.
The fair value of derivative assets and derivative liabilities are presented on the Consolidated Statements on Financial Condition in Financial Instruments Owned — Derivatives and Financial Instruments Sold, Not Yet Purchased — Derivatives net of cash paid or received under credit support agreements and on a net counterparty basis when a legal right to offset exists under a master netting agreement. Net unrealized
and realized gains and losses on derivative contracts are recognized within Principal transactions revenue in our Consolidated Statements of Earnings. (See Notes 3 and 16 for additional disclosures about derivative instruments.)
The following table presents the fair value and related notional amounts of derivative contracts at December 31, 2009 categorized by predominant risk exposure. The fair value of assets/liabilities related to derivative contracts represents our receivable/payable for derivative financial instruments, gross of counterparty netting and cash collateral received and pledged:
| December 31, 2009 | ||||||||||||||||
| Assets | Liabilities | |||||||||||||||
| Notional | Notional | |||||||||||||||
| (in thousands) | Fair Value | Amount | Fair Value | Amount | ||||||||||||
|
Interest rate contracts
|
$ | 27,415 | $ | 1,259,014 | $ | 24,068 | $ | 1,910,832 | ||||||||
|
Foreign exchange contracts
|
2,637 | 291,812 | 7,470 | 281,246 | ||||||||||||
|
Equity contracts
|
222,311 | 3,580,416 | 228,403 | 8,958,430 | ||||||||||||
|
Commodity contracts
|
54,257 | 4,882,782 | 57,237 | 2,683,425 | ||||||||||||
|
Credit contracts
|
16,713 | 217,441 | 13,682 | 135,000 | ||||||||||||
|
|
||||||||||||||||
|
Total
|
323,333 | $ | 10,231,465 | 330,860 | $ | 13,968,933 | ||||||||||
|
|
||||||||||||||||
|
Counterparty/cash-collateral netting
|
(261,216 | ) | (312,433 | ) | ||||||||||||
|
|
||||||||||||||||
|
Total per consolidated statement of financial position
|
$ | 62,117 | $ | 18,427 | ||||||||||||
|
|
||||||||||||||||
30
JEFFERIES GROUP, INC.
AND SUBSIDIARIES
AND SUBSIDIARIES
Notes to Consolidated Financial Statements — (Continued)
December 31, 2009 and 2008
December 31, 2009 and 2008
The following table presents net unrealized and realized gains and losses on derivative contracts for the year ended December 31, 2009:
| Year Ended | ||||
| December 31, 2009 | ||||
| (in thousands) | (Losses) Gains | |||
|
Interest rate contracts
|
$ | (11,581 | ) | |
|
Foreign exchange contracts
|
663 | |||
|
Equity contracts
|
(202,091 | ) | ||
|
Commodity contracts
|
(2,571 | ) | ||
|
Credit contracts
|
3,057 | |||
|
|
||||
|
Total
|
$ | (212,523 | ) | |
|
|
||||
The following tables set forth the remaining contract maturity of the fair value of OTC derivative assets and liabilities as of December 31, 2009. Derivative fair values include counterparty netting and are gross of cash collateral received and pledged:
| OTC derivative assets (1) (2) | ||||||||||||||||||||
| Greater Than | Cross-Maturity | |||||||||||||||||||
| (in thousands) | 0 – 12 Months | 1 – 5 Years | 5 Years | Netting (3) | Total | |||||||||||||||
|
Commodity swaps
|
$ | 10,832 | $ | 153 | $ | — | $ | (153 | ) | $ | 10,832 | |||||||||
|
Commodity options
|
18,705 | 8,301 | — | — | 27,006 | |||||||||||||||
|
Total return swaps
|
2,273 | 2,447 | — | — | 4,720 | |||||||||||||||
|
Credit default swaps
|
— | 315 | 13,600 | — | 13,915 | |||||||||||||||
|
Foreign exchange forwards and swaps
|
2,637 | — | — | (22 | ) | 2,615 | ||||||||||||||
|
Interest rate swaps
|
— | — | 6,554 | (460 | ) | 6,094 | ||||||||||||||
|
|
||||||||||||||||||||
|
Total
|
$ | 34,447 | $ | 11,216 | $ | 20,154 | $ | (635 | ) | $ | 65,182 | |||||||||
|
|
||||||||||||||||||||
| (1) | At December 31, 2009, we held exchange-traded derivative assets of $8.0 million. | |
| (2) | Option and swap contracts in the table above are gross of collateral received. Option and swap contracts are recorded net of collateral received on the Consolidated Statement of Financial Condition. At December 31, 2009, collateral received was $11.1 million. | |
| (3) | Amounts represent the netting of receivable balances with payable balances for the same counterparty across maturity categories. |
31
JEFFERIES GROUP, INC.
AND SUBSIDIARIES
AND SUBSIDIARIES
Notes to Consolidated Financial Statements — (Continued)
December 31, 2009 and 2008
December 31, 2009 and 2008
| OTC derivative liabilities (1) (2) | ||||||||||||||||||||
| Greater Than | Cross-Maturity | |||||||||||||||||||
| (in thousands) | 0 – 12 Months | 1 – 5 Years | 5 Years | Netting (3) | Total | |||||||||||||||
|
Commodity swaps
|
$ | 17,106 | $ | — | $ | — | $ | (153 | ) | $ | 16,953 | |||||||||
|
Commodity options
|
9,758 | 15,053 | — | — | 24,811 | |||||||||||||||
|
Total return swaps
|
278 | 256 | — | — | 534 | |||||||||||||||
|
Credit default swaps
|
— | 304 | 12,489 | — | 12,793 | |||||||||||||||
|
Equity options
|
— | 4,926 | — | — | 4,926 | |||||||||||||||
|
Foreign exchange forwards and swaps
|
3,077 | 4,394 | — | (22 | ) | 7,449 | ||||||||||||||
|
Interest rate swaps
|
— | 493 | 8,444 | (460 | ) | 8,477 | ||||||||||||||
|
|
||||||||||||||||||||
|
Total
|
$ | 30,219 | $ | 25,426 | $ | 20,933 | $ | (635 | ) | $ | 75,943 | |||||||||
|
|
||||||||||||||||||||
| (1) | At December 31, 2009, we held exchange-traded derivative liabilities of $4.9 million. | |
| (2) | Option and swap contracts in the table above are gross of collateral pledged. Option and swap contracts are recorded net of collateral pledged on the Consolidated Statement of Financial Condition. At December 31, 2009, collateral pledged was $62.4 million. | |
| (3) | Amounts represent the netting of receivable balances with payable balances for the same counterparty across maturity categories. |
At December 31, 2009, the counterparty credit quality with respect to the fair value of our OTC derivatives assets was as follows (in thousands). Derivative fair values include counterparty netting and are gross of cash collateral received:
| Total pre-credit | Credit | Total post- credit | ||||||||||
| enhancement | enhancement | enhancement | ||||||||||
| netting | netting (1) | netting | ||||||||||
|
Counterparty credit quality:
|
||||||||||||
|
A or higher
|
$ | 63,203 | $ | (832 | ) | $ | 62,371 | |||||
|
B to BBB
|
228 | — | 228 | |||||||||
|
Unrated
|
2,583 | — | 2,583 | |||||||||
|
|
||||||||||||
|
Total
|
$ | 66,014 | $ | (832 | ) | $ | 65,182 | |||||
|
|
||||||||||||
| (1) | Credit enhancement netting relates to JFP credit intermediation facilities with AA-rated European banks. |
Contingent Features
Certain of our derivative instruments contain provisions that require our debt to maintain an investment grade credit rating from each of the major credit rating agencies. If our debt were to fall below investment grade, it would be in violation of these provisions, and the counterparties to the derivative instruments could request immediate payment or demand immediate and ongoing full overnight collateralization on our derivative
instruments in liability positions. The aggregate fair value of all derivative instruments with such credit-risk-related contingent features that are in a liability position at December 31, 2009 is $12.2 million for which we have posted collateral of $18.9 million in the normal course of business. If the credit-risk-related contingent features underlying these agreements were triggered on December 31, 2009, we would be required to post an additional $4.6 million of collateral to our counterparties.
32
JEFFERIES GROUP, INC.
AND SUBSIDIARIES
AND SUBSIDIARIES
Notes to Consolidated Financial Statements — (Continued)
December 31, 2009 and 2008
December 31, 2009 and 2008
(5) Securitization Activities and Variable Interest Entities (“VIEs”)
Securitization Activities
We engage in securitization activities related to residential and commercial mortgage-backed and other asset-backed securities. In our securitization activities, we use special purpose entities (“SPEs”). We do not consolidate certain securitization vehicles, commonly known as qualifying special purpose entities (“QSPEs”), if they meet certain criteria regarding the types of assets and derivatives they
may hold, the types of sales they may engage in and the range of discretion they may exercise in connection with the assets they hold. The determination of whether a SPE meets the criteria to be a QSPE requires considerable judgment, particularly in evaluating whether the permitted activities of the SPE are significantly limited and in determining whether derivatives held by the SPE are passive and non-excessive.
We derecognize financial assets transferred in securitizations when we have relinquished control over such assets. Transferred assets are carried at fair value prior to securitization, with unrealized gains and losses reflected in Principal transactions in the Consolidated Statements of Earnings. We act as placement or structuring agent in connection with the beneficial interests issued by securitization vehicles. Net revenues
are recognized in connection with these activities.
During the years ended December 31, 2009 and 2008 we transferred assets of $11,284.1 million and $177.1 million, respectively, as part of our securitization activities, received proceeds of $11,308.5 million and $178.2 million, respectively, and recognized net revenues of $47.8 million and $10.0 million, respectively. These transfers were accounted for as sales of assets.
The following table presents the total assets (unpaid principal amount) of, and retained interests in, QSPEs at December 31, 2009 to which we, acting as transferor, have transferred assets and for which we received sale accounting treatment (in millions):
| Securitization Type | Total QSPE Assets | Retained Interests (1) | ||||||
|
Residential mortgage-backed securities
|
$ | 1,483.5 | $ | 104.8 | ||||
|
Commercial mortgage-backed securities
|
641.7 | 9.2 | ||||||
| (1) | At December 31, 2009, 100% of our retained interests in these securitizations are AAA-rated. |
The following table presents cash flows received on retained interests during the year ended December 31, 2009 (in millions):
| Residential | Commercial | |||||||
| mortgage-backed | mortgage-backed | |||||||
| securities | securities | |||||||
|
Cash flows received on retained interests
|
$ | 2.7 | $ | (0.2 | ) | |||
We have not provided financial or other support to these QSPEs during the year ended December 31 2009. We have no explicit or implicit arrangements to provide additional financial support to these QSPEs and have no liabilities related to these QSPEs at December 31 2009. Although not obligated, we may make a market in the securities issued by the QSPEs. In these market-making transactions, we buy these securities from
and sell these securities to investors. Securities purchased through these market-making activities are not considered to be retained interests, although the securities are included in Financial instruments owned - mortgage- and asset-backed securities.
33
JEFFERIES GROUP, INC.
AND SUBSIDIARIES
AND SUBSIDIARIES
Notes to Consolidated Financial Statements — (Continued)
December 31, 2009 and 2008
December 31, 2009 and 2008
Variable Interest Entities
Variable interest entities (“VIEs”) are entities in which equity investors lack the characteristics of a controlling financial interest or do not have sufficient equity at risk for the entity to finance its activities without additional subordinated financial support. VIEs are consolidated by the primary beneficiary. The primary beneficiary is the party that absorbs a majority of the entity’s expected losses,
receives a majority of its expected residual returns, or both, as a result of holding variable interests, direct or implied.
VIEs Where We Are The Primary Beneficiary
We conduct our high yield secondary market trading activities through Jefferies High Yield Trading, LLC (“JHYT”). JHYT is a registered broker-dealer engaged in the secondary sales and trading of high yield and distressed securities, bank loans and other financial instruments. JHYT makes markets in high yield and distressed securities and provides research coverage on these types of securities. JHYT is a wholly-owned
subsidiary of Jefferies High Yield Holdings, LLC (“JHYH”).
We own voting and non-voting interests in JHYH and have entered into management, clearing, and other services agreements with JHYH. We and Leucadia National Corporation (“Leucadia”) each have the right to nominate two of a total of four directors to JHYH’s board of directors. Two funds managed by us, Jefferies Special Opportunities Fund (“JSOP”) and Jefferies Employees Special Opportunities Fund
(“JESOP”), are also investors in JHYH. The arrangement term is through April 2013, with an option to extend. As a result of agreements entered into with Leucadia in April 2008, any request to Leucadia for additional capital investment in JHYH requires the unanimous consent of our Board of Directors, including the consent of any Leucadia designees to our board. (See Note 1, Organization and Summary of Significant Accounting Policies, herein for additional discussion of agreements entered into with
Leucadia.)
We determined that JHYH and JESOP each meet the definition of a variable interest entity. We are the primary beneficiary of JHYH and JESOP and accordingly consolidate JHYH (and the assets, liabilities and results of operations of its wholly-owned subsidiary JHYT) and JESOP.
The following tables present information about the assets and liabilities of our consolidated VIEs which are presented within our Consolidated Statement of Financial Condition in the respective asset and liability categories, as of December 31, 2009 and 2008 (in millions):
| VIE Assets | ||||||||
| December 31, 2009 | December 31, 2008 | |||||||
|
Cash
|
$ | 190.9 | $ | 277.1 | ||||
|
Financial instruments owned
|
1,100.1 | 546.9 | ||||||
|
Securities borrowed
|
559.9 | 242.7 | ||||||
|
Receivable from brokers and dealers
|
340.5 | — | ||||||
|
Other
|
47.0 | 49.3 | ||||||
|
|
||||||||
|
|
$ | 2,238.4 | $ | 1,116.0 | ||||
|
|
||||||||
34
JEFFERIES GROUP, INC.
AND SUBSIDIARIES
AND SUBSIDIARIES
Notes to Consolidated Financial Statements — (Continued)
December 31, 2009 and 2008
December 31, 2009 and 2008
| VIE Liabilities | ||||||||
| December 31, 2009 | December 31, 2008 | |||||||
|
Financial instruments sold, not yet purchased
|
$ | 893.2 | $ | 230.8 | ||||
|
Payable to brokers and dealers
|
326.5 | — | ||||||
|
Mandatorily redeemable interests (1)
|
964.2 | 854.0 | ||||||
|
Other
|
9.8 | 31.4 | ||||||
|
|
||||||||
|
|
$ | 2,193.7 | $ | 1,116.2 | ||||
|
|
||||||||
| (1) | After consolidation, which eliminates our interests and the interests of our consolidated subsidiaries, JSOP and JESOP, the carrying amount of the mandatorily redeemable financial interests pertaining to the above VIEs included within Mandatorily redeemable preferred interests of consolidated subsidiaries in the Consolidated Statements of Financial Condition was approximately $318.2 million and $280.9 million at December 31, 2009 and 2008, respectively. |
The assets of these VIEs are available for the benefit of the mandatorily redeemable interest holders.
Our maximum exposure to loss at December 31, 2009 and 2008 was $329.8 million and $291.2 million, respectively, which consist of our debt, equity and partnership interests in JHYH and JESOP which are eliminated in consolidation.
JHYH’s net revenue and formula-determined non-interest expenses amounted $186.9 million and $73.7 million, respectively, for the year ended December 31, 2009. JHYH’s net revenue and formula-determined non-interest expenses amounted to $(145.2) million and $48.7 million, respectively, for the year ended December 31, 2008. These revenues and expenses are included in commissions and principal
transactions and in our non-interest expenses. These formula-determined non-interest expenses do not necessarily reflect the actual expenses of operating JHYH. Based on the terms of our interests in JHYH and JESOP, percentages of JHYH and JESOP’s net revenue and non-interest expenses are allocated to us and to third party interest holders.
There have been no changes in our conclusion to consolidate JHYH and JESOP since formation.
VIEs Where We Have a Significant Variable Interest
We also hold significant variable interests in VIEs in which we are not the primary beneficiary and accordingly do not consolidate. Determining whether an interest in a VIE is significant is a matter of judgment and is based on an assessment of our exposure to the overall assets and liabilities of a VIE. We do not consolidate these VIEs as we do not absorb a majority of the entity’s expected losses or receive a majority
of its expected residual returns as a result of holding these variable interests. We have not provided financial or other support to these VIEs during the year ended December 31, 2009. We have no explicit or implicit arrangements to provide additional financial support to these VIEs and have no liabilities related to these VIEs at December 31, 2009.
The following table presents total assets in these nonconsolidated VIEs and our maximum exposure to loss associated with these non-consolidated VIEs in which we hold significant variable interests at December 31, 2009 and 2008 (in millions):
35
JEFFERIES GROUP, INC.
AND SUBSIDIARIES
AND SUBSIDIARIES
Notes to Consolidated Financial Statements — (Continued)
December 31, 2009 and 2008
December 31, 2009 and 2008
| December 31, 2009 | ||||||||||||
| Maximum exposure | ||||||||||||
| to loss in non- | Carrying | |||||||||||
| VIE Assets | consolidated VIEs | Amount | ||||||||||
|
Managed CLOs
|
$ | 1,310.0 | $ | 7.3 | (2) | $ | 7.3 | |||||
|
Third Party Managed CLO
|
552.6 | 14.4 | (2) | 14.4 | ||||||||
|
Mortgage- and Asset-Backed Vehicles (1)
|
123,560.0 | 488.7 | (2) | 488.7 | ||||||||
|
Private Equity Vehicle
|
52.3 | 50.0 | (3) | 45.7 | ||||||||
|
|
||||||||||||
|
Total
|
$ | 125,474.9 | $ | 560.4 | $ | 556.1 | ||||||
|
|
||||||||||||
| (1) | VIE assets represent the unpaid principal balance of the assets in these vehicles at December 31, 2009. | |
| (2) | Our maximum exposure to loss in these non-consolidated VIEs is limited to our investment. | |
| (3) | Our maximum exposure to loss in this non-consolidated VIE is limited to our loan commitment. |
| December 31, 2008 | ||||||||||||
| Maximum exposure | ||||||||||||
| to loss in non- | ||||||||||||
| consolidated VIEs | ||||||||||||
| VIE Assets | (2) | Carrying Amount | ||||||||||
|
Managed CLOs
|
$ | 925.0 | $ | 4.1 | $ | 4.1 | ||||||
|
Third Party Managed CLO
|
390.2 | 3.3 | 3.3 | |||||||||
|
Mortgage- and Asset-Backed Vehicles (1)
|
19,274.9 | 86.8 | 86.8 | |||||||||
|
|
||||||||||||
|
Total
|
$ | 20,590.1 | $ | 94.2 | $ | 94.2 | ||||||
|
|
||||||||||||
| (1) | VIE assets represent the unpaid principal balance of the assets in these vehicles at December 31, 2008. | |
| (2) | Our maximum exposure to loss in non-consolidated VIEs is limited to our investment. |
Managed CLOs.
We own significant variable interests in various managed collateralized loan obligations (“CLOs”) for which we are not the primary beneficiary, and therefore, do not consolidate these entities. We also receive management fees in connection with managing these CLOs. Our exposure to loss is limited to our capital contributions. Our investments
in these VIEs consists of securities and are accounted for at fair value and are included in investments in managed funds on our Consolidated Statements of Financial Condition.
Effective with the adoption of accounting changes to ASC 810, Consolidation Topics, on January 1, 2010, we have consolidated assets of $1.6 billion and liabilities of $1.6 billion related to these managed CLOs as we have concluded that we are the primary beneficiary on January 1, 2010 given our management rights over and capital interests in the CLOs. In January 2010, we sold and assigned our management
agreements for the CLOs to a third party; thus we no longer have the power to direct the most significant activities of the CLOs. Upon the assignment of the management agreements in the first quarter of 2010, we deconsolidated the CLOs and account for our remaining interests in the CLOs at fair value.
Third Party Managed CLO.
We have significant variable interests in Babson Loan Opportunity CLO, Ltd., a third party managed CLO. This VIE has assets consisting primarily of senior secured loans, unsecured loans and high yield bonds. Our variable interests in this VIE consists of debt securities. The fair value of our interests in this VIE consist of a direct interest
and an indirect interest via Jefferies Finance, LLC. The direct investment is accounted for at fair value and included in Financial instruments owned in our Consolidated Statements of Financial Condition.
Mortgage and Asset-Backed Vehicles
. We purchase and sell variable interests in VIEs, which primarily issue mortgage-backed and other asset-backed securities, in connection with our trading and market-making activities.
36
JEFFERIES GROUP, INC.
AND SUBSIDIARIES
AND SUBSIDIARIES
Notes to Consolidated Financial Statements — (Continued)
December 31, 2009 and 2008
December 31, 2009 and 2008
Our variable interests in these VIEs consist of mortgage and asset-backed securities and are accounted for at fair value and included in Financial instruments owned on our Consolidated Statements of Financial Condition.
Private Equity Vehicle.
We entered into a Credit Agreement with JCP Fund V Bridge Partners, LLC (“the Borrower or JCP V”), pursuant to which we may make loans to the Borrower in an aggregate principal amount of up to $50.0 million. As of December 31, 2009, we have funded approximately $45.7 million of the aggregate principal balance leaving
approximately $4.3 million unfunded. Our loan to the Borrower is recorded in other investments on the consolidated statements of financial condition. (See Note 19 for additional discussion of the credit agreement with JCP V.)
(6) Jefferies Finance LLC
On October 7, 2004, we entered into an agreement with Babson Capital and MassMutual to form Jefferies Finance, LLC (“JFIN”), a joint venture entity created for the purpose of offering senior loans to middle market and growth companies. JFIN is a commercial finance company whose primary focus is the origination and syndication of senior secured debt in the form of term and revolving loans. JFIN can also originate
various other debt products such as second lien term, bridge and mezzanine loans as well as related equity co-investments. JFIN also purchases syndicated loans in the secondary market, including loans that are performing, stressed and distressed loan obligations.
In February 2006, we and MassMutual reached an agreement to double our equity commitments to JFIN. With an incremental $125 million from each partner, the new total committed equity capitalization of JFIN is $500 million. Loans are originated primarily through the investment banking efforts of Jefferies with Babson Capital providing primary credit analytics and portfolio management services. As of December 31,
2009, we have funded $107.5 million of our aggregate $250.0 million commitment leaving $142.5 million unfunded. Our investment in JFIN is accounted for under the equity method of accounting and is included in Other investments in the Consolidated Statements of Financial Condition. Equity method gains and losses on JFIN are included in Principal transactions in the Consolidated Statements of Earnings.
The following is a summary of selected financial information for JFIN as of and for each of the years in the two-year period ended December 31, 2009 (in millions):
| 2009 | 2008 | |||||||
|
Balance Sheet
|
||||||||
|
Total assets
|
$ | 944.1 | $ | 1,075.4 | ||||
|
Total liabilities
|
691.2 | 890.5 | ||||||
|
Total equity
|
252.9 | 184.9 | ||||||
|
Our total equity balance
|
126.4 | 92.4 | ||||||
|
Net earnings (loss)
|
$ | 67.5 | $ | (43.9 | ) | |||
(7) Acquisitions
Depfa
On March 27, 2009, we acquired 100% of the membership interests of Depfa First Albany Securities LLC (“Depfa”), a leading New York City-based municipal securities broker-dealer that provides integrated investment banking, advisory, and sales and trading services. As of March 31, 2009, Depfa has been merged into Jefferies.
The Depfa acquisition is being accounted for under the acquisition method of accounting. Accordingly, the purchase price is allocated to the acquired assets and liabilities based on their estimated fair values at acquisition date as summarized in the following table. Goodwill of $568,000 is measured as the excess of the cash consideration over fair value of net assets acquired, including identified intangible assets, and
represents the value
37
JEFFERIES GROUP, INC.
AND SUBSIDIARIES
AND SUBSIDIARIES
Notes to Consolidated Financial Statements — (Continued)
December 31, 2009 and 2008
December 31, 2009 and 2008
expected from the synergies and economies of scale created from combining Depfa’s municipal securities business with our full-service sales and trading, and investment banking capabilities. All goodwill is assigned to our capital markets segment and is expected to be deductible for income tax purposes.
The following table presents the consideration paid for Depfa and the amounts of the assets acquired and liabilities assumed at the acquisition date (in thousands):
|
Cash consideration
|
$ | 38,760 | ||
|
|
||||
|
|
||||
|
Recognized assets and assumed liabilities:
|
||||
|
Cash
|
$ | 300 | ||
|
Financial instruments owned
|
31,458 | |||
|
Receivable from broker
|
16,691 | |||
|
Premises and equipment
|
155 | |||
|
Intangible assets
|
1,151 | |||
|
Other assets
|
2,781 | |||
|
Financial instruments sold, not yet purchased
|
(1,084 | ) | ||
|
Other liabilities
|
(13,260 | ) | ||
|
|
||||
|
Total identifiable net assets
|
$ | 38,192 | ||
|
|
||||
Goodwill
The following is a summary of goodwill activity for the years ended December 31, 2009 and 2008 (in thousands):
| Year Ended December 31, | ||||||||
| 2009 | 2008 | |||||||
|
Balance, at beginning of period
|
$ | 358,837 | $ | 344,063 | ||||
|
Add: Contingent Consideration
|
10,038 | 16,498 | ||||||
|
Add: Acquisition
|
568 | — | ||||||
|
Less: Acquisition adjustment
|
— | (1,724 | ) | |||||
|
Less: Translation adjustments
|
(4,648 | ) | — | |||||
|
|
||||||||
|
Balance, at end of period
|
$ | 364,795 | $ | 358,837 | ||||
|
|
||||||||
Acquisitions of LongAcre Partners Limited, Helix Associates, and Randall & Dewey executed in prior years each contain a five-year contingency for additional consideration to the selling owners, based on future revenues. This additional consideration is paid in cash annually. There is no contractual dollar limit to the potential of additional consideration. The last contingency period of these acquisitions expires in 2012.
During the year ended December 31, 2009, we paid approximately $28.7 million in cash related to contingent consideration that had been earned during the current year or prior periods.
Mortgage Servicing Rights
In December 2009, we acquired servicing rights to certain military housing mortgage loans, which are accounted for as an intangible asset and included within Other assets in the Consolidated Statements of Financial Condition. The mortgage servicing rights are amortized over the period of the estimated net servicing income, which is reported in Other income in the Consolidated Statements of Earnings. We provide no credit
support in connection with the
38
JEFFERIES GROUP, INC.
AND SUBSIDIARIES
AND SUBSIDIARIES
Notes to Consolidated Financial Statements — (Continued)
December 31, 2009 and 2008
December 31, 2009 and 2008
servicing of these loans and are not required to make servicing advances on the loans in the underlying portfolio. The following presents information about these servicing rights at December 31, 2009 (in millions):
| Carrying | ||||
| Amount | Fair Value | |||
|
$8.5
|
$ | 8.5 | ||
We have determined that the servicing rights acquired in December 2009 represent one class of servicing rights based on the availability of market inputs to measure the fair value of the asset and our treatment of the asset as one aggregate pool for risk management purposes. The fair value of servicing rights is estimated at December 31, 2009 based on the recent transaction price.
(8) Short-Term Borrowings
Bank loans represent short-term borrowings that are payable on demand and generally bear interest at a spread over the federal funds rate. Unsecured bank loans are typically overnight loans used to finance securities owned or clearing related balances. We had no outstanding unsecured or secured bank loans as of December 31, 2009 and 2008. Average daily bank loans for the years ended December 31, 2009 and 2008 were
$24.2 million and $94.9 million, respectively.
The following summarizes our long-term debt carrying values (including unamortized discounts and premiums) at December 31, 2009 and 2008 (in thousands):
| December 31, | ||||||||
| 2009 | 2008 | |||||||
|
7.75% Senior Notes, due 2012
|
$ | 306,811 | $ | 328,215 | ||||
|
5.875% Senior Notes, due 2014
|
248,831 | 248,608 | ||||||
|
5.5% Senior Notes, due 2016
|
348,865 | 348,683 | ||||||
|
8.5% Senior Notes, due 2019
|
709,193 | — | ||||||
|
6.45% Senior Debentures, due 2027
|
346,439 | 346,333 | ||||||
|
3.875% Convertible Senior Debentures, due, 2029
|
276,433 | — | ||||||
|
6.25% Senior Debentures, due 2036
|
492,545 | 492,435 | ||||||
|
|
||||||||
|
|
$ | 2,729,117 | $ | 1,764,274 | ||||
|
|
||||||||
In June and September 2009, we issued 8.5% Senior Notes, due in 2019, with a par amount of $400 million and $300 million, respectively, and received proceeds of $393.9 million and $321.0 million, respectively. During the year ended December 31, 2009, we repurchased approximately $20.3 million of our outstanding long-term debt, resulting in a gain on debt extinguishment of $7.7 million, which is recognized
in Other income on the Consolidated Statements of Earnings.
On October 26, 2009, we issued 3.875% convertible senior debentures (the “debentures”), maturing in 2029, with an aggregate principal amount of $345.0 million, each $1,000 debenture convertible into 25.5076 shares of our common stock (equivalent to a conversion price of approximately $39.20 per share of common stock). We received net proceeds of $339.6 million in connection with the offering. Approximately
$275.0 million of the net proceeds was allocated to Long-term debt, approximately $5.0 million was allocated to Other assets as debt issuance costs and approximately $42.0 million was allocated to Additional paid-in capital, net of deferred taxes of $27.0 million, on the Consolidated Statements of Financial Condition. In addition to ordinary interest, beginning on November 1, 2017, contingent interest will accrue at 0.375% if the average trading price of a debenture for 5 trading days
ending
39
JEFFERIES GROUP, INC.
AND SUBSIDIARIES
AND SUBSIDIARIES
Notes to Consolidated Financial Statements — (Continued)
December 31, 2009 and 2008
December 31, 2009 and 2008
on and including the third trading day immediately preceding a six-month interest period equals or exceed $1,200 per $1,000 debenture. The debentures are convertible at the holders’ option any time beginning on August 1, 2029 and convertible at any time if 1) our common stock price is greater than 130% of the conversion price for at least 20 trading days in a period of 30 consecutive trading days; 2) if the trading price per debenture is less
than 95% of the price of our common stock times the conversion ratio for any 10 consecutive trading days; 3) if the debentures are called for redemption; or 4) upon the occurrence of specific corporate actions. We may redeem the debentures for par, plus accrued interest, on or after November 1, 2012 if the price of our common stock is greater than 130% of the conversion price for at least 20 days in a period of 30 consecutive trading days and we may redeem the debentures for par, plus accrued interest,
at our election any time on or after November 1, 2017. Holders may require us to repurchase the debentures for par, plus accrued interest, on November 1, 2017, 2019 and 2024.
We previously entered into a fair value hedge with no ineffectiveness using interest rate swaps in order to convert $200 million aggregate principal amount of unsecured 7.75% senior notes due March 15, 2012 into floating rates based upon LIBOR. During 2007, we terminated these interest rate swaps and received cash consideration less accrued interest of $8.5 million. The $8.5 million basis difference related
to the fair value of the interest rate swaps at the time of the termination is being amortized as a reduction in Interest expense of approximately $1.9 million per year over the remaining life of the notes through March 2012.
(10) Mandatorily Redeemable Convertible Preferred Stock
In February 2006, MassMutual purchased in a private placement $125.0 million of our Series A convertible preferred stock. Our Series A convertible preferred stock has a 3.25% annual, cumulative cash dividend and is currently convertible into 4,105,138 shares of our common stock at an effective conversion price of approximately $30.45 per share. The preferred stock is callable beginning in 2016 and will
mature in 2036. As of December 31, 2008, 10,000,000 shares of preferred stock were authorized and 125,000 shares of preferred stock were issued and outstanding. The dividend is recorded as a component of Interest expense as the Series A convertible preferred stock is treated as debt for accounting purposes. The dividend is not deductible for tax purposes because the Series A convertible preferred stock is considered “equity” for tax purposes.
(11) Noncontrolling Interest and Mandatorily Redeemable Preferred Interests of Consolidated Subsidiaries
Noncontrolling Interest
Noncontrolling interest represents equity interests in consolidated subsidiaries that are not attributable, either directly or indirectly, to us (i.e., minority interests). Noncontrolling interest includes the minority equity holders’ proportionate share of the equity of JSOP, JESOP and our consolidated asset management entities. The following table presents our noncontrolling interests at December 31, 2009 and
2008 (in millions):
| December 31, | ||||||||
| 2009 | 2008 | |||||||
|
JSOP
|
$ | 282.7 | $ | 252.3 | ||||
|
JESOP
|
33.2 | 29.4 | ||||||
|
Consolidated asset management entities
|
5.6 | 6.1 | ||||||
|
|
||||||||
|
Noncontrolling interests
|
$ | 321.5 | $ | 287.8 | ||||
|
|
||||||||
Prior to January 1, 2009, we reported minority interests within liabilities on our Consolidated Statements of Financial Condition. As of January 1, 2009, we identify and present ownership interests in subsidiaries held by parties other than our common shareholders as noncontrolling interests within stockholders’ equity, separately from our own equity. This change in presentation resulted in an increase to
total stockholders’ equity of $287.8 million and a decrease to total liabilities of $287.8 million on our Consolidated Statement of Financial Condition as of December 31, 2008. Previously reported balances have been reclassified.
40
JEFFERIES GROUP, INC.
AND SUBSIDIARIES
AND SUBSIDIARIES
Notes to Consolidated Financial Statements — (Continued)
December 31, 2009 and 2008
December 31, 2009 and 2008
Revenues, expenses, net income or loss, and other comprehensive income or loss are reported in the consolidated financial statements at the consolidated amounts, which includes amounts attributable to both owners of the parent and noncontrolling interests. Net income or loss and other comprehensive income or loss is then attributed to the parent and noncontrolling interest. Prior to January 1, 2009, we recorded minority
interest in earnings (loss) of consolidated subsidiaries in the determination of net earnings (loss). As of January 1, 2009, Net earnings (loss) to noncontrolling interests is deducted from Net earnings (loss) to determine Net earnings (loss) to common shareholders. This change in presentation resulted in a decrease to Net loss of approximately $53.9 million for the year ended December 31, 2008. There has been no impact on Other comprehensive income or loss because all other
comprehensive income or loss is attributable to us.
Mandatorily Redeemable Interests of Consolidated Subsidiaries
Certain interests in consolidated subsidiaries meet the definition of a mandatorily redeemable financial instrument and require liability classification and remeasurement at the estimated amount of cash that would be due and payable to settle such interests under the applicable entity’s organization agreement. These mandatorily redeemable financial instruments represent interests held in Jefferies High Yield Holdings,
LLC (“JHYH”), which are entitled to a pro rata share of the profits and losses of JHYH and are scheduled to terminate in 2013, with an option to extend up to three additional one-year periods. We previously reported these mandatorily redeemable financial instruments within minority interest. Financial instruments issued by a subsidiary that are classified as equity in the subsidiary’s financial statements are treated as noncontrolling interests in the consolidated financial statements. Therefore,
these mandatorily redeemable financial instruments are reported within liabilities as Mandatorily redeemable preferred interests of consolidated subsidiaries on our Consolidated Statements of Financial Condition. In addition, changes to these mandatorily redeemable financial instruments of JHYH were previously reflected as minority interest in earnings (loss) of consolidated subsidiaries. As of January 1, 2009, we reclassified these changes to be part of net revenues and are reflected as Interest on
mandatorily redeemable preferred interest of consolidated subsidiaries on our Consolidated Statements of Earnings. The reclassification did not impact Net earnings (loss), but resulted in an increase to Net revenues of $69.1 million for the year ended December 31, 2008. The carrying amount of the mandatorily redeemable interests of consolidated subsidiaries was approximately $318.0 million and $280.9 million at December 31, 2009 and 2008, respectively.
(12) Benefit Plans
Pension Plan
We have a defined benefit pension plan, Jefferies Employees’ Pension Plan, which covers certain of our employees. The plan is subject to the provisions of the Employee Retirement Income Security Act of 1974. Benefits are based on years of service and the employee’s career average pay. Our funding policy is to contribute to the plan at least the minimum amount required for funding purposes under the Internal Revenue
Code. Differences in each year, if any, between expected and actual returns in excess of a 10% corridor are amortized in net periodic pension calculations. Effective December 31, 2005, benefits under the pension plan have been frozen. Accordingly, there are no further benefit accruals for future service after December 31, 2005.
The following tables set forth the plan’s funded status and amounts recognized in our accompanying Consolidated Statements of Financial Condition and Consolidated Statements of Earnings (in thousands):
41
JEFFERIES GROUP, INC.
AND SUBSIDIARIES
AND SUBSIDIARIES
Notes to Consolidated Financial Statements — (Continued)
December 31, 2009 and 2008
December 31, 2009 and 2008
| December 31, | ||||||||
| 2009 | 2008 | |||||||
|
Accumulated benefit obligation
|
$ | 43,750 | $ | 41,492 | ||||
|
|
||||||||
|
Projected benefit obligation for service rendered to date
|
43,750 | 41,492 | ||||||
|
Plan assets, at fair value
|
35,892 | 33,731 | ||||||
|
|
||||||||
|
|
||||||||
|
Funded status
|
(7,858 | ) | (7,761 | ) | ||||
|
Unrecognized net loss
|
12,005 | 14,017 | ||||||
|
|
||||||||
|
Prepaid benefit cost
|
4,147 | 6,256 | ||||||
|
Accumulated other comprehensive loss, before taxes
|
(12,005 | ) | (14,017 | ) | ||||
|
|
||||||||
|
Pension liability
|
$ | (7,858 | ) | $ | (7,761 | ) | ||
|
|
||||||||
| Year ended December 31, | ||||||||
| 2009 | 2008 | |||||||
|
Net pension cost included the following components:
|
||||||||
|
Service cost — benefits earned during the period
|
$ | 200 | $ | 200 | ||||
|
Interest cost on projected benefit obligation
|
2,586 | 2,531 | ||||||
|
Expected return on plan assets
|
(2,417 | ) | (3,113 | ) | ||||
|
Net amortization
|
906 | — | ||||||
|
Settlement losses (1)
|
835 | — | ||||||
|
|
||||||||
|
Net periodic pension cost (income)
|
$ | 2,110 | $ | (382 | ) | |||
|
|
||||||||
| (1) | Of the $2.1 million in pension cost, $0.8 million is due to previously unrecognized losses associated with the projected pension obligation as the cost of all settlements in 2009 for terminated employees exceeded current year interest and service costs. |
| Year ended December 31 | ||||||||
| 2009 | 2008 | |||||||
|
Projected benefit obligation, beginning of year
|
$ | 41,492 | $ | 40,828 | ||||
|
Service cost
|
200 | 200 | ||||||
|
Interest cost
|
2,586 | 2,531 | ||||||
|
Actuarial losses
|
3,132 | (366 | ) | |||||
|
Administrative expenses paid
|
(180 | ) | (209 | ) | ||||
|
Benefits paid
|
(438 | ) | (1,492 | ) | ||||
|
Settlements
|
(3,042 | ) | — | |||||
|
|
||||||||
|
Projected benefit obligation, end of year
|
$ | 43,750 | $ | 41,492 | ||||
|
|
||||||||
| Year ended December 31, | ||||||||
| 2009 | 2008 | |||||||
|
Fair value of assets, beginning of year
|
$ | 33,731 | $ | 41,634 | ||||
|
Employer contributions
|
— | 2,000 | ||||||
|
Benefit payments made
|
(438 | ) | (1,492 | ) | ||||
|
Administrative expenses paid
|
(180 | ) | (209 | ) | ||||
|
Total investment return
|
5,821 | (8,202 | ) | |||||
|
Settlements
|
(3,042 | ) | — | |||||
|
|
||||||||
|
Fair value of assets, end of year
|
$ | 35,892 | $ | 33,731 | ||||
|
|
||||||||
42
JEFFERIES GROUP, INC.
AND SUBSIDIARIES
AND SUBSIDIARIES
Notes to Consolidated Financial Statements — (Continued)
December 31, 2009 and 2008
December 31, 2009 and 2008
We did not contribute to our pension plan during the year ended December 31, 2009. The amounts in accumulated other comprehensive income that have not yet been recognized as components of net periodic benefit cost include $12.0 million and $14.0 million as of December 31, 2009 and 2008, respectively. During 2010, we expect to recognize an amortization of net loss of $0.7 million as a component of net periodic
benefit cost.
Expected benefit payments through December 31, 2019 are as follows (in thousands):
|
2010
|
$ | 1,783.4 | ||
|
2011
|
1,158.2 | |||
|
2012
|
2,723.6 | |||
|
2013
|
1,700.1 | |||
|
2014
|
1,904.1 | |||
|
2015 through 2019
|
13,664.4 |
The following is a summary of the fair value of plan assets as of December 31, 2009 by level within the fair value hierarchy (in thousands):
| As of December 31, 2009 | ||||||||||||
| Level 1 | Level 2 | Total | ||||||||||
|
Plan assets
(1)
:
|
||||||||||||
|
Cash and cash equivalents
|
$ | 1,169 | $ | — | $ | 1,169 | ||||||
|
Listed equity securities (2)
|
17,999 | — | 17,999 | |||||||||
|
Fixed income securities:
|
||||||||||||
|
Corporate debt securities
|
— | 7,874 | 7,874 | |||||||||
|
Foreign corporate debt securities
|
— | 497 | 497 | |||||||||
|
U.S. government securities
|
— | 3,750 | 3,750 | |||||||||
|
Commercial mortgage-backed securities
|
— | 1,207 | 1,207 | |||||||||
|
Agency mortgage-backed securities
|
— | 2,511 | 2,511 | |||||||||
|
Asset-backed securities
|
— | 391 | 391 | |||||||||
|
Other
|
— | 494 | 494 | |||||||||
|
|
||||||||||||
|
|
$ | 19,168 | $ | 16,724 | $ | 35,892 | ||||||
|
|
||||||||||||
| (1) | There are no plan assets classified within Level 3 of the fair value hierarchy. | |
| (2) | Listed equity securities are diversified across a spectrum of primarily U.S. large-cap companies. |
Assets in the plan are invested under guidelines adopted by the Administrative Committee of the Plan. Because the Plan exists to provide a vehicle for funding future benefit obligations, the investment objectives of the portfolio takes into account the nature and timing of future plan liabilities. The policy recognizes that the portfolio’s long-term investment performance and its ability to meet the plan’s overall
objectives are dependent on the strategic asset allocation which includes adequate diversification among assets classes.
The target allocation of plan assets for 2010 is approximately 60% equities and 40% fixed income securities. The target asset allocation was determined based on the risk tolerance characteristics of the plan and, at times, may be adjusted to achieve the plan’s investment objective and to minimize any concentration of investment risk. The Administrative Committee evaluates the asset allocation strategy and adjusts the
allocation if warranted based upon market conditions and the impact of the investment strategy on future contribution requirements. The expected long-term rate of return assumption is based on an analysis of historical experience of the portfolio and the summation of prospective returns for each asset class in proportion to the fund’s current asset allocation.
43
JEFFERIES GROUP, INC.
AND SUBSIDIARIES
AND SUBSIDIARIES
Notes to Consolidated Financial Statements — (Continued)
December 31, 2009 and 2008
December 31, 2009 and 2008
On a weighted average basis, the following are assumptions used to determine the actuarial present value of the projected benefit obligation:
| 2009 | 2008 | |||||||
|
Discount rates
|
5.75 | % | 6.50 | % | ||||
|
Rate of compensation increase
|
— | % | — | % | ||||
|
Expected long-term rate of return on plan assets
|
7.5 | % | 7.5 | % | ||||
The equity portfolio may invest up to 5% of the market value of the portfolio in any one company and may invest up to 10% of the market value of the portfolio in any one sector or up to two times the percentage weighting of any one sector as defined by the S&P 500 or the Russell 1000 Value indices, whichever is higher. Permissible investments specified under the equity portfolio of the plan include equity securities of
U.S. and non-U.S. incorporated entities and private placement securities issued pursuant to Rule 144A. At least 75% of the market value of the fixed income portfolio must be invested in investment grade securities rated BBB-/Baa3, including cash and cash equivalents. Permissible investments specified under the fixed income portfolio of the plan include: public or private debt obligations issued or guaranteed by U.S. or foreign issuers; preferred, hybrid, mortgage or asset-backed securities; senior loans;
and derivatives and foreign currency exchange contracts.
(13) Compensation Plans
We sponsor the following share-based compensation plans: incentive compensation plan, director plan, employee stock purchase plan and the deferred compensation plan. The fair value of share based awards is estimated on the date of grant based on the market price of our common stock less the impact of selling restrictions subsequent to vesting, if any, and is amortized as compensation expense over the related requisite service
periods.
Total compensation cost related to share-based compensation plans amounted to $125.7 million and $562.6 million for the years ended December 31, 2009 and 2008, respectively. The net tax (deficiency) benefit related to share-based compensation plans recognized in additional paid-in capital during 2009 and 2008 was ($14.6) million and $6.2 million, respectively. Cash flows resulting from tax deductions
in excess of the grant-date fair value of share-based awards are included in cash flows from financing activities; accordingly, we reflected the excess tax benefit of $12.4 million and $11.9 million related to share-based compensation in cash flows from financing activities for the years ended December 31, 2009 and 2008, respectively. As of December 31, 2009, we had $53.7 million of total unrecognized compensation cost related to nonvested share based awards, which is expected to be recognized
over a remaining weighted-average vesting period of approximately 5.2 years. We have historically and generally expect to issue new shares of common stock when satisfying our issuance obligations pursuant to share based awards, as opposed to reissuing shares from our treasury stock.
In addition, we sponsor non-share based compensation plans. Non-share based compensation plans sponsored by us include an employee stock ownership plan and a profit sharing plan.
The following are descriptions of the compensation plans sponsored by us and the activity of such plans for the years ended December 31, 2009 and 2008:
Incentive Compensation Plan.
We have an Incentive Compensation Plan (“Incentive Plan”) which allows awards in the form of incentive stock options (within the meaning of Section 422 of the Internal Revenue Code), nonqualified stock options, stock appreciation rights, restricted stock, unrestricted
stock, performance awards, restricted stock units, dividend equivalents or other share-based awards. The plan imposes a limit on the number of shares of our common stock that may be subject to awards. An award relating to shares may be granted if the aggregate number of shares subject to then-outstanding awards (as defined in the Incentive Plan) plus the number of shares subject to the award being granted do not exceed 30% of the number of shares issued and outstanding immediately prior to the grant.
44
JEFFERIES GROUP, INC.
AND SUBSIDIARIES
AND SUBSIDIARIES
Notes to Consolidated Financial Statements — (Continued)
December 31, 2009 and 2008
December 31, 2009 and 2008
Restricted Stock and Restricted Stock Units
The Incentive Plan allows for grants of restricted stock awards, whereby employees are granted restricted shares of common stock subject to forfeiture. The Incentive Plan also allows for grants of restricted stock units. Restricted stock units give a participant the right to receive fully vested shares at the end of a specified deferral period. One advantage of restricted stock units, as compared to restricted stock, is that
the period during which the award is deferred as to settlement can be extended past the date the award becomes non-forfeitable, allowing a participant to hold an interest tied to common stock on a tax deferred basis. Prior to settlement, restricted stock units carry no voting or dividend rights associated with the stock ownership, but dividend equivalents are accrued to the extent there are dividends declared on our common stock.
On December 2, 2008, we approved an overall compensation strategy that modified the terms of all outstanding restricted stock and restricted stock units of active employees and addressed the terms of future restricted stock and restricted stock units granted as part of year-end compensation. We modified these awards by removing the service requirement employees must fulfill in exchange for the right to those awards.
As such, employees who terminate their employment or are terminated without cause may continue to vest, so long as the awards are not forfeited as a result of the other forfeiture provisions of those awards (e.g. competition). Prior to the modifications, these awards were generally subject to annual ratable vesting upon a five year service requirement, with provisions related to retirement eligibility. As a result of the removal of the service requirements, we accelerated the remaining compensation cost of the
outstanding awards of $302.6 million which was recognized on the modification date and recognized compensation expense of $74.0 million associated with 2008 year-end compensation awards on the date of grant (December 30, 2008).
Upon approval of the overall compensation strategy, we determined that the service inception date precedes the grant date for future restricted stock and restricted stock units granted as part of year-end compensation, and, as such, the compensation expense associated with these awards is accrued over the one-year period prior to the grant date. For the year ended December 31, 2009, we recognized compensation expense
of $126.5 million related to restricted stock and restricted stock units of approximately 5,384,000 and 215,000, respectively, granted as part of our 2009 year-end compensation.
In addition to year-end compensation awards, we may grant restricted stock and restricted stock units to new employees as “sign-on” awards. Sign-on awards are generally subject to annual ratable vesting upon a four year service requirement and are amortized as compensation expense on a straight-line basis over the related four years.
The total compensation cost associated with restricted stock and restricted stock units amounted to $125.1 million and $561.7 million for the years ended December 31, 2009 and 2008, respectively. Total compensation cost includes 2009 year-end compensation and the amortization of sign-on awards, less forfeitures and clawbacks.
The following table details the activity of restricted stock:
| Weighted | ||||||||
| Period Ended | Average Grant | |||||||
| December 31, 2009 | Date Fair Value | |||||||
| (Shares in 000s) | ||||||||
|
Restricted stock
|
||||||||
|
Balance, beginning of year
|
— | $ | — | |||||
|
Grants
|
8,136 | (1) | $ | 21.41 | ||||
|
Fulfillment of service requirement
|
(5,920 | )(1) | $ | 21.94 | ||||
|
|
||||||||
|
Balance, end of year
|
2,216 | (2) | $ | 20.01 | ||||
|
|
||||||||
| (1) | Includes approximately 5.9 million shares of restricted stock granted with no future service requirement during the year ended December 31, 2009. As such, these shares are shown as granted and vested in the year ended December 31, 2009. |
45
JEFFERIES GROUP, INC.
AND SUBSIDIARIES
AND SUBSIDIARIES
Notes to Consolidated Financial Statements — (Continued)
December 31, 2009 and 2008
December 31, 2009 and 2008
| (2) | Represents restricted stock with a future service requirement. |
The following table details the activity of restricted stock units:
| Weighted | ||||||||||||||||
| Period Ended | Average Grant | |||||||||||||||
| December 31, 2009 | Date Fair Value | |||||||||||||||
| (Shares in 000s) | ||||||||||||||||
| Future | No Future | Future | No Future | |||||||||||||
| Service | Service | Service | Service | |||||||||||||
| Required | Required | Required | Required | |||||||||||||
|
Restricted stock units
|
||||||||||||||||
|
Balance, beginning of year
|
— | 34,262 | $ | — | $ | 14.78 | ||||||||||
|
Grants
|
936 | 351 | $ | 17.07 | $ | 20.34 | ||||||||||
|
Distribution of underlying shares
|
— | (7,725 | ) | $ | — | $ | 14.51 | |||||||||
|
Forfeited
|
— | (420 | ) | $ | — | $ | 20.39 | |||||||||
|
|
||||||||||||||||
|
Balance, end of year
|
936 | 26,468 | $ | 17.07 | $ | 14.84 | ||||||||||
|
|
||||||||||||||||
The aggregate fair value of restricted stock and restricted stock units upon the awards vesting during 2009 and 2008 was $129.9 million and $563.1 million, respectively. In addition, we granted restricted stock units with no future service period during 2009 with an aggregate fair value of $7.1 million.
Stock Options
The fair value of all option grants are estimated on the date of grant using the Black-Scholes option-pricing model with the following weighted-average assumptions used for all fixed option grants in 2004: dividend yield of 0.9%; expected volatility of 32.6%; risk-free interest rates of 3.0%; and expected lives of 4.8 years. There are no option grants subsequent to 2004. A summary of our stock option activity for the
year ended December 31, 2009 is presented below (amounts in thousands, except per share data):
| Year Ended December 31, 2009 | ||||||||
| Weighted Average | ||||||||
| Options | Exercise Price | |||||||
|
Outstanding at beginning of year
|
60 | $ | 7.24 | |||||
|
Exercised
|
(12 | ) | $ | 5.64 | ||||
|
|
||||||||
|
Outstanding at end of year
|
48 | $ | 7.65 | |||||
|
|
||||||||
|
Options exercisable at year-end
|
48 | $ | 7.65 | |||||
The total intrinsic value of stock options exercised during 2009 and 2008 was $94,000 and $775,000, respectively. Cash received from the exercise of stock options during 2009 and 2008 totaled $69,000 and $840,000, respectively, and the tax benefit realized from stock options exercised during 2009 and 2008 was $38,000 and $305,000, respectively.
46
JEFFERIES GROUP, INC.
AND SUBSIDIARIES
AND SUBSIDIARIES
Notes to Consolidated Financial Statements — (Continued)
December 31, 2009 and 2008
December 31, 2009 and 2008
The table below provides additional information related to stock options outstanding at December 31, 2009:
Dollars and shares in thousands, except per share data
| Outstanding, | ||||||||
| Net of Expected | Options | |||||||
| December 31, 2009 | Forfeitures | Exercisable | ||||||
|
Number of options
|
48 | 48 | ||||||
|
Weighted-average exercise price
|
7.65 | 7.65 | ||||||
|
Aggregate intrinsic value
|
756 | 756 | ||||||
|
Weighted-average remaining contractual term, in years
|
4.35 | 4.35 | ||||||
At December 31, 2009, the intrinsic value of vested options was approximately $756,000 for which tax benefits expected to be recognized in equity upon exercise are approximately $310,000.
Directors’ Plan.
We have a Directors’ Stock Compensation Plan (“Directors’ Plan”) which provides for an annual grant to each non-employee director of $100,000 of restricted stock or deferred shares (which are similar to restricted stock units). These grants are made automatically on
the date directors are elected or reelected at our annual shareholders’ meeting. These grants vest three years after the date of grant and are expensed over the requisite service period.
Additionally, the Directors’ Plan permits each non-employee director to elect to be paid annual retainer fees, meeting fees and fees for service as chairman of a Board committee in the form of cash, deferred cash or deferred shares. If deferred cash is elected, interest is credited to such deferred cash at the prime interest rate in effect at the date of each annual meeting of stockholders. If deferred shares are elected,
dividend equivalents equal to dividends declared and paid on our common stock are credited to a Director’s account and reinvested as additional deferred shares.
Employee Stock Purchase Plan.
We also have an Employee Stock Purchase Plan (“ESPP”) which we consider non-compensatory effective January 1, 2007. All regular full-time employees and employees who work part-time over 20 hours per week are eligible for the ESPP. Annual employee contributions are
limited to $21,250, are voluntary and are made via payroll deduction. The employee contributions are used to purchase our common stock. The stock price used is 95% of the closing price of our common stock on the last day of the applicable session (monthly).
Deferred Compensation Plan.
We also have a Deferred Compensation Plan, which was established in 2001. In 2009 and 2008, employees with annual compensation of $200,000 or more were eligible to defer compensation on a pre-tax basis by investing it in our common stock at a discount (“DCP shares”) and/or
stock options (prior to 2004) or by specifying the return in other alternative investments. We often invest directly, as a principal, in such investment alternatives related to our obligations to perform under the Deferred Compensation Plan. The compensation deferred by our employees is expensed in the period earned. As of the third quarter of 2008, the change in fair value of the specified other alternative investments are recognized in Investment income and changes in the corresponding deferral compensation
liability are reflected as Compensation and benefits expense in our Consolidated Statements of Earnings. Prior financial statement periods have not been adjusted for this change in presentation as the impact of such change does not have a material impact on the related line items within the Consolidated Statements of Earnings for each of the periods presented.
Additionally, we recognize compensation cost related to the discount provided to employees in electing to defer compensation in DCP shares. This compensation cost was $0.6 million and $0.9 million in 2009 and 2008, respectively. As of December 31, 2009, there were 3,449,000 DCP shares issuable under the Plan.
Employee Stock Ownership Plan.
We have an Employee Stock Ownership Plan (“ESOP”) which was established in 1988. We had no contributions and no compensation cost related to the ESOP during 2009 and 2008.
47
JEFFERIES GROUP, INC.
AND SUBSIDIARIES
AND SUBSIDIARIES
Notes to Consolidated Financial Statements — (Continued)
December 31, 2009 and 2008
December 31, 2009 and 2008
Profit Sharing Plan.
We have a profit sharing plan, covering substantially all employees, which includes a salary reduction feature designed to qualify under Section 401(k) of the Internal Revenue Code. The compensation cost related to this plan was $4.5 million and $9.1 million for the years ended December 31,
2009 and 2008, respectively.
(14) Earnings per Share
The following is a reconciliation of the numerators and denominators of the Basic and Diluted earnings per common share computations for the years 2009 and 2008 (in thousands, except per share amounts):
| Year ended December 31, | ||||||||
| 2009 | 2008 | |||||||
|
Earnings for basic earnings per common share:
|
||||||||
|
Net earnings (loss)
|
$ | 316,580 | $ | (590,012 | ) | |||
|
Net earnings (loss) to noncontrolling interests
|
36,537 | (53,884 | ) | |||||
|
|
||||||||
|
Net earnings (loss) to common shareholders
|
280,043 | (536,128 | ) | |||||
|
Less: Allocation of earnings to participating securities (1)
|
2,311 | 6,831 | ||||||
|
|
||||||||
|
Net earnings (loss) available to common shareholders
|
$ | 277,732 | $ | (542,959 | ) | |||
|
|
||||||||
|
Earnings for diluted earnings per common share:
|
||||||||
|
Net earnings (loss)
|
$ | 316,580 | $ | (590,012 | ) | |||
|
Net earnings (loss) to noncontrolling interests
|
36,537 | (53,884 | ) | |||||
|
|
||||||||
|
Net earnings (loss) to common shareholders
|
280,043 | (536,128 | ) | |||||
|
Add: Convertible preferred stock dividends
|
4,063 | ¾ | ||||||
|
Less: Allocation of earnings to participating securities (1)
|
2,299 | 6,831 | ||||||
|
|
||||||||
|
Net earnings (loss) available to common shareholders
|
$ | 281,807 | $ | (542,959 | ) | |||
|
|
||||||||
|
Shares:
|
||||||||
|
Average common shares used in basic computation
|
200,446 | 166,163 | ||||||
|
Stock options
|
21 | ¾ | ||||||
|
Mandatorily redeemable convertible preferred stock
|
4,105 | ¾ | ||||||
|
|
||||||||
|
Average common shares used in diluted computation
|
204,572 | 166,163 | ||||||
|
|
||||||||
|
Earnings (loss) per common share:
|
||||||||
|
Basic
|
$ | 1.39 | $ | (3.27 | ) | |||
|
Diluted
|
$ | 1.38 | $ | (3.27 | ) | |||
| (1) | Represents dividends declared during the period on participating securities plus an allocation of undistributed earnings to participating securities. Losses are not allocated to participating securities. Participating securities represent restricted stock and restricted stock units for which requisite service has not yet been rendered and amounted to weighted average shares of 1,668,000 and 27,310,000 for the years ended December 31, 2009 and 2008, respectively. No dividends were declared during 2009. Dividends declared on participating securities during 2008 amounted to approximately $6.8 million. Undistributed earnings are allocated to participating securities based upon their right to share in earnings if all earnings for the period had been distributed. |
The following securities were considered antidilutive and, therefore, not included in the computation of Diluted earnings per share:
| Number of securities outstanding at | ||||||||
| December 31, | ||||||||
| 2009 | 2008 | |||||||
|
Stock options
|
¾ | 59,720 | ||||||
|
Mandatorily redeemable convertible preferred stock
|
¾ | 4,105,138 | ||||||
48
JEFFERIES GROUP, INC.
AND SUBSIDIARIES
AND SUBSIDIARIES
Notes to Consolidated Financial Statements — (Continued)
December 31, 2009 and 2008
December 31, 2009 and 2008
The only restrictions on our present ability to pay dividends on our common stock are the dividend preference terms of our Series A convertible preferred stock and the governing provisions of the Delaware General Corporation Law.
Dividends per Common Share (declared and paid):
| 1 st Quarter | 2 nd Quarter | 3 rd Quarter | 4 th Quarter | |||||||||||||
|
2009
|
— | — | — | — | ||||||||||||
|
2008
|
$ | 0.125 | $ | 0.125 | — | — | ||||||||||
On January 19, 2010, a quarterly dividend was declared of $0.075 per share of common stock payable on March 15, 2010 to stockholders of record as of February 16, 2010.
During the year ended December 31, 2008, we recognized dividend equivalents of $34.4 million distributed on restricted stock units that were granted in prior periods, but which had not previously been charged against retained earnings.
(15) Income Taxes
Total income taxes for the years ended December 31, 2009 and 2008 were allocated as follows (in thousands):
| Year ended December 31, | ||||||||
| 2009 | 2008 | |||||||
|
Earnings/(loss)
|
$ | 199,041 | $ | (290,249 | ) | |||
|
Stockholders’ equity, for compensation expense for tax purposes less than/(in excess of) amounts recognized for financial reporting purposes
|
14,606 | (6,233 | ) | |||||
|
|
||||||||
|
|
$ | 213,647 | $ | (296,482 | ) | |||
|
|
||||||||
Income tax expense (benefit) for the years ended December 31, 2009 and 2008 consists of the following (in thousands):
| Year ended December 31, | ||||||||
| 2009 | 2008 | |||||||
|
Current:
|
||||||||
|
Federal
|
$ | 130,729 | $ | (110,458 | ) | |||
|
State and local
|
34,835 | 5,949 | ||||||
|
Foreign
|
23,084 | (5,034 | ) | |||||
|
|
||||||||
|
|
188,648 | (109,543 | ) | |||||
|
|
||||||||
|
|
||||||||
|
Deferred:
|
||||||||
|
Federal
|
17,032 | (101,482 | ) | |||||
|
State and local
|
8,018 | (38,575 | ) | |||||
|
Foreign
|
(14,657 | ) | (40,649 | ) | ||||
|
|
||||||||
|
|
10,393 | (180,706 | ) | |||||
|
|
||||||||
|
|
$ | 199,041 | $ | (290,249 | ) | |||
|
|
||||||||
49
JEFFERIES GROUP, INC.
AND SUBSIDIARIES
AND SUBSIDIARIES
Notes to Consolidated Financial Statements — (Continued)
December 31, 2009 and 2008
December 31, 2009 and 2008
Income taxes differed from the amounts computed by applying the Federal statutory income tax rate of 35% for 2009 and 2008 as a result of the following (in thousands):
| Year ended December 31, | ||||||||||||||||
| 2009 | 2008 | |||||||||||||||
| Amount | Percent | Amount | Percent | |||||||||||||
|
Computed expected income taxes
|
$ | 180,467 | 35.0 | % | $ | (308,091 | ) | 35.0 | % | |||||||
|
Increase (decrease) in income taxes resulting from:
|
||||||||||||||||
|
State and city income taxes, net of Federal income tax benefit
|
27,855 | 5.4 | (21,207 | ) | 2.4 | |||||||||||
|
Noncontrolling interest, not subject to tax
|
(12,788 | ) | (2.5 | ) | 18,859 | (2.1 | ) | |||||||||
|
Foreign income
|
326 | 0.1 | 16,948 | (1.9 | ) | |||||||||||
|
Other, net
|
3,181 | 0.6 | 3,243 | (0.4 | ) | |||||||||||
|
|
||||||||||||||||
|
Total income taxes
|
$ | 199,041 | 38.6 | % | $ | (290,248 | ) | 33.0 | % | |||||||
|
|
||||||||||||||||
The following table presents a reconciliation of gross unrecognized tax benefits for the years ended December 31, 2009 and 2008 (in thousands):
| Year ended December 31, | ||||||||
| 2009 | 2008 | |||||||
|
Balance at January 1,
|
$ | 13,485 | $ | 8,825 | ||||
|
Increases based on tax positions related to the current period
|
10,769 | 2,395 | ||||||
|
Decreases based on tax positions related to the current period
|
— | (145 | ) | |||||
|
Increases based on tax positions related to prior periods
|
1,136 | 3,372 | ||||||
|
Decreases based on tax positions related to prior periods
|
— | (265 | ) | |||||
|
Decreases related to settlements with taxing authorities
|
(969 | ) | (697 | ) | ||||
|
Decreases related to a lapse of applicable statute of limitations
|
(268 | ) | — | |||||
|
|
||||||||
|
Balance at December 31,
|
$ | 24,153 | $ | 13,485 | ||||
|
|
||||||||
The total amount of unrecognized benefits that, if recognized, would affect the effective tax rate was $15.7 million and $8.8 million for the years ended December 31, 2009 and 2008, respectively. Interest related to income tax liabilities is recognized in Interest expense. Penalties, if any, are recognized in other expenses. Net, pretax interest expense related to income tax liabilities was $0.7 million
in 2009. In addition to the liability for unrecognized tax benefits, we had interest accrued of approximately $4.4 million and $3.7 million for the years ended December 31, 2009 and 2008, respectively, included in Accrued expenses and other liabilities. No material penalties were accrued.
We are currently under examination by the Internal Revenue Service and other major tax jurisdictions. We do not expect that resolution of these examinations will have a material effect on our consolidated financial position, but could have a material impact on the consolidated results of operations for the period in which resolution occurs. It is reasonably possible that, within the next twelve months, various tax examinations
will be concluded and statutes of limitation will expire. These events will have the combined effect of reducing the December 31, 2009 balance of unrecognized tax benefits by $4.2 million, whether resolution results in payment or recognition. It is also reasonably possible that the balance of unrecognized tax benefits will increase significantly during the next twelve months for tax positions related to that period.
50
JEFFERIES GROUP, INC.
AND SUBSIDIARIES
AND SUBSIDIARIES
Notes to Consolidated Financial Statements — (Continued)
December 31, 2009 and 2008
December 31, 2009 and 2008
We are subject to U.S. Federal income tax as well as income tax in multiple state and foreign jurisdictions. The table below summarizes the earliest tax years that are subject to examination in the major tax jurisdictions in which we operate:
| Jurisdiction | Tax Year | |||
|
United States
|
2006 | |||
|
United Kingdom
|
2007 | |||
|
New Jersey
|
2005 | |||
|
New York State
|
2001 | |||
|
New York City
|
2003 | |||
The cumulative tax effects of temporary differences that give rise to significant portions of the deferred tax assets and liabilities at December 31, 2009 and 2008 are presented below (in thousands):
| December 31, | ||||||||
| 2009 | 2008 | |||||||
|
Deferred tax assets:
|
||||||||
|
Compensation
|
$ | 325,995 | $ | 350,742 | ||||
|
Net operating loss
|
29,861 | 44,117 | ||||||
|
Investments
|
34,975 | 10,729 | ||||||
|
Other
|
31,309 | 12,204 | ||||||
|
|
||||||||
|
Sub-total
|
422,140 | 417,792 | ||||||
|
Valuation allowance
|
(6,980 | ) | (3,390 | ) | ||||
|
|
||||||||
|
Total deferred tax assets
|
415,160 | 414,402 | ||||||
|
|
||||||||
|
|
||||||||
|
Deferred tax liabilities:
|
||||||||
|
Long-term debt
|
28,673 | 3,301 | ||||||
|
Amortization of intangibles
|
34,112 | 22,513 | ||||||
|
Other
|
8,713 | 7,622 | ||||||
|
|
||||||||
|
Total deferred tax liabilities
|
71,498 | 33,436 | ||||||
|
|
||||||||
|
|
||||||||
|
Net deferred tax asset, included in other assets
|
$ | 343,662 | $ | 380,966 | ||||
|
|
||||||||
A valuation allowance of $7.0 million and $3.4 million was recorded at December 31, 2009 and 2008, respectively, and represents the portion of our deferred tax assets for which it is more likely than not that the benefit of such items will not be realized. Such valuation allowance increased by approximately $3.6 million for the year ended December 31, 2009. We believe that the realization of the net
deferred tax asset of $343.7 million is more likely than not based on expectations of future taxable income in the jurisdictions in which we operate.
At December 31, 2009, we had United Kingdom loss carryforwards of approximately $77.0 million. The United Kingdom loss carryforwards have an unlimited carryforward period. A tax benefit has been recorded for the associated deferred tax assets with no valuation allowance. At December 31, 2009, we had loss carryforwards and other deductible temporary differences in other countries in which we operate of approximately
$17.7 million. The losses begin to expire in the year 2013 and the deferred tax assets related to these temporary differences have been fully offset by a valuation allowance.
There is a current tax payable of $94.8 million at December 31, 2009 and a current tax receivable of $130.5 million as of December 31, 2008.
To the extent the non-U.S. subsidiaries have future earnings, no U.S. Federal income tax will be provided for the undistributed earnings because we intend to permanently reinvest these earnings in such operations.
51
JEFFERIES GROUP, INC.
AND SUBSIDIARIES
AND SUBSIDIARIES
Notes to Consolidated Financial Statements — (Continued)
December 31, 2009 and 2008
December 31, 2009 and 2008
(16) Commitments, Contingencies and Guarantees
The following table summarizes other commitments and guarantees at December 31, 2009:
| Maturity Date | ||||||||||||||||||||||||
| Notional / | 2012 | 2014 | 2016 | |||||||||||||||||||||
| Maximum | and | and | and | |||||||||||||||||||||
| Payout | 2010 | 2011 | 2013 | 2015 | Later | |||||||||||||||||||
| (Dollars in Millions) | ||||||||||||||||||||||||
|
Bank credit
|
$ | 36.0 | $ | 18.0 | — | $ | 18.0 | — | — | |||||||||||||||
|
|
||||||||||||||||||||||||
|
Equity commitments
|
$ | 415.7 | $ | 250.0 | $ | 0.6 | $ | 2.3 | $ | 16.6 | $ | 146.2 | ||||||||||||
|
|
||||||||||||||||||||||||
|
Loan commitments
|
$ | 159.4 | $ | 159.3 | — | $ | 0.1 | — | — | |||||||||||||||
|
|
||||||||||||||||||||||||
|
Derivative contracts – non-credit related
|
$ | 35,668.9 | $ | 30,437.4 | $ | 5,223.4 | $ | 8.1 | — | — | ||||||||||||||
|
|
||||||||||||||||||||||||
|
Derivative contracts – credit related:
|
||||||||||||||||||||||||
|
Index credit default swaps
|
$ | 105.0 | — | — | — | $ | 75.0 | $ | 30.0 | |||||||||||||||
The following table summarizes the external credit ratings of the underlyings or referenced assets for credit related guarantees and derivatives:
| External Credit Rating | ||||||||||||||||
| Notional / | ||||||||||||||||
| Maximum | AAA/ | |||||||||||||||
| Payout | Aaa | AA/Aa | Unrated | |||||||||||||
| (Dollars in Millions) | ||||||||||||||||
|
Bank credit
|
$ | 36.0 | — | — | $ | 36.0 | ||||||||||
|
|
||||||||||||||||
|
Loan commitments
|
$ | 159.4 | — | — | $ | 159.4 | ||||||||||
|
|
||||||||||||||||
|
Derivative contracts — credit related:
|
||||||||||||||||
|
Index credit default swaps
|
$ | 105.0 | $ | 20.0 | $ | 10.0 | $ | 75.0 | ||||||||
Bank Credit.
As of December 31, 2009, we had outstanding guarantees of $36.0 million relating to bank credit obligations ($1.5 million of which is undrawn) of associated investment vehicles in which we have an interest.
Equity Commitments.
On October 7, 2004, we entered into an agreement with Babson Capital and MassMutual to form Jefferies Finance LLC, a joint venture entity created for the purpose of offering senior loans to middle market and growth companies. The total committed equity capitalization by the partners to
Jefferies Finance LLC is $500 million as of December 31, 2009. Loans are originated primarily through the investment banking efforts of Jefferies with Babson Capital providing primary credit analytics and portfolio management services. As of December 31, 2009, we have funded $107.5 million of our aggregate $250.0 million commitment leaving $142.5 million unfunded.
As of December 31, 2009, we have an aggregate commitment to invest equity of approximately $14.3 million in Jefferies Capital Partners IV L.P. and its related parallel fund, a private equity fund managed by a team led by Brian P. Friedman (one of our directors and Chairman, Executive Committee).
52
JEFFERIES GROUP, INC.
AND SUBSIDIARIES
AND SUBSIDIARIES
Notes to Consolidated Financial Statements — (Continued)
December 31, 2009 and 2008
December 31, 2009 and 2008
We have an aggregate commitment to fund JHYH of $600.0 million and have funded approximately $350.0 million as of December 31, 2009, leaving $250.0 million unfunded.
As of December 31, 2009, we had other equity commitments to invest up to $8.9 million in various other investments.
Loan Commitments.
From time to time we make commitments to extend credit to investment-banking and other clients in loan syndication, acquisition-finance and securities transactions. These commitments and any related drawdowns of these facilities typically have fixed maturity dates and are contingent on certain
representations, warranties and contractual conditions applicable to the borrower. As of December 31, 2009, we had $155.1 million of loan commitments outstanding to clients.
On August 11, 2008, we entered into a Credit Agreement with JCP Fund V Bridge Partners, LLC (“the Borrower or JCP V”), pursuant to which we may make loans to the Borrower in an aggregate principal amount of up to $50.0 million. As of December 31, 2009, we have funded approximately $45.7 million of the aggregate principal balance leaving approximately $4.3 million unfunded. (See Note 19
for additional discussion of the credit agreement with JCP V.)
Derivative Contracts.
We disclose certain derivative contracts meeting the definition of a guarantee under U.S. generally accepted accounting principles. Such derivative contracts include credit default swaps (whereby a default or significant change in the credit quality of the underlying financial instrument may
obligate us to make a payment) and written equity put options. At December 31, 2009, the maximum payout value of derivative contracts deemed to meet the definition of a guarantee was approximately $35,773.9 million. For purposes of determining maximum payout, notional values are used; however, we believe the fair value of these contracts is a more relevant measure of these obligations because we believe the notional amounts overstate our expected payout. At December 31, 2009, the fair value of
such derivative contracts approximated $(53.6) million. In addition, the derivative contracts deemed to meet the definition of a guarantee under U.S. generally accepted accounting principles are before consideration of hedging transactions. We substantially mitigate our risk on these contracts through hedges, such as other derivative contracts and/or cash instruments. We manage risk associated with derivative contracts meeting the definition of a guarantee consistent with our risk management policies.
Jefferies Financial Products, LLC.
JFP maintains a credit intermediation facility with a highly rated European bank (the “Bank”), which allow JFP customers that require a counterparty with a high credit rating for commodity index transactions to transact with the Bank. The Bank simultaneously enter
into offsetting transactions with JFP and receive a fee from JFP for providing credit support.
Other Guarantees.
In the normal course of business we provide guarantees to securities clearinghouses and exchanges. These guarantees generally are required under the standard membership agreements, such that members are required to guarantee the performance of other members. To mitigate these performance risks,
the exchanges and clearinghouses often require members to post collateral. Our obligations under such guarantees could exceed the collateral amounts posted; however, the potential for us to be required to make payments under such guarantees is deemed remote.
Leases.
As lessee, we lease certain premises and equipment under noncancelable agreements expiring at various dates through 2022 which are operating leases. Future minimum lease payments for all noncancelable operating leases at December 31, 2009 are as follows (in thousands):
53
JEFFERIES GROUP, INC.
AND SUBSIDIARIES
AND SUBSIDIARIES
Notes to Consolidated Financial Statements — (Continued)
December 31, 2009 and 2008
December 31, 2009 and 2008
| Gross | Sub-leases | Net | ||||||||||
|
2010
|
48,256 | 5,152 | 43,104 | |||||||||
|
2011
|
43,246 | 5,048 | 38,198 | |||||||||
|
2012
|
39,666 | 4,987 | 34,679 | |||||||||
|
2013
|
38,519 | 5,033 | 33,486 | |||||||||
|
2014
|
33,104 | 4,469 | 28,635 | |||||||||
|
Thereafter
|
103,799 | 4,430 | 99,369 | |||||||||
Rental expense amounted to $50,942,000 and $50,529,000, in 2009 and 2008, respectively.
(17) Net Capital Requirements
As registered broker-dealers, Jefferies, Jefferies Execution and Jefferies High Yield Trading are subject to the Securities and Exchange Commission Uniform Net Capital Rule (Rule 15c3-1), which requires the maintenance of minimum net capital. Jefferies, Jefferies Execution and Jefferies High Yield Trading have elected to use the alternative method permitted by the Rule.
As of December 31, 2009, Jefferies, Jefferies Execution and Jefferies High Yield Trading’s net capital and excess net capital were as follows (in thousands of dollars):
| Net Capital | Excess Net Capital | |||||||
|
Jefferies
|
$ | 826,438 | $ | 777,316 | ||||
|
Jefferies Execution
|
$ | 9,357 | $ | 9,107 | ||||
|
Jefferies High Yield Trading
|
$ | 503,666 | $ | 503,416 | ||||
(18) Segment Reporting
The Capital Markets reportable segment includes our traditional securities brokerage trading activities, including the results of our high yield secondary market trading activities, and investment banking activities. The Capital Markets reportable segment is managed as a single operating segment that provides the sales, trading and origination effort for various fixed income, equity and advisory products and services. The
Capital Markets segment comprises a number of interrelated divisions. In addition, we choose to voluntarily disclose the Asset Management segment even though it is currently an “immaterial non-reportable” segment.
Our reportable business segment information is prepared using the following methodologies:
| • | Net revenues and expenses directly associated with each reportable business segment are included in determining earnings before taxes. |
| • | Net revenues and expenses not directly associated with specific reportable business segments are allocated based on the most relevant measures applicable, including each reportable business segment’s net revenues, headcount and other factors. |
| • | Reportable business segment assets include an allocation of indirect corporate assets that have been fully allocated to our reportable business segments, generally based on each reportable business segment’s capital utilization. |
54
JEFFERIES GROUP, INC.
AND SUBSIDIARIES
AND SUBSIDIARIES
Notes to Consolidated Financial Statements — (Continued)
December 31, 2009 and 2008
December 31, 2009 and 2008
Our net revenues, expenses, and total assets by segment are summarized below (amounts in millions):
| Capital | Asset | |||||||||||
| Markets | Management | Total | ||||||||||
|
Year ended December 31, 2009
|
||||||||||||
|
Net revenues
|
$ | 2,134.9 | $ | 35.9 | $ | 2,170.8 | ||||||
|
|
||||||||||||
|
Expenses
|
$ | 1,587.1 | $ | 30.8 | $ | 1,617.9 | ||||||
|
Segment assets
|
$ | 28,015.6 | $ | 173.7 | $ | 28,189.3 | ||||||
|
Year ended December 31, 2008
|
||||||||||||
|
Net revenues
|
$ | 1,074.7 | $ | (52.9 | ) | $ | 1,021.8 | |||||
|
|
||||||||||||
|
Expenses
|
$ | 1,926.1 | $ | 45.0 | $ | 1,971.1 | ||||||
|
Segment assets
|
$ | 19,843.7 | $ | 135.0 | $ | 19,978.7 | ||||||
|
|
||||||||||||
Net Revenues by Geographic Region
Net revenues are recorded in the geographic region in which the senior coverage banker is located in the case of investment banking, or where the position was risk-managed within Capital Markets or the location of the investment advisor in the case of Asset Management. In addition, certain revenues associated with U.S. financial instruments and services that result from relationships with non-U.S. clients have been classified
as non-U.S. revenues using an allocation consistent with our internal reporting. The following table presents net revenues by geographic region for the years ended December 31, 2009 and 2008 (amounts in thousands):
| Year Ended December 31, | ||||||||
| 2009 | 2008 | |||||||
|
Americas (1)
|
$ | 1,900,948 | $ | 812,567 | ||||
|
Europe
|
268,487 | 191,850 | ||||||
|
Asia (including Middle East)
|
1,342 | 17,358 | ||||||
|
|
||||||||
|
Net Revenues
|
$ | 2,170,777 | $ | 1,021,775 | ||||
|
|
||||||||
| (1) | Substantially all relates to U.S. results. |
(19) Related Party Transactions
On August 11, 2008, we entered into a Credit Agreement (the “Credit Facility”) with JCP Fund V Bridge Partners, LLC, a Delaware limited liability company ( “the Borrower”), pursuant to which we may make loans to the Borrower in an aggregate principal amount of up to $50.0 million. The Borrower is owned by its two managing members, including Brian P. Friedman, one of our directors and executive
officers. The loan proceeds may be used by the Borrower to make investments that are expected to be sold to Jefferies Capital Partners V, L.P. (“Fund V”) upon its capitalization by third party investors. Fund V will be managed by a team led by Mr. Friedman.
In July of 2009, the Borrower exercised its right to extend the final maturity date of the Credit Facility from August 12, 2009 to January 11, 2010; and in October 2009, we and the Borrower agreed to extend the final maturity date to June 30, 2010. The interest rate on any loans made under the Credit Facility is the Prime Rate (as defined in the Credit Facility) plus 200 basis points, payable at the final
maturity date, or upon repayment of any principal amounts, as applicable. The obligations of the Borrower under the Credit Facility are secured by its interests in each investment. As of December 31, 2009 and 2008, loans in the aggregate principal amount of approximately $45.7
55
JEFFERIES GROUP, INC.
AND SUBSIDIARIES
AND SUBSIDIARIES
Notes to Consolidated Financial Statements — (Continued)
December 31, 2009 and 2008
December 31, 2009 and 2008
million and $31.3 million, respectively, were outstanding under the Credit Facility and recorded in other investments on the consolidated statements of financial condition.
At December 31, 2009, we have commitments to purchase $53.4 million in agency commercial mortgage-backed securities from Berkadia Commercial Mortgage, LLC, which is partially owned by Leucadia.
(20) Selected Quarterly Financial Data (Unaudited)
The following is a summary of unaudited quarterly statements of earnings for the years ended December 31, 2009 and December 31, 2008 (in thousands of dollars, except per share amounts):
| March | June | September | December | Year | ||||||||||||||||
|
2009
|
||||||||||||||||||||
|
Total revenues
|
$ | 405,904 | $ | 667,576 | $ | 777,177 | $ | 622,045 | $ | 2,472,702 | ||||||||||
|
Earnings before income taxes
|
49,182 | 122,328 | 175,030 | 169,081 | 515,621 | |||||||||||||||
|
Net earnings to common shareholders
|
38,337 | 61,900 | 86,286 | 93,520 | 280,043 | |||||||||||||||
|
Net earnings per common share:
|
||||||||||||||||||||
|
Basic
|
$ | 0.19 | $ | 0.31 | $ | 0.42 | $ | 0.47 | $ | 1.39 | ||||||||||
|
|
||||||||||||||||||||
|
Diluted
|
$ | 0.19 | $ | 0.30 | $ | 0.42 | $ | 0.46 | $ | 1.38 | ||||||||||
|
|
||||||||||||||||||||
|
2008
|
||||||||||||||||||||
|
Total revenues
|
$ | 396,487 | $ | 584,025 | $ | 453,251 | $ | 248,976 | $ | 1,682,739 | ||||||||||
|
(Loss)/earnings before income taxes
|
(132,306 | ) | 5,469 | (53,656 | ) | (699,768 | ) | (880,261 | ) | |||||||||||
|
Net (loss) to common shareholders
|
(60,537 | ) | (4,385 | ) | (31,304 | ) | (439,902 | ) | (536,128 | ) | ||||||||||
|
Net (loss) per common share:
|
||||||||||||||||||||
|
Basic
|
$ | (0.45 | ) | $ | (0.05 | ) | $ | (0.18 | ) | $ | (2.39 | ) | $ | (3.27 | ) | |||||
|
|
||||||||||||||||||||
|
Diluted
|
$ | (0.45 | ) | $ | (0.05 | ) | $ | (0.18 | ) | $ | (2.39 | ) | $ | (3.27 | ) | |||||
|
|
||||||||||||||||||||
During the fourth quarter of 2008, we recognized compensation expense of $302.6 million associated with the removal of service requirements on outstanding restricted stock and restricted stock units. For further discussion, refer to Note 13, “Compensation Plans,” in the Notes to the Consolidated Financial Statements.
(21) Subsequent Events
We have evaluated whether events or transactions have occurred after December 31, 2009 that would require recognition or disclosure in these consolidated financial statements through February 26, 2010, which is the date of issuance of these financial statements.
56
HFH ShortPLUS FUND, L.P.
(In Liquidation)
Statement of Financial Condition
Period Ended March 31, 2009 (unaudited)
|
Assets
|
||||
|
Investment in HFH ShortPLUS Master Fund, Ltd. (In Liquidation), at fair value
|
$ | 19,039,823 | ||
|
Investment in HFH ShortPLUS Liquidating Trust, at fair value
|
640,214 | |||
|
Cash
|
4,283 | |||
| $ | 19,684,320 | |||
|
Liabilities and partners' capital
|
||||
|
Liabilities
|
||||
|
Capital withdrawals payable
|
$ | 19,574,168 | ||
|
Accrued expenses
|
110,152 | |||
|
Total liabilities
|
19,684,320 | |||
|
Partners' capital
|
- | |||
| $ | 19,684,320 | |||
1
HFH ShortPLUS FUND, L.P.
(In Liquidation)
Statement of Operations
Period Ended March 31, 2009 (unaudited)
|
Net investment income (loss) allocated from
|
||||
|
HFH ShortPLUS Master Fund, Ltd. (In Liquidation)
|
||||
|
Interest income
|
$ | 2,303 | ||
|
Dividend income
|
775 | |||
|
Professional fees and other
|
(19,722 | ) | ||
|
Administrative fee
|
(5,027 | ) | ||
|
Total net investment income (loss) allocated from
|
||||
|
HFH ShortPLUS Master Fund, Ltd. (In Liquidation)
|
(21,671 | ) | ||
|
Net investment income (loss) allocated from
|
||||
|
HFH ShortPLUS Master Fund Liquidating Trust
|
10,523 | |||
|
Fund income
|
||||
|
Interest
|
110 | |||
|
Fund expenses
|
||||
|
Management fee
|
49,913 | |||
|
Professional fees and other
|
- | |||
|
Total Fund expenses
|
49,913 | |||
|
Net investment income
|
(60,951 | ) | ||
|
Realized and unrealized gain (loss) on investments allocated from
|
||||
|
HFH ShortPLUS Master Fund, Ltd. (In Liquidation)
|
||||
|
Net realized gain (loss) on securities
|
(16,277,063 | ) | ||
|
Net realized gain (loss) on credit default swap contracts
|
627,265 | |||
|
Net change in unrealized appreciation or (depreciation) on securities
|
16,277,063 | |||
|
Net change in unrealized appreciation or (depreciation) on credit default
swap contracts
|
(962,009 | ) | ||
|
Net gain (loss) from foreign exchange transactions
|
- | |||
|
Net gain (loss) on investments
|
(334,744 | ) | ||
|
Net loss
|
(395,695 | ) | ||
|
Less reallocation to the General Partner
|
0 | |||
|
Net loss allocated to all partners
|
$ | (395,695 | ) | |
2
HFH ShortPLUS FUND, L.P.
(In Liquidation)
Statement of Changes in Partners’ Capital
Period Ended March 31, 2009 (unaudited)
|
General
|
Limited
|
|||||||||||
|
Partner
|
Partners
|
Total
|
||||||||||
|
Partners' capital,
beginning of year
|
$ | 557,782 | $ | 19,965,072 | $ | 20,522,854 | ||||||
|
Early withdrawal fees
|
- | - | - | |||||||||
|
Capital withdrawals
|
(557,700 | ) | (19,569,459 | ) | (20,127,159 | ) | ||||||
|
Allocation of net loss
|
||||||||||||
|
Pro rata allocation
|
(82 | ) | (395,613 | ) | (395,695 | ) | ||||||
|
Reallocation to General Partner
|
- | - | - | |||||||||
| - | - | - | ||||||||||
|
Partners' capital, end of period
|
$ | - | $ | - | $ | - | ||||||
3
HFH ShortPLUS FUND, L.P.
(In Liquidation)
Statement of Cash Flows
Period Ended March 31, 2009 (unaudited)
|
Cash flows from operating activities
|
||||
|
Net loss
|
$ | (395,695 | ) | |
|
Adjustments to reconcile net income to net cash provided by
|
||||
|
operating activities:
|
||||
|
Net income allocated from HFH ShortPLUS Master Fund, Ltd. (In Liquidation)
|
356,415 | |||
|
Net income allocated from HFH ShortPLUS Master Fund Liquidating Trust
|
(10,523 | ) | ||
|
Changes in operating assets and liabilities:
|
||||
|
Proceeds from the sales of shares from
|
||||
|
HFH ShortPLUS Master Fund, Ltd. (In Liquidation)
|
19,969,477 | |||
|
Other assets
|
- | |||
|
Accrued expenses
|
(24,847 | ) | ||
|
Net cash provided by operating activities
|
19,894,827 | |||
|
Net cash flows used in financing activities,
|
||||
|
Capital withdrawals, net of capital withdrawals payable and early withdrawal fees
|
(19,893,217 | ) | ||
|
Net change in cash
|
1,610 | |||
|
Cash
, beginning of year
|
2,673 | |||
|
Cash
, end of period
|
$ | 4,283 | ||
See accompanying notes to financial statements.
4
HFH ShortPLUS FUND, L.P. (In Liquidation)
March 31, 2009 (unaudited)
Notes to Financial statements
1. Nature of operations and summary of significant accounting policies
Nature of Operations
HFH ShortPLUS Fund, L.P. (the “Partnership”) is a Delaware limited partnership and commenced operations on January 2, 2007. The Partnership invests substantially all of its investable assets through a “master-feeder” structure in HFH ShortPLUS Master Fund, Ltd. (the “Master Fund”), a Cayman
Islands exempted company that invests and trades a short-biased portfolio of asset-backed securities (“ABS”) that the Investment Manager believes are most likely to produce high returns during periods of adverse credit performance for residential mortgages, and for mortgage-backed securities (“MBS”) and ABS. Returns will come from two principal sources: (i) market value changes, arising from changes in credit spreads on the Master Fund’s short positions; and
(ii) credit default payments from counterparties on credit default swaps (“CDS”) or other derivatives in credit sensitive mortgage and asset-backed securities, consumer debt and other assets. The Partnership’s investment objective is the same as that of the Master Fund. The financial statements of the Master Fund are included elsewhere in this report and should be read in conjunction with the Partnership’s financial statements. Highland Financial Holdings,
LLC (the “General Partner”) serves as the General Partner and Highland Financial Holdings Group, LLC (“Investment Manager”) serves as the investment manager of the Partnership.
The Master Fund is also managed by the Investment Manager. Valuation of the investments held by the Master Fund is discussed in the notes to the financial statements of the Master Fund included elsewhere in this report. The percentage of the Master Fund’s net assets owned by the Partnership at March 31,
2009 was approximately 25.5%.
In accordance with the Partnership’s documents, the General Partner has formalized a plan of liquidation to liquidate the Partnership in an orderly manner, and as a result, changed its basis of accounting from the going concern to the liquidation basis whereby assets and liabilities are stated at their estimated settlement amounts
and all costs of liquidation have been recognized. The adoption of the liquidation basis of accounting did not have a material effect on the carrying values of assets and liabilities as of March 31, 2009. The residual 50% of the capital held by the remaining investors in the Partnership will be distributed in April 2009 with a value date of March 31, 2009. The distribution amount of cash and securities is $19,574,168. This amount is shown as capital withdrawals
payable in the Statement of Financial Condition. In addition, a new entity, HFH ShortPLUS Master Fund Liquidating Trust was established for purposes of receiving cash flows on securities that were distributed in-kind.
Basis of Presentation
The financial statements have been prepared in conformity with accounting principles generally accepted in the United States of America.
Valuation of Investment in HFH ShortPLUS Master Fund, Ltd.
The Partnership records its investment in the Master Fund at fair value based on the net asset value of the Master Fund. Valuation of instruments held by the Master Fund is discussed in Note 1 of the Master Fund’s financial statements.
5
HFH ShortPLUS FUND, L.P. (In Liquidation)
March 31, 2009 (unaudited)
Notes to Financial statements
Income and Expense Recognition
The Partnership records its proportionate share of the Master Fund’s investment income/loss, expenses and realized and unrealized gains and losses. The Master Fund’s income and expense recognition and allocation policies are discussed in Note 1 of the Master Fund’s financial statements.
Interest income of the Partnership’s cash balance is accrued as earned. Expenses that are directly attributable to the Partnership are recorded on the accrual basis as incurred.
Income Taxes
The Partnership is not a taxable entity for federal, state or local income tax purposes; such taxes are the responsibility of the individual partners. Accordingly, no provision has been made in the accompanying financial statements for any federal, state or local income taxes.
On December 30, 2008, the FASB issued FIN 48-3, Effective Date of FASB Interpretation No. 48 for Certain Nonpublic Enterprises ("FSP"), which allows the Partnership to defer the adoption of FIN 48 until periods beginning after December 15, 2008. The General Partner has elected to take advantage of this deferral. Based
on its continued analysis, the General Partner has determined that the adoption of FIN 48 will not have a material impact on the Partnership’s financial statements. However, the General Partner's conclusions regarding FIN 48 may be subject to review and adjustment at a later date based on factors including, but not limited to, further implementation guidance and on-going analyses of tax laws, regulations and interpretations thereof. The Partnership’s accounting policy for evaluating
uncertain tax positions during financial statement periods subject to the deferral of FIN 48 is based on the recognition and disclosure criteria for loss contingencies under SFAS No. 5 “Accounting for Contingencies”.
FIN 48 requires the General Partner to determine whether a tax position of the Partnership is more likely than not to be sustained upon examination by the applicable taxing authority, including resolution of any related appeals or litigation processes, based on the technical merits of the position. The tax benefit to be recognized
is measured as the largest amount of benefit that is greater than fifty percent likely of being realized upon ultimate settlement which could result in the Partnership recording a tax liability that would reduce net assets. FIN 48 must be applied to all existing tax positions upon initial adoption and the cumulative effect, if any, is to be reported as an adjustment to partners’ capital upon adoption.
Use of Estimates
The financial statements are prepared in accordance with accounting principles generally accepted in the United States of America (“U.S. GAAP”). The preparation of financial statements in accordance with U.S. GAAP requires management to make estimates and assumptions that affect the reported amounts and disclosures
in the financial statements. Actual results could differ from these estimates.
6
HFH ShortPLUS FUND, L.P. (In Liquidation)
March 31, 2009 (unaudited)
Notes to Financial statements
2. Partners’ capital
The minimum initial and subsequent capital contributions (each a “Capital Contribution”) in the Partnership are $5,000,000 and $1,000,000, respectively. The Investment Manager may waive or reduce the minimum capital contributions in its sole discretion. The General Partner admitted new Limited Partners
and permitted Limited Partners to make additional capital contributions as of the first business day of each calendar month, or at any other time in the General Partner’s sole discretion.
Subject to the lock-up period and early withdrawal fee, Limited Partners had the right to require the Partnership to withdraw all or any portion of their investment by delivering written notice to the General Partner not less than 90 days prior to the end of any calendar quarter, or at such other times as the General Partner determined
in its sole discretion. The General Partner reserved the right to waive or reduce the notice period in its sole discretion. Notwithstanding anything to the contrary, a Limited Partner could not withdraw each capital contribution (and any appreciation thereon) until after the 12 month period (the “Lock-up Period”) following the date of such contribution, without the prior consent of the General Partner, which may have been granted or denied in the General Partner’s sole
discretion.
Limited Partners who withdraw a Capital Contribution after the Lock-up Period with respect to such Capital Contribution but less than 24 months after purchasing such capital contribution will be charged an early withdrawal fee equal to 5% of the withdrawal amount. Any early withdrawal fee will be payable to the Partnership and
is subject to the incentive allocation described in Note 3. The General Partner reserves the right, in its sole discretion, to waive or reduce the early withdrawal fee on a case-by-case basis. Subject to the Partnership’s right to establish reserves, a minimum of 95% of the withdrawals proceeds will generally be paid to the withdrawing Limited Partner within 15 business days after the corresponding withdrawal date, with the balance payable (without interest) within 90 days of the corresponding
withdrawal date. However, payments to withdrawing Limited Partners may be subject to further delay or may be suspended.
In the event that withdrawal requests are received representing in the aggregate more than 10% of the total Net Asset Value of the Partnership on any withdrawal date, the Partnership is entitled to reduce ratably and pro rata amongst all Limited Partners seeking to withdraw interests on the withdrawal date and to carry out only sufficient
withdrawals, which in the aggregate, amount to 10% of the total Net Asset Value of the Partnership on such withdrawal date.
7
HFH ShortPLUS FUND, L.P. (In Liquidation)
March 31, 2009 (unaudited)
Notes to Financial statements
3. Allocation of net income (loss) and incentive allocation
Net investment income and gains and losses are allocated to the partners on a monthly basis, based on the partners’ proportionate share of capital in the Partnership at the beginning of the month.
The General Partner receives an incentive allocation equal to 20% of net capital appreciation (as defined in the limited partnership agreement) credited to the capital account of each limited partner, less management fees. The incentive allocation will be deducted from the capital account of such limited partner and reallocated
to the General Partner’s capital account. At the discretion of the General Partner, this rate may be reduced for certain Limited Partners. If there is a loss for the fiscal period, such loss is carried forward to future periods and no incentive allocations will be made to the General Partner until prior fiscal period losses are recovered. For the period ended March 31, 2009, the General Partner was allocated $0 in incentive allocations.
4. Management fee and other related party transactions
The Investment Manager receives a quarterly management fee in arrears, equal to 0.50% (2% per annum) of each Limited Partner’s capital account. At the discretion of the General Partner, this rate may be reduced for certain Limited Partners and affiliated fund investments. For the period ended March 31, 2009,
the Investment Manager earned a management fee of $49,913 from the Partnership.
5. Off-balance sheet risk, leverage and concentration of credit risks
Off-balance sheet risk, leverage and concentration of credit risks are discussed in the Master Fund’s financial statements.
Due to the nature of the master fund/feeder fund structure, the Partnership could be materially affected by significant subscriptions and redemptions of the other feeder fund. From time to time, the Partnership may have a concentration of partners holding a significant percentage of the Partnership's partners' capital. Investment
activities of these partners could have a material impact on the Partnership. At March 31, 2009, one partner owned 99.98% of the total partners' capital of the Partnership
8
HFH ShortPLUS FUND, L.P. (In Liquidation)
March 31, 2009 (unaudited)
Notes to Financial statements
6. Capital withdrawals payable
In accordance with FASB Statement No. 150,
Accounting for Certain Financial Instruments with Characteristics of Both Liabilities and Equity, as effected by FASB Staff Position No. FAS 150-3
, withdrawals are recognized as liabilities by the Partnership, net of incentive allocations,
when the amount requested in the withdrawal notice becomes fixed. This generally occurs either at the time of the receipt of the notice, or on the last day of a fiscal period, depending on the nature of the request. As a result, withdrawals paid after the end of the period, but based upon year-end capital balances are reflected as capital withdrawals payable at March 31, 2009. Withdrawal notices received for which the dollar amount is not fixed remains in capital until the amount
is determined. Withdrawals payable may be treated as capital for purposes of allocations of gains/losses pursuant to the Partnership's governing documents. On March 31, 2009, $19,574,168 is included in redemptions payable.
7. Commitments and contingencies
In the normal course of business, the Partnership enters into contracts that contain a variety of representations, warranties and general indemnifications. The Partnership’s maximum exposure under these arrangements, including future claims that may be made against the Partnership that have not yet occurred, is unknown. However,
based on the experience of the General Partner, the Partnership expects the risk of loss associated with such contracts to be remote.
8. Administrative fee
Admiral Administration, Ltd. (Cayman Islands) (the “Administrator”) serves as the Partnership’s Administrator and performs certain administrative and clerical services on behalf of the Partnership.
9
HFH ShortPLUS FUND, L.P. (In Liquidation)
March 31, 2009 (unaudited)
Notes to Financial statements
9. Financial highlights
Financial highlights for the year ended March 31, 2009 are as follows:
|
Total return
|
||||
|
Total return before reallocation to General Partner
|
(2.0 | ) % | ||
|
Reallocation to General Partner
|
0.0 | |||
|
Total return after reallocation to General Partner (a)
|
(2.0 | ) % | ||
|
Ratio to average limited partners' capital
|
||||
|
Expenses (including interest) (b)
|
0.4 | % | ||
|
Reallocation to General Partner
|
0.0 | |||
|
Expenses and reallocation to General Partner
|
0.4 | % | ||
|
Expenses excluding interest expense (c)
|
0.4 | % | ||
|
Net investment income (d)
|
(0.3 | ) % | ||
|
(a)
|
Total return is calculated for aggregate limited partners’ capital, exclusive of the General Partner, taken as a whole and adjusted for cash flows related to capital contributions and withdrawals during the year. An individual limited partner’s return may differ depending on the timing of contributions and withdrawals, as well as
varying fee structures.
|
|
(b)
|
The operating expense ratio is based on the expenses allocated to each partner prior to the effects of any incentive allocation. For the purpose of this calculation, operating expenses include expenses incurred by the Partnership directly as well as expenses allocated from the Master Fund. Expense ratios are calculated over average
net assets. Expense ratio excluding the effect of allocated expenses from the Master Fund would be .3%. The expense ratios attributable to an individual partner’s account may vary based on different management fee and incentive allocation arrangements and the timing of capital transactions.
|
|
(c)
|
The expenses excluding interest expense ratio is based on the expenses allocated to each partner. For the purpose of this calculation, operating expenses include expenses incurred by the Partnership directly as well as expenses allocated from the Master Fund, excluding interest expense and the reallocation to the General Partner. Expense
ratios are calculated over average net assets. The expense ratios attributable to an individual partner’s account may vary based on different management fee arrangements and the timing of capital transactions.
|
|
(d)
|
The net investment income ratio is based on the net investment income allocated to a limited partner prior to the effect of an incentive allocation and is exclusive of unrealized and realized gains and losses. The net investment income ratio attributable to an individual partner’s account may vary based on timing of capital transactions
and different management fee arrangements.
|
10
HFH ShortPLUS FUND, L.P. (In Liquidation)
March 31, 2009 (unaudited)
Notes to Financial statements
|
10.
|
Subsequent events
|
A Certificate of Cancellation was issued by the state of Delaware on May 31, 2009.
11
HFH ShortPLUS MASTER FUND, LTD.
(In Liquidation)
Statement of Assets and Liabilities
(Expressed in United States Dollars)
|
Period Ended March 31, 2009 (unaudited
)
|
||||
|
Assets
|
||||
|
Cash and cash equivalents
|
$ | 74,919,781 | ||
|
Other assets
|
30,105 | |||
|
Total assets
|
74,949,886 | |||
|
Liabilities
|
||||
|
Accrued expenses and other payables
|
392,237 | |||
|
Due to broker
|
18,854 | |||
|
Total liabilities
|
411,091 | |||
|
Net assets
|
$ | 74,538,795 | ||
|
Net asset value per share, based on net assets of $74,538,795
|
||||
|
and 188.08 shares outstanding
|
$ | 396,311.78 | ||
See accompanying notes to financial statements.
1
HFH ShortPLUS MASTER FUND, LTD.
(In Liquidation)
Statement of Operations
(Expressed in United States Dollars)
|
Period Ended March 31, 2009 (unaudited)
|
||||
|
Investment income
|
||||
|
Interest
|
$ | 9,044 | ||
|
Dividends (net of foreign and U.S. withholding taxes of $0)
|
3,041 | |||
|
Total investment income
|
12,085 | |||
|
Expenses
|
||||
|
Professional fees and other
|
77,432 | |||
|
Administrative fee
|
19,719 | |||
|
Total expenses
|
97,151 | |||
|
Net investment income (loss)
|
(85,066 | ) | ||
|
Realized and unrealized gain (loss) on investments
|
||||
|
Net realized gain (loss) on securities
|
(63,908,302 | ) | ||
|
Net realized gain (loss) on credit default swap contracts
|
2,471,529 | |||
|
Net change in unrealized appreciation or (depreciation) on securities
|
63,908,302 | |||
|
Net change in unrealized appreciation or (depreciation) on credit default swap
contracts
|
(3,783,621 | ) | ||
|
Net gain (loss) from foreign exchange transactions
|
- | |||
|
Net gain (loss) on investments
|
(1,312,092 | ) | ||
|
Net change in net assets resulting from operations
|
$ | (1,397,158 | ) | |
See accompanying notes to financial statements.
2
HFH ShortPLUS MASTER FUND, LTD.
(In Liquidation)
Statement of Changes in Net Assets
(Expressed in United States Dollars)
|
Period Ended March 31, 2009 (unaudited)
|
||||
|
Operations
|
||||
|
Net investment income (loss)
|
$ | (85,066 | ) | |
|
Net realized gain (loss) on securities
|
(63,908,302 | ) | ||
|
Net realized gain (loss) on credit default swaps
|
2,471,529 | |||
|
Net change in unrealized appreciation or (depreciation) on securities
|
63,908,302 | |||
|
Net change in unrealized appreciation or (depreciation) on credit default swap
contracts
|
(3,783,621 | ) | ||
|
Net change in net assets resulting from operations
|
(1,397,158 | ) | ||
|
Capital share transactions
|
||||
|
Issuance of shares
|
- | |||
|
Redemption of shares
|
(113,284,704 | ) | ||
|
Net change in net assets resulting from capital share transactions
|
(113,284,704 | ) | ||
|
Net change in net assets
|
(114,681,862 | ) | ||
|
Net assets,
beginning of year
|
189,220,657 | |||
|
Net assets,
end of period
|
$ | 74,538,795 | ||
See accompanying notes to financial statements.
3
HFH ShortPLUS MASTER FUND, LTD.
(In Liquidation)
Statement of Cash Flows
(Expressed in United States Dollars)
|
Period Ended March 31, 2009 (unaudited)
|
||||
|
Cash flows from operating activities
|
||||
|
Net change in net assets resulting from operations
|
$ | (1,397,158 | ) | |
|
Adjustments to reconcile net change in net assets resulting
|
||||
|
from operations to net cash provided by operating activities:
|
||||
|
Net realized gain (loss) on securities
|
63,908,302 | |||
|
Net change in unrealized appreciation or (depreciation) on securities
|
(63,908,302 | ) | ||
|
Changes in operating assets and liabilities:
|
||||
|
Purchases of investments in securities, at fair value
|
- | |||
|
Proceeds from sales of investments in securities, at fair value
|
5,812,984 | |||
|
Credit default swap contracts, at fair value
|
7,396,121 | |||
|
Securities purchased under agreements to resell, at fair value
|
32,338,000 | |||
|
Margin cash paid to counterparties
|
11,986,130 | |||
|
Other assets
|
35,350 | |||
|
Margin cash received from counterparties
|
(12,088,168 | ) | ||
|
Due to broker
|
(14,585 | ) | ||
|
Accrued expenses
|
(49,247 | ) | ||
|
Net cash provided by operating activities
|
44,019,427 | |||
|
Cash flows from financing activities
|
||||
|
Proceeds from issuance of shares
|
- | |||
|
Payments for redemption of shares
|
(113,284,704 | ) | ||
|
Net cash used in financing activities
|
(113,284,704 | ) | ||
|
Net change in cash and cash equivalents
|
(69,265,277 | ) | ||
|
Cash and cash equivalents, beginning of year
|
144,185,058 | |||
|
Cash and cash equivalents, end of period
|
$ | 74,919,781 | ||
See accompanying notes to financial statements.
4
HFH ShortPLUS MASTER FUND, LTD. (In Liquidation)
March 31, 2009 (unaudited)
Notes to Financial Statements
(Expressed in United States Dollars)
1. Nature of operations and summary of significant accounting policies
Nature of Operations
HFH ShortPLUS Master Fund, Ltd. (In Liquidation) (the “Fund”) is a Cayman Islands exempted company incorporated in accordance with the Companies Law (2004 revision) which commenced operations on January 2, 2007. The Fund’s strategy is to assemble a short-biased portfolio of asset-backed securities (“ABS”)
that the Investment Manager believes are most likely to produce high returns during periods of adverse credit performance for residential mortgages, and for mortgage-backed securities (“MBS”) and ABS. Returns will come from two principal sources: (i) market value changes arising from changes in credit spreads on the Fund’s short positions; and (ii) credit default payments from counterparties on credit default swaps (“CDS”) or other derivatives.
In accordance with the Fund’s documents, the board of directors has formalized a plan of liquidation to liquidate the Fund in an orderly manner, and as a result, changed its basis of accounting from the going concern to the liquidation basis whereby assets and liabilities are stated at their estimated settlement amounts and all costs
of liquidation have been recognized. The adoption of the liquidation basis of accounting did not have a material effect on the carrying values of assets and liabilities as of March 31, 2009
The shares held by the remaining investors will be distributed in April 2009 with a value date of March 31, 2009. In addition, a new entity called HFH ShortPLUS Master Fund Liquidating Trust was established for purposes of receiving cash flows on securities that were distributed in-kind.
Highland Financial Holdings Group, LLC (“Investment Manager") serves as the investment manager of the Fund. The Investment Manager manages and invests the Fund’s assets and effects all security transactions on behalf of the Fund. The Fund operates under a “master fund/feeder fund” structure. HFH
ShortPLUS, Ltd. and HFH ShortPLUS Fund, L.P. (collectively, the “Feeder Funds”) invest substantially all of their investable assets in the Fund.
Basis of Presentation
The financial statements are expressed in United States dollars and have been prepared in conformity with accounting principles generally accepted in the United States of America.
Cash and Cash Equivalents
Cash and cash equivalents consist principally of cash, margin cash received from counterparties, and short term investments (treasury bills), which are readily convertible into cash and have original maturities of three months or less.
5
HFH ShortPLUS MASTER FUND, LTD. (In Liquidation)
March 31, 2009 (unaudited)
Notes to Financial Statements
(Expressed in United States Dollars)
Valuation of Investments in Securities at Fair Value -- Definition and Hierarchy
The Fund adopted the provisions of SFAS No. 157, “Fair Value Measurements” (“SFAS No. 157”), effective January 1, 2008. Under SFAS No. 157, fair value is defined as the price that would be received to sell an asset or paid to transfer a liability (i.e., the “exit price”) in an
orderly transaction between market participants at the measurement date.
In determining fair value, the Fund uses various valuation approaches. SFAS No. 157 establishes a fair value hierarchy for inputs used in measuring fair value that maximizes the use of observable inputs and minimizes the use of unobservable inputs by requiring that the most observable inputs be used when available. Observable
inputs are those that market participants would use in pricing the asset or liability based on market data obtained from sources independent of the Fund. Unobservable inputs reflect the Fund’s assumptions about the inputs market participants would use in pricing the asset or liability developed based on the best information available in the circumstances. The fair value hierarchy is categorized into three levels based on the inputs as follows:
Level 1
- Valuations based on unadjusted quoted prices in active markets for identical assets or liabilities that the Fund has the ability to access. Valuation adjustments and block discounts are not applied to Level 1 securities. Since valuations are based
on quoted prices that are readily and regularly available in an active market, valuation of these securities does not entail a significant degree of judgment.
Level 2
- Valuations based on quoted prices in markets that are not active or for which all significant inputs are observable, either directly or indirectly.
Level 3
- Valuations based on inputs that are unobservable and significant to the overall fair value measurement.
The availability of valuation techniques and observable inputs can vary from security to security and is affected by a wide variety of factors including, the type of security, whether the security is new and not yet established in the marketplace, and other characteristics particular to the transaction. To the extent that valuation
is based on models or inputs that are less observable or unobservable in the market, the determination of fair value requires more judgment. Those estimated values do not necessarily represent the amounts that may be ultimately realized due to the occurrence of future circumstances that cannot be reasonably determined. Because of the inherent uncertainty of valuation, those estimated values may be materially higher or lower than the values that would have been used had a ready market for
the securities existed. Accordingly, the degree of judgment exercised by the Fund in determining fair value is greatest for securities categorized in Level 3. In certain cases, the inputs used to measure fair value may fall into different levels of the fair value hierarchy. In such cases, for disclosure purposes, the level in the fair value hierarchy within which the fair value measurement in its entirety falls, is determined based on the lowest level input that is significant
to the fair value measurement.
6
HFH ShortPLUS MASTER FUND, LTD. (In Liquidation)
March 31, 2009 (unaudited)
Notes to Financial Statements
(Expressed in United States Dollars)
Fair value is a market-based measure considered from the perspective of a market participant rather than an entity-specific measure. Therefore, even when market assumptions are not readily available, the Fund’s own assumptions are set to reflect those that market participants would use in pricing the asset or liability
at the measurement date. The Fund uses prices and inputs that are current as of the measurement date, including periods of market dislocation. In periods of market dislocation, the observability of prices and inputs may be reduced for many securities. This condition could cause a security to be reclassified to a lower level within the fair value hierarchy.
Valuation Techniques
The Investment Manager will use its reasonable discretion to value each investment by using, as a guide, a combination of (i) independent, third-party pricing sources; (ii) indications from one or more financial institutions engaged in trading the investments or securities similar to the investments being valued; (iii) transactions in the
market of the same or similar securities; and (iv) in-house models the Investment Manager maintains (the “Highland Model”). In cases where the number of indications is limited, the Investment Manager will review other factors such as the previous month’s value, whether such indication is from the same counterparty, the delta between the current value and the previous month value, relevant market data or news, the value of similar securities, recent trading information and any other
information which may be deemed relevant at the discretion of the Investment Manager. With respect to credit default swaps (“CDS”), the Investment Manager may use, if considered representative of the value of CDS positions, margin marks from the actual counterparty with whom the security was traded, or from counterparties of a similar CDS position to estimate the valuation. However, if the Investment Manager believes the exit price will be either greater or less than the current margin
mark, the Investment Manager has the discretion to revise the value accordingly.
Fair value determinations based on indications from financial institutions or margin marks from counterparties may be based on as few as a single indication/margin mark, or may be calculated as the average of more than one such indication/margin mark, which average may include recent transactions in the market or ignore outlying indications/margin
marks based on the Investment Manager’s discretion. The Investment Manager may use observable transactions in the market in determining the fair value of investments if, at the discretion of the Investment Manager, prioritization of such transactions is considered more relevant given market conditions or other factors.
The Highland Model is a proprietary system that is used to generate a price/yield based on key inputs. Cash flows for the Fund’s securities that are projected through the Highland Model, incorporate assumptions regarding potential future rates of delinquency, prepayments, defaults, collateral losses, and interest rates. On
a monthly basis, each security’s actual cash flows are compared to the previously projected cash flows. Assumptions can be modified based on significant deviations between actual cash flows and cash flows from previous projections. Discount rates may be changed based on market observations for prices and discount rates of similar securities trading in the secondary market. The following outlines the key inputs that are reevaluated on a monthly basis:
7
HFH ShortPLUS MASTER FUND, LTD. (In Liquidation)
March 31, 2009 (unaudited)
Notes to Financial Statements
(Expressed in United States Dollars)
|
i.
|
Constant Default Rate (CDR) – an annualized rate of default on a group of mortgages within a collateralized product (i.e. MBS). It represents the percentage of outstanding principal balances in the pool that are in default, which typically equates to the home being past 60-day and 90-day notices and in the foreclosure process.
|
|
ii.
|
Constant Prepayment Rate (CPR) – A loan prepayment rate that is equal to the proportion of the principal of a pool of loans that is assumed to be paid off prematurely in each period. The calculation of this estimate is based on a number of factors such as historical prepayment rates for previous loans that are similar
to ones in the pool and on the future economic outlook.
|
|
iii.
|
Loss Severity – costs (expressed as a %) to foreclose and liquidate a home securing a defaulted mortgage, as well as any decline in property value.
|
|
iv.
|
Delinquency – monthly mortgage payments that are 30, 60, or more than 60 days past due.
|
|
v.
|
Yield – the yield is obtained from the “Matrix” which is updated on a monthly basis. The Matrix associates yields based on various groups of securities and market conditions.
|
The Fund will also determine fair value for MBS and ABS securities that are not based on the Highland Model price. The following represent additional price sources:
Transaction based – Represents a recent transaction utilized as the price source if the transaction occurred within 30 days of the valuation date.
Trader based - Represents a price determined by a portfolio manager. The portfolio manager will determine the proper valuation for a particular security utilizing a combination of observable and unobservable inputs. In determining the valuation the portfolio manager will rely upon third party broker quotes, pricing services, recent transactions
of the security or similar securities, inquiries with marker-makers and industry expertise. The Fund will use this valuation technique if the responsible portfolio manager determines that the Highland Model does not accurately reflect certain idiosyncratic factors for a specific security.
Third party quotes - Represents a valuation that is received externally from either a pricing service or dealer price. The Fund will utilize this price if the responsible portfolio manager determines that this price accurately reflects fair value and for various reasons the Highland Model price (e.g. model inadequacies, non-current
data, etc.) is less accurate than the third party price.
The Fund did not hold any securities at March 31, 2009.
8
HFH ShortPLUS MASTER FUND, LTD. (In Liquidation)
March 31, 2009 (unaudited)
Notes to Financial Statements
(Expressed in United States Dollars)
Derivative Instruments and Hedging Activities
The Fund recognizes the value of all derivative instruments as either assets or liabilities in the Statement of Assets and Liabilities and measures those instruments at fair value.
Interest Rate and Index Swaps
The Fund may enter into interest rate and index swaps as part of its investment strategies. Swaps involve the exchange by the Fund with another party of respective commitments to pay or receive interest, effective return, or total return throughout the lives of the agreements. The Fund may be required to deliver or
receive cash or securities as collateral upon entering into swap transactions. Movements in the relative value of the swap transactions may require the Fund or the counterparty to post additional collateral. Interest rate swaps change in value with movements in interest rates. During the term of the swap contracts, changes in value and accrued interest payments are recognized as unrealized gains or losses by marking the contracts to the market. These unrealized gains
and losses are reported as an asset or liability, respectively, on the Statement of Assets and Liabilities. When contracts are terminated, the Fund will realize a gain or loss equal to the difference between the proceeds from (or cost of) the closing transaction and the Fund’s basis in the contract, if any.
Credit Default Swaps
The Fund adopted FASB Staff Position FAS 133-1 and FIN 45-4,
Disclosures about Credit Derivatives and Certain Guarantees: An Amendment of FASB Statement No. 133 and FASB Interpretation No. 45
, as of December 31, 2008, which requires additional disclosures about credit derivatives.
The Fund enters into credit default swaps to simulate long and short bond positions that are either unavailable or considered to be less attractively priced in the bond market. The Fund uses these swaps to attempt to reduce risk where the Fund has exposure to the issuer, or to take an active long or short position with respect
to the likelihood of the issuer’s default. There is no certainty that the objectives of holding credit default swaps will be achieved.
9
HFH ShortPLUS MASTER FUND, LTD. (In Liquidation)
March 31, 2009 (unaudited)
Notes to Financial Statements
(Expressed in United States Dollars)
The buyer of a credit default swap is obligated to pay the seller a periodic stream of payments over the term of the contract in return for a contingent payment upon the occurrence of a credit event, with respect to an underlying reference obligation. Generally, a credit event means bankruptcy, failure to pay, obligation accelerated
or modified restructuring. If a credit event occurs, the seller typically must pay the contingent payment to the buyer, which is typically the par value (full notional value) of the reference obligation. The contingent payment may be a cash settlement or by a physical delivery of the reference obligation in return for payment of the face amount of the obligation. If the Fund is a buyer and no credit event occurs, the Fund may lose its investment and recover nothing. However,
if a credit event occurs, the buyer typically receives full notional value and interest for a reference obligation that may have little or no value. As a seller, the Fund receives a fixed rate of income throughout the term of the contract, provided that no credit event occurs. If a credit event occurs, the seller may pay the buyer the full notional value and interest of the reference obligation. Upfront payments made and/or received by the Fund are recorded as an asset and/or
liability on the Statement of Assets and Liabilities and are recorded as a realized gain or loss on the termination date.
As of March 31, 2009, the Fund has no open credit default swaps.
Credit default swaps involve greater risks than if the Fund had invested in the reference obligations directly. In addition to general market risks, credit default swaps are subject to liquidity risk and counterparty credit risk. A buyer also may lose its investment and recover nothing should a credit event not occur. If
a credit event did occur, the value of the reference obligation received by the seller, coupled with the periodic payments previously received, may be less than the full notional value it pays to the buyer, resulting in a loss of value.
10
HFH ShortPLUS MASTER FUND, LTD. (In Liquidation)
March 31, 2009 (unaudited)
Notes to Financial Statements
(Expressed in United States Dollars)
Futures
A futures contract is an agreement between two parties to buy or sell a financial instrument for a set price on a future date. Initial margin deposits are made upon entering into futures contracts and can be either cash or securities. During the period the futures contract is open, changes in the value of the contract
are recognized as unrealized gains or losses by marking to market on a daily basis to reflect the fair value of the contract at the end of each day’s trading. When the contract is closed, the Fund records a realized gain or loss equal to the difference between the proceeds of the closing transaction and the Fund’s basis in the contract.
Purchased Options
The Fund may purchase put or call options. When the Fund purchases an option, an amount equal to the premium paid is recorded as an asset and is subsequently marked-to-market. Premiums paid for purchasing options that expire unexercised are recognized on the expiration date as realized losses. If an option
is exercised, the premium paid is subtracted from the proceeds of the sale or added to the cost of the purchase to determine whether the Fund has realized a gain or loss on the related investment transaction. When the Fund enters into a closing transaction, the Fund will realize a gain or loss depending upon whether the amount from the closing transaction is greater or less than the premium paid.
Written Options
The Fund may write put or call options. When the Fund writes an option, an amount equal to the premium received is recorded as a liability and is subsequently marked-to-market. Premiums received for writing options that expire unexercised are recognized on the expiration date as realized gains. If an option
is exercised, the premium received is subtracted from the cost of the purchase or added to the proceeds of the sale to determine whether the account has realized a gain or loss on the related investment transaction. When the Fund enters into a closing transaction, the Fund will realize a gain or loss depending upon whether the amount from the closing transaction is less or greater than the premium received.
Short Sales
When the Fund sells short, it may borrow the security sold short and deliver it to the broker-dealer through which it sold short as collateral for its obligation to deliver the security upon conclusion of the sale. Additionally, the Fund generally is required to deliver cash or securities as collateral for the Fund’s obligation
to return the borrowed security. The Fund may have to pay a fee to borrow the particular securities and may be obligated to pay over any payments received on such borrowed securities. A gain, limited to the price at which the Fund sold the security short, or a loss, unlimited as to dollar amount, will be recognized upon the termination of a short sale if the exit price is less or greater than the proceeds originally received.
11
HFH ShortPLUS MASTER FUND, LTD. (In Liquidation)
March 31, 2009 (unaudited)
Notes to Financial Statements
(Expressed in United States Dollars)
Financing Transactions
The Fund enters into repurchase agreements as a borrower (securities sold under agreements to repurchase) and as a lender (securities purchased under agreements to resell). All repurchase agreements are carried at their contractual amounts on the Statement of Assets and Liabilities, and the accrued income (expense) is recorded
separately. Securities sold under agreements to repurchase include sell-buy financing transactions while securities purchased under agreements to resell include buy-sell financing transaction.
Securities Sold Under Agreements to Repurchase
The Fund monitors collateral fair values relative to the amounts due under the agreements, including accrued interest, throughout the lives of the agreements, and when necessary, requires transfer of cash or securities in order to manage exposure and liquidity. In connection with such agreements, if the counterparty defaults
or enters an insolvency proceeding, realization or return of the collateral to the Fund may be delayed or limited.
At March 31, 2009, the Fund had no securities sold under agreements to repurchase.
Securities Purchased Under Agreements to Resell
Transactions involving purchases of securities under agreements to resell are treated as collateralized financial transactions and are recorded at their contracted resell amounts. Securities purchased under agreements to resell are generally collateralized principally by U.S. government and agency securities. The Fund
takes possession of such underlying collateral, monitors its fair value relative to the amounts due under the agreements, including accrued interest, throughout the lives of the agreements, and when necessary, may require a transfer of additional cash or securities in order to manage exposure and liquidity. In connection with such agreements, if the counterparty defaults or enters an insolvency proceeding, realization or return of the funds to the Fund may be delayed or limited.
At March 31, 2009, the Fund had no securities purchased under agreements to resell.
Translation of Foreign Currency
Assets and liabilities denominated in foreign currencies are translated into United States dollar amounts at the year-end exchange rates. Transactions denominated in foreign currencies, including purchases and sales of investments,
and income and expenses, are translated into United States dollar amounts on the transaction date. Adjustments arising from foreign currency transactions are reflected in the statement of operations.
The Fund does not isolate that portion of the results of operations arising from the effect of changes in foreign exchange rates on investments from fluctuations arising from changes in market prices of investments held. Such fluctuations are included in net gain (loss) on investments in the statement of operations.
12
HFH ShortPLUS MASTER FUND, LTD. (In Liquidation)
March 31, 2009 (unaudited)
Notes to Financial Statements
(Expressed in United States Dollars)
Investment Transactions and Related Investment Income
Investment transactions are accounted for on a trade-date basis. Interest is recognized on the accrual basis.
Offsetting of Amounts Related to Certain Contracts
The Fund has elected not to offset fair value amounts recognized for cash collateral receivables and payables against fair value amounts recognized for net derivative positions executed with the same counterparty under the same master netting arrangement. At March 31, 2009, the Fund had no cash collateral receivables and payables with derivative
counterparties covered under the same master netting arrangement.
Income Taxes
The Fund is a Cayman Islands exempted company. Under the current laws of the Cayman Islands, there are no income, estate, transfer, sale or other taxes payable by the Fund. The Fund is taxed as a partnership for U.S. Federal income tax purposes, and as such, is not subject to income taxes; each investor may be individually
liable for income taxes, if any, on its share of the Fund's net taxable income. The Fund trades securities for its own account and, as such, investors are generally not subject to U.S. tax on such earnings (other than certain withholding taxes indicated below). The Investment Manager intends to conduct the business of the Fund to the maximum extent practicable so that the Fund's activities do not constitute a U.S. trade or business. Interest and other income received by
the Fund from sources within the United States may be subject to, and reflected net of, United States withholding tax at the rate of 30%. Interest, dividend and other income realized by the Fund from non-U.S. sources and capital gains realized on the sale of securities of non-U.S. issuers may be subject to withholding and other taxes levied by the jurisdiction in which the income is sourced.
The Fund has adopted FASB Staff Position No. FIN 48-3, which allows certain nonpublic entities to defer the effective date of FASB Interpretation No. 48, “Accounting for Uncertainty in Income Taxes” (“FIN 48”), until the annual financial statements for fiscal years beginning after December 15, 2008. The
Investment Manager has elected to take advantage of this deferral. Based on its continued analysis, the Investment Manager has determined that the adoption of FIN 48 will not have a material impact to the Fund’s financial statements. However, the Investment Manager's conclusions regarding FIN 48 may be subject to review and adjustment at a later date based on factors including, but not limited to, further implementation guidance, and on-going analyses of tax laws, regulations and interpretations
thereof. The Fund’s accounting policy for evaluating uncertain tax positions during financial statement periods subject to the deferral of FIN 48 is based on the recognition and disclosure criteria for loss contingencies under SFAS No. 5 “Accounting for Contingencies”.
13
HFH ShortPLUS MASTER FUND, LTD. (In Liquidation)
March 31, 2009 (unaudited)
Notes to Financial Statements
(Expressed in United States Dollars)
FIN 48 requires the Investment Manager to determine whether a tax position of the Fund is more likely than not to be sustained upon examination by the applicable taxing authority, including resolution of any related appeals or litigation processes, based on the technical merits of the position. The tax benefit to be recognized is measured
as the largest amount of benefit that is greater than fifty percent likely of being realized upon ultimate settlement which could result in the Fund recording a tax liability that would reduce net assets. FIN 48 must be applied to all existing tax positions upon initial adoption and the cumulative effect, if any, is to be reported as an adjustment to net assets upon adoption.
Use of Estimates
The preparation of financial statements in conformity with accounting principles generally accepted in the United States of America requires the Fund’s management to make estimates and assumptions that affect the amounts disclosed in the financial statements. Actual results could differ from those estimates.
|
2.
|
Fair value measurements
|
The Fund’s assets and liabilities recorded at fair value have been categorized based upon a fair value hierarchy in accordance with SFAS No. 157. See Note 1 for a discussion of the Fund’s policies.
The following table presents additional information about Level 3 assets and liabilities measured at fair value. Both observable and unobservable inputs may be used to determine the fair value of positions that the Fund has classified within the Level 3 category. As a result, the unrealized
gains and losses for assets and liabilities within the Level 3 category may include changes in fair value that were attributable to both observable (e.g., changes in market interest rates) and unobservable (e.g., changes in
unobservable long-dated volatilities) inputs.
Changes in Level 3 assets and liabilities measured at fair value for the period ended March 31, 2009 (in thousands) are as follows:
14
HFH ShortPLUS MASTER FUND, LTD. (In Liquidation)
March 31, 2009 (unaudited)
Notes to Financial Statements
(Expressed in United States Dollars)
|
Level 3
|
||||||||||||||||||||||||
|
Beginning
Balance
January 1, 2009
|
Realized &
Unrealized
Gains
(Losses)
|
Purchases
Sales and
Settlements
|
Net
Transfers
In and/or
(Out) of
|
Ending
Balance
March 31,
2009
|
Changes in
Unrealized
Gains (Losses)
For Investments
still held at
March 31,
2009
|
|||||||||||||||||||
|
Assets
|
||||||||||||||||||||||||
|
Investments in securities
at fair value
|
$ | 5,813 | $ | - | $ | (5,813) | $ | - | $ | - | $ | - | ||||||||||||
|
Credit default swap contracts
at fair value
|
22,082 | (5,087 | ) | (16,995 | ) | - | - | - | ||||||||||||||||
| $ | 27,895 | $ | (5,087 | ) | $ | (22,808 | ) | $ | - | $ | - | $ | - | |||||||||||
|
Liabilities
|
||||||||||||||||||||||||
|
Credit default swap contracts
at fair value
|
14,686 | (3,812 | ) | (10,874 | ) | - | - | - | ||||||||||||||||
| $ | 14,686 | $ | (3,812 | ) | $ | (10,874 | ) | $ | - | $ | - | $ | - | |||||||||||
Realized and unrealized gains and losses are included in net gain (loss) on securities in the statement of operations.
|
3.
|
Due to broker
|
Amounts due to broker represent interest payable on terminated Credit Default Swaps.
In the normal course of business, substantially all of the Fund’s securities transactions, money balances and security positions are transacted with a broker. The Fund is subject to credit risk to the extent any broker with which it conducts business is unable to fulfill contractual obligations on its behalf. The
Fund’s management monitors the financial condition of such brokers and does not anticipate any losses from these counterparties.
Throughout 2009, the Fund primarily transacted with the following brokers J.P. Morgan, Goldman Sachs, Deutsche Bank, Citibank, Credit Suisse and Merrill Lynch.
|
4.
|
Financial instruments with off-balance sheet risk and other risks
|
The Fund invests on a leveraged basis in various financial instruments and is exposed to market risks resulting from changes in the fair value of the instruments. The Statement of Assets and Liabilities may include the fair value of contractual commitments involving forward settlements, futures contracts and swap transactions
as well as investments in securities sold short. These instruments involve elements of market risk in excess of amounts reflected on the Statement of Assets and Liabilities. Derivative financial statements are used by the Fund to help manage such market risk and to take an active long or short position in the market. Should interest rates move unexpectedly, the Fund may not achieve the anticipated benefits of the hedging instruments and may realize a loss. Further,
the use of such derivative instruments involves the risk of imperfect correlation in movements in the price of the instruments, interest rates and the underlying hedged assets.
15
HFH ShortPLUS MASTER FUND, LTD. (In Liquidation)
March 31, 2009 (unaudited)
Notes to Financial Statements
(Expressed in United States Dollars)
The investment characteristics of mortgage-backed and asset-backed securities differ from traditional debt securities. Among the major differences are that interest and principal payments are made more frequently, usually monthly, and that the underlying residential or commercial mortgage loans or other assets generally may be
prepaid at any time. Maturities on mortgage-backed and asset-backed securities represent stated maturity dates. Actual maturity dates may differ based on prepayment dates.
The Fund is exposed to credit-related losses in the event of nonperformance by counterparties to financial instruments. The maximum credit exposure related to the derivative financial instruments of the Fund is equal to the fair value of the contracts with positive fair values as of March 31, 2009. It is the policy
of the Fund to transact the majority of its securities and contractual commitment activity with broker-dealers, banks and regulated exchanges that the Investment Manager considers to be well established.
The Fund’s short-biased strategy depends in large measure upon the ability of the Investment Manager to identify ABS that experience future credit losses arising from the defaults by obligors on the related mortgage loans. This is the opposite approach from that employed in traditional long-bias credit investment strategies
that generally seek to avoid credit losses on investments purchased on the basis of fundamental credit analysis, or on other bases.
There can be no assurance that the Investment Manager’s assessments of the likelihood of default and losses on specific ABS transactions will be accurate or that the predictive strengths of the Investment Manager’s models and practices will not decline in the future. Even if ABS default and loss rates increase generally
in the future relative to the rates observed in the past, the Fund’s return objectives will not be met if the Fund has bought credit protection or otherwise shorted securities that do not experience such higher default and loss rates.
The Fund’s strategy also includes long investments that are intended to generate positive income during the first several years of the Fund, in order to partially offset the negative carry of the short positions. Losses on these long positions could produce losses for the Fund and could result in the failure of the Fund
to achieve the intended purpose of offsetting the CDS premium costs.
An investment in the Fund entails risk. There can be no assurance that the Fund will achieve its investment objective or that the Fund’s strategies will be successful. There exists a possibility that an investor could suffer a substantial loss as a result of an investment in the Fund.
The success of any investment activity is influenced by general economic conditions that may affect the level and volatility of equity prices, credit spreads, interest rates and the extent and timing of investor participation in the markets for both equity and interest-rate-sensitive securities. Unexpected volatility or illiquidity
in the markets in which the Fund directly or indirectly holds positions could impair the Fund’s ability to carry out its business and could cause the Fund to incur losses.
Depending on market conditions, reliable pricing information will not always be available from any source. Prices quoted by different sources are subject to material variation.
16
HFH ShortPLUS MASTER FUND, LTD. (In Liquidation)
March 31, 2009 (unaudited)
Notes to Financial Statements
(Expressed in United States Dollars)
Credit-sensitive tranches of ABS are exposed to credit risk arising from possible defaults of the underlying loans and recovery rates on those liquidated loans. The default rates of loans backing these securities is dependent on a number of factors including the quality and characteristics of the loans, national and regional
economic growth, real estate values, the level of interest rates, changes in the availability of mortgage financing and other factors. Recovery values following a default will be dependent largely on regional and national real estate values among other things; although real estate values may depend on other economic variables.
The rate of prepayments on the loans collateralizing a subordinate ABS tranche will generally have a significant effect on the amount of obligor defaults such a tranche can face before suffering losses of interest or principal. The Investment Manager believes it is impossible to accurately predict prepayment rates because prepayment
rates are heavily influenced by equally unpredictable interest rates. Consequently, while the Investment Manager seeks to explore the potential effects of a wide range of possible prepayment rates for securities or CDS it purchases or sells, there can be no assurance that this analysis will exhaust the possible paths prepayments could take, or that the effects of any particular prepayment rate scenario will be evaluated correctly in respect of a specific ABS tranche or CDS.
A decline in the fair value of the Fund’s portfolio of assets may limit the Investment Manager’s ability to borrow, or may result in lenders initiating margin calls (i.e., requiring a pledge of cash or additional assets to re-establish the ratio of the amount of the borrowing to the value of the collateral). The Investment
Manager could be required to sell assets at distressed prices under adverse market conditions in order to satisfy the requirements of the lenders. A default by the Fund under its collateralized borrowings could also result in a liquidation of the collateral by the lender, including any cross-collateralized assets, and a resulting loss of the difference between the value of the collateral and the amount borrowed.
As discussed in Note 1, the Fund’s investors are two Feeder Funds managed by the Investment Manager. The Fund could be materially affected by significant subscriptions and redemptions from the underlying investors of these Feeder Funds.
|
5.
|
Capital share transactions
|
The authorized share capital of the Fund consists of 5,000,000 shares having a par value of $0.01 (U.S.) per share. At March 31, 2009, 188.08 shares were issued and outstanding.
Common shares are no longer offered since the Fund is in Liquidation
Any holder of common shares has the right, in accordance with and subject to the applicable provisions of the memorandum of association of the Fund and the laws of the Cayman Islands, to have all or a portion of their shares redeemed on a date determined by the Directors.
17
HFH ShortPLUS MASTER FUND, LTD. (In Liquidation)
March 31, 2009 (unaudited)
Notes to Financial Statements
(Expressed in United States Dollars)
At March 31, 2009, all outstanding shares are held by the Feeder Funds.
The following table reconciles share transactions for the period ended March 31, 2009:
|
Shares
|
||||
|
Shares outstanding, beginning of year
|
468.89 | |||
|
Shares issued
|
- | |||
|
Shares redeemed
|
(280.81 | ) | ||
|
Shares outstanding, March 31,2009
|
188.08 | |||
Shareholders have redemption rights which contain certain restrictions with respect to rights of redemption of shares as specified in the offering memorandum.
|
6.
|
Director fee
|
The following persons are independent non-executive Directors of the Fund:
|
·
|
David Bree
|
|
·
|
Peter Burnim
|
All members of the Board of Directors are reimbursed for their out-of-pocket expenses incurred in connection with the performance of their duties and each receives an annual fee of approximately $5,000. No Directors have a shareholder interest in the Fund or have an interest, direct or indirect, in any transaction affecting
the Fund during the period ended March 31, 2009, which is unusual in nature or significant to the business of the Fund. No Director has any contracts of significance with the Fund.
|
7.
|
Administrative fee
|
Admiral Administration, Ltd. (Cayman Islands) (the “Administrator”) serves as the Fund’s Administrator and performs certain administrative and clerical services on behalf of the Fund.
18
HFH ShortPLUS MASTER FUND, LTD. (In Liquidation)
March 31, 2009 (unaudited)
Notes to Financial Statements
(Expressed in United States Dollars)
|
8.
|
Financial highlights
|
Financial highlights for the period ended March 31, 2009 are as follows:
|
Shares
|
||||
|
Per share operating performance
|
||||
|
Net asset value, beginning of year
|
$
|
403,554.21
|
||
|
Income (loss) from investment operations:
|
||||
|
Net investment income (loss)
|
(429.79)
|
|||
|
Net gain (loss) on investments
|
(6,812.64)
|
|||
|
Total from investment operations
|
(7,242.43)
|
|||
|
Net asset value, end of year
|
$
|
396,311.78
|
||
|
Total return
|
(1.8)
|
%
|
||
|
Ratio to average net assets
|
||||
|
Total operating expenses
|
0.1
|
%
|
||
|
Total operating expenses excluding interest expense
|
0.1
|
%
|
||
|
Net investment income (loss)
|
(0.1)
|
%
|
||
Financial highlights are calculated for common shares. An individual investor’s return and ratios may vary based on participation in new issues, private investments, and the timing of capital share transactions.
|
9.
|
Subsequent events
|
The Fund will be dissolved on March 15, 2010 according to Cayman law.
19
HFH ShortPLUS Fund, L.P.
(In Liquidation)
Statement of Financial Condition
|
Year Ended December 31, 2008
|
||||
|
Assets
|
||||
|
Investment in HFH ShortPLUS Master Fund, Ltd. (In Liquidation),
at fair value
|
$ | 40,625,051 | ||
|
Cash
|
2,673 | |||
| $ | 40,627,724 | |||
|
Liabilities and partners' capital
|
||||
|
Liabilities
|
||||
|
Capital withdrawals payable
|
$ | 19,969,871 | ||
|
Accrued expenses
|
134,999 | |||
|
Total liabilities
|
20,104,870 | |||
|
Partners' capital
|
20,522,854 | |||
| $ | 40,627,724 | |||
See accompanying notes to financial statements.
1
HFH ShortPLUS Fund, L.P.
(In Liquidation)
Statement of Operations
|
Year Ended December 31, 2008
|
||||
|
Net investment income (loss) allocated from
|
||||
|
HFH ShortPLUS Master Fund, Ltd. (In Liquidation)
|
||||
|
Interest income
|
$ | 2,542,190 | ||
|
Interest expense
|
(864,798 | ) | ||
|
Professional fees and other
|
(227,559 | ) | ||
|
Administrative fee
|
(40,223 | ) | ||
|
Total net investment income (loss) allocated from
|
||||
|
HFH ShortPLUS Master Fund, Ltd. (In Liquidation)
|
1,409,610 | |||
|
Fund income
|
||||
|
Interest
|
1,912 | |||
|
Fund expenses
|
||||
|
Management fee
|
601,176 | |||
|
Professional fees and other
|
125,733 | |||
|
Total Fund expenses
|
726,909 | |||
|
Net investment income
|
684,613 | |||
|
Realized and unrealized gain (loss) on investments allocated from
|
||||
|
HFH ShortPLUS Master Fund, Ltd. (In Liquidation)
|
||||
|
Net realized gain (loss) on securities
|
(2,200,823 | ) | ||
|
Net realized gain (loss) on credit default swap contracts
|
59,941,394 | |||
|
Net change in unrealized appreciation or (depreciation) on securities
|
(887,582 | ) | ||
|
Net change in unrealized appreciation or (depreciation) on credit default swap
contracts
|
(45,623,955 | ) | ||
|
Net gain (loss) from foreign exchange transactions
|
(23,115 | ) | ||
|
Net gain (loss) on investments
|
11,205,919 | |||
|
Net income
|
11,890,532 | |||
|
Less reallocation to the General Partner
|
1,246,505 | |||
|
Net income available for distribution to all partners
|
$ | 10,644,027 | ||
See accompanying notes to financial statements.
2
HFH ShortPLUS Fund, L.P.
(In Liquidation)
Statement of Changes in Partners’ Capital
|
Year Ended December 31, 2008
|
||||||||||||
|
General
|
Limited
|
|||||||||||
|
Partner
|
Partners
|
Total
|
||||||||||
|
Partners' capital,
beginning of year
|
$ | 6,565,358 | $ | 83,295,107 | $ | 89,860,465 | ||||||
|
Early withdrawal fees
|
13 | 210,664 | 210,677 | |||||||||
|
Capital withdrawals
|
(7,260,220 | ) | (74,178,600 | ) | (81,438,820 | ) | ||||||
|
Allocation of net income
|
||||||||||||
|
Pro rata allocation
|
6,126 | 11,884,406 | 11,890,532 | |||||||||
|
Reallocation to General Partner
|
1,246,505 | (1,246,505 | ) | - | ||||||||
| 1,252,631 | 10,637,901 | 11,890,532 | ||||||||||
|
Partners' capital,
end of year
|
$ | 557,782 | $ | 19,965,072 | $ | 20,522,854 | ||||||
See accompanying notes to financial statements.
3
HFH ShortPLUS Fund, L.P.
(In Liquidation)
Statement of Cash Flows
|
Year Ended December 31, 2008
|
||||
|
Cash flows from operating activities
|
||||
|
Net income
|
$
|
11,890,532
|
||
|
Adjustments to reconcile net income to net cash provided by
|
||||
|
operating activities:
|
||||
|
Net income allocated from HFH ShortPLUS Master Fund, Ltd. (In Liquidation)
|
(12,615,529)
|
|||
|
Changes in operating assets and liabilities:
|
||||
|
Proceeds from the sales of shares from
|
||||
|
HFH ShortPLUS Master Fund, Ltd. (In Liquidation)
|
55,914,309
|
|||
|
Other assets
|
140
|
|||
|
Accrued expenses
|
112,498
|
|||
|
Net cash provided by operating activities
|
55,301,950
|
|||
|
Net cash flows used in financing activities,
|
||||
|
Capital withdrawals, net of capital withdrawals payable and early withdrawal fees
|
(61,258,272)
|
|||
|
Net change in cash
|
|
(5,956,322)
|
||
|
Cash
, beginning of year
|
5,958,995
|
|||
|
Cash
, end of year
|
$
|
2,673
|
||
See accompanying notes to financial statements.
4
HFH ShortPLUS Fund, L.P. (In Liquidation)
December 31, 2008
Notes to Financial Statements
1. Nature of operations and summary of significant accounting policies
Nature of Operations
HFH ShortPLUS Fund, L.P. (the “Partnership”) is a Delaware limited partnership and commenced operations on January 2, 2007. The Partnership invests substantially all of its investable assets through a “master-feeder” structure in HFH ShortPLUS Master Fund, Ltd. (the “Master Fund”), a Cayman
Islands exempted company that invests and trades a short-biased portfolio of asset-backed securities (“ABS”) that the Investment Manager believes are most likely to produce high returns during periods of adverse credit performance for residential mortgages, and for mortgage-backed securities (“MBS”) and ABS. Returns will come from two principal sources: (i) market value changes, arising from changes in credit spreads on the Master Fund’s short positions; and
(ii) credit default payments from counterparties on credit default swaps (“CDS”) or other derivatives in credit sensitive mortgage and asset-backed securities, consumer debt and other assets. The Partnership’s investment objective is the same as that of the Master Fund. The financial statements of the Master Fund are included elsewhere in this report and should be read in conjunction with the Partnership’s financial statements. Highland Financial Holdings,
LLC (the “General Partner”) serves as the General Partner and Highland Financial Holdings Group, LLC (“Investment Manager”) serves as the investment manager of the Partnership.
The Master Fund is also managed by the Investment Manager. Valuation of the investments held by the Master Fund is discussed in the notes to the financial statements of the Master Fund included elsewhere in this report. The percentage of the Master Fund’s net assets owned by the Partnership at December 31,
2008 was approximately 21.5%.
In accordance with the Partnership’s documents, the General Partner has formalized a plan of liquidation to liquidate the Partnership in an orderly manner, and as a result, changed its basis of accounting from the going concern to the liquidation basis whereby assets and liabilities are stated at their estimated settlement amounts
and all costs of liquidation have been recognized. The adoption of the liquidation basis of accounting did not have a material effect on the carrying values of assets and liabilities as of December 31, 2008. The residual 50% of the capital held by the remaining investors in the Partnership will be distributed on or about March 31, 2009. The distribution amount which dollars and shares are not currently fixed and determinable approximate $19,970,000. In addition, a new
entity, HFH ShortPLUS Master Fund Liquidating Trust was established for purposes of receiving cash flows on securities that were distributed in-kind.
Basis of Presentation
The financial statements have been prepared in conformity with accounting principles generally accepted in the United States of America.
5
HFH ShortPLUS Fund, L.P. (In Liquidation)
December 31, 2008
Notes to Financial Statements
Valuation of Investment in HFH ShortPLUS Master Fund, Ltd.
The Partnership records its investment in the Master Fund at fair value based on the net asset value of the Master Fund. Valuation of instruments held by the Master Fund is discussed in Note 1 of the Master Fund’s financial statements.
Income and Expense Recognition
The Partnership records its proportionate share of the Master Fund’s investment income/loss, expenses and realized and unrealized gains and losses. The Master Fund’s income and expense recognition and allocation policies are discussed in Note 1 of the Master Fund’s financial statements.
Interest income of the Partnership’s cash balance is accrued as earned. Expenses that are directly attributable to the Partnership are recorded on the accrual basis as incurred.
Income Taxes
The Partnership is not a taxable entity for federal, state or local income tax purposes; such taxes are the responsibility of the individual partners. Accordingly, no provision has been made in the accompanying financial statements for any federal, state or local income taxes.
On December 30, 2008, the FASB issued FIN 48-3, Effective Date of FASB Interpretation No. 48 for Certain Nonpublic Enterprises ("FSP"), which allows the Partnership to defer the adoption of FIN 48 until periods beginning after December 15, 2008. The General Partner has elected to take advantage of this deferral. Based
on its continued analysis, the General Partner has determined that the adoption of FIN 48 will not have a material impact on the Partnership’s financial statements. However, the General Partner's conclusions regarding FIN 48 may be subject to review and adjustment at a later date based on factors including, but not limited to, further implementation guidance and on-going analyses of tax laws, regulations and interpretations thereof. The Partnership’s accounting policy for evaluating
uncertain tax positions during financial statement periods subject to the deferral of FIN 48 is based on the recognition and disclosure criteria for loss contingencies under SFAS No. 5 “Accounting for Contingencies”.
FIN 48 requires the General Partner to determine whether a tax position of the Partnership is more likely than not to be sustained upon examination by the applicable taxing authority, including resolution of any related appeals or litigation processes, based on the technical merits of the position. The tax benefit to be recognized
is measured as the largest amount of benefit that is greater than fifty percent likely of being realized upon ultimate settlement which could result in the Partnership recording a tax liability that would reduce net assets. FIN 48 must be applied to all existing tax positions upon initial adoption and the cumulative effect, if any, is to be reported as an adjustment to partners’ capital upon adoption.
6
HFH ShortPLUS Fund, L.P. (In Liquidation)
December 31, 2008
Notes to Financial Statements
Use of Estimates
The financial statements are prepared in accordance with accounting principles generally accepted in the United States of America (“U.S. GAAP”). The preparation of financial statements in accordance with U.S. GAAP requires management to make estimates and assumptions that affect the reported amounts and disclosures
in the financial statements. Actual results could differ from these estimates.
2. Partners’ capital
The minimum initial and subsequent capital contributions (each a “Capital Contribution”) in the Partnership are $5,000,000 and $1,000,000, respectively. The Investment Manager may waive or reduce the minimum capital contributions in its sole discretion. The General Partner admitted new Limited Partners
and permitted Limited Partners to make additional capital contributions as of the first business day of each calendar month, or at any other time in the General Partner’s sole discretion.
Subject to the lock-up period and early withdrawal fee, Limited Partners had the right to require the Partnership to withdraw all or any portion of their investment by delivering written notice to the General Partner not less than 90 days prior to the end of any calendar quarter, or at such other times as the General Partner determined
in its sole discretion. The General Partner reserved the right to waive or reduce the notice period in its sole discretion. Notwithstanding anything to the contrary, a Limited Partner could not withdraw each capital contribution (and any appreciation thereon) until after the 12 month period (the “Lock-up Period”) following the date of such contribution, without the prior consent of the General Partner, which may have been granted or denied in the General Partner’s sole
discretion.
Limited Partners who withdraw a Capital Contribution after the Lock-up Period with respect to such Capital Contribution but less than 24 months after purchasing such capital contribution will be charged an early withdrawal fee equal to 5% of the withdrawal amount. Any early withdrawal fee will be payable to the Partnership and
is subject to the incentive allocation described in Note 3. The General Partner reserves the right, in its sole discretion, to waive or reduce the early withdrawal fee on a case-by-case basis. Subject to the Partnership’s right to establish reserves, a minimum of 95% of the withdrawals proceeds will generally be paid to the withdrawing Limited Partner within 15 business days after the corresponding withdrawal date, with the balance payable (without interest) within 90 days of the corresponding
withdrawal date. However, payments to withdrawing Limited Partners may be subject to further delay or may be suspended.
In the event that withdrawal requests are received representing in the aggregate more than 10% of the total Net Asset Value of the Partnership on any withdrawal date, the Partnership is entitled to reduce ratably and pro rata amongst all Limited Partners seeking to withdraw interests on the withdrawal date and to carry out only sufficient
withdrawals, which in the aggregate, amount to 10% of the total Net Asset Value of the Partnership on such withdrawal date.
7
HFH ShortPLUS Fund, L.P. (In Liquidation)
December 31, 2008
Notes to Financial Statements
3. Allocation of net income (loss) and incentive allocation
Net investment income and gains and losses are allocated to the partners on a monthly basis, based on the partners’ proportionate share of capital in the Partnership at the beginning of the month.
The General Partner receives an incentive allocation equal to 20% of net capital appreciation (as defined in the limited partnership agreement) credited to the capital account of each limited partner, less management fees. The incentive allocation will be deducted from the capital account of such limited partner and reallocated
to the General Partner’s capital account. At the discretion of the General Partner, this rate may be reduced for certain Limited Partners. If there is a loss for the fiscal period, such loss is carried forward to future periods and no incentive allocations will be made to the General Partner until prior fiscal period losses are recovered. For the year ended December 31, 2008, the General Partner was allocated $1,246,505 in incentive allocations.
4. Management fee and other related party transactions
The Investment Manager receives a quarterly management fee in arrears, equal to 0.50% (2% per annum) of each Limited Partner’s capital account. At the discretion of the General Partner, this rate may be reduced for certain Limited Partners and affiliated fund investments. For the year ended December 31,
2008, the Investment Manager earned a management fee of $601,176 from the Partnership.
5. Off-balance sheet risk, leverage and concentration of credit risks
Off-balance sheet risk, leverage and concentration of credit risks are discussed in the Master Fund’s financial statements.
Due to the nature of the master fund/feeder fund structure, the Partnership could be materially affected by significant subscriptions and redemptions of the other feeder fund. From time to time, the Partnership may have a concentration of partners holding a significant percentage of the Partnership's partners' capital. Investment
activities of these partners could have a material impact on the Partnership. At December 31, 2008, one partner owned 97% of the total partners' capital of the Partnership
8
HFH ShortPLUS Fund, L.P. (In Liquidation)
December 31, 2008
Notes to Financial Statements
6. Capital withdrawals payable
In accordance with FASB Statement No. 150,
Accounting for Certain Financial Instruments with Characteristics of Both Liabilities and Equity, as effected by FASB Staff Position No. FAS 150-3
, withdrawals are recognized as liabilities by the Partnership, net of incentive allocations,
when the amount requested in the withdrawal notice becomes fixed. This generally occurs either at the time of the receipt of the notice, or on the last day of a fiscal period, depending on the nature of the request. As a result, withdrawals paid after the end of the year, but based upon year-end capital balances are reflected as capital withdrawals payable at December 31, 2008. Withdrawal notices received for which the dollar amount is not fixed remains in capital until the amount
is determined. Withdrawals payable may be treated as capital for purposes of allocations of gains/losses pursuant to the Partnership's governing documents. On December 31, 2008, the General Partner of the Partnership passed a resolution to wind-up the operations of the Fund and a compulsorily redeem 50% of the net asset value of the Fund (approximately $19,970,000) which is included in redemptions payable at December 31, 2008.
7. Commitments and contingencies
In the normal course of business, the Partnership enters into contracts that contain a variety of representations, warranties and general indemnifications. The Partnership’s maximum exposure under these arrangements, including future claims that may be made against the Partnership that have not yet occurred, is unknown. However,
based on the experience of the General Partner, the Partnership expects the risk of loss associated with such contracts to be remote.
8. Administrative fee
Admiral Administration, Ltd. (Cayman Islands) (the “Administrator”) serves as the Partnership’s Administrator and performs certain administrative and clerical services on behalf of the Partnership.
9
HFH ShortPLUS Fund, L.P. (In Liquidation)
December 31, 2008
Notes to Financial Statements
9. Financial highlights
Financial highlights for the year ended December 31, 2008 are as follows:
|
Total return
|
||||
|
Total return before reallocation to General Partner
|
16.6 | % | ||
|
Reallocation to General Partner
|
(1.7 | ) | ||
|
Total return after reallocation to General Partner (a)
|
14.9 | % | ||
|
Ratio to average limited partners' capital
|
||||
|
Expenses (including interest) (b)
|
3.3 | % | ||
|
Reallocation to General Partner
|
2.2 | |||
|
Expenses and reallocation to General Partner
|
5.5 | % | ||
|
Expenses excluding interest expense (c)
|
1.8 | % | ||
|
Net investment income (d)
|
1.2 | % | ||
|
(a)
|
Total return is calculated for aggregate limited partners’ capital, exclusive of the General Partner, taken as a whole and adjusted for cash flows related to capital contributions and withdrawals during the year. An individual limited partner’s return may differ depending on the timing of contributions and withdrawals, as well as
varying fee structures.
|
|
(b)
|
The operating expense ratio is based on the expenses allocated to each partner prior to the effects of any incentive allocation. For the purpose of this calculation, operating expenses include expenses incurred by the Partnership directly as well as expenses allocated from the Master Fund. Expense ratios are calculated over average
net assets. Expense ratio excluding the effect of allocated expenses from the Master Fund would be 1.3%. The expense ratios attributable to an individual partner’s account may vary based on different management fee and incentive allocation arrangements and the timing of capital transactions.
|
|
(c)
|
The expenses excluding interest expense ratio is based on the expenses allocated to each partner. For the purpose of this calculation, operating expenses include expenses incurred by the Partnership directly as well as expenses allocated from the Master Fund, excluding interest expense and the reallocation to the General Partner. Expense
ratios are calculated over average net assets. The expense ratios attributable to an individual partner’s account may vary based on different management fee arrangements and the timing of capital transactions.
|
10
HFH ShortPLUS Fund, L.P. (In Liquidation)
December 31, 2008
Notes to Financial Statements
|
(d)
|
The net investment income ratio is based on the net investment income allocated to a limited partner prior to the effect of an incentive allocation and is exclusive of unrealized and realized gains and losses. The net investment income ratio attributable to an individual partner’s account may vary based on timing of capital transactions
and different management fee arrangements.
|
10. Subsequent events
As of February 2, 2009, the Custodian for the Partnership changed from J.P. Morgan to Wells Fargo Bank, N.A.
11
HFH ShortPLUS MASTER FUND, LTD.
(In Liquidation)
Statement of Assets and Liabilities
(Expressed in United States Dollars)
|
Year Ended December 31, 2008
|
||||
|
Assets
|
||||
|
Investments in securities, at fair value
|
||||
|
(cost $69,721,286)
|
$ | 5,812,984 | ||
|
Credit default swap contracts, at fair value
|
||||
|
(upfront fee payments $9,912,500)
|
22,081,724 | |||
|
Securities purchased under agreements to resell, at fair value
|
32,338,000 | |||
|
Cash and cash equivalents
|
144,185,058 | |||
|
Margin cash paid to counterparties
|
11,986,130 | |||
|
Other assets
|
65,455 | |||
|
Total assets
|
216,469,351 | |||
|
Liabilities
|
||||
|
Margin cash received from counterparties
|
12,088,168 | |||
|
Credit default swap contracts, at fair value
|
||||
|
(upfront fee receipts $6,300,000)
|
14,685,603 | |||
|
Accrued expenses and other payables
|
441,484 | |||
|
Due to broker
|
33,439 | |||
|
Total liabilities
|
27,248,694 | |||
|
Net assets
|
$ | 189,220,657 | ||
|
Net asset value per share, based on net assets of $189,220,657
|
||||
|
and 468.89 shares outstanding
|
$ | 403,554.21 | ||
See accompanying notes to financial statements.
1
HFH ShortPLUS MASTER FUND, LTD.
(In Liquidation)
Statement of Operations
(Expressed in United States Dollars)
|
Year Ended December 31, 2008
|
||||
|
Investment income
|
||||
|
Interest
|
$ | 9,210,975 | ||
|
Expenses
|
||||
|
Interest
|
3,071,390 | |||
|
Professional fees and other
|
890,215 | |||
|
Administrative fee
|
158,920 | |||
|
Total expenses
|
4,120,525 | |||
|
Net investment income (loss)
|
5,090,450 | |||
|
Realized and unrealized gain (loss) on investments
|
||||
|
Net realized gain (loss) on securities
|
(9,307,178 | ) | ||
|
Net realized gain (loss) on credit default swap contracts
|
225,379,191 | |||
|
Net change in unrealized appreciation or (depreciation) on securities
|
(2,534,158 | ) | ||
|
Net change in unrealized appreciation or (depreciation) on credit default swap
contracts
|
(174,353,921 | ) | ||
|
Net gain (loss) from foreign exchange transactions
|
(107,994 | ) | ||
|
Net gain (loss) on investments
|
39,075,940 | |||
|
Net change in net assets resulting from operations
|
$ | 44,166,390 | ||
See accompanying notes to financial statements.
2
HFH ShortPLUS MASTER FUND, LTD.
(In Liquidation)
Statement of Changes in Net Assets
(Expressed in United States Dollars)
|
Year Ended December 31, 2008
|
||||
|
Operations
|
||||
|
Net investment income (loss)
|
$ | 5,090,450 | ||
|
Net realized gain (loss) on securities
|
(9,307,178 | ) | ||
|
Net realized gain (loss) on credit default swaps
|
225,379,191 | |||
|
Net change in unrealized appreciation or (depreciation) on securities
|
(2,534,158 | ) | ||
|
Net change in unrealized appreciation or (depreciation) on credit default swap
contracts
|
(174,353,921 | ) | ||
|
Net gain (loss) from foreign exchange transactions
|
(107,994 | ) | ||
|
Net change in net assets resulting from operations
|
44,166,390 | |||
|
Capital share transactions
|
||||
|
Issuance of shares
|
304,492 | |||
|
Redemption of shares
|
(176,552,945 | ) | ||
|
Net change in net assets resulting from capital share transactions
|
(176,248,453 | ) | ||
|
Net change in net assets
|
(132,082,063 | ) | ||
|
Net assets,
beginning of year
|
321,302,720 | |||
|
Net assets,
end of year
|
$ | 189,220,657 | ||
See accompanying notes to financial statements.
3
HFH ShortPLUS MASTER FUND, LTD.
(In Liquidation)
Statement of Cash Flows
(Expressed in United States Dollars)
|
Year Ended December 31, 2008
|
||||
|
Cash flows from operating activities
|
||||
|
Net change in net assets resulting from operations
|
$
|
44,166,390
|
||
|
Adjustments to reconcile net change in net assets resulting
|
||||
|
from operations to net cash provided by operating activities:
|
||||
|
Net realized gain (loss) on securities
|
9,307,178
|
|||
|
Net change in unrealized appreciation or (depreciation) on securities
|
2,534,158
|
|||
|
Changes in operating assets and liabilities:
|
||||
|
Purchases of investments in securities, at fair value
|
(41,515,670)
|
|||
|
Proceeds from sales of investments in securities, at fair value
|
36,188,013
|
|||
|
Credit default swap contracts, at fair value
|
210,366,456
|
|||
|
Securities purchased under agreements to resell, at fair value
|
26,836,000
|
|||
|
Margin cash paid to counterparties
|
(10,185,886)
|
|||
|
Dividends and interest receivable
|
(1,811,299)
|
|||
|
Other assets
|
23,679
|
|||
|
Margin cash received from counterparties
|
(206,559,962)
|
|||
|
Due to broker
|
(62,044)
|
|||
|
Accrued expenses
|
207,734
|
|||
|
Net cash provided by operating activities
|
69,494,747
|
|||
|
Cash flows from financing activities
|
||||
|
Proceeds from issuance of shares
|
304,492
|
|||
|
Payments for redemption of shares
|
(176,552,945)
|
|||
|
Net cash used in financing activities
|
(176,248,453)
|
|||
|
Net change in cash and cash equivalents
|
|
(106,753,706)
|
||
|
Cash and cash equivalents, beginning of year
|
250,938,764
|
|||
|
Cash and cash equivalents, end of year
|
$
|
144,185,058
|
See accompanying notes to financial statements.
4
HFH ShortPLUS MASTER FUND, LTD.
(In Liquidation)
Condensed Schedule of Investments
(Expressed in United States Dollars)
|
December 31, 2008
|
|||||||||||||||||
|
Current Face /
|
Coupon
|
Maturity
|
Percentage of
|
Fair
|
|||||||||||||
|
Notional
|
Rates %
|
Date Range
|
Net Assets
|
Value
|
|||||||||||||
|
Asset-Backed Securities,
at fair value
|
|||||||||||||||||
|
Fixed Rate Home Equity
|
|||||||||||||||||
|
TMTS 04-8HES B2 (cost $407,368)
|
446,131 | 8.000 | % |
6/25/34
|
0.07 | % | $ | 131,312 | |||||||||
|
Floating Rate Home Equity
|
|||||||||||||||||
|
Bayview Financial TR 2004-D
|
1,893,329 | 2.971 |
8/28/44
|
0.10 | 190,220 | ||||||||||||
|
Morgan Stanley Cap 2007-NC A2A
|
1,615,661 | 0.551 |
6/25/37
|
0.62 | 1,181,957 | ||||||||||||
|
Total Floating Rate Home Equity
|
0.72 | 1,372,177 | |||||||||||||||
|
(cost $3,294,809)
|
|||||||||||||||||
|
Floating Rate Business Loans
|
|||||||||||||||||
|
BAYC 05-3A B3
|
594,122 | 3.471 |
11/25/35
|
0.13 | 243,915 | ||||||||||||
|
Bayview Coml Mtg TR 2006-SP1
|
7,060,000 | 4.471 |
4/25/36
|
0.76 | 1,438,475 | ||||||||||||
|
Total Floating Rate Business Loans
|
|||||||||||||||||
|
(cost $7,325,808)
|
0.89 | 1,682,390 | |||||||||||||||
|
Home Equity Residuals
|
|||||||||||||||||
|
Option One Mtg LN TR 2007-4
|
|||||||||||||||||
|
20370425 FL (cost $2,874,362)
|
3,090,711 | 0.561 |
4/25/37
|
1.39 | 2,627,105 | ||||||||||||
|
Other
(cost $55,818,939)*
|
46,136,708 | 0-8.500 | % |
1/15/35-9/08/51
|
- | - | |||||||||||
|
Total Asset-Backed Securities,
|
|||||||||||||||||
|
at fair value (cost $69,721,286)
|
3.07 | % | $ | 5,812,984 | |||||||||||||
|
* Fifteen (15) bonds with a cost of $55,818,939 had fair values of -0- at December 31, 2008.
|
See accompanying notes to financial statements.
5
HFH ShortPLUS MASTER FUND, LTD.
(In Liquidation)
Condensed Schedule of Investments (continued)
(Expressed in United States Dollars)
|
December 31, 2008
|
|||||||||||||
|
Notional
|
Termination
|
Percentage of
|
Fair
|
||||||||||
|
Amount
|
Date
|
Net Assets
|
Value
|
||||||||||
|
Swap contracts,
at fair value
|
|||||||||||||
|
Credit default swap contracts
|
|||||||||||||
|
United States
|
|||||||||||||
|
JPMAC 2005-OPTI M9
|
|||||||||||||
|
(pay 3.00%)
|
5,595,354 |
6/25/2035
|
2.80 | % | $ | 5,288,265 | |||||||
|
RFC06NC3 M9
|
|||||||||||||
|
(pay CITI 7.50%)
|
4,000,000 |
3/25/2036
|
2.10 | 3,921,978 | |||||||||
|
SAIL 2006-4 M4
|
|||||||||||||
|
(pay CS 3.75%)
|
10,000,000 |
7/25/2036
|
5.10 | 9,708,523 | |||||||||
|
Nevada GO CDS (pay .98%)
|
10,000,000 |
3/1/2017
|
0.50 | 971,094 | |||||||||
|
New Jersey GO CDS (pay .87%)
|
10,000,000 |
7/1/2019
|
0.50 | 906,641 | |||||||||
|
SHIPO 3 A2 (pay 2.60%)
|
13,971,000 |
1/18/2050
|
0.70 | 1,285,223 | |||||||||
|
Total credit default swap contracts
|
11.70 | 22,081,724 | |||||||||||
|
(upfront fee payments $9,912,500)
|
|||||||||||||
|
Credit default swap contracts
|
|||||||||||||
|
United States
|
|||||||||||||
|
SAIL 2006-4 M4
|
|||||||||||||
|
(JP Morgan (Bear) pays 5.80%)
|
(10,000,000 | ) |
7/25/2036
|
(5.20 | ) | (9,819,978 | ) | ||||||
|
RFC06NC3 M8
|
|||||||||||||
|
(CITI pays 5.00%)
|
(5,000,000 | ) |
3/25/2036
|
(2.60 | ) | (4,865,625 | ) | ||||||
|
Total credit default swap contracts
|
(7.80 | ) | (14,685,603 | ) | |||||||||
|
(upfront fee receipts $6,300,000)
|
|||||||||||||
|
Total swap contracts,
at fair value
|
3.90 | % | $ | 7,396,121 | |||||||||
|
Securities purchased under agreements to resell,
at fair value
|
|||||||||||||
|
J.P. Morgan, 1.74% - 6.00%, 4/15/2032 - 6/16/2038
(cost $32,338,000)
|
17.10 | % | $ | 32,338,000 | |||||||||
See accompanying notes to financial statements.
6
HFH ShortPLUS MASTER FUND, LTD.
(In Liquidation)
December 31, 2008
Notes to Financial Statements
(Expressed in United States Dollars)
Nature of operations and summary of significant accounting policies
Nature of Operations
HFH ShortPLUS Master Fund, Ltd. (In Liquidation) (the “Fund”) is a Cayman Islands exempted company incorporated in accordance with the Companies Law (2004 revision) which commenced operations on January 2, 2007. The Fund’s strategy is to assemble a short-biased portfolio of asset-backed securities (“ABS”)
that the Investment Manager believes are most likely to produce high returns during periods of adverse credit performance for residential mortgages, and for mortgage-backed securities (“MBS”) and ABS. Returns will come from two principal sources: (i) market value changes arising from changes in credit spreads on the Fund’s short positions; and (ii) credit default payments from counterparties on credit default swaps (“CDS”) or other derivatives.
In accordance with the Fund’s documents, the board of directors have formalized a plan of liquidation to liquidate the Fund in an orderly manner, and as a result, changed its basis of accounting from the going concern to the liquidation basis whereby assets and liabilities are stated at their estimated settlement amounts and all costs
of liquidation have been recognized. The adoption of the liquidation basis of accounting did not have a material effect on the carrying values of assets and liabilities as of December 31, 2008. The shares held by the remaining investors will be distributed on March 31, 2009. In addition, a new entity called HFH ShortPLUS Master Fund Liquidating Trust was established for purposes of receiving cash flows on securities that were distributed in-kind.
Highland Financial Holdings Group, LLC (“Investment Manager") serves as the investment manager of the Fund. The Investment Manager manages and invests the Fund’s assets and effects all security transactions on behalf of the Fund. The Fund operates under a “master fund/feeder fund” structure. HFH
ShortPLUS, Ltd. and HFH ShortPLUS Fund, L.P. (collectively, the “Feeder Funds”) invest substantially all of their investable assets in the Fund.
Basis of Presentation
The financial statements are expressed in United States dollars and have been prepared in conformity with accounting principles generally accepted in the United States of America.
Cash and Cash Equivalents
Cash and cash equivalents consist principally of cash, margin cash received from counterparties, and short term investments (treasury bills), which are readily convertible into cash and have original maturities of three months or less.
Valuation of Investments in Securities at Fair Value - Definition and Hierarchy
The Fund adopted the provisions of SFAS No. 157, “Fair Value Measurements” (“SFAS No. 157”), effective January 1, 2008. Under SFAS No. 157, fair value is defined as the price that would be received to sell an asset or paid to transfer a liability (i.e., the “exit price”) in an
orderly transaction between market participants at the measurement date.
7
HFH ShortPLUS MASTER FUND, LTD.
(In Liquidation)
December 31, 2008
Notes to Financial Statements
(Expressed in United States Dollars)
In determining fair value, the Fund uses various valuation approaches. SFAS No. 157 establishes a fair value hierarchy for inputs used in measuring fair value that maximizes the use of observable inputs and minimizes the use of unobservable inputs by requiring that the most observable inputs be used when available. Observable
inputs are those that market participants would use in pricing the asset or liability based on market data obtained from sources independent of the Fund. Unobservable inputs reflect the Fund’s assumptions about the inputs market participants would use in pricing the asset or liability developed based on the best information available in the circumstances. The fair value hierarchy is categorized into three levels based on the inputs as follows:
Level 1
- Valuations based on unadjusted quoted prices in active markets for identical assets or liabilities that the Fund has the ability to access. Valuation adjustments and block discounts are not applied to Level 1 securities. Since valuations are based
on quoted prices that are readily and regularly available in an active market, valuation of these securities does not entail a significant degree of judgment.
Level 2
- Valuations based on quoted prices in markets that are not active or for which all significant inputs are observable, either directly or indirectly.
Level 3
- Valuations based on inputs that are unobservable and significant to the overall fair value measurement.
The availability of valuation techniques and observable inputs can vary from security to security and is affected by a wide variety of factors including, the type of security, whether the security is new and not yet established in the marketplace, and other characteristics particular to the transaction. To the extent that valuation
is based on models or inputs that are less observable or unobservable in the market, the determination of fair value requires more judgment. Those estimated values do not necessarily represent the amounts that may be ultimately realized due to the occurrence of future circumstances that cannot be reasonably determined. Because of the inherent uncertainty of valuation, those estimated values may be materially higher or lower than the values that would have been used had a ready market for
the securities existed. Accordingly, the degree of judgment exercised by the Fund in determining fair value is greatest for securities categorized in Level 3. In certain cases, the inputs used to measure fair value may fall into different levels of the fair value hierarchy. In such cases, for disclosure purposes, the level in the fair value hierarchy within which the fair value measurement in its entirety falls, is determined based on the lowest level input that is significant
to the fair value measurement.
Fair value is a market-based measure considered from the perspective of a market participant rather than an entity-specific measure. Therefore, even when market assumptions are not readily available, the Fund’s own assumptions are set to reflect those that market participants would use in pricing the asset or liability
at the measurement date. The Fund uses prices and inputs that are current as of the measurement date, including periods of market dislocation. In periods of market dislocation, the observability of prices and inputs may be reduced for many securities. This condition could cause a security to be reclassified to a lower level within the fair value hierarchy.
8
HFH ShortPLUS MASTER FUND, LTD.
(In Liquidation)
December 31, 2008
Notes to Financial Statements
(Expressed in United States Dollars)
Valuation Techniques
The Investment Manager will use its reasonable discretion to value each investment by using, as a guide, a combination of (i) independent, third-party pricing sources; (ii) indications from one or more financial institutions engaged in trading the investments or securities similar to the investments being valued; (iii) transactions in the
market of the same or similar securities; and (iv) in-house models the Investment Manager maintains (the “Highland Model”). In cases where the number of indications is limited, the Investment Manager will review other factors such as the previous month’s value, whether such indication is from the same counterparty, the delta between the current value and the previous month value, relevant market data or news, the value of similar securities, recent trading information and any other
information which may be deemed relevant at the discretion of the Investment Manager. With respect to credit default swaps (“CDS”), the Investment Manager may use, if considered representative of the value of CDS positions, margin marks from the actual counterparty with whom the security was traded, or from counterparties of a similar CDS position to estimate the valuation. However, if the Investment Manager believes the exit price will be either greater or less than the current margin
mark, the Investment Manager has the discretion to revise the value accordingly.
Fair value determinations based on indications from financial institutions or margin marks from counterparties may be based on as few as a single indication/margin mark, or may be calculated as the average of more than one such indication/margin mark, which average may include recent transactions in the market or ignore outlying indications/margin
marks based on the Investment Manager’s discretion. The Investment Manager may use observable transactions in the market in determining the fair value of investments if, at the discretion of the Investment Manager, prioritization of such transactions is considered more relevant given market conditions or other factors.
The Highland Model is a proprietary system that is used to generate a price/yield based on key inputs. Cash flows for the Fund’s securities that are projected through the Highland Model, incorporate assumptions regarding potential future rates of delinquency, prepayments, defaults, collateral losses, and interest rates. On
a monthly basis, each security’s actual cash flows are compared to the previously projected cash flows. Assumptions can be modified based on significant deviations between actual cash flows and cash flows from previous projections. Discount rates may be changed based on market observations for prices and discount rates of similar securities trading in the secondary market. The following outlines the key inputs that are reevaluated on a monthly basis:
|
i.
|
Constant Default Rate (CDR) – an annualized rate of default on a group of mortgages within a collateralized product (i.e. MBS). It represents the percentage of outstanding principal balances in the pool that are in default, which typically equates to the home being past 60-day and 90-day notices and in the foreclosure process.
|
9
HFH ShortPLUS MASTER FUND, LTD.
(In Liquidation)
December 31, 2008
Notes to Financial Statements
(Expressed in United States Dollars)
|
ii.
|
Constant Prepayment Rate (CPR) – A loan prepayment rate that is equal to the proportion of the principal of a pool of loans that is assumed to be paid off prematurely in each period. The calculation of this estimate is based on a number of factors such as historical prepayment rates for previous loans that are similar
to ones in the pool and on the future economic outlook.
|
|
iii.
|
Loss Severity – costs (expressed as a %) to foreclose and liquidate a home securing a defaulted mortgage, as well as any decline in property value.
|
|
iv.
|
Delinquency – monthly mortgage payments that are 30, 60, or more than 60 days past due.
|
|
v.
|
Yield – the yield is obtained from the “Matrix” which is updated on a monthly basis. The Matrix associates yields based on various groups of securities and market conditions.
|
The Fund will also determine fair value for MBS and ABS securities that are not based on the Highland Model price. The following represent additional price sources:
Transaction based – Represents a recent transaction utilized as the price source if the transaction occurred within 30 days of the valuation date.
Trader based - Represents a price determined by a portfolio manager. The portfolio manager will determine the proper valuation for a particular security utilizing a combination of observable and unobservable inputs. In determining the valuation the portfolio manager will rely upon third party broker quotes, pricing services, recent transactions
of the security or similar securities, inquiries with marker-makers and industry expertise. The Fund will use this valuation technique if the responsible portfolio manager determines that the Highland Model does not accurately reflect certain idiosyncratic factors for a specific security.
Third party quotes - Represents a valuation that is received externally from either a pricing service or dealer price. The Fund will utilize this price if the responsible portfolio manager determines that this price accurately reflects fair value and for various reasons the Highland Model price (e.g. model inadequacies, non-current
data, etc.) is less accurate than the third party price.
10
HFH ShortPLUS MASTER FUND, LTD.
(In Liquidation)
December 31, 2008
Notes to Financial Statements
(Expressed in United States Dollars)
The following table summarizes the pricing sources used to determine fair value of the securities owned by the Fund at December 31, 2008:
|
Pricing Source
|
% of Portfolio Priced
|
|||
|
Third party quotes
|
39.8 | % | ||
|
Trader based
|
32.9 | % | ||
|
Transaction based
|
14.1 | % | ||
|
Highland Model
|
13.2 | % | ||
ABS and MBS and Credit Default Swaps on ABS and MBS securities are generally categorized in Level 3 of the fair value hierarchy.
Derivative Instruments and Hedging Activities
The Fund recognizes the value of all derivative instruments as either assets or liabilities in the Statement of Assets and Liabilities and measures those instruments at fair value.
Interest Rate and Index Swaps
The Fund may enter into interest rate and index swaps as part of its investment strategies. Swaps involve the exchange by the Fund with another party of respective commitments to pay or receive interest, effective return, or total return throughout the lives of the agreements. The Fund may be required to deliver or
receive cash or securities as collateral upon entering into swap transactions. Movements in the relative value of the swap transactions may require the Fund or the counterparty to post additional collateral. Interest rate swaps change in value with movements in interest rates. During the term of the swap contracts, changes in value and accrued interest payments are recognized as unrealized gains or losses by marking the contracts to the market. These unrealized gains
and losses are reported as an asset or liability, respectively, on the Statement of Assets and Liabilities. When contracts are terminated, the Fund will realize a gain or loss equal to the difference between the proceeds from (or cost of) the closing transaction and the Fund’s basis in the contract, if any.
Credit Default Swaps
The Fund adopted FASB Staff Position FAS 133-1 and FIN 45-4,
Disclosures about Credit Derivatives and Certain Guarantees: An Amendment of FASB Statement No. 133 and FASB Interpretation No. 45
, as of December 31, 2008, which requires additional disclosures about credit derivatives.
The Fund enters into credit default swaps to simulate long and short bond positions that are either unavailable or considered to be less attractively priced in the bond market. The Fund uses these swaps to attempt to reduce risk where the Fund has exposure to the issuer, or to take an active long or short position with respect
to the likelihood of the issuer’s default. There is no certainty that the objectives of holding credit default swaps will be achieved.
11
HFH ShortPLUS MASTER FUND, LTD.
(In Liquidation)
December 31, 2008
Notes to Financial Statements
(Expressed in United States Dollars)
The buyer of a credit default swap is obligated to pay the seller a periodic stream of payments over the term of the contract in return for a contingent payment upon the occurrence of a credit event, with respect to an underlying reference obligation. Generally, a credit event means bankruptcy, failure to pay, obligation accelerated
or modified restructuring. If a credit event occurs, the seller typically must pay the contingent payment to the buyer, which is typically the par value (full notional value) of the reference obligation. The contingent payment may be a cash settlement or by a physical delivery of the reference obligation in return for payment of the face amount of the obligation. If the Fund is a buyer and no credit event occurs, the Fund may lose its investment and recover nothing. However,
if a credit event occurs, the buyer typically receives full notional value and interest for a reference obligation that may have little or no value. As a seller, the Fund receives a fixed rate of income throughout the term of the contract, provided that no credit event occurs. If a credit event occurs, the seller may pay the buyer the full notional value and interest of the reference obligation. Upfront payments made and/or received by the Fund are recorded as an asset and/or
liability on the Statement of Assets and Liabilities and are recorded as a realized gain or loss on the termination date.
As of December 31, 2008, the Fund has eight open credit default swaps. The Fund is the buyer on six of these swaps (“receiving protection” on a total notional amount of approximately $53.6 million) and is the seller on the remaining two (“providing protection” on a total notional amount of $15 million).
12
HFH ShortPLUS MASTER FUND, LTD.
(In Liquidation)
December 31, 2008
Notes to Financial Statements
(Expressed in United States Dollars)
Credit default swaps involve greater risks than if the Fund had invested in the reference obligations directly. In addition to general market risks, credit default swaps are subject to liquidity risk and counterparty credit risk. A buyer also may lose its investment and recover nothing should a credit event not occur. If
a credit event did occur, the value of the reference obligation received by the seller, coupled with the periodic payments previously received, may be less than the full notional value it pays to the buyer, resulting in a loss of value.
At December 31, 2008, the two credit default swaps sold held by the Fund were referenced to mortgage-backed securities. Both credit default swaps sold expire in 2036.
The current status of the performance risk of both credit default swaps sold are classified by the external Standard & Poor’s credit ratings of the reference obligations as CC.
In the event that certain specified credit events occur, the maximum potential amount of future undiscounted payments that the Fund would be required to pay under the credit default swaps sold would be approximately $15,000,000. However, if the Fund was required to make payments under the credit default swaps sold, it would be
entitled to certain assets owned by the reference entities that collateralize the reference obligations. The Fund is unable to estimate the approximate extent of which the proceeds from liquidation can be applied towards the maximum potential amount of future payments under the credit default swaps sold.
The fair value of open swaps reported in the statement of assets and liabilities may differ from that which would be realized in the event the Fund terminated its position in the contract. Risks may arise as a result of the failure of the counterparty to the swap contract to comply with the terms of the swap contract. The
loss incurred by the failure of a counterparty is generally limited to the aggregate of the unrealized gain on the swap contracts in an unrealized gain position as well as any collateral posted with the counterparty. Therefore, the Fund considers the creditworthiness of each counterparty to a swap contract in evaluating potential credit risk. Additionally, risks may arise from unanticipated movements in the fair value of the underlying securities and the lack of market liquidity to unwind
the positions at current fair values.
The Fund’s credit default swap contracts are subject to International Swaps and Derivatives Association (ISDA) Master Agreements which contain certain covenants and other provisions. During the year ended December 31, 2008, the decline of the Fund’s net asset value resulted in an additional termination event as defined
in two of these agreements. As a result, the Fund’s counterparties have the right to terminate these agreements and the related derivative contracts. The Fund closed one of the contracts subsequent to year end. The swap contract had a fair value of approximately $1,285,000 at December 31, 2008. The Fund is in the process of closing the remaining swap in connection with the liquidation of the Fund. As of December 31, 2008, the value of this swap was
approximately $9,846,000 and the Fund held collateral from the counterparty in the amount of approximately $3,488,000. In January 2009, the counterparty posted an additional $6,360,000 of collateral with the Fund. The Fund has not received any notice from its counterparty to terminate this agreement.
The fair values of the credit default swaps sold referenced to mortgage-backed securities were approximately $14,686,000 as of December 31, 2008.
13
HFH ShortPLUS MASTER FUND, LTD.
(In Liquidation)
December 31, 2008
Notes to Financial Statements
(Expressed in United States Dollars)
Futures
A futures contract is an agreement between two parties to buy or sell a financial instrument for a set price on a future date. Initial margin deposits are made upon entering into futures contracts and can be either cash or securities. During the period the futures contract is open, changes in the value of the contract
are recognized as unrealized gains or losses by marking to market on a daily basis to reflect the fair value of the contract at the end of each day’s trading. When the contract is closed, the Fund records a realized gain or loss equal to the difference between the proceeds of the closing transaction and the Fund’s basis in the contract.
Purchased Options
The Fund may purchase put or call options. When the Fund purchases an option, an amount equal to the premium paid is recorded as an asset and is subsequently marked-to-market. Premiums paid for purchasing options that expire unexercised are recognized on the expiration date as realized losses. If an option
is exercised, the premium paid is subtracted from the proceeds of the sale or added to the cost of the purchase to determine whether the Fund has realized a gain or loss on the related investment transaction. When the Fund enters into a closing transaction, the Fund will realize a gain or loss depending upon whether the amount from the closing transaction is greater or less than the premium paid.
Written Options
The Fund may write put or call options. When the Fund writes an option, an amount equal to the premium received is recorded as a liability and is subsequently marked-to-market. Premiums received for writing options that expire unexercised are recognized on the expiration date as realized gains. If an option
is exercised, the premium received is subtracted from the cost of the purchase or added to the proceeds of the sale to determine whether the account has realized a gain or loss on the related investment transaction. When the Fund enters into a closing transaction, the Fund will realize a gain or loss depending upon whether the amount from the closing transaction is less or greater than the premium received.
Short Sales
When the Fund sells short, it may borrow the security sold short and deliver it to the broker-dealer through which it sold short as collateral for its obligation to deliver the security upon conclusion of the sale. Additionally, the Fund generally is required to deliver cash or securities as collateral for the Fund’s obligation
to return the borrowed security. The Fund may have to pay a fee to borrow the particular securities and may be obligated to pay over any payments received on such borrowed securities. A gain, limited to the price at which the Fund sold the security short, or a loss, unlimited as to dollar amount, will be recognized upon the termination of a short sale if the exit price is less or greater than the proceeds originally received.
14
HFH ShortPLUS MASTER FUND, LTD.
(In Liquidation)
December 31, 2008
Notes to Financial Statements
(Expressed in United States Dollars)
Financing Transactions
The Fund enters into repurchase agreements as a borrower (securities sold under agreements to repurchase) and as a lender (securities purchased under agreements to resell). All repurchase agreements are carried at their contractual amounts on the Statement of Assets and Liabilities, and the accrued income (expense) is recorded
separately. Securities sold under agreements to repurchase include sell-buy financing transactions while securities purchased under agreements to resell include buy-sell financing transactions.
Securities Sold Under Agreements to Repurchase
The Fund monitors collateral fair values relative to the amounts due under the agreements, including accrued interest, throughout the lives of the agreements, and when necessary, requires transfer of cash or securities in order to manage exposure and liquidity. In connection with such agreements, if the counterparty defaults
or enters an insolvency proceeding, realization or return of the collateral to the Fund may be delayed or limited.
At December 31, 2008, the Fund had no securities sold under agreements to repurchase.
Securities Purchased Under Agreements to Resell
Transactions involving purchases of securities under agreements to resell are treated as collateralized financial transactions and are recorded at their contracted resell amounts. Securities purchased under agreements to resell are generally collateralized principally by U.S. government and agency securities. The Fund
takes possession of such underlying collateral, monitors its fair value relative to the amounts due under the agreements, including accrued interest, throughout the lives of the agreements, and when necessary, may require a transfer of additional cash or securities in order to manage exposure and liquidity. In connection with such agreements, if the counterparty defaults or enters an insolvency proceeding, realization or return of the funds to the Fund may be delayed or limited.
At December 31, 2008, the Fund had securities purchased under agreements to resell totaling $32,338,000. The Fund received collateral in the form of various FNMA MBS pools under a held in custody agreement with an interest rate of 0.035% and a maturity of two days. The value of the securities, including accrued
interest, received as collateral by the Fund that it was permitted to sell or repledge was approximately $33,294,000.
Translation of Foreign Currency
Assets and liabilities denominated in foreign currencies are translated into United States dollar amounts at the year-end exchange rates. Transactions denominated in foreign currencies, including purchases and sales of investments,
and income and expenses, are translated into United States dollar amounts on the transaction date. Adjustments arising from foreign currency transactions are reflected in the statement of operations.
15
HFH ShortPLUS MASTER FUND, LTD.
(In Liquidation)
December 31, 2008
Notes to Financial Statements
(Expressed in United States Dollars)
The Fund does not isolate that portion of the results of operations arising from the effect of changes in foreign exchange rates on investments from fluctuations arising from changes in market prices of investments held. Such fluctuations are included in net gain (loss) on investments in the statement of operations.
Investment Transactions and Related Investment Income
Investment transactions are accounted for on a trade-date basis. Interest is recognized on the accrual basis.
Offsetting of Amounts Related to Certain Contracts
The Fund has elected not to offset fair value amounts recognized for cash collateral receivables and payables against fair value amounts recognized for net derivative positions executed with the same counterparty under the same master netting arrangement. At December 31, 2008, the Fund had no cash collateral receivables and payables with
derivative counterparties covered under the same master netting arrangement.
Income Taxes
The Fund is a Cayman Islands exempted company. Under the current laws of the Cayman Islands, there are no income, estate, transfer, sale or other taxes payable by the Fund. The Fund is taxed as a partnership for U.S. Federal income tax purposes, and as such, is not subject to income taxes; each investor may be individually
liable for income taxes, if any, on its share of the Fund's net taxable income. The Fund trades securities for its own account and, as such, investors are generally not subject to U.S. tax on such earnings (other than certain withholding taxes indicated below). The Investment Manager intends to conduct the business of the Fund to the maximum extent practicable so that the Fund's activities do not constitute a U.S. trade or business. Interest and other income received by
the Fund from sources within the United States may be subject to, and reflected net of, United States withholding tax at the rate of 30%. Interest, dividend and other income realized by the Fund from non-U.S. sources and capital gains realized on the sale of securities of non-U.S. issuers may be subject to withholding and other taxes levied by the jurisdiction in which the income is sourced.
The Fund has adopted FASB Staff Position No. FIN 48-3, which allows certain nonpublic entities to defer the effective date of FASB Interpretation No. 48, “Accounting for Uncertainty in Income Taxes” (“FIN 48”), until the annual financial statements for fiscal years beginning after December 15, 2008. The
Investment Manager has elected to take advantage of this deferral. Based on its continued analysis, the Investment Manager has determined that the adoption of FIN 48 will not have a material impact to the Fund’s financial statements. However, the Investment Manager's conclusions regarding FIN 48 may be subject to review and adjustment at a later date based on factors including, but not limited to, further implementation guidance, and on-going analyses of tax laws, regulations and interpretations
thereof. The Fund’s accounting policy for evaluating uncertain tax positions during financial statement periods subject to the deferral of FIN 48 is based on the recognition and disclosure criteria for loss contingencies under SFAS No. 5 “Accounting for Contingencies”.
16
HFH ShortPLUS MASTER FUND, LTD.
(In Liquidation)
December 31, 2008
Notes to Financial Statements
(Expressed in United States Dollars)
FIN 48 requires the Investment Manager to determine whether a tax position of the Fund is more likely than not to be sustained upon examination by the applicable taxing authority, including resolution of any related appeals or litigation processes, based on the technical merits of the position. The tax benefit to be recognized is measured
as the largest amount of benefit that is greater than fifty percent likely of being realized upon ultimate settlement which could result in the Fund recording a tax liability that would reduce net assets. FIN 48 must be applied to all existing tax positions upon initial adoption and the cumulative effect, if any, is to be reported as an adjustment to net assets upon adoption.
Use of Estimates
The preparation of financial statements in conformity with accounting principles generally accepted in the United States of America requires the Fund’s management to make estimates and assumptions that affect the amounts disclosed in the financial statements. Actual results could differ from those estimates.
|
2.
|
Fair value measurements
|
The Fund’s assets and liabilities recorded at fair value have been categorized based upon a fair value hierarchy in accordance with SFAS No. 157. See Note 1 for a discussion of the Fund’s policies.
The following table presents information about the Fund’s assets and liabilities measured at fair value as of December 31, 2008 (in thousands):
|
Quoted Prices
|
Significant
|
|||||||||||||||
|
in Active
|
Other
|
Significant
|
Balance
|
|||||||||||||
|
Markets for
|
Observable
|
Unobservable
|
as of
|
|||||||||||||
|
Identical Assets
|
Inputs
|
Inputs
|
December 31,
|
|||||||||||||
|
(Level 1)
|
(Level 2)
|
(Level 3)
|
2008
|
|||||||||||||
|
Assets
|
||||||||||||||||
|
Investments in
securities, at fair value
|
$ | - | $ | - | $ | 5,813 | $ | 5,813 | ||||||||
|
Credit default swap
contracts, at fair value
|
- | - | 22,082 | 22,082 | ||||||||||||
| $ | - | $ | - | $ | 27,895 | $ | 27,895 | |||||||||
|
Liabilities
|
||||||||||||||||
|
Credit default swap
contracts, at fair value
|
$ | - | $ | - | $ | 14,686 | $ | 14,686 | ||||||||
17
HFH ShortPLUS MASTER FUND, LTD.
(In Liquidation)
December 31, 2008
Notes to Financial Statements
(Expressed in United States Dollars)
The following table presents additional information about Level 3 assets and liabilities measured at fair value. Both observable and unobservable inputs may be used to determine the fair value of positions that the Fund has classified within the Level 3 category. As a result, the unrealized
gains and losses for assets and liabilities within the Level 3 category may include changes in fair value that were attributable to both observable (e.g., changes in market interest rates) and unobservable (e.g., changes in
unobservable long-dated volatilities) inputs.
Changes in Level 3 assets and liabilities measured at fair value for the year ended December 31, 2008 (in thousands) are as follows:
|
Level 3
|
||||||||||||||||||||||||
|
Beginning
Balance
January 1, 2008
|
Realized &
Unrealized
Gains
(Losses)
|
Purchases
Sales and
Settlements
|
Net
Transfers
In and/or
(Out) of
|
Ending
Balance
December 31,
2008
|
Changes in
Unrealized
Gains (Losses)
For Investments
still held at
December 31,
2008
|
|||||||||||||||||||
|
Assets
|
||||||||||||||||||||||||
|
Investments in securities
at fair value
|
$ | 12,297 | $ | (10,658 | ) | $ | 4,174 | $ | - | $ | 5,813 | $ | (2,737 | ) | ||||||||||
|
Credit default swap contracts
at fair value
|
271,422 | 66,112 | (315,452 | ) | - | 22,082 | 5,271 | |||||||||||||||||
| $ | 283,719 | $ | 55,454 | $ | (311,278 | ) | $ | - | $ | 27,895 | $ | 2,534 | ||||||||||||
|
Liabilities
|
||||||||||||||||||||||||
|
Credit default swap contracts
at fair value
|
54,613 | 8,658 | (48,585 | ) | - | 14,686 | (4,430 | ) | ||||||||||||||||
| $ | 54,613 | $ | 8,658 | $ | (48,585 | ) | $ | - | $ | 14,686 | $ | (4,430 | ) | |||||||||||
Realized and unrealized gains and losses are included in net gain (loss) on securities in the statement of operations. The change in unrealized gains (losses) for the year ended December 31, 2008 for investments still held at December 31, 2008 of ($2,737) and ($841) are reflected in unrealized appreciation or depreciation of
securities and unrealized appreciation or depreciation on credit default swap contracts, respectively, in the statement of operations.
18
HFH ShortPLUS MASTER FUND, LTD.
(In Liquidation)
December 31, 2008
Notes to Financial Statements
(Expressed in United States Dollars)
|
3.
|
Due to broker
|
Amounts due to broker represent margin borrowings that are collateralized by certain securities.
In the normal course of business, substantially all of the Fund’s securities transactions, money balances and security positions are transacted with a broker. The Fund is subject to credit risk to the extent any broker with which it conducts business is unable to fulfill contractual obligations on its behalf. The
Fund’s management monitors the financial condition of such brokers and does not anticipate any losses from these counterparties.
Throughout 2008, the Fund primarily transacted with the following brokers J.P. Morgan, Goldman Sachs, Deutsche Bank, Citibank, Credit Suisse and Merrill Lynch.
|
4.
|
Financial instruments with off-balance sheet risk and other risks
|
The Fund invests on a leveraged basis in various financial instruments and is exposed to market risks resulting from changes in the fair value of the instruments. The Statement of Assets and Liabilities may include the fair value of contractual commitments involving forward settlements, futures contracts and swap transactions
as well as investments in securities sold short. These instruments involve elements of market risk in excess of amounts reflected on the Statement of Assets and Liabilities. Derivative financial statements are used by the Fund to help manage such market risk and to take an active long or short position in the market. Should interest rates move unexpectedly, the Fund may not achieve the anticipated benefits of the hedging instruments and may realize a loss. Further,
the use of such derivative instruments involves the risk of imperfect correlation in movements in the price of the instruments, interest rates and the underlying hedged assets.
The investment characteristics of mortgage-backed and asset-backed securities differ from traditional debt securities. Among the major differences are that interest and principal payments are made more frequently, usually monthly, and that the underlying residential or commercial mortgage loans or other assets generally may be
prepaid at any time. Maturities on mortgage-backed and asset-backed securities represent stated maturity dates. Actual maturity dates may differ based on prepayment dates.
The Fund is exposed to credit-related losses in the event of nonperformance by counterparties to financial instruments. The maximum credit exposure related to the derivative financial instruments of the Fund is equal to the fair value of the contracts with positive fair values as of December 31, 2008. It is the policy
of the Fund to transact the majority of its securities and contractual commitment activity with broker-dealers, banks and regulated exchanges that the Investment Manager considers to be well established.
The Fund’s short-biased strategy depends in large measure upon the ability of the Investment Manager to identify ABS that experience future credit losses arising from the defaults by obligors on the related mortgage loans. This is the opposite approach from that employed in traditional long-bias credit investment strategies
that generally seek to avoid credit losses on investments purchased on the basis of fundamental credit analysis, or on other bases.
19
HFH ShortPLUS MASTER FUND, LTD.
(In Liquidation)
December 31, 2008
Notes to Financial Statements
(Expressed in United States Dollars)
There can be no assurance that the Investment Manager’s assessments of the likelihood of default and losses on specific ABS transactions will be accurate or that the predictive strengths of the Investment Manager’s models and practices will not decline in the future. Even if ABS default and loss rates increase generally
in the future relative to the rates observed in the past, the Fund’s return objectives will not be met if the Fund has bought credit protection or otherwise shorted securities that do not experience such higher default and loss rates.
The Fund’s strategy also includes long investments that are intended to generate positive income during the first several years of the Fund, in order to partially offset the negative carry of the short positions. Losses on these long positions could produce losses for the Fund and could result in the failure of the Fund
to achieve the intended purpose of offsetting the CDS premium costs.
An investment in the Fund entails risk. There can be no assurance that the Fund will achieve its investment objective or that the Fund’s strategies will be successful. There exists a possibility that an investor could suffer a substantial loss as a result of an investment in the Fund.
The success of any investment activity is influenced by general economic conditions that may affect the level and volatility of equity prices, credit spreads, interest rates and the extent and timing of investor participation in the markets for both equity and interest-rate-sensitive securities. Unexpected volatility or illiquidity
in the markets in which the Fund directly or indirectly holds positions could impair the Fund’s ability to carry out its business and could cause the Fund to incur losses.
Depending on market conditions, reliable pricing information will not always be available from any source. Prices quoted by different sources are subject to material variation.
Credit-sensitive tranches of ABS are exposed to credit risk arising from possible defaults of the underlying loans and recovery rates on those liquidated loans. The default rates of loans backing these securities is dependent on a number of factors including the quality and characteristics of the loans, national and regional
economic growth, real estate values, the level of interest rates, changes in the availability of mortgage financing and other factors. Recovery values following a default will be dependent largely on regional and national real estate values among other things; although real estate values may depend on other economic variables.
The rate of prepayments on the loans collateralizing a subordinate ABS tranche will generally have a significant effect on the amount of obligor defaults such a tranche can face before suffering losses of interest or principal. The Investment Manager believes it is impossible to accurately predict prepayment rates because prepayment
rates are heavily influenced by equally unpredictable interest rates. Consequently, while the Investment Manager seeks to explore the potential effects of a wide range of possible prepayment rates for securities or CDS it purchases or sells, there can be no assurance that this analysis will exhaust the possible paths prepayments could take, or that the effects of any particular prepayment rate scenario will be evaluated correctly in respect of a specific ABS tranche or CDS.
20
HFH ShortPLUS MASTER FUND, LTD.
(In Liquidation)
December 31, 2008
Notes to Financial Statements
(Expressed in United States Dollars)
A decline in the fair value of the Fund’s portfolio of assets may limit the Investment Manager’s ability to borrow, or may result in lenders initiating margin calls (i.e., requiring a pledge of cash or additional assets to re-establish the ratio of the amount of the borrowing to the value of the collateral). The Investment
Manager could be required to sell assets at distressed prices under adverse market conditions in order to satisfy the requirements of the lenders. A default by the Fund under its collateralized borrowings could also result in a liquidation of the collateral by the lender, including any cross-collateralized assets, and a resulting loss of the difference between the value of the collateral and the amount borrowed.
As discussed in Note 1, the Fund’s investors are two Feeder Funds managed by the Investment Manager. The Fund could be materially affected by significant subscriptions and redemptions from the underlying investors of these Feeder Funds.
|
5.
|
Capital share transactions
|
The authorized share capital of the Fund consists of 5,000,000 shares having a par value of $0.01 (U.S.) per share. At December 31, 2008, 468.89 shares were issued and outstanding.
Common shares are offered at an offering price equal to the net asset value per common share as of the close of business on the immediately preceding business day.
Any holder of common shares has the right, in accordance with and subject to the applicable provisions of the memorandum of association of the Fund and the laws of the Cayman Islands, to have all or a portion of their shares redeemed on a date determined by the Directors.
At December 31, 2008, all outstanding shares are held by the Feeder Funds.
The following table reconciles share transactions for the year ended December 31, 2008:
|
Shares
|
||||
|
Shares outstanding, beginning of year
|
931.50 | |||
|
Shares issued
|
0.88 | |||
|
Shares redeemed
|
(463.49 | ) | ||
|
Shares outstanding, end of year
|
468.89 | |||
Shareholders have redemption rights which contain certain restrictions with respect to rights of redemption of shares as specified in the offering memorandum.
21
HFH ShortPLUS MASTER FUND, LTD.
(In Liquidation)
December 31, 2008
Notes to Financial Statements
(Expressed in United States Dollars)
|
6.
|
Director fee
|
The following persons are independent non-executive Directors of the Fund:
|
·
|
David Bree
|
|
·
|
Peter Burnim
|
All members of the Board of Directors are reimbursed for their out-of-pocket expenses incurred in connection with the performance of their duties and each receives an annual fee of approximately $5,000. No Directors have a shareholder interest in the Fund or have an interest, direct or indirect, in any transaction affecting
the Fund during the year ended December 31, 2008, which is unusual in nature or significant to the business of the Fund. No Director has any contracts of significance with the Fund.
|
7.
|
Administrative fee
|
Admiral Administration, Ltd. (Cayman Islands) (the “Administrator”) serves as the Fund’s Administrator and performs certain administrative and clerical services on behalf of the Fund.
|
8.
|
Financial highlights
|
Financial highlights for the year ended December 31, 2008 are as follows:
22
HFH ShortPLUS MASTER FUND, LTD.
(In Liquidation)
December 31, 2008
Notes to Financial Statements
(Expressed in United States Dollars)
|
Shares
|
||||
|
Per share operating performance
|
||||
|
Net asset value, beginning of year
|
$
|
344,929.53
|
||
|
Income (loss) from investment operations:
|
||||
|
Net investment income (loss)
|
8,875.78
|
|||
|
Net gain (loss) on investments
|
49,748.90
|
|||
|
Total from investment operations
|
58,624.68
|
|||
|
Net asset value, end of year
|
$
|
403,554.21
|
||
|
Total return
|
17.0
|
%
|
||
|
Ratio to average net assets
|
||||
|
Total operating expenses
|
1.8
|
%
|
||
|
Total operating expenses excluding interest expense
|
0.5
|
%
|
||
|
Net investment income (loss)
|
2.3
|
%
|
||
Financial highlights are calculated for common shares. An individual investor’s return and ratios may vary based on participation in new issues, private investments, and the timing of capital share transactions.
9. Subsequent events
As of February 2, 2009, the Custodian for the Fund’s securities changed from J.P. Morgan to Wells Fargo Bank, N.A.
23
HFH SHORTPLUS FUND, L.P. (A DELAWARE LIMITED PARTNERSHIP) FINANCIAL STATEMENTS DECEMBER 31, 2007 A CLAIM OF EXEMPTION FROM CERTAIN REGULATORY REQUIREMENTS HAS BEEN MADE TO THE COMMODITY FUTURES TRADING COMMISSION PURSUANT TO COMMISSION REGULATION 4.7 BY THE COMMODITY POOL OPERATOR OF HFH SHORTPLUS FUND, L.P. <PAGE> HFH SHORTPLUS FUND, L.P. (A DELAWARE LIMITED PARTNERSHIP) INDEX DECEMBER 31, 2007 --------------------------------------------------------------------------------
PAGE(S)
REPORT OF INDEPENDENT AUDITORS.............................................1
FINANCIAL STATEMENTS
Statement of Assets, Liabilities and Partners' Capital.....................2
Statement of Operations and Special Allocation.............................3
Statement of Changes in Partners' Capital..................................4
Statement of Cash Flows....................................................5
Financial Highlights.......................................................6
Notes to Financial Statements...........................................7-10
Affirmation of the Commodity Pool Operator................................11
<PAGE>
REPORT OF INDEPENDENT AUDITORS
To the General Partner and Limited Partners of
HFH ShortPLUS Fund, L.P.
In our opinion, the accompanying statement of assets, liabilities, and partners'
capital and the related statements of operations and special allocation, of
changes in partners' capital, of cash flows and financial highlights present
fairly, in all material respects, the financial position of HFH ShortPLUS Fund,
L.P. (the "Partnership") at December 31, 2007, and the results of its
operations, the changes in its partners' capital, its cash flows and the
financial highlights for the year then ended, in conformity with accounting
principles generally accepted in the United States of America. These financial
statements and financial highlights (hereinafter referred to as the "financial
statements") are the responsibility of the General Partner. Our responsibility
is to express an opinion on these financial statements based on our audit. We
conducted our audit of these financial statements in accordance with auditing
standards generally accepted in the United States of America. Those standards
require that we plan and perform the audit to obtain reasonable assurance about
whether the financial statements are free of material misstatement. An audit
includes examining, on a test basis, evidence supporting the amounts and
disclosures in the financial statements, assessing the accounting principles
used and significant estimates made by the General Partner, and evaluating the
overall financial statement presentation. We believe that our audit provides a
reasonable basis for our opinion.
/s/ PricewaterhouseCoopers
March 17, 2008
1
<PAGE>
HFH SHORTPLUS FUND, L.P.
(A DELAWARE LIMITED PARTNERSHIP)
STATEMENT OF ASSETS, LIABILITIES AND PARTNERS' CAPITAL
DECEMBER 31, 2007
--------------------------------------------------------------------------------
(expressed in U.S. dollars)
ASSETS
Investment in HFH ShortPLUS Master Fund, Ltd. $83,923,831
Cash and cash equivalents 5,958,995
Other assets 140
-----------
Total assets $89,882,966
===========
LIABILITIES
Accrued expenses and other liabilities $ 22,501
-----------
Total liabilities 22,501
-----------
PARTNERS' CAPITAL 89,860,465
-----------
Total liabilities and partners' capital $89,882,966
===========
The accompanying notes are an integral part of these financial statements.
2
<PAGE>
HFH SHORTPLUS FUND, L.P.
(A DELAWARE LIMITED PARTNERSHIP)
STATEMENT OF OPERATIONS AND SPECIAL ALLOCATION
YEAR ENDED DECEMBER 31, 2007
--------------------------------------------------------------------------------
(expressed in U.S. dollars)
NET INVESTMENT INCOME ALLOCATED FROM HFH SHORTPLUS MASTER FUND, LTD.
Income $ 3,798,885
Expense (1,523,828)
------------
2,275,057
------------
PARTNERSHIP INVESTMENT INCOME
Interest 10,538
------------
Total income 2,285,595
PARTNERSHIP EXPENSES
Management fee 416,360
Professional fees 30,000
------------
Total expenses 446,360
------------
Net investment income 1,839,235
------------
REALIZED AND UNREALIZED GAIN (LOSS) ON INVESTMENTS ALLOCATED FROM HFH SHORTPLUS
MASTER FUND, LTD.
Net realized gains on investments and derivatives 26,147,378
Net change in unrealized appreciation on investments and derivatives 38,016,188
------------
Net realized and unrealized gains on investments and derivatives 64,163,566
------------
Net increase in partners' capital resulting from operations 66,002,801
Profit Reallocation to General Partner 6,561,910
------------
Net income available for pro-rata distribution to all partners $ 59,440,891
============
The accompanying notes are an integral part of these financial statements.
3
<PAGE>
HFH SHORTPLUS FUND, L.P.
(A DELAWARE LIMITED PARTNERSHIP)
STATEMENT OF CHANGES IN PARTNERS' CAPITAL
YEAR ENDED DECEMBER 31, 2007
--------------------------------------------------------------------------------
(expressed in U.S. dollars)
GENERAL LIMITED
PARTNER PARTNERS TOTAL
------------ ------------ ------------
Balance, January 2, 2007 $ -- $ -- $ --
Capital contributions 1,000 39,965,569 39,966,569
Capital withdrawals -- (16,108,905) (16,108,905)
Increase in partners' capital resulting from operations
Pro rata allocation 2,448 66,000,353 66,002,801
Incentive allocation 6,561,910 (6,561,910) --
------------ ------------ ------------
BALANCE, DECEMBER 31, 2007 $ 6,565,358 $ 83,295,107 $ 89,860,465
============ ============ ============
The accompanying notes are an integral part of these financial statements.
4
<PAGE>
HFH SHORTPLUS FUND, L.P.
(A DELAWARE LIMITED PARTNERSHIP)
STATEMENT OF CASH FLOWS
YEAR ENDED DECEMBER 31, 2007
--------------------------------------------------------------------------------
(expressed in U.S. dollars)
Net increase in partners' capital resulting from operations $ 66,002,801
Adjustments to reconcile net increase in partners' capital resulting
from operations to net cash used in operating activities
Investment in HFH ShortPLUS Master Fund, Ltd. (39,961,486)
Withdrawal from HFH ShortPLUS Master Fund, Ltd. 22,476,276
Income from Master Fund (66,438,621)
Increase in other assets (140)
Increase in accrued expenses and other liabilities 22,501
------------
Net cash used in operating activities (17,898,669)
------------
Cash provided from financing activities
Partners' capital contributions 39,966,569
Partners' capital withdrawals (16,108,905)
------------
Net cash provided by financing activities 23,857,664
Net increase in cash and cash equivalents 5,958,995
Cash
Beginning of year --
------------
End of year $ 5,958,995
============
The accompanying notes are an integral part of these financial statements.
5
<PAGE>
HFH SHORTPLUS FUND, L.P.
(A DELAWARE LIMITED PARTNERSHIP)
FINANCIAL HIGHLIGHTS
YEAR ENDED DECEMBER 31, 2007
--------------------------------------------------------------------------------
(expressed in U.S. dollars)
The financial highlights table represents the Partnership's financial
performance for the year ended December 31, 2007 as follows:
LIMITED PARTNERS
Total return before incentive allocation 242.28%
Incentive allocation (34.15)
----------
Total return after incentive allocation(a) 208.13%
==========
Net investment income ratio(b) 3.51%
Operating expense ratio(c) (3.77)%
Incentive allocation (12.54)
----------
Total expenses and incentive allocation (16.31)%
==========
Operating expense ratio excluding interest expense(d) (1.20)%
==========
(a) Total return is calculated for aggregate limited partners' capital,
exclusive of the General Partner, taken as a whole and adjusted for
cash flows related to capital contributions and withdrawals during
the year. An individual limited partner's return may differ
depending on the timing of contributions and withdrawals, as well
as varying fee structures.
(b) The net investment income ratio is based on the net investment
income allocated to a limited partner prior to the effect of an
incentive allocation and is exclusive of unrealized and realized
gains and losses. The net investment income ratio attributable to
an individual partner's account may vary based on timing of capital
transactions.
(c) The operating expense ratio is based on the expenses allocated to
each partner prior to the effects of any incentive allocation. For
the purpose of this calculation, operating expenses include
expenses incurred by the Partnership directly as well as expenses
allocated from the Master Fund. Expense ratios are calculated over
average net assets. Expense ratio excluding the effect of allocated
expenses from the Master Fund would be (0.85%). The expense ratios
attributable to an individual partner's account may vary based on
different management fee and incentive allocation arrangements and
the timing of capital transactions.
(d) The operating expense ratio is based on the expenses allocated to
each partner. For the purpose of this calculation, operating
expenses include expenses incurred by the Partnership directly as
well as expenses allocated from the Master Fund, excluding interest
expense. Expense ratios are calculated over average net assets. The
expense ratios attributable to an individual partner's account may
vary based on different fee arrangements and the timing of capital
transactions.
The accompanying notes are an integral part of these financial statements.
6
<PAGE>
HFH SHORTPLUS FUND, L.P.
(A DELAWARE LIMITED PARTNERSHIP)
NOTES TO FINANCIAL STATEMENTS
DECEMBER 31, 2007
--------------------------------------------------------------------------------
1. ORGANIZATION
Highland ShortPLUS Fund, L.P. (the "Partnership") is a Delaware limited
partnership and commenced operations on January 2, 2007. The Partnership
invests substantially all of its investable assets through a
"master-feeder" structure in HFH ShortPLUS Master Fund, Ltd. ("Master
Fund"), a Cayman Islands exempted company that invests and trades a
short-biased portfolio of asset-backed securities ("ABS") that the
Investment Manager believes are most likely to produce high returns
during periods of adverse credit performance for residential mortgages,
and for mortgage-backed securities ("MBS") and ABS. Returns will come
from two principal sources: (i) market value changes, arising from
changes in credit spreads on the Master Fund's short positions; and (ii)
credit default payments from counterparties on credit default swaps
("CDS") or other derivatives in credit sensitive mortgage and
asset-backed securities, consumer debt and other assets. The
Partnership's investment objective is the same as that of the Master
Fund. The financial statements of the Master Fund are included elsewhere
in this report and should be read in conjunction with the Partnership's
financial statements. Highland Financial Holdings, LLC (the "General
Partner") serves as the general partner and Highland Financial Holdings
Group, LLC ("Investment Manager") serves as the investment manager of
the Partnership.
The Master Fund is also managed by the Investment Manager. Valuation of
the investments held by the Master Fund is discussed in the notes to the
financial statements included elsewhere in this report. The percentage
of the Master Fund's net assets owned by the Partnership at December 31,
2007 was approximately 26.1%.
2. SUMMARY OF SELECTED SIGNIFICANT ACCOUNTING POLICIES
USE OF ESTIMATES
The financial statements are prepared in accordance with accounting
principles generally accepted in the United States of America ("U.S.
GAAP"). The preparation of financial statements in accordance with U.S.
GAAP requires management to make estimates and assumptions that affect
the reported amounts and disclosures in the financial statements. Actual
results could differ from these estimates.
BASIS OF ACCOUNTING
The Fund records security and contractual transactions, if any, on a
trade/contractual date basis.
CASH AND CASH EQUIVALENTS
Cash and cash equivalents consist principally of cash and short term
investments (overnight bank investments), which are readily convertible
into cash and have original maturities of three months or less.
VALUATION
The Partnership records its investment in the Master Fund at fair value
based on the net asset value of the Master Fund. Valuation of financial
instruments by the Master Fund is discussed in Note 2 of the Master
Fund's Notes.
INCOME AND EXPENSE RECOGNITION
The Partnership records its proportionate share of the Master Fund's
investment income/loss, expenses and realized and unrealized gains and
losses. The Master Fund's income and expense recognition and allocations
policies are discussed in Note 2 of the Master Fund's Notes.
7
<PAGE>
HFH SHORTPLUS FUND, L.P.
(A DELAWARE LIMITED PARTNERSHIP)
NOTES TO FINANCIAL STATEMENTS
DECEMBER 31, 2007
--------------------------------------------------------------------------------
Interest income of the Partnership's cash balance is accrued as earned.
Expenses that are directly attributable to the Partnership are recorded
on the accrual basis as incurred.
INCOME TAXES
The Partnership is not a taxable entity for federal, state or local
income tax purposes; such taxes are the responsibility of individual
partners. Accordingly, no provision has been made in the accompanying
financial statements for any federal, state or local income taxes.
On February 1, 2008, FASB issued FIN 48-2, Effective Date of FASB
Interpretation No. 48 for Certain Nonpublic Enterprises ("FSP"), which
allows the Partnership to defer the adoption of FIN 48 until periods
beginning after December 15, 2007. The General Partner has elected to
take advantage of this deferral. Based on its analysis, the General
Partner has determined that the adoption of FIN 48 will not have a
material impact to the Partnership's financial statements. However, the
General Partner's conclusions regarding FIN 48 may be subject to review
and adjustment at a later date based on factors including, but not
limited to, further implementation guidance, and on-going analyses of
tax laws, regulations and interpretations thereof.
FIN 48 requires the General Partner to determine whether a tax position
of the Partnership is more likely than not to be sustained upon
examination by the applicable taxing authority, including resolution of
any related appeals or litigation processes, based on the technical
merits of the position. The tax benefit to be recognized is measured as
the largest amount of benefit that is greater than fifty percent likely
of being realized upon ultimate settlement which could result in the
Partnership recording a tax liability that would reduce partners'
capital. FIN 48 must be applied to all existing tax positions upon
initial adoption and the cumulative effect, if any, is to be reported as
an adjustment to partners' capital upon adoption.
3. CONTRIBUTIONS AND WITHDRAWALS
The minimum initial and subsequent capital contributions (each a
"Capital Contribution") in the Partnership are $5,000,000 and
$1,000,000, respectively. The Investment Manager may waive or reduce the
minimum Capital Contributions in its sole discretion. The General
Partner may admit new Limited Partners and permit Limited Partners to
make additional Capital Contributions as of the first business day of
each calendar month, or at any other time in the General Partner's sole
discretion.
Subject to the lock-up period and early withdrawal fee, Limited Partners
shall have the right to require the Partnership to withdraw all or any
portion of their investment by delivering written notice to the General
Partner not less than 90 days prior to the end of any calendar quarter,
or at such other times as the General Partner determines in its sole
discretion. The General Partner reserves the right to waive or reduce
the notice period in its sole discretion. Notwithstanding anything to
the contrary, a Limited Partner may not withdraw each Capital
Contribution (and any appreciation thereon) until after the 12 month
period (the "Lock-up Period") following the date of such contribution,
without the prior consent of the General Partner, which may be granted
or denied in the General Partner's sole discretion.
Limited Partners who withdraw a Capital Contribution after the Lock-up
Period with respect to such Capital Contribution but less than 24 months
after purchasing such Capital Contribution will be charged an early
withdrawal fee equal to 5% of the withdrawal amount. Any early
withdrawal fee will be payable to the Partnership. The General Partner
reserves the right, in its sole discretion, to waive or reduce the early
withdrawal fee on a case-by-case basis. Subject to the Partnership's
8
<PAGE>
HFH SHORTPLUS FUND, L.P.
(A DELAWARE LIMITED PARTNERSHIP)
NOTES TO FINANCIAL STATEMENTS
DECEMBER 31, 2007
--------------------------------------------------------------------------------
right to establish reserves, a minimum of 95% of the withdrawals
proceeds will generally be paid to the withdrawing Limited Partner
within 15 business days after the corresponding withdrawal date, with
the balance payable (without interest) within 90 days of the
corresponding withdrawal date. The General Partner, at its discretion,
reserves the right to suspend or limit redemptions.
In the event that withdrawal requests are received representing in the
aggregate more than 10% of the total Net Asset Value of the Partnership
on any withdrawal date, the Partnership is entitled to reduce ratably
and pro rata amongst all Limited Partners seeking to withdraw interests
on the withdrawal date and to carry out only sufficient withdrawals,
which in the aggregate, amount to 10% of the total Net Asset Value of
the Partnership on such withdrawal date.
4. ALLOCATION OF NET INCOME (LOSS) AND INCENTIVE ALLOCATION
Net investment income and gains and losses are allocated to the partners
on a monthly basis, based on the partners' proportionate share of
capital in the Partnership at the beginning of the month.
The General Partner receives an incentive allocation equal to 20% of
such net income (includes net realized and unrealized gains and losses)
which will be deducted from the capital account of such limited partner
and reallocated to the General Partner's capital account. Such incentive
allocation is earned at December 31 of each year or when withdrawals
occur. At the discretion of the General Partner, this rate may be
reduced for certain Limited Partners. If there is a loss for the fiscal
period, such loss is carried forward to future periods and no
allocations will be made to the General Partner until prior fiscal
period losses are recovered. For the year ended December 31, 2007, the
General Partner was allocated $6,561,910 in incentive allocations.
5. MANAGEMENT FEE AND OTHER RELATED PARTY TRANSACTIONS
The Investment Manager receives a quarterly management fee
prospectively, equal to 0.50% (2% per annum) of each Limited Partner's
capital account. At the discretion of the General Partner, this rate may
be reduced for certain Limited Partners and affiliated fund investments.
For the year ended December 31, 2007, the Investment Manager earned a
management fee of $416,360 from the Partnership.
For the year ended December 31, 2007, an affiliated party contributed
$13,365,569 of capital and made $16,108,905 of withdrawals. At December
31, 2007, the principal officers and employees of the Investment
Manager, either directly or through family members and affiliated
entities, had $296,785 invested in the Partnership.
6. OFF-BALANCE SHEET RISK, LEVERAGE AND CONCENTRATION OF CREDIT RISKS
Off-balance sheet risk, leverage and concentration of credit risks are
discussed in the Master Fund's Notes.
Due to the nature of the master fund/feeder fund structure, the
Partnership could be materially affected by significant subscriptions
and redemptions of the other feeder fund. From time to time, the
Partnership may have a concentration of partners holding a significant
percentage of the Partnership's partners' capital. Investment activities
of these partners could have a material impact on the Partnership. At
December 31, 2007, one partner individually owned approximately 95% of
the total partners' capital.
9
<PAGE>
HFH SHORTPLUS FUND, L.P.
(A DELAWARE LIMITED PARTNERSHIP)
NOTES TO FINANCIAL STATEMENTS
DECEMBER 31, 2007
--------------------------------------------------------------------------------
7. WITHDRAWALS PAYABLE
In accordance with FASB Statement No. 150, Accounting for Certain
Financial Instruments with Characteristics of Both Liabilities and
Equity, as effected by FASB Staff Position No. FAS 150-3, withdrawals
are recognized as liabilities by the Partnership, net of incentive
allocations, when the amount requested in the withdrawal notice becomes
fixed. This generally occurs either at the time of the receipt of the
notice, or on the last day of a fiscal period, depending on the nature
of the request. As a result, withdrawals paid after the end of the year,
but based upon year-end capital balances are reflected as withdrawals
payable at December 31, 2007. Withdrawal notices received for which the
dollar amount is not fixed remains in capital until the amount is
determined. Withdrawals payable may be treated as capital for purposes
of allocations of gains/losses pursuant to the Partnership's governing
documents.
The Partnership has received withdrawal notices for which the dollar
amounts are not fixed as of December 31, 2007. As such, associated
amounts have remained in capital and are not reflected as withdrawals
payable. There is no capital subject to withdrawal notices for amounts
that are fixed and determinable as of December 31, 2007.
8. CONTINGENCIES AND COMMITMENTS
In the normal course of business, the Partnership enters into contracts
that contain a variety of representations, warranties and general
indemnifications. The Partnership's maximum exposure under these
arrangements, including future claims that may be made against the
Partnership that have not yet occurred, is unknown. However, based on
experience of the General Partner, the Partnership expects the risk of
loss associated with such contracts to be remote.
9. SUBSEQUENT EVENTS
As of December 31, 2007 and through March 1, 2008, the Partnership
received requests for withdrawals, including amounts which are not
currently fixed and determinable, amounting to approximately $4,000,938.
All these withdrawal requests will be recorded subsequent to March 1,
2008, in accordance with the Partnership's withdrawal notice
requirements.
In September 2006, the Financial Accounting Standards Board issued
Statement of Financial Accounting Standards No. 157, Fair Value
Measurements ("SFAS 157"). SFAS 157 defines fair value, establishes a
framework for measuring fair value, and expands disclosures about fair
value measurements. SFAS 157 applies to reporting periods beginning
after November 15, 2007. The adoption of SFAS 157 is not expected to
have a material impact on the Fund's financial statements.
10
<PAGE>
AFFIRMATION OF COMMODITY POOL OPERATOR
To the best of my knowledge and belief the information contained herein
pertaining to HFH ShortPLUS Fund, L.P. is accurate and complete.
Highland Financial Holdings, LLC
Commodity Pool Operator
/s/ Paul Ullman -------------------------------------------
By Paul Ullman President of Highland Financial Holdings, LLC,
General Partner of HFH ShortPLUS Fund, L.P. 11<PAGE>
HFH SHORTPLUS MASTER
FUND, LTD.
(A CAYMAN ISLANDS EXEMPTED COMPANY)
FINANCIAL STATEMENTS
DECEMBER 31, 2007
A CLAIM OF EXEMPTION FROM CERTAIN REGULATORY REQUIREMENTS
HAS BEEN MADE TO THE COMMODITY FUTURES TRADING COMMISSION
PURSUANT TO COMMISSION REGULATION 4.7 BY THE COMMODITY POOL
OPERATOR OF HFH SHORTPLUS MASTER FUND, LTD.
<PAGE>
HFH SHORTPLUS MASTER FUND, LTD.
(A CAYMAN ISLANDS EXEMPTED COMPANY)
INDEX
DECEMBER 31, 2007
--------------------------------------------------------------------------------
PAGE(S)
REPORT OF INDEPENDENT AUDITORS..............................................1
FINANCIAL STATEMENTS
Statement of Assets and Liabilities.........................................2
Schedule of Investments...................................................3-7
Statement of Operations.....................................................8
Statement of Changes in Net Assets..........................................9
Statement of Cash Flows....................................................10
Financial Highlights.......................................................11
Notes to Financial Statements...........................................12-20
Affirmation of the Commodity Pool Operator.................................21
<PAGE>
REPORT OF INDEPENDENT AUDITORS
To the Board of Directors and Shareholders of
HFH ShortPLUS Master Fund, Ltd.
In our opinion, the accompanying statement of assets and liabilities, including
the schedule of investments, and the related statements of operations, of
changes in net assets, of cash flows and financial highlights present fairly, in
all material respects, the financial position of HFH ShortPLUS Master Fund, Ltd.
(the "Fund") at December 31, 2007, and the results of its operations, the
changes in its net assets, its cash flows and the financial highlights for the
year then ended, in conformity with accounting principles generally accepted in
the United States of America. These financial statements and financial
highlights (hereinafter referred to as the "financial statements") are the
responsibility of the Fund's management. Our responsibility is to express an
opinion on these financial statements based on our audit. We conducted our audit
of these financial statements in accordance with auditing standards generally
accepted in the United States of America. Those standards require that we plan
and perform the audit to obtain reasonable assurance about whether the financial
statements are free of material misstatement. An audit includes examining, on a
test basis, evidence supporting the amounts and disclosures in the financial
statements, assessing the accounting principles used and significant estimates
made by management, and evaluating the overall financial statement presentation.
We believe that our audit provides a reasonable basis for our opinion.
/s/ PricewaterhouseCoopers
March 17, 2008
1
<PAGE>
HFH SHORTPLUS MASTER FUND, LTD.
(A CAYMAN ISLANDS EXEMPTED COMPANY)
STATEMENT OF ASSETS AND LIABILITIES
DECEMBER 31, 2007
--------------------------------------------------------------------------------
(expressed in U.S. dollars)
<TABLE>
<CAPTION>
ASSETS
<S> <C>
Investments, at value $ 12,296,717
------------
Total investments, at value (cost $ 73,670,861) 12,296,717
Cash and cash equivalents 250,938,764
Margin cash paid to counterparties 1,800,244
Securities purchased under agreements to resell 59,174,000
Credit default swap contracts, at value (upfront fee payments $79,349,003) 271,421,697
Interest receivable 126,085
Other assets 89,134
------------
Total assets $595,846,641
------------
LIABILITIES
Margin cash received from counterparties $218,648,130
Credit default swap contracts, at value (upfront fee receipts $39,723,958) 54,612,639
Due to brokers (Note 3) 95,483
Interest payable on margin cash 953,919
Accrued expenses and other liabilities 233,750
------------
Total liabilities 274,543,921
------------
Net assets (5,000,000 common shares authorized, $0.01 par value;
931.50 shares issued and outstanding) $321,302,720
============
</TABLE>
Net asset value per share disclosures are made in the financial highlights.
The accompanying notes are an integral part of these financial statements.
2
<PAGE>
HFH SHORTPLUS MASTER FUND, LTD.
(A CAYMAN ISLANDS EXEMPTED COMPANY)
SCHEDULE OF INVESTMENTS
DECEMBER 31, 2007
--------------------------------------------------------------------------------
(expressed in U.S. dollars)
<TABLE>
<CAPTION>
CURRENT FACE / COUPON
NOTIONAL DESCRIPTION RATE MATURITY VALUE
<S> <C> <C> <C> <C>
Asset Backed Securities -
Fixed Rate Home Equity (0.27%)
$ 707,099 TMTS 04-8HES B2 8.000% 6/25/2034 $ 595,872
1,990,000 MASD 07-1 B1 5.250% 1/25/2037 104,475
3,482,000 MASD 07-1 B2 5.250% 1/25/2037 182,805
-----------
Total Asset Backed Securities -
Fixed Rate Home Equity
(cost $ 5,306,332) 883,152
-----------
ASSET BACKED SECURITIES -
FLOATING RATE HOME EQUITY (0.21%)
1,977,237 BAYVIEW FINANCIAL TR 2004-D 8.355% 8/28/2044 284,426
1,893,631 QUEST 2006-X1 M5 7.365% 3/25/2036 94,682
2,476,000 QUEST 2006-X2 M9 7.365% 8/25/2036 173,320
2,539,341 QUEST 2006-X2 M10 7.365% 8/25/2036 126,967
-----------
Total Asset Backed Securities -
Floating Rate Home Equity
(cost $ 8,263,205) 679,395
-----------
ASSET BACKED SECURITIES -
FIXED RATE HOME EQUITY NIM (0.40%)
2,218,243 CWALN 2006-0C8 N 7.750% 2/25/2037 420,539
6,171,417 GSAMP 07 FM1N N1 6.000% 12/25/2036 433,323
4,950,000 HASCN 06-OPT1 B 8.000% 12/26/2035 80,437
5,740,685 NHELN 07-2 N1 NIM 7.385% 1/25/2037 287,034
5,900,000 SBFT 05-HE3 N2 144A * 6.500% 9/25/2035 77,466
-----------
Total Asset Backed Securities -
Fixed Rate Home Equity NIM
(cost $ 23,132,410) 1,298,799
-----------
ASSET BACKED SECURITIES - FLOATING
RATE BUSINESS LOANS (2.41%)
738,720 BAYC 05-3A B3 7.865% 11/25/2035 470,587
7,060,000 BAYVIEW COML MTG TR 2006-SP1 8.865% 4/25/2036 3,591,775
4,178,000 LBSBN 2007-1 N2 8.500% 3/27/2037 3,676,640
-----------
Total Asset Backed Securities -
Floating Rate Business Loans
(cost $ 11,414,997) 7,739,002
-----------
PREFERRED ASSET BACKED SECURITIES - FLOATING
SHARES RATE CDO (0.03%)
2,000,000 BUCKINGHAM CDO III LTD 2007-3 0.000% 9/5/2051 20,000
8,000 CITATION HGH GRD ABS CDO I LTD PFD
3C7 144A *# 6.000% 1/15/2035 80,000
-----------
Total Asset Backed Securities -
Floating Rate CDO (cost $ 6,981,641) 100,000
-----------
</TABLE>
The accompanying notes are an integral part of these financial statements.
3
<PAGE>
HFH SHORTPLUS MASTER FUND, LTD.
(A CAYMAN ISLANDS EXEMPTED COMPANY)
SCHEDULE OF INVESTMENTS
DECEMBER 31, 2007
--------------------------------------------------------------------------------
(expressed in U.S. dollars)
NOTIONAL/
PREFERRED COUPON
SHARES DESCRIPTION RATE MATURITY VALUE
<S> <C> <C> <C> <C>
ASSET BACKED SECURITIES -
HOME EQUITY RESIDUALS (0.50%)
$ 2,351,781 CMLTI 2006-HE1 CE 0.000% 1/25/2036 $ 250,000
18 CMLTI 2006-HE1 P 0.000% 1/25/2036 275,000
24,000 GSAMP 2006 RES - PREFERRED 0.000% N/A 999,999
2,469,540 MANM 07-1 1N2 5.873% 1/25/2047 71,370
5,514,200 MANM 07-1 1N3 7.373% 1/25/2047 -
------------
Total Asset Backed Securities -
Home Equity Residuals
(cost $ 18,572,276) 1,596,369
------------
Total Investments
(cost $ 73,670,861) $ 12,296,717
------------
* 144A securities are exempt from registration under Rule 144A of
the Securities Act of 1933. These securities may only be resold
to qualified institutional buyers.
# Citation is an entity that is advised by Highland Financial
Holdings Group, LLC, the Fund's Investment Manager, and
accordingly is considered an affiliate.
CREDIT
DEFAULT SWAP
NOTIONAL TERMINATION CONTRACTS,
AMOUNT CREDIT DEFAULT SWAP CONTRACTS, AT VALUE (-17.00) DATE AT VALUE
$(10,000,000) SAIL 2006-4 M4 (BEAR pays 5.80%) 6/25/2036 $(6,851,192)
(10,000,000) RAMP 2005-EFC6 M9 (BEAR pays 5.85%) 11/25/2035 (6,576,706)
(7,500,000) BNC07001 M8 (UBS pays 5.75%) 3/25/2037 (5,232,031)
(6,000,000) HASC 2006 -OPT1 M9 (DB pays 7.45%) 12/25/2035 (4,291,400)
(5,000,000) RFC06NC3 M8 (CITI pays 5.00%) 3/25/2036 (3,759,223)
(5,000,000) SAST 06-1 B3 (GS pays 6.55%) 3/25/2036 (3,086,684)
(5,000,000) RFC05KS9 M8 (UBS pays 5.60%) 10/25/2035 (2,772,204)
(5,000,000) WLT05WC1 M9 (GS pays 7.30%) 10/25/2035 (2,762,035)
(5,000,000) SABR 2005-FR2 B2 (LEH pays 3.20%) 3/25/2035 (2,815,630)
(5,000,000) LBML0502 M8 (GS pays 4.90%) 4/25/2035 (2,589,105)
(5,000,000) CWL 2006 -15 (CS pays 6.25%) 8/25/2042 (2,879,129)
(5,000,000) RFC06KS2 M8 (GS pays 5.75%) 3/25/2036 (3,661,476)
(5,000,000) CMLTI 2006-HE1 M8 (DB pays 2.11%) 1/25/2036 (3,807,247)
(5,000,000) WMLT 2005-WMC1 M9 (CS pays 7.30%) 10/25/2035 (2,778,257)
(2,000,000) FFML 2005-FF2 B3 (GS pays 3.75%) 3/25/2035 (750,320)
------------
Credit Default Swap Contracts, at Value -
(upfront fee receipts: $ 39,723,958) $(54,612,639)
</TABLE>
The accompanying notes are an integral part of these financial statements.
4
<PAGE>
HFH SHORTPLUS MASTER FUND, LTD.
(A CAYMAN ISLANDS EXEMPTED COMPANY)
SCHEDULE OF INVESTMENTS
DECEMBER 31, 2007
--------------------------------------------------------------------------------
(expressed in U.S. dollars)
<TABLE>
<CAPTION>
CREDIT
DEFAULT SWAP
NOTIONAL TERMINATION CONTRACTS,
AMOUNT CREDIT DEFAULT SWAP CONTRACTS, AT VALUE (84.48%) DATE AT VALUE
<C> <C> <C> <C>
$ 2,000,000 FFML 2005-FF2 B3 (Pay GS 1.70%) 3/25/2035 $ 751,087
3,350,000 JPMAC 2005-FRE1 MP (Pay DB 7.00%) 10/25/2035 1,978,175
4,000,000 FFML 2004-FF8 B3 (Pay CS 2.00%) 10/25/2034 596,458
4,000,000 RFC06NC3 M9 (Pay CITI 7.50%) 3/25/2036 2,604,830
4,000,000 RFC06KS8 M5 (Pay GS 1.10%) 10/25/2036 2,739,291
4,000,000 FFML06F5 M9 (Pay CITI 3.35%) 4/25/2036 3,309,590
5,000,000 SAMI 2006-AR1 B6 (Pay CS 3.00%) 2/25/2036 3,035,000
5,000,000 CWE0626 M7 (Pay UBS 2.30%) 5/25/2037 2,877,000
5,000,000 HEAT0607 B1 (Pay CS 5.35%) 1/25/2037 3,820,443
5,000,000 FFML 2006 - FF12 M9 (Pay CITI 3.00%) 9/25/2036 4,161,633
5,000,000 ARS06W01 M9 (Pay GS 2.42%) 3/25/2036 3,924,809
5,000,000 RFC06NC2 M9 (Pay GS 2.42%) 2/25/2036 4,137,900
5,000,000 NFHE0603 M6 (Pay GS 0.98%) 10/25/2036 3,505,230
5,000,000 NFHE0603 M8 (Pay UBS 2.23%) 10/25/2036 3,739,510
5,000,000 RASC 2006-KS3 M9 (Pay GS 2.42%) 4/25/2036 4,074,810
5,000,000 NCHET 2005-D M8 (Pay GS 1.70%) 2/25/2036 2,991,500
5,000,000 ACE 06-OP1 M8 (Pay GS 2.25%) 3/25/2036 4,076,989
5,000,000 MSAC 2006-HE2 B3 (Pay GS 2.42%) 3/25/2036 4,331,125
5,000,000 BSABS 2006-EC2 M9 (Pay GS 3.50%) 2/25/2036 3,987,429
5,000,000 MAB06AM2 M9 (Pay CS 4.50%) 6/25/2036 4,210,759
5,000,000 MLMI 2005-HE1 B3 (Pay GS 1.24%) 3/25/2037 4,015,848
5,000,000 SABR 2005-FR2 B2 (Pay UBS 1.92%) 3/25/2035 2,822,047
5,000,000 LBML0502 M8 (Pay CITI 2.40%) 4/25/2035 2,601,605
5,000,000 CMLTI 2006-HE1 M8 (Pay GS 2.11%) 1/25/2036 3,820,448
5,000,000 RFC05KS9 M8 (Pay UBS 3.50%) 10/25/2035 2,782,715
5,000,000 CWHE0615 B (Pay ML 4.75%) 10/25/2046 2,886,629
5,000,000 CHEC06A M9 (Pay CITI 2.87%) 6/25/2036 3,097,201
5,000,000 SAST 06-1 B3 (Pay UBS 4.30%) 3/25/2036 3,097,934
5,000,000 RFC06EM8 M5 (Pay GS 1.50%) 10/25/2036 3,173,000
5,000,000 ACCT0601 M9 (Pay GS 2.17%) 4/25/2036 3,217,315
5,000,000 ACCT0601 M9 (Pay CS 3.72%) 4/25/2036 3,209,565
5,000,000 CWHE0614 M8 (Pay CITI 6.90%) 2/25/2037 3,315,500
5,000,000 CWHE0610 MV9 (Pay CITI 8.50%) 9/25/2046 3,440,023
5,000,000 SVHE06E1 M9 (Pay CITI 5.75%) 10/25/2036 3,511,748
5,000,000 FFM07FF1 B1 (Pay CITI 3.10%) 1/25/2038 3,627,912
5,000,000 RFC06KS2 M8 (Pay CITI 2.50%) 3/25/2036 3,677,726
5,000,000 RASC 2007-KS2 M8 (Pay GS 2.80%) 2/25/2037 3,740,497
5,000,000 BSABS 2007-HE2 2M8 (Pay GS 3.25%) 3/25/2037 3,873,094
5,000,000 GSA06HE7 M9 (Pay CITI 5.50%) 10/25/2036 3,888,971
5,000,000 FFML 06-FF6 M6 (Pay GS 2.65%) 4/25/2036 3,934,604
5,000,000 RASC 2007-KS2 M8 (Pay GS 3.25%) 2/25/2037 3,950,383
5,000,000 ACE06OP1 M9 (Pay DB 3.25%) 4/25/2036 4,109,693
5,000,000 GSA06HE7 M9 (Pay GS 5.80%) 10/25/2036 4,120,351
</TABLE>
The accompanying notes are an integral part of these financial statements.
5
<PAGE>
HFH SHORTPLUS MASTER FUND, LTD.
(A CAYMAN ISLANDS EXEMPTED COMPANY)
SCHEDULE OF INVESTMENTS
DECEMBER 31, 2007
--------------------------------------------------------------------------------
(expressed in U.S. dollars)
<TABLE>
<CAPTION>
CREDIT
DEFAULT SWAP
NOTIONAL TERMINATION CONTRACTS,
AMOUNT CREDIT DEFAULT SWAP CONTRACTS, AT VALUE (84.48%) DATE AT VALUE
<C> <C> <C> <C>
$ 5,000,000 CWHE0619 M9 (Pay CITI 3.35%) 3/25/2037 $ 4,216,615
6,000,000 CWL 2006-26 M9 (Pay CS 4.79%) 6/25/2037 4,762,222
6,000,000 HSA06OP1 M9 (Pay GS 3.80%) 12/25/2035 4,323,348
6,250,000 RFC06EF1 M8 (Pay UBS 2.45%) 4/25/2036 4,047,188
7,500,000 CWL 2006 - 22 M8 (Pay CS 5.00%) 5/25/2037 5,876,598
7,500,000 CWABS INC 2006-26 (Pay GS 2.75%) 8/25/2037 5,697,813
7,500,000 OOMLT0503 M9 (Pay GS 10.25%) 8/25/2035 4,562,982
7,500,000 BNC07001 M8 (Pay UBS 3.53%) 3/25/2037 5,223,525
7,500,000 FFM07FF1 B2 (Pay UBS 5.25%) 1/25/2038 5,255,116
7,500,000 FFM06F17 M8 (Pay UBS 5.53%) 12/25/2036 6,018,409
7,500,000 FFM06F15 M8 (Pay CITI 5.43%) 11/25/2036 6,261,120
10,000,000 FFM07FF1 B2 (Pay UBS 3.10%) 1/25/2038 5,429,476
10,000,000 NOVASTAR MTG FDG TR 2006-5 (Pay UBS 3.14%) 11/25/2036 7,167,728
10,000,000 SAIL 2006-4 M4 (Pay CS 3.75%) 7/25/2036 6,849,220
10,000,000 WLT05WC1 M9 (Pay BEAR 5.05%) 10/25/2035 5,546,570
10,000,000 RFC05EF6 M9 (Pay CITI 3.80%) 11/25/2035 6,537,957
10,000,000 CWHE0610 MV9 (Pay BEAR 8.25%) 9/25/2046 6,951,296
10,000,000 OOMLT0603 M8 (Pay UBS 4.78%) 2/25/2037 7,741,132
10,000,000 SAS06EQ1 M8 (Pay UBS 1.60%) 7/25/2036 7,834,000
10,000,000 FFM06F17 M8 (Pay DB 2.90%) 12/25/2036 8,187,489
10,000,000 FFM06F12 M8 (Pay UBS 5.42%) 9/25/2036 8,163,516
------------
Credit Default Swap Contracts, at Value -
(upfront fee payments: $ 79,349,003) $271,421,697
------------
Total Net Credit Default Swap Contracts, at Value $216,809,058
------------
</TABLE>
The accompanying notes are an integral part of these financial statements.
6
<PAGE>
HFH SHORTPLUS MASTER FUND, LTD.
(A CAYMAN ISLANDS EXEMPTED COMPANY)
SCHEDULE OF INVESTMENTS
DECEMBER 31, 2007
--------------------------------------------------------------------------------
(expressed in U.S. dollars)
SECURITIES PURCHASED UNDER AGREEMENTS TO RESELL
DAYS TO REPURCHASE
COUNTERPARTY RATE MATURITY AGREEMENT TOTAL
Bear Stearns 4.60% 2 $ 59,174,000
-------------
Total $ 59,174,000
-------------
The accompanying notes are an integral part of these financial statements.
7
<PAGE>
HFH SHORTPLUS MASTER FUND, LTD.
(A CAYMAN ISLANDS EXEMPTED COMPANY)
STATEMENT OF OPERATIONS
YEAR ENDED DECEMBER 31, 2007
--------------------------------------------------------------------------------
(expressed in U.S. dollars)
<TABLE>
<CAPTION>
<S> <C>
INVESTMENT INCOME
Interest (includes interest from an affiliated investment
of $427,870) $ 11,304,208
Dividends 1,257,011
-------------
Total investment income 12,561,219
INVESTMENT EXPENSE
Interest 4,935,004
-------------
OTHER EXPENSES
Custody fees 62,530
Professional fees 308,250
Administration fees 141,333
Director fees 17,160
Other expenses 6,352
-------------
Total other expenses 535,625
-------------
Total expenses 5,470,629
-------------
Net investment income 7,090,590
-------------
NET REALIZED AND UNREALIZED GAIN (LOSS)
Net realized gain (loss) on
Investments (8,247,891)
Swap contracts 107,929,188
-------------
Net realized gain 99,681,297
-------------
Net change in unrealized appreciation/(depreciation) on
Investments (includes depreciation from an affiliated
investment of $5,160,391) (61,374,144)
Swap contracts 178,219,519
-------------
Net change in unrealized appreciation 116,845,375
-------------
Net realized and unrealized gain 216,526,672
-------------
Net increase in net assets resulting from operations $ 223,617,262
=============
</TABLE>
The accompanying notes are an integral part of these financial statements.
8
<PAGE>
HFH SHORTPLUS MASTER FUND, LTD.
(A CAYMAN ISLANDS EXEMPTED COMPANY)
STATEMENT OF CHANGES IN NET ASSETS
YEAR ENDED DECEMBER 31, 2007
--------------------------------------------------------------------------------
(expressed in U.S. dollars)
<TABLE>
<CAPTION>
<S> <C> <C> <C> <C> <C> <C>
FROM OPERATIONS
Net investment income $ 7,090,590
Net realized gain 99,681,297
Net change in unrealized appreciation 116,845,375
-------------
Net increase in net assets resulting from operations 223,617,262
-------------
FROM CAPITAL SHARE TRANSACTIONS
Subscriptions 135,380,623
Redemptions (37,695,165)
-------------
Net increase in net assets resulting from capital share transactions 97,685,458
-------------
Total increase in net assets 321,302,720
NET ASSETS
Beginning of year --
-------------
End of year $ 321,302,720
-------------
</TABLE>
The accompanying notes are an integral part of these financial statements.
9
<PAGE>
HFH SHORTPLUS MASTER FUND, LTD.
(A CAYMAN ISLANDS EXEMPTED COMPANY)
STATEMENT OF CASH FLOWS
YEAR ENDED DECEMBER 31, 2007
--------------------------------------------------------------------------------
(expressed in U.S. dollars)
<TABLE>
<CAPTION>
<S> <C>
NET INCREASE IN NET ASSETS RESULTING FROM OPERATIONS $ 223,617,262
Adjustments to reconcile net increase in net assets resulting from
operations to net cash provided from operating activities
Purchase of investment securities (111,312,492)
Purchase of credit default swaps (87,793,098)
Proceeds from dispositions of investment securities
(including paydowns) 29,393,740
Proceeds from dispositions of credit default swaps 156,097,241
Net realized (gain)/loss on investments 8,247,891
Net realized (gain)/loss on swap contracts (107,929,188)
Net change in unrealized depreciation on investments 61,374,144
Change in net value of swap contracts (177,184,013)
Change in margin cash received from counterparties 218,648,130
Change in margin cash paid to counterparties (1,800,244)
Change in securities purchased under agreements to resell (59,174,000)
Change in interest receivable (126,085)
Change in interest payable on margin cash 953,919
Change in accrued expenses and other liabilities 233,750
Change in due to brokers 95,483 Change in other assets (89,134)
-------------
Net cash provided from operating activities 153,253,306
-------------
CASH PROVIDED FROM FINANCING ACTIVITIES
Capital subscriptions 135,380,623
Capital redemptions (37,695,165)
-------------
Net cash provided from financing activities 97,685,458
-------------
Net change in cash and cash equivalents 250,938,764
CASH AND CASH EQUIVALENTS
Beginning of year --
-------------
End of year $ 250,938,764
=============
SUPPLEMENTAL DISCLOSURE OF CASH FLOW INFORMATION
Interest paid $ 3,981,085
=============
</TABLE>
The accompanying notes are an integral part of these financial statements.
10
<PAGE>
HFH SHORTPLUS MASTER FUND, LTD.
(A CAYMAN ISLANDS EXEMPTED COMPANY)
FINANCIAL HIGHLIGHTS
YEAR ENDED DECEMBER 31, 2007
--------------------------------------------------------------------------------
(expressed in U.S. dollars)
Results of operations for a share outstanding for the year ended December 31,
2007 are as follows:
Per share operating performance(a)
NET ASSET VALUE PER SHARE, BEGINNING OF YEAR $ 100,000.00
Net investment income 7,873.42
Net realized and unrealized gain 237,056.11
--------------
NET ASSET VALUE PER SHARE, END OF YEAR $ 344,929.53
==============
Total return(b) 244.93%
RATIOS TO AVERAGE NET ASSETS
Operating expense(c) (3.34)%
Operating expense excluding interest expense(c) (0.33)%
Net investment income(c) 4.33%
(a) Per share operating performance is computed based upon the monthly
outstanding shares.
(b) Total return is calculated for a share outstanding the entire year. An
individual shareholder's return may differ depending on the timing of
subscriptions and redemptions.
(c) The operating expense and net investment income ratios are calculated for
the Fund taken as a whole. An individual shareholder's ratio may vary from
these ratios based on the timing of capital transactions.
The accompanying notes are an integral part of these financial statements.
11
<PAGE>
HFH SHORTPLUS MASTER FUND, LTD.
(A CAYMAN ISLANDS EXEMPTED COMPANY)
NOTES TO FINANCIAL STATEMENTS
DECEMBER 31, 2007
--------------------------------------------------------------------------------
1. ORGANIZATION AND INVESTMENT OBJECTIVE
HFH ShortPLUS Master Fund, Ltd. (the "Fund") is a Cayman Islands
exempted company incorporated in accordance with the Companies Law (2004
revision) which commenced operations on January 2, 2007. The Fund's
strategy is to assemble a short-biased portfolio of asset-backed
securities ("ABS") that the Investment Manager believes are most likely
to produce high returns during periods of adverse credit performance for
residential mortgages, and for mortgage-backed securities ("MBS") and
ABS. Returns will come from two principal sources: (i) market value
changes arising from changes in credit spreads on the Fund's short
positions; and (ii) credit default payments from counterparties on
credit default swaps ("CDS") or other derivatives.
Highland Financial Holdings Group, LLC ("Investment Manager") serves as
the investment manager of the Fund. The Investment Manager manages and
invests the Fund's assets and effects all security transactions on
behalf of the Fund.
The Fund operates under a "master fund/feeder fund" structure. HFH
ShortPLUS Fund, Ltd. and HFH ShortPLUS Fund, L.P. (collectively, the
"Feeder Funds") invest substantially all of their investable assets in
the Fund. The following Feeder Funds were invested in the Fund at
December 31, 2007:
HFH ShortPLUS Fund, Ltd. $237,378,889
HFH ShortPLUS Fund, L.P. 83,923,831
------------
Total Feeder Funds' investment in the Fund $321,302,720
------------
2. SUMMARY OF SIGNIFICANT ACCOUNTING POLICIES
USE OF ESTIMATES
The financial statements are prepared in accordance with accounting
principles generally accepted in the United States of America ("U.S.
GAAP"). The preparation of financial statements in accordance with U.S.
GAAP requires management to make estimates and assumptions, including
estimates of fair value investments and CDS, that affect the reported
amounts and disclosures in the financial statements. Actual results
could differ from these estimates and those differences could be
material to the financial statements.
BASIS OF ACCOUNTING
Transactions in securities are recorded on a trade date basis. Realized
and unrealized gains/losses are calculated based on a FIFO cost basis.
Interest income is recorded on an accrual basis when earned. Operating
expenses, including interest on securities sold short, margin deposits,
and reverse repurchase agreements, are recorded on the accrual basis as
incurred.
CASH AND CASH EQUIVALENTS
Cash and cash equivalents consist principally of cash, margin cash
received from counterparties, and short term investments (treasury
bills), which are readily convertible into cash and have original
maturities of three months or less.
12
<PAGE>
HFH SHORTPLUS MASTER FUND, LTD.
(A CAYMAN ISLANDS EXEMPTED COMPANY)
NOTES TO FINANCIAL STATEMENTS
DECEMBER 31, 2007
--------------------------------------------------------------------------------
VALUATION
Investments in securities held by the Fund are carried at value. Value
for such investments is estimated by the Investment Manager. The
Investment Manager will use its reasonable discretion to value each
investment by using, as a guide, a combination of (i) independent,
third-party pricing sources; (ii) indications from one or more financial
institutions engaged in trading the investments or securities similar to
the investments being valued; (iii) transactions in the market of the
same or similar securities; and (iv) in-house models the Investment
Manager maintains. In cases where the number of indications is limited,
the Investment Manager will review other factors such as the previous
month's value, whether such indication is from the same counterparty,
the delta between the current value and the previous month value,
relevant market data or news, the value of similar securities, recent
trading information and any other information which may be deemed
relevant at the discretion of the Investment Manager. With respect to
CDS, the Investment Manager may use, if considered representative of the
value of CDS positions, margin marks from the actual counterparty with
whom the security was traded, or from counterparties of a similar CDS
position to estimate the valuation. However, if the Investment Manager
believes the exit price will be either greater or less than the current
margin mark, the Investment Manager has the discretion to revise the
value accordingly.
Fair value determinations based on indications from financial
institutions or margin marks from counterparties may be based on as few
as a single indication/margin mark, or may be calculated as the average
of more than one such indication/margin mark, which average may include
recent transactions in the market or ignore outlying indications/margin
marks based on the Investment Manager's discretion. The Investment
Manager may use observable transactions in the market in determining the
fair value of investments if, at the discretion of the Investment
Manager, prioritization of such transactions is considered more relevant
given market conditions or other factors. Securities for which no
indications are available are to be valued at such value as the
Investment Manager may reasonably determine.
The Investment Manager defines investments that are fair valued as those
investments for which an investment is valued solely based on an
in-house maintained model. As of December 31, 2007, these financial
statements include investments fair valued by such in-house model
totaling $4,705,836 (1.5% of net assets). In addition, the Investment
Manager has determined that conditions in the 2007 asset backed
securities market have impacted the extent of relevant data points that
are available to estimate fair value of the Fund's investments. These
market conditions include reduced liquidity, increased risk premiums for
issuers, reduced investor demand for asset-backed securities,
particularly those securities backed by sub-prime collateral, general
financial stress and rating agency downgrades, and a general tightening
of available credit. At December 31, 2007, the values for approximately
$7,507,552 (2.3% of net assets) of investments, $176,174,662 (54.8% of
net assets) of CDS "receiving" protection, and -$3,759,223 (-1.2% of net
assets) of CDS "providing" protection were primarily estimated using one
indication/margin mark obtained from an external source. Given market
conditions described above, the indication/margin mark provided by
financial institutions may differ from the bid or ask that market
participants would be willing to transact. As a result, the range of
fair value of investments and CDS positions can be significant and the
values reflected in these financial statements may differ from the
values that would have been realized had such investments been
liquidated.
Options that are listed on or admitted to trading on one or more
exchanges are valued at the last sale price, if such price is equal to
or is between, the "bid" and the "ask" prices (otherwise, the mean
between the "bid" and "ask" prices is used). If options are not listed
or admitted to trading on one or more exchanges, the fair value of such
options is obtained from external parties which may include the contract
13
<PAGE>
HFH SHORTPLUS MASTER FUND, LTD.
(A CAYMAN ISLANDS EXEMPTED COMPANY)
NOTES TO FINANCIAL STATEMENTS
DECEMBER 31, 2007
--------------------------------------------------------------------------------
counterparty. Future contracts traded on a national exchange or market
are valued at the last reported sales price on the valuation date.
DERIVATIVE INSTRUMENTS AND HEDGING ACTIVITIES
The Fund recognizes the market value of all derivative instruments as
either assets or liabilities in the Statement of Assets and Liabilities
and measures those instruments at fair value.
INTEREST RATE AND INDEX SWAPS
The Fund may enter into interest rate and index swaps as part of its
investment strategies. Swaps involve the exchange by the Fund with
another party of respective commitments to pay or receive interest,
effective return, or total return throughout the lives of the
agreements. The Fund may be required to deliver or receive cash or
securities as collateral upon entering into swap transactions. Movements
in the relative value of the swap transactions may require the Fund or
the counterparty to post additional collateral. Swaps change in value
with movements in interest rates. During the term of the swap contracts,
changes in value and accrued interest payments are recognized as
unrealized gains or losses by marking the contracts to the market. These
unrealized gains and losses are reported as an asset or liability,
respectively, on the Statement of Assets and Liabilities. When contracts
are terminated, the Fund will realize a gain or loss equal to the
difference between the proceeds from (or cost of) the closing
transaction and the Fund's basis in the contract, if any.
CREDIT DEFAULT SWAPS
The Fund enters into credit default swaps to simulate long and short
bond positions that are either unavailable or considered to be less
attractively priced in the bond market. The Fund uses these swaps to
attempt to reduce risk where the Fund has exposure to the issuer, or to
take an active long or short position with respect to the likelihood of
the issuer's default. There is no certainty that the objectives of
holding credit default swaps will be achieved.
The buyer of a credit default swap is obligated to pay the seller a
periodic stream of payments over the term of the contract in return for
a contingent payment upon the occurrence of a credit event, with respect
to an underlying reference obligation. Generally, a credit event means
bankruptcy, failure to pay, obligation accelerated or modified
restructuring. If a credit event occurs, the seller typically must pay
the contingent payment to the buyer, which is typically the par value
(full notional value) of the reference obligation. The contingent
payment may be a cash settlement or by a physical delivery of the
reference obligation in return for payment of the face amount of the
obligation. If the Fund is a buyer and no credit event occurs, the Fund
may lose its investment and recover nothing. However, if a credit event
occurs, the buyer typically receives full notional value and interest
for a reference obligation that may have little or no value. As a
seller, the Fund receives a fixed rate of income throughout the term of
the contract, provided that no credit event occurs. If a credit event
occurs, the seller may pay the buyer the full notional value and
interest of the reference obligation. Upfront payments made and/or
received by the Fund are recorded as an asset and/or liability on the
Statement of Assets and Liabilities and are recorded as a realized gain
or loss on the termination date.
As of December 31, 2007, the Fund has 79 open credit default swaps. The
Fund is the buyer on 64 of these swaps ("receiving protection" on a
total notional amount of $382.1 million) and is the seller on the
remaining 15 ("providing protection" on a total notional amount of $85.5
million).
Credit default swaps involve greater risks than if the Fund had invested
in the reference obligations directly. In addition to general market
risks, credit default swaps are subject to liquidity risk and
counterparty credit risk. A buyer also may lose its investment and
recover nothing should a credit event not occur. If a credit event did
14
<PAGE>
HFH SHORTPLUS MASTER FUND, LTD.
(A CAYMAN ISLANDS EXEMPTED COMPANY)
NOTES TO FINANCIAL STATEMENTS
DECEMBER 31, 2007
--------------------------------------------------------------------------------
occur, the value of the reference obligation received by the seller,
coupled with the periodic payments previously received, may be less than
the full notional value it pays to the buyer, resulting in a loss of
value.
The notional amounts of the swaps are not recorded in the financial
statements. The swaps are carried at their estimated fair value, as
determined in good faith by the Investment Manager. The change in value
is recorded within unrealized appreciation (depreciation) until the
occurrence of a credit event or the termination of the swap, at which
time a realized gain (loss) is recorded.
FUTURES
A futures contract is an agreement between two parties to buy or sell a
financial instrument for a set price on a future date. Initial margin
deposits are made upon entering into futures contracts and can be either
cash or securities. During the period the futures contract is open,
changes in the value of the contract are recognized as unrealized gains
or losses by marking to market on a daily basis to reflect the market
value of the contract at the end of each day's trading. When the
contract is closed, the Fund records a realized gain or loss equal to
the difference between the proceeds of the closing transaction and the
Fund's basis in the contract.
PURCHASED OPTIONS
The Fund may purchase put or call options. When the Fund purchases an
option, an amount equal to the premium paid is recorded as an asset and
is subsequently marked-to-market. Premiums paid for purchasing options
that expire unexercised are recognized on the expiration date as
realized losses. If an option is exercised, the premium paid is
subtracted from the proceeds of the sale or added to the cost of the
purchase to determine whether the Fund has realized a gain or loss on
the related investment transaction. When the Fund enters into a closing
transaction, the Fund will realize a gain or loss depending upon whether
the amount from the closing transaction is greater or less than the
premium paid.
WRITTEN OPTIONS
The Fund may write put or call options. When the Fund writes an option,
an amount equal to the premium received is recorded as a liability and
is subsequently marked-to-market. Premiums received for writing options
that expire unexercised are recognized on the expiration date as
realized gains. If an option is exercised, the premium received is
subtracted from the cost of the purchase or added to the proceeds of the
sale to determine whether the account has realized a gain or loss on the
related investment transaction. When the Fund enters into a closing
transaction, the Fund will realize a gain or loss depending upon whether
the amount from the closing transaction is less or greater than the
premium received.
SHORT SALES
When the Fund sells short, it may borrow the security sold short and
deliver it to the broker-dealer through which it sold short as
collateral for its obligation to deliver the security upon conclusion of
the sale. Additionally, the Fund generally is required to deliver cash
or securities as collateral for the Fund's obligation to return the
borrowed security. The Fund may have to pay a fee to borrow the
particular securities and may be obligated to pay over any payments
received on such borrowed securities. A gain, limited to the price at
which the Fund sold the security short, or a loss, unlimited as to
dollar amount, will be recognized upon the termination of a short sale
if the market price is less or greater than the proceeds originally
received.
15
<PAGE>
HFH SHORTPLUS MASTER FUND, LTD.
(A CAYMAN ISLANDS EXEMPTED COMPANY)
NOTES TO FINANCIAL STATEMENTS
DECEMBER 31, 2007
--------------------------------------------------------------------------------
FINANCING TRANSACTIONS
The Fund enters into repurchase agreements as a borrower (securities
sold under agreement to repurchase) and as a lender (securities
purchased under agreement to resell). All repurchase agreements are
carried at their contractual amounts on the Statement of Assets and
Liabilities, and the accrued income (expense) is recorded separately.
Securities sold under agreements to repurchase include buy-sell
financing transactions.
SECURITIES SOLD UNDER AGREEMENTS TO REPURCHASE
("REVERSE REPURCHASE AGREEMENTS")
The Fund monitors collateral market values relative to the amounts due
under the agreements, including accrued interest, throughout the lives
of the agreements, and when necessary, requires transfer of cash or
securities in order to manage exposure and liquidity. In connection with
such agreements, if the counterparty defaults or enters an insolvency
proceeding, realization or return of the collateral to the Fund may be
delayed or limited.
At December 31, 2007, the Fund had no securities sold under agreements
to repurchase.
SECURITIES PURCHASED UNDER AGREEMENTS TO RESELL ("REPURCHASE
AGREEMENTS")
Securities purchased under agreements to resell are generally
collateralized principally by U.S. government and agency securities. The
Fund takes possession of such underlying collateral, monitors its market
value relative to the amounts due under the agreements, including
accrued interest, throughout the lives of the agreements, and when
necessary, may require a transfer of additional cash or securities in
order to manage exposure and liquidity. In connection with such
agreements, if the counterparty defaults or enters an insolvency
proceeding, realization or return of the funds to the Fund may be
delayed or limited.
At December 31, 2007, the Fund had securities purchased under agreements
to resell totaling $59,174,000. The Fund received collateral in the form
of various FNMA MBS pools under a held in custody agreement with an
interest rate of 4.6% and a maturity of two days. The value of the
securities, including accrued interest, received as collateral by the
Fund that it was permitted to sell or repledge was $59,189,122.
INCOME TAXES
The Fund is a Cayman Islands exempted company. Under the current laws of
the Cayman Islands, there are no income, estate, transfer, sale or other
taxes payable by the Fund. The Fund is taxed as a partnership for U.S.
Federal income tax purposes, and as such, is not subject to income
taxes; each investor may be individually liable for income taxes, if
any, on its share of the Fund's net taxable income. The Fund trades
securities for its own account and, as such, investors are generally not
subject to U.S. tax on such earnings (other than certain withholding
taxes indicated below). The Investment Manager intends to conduct the
business of the Fund to the maximum extent practicable so that the
Fund's activities do not constitute a U.S. trade or business. Interest
and other income received by the Fund from sources within the United
States may be subject to, and reflected net of, United States
withholding tax at the rate of 30%. Interest, dividend and other income
realized by the Fund from non-U.S. sources and capital gains realized on
the sale of securities of non-U.S. issuers may be subject to withholding
and other taxes levied by the jurisdiction in which the income is
sourced.
On February 1, 2008, FASB issued FIN 48-2, Effective Date of FASB
Interpretation No. 48 for Certain Nonpublic Enterprises ("FSP"), which
allows the Fund to defer the adoption of FIN 48 until periods beginning
after December 15, 2007. The Investment Manager has elected to take
advantage of this deferral. Based on its analysis, the Investment
Manager has determined that the adoption of FIN 48 will not have a
16
<PAGE>
HFH SHORTPLUS MASTER FUND, LTD.
(A CAYMAN ISLANDS EXEMPTED COMPANY)
NOTES TO FINANCIAL STATEMENTS
DECEMBER 31, 2007
--------------------------------------------------------------------------------
material impact to the Fund's financial statements. However, the
Investment Manager's conclusions regarding FIN 48 may be subject to
review and adjustment at a later date based on factors including, but
not limited to, further implementation guidance, and on-going analyses
of tax laws, regulations and interpretations thereof.
FIN 48 requires the Investment Manager to determine whether a tax
position of the Fund is more likely than not to be sustained upon
examination by the applicable taxing authority, including resolution of
any related appeals or litigation processes, based on the technical
merits of the position. The tax benefit to be recognized is measured as
the largest amount of benefit that is greater than fifty percent likely
of being realized upon ultimate settlement which could result in the
Fund recording a tax liability that would reduce net assets. FIN 48 must
be applied to all existing tax positions upon initial adoption and the
cumulative effect, if any, is to be reported as an adjustment to net
assets upon adoption.
3. DUE TO/FROM BROKERS
The Fund has brokerage agreements with various brokerage firms to carry
its account as a customer. The brokers have custody of the Fund's
securities and, from time to time, cash balances may be due to/from
these brokers.
These securities and/or cash positions serve as collateral for any
amounts due to brokers or as collateral for securities sold, not yet
purchased or investment securities purchased on margin. The securities
and/or cash positions also serve as collateral for potential defaults of
the Fund.
The Fund is subject to credit risk if the brokers are unable to repay
balances due or deliver securities in their custody.
4. FINANCIAL INSTRUMENTS WITH OFF-BALANCE SHEET RISK AND OTHER RISKS
The Fund may invest on a leveraged basis in various financial
instruments and is exposed to market risks resulting from changes in the
fair value of the instruments. The Statement of Assets and Liabilities
may include the market or fair value of contractual commitments
involving forward settlements, futures contracts and swap transactions
as well as investments in securities sold short. These instruments
involve elements of market risk in excess of amounts reflected on the
Statement of Assets and Liabilities. Derivative financial statements are
used by the Fund to help manage such market risk and to take an active
long or short position in the market. Should interest rates move
unexpectedly, the Fund may not achieve the anticipated benefits of the
hedging instruments and may realize a loss. Further, the use of such
derivative instruments involves the risk of imperfect correlation in
movements in the price of the instruments, interest rates and the
underlying hedged assets.
The investment characteristics of mortgage-backed and asset-backed
securities differ from traditional debt securities. Among the major
differences are that interest and principal payments are made more
frequently, usually monthly, and that principal may be prepaid at any
time because the underlying residential or commercial mortgage loans or
other assets generally may be prepaid at any time. Maturities on
mortgage-backed and asset-backed securities represent stated maturity
dates. Actual maturity dates may differ based on prepayment rates.
The Fund is exposed to credit-related losses in the event of
nonperformance by counterparties to financial instruments. The maximum
credit exposure related to the derivative financial instruments of the
17
<PAGE>
HFH SHORTPLUS MASTER FUND, LTD.
(A CAYMAN ISLANDS EXEMPTED COMPANY)
NOTES TO FINANCIAL STATEMENTS
DECEMBER 31, 2007
--------------------------------------------------------------------------------
Fund is equal to the fair value of the contracts with positive fair
values as of December 31, 2007. It is the policy of the Fund to transact
the majority of its securities and contractual commitment activity with
broker-dealers, banks and regulated exchanges that the Investment
Manager considers to be well established.
The Fund's short-biased strategy depends in large measure upon the
ability of the Investment Manager to identify ABS that experience future
credit losses arising from the defaults by obligors on the related
mortgage loans. This is the opposite approach from that employed in
traditional long-bias credit investment strategies that generally seek
to avoid credit losses on investments purchased on the basis of
fundamental credit analysis, or on other bases.
There can be no assurance that the Investment Manager's assessments of
the likelihood of default and losses on specific ABS transactions will
be accurate or that the predictive strengths of the Investment Manager's
models and practices will not decline. Even if ABS default and loss
rates increase generally in the future relative to the rates observed in
the past, the Fund's return objectives will not be met if the Fund has
bought credit protection or otherwise shorted securities that do not
experience such higher default and loss rates.
The Fund's strategy also includes long investments that are intended to
generate positive income during the first several years of the Fund, in
order to partially offset the negative carry of the short positions.
Losses on these long positions could produce losses for the Fund and
could result in the failure of the Fund to achieve the intended purpose
of offsetting the CDS premium costs.
The Fund is a new enterprise with limited operating history.
Accordingly, an investment in the Fund entails risk. There can be no
assurance that the Fund will achieve its investment objective or that
the Fund's strategies will be successful. There exists a possibility
that an investor could suffer a substantial loss as a result of an
investment in the Fund.
The success of any investment activity is influenced by general economic
conditions that may affect the level and volatility of equity prices,
credit spreads, interest rates and the extent and timing of investor
participation in the markets for both equity and interest-rate-sensitive
securities. Unexpected volatility or illiquidity in the markets in which
the Fund directly or indirectly holds positions could impair the Fund's
ability to carry out its business and could cause the Fund to incur
losses.
Depending on market conditions, reliable pricing information will not
always be available from any source. Prices quoted by different sources
are subject to material variation.
Credit-sensitive tranches of ABS are exposed to credit risk arising from
possible defaults of the underlying loans and recovery rates on those
liquidated loans. The default rates of loans backing these securities is
dependent on a number of factors including the quality and
characteristics of the loans, national and regional economic growth,
real estate values, the level of interest rates, changes in the
availability of mortgage financing and other factors. Recovery values
following a default will be dependent largely on regional and national
real estate values among other things; although real estate values may
depend on other economic variables.
The rate of prepayments on the loans collateralizing a subordinate ABS
tranche will generally have a significant effect on the amount of
obligor defaults a tranche can face before suffering losses of interest
or principal. The Investment Manager believes it is impossible to
accurately predict prepayment rates because prepayment rates are heavily
influenced by equally unpredictable interest rates. Consequently, while
18
<PAGE>
HFH SHORTPLUS MASTER FUND, LTD.
(A CAYMAN ISLANDS EXEMPTED COMPANY)
NOTES TO FINANCIAL STATEMENTS
DECEMBER 31, 2007
--------------------------------------------------------------------------------
the Investment Manager seeks to explore the potential effects of a wide
range of possible prepayment rates for securities or CDS it purchases or
sells, there can be no assurance that this analysis will exhaust the
possible paths prepayments could take, or that the effects of any
particular prepayment rate scenario will be evaluated correctly in
respect of a specific ABS tranche or CDS.
A decline in the market value of the Fund's portfolio of assets may
limit the Investment Manager's ability to borrow, or may result in
lenders initiating margin calls (i.e., requiring a pledge of cash or
additional assets to re-establish the ratio of the amount of the
borrowing to the value of the collateral). The Investment Manager could
be required to sell assets at distressed prices under adverse market
conditions in order to satisfy the requirements of the lenders. A
default by the Fund under its collateralized borrowings could also
result in a liquidation of the collateral by the lender, including any
cross-collateralized assets, and a resulting loss of the difference
between the value of the collateral and the amount borrowed.
As discussed in Note 1, the Fund's investors are two Feeder Funds
managed by the Investment Manager. The Fund could be materially affected
by significant subscriptions and redemptions from the underlying
investors of these Feeder Funds.
5. SHARE CAPITAL
The authorized share capital of the Fund consists of 5,000,000 shares
having a par value of $0.01 (U.S.) per share. At December 31, 2007,
931.50 shares were issued and outstanding.
Common shares are offered at an offering price equal to the net asset
value per common share as of the close of business on the immediately
preceding business day.
Any holder of common shares has the right, in accordance with and
subject to the applicable provisions of the memorandum of association of
the Fund and the laws of the Cayman Islands, to have all or a portion of
their shares redeemed on a date determined by the Directors.
At December 31, 2007, all outstanding shares are held by the Feeder
Funds.
The following table reconciles share transactions for the year ended
December 31, 2007:
SHARES
Balance, January 2, 2007 --
Shares issued 1,150.86
Shares redeemed (219.36)
-----------
BALANCE, DECEMBER 31, 2007 931.50
===========
The Directors of the Fund have the sole discretion to authorize
distribution of dividends.
6. DIRECTORS AND FEES
The following persons are independent non-executive Directors of the
Fund:
o David Bree
19
<PAGE>
HFH SHORTPLUS MASTER FUND, LTD.
(A CAYMAN ISLANDS EXEMPTED COMPANY)
NOTES TO FINANCIAL STATEMENTS
DECEMBER 31, 2007
--------------------------------------------------------------------------------
o Peter Burnim
All members of the Board of Directors are reimbursed for their
out-of-pocket expenses incurred in connection with the performance of
their duties and each receives an annual fee of approximately $5,000. No
Directors have a shareholder interest in the Fund or have an interest,
direct or indirect, in any transaction affecting the Fund during the
year ended December 31, 2007, which is unusual in nature or significant
to the business of the Fund. No Director has any contracts of
significance with the Fund.
7. CONTINGENCIES AND COMMITMENTS
In the normal course of business, the Fund enters into contracts that
contain a variety of representations, warranties and general
indemnifications. The Fund's maximum exposure under these arrangements,
including future claims that may be made against the Fund that have not
yet occurred, is unknown. However, based on experience of the Investment
Manager, the Fund expects the risk of loss associated with such
contracts to be remote.
8. RELATED PARTY TRANSACTIONS
The Investment Manager provides discretionary services to other funds
that follow an investment program similar to that which was followed by
the Fund. Investments may be allocated between the Fund and other funds.
Also, the Fund may purchase securities from and sell securities to such
other funds. No additional transaction costs are incurred by the Fund as
a result of such transactions. The Investment Manager allocates certain
expenses to the Fund for the day-to-day accounting and administrative
services performed by its employees on behalf of the Fund. For the
year-ended December 31, 2007, these costs amounted to $163,588. These
costs are included in the Fund's "professional expenses" on the
statement of operations.
9. SUBSEQUENT EVENTS
From January 1 through March 1, 2008, the Fund had redemptions of
$33,617,455.
In September 2006, the Financial Accounting Standards Board issued
Statement of Financial Accounting Standards No. 157, Fair Value
Measurements ("SFAS 157"). SFAS 157 defines fair value, establishes a
framework for measuring fair value, and expands disclosures about fair
value measurements. SFAS 157 applies to reporting periods beginning
after November 15, 2007. The adoption of SFAS 157 is not expected to
have a material impact on the Fund's financial statements.
20
<PAGE>
AFFIRMATION OF COMMODITY POOL OPERATOR
To the best of my knowledge and belief the information contained herein
pertaining to HFH ShortPLUS Master Fund, Ltd. is accurate and complete.
Highland Financial Holdings Group, LLC
Commodity Pool Operator
------------------------------------------
By Paul Ullman
President of Highland Financial Holdings
Group, LLC The Investment Manager of
Highland ShortPLUS Master Fund, Ltd.
21
CONSOLIDATED FINANCIAL STATEMENTS
Premier Entertainment Biloxi LLC and Subsidiary
Debtor-In-Possession
Period From January 1, 2007 Through August 9, 2007
(end of pre-emergence period)
<PAGE>
Premier Entertainment Biloxi LLC and Subsidiary
Debtor-In-Possession
Consolidated Financial Statements
Period From January 1, 2007 Through August 9, 2007
(end of pre-emergence period)
CONTENTS
Audited Consolidated Financial Statements
Report of Independent Registered Public Accounting Firm...................1
Consolidated Statement of Financial Position..............................2
Consolidated Statement of Operations and Member's Equity..................4
Consolidated Statement of Cash Flows......................................5
Notes to Consolidated Financial Statements................................6
<PAGE>
Report of Independent Registered Public Accounting Firm
To the Board of Directors and Member:
In our opinion, the accompanying consolidated statement of financial position
and the related consolidated statements of operations and member's equity and of
cash flows present fairly, in all material respects, the financial position of
Premier Entertainment Biloxi LLC and Subsidiary at August 9, 2007 and the
results of their operations and their cash flows for the period from January 1,
2007 to August 9, 2007 (end of pre-emergence period), in conformity with
accounting principles generally accepted in the United States of America. These
financial statements are the responsibility of the Company's management. Our
responsibility is to express an opinion on these financial statements based on
our audit. We conducted our audit of these statements in accordance with
generally accepted auditing standards as established by the Auditing Standards
Board (United States) and in accordance with the auditing standards of the
Public Company Accounting Oversight Board (United States). Those standards
require that we plan and perform the audit to obtain reasonable assurance about
whether the financial statements are free of material misstatement. An audit
includes examining, on a test basis, evidence supporting the amounts and
disclosures in the financial statements, assessing the accounting principles
used and significant estimates made by management, and evaluating the overall
financial statement presentation. We believe that our audit provides a
reasonable basis for our opinion.
As discussed under the heading "Liquidity and Management's Plans" in Note 1 to
the consolidated financial statements, after considering the Company's operating
results for 2009 and the potential impacts of the Company's failure to meet debt
service obligations in 2010, which could include defaults under the related
credit agreements and immediate acceleration of related amounts due, the Company
is undertaking actions to improve operating results, obtain capital
contributions and modify credit agreements in order to avoid defaults under such
credit agreements.
As discussed in Note 1 to the consolidated financial statements, the Company
filed petitions on September 19, 2006 with the United States Bankruptcy Court
for the Southern District of Mississippi, Southern Division, for reorganization
under the provisions of Chapter 11 of the Bankruptcy Code. The Company's Joint
Plan of Reorganization was substantially consummated on August 10, 2007 and the
Company emerged from bankruptcy. In connection with its emergence from
bankruptcy, the Company did not qualify for fresh start accounting.
/s/ PricewaterhouseCoopers LLP
March 25, 2008, except with respect to our opinion on the consolidated financial
statements insofar as it relates to the disclosures under the heading "Liquidity
and Management Plans" in Note 1, as to which the date is February 24, 2010
1
<PAGE>
Premier Entertainment Biloxi LLC and Subsidiary
Debtor-In-Possession
Consolidated Statement of Financial Position
AUGUST 9, 2007 (END OF PRE-EMERGENCE PERIOD)
ASSETS
Current assets:
Cash and cash equivalents $ 17,158,856
Insurance receivable 11,089,220
Accounts receivable, net of doubtful accounts of $47,107 732,069
Inventories 1,158,523
Prepaid insurance 6,184,072
Prepaid expenses - other 1,813,143
Other current assets 30,234
-----------------
Total current assets 38,166,117
Property and equipment, net 214,058,811
Other noncurrent assets:
Restricted cash 40,662,134
Other assets, net 854,718
-----------------
Total assets $ 293,741,780
=================
2
<PAGE>
Premier Entertainment Biloxi LLC and Subsidiary
Debtor-In-Possession
Consolidated Statement of Financial Position (continued)
AUGUST 9, 2007 (END OF PRE-EMERGENCE PERIOD)
LIABILITIES AND MEMBER'S EQUITY
Liabilities not subject to compromise:
Current liabilities:
Accounts payable $ 21,920,063
Accrued interest - related party 305,139
Amounts due to related parties 11,242,201
Accrued payroll and employee benefits 1,919,525
Gaming liabilities 1,211,896
Other accrued liabilities 5,640,958
Notes payable 9,084,267
---------------------
Total current liabilities 51,324,049
Long-term debt 16,730,358
Liabilities subject to compromise (Note 1) 208,624,318
---------------------
Total liabilities 276,678,725
Member's contributed capital 52,775,215
Accumulated deficit (35,712,160)
---------------------
Total member's equity 17,063,055
---------------------
Total liabilities and member's equity $ 293,741,780
=====================
See accompanying notes.
3
<PAGE>
Premier Entertainment Biloxi LLC and Subsidiary
Debtor-In-Possession
Consolidated Statement of Operations and Member's Equity
PERIOD FROM JANUARY 1, 2007 THROUGH AUGUST 9, 2007 (END OF PRE-EMERGENCE PERIOD)
REVENUES
Casino $ 12,317,597
Hotel 1,458,954
Food and beverage 3,070,697
Other 1,034,897
----------------------
Gross revenues 17,882,145
Less promotional allowances 2,053,719
----------------------
Net revenues 15,828,426
OPERATING EXPENSES
Casino 7,314,675
Hotel 587,673
Food and beverage 1,505,075
General and administrative 1,681,892
Insurance recoveries (11,391,658)
Management fees to related party 241,231
Pre-opening expenses 11,962,866
Utilities 310,226
Depreciation and amortization 1,664,898
Other operating 2,016,767
----------------------
Total operating expenses 15,893,645
----------------------
Loss from operations (65,219)
OTHER (INCOME) EXPENSE
Interest expense, net of capitalized
interest 11,068,508
Interest income (71,632)
----------------------
Total other (income) expense 10,996,876
Loss before reorganization items (11,062,095)
----------------------
Reorganization costs, net 211,826
----------------------
Net loss (11,273,921)
Member's equity at beginning of the period 28,336,976
----------------------
Member's equity at end of the period $ 17,063,055
======================
See accompanying notes.
4
<PAGE>
Premier Entertainment Biloxi LLC and Subsidiary
Debtor-In-Possession
Consolidated Statement of Cash Flows
PERIOD FROM JANUARY 1, 2007 THROUGH AUGUST 9, 2007 (END OF PRE-EMERGENCE PERIOD)
OPERATING ACTIVITIES
Net loss $ (11,273,921)
Depreciation and amortization 1,664,898
Amortization of deferred financing costs, discount and repayment premium 57,839
Insurance recoveries receivable (11,089,220)
Changes in operating assets and liabilities:
Accounts receivable (180,361)
Inventories (1,158,523)
Prepaid assets (4,605,260)
Other assets (59,458)
Accounts payable and accrued expenses 11,332,205
Accrued interest 4,603,386
------------------
Net cash used in operating activities (10,708,415)
INVESTING ACTIVITIES
Purchases of property and equipment (66,571,126)
Change in restricted cash 93,580,325
------------------
Net cash provided by investing activities 27,009,199
Net change in cash and cash equivalents 16,300,784
Cash and cash equivalents at beginning of period 858,072
------------------
Cash and cash equivalents at end of period $ 17,158,856
==================
Cash paid during the period for:
Interest, net of capitalized interest $ 5,921,064
==================
Supplemental schedule of noncash investing and financing activities:
Change in construction costs funded through accounts payable,
amounts due to related parties and liabilities subject
to compromise $ 15,043,007
==================
Unpaid interest reclassified to principal $ 3,218,465
==================
Reorganization items - See Note 1
See accompanying notes.
5
<PAGE>
Premier Entertainment Biloxi LLC and Subsidiary
Debtor-In-Possession
Notes to Consolidated Financial Statements
AUGUST 9, 2007 (END OF PRE-EMERGENCE PERIOD)
1. NATURE OF BUSINESS AND ORGANIZATION OF COMPANY
Premier Entertainment Biloxi LLC, a Delaware limited liability company formed on
October 16, 2003, (Premier Entertainment or the Company) owns and operates the
Hard Rock Hotel & Casino Biloxi (Hard Rock Biloxi). The liability of GAR LLC
(GAR), the Company's sole member, and officers of the Company is limited to the
maximum amount permitted under the laws of the state of Delaware.
Premier Finance Biloxi Corp. (Premier Finance) was incorporated in October 2003
as a Delaware corporation and is a wholly owned subsidiary of Premier
Entertainment. Under Mississippi law, certain expenditures are exempt from sales
tax if purchased with proceeds from industrial development revenue bonds issued
by the Mississippi Finance Corporation. Premier Finance was formed to fund the
capital expenditures that qualify for the tax-exempt status.
Hard Rock Biloxi is a single casino gaming facility located on an 8.5 acre site
on the Mississippi Gulf Coast and has approximately 1,375 slot machines, 50
table games, six live poker tables, five restaurants (including a Hard Rock Cafe
and Ruth's Chris Steakhouse), a full service spa, a 5,200 square foot pool area,
3,000 square feet of retail space, an eleven-story hotel with 318 rooms and
suites and a Hard Rock Live! entertainment venue with a capacity of 1,500
persons. Hard Rock Biloxi commenced operations on June 30, 2007.
Casino operations are subject to extensive regulation in the State of
Mississippi by the Mississippi Gaming Commission and Mississippi State Tax
Commission. The Company, its ownership and management are subjected to findings
of suitability reviews by the Mississippi Gaming Commission. In addition, the
laws, rules and regulations of state and local governments in Mississippi
require the Company to hold various licenses, registrations and permits and to
obtain various approvals for a variety of matters. In order to continue
operating, the Company must remain in compliance with all laws, rules and
regulations and pay gaming taxes on its gross gaming revenues. Failure to
maintain such approvals or obtain renewals when due, or failure to comply with
new laws or regulations or changes to existing laws and regulations would have
an adverse effect on the Company's business. Management believes it is currently
in compliance with all governmental rules and regulations.
6
<PAGE>
Premier Entertainment Biloxi LLC and Subsidiary
Debtor-In-Possession
Notes to Consolidated Financial Statements (continued)
1. NATURE OF BUSINESS AND ORGANIZATION OF COMPANY (CONTINUED)
LIQUIDITY AND MANAGEMENT'S PLANS
The Company has incurred net losses since inception and although income from
operations was generated in 2009 and management expects to be able to meet
operating obligations and obligations due under the Loan and Security Agreement
for equipment financing with IGT it does not anticipate that cash flows from
operations during 2010 will be sufficient to meet its interest obligations under
the $180 million senior secured credit facility with BHR Holdings, Inc. (BHR)
(as further described below) without capital contributions from GAR or
modifications to the BHR Credit Agreement.
Failure to meet the interest obligation under the BHR Credit Agreement when due
would constitute a default under the BHR Credit Agreement which would also
create a default under the junior subordinated note held by LUK-Ranch
Entertainment, LLC (LRE) described in Note 7. Such defaults allow the
respective lenders to declare the notes immediately due and payable.
Furthermore, a default under the BHR Credit Agreement provides Hard Rock Hotel
Licensing, Inc. the right to terminate the Hard Rock license agreement (Notes 9)
under certain conditions.
BHR and LRE are related parties that are controlled by Leucadia National
Corporation, who through its subsidiaries is also the controlling member of GAR.
Management intends to improve operating results by growth in revenues through
its marketing and customer loyalty programs and by continued emphasis on expense
control. In addition, management intends to seek capital contributions from GAR
and or modifications to the BHR Credit Agreement, in order to meet its interest
obligations under the BHR Credit Agreement. There is no assurance that
management's plans will generate sufficient cash flows from operations to meet
the related party interest obligations or that modifications to the BHR Credit
Agreement will be obtained. As such, there is substantial doubt about the
Company's ability to continue as a going concern. The financial statements do
not include any adjustments that might result from the outcome of this
uncertainty. The Company's consolidated financial statements have been prepared
on a going concern basis, which contemplates the realization of assets and the
satisfaction of liabilities in the normal course of business.
7
<PAGE>
BANKRUPTCY FILING
On September 19, 2006 (the Petition Date), the Company filed voluntary petitions
for reorganization under Chapter 11 of Title 11 of the United States Code,
before the United States Bankruptcy Court (the Court) for the Southern District
of Mississippi, Southern Division (Case No. 06-50975 (ERG). The Company sought
the Court's assistance in gaining access to Hurricane Katrina - related
insurance proceeds over which U.S. Bank National Association, in its capacity as
trustee and disbursement agent (the Trustee) for the Company's 10 3/4% First
Mortgage Notes (the Notes) and a group of majority holders of the Notes had
denied access. Under Chapter 11, certain claims against the Company in existence
prior to the filing of the petitions were stayed while the Company continued
business operations as a debtor-in-possession.
As a debtor-in-possession, the Company followed the guidance of Statement of
Position 90-7, Financial Reporting by Entities in Reorganization Under the
Bankruptcy Code. Accordingly, certain of the stayed claims which were impaired
under the plan are reflected in the August 9, 2007 consolidated statement of
financial position as "liabilities subject to compromise." Certain revenues and
expenses resulting from the reorganization are reported as reorganization items
in the August 9, 2007 statement of operations and member's equity.
On December 11, 2006, the Company filed with the Court a plan of reorganization
(the Plan) and subsequently filed an amended Plan with the Court on February 22,
2007.
On July 30, 2007, the Court entered an order confirming the Plan, subject to a
modification which the Company filed on August 1, 2007. On August 10, 2007,
Premier Entertainment and Premier Finance emerged from bankruptcy when the Plan
was substantially consummated (the Effective Date). As such, Premier
Entertainment and Premier Finance are no longer classified as
debtors-in-possession. The Court continues to retain jurisdiction of certain
matters including the ultimate resolution of the disputed escrow amount as
described below and resolution of certain other disputed claims.
8
<PAGE>
Premier Entertainment Biloxi LLC and Subsidiary
Debtor-In-Possession
Notes to Consolidated Financial Statements (continued)
1. NATURE OF BUSINESS AND ORGANIZATION OF COMPANY (CONTINUED)
Under the Plan, as approved by the Court, noteholders received principal of $160
million and accrued unpaid interest of $9.1 million in cash on the Effective
Date. In addition, the Company placed $14.7 million in escrow with U.S. Bank.
$13.7 million of this amount represents a prepayment premium or penalty, to
which the noteholders may be entitled. The Company disputes that any prepayment
premium or penalty is due the noteholders and as such the disputed amount has
been placed in escrow pending resolution by the Court. In addition, the Company
placed $1 million in escrow for fees and expenses which may be incurred by the
Trustee in conjunction with the dispute resolution. Entitlement to the escrows
is expected to be determined by the Court during 2008. The Company believes it
is probable that the Court will approve payment of Trustee legal fees and
expenses and has fully reserved for that contingency. However, the Company does
not believe it is probable or remote that the Court will find in favor of the
noteholders with respect to the additional damages escrow, and any potential
loss can not be reasonably estimated. Accordingly, the Company has not accrued a
loss for the additional damages contingency.
On the Effective Date, Peoples Bank, holder of the senior secured reducing line
of credit facility received $1.3 million of principal plus interest at a reduced
rate of 7% from the Petition Date through the Effective Date. The reduction in
interest rate resulted in a $29,672 difference in interest costs.
Holders of other secured claims received 100% of their allowed claim, including
contractual interest on the Effective Date.
Holders of general unsecured claims received 50% of their allowed claim plus
post petition interest at the federal judgment rate of 5.02% on the Effective
Date and received the balance, with interest, on October 10, 2007. The reduction
in contractual interest rates and interest paid under the plan on certain
general unsecured claims resulted in $1.2 million difference in interest costs.
The Plan was funded by a $180 million senior secured credit facility dated
August 10, 2007 provided by BHR Holdings, Inc. (BHR), a related party, and a $20
million loan and security agreement dated August 10, 2007 provided by
International Game Technology (IGT).
The BHR credit facility will mature February 2012, bears interest at 10 3/4%, is
prepayable at any time without penalty, and contains other covenants, terms and
conditions similar to those contained in the indenture that governed the Notes
9
<PAGE>
Premier Entertainment Biloxi LLC and Subsidiary
Debtor-In-Possession
Notes to Consolidated Financial Statements (continued)
1. NATURE OF BUSINESS AND ORGANIZATION OF COMPANY (CONTINUED)
(see Note 7). On the Effective Date, $160 million was advanced to the Company
under this facility. As of October 11, 2007, the full $180 million had been
advanced.
The IGT loan was initially funded on the Effective Date and $19.8 million had
been advanced as of August 17, 2007. The IGT loan is secured by certain IGT slot
machines, slot system, and non-IGT ancillary equipment and is payable in
thirty-five consecutive monthly installments based on a sixty-month amortization
with a balloon payment on the thirty-sixth month of the outstanding remaining
principal balance. Interest accrues at the "high Wall Street Journal prime
lending rate," (8.25% at August 9, 2007) and the first payment of principal and
interest was due September 20, 2007. The loan also includes a 2% loan fee of
$139,332 for the portion of the loan representing the non-IGT ancillary
equipment
On August 2, 2007, certain of the noteholders filed a notice of appeal of the
confirmation order and a motion for stay of the confirmation order pending
resolution of the appeal. On August 10, 2007, the motion for stay of the
confirmation was denied by both the Court and the United States District Court
for the Southern District of Mississippi.
The Company has filed a motion to dismiss the appeal on the basis of equitable
mootness due to the fact that the Plan has been substantially carried out. On
March 19, 2008 the United States District Court for the Southern District of
Mississippi granted the Company's motion to dismiss the appeal.
Liabilities Subject to Compromise
The following table summarizes the components of liabilities subject to
compromise included on the consolidated statement of financial position as of
August 9, 2007:
Senior note in default, including accrued interest $ 169,105,847
Equipment financing in default, including accrued interest 15,967,710
Accounts payable and other accrued liabilities (a) 23,550,761
----------------
Total liabilities subject to compromise $ 208,624,318
=================
(a) Accounts payable and other accrued liabilities include $15.7 million
payable to related parties (see Note 8).
10
<PAGE>
Premier Entertainment Biloxi LLC and Subsidiary
Debtor-In-Possession
Notes to Consolidated Financial Statements (continued)
1. NATURE OF BUSINESS AND ORGANIZATION OF COMPANY (CONTINUED)
Liabilities subject to compromise refers to pre-petition obligations that may
have been impacted by the Chapter 11 reorganization process. At August 9, 2007,
liabilities subject to compromise represents the balances of pre-petition
liabilities as resolved by the Plan.
REORGANIZATION ITEMS, NET
The following table summarizes the components included in reorganization items,
net on the consolidated statement of operations and member's equity for the
period from January 1, 2007 through August 9, 2007:
Professional fees $ 3,738,148
Net gain on claim settlements (1,069,981)
Interest income (2,456,341)
----------------------
Total reorganization items, net $ 211,826
======================
2. SUMMARY OF SIGNIFICANT ACCOUNTING POLICIES
BASIS OF PRESENTATION AND USE OF ESTIMATES
The Company's accounting policies and its standards of financial disclosure are
in conformity with United States generally accepted accounting principles. The
preparation of financial statements in conformity with accounting principles
generally accepted in the United States requires management to make estimates
and assumptions that affect the amounts reported in the consolidated financial
statements and accompanying notes. Significant estimates include the estimated
useful lives for depreciable assets, the estimated allowance for doubtful
accounts receivable, estimated cash flows in assessing the recoverability of
long-lived assets, and estimated liabilities for the slot bonus point program
and self insurance claims. Actual results could differ significantly from those
estimates.
PRINCIPLES OF CONSOLIDATION
The consolidated financial statements include the accounts of Premier
Entertainment and its wholly owned subsidiary, Premier Finance Biloxi Corp. All
significant inter-company accounts and transactions have been eliminated.
11
<PAGE>
Premier Entertainment Biloxi LLC and Subsidiary
Debtor-In-Possession
Notes to Consolidated Financial Statements (continued)
2. SUMMARY OF SIGNIFICANT ACCOUNTING POLICIES (CONTINUED)
CASH AND CASH EQUIVALENTS
Cash includes cash required for gaming operations. For purposes of reporting the
statements of cash flows, the Company considers all cash accounts and all
short-term investments with maturity dates of ninety days or less when purchased
to be cash equivalents.
ACCOUNTS RECEIVABLE AND ALLOWANCE FOR DOUBTFUL ACCOUNTS
Accounts receivable are principally comprised of casino and hotel receivables,
which do not bear interest and are recorded at cost. The Company extends credit
to approved casino customers following background checks and investigations of
creditworthiness. The Company reserves an estimated amount of receivables that
may not be collected. The methodology for estimating the allowance includes
specific reserves and applying various percentages to aged receivables.
Historical collection rates are considered, as are customer relationships, in
determining specific allowances. As with many estimates, management must make
judgments about potential actions by third parties in establishing and
evaluating the allowance for bad debts.
INVENTORIES
Inventories, consisting principally of food, beverages and operating supplies,
are stated at the lower of cost (first-in, first-out) or market.
PROPERTY AND EQUIPMENT
Property and equipment are stated at cost less accumulated depreciation and
amortization. The Company capitalizes the cost of purchases of property and
equipment and capitalizes the cost of improvements to property and equipment
that increase the value or extend the useful life of the asset. Maintenance and
repairs are charged to expense as incurred. Depreciation is computed using the
straight-line method over the following estimated useful lives of the assets:
Land improvements 20 years
Building 40 years
Furniture, fixtures, and equipment 3-10 years
12
<PAGE>
Premier Entertainment Biloxi LLC and Subsidiary
Debtor-In-Possession
Notes to Consolidated Financial Statements (continued)
2. SUMMARY OF SIGNIFICANT ACCOUNTING POLICIES (CONTINUED)
In accordance with SFAS No. 144, "Accounting for the Impairment or Disposal of
Long-lived Assets", long-lived assets to be held and used by the Company are
reviewed to determine whether any events or changes in circumstances indicate
the carrying amount of the asset may not be recoverable. Factors that might
indicate a potential impairment may include, but are not limited to, significant
decreases in the market value of the long-lived asset, a significant change in
the long-lived asset's physical condition, a change in industry conditions or a
reduction in cash flows associated with the use of the long-lived asset. If
these or other factors indicate the carrying amount of the asset may not be
recoverable, the Company determines whether an impairment has occurred through
the use of an undiscounted cash flow analysis of the asset at the lowest level
for which identifiable cash flows exist. If an impairment has occurred, the
Company recognizes a loss for the difference between the carrying amount and the
fair value of the asset. The fair value of the asset is measured using market
prices or, in the absence of market prices, is based on an estimate of
discounted cash flows. At August 9, 2007 and for the period January 1, 2007
through August 9, 2007, there has been no impairment of long-lived assets.
CAPITALIZATION OF INTEREST
In accordance with SFAS No. 34, Capitalization of Interest Cost (SFAS No. 34),
the Company capitalizes the interest cost associated with construction projects
as part of the cost of the project. Interest is typically capitalized on amounts
expended on the project using the weighted-average cost of outstanding
borrowings. Capitalization of interest starts when construction activities, as
defined in SFAS No. 34, begin and ceases when construction is substantially
complete. Such capitalized interest becomes part of the cost of the related
asset and is depreciated over the estimated useful life.
INTANGIBLE ASSETS
The Company has a license agreement with Hard Rock Hotel Licensing, Inc., which
provides for an initial term of twenty years and the option to renew for two
successive ten-year terms. Under the license agreement, the Company has the
exclusive right to use the "Hard Rock" brand name in connection with its hotel
and casino resort. As consideration for the licensed rights as provided in the
license agreement, the Company paid a one-time territory fee of $500,000. This
cost was capitalized and is recorded as other assets on the consolidated
statement of financial position and is being amortized over a 20-year period
that began in September 2005.
13
<PAGE>
Premier Entertainment Biloxi LLC and Subsidiary
Debtor-In-Possession
Notes to Consolidated Financial Statements (continued)
2. SUMMARY OF SIGNIFICANT ACCOUNTING POLICIES (CONTINUED)
REVENUE AND PROMOTIONAL ALLOWANCES
Casino revenue is the aggregate net difference between gaming wins and losses,
with liabilities recognized for funds deposited by customers before gaming play
occurs, for chips outstanding and "ticket-in, ticket-out" coupons in the
customers' possession, and for accruals related to the anticipated payout of
progressive jackpots. Progressive slot machines, which contain base jackpots
that increase at a progressive rate based on the number of credits played, are
charged to revenue as the amount of the progressive jackpots increase. Sales
incentives to customers such as points earned in point-loyalty programs related
to gaming play are recorded as a reduction of gross casino revenues.
Hotel revenue recognition criteria are met at the time of occupancy. Food and
beverage revenue recognition criteria are met at the time of service. Advance
deposits for hotel rooms are recorded as liabilities until revenue recognition
criteria are met.
The retail value of accommodations, food and beverage, and other services
furnished to hotel/casino guests without charge is included in gross revenue and
then deducted as promotional allowances. The estimated retail value of such
promotional allowances is included in operating revenues as follows:
Food & beverage $ 1,546,760
Rooms 243,640
Other 263,319
-----------------------
Total $ 2,053,719
=======================
The estimated departmental cost of providing such promotional allowances is
included in casino operating expenses as follows:
Food & beverage $ 1,014,003
Rooms 118,385
Other 378,759
-----------------------
Total $ 1,511,147
=======================
14
<PAGE>
Premier Entertainment Biloxi LLC and Subsidiary
Debtor-In-Possession
Notes to Consolidated Financial Statements (continued)
2. SUMMARY OF SIGNIFICANT ACCOUNTING POLICIES (CONTINUED)
FREQUENT PLAYERS PROGRAM
The Company has established a promotional club to encourage repeat business from
frequent and active slot machine customers. Members earn points based on gaming
activity and such points can be redeemed for free slot play. The Company accrues
for club points as a reduction to gaming revenue based upon the estimates for
expected redemptions.
ADVERTISING COSTS
Costs for advertising are expensed as incurred. Advertising costs included in
casino expense was $350,956 for the period from January 1, 2007 through August
9, 2007.
SELF-INSURANCE
The Company is self-insured for employee medical insurance coverage up to an
individual stop loss of $50,000. Self-insurance liabilities are estimated based
on the Company's claims experience and are included in other accrued liabilities
on the consolidated statement of financial position. Such amount at August 9,
2007 was $345,817. At August 9, 2007, the total amount of claims exceeding the
stop loss was immaterial.
PRE-OPENING COSTS
Pre-opening costs are expensed as incurred, consistent with Statement of
Position 98-5, Reporting on the Costs of Start-up Activities (SOP 98-5).
Expenses incurred include payroll and payroll related expenses, marketing
expenses, rental expenses, outside services, legal and professional fees,
management fees to related party and other expenses related to the start-up
phase of operations.
INCOME TAXES
As a limited liability company, the Company has elected to be treated as a
partnership for income tax purposes; accordingly, any tax related to the
Company's income is the obligation of its member and no federal or state income
tax provision has been recorded in the Company's consolidated financial
statements.
15
<PAGE>
Premier Entertainment Biloxi LLC and Subsidiary
Debtor-In-Possession
Notes to Consolidated Financial Statements (continued)
3. HURRICANE INSURANCE RECOVERIES
On August 29, 2005, just two days before the Hard Rock Biloxi was originally
scheduled to open to the public, Hurricane Katrina hit the Mississippi Gulf
Coast and severely damaged the hotel and related structures and completely
destroyed the casino.
On August 15, 2005, the Company purchased a comprehensive blanket insurance
policy providing up to $181.1 million in coverage for damage to real and
personal property, including business interruption coverage. The insurance was
comprised of a $25.0 million primary layer underwritten by Industrial Risk
Insurers, a $25.0 million first excess layer underwritten by several insurance
carriers, and a second excess layer comprising $131.1 million underwritten by
several insurance carriers. The syndicated coverage was spread over twelve
different insurance carriers. The Company had a 3.0% deductible on its coverage,
but purchased three additional insurance policies to reduce the Company's
exposure related to that deductible.
As of August 9, 2007, the Company had reached final settlements with all but one
of its carriers under its blanket insurance policies and had collected total
insurance recoveries of $161.2 million. In January 2008, the Company settled the
remaining insurance claim. As of and for the period ended August 9, 2007, the
Company has recognized insurance recoveries of $11.4 million with an insurance
receivable of $11.1 million. Such receivable was collected in full on February
21, 2008. All other insurance recoveries were recognized in years ended prior to
2007.
4. RESTRICTED CASH
Restricted cash consists of cash and highly liquid instruments with original
maturities of 90 days or less, which carrying amounts approximate fair value.
The net proceeds from the issuance of the Notes, a portion of the equity
investment and the proceeds from the junior subordinated note were deposited
into a construction disbursement account and a tidelands lease reserve account
pursuant to the disbursement agreement of the Notes. These proceeds were
utilized to construct the property which was substantially completed in August
2005 and subsequently damaged by Hurricane Katrina. The insurance proceeds
related to Hurricane Katrina received prior to August 9, 2007 totaling $161.2
million have been deposited into the restricted accounts held by the Trustee.
These accounts were pledged to the Trustee as security for the Company's
obligations under the Notes, and could only be released to the Company in
accordance with the disbursement agreement or approval from the Court (see Note
1). The Company also has a $1.0 million certificate of deposit which is pledged
as security for the Company's obligations under the Hard
16
<PAGE>
Premier Entertainment Biloxi LLC and Subsidiary
Debtor-In-Possession
Notes to Consolidated Financial Statements (continued)
4. RESTRICTED CASH (CONTINUED)
Rock license agreement. In the accompanying consolidated statement of financial
position, restricted cash is classified as noncurrent as it is primarily
designated for the reconstruction of property and purchases of equipment.
Restricted cash at August 9, 2007 includes the following:
Construction disbursement $ 23,157,552
Tidelands lease reserve 880,872
Insurance proceeds in escrow (a) 15,623,710
-----------------
Cash restricted by the Notes 39,662,134
Certificate of deposit restricted by the Hard
Rock license agreement 1,000,000
------------------
Total restricted cash $ 40,662,134
==================
(a) Includes $1.3 million escrowed on behalf of Peoples Bank and $14.3
million escrowed on behalf of IGT pending determination of their
rights, if any to the insurance proceeds.
5. PROPERTY AND EQUIPMENT
Property and equipment held at August 9, 2007 consisted of the following:
Land $ 31,416,920
Building 131,072,698
Equipment 54,316,354
-----------------
216,805,972
Less accumulated depreciation 2,747,161
-----------------
Property and equipment, net $ 214,058,811
=================
Depreciation expense totaled $1.6 million for the period from January 1, 2007
through August 9, 2007. Interest capitalized for the period from January 1, 2007
through August 9, 2007 was $2.7 million.
17
<PAGE>
Premier Entertainment Biloxi LLC and Subsidiary
Debtor-In-Possession
Notes to Consolidated Financial Statements (continued)
6. OTHER NONCURRENT ASSETS
Other assets, net consisted of the following at August 9, 2007:
Hard Rock license fee, net of accumulated amortization of
$48,589 $ 451,411
Deferred financing costs, net of accumulated amortization of
$182,813 242,187
Deposit 161,120
-----------------
Other assets, net $ 854,718
=================
Amortization expense for the Hard Rock license fee and the leasehold contract
was $15,137 for the period from January 1, 2007 through August 9, 2007. For the
Hard Rock license fee, the estimated amortization expense per year for the next
five years is $25,000.
7. LONG-TERM DEBT AND LOAN AND SECURITY AGREEMENT
Long-term debt as of August 9, 2007 is as follows:
10 3/4% First Mortgage Notes due 2012 in default $ 160,000,000
15% Junior Subordinated Note due 2012 16,730,358
Variable rate IGT note payable in default 12,870,932
Variable rate Senior Secured Reducing Line of Credit
Facility in default 1,250,000
Fixed rate BHR note payable in default 9,084,267
------------------
199,935,557
Less debt and loan agreements classified as liabilities
subject to compromise 174,120,932
Less notes payable current 9,084,267
------------------
Long-term debt $ 16,730,358
==================
10 3/4% FIRST MORTGAGE NOTES DUE 2012
On January 23, 2004, the Company issued $160 million of 10 3/4% First Mortgage
Notes due February 1, 2012 in a private placement offering which were
subsequently exchanged in an exchange offer registered on Form S-4. The Notes
were senior to all existing and future senior unsecured indebtedness, but were
subordinated to $14.1 million of senior secured indebtedness incurred to finance
18
<PAGE>
Premier Entertainment Biloxi LLC and Subsidiary
Debtor-In-Possession
Notes to Consolidated Financial Statements (continued)
7. LONG-TERM DEBT AND LOAN AND SECURITY AGREEMENT (CONTINUED)
the acquisition and installation of furniture, fixtures, and equipment. The
Notes were secured by a pledge of the Company's membership interests and
substantially all of the existing and future assets, except for assets securing
certain other indebtedness. In addition, the Trustee was named as a loss payee
on behalf of the noteholders under the Company's insurance policies.
Interest on the Notes was payable semiannually on each February 1 and August 1
through maturity. Under the governing indenture, the Notes may have been
redeemed, in whole or in part, at any time on or after February 1, 2008 at the
redemption prices (expressed as percentages of principal amount) set forth
below, plus accrued and unpaid interest, to the applicable redemption date, if
redeemed during the 12-month period beginning on February 1 of the years
indicated below:
-------------------------------------------------
YEAR PERCENTAGE
-------------------------------------------------
2008 105.38%
2009 102.69%
2010 and thereafter 100.00%
In addition, up to 35% of the Notes may have been redeemed at a premium on or
prior to February 1, 2007 with the net cash proceeds of an initial public
offering. As a result of the bankruptcy, the Notes are classified as liabilities
subject to compromise in the accompanying consolidated statement of financial
position. The Notes were paid in full on August 10, 2007 in accordance with the
Company's confirmed plan of reorganization (see Note 1).
15% JUNIOR SUBORDINATED NOTE DUE 2012
On January 13, 2004 the Company borrowed $10.0 million in the form of a junior
subordinated note due August 1, 2012 from Rank America, Inc., an affiliate of
The Rank Group Plc, and owner of Hard Rock Hotel Licensing, Inc. On April 25,
2006 the junior subordinated note was acquired by LUK-Ranch Entertainment, LLC
(LRE), a related party. Interest on the junior subordinated note accrues at a
rate of 15% per annum. Accrued interest at each semi annual interest payment
date of February 1 and August 1 is added to the principal balance to the extent
not paid. The Company will be required to pay a repayment premium of 3% of the
principal amount of the junior subordinated note when it is repaid. Such premium
is being accrued over the term of the junior subordinated note.
19
<PAGE>
Premier Entertainment Biloxi LLC and Subsidiary
Debtor-In-Possession
Notes to Consolidated Financial Statements (continued)
7. LONG-TERM DEBT AND LOAN AND SECURITY AGREEMENT (CONTINUED)
IGT NOTE PAYABLE
On January 5, 2005, the Company entered into a Commercial Sales and Security
Agreement with IGT (the IGT Agreement) for the financing of certain gaming
devices and systems. Pursuant to the IGT Agreement, the Company purchased
approximately 1,100 slot devices from IGT, as well as software licenses and
related equipment for the gaming system. Under the IGT Agreement, interest
accrued at the "high Wall Street Journal prime lending rate" (8.25% at August 9,
2007) and payments were based on a 60-month amortization payable in thirty-six
monthly installments of principal and accrued interest with the balance due on
the thirty-seventh month (November 2008). IGT was named as a loss payee under
the Company's insurance policies. As a result of the bankruptcy, the amount due
under the IGT Agreement is classified as liabilities subject to compromise in
the accompanying consolidated statement of financial position. In accordance
with the Company's confirmed plan of reorganization, $7.6 million of principal,
accrued pre-petition interest at the contract rate, and post-petition accrued
interest at the reduced rate of 5.02% was paid on August 10, 2007. The remaining
balance of principal and accrued interest was paid October 10, 2007 (see Note
1).
SENIOR SECURED REDUCING LINE OF CREDIT FACILITY
On August 26, 2005, the Company received a $1.3 million loan from The Peoples
Bank pursuant to a $10.0 million Senior Secured Reducing Line of Credit Facility
(the Credit Facility). The Credit Facility was secured by a security interest in
certain collateral purchased by the Company and the lender was named as a loss
payee under the Company's blanket insurance policies. The Credit Facility had a
term of 66 months that included an initial funding period that ended on December
31, 2005.
Interest on the Credit Facility accrued at the rate of LIBOR plus 4.25% (9.7475%
at August 9, 2007). On December 31, 2005, the outstanding balance of the Credit
Facility was converted into a fully amortizing, five-year term loan due December
31, 2010, requiring quarterly payments of principal and interest. As a result of
the bankruptcy, the amounts due under the credit facility are classified as
liabilities subject to compromise in the accompanying consolidated statement of
financial position. In accordance with the Company's confirmed plan of
reorganization, the credit facility was paid in full, with post petition accrued
interest at the reduced rate of 7% per annum on August 10, 2007.
20
<PAGE>
Premier Entertainment Biloxi LLC and Subsidiary
Debtor-In-Possession
Notes to Consolidated Financial Statements (continued)
7. LONG-TERM DEBT AND LOAN AND SECURITY AGREEMENT (CONTINUED)
BHR HOLDINGS, INC. FIXED RATE NOTE PAYABLE
On May 23, 2006, the Company received an $8.0 million loan from BHR, a related
party. An additional $0.1 million was received in September 2006. The note bears
interest at 12% per annum and the principal balance and all accrued and unpaid
interest is due on the earlier of May 23, 2007 or the date on which sufficient
insurance proceeds received from certain insurance carriers become available to
repay the note. Under the Fixed Rate Note, any interest not paid on the maturity
date shall be compounded by increasing the principal amount by the amount of
interest accrued through the maturity date. On May 23, 2007, $984,267 of accrued
and unpaid interest was added to the principal balance of the BHR Fixed Rate
Note. On February 26, 2008, the Company repaid the principal balance and accrued
interest due under the BHR Fixed Rate Note in full.
OTHER
On July 1, 2005, the Company obtained an Irrevocable Letter of Credit from The
Peoples Bank in favor of Hard Rock Hotel Licensing, Inc. in the amount of $1.0
million to comply with the terms and conditions of the Licensing Agreement with
Hard Rock Hotel Licensing, Inc. The Letter of Credit is secured by a certificate
of deposit in the amount of $1.0 million. The Letter of Credit reduces by
$100,000 on the first of each month beginning January 1, 2008 until it reaches
zero on October 1, 2008.
8. RELATED PARTY TRANSACTIONS
Roy Anderson, III a member of GAR, is the President, Chief Executive Officer and
majority stockholder of Roy Anderson Corp. (RAC), the Company's general
contractor.
In the aftermath of Hurricane Katrina, RAC performed remedial work in the amount
of $7.5 million, of which $2.9 million was outstanding and reflected in
liabilities subject to compromise in the August 9, 2007 consolidated statement
of financial position. In accordance with the Company's confirmed plan of
reorganization, this amount was paid in full with post petition interest as per
the Plan on September 30, 2007 (see Note 1).
On June 16, 2006, the Company entered into a $78.3 million guaranteed maximum
price construction agreement (Construction Agreement) with RAC to provide for
rebuilding the casino portion of the Hard Rock Biloxi and renovating and
repairing the existing hotel tower, low-rise building, parking garage and pool
21
<PAGE>
Premier Entertainment Biloxi LLC and Subsidiary
Debtor-In-Possession
Notes to Consolidated Financial Statements (continued)
8. RELATED PARTY TRANSACTIONS (CONTINUED)
and deck area that were severely damaged by Hurricane Katrina. Deductive change
orders were issued on October 25, 2006, May 25, 2007, and October 10, 2007,
reducing the amount of the guaranteed maximum price to $73.0 million. During the
period from January 1, 2007 through August 9, 2007, $42.0 million was paid to
RAC under the Construction Agreement and $4.6 million is outstanding and
reflected in amounts due to related parties in the August 9, 2007 consolidated
statement of financial position. Subsequent to August 9, 2007, the $4.6 million
was paid to RAC.
On June 16, 2006, the Company entered into a receivables purchase agreement with
BHR and RAC. Pursuant to the terms of the receivables purchase agreement, BHR
agreed to purchase up to $40.0 million of receivables due to RAC by the Company
under the Construction Agreement if such receivables are past due for more than
ten days. As of August 9, 2007, $11.3 million of the amount due to RAC was paid
under this purchase agreement. The Company has reflected these amounts owing to
BHR as liabilities subject to compromise in the August 9, 2007 consolidated
statement of financial position. In accordance with the Company's confirmed plan
of reorganization, this amount was paid in full with post petition interest as
per the Plan on October 10, 2007 (see Note 1).
During the bankruptcy proceedings, LRE purchased certain third party claims
against the Company in the amount of $1.0 million. The Company has reflected
these amounts owing to LRE as liabilities subject to compromise in the August 9,
2007 consolidated statement of financial position. In accordance with the
Company's confirmed plan of reorganization, this amount was paid in full with
post petition interest as per the Plan on October 10, 2007 (see Note 1).
In 2006, in conjunction with a change of control of the Company's members, BHR
commenced a tender offer (the Offer) for all of the Company's outstanding
10 3/4% First Mortgage Notes at a price equal to 101% of the par value of the
Notes in satisfaction of the Company's obligation under the Indenture to make
such an offer upon the occurrence of a change of control as defined in the
Indenture. The offer expired with none of the Notes being tendered. In
connection with the Offer, GAR agreed to cause Premier to pay BHR a fee of $2.0
million, which will be paid only to the extent distributions from the Company
are available for such purpose. At August 9, 2007 the fee remains unpaid and is
included in amounts due to related parties on the consolidated statement of
financial position.
22
<PAGE>
Premier Entertainment Biloxi LLC and Subsidiary
Debtor-In-Possession
Notes to Consolidated Financial Statements (continued)
8. RELATED PARTY TRANSACTIONS (CONTINUED)
In addition, the members of the Board of Managers of Premier are entitled to be
paid an annual management fee in an aggregate amount of $2.0 million, which will
be paid by Premier to the extent distributions from the Company are available
for such purpose. The Company began accruing for this fee on April 26, 2006 and
has accrued $2.6 million for this management fee in amounts due to related
parties on the August 9, 2007 consolidated statement of financial position.
As of August 9, 2007 LRE has paid $2.1 million of expenses on behalf of the
Company. Such amount is included in amounts due to related parties on the August
9, 2007 consolidated statement of financial position.
9. COMMITMENTS
OPERATING LEASES
The Company is committed under various operating lease agreements which were
assumed in the bankruptcy proceedings primarily related to property, submerged
tidelands and equipment. Generally, these leases include renewal provisions and
rental payments, which may be adjusted for taxes, insurance and maintenance
related to the property. Future minimum rental commitments under noncancelable
operating leases are as follows:
2007 $ 563,532
2008 1,358,660
2009 1,293,910
2010 1,293,940
2011 1,291,818
2012 1,294,135
Thereafter 27,762,291
----------------
$ 34,858,286
================
Total rent expense for these long-term lease obligations was $329,303 for the
period from January 1, 2007 through August 9, 2007.
23
<PAGE>
Premier Entertainment Biloxi LLC and Subsidiary
Debtor-In-Possession
Notes to Consolidated Financial Statements (continued)
9. COMMITMENTS (CONTINUED)
In October 2003, the Company entered into an agreement with the State of
Mississippi for the lease and use of approximately 5 acres of submerged
tidelands. The term of the lease is for a period of 30 years. For the initial
period commencing on October 27, 2003 until the opening date as defined in the
agreement, the Company was required to pay annual rent of $21,900. From the
opening date through the remainder of the lease term, the lease rate was to be
determined as fair value on that date. In conjunction with the opening of the
casino, the revised lease rate is $985,000 annually. This rate will be adjusted
every five years based on the greater of the Consumer Price Index change for the
period or by appraisal of the fair market rent.
In November 2003, the Company entered into an agreement with the City of Biloxi,
Mississippi to lease property and the related airspace for a period of 40 years.
For the initial three years of the lease beginning in October 2004, the Company
must pay monthly rent of $12,500. The rent will increase by the Consumer Price
Index beginning on the fifth anniversary date of execution of the lease and
continuing on each fifth anniversary date.
Under the Hard Rock licensing agreement, the Company is obligated to pay an
annual lease fee of $150,000 for memorabilia displayed at the Hard Rock Biloxi.
The annual lease fee is fixed for the first two years and then adjusts
thereafter by the greater of 3% or an adjustment based on the inflation index,
but in no event shall such adjustment exceed 5% annually.
OTHER COMMITMENTS
Under the Hard Rock licensing agreement, the Company is obligated to pay an
annual fee of $1.1 million which increases to $1.5 million over five years and
increases annually thereafter based on the consumer price index, plus fees based
on future non-gaming revenues. The Company will pay a "Continuing Fee" equal to
three percent (3%) of the Licensing Fee Revenues and a marketing fee equal to
one percent (1%) of the Licensing Fee Revenues during the term of the agreement.
In no event shall these fees be construed so as to allow licensor to share in
any revenue generated by the Company's gaming operations. Fee expense under the
license agreement was $231,489 for the period from commencement of operations on
June 30, 2007 through August 9, 2007 and is included in other operating expenses
on the consolidated statement of operations and member's equity. In April 2006,
the Company agreed to accrue $150,000 per month in lieu of any other fees due
under the terms of the license agreement until such time that the operations
commence. Pursuant to this agreement, $900,000 was expensed during the period
from January 1, 2007 through June 30, 2007 and is included in preopening
expenses on the consolidated statement of operations and member's equity. At
August 9, 2007, $3.5 million has been accrued and recorded in other accrued
liabilities in the accompanying consolidated statement of financial position.
24
<PAGE>
Premier Entertainment Biloxi LLC and Subsidiary
Debtor-In-Possession
Notes to Consolidated Financial Statements (continued)
9. COMMITMENTS (CONTINUED)
Such amounts were paid in full on November 30, 2007.
In December 2004, the Company entered into a lease which gives RCSH Operations,
LLC (RCSH) the right to operate a Ruth's Chris Steak House restaurant within the
Hard Rock Biloxi. The initial term is for ten years beginning July 1, 2007 and
RCSH has the right to extend the lease for four additional terms of five years
each. RCSH is obligated to pay minimum annual rent of $179,000 to the Company in
years one through five and $201,825 annually in years six through ten. In
addition to the minimum rent, RCSH is obligated to pay rent in the amount by
which 6% of RCSH's annual gross sales exceeds the minimum annual rent. Future
minimum rent payable to the Company under the lease with RCSH is as follows:
2007 $ 70,253
2008 179,000
2009 179,000
2010 179,000
2011 179,000
2012 190,413
Thereafter 908,213
----------------
$ 1,884,879
================
10. RECENTLY ISSUED ACCOUNTING STANDARDS
SFAS NO. 159 In February 2007, the FASB issued SFAS No. 159, "The Fair Value
Option for Financial Assets and Financial Liabilities--Including an Amendment of
FASB Statement No. 115," which permits entities to choose to measure many
financial instruments and certain other items at fair value. SFAS No. 159 will
become effective for the Company on January 1, 2008 (the first fiscal year
beginning after November 15, 2007). The Company is currently evaluating the
impact of adopting SFAS No. 159 but does not expect that the adoption will have
a material impact on its consolidated financial statements.
25
<PAGE>
Premier Entertainment Biloxi LLC and Subsidiary
Debtor-In-Possession
Notes to Consolidated Financial Statements (continued)
10. RECENTLY ISSUED ACCOUNTING STANDARDS (CONTINUED)
SFAS NO. 157 In September 2006, the FASB issued SFAS No. 157, "Fair Value
Measurements." The statement defines fair value, establishes a framework for
measuring fair value, expands disclosures about fair value measurements and does
not require any new fair value measurements. SFAS No. 157 will become effective
for the Company on January 1, 2008 (the first fiscal year beginning after
November 15, 2007). In February 2008, the FASB decided to issue final Staff
Positions that will partially defer the effective date of SFAS No. 157 for one
year for certain nonfinancial assets and nonfinancial liabilities and remove
certain leasing transactions from the scope of SFAS No. 157. The Company is
currently evaluating the impact of adopting SFAS No. 157 but does not expect
that the adoption will have a material impact on its consolidated financial
statements
11. FAIR VALUE OF FINANCIAL INSTRUMENTS
The following methods and assumptions were used to estimate the fair value of
each class of financial instruments for which it is practical to estimate that
value:
o Cash and cash equivalents - The carrying amounts approximate fair
value because of the short maturity of these instruments.
o Restricted cash - The carrying amounts approximate fair value
because of the short maturity of these instruments.
o Long-term debt - As a result of the bankruptcy filing, the fair
value of the Company's long-term debt as of August 9, 2007 cannot be
estimated. As a result, the fair value is presented at its carrying
value. Debt obligations with a short remaining maturity are valued
at the carrying amount.
26
<PAGE>
Premier Entertainment Biloxi LLC and Subsidiary
Debtor-In-Possession
Notes to Consolidated Financial Statements (continued)
11. FAIR VALUE OF FINANCIAL INSTRUMENTS (CONTINUED)
The estimated carrying amounts and fair values of the Company's financial
instruments at August 9, 2007 are as follows:
--------------------------------------
CARRYING FAIR
AMOUNT VALUE
--------------------------------------
FINANCIAL ASSETS:
Cash and cash equivalents $ 17,158,856 $ 17,158,856
Restricted cash 40,662,134 40,662,134
FINANCIAL LIABILITIES:
10 3/4% First mortgage notes 160,000,000 160,000,000
15% Junior subordinated note 16,730,358 16,730,358
IGT note payable 12,870,932 12,870,932
Senior secured reducing line of
credit facility 1,250,000 1,250,000
BHR note payable 9,084,267 9,084,267
27
TABLE OF CONTENTS
Part IItem 1 . BusinessItem 1A . Risk FactorsItem 1B . Unresolved Staff CommentsItem 2 . PropertiesItem 3 . Legal ProceedingsItem 4 . Submission Of Matters To A Vote Of Security HoldersItem 10 . Executive Officers Of The RegistrantPart IIItem 5. Market For Registrant S Common Equity, Related Stockholder Matters and Issuer Purchases Of Equity SecuritiesItem 6 . Selected Financial DataItem 7 . Management S Discussion and Analysis Of Financial Condition and Results Of OperationsItem 7A . Quantitative and Qualitative Disclosures About Market RiskItem 8 . Financial Statements and Supplementary DataItem 9 . Changes in and Disagreements with Accountants on Accounting and Financial DisclosureItem 9A . Controls and ProceduresItem 9B . Other InformationPart IIIItem 10 . Directors and Executive Officers Of The RegistrantItem 11 . Executive CompensationItem 12 . Security Ownership Of Certain Beneficial Owners and ManagementItem 13 . Certain Relationships and Related TransactionsItem 14 . Independent Accounting Firm FeesPart IVItem 15. Exhibits and Financial Statement Schedule