JELD-WEN HOLDING, INC.
UNITED STATES
SECURITIES AND EXCHANGE COMMISSION
Washington, D.C. 20549
__________________________________
FORM
10-K
__________________________________
x
ANNUAL
REPORT PURSUANT TO SECTION 13 OR 15(d) OF THE SECURITIES EXCHANGE ACT OF 1934
For the fiscal year ended
December 31, 2018
or
o
TRANSITION REPORT PURSUANT TO SECTION 13 OR 15(d) OF THE SECURITIES EXCHANGE ACT OF 1934
For the transition period from _____ to _____
Commission File Number: 001-38000
__________________________________
JELD-WEN Holding, Inc.
(Exact name of registrant as specified in its charter)
__________________________________
|
Delaware
(State or other jurisdiction of
incorporation or organization)
|
|
93-1273278
(I.R.S. Employer
Identification No.)
|
2645 Silver Crescent Drive
Charlotte, North Carolina 28273
(Address of principal executive offices, zip code)
(704) 378-5700
(Registrant’s telephone number, including area code)
__________________________________
Securities Registered Pursuant to Section 12(b) of the Act:
|
Title of each class
|
|
Name of each exchange on which registered
|
|
Common Stock (par value $0.01 per share)
|
|
New York Stock Exchange
|
Securities Registered Pursuant to Section 12(g) of the Act: None
Indicate by check mark if the registrant is a well-known seasoned issuer, as defined in Rule 405 of the Securities Act. Yes
x
No
o
Indicate by check mark if the registrant is not required to file reports pursuant to Section 13 or Section 15(d) of the Act. Yes
o
No
x
Indicate by check mark whether the registrant: (1) has filed all reports required to be filed by Section 13 or 15(d) of the Securities Exchange Act of 1934 during the preceding 12 months (or for such shorter period that the registrant was required to file such reports), and (2) has been subject to such filing requirements for the past 90 days. Yes
x
No
o
Indicate by check mark whether the registrant has submitted electronically every Interactive Data File required to be submitted pursuant to Rule 405 of Regulation S-T (§232.405 of this chapter) during the preceding 12 months (or for such shorter period that the registrant was required to submit such files). Yes
x
No
o
Indicate by check mark if disclosure of delinquent filers pursuant to Item 405 of Regulation S-K (§229.405 of this chapter) is not contained herein, and will not be contained, to the best of registrant’s knowledge, in definitive proxy or information statements incorporated by reference in Part III of this Form 10-K or any amendment to this Form 10-K.
x
Indicate by check mark whether the registrant is a large accelerated filer, an accelerated filer, a non-accelerated filer, a smaller reporting company, or an emerging growth company. See the definitions of “large accelerated filer,” “accelerated filer”, “smaller reporting company” and “emerging growth company” in Rule 12b-2 of the Exchange Act.
|
Large accelerated filer
|
|
x
|
|
Accelerated filer
|
|
o
|
|
|
|
|
|
|||
|
Non-accelerated filer
|
|
o
|
|
Smaller reporting company
|
|
o
|
|
Emerging growth company
|
o
|
|
||||
If an emerging growth company, indicate by checkmark if the registrant has elected not to use the extended transition period for complying with any new or revised financial accounting standards provided pursuant to Section 13(a) of the Exchange Act.
o
Indicate by check mark whether the registrant is a shell company (as defined in Rule 12b-2 of the Exchange Act). Yes
o
No
x
The aggregate market value of the common stock held by non-affiliates of the registrant was
$2.0 billion
as of the end of the registrant's second fiscal quarter (based on the closing sale price for the common stock on the New York Stock Exchange on June 29, 2018). Shares of the registrant's voting stock held by each executive officer and director and by each entity or person that, to the registrant's knowledge, owned 10% or more of the registrant's outstanding common stock as of June 30, 2018 have been excluded from this number in that these persons may be deemed affiliates of the registrant. This determination of possible affiliate status is not necessarily a conclusive determination for other purposes
The registrant had
100,739,266
shares of common stock, par value $0.01 per share, issued and outstanding as of
February 27, 2019
.
DOCUMENTS INCORPORATED BY REFERENCE
Items 10, 11, 12, 13 and 14 of Part III incorporate information by reference from the registrant's definitive proxy statement relating to its 2019 annual meeting of stockholders to be filed with the Securities and Exchange Commission within 120 days after the close of the registrant's fiscal year.
1
JELD-WEN HOLDING, Inc.
- Table of Contents –
|
Page No.
|
|
|
Part I.
|
|
|
Part II.
|
|
|
Item 5. Market for Registrant's Common Equity, Related Shareholder Matters and Issuer Purchases of Equity Securities
|
|
|
Part III.
|
|
|
Item 12. Security Ownership of Certain Beneficial Owners and Management and Related Shareholder Matters
|
|
|
Part IV.
|
|
|
Item 16. Form 10-K Summary
|
|
|
Consolidated Financial Statements
|
|
2
Glossary of Terms
When the following terms and abbreviations appear in the text of this report, they have the meaning indicated below:
|
2016 Dividend
|
Means (i) the borrowing of an additional $375 million under our Term Loan Facility and (ii) the application of approximately $35 million in cash and borrowings under our ABL Facility for the purpose of making payments of approximately $400 million to holders of our outstanding common stock, Series A Convertible Preferred Stock, Class B-1 Common Stock, options, and Restricted Stock Units, or “RSUs”
|
|
A&L
|
A&L Windows Pty. Ltd.
|
|
ABL Facility
|
Our $400 million asset-based loan revolving credit facility, dated as of October 15, 2014 and as amended from time to time, with JWI (as hereinafter defined) and JELD-WEN of Canada, Ltd., as borrowers, the guarantors party thereto, a syndicate of lenders, and Wells Fargo Bank, N.A., as administrative agent
|
|
ABS
|
American Building Supply, Inc.
|
|
Adjusted EBITDA
|
A supplemental non-GAAP financial measure of operating performance not based on any standardized methodology prescribed by GAAP that we define as net income (loss), adjusted for the following items: loss from discontinued operations, net of tax; equity earnings of non-consolidated entities; income tax (benefit) expense; depreciation and amortization; interest expense, net; impairment and restructuring charges; gain on previously held shares of equity investment; (gain) loss on sale of property and equipment; share-based compensation expense; non-cash foreign exchange transaction/translation (income) loss; other non-cash items; other items; and costs related to debt restructuring and debt refinancing.
|
|
ASC
|
Accounting Standards Codification
|
|
ASU
|
Accounting Standards Update
|
|
AUD
|
Australian Dollar
|
|
Australia Senior Secured Credit Facility
|
Our senior secured credit facility, dated as of October 6, 2015 and as amended from time to time, with certain of our Australian subsidiaries, as borrowers, and Australia and New Zealand Banking Group Limited, as lender
|
|
BBSY
|
Bank Bill Swap Bid Rate
|
|
Breezway
|
Breezway Australia Pty. Ltd.
|
|
Bylaws
|
Amended and Restated Bylaws of JELD-WEN Holding, Inc.
|
|
CAP
|
Cleanup Action Plan
|
|
Charter
|
Restated Certificate of Incorporation of JELD-WEN Holding, Inc.
|
|
Class B-1 Common Stock
|
Shares of our Class B-1 common stock, par value $0.01 per share, all of which were converted into shares of our Common Stock on February 1, 2017
|
|
CMI
|
CraftMaster Manufacturing, Inc.
|
|
COA
|
Consent Order and Agreement
|
|
CODM
|
Chief Operating Decision Maker
|
|
Common Stock
|
The 900,000,000 shares of common stock, par value $0.01 per share, authorized under our Charter
|
|
Corporate Credit Facilities
|
Collectively, our ABL Facility and our Term Loan Facility
|
|
Credit Facilities
|
Collectively, our Corporate Credit Facilities, our Australia Senior Secured Credit Facility, and our Euro Revolving Facility as well as other acquired term loans and revolving credit facilities
|
|
D&K
|
D&K Home Security Pty. Ltd.
|
|
DKK
|
Danish Krone
|
|
Domoferm
|
The Domoferm Group of companies
|
|
Dooria
|
Dooria AS
|
|
EPA
|
The U.S. Environmental Protection Agency
|
|
ERP
|
Enterprise Resource Planning
|
|
ESOP
|
JELD-WEN, Inc. Employee Stock Ownership and Retirement Plan
|
|
E.U.
|
European Union
|
|
Euro Revolving Facility
|
Our €39 million revolving credit facility, dated as of January 30, 2015 and as amended from time to time, with JELD-WEN ApS, as borrower, Danske Bank A/S and Nordea Bank Danmark A/S as lenders
|
3
|
Exchange Act
|
Securities Exchange Act of 1934, as amended
|
|
FASB
|
Financial Accounting Standards Board
|
|
10-K
|
Annual Report on Form 10-K for the fiscal year ended December 31, 2018
|
|
GAAP
|
Generally Accepted Accounting Principles in the United States
|
|
GILTI
|
Global Intangible Low-Taxed Income
|
|
IBOR
|
Interbank Offered Rate
|
|
IPO
|
The initial public offering of shares of our common stock, as further described in this report on Form 10-K
|
|
JELD-WEN
|
JELD-WEN Holding, Inc.
,
together with its consolidated subsidiaries where the context requires
|
|
JEM
|
JELD-WEN Excellence Model
|
|
JWA
|
JELD-WEN of Australia Pty. Ltd.
|
|
JWH
|
JELD-WEN Holding, Inc., a Delaware corporation
|
|
JWI
|
JELD-WEN, Inc., a Delaware corporation
|
|
Kolder
|
Kolder Group
|
|
LIBOR
|
London Interbank Offered Rate
|
|
M&A
|
Mergers & Acquisitions
|
|
Mattiovi
|
Mattiovi Oy
|
|
MMI Door
|
Milliken Millwork, Inc.
|
|
MD&A
|
Management’s Discussion and Analysis of Financial Condition and Results of Operations
|
|
NAV
|
Net asset value
|
|
NRD
|
Natural Resource Damage Trustee Council
|
|
NYSE
|
New York Stock Exchange
|
|
Onex
|
Onex Partners III LP and certain affiliates
|
|
PaDEP
|
Pennsylvania Department of Environmental Protection
|
|
Preferred Stock
|
90,000,000 shares of Preferred Stock, par value $0.01 per share, authorized under our Charter
|
|
PSU
|
Performance stock unit
|
|
R&R
|
Repair and remodel
|
|
RSU
|
Restricted stock unit
|
|
Sarbanes-Oxley
|
Sarbanes-Oxley Act of 2002, as amended
|
|
SEC
|
Securities and Exchange Commission
|
|
Securities Act
|
Securities Act of 1933, as amended
|
|
Senior Notes
|
$800.0 million of unsecured notes issued in December 2017 in a private placement in two tranches: $400.0 million bearing interest at 4.625% and maturing in December 2025 and $400.0 million bearing interest at 4.875% and maturing in December 2027
|
|
Series A Convertible Preferred Stock
|
Our Series A-1 Convertible Preferred Stock, par value $0.01 per share, Series A-2 Convertible Preferred Stock, par value $0.01 per share, Series A-3 Convertible Preferred Stock, par value $0.01 per share, and Series A-4 Convertible Preferred Stock, par value $0.01 per share, all of which were converted into shares of our common stock on February 1, 2017
|
|
SG&A
|
Selling, general, and administrative expenses
|
|
Tax Act
|
Tax Cuts and Jobs Act
|
|
Term Loan Facility
|
Our term loan facility, dated as of October 15, 2014, as amended from time to time with JWI, as borrower, the guarantors party thereto, a syndicate of lenders, and Bank of America, N.A., as administrative agent
|
|
Trend
|
Trend Windows & Doors Pty. Ltd.
|
|
U.K.
|
United Kingdom
|
|
U.S.
|
United States of America
|
|
WADOE
|
Washington State Department of Ecology
|
4
CERTAIN TRADEMARKS, TRADE NAMES AND SERVICE MARKS
This 10-K includes trademarks, trade names, and service marks owned by us. Our U.S. window and door trademarks include JELD-WEN
®
, AuraLast
®
, MiraTEC
®
, Extira
®
, LaCANTINA
TM
, MMI Door
TM
, Karona
TM
, ImpactGard
®
, JW
®
, Aurora
®
, IWP
®
, and True BLU
TM
, ABS
TM
. Our trademarks are either registered or have been used as common law trademarks by us. The trademarks we use outside the U.S. include the Stegbar
®
, Regency
®
, William Russell Doors
®
, Airlite
®
, Trend
®
, The Perfect Fit
TM
, Aneeta
®
, Breezway
®
, Kolder
TM
,
Corinthian
®
and A&L
TM
marks in Australia, and Swedoor
®
, Dooria
®
, DANA
®
, Mattiovi
TM
, Alupan
®
and Domoferm
®
marks in Europe. ENERGY STAR
®
is a registered trademark of the U.S. Environmental Protection Agency. This 10-K contains additional trademarks, trade names, and service marks of others, which are, to our knowledge, the property of their respective owners. Solely for convenience, trademarks, trade names, and service marks referred to in this 10-K appear without the
®
, ™ or
SM
symbols, but such references are not intended to indicate, in any way, that we will not assert, to the fullest extent under applicable law, our rights or the right of the applicable licensor to these trademarks, trade names, and service marks. We do not intend our use of other parties’ trademarks, trade names, or service marks to imply, and such use or display should not be construed to imply, a relationship with, or endorsement or sponsorship of us by, these other parties.
5
PART I - FINANCIAL INFORMATION
FORWARD-LOOKING STATEMENTS
In addition to historical information, this Form 10-K contains “forward-looking statements” within the meaning of Section 27A of the Securities Act and Section 21E of the Exchange Act, which are subject to the “safe harbor” created by those sections. All statements, other than statements of historical facts, included in this Form 10-K are forward-looking statements. You can generally identify forward-looking statements by our use of forward-looking terminology such as “anticipate”, “believe”, “continue”, “could”, “estimate”, “expect”, “intend”, “may”, “might”, “plan”, “potential”, “predict”, “seek”, or “should”, or the negative thereof or other variations thereon or comparable terminology. In particular, statements about the markets in which we operate, including growth of our various markets, and our expectations, beliefs, plans, strategies, objectives, prospects, assumptions, or future events or performance contained under the headings Item 1A-
Risk Factors
, Item 7-
Management’s Discussion and Analysis of Financial Condition and Results of Operations
, and Item 1-
Business
are forward-looking statements. In addition, statements regarding the potential outcome of pending litigation are forward-looking statements.
We have based these forward-looking statements on our current expectations, assumptions, estimates, and projections. While we believe these expectations, assumptions, estimates, and projections are reasonable, such forward-looking statements are only predictions and involve known and unknown risks and uncertainties, many of which are beyond our control. These and other important factors, including those discussed under the headings Item 1A-
Risk Factors
, Item 7-
Management’s Discussion and Analysis of Financial Condition and Results of Operations
, and Item 1-
Business
, may cause our actual results, performance or achievements to differ materially from any future results, performance or achievements expressed or implied by these forward-looking statements. Some of the factors that could cause actual results to differ materially from those expressed or implied by the forward-looking statements include:
|
•
|
negative trends in overall business, financial market and economic conditions, and/or activity levels in our end markets;
|
•
our highly competitive business environment;
•
failure to timely identify or effectively respond to consumer needs, expectations or trends;
•
failure to maintain the performance, reliability, quality, and service standards required by our customers;
•
failure to implement our strategic initiatives, including JEM;
•
acquisitions or investments in other businesses that may not be successful;
•
declines in our relationships with and/or consolidation of our key customers;
|
•
|
increases in interest rates and reduced availability of financing for the purchase of new homes and home construction and improvements;
|
•
fluctuations in the prices of raw materials used to manufacture our products;
•
delays or interruptions in the delivery of raw materials or finished goods;
•
seasonal business and varying revenue and profit;
•
changes in weather patterns;
•
political, economic, and other risks that arise from operating a multinational business;
•
exchange rate fluctuations;
•
disruptions in our operations;
•
manufacturing realignments and cost savings programs resulting in a decrease in short-term earnings;
•
our new Enterprise Resource Planning system that we anticipate implementing in the future proving ineffective;
•
security breaches and other cybersecurity incidents;
•
increases in labor costs, potential labor disputes, and work stoppages at our facilities;
|
•
|
changes in building codes that could increase the cost of our products or lower the demand for our windows and doors;
|
•
compliance costs and liabilities under environmental, health, and safety laws and regulations;
•
compliance costs with respect to legislative and regulatory proposals to restrict emission of GHGs;
6
|
•
|
lack of transparency, threat of fraud, public sector corruption, and other forms of criminal activity involving government officials;
|
•
product liability claims, product recalls, or warranty claims;
•
inability to protect our intellectual property;
•
loss of key officers or employees;
•
pension plan obligations;
•
our current level of indebtedness;
•
risks associated with the material weaknesses that have been identified;
•
the extent of Onex’ control of us; and
•
other risks and uncertainties, including those listed under Item 1A-
Risk Factors
.
Given these risks and uncertainties, you are cautioned not to place undue reliance on such forward-looking statements. The forward-looking statements contained in this Form 10-K are not guarantees of future performance and our actual results of operations, financial condition, and liquidity, and the development of the industry in which we operate, may differ materially from the forward-looking statements contained in herein. In addition, even if our results of operations, financial condition, and liquidity, and events in the industry in which we operate, are consistent with the forward-looking statements contained in this Form 10-K, they may not be predictive of results or developments in future periods.
Any forward-looking statement in this Form 10-K speaks only as of the date of this Form 10-K or as of the date such statement was made. We do not undertake any obligation to update or revise, or to publicly announce any update or revision to, any of the forward-looking statements, whether as a result of new information, future events or otherwise, except as required by law.
Unless the context requires otherwise, references in this Form 10-K to “we,” “us,” “our,” “the Company,” or “JELD-WEN” mean JELD-WEN Holding, Inc., together with our consolidated subsidiaries where the context requires, including our wholly owned subsidiary JWI.
7
Item 1 - Business.
Our Company
We are one of the world’s largest door and window manufacturers. We design, produce, and distribute an extensive range of interior and exterior doors, wood, vinyl, and aluminum windows, and related products for use in the new construction and R&R of residential homes and, to a lesser extent, non-residential buildings.
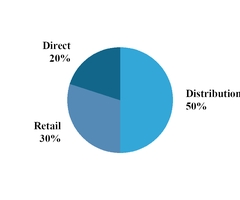
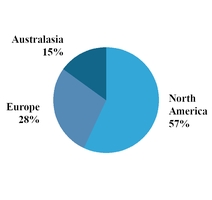
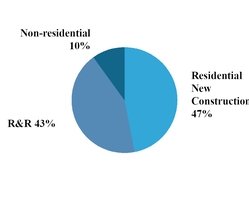
We market our products globally under the JELD-WEN brand, along with several market-leading regional brands such as Swedoor and DANA in Europe and Corinthian, Stegbar, and Trend in Australia. Our customers include wholesale distributors and retailers as well as individual contractors and consumers. As a result, our business is highly diversified by distribution channel, geography, and construction application, as illustrated in the charts below:
|
2018 Net Revenues $4,347 million
|
|
Distribution Channel
|
Geography
|
Construction Application(1)
|
||
|
(1)
|
Percentage of net revenues by construction application is a management estimate based on the end markets into which our customers sell.
|
As one of the largest door and window companies in the world, we have invested significant capital to build a business platform that we believe is unique among our competitors. We operate
135
manufacturing facilities in
20
countries, located primarily in North America, Europe, and Australia. Our global manufacturing footprint is strategically sized and located to meet the delivery requirements of our customers. For many product lines, our manufacturing processes are vertically integrated, enhancing our range of capabilities, our ability to innovate, and our quality control, as well as providing us with supply chain, transportation, and working capital savings. We believe that our manufacturing network allows us to deliver our broad portfolio of products to a wide range of customers across the globe, improves our customer service, and strengthens our market positions.
Our History
We were founded in 1960 by Richard L. Wendt, when he, together with four business partners, bought a millwork plant in Oregon. The subsequent decades were a time of successful expansion and growth as we added different businesses and product categories such as interior doors, exterior steel doors, and vinyl windows. Our first overseas acquisition was Norma Doors in Spain in 1992 and since then we acquired or established numerous businesses in Europe, Australia, Asia, Canada, Mexico, and Chile, making us a truly global company.
In October 2011, certain funds managed by affiliates of Onex acquired a majority of the combined voting power in the Company through the acquisition of convertible debt and convertible preferred equity.
After the Onex investment, we began the transformation of our business from a family-run operation to a global organization with independent, professional management. The transformation accelerated after 2013 with the hiring of a new senior management team strategically recruited from a number of world-class industrial companies. Our new management team has decades of experience driving operational improvement, innovation, and growth, both organically and through acquisitions.
On February 1, 2017, we closed an IPO of
28.75 million
shares of our common stock at a public offering price of $23.00 per share. We sold
22.27 million
shares and Onex sold
6.48 million
shares from which we did not receive any proceeds. We received
$472.4 million
after deducting underwriters’ discounts and commissions and other offering expenses. We used a portion of the net proceeds from the IPO to repay $375.0 million of indebtedness outstanding under our Term Loan Facility and used the remaining net
8
proceeds for working capital and other general corporate purposes, including sales and marketing activities, general and administrative matters, capital expenditures, and to invest in or acquire complementary businesses, products, services, technologies, or other assets.
In May and November 2017, we completed secondary public offerings of 16.1 million and $14.4 million shares, respectively, of our Common Stock, substantially all of which were owned by Onex.
As of
December 31, 2018
, Onex owned approximately
32.4%
of our outstanding shares of common stock.
Our Business Strategy and Operating Model
We seek to achieve best-in-industry financial performance through the disciplined execution of:
|
•
|
operational excellence programs, including JEM and our facility rationalization and modernization initiative to improve our profit margins and free cash flow;
|
|
•
|
initiatives to drive profitable organic sales growth, including new product development, investments in our brands and marketing, channel management, and pricing optimization; and
|
|
•
|
disciplined and balanced capital allocation with a focus on maximizing returns.
|
The execution of our strategy is supported and enabled by a relentless focus on talent management. Over the long term, we believe that the implementation of our strategy is largely within our control and is less dependent on external factors. The key elements of our strategy are described further below.
Expand Our Margins and Free Cash Flow Through Operational Excellence
With
135
manufacturing facilities around the world and approximately
23,000
dedicated employees, we have a global manufacturing footprint that is unique in the door and window industry. We believe we have identified a substantial opportunity to improve our profitability by building a culture of operational excellence and continuous improvement across all aspects of our business through our JEM initiative. Due to our history of growth through acquisitions, historically, we were not centrally managed and had a limited focus on standard work, cost reduction, operational improvement, and strategic material sourcing. This resulted in profit margins that were lower than our building products peers and far lower than what would typically be expected of a world-class industrial company.
Our senior management team has a proven track record of implementing operational excellence programs at some of the world’s leading industrial manufacturing businesses, and we believe the same successes can be realized at JELD-WEN. Key areas of focus of our operational excellence program include:
|
•
|
reducing labor costs, overtime, and waste by optimizing planning and manufacturing processes;
|
|
•
|
reducing or minimizing increases in material costs through strategic global sourcing and value-added re-engineering of components, in part by leveraging our significant spend and the global nature of our purchases;
|
|
•
|
reducing warranty costs by improving quality; and
|
|
•
|
a JEM-enabled facility rationalization and modernization initiative that will reduce overhead costs and complexity, while increasing our overall capacity and improving our service levels.
|
Drive Profitable Organic Sales Growth
We seek to deliver profitable organic revenue growth through several strategic initiatives, including new product development, brand and marketing investment, channel management, and continued pricing optimization. These strategic initiatives will drive our sales mix to include more value-added, higher margin products.
|
•
|
New Product Development
: Our management team has renewed our focus on innovation and new product development. We believe that leading the market in innovation will enhance demand for our products, increase the rate at which our products are specified into home and non-residential designs, and allow us to sell a higher margin product mix.
|
|
•
|
Brand and Marketing Investment
: We recently began to make meaningful investments in new marketing initiatives designed to enhance the positioning of the JELD-WEN family of brands. Our new initiatives include marketing campaigns focused on the distributor, builder, architect, and consumer communities.
|
|
•
|
Channel Management
: We are implementing initiatives and investing in tools and technology to enhance our relationships with key customers, make it easier for them to source from JELD-WEN, and support their ability to sell our products in the marketplace. These incentives help our customers grow their businesses
|
9
in a profitable manner while also improving our
sales volumes and the margin of our product mix.
|
•
|
Pricing Optimization
: We are focused on profitable growth and will continue to employ a strategic approach to pricing our products. Pricing discipline is an important element of our effort to improve our profit margins and earn an appropriate return on our invested capital.
|
Disciplined and Balanced Capital Allocation
We believe there is a significant opportunity to increase shareholder value by deploying our free cash flow in a balanced manner between strategic M&A and share repurchases. Our approach to capital allocation includes a disciplined, returns-focused evaluation of opportunities.
Collectively, our senior management team has acquired and integrated more than 100 companies during their careers. Leveraging this collective experience, we have developed a disciplined governance process for identifying, evaluating, and integrating acquisitions. Since 2015, we have completed 13 acquisitions across North America, Europe, and Australasia. Our M&A focuses on three types of opportunities:
|
•
|
Expansion in Existing Markets
: The competitive landscape in several of our key markets remains highly fragmented, which creates an opportunity for us to acquire businesses that will, enhance our market-leading positions and realize synergies through the elimination of duplicate costs. Our acquisitions of Mattiovi (Finland), Dooria (Norway), Kolder (Australia), Trend (Australia) and A&L (Australia) are examples of this strategy.
|
|
•
|
Enhancing Our Portfolio of Products and Service Offerings
: We strive to provide the broadest range of doors and windows to our customers so that we can enhance our share of their overall spend. Along with our organic new product development pipeline, we seek to expand our door and window product and service portfolio by acquiring companies that have developed unique products, technologies, or value-added services. Our acquisitions of Karona (stile and rail doors), LaCantina (folding and sliding wall systems), Aneeta (sashless windows), Breezway (louver windows), MMI Door (value-added supplier of customized door systems), Domoferm (steel frames and doors), and ABS (value-added supplier of millwork to both residential and commercial channels) are examples of this strategy.
|
|
•
|
Product Adjacencies and New Geographies
: Opportunities also exist to expand our company through the acquisition of complementary door and window manufacturers in new geographies as well as providers of product adjacencies. While this has not been a major focus in recent years, we expect it to be a key element in our long-term growth.
|
In addition to M&A, we seek opportunities to create value by opportunistically repurchasing our own common stock. In 2018, our board of directors approved a
$250.0 million
share repurchase authorization, under which we repurchased
$125.0 million
during 2018. We will consistently balance the growth, strategic fit, and returns potential of acquisition opportunities against the return potential of purchasing our own shares.
Our Products
We provide a broad portfolio of interior and exterior doors, windows, and related products, manufactured from a variety of wood, metal, and composite materials and offered across a full spectrum of price points. In the year ended
December 31, 2018
, our door sales accounted for
66%
of net revenues, our window sales accounted for
21%
of net revenues, and our other ancillary products and services accounted for
13%
of net revenues.
Doors
We are a leading global manufacturer of residential doors. We offer a full line of residential interior and exterior door products, including patio doors and folding or sliding wall systems. Our non-residential door product offering is concentrated in Europe, where we are a leading non-residential door provider by net revenues in Germany, Austria, Switzerland, and Scandinavia. In order to meet the style, design, and durability needs of our customers across a broad range of price points, our product portfolio encompasses many types of materials, including wood veneer, composite wood, steel, glass, and fiberglass. Our interior and exterior residential door models generally retail at prices ranging from $30 to $40 for our most basic products to several thousand dollars for our high-end exterior doors. Our highest volume products include molded interior doors, which are made from two composite molded door skins joined by a wooden frame and filled with a hollow honey-cell core or other solid core materials. These low-cost doors are the most popular choice for interior residential applications in North America and also are prevalent in France and the U.K. In Europe, we also sell highly engineered non-residential doors, with features such as soundproofing, fire resistance, radiation resistance, and added security. We also manufacture stile and rail doors in our Southeast Asia and U.S. manufacturing facilities. In the U.S.we also manufacture folding and sliding wall systems. Additionally, we offer profitable value-added distribution services in all of our markets,
10
including customizable configuration services, specialized component options, and multiple finishing options. These services are valued by labor constrained customers and allow us to capture more profit from the sale of our door products. In the U.S., our recent acquisitions of ABS and MMI Door are examples of our increased focus on value-added services. Our newest door product offerings include steel doors, steel door frames, and fire doors for commercial and residential markets through our recent acquisition of Domoferm, which closed in February 2018.
Windows
We are a leading global manufacturer of residential windows. We manufacture wood, vinyl, and aluminum windows in North America, wood and aluminum windows in Australia, and wood windows in the U.K. Our window product lines comprise a full range of styles, features, and energy-saving options in order to meet the varied needs of our customers in each of our regional end markets. For example, our high performance wood and vinyl windows with multi-pane glazing and superior energy efficiency properties are in greater demand in Canada and the northern U.S. By contrast, our lower-cost aluminum framed windows are popular in some regions of the southern U.S., while in coastal Florida certain local building codes require windows that can withstand the impact of debris propelled by hurricane-force winds. Wood windows are prevalent as a high-end option in all of our markets because they possess both insulating qualities and the beauty of natural wood. In North America, our wood windows and patio doors include our proprietary AuraLast treatment, which is a unique water-based wood protection process that provides protection against wood rot and decay. We believe AuraLast is unique in its ability to penetrate and protect the wood through to the core, as opposed to being a shallow or surface-only treatment. Our most recent window product offerings include sashless window systems through our 2015 acquisition of Aneeta and louver window systems through our 2016 acquisition of Breezway. Our windows typically retail at prices ranging from $100 to $200 for a basic vinyl window to over $1,000 for a custom energy-efficient wood window. We believe that our innovative energy-efficient windows position us to benefit from increasing environmental awareness among consumers and from changes in local building codes. In recognition of our expansive energy-efficient product line, we have been an ENERGY STAR partner since 1998.
Other Ancillary Products and Services
In certain regions, we sell a variety of other products that are ancillary to our door and window offerings, which we do not classify as door or window sales. These products include shower enclosures and wardrobes, moldings, trim board, lumber, cutstock, glass, staircases, hardware and locks, cabinets, and screens. We sell molded door skins to certain customers pursuant to long-term contracts, and these customers in turn use the molded door skins to manufacture interior doors and compete directly against us in the marketplace. Miscellaneous installation and other services are also included in this category.
Our Segments
We operate within the global market for residential and non-residential doors and windows with sales spanning approximately
100
countries. While we operate globally, the markets for doors and windows are regionally distinct with suppliers manufacturing finished goods in proximity to their customers. Finished doors and windows are generally bulky, expensive to ship, and, in the case of windows, fragile. Designs and specifications of doors and windows also vary from country to country due to differing construction methods, building codes, certification requirements, and consumer preferences. Customers also demand short delivery times and can require special order customizations. We believe that we are well-positioned to meet the global demands of our customers due to our market leadership, strong brands, broad product line, and strategically located manufacturing and distribution facilities.
Our operations are managed and reported in three reportable segments, organized and managed principally by geographic region. Our reportable segments are North America, Europe and Australasia. We report all other business activities in Corporate and unallocated costs. Factors considered in determining the three reportable segments include the nature of business activities, the management structure accountable directly to the CODM for operating and administrative activities, the discrete financial information available and the information regularly presented to the CODM.
North America
In our North America segment, we compete primarily in the market for residential doors and windows in the U.S. and Canada. We are the only manufacturer that offers a full line of interior and exterior door and window products, allowing us to offer a more complete solution to our customer base. We believe that our leading position in the North American market will enable us to benefit from continued recovery in residential construction activity over the next several years. We believe that our total market opportunity in North America also includes non-residential applications, other related building products, and value-added services.
Europe
The European market for doors is highly fragmented and we have the only platform in the industry capable of serving nearly all European countries. In our Europe segment, we compete primarily in the market for residential and non-residential doors in
11
Germany, the U.K., France, Austria, Switzerland, and Scandinavia. We believe that our total market opportunity in Europe also includes other European countries, other door product lines, related building products, and value-added services. Although construction activity in Europe has been slower to recover compared to construction activity in North America, new construction and R&R activity is expected to increase across Europe over the next several years.
Australasia
In our Australasia segment, we compete primarily in the market for residential doors and windows in Australia, where we hold a leading position by net revenues. We believe that our total market opportunity in the Australasia region also includes non-residential applications and other countries in the region, as well as other related building products, and value-added services. For example, we also sell a full line of shower enclosures and closet systems throughout Australia.
Financial information regarding our segments is included in Note 18 -
Segment Information
to our financial statements included in this Form 10-K.
Materials
Historically our sourcing function operated primarily in a regional, decentralized model. With our recent leadership transformation, we have increased our focus on making global sourcing a competitive advantage, as evidenced by our hiring in early 2016 of an experienced procurement executive to lead our global sourcing function. Under his leadership, our focus has been and will continue to be on minimizing material costs through strategic global sourcing and value-added re-engineering of components. We believe leveraging our significant spending and the global nature of our purchases will allow us to achieve these goals.
We generally maintain a diversified supply base for the materials used in our manufacturing operations. Materials represented approximately
51%
of our cost of sales in the year ended
December 31, 2018
. The primary materials used for our door business include wood, wood veneers, wood composites, steel, glass, internally produced door skins, fiberglass compound, and hardware, as well as petroleum-based products such as resin and binders. The primary materials for our window business include wood, wood components, glass, hardware, aluminum extrusions, and vinyl extrusions. Wood components for our window operations are sourced primarily from our own manufacturing plants, which allow us to improve margins and take advantage of our proprietary technologies such as our AuraLast wood treatment process.
We track commodities in order to understand our vendors’ costs, realizing that our costs are determined by the broader competitive market as well as by increases in the inputs to our vendors. In order to manage the risk in material costs, we develop strategic relationships with suppliers, routinely evaluate substitute components, develop new products, vertically integrate where applicable and seek alternative sources of supply from multiple vendors and often from multiple geographies.
Seasonality
In a typical year, our operating results are impacted by seasonality. Historically, peak season for home construction and remodeling in our North America and Europe segments, which represent the substantial majority of our revenues, generally corresponds with the second and third calendar quarters, and therefore our sales volume is usually higher during those quarters. Seasonal variations in operating results may be impacted by inclement weather conditions, such as cold or wet weather, which can delay construction projects.
Sales and Marketing
We actively market and sell our products directly to our customers around the world through our global sales force and indirectly through our marketing and branding initiatives. Our global sales force, which is organized and managed regionally, focuses on building and maintaining relationships with key customers as well as managing customer supply needs and arranging in-store promotional initiatives. In North America, we also have a dedicated team that focuses on our large home center customers. We have recently made significant investments in tools and technologies to enhance the effectiveness of our sales force and improve ease of doing business. For example, we are in the process of deploying Salesforce.com on a global basis, which will provide us with a common global customer relationship management platform. In addition, we are in the process of simplifying our order entry process by implementing online configuration tools. We have introduced an electronic ordering system for easy order placement, and we intend to expand our online retail sales. Our new strategy also includes initiatives focused on expanding our market through the use of social media.
We have restructured the commission and incentive plans of our sales team to drive focus on achieving profitable growth. We have also invested significantly in our architectural sales force by adding staff and tools to increase the frequency with which our
12
products are specified by architects. We believe these investments will increase sales force effectiveness, create pull-through demand, and optimize sales force productivity.
We believe that our broad product portfolio of both doors and windows in North America and Australasia is a competitive advantage as it allows us to cross-sell our door and window products to our end customers, many of whom find it more efficient to choose one supplier for their door and window needs on a given project. None of our primary competitors in these regions offers a similarly complete range of windows as well as interior and exterior doors.
Research and Development
Following a number of years during and after the global financial crisis of limited investment in new product development, a core element of our strategy is a renewed focus on innovation and the development of new products and technologies. We believe that leading the market in innovation will enhance demand for our products and allow us to sell a higher margin product mix. Our research and development efforts encompass new product development, derivative product development, as well as value added re-engineering of components in our existing products leading to reduced costs and manufacturing efficiencies. We have also designed a new governance process that prioritizes the most impactful projects and is expected to improve the efficiency and quality of our research and development efforts. The governance process is currently being deployed globally, such that we can leverage best practices from region to region. Additionally, a substantial driver of our acquisition activity has been increasing access to new and innovative products.
Although product specifications and certifications vary from country to country, the global nature of our operations allows us to leverage our global innovation capabilities and share new product designs across our markets. We believe that the global nature of our research and development capabilities is unique among our door and window competition. An example of global sharing of innovation is the “soft close” door system, which is based on hardware originally designed and manufactured by our European operations that is now being offered in North America and Australia. Additionally, we have successfully launched new door designs into our North American and Australian markets that were originally developed in our European operations.
Customers
We sell our products worldwide and have well-established relationships with numerous customers throughout the door and window distribution chain in each of our end markets, including retail home centers, wholesale distributors, and building product dealers that supply homebuilders, contractors, and consumers. Our wholesale customers include such industry leaders as BMC/Stock Building Supply, ProBuild/Builders First Source, Saint-Gobain, and the Holzring group. Our home center customers include, among others, The Home Depot, Lowes, and Menards in North America; B&Q, Howdens, and Bauhaus in Europe; and Bunnings Warehouse in Australia. We have maintained relationships with the majority of our top ten customers for over
20
years and believe that the strength and tenure of our customer relationships is based on our ability to produce and deliver high-quality products quickly and in the desired volumes for a reasonable price. Our top ten customers together accounted for approximately
35%
of our net revenues in the year ended
December 31, 2018
, and our largest customer, The Home Depot, accounted for approximately
14.2%
of our net revenues in the year ended
December 31, 2018
.
Competition
The door and window industry is highly competitive and includes a number of regional and international competitors. Competition is largely based on the functional and aesthetic quality of products, service quality, distribution capability and price. We believe that we are well-positioned in our industry due to our leading brands, our broad product lines, our consistently high product quality and service, our global manufacturing and distribution capabilities, and our extensive multi-channel distribution. For North American interior doors, our major competitors include Masonite and several smaller independent door manufacturers. For North American exterior doors, competitors include Masonite, Therma-Tru (a division of Fortune Brands), and Plastpro. The North American window market is highly fragmented, with sizable competitors including Andersen, Pella, Marvin, Ply-Gem (a division of NCI Building Systems), and Milgard (a division of Masco). The door manufacturers that we primarily compete with in our European markets include Huga, Prüm/Garant, Viljandi, Masonite, Keyor, and Herholz. The competitive landscape in Australia is varied across the door and window markets. In the Australian door market, Hume Doors is our primary competitor, while in the window, shower screen, and wardrobe markets we largely compete against a fragmented set of smaller companies.
Intellectual Property
We rely primarily on patent, trademark, copyright, and trade secret laws and contractual commitments to protect our intellectual property and other proprietary rights. Generally, registered trademarks have a perpetual life, provided that they are renewed on a timely basis and continue to be used properly as trademarks. We intend to maintain the trademark registrations listed below so long as they remain valuable to our business.
13
Our U.S. window and door trademarks include JELD-WEN, AuraLast, MiraTEC, Extira, LaCANTINA, Karona, ImpactGard, JW, Aurora, MMI Door, IWP, and ABS. Our trademarks are either registered or have long been used as a common law trademark by the Company. The trademarks we use outside the U.S. include the Stegbar, Regency, William Russell Doors, Airlite, Trend, The Perfect Fit, Aneeta, Breezway, Kolder, Corinthian and A&L marks in Australia, and Swedoor, Dooria, DANA, Mattiovi, Alupan and Domoferm in Europe.
Employees
As of
December 31, 2018
, we employed approximately
23,000
people. Of our total number of employees, approximately
11,500
are employed in operations included in our North America segment and corporate operations, approximately
6,700
are employed in operations included in our Europe segment, and approximately
4,800
are employed in operations included in our Australasia segment.
In total, approximately
1,120
, or
10%
, of our employees in the U.S. and Canada are unionized. Two facilities in the U.S., representing approximately
350
employees, are covered by collective bargaining agreements. In Canada, approximately
64%
of our employees work at facilities covered by collective bargaining agreements. As is common in Europe and Australia, the majority of our facilities are covered by work councils and/or labor agreements. We believe we have satisfactory relationships with our employees and our organized labor unions.
Environmental Matters
The geographic breadth of our facilities and the nature of our operations subject us to extensive environmental, health, and safety laws and regulations in jurisdictions throughout the world. Such laws and regulations relate to, among other things, air emissions, the treatment and discharge of wastewater, the discharge of hazardous materials into the environment, the handling, storage, use and disposal of solid, hazardous and other wastes, worker health and safety, or otherwise relate to health, safety, and protection of the environment. Many of our products are also subject to various laws and regulations such as building and construction codes, product safety regulations, and regulations and mandates related to energy efficiency.
The nature of our operations, which involve the handling, storage, use, and disposal of hazardous wastes, exposes us to the risk of liability and claims associated with contamination at our current and former facilities or sites where we have disposed of or arranged for the disposal of waste, or with the impact of our products on human health and safety and the environment. Laws and regulations with respect to the investigation and remediation of contaminated sites can impose joint and several liability for releases or threatened releases of hazardous materials upon statutorily defined parties, including us, regardless of fault or the lawfulness of the original activity or disposal. We have been subject to claims, including having been named as a potentially responsible party, in certain proceedings initiated pursuant to the Comprehensive Environmental Response, Compensation, and Liability Act, or CERCLA, and similar state and foreign laws, regulations, and statutes, and may be named a potentially responsible party in other similar proceedings in the future. Unforeseen expenditures or liabilities may arise in connection with such matters.
We have also been the subject of certain environmental regulatory actions by the EPA and state regulatory agencies in the U.S. and foreign governmental authorities in jurisdictions in which we operate, and are obligated to make certain expenditures in settlement of those actions. We do not expect expenditures for compliance with environmental laws and regulations to have a material adverse effect on our results of operations or competitive position. However, the discovery of a presently unknown environmental condition, changes in environmental requirements or their enforcement, or other unanticipated events, may give rise to unforeseen expenditures and liabilities which could be material.
For more information, see Item 1A -
Risk Factors -
We may be subject to significant compliance costs as well as liabilities under environmental, health, and safety laws and regulations, Item 1A -
Risk Factors -
Risks Relating to Our Business and Industry, Item 1A -
Risk Factors -
We may be subject to significant compliance costs with respect to legislative and regulatory proposals to restrict emissions of GHGs.
Environmental Sustainability
We strive to conduct our business in a manner that is environmentally sustainable and demonstrates environmental stewardship. Toward that end, we pursue processes that are designed to minimize waste, maximize efficient utilization of materials, and conserve resources, including using recycled and reused materials to produce portions of our products. We continue to evaluate and modify our manufacturing and other processes on an ongoing basis to further reduce our impact on the environment. We believe it is important for our employees to share our commitment and we strive to recruit, educate, and train our employees in these values on an ongoing basis throughout their careers with us.
14
Environmental Regulatory Actions
In 2008, we entered into an Agreed Order with the WADOE, to assess historic environmental contamination and remediation feasibility at our former manufacturing site in Everett, Washington. As part of this agreement, we also agreed to develop a CAP, arising from the feasibility assessment. We are currently working with WADOE to finalize our RI/FS, and, once final, we will develop the CAP. We estimate the remaining cost to complete our RI/FS (Remedial Investigation and Feasibility Study), and develop the CAP at $0.5 million, which we have fully accrued. However, because we cannot at this time reasonably estimate the cost associated with any remedial action we would be required to undertake, we have not provided accruals for any remedial actions in our consolidated financial statements.
In 2015, we entered into a COA with the PaDEP to remove a pile of wood fiber waste from our site in Towanda, Pennsylvania, which we acquired in connection with our acquisition of CMI in 2013, by using it as fuel for a boiler at that site. The COA replaced a 1995 Consent Decree between CMI’s predecessor Masonite, Inc. and PaDEP. Under the COA, we are required to achieve certain periodic removal objectives and ultimately remove the entire pile by
August 31, 2022
. There are currently
$11.0 million
in bonds posted in connection with these obligations. If we are unable to remove this pile by
August 31, 2022
, then the bonds will be forfeited and we may be subject to penalties by PaDEP. We currently anticipate meeting all applicable removal deadlines; however, if our operations at this site decrease and we burn less fuel than currently anticipated, we may not be able to meet such deadlines.
Available Information
Our Annual Reports on Form 10-K, Quarterly Reports on Form 10-Q, Current Reports on Form 8-K, and amendments to reports filed pursuant to Sections 13(a) and 15(d) of the Exchange Act, are filed with the SEC. We are subject to the informational requirements of the Exchange Act and file or furnish reports, proxy statements and other information with the SEC. Such reports and other information filed by us with the SEC are available free of charge on our website at investors.jeld-wen.com when such reports are made available on the SEC’s website at www.sec.gov. The contents of these websites are not incorporated into this filing. Further, our references to the URLs for these websites are intended to be inactive textual references only.
Item 1A - Risk Factors
Investing in our common stock involves a high degree of risk. You should carefully consider the following factors, as well as other information contained or incorporated by reference in this 10-K, before deciding to invest in shares of our common stock. The trading price of our common stock could decline due to any of these risks, and you may lose all or part of your investment in our common stock.
Risks Relating to Our Business and Industry
Negative trends in overall business, financial market and economic conditions, and/or activity levels in our end markets may reduce demand for our products, which could have a material adverse effect on our business, financial condition, and results of operations.
Negative trends in overall business, financial market, and economic conditions globally or in the regions where we operate may reduce demand for our doors and windows, which is tied to activity levels in the R&R and new residential and non-residential construction end markets. In particular, the following factors may have a direct impact on our business in the regions where our products are marketed and sold:
|
•
|
the strength of the economy;
|
|
•
|
employment rates and consumer confidence and spending rates;
|
|
•
|
the availability and cost of credit;
|
|
•
|
the amount and type of residential and non-residential construction;
|
|
•
|
housing sales and home values;
|
|
•
|
the age of existing home stock, home vacancy rates, and foreclosures;
|
|
•
|
interest rate fluctuations for our customers and consumers;
|
|
•
|
volatility in both debt and equity capital markets;
|
|
•
|
increases in the cost of raw materials or any shortage in supplies or labor, including as a result of tariffs or other trade restrictions;
|
|
•
|
the effects of governmental regulation and initiatives to manage economic conditions;
|
15
|
•
|
geographical shifts in population and other changes in demographics; and
|
|
•
|
changes in weather patterns.
|
Toward the end of the last decade, the global economy endured a significant recession followed by a prolonged period of moderate recovery that had a substantial negative effect on sales across our end markets. In particular, beginning in mid-2006 and continuing through late 2011, the U.S. residential and non-residential construction industry experienced one of the most severe downturns of the last 40 years. While cyclicality in our new residential and non-residential construction end markets is moderated to a certain extent by R&R activity, much R&R spending is discretionary and can be deferred or postponed entirely when economic conditions are poor. We experienced sales declines in all of our end markets during the most recent economic downturn.
Although conditions in the U.S. improved in recent years, there can be no assurance that this improvement will be sustained in the near or long-term. Uncertain economic and political conditions may make it difficult for us and our customers or suppliers to accurately forecast and plan future business activities. For example, recent changes to U.S. policies related to global trade and tariffs have resulted in uncertainty surrounding the future of the global economy as well as retaliatory trade measures implemented by other countries. Increasing costs of steel and aluminum may impact customer spending as well as our raw materials costs.
Moreover, uncertain economic conditions continue in our Australasia segment, which has been forecasting a housing recession, and certain countries in our Europe segment. Negative business, financial market, and economic conditions globally within the industries or regions we compete in may materially and adversely affect demand for our products, and our business, financial condition, and results of operations could be materially negatively impacted as a result.
We operate in a highly competitive business environment. Failure to compete effectively could cause us to lose market share and/or force us to reduce the prices we charge for our products. This competition could have a material adverse effect on our business, financial condition, and results of operations.
We operate in a highly competitive business environment. Some of our competitors may have greater financial, marketing, and distribution resources and may develop stronger relationships with customers in the markets where we sell our products. Some of our competitors may be less leveraged than we are, providing them with more flexibility to invest in new facilities and processes and also making them better able to withstand adverse economic or industry conditions.
In addition, some of our competitors, regardless of their size or resources, may choose to compete in the marketplace by adopting more aggressive sales policies, including price cuts, or by devoting greater resources to the development, promotion, and sale of their products. This could result in our loss of customers and/or market share to these competitors or being forced to reduce the prices at which we sell our products to remain competitive.
As a result of competitive bidding processes, we may have to provide pricing concessions to our significant customers in order for us to keep their business. Reduced pricing would result in lower product margins on sales to those customers. There is no guarantee that a reduction in prices would be offset by sufficient gains in market share and sales volume to those customers.
The loss of, or a reduction in orders from, any significant customers, or decreases in the prices of our products, could have a material adverse effect on our business, financial condition, and results of operations.
We may not identify or effectively respond to consumer needs, expectations, or trends in a timely fashion, which could adversely affect our relationship with customers, our reputation, the demand for our brands, products, and services, and our market share.
The quantity, type, and prices of products demanded by consumers and our customers have shifted over time. For example, demand has increased for multi-family housing units such as apartments and condominiums, which typically require fewer of our products, and we are experiencing growth in certain channels for products with lower price points. In certain cases, these shifts have negatively impacted our sales and/or our profitability. Also, we must continually anticipate and adapt to the increasing use of technology by our customers. Recent years have seen shifts in consumer preferences and purchasing practices and changes in the business models and strategies of our customers. Consumers are increasingly using the internet and mobile technology to research home improvement products and to inform and provide feedback on their purchasing and ownership experience for these products. Trends towards online purchases could impact our ability to compete as we currently sell a significant portion of our products through retail home centers, wholesale distributors, and building products dealers.
Accordingly, the success of our business depends in part on our ability to maintain strong brands and identify and respond promptly to evolving trends in demographics, consumer preferences, and expectations and needs, while also managing inventory levels. It is difficult to successfully predict the products and services our customers will demand. Even if we are successful in anticipating consumer preferences, our ability to adequately react to and address those preferences will in part depend upon our continued ability to develop and introduce innovative, high-quality products and acquire or develop the intellectual property necessary to develop new products or improve our existing products. There can be no assurance that the products we develop, even
16
those to which we devote substantial resources, will be successful. While we continue to invest in innovation, brand building, and brand awareness, and intend to increase our investments in these areas in the future, these initiatives may not be successful. Failure to anticipate and successfully react to changing consumer preferences could have a material adverse effect on our business, financial condition, and results of operations.
In addition, our competitors could introduce new or improved products that would replace or reduce demand for our products or create new proprietary designs and/or changes in manufacturing technologies that may render our products obsolete or too expensive for efficient competition in the marketplace. Our failure to competitively respond to changing consumer and customer trends, demands, and preferences could cause us to lose market share, which could have a material adverse effect on our business, financial condition, and results of operations.
Failure to maintain the performance, reliability, quality, and service standards required by our customers, or to timely deliver our products, could have a material adverse effect on our business, financial condition, and results of operations.
If our products have performance, reliability, or quality problems, our reputation and brand equity, which we believe is a substantial competitive advantage, could be materially adversely affected. We may also experience increased and unanticipated warranty and service expenses. Furthermore, we manufacture a significant portion of our products based on the specific requirements of our customers, and delays in providing our customers the products and services they specify on a timely basis could result in reduced or canceled orders and delays in the collection of accounts receivable. Additionally, claims from our customers, with or without merit, could result in costly and time-consuming litigation that could require significant time and attention of management and involve significant monetary damages that could have a material adverse effect on our business, financial condition, and results of operations.
We are in the early stages of implementing strategic initiatives, including JEM and our global footprint rationalization initiatives. If we fail to implement these initiatives as expected, our business, financial condition, and results of operations could be adversely affected.
Our future financial performance depends in part on our management’s ability to successfully implement our strategic initiatives, including JEM and our global footprint rationalization initiatives. We cannot assure you that we will be able to continue to successfully implement these initiatives and related strategies throughout the geographic regions in which we operate or be able to continue improving our operating results. Similarly, these initiatives, even if implemented in all of our geographic regions, may not produce similar results. Any failure to successfully implement these initiatives and related strategies could adversely affect our business, financial condition, and results of operations. We may, in addition, decide to alter or discontinue certain aspects of our business strategy at any time.
We may make acquisitions or investments in other businesses which may involve risks or may not be successful.
Generally, we seek to acquire businesses that broaden our existing product lines and service offerings or expand our geographic reach. There can be no assurance that we will be able to identify suitable acquisition candidates or that our acquisitions or investments in other businesses will be successful. These acquisitions or investments in other businesses may also involve risks, many of which may be unpredictable and beyond our control, and which may have a material adverse effect on our business, financial condition, and results of operations, including risks related to:
|
•
|
the nature of the acquired company’s business;
|
|
•
|
any acquired business not performing as well as anticipated;
|
|
•
|
the potential loss of key employees of the acquired company;
|
|
•
|
any damage to our reputation as a result of performance or customer satisfaction problems relating to an acquired business;
|
|
•
|
the failure of our due diligence procedures to detect material issues related to the acquired business, including exposure to legal claims for activities of the acquired business prior to the acquisition;
|
|
•
|
unexpected liabilities resulting from the acquisition for which we may not be adequately indemnified;
|
|
•
|
our inability to enforce indemnification and non-compete agreements;
|
|
•
|
the integration of the personnel, operations, technologies, and products of the acquired business, and establishment of internal controls, including the implementation of our enterprise resource planning system, into the acquired company’s operations;
|
|
•
|
our failure to achieve projected synergies or cost savings;
|
|
•
|
our inability to establish uniform standards, controls, procedures, and policies;
|
17
|
•
|
any requirement that we make divestitures of operations or properties in order to comply with applicable antitrust laws in connection with future acquisitions;
|
|
•
|
the diversion of management attention and financial resources; and
|
|
•
|
any unforeseen management and operational difficulties, particularly if we acquire assets or businesses in new foreign jurisdictions where we have little or no operational experience.
|
In furtherance of our strategy of growth through acquisitions, we routinely review and conduct investigations of potential acquisitions, some of which may be material. When we believe a favorable opportunity exists, we seek to enter into discussions with targets or sellers regarding the possibility of such acquisitions. At any given time, we may be in discussions with one or more counterparties. There can be no assurances that any such negotiations will lead to definitive agreements, or if such agreements are reached, that any transactions would be consummated.
Our inability to achieve the anticipated benefits of acquisitions and other investments could materially and adversely affect our business, financial condition, and results of operations.
In addition, the means by which we finance an acquisition may have a material adverse effect on our business, financial condition, and results of operations, including changes to our equity, debt, and liquidity position. If we issue convertible preferred or common stock to pay for an acquisition, the ownership percentage of our existing shareholders may be diluted. Using our existing cash may reduce our liquidity. Incurring additional debt to fund an acquisition may result in higher debt service and a requirement to comply with additional financial and other covenants, including potential restrictions on future acquisitions and distributions.
A decline in our relationships with our key customers or the amount of products they purchase from us, or a decline in our key customers’ financial condition, could have a material adverse effect on our business, financial condition, and results of operations.
Our business depends on our relationships with our key customers, which consist mainly of wholesale distributors and retail home centers. Our top ten customers together accounted for approximately
35%
of our net revenues in the year ended
December 31, 2018
, and our largest customer, The Home Depot, accounted for approximately
14.2%
of our net revenues in the year ended
December 31, 2018
. Although we have established and maintain significant long-term relationships with our key customers, we cannot assure you that all of these relationships will continue or will not diminish. We generally do not enter into long-term contracts with our customers and they generally do not have an obligation to purchase products from us. Accordingly, sales from customers that have accounted for a significant portion of our sales in past periods, individually or as a group, may not continue in future periods, or if continued, may not reach or exceed historical levels in any period. For example, certain of our large customers perform periodic line reviews to assess their product offering, which have in the past and may in the future lead to loss of business and pricing pressures. Some of our large customers may also experience economic difficulties or otherwise default on their obligations to us. Furthermore, our pricing optimization strategy, which requires maintaining pricing discipline in order to improve profit margins, has in the past and may in the future lead to the loss of certain customers, including key customers, who do not agree to our pricing terms. The loss of, or a diminution in our relationship with, any of our largest customers could lower our sales volumes, which could increase our costs and lower our profitability. This could have a material adverse effect on our business, financial condition, and results of operations.
Certain of our customers may expand through consolidation and internal growth, which may increase their buying power. The increased size of our customers could have a material adverse effect on our business, financial condition, and results of operations.
Certain of our significant customers are large companies with strong buying power, and our customers may expand through consolidation or internal growth. Consolidation could decrease the number of potential significant customers for our products and increase our reliance on key customers. Further, the increased size of our customers could result in our customers seeking more favorable terms, including pricing, for the products that they purchase from us. Accordingly, the increased size of our customers may further limit our ability to maintain or raise prices in the future. This could have a material adverse effect our business, financial condition, and results of operations.
18
We are subject to the credit risk of our customers.
We are subject to the credit risk of our customers because we provide credit to our customers in the normal course of business. All of our customers are sensitive to economic changes and to the cyclical nature of the building industry. Especially during protracted or severe economic declines and cyclical downturns in the building industry, our customers may be unable to perform on their payment obligations, including their debts to us. Any failure by our customers to meet their obligations to us may have a material adverse effect on our business, financial condition, and results of operations. In addition, we may incur increased expenses related to collections in the future if we find it necessary to take legal action to enforce the contractual obligations of a significant number of our customers.
Increases in interest rates used to finance home construction and improvements, such as mortgage and credit card interest rates, and the reduced availability of financing for the purchase of new homes and home construction and improvements, could have a material adverse impact on our business, financial condition, and results of operations.
Our performance depends in part upon consumers having the ability to access third-party financing for the purchase of new homes and buildings and R&R of existing homes and other buildings. The ability of consumers to finance these purchases is affected by the interest rates available for home mortgages, credit card debt, home equity or other lines of credit, and other sources of third-party financing. Interest rates in the majority of the regions where we market and sell our products have generally increased in recent years, most notably in the U.S. with the U.S. Federal Reserve raising the federal funds rate numerous times since 2015. Each increase in the federal funds rate or applicable central bank’s prime rates could cause an increase in future interest rates applicable to mortgages, credit card debt, and other sources of third-party financing. If interest rates continue to increase and, consequently, the ability of prospective buyers to finance purchases of new homes or home improvement products is adversely affected, our business, financial condition, and results of operations may be materially and adversely affected.
In addition to increased interest rates, the ability of consumers to procure third-party financing is impacted by such factors as new and existing home prices, unemployment levels, high mortgage delinquency and foreclosure rates, and lower housing turnover. Adverse developments affecting any of these factors could result in the imposition of more restrictive lending standards by financial institutions and reduce the ability of some consumers to finance home purchases or R&R expenditures.
Prices and availability of the raw materials we use to manufacture our products are subject to fluctuations, and we may be unable to pass along to our customers the effects of any price increases.
We use wood, glass, vinyl and other plastics, fiberglass and other composites, aluminum, steel and other metals, as well as hardware and other components to manufacture our products. Materials represented approximately
51%
of our cost of sales in the year ended
December 31, 2018
. Prices and availability of our materials fluctuate for a variety of reasons beyond our control, many of which cannot be anticipated with any degree of reliability. Our most significant raw materials include logs and lumber, vinyl extrusions, glass, steel, and aluminum, each of which has been subject to periods of rapid and significant fluctuations in price. The reasons for these fluctuations include, among other things, variable worldwide supply and demand across different industries, speculation in commodities futures, general economic or environmental conditions, labor costs, competition, import duties, tariffs, worldwide currency fluctuations, freight, regulatory costs, and product and process evolutions that impact demand for the same materials.
The U.S. recently imposed tariffs on certain products imported into the U.S. from China and could impose additional tariffs or trade restrictions. The imposition of tariffs may impact the prices of materials purchased outside of the U.S. and include goods in transit as well as increasing the price of domestically sourced materials, including, in particular, steel and aluminum. Impositions of tariffs by other countries could also impact pricing and availability of raw materials. As another example, as global demand for key chemicals increases, the limited number of suppliers and investment in greater supply capacity drives increased global pricing.
We have short-term supply contracts with certain of our largest suppliers that limit our exposure to short term fluctuations in prices and availability of our materials, but we are susceptible to longer-term fluctuations in prices. We generally do not hedge against commodity price fluctuations. Significant increases in the prices of raw materials for finished goods, including as a result of significant or protracted material shortages, may be difficult to pass through to customers and may negatively impact our profitability and net revenues. We may attempt to modify products that use certain raw materials, but these changes may not be successful.
19
Our business may be affected by delays or interruptions in the delivery of raw materials, finished goods, and certain component parts. A supply shortage or delivery chain interruption could have a material adverse effect on our business, financial condition, and results of operations.
We rely upon regular deliveries of raw materials, finished goods, and certain component parts. For certain raw materials that are used in our products, we depend on a single or limited number of suppliers for our materials, and we typically do not have long-term contracts with our suppliers. If we are not able to accurately forecast our supply needs, our limited number of suppliers may make it difficult to quickly obtain additional raw materials to respond to shifting or increased demand. In addition, a supply shortage could occur as a result of unanticipated increases in market demand, including as a result of accelerated demand in reaction to the threat of tariffs or trade restrictions; difficulties in production or delivery; financial difficulties; or catastrophic events in the supply chain. Furthermore, because our products and the components of some of our products are subject to regulation, changes to these regulations could cause delays in delivery of raw materials, finished goods, and certain component parts.
Until we can make acceptable arrangements with alternate suppliers, any interruption or disruption could impact our ability to ship orders on time and could idle some of our manufacturing capability for those products. This could result in a loss of revenues, reduced margins, and damage to our relationships with customers, which could have a material adverse effect on our business, financial condition, and results of operations.
Our business is seasonal and revenue and profit can vary significantly throughout the year, which may adversely impact the timing of our cash flows and limit our liquidity at certain times of the year.
Our business is seasonal, and our net revenues and operating results vary significantly from quarter to quarter based upon the timing of the building season in our markets. Our sales typically follow seasonal new construction and R&R industry patterns. The peak season for home construction and R&R activity in the majority of the geographies where we market and sell our products generally corresponds with the second and third calendar quarters, and therefore our sales volume is typically higher during those quarters. Our first and fourth quarter sales volumes are generally lower due to reduced R&R and new construction activity as a result of less favorable climate conditions in the majority of our geographic end markets. Failure to effectively manage our inventory in anticipation of or in response to seasonal fluctuations could negatively impact our liquidity profile during certain seasonal periods.
Changes in weather patterns, including as a result of global climate change, could significantly affect our financial results or financial condition.
Weather patterns may affect our operating results and our ability to maintain our sales volume throughout the year. Because our customers depend on suitable weather to engage in construction projects, increased frequency or duration of extreme weather conditions could have a material adverse effect on our financial results or financial condition. For example, unseasonably cool weather or extraordinary amounts of rainfall may decrease construction activity, thereby decreasing our sales. Also, we cannot predict the effects that global climate change may have on our business. In addition to changes in weather patterns, it might, for example, reduce the demand for construction, destroy forests (increasing the cost and reducing the availability of wood products used in construction), and increase the cost and reduce the availability of raw materials and energy. New laws and regulations related to global climate change may also increase our expenses or reduce our sales.
We are exposed to political, economic, and other risks that arise from operating a multinational business.
We have operations in North America, South America, Europe, Australia, and Asia. In the year ended
December 31, 2018
, our North America segment accounted for approximately
57%
of net revenues, our Europe segment accounted for approximately
28%
of net revenues, and our Australasia segment accounted for approximately
15%
of our net revenues. Further, certain of our businesses obtain raw materials and finished goods from foreign suppliers. Accordingly, our business is subject to political, economic, and other risks that are inherent in operating in numerous countries.
These risks include:
|
•
|
the difficulty of enforcing agreements and collecting receivables through foreign legal systems;
|
|
•
|
trade protection measures and import or export licensing requirements;
|
|
•
|
the imposition of, or increases in, tariffs or other restrictions;
|
|
•
|
required compliance with a variety of foreign laws and regulations, including the application of foreign labor regulations;
|
|
•
|
tax rates in foreign countries and the imposition of withholding requirements on foreign earnings;
|
20
|
•
|
difficulty in staffing and managing widespread operations;
|
|
•
|
the imposition of, or increases in, currency exchange controls;
|
|
•
|
potential inflation in applicable non-U.S. economies; and
|
|
•
|
changes in general economic and political conditions in countries where we operate, including as a result of the impact of the planned withdrawal of the U.K. from the E.U.
|
The success of our business depends in part on our ability to anticipate and effectively manage these and other risks. We cannot assure you that these and other factors will not have a material adverse effect on our international operations or ultimately on our global business, financial condition, and results of operations.
The notice given by the U.K. of its intent to withdraw from the E.U. could have a material adverse effect on our business, financial condition, and results of operations.
The notification by the U.K. of its intent to exit the E.U., or “Brexit”, has created volatility in the global financial markets. The terms of the withdrawal remain subject to an ongoing negotiation. If the U.K. and the E.U. are unable to negotiate acceptable withdrawal terms or if other E.U. member states pursue withdrawal, barrier-free access between the U.K. and other E.U. member states or among the European Economic Area overall could be diminished or eliminated. The effects of the U.K.’s withdrawal from the E.U. on the global economy, and on our business in particular, will depend on agreements the U.K. makes to retain access to E.U. markets both during a transitional period and more permanently. Brexit could impair the ability of our operations in the E.U. to transact business in the future in the U.K., as well as the ability of our U.K. operations to transact business in the future in the E.U., including through the imposition of tariffs between the U.K. and other E.U. countries.
Volatility associated with Brexit could continue to adversely affect European and worldwide economic conditions and may contribute to greater instability in the global financial markets. Among other things, Brexit could reduce consumer spending in the U.K. and the E.U., which could result in decreased demand for our products within these regions. Similarly, housing sales and home values in the U.K. and in the E.U. could be negatively impacted and Brexit could also influence foreign currency exchange rates. For the year ended
December 31, 2018
, we derived
3%
of our net revenues from our operations in the U.K., and our Europe headquarters is located in the U.K. As a result, the effects of Brexit could inhibit the growth of our business and have a material adverse effect on our business, financial condition, and results of operations.
Exchange rate fluctuations may impact our business, financial condition, and results of operations.
Our operations expose us to both transaction and translation exchange rate risks. In the year ended
December 31, 2018
,
49%
of our net revenues came from sales outside of the U.S., and we anticipate that our operations outside of the U.S. will continue to represent a significant portion of our net revenues for the foreseeable future. In addition, the nature of our operations often requires that we incur expenses in currencies other than those in which we earn revenue. Because of the mismatch between revenues and expenses, we are exposed to significant currency exchange rate risk and we may not be successful in achieving balances in currencies throughout our operations. In addition, if the effective price of our products were to increase as a result of fluctuations in foreign currency exchange rates, demand for our products could decline, which could adversely affect our business, financial condition, and results of operations. Also, because our financial statements are presented in U.S. dollars, we must translate the financial statements of our foreign subsidiaries and affiliates into U.S. dollars at exchange rates in effect during or at the end of each reporting period, and increases or decreases in the value of the U.S. dollar against other major currencies will affect our reported financial results, including the amount of our outstanding indebtedness. Exchange rates, net, had an impact of less than 1% on our consolidated net revenues in the year ended
December 31, 2018
as compared to a
1%
positive impact in the year ended
December 31, 2017
. We cannot assure you that fluctuations in foreign currency exchange rates, particularly the strengthening of the U.S. dollar against major currencies, such as the Euro, the Australian dollar, the Canadian dollar, the British pound, or the currencies of large developing countries, would not materially adversely affect our business, financial condition, and results of operations.
A disruption in our operations due to natural disasters or acts of war could have a material adverse effect on our business, financial condition, and results of operations.
We operate facilities worldwide. Many of our facilities are located in areas that are vulnerable to hurricanes, earthquakes, and other natural disasters. In the event that a hurricane, earthquake, natural disaster, fire, or other catastrophic event were to interrupt our operations for any extended period of time, it could delay shipment of merchandise to our customers, damage our reputation, or otherwise have a material adverse effect on our business, financial condition, and results of operations.
In addition, our operations may be interrupted by terrorist attacks or other acts of violence or war. These attacks may directly impact our suppliers’ or customers’ physical facilities. Furthermore, these attacks may make travel and the transportation of our supplies and products more difficult and more expensive and ultimately have a material adverse effect on our business,
21
financial condition, and results of operations. The U.S. has entered into armed conflicts, which could have an impact on our sales and our ability to deliver product to our customers. Political and economic instability in some regions of the world may also negatively impact the global economy and, therefore, our business. The consequences of any of these armed conflicts are unpredictable, and we may not be able to foresee events that could have an adverse effect on our business or your investment. More generally, any of these events could cause consumer confidence and spending to decrease or result in increased volatility in the worldwide financial markets. They could also result in economic recessions. Any of these occurrences could have a material adverse effect on our business, financial condition, and results of operations.
Manufacturing realignments and cost savings programs may result in a decrease in our short-term earnings and operating efficiency.
We continually review our manufacturing operations to address market changes and to implement efficiencies presented by acquisitions. Effects of periodic manufacturing integrations, realignments and cost savings programs have in the past and could in the future result in a decrease in our short-term earnings and operating efficiency until the expected results are achieved. Such programs may include the consolidation, integration, and upgrading of facilities, functions, systems, and procedures. Such programs involve substantial planning, often require capital investments, and may result in charges for fixed asset impairments or obsolescence and substantial severance costs. We also cannot assure you that we will achieve all of our cost savings. Our ability to achieve cost savings and other benefits within expected time frames is subject to many estimates and assumptions. These estimates and assumptions are subject to significant economic, competitive, and other uncertainties, some of which are beyond our control. If these estimates and assumptions are incorrect, if we experience delays, or if other unforeseen events occur, our operations could experience disruption, and our business, financial condition, and results of operations could be materially and adversely affected.
We are highly dependent on information technology, the disruption of which could significantly impede our ability to do business.
Our operations depend on our network of information technology systems, which are vulnerable to damage from hardware failure, fire, power loss, telecommunications failure, and impacts of terrorism, natural disasters, or other disasters. We rely on our information technology systems to accurately maintain books and records, record transactions, provide information to management and prepare our financial statements. We may not have sufficient redundant operations to cover a loss or failure in a timely manner. Any damage to our information technology systems could cause interruptions to our operations that materially adversely affect our ability to meet customers’ requirements, resulting in an adverse impact to our business, financial condition, and results of operations. Periodically, these systems need to be expanded, updated, or upgraded as our business needs change. We may not be able to successfully implement changes in our information technology systems without experiencing difficulties, which could require significant financial and human resources. Moreover, our increasing dependence on technology may exacerbate this risk.
We are implementing new systems, including a new Enterprise Resource Planning system, as part of our ongoing technology and process improvements. If these new systems prove ineffective, we may be unable to timely or accurately prepare financial reports, make payments to our suppliers and employees, or invoice and collect from our customers.
We are implementing new systems, including our continued implementation of a new ERP system, as part of our ongoing technology and process improvements. This ERP system will provide a standardized method of accounting for, among other things, order entry and inventory and should enhance our ability to implement our strategic initiatives. Any delay in the implementation, or disruption in the upgrade, of these systems could adversely affect our ability to timely and accurately report financial information, including the filing of our quarterly or annual reports with the SEC. Such delay or disruption could also impact our ability to timely or accurately make payments to our suppliers and employees, and could also inhibit our ability to invoice and collect from our customers. Data integrity problems or other issues may be discovered which could impact our business or financial results. In addition, we may experience periodic or prolonged disruption of our financial functions arising out of this conversion, general use of such systems, other periodic upgrades or updates, or other external factors that are outside of our control. If we encounter unforeseen problems with our financial system or related systems and infrastructure, our business, operations, and financial systems could be adversely affected. We may also need to implement additional systems or transition to other new systems that require further expenditures in order to function effectively as a public company. There can be no assurance that our implementation of additional systems or transition to new systems will be successful, or that such implementation or transition will not present unforeseen costs or demands on our management.
Our systems and IT infrastructure may be subject to security breaches and other cybersecurity incidents.
We rely on the accuracy, capacity, and security of our IT systems, some of which are managed or hosted by third parties, and the sale of our products may involve the transmission and/or storage of data, including in certain instances customers’ and employees’ business and personally identifiable information. Maintaining the security of computers, computer networks, and data storage resources is a critical issue for us and our customers, as security breaches could result in vulnerabilities and loss of and/or
22
unauthorized access to confidential information. We have experienced and may in the future face attempts by experienced hackers, cybercriminals, or others with authorized access to our systems to misappropriate our proprietary information and technology, interrupt our business, and/or gain unauthorized access to confidential information. The reliability and security of our information technology infrastructure and software, and our ability to expand and continually update technologies in response to our changing needs is critical to our business. To the extent that any disruptions or security breaches result in a loss or damage to our data, it could cause harm to our reputation or brand. This could lead some customers to stop purchasing our products and reduce or delay future purchases of our products or use competing products. In addition, we could face enforcement actions by U.S. states, the U.S. federal government, or foreign governments, which could result in fines, penalties, and/or other liabilities and which may cause us to incur legal fees and costs, and/or additional costs associated with responding to the cyberattack. Increased regulation regarding cybersecurity may increase our costs of compliance, including fines and penalties, as well as costs of cybersecurity audits. Any of these actions could materially adversely impact our business and results of operations. Although we maintain insurance coverage to protect us against some of the risks, those policies may be insufficient or may not cover us in the event of a loss caused by a cyberattack or other cybersecurity breach.
In addition, as a result of our global operations, we are subject to foreign and international laws and regulations that apply to the collection, use, retention, protection, disclosure, transfer and other processing of personal data. These privacy and data-protection related laws and regulations are evolving, with new or modified laws and regulations proposed and implemented frequently and existing laws and regulations subject to new or different interpretations. In particular, the E.U. General Data Protection Regulation (“GDPR”), which became effective in 2018, poses increased compliance challenges both for companies operating within the E.U. and non-E.U. companies that administer or process certain personal data of E.U. residents. It is not possible to predict the ultimate content, and therefore effect, of data protection regulation over time, and efforts to comply with evolving regulation may result in additional costs.
We believe we have invested in industry-appropriate protections and monitoring practices for our data and information technology to reduce these risks and continue to monitor our systems on an ongoing basis for compliance with applicable privacy regulations and any current or potential threats. While we have not experienced any material breaches in security in our recent history, there can be no assurance that our efforts will prevent breakdowns or breaches to databases or systems that could have a material adverse effect on our business, financial condition, and results of operations, or that we will be subject to enforcement actions or penalties in connection with a failure or alleged failure to comply with applicable laws.
Increases in labor costs, potential labor disputes, and work stoppages at our facilities or the facilities of our suppliers could have a material adverse effect on our business, financial condition, and results of operations.
Our financial performance is affected by the availability of qualified personnel and the cost of labor. As of
December 31, 2018
, we had approximately
23,000
employees worldwide, including approximately
10,900
employees in the U.S. and Canada. Approximately
1,120
, or
10%
, of our employees in the U.S. and Canada are unionized workers, and the majority of our workforce in other countries belong to work councils or are otherwise subject to labor agreements. U.S. and Canada employees represented by these unions are subject to collective bargaining agreements that are subject to periodic negotiation and renewal. If we are unable to enter into new, satisfactory labor agreements with our unionized employees upon expiration of their agreements, we could experience a significant disruption of our operations, which could cause us to be unable to deliver products to customers on a timely basis. Such disruptions could result in a loss of business and an increase in our operating expenses, which could reduce our net revenues and profit margins. In addition, our non-unionized labor force may become subject to labor union organizing efforts, which could cause us to incur additional labor costs and increase the related risks that we now face.
We believe many of our direct and indirect suppliers also have unionized workforces. Strikes, work stoppages, or slowdowns experienced by suppliers could result in slowdowns or closures of facilities where components of our products are manufactured or delivered. Any interruption in the production or delivery of these components could reduce sales, increase costs, and have a material adverse effect on us.
Changes in building codes and standards (including ENERGY STAR standards) could increase the cost of our products, lower the demand for our windows and doors, or otherwise adversely affect our business.
Our products and markets are subject to extensive and complex local, state, federal, and foreign statutes, ordinances, rules, and regulations. These mandates, including building design and safety and construction standards and zoning requirements, affect the cost, selection, and quality requirements of building components like windows and doors.
These regulations often provide broad discretion to governmental authorities as to the types and quality specifications of products used in new residential and non-residential construction and home renovations and improvement projects, and different governmental authorities can impose different standards. Compliance with these standards and changes in such regulations may increase the costs of manufacturing our products or may reduce the demand for certain of our products in the affected geographical areas or product markets. Conversely, a decrease in product safety standards could reduce demand for our more modern products if
23
less expensive alternatives that did not meet higher standards became available for use in that market. All or any of these changes could have a material adverse effect on our business, financial condition, and results of operations.
In addition, in order for our products to obtain the “ENERGY STAR” certification, they must meet certain requirements set by the EPA. Changes in the energy efficiency requirements established by the EPA for the ENERGY STAR label, such as those announced in August 2018, could increase our costs, and a lapse in our ability to label our products as such or to comply with the new standards, may have a material adverse effect on our business, financial condition, and results of operations.
The elimination of the ENERGY STAR program could lower the demand for our products or otherwise adversely affect our business.
Many of our products comply with the federal government’s ENERGY STAR program. We believe that marketing our products with the ENERGY STAR label gives us a competitive advantage as compared to competing products that are not labeled as ENERGY STAR products. The current U.S. presidential administration has proposed discontinuing or privatizing the use of the ENERGY STAR program. Eliminating or privatizing the ENERGY STAR program could diminish any competitive advantage for ENERGY STAR compliant products and result in a material adverse effect on our business, financial condition and results of operations.
Domestic and foreign governmental regulations applicable to general business operations could increase the costs of operating our business and adversely affect our business.
We are subject to a variety of regulations from U.S. and foreign governmental authorities relating to wage requirements, employee benefits, and other workplace matters. Changes in local minimum or living wage requirements, rights of employees to unionize, healthcare regulations, and other requirements relating to employee benefits could increase our labor costs, which would in turn increase our cost of doing business. In addition, our international operations are subject to laws applicable to foreign operations, trade protection measures, foreign labor relations, differing intellectual property rights, privacy regulations, other legal and regulatory constraints, and currency regulations of the countries or regions in which we currently operate or where we may operate in the future. These factors may restrict the sales of, or increase costs of, manufacturing and selling our products.
We may be subject to significant compliance costs, as well as liabilities under environmental, health, and safety laws and regulations.
Our past and present operations, assets, and products are subject to extensive environmental laws and regulations at the federal, state, and local level worldwide. These laws regulate, among other things, air emissions, the discharge or release of materials into the environment, the handling and disposal of wastes, remediation of contaminated sites, worker health and safety, and the impact of products on human health and safety and the environment. Under certain of these laws, liability for contaminated property may be imposed on current or former owners or operators of the property or on parties that generated or arranged for waste sent to the property for disposal. Liability under these laws may be joint and several and may be imposed without regard to fault or the legality of the activity giving rise to the contamination. Notwithstanding our compliance efforts we may still face material liability, limitations on our operations, fines, or penalties for violations of environmental, health, and safety laws and regulations, including releases of regulated materials and contamination by us or previous occupants at our current or former properties or at offsite disposal locations we use.
The applicable environmental, health, and safety laws and regulations, and any changes to them or in their enforcement, may require us to make material expenditures with respect to ongoing compliance with or remediation under these laws and regulations or require that we modify our products or processes in a manner that increases our costs and/or reduces our profitability. For example, additional pollution control equipment, process changes, or other environmental control measures may be needed at some of our facilities to meet future requirements. In addition, discovery of currently unknown or unanticipated soil or groundwater conditions at our properties could result in significant liabilities and costs. Accordingly, we are unable to predict the exact future costs of compliance with or liability under environmental, health, and safety laws and regulations.
We may be subject to significant compliance costs with respect to legislative and regulatory proposals to restrict emissions of greenhouse gasses, or “GHGs”.
Various legislative, regulatory, and inter-governmental proposals to restrict emissions of GHGs, such as carbon dioxide (“CO
2
”
)
, are under consideration by governmental legislative bodies and regulators in the jurisdictions where we operate. The EPA promulgated regulations in 2015 to reduce GHG emissions from new and existing power plants. The regulations applicable to existing power plants in the U.S., commonly referred to as the Clean Power Plan, would require states to develop strategies to reduce GHG emissions within the states that may include reductions at other sources in addition to electric utilities. The EPA has delayed implementation of the Clean Power Plan while legal challenges to such regulations are addressed by lower courts and the current presidential administration has taken steps to repeal or replace the Clean Power Plan, resulting in uncertainty regarding CO
2
reduction commitments in the U.S. However, many states and nations, comprising the world’s 20 largest economies (the
24
“G20”), including other jurisdictions in which we operate, have also continued to commit to limiting emissions of GHGs, most prominently through an agreement reached in Paris in December 2015 at the 21
st
Conference of the Parties to the United Nations Framework Convention on Climate Change. The Paris Agreement sets out a new process for achieving global GHG reductions. On June 1, 2017, President Trump announced that the U.S. plans to withdraw from the Paris Agreement and to seek negotiations either to reenter the Paris Agreement on different terms or to establish a new framework agreement. The earliest permitted exit date under the Paris Agreement is four years from when it took effect in November 2016, or November 2020. Since some of our manufacturing facilities operate boilers or other process equipment that emit GHGs, such regulatory and global initiatives may require us to modify our operating procedures or production levels, incur capital expenditures, change fuel sources, or take other actions that may adversely affect our financial results. However, given the high degree of uncertainty about the ultimate parameters of any such regulatory or global initiative, whether the U.S. will adhere to the Paris Agreement’s exit process, and the terms on which the U.S. may reenter the Paris Agreement or a separately negotiated agreement, and because proposals like the Clean Power Plan are currently subject to legal challenges and reconsideration, we cannot predict at this time the ultimate impact of such initiatives on our operations or financial results.
A significant portion of our U.S. GHG emissions are from biomass-fired boilers, which emit biogenic CO2 . Biogenic CO2 is generally considered carbon neutral. In November 2014, the EPA released its Framework for Assessing Biogenic CO2 Emissions From Stationary Sources along with an accompanying memo that generally supports carbon neutrality for biomass combustion, but left open the possibility that it may not always be characterized as carbon neutral.
In Europe, EU member states have agreed to reduce CO2 emissions by 2030 by 30%. Focus is currently upon reducing emissions from power plants and diesel engines; however, future actions taken by individual Member States to substantially reduce or capture carbon emissions, or develop, manufacture, and expand alternative fuel sources, may affect the cost of energy needed to operate our manufacturing facilities.
Similarly, Australia has stated a commitment to reduce CO2 emissions to 2005 levels by 2030 (a 50-52% reduction). Currently, Australia is focusing their efforts, to achieve these reductions, on low emission technologies and practices.
Increasing regulations to reduce GHG emissions, as proposed throughout all of our operating regions, would be expected to increase energy costs, increase price volatility for petroleum, and reduce petroleum production levels, which in turn could impact the prices of those raw materials. In addition, laws and regulations relating to forestry practices limit the volume and manner of harvesting timber to mitigate environmental impacts such as deforestation, soil erosion, damage to riparian areas, and GHG levels. The extent of these regulations and related compliance costs has grown in recent years and will increase our materials costs and may increase other aspects of our production costs.
Changes to legislative and regulatory policies that currently promote home ownership may have a material adverse effect on our business, financial condition, and results of operations.
Our markets are also affected by legislative and regulatory policies, such as U.S. tax rules allowing for deductions of mortgage interest and the mandate of government-sponsored entities like Freddie Mac and Fannie Mae to promote home ownership through mortgage guarantees on certain types of home loans. The Tax Act passed in the U.S. in December 2017 made significant changes to some of these historical benefits of home ownership. The specific changes which could affect our markets are, among others, (i) a reduction of the maximum amount of home mortgage indebtedness for which a tax deduction for interest paid may be claimed from $1 million to $750,000, (ii) an elimination of the deduction for interest paid on home equity indebtedness, and (iii) a limitation on the amount of state and local taxes which may be deducted annually as itemized deductions which may limit certain individuals’ deduction for local property taxes. These changes to the tax code and any future policy changes may adversely impact demand for our products and have a material adverse effect on our business, financial condition, and results of operations.
Changes in legislation, regulation and government policy, including as a result of U.S. presidential and congressional elections, may have a material adverse effect on our business in the future.
The recent midterm congressional elections in the U.S. could result in significant changes in, and uncertainty with respect to, legislation, regulation and government policy. While it is not possible to predict whether and when any such changes will occur, changes at the local, state and federal level could significantly impact our business. Specific legislative and regulatory proposals that could have a material impact on us include, but are not limited to, infrastructure renewal programs; changes to immigration policy; modifications to international trade policy, including renegotiation of or withdrawal from trade agreements; the imposition of tariffs or trade restrictions; and changes to financial legislation and public company reporting requirements.
In addition, U.S. lawmakers have made substantial changes to U.S. fiscal and tax policies, including the adoption of the Tax Act, which introduced a variety of tax reforms that significantly impact U.S. taxation of multi-national corporations. These include, among others, reductions in the U.S. corporate tax rate, repeal of the corporate alternative minimum tax, introduction of immediate cost recovery for capital investments, the limitation of the interest deduction, the limitation of certain deductions for
25
executive compensation and changes to the international tax system, including the adoption of a territorial tax system and taxation of the accumulated foreign earnings of U.S. multinational corporations. The specific provisions of the Tax Act, while generally favorable to our U.S. operations, may have certain negative implications, such as the GILTI provisions, which could materially impact our financial performance. In accordance with SEC guidance, we made provisional estimates of the effects of these tax law changes in our financial statements for the year ended December 31, 2017. Our analysis was finalized during the year ended December 31, 2018 and any adjustments to our provisional estimates have been recorded as a component of income tax expense from continuing operations. Certain aspects of the Tax Act took effect during fiscal year 2018 including, among other things, the GILTI, Base Erosion Anti-Abuse Tax (“BEAT”), and limitations on business interest, executive compensation and employer-provided parking. These provisions will continue to have a significant impact on our future performance.
Lack of transparency, threat of fraud, public sector corruption, and other forms of criminal activity involving government officials increases the risk of potential liability under anti-bribery/anti-corruption or anti-fraud legislation, including the U.S. Foreign Corrupt Practices Act, the U.K. Bribery Act, and similar laws and regulations.
We operate manufacturing facilities in
20
countries and sell our products in approximately
100
countries around the world. As a result of the international nature of our operations, we may enter from time to time into negotiations and contractual arrangements with parties affiliated with foreign governments and their officials in the ordinary course of business. In connection with these activities, we may be subject to anti-corruption laws in various jurisdictions, including the U.S. Foreign Corrupt Practices Act, or the “FCPA”, the U.K. Bribery Act and other anti-bribery laws applicable to jurisdictions where we do business that prohibit improper payments or offers of payments to foreign governments and their officials and political parties for the purpose of obtaining or retaining business, or otherwise receiving discretionary favorable treatment of any kind, and require the maintenance of internal controls to prevent such payments. In particular, we may be held liable for actions taken by agents in foreign countries where we operate, even though such parties are not always subject to our control. We have established anti-bribery/anti-corruption policies and procedures and offer several channels for raising concerns in an effort to comply with the laws and regulations applicable to us. However, there can be no assurance that our policies and procedures will effectively prevent us from violating these laws and regulations in every transaction in which we may engage. Any determination that we have violated the FCPA or other anti-bribery/anti-corruption laws (whether directly or through acts of others, intentionally or through inadvertence) could result in sanctions that could have a material adverse effect on our business, reputation, financial condition, and results of operations.
As we continue to expand our business globally, including through foreign acquisitions, we may have difficulty anticipating and effectively managing these and other risks that our international operations may face, which may adversely impact our business outside of the U.S. and our financial condition and results of operations. In addition, any acquisition of businesses with operations outside of the U.S. may exacerbate this risk.
We may be the subject of product liability claims or product recalls and we may not accurately estimate costs related to warranty claims. Expenses associated with product liability claims and lawsuits and related negative publicity or warranty claims in excess of our reserves could have a material adverse effect on our business, financial condition, and results of operations.
Our products are used in a wide variety of residential, non-residential, and architectural applications. We face the risk of exposure to product liability or other claims, including class action lawsuits, in the event our products are alleged to be defective or have resulted in harm to others or to property. We may in the future incur liability if product liability lawsuits against us are successful. Moreover, any such lawsuits, whether or not successful, could result in adverse publicity to us, which could cause our sales to decline materially. In addition, it may be necessary for us to recall defective products, which would also result in adverse publicity, as well as resulting in costs connected to the recall and loss of sales. We maintain insurance coverage to protect us against product liability claims, but that coverage may not be adequate to cover all claims that may arise or we may not be able to maintain adequate insurance coverage in the future at an acceptable cost. Any liability not covered by insurance could have a material adverse effect on our business, financial condition, and results of operations.
In addition, consistent with industry practice, we provide warranties on many of our products and we may experience costs associated with warranty claims if our products have defects in manufacture or design or they do not meet contractual specifications. We estimate our future warranty costs based on historical trends and product sales, but we may fail to accurately estimate those costs and thereby fail to establish adequate warranty reserves for them. If warranty claims exceed our estimates, it may have a material adverse effect on our business, financial condition, and results of operations.
We may be unable to protect our intellectual property, and we may face claims of intellectual property infringement.
We rely on a combination of patent, copyright, trademark, and trade secret laws, as well as confidentiality agreements, nondisclosure agreements, and other contractual commitments, to protect our intellectual property rights. However, these measures may not be adequate or sufficient, and third parties may not always respect these legal protections even if they are aware of them. In addition, our competitors may develop similar technologies and know-how without violating our intellectual property rights.
26
Furthermore, the laws of foreign countries may not protect our intellectual property rights to the same extent as the laws of the U.S. The failure to obtain worldwide patent and trademark protection may result in other companies copying and marketing products based on our technologies or under brand or trade names similar to ours outside the jurisdictions in which we are protected. This could impede our growth in existing regions, create confusion among consumers, and result in a greater supply of similar products that could erode prices for our protected products.
Litigation may be necessary to protect our intellectual property rights. Intellectual property litigation can result in substantial costs, could distract our management, and could impinge upon other resources. Our failure to enforce and protect our intellectual property rights may cause us to lose brand recognition and result in a decrease in sales of our products.
Moreover, while we are not aware that any of our products or brands infringes upon the proprietary rights of others, third parties may make such claims in the future. From time to time, third parties may claim that we have infringed upon their intellectual property rights and we may receive notices from such third parties asserting such claims. Any such infringement claims are thoroughly investigated and, regardless of merit, could be time-consuming and result in costly litigation or damages, undermine the exclusivity and value of our brands, decrease sales, or require us to enter into royalty or licensing agreements that may not be on acceptable terms and that could have a material adverse effect on our business, financial condition, and results of operations.
Our business will suffer if certain key officers or employees discontinue employment with us or if we are unable to recruit and retain highly skilled staff at a competitive cost.
The success of our business depends upon the skills, experience, and efforts of our key officers and employees. In recent years, we have hired key executives who have and will continue to be integral in the continuing transformation of our business. The loss of key personnel could have a material adverse effect on our business, financial condition, and results of operations. We do not maintain key-man life insurance policies on any members of management. Our business also depends on our ability to continue to recruit, train, and retain skilled employees, particularly skilled sales personnel. The loss of the services of any key personnel, or our inability to hire new personnel with the requisite skills, could impair our ability to develop new products or enhance existing products, sell products to our customers or manage our business effectively. Should we lose the services of any member of our senior management team, our board of directors would have to conduct a search for a qualified replacement. This search may be prolonged, and we may not be able to locate and hire a qualified replacement. A significant increase in the wages paid by competing employers could result in a reduction of our qualified labor force, increases in the wage rates that we must pay, or both.
Our pension plan obligations are currently not fully funded, and we may have to make significant cash payments to these plans, which would reduce the cash available for our businesses.
Although we have closed our U.S. pension plan to new participants and have frozen future benefit accruals for current participants, we continue to have unfunded obligations under that plan. The funded levels of our pension plan depend upon many factors, including returns on invested assets, certain market interest rates, and the discount rate used to determine pension obligations. The projected benefit obligation and unfunded liability included in our consolidated financial statements as of
December 31, 2018
for our U.S. pension plan were approximately
$383.9 million
and
$81.2 million
, respectively. Unfavorable returns on the plan assets or unfavorable changes in applicable laws or regulations could materially change the timing and amount of required plan funding, which would reduce the cash available for our operations. In addition, a decrease in the discount rate used to determine pension obligations could increase the estimated value of our pension obligations, which would affect the reported funding status of our pension plans and would require us to increase the amounts of future contributions. Additionally, we have foreign defined benefit plans, some of which continue to be open to new participants. As of
December 31, 2018
, our foreign defined benefit plans had unfunded pension liabilities of approximately
$31.6 million
and overfunded pension assets of approximately
$1.5 million
.
Under the Employee Retirement Income Security Act of 1974, as amended, or “ERISA”, the U.S. Pension Benefit Guaranty Corporation, or the “PBGC”, also has the authority to terminate an underfunded tax-qualified U.S. pension plan under certain circumstances. In the event our tax-qualified U.S. pension plans were terminated by the PBGC, we could be liable to the PBGC for an amount that exceeds the underfunding disclosed in our consolidated financial statements. In addition, because our U.S. pension plan has unfunded obligations, if we have a substantial cessation of operations at a U.S. facility and, as a result of such cessation of operations an event under ERISA Section 4062(e) is triggered, additional liabilities that exceed the amounts disclosed in our consolidated financial statements could arise, including an obligation for us to provide additional contributions or alternative security for a period of time after such an event occurs. Any such action could have a material adverse effect on our business, financial condition, and results of operations.
Changes in accounting standards, new interpretations of existing standards and subjective assumptions, estimates, and judgments by management related to complex accounting matters could significantly affect our financial results or financial condition.
27
Generally accepted accounting principles and related accounting pronouncements, implementation guidelines and interpretations with regard to a wide range of matters that are relevant to our business, such as revenue recognition, asset impairment, impairment of goodwill and other intangible assets, inventories, lease obligations, self-insurance, tax matters, and litigation, are highly complex and involve many subjective assumptions, estimates, and judgments. Changes in these rules or their interpretation or changes in underlying assumptions, estimates, or judgments could significantly change our reported results.
Risks Relating to our Indebtedness
Our indebtedness could adversely affect our financial flexibility and our competitive position.
Financial information regarding our indebtedness is included in Note 15 -
Notes Payable and Long-Term Debt
to our financial statements included in this 10-K.
Our level of indebtedness increases the risk that we may be unable to generate cash sufficient to pay amounts due in respect of our indebtedness and could have other material consequences, including:
|
•
|
limiting our ability to obtain financing in the future for working capital, capital expenditures, acquisitions, debt service, or other general corporate purposes;
|
|
•
|
requiring us to use a substantial portion of our available cash flow to service our debt, which will reduce the amount of cash flow available for working capital, capital expenditures, acquisitions, and other general corporate purposes;
|
|
•
|
increasing our vulnerability to general economic downturns and adverse industry conditions;
|
|
•
|
limiting our flexibility in planning for, or reacting to, changes in our business and in our industry in general;
|
|
•
|
limiting our ability to invest in and develop new products;
|
|
•
|
placing us at a competitive disadvantage compared to our competitors that are not as highly leveraged, as we may be less capable of responding to adverse economic conditions, general economic downturns, and adverse industry conditions;
|
|
•
|
restricting the way we conduct our business because of financial and operating covenants in the agreements governing our existing and future indebtedness;
|
|
•
|
increasing the risk of our failing to satisfy our obligations with respect to borrowings outstanding under our Credit Facilities and Senior Notes and/or being able to comply with the financial and operating covenants contained in our debt instruments, which could result in an event of default under the credit agreements governing our Credit Facilities and the agreements governing our other debt, including the indenture governing the Senior Notes, that, if not cured or waived, could have a material adverse effect on our business, financial condition, and results of operations; and
|
|
•
|
increasing our cost of borrowing.
|
The credit agreements governing our Credit Facilities and the indenture governing the Senior Notes impose significant operating and financial restrictions on us that may prevent us from capitalizing on business opportunities.
The credit agreements governing our Credit Facilities and the indenture governing the Senior Notes impose significant operating and financial restrictions on us. These restrictions limit our ability, among other things, to:
|
•
|
incur or guarantee additional indebtedness;
|
|
•
|
make certain loans or investments or restricted payments, including dividends to our shareholders;
|
|
•
|
repurchase or redeem capital stock;
|
|
•
|
engage in certain transactions with affiliates;
|
|
•
|
sell certain assets (including stock of subsidiaries) or merge with or into other companies; and
|
|
•
|
create or incur liens.
|
Under the terms of the ABL Facility, we will at times be required to comply with a specified fixed charge coverage ratio when the amount of certain unrestricted cash balances of the U.S. and Canadian loan parties plus the amount available for borrowing by the U.S. borrowers and Canadian borrowers is less than a specified amount. The Australia Senior Secured Credit
28
Facility also contains financial maintenance covenants. Our ability to meet the specified covenants could be affected by events beyond our control, and our failure to meet these covenants will result in an event of default as defined in the applicable facility.
In addition, our ability to borrow under the ABL Facility is limited by the amount of the borrowing base applicable to U.S. dollar and Canadian dollar borrowings. Any negative impact on the elements of our borrowing base, such as eligible accounts receivable and inventory, will reduce our borrowing capacity under the ABL Facility. Moreover, the ABL Facility provides discretion to the agent bank acting on behalf of the lenders to impose additional requirements on what accounts receivable and inventory may be counted toward the borrowing base availability and to impose other reserves, which could materially impair the amount of borrowings that would otherwise be available to us. There can be no assurance that the agent bank will not impose such reserves or, were it to do so, that the resulting impact of this action would not materially and adversely impair our liquidity.
As a result of these covenants and restrictions, we are limited in how we conduct our business, and we may be unable to raise additional debt or equity financing to compete effectively or to take advantage of new business opportunities or engage in other activities that may be in our long-term best interests. The terms of any future indebtedness we may incur could include more restrictive covenants. We cannot assure you that we will be able to maintain compliance with these covenants in the future and, if we fail to do so, we may be unable to obtain waivers from the lenders or amend the covenants.
Our failure to comply with the credit agreements governing our Credit Facilities and indenture governing the Senior Notes, including as a result of events beyond our control, could trigger events of default and acceleration of our indebtedness. Defaults under our debt agreements could have a material adverse effect on our business, financial condition, and results of operations.
If there were an event of default under the credit agreements governing our Credit Facilities, the indenture governing the Senior Notes, or other indebtedness that we may incur, the holders of the defaulted indebtedness could cause all amounts outstanding with respect to that indebtedness to be immediately due and payable. It is likely that our cash flows would not be sufficient to fully repay borrowings under our Credit Facilities and principal amount of the Senior Notes, if accelerated upon an event of default. If we are unable to repay, refinance, or restructure our secured debt, the holders of such indebtedness may proceed against the collateral securing that indebtedness.
Furthermore, any event of default or declaration of acceleration under one debt instrument may also result in an event of default under one or more of our other debt instruments. In exacerbated or prolonged circumstances, one or more of these events could result in our bankruptcy or liquidation. Accordingly, any default by us on our debt could have a material adverse effect on our business, financial condition, and results of operations.
We require a significant amount of liquidity to fund our operations, and borrowing has increased our vulnerability to negative unforeseen events.
Our liquidity needs vary throughout the year. If our business experiences materially negative unforeseen events, we may be unable to generate sufficient cash flow from operations to fund our needs or maintain sufficient liquidity to operate and remain in compliance with our debt covenants, which could result in reduced or delayed purchases of raw materials, planned capital expenditures and other investments and adversely affect our financial condition or results of operations. Our ability to borrow under the ABL Facility may be limited due to decreases in the borrowing base as described above.
Despite our current debt levels, we may incur substantially more indebtedness. This could further exacerbate the risks associated with our substantial leverage.
We may incur substantial additional indebtedness in the future. Although the covenants under the credit agreements governing our Credit Facilities and indenture governing the Senior Notes provide certain restrictions on our ability to incur additional debt, the terms of such agreements permit us to incur significant additional indebtedness. To the extent that we incur additional indebtedness, the risk associated with our substantial indebtedness described above, including our possible inability to service our indebtedness, will increase.
Risks Relating to Ownership of Our Common Stock
The market price of our common stock may be highly volatile.
Our common stock has only been listed for public trading since January 27, 2017. Since that date, the price of our common stock, as reported by the NYSE, has ranged from a high of $42.27 on January 5, 2018 to a low of $13.28 on December 26, 2018. The trading price of our common stock may be volatile. Securities markets worldwide experience significant price and volume fluctuations. This market volatility, as well as other general economic, market or political conditions, could reduce the market price of our shares in spite of our operating performance. The following factors may have a significant impact on the market price of our common stock:
29
|
•
|
negative trends in global economic conditions and/or activity levels in our end markets;
|
|
•
|
increases in interest rates used to finance home construction and improvements;
|
|
•
|
our ability to compete effectively against our competitors;
|
|
•
|
changes in consumer needs, expectations, or trends;
|
|
•
|
our ability to maintain our relationships with key customers;
|
|
•
|
our ability to implement our business strategy;
|
|
•
|
our ability to complete and integrate new acquisitions;
|
|
•
|
variations in the prices of raw materials used to manufacture our products;
|
|
•
|
adverse changes in building codes and standards or governmental regulations applicable to general business operations;
|
|
•
|
product liability claims or product recalls;
|
|
•
|
any legal actions in which we may become involved, including disputes relating to our intellectual property;
|
|
•
|
our ability to recruit and retain highly skilled staff;
|
|
•
|
actual or anticipated fluctuations in our quarterly or annual operating results;
|
|
•
|
trading volume of our common stock;
|
|
•
|
sales of our common stock by us, our executive officers and directors, or our shareholders (including certain affiliates of Onex) in the future; and
|
|
•
|
general economic and market conditions and overall fluctuations in the U.S. equity markets.
|
In addition, broad market and industry factors, including the trading prices of the securities of our publicly-traded competitors, may negatively affect the market price of our common stock, regardless of our actual operating performance, and factors beyond our control may cause our stock price to decline rapidly and unexpectedly. Furthermore, the stock market has experienced extreme volatility that, in some cases, has been unrelated or disproportionate to the operating performance of particular companies.
Publishing earnings guidance subjects us to risks, including increased stock volatility, that could lead to potential lawsuits by investors.
Because we publish earnings guidance, we are subject to a number of risks. Actual results may vary from the guidance we provide investors from time to time, such that our stock price may decline following, among other things, any earnings release or guidance that does not meet market expectations. It has become increasingly commonplace for investors to file lawsuits against companies following a rapid decrease in market capitalization. We have been in the past, and may be in the future, named in these types of lawsuits. These types of lawsuits can be costly and divert management attention and other resources away from our business, regardless of their merits, and could result in adverse settlements or judgments.
We may be subject to securities litigation, which is expensive and could divert management attention.
Our share price may be volatile and, in the past, companies that have experienced volatility in the market price of their stock have been subject to securities class action litigation. We may be the target of this type of litigation in the future. Litigation of this type could result in substantial costs and diversion of management’s attention and resources, which could have a material adverse effect on our business, financial condition, and results of operations. Any adverse determination in litigation could also subject us to significant liabilities.
30
Because Onex owns a substantial portion of our common stock, it may influence major corporate decisions and its interests may conflict with the interests of other holders of our common stock.
Onex beneficially owns approximately
32.9 million
shares of our common stock representing approximately
32.4%
of our outstanding shares. Although we are no longer a controlled company, Onex will continue to be able to influence matters requiring approval by our shareholders and/or our board of directors, including the election of directors and the approval of business combinations or dispositions and other extraordinary transactions. They may also have interests that differ from other shareholders and may vote in a way with which other shareholders disagree and which may be adverse to their interests. The concentration of ownership may have the effect of delaying, preventing, or deterring a change of control of our company, could deprive our shareholders of an opportunity to receive a premium for their common stock as part of a sale of our company and may materially and adversely affect the market price of our common stock. In addition, Onex may in the future own businesses that directly compete with ours. Further, for so long as Onex owns at least 5% of our outstanding shares, Onex has the right to purchase its pro rata portion of the primary shares offered in any future public offering. This right could result in Onex continuing to maintain a substantial ownership of our common stock.
Our directors who have relationships with Onex may have conflicts of interest with respect to matters involving our Company.
Two of our eleven directors are affiliated with Onex. These persons have fiduciary duties to both us and Onex. As a result, they may have real or apparent conflicts of interest on matters affecting both us and Onex, which in some circumstances may have interests adverse to ours. Onex is in the business of making or advising on investments in companies and may hold, and may from time to time in the future acquire, interests in, or provide advice to, businesses that directly or indirectly compete with certain portions of our business or that are suppliers or customers of ours. In addition, as a result of Onex’ ownership interest, conflicts of interest could arise with respect to transactions involving business dealings between us and Onex including potential acquisitions of businesses or properties, the issuance of additional securities, the payment of dividends by us, and other matters.
In addition, our restated certificate of incorporation provides that the doctrine of “corporate opportunity” will not apply with respect to us, to Onex or certain related parties or any of our directors who are employees of Onex or its affiliates in a manner that would prohibit them from investing in competing businesses or doing business with our customers. To the extent they invest in such other businesses, Onex may have differing interests than our other shareholders.
The requirements of being a public company, including compliance with the reporting requirements of the Exchange Act and the requirements of the Sarbanes-Oxley Act of 2002, and the NYSE, may strain our resources, increase our costs and distract management, and we may be unable to comply with these requirements in a timely or cost-effective manner.
As a public company, we are subject to the reporting requirements of the Exchange Act and the corporate governance standards of the Sarbanes-Oxley Act of 2002 and the NYSE and SEC rules and requirements. As a result, we have incurred and will continue to incur significant legal, regulatory, accounting, investor relations, and other costs that we did not incur as a private company. These requirements may also place a strain on our management, systems, and resources. The Exchange Act requires us to file annual, quarterly, and current reports with respect to our business and financial condition within specified time periods and to prepare proxy statements with respect to our annual meeting of shareholders. The Sarbanes-Oxley Act requires that we maintain effective disclosure controls and procedures and internal controls over financial reporting. The NYSE requires that we comply with various corporate governance requirements. To maintain and improve the effectiveness of our disclosure controls and procedures and internal controls over financial reporting and comply with the Exchange Act and NYSE requirements, significant resources and management oversight will be required. As a public company, we are required to:
|
•
|
expand the roles and duties of our board of directors and committees of the board;
|
|
•
|
institute more formal comprehensive financial reporting and disclosure compliance functions;
|
|
•
|
supplement our internal accounting and auditing function;
|
|
•
|
enhance and formalize closing procedures for our accounting periods;
|
|
•
|
enhance our investor relations function;
|
|
•
|
enhance our regulatory and corporate compliance function;
|
|
•
|
establish new or enhanced internal policies, including those relating to disclosure controls and procedures; and
|
|
•
|
involve and retain to a greater degree outside counsel and accountants in the activities listed above.
|
These activities may divert management’s attention from revenue producing activities to management and administrative oversight. Any of the foregoing could have a material adverse effect on us and the price of our common stock. In addition, failure to comply with any laws or regulations applicable to us may result in legal proceedings and/or regulatory investigations.
31
Material weaknesses in our internal control over financial reporting or our failure to remediate such material weaknesses could result in a violation of Section 404 of the Sarbanes-Oxley Act, or in a material misstatement in our financial statements not being prevented or detected, and could affect investor confidence in the accuracy and completeness of our financial statements, as well as our common stock price.
As a public company, we are required to comply with Section 404 of the Sarbanes-Oxley Act. We made our first annual assessment of our internal control over financial reporting pursuant to Section 404 of the Sarbanes-Oxley Act with our annual report for the fiscal year ended December 31, 2018 and included an auditor attestation on management’s internal controls report in with this Form 10-K. If we fail to abide by the applicable requirements of Section 404, regulatory authorities, such as the SEC, might subject us to sanctions or investigation, and our independent registered public accounting firm may not be able to certify as to the effectiveness of our internal control over financial reporting pursuant to an audit of our controls. Even effective internal controls can provide only reasonable assurance with respect to the preparation and fair presentation of financial statements. Accordingly, our internal control over financial reporting may not prevent or detect misstatements because of their inherent limitations, including the possibility of human error, the circumvention or overriding of controls, or fraud.
During the preparation of our financial statements for the year ended December 31, 2018, we concluded that we did not maintain a sufficient complement of personnel in our Europe operations with the appropriate level of knowledge, experience and training in internal control over financial reporting commensurate with our financial reporting requirements to allow for the consistent execution of control activities. Further, monitoring controls maintained at the Europe operations and corporate levels did not operate with a sufficient degree of precision to provide for the appropriate level of oversight of activities related to our internal control over financial reporting. These material weaknesses contributed to the following additional material weaknesses in that we did not design and maintain effective controls within certain of our Europe operations related to the review and approval of customer pricing, the review and approval of manual journal entries, and the reconciliation of subsidiary ledger financial information used in the consolidated financial statements. Specifically, we did not design and maintain controls to ensure (i) the review and approval of the initial set-up, and subsequent changes/modifications, of customer pricing related to revenue arrangements; (ii) that journal entries were properly prepared with sufficient supporting documentation, were reviewed and approved to ensure accuracy and completeness of the journal entries, and were reviewed by an appropriate individual separate from the preparer of such journal entry; and (iii) the subsidiary financial information used in the preparation of the consolidated financial statements agreed to the financial information recorded in the subsidiary ledger, and to the extent there were differences, that they were appropriately validated.
While we continue to address these material weaknesses and to strengthen our overall internal control over financial reporting, we may discover other material weaknesses going forward that could result in inaccurate reporting of our financial condition or results of operations. Inadequate internal control over financial reporting may cause investors to lose confidence in our reported financial information. Any loss of confidence in the reliability of our financial statements or other negative reaction to our failure to develop timely or adequate disclosure controls and procedures or internal controls could result in a decline in the price of our common stock and may restrict access to the capital markets and may adversely affect the price of our common stock.
Future sales, or the perception of future sales, of shares of our common stock in the public market by us or our existing shareholders could cause our stock price to fall.
The sales of a substantial number of shares of our common stock in the public market, or the perception that such sales could occur, including sales by Onex, could materially adversely affect the prevailing market price of our common stock. As of
December 31, 2018
, we had
101,310,862
shares of common stock outstanding.
Shares held by Onex and certain of our directors, officers and existing shareholders are eligible for resale, subject to volume, manner of sale and other limitations under Rule 144. In addition, pursuant to the Registration Rights Agreement (as defined below), each have the right, subject to certain conditions, to require us to register the sale of shares owned by such persons under the federal securities laws. By exercising their registration rights, and selling a large number of shares, these holders could cause the prevailing market price of our common stock to decline. In addition, shares issued or issuable upon exercise of options and vested RSUs and PSUs will be eligible for sale from time to time.
In addition, as of
December 31, 2018
we had 2,430,705 shares reserved for issuance pursuant to equity awards outstanding under our 2011 Stock Incentive Plan and 5,632,850 shares reserved for issuance pursuant to equity awards under our 2017 Omnibus Equity Plan. These shares have been registered by us on Form S-8 and, upon exercise of options and vesting of RSUs and PSUs, will be eligible for sale from time to time or, will be eligible for sale immediately following exercise of such options.
Our employees, officers, and directors may elect to sell shares of our common stock in the public market. Sales of a substantial number of shares of our common stock in the public market could depress the market price of our common stock and impair our ability to raise capital through the sale of additional equity securities.
32
The ESOP and the JELD-WEN, Inc. KSOP (“KSOP”), are designed as a tax-qualified retirement plans and employee stock ownership plans under the Code. Participants whose employment with us or our subsidiaries is terminated are entitled to receive distributions of accounts held under the ESOP and KSOP at specified times and in specified forms. In addition, each plan permits diversification of our common stock held in participants’ accounts. The ESOP and KSOP may sell shares in the open market to fund hardship distributions and diversifications or participants may sell shares received as part of their distributions. In the year ended
December 31, 2018
, 644,054 shares were either sold by the plans to cover cash distributions and diversifications or distributed to participants.
In the future, we may issue securities to raise cash for acquisitions or otherwise. We may also acquire interests in other companies by using a combination of cash and our common stock or just our common stock.
We may also issue securities convertible into our common stock. Any of these events may dilute your ownership interest in our company and have an adverse impact on the price of our common stock.
If securities or industry analysts cease publishing research or reports about us, our business, or our market, or if they adversely change their recommendations or publish negative reports regarding our business or our stock, our stock price and trading volume could decline.
The trading market for our common stock can be influenced by the research and reports that industry or securities analysts may publish about us, our business, our market, or our competitors. We do not have any control over these analysts and we cannot provide any assurance that analysts will cover us or provide favorable coverage. If any of the analysts who may cover us adversely change their recommendation regarding our stock, or provide more favorable relative recommendations about our competitors, our stock price could decline. If any analyst who may cover us were to cease coverage of our company or fail to regularly publish reports on us, we could lose visibility in the financial markets, which in turn could cause our stock price or trading volume to decline.
Because we have no current plans to pay cash dividends on our shares of common stock, shareholders must rely on appreciation of the value of our common stock for any return on their investment.
We currently anticipate that we will retain future earnings for the development, operation, and expansion of our business and have no current plans to declare or pay any cash dividends in the foreseeable future. In addition, the terms of our Credit Facilities, Senior Notes and any future debt agreements may preclude us from paying dividends. As a result, we expect that only appreciation of the price of our common stock, if any, will provide a return to shareholders for the foreseeable future.
Some provisions of our charter documents and Delaware law may have anti-takeover effects that could discourage an acquisition of us by others, even if an acquisition would be beneficial to our shareholders, and may prevent attempts by our shareholders to replace or remove our current management.
Provisions in our restated certificate of incorporation and our amended and restated bylaws, as well as provisions of the Delaware General Corporation Law, or the “DGCL”, could make it more difficult for a third party to acquire us or increase the cost of acquiring us, even if doing so would benefit our shareholders, including transactions in which shareholders might otherwise receive a premium for their shares. Among other things, our restated certificate of incorporation and amended and restated bylaws:
|
•
|
divide our board of directors into three classes with staggered three-year terms;
|
|
•
|
limit the ability of shareholders to remove directors only “for cause”;
|
|
•
|
provide that our board of directors is expressly authorized to adopt, alter, or repeal our bylaws;
|
|
•
|
authorize the issuance of blank check preferred stock that our board of directors could issue to increase the number of outstanding shares and to discourage a takeover attempt;
|
|
•
|
prohibit shareholder action by written consent, which requires all shareholder actions to be taken at a meeting of our shareholders;
|
|
•
|
prohibit our shareholders from calling a special meeting of shareholders ;
|
|
•
|
establish advance notice requirements for nominations for election to our board of directors or for proposing matters that can be acted upon by shareholders at shareholder meetings; and
|
|
•
|
require the approval of holders of at least two-thirds of the outstanding shares of common stock to amend our bylaws and certain provisions of our certificate of incorporation.
|
We have also opted out of Section 203 of the DGCL, which, subject to some exceptions, prohibits business combinations between a Delaware corporation and an interested shareholder, which is generally defined as a shareholder who becomes a beneficial owner of 15% or more of a Delaware corporation’s voting stock for a three-year period following the date that the
33
shareholder became an interested shareholder. At some time in the future, we may again be governed by Section 203. Section 203 could have the effect of delaying, deferring or preventing a change in control that our shareholders might consider to be in their best interests.
These anti-takeover defenses could discourage, delay or prevent a transaction involving a change in control of our company. These provisions could also discourage proxy contests and make it more difficult for you and other shareholders to elect directors of your choosing and cause us to take corporate actions other than those you desire.
Our restated certificate of incorporation provides, subject to limited exceptions, that the Court of Chancery of the State of Delaware will be the exclusive forum for substantially all disputes between us and our shareholders, which could limit our shareholders’ ability to obtain a favorable judicial forum for disputes with us or our directors, officers or employees.
Our restated certificate of incorporation provides, unless we consent to an alternative forum, that the Court of Chancery of the State of Delaware (or, if such court does not have jurisdiction, the Superior Court of the State of Delaware, or, if such other court does not have jurisdiction, the U.S. District Court for the District of Delaware) shall be the exclusive forum for any claims, including claims on behalf of JWH, brought by a shareholder (i) that are based upon a violation of a duty by a current or former director or officer or shareholder in such capacity or (ii) as to which the DGCL confers jurisdiction upon the Court of Chancery of the State of Delaware. This provision may limit a shareholder’s ability to bring a claim in a judicial forum that it finds favorable for disputes with us or our directors, officers or other employees, which may discourage such lawsuits against us and our directors, officers, and other employees. Alternatively, if a court were to find the provision contained in our restated certificate of incorporation to be inapplicable or unenforceable in an action, we may incur additional costs associated with resolving such action in other jurisdictions, which could adversely affect our business and financial condition.
Because we are a holding company with no operations of our own, we rely on dividends, distributions, and transfers of funds from our subsidiaries and we could be harmed if such distributions were not made in the future.
We are a holding company that conducts all of our operations through subsidiaries and the majority of our operating income is derived from JWI, our main operating subsidiary. Consequently, we rely on dividends or advances from our subsidiaries. We have no current plans to declare or pay dividends on our common stock for the foreseeable future; however, to the extent that we determine in the future to pay dividends on our common stock, none of our subsidiaries will be obligated to make funds available to us for the payment of dividends. The ability of such subsidiaries to pay dividends to us is subject to applicable local law and may be limited due to terms of other contractual arrangements, including our indebtedness. Such laws and restrictions would restrict our ability to continue operations. In addition, Delaware law may impose requirements that may restrict our ability to pay dividends to holders of our common stock.
Item 1B - Unresolved Staff Comments.
None.
34
Item 2 - Properties
Our principal executive offices are located in Charlotte, North Carolina. We also own and lease other properties, including sales offices, closed facilities, and administrative office space in Klamath Falls, Oregon, which we own, as well as Charlotte, North Carolina; Birmingham, U.K.; and Sydney, Australia, each of which we lease.
|
Manufacturing
|
Distribution
|
Showrooms
|
||||||
|
North America
|
||||||||
|
United States
|
45
|
|
10
|
|
1
|
|
||
|
Canada
|
4
|
|
2
|
|
—
|
|
||
|
St. Kitts
|
—
|
|
1
|
|
—
|
|
||
|
Chile
|
1
|
|
—
|
|
—
|
|
||
|
Peru
|
1
|
|
—
|
|
—
|
|
||
|
Mexico
|
2
|
|
—
|
|
—
|
|
||
|
53
|
|
13
|
|
1
|
|
|||
|
Europe
|
||||||||
|
United Kingdom
|
5
|
|
1
|
|
—
|
|
||
|
France
|
2
|
|
—
|
|
—
|
|
||
|
Austria
|
3
|
|
—
|
|
3
|
|
||
|
Croatia
|
—
|
|
—
|
|
1
|
|
||
|
Switzerland
|
1
|
|
—
|
|
3
|
|
||
|
Hungary
|
1
|
|
—
|
|
—
|
|
||
|
Germany
|
4
|
|
1
|
|
—
|
|
||
|
Sweden
|
3
|
|
—
|
|
—
|
|
||
|
Denmark
|
3
|
|
—
|
|
—
|
|
||
|
Latvia
|
3
|
|
—
|
|
—
|
|
||
|
Estonia
|
3
|
|
—
|
|
—
|
|
||
|
Finland
|
5
|
|
—
|
|
—
|
|
||
|
33
|
|
2
|
|
7
|
|
|||
|
Australasia
|
||||||||
|
Australia
|
46
|
|
6
|
|
48
|
|
||
|
New Zealand
|
—
|
|
1
|
|
—
|
|
||
|
Indonesia
|
2
|
|
—
|
|
—
|
|
||
|
Malaysia
|
1
|
|
—
|
|
—
|
|
||
|
49
|
|
7
|
|
48
|
|
|||
|
Total JELD-WEN
|
135
|
|
22
|
|
56
|
|
||
Item 3 - Legal Proceedings
We are involved in various legal proceedings, claims, and government audits arising in the ordinary course of business. We record our best estimate of a loss when the loss is considered probable and the amount of such loss can be reasonably estimated. Legal judgments and estimated settlements have been included in accrued expenses in our consolidated balance sheets included in this report. When a loss is probable and there is a range of estimated loss with no best estimate within the range, we record the minimum estimated liability related to the lawsuit or claim. As additional information becomes available, we assess the potential liability related to pending litigation and claims and revise our accruals if necessary. Because of uncertainties related to the resolution of lawsuits and claims, the ultimate outcome may differ materially from our estimates. In the opinion of management, other than as described below, as of December 31, 2018, there are no current proceedings or litigation matters involving the Company or its property that we believe would have a material adverse effect on our consolidated financial position or cash flows, although they could have a material adverse effect on our operating results for a particular reporting period.
Steves & Sons Litigation
We sell molded door skins to certain customers pursuant to long-term contracts, and these customers in turn use the molded
35
door skins to manufacture interior doors and compete directly against us in the marketplace. We gave notice of termination of one of these contracts and, on June 29, 2016, the counterparty to the agreement, Steves and Sons, Inc. (“Steves”) filed a claim against JWI in the U.S. District Court for the Eastern District of Virginia, Richmond Division (“Eastern District of Virginia”). The complaint alleges that our acquisition of CMI, a competitor in the molded door skins market, together with subsequent price increases and other alleged acts and omissions, violated antitrust laws and constituted a breach of contract, and breach of warranty. Specifically, the complaint alleged that our acquisition of CMI substantially lessened competition in the molded door skins market. The complaint sought declaratory relief, ordinary and treble damages, and injunctive relief, including divestiture of certain assets acquired in the CMI acquisition.
In February 2018, a jury in the Eastern District of Virginia returned a verdict that was unfavorable to JWI with respect to Steves’ claims that our acquisition of CMI violated Section 7 of the Clayton Act and found that JWI had breached the supply agreement between the parties. The verdict awarded Steves
$12.2 million
for past damages under both the Clayton Act and breach of contract claims and
$46.5 million
in future lost profits under the Clayton Act claim.
In October 2018, the presiding judge vacated a portion of the jury verdict, reducing the contract damages award by $2.2 million. We expect that Steves will be required to elect to recover its past damages either under the Clayton Act claims or the contract claims, but not both. If a judgment is entered under the Clayton Act, any damages awarded will be trebled. In addition, if a judgment is entered under either theory in accordance with the verdict, Steves will be entitled to an award of attorney’s fees, which amounts have not yet been quantified. We asserted a position that, because future lost profits were awarded, Steves is not permitted to pursue its claim for divestiture of certain assets acquired in the CMI acquisition. An evidentiary hearing on equitable remedies, including divestiture, was held in April 2018. On October 5, 2018, the presiding judge issued an opinion finding that a remedy of divestiture is an appropriate remedy. On December 7, 2018, the presiding judge granted in part and denied in part Steves’ request for declaratory relief. On December 20, 2018, the presiding judge entered a Final Judgment Order, granting divestiture and conditionally awarding monetary damages in the event the divestiture order is overturned. Steves moved to amend on January 11, 2019.
JELD-WEN has filed a renewed motion for judgment as a matter of law and a motion for a new trial, and we intend to vigorously oppose entry of an adverse judgment, and to appeal any adverse judgment that may be entered. We continue to believe that Steves’ claims lack merit, Steves’ damages calculations are speculative and excessive, and Steves is not entitled in any event to the extraordinary remedy of divestiture. We believe that multiple pretrial and trial rulings were erroneous and improperly limited the Company’s defenses, and that judgment in accordance with the verdict would be improper for several reasons under applicable law. However, based upon the rulings described above, in the third quarter of 2018 the Company recorded a charge of $76.5 million associated with this loss contingency. The charge reflects the judgment anticipated to be entered against the Company, including the trebling of $12.2 million of past damages under the Clayton Act, and estimated legal fees. The charge does not include any amount for lost profits or divestiture. Steves has indicated its intention to elect divestiture, rather than lost profits. Any judgment entered that awards lost profits, if ultimately upheld after exhaustion of our appellate remedies could have a material adverse effect on our financial position, operating results, or cash flows, particularly for the reporting period in which a loss is recorded. Because the operations acquired from CMI have been fully integrated into the Company’s other operations, divestiture of those operations would be difficult if not impossible and, therefore, it is not possible to estimate the cost of any final divestiture order or the extent to which such an order would have a material adverse effect on our financial position, operating results or cash flows.
During the course of the proceedings in the Eastern District of Virginia, we discovered certain facts that led us to conclude that Steves, its principals and certain former employees of the Company had misappropriated Company trade secrets, violated the terms of various agreements between the Company and those parties and violated other laws. On May 11, 2018, a jury in the Eastern District of Virginia returned a verdict on our trade secrets claims against Steves and awarded damages in the amount of $1.2 million. The presiding judge has entered a judgment in our favor for those amounts. On November 30, 2018, the presiding judge denied our request for a permanent injunction. Our other claims remain pending in Bexar County, Texas.
36
In Re: Interior Molded Doors Antitrust Litigation
On October 19, 2018, Grubb Lumber Company, on behalf of itself and others similarly situated, filed a putative class action lawsuit against us and one of our competitors in the doors market, Masonite Corporation (“Masonite”) in the Eastern District of Virginia. We subsequently received additional complaints from and on behalf of direct and indirect purchasers of interior molded doors. The suits have been consolidated into two separate actions, a Direct Purchaser Action and an Indirect Purchaser Action. The suits allege that Masonite and we violated Section 1 of the Sherman Act, and, in the Indirect Purchaser Action, related state law antitrust and consumer protection laws, by engaging in a scheme to artificially raise, fix, maintain, or stabilize the prices of interior molded doors in the United States. The complaints seek unquantified ordinary and treble damages, declaratory relief, interest, costs and attorneys’ fees. The Company believes the claims lack merit and intends to vigorously defend against the actions. At this early stage of the proceedings, we are unable to conclude that a loss is probable or to estimate the potential magnitude of any loss in the matters, although a loss could have a material adverse effect on our operating results, consolidated financial position or cash flows.
Item 4 - Mine Safety Disclosures.
Not applicable.
37
PART II - OTHER INFORMATION
Item 5 - Market for Registrant's Common Equity, Related Shareholder Matters and Issuer Purchases of Equity Securities.
MARKET INFORMATION
Our common stock has been listed and traded on the NYSE under the symbol “JELD” since January 27, 2017. Prior to that time, there was no public trading market for our stock.
HOLDERS
As of
February 27, 2019
, there were
1,169
shareholders of record of our common stock. The number of record holders does not include a substantially greater number of holders whose shares are held of record in nominee or “street name” accounts through banks, brokers and other financial institutions.
38
STOCK PERFORMANCE GRAPH
The following graph depicts the total return to shareholders from January 27, 2017, the date our common shares became listed on the NYSE, through
December 31, 2018
, relative to the performance of the Standard & Poor's 500 Index and the Standard & Poor's 1500 Building Products Index. The graph assumes an investment of $100 in our common stock and each index on January 27, 2017, and the reinvestment of dividends paid since that date. The stock performance shown in the graph is not necessarily indicative of future price performance.
*$100 invested on 1/27/17 in stock or 12/31/16 in index, including reinvestment of dividends.
Fiscal year ended December 31.
Copyright© 2018 Standard & Poor's, a division of S&P Global. All rights reserved.
Fiscal year ended December 31.
Copyright© 2018 Standard & Poor's, a division of S&P Global. All rights reserved.
|
1/27/2017
|
3/31/2017
|
6/30/2017
|
9/30/2017
|
12/31/2017
|
3/31/2018
|
6/30/2018
|
9/30/2018
|
12/31/2018
|
|||||||||
|
JELD-WEN Holding, Inc.
|
$100.00
|
$125.77
|
$124.27
|
$135.99
|
$150.73
|
$117.23
|
$109.46
|
$94.41
|
$54.40
|
||||||||
|
S&P 500
|
$100.00
|
$106.07
|
$109.34
|
$114.24
|
$121.83
|
$120.91
|
$125.06
|
$134.7
|
$116.49
|
||||||||
|
S&P 1500 Building Products Index
|
$100.00
|
$101.36
|
$106.76
|
$106.55
|
$110.00
|
$104.60
|
$100.63
|
$104.84
|
$86.71
|
||||||||
EQUITY COMPENSATION PLANS
See “Item 12-
Security Ownership of Certain Beneficial Owners and Management and Related Shareholder Matters”
for the information required by Item 201(d) of Regulation S-K regarding equity compensation plans.
DIVIDENDS
In November 2016, we paid an aggregate cash dividend of approximately $73.8 million to holders of our then-outstanding common stock, approximately $0.9 million to holders of our then-outstanding Class B-1 Common Stock, and approximately $307 million to holders of our then-outstanding Series A Convertible Preferred Stock. The payment to holders of our outstanding Series A Convertible Preferred Stock represented payment for (i) preferred dividends accrued from May 31, 2016 through November 3, 2016 and (ii) a dividend on an as-if-converted-to common basis based on the original principal amount of the Series A Convertible Preferred Stock investment plus preferred dividends accrued through May 30, 2016. In conjunction with our IPO, these securities converted into
39
shares of our Common Stock as described below in “Part II-Item 8.
Financial Statements and Supplementary Data
, Note 1 -
Description of Company and Summary of Significant Accounting Policies
.”
We do not currently expect to pay any further cash dividends on our common stock for the foreseeable future. Instead, we intend to retain future earnings, if any, for the future operation and expansion of our business and the repayment of debt. Any determination to pay dividends in the future will be at the discretion of our board of directors and will depend upon our results of operations, cash requirements, financial condition, contractual restrictions, restrictions imposed by applicable laws and other factors that our board of directors may deem relevant.
The terms of the agreements governing our existing or future indebtedness may limit our ability to further pay dividends and make distributions to our shareholders. Our business is conducted through our subsidiaries and dividends from, and cash generated by, our subsidiaries will be our principal sources of cash to repay indebtedness, fund operations, and pay any dividends. Accordingly, our ability to pay dividends to our shareholders is dependent on the earnings and distributions of funds from our subsidiaries (which distributions may be restricted by the terms of our Corporate Credit Facilities and Senior Notes).
ISSUER PURCHASES OF EQUITY SECURITIES
A summary of our repurchases of Common Stock during the fourth quarter of 2018 is as follows (in thousands, except share and per share amounts)
:
|
(a)
|
(b)
|
(c)
|
(d)
|
|||||
|
Period
|
Total Number of Shares (or Units) Purchased
1
|
Average Price Paid Per Share (or Unit)
2
|
Total Number of Shares (or Units) Purchased as Part of Publicly Announced Plans or Programs
|
Maximum Number (or Approximate Dollar Value) of Shares (or Units) That May Yet Be Purchased Under The Plans or Programs
|
||||
|
September 30, 2018 - October 27, 2018
|
492,139
|
$23.24
|
492,139
|
$154,971
|
||||
|
October 28, 2018 - November 24, 2018
|
1,342,627
|
$17.98
|
1,342,627
|
$130,830
|
||||
|
November 25, 2018 - December 31, 2018
|
372,604
|
$15.73
|
372,604
|
$124,971
|
||||
|
Total
|
2,207,370
|
$18.77
|
2,207,370
|
|
||||
1
In April 2018, our Board of Directors authorized a $250.0 million share repurchase program that extends through December 31, 2019. Certain purchases made in the fiscal quarter ended December 31, 2018 were made in open market transactions pursuant to a trading plan meeting the requirements of Rule 10b5-1 under the Exchange Act.
2
Average price paid per share includes costs associated with the repurchases.
Item 6 - Selected Financial Data
Our historical results are not necessarily indicative of the results expected for any future period. Since the year ended December 31, 2014, we have completed several acquisitions. See
Acquisitions
, included in our Management’s Discussion and Analysis of Financial Condition and Results of Operations below. The results of these acquired entities are included in our consolidated statements of operations for the periods subsequent to the respective acquisition date. During the fourth quarter of 2016, we released a valuation allowance in the U.S. totaling
$278.4 million
resulting in an increase in tax benefit and net income for the period. During the fourth quarter of 2017, the Tax Act lowered our U.S. federal tax rate which reduced the valuation of our net deferred tax assets, resulting in an additional tax expense of approximately
$21.1 million
and we provisionally recorded an additional foreign repatriation tax charge of
$11.3 million
. During 2018, we finalized our accounting for all of the enactment-date income tax effects of the Tax Act and recognized a tax benefit of
$40.2 million
due to changes in the provisional amounts recorded at December 31, 2017 and included these adjustments as a component of income tax expense from continuing operations. See Note 17 -
Income Taxes
for further detail.
40
The selected historical consolidated financial data set forth below should be read in conjunction with, and are qualified by reference to, “Management’s Discussion and Analysis of Financial Condition and Results of Operations”, and our consolidated financial statements and related notes thereto included elsewhere in this Form 10-K.
|
Year Ended December 31,
|
||||||||||||||||||||
|
2018
|
2017
|
2016
|
2015
|
2014
|
||||||||||||||||
|
(dollars in thousands, except per share data)
|
||||||||||||||||||||
|
Net revenues
|
$
|
4,346,703
|
|
$
|
3,763,749
|
|
$
|
3,666,942
|
|
$
|
3,381,060
|
|
$
|
3,507,206
|
|
|||||
|
Income (loss) from continuing operations, net of tax
|
143,535
|
|
7,152
|
|
376,714
|
|
91,390
|
|
(78,275
|
)
|
||||||||||
|
Income (loss) per common share from continuing operations:
|
||||||||||||||||||||
|
Basic
|
$
|
1.38
|
|
$
|
0.00
|
|
$
|
(0.90
|
)
|
$
|
(15.72
|
)
|
$
|
(8.75
|
)
|
|||||
|
Diluted
|
1.36
|
|
0.00
|
|
(0.90
|
)
|
(15.72
|
)
|
(8.75
|
)
|
||||||||||
|
Cash dividends per common share
|
$
|
0.00
|
|
$
|
0.00
|
|
$
|
4.09
|
|
$
|
4.73
|
|
$
|
0.00
|
|
|||||
|
Other financial data:
|
||||||||||||||||||||
|
Capital expenditures
|
$
|
118,700
|
|
$
|
63,049
|
|
$
|
79,497
|
|
$
|
77,687
|
|
$
|
70,846
|
|
|||||
|
Depreciation and amortization
|
125,100
|
|
111,273
|
|
107,995
|
|
95,196
|
|
100,026
|
|
||||||||||
|
Adjusted EBITDA
(1)
|
465,346
|
|
437,613
|
|
393,682
|
|
310,986
|
|
229,849
|
|
||||||||||
|
Consolidated balance sheet data
:
|
||||||||||||||||||||
|
Total assets
|
$
|
3,051,055
|
|
$
|
2,862,940
|
|
$
|
2,536,046
|
|
$
|
2,182,373
|
|
$
|
2,184,059
|
|
|||||
|
Total debt
|
1,477,892
|
|
1,273,703
|
|
1,620,035
|
|
1,260,320
|
|
806,228
|
|
||||||||||
|
Redeemable convertible preferred stock
|
—
|
|
—
|
|
150,957
|
|
481,937
|
|
817,121
|
|
||||||||||
___________________________
|
(1)
|
In addition to our consolidated financial statements presented in accordance with GAAP, we use Adjusted EBITDA to measure our financial performance. Adjusted EBITDA is a supplemental non-GAAP financial measure of operating performance and is not based on any standardized methodology prescribed by GAAP. Adjusted EBITDA should not be considered in isolation or as an alternative to net income (loss), cash flows from operating activities, or other measures determined in accordance with GAAP. Also, Adjusted EBITDA is not necessarily comparable to similarly titled measures presented by other companies. Adjusted EBITDA margin is defined as Adjusted EBITDA divided by net revenues.
|
We define Adjusted EBITDA as net income (loss), adjusted for the following items: loss from discontinued operations, net of tax; equity earnings of non-consolidated entities; income tax (benefit) expense; depreciation and amortization; interest expense, net; impairment and restructuring charges; gain on previously held shares of equity investment; (gain) loss on sale of property and equipment; share-based compensation expense; non-cash foreign exchange transaction/translation (income) loss; other non-cash items; other items; and costs related to debt restructuring and debt refinancing.
We use this non-GAAP measure in assessing our performance in addition to net income (loss) determined in accordance with GAAP. We believe Adjusted EBITDA is an important measure to be used in evaluating operating performance because it allows management and investors to better evaluate and compare our core operating results from period to period by removing the impact of our capital structure (net interest income or expense from our outstanding debt), asset base (depreciation and amortization), tax consequences, other non-operating items, and share-based compensation. Furthermore, the instruments governing our indebtedness use Adjusted EBITDA to measure our compliance with certain limitations and covenants. We reference this non-GAAP financial measure frequently in our decision-making because it provides supplemental information that facilitates internal comparisons to the historical operating performance of prior periods. In addition, executive incentive compensation is based in part on Adjusted EBITDA, and we base certain of our forward-looking estimates and budgets on Adjusted EBITDA.
We also believe Adjusted EBITDA is a measure widely used by securities analysts and investors to evaluate the financial performance of our company and other companies. Adjusted EBITDA has limitations as an analytical tool, and you should not consider it in isolation, or as a substitute for analysis of our results as reported under GAAP. Adjusted EBITDA eliminates the effect of certain items on net income and thus has certain limitations. Some of these limitations are: Adjusted EBITDA does not reflect the interest expense, or the cash requirements necessary to service interest or principal payments, on our debt; Adjusted EBITDA does not reflect any income tax payments we are required to make and although depreciation and amortization are non-cash charges, the assets being depreciated and amortized will often have to be replaced in the future; and Adjusted EBITDA does not reflect any cash requirements for such replacement. Other companies may calculate Adjusted EBITDA differently, and, therefore, our Adjusted EBITDA may not be comparable to similarly titled measures of other companies.
41
The following is a reconciliation of our net income (loss), the most directly comparable GAAP financial measure, to Adjusted EBITDA:
|
Year Ended December 31,
|
||||||||||||||||||||
|
2018
|
2017
|
2016
|
2015
|
2014
|
||||||||||||||||
|
(dollars in thousands)
|
||||||||||||||||||||
|
Net income (loss)
|
$
|
144,273
|
|
$
|
10,791
|
|
$
|
377,181
|
|
$
|
90,918
|
|
$
|
(84,109
|
)
|
|||||
|
Adjustments:
|
||||||||||||||||||||
|
Loss from discontinued operations, net of tax
|
—
|
|
—
|
|
3,324
|
|
2,856
|
|
5,387
|
|
||||||||||
|
Equity (earnings) loss of non-consolidated entities
|
(738
|
)
|
(3,639
|
)
|
(3,791
|
)
|
(2,384
|
)
|
447
|
|
||||||||||
|
Income tax (benefit) expense
|
(7,958
|
)
|
138,603
|
|
(246,394
|
)
|
(5,435
|
)
|
18,942
|
|
||||||||||
|
Depreciation and amortization
|
125,100
|
|
111,273
|
|
107,995
|
|
95,196
|
|
100,026
|
|
||||||||||
|
Interest expense, net
(a)
|
70,818
|
|
79,034
|
|
77,590
|
|
60,632
|
|
69,289
|
|
||||||||||
|
Impairment and restructuring charges
(b)
|
17,328
|
|
13,057
|
|
18,353
|
|
31,031
|
|
38,645
|
|
||||||||||
|
Gain on previously held shares of equity investment
|
(20,767
|
)
|
—
|
|
—
|
|
—
|
|
—
|
|
||||||||||
|
Loss (gain) on sale of property and equipment
|
144
|
|
(299
|
)
|
(3,275
|
)
|
(416
|
)
|
(23
|
)
|
||||||||||
|
Share-based compensation expense
|
15,052
|
|
19,785
|
|
22,464
|
|
15,620
|
|
7,968
|
|
||||||||||
|
Non-cash foreign exchange transaction/translation (income) loss
|
8
|
|
(2,181
|
)
|
5,734
|
|
2,697
|
|
(528
|
)
|
||||||||||
|
Other non-cash items
(c)
|
3,859
|
|
526
|
|
2,843
|
|
1,141
|
|
2,334
|
|
||||||||||
|
Other items
(d)
|
117,933
|
|
47,000
|
|
30,585
|
|
18,893
|
|
20,278
|
|
||||||||||
|
Costs relating to debt restructuring, debt refinancing, and the Onex investment
(e)
|
294
|
|
23,663
|
|
1,073
|
|
237
|
|
51,193
|
|
||||||||||
|
Adjusted EBITDA
|
$
|
465,346
|
|
$
|
437,613
|
|
$
|
393,682
|
|
$
|
310,986
|
|
$
|
229,849
|
|
|||||
____________________________
|
(a)
|
Interest expense for the year ended
December 31, 2017
includes
$6,097
related to the write-off of a portion of the unamortized debt issuance costs and original issue discount associated with the Term Loan Facility.
|
|
(b)
|
Impairment and restructuring charges consist of (i) impairment and restructuring charges that are included in our consolidated statements of operations plus (ii) additional charges of $0, $1, $4,506, $9,687, and $257, for the years ended December 31, 2018, 2017, 2016, 2015, and 2014, respectively. These additional charges are primarily comprised of non-cash changes in inventory valuation reserves, such as excess and obsolete reserves. For further explanation of impairment and restructuring charges that are included in our consolidated statements of operations, see Note 24 -
Impairment and Restructuring Charges of Continuing Operations
in our financial statements for the years ended December 31, 2018, 2017 and 2016 included in Item 8 of this 10-K.
|
|
(c)
|
Other non-cash items include, among other things, (i) charges of
$3,740
, $439, $357, $893, and $2,496, for the years ended December 31, 2018, 2017, 2016, 2015, and 2014, respectively, relating to (1) the fair value adjustment for inventory acquired as part of the acquisitions referred to in “Management’s Discussion and Analysis of Financial Condition and Results of Operations-Acquisitions” and (2) other non-cash items include charges of $2,153 for the out-of-period European warranty liability adjustment for the year ended December 31, 2016.
|
|
(d)
|
Other items include: (i) in the year ended
December 31, 2018
, (1)
$76,500
in litigation contingency accruals, (2)
$25,444
in legal costs, (3)
$10,324
in acquisition costs, (4)
$3,381
in costs related to the departure of the former CEO and CFO, (5)
$2,901
in entity consolidation and reorganization costs, and (6)
$(5,396)
in realized gain on hedges; (ii) in the year ended December 31, 2017, (1) $34,178 in legal costs, (2) $4,176 in realized loss on hedges, (3) $3,484 in acquisition costs, (4) $2,202 in secondary offering costs, (5) $754
in tax consulting fee, (6)
$678 in legal entity consolidation costs, (7) $649 in taxes related to equity-based compensation, (8) $578 in facility ramp down costs, and (9) $(2,247) gain on settlement of contract escrow; (iii) in the year ended December 31, 2016, (1) $20,695 in payments to holders of vested options and restricted shares in connection with the November 2016 dividend, (2) $3,721 of professional fees related to the IPO of our common stock, (3) $1,626 of acquisition costs, (4) $584 in legal costs associated with disposition of non-core properties, (5) $507 of dividend-related costs, (6) $500 of costs related to the recruitment of executive management employees, (7) $450 in legal costs, and (8) $346 in Dooria plant closure costs; (iv) in the year ended December 31, 2015, (1) $11,446 payment to holders of vested options and restricted shares in connection with the July 2015 dividend, (2) $5,510 related to a U.K. legal settlement, (3) $1,825 in acquisition costs, (4) $1,833 of recruitment costs related to the recruitment of executive management employees, (5) $1,082 of legal costs related to non-core property disposal, and partially offset by (6) ($5,678) of realized gain on foreign exchange hedges related to an intercompany loan; and (v) in the year ended December 31, 2014, (1) $5,000 legal settlement related to our ESOP plan, (2) $3,657 of legal costs associated with noncore property disposal, (3) $3,443 production ramp-down costs, (4) $2,769 of consulting fees in Europe, and (5) $1,250 of costs related to a prior acquisition.
|
|
(e)
|
Included in the year ended December 31, 2017 is a loss on debt extinguishment of $23,262 associated with the refinancing of our term loan. Included in the year ended December 31, 2014 is a loss on debt extinguishment of $51,036 associated with the refinancing of our 12.25% secured notes.
|
Item 7 - Management’s Discussion and Analysis of Financial Condition and Results of Operations
42
This MD&A contains forward-looking statements that involve risks and uncertainties. Please see “Forward-Looking Statements” in Item 1-
Business
and Item 1A-
Risk Factors
in this Form 10-K for a discussion of the uncertainties, risks and assumptions associated with these statements. This discussion should be read in conjunction with our historical financial statements and related notes thereto and the other disclosures contained elsewhere in this Form 10-K. The results of operations for the periods reflected herein are not necessarily indicative of results that may be expected for future periods, and our actual results may differ materially from those discussed in the forward-looking statements as a result of various factors, including but not limited to those listed under Item 1A-
Risk Factors
and included elsewhere in this Form 10-K.
This MD&A is a supplement to our financial statements and notes thereto included elsewhere in this 10-K and is provided to enhance your understanding of our results of operations and financial condition. Our discussion of results of operations is presented in millions throughout the MD&A and due to rounding may not sum or calculate precisely to the totals and percentages provided in the tables. Our MD&A is organized as follows:
|
•
|
Overview and Background. This section provides a general description of our Company and reportable segments, business and industry trends, our key business strategies and background information on other matters discussed in this MD&A.
|
|
•
|
Consolidated Results of Operations and Operating Results by Business Segment. This section provides our analysis and outlook for the significant line items on our consolidated statements of operations, as well as other information that we deem meaningful to an understanding of our results of operations on both a consolidated basis and a business segment basis.
|
|
•
|
Liquidity and Capital Resources. This section contains an overview of our financing arrangements and provides an analysis of trends and uncertainties affecting liquidity, cash requirements for our business and sources and uses of our cash.
|
|
•
|
Critical Accounting Policies and Estimates. This section discusses the accounting policies that we consider important to the evaluation and reporting of our financial condition and results of operations, and whose application requires significant judgments or a complex estimation process.
|
Overview and Background
We are one of the world’s largest door and window manufacturers, and we hold a leading position by net revenues in the majority of the countries and markets we serve. We design, produce and distribute an extensive range of interior and exterior doors, wood, vinyl, and aluminum windows, and related products for use in the new construction, R&R of residential homes and, to a lesser extent, non-residential buildings.
We operate manufacturing facilities in
20
countries, located primarily in North America, Europe and Australia. For many product lines, our manufacturing processes are vertically integrated, enhancing our range of capabilities, our ability to innovate, and our quality control as well as providing supply chain, transportation, and working capital savings.
In October 2011, Onex acquired a majority of the combined voting power in the Company through the acquisition of convertible debt and convertible preferred equity.
In February 2017, we closed on the IPO of 28.75 million shares of our common stock at a public offering price of $23.00, resulting in net proceeds to us of
$472.4 million
after deducting underwriters’ discounts and commissions and other offering expenses. We used a portion of the net proceeds from the offering to repay $375.0 million of indebtedness outstanding under our Term Loan Facility and used the remaining net proceeds for working capital and other general corporate purposes, including sales and marketing activities, general and administrative matters, capital expenditures, and to invest in or acquire complementary businesses, products, services, technologies, or other assets.
In May and November 2017, we completed secondary public offerings of 16.1 million and 14.4 million shares, respectively, of our Common Stock, substantially all of which were owned by Onex.
As of
December 31, 2018
, Onex owned approximately
32.4%
of our outstanding shares of common stock.
43
Business Segments
Our business is organized in geographic regions to ensure integration across operations serving common end markets and customers. We have three reportable segments: North America (which includes limited activity in Chile and Peru), Europe, and Australasia. Financial information related to our business segments can be found in Note 18 -
Segment Information
of our financial statements included elsewhere in this 10-K.
Acquisitions
In April 2018, we acquired the assets of D&K, a long-standing supplier of cavity sliders to our Corinthian Doors business. D&K is now part of our Australasia segment.
In March 2018, we acquired the remaining issued and outstanding shares and membership interests of ABS, headquartered in Sacramento, California. ABS is a premier supplier of value-added services for the millwork industry. ABS is now part of our North America segment.
In February 2018, we acquired A&L, a leading Australian manufacturer of residential aluminum windows and patio doors. A&L has a network of manufacturing facilities across the eastern seaboard of Australia, which we expect will deliver synergies through operational savings from the implementation of JEM and by leveraging the benefits of our combined supply chain. A&L is now part of our Australasia segment.
In February 2018, we acquired Domoferm, headquartered in Gänserndorf, Austria. Domoferm is a leading European provider of steel doors, steel door frames, and fire doors for commercial and residential markets with four manufacturing sites in Austria, Germany, and the Czech Republic. Domoferm is now part of our Europe segment.
In August 2017, we acquired the Kolder Group, headquartered in Smithfield, Australia. Kolder is a leading Australian provider of shower enclosures, closet systems, and related building products, with leading positions in both the commercial and residential markets. Kolder is part of our Australasia segment. The acquisition significantly enhances our existing Australian capabilities in glass shower enclosures and built-in closet systems, and supports our strategy to build leadership positions in attractive markets.
In August 2017, we acquired MMI Door, headquartered in Sterling Heights, Michigan. MMI Door is a leading provider of doors and related value-added services in the Midwest region of the U.S. and is part of our North America segment. The acquisition complements our North America door business and allows us to improve service offerings and lead times to our channel partners.
In June 2017, we acquired Mattiovi, headquartered in Finland. Mattiovi is a leading manufacturer of interior doors and door frames in Finland and is part of our Europe segment. The acquisition enhances our market position in the Nordic region, increases our product offering, and also provides us with additional door frame capacity to support growth in the region.
In August 2016, we acquired the shares of Arcpac Building Products Limited, which includes its primary operating subsidiary Breezway, headquartered in Brisbane, Australia. Breezway is a manufacturer of louver window systems for the residential and commercial window markets and is part of our Australasia segment. Breezway’s primary sales market is Australia and it also maintains a presence in Malaysia and Hawaii. The acquisition of Breezway is expected to strengthen our position in the Australian window market and expand our product portfolio with new and innovative window designs as well as other complementary products.
In February 2016, we acquired Trend, headquartered in Sydney, Australia. Trend is a leading manufacturer of doors and windows in Australia and is now part of our Australasia segment. The acquisition of Trend strengthened our market position in the Australian window market and expanded our product portfolio with new and innovative window designs.
We paid an aggregate of approximately
$384.9 million
in cash (net of cash acquired) for the 2016, 2017, and 2018 acquisitions. In addition, we assumed debt of approximately
$70.6 million
associated with our 2018 acquired companies.
For additional information on acquisition activity, see Note 2 -
Acquisitions
.
44
Factors and Trends Affecting Our Business
Drivers of Net Revenues
The key components of our net revenues include core net revenues (which we define to include the impact of pricing and volume/mix, as discussed further under the heading, “Product Pricing and Volume/Mix” below), contribution from acquisitions made within the prior twelve months, and the impact of foreign exchange. Our core net revenues are impacted by the relative and fluctuating currency values in the geographies in which we operate, which we refer to as the impact of foreign exchange. Throughout this “Management’s Discussion and Analysis of Financial Condition and Results of Operations”, percentage changes in pricing are based on management schedules and are not derived directly from our accounting records.
Product Demand
General business, financial market, and economic conditions globally and in the regions where we operate influence overall demand in our end markets and for our products. In particular, the following factors may have a direct impact on demand for our products in the countries and regions where our products are marketed and sold:
|
•
|
the strength of the economy;
|
|
•
|
employment rates and consumer confidence and spending rates;
|
|
•
|
the availability and cost of credit;
|
|
•
|
the amount and type of residential and non-residential construction;
|
|
•
|
housing sales and home values;
|
|
•
|
the age of existing home stock, home vacancy rates, and foreclosures;
|
|
•
|
interest rate fluctuations for our customers and consumers;
|
|
•
|
increases in the cost of raw materials or any shortage in supplies or labor;
|
|
•
|
the effects of governmental regulation and initiatives to manage economic conditions;
|
|
•
|
geographical shifts in population and other changes in demographics; and
|
|
•
|
changes in weather patterns.
|
In addition, we seek to drive demand for our products through the implementation of various strategies and initiatives. We believe we can enhance demand for our new and existing products by:
|
•
|
innovating and developing new products and technologies;
|
|
•
|
investing in branding and marketing strategies, including marketing campaigns in both print and social media, as well as our investments in new training centers and mobile training facilities; and
|
|
•
|
implementing channel initiatives to enhance our relationships with key channel partners and customers, including the True BLU dealer management program in North America.
|
Product Pricing and Volume/Mix
The price and mix of products that we sell are important drivers of our net revenues and net income. Under the heading “Results of Operations” references to (i) “pricing” refer to the impact of price increases or decreases, as applicable, for particular products between periods and (ii) “volume/mix” refer to the combined impact of both the number of products we sell in a particular period and the types of products sold, in each case, on net revenues. While we operate in competitive markets, pricing discipline is an important element of our strategy to achieve profitable growth through improved margins. Our strategies also include incentivizing our channel partners to sell our higher margin products, and we believe a renewed focus on innovation and the development of new technologies will increase our sales volumes and the overall profitability of our product mix.
Cost Reduction Initiatives
Prior to the ongoing operational transformation being executed by our senior executive team, our operations were managed in a decentralized manner with varying degrees of emphasis on cost efficiency and limited focus on continuous improvement or strategic sourcing. Our senior management team has a proven track record of implementing operational excellence programs at some of the world’s leading industrial manufacturing businesses, and we believe the same successes can be realized at JELD-WEN. Key areas of focus of our operational excellence and footprint rationalization programs include:
45
|
•
|
reducing labor, overtime, and waste costs by reducing facility count while optimizing manufacturing capacity and improving planning and manufacturing processes;
|
|
•
|
reducing or minimizing increases in material costs through strategic global sourcing and value-added re-engineering of components, in part by leveraging our significant spend and the global nature of our purchases;
|
|
•
|
reducing warranty costs by improving quality; and
|
|
•
|
a JEM-enabled facility rationalization and modernization initiative that will reduce overhead costs and complexity, while increasing our overall capacity and improving our service levels.
|
We are in the early stages of implementing our strategic initiatives enabled by JEM, to develop the culture and processes of operational excellence and continuous improvement. These cost reduction initiatives, which include plant closures and consolidations, headcount reductions, and various initiatives aimed at lowering production and overhead costs, may not produce the intended results within the intended timeframe.
Raw Material Costs
Commodities such as vinyl extrusions, glass, aluminum, wood, steel, plastics, fiberglass, and other composites are major components in the production of our products. Changes in the underlying prices of these commodities have a direct impact on the cost of products sold. While we attempt to pass on a substantial portion of such cost increases to our customers, we may not be successful in doing so. In addition, our results of operations for individual quarters may be negatively impacted by a delay between the time of raw material cost increases and a corresponding price increase. Conversely, our results of operations for individual quarters may be positively impacted by a delay between the time of a raw material price decrease and a corresponding competitive pricing decrease.
Freight Costs
We incur substantial freight costs to third party logistics providers to transport raw materials and work-in-process inventory to our manufacturing facilities and to deliver finished goods to our customers. Changes in freight rates and the availability of freight services can have a significant impact on our cost of goods sold. Freight costs have risen significantly due to a number of factors that have affected the supply and demand of trucking services including increased regulation, such as data logging of miles, increases in general economic activity, and an aging workforce. We attempt to mitigate some of these cost increases through various internal initiatives and to pass a substantial portion of these increases to our customers; however, we may not realize the intended results within the intended timeframe.
Working Capital and Seasonality
Working capital, which is defined as accounts receivable plus inventory less accounts payable, fluctuates throughout the year and is affected by seasonality of sales of our products and of customer payment patterns. The peak season for home construction and remodeling in our North America and Europe segments, which represent the substantial majority of our revenues, generally corresponds with the second and third calendar quarters, and therefore our sales volume is usually higher during those quarters. Typically, working capital increases at the end of the first quarter and beginning of the second quarter in conjunction with, and in preparation for, our peak season, and working capital decreases starting in the third quarter as inventory levels and accounts receivable decline. Inventories fluctuate for some raw materials with long delivery lead times, such as steel, as we work through prior shipments and take delivery of new orders.
Foreign Currency Exchange Rates
We report our consolidated financial results in U.S. dollars. Due to our international operations, the weakening or strengthening of foreign currencies against the U.S. dollar can affect our reported operating results and our cash flows as we translate our foreign subsidiaries’ financial statements from their reporting currencies into U.S. dollars. In the year ended
December 31, 2018
compared to the year ended
December 31, 2017
, the depreciation or appreciation of the U.S. dollar relative to the reporting currencies of our foreign subsidiaries resulted in higher or lower reported results in such foreign reporting entities. In particular, the exchange rates used to translate our foreign subsidiaries’ financial results for the year ended
December 31, 2018
compared to the year ended
December 31, 2017
reflected, on average, the U.S. dollar weakening against the Euro and Canadian dollar by 5% and less than 1%, respectively, and strengthening against the Australia dollar by 3%. See Item 1A-
Risk Factors
- Risks Relating to Our Business and Industry, Item 1A-
Risk Factors
- Exchange rate fluctuations may impact our business, financial condition, and results of operations, and Item 7A-
Quantitative and Qualitative Disclosures About Market Risk-
Exchange Rate Risk.
46
Public Company Costs
Following our IPO, we have incurred, and will continue to incur, additional legal, accounting, board compensation, and other expenses that we did not previously incur, including costs associated with SEC, reporting and corporate governance requirements, and other requirements associated with operating as a public company. These requirements include compliance with the Sarbanes-Oxley Act of 2002, as amended, as well as other rules implemented by the SEC and the national securities exchanges. Our financial statements following our IPO reflect the impact of these expenses.
Components of our Operating Results
Net Revenues
Our net revenues are a function of sales volumes and selling prices, each of which is a function of product mix, and consist primarily of:
|
•
|
sales of a wide variety of interior and exterior doors, including patio doors, for use in residential and non-residential applications, with and without frames, to a broad group of wholesale and retail customers in all of our geographic markets;
|
|
•
|
sales of a wide variety of windows for both residential and certain non-residential uses, to a broad group of wholesale and retail customers primarily in North America, Australia, and the U.K.; and
|
|
•
|
other sales, including sales of moldings, trim board, cut-stock, glass, stairs, hardware and locks, door skins, shower enclosures, wardrobes, window screens, and miscellaneous installation and other services revenue.
|
Net revenues do not include internal transfers of products between our component manufacturing, product manufacturing and assembly, and distribution facilities.
Cost of Sales
Cost of sales consists primarily of material costs, direct labor and benefit costs, including payroll taxes, repair and maintenance, depreciation, utility, rent and warranty expenses, outbound freight, and insurance and benefits, supervision and tax expenses. Detail for each of these items is provided below.
|
•
|
Material Costs.
The single largest component of cost of sales is material costs, which include raw materials, components and finished goods purchased for use in manufacturing our products or for resale. Our most significant material costs include glass, wood, wood components, doors, door facings, door parts, hardware, vinyl extrusions, steel, fiberglass, packaging materials, adhesives, resins and other chemicals, core material, and aluminum extrusions. The cost of each of these items is impacted by global supply and demand trends, both within and outside our industry, as well as commodity price fluctuations, conversion costs, energy costs, and transportation costs. The imposition of new tariffs on imports, new trade restrictions, or changes in tariff rates or trade restrictions may further impact material costs. See Item 7A-
Quantitative and Qualitative Disclosures About Market Risk-
Raw Materials Risk.
|
|
•
|
Direct Labor and Benefit Costs.
Direct labor and benefit costs reflect a combination of production hours, average headcount, general wage levels, payroll taxes, and benefits provided to employees. Direct labor and benefit costs include wages, overtime, payroll taxes, and benefits paid to hourly employees at our facilities that are involved in the production and/or distribution of our products. These costs are generally managed by each facility and headcount is adjusted according to overall and seasonal production demand. We run multi-shift operations in many of our facilities to maximize return on assets and utilization. Direct labor and benefit costs fluctuate with headcount, but generally tend to increase with inflation due to increases in wages and health benefit costs.
|
|
•
|
Repair and Maintenance, Depreciation, Utility, Rent, and Warranty Expenses.
|
|
◦
|
Repairs and maintenance costs consist of equipment and facility maintenance expenses, purchases of maintenance supplies, and the labor costs involved in performing maintenance on our equipment and facilities.
|
|
◦
|
Depreciation includes depreciation expense associated with our production assets and plants.
|
47
|
◦
|
Rent is predominantly comprised of lease costs for facilities we do not own as well as vehicle fleet and equipment lease costs. Facility leases are typically multi-year and may include increases tied to certain measures of inflation.
|
|
◦
|
Warranty expenses represent all costs related to servicing warranty claims and product issues and are mostly related to our window products sold in the U.S. and Canada.
|
|
•
|
Outbound Freight.
Outbound freight includes payments to third-party carriers for shipments of orders to our customers, as well as driver, vehicle, and fuel expenses when we deliver orders to customers. The majority of our products are shipped by third-party carriers.
|
|
•
|
Insurance and Benefits, Supervision, and Tax Expenses.
|
|
◦
|
Insurance and benefit costs are the expenses relating to our insurance programs, health benefits, retirement benefit programs (including the pension plan), and other benefits that are not included in direct labor and benefits costs.
|
|
◦
|
Supervision costs are the wages and bonus expenses related to plant managers. Both insurance and benefits and supervision expenses tend to be influenced by headcount and wage levels.
|
|
◦
|
Tax costs are mostly payroll taxes for employees not included in direct labor and benefit costs, and property taxes. Tax expenses are impacted by changes in tax rates, headcount and wage levels, and the number and value of properties owned.
|
In addition, an appropriate portion of each of the insurance and benefits, supervision and tax expenses are allocated to SG&A expenses.
Selling, general, and administrative expenses
SG&A expenses consist primarily of research and development, sales and marketing, and general and administrative expenses.
Research and Development
. Research and development expenses consist primarily of personnel expenses related to research and development, consulting and contractor expenses, tooling and prototype materials, and overhead costs allocated to such expenses. Substantially all of our research and development expenses are related to developing new products and services and improving our existing products and services. To date, research and development expenses have been expensed as incurred, because the period between achieving technological feasibility and the release of products and services for sale has been short and development costs qualifying for capitalization have been insignificant.
We expect our research and development expenses to increase in absolute dollars as we continue to make significant investments in developing new products and enhancing existing products.
Sales and Marketing.
Sales and marketing expenses consist primarily of advertising and marketing promotions of our products and services and related personnel expenses, as well as sales incentives, trade show and event costs, sponsorship costs, consulting and contractor expenses, travel, display expenses, and related amortization. Sales and marketing expenses are generally variable expenses and not fixed expenses. We expect our sales and marketing expenses to increase in absolute dollars as we continue to actively promote our products and services.
General and Administrative
. General and administrative expenses consist of personnel expenses for our finance, legal, human resources, and administrative personnel, as well as the costs of professional services, any allocated overhead, information technology, amortization of intangible assets acquired, and other administrative expenses. We expect our general and administrative expenses to increase in absolute dollars due to the anticipated growth of our business and related infrastructure as well as legal, accounting, insurance, investor relations, and other costs associated with being a public company.
Impairment and Restructuring Costs
Impairment and restructuring costs consist primarily of all salary-related severance benefits that are accrued and expensed when a restructuring plan has been put into place, the plan has received approval from the appropriate level of management and the benefit is probable and reasonably estimable. In addition to salary-related costs, we incur other restructuring costs when facilities are closed or capacity is realigned within the organization. Upon termination of an employment or commercial contract we record
48
liabilities and expenses pursuant to the terms of the relevant agreement. For non-contractual restructuring activities, liabilities and expenses are measured and recorded at fair value in the period in which they are incurred.
Interest Expense, Net
Interest expense, net relates primarily to interest payments on our then-outstanding credit facilities (and debt securities) as well as amortization of any original issue discount or debt issuance costs. Debt issuance costs are included as an offset to long-term debt in the accompanying consolidated balance sheets and are amortized to interest expense over the life of the applicable facility using the effective interest method. For additional details, see Note 15 -
Long-Term Debt
in our financial statements for the year ended
December 31, 2018
included elsewhere in this 10-K
.
Other Income (Expense), Net
Other income (expense), net includes profit and losses related to various miscellaneous non-operating expenses including loss on extinguishment of debt and certain foreign currency related gains and losses.
Income Taxes
Income taxes are recorded using the asset and liability method of accounting for income taxes. Under this method, deferred tax assets and liabilities are recognized for the deferred tax consequences attributable to differences between the financial statement carrying amounts of existing assets and liabilities and their respective tax bases. Deferred tax assets and liabilities are measured using enacted tax rates expected to apply to taxable income in the years in which those temporary differences are expected to be recovered or settled. The effect on deferred tax assets and liabilities due to a change in tax rates is recognized in income in the period that includes the date of enactment. We recognize the effect of income tax positions only if those positions are more likely than not of being sustained. Recognized income tax positions are measured at the largest amount that is greater than 50% likely of being realized. Changes in recognition or measurement are reflected in the period in which the change in judgment occurs. We record interest related to unrecognized tax benefits in income tax expense. As of
December 31, 2018
, our U.S. federal, state, and foreign net operating loss (“NOL”) carryforwards were
$1,477.7 million
in the aggregate and
$85.6 million
of such NOL carryforwards do not expire.
The Tax Act passed in December 2017 had significant effects on our financial statements. In accordance with Staff Accounting Bulletin #118 issued by the SEC in December 2017 immediately following the passage of the Tax Act, we made provisional estimates for certain direct and indirect effects of the Tax Act for the year ended
December 31, 2017
. In the fourth quarter of 2018, we completed our accounting for all of the enactment-date income tax effects of the Tax Act and included any adjustments as a component of income tax expense from continuing operations. The Tax Act subjects a U.S. shareholder to current tax on GILTI earned by certain foreign subsidiaries. The FASB Staff Q&A, Topic 740, No. 5, “Accounting for Global Intangible Low-Taxed Income”, provides that we are permitted to make an accounting policy election to either recognize deferred taxes for temporary basis differences expected to reverse as GILTI in future years or provide for the tax expense related to such income in the year the tax is incurred. We have elected to account for the impact of GILTI in the period in which it is incurred. For additional details, see Note 17 -
Income Taxes
in our financial statements for the year ended
December 31, 2018
included elsewhere in this 10-K.
Results of Operations
The tables in this section summarize key components of our results of operations for the periods indicated, both in U.S. dollars and as a percentage of our net revenues. Certain percentages presented in this section have been rounded to the nearest whole number. Accordingly, totals may not equal the sum of the line items in the tables below. We reclassified certain immaterial amounts in our statement of operations for the year ended
December 31, 2017
. See Note 1 -
Description of Company and Summary of Significant Accounting Policies
in our consolidated financial statements included elsewhere in this 10-K.
49
Comparison of the
Year Ended
December 31, 2018
to the
Year Ended
December 31, 2017
|
Year Ended
|
|||||||||||||
|
December 31, 2018
|
December 31, 2017
|
||||||||||||
|
(amounts in thousands)
|
% of Net
Revenues
|
% of Net
Revenues
|
|||||||||||
|
Net revenues
|
$
|
4,346,703
|
|
100.0
|
%
|
$
|
3,763,749
|
|
100.0
|
%
|
|||
|
Cost of sales
|
3,422,969
|
|
78.7
|
%
|
2,914,327
|
|
77.4
|
%
|
|||||
|
Gross margin
|
923,734
|
|
21.3
|
%
|
849,422
|
|
22.6
|
%
|
|||||
|
Selling, general and administrative
|
733,748
|
|
16.9
|
%
|
572,458
|
|
15.2
|
%
|
|||||
|
Impairment and restructuring charges
|
17,328
|
|
0.4
|
%
|
13,056
|
|
0.3
|
%
|
|||||
|
Operating income
|
172,658
|
|
4.0
|
%
|
263,908
|
|
7.0
|
%
|
|||||
|
Interest expense, net
|
70,818
|
|
1.6
|
%
|
79,034
|
|
2.1
|
%
|
|||||
|
Other (income) expense
|
(33,737
|
)
|
(0.8
|
)%
|
39,119
|
|
1.0
|
%
|
|||||
|
Income before taxes, equity earnings and discontinued operations
|
135,577
|
|
3.1
|
%
|
145,755
|
|
3.9
|
%
|
|||||
|
Income tax (benefit) expense
|
(7,958
|
)
|
(0.2
|
)%
|
138,603
|
|
3.7
|
%
|
|||||
|
Income from continuing operations, net of tax
|
143,535
|
|
3.3
|
%
|
7,152
|
|
0.2
|
%
|
|||||
|
Equity earnings of non-consolidated entities
|
738
|
|
—
|
%
|
3,639
|
|
0.1
|
%
|
|||||
|
Net income
|
$
|
144,273
|
|
3.3
|
%
|
$
|
10,791
|
|
0.3
|
%
|
|||
Consolidated Results
Net Revenues
– Net revenues increased
$583.0 million
, or
15.5%
, to
$4,346.7 million
in the
year
ended
December 31, 2018
from
$3,763.7 million
in the
year
ended
December 31, 2017
. The increase was due to a
15%
contribution from recent acquisitions and a
1%
increase in core revenue growth. Core growth included a
2%
increase in price, partially offset by a
1%
decrease in volume/mix.
Gross Margin
– Gross margin increased
$74.3 million
, or
8.7%
, to
$923.7 million
in the
year
ended
December 31, 2018
from
$849.4 million
in the
year
ended
December 31, 2017
. Gross margin as a percentage of net revenues was
21.3%
in the
year
ended
December 31, 2018
and
22.6%
in the
year
ended
December 31, 2017
. The increase in gross margin was due to favorable pricing, and the contribution from our recent acquisitions, partially offset by material and freight inflation. The decrease in gross margin as a percentage of sales was due primarily to the dilutive impact of our acquisitions, material and freight inflation, and operational inefficiencies due to lower volumes and favorable mix, partially offset by price.
SG&A Expense
– SG&A expense increased
$161.3 million
, or
28.2%
, to
$733.7 million
in the
year
ended
December 31, 2018
from
$572.5 million
in the
year
ended
December 31, 2017
. SG&A expense as a percentage of net revenues was
16.9%
for the
year
ended
December 31, 2018
and
15.2%
for the
year
ended
December 31, 2017
. The increase in SG&A expense was primarily due to a litigation contingency accrual of
$76.5 million
, SG&A associated with our recent acquisitions and increased professional fees. Excluding the impact of the litigation contingency accrual and SG&A associated with our recent acquisitions, SG&A expense would have been $588.3 million, or 15.4% of net revenues on a comparative basis to 2017.
Impairment and Restructuring Charges
– Impairment and restructuring charges increased
$4.3 million
, or
32.7%
, to
$17.3 million
in the
year
ended
December 31, 2018
from
$13.1 million
in the
year
ended
December 31, 2017
. The 2018 charges consisted primarily of personnel restructuring costs in our North America, Europe and Australasia segments as well as plant consolidations in our North America and Australasia segments. The 2017 charges consisted primarily of a reduction in workforce in our North American segment as well as ongoing restructuring costs in our Europe segment.
Interest Expense, Net
– Interest expense, net, decreased
$8.2 million
, or
10.4%
, to
$70.8 million
in the
year
ended
December 31, 2018
from
$79.0 million
in the
year
ended
December 31, 2017
. The decrease was primarily due to additional interest expense incurred in the prior year resulting from the write-offs of a portion of the unamortized debt issuance costs and original issue discount totaling approximately
$6.1 million
in connection with the repayment of $375.0 million of outstanding term loans with proceeds from our IPO and higher pre-IPO debt levels.
50
Other (Income) Expense
– Other (income) expense increased
$72.9 million
, to income of
$33.7 million
in the
year
ended
December 31, 2018
from expense of
$39.1 million
in the
year
ended
December 31, 2017
. The Other income in the
year
ended
December 31, 2018
was primarily due to a fair value adjustment of
$20.8 million
associated with our acquisition of the remaining shares outstanding of an equity investment, foreign currency income of
$10.2 million
, and legal settlement income of
$7.5 million
, partially offset by pension expense of
$7.0 million
. Other expense in the
year
ended
December 31, 2017
primarily consisted of a loss on extinguishment of debt of
$23.3 million
associated with our Term Loan, pension expense of
$12.6 million
and foreign currency losses of
$10.4 million
, partially offset by a beneficial contract settlement of
$2.2 million
and legal settlement income of
$2.5 million
.
Income Taxes
– Income tax benefit in the
year
ended
December 31, 2018
was
$8.0 million
, compared to expense of
$138.6 million
in the
year
ended
December 31, 2017
. The effective tax rate in the
year
ended
December 31, 2018
was a benefit of
5.9%
compared to an expense of
95.1%
in the
year
ended
December 31, 2017
. The 2018 tax benefit of
$8.0 million
was primarily due to the $40.2 million of deferred tax benefit related to finalizing our provisional estimates connected to the Tax Act, $19.6 million of deferred tax benefit related to the Steves’ litigation, and
$10.2 million
of benefit related to our investment in ABS, offset by tax expense of
$5.4 million
for a net increase to uncertain tax positions including interest, as well as tax expense associated with strong business results of our foreign subsidiaries such as Australia, Canada, and UK. The effective tax rate for the year ended
December 31, 2018
includes the impact of the new GILTI tax. As discussed above, we have elected to account for the impact of GILTI in the period in which it is incurred.
Tax expense for the year ended December 31, 2017 included a provisional estimate of the change in the U.S. corporate income tax rate from 35% to 21% and the one-time deemed repatriation tax. As a result of the lowering of the U.S. federal tax rate, we revalued our net deferred tax assets in the U.S. reflecting the lower expected benefit in the U.S. in the future. This estimate of the revaluation resulted in additional non-cash tax expense totaling approximately $21.1 million. The provisional estimate of the one-time deemed repatriation tax, which effectively subjected the Company’s net aggregate historic foreign earnings to taxation in the U.S., resulted in a further tax charge of $11.3 million. While this repatriation tax is measured as of December 31, 2017, taxpayers are permitted to pay the tax over an 8-year period which resulted in an increase to our non-current liabilities. During the fourth quarter of 2018, the Company undertook certain transactions which premised the repatriation of certain earnings from foreign subsidiaries. While these transactions were not undertaken as a direct result of tax reform, the U.S. tax implications were heavily impacted due to the timing of the transactions and the measurement dates as outlined in the Tax Act. We recorded a provisional estimate of the effects of these transactions resulting in a net increase to tax expense of $65.8 million related to these transactions and their impacts under the Tax Act.
Comparison of the Year Ended
December 31, 2017
to the Year Ended
December 31, 2016
|
December 31, 2017
|
December 31, 2016
|
||||||||||||
|
(dollars in thousands)
|
% of Net
Revenues
|
% of Net
Revenues
|
|||||||||||
|
Net revenues
|
$
|
3,763,749
|
|
100.0
|
%
|
$
|
3,666,942
|
|
100.0
|
%
|
|||
|
Cost of sales
|
2,914,327
|
|
77.4
|
%
|
2,890,894
|
|
78.8
|
%
|
|||||
|
Gross margin
|
849,422
|
|
22.6
|
%
|
776,048
|
|
21.2
|
%
|
|||||
|
Selling, general and administrative
|
572,458
|
|
15.2
|
%
|
552,881
|
|
15.1
|
%
|
|||||
|
Impairment and restructuring charges
|
13,056
|
|
0.3
|
%
|
13,847
|
|
0.4
|
%
|
|||||
|
Operating income
|
263,908
|
|
7.0
|
%
|
209,320
|
|
5.7
|
%
|
|||||
|
Interest expense, net
|
79,034
|
|
2.1
|
%
|
77,590
|
|
2.1
|
%
|
|||||
|
Other expense
|
39,119
|
|
1.0
|
%
|
1,410
|
|
0.0
|
%
|
|||||
|
Income before taxes, equity earnings and discontinued operations
|
145,755
|
|
3.9
|
%
|
130,320
|
|
3.6
|
%
|
|||||
|
Income tax expense (benefit)
|
138,603
|
|
3.7
|
%
|
(246,394
|
)
|
(6.7
|
)%
|
|||||
|
Income from continuing operations, net of tax
|
7,152
|
|
0.2
|
%
|
376,714
|
|
10.3
|
%
|
|||||
|
Equity earnings of non-consolidated entities
|
3,639
|
|
0.1
|
%
|
3,791
|
|
0.1
|
%
|
|||||
|
Loss from discontinued operations, net of tax
|
—
|
|
—
|
%
|
(3,324
|
)
|
(0.1
|
)%
|
|||||
|
Net income
|
$
|
10,791
|
|
0.3
|
%
|
$
|
377,181
|
|
10.3
|
%
|
|||
51
Consolidated Results
Net Revenues
—Net revenues increased $
96.8 million
, or
2.6%
, to
$3,763.7 million
in the year ended
December 31, 2017
from
$3,666.9 million
in the year ended
December 31, 2016
. The increase in net revenues was primarily due to our recent acquisitions which provided a
2%
increase as well as a favorable foreign exchange impact of
1%
. Our core net revenues were unchanged with a
1%
benefit from pricing offset by a
1%
decrease in volume/mix.
Gross Margin
—Gross margin increased
$73.4 million
, or
9.5%
, to
$849.4 million
in the year ended
December 31, 2017
from
$776.0 million
in the year ended
December 31, 2016
. Gross margin as a percentage of net revenues was
22.6%
in the year ended
December 31, 2017
and
21.2%
in the year ended
December 31, 2016
. The increase in gross margin and gross margin percentage was due to favorable pricing, cost savings initiatives and contribution from recent acquisitions, partially offset by operational inefficiencies in our North American windows business.
SG&A Expense
—SG&A expense increased
$19.6 million
, or
3.5%
, to
$572.5 million
in the year ended
December 31, 2017
from
$552.9 million
in the year ended
December 31, 2016
. SG&A expense as a percentage of net revenues was
15.2%
for the year ended
December 31, 2017
and
15.1%
for the year ended
December 31, 2016
. The increase in SG&A expense was primarily due to increased professional fees, costs associated with our IPO and secondary offerings, SG&A expense associated with
acquisitions, and increased wages, partially offset by a decrease in share-based compensation associated with the 2016 Dividend.
Impairment and Restructuring Charges
—Impairment and restructuring charges decreased
$0.8 million
, or
5.7%
, to
$13.1 million
in the year ended
December 31, 2017
from
$13.8 million
in the year ended
December 31, 2016
. The charges in the year ended
December 31, 2017
consisted primarily of a reduction in workforce in our North American segment as well as ongoing restructuring costs in our Europe segment. The charges for the year ended
December 31, 2016
consisted primarily of ongoing personnel restructuring in our Europe and North America segment.
Interest Expense, Net
—Interest expense, net increased
$1.4 million
, or
1.9%
, to an expense of
$79.0 million
in the year ended
December 31, 2017
from an expense of
$77.6 million
in the year ended
December 31, 2016
. The increase was primarily due to interest expense resulting from the write-offs of a portion of the unamortized debt issuance costs and original issue discount totaling approximately
$6.1 million
in connection with the repayment of $375.0 million of outstanding term loans with proceeds from our IPO. In addition, interest expense increased due to higher long-term debt levels for the first month of the period as a result of borrowings of $375.0 million under our Term Loan Facility, partially offset by reductions in the applicable margin which became effective in March 2017 and December 2017.
Other Expense (Income)
– Other expense increased
$37.7 million
, to a
$39.1 million
expense in the year ended
December 31, 2017
from
$1.4 million
in the year ended
December 31, 2016
. The expense in the year ended
December 31, 2017
was primarily a loss on the extinguishment of debt of
$23.3 million
associated with our Term Loan, pension expense of
$12.6 million
, foreign currency losses of
$10.4 million
, partially offset by legal settlement income of
$2.5 million
and contract settlement of
$2.2 million
. The expense in the year ended
December 31, 2016
primarily consisted of pension expense of
$12.7 million
, partially offset by $8.4 million received in a confidential settlement agreement on a commercial matter in our North America segment.
Income Taxes
— On December 22, 2017, the Tax Act was enacted in the U.S. The specific provisions of the Tax Act had both direct and indirect impacts on our 2017 results and will continue to have significant effects on our future performance. The direct impacts were due primarily to the change in the U.S. corporate income tax rate from 35% to 21% for tax years beginning after December 31, 2017 and the one-time deemed repatriation tax. As a result of the lowering of the U.S. federal tax rate, we revalued our net deferred tax assets in the U.S. reflecting the lower expected benefit in the U.S. in the future. This revaluation resulted in additional non-cash tax expense totaling approximately $21.1 million. The one-time deemed repatriation tax, which effectively subjected the Company’s net aggregate historic foreign earnings to taxation in the U.S., resulted in a further tax charge of $11.3 million. While this repatriation tax is measured as of December 31, 2017, taxpayers can pay the tax over an 8-year period resulting in an increase to our non-current liabilities.
During the fourth quarter of 2017, the Company undertook certain transactions which premised the repatriation of certain earnings from foreign subsidiaries. While these transactions were not undertaken as a direct result of tax reform, the U.S. tax implications were heavily impacted due to the timing of the transactions and the measurement dates as outlined in the Tax Act. We recorded a net increase to tax expense of $65.8 million related to these transactions and their impacts under the Tax Act.
While we recorded provisional estimates of the tax impact of the above transactions as of December 31, 2017 based on information available to us, we had not yet completed our full analysis of the net effects of the Tax Act.
52
Income tax benefit in the year ended
December 31, 2017
was
$138.6 million
, compared to a benefit of
$246.4 million
in the year ended
December 31, 2016
. The effective tax rate in the year ended
December 31, 2017
was
95.1%
compared to an effective tax rate of (189.1)% in the year ended
December 31, 2016
. The prior year tax benefit of
$246.4 million
was due primarily to the net release of our valuation allowance of
$236.5 million
Segment Results
We report our segment information in the same way management internally organizes the business in assessing performance and making decisions regarding allocation of resources in accordance with ASC 280-10-
Segment Reporting
. We have determined that we have three reportable segments, organized and managed principally by geographic region. Our reportable segments are North America, Europe and Australasia. We report all other business activities in Corporate and unallocated costs. We define Adjusted EBITDA as net income (loss), adjusted for the following items: loss from discontinued operations, net of tax; equity earnings of non-consolidated entities; income tax (benefit) expense; depreciation and amortization; interest expense, net; impairment and restructuring charges; gain on previously held shares of equity investment; (gain) loss on sale of property and equipment; share-based compensation expense; non-cash foreign exchange transaction/translation (income) loss; other non-cash items; other items; and costs related to debt restructuring and debt refinancing. For additional information on segment Adjusted EBITDA, see Note 18 -
Segment Information
to our consolidated financial statements included in this 10-K.
We reclassified certain immaterial amounts for year ended
December 31, 2017
impacting “Net revenues from external customers - North America” line below to conform to our 2018 presentation. See Note 1 -
Description of Company and Summary of Significant Accounting Policies
in our consolidated financial statements included in this 10-K.
Comparison of the
Year Ended
December 31, 2018
to the
Year Ended
December 31, 2017
|
|
Year Ended
|
|
|||||||||
|
(amounts in thousands)
|
December 31, 2018
|
December 31, 2017
|
|
||||||||
|
Net revenues from external customers
|
% Variance
|
||||||||||
|
North America
|
$
|
2,460,987
|
|
$
|
2,157,898
|
|
14.0
|
%
|
|||
|
Europe
|
1,215,801
|
|
1,042,767
|
|
16.6
|
%
|
|||||
|
Australasia
|
669,915
|
|
563,084
|
|
19.0
|
%
|
|||||
|
Total Consolidated
|
$
|
4,346,703
|
|
$
|
3,763,749
|
|
15.5
|
%
|
|||
|
Percentage of total consolidated net revenues
|
|||||||||||
|
North America
|
56.6
|
%
|
57.3
|
%
|
|||||||
|
Europe
|
28.0
|
%
|
27.7
|
%
|
|||||||
|
Australasia
|
15.4
|
%
|
15.0
|
%
|
|||||||
|
Total Consolidated
|
100.0
|
%
|
100.0
|
%
|
|||||||
|
Adjusted EBITDA
(1)
|
|||||||||||
|
North America
|
$
|
278,975
|
|
$
|
273,594
|
|
2.0
|
%
|
|||
|
Europe
|
129,202
|
|
132,929
|
|
(2.8)
|
%
|
|||||
|
Australasia
|
91,172
|
|
74,706
|
|
22.0
|
%
|
|||||
|
Corporate and unallocated costs
|
(34,003
|
)
|
(43,616
|
)
|
(22.0)
|
%
|
|||||
|
Total Consolidated
|
$
|
465,346
|
|
$
|
437,613
|
|
6.3
|
%
|
|||
|
Adjusted EBITDA as a percentage of segment net revenues
|
|||||||||||
|
North America
|
11.3
|
%
|
12.7
|
%
|
|||||||
|
Europe
|
10.6
|
%
|
12.7
|
%
|
|||||||
|
Australasia
|
13.6
|
%
|
13.3
|
%
|
|||||||
|
Total Consolidated
|
10.7
|
%
|
11.6
|
%
|
|||||||
|
(1)
|
Adjusted EBITDA is a financial measure that is not calculated in accordance with GAAP. For a discussion of our presentation of Adjusted EBITDA, see Note 18 -
Segment Information in our consolidated financial statements
|
53
North America
Net revenues in North America increased
$303.1 million
, or
14.0%
, to
$2,461.0 million
in the
year
ended
December 31, 2018
from
$2,157.9 million
in the
year
ended
December 31, 2017
. The increase was primarily due to a
14%
increase attributable to the acquisitions of MMI Door and ABS.
Adjusted EBITDA in North America increased
$5.4 million
, or
2.0%
, to
$279.0 million
in the
year
ended
December 31, 2018
from
$273.6 million
in the
year
ended
December 31, 2017
. The increase was primarily due to the MMI Door and ABS acquisitions partially offset by the impact of a lag in pricing to offset inflation in material and freight and lower core volumes and mix shift to lower margin products.
Europe
Net revenues in Europe increased
$173.0 million
, or
16.6%
, to
$1,215.8 million
in the
year
ended
December 31, 2018
from
$1,042.8 million
in the
year
ended
December 31, 2017
. The increase was primarily due to a
13%
increase attributable to the acquisitions of Mattiovi and Domoferm, core revenue growth of
1%
, and a favorable foreign exchange impact of
3%
.
Adjusted EBITDA in Europe decreased
$3.7 million
, or
2.8%
, to
$129.2 million
in the
year
ended
December 31, 2018
from
$132.9 million
in the
year
ended
December 31, 2017
. The decrease was primarily due to inflation and unfavorable product mix, partially offset by favorable pricing and our acquisitions of Mattiovi and Domoferm.
Australasia
Net revenues in Australasia increased
$106.8 million
, or
19.0%
, to
$669.9 million
in the
year
ended
December 31, 2018
from
$563.1 million
in the
year
ended
December 31, 2017
. The increase was due primarily to a
20%
increase attributable to the acquisitions of Kolder and A&L, core revenue growth of
2%
, consisting of an increase in volume/mix of
1%
and favorable pricing of
1%
, offset by unfavorable foreign exchange rates of
3%
.
Adjusted EBITDA in Australasia increased
$16.5 million
, or
22.0%
, to
$91.2 million
in the
year
ended
December 31, 2018
from
$74.7 million
in the
year
ended
December 31, 2017
. The increase was primarily due to the acquisitions of Kolder and A&L and pricing initiatives, partially offset by material inflation.
54
Comparison of the Year Ended
December 31, 2017
to the Year Ended
December 31, 2016
|
|
Year Ended
|
|
|||||||||
|
(dollars in thousands)
|
December 31, 2017
|
December 31, 2016
|
|||||||||
|
Net revenues from external customers
|
% Variance
|
||||||||||
|
North America
|
$
|
2,157,898
|
|
$
|
2,149,311
|
|
0.4
|
%
|
|||
|
Europe
|
1,042,767
|
|
1,008,729
|
|
3.4
|
%
|
|||||
|
Australasia
|
563,084
|
|
508,902
|
|
10.6
|
%
|
|||||
|
Total Consolidated
|
$
|
3,763,749
|
|
$
|
3,666,942
|
|
2.6
|
%
|
|||
|
Percentage of total consolidated net revenues
|
|||||||||||
|
North America
|
57.3
|
%
|
58.6
|
%
|
|||||||
|
Europe
|
27.7
|
%
|
27.5
|
%
|
|||||||
|
Australasia
|
15.0
|
%
|
13.9
|
%
|
|||||||
|
Total Consolidated
|
100.0
|
%
|
100.0
|
%
|
|||||||
|
Adjusted EBITDA
(1)
|
|||||||||||
|
North America
|
$
|
273,594
|
|
$
|
251,831
|
|
8.6
|
%
|
|||
|
Europe
|
132,929
|
|
122,574
|
|
8.4
|
%
|
|||||
|
Australasia
|
74,706
|
|
59,519
|
|
25.5
|
%
|
|||||
|
Corporate and Unallocated costs
|
(43,616
|
)
|
(40,242
|
)
|
8.4
|
%
|
|||||
|
Total Consolidated
|
$
|
437,613
|
|
$
|
393,682
|
|
11.2
|
%
|
|||
|
Adjusted EBITDA as a percentage of segment net revenues
|
|||||||||||
|
North America
|
12.7
|
%
|
11.7
|
%
|
|||||||
|
Europe
|
12.7
|
%
|
12.2
|
%
|
|||||||
|
Australasia
|
13.3
|
%
|
11.7
|
%
|
|||||||
|
Total Consolidated
|
11.6
|
%
|
10.7
|
%
|
|||||||
|
(1)
|
Adjusted EBITDA is a financial measure that is not calculated in accordance with GAAP. For a discussion of our presentation of Adjusted EBITDA, see Note 18 -
Segment Information
in our consolidated financial statements.
|
North America
Net revenues in North America increased
$8.6 million
, or
0.4%
, to
$2,157.9 million
in the year ended
December 31, 2017
from
$2,149.3 million
in the year ended
December 31, 2016
. The increase in net revenues was primarily due to the acquisition of MMI Door which provided a
2%
increase. This was partially offset by a decrease in core net revenues of
1%
comprised of favorable pricing of
2%
, offset by a decrease in volume/mix of
3%
. The decrease in volume/mix was primarily driven by activity in our retail channel, including the impact of the previously announced business line rationalization in Florida and reduced volume in our windows business.
Adjusted EBITDA in North America increased
$21.8 million
, or
8.6%
, to
$273.6 million
in the year ended
December 31, 2017
from
$251.8 million
in the year ended
December 31, 2016
. The increase in Adjusted EBITDA was due to the acquisition of MMI Door, as well as favorable pricing and cost saving initiatives, partially offset by operational inefficiencies in our windows business.
Europe
Net revenues in Europe increased
$34.0 million
, or
3.4%
, to
$1,042.8 million
in the year ended
December 31, 2017
from
$1,008.7 million
in the year ended
December 31, 2016
. The increase in net revenues was primarily due to an increase in core net revenues of
2%
which was comprised of an increase in volume/mix of approximately
1%
and favorable pricing of approximately
1%
. The acquisition of Mattiovi provided an additional
1%
increase.
Adjusted EBITDA in Europe increased
$10.4 million
, or
8.4%
, to
$132.9 million
in the year ended
December 31, 2017
from
$122.6 million
in the year ended
December 31, 2016
. The increase in Adjusted EBITDA was primarily due to the additional shipping days in the first quarter of 2017, favorable pricing, our Mattiovi acquisition and our cost saving initiatives.
55
Australasia
Net revenues in Australasia increased
$54.2 million
, or
10.6%
, to
$563.1 million
in the year ended
December 31, 2017
from
$508.9 million
in the year ended
December 31, 2016
. The increase in net revenues was primarily due to the acquisitions of Trend, Breezway and Kolder which provided a
7%
increase in net revenues. Core net revenues increased
1%
, primarily due to favorable pricing of
1%
. Favorable foreign exchange rates added an additional
3%
increase in net revenues.
Adjusted EBITDA in Australasia increased
$15.2 million
, or
25.5%
, to
$74.7 million
in the year ended
December 31, 2017
from
$59.5 million
in the year ended
December 31, 2016
. The increase in Adjusted EBITDA was primarily due to the acquisitions of Trend, Breezway and Kolder as well as our pricing initiatives, and favorable foreign exchange impact.
Liquidity and Capital Resources
Overview
We have historically funded our operations through a combination of cash from operations, draws on our revolving credit facilities, and the issuance of non-revolving debt such as our Term Loan Facility and Senior Notes. Working capital, which we define as accounts receivable plus inventory less accounts payable, fluctuates throughout the year and is affected by the seasonality of sales of our products, customer payment patterns, and the translation of the balance sheets of our foreign operations into the U.S. dollar, which is our reporting currency. Typically, working capital increases at the end of the first quarter and beginning of the second quarter in conjunction with, and in preparation for, the peak season for home construction and remodeling in our North America and Europe segments, which represent the substantial majority of our revenues, and working capital decreases starting in the fourth quarter as inventory levels and accounts receivable decline. Inventories fluctuate for some raw materials with long delivery lead times, such as steel, as we work through prior shipments and take delivery of new orders.
As of
December 31, 2018
, we had total liquidity (a non-GAAP measure) of
$380.2 million
, which included
$117.0 million
in unrestricted cash,
$208.6 million
available for borrowing under the ABL Facility, AUD
$15.0 million
(
$10.6 million
) available for borrowing under the Australia Senior Secured Credit Facility, and €
38.4 million
(
$44.0 million
) available for borrowing under the Euro Revolving Facility, which we let expire in January 2019. This compares to total liquidity of
$512.2 million
as of
December 31, 2017
. The decrease in total liquidity at
December 31, 2018
was primarily due to cash used to repurchase our shares, increased capital expenditures and cash paid for acquisitions.
As of
December 31, 2018
, our cash balances, including
$0.6 million
of restricted cash, consisted of
$23.7 million
in the U.S. and
$93.9 million
in non-U.S. subsidiaries. Based on our current level of operations, the seasonality of our business and anticipated growth, we believe that cash provided by operations and other sources of liquidity, including cash, cash equivalents and borrowings under our revolving credit facilities, will provide adequate liquidity for ongoing operations, planned capital expenditures and other investments, and debt service requirements for at least the next twelve months.
We may, from time to time, refinance, reprice, extend, retire or otherwise modify our outstanding debt to lower our interest payments, reduce our debt or otherwise improve our financial position. These actions may include repricing amendments, extensions, and/or opportunistic refinancing of debt. The amount of debt that may be refinanced, re-priced, extended, retired or otherwise modified, if any, will depend on market conditions, trading levels of our debt, our cash position, compliance with debt covenants and other considerations. Our affiliates may also purchase our debt from time to time, through open market purchases or other transactions. In such cases, our debt may not be retired, in which case we would continue to pay interest in accordance with the terms of the debt, and we would continue to reflect the debt as outstanding in our consolidated balance sheets.
A hypothetical increase or decrease in interest rates of 1.0% (based on variable rate debt if our revolving credit facilities were fully drawn) would have increased or decreased our interest expense by
$9.7 million
for the
year
ended
December 31, 2018
.
56
Borrowings and Refinancings
In November 2016, we borrowed an additional $375.0 million under the Corporate Credit Facilities primarily to fund distributions to our shareholders and in February 2017, we repaid $375.0 million under our Corporate Credit Facilities. In March 2017, we amended the Term Loan Facility to reduce the interest rate applicable to all outstanding terms loans. In December 2017, we issued $800.0 million of unsecured Senior Notes, re-priced and amended the Term Loan Facility, and repaid $787.4 million of outstanding term loan borrowings with the net proceeds from the Senior Notes. The December 2017 refinancing transactions reduced our overall interest rates and modified other terms and provisions, including providing for additional covenant flexibility and additional capacity under the Term Loan Facility. Our results have been and will continue to be impacted by substantial changes in our net interest expense throughout the periods presented and in the future. In December 2018, we amended the ABL Facility, providing for a $100.0 million increase in the U.S. revolving credit commitments. In February 2018, we amended the Australia Senior Secured Credit Facility to include an additional AUD $55.0 million floating rate term loan facility. See Note 15 -
Long-Term Debt
in our consolidated financial statements for additional details.
Cash Flows
The following table summarizes the changes to our cash flows for the years ended December 31,:
|
(amounts in thousands)
|
2018
|
2017
|
2016
|
|||||||||
|
Cash provided by (used in):
|
||||||||||||
|
Operating activities
|
$
|
219,653
|
|
$
|
265,793
|
|
$
|
201,655
|
|
|||
|
Investing activities
|
(284,141
|
)
|
(189,793
|
)
|
(156,782
|
)
|
||||||
|
Financing activities
|
(67,475
|
)
|
64,090
|
|
(52,001
|
)
|
||||||
|
Effect of changes in exchange rates on cash and cash equivalents
|
(6,648
|
)
|
12,692
|
|
(3,697
|
)
|
||||||
|
Net change in cash and cash equivalents
|
$
|
(138,611
|
)
|
$
|
152,782
|
|
$
|
(10,825
|
)
|
|||
Cash Flow from Operations
Net cash provided by operating activities decreased
$46.1 million
to
$219.7 million
in the
year
ended
December 31, 2018
from
$265.8 million
in net cash provided by operating activities in the
year
ended
December 31, 2017
. The decrease in cash provided by operating activities resulted primarily from increased accounts receivable due to increased sales volume and changes in terms with customers, increases in inventory associated with our recent acquisitions and stock build program and to ensure adequate raw material availability, and a decrease in accounts payable.
Net cash provided by operating activities increased
$64.1 million
to
$265.8 million
in the
year
ended
December 31, 2017
from
$201.7 million
in the
year
ended
December 31, 2016
. This increase was primarily due to improved profitability and the impact of acquisitions, partially offset by increased inventory levels.
Cash Flow from Investing Activities
Net cash used in investing activities increased
$94.3 million
to
$284.1 million
in the
year
ended
December 31, 2018
from
$189.8 million
in the
year
ended
December 31, 2017
. The increase was primarily due to cash used for acquisitions and capital expenditures compared to the prior period.
Net cash used in investing activities increased
$33.0 million
to
$189.8 million
in the
year
ended
December 31, 2017
from
$156.8 million
in the
year
ended
December 31, 2016
. The increase was primarily due to acquisitions during the year, partly offset by reduction in capital expenditures compared to the prior period due to the completion of the glass plant in Australia in January 2017.
Cash Flow from Financing Activities
Net cash used in financing activities was
$67.5 million
in the
year
ended
December 31, 2018
and was comprised primarily of repurchases of our common stock of
$125.0 million
and payments to tax authorities for employee share-based compensation of
$9.5 million
, offset by increased borrowings of
$70.5 million
,
Net cash provided by financing activities in the
year
ended
December 31, 2017
was
$64.1 million
and comprised primarily of proceeds from the IPO of
$480.3 million
of which $375.0 million of proceeds were used to partially repay outstanding debt.
57
Net cash used in financing activities in the
year
ended
December 31, 2016
was
$52.0 million
and was comprised primarily of
$404.2 million
of distributions to shareholders,
$16.1 million
of short-term and long-term debt borrowings, and
$8.1 million
of debt issuance costs payments, partially offset by
$374.1 million
of net proceeds from issuance of new debt as well as
$2.3 million
in employee note repayment.
Holding Company Status
We are a holding company that conducts all of our operations through subsidiaries. The majority of our operating income is derived from JWI, our main operating subsidiary. Consequently, we rely on dividends or advances from our subsidiaries. The ability of our subsidiaries to pay dividends to us is subject to applicable local law and may be limited due to the terms of other contractual arrangements, including our Credit Facilities and the Senior Notes.
The Australia Senior Secured Credit Facility also contain restrictions on dividends that limit the amount of cash that the obligors under these facilities can distribute to JWI. Obligors under the Australia Senior Secured Credit Facility may pay dividends only to the extent they do not exceed 80% of after tax net profits (with a one-year carryforward of unused amounts) and only while no default is continuing under such agreement. For further information regarding the Australia Senior Secured Credit Facility, see Note 15 -
Long-Term Debt
in our consolidated financial statements.
The amount of our consolidated net assets that were available to be distributed under our credit facilities as of
December 31, 2018
was
$457.6 million
.
Off-Balance Sheet Arrangements
We do not have any off-balance sheet arrangements that have or are reasonably likely to have a current or future material effect on our financial condition, changes in financial condition, revenues or expenses, results of operations, liquidity, capital expenditures, or capital resources.
Contractual Obligations
The following table summarizes our significant contractual obligations at
December 31, 2018
:
|
Payments Due By Period
|
||||||||||||||||||||
|
Total
|
Less Than
1 Year
|
1-3 Years
|
3-5 Years
|
More Than
5 Years
|
||||||||||||||||
|
(dollars in thousands)
|
||||||||||||||||||||
|
Contractual Obligations
(1)
|
||||||||||||||||||||
|
Long-term debt obligations
|
$
|
1,378,978
|
|
$
|
9,590
|
|
$
|
12,138
|
|
$
|
132,041
|
|
$
|
1,225,209
|
|
|||||
|
Capital lease obligations
|
98,914
|
|
45,752
|
|
22,737
|
|
6,174
|
|
24,251
|
|
||||||||||
|
Operating lease obligations
|
201,122
|
|
49,128
|
|
74,679
|
|
43,372
|
|
33,943
|
|
||||||||||
|
Purchase obligations
(2)
|
9,009
|
|
6,475
|
|
2,534
|
|
—
|
|
—
|
|
||||||||||
|
Interest on long-term debt obligations
(3)
|
450,692
|
|
64,156
|
|
127,626
|
|
121,986
|
|
136,924
|
|
||||||||||
|
Totals:
|
$
|
2,138,715
|
|
$
|
175,101
|
|
$
|
239,714
|
|
$
|
303,573
|
|
$
|
1,420,327
|
|
|||||
____________________________
|
(1)
|
Not included in the table above are our unfunded pension liabilities totaling
$112.8 million
and uncertain tax position liabilities of
$19.0 million
as of
December 31, 2018
, for which the timing of payment is unknown.
|
|
(2)
|
Purchase obligations are defined as purchase agreements that are enforceable and legally binding and that specify all significant terms, including quantity, price, and the approximate timing of the transaction. The obligations reflected in the table relates primarily to raw materials purchase agreements and software hosting services.
|
|
(3)
|
Interest on long-term debt obligations is calculated based on debt outstanding and interest rates in effect on
December 31, 2018
, taking into account scheduled maturities and amortization payments.
|
Critical Accounting Policies and Estimates
Our MD&A is based upon our consolidated financial statements, which have been prepared in accordance with GAAP. The preparation of these consolidated financial statements requires us to make estimates and judgments that affect the reported amounts of
58
assets, liabilities, revenues and expenses, and related disclosure of contingent assets and liabilities. On an ongoing basis, we evaluate our estimates. We base our estimates on historical experience and on various other assumptions that are believed to be reasonable under the circumstances, the results of which may differ from these estimates. Our significant accounting policies are fully disclosed in our annual consolidated financial statements included elsewhere in this Form 10-K. The following discussion highlights the estimates we believe are critical and should be read in conjunction with the consolidated financial statements included in Part II, Item 8 of this Form 10-K.
Revenue Recognition
Revenue is recognized when obligations under the terms of a contract with our customer are satisfied. Generally, this occurs with the transfer of control of our products or services. Revenue is measured as the amount of consideration we expect to receive in exchange for transferring goods or providing services. The taxes we collect concurrent with revenue-producing activities (e.g., sales tax, value added tax, and other taxes) are excluded from revenue. Incentive payments to customers that directly relate to future business are recorded as a reduction of net revenues over the periods benefited.
Shipping and handling costs and the related expenses are reported as fulfillment revenues and expenses for all customers. Therefore all shipping and handling costs associated with outbound freight are accounted for as fulfillment costs and are included in cost of sales. The expected costs associated with our base warranties and field service actions continue to be recognized as expense when the products are sold (see Note 14 -
Warranty Liabilities
). Since payment is due at or shortly after the point of sale, the contract asset is classified as a receivable.
We do not adjust the promised amount of consideration for the effects of a significant financing component when we expect, at contract inception, that the period between our transfer of a promised product or service to a customer and when the customer pays for that product or service will be one year or less. We do not typically include extended payment terms in our contracts with customers. Incidental items that are immaterial in the context of the contract are recognized as expense.
Acquisitions
We allocate the fair value of purchase consideration to the tangible assets acquired, liabilities assumed and intangible assets acquired based on their acquisition date fair values. Goodwill as of the acquisition date is measured as the excess of consideration transferred over the net of the acquisition date fair values of the assets acquired and the liabilities assumed. If the fair value of the acquired assets exceeds the purchase price the difference is recorded as a bargain purchase in other income (expense). Such valuations require us to make significant estimates and assumptions, especially with respect to intangible assets. As a result, during the measurement period, which may be up to one year from the acquisition date, material adjustments must be reflected in the comparative consolidated financial statements in the period in which the adjustment amount will be determined. Upon the conclusion of the measurement period or final determination of the values of assets acquired or liabilities assumed, whichever comes first, any subsequent adjustments are recorded to our consolidated statements of operations. Newly acquired entities are included in our results from the date of their respective acquisitions.
Allowance for Doubtful Accounts
Substantially all accounts receivable arise from sales to customers in our manufacturing and distribution businesses and are recognized net of offered cash discounts. Credit is extended in the normal course of business under standard industry terms that normally reflect 60 day or less payment terms and do not require collateral. An allowance is recorded based on a variety of factors, including the length of time receivables are past due, the financial health of our customers, unusual macroeconomic conditions and historical experience. If the customer’s financial conditions were to deteriorate resulting in the inability to make payments, additional allowances may need to be recorded which would result in additional expenses being recorded for the period in which such determination was made.
Inventories
Inventories are valued at the lower of cost or market or net realizable value and are determined by the FIFO or average cost methods. We record provisions to write-down obsolete and excess inventory to estimated net realizable value. The process for evaluating obsolete and excess inventory requires us to make subjective judgments and estimates concerning future sales levels, quantities and prices at which such inventory will be able to be sold in the normal course of business. Accelerating the disposal process or incorrect estimates of future sales potential may cause actual results to differ from the estimates at the time such inventory is disposed or sold.
59
Intangible Assets
Definite lived intangible assets are amortized on a straight-line basis over their estimated useful lives that typically range from 5 to 40 years. The lives of definite lived intangible assets are reviewed and reduced if necessary whenever changes in their planned use occur. Legal and registration costs related to internally developed patents and trademarks are capitalized and amortized over the lesser of their expected useful life or the legal patent life. We review the carrying value of intangible assets to assess their recoverability when facts and circumstances indicate that the carrying value may not be recoverable.
Long-Lived Assets
Long-lived assets, other than goodwill, are reviewed for impairment whenever events or changes in circumstances indicate the carrying amount of such assets may not be recoverable. Such events or circumstances include, but are not limited to, a significant decrease in the fair value of the underlying business or a change in utilization of property and equipment.
We group assets to test for impairment at the lowest level for which identifiable cash flows are largely independent of the cash flows of other groups of assets and liabilities. Recoverability of assets to be held and used is measured by a comparison of the carrying amount of an asset to estimated undiscounted future cash flows expected to be generated by the assets.
When evaluating long-lived assets and definite lived intangible assets for potential impairment, the first step to review for impairment is to forecast the expected undiscounted cash flows generated from the anticipated use and eventual disposition of the asset. If the expected undiscounted cash flows are less than the carrying value of the asset, then an impairment charge is required to reduce the carrying value of the asset to fair value. If we recognize an impairment loss, the carrying amount of the asset is adjusted to fair value based on the discounted estimated future net cash flows. For a depreciable long-lived asset, the new cost basis will be depreciated over the remaining useful life of that asset. For an amortizable intangible asset, the new cost basis will be amortized over the remaining useful life of the asset. Our impairment loss calculations require management to apply judgments in estimating future cash flows to determine asset fair values, including forecasting useful lives of the assets and selecting the discount rate that represents the risk inherent in future cash flows.
Goodwill
Goodwill is tested for impairment on an annual basis during the fourth quarter and between annual tests if indicators of potential impairment exist, using a fair-value-based approach. Current accounting guidance provides an entity the option to perform a qualitative assessment to determine whether it is more likely than not that the fair value of a reporting unit is less than its carrying amount prior to performing the two-step goodwill impairment test. If this is the case, the two-step goodwill impairment test is required. If it is more likely than not that the fair value of a reporting unit is greater than its carrying amount, the two-step goodwill impairment test is not required.
If the two-step goodwill impairment test is required, first, the fair value of the reporting unit is compared with its carrying amount (including attributable goodwill). If the fair value of the reporting unit exceeds its carrying amount, step two does not need to be performed. If the fair value of the reporting unit is less than its carrying amount, an indication of goodwill impairment exists for the reporting unit and the entity must perform step two of the impairment test (measurement). Under step two, an impairment loss is recognized for any excess of the carrying amount of the reporting unit’s goodwill over the implied fair value of that goodwill. The implied fair value of goodwill is determined by allocating the fair value of the reporting unit in a manner similar to a purchase price allocation and the residual fair value after this allocation is the implied fair value of the reporting unit goodwill. Fair value of the reporting unit is determined using a discounted cash flow analysis.
We estimated the fair value of our reporting units using a discounted cash flow model (implied fair value measured on a non-recurring basis using level 3 inputs). Inherent in the development of the discounted cash flow projections are assumptions and estimates of our future revenue growth rates, profit margins, business plans, cost of capital and tax rates. Our judgments with respect to these metrics are based on historical experience, current trends, consultations with external specialists, and other information. Changes in assumptions or estimates used in our goodwill impairment testing could materially affect the determination of the fair value of a reporting unit, and therefore, could eliminate the excess of fair value over carrying value of a reporting unit and, in some cases, could result in impairment. Such changes in assumptions could be caused by items such as a loss of one or more significant customers, decline in the demand for our products due to changing economic conditions or failure to control cost increases above what can be recouped in sale price increases. These types of changes would negatively affect our profits, revenues and growth over the long term and such a decline could significantly affect the fair value assessment of our reporting units and cause our goodwill to become impaired.
As of
December 31, 2018
, the fair value of our North America, Europe and Australasia reporting units would have to decline by approximately 16%, 53% and 57%, respectively, to be considered for potential impairment.
60
As the carrying value and fair value of the North America reporting unit are closely aligned, a material change in the fair value or carrying value would put the reporting unit at risk of goodwill impairment. For example, our ability to realize synergies, revenue growth, and increased margins are key assumptions in our projections of revenue, earnings and cash flows. If our actual experience in future years falls significantly below our current projections, the fair value of the reporting unit could be negatively impacted. Similarly, an increase in interest rates would lower our discounted cash flows and negatively impact the fair value of the reporting unit. We believe our projections and assumptions are reasonable, but it is possible they could change, impacting our fair value estimate, or the carrying value could change.
Warranty Accrual
Warranty terms range primarily from one year to lifetime on certain window and door components. Warranties are normally limited to replacement or service of defective components for the original customer. Some warranties are transferable to subsequent owners and are generally limited to ten years from the date of manufacture or require pro-rata payments from the customer. A provision for estimated warranty costs is recorded at the time of sale based on historical experience and we periodically adjust these provisions to reflect actual experience.
Income Taxes
Income taxes are accounted for under the asset and liability method. Deferred tax assets and liabilities are recognized for the future tax consequences attributable to differences between the financial statement carrying amounts of existing assets and liabilities and their respective tax bases and operating loss and tax credit carryforwards. Deferred tax assets and liabilities are measured using enacted tax rates expected to apply to taxable income in the years in which those temporary differences are expected to be recovered or settled. The effect on the deferred tax assets and liabilities of a change in tax rates is recognized in income in the period that includes the enactment date. We evaluate both the positive and negative evidence that is relevant in assessing whether we will realize the deferred tax assets. A valuation allowance is recorded when it is more likely than not that some of the deferred tax assets will not be realized. This projected realization is directly related to our future projections of the performance of our business and management’s planning initiatives at any point in time. As a result, valuation allowances are subject to change as proven business trends and planning initiatives develop.
The Tax Act passed in December 2017 had significant effects on our financial statements. In accordance with Staff Accounting Bulletin No.118 issued by the SEC in December 2017 immediately following the passage of the Tax Act, we made provisional estimates for certain direct and indirect effects of the Tax Act based on information available to us for the year ended December 31, 2017. In the fourth quarter of 2018, we completed our accounting for all of the enactment-date income tax effects of the Tax Act and recorded any adjustments as a component of income tax expense from continuing operations. The Tax Act subjects a U.S. shareholder to current tax on GILTI earned by certain foreign subsidiaries. The FASB Staff Q&A, Topic 740, No. 5, Accounting for Global Intangible Low-Taxed Income, states that we are permitted to make an accounting policy election to either recognize deferred taxes for temporary basis differences expected to reverse as GILTI in future years or provide for the tax expense related to such income in the year the tax is incurred. We have elected to account for the impact of GILTI in the period in which it is incurred.
The tax effects from an uncertain tax position can be recognized in the consolidated financial statements only if the position is more likely than not to be sustained, based on the technical merits of the position and the jurisdiction. We recognize the financial statement benefit of a tax position only after determining that the relevant tax authority would more likely than not sustain the position following an audit and the tax related to the position would be due to the entity and not the owners. For tax positions meeting the more likely than not threshold, the amount recognized in the consolidated financial statements is the largest benefit that has a greater than 50 percent likelihood of being realized, upon ultimate settlement with the relevant tax authority. We apply this accounting standard to all tax positions for which the statute of limitations remains open. Changes in recognition or measurement are reflected in the period in which the change in judgment occurs.
We file a consolidated federal income tax return in the U.S. and various states. For financial statement purposes, we calculate the provision for federal income taxes using the separate return method. Certain subsidiaries file separate tax returns in certain countries and states. Any U.S. federal, state and foreign income taxes refundable and payable are reported in other current assets and accrued income taxes payable in the consolidated balance sheets as of December 31, 2018 and in deferred credits and other liabilities as of December 31, 2017. The income taxes refundable and payable relating to the U.S. federal transition tax is reported in other assets in our consolidated balance sheets. We record interest and penalties on amounts due to tax authorities as a component of income tax expense in the consolidated statements of operations.
61
Derivative Financial Instruments
We utilize derivative financial instruments to manage foreign currency exposures related to subsidiaries that operate outside the U.S. and use their local currency as the functional currency. We record all derivative instruments in the consolidated balance sheets at fair value. Changes in a derivative’s fair value are recognized in earnings unless specific hedge criteria are met and we elect hedge accounting prior to entering into the derivative. If a derivative is designated as a fair value hedge, the changes in fair value of both the derivative and the hedged item attributable to the hedged risk are recognized in the results of operations. If the derivative is designated as a cash flow hedge, changes in the fair value of the derivative are recorded in consolidated other comprehensive income (loss) and subsequently classified to the consolidated statements of operations when the hedged item impacts earnings. At the inception of a fair value or cash flow hedge transaction, we formally document the hedge relationship and the risk management objective for undertaking the hedge. In addition, we assess both at inception of the hedge and on an ongoing basis, whether the derivative in the hedging transaction has been highly effective in offsetting changes in fair value or cash flows of the hedged item and whether the derivative is expected to continue to be highly effective. The impact of any ineffectiveness is recognized in our consolidated statements of operations.
Contingent Liabilities
Contingent liabilities require significant judgment in estimating potential losses for legal claims. Each quarter, we review significant new claims and litigation for the probability of an adverse outcome. Estimates are recorded as liabilities when it is probable that a liability has been incurred and the amount of the loss is reasonably estimable. Disclosure is required when there is a reasonable possibility that the ultimate loss will materially exceed the recorded provision. Contingent liabilities are often resolved over long time periods. Estimating probable losses requires analysis of multiple forecasts that often depend on judgments about potential actions by third parties such as regulators, and the estimated loss can change materially as individual claims develop.
Share-based Compensation Plan
We have share-based compensation plans that provide for compensation to employees through various grants of share-based instruments. We apply the fair value method of accounting using the Black-Scholes option pricing model to determine the compensation expense for stock appreciation rights. The compensation expense for RSU awarded is based on the fair value of the RSU at the date of grant. Compensation expense is recorded in the consolidated statements of operations and is recognized over the requisite service period. The determination of obligations and compensation expense requires the use of several mathematical and judgmental factors, including stock price, expected volatility, the anticipated life of the option, and estimated risk-free rate and the number of shares or share options expected to vest. Any difference in the number of shares or share options that actually vest can affect future compensation expense. Other assumptions are not revised after the original estimate. For stock options granted, we prepare the valuations with the assistance of a third-party valuation firm, utilizing approaches and methodologies consistent with the AICPA Practice Aid.
The Black-Scholes option-pricing model requires the use of weighted average assumptions for estimated expected volatility, estimated expected term of stock options, risk-free rate, estimated expected dividend yield, and the fair value of the underlying common stock at the date of grant. We estimate the expected term of all stock options based on previous history of exercises. The risk-free rate is based on the U.S. Treasury yield curve in effect at the time of grant for the expected term of the stock option. The expected dividend yield rate is 0.00% which is consistent with the expected dividends to be paid on common stock. We estimate forfeitures based on our historical analysis of actual stock option forfeitures. Actual forfeitures are recorded when incurred and estimated forfeitures are reviewed and adjusted at least annually.
Employee Retirement and Pension Benefits
The obligations under our defined benefit pension plans are calculated using actuarial models and methods. The most critical assumption and estimate used in the actuarial calculations is the discount rate for determining the current value of benefit obligations. Other assumptions and estimates used in determining benefit obligations and plan expenses include expected return on plan assets, inflation rates, and demographic factors such as retirement age, mortality, and turnover. These assumptions and estimates are evaluated periodically and are updated accordingly to reflect our actual experience and expectations.
The discount rate used to determine the benefit obligations was computed through a projected benefit cash flow model. This approach determines the discount rate as the rate that equates the present value of the cash flows (determined using that single rate) to the present value of the cash flows where each cash flows' present value is determined using the spot rates from the Willis Towers Watson RATE: Link 10:90 Yield Curve.
The discount rate utilized to calculate the projected benefit obligation at the measurement date for our U.S. pension plan increased to
4.27%
at
December 31, 2018
from 3.47% at
December 31, 2017
. As the discount rate is reduced or increased, the pension
62
and post retirement obligation would increase or decrease, respectively, and future pension and post-retirement expense would increase or decrease, respectively. Lowering the discount rate by 0.25% would increase the U.S. pension and post-retirement obligation at
December 31, 2018
by approximately $12.6 million and would increase estimated fiscal year 2019 expense by approximately $1.2 million. Increasing the discount rate by 0.25% would decrease the U.S. pension and post-retirement obligation at
December 31, 2018
by approximately $11.9 million and would decrease estimated fiscal year 2019 expense by approximately $1.3 million.
We determine the expected long-term rate of return on plan assets based on the plan assets’ historical long-term investment performance, current asset allocation, and estimates of future long-term returns by asset class. Holding all other assumptions constant, a 1% increase or decrease in the assumed rate of return on plan assets would have decreased or increased, respectively, 2019 net periodic pension expense by approximately $3.0 million.
The actuarial assumptions we use in determining our pension benefits may differ materially from actual results because of changing market and economic conditions, higher or lower withdrawal rates, or longer or shorter life spans of participants. While we believe that the assumptions used are appropriate, differences in actual experience or changes in assumptions might materially affect our financial position or results of operations.
Capital Expenditures
We expect that the majority of our capital expenditures will be focused on supporting our cost reduction and efficiency improvement projects, certain growth initiatives, and to a lesser extent, on sustaining our current manufacturing operations. We are subject to health, safety, and environmental regulations that may require us to make capital expenditures to ensure our facilities are compliant with those various regulations
.
Item 7A - Quantitative and Qualitative Disclosures About Market Risk
We are exposed to various types of market risks, including the effects of adverse fluctuations in foreign currency exchange rates, adverse changes in interest rates, and adverse movements in commodity prices for products we use in our manufacturing. To reduce our exposure to these risks, we maintain risk management controls and policies to monitor these risks and take appropriate actions to attempt to mitigate such forms of market risk.
Exchange Rate Risk
We have global operations and therefore enter into transactions denominated in various foreign currencies. To mitigate cross-currency transaction risk, we analyze significant forecast exposures where we expect receipts or payments in a currency other than the functional currency of our operations, and from time to time we may strategically enter into short-term foreign currency forward contracts to lock in some or all of the cash flows associated with these transactions. We also are subject to currency translation risk associated with converting our foreign operations’ financial statements into U.S. dollars. We use short-term foreign currency forward contracts and hedges to mitigate the impact of foreign exchange fluctuations on consolidated earnings. We use foreign currency derivative contracts, with a total notional amount of
$127.3 million
, in order to manage the effect of exchange fluctuations on forecasted sales, purchases, acquisitions, inventory and capital expenditures and certain intercompany transactions that are denominated in foreign currencies. We use foreign currency derivative contracts, with a total notional amount of
$72.1 million
, to hedge the effects of translation gains and losses on intercompany loans and interest. We also use foreign currency derivative contracts, with a total notional amount of
$185.3 million
, to mitigate the impact to the consolidated earnings of the Company from the effect of the translation of certain subsidiaries’ local currency results into U.S. dollars. We do not use derivative financial instruments for trading or speculative purposes.
By using derivative financial instruments to hedge exposures to foreign currency fluctuations, we are exposed to credit risk and market risk. Credit risk is the failure of the counterparty to perform under the terms of the derivative contract. When the fair value of a derivative contract is positive, the counterparty owes us, which creates credit risk for us. When the fair value of a derivative contract is negative, we owe the counterparty and, therefore, we are not exposed to the counterparty’s credit risk in those circumstances. We attempt to minimize counterparty credit risk in derivative instruments by entering into transactions with high-quality counterparties whose credit rating is at least upper-medium investment grade. Our derivative instruments do not contain credit risk related contingent features.
63
Interest Rate Risk
We are subject to interest rate market risk in connection with our long-term debt, some of which is based upon floating interest rates. To manage our interest rate risk, we may enter into interest rate derivatives, such as interest rate swaps or caps when we deem it to be appropriate. We do not use financial instruments for trading or other speculative purposes and are not a party to any leveraged derivative instruments. Our net exposure to interest rate risk would primarily be based on the difference between outstanding variable rate debt and the notional amount of any interest rate derivatives. We assess interest rate risk by continually identifying and monitoring changes in interest rate exposures that may adversely impact expected future cash flows and by evaluating hedging opportunities. We maintain risk management control systems to monitor interest rate risk attributable to both our outstanding or forecasted debt obligations as well as any offsetting hedge positions. The risk management control systems involve the use of analytical techniques, including cash flow sensitivity analysis, to estimate the expected impact of changes in interest rates on our future cash flows.
Raw Materials Risk
Our major raw materials include glass, vinyl extrusions, aluminum, steel, wood, hardware, adhesives, and packaging. Prices of these commodities can fluctuate significantly in response to, among other things, variable worldwide supply and demand across different industries, speculation in commodities futures, general economic or environmental conditions, labor costs, competition, import duties, tariffs, worldwide currency fluctuations, freight, regulatory costs, and product and process evolutions that impact demand for the same materials. Increasing raw material prices directly impact our cost of sales, and our ability to maintain margins depends on implementing price increases in response to increasing raw material costs. The market for our products may or may not accept price increases, and as such there is no assurance that we can maintain margins in an environment of rising commodity prices. See Item 1A-
Risk Factors
- Prices and availability of the raw materials we use to manufacture our products are subject to fluctuations, and we may be unable to pass along to our customers the effects of any price increases.
We have not historically used derivatives or similar instruments to hedge commodity price fluctuations. We purchase from multiple, geographically diverse companies mitigate the adverse impact of higher prices for our raw materials. We also maintain other strategies to mitigate the impact of higher raw material, energy, and commodity costs, which typically offset only a portion of the adverse impact.
Item 8 - Financial Statements
See Index to Consolidated Financial Statement beginning on page F-1 of the Form 10-K.
Item 9 - Changes in and Disagreements with Accountants on Accounting and Financial Disclosure.
None.
Item 9A - Controls and Procedures
Disclosure Controls and Procedures
The Company maintains disclosure controls and procedures (as defined in Rules 13a-15(e) and 15d-15(e) under the Securities Exchange Act of 1934, as amended (the “Exchange Act”)), which are designed to ensure that information required to be disclosed by the Company in reports that it files or submits under the Exchange Act, including this Report, are recorded, processed, summarized and reported within the time periods specified in the SEC’s rules and forms. These disclosure controls and procedures include controls and procedures designed to ensure that information required to be disclosed by the Company under the Exchange Act is accumulated and communicated to the Company’s management, including its principal executive officer (“CEO”) and principal financial officer (“CFO”), as appropriate to allow timely decisions regarding required disclosure. The Company’s management, including the Company’s CEO and CFO, conducted an evaluation of the effectiveness of the Company’s disclosure controls and procedures as of the end of the period covered by this Report and, based on that evaluation, the CEO and CFO concluded that the Company’s disclosure controls and procedures were not effective as of
December 31, 2018
because of the material weaknesses in our internal control over financial reporting described below.
64
Management’s Report on Internal Control over Financial Reporting
The Company’s management is responsible for establishing and maintaining adequate internal control over financial reporting, as such term is defined in Exchange Act Rules 13a-15(f) and 15d-15(f).
The Company carried out an evaluation under the supervision and with the participation of the Company’s management, including the Company’s Chief Executive Officer and Chief Financial Officer, of the effectiveness of the Company’s internal control over financial reporting. The Company’s management used the framework in
Internal Control-Integrated Framework
(2013) issued by the Committee of Sponsoring Organizations (COSO) to perform this evaluation. Based on this evaluation, management has concluded that we did not maintain effective internal control over financial reporting as of
December 31, 2018
, due to the material weaknesses identified below.
A material weakness is a deficiency, or combination of deficiencies, in internal control over financial reporting, such that there is a reasonable possibility that a material misstatement of the Company’s annual or interim financial statements will not be prevented or detected on a timely basis.
We did not maintain a sufficient complement of personnel in our Europe operations with the appropriate level of knowledge, experience and training in internal control over financial reporting commensurate with our financial reporting requirements to allow for the consistent execution of control activities. Further, monitoring controls maintained at the Europe operations and corporate levels did not operate with a sufficient degree of precision to provide for the appropriate level of oversight of activities related to our internal control over financial reporting. These material weaknesses contributed to the following additional material weaknesses in that we did not design and maintain effective controls within certain of our Europe operations related to the review and approval of customer pricing, the review and approval of manual journal entries, and the reconciliation of subsidiary ledger financial information used in the consolidated financial statements. Specifically, we did not design and maintain controls to ensure (i) the review and approval of the initial set-up, and subsequent changes/modifications, of customer pricing related to revenue arrangements; (ii) that journal entries were properly prepared with sufficient supporting documentation, were reviewed and approved to ensure accuracy and completeness of the journal entries, and were reviewed by an appropriate individual separate from the preparer of such journal entry; and (iii) the subsidiary financial information used in the preparation of the consolidated financial statements agreed to the financial information recorded in the subsidiary ledger, and to the extent there were differences, that they were appropriately validated.
These material weaknesses did not result in any material misstatements of the Company’s financial statements or disclosures but did result in immaterial out-of-period adjustments that were recorded in the quarter ended December 31, 2018. These material weaknesses could result in a misstatement of substantially all account balances or disclosures within the European operations that would result in a material misstatement to the annual or interim consolidated financial statements that would not be prevented or detected.
Management has excluded from its assessment of the Company’s internal control over financial reporting as of
December 31, 2018
certain elements of the internal control over financial reporting of American Building Supply, Inc., A&L Windows Pty. Ltd., and The Domoferm Group of companies, each wholly-owned subsidiaries of the Company, that were acquired by the Company in purchase business combinations during 2018. Subsequent to the acquisition of each entity, certain elements of the acquired businesses’ internal control over financial reporting and related functions, processes and systems were integrated into the Company’s existing internal control over financial reporting and related functions, processes and systems. Those elements of the acquired businesses’ internal control over financial reporting that were not integrated have been excluded from management’s assessment of the effectiveness of internal control over financial reporting as of
December 31, 2018
. The excluded elements represent approximately 7.9% of consolidated total assets and 11.7% of consolidated net revenues as of and for the year ended
December 31, 2018
. American Building Supply, Inc. represents 4.2% of consolidated total assets and 6.7% of consolidated total revenue.
The effectiveness of our internal control over financial reporting as of
December 31, 2018
has been audited by PricewaterhouseCoopers LLP, an independent registered public accounting firm, as stated in their report appearing under "Item 8. Financial Statements and Supplementary Data".
Remediation Plan for Material Weaknesses as of December 31, 2018
Management has begun implementing a remediation plan to address the control deficiencies that led to the material weakness. The remediation plan includes the following:
|
•
|
Enhance and supplement the finance team in Europe by increasing the number of roles, reassigning responsibilities, and adding additional resources with an appropriate level of knowledge and experience in internal control over financial reporting commensurate with the financial reporting complexities of the organization;
|
|
•
|
Enhance the tone, communication and overall awareness of the importance of internal control over financial reporting from executive management;
|
65
|
•
|
Evaluate corporate and segment monitoring controls to ensure they are designed and operating at the appropriate level of precision required to support risk mitigation;
|
|
•
|
Implement enhancements to the design of our customer pricing controls in Europe;
|
|
•
|
Implement enhancements to the design of our journal entry controls in Europe;
|
|
•
|
Implement enhancements to the design of our controls related to the
reconciliation of subsidiary ledger financial information used in the consolidated financial statements;
|
|
•
|
Strengthen procedures and set guidelines for documentation of controls throughout our domestic and international locations for consistency of application;
|
|
•
|
Institute additional training programs that will continue on a regular basis related to internal control over financial reporting for our world-wide finance and accounting personnel.
|
Remediation of Material Weaknesses as of December 31, 2017
In order to address the material weaknesses related to income taxes described in the Company’s 2017 Annual Report on Form 10-K, the Company’s management began implementing a remediation plan in 2016 to address the control deficiencies that led to the material weaknesses. The remediation plan included the following:
|
•
|
Engaged a third party to review our tax provision process and recommend process enhancements;
|
|
•
|
Implemented the enhancements to the quarterly and annual provision processes as recommended by the third party;
|
|
•
|
Redesigned controls related to the accounting for income tax process;
|
|
•
|
Undertook extensive training for key personnel in each reporting jurisdiction on ASC 740 reporting requirements and our redesigned processes;
|
|
•
|
Engaged a third party to review our quarterly and annual tax calculations;
|
|
•
|
Hired experienced resources, including a new VP of Global Tax, with backgrounds in accounting for income taxes as well as public company experience; and
|
|
•
|
Implemented a tax reporting solution enhancing our internal reporting requirements.
|
As of
December 31, 2018
, the remedial measures described above have been satisfactorily implemented and we have had sufficient time to test the operating effectiveness of such remedial measures. We maintained internal control over financial reporting related to accounting for income taxes, and as such, the material weaknesses identified in the Company’s internal control over financial reporting related to accounting for income taxes have been remediated.
Changes in Internal Control over Financial Reporting
There were no changes in our internal control over financial reporting (as defined in Rules 13a-15(f) and 15d-15(f) under the Exchange Act) that occurred during the Company’s most recently completed quarter ended December 31, 2018 that have materially affected, or are reasonably likely to materially affect, the Company’s internal control over financial reporting.
Item 9B - Other Information
None.
66
Item 10 - Directors, Executive Officers and Corporate Governance
Executive Officers
Set forth below is certain information about our executive officers. Ages are as of March 1, 2019. There are no family relationships among the following executive officers.
Gary S. Michel,
President and Chief Executive Officer.
Mr. Michel, age 56, joined the Company as President and Chief Executive Officer and our Board of Directors in June 2018. Mr. Michel joined the Company from Honeywell International, Inc., where he served as the president and chief executive officer of the Home and Building Technologies strategic business group since October 2017. Prior to that, he spent 32 years at Ingersoll Rand, most recently as senior vice president and president of its residential heating, ventilation and air conditioning business and as a member of Ingersoll Rand’s enterprise leadership team from 2011 to 2017. He began his career there in 1985 as an application engineer and held various product, sales and business management roles before moving into a series of leadership positions across various geographic and market segments. Mr. Michel holds a B.S. in mechanical engineering from Virginia Tech and an M.B.A. from the University of Phoenix. He has served as a member of the board of directors of Cooper Tire & Rubber Company since 2015.
John Linker,
Executive Vice President and Chief Financial Officer.
Mr. Linker, age 43, joined the Company in December 2012 and has held the position of Executive Vice President and Chief Financial Officer since November 2018. Previously, he served as the Company’s Senior Vice President, Corporate Development and Investor Relations from 2015 to 2018, and as Treasurer from 2012 to 2014. Prior to joining the Company, Mr. Linker held leadership positions in corporate development and finance with United Technologies Corporation’s Aerospace Systems Division, and its predecessor, Goodrich Corporation, from 2008 to 2012. Mr. Linker began his career in investment banking for Wells Fargo and consulting for Accenture PLC. Mr. Linker holds a B.A. in Economics and International Studies from Duke University and a M.B.A. from The Fuqua School of Business at Duke University.
Laura W. Doerre
,
Executive Vice President, General Counsel and Chief Compliance Officer
. Ms. Doerre, age 51, joined the Company in September 2016 and is responsible for the Company’s global legal affairs and global risk and compliance functions. Prior to joining the Company, Ms. Doerre served as Vice President and General Counsel for Nabors Industries Ltd. from 2008 to August 2016. From 1996 to 2008, she held positions of increasing responsibility with Nabors. Prior to joining Nabors in 1996, Ms. Doerre practiced commercial litigation with the law firm Mayor, Day, Caldwell & Keeton LLP. Ms. Doerre received her B.S. with distinction in Accounting from the University of North Carolina at Chapel Hill and graduated with honors from the University of Texas School of Law. She is admitted to practice law in the state of Texas.
Timothy Craven,
Executive Vice President, Human Resources.
Mr. Craven, age 50, was appointed Vice President, Employee Relations of the Company in July 2015 and was promoted to his current role as Executive Vice President, Human Resources in February 2016. Mr. Craven is responsible for global human resources and employee relation activities. His duties include talent acquisition, training and development, wage and benefit reviews, and employee engagement. Previously, Mr. Craven was employed at Eaton Corporation (formerly Cooper Industries) where he held a number of senior-level human resources roles since 2007. Immediately prior to joining the Company, Mr. Craven served as Vice President, Human Resources at the Crouse-Hinds Division of Eaton Corporation in Syracuse, New York. Earlier in his career, Mr. Craven served in a number of human resources positions of increasing responsibility at both corporate and operating locations with Xerox’s Affiliated Computer Services Business and Honeywell, Inc. Mr. Craven earned a B.S. in human resource management from Western Illinois University.
Peter Farmakis
,
Executive Vice President and President, Australasia.
Mr. Farmakis, age 51, joined the Company as Chief Operating Officer, Australia in September 2013 and was promoted to Executive Vice President and President, Australasia in June 2014. Prior to joining the Company, Mr. Farmakis served as Chief Executive Officer of Dexion Limited (which was acquired by GUD Holdings Limited in 2012) from 2007 until August 2013. Mr. Farmakis also served in a variety of key leadership roles with numerous companies, including as Executive General Manager of Smorgon Steel Group Limited, Distribution Business; Global Vice President of Huntsman Corporation, Advanced Materials division; Americas Regional President of Vantico Inc.; and Strategy & Corporate Planning Manager for Ciba-Geigy AG in Switzerland. He began his career in research and development with ICI (Dulux) and Bayer AG. Mr. Farmakis earned a B.S. from the University of Wollongong and a postgraduate degree in Marketing and Finance from the University of Technology, Sydney in Australia.
Peter Maxwell
,
Executive Vice President and President, Europe.
Mr. Maxwell, age 56, joined the Company as Executive Vice President and President, Europe in September 2015. Prior to joining the Company, Mr. Maxwell served as a Vice President and General Manager at MTL Instruments Group, Eaton Corporation from September 2008 to August 2015. Previously, Mr. Maxwell worked for Cooper Industries (which was acquired by Eaton Corporation in 2012) for nearly 20 years and held various general management roles of increasing responsibility within Cooper Industries and Eaton Corporation serving the commercial and industrial building sector and the as Vice President and General Manager in the Crouse-Hinds Division. He served as the Chief Financial Officer of Cooper Industries’ Safety Division based in Europe from 1998 to 2002. Mr. Maxwell graduated with a B.Sc. in Civil Engineering
67
from the University of Edinburgh before qualifying as a Chartered Accountant with Coopers & Lybrand, now PricewaterhouseCoopers LLP.
Information to be provided in Items 10, 11, 12, 13 and 14 of this Form 10-K and not otherwise included herein is incorporated by reference to the Company’s Proxy Statement for its 2019 Annual Meeting of the Shareholders to be held on
May 9, 2019
, which will be filed with the SEC within 120 days of the Company’s fiscal year end covered by this Form 10-K.
Item 11 - Executive Compensation.
Refer to Item 10.
68
Item 12 - Security Ownership of Certain Beneficial Owners and Management and Related Shareholder Matters.
Equity Compensation Plan Information
The following table sets forth information with respect to shares of our common stock that may be issued under our existing equity compensation plans, as of
December 31, 2018
:
|
(a)
|
(b)
|
(c)
|
|||||
|
Plan Category
|
Number of Securities to be Issued Upon Exercise of Outstanding Options, Warrants, and Rights
|
Weighted Average Exercise Price of Outstanding Options, Warrants, and Rights
(1)
|
Number of Securities Remaining Available for Future Issuance Under Equity Compensation Plans (Excluding Securities Reflected in Column (a))
|
||||
|
Equity compensation plans approved by security holders
(1)
|
4,268,579
(2)
|
$18.22
|
5,632,850
(3)
|
||||
|
Equity compensation plans not approved by security holders
|
—
|
—
|
|
—
|
|||
|
Total
|
4,268,579
|
$18.22
|
5,632,850
|
||||
|
(1)
|
Excludes RSUs and PSUs, which have no exercise price.
|
|
(2)
|
Consists of shares underlying
3,332,705
stock options,
673,868
RSUs and 262,006 PSUs outstanding under the 2011 Stock Incentive Plan and 2017 Omnibus Equity Plan.
|
|
(3)
|
Number of securities remaining for future issuances includes only shares available under the 2017 Omnibus Equity Plan.
|
Refer to Item 10 for additional information required by this item.
Item 13 - Certain Relationships and Related Transactions, and Director Independence.
Refer to Item 10.
Item 14 - Principal Accounting Fees and Services.
Refer to Item 10.
69
Item 15 - Exhibits and Financial Statement Schedules.
1.
Financial Statements
The financial statements are set forth under Item 8-
Financial Statements and Supplementary Data
of this Form 10-K.
2.
Financial Statement Schedules
The following financial statement schedules are attached to this report.
Schedule I - Condensed Financial Information of the Registrant
All other schedules are omitted because they are not applicable, not required, or the information is included in the financial statements or the notes thereto.
3.
Exhibits
The exhibits listed on the accompanying Exhibit Index are filed or incorporated by reference as part of this 10-K and such Exhibit Index is incorporated herein by reference.
|
Exhibit No.
|
Exhibit Description
|
Form
|
File No.
|
Exhibit
|
Filing Date
|
|||||
|
3.1
|
8-K
|
001-38000
|
3.1
|
February 3, 2017
|
||||||
|
3.2
|
S-1/A
|
333-211761
|
3.4
|
January 5, 2017
|
||||||
|
4.1
|
S-1/A
|
333-211761
|
4.1
|
January 5, 2017
|
||||||
|
4.2
|
10-K
|
001-38000
|
4.2
|
March 3, 2017
|
||||||
|
4.3
|
S-1
|
333-221538
|
4.3
|
May 15, 2017
|
||||||
|
4.4
|
S-1
|
333-221538
|
4.4
|
November 13, 2017
|
||||||
|
4.5
|
8-K
|
001-38000
|
4.1
|
December 27, 2018
|
||||||
|
10.1
|
S-1
|
333-211761
|
10.1
|
June 1, 2016
|
||||||
|
10.2
|
S-1
|
333-211761
|
10.1.1
|
June 1, 2016
|
||||||
|
10.3
|
S-1/A
|
333-211761
|
10.1.2
|
November 17, 2016
|
||||||
|
10.4
|
8-K
|
001-38000
|
10.1
|
December 15, 2017
|
||||||
70
|
Exhibit No.
|
Exhibit Description
|
Form
|
File No.
|
Exhibit
|
Filing Date
|
|||||
|
10.5
|
S-1
|
333-211761
|
10.2
|
June 1, 2016
|
||||||
|
10.6
|
S-1
|
333-211761
|
10.2.1
|
June 1, 2016
|
||||||
|
10.7
|
S-1/A
|
333-211761
|
10.2.2
|
November 17, 2016
|
||||||
|
10.8
|
8-K
|
001-38000
|
10.1
|
March 8, 2017
|
||||||
|
10.9
|
8-K
|
001-38000
|
10.2
|
December 15, 2017
|
||||||
|
10.10
|
S-1/A
|
333-211761
|
10.3
|
December 16, 2016
|
||||||
|
10.11
|
S-1/A
|
333-211761
|
10.3.1
|
December 16, 2016
|
||||||
|
10.12
|
S-1/A
|
333-211761
|
10.3.2
|
December 16, 2016
|
||||||
|
10.13
|
S-1/A
|
333-211761
|
10.3.3
|
December 16, 2016
|
||||||
|
10.14
|
S-1/A
|
333-211761
|
10.4
|
December 16, 2016
|
||||||
|
10.15
|
S-1/A
|
333-211761
|
10.4.1
|
December 16, 2016
|
||||||
|
10.16
|
S-1/A
|
333-211761
|
10.4.2
|
December 16, 2016
|
||||||
|
10.17+
|
S-1/A
|
333-211761
|
10.6
|
December 16, 2016
|
||||||
|
10.18+
|
10-Q
|
001-38000
|
10.14
|
May 12, 2017
|
||||||
|
10.19+
|
S-1/A
|
333-211761
|
10.7
|
December 16, 2016
|
||||||
|
10.20+
|
S-1/A
|
333-211761
|
10.8
|
December 16, 2016
|
||||||
|
10.21+
|
S-1/A
|
333-211761
|
10.9
|
December 16, 2016
|
||||||
|
10.22+
|
S-1/A
|
333-211761
|
10.11
|
January 5, 2017
|
||||||
|
10.23+
|
S-1/A
|
333-211761
|
10.13
|
January 5, 2017
|
||||||
|
10.24+
|
S-1/A
|
333-211761
|
10.15
|
January 5, 2017
|
||||||
|
10.25+
|
S-1/A
|
333-211761
|
10.15.1
|
January 5, 2017
|
||||||
|
10.26+
|
S-1/A
|
333-211761
|
10.16
|
January 5, 2017
|
||||||
|
10.27+
|
S-1/A
|
333-211761
|
10.17
|
January 5, 2017
|
||||||
71
|
Exhibit No.
|
Exhibit Description
|
Form
|
File No.
|
Exhibit
|
Filing Date
|
|||||
|
10.28+
|
S-1/A
|
333-211761
|
10.18
|
January 5, 2017
|
||||||
|
10.29+
|
S-1/A
|
333-211761
|
10.19
|
January 5, 2017
|
||||||
|
10.30+
|
S-1/A
|
333-211761
|
10.20
|
January 5, 2017
|
||||||
|
10.31+
|
10-K
|
001-38000
|
10.36
|
March 6, 2018
|
||||||
|
10.32+
|
10-K
|
001-38000
|
10.37
|
March 6, 2018
|
||||||
|
10.33+
|
10-K
|
001-38000
|
10.38
|
March 6, 2018
|
||||||
|
10.34+
|
10-K
|
001-38000
|
10.39
|
March 6, 2018
|
||||||
|
10.35
|
S-1
|
333-211761
|
10.25
|
June 1, 2016
|
||||||
|
10.36
|
8-K
|
001-38000
|
10.1
|
December 27, 2018
|
||||||
|
10.37+
|
10-Q
|
001-38000
|
10.0
|
May 9, 2018
|
||||||
|
10.38+*
|
||||||||||
|
10.39+*
|
||||||||||
|
10.40+*
|
||||||||||
|
21.1*
|
||||||||||
|
23.1*
|
||||||||||
|
24.1*
|
||||||||||
|
31.1*
|
||||||||||
|
31.2*
|
||||||||||
|
32.1*
|
||||||||||
|
101.INS*
|
XBRL Instance Document.
|
|||||||||
|
101.SCH*
|
XBRL Taxonomy Extension Schema Document.
|
|||||||||
|
101.CAL*
|
XBRL Taxonomy Extension Calculation Linkbase Document.
|
|||||||||
|
101.DEF*
|
XBRL Taxonomy Extension Definition Linkbase Document.
|
|||||||||
|
101.LAB*
|
XBRL Taxonomy Extension Label Linkbase Document.
|
|||||||||
|
101.PRE*
|
XBRL Taxonomy Extension Presentation Linkbase Document.
|
|||||||||
|
*
|
Filed herewith.
|
|||||||||
|
+
|
Indicates management contract or compensatory plan.
|
|||||||||
Item 16 - Form 10-K Summary.
None.
72
SIGNATURES
Pursuant to the requirements of Section 13 or 15(d) of the Securities Exchange Act of 1934, the registrant has duly caused this 10-K to be signed on its behalf by the undersigned, thereunto duly authorized.
|
JELD-WEN HOLDING, INC.
|
|
|
(Registrant)
|
|
|
By:
|
/s/ John Linker
|
|
John Linker
|
|
|
Chief Financial Officer
|
|
Date:
March 1, 2019
POWER OF ATTORNEY
KNOW ALL PERSONS BY THESE PRESENTS, that each person whose signature appears below constitutes and appoints John Linker and Laura W. Doerre, jointly and severally, his attorney-in-fact, with the power of substitution, for him in any and all capacities, to sign any amendments to this Annual Report on Form 10-K and to file the same, with exhibits thereto and other documents in connection therewith, with the Securities and Exchange Commission, hereby ratifying and confirming all that each of said attorneys-in-fact, or his substitute or substitutes, may do or cause to be done by virtue hereof.
Pursuant to the requirements of the Securities and Exchange Act of 1934, this 10-K has been signed below by the following persons on behalf of the registrant and in the capacities and on the dates indicated.
|
Signature
|
Title
|
Date
|
|||
|
/s/ Gary S. Michel
|
President, Chief Executive Officer and Director (Principal Executive Officer)
|
March 1, 2019
|
|||
|
Gary S. Michel
|
|||||
|
/s/ John Linker
|
Chief Financial Officer (Principal Financial Officer)
|
March 1, 2019
|
|||
|
John Linker
|
|||||
|
/s/ Scott Vining
|
Chief Accounting Officer (Principal Accounting Officer)
|
March 1, 2019
|
|||
|
Scott Vining
|
|||||
|
/s/ Kirk Hachigian
|
Chairman
|
March 1, 2019
|
|||
|
Kirk Hachigian
|
|||||
|
/s/ Roderick C. Wendt
|
Vice Chairman
|
March 1, 2019
|
|||
|
Roderick C. Wendt
|
|||||
|
/s/ William Banholzer
|
Director
|
March 1, 2019
|
|||
|
William Banholzer
|
|||||
|
/s/ Martha Byorum
|
Director
|
March 1, 2019
|
|||
|
Martha (Stormy) Byorum
|
|||||
|
/s/ Greg G. Maxwell
|
Director
|
March 1, 2019
|
|||
|
Greg G. Maxwell
|
|||||
|
/s/ Anthony Munk
|
Director
|
March 1, 2019
|
|||
|
Anthony Munk
|
|||||
73
|
Signature
|
Title
|
Date
|
|||
|
/s/ Matthew Ross
|
Director
|
March 1, 2019
|
|||
|
Matthew Ross
|
|||||
|
/s/ Suzanne Stefany
|
Director
|
March 1, 2019
|
|||
|
Suzanne Stefany
|
|||||
|
/s/ Bruce Taten
|
Director
|
March 1, 2019
|
|||
|
Bruce Taten
|
|||||
|
/s/ Steven E. Wynne
|
Director
|
March 1, 2019
|
|||
|
Steven E. Wynne
|
|||||
74
Index to Consolidated Financial Statements
|
Report of Independent Registered Public Accounting Firm
|
||
|
Consolidated Statements of Operations for the Years Ended December 31, 2018, 2017 and 2016
|
||
|
Consolidated Statements of Comprehensive Income (Loss) for the Years Ended December 31, 2018, 2017 and 2016
|
||
|
Consolidated Balance Sheets as of December 31, 2018 and 2017
|
||
|
Consolidated Statements of Equity for the Years Ended December 31, 2018, 2017 and 2016
|
||
|
Consolidated Statements of Cash Flows for the Years Ended December 31, 2018, 2017 and 2016
|
||
|
Notes to Consolidated Financial Statements
|
||
Index to Financial Statement Schedules
|
Schedule I - Parent Company Information as of December 31, 2018 and 2017 and for the Years Ended December 31, 2018, 2017 and 2016
|
||
F-1
Report of Independent Registered Public Accounting Firm
To the Board of Directors and Shareholders of JELD-WEN Holding, Inc.
Opinions on the Financial Statements and Internal Control over Financial Reporting
We have audited the accompanying consolidated balance sheets of JELD-WEN Holding, Inc. and its subsidiaries
(the “Company”) as of December 31, 2018 and 2017,
and the related consolidated statements of operations, comprehensive income (loss), equity, and cash flows for each of the three years in the period ended December 31, 2018, including the related notes and financial statement schedule listed in the accompanying index (collectively referred to as the “consolidated financial statements”).
We also have audited the Company's internal control over financial reporting as of December 31, 2018, based on criteria established in
Internal Control - Integrated Framework
(2013)
issued by the Committee of Sponsoring Organizations of the Treadway Commission (COSO).
In our opinion, the consolidated financial statements referred to above present fairly, in all material respects, the financial position of the Company as of
December 31, 2018 and 2017, and the results of its operations and its cash flows for each of the three years in the period ended
December 31, 2018 in conformity with accounting principles generally accepted in the United States of America. Also in our opinion, the Company did not maintain, in all material respects, effective internal control over financial reporting as of December 31, 2018, based on criteria established in
Internal Control - Integrated Framework
(2013)
issued by the COSO because
material weaknesses in internal control over financial reporting existed as of that date related to (1) the ineffective control environment in its Europe operations due to a lack of a sufficient complement of personnel with the appropriate level of knowledge, experience and training, (2) ineffective monitoring controls at the Europe operations and corporate levels as they did not operate with a sufficient degree of precision to provide for the appropriate level of oversight of activities, (3) a lack of controls designed and maintained to ensure the review and approval of the initial set-up, and subsequent changes/modifications, of customer pricing related to revenue arrangements at certain European locations, (4) a lack of controls designed and maintained to ensure journal entries were properly prepared with sufficient supporting documentation, were reviewed and approved to ensure accuracy and completeness of the journal entries, and were reviewed by an appropriate individual separate from the preparer of such journal entry at certain European locations, and (5) a lack of controls designed and maintained to ensure the subsidiary financial information used in the preparation of the consolidated financial statements agreed to the financial information recorded in the subsidiary ledger, and to the extent there were differences, that they were appropriately validated at certain European locations.
A material weakness is a deficiency, or a combination of deficiencies, in internal control over financial reporting, such that there is a reasonable possibility that a material misstatement of the annual or interim financial statements will not be prevented or detected on a timely basis. The material weaknesses referred to above are described in Management's Report on Internal Control over Financial Reporting appearing under Item 9A. We considered these material weaknesses in determining the nature, timing, and extent of audit tests applied in our audit of the 2018
consolidated
financial statements, and our opinion regarding the effectiveness of the Company’s internal control over financial reporting does not affect our opinion on those consolidated financial statements.
Basis for Opinions
The Company's management is responsible for these consolidated financial statements, for maintaining effective internal control over financial reporting, and for its assessment of the effectiveness of internal control over financial reporting included in management's report referred to above. Our responsibility is to express opinions on the Company’s consolidated financial statements and on the Company's internal control over financial reporting based on our audits. We are a public accounting firm registered with the Public Company Accounting Oversight Board (United States) (PCAOB) and are required to be independent with respect to the Company in accordance with the U.S. federal securities laws and the applicable rules and regulations of the Securities and Exchange Commission and the PCAOB.
We conducted our audits in accordance with the standards of the PCAOB. Those standards require that we plan and perform the audits to obtain reasonable assurance about whether the consolidated financial statements are free of material misstatement, whether due to error or fraud, and whether effective internal control over financial reporting was maintained in all material respects.
Our audits of the consolidated financial statements included performing procedures to assess the risks of material misstatement of the consolidated financial statements, whether due to error or fraud, and performing procedures that respond to those risks. Such procedures included examining, on a test basis, evidence regarding the amounts and disclosures in the consolidated financial statements. Our audits also included evaluating the accounting principles used and significant estimates made by management, as well as evaluating the overall presentation of the consolidated financial statements. Our audit of internal control over financial reporting included obtaining an understanding of internal control over financial reporting, assessing the risk that a material weakness exists, and testing and evaluating the design and operating effectiveness of internal control based on the assessed risk. Our audits also included performing such other procedures as we considered necessary in the circumstances. We believe that our audits provide a reasonable basis for our opinions.
F-2
As described in Management’s Report on Internal Control over Financial Reporting, management has excluded certain elements of the internal control over financial reporting of American Building Supply, Inc., A&L Windows Pty. Ltd. and The Domoferm Group of companies from its assessment of the Company’s internal control over financial reporting as of December 31, 2018 because they were acquired by the Company in purchase business combinations during 2018. Subsequent to the acquisitions, certain elements of American Building Supply, Inc., A&L Windows Pty. Ltd., and The Domoferm Group of companies’ internal control over financial reporting and related processes were integrated into the Company’s existing systems and internal control over financial reporting. Those controls that were not integrated have been excluded from management’s assessment of the effectiveness of internal control over financial reporting as of December 31, 2018. We have also excluded these elements of the internal control over financial reporting of American Building Supply, Inc., A&L Windows Pty. Ltd., and The Domoferm Group of companies from our audit of the Company’s internal control over financial reporting. The excluded elements represent controls over approximately 7.9% of consolidated total assets and 11.7% of the consolidated net revenues as of and for the year ended December 31, 2018. American Building Supply, Inc. represents 4.2% and 6.7% of the related consolidated financial statements amounts, respectively.
Definition and Limitations of Internal Control over Financial Reporting
A company’s internal control over financial reporting is a process designed to provide reasonable assurance regarding the reliability of financial reporting and the preparation of financial statements for external purposes in accordance with generally accepted accounting principles. A company’s internal control over financial reporting includes those policies and procedures that (i) pertain to the maintenance of records that, in reasonable detail, accurately and fairly reflect the transactions and dispositions of the assets of the company; (ii) provide reasonable assurance that transactions are recorded as necessary to permit preparation of financial statements in accordance with generally accepted accounting principles, and that receipts and expenditures of the company are being made only in accordance with authorizations of management and directors of the company; and (iii) provide reasonable assurance regarding prevention or timely detection of unauthorized acquisition, use, or disposition of the company’s assets that could have a material effect on the financial statements.
Because of its inherent limitations, internal control over financial reporting may not prevent or detect misstatements. Also, projections of any evaluation of effectiveness to future periods are subject to the risk that controls may become inadequate because of changes in conditions, or that the degree of compliance with the policies or procedures may deteriorate.
/s/ PricewaterhouseCoopers LLP
Charlotte, North Carolina
March 1, 2019
We have served as the Company’s auditor since 2000.
F-3
Item 1 - Financial Statements
JELD-WEN HOLDING, INC.
CONSOLIDATED STATEMENTS OF OPERATIONS
|
For the Years Ended December 31,
|
||||||||||||
|
(amounts in thousands, except share and per share data)
|
2018
|
2017
|
2016
|
|||||||||
|
Net revenues
|
$
|
4,346,703
|
|
$
|
3,763,749
|
|
$
|
3,666,942
|
|
|||
|
Cost of sales
|
3,422,969
|
|
2,914,327
|
|
2,890,894
|
|
||||||
|
Gross margin
|
923,734
|
|
849,422
|
|
776,048
|
|
||||||
|
Selling, general and administrative
|
733,748
|
|
572,458
|
|
552,881
|
|
||||||
|
Impairment and restructuring charges
|
17,328
|
|
13,056
|
|
13,847
|
|
||||||
|
Operating income
|
172,658
|
|
263,908
|
|
209,320
|
|
||||||
|
Interest expense, net
|
70,818
|
|
79,034
|
|
77,590
|
|
||||||
|
Loss on debt extinguishment
|
—
|
|
23,262
|
|
—
|
|
||||||
|
Gain on previously held shares of an equity investment
|
(20,767
|
)
|
—
|
|
—
|
|
||||||
|
Other (income) expense
|
(12,970
|
)
|
15,857
|
|
1,410
|
|
||||||
|
Income before taxes, equity earnings
|
135,577
|
|
145,755
|
|
130,320
|
|
||||||
|
Income tax (benefit) expense
|
(7,958
|
)
|
138,603
|
|
(246,394
|
)
|
||||||
|
Income from continuing operations, net of tax
|
143,535
|
|
7,152
|
|
376,714
|
|
||||||
|
Equity earnings of non-consolidated entities
|
738
|
|
3,639
|
|
3,791
|
|
||||||
|
Loss from discontinued operations, net of tax
|
—
|
|
—
|
|
(3,324
|
)
|
||||||
|
Net income
|
$
|
144,273
|
|
$
|
10,791
|
|
$
|
377,181
|
|
|||
|
Less net loss attributable to non-controlling interest
|
(87
|
)
|
—
|
|
—
|
|
||||||
|
Convertible preferred stock dividends
|
—
|
|
10,462
|
|
396,647
|
|
||||||
|
Net income (loss) attributable to common shareholders
|
$
|
144,360
|
|
$
|
329
|
|
$
|
(19,466
|
)
|
|||
|
|
||||||||||||
|
Weighted average common shares outstanding
|
||||||||||||
|
Basic
|
104,530,572
|
97,460,676
|
17,992,879
|
|||||||||
|
Diluted
|
106,360,657
|
101,462,135
|
17,992,879
|
|||||||||
|
Income (loss) per share from continuing operations
|
||||||||||||
|
Basic
|
$
|
1.38
|
|
$
|
0.00
|
|
$
|
(0.90
|
)
|
|||
|
Diluted
|
$
|
1.36
|
|
$
|
0.00
|
|
$
|
(0.90
|
)
|
|||
|
Loss per share from discontinued operations
|
||||||||||||
|
Basic
|
$
|
0.00
|
|
$
|
0.00
|
|
$
|
(0.18
|
)
|
|||
|
Diluted
|
$
|
0.00
|
|
$
|
0.00
|
|
$
|
(0.18
|
)
|
|||
|
Net income (loss) per share
|
||||||||||||
|
Basic
|
$
|
1.38
|
|
$
|
0.00
|
|
$
|
(1.08
|
)
|
|||
|
Diluted
|
$
|
1.36
|
|
$
|
0.00
|
|
$
|
(1.08
|
)
|
|||
The accompanying notes are an integral part of these Consolidated Financial Statements.
F-4
JELD-WEN HOLDING, INC.
CONSOLIDATED STATEMENTS OF COMPREHENSIVE INCOME (LOSS)
|
For the Years Ended December 31,
|
||||||||||||
|
(amounts in thousands)
|
2018
|
2017
|
2016
|
|||||||||
|
Net income
|
$
|
144,273
|
|
$
|
10,791
|
|
$
|
377,181
|
|
|||
|
Other comprehensive (loss) income, net of tax:
|
||||||||||||
|
Foreign currency translation adjustments, net of tax of ($1,892), $0, and $0, respectively
|
(64,349
|
)
|
87,934
|
|
(32,383
|
)
|
||||||
|
Interest rate hedge adjustments, net of tax (benefit) expense of ($538), $5,001 and $0, respectively
|
2,636
|
|
4,486
|
|
(2,679
|
)
|
||||||
|
Defined benefit pension plans, net of tax expense (benefit) of $4,214, $5,357 and ($419), respectively
|
12,237
|
|
9,415
|
|
868
|
|
||||||
|
Total other comprehensive (loss) income, net of tax
|
(49,476
|
)
|
101,835
|
|
(34,194
|
)
|
||||||
|
Comprehensive income
|
$
|
94,797
|
|
$
|
112,626
|
|
$
|
342,987
|
|
|||
The accompanying notes are an integral part of these Consolidated Financial Statements.
F-5
JELD-WEN HOLDING, INC.
CONSOLIDATED BALANCE SHEETS
|
(amounts in thousands, except share and per share data)
|
December 31,
2018 |
December 31,
2017 |
||||||
|
ASSETS
|
||||||||
|
Current assets
|
||||||||
|
Cash and cash equivalents
|
$
|
116,991
|
|
$
|
220,175
|
|
||
|
Restricted cash
|
632
|
|
36,059
|
|
||||
|
Accounts receivable, net
|
471,655
|
|
453,251
|
|
||||
|
Inventories
|
513,238
|
|
405,353
|
|
||||
|
Other current assets
|
48,961
|
|
30,403
|
|
||||
|
Total current assets
|
1,151,477
|
|
1,145,241
|
|
||||
|
Property and equipment, net
|
843,403
|
|
756,711
|
|
||||
|
Deferred tax assets
|
207,065
|
|
183,726
|
|
||||
|
Goodwill
|
585,942
|
|
549,063
|
|
||||
|
Intangible assets, net
|
225,553
|
|
166,313
|
|
||||
|
Other assets
|
37,615
|
|
61,886
|
|
||||
|
Total assets
|
$
|
3,051,055
|
|
$
|
2,862,940
|
|
||
|
LIABILITIES AND EQUITY
|
||||||||
|
Current liabilities
|
||||||||
|
Accounts payable
|
$
|
250,281
|
|
$
|
259,934
|
|
||
|
Accrued payroll and benefits
|
114,784
|
|
122,212
|
|
||||
|
Accrued expenses and other current liabilities
|
250,274
|
|
186,605
|
|
||||
|
Notes payable and current maturities of long-term debt
|
54,930
|
|
8,770
|
|
||||
|
Total current liabilities
|
670,269
|
|
577,521
|
|
||||
|
Long-term debt
|
1,422,962
|
|
1,264,933
|
|
||||
|
Unfunded pension liability
|
107,522
|
|
116,586
|
|
||||
|
Deferred credits and other liabilities
|
72,038
|
|
102,614
|
|
||||
|
Deferred tax liabilities
|
10,457
|
|
9,249
|
|
||||
|
Total liabilities
|
2,283,248
|
|
2,070,903
|
|
||||
|
Commitments and contingencies
(Note 29)
|
|
|
||||||
|
Shareholders’ equity
|
||||||||
|
Preferred Stock, par value $0.01 per share, 90,000,000 shares authorized; no shares issued and outstanding
|
—
|
|
—
|
|
||||
|
Common Stock: 900,000,000 shares authorized, par value $0.01 per share, 101,310,862 shares outstanding as of December 31, 2018; 900,000,000 shares authorized, par value $0.01 per share, 105,990,483 shares outstanding as of December 31, 2017
|
1,013
|
|
1,060
|
|
||||
|
Additional paid-in capital
|
658,593
|
|
652,666
|
|
||||
|
Retained earnings
|
253,041
|
|
233,658
|
|
||||
|
Accumulated other comprehensive loss
|
(144,823
|
)
|
(95,347
|
)
|
||||
|
Total shareholders’ equity attributable to common shareholders
|
767,824
|
|
792,037
|
|
||||
|
Non-controlling interest
|
(17
|
)
|
—
|
|
||||
|
Total shareholders’ equity
|
767,807
|
|
792,037
|
|
||||
|
Total liabilities and shareholders’ equity
|
$
|
3,051,055
|
|
$
|
2,862,940
|
|
||
The accompanying notes are an integral part of these Consolidated Financial Statements.
F-6
JELD-WEN HOLDING, INC.
CONSOLIDATED STATEMENTS OF EQUITY
|
December 31, 2018
|
December 31, 2017
|
December 31, 2016
|
||||||||||||||||
|
(amounts in thousands, except share and per share amounts)
|
Shares
|
Amount
|
Shares
|
Amount
|
Shares
|
Amount
|
||||||||||||
|
Preferred stock, $0.01 par value per share
|
—
|
$
|
—
|
|
—
|
|
$
|
—
|
|
—
|
$
|
—
|
|
|||||
|
Common stock, $0.01 par value per share
|
||||||||||||||||||
|
Common stock
|
||||||||||||||||||
|
Balance as of January 1
|
105,990,483
|
$
|
1,060
|
|
17,894,393
|
|
$
|
178
|
|
17,829,240
|
$
|
178
|
|
|||||
|
Shares issued for exercise/vesting of share-based compensation awards
|
907,068
|
9
|
|
2,047,668
|
|
21
|
|
65,153
|
—
|
|
||||||||
|
Shares repurchased
|
(5,287,964)
|
(53
|
)
|
(2,266
|
)
|
—
|
|
—
|
—
|
|
||||||||
|
Shares issued upon conversion of Class B-1 Common Stock
|
—
|
—
|
|
309,404
|
|
3
|
|
—
|
—
|
|
||||||||
|
Shares issued upon conversion of convertible preferred stock to Common Stock
|
—
|
—
|
|
64,211,172
|
|
642
|
|
—
|
—
|
|
||||||||
|
Shares surrendered for tax obligations for employee share-based transactions
|
(298,725)
|
(3
|
)
|
(742,615
|
)
|
(7
|
)
|
—
|
$
|
—
|
|
|||||||
|
Shares issued in initial public offering
|
—
|
—
|
|
22,272,727
|
|
223
|
|
—
|
$
|
—
|
|
|||||||
|
Balance at period end
|
101,310,862
|
1,013
|
|
105,990,483
|
|
1,060
|
|
17,894,393
|
178
|
|
||||||||
|
Class B-1 Common Stock
|
||||||||||||||||||
|
Balance as of January 1
|
—
|
—
|
|
177,221
|
|
2
|
|
68,046
|
1
|
|
||||||||
|
Shares issued for exercise of stock options
|
—
|
—
|
|
—
|
|
—
|
|
109,175
|
1
|
|
||||||||
|
Class B-1 Common Stock converted to common
|
—
|
—
|
|
(177,221
|
)
|
(2
|
)
|
—
|
—
|
|
||||||||
|
Balance at period end
|
—
|
—
|
|
—
|
|
—
|
|
177,221
|
2
|
|
||||||||
|
Balance at period end
|
$
|
1,013
|
|
$
|
1,060
|
|
$
|
180
|
|
|||||||||
|
Additional paid-in capital
|
||||||||||||||||||
|
Balance as of January 1
|
$
|
653,327
|
|
$
|
37,205
|
|
$
|
89,101
|
|
|||||||||
|
Shares issued for exercise/vesting of share-based compensation awards
|
192
|
|
1,008
|
|
1,187
|
|
||||||||||||
|
Shares repurchased
|
—
|
|
(183
|
)
|
—
|
|
||||||||||||
|
Shares surrendered for tax obligations for employee share-based transactions
|
(8,887
|
)
|
(25,897
|
)
|
(982
|
)
|
||||||||||||
|
Conversion of convertible preferred stock
|
—
|
|
150,901
|
|
—
|
|
||||||||||||
|
Initial public offering proceeds, net of underwriting fees and commissions
|
—
|
|
480,306
|
|
—
|
|
||||||||||||
|
Costs associated with initial public offering
|
—
|
|
(7,923
|
)
|
—
|
|
||||||||||||
|
Distributions on common stock and Class B-1 common stock
|
—
|
|
—
|
|
(73,957
|
)
|
||||||||||||
|
Amortization of share-based compensation
|
14,609
|
|
17,910
|
|
21,856
|
|
||||||||||||
|
Balance at period end
|
659,241
|
|
653,327
|
|
37,205
|
|
||||||||||||
|
Director notes
|
||||||||||||||||||
|
Balance as of January 1
|
—
|
|
—
|
|
(2,068
|
)
|
||||||||||||
|
Net issuances, payments and accrued interest on notes
|
—
|
|
—
|
|
2,068
|
|
||||||||||||
|
Balance at period end
|
—
|
|
—
|
|
—
|
|
||||||||||||
|
Employee stock notes
|
||||||||||||||||||
|
Balance as of January 1
|
(661
|
)
|
(843
|
)
|
(1,011
|
)
|
||||||||||||
|
Net issuances, payments and accrued interest on notes
|
13
|
|
182
|
|
168
|
|
||||||||||||
|
Balance at period end
|
(648
|
)
|
(661
|
)
|
(843
|
)
|
||||||||||||
|
Balance at period end
|
$
|
658,593
|
|
$
|
652,666
|
|
$
|
36,362
|
|
|||||||||
(continued on next page)
F-7
JELD-WEN HOLDING, INC.
CONSOLIDATED STATEMENTS OF EQUITY
(continued)
|
December 31, 2018
|
December 31, 2017
|
December 31, 2016
|
|||||||||||||||
|
Shares
|
Amount
|
Shares
|
Amount
|
Shares
|
Amount
|
||||||||||||
|
Retained earnings
|
|||||||||||||||||
|
Balance as of January 1
|
$
|
233,658
|
|
$
|
222,232
|
|
$
|
(154,949
|
)
|
||||||||
|
Share repurchased
|
(124,977
|
)
|
—
|
|
|||||||||||||
|
Adoption of new accounting standard ASU 2016-09
|
—
|
|
635
|
|
—
|
|
|||||||||||
|
Net income
|
144,360
|
|
10,791
|
|
377,181
|
|
|||||||||||
|
Balance at period end
|
$
|
253,041
|
|
$
|
233,658
|
|
$
|
222,232
|
|
||||||||
|
Accumulated other comprehensive (loss) income
|
|||||||||||||||||
|
Foreign currency adjustments
|
|||||||||||||||||
|
Balance as of January 1
|
$
|
21,985
|
|
$
|
(65,949
|
)
|
$
|
(33,575
|
)
|
||||||||
|
Change during period
|
(64,349
|
)
|
87,934
|
|
(32,374
|
)
|
|||||||||||
|
Balance at period end
|
(42,364
|
)
|
21,985
|
|
(65,949
|
)
|
|||||||||||
|
Unrealized (loss) gain on interest rate hedges
|
|||||||||||||||||
|
Balance as of January 1
|
(8,810
|
)
|
(13,296
|
)
|
(10,617
|
)
|
|||||||||||
|
Change during period
|
2,636
|
|
4,486
|
|
(2,679
|
)
|
|||||||||||
|
Balance at period end
|
(6,174
|
)
|
(8,810
|
)
|
(13,296
|
)
|
|||||||||||
|
Net actuarial pension (loss) gain
|
|||||||||||||||||
|
Balance as of January 1
|
(108,522
|
)
|
(117,937
|
)
|
(118,805
|
)
|
|||||||||||
|
Change during period
|
12,237
|
|
9,415
|
|
868
|
|
|||||||||||
|
Balance at period end
|
(96,285
|
)
|
(108,522
|
)
|
(117,937
|
)
|
|||||||||||
|
Balance at period end
|
$
|
(144,823
|
)
|
$
|
(95,347
|
)
|
$
|
(197,182
|
)
|
||||||||
|
Non-controlling interest
|
|||||||||||||||||
|
Balance as of January 1
|
$
|
—
|
|
$
|
—
|
|
$
|
—
|
|
||||||||
|
Acquisition of non-controlling interest
|
51
|
|
—
|
|
—
|
|
|||||||||||
|
Net loss
|
(87
|
)
|
—
|
|
—
|
|
|||||||||||
|
Foreign currency translation
|
19
|
|
—
|
|
—
|
|
|||||||||||
|
Balance at period end
|
$
|
(17
|
)
|
$
|
—
|
|
$
|
—
|
|
||||||||
|
Total shareholders’ equity at period end
|
$
|
767,807
|
|
$
|
792,037
|
|
$
|
61,592
|
|
||||||||
The accompanying notes are an integral part of these Consolidated Financial Statements.
F-8
JELD-WEN HOLDING, INC.
CONSOLIDATED STATEMENTS OF CASH FLOWS
|
For the Years Ended December 31,
|
||||||||||||
|
(amounts in thousands)
|
2018
|
2017
|
2016
|
|||||||||
|
OPERATING ACTIVITIES
|
||||||||||||
|
Net income
|
$
|
144,273
|
|
$
|
10,791
|
|
$
|
377,181
|
|
|||
|
Adjustments to reconcile net income to cash used in operating activities:
|
||||||||||||
|
Depreciation and amortization
|
125,100
|
|
111,273
|
|
107,995
|
|
||||||
|
Deferred income taxes
|
(34,676
|
)
|
96,776
|
|
(265,756
|
)
|
||||||
|
(Gain) loss on sale of business units, property and equipment
|
845
|
|
206
|
|
(3,275
|
)
|
||||||
|
Adjustment to carrying value of assets
|
1,230
|
|
1,479
|
|
5,221
|
|
||||||
|
Equity earnings in non-consolidated entities
|
(738
|
)
|
(3,639
|
)
|
(3,791
|
)
|
||||||
|
Amortization of deferred financing costs
|
2,107
|
|
9,422
|
|
3,980
|
|
||||||
|
Loss on extinguishment of debt
|
—
|
|
23,262
|
|
—
|
|
||||||
|
Non-cash gain on previously held shares of an equity investment
|
(20,767
|
)
|
—
|
|
—
|
|
||||||
|
Stock-based compensation
|
15,052
|
|
19,785
|
|
22,464
|
|
||||||
|
Contributions to U.S. pension plan
|
(4,125
|
)
|
(10,000
|
)
|
—
|
|
||||||
|
Amortization of U.S. pension expense
|
9,314
|
|
12,680
|
|
12,264
|
|
||||||
|
Other items, net
|
3,158
|
|
(8,170
|
)
|
(5,283
|
)
|
||||||
|
Net change in operating assets and liabilities, net of effect of acquisitions:
|
||||||||||||
|
Accounts receivable
|
16,792
|
|
660
|
|
(79,860
|
)
|
||||||
|
Inventories
|
(35,529
|
)
|
(32,028
|
)
|
14,749
|
|
||||||
|
Other assets
|
(19,865
|
)
|
(5,657
|
)
|
(10,799
|
)
|
||||||
|
Accounts payable and accrued expenses
|
37,230
|
|
26,714
|
|
27,569
|
|
||||||
|
Change in short term and long term tax liabilities
|
(19,748
|
)
|
12,239
|
|
(1,004
|
)
|
||||||
|
Net cash provided by operating activities
|
219,653
|
|
265,793
|
|
201,655
|
|
||||||
|
INVESTING ACTIVITIES
|
||||||||||||
|
Purchases of property and equipment
|
(97,399
|
)
|
(59,599
|
)
|
(74,033
|
)
|
||||||
|
Proceeds from sale of business units, property and equipment
|
1,973
|
|
2,713
|
|
7,614
|
|
||||||
|
Purchase of intangible assets
|
(21,301
|
)
|
(3,450
|
)
|
(5,464
|
)
|
||||||
|
Purchases of businesses, net of cash acquired
|
(167,688
|
)
|
(131,448
|
)
|
(85,866
|
)
|
||||||
|
Cash received for notes receivable
|
274
|
|
1,991
|
|
967
|
|
||||||
|
Net cash used in investing activities
|
(284,141
|
)
|
(189,793
|
)
|
(156,782
|
)
|
||||||
|
FINANCING ACTIVITIES
|
||||||||||||
|
Distributions paid
|
—
|
|
—
|
|
(404,198
|
)
|
||||||
|
Change in long-term debt
|
70,468
|
|
(389,665
|
)
|
349,836
|
|
||||||
|
Payments of notes payable
|
—
|
|
(205
|
)
|
(180
|
)
|
||||||
|
Employee note repayments
|
39
|
|
26
|
|
2,336
|
|
||||||
|
Contingent consideration for acquisitions
|
(3,701
|
)
|
—
|
|
||||||||
|
Common stock issued for exercise of options
|
201
|
|
1,029
|
|
1,187
|
|
||||||
|
Common stock repurchased
|
(125,030
|
)
|
—
|
|
—
|
|
||||||
|
Payments to tax authority for employee share-based compensation
|
(9,452
|
)
|
(25,335
|
)
|
(982
|
)
|
||||||
|
Proceeds from sale of common stock, net of underwriting fees and commissions
|
—
|
|
480,306
|
|
—
|
|
||||||
|
Payments associated with initial public offering
|
—
|
|
(2,066
|
)
|
—
|
|
||||||
|
Net cash provided by financing activities
|
(67,475
|
)
|
64,090
|
|
(52,001
|
)
|
||||||
|
Effect of foreign currency exchange rates on cash
|
(6,648
|
)
|
12,692
|
|
(3,697
|
)
|
||||||
|
Net (decrease) increase in cash and cash equivalents
|
(138,611
|
)
|
152,782
|
|
(10,825
|
)
|
||||||
|
Cash, cash equivalents and restricted cash, beginning
|
256,234
|
|
103,452
|
|
114,277
|
|
||||||
|
Cash, cash equivalents and restricted cash, ending
|
$
|
117,623
|
|
$
|
256,234
|
|
$
|
103,452
|
|
|||
|
For further information see Footnote 31 -
Supplemental Cash Flow.
|
||||||||||||
The accompanying notes are an integral part of these Consolidated Financial Statements.
F-9
JELD-WEN HOLDING, INC.
NOTES TO CONSOLIDATED FINANCIAL STATEMENTS
Note 1. Description of Company and Summary of Significant Accounting Policies
Nature of Business
– JELD-WEN Holding, Inc., along with its subsidiaries, is a vertically integrated global manufacturer and distributor of windows and doors that derives substantially all of its revenues from the sale of its door and window products. Unless otherwise specified or the context otherwise requires, all references in these notes to “JELD-WEN,” “we,” “us,” “our,” or the “Company” are to JELD-WEN Holding, Inc. and its subsidiaries.
We have facilities located in the U.S., Canada, Europe, Australia, Asia, Mexico, and South America, and our products are marketed primarily under the JELD-WEN brand name in the U.S. and Canada and under JELD-WEN and a variety of acquired brand names in Europe, Australia and Asia.
Our revenues are affected by the level of new housing starts and remodeling activity in each of our markets. Our sales typically follow seasonal new construction and repair and remodeling industry patterns. The peak season for home construction and remodeling in many of our markets generally corresponds with the second and third calendar quarters, and therefore, sales volume is typically higher during those quarters. Our first and fourth quarter sales volumes are generally lower due to reduced repair and remodeling activity and reduced activity in the building and construction industry as a result of colder and more inclement weather in certain of our geographic end markets.
Basis of Presentation
– As a result of our retrospective application of ASU 2017-07,
Improving the Presentation of Net Periodic Pension Cost and Net Periodic Postretirement Benefit Cost
, we reclassified certain amounts in our statement of operations for the
year ended
December 31, 2017
and
December 31, 2016
as noted below. See “Recently Adopted Accounting Standards
”
below for additional information.
In addition, to conform with current-period presentation of revenues, we reclassified certain amounts in our statement of operations for the
year ended
December 31, 2017
and
December 31, 2016
. The reclassification was not material to our previously issued financial statements and is summarized in the “Reclassification” column in the table below.
|
Year Ended
|
|||||||||||||||
|
December 31, 2017
|
|||||||||||||||
|
(amounts in thousands, except per share data)
|
As Reported
|
ASU 2017-07
|
Re-classification
*
|
As Revised
|
|||||||||||
|
Consolidated Statement of Operations:
|
|||||||||||||||
|
Net revenues
|
$
|
3,763,934
|
|
$
|
—
|
|
$
|
(185
|
)
|
$
|
3,763,749
|
|
|||
|
Cost of sales
|
2,915,736
|
|
—
|
|
(1,409
|
)
|
2,914,327
|
|
|||||||
|
Gross margin
|
848,198
|
|
—
|
|
1,224
|
|
849,422
|
|
|||||||
|
Selling, general and administrative
|
585,074
|
|
(12,616
|
)
|
—
|
|
572,458
|
|
|||||||
|
Operating income
|
250,068
|
|
12,616
|
|
1,224
|
|
263,908
|
|
|||||||
|
Other expense
|
2,017
|
|
12,616
|
|
1,224
|
|
15,857
|
|
|||||||
|
|
|||||||||||||||
|
Year Ended
|
|||||||||||||||
|
December 31, 2016
|
|||||||||||||||
|
(amounts in thousands, except per share data)
|
As Reported
|
ASU 2017-07
|
Re-classification
*
|
As Revised
|
|||||||||||
|
Consolidated Statement of Operations:
|
|||||||||||||||
|
Net revenues
|
$
|
3,666,799
|
|
$
|
—
|
|
$
|
143
|
|
$
|
3,666,942
|
|
|||
|
Cost of sales
|
2,892,248
|
|
—
|
|
(1,354
|
)
|
2,890,894
|
|
|||||||
|
Gross margin
|
774,551
|
|
—
|
|
1,497
|
|
776,048
|
|
|||||||
|
Selling, general and administrative
|
565,619
|
|
(12,738
|
)
|
—
|
|
552,881
|
|
|||||||
|
Operating income
|
195,085
|
|
12,738
|
|
1,497
|
|
209,320
|
|
|||||||
|
Other expense
|
(12,825
|
)
|
12,738
|
|
1,497
|
|
1,410
|
|
|||||||
* Note: reclassification relates entirely to revenue in our North America segment.
F-10
All U.S. dollar and other currency amounts, except per share amounts, are presented in thousands unless otherwise noted.
Ownership
– On
October 3, 2011
, Onex
invested
$700.0 million
in return for shares of our Series A Convertible Preferred Stock. Concurrent with the investment, Onex provided
$171.0 million
in the form of a convertible bridge loan due in
April 2013
. In
October 2012
, Onex invested an additional
$49.8 million
in return for additional shares of our Series A Convertible Preferred Stock to fund an acquisition. In
April 2013
, the
$71.6 million
outstanding balance of the convertible bridge loan was converted into additional shares of our Series A Convertible Preferred Stock. In
March 2014
, Onex purchased
$65.8 million
in common stock from another investor. As part of the IPO, Onex sold
6,477,273
shares of our Common Stock. In
May 2017
and November 2017, Onex sold a total of
15,693,139
and
14,211,736
shares of our Common Stock, respectively, in secondary offerings. We did not receive any proceeds from the shares of Common Stock sold by Onex, in any offering. As of
December 31, 2018
, Onex owned approximately
32.4%
of the outstanding shares of our Common Stock.
Stock Split
– On January 3, 2017, our shareholders approved amendments to our then-existing certificate of incorporation increasing the authorized number of shares and effecting an
11
-for-1 stock split of our then-outstanding common stock and Class B-1 Common Stock. Accordingly, all share and per share amounts for all periods presented in these consolidated financial statements and notes thereto have been adjusted to reflect this stock split.
Stock Conversion and Initial Public Offering
– Prior to the IPO, we had the authority to issue up to
8,750,000
shares of preferred stock, par value of
$0.01
, of which
8,749,999
shares were designated as Series A Convertible Preferred Stock and
one
share was designated as Series B Preferred Stock. Series A Convertible Preferred Stock consisted of
2,922,634
shares of Series A-1 Stock,
208,760
shares of Series A-2 Stock,
843,132
shares of Series A-3 Stock, and
4,775,473
shares of Series A-4 Stock.
On February 1, 2017, immediately prior to the closing of our IPO, the outstanding shares of our Series A Convertible Preferred Stock and all accumulated and unpaid dividends converted into
64,211,172
shares of our Common Stock, and all of the outstanding shares of our Class B-1 Common Stock converted into
309,404
shares of our Common Stock. In addition, the
one
outstanding share of our Series B Preferred Stock was canceled. We filed our Charter with the Secretary of State of the State of Delaware, and our Bylaws became effective, each as contemplated by the registration statement we filed as part of our IPO. The Charter, among other things, provided that our authorized capital stock consists of
900,000,000
shares of Common Stock, par value
$0.01
per share and
90,000,000
shares of preferred stock, par value
$0.01
per share.
On February 1, 2017, we closed our IPO and received
$472.4 million
in proceeds, net of underwriting discounts, fees and commissions and
$7.9 million
of offering expenses from the issuance of
22,272,727
shares of our Common Stock.
Share Repurchases
– In April 2018, our Board of Directors authorized the repurchase of up to
$250.0 million
of our Common Stock. Share repurchases are recorded on their trade date and reduce shareholders’ equity and increase accounts payable. Repurchased shares are retired, and the excess of the repurchase price over the par value of the shares is charged to retained earnings. We have repurchased
5,287,964
shares for total consideration of
$125.0 million
through
December 31, 2018
.
Fiscal Year
– We operate on a fiscal calendar year, and each interim quarter is comprised of
two
4
-week periods and
one
5
-week period, with each week ending on a Saturday. Our fiscal year always begins on
January 1
and ends on December 31. As a result, our first and fourth quarters may have more or fewer days included than a traditional
91
-day fiscal quarter.
Use of Estimates
– The preparation of consolidated financial statements in conformity with GAAP requires management to make estimates and assumptions that affect amounts reported in the consolidated financial statements and related notes. Significant items that are subject to such estimates and assumptions include, but are not limited to, long-lived assets including goodwill and other intangible assets, employee benefit obligations, income tax uncertainties, contingent assets and liabilities, provisions for bad debt, inventory, warranty liabilities, legal claims, valuation of derivatives, environmental remediation and claims relating to self-insurance. Actual results could differ due to the uncertainty inherent in the nature of these estimates.
Segment Reporting
– Our reportable segments are organized and managed principally by geographic region: North America, Europe and Australasia. We report all other business activities in Corporate and unallocated costs. In addition to similar economic characteristics, we also consider the following factors in determining the reportable segments: the nature of business activities, the management structure directly accountable to our chief operating decision maker for operating
F-11
and administrative activities, the discrete financial information regularly reviewed by the chief operating decision maker, and information presented to the Board of Directors and investors. No segments have been aggregated for our presentation.
Acquisitions
– We apply the provisions of FASB ASC Topic 805,
Business Combinations
, in the accounting for our acquisitions. It requires us to recognize separately from goodwill the assets acquired and the liabilities assumed, at their acquisition date fair values. Goodwill as of the acquisition date is measured as the excess of consideration transferred and the net of the acquisition date fair values of the assets acquired and the liabilities assumed. While we use our best estimates and assumptions to accurately value assets acquired and liabilities assumed at the acquisition date as well as contingent consideration, where applicable, our estimates are inherently uncertain and subject to refinement. As a result, during the measurement period, which may be up to one year from the acquisition date, material adjustments must be reflected in the reporting period in which the adjustment amount is determined. Upon the conclusion of the measurement period or final determination of the values of assets acquired or liabilities assumed, whichever comes first, any subsequent adjustments are recorded in the current period in our consolidated statements of operations.
For a given acquisition, we may identify certain pre-acquisition contingencies as of the acquisition date and may extend our review and evaluation of these pre-acquisition contingencies throughout the measurement period in order to obtain sufficient information to assess whether we include these contingencies as a part of the fair value estimates of assets acquired and liabilities assumed and, if so, to determine their estimated amounts.
If we cannot reasonably determine the fair value of a pre-acquisition contingency (non-income tax related) by the end of the measurement period, we will recognize an asset or a liability for such pre-acquisition contingency if: (a) it is probable that an asset existed or a liability had been incurred at the acquisition date and (b) the amount of the asset or liability can be reasonably estimated. Subsequent to the measurement period, changes in our estimates of such contingencies will affect earnings and could have a material effect on our results of operations and financial position.
In addition, uncertain tax positions and tax related valuation allowances assumed in connection with a business combination are initially estimated as of the acquisition date. We re-evaluate these items quarterly based upon facts and circumstances that existed as of the acquisition date. Subsequent to the measurement period or our final determination of the tax allowance’s or contingency’s estimated value, whichever comes first, changes to these uncertain tax positions and tax related valuation allowances will affect our provision for income taxes in our consolidated statements of operations and could have a material impact on our results of operations and financial position.
Cash and Cash Equivalents
– We consider all highly-liquid investments purchased with an original or remaining maturity at the date of purchase of three months or less to be cash equivalents. Our cash management system is designed to maintain zero bank balances at certain banks. Checks written and not presented to these banks for payment are reflected as book overdrafts and are a component of accounts payable.
Restricted Cash
– Restricted cash consists primarily of cash deposits required to meet certain bank guarantees and projected self-insurance obligations. New funding is generated from employees’ portion of contributions and is added to the deposit account weekly as claims are paid.
Accounts Receivable
– Accounts receivable are recorded at their net realizable value. Our customers are primarily retailers, distributors and contractors. As of
December 31, 2018
, one customer accounted for
16.0%
of the consolidated accounts receivable balance. As of
December 31, 2017
, one customer accounted for
16.9%
of the consolidated accounts receivable balance. We maintain allowances for doubtful accounts for estimated losses resulting from the inability of our customers to make required payments. We estimate the allowance for doubtful accounts based on a variety of factors including the length of time receivables are past due, the financial health of our customers, unusual macroeconomic conditions and historical experience. If the financial condition of a customer deteriorates or other circumstances occur that result in an impairment of a customer’s ability to make payments, we record additional allowances as needed. We write off uncollectible trade accounts receivable against the allowance for doubtful accounts when collection efforts have been exhausted and/or any legal action taken by us has concluded.
Inventories
– Inventories in the accompanying consolidated balance sheets are valued at the lower of cost or net realizable value and are determined by the first-in, first-out (“FIFO”) or average cost methods. We record provisions to write-down obsolete and excess inventory to its estimated net realizable value. The process for evaluating obsolete and excess inventory requires us to make subjective judgments and estimates concerning future sales levels, quantities and prices at which such inventory will be able to be sold in the normal course of business. Accelerating the disposal process or incorrect estimates of future sales potential may cause actual results to differ from the estimates at the time such inventory is disposed or sold. We classify certain inventories that are available for sale directly to external customers or used in the manufacturing of a finished good within raw materials.
F-12
Notes Receivable
– Notes receivable are recorded at their net realizable value. The balance consists primarily of installment notes and affiliate notes. The allowance for doubtful notes is based upon historical loss trends and specific reviews of delinquent notes. We write off uncollectible note receivables against the allowance for doubtful accounts when collection efforts have been exhausted and/or any legal action taken by us has been concluded. Current maturities and interest, net of short-term allowance are reported as other current assets.
Customer Displays
– Customer displays include all costs to manufacture, ship and install the displays of our products in retail store locations. Capitalized display costs are included in other assets and are amortized over the life of the product lines, typically
3
to
4 years
. Related amortization is included in SG&A expense in the accompanying consolidated statements of operations and was
$9.0 million
in
2018
,
$8.6 million
in
2017
, and
$8.8 million
in
2016
.
Property and Equipment
– Property and equipment are recorded at cost. The cost of major additions and betterments are capitalized and depreciated using the straight-line method over their estimated useful lives while replacements, maintenance and repairs that do not improve or extend the useful lives of the related assets or adapt the property to a new or different use are expensed as incurred. Interest over the construction period is capitalized as a component of cost of constructed assets. Upon sale or retirement of property or equipment, cost and related accumulated depreciation are removed from the accounts and any gain or loss is charged to income.
Leasehold improvements are amortized over the shorter of the useful life of the improvement, the lease term, or the life of the building. Depreciation is generally provided over the following estimated useful service lives:
|
Land improvements
|
10 - 20 years
|
|
Buildings
|
15 - 45 years
|
|
Machinery and equipment
|
3 - 20 years
|
Intangible Assets
–Intangible assets are accounted for in accordance with ASC 350,
Intangibles – Goodwill
and Other
. Definite lived intangible assets are amortized based on the pattern of economic benefit over the following estimated useful lives:
|
Trademarks and trade names
|
3 - 40 years
|
|
Software
|
2 - 20 years
|
|
Licenses and rights
|
5 - 15 years
|
|
Customer relationships
|
2 - 20 years
|
|
Patents
|
5 - 25 years
|
The lives of definite lived intangible assets are reviewed and reduced if necessary whenever changes in their
planned use occur. Legal and registration costs related to internally-developed patents and trademarks are
capitalized and amortized over the lesser of their expected useful life or the legal patent life. Cost and
accumulated amortization are removed from the accounts in the period that an intangible asset becomes
fully amortized. The carrying value of intangible assets is reviewed by management to assess the
recoverability of the assets when facts and circumstances indicate that the carrying value may not be
recoverable. The recoverability test requires us to first compare undiscounted cash flows expected to be
generated by that definite lived intangible asset or asset group to its carrying amount. If the carrying
amounts of the definite lived intangible assets are not recoverable on an undiscounted cash flow basis, an
impairment charge is recognized to the extent that the carrying amount exceeds its fair value. Fair value is determined through various valuation techniques.
Our valuation of identifiable intangible assets acquired is based on information and assumptions available to
us at the time of acquisition, using income and market approaches to determine fair value. We do not
amortize our indefinite-lived intangible assets, but test for impairment annually, or when indications of
potential impairment exist. For intangible assets other than goodwill, if the carrying value exceeds the fair
value, we recognize an impairment loss in an amount equal to the excess.
No
material impairments were
identified during fiscal years
2018
,
2017
and
2016
.
We capitalize certain qualified internal use software costs during the application development stage and subsequently amortize these costs over the estimated useful life of the asset. Costs incurred during the preliminary project stage and post-implementation operation stage are expensed as incurred.
Long-Lived Assets
– Long-lived assets, other than goodwill, are reviewed for impairment whenever events
or changes in circumstances indicate the carrying amount of such assets may not be recoverable. The first
step in an impairment review is to forecast the expected undiscounted cash flows generated from the
anticipated use and eventual disposition of the asset. If
F-13
the expected undiscounted cash flows are less than
the carrying value of the asset, then an impairment charge is required to reduce the carrying value of the
asset to fair value. Long-lived assets currently available for sale and expected to be sold within one year are
classified as held for sale in other current assets.
Goodwill
– Goodwill is tested for impairment on an annual basis and between annual tests if indicators of potential impairment exist, using a fair-value-based approach. Current accounting guidance provides an entity the option to perform a qualitative assessment to determine whether it is more-likely-than-not that the fair value of a reporting unit is less than its carrying amount prior to performing the two-step goodwill impairment test. If this is the case, the two-step goodwill impairment test is required. If it is more-likely-than-not that the fair value of a reporting unit is greater than its carrying amount, the two-step goodwill impairment test is not required.
If the two-step goodwill impairment test is required, first, the fair value of the reporting unit is compared with its carrying amount (including attributable goodwill). If the fair value of the reporting unit is less than its carrying amount, an indication of goodwill impairment exists for the reporting unit and the entity must perform step two of the impairment test (measurement). Under step two, an impairment loss is recognized for any excess of the carrying amount of the reporting unit’s goodwill over the implied fair value of that goodwill. The implied fair value of goodwill is determined by allocating the fair value of the reporting unit in a manner similar to a purchase price allocation and the residual fair value after this allocation is the implied fair value of the reporting unit goodwill. Fair value of the reporting unit is determined using a discounted cash flow analysis. If the fair value of the reporting unit exceeds its carrying amount, step two does not need to be performed.
We estimated the fair value of our reporting units using a discounted cash flow model (implied fair value measured on a non-recurring basis using level 3 inputs). Inherent in the development of the discounted cash flow projections are assumptions and estimates derived from a review of our expected revenue growth rates, profit margins, business plans, cost of capital and tax rates. Changes in assumptions or estimates used in our goodwill impairment testing could materially affect the determination of the fair value of a reporting unit, and therefore, could eliminate the excess of fair value over carrying value of a reporting unit and, in some cases, could result in impairment. Such changes in assumptions could be caused by items such as a loss of one or more significant customers, decline in the demand for our products due to changing economic conditions or failure to control cost increases above what can be recouped in sale price increases. These types of changes would negatively affect our profits, revenues and growth over the long term and such a decline could significantly affect the fair value assessment of our reporting units and cause our goodwill to become impaired.
We have completed the required annual testing of goodwill for impairment for all reporting units and have determined that goodwill was not impaired in any years presented.
Warranty Accrual
– Warranty terms range primarily from
one
year to lifetime on certain window and door components. Warranties are normally limited to replacement or service of defective components for the original customer. Some warranties are transferable to subsequent owners and are generally limited to
ten
years from the date of manufacture or require pro-rata payments from the customer. A provision for estimated warranty costs is recorded at the time of sale based on historical experience and we periodically adjust these provisions to reflect actual experience.
Restructuring
– Costs to exit or restructure certain activities of an acquired company or our internal operations are accounted for as one-time termination and exit costs as required by the provisions of FASB ASC 420,
Exit or Disposal Cost Obligations
, and are accounted for separately from any business combination. A liability for costs associated with an exit or disposal activity is recognized and measured at its fair value in our consolidated statements of operations in the period in which the liability is incurred. When estimating the fair value of facility restructuring activities, assumptions are applied regarding estimated sub-lease payments to be received, which can differ materially from actual results. This may require us to revise our initial estimates which may materially affect our results of operations and financial position in the period the revision is made.
Derivative Financial Instruments
– Derivative financial instruments have been used to manage interest rate risk associated with our borrowings and foreign currency exposures related to transactions denominated in currencies other than the U.S. dollar, or in the case of our non-U.S. companies, transactions denominated in a currency other than their functional currency. We record all derivative instruments in the consolidated balance sheets at fair value. Changes in a derivative’s fair value are recognized in earnings unless specific hedge criteria are met and we elect hedge accounting prior to entering into the derivative. If a derivative is designated as a fair value hedge, the changes in fair value of both the derivative and the hedged item attributable to the hedged risk are recognized in the results of operations. If the derivative is designated as a cash flow hedge, changes in the fair value of the derivative are recorded in consolidated other comprehensive income (loss) and subsequently classified to the consolidated statements of operations when the hedged item impacts earnings. At the inception of a fair value or cash flow hedge transaction, we formally document the hedge relationship and the risk
F-14
management objective for undertaking the hedge. In addition, we assess both at inception of the fair value or cash flow hedge and on an ongoing basis, whether the derivative in the hedging transaction has been highly effective in offsetting changes in fair value or cash flows of the hedged item and whether the derivative is expected to continue to be highly effective. The impact of any ineffectiveness is recognized in our consolidated statements of operations.
Revenue Recognition
– Revenue is recognized when obligations under the terms of a contract with our customer are satisfied. Generally, this occurs with the transfer of control of our products or services. Revenue is measured as the amount of consideration we expect to receive in exchange for transferring goods or providing services. The taxes we collect concurrent with revenue-producing activities (e.g., sales tax, value added tax, and other taxes) are excluded from revenue. Incentive payments to customers that directly relate to future business are recorded as a reduction of net revenues over the periods benefited.
Shipping and handling costs and the related expenses are reported as fulfillment revenues and expenses for all customers. Therefore all shipping and handling costs associated with outbound freight are accounted for as fulfillment costs and are included in cost of sales. The expected costs associated with our base warranties and field service actions continue to be recognized as expense when the products are sold (see Note 14 - Warranty Liabilities). Since payment is due at or shortly after the point of sale, the contract asset is classified as a receivable.
We do not adjust the promised amount of consideration for the effects of a significant financing component when we expect, at contract inception, that the period between our transfer of a promised product or service to a customer and when the customer pays for that product or service will be one year or less. We do not typically include extended payment terms in our contracts with customers. Incidental items that are immaterial in the context of the contract are recognized as expense.
Shipping Costs
– Shipping costs charged to customers are included in net revenues. The cost of shipping is included in cost of sales.
Advertising Costs
– All costs of advertising our products and services are charged to expense as incurred. Advertising and promotion expenses included in SG&A expenses were
$43.2 million
in
2018
,
$48.4 million
in
2017
and
$49.1 million
in
2016
.
Interest Expense and Extinguishment of Debt Costs
– We record the debt extinguishment cost separately in the consolidated statements of operations. During
2016
, interest expense was allocated to discontinued operations based on debt that was specifically attributable to those operations.
Foreign Currency Translation and Adjustments
– Typically, our foreign subsidiaries maintain their accounting records in their local currency. All of the assets and liabilities of these subsidiaries (including long-term assets, such as goodwill) are converted to U.S. dollars at the exchange rate in effect at the balance sheet date, income and expense accounts are translated at average rates for the period, and shareholder’s equity accounts are translated at historical rates. The effects of translating financial statements of foreign operations into our reporting currency are recognized as a cumulative translation adjustment in consolidated other comprehensive income (loss). This balance is net of tax, where applicable.
The effects of translating financial statements of foreign operations in which the U.S. dollar is their functional currency are included in the consolidated statements of operations. The effects of translating intercompany debt are recorded in the consolidated statements of operations unless the debt is of a long-term investment nature in which case gains and losses are recorded in consolidated other comprehensive income (loss).
Foreign currency transaction gains or losses are credited or charged to income as incurred.
Income Taxes
– Income taxes are accounted for under the asset and liability method. Deferred tax assets and liabilities are recognized for the future tax consequences attributable to differences between the financial statement carrying amounts of existing assets and liabilities and their respective tax bases and operating loss and tax credit carryforwards. Deferred tax assets and liabilities are measured using enacted tax rates expected to apply to taxable income in the years in which those temporary differences are expected to be recovered or settled. The effect on the deferred tax assets and liabilities of a change in tax rates is recognized in income in the period that includes the enactment date. We evaluate both the positive and negative evidence that is relevant in assessing whether we will realize the deferred tax assets. A valuation allowance is recorded when it is more likely than not that some of the deferred tax assets will not be realized. The tax effects from an uncertain tax position can be recognized in the consolidated financial statements, only if the position is more likely than not to be sustained, based on the technical merits of the position and the jurisdiction taxes of the Company. We recognize the financial statement benefit of a tax position only after determining that the relevant tax authority would more likely than
F-15
not sustain the position following an audit and the tax related to the position would be due to the entity and not the owners. For tax positions meeting the more likely than not threshold, the amount recognized in the consolidated financial statements is the largest benefit that has a greater than
50
percent likelihood of being realized, upon ultimate settlement with the relevant tax authority. We apply this accounting standard to all tax positions for which the statute of limitations remains open. Changes in recognition or measurement are reflected in the period in which the change in judgment occurs.
The Tax Act passed in December 2017 had significant effects on our financial statements. In accordance with Staff Accounting Bulletin No. 118 issued by the SEC in December 2017 immediately following the passage of the Tax Act, we made provisional estimates for certain direct and indirect effects of the Tax Act based on information available to us at that time. In the fourth quarter of 2018, we completed our accounting for all of the enactment-date income tax effects of the Tax Act and recorded adjustments as a component of income tax expense from continuing operations. The Tax Act subjects a U.S. shareholder to current tax on GILTI earned by certain foreign subsidiaries. The FASB Staff Q&A, Topic 740, No. 5, Accounting for Global Intangible Low-Taxed Income, states that we are permitted to make an accounting policy election to either recognize deferred taxes for temporary basis differences expected to reverse as GILTI in future years or provide for the tax expense related to such income in the year the tax is incurred. We have elected to account for the impact of GILTI in the period in which it is incurred.
We file a consolidated federal income tax return in the U.S. and various states. For financial statement purposes, we calculate the provision for federal income taxes using the separate return method. Certain subsidiaries file separate tax returns in certain countries and states. Any U.S. federal, state and foreign income taxes refundable and payable are reported in other current assets and accrued income taxes payable in the consolidated balance sheets. The income taxes refundable and payable relating to the U.S. federal transition tax is reported in other assets in the consolidated balance sheets as of December 31, 2018 and in deferred credits and other liabilities as of December 31, 2017.
We record interest and penalties on amounts due to tax authorities as a component of income tax expense (benefit) in the consolidated statements of operations.
Contingent Liabilities
– Contingent liabilities require significant judgment in estimating potential losses for legal claims. Each quarter, we review significant new claims and litigation for the probability of an adverse outcome. Estimates are recorded as liabilities when it is probable that a liability has been incurred and the amount of the loss is reasonably estimable. Disclosure is required when there is a reasonable possibility that the ultimate loss will materially exceed the recorded provision. Contingent liabilities are often resolved over long time periods. Estimating probable losses requires analysis of multiple forecasts that often depend on judgments about potential actions by third parties such as regulators, and the estimated loss can change materially as individual claims develop.
Employee Retirement and Pension Benefits
– We have a defined benefit plan available to certain U.S. hourly employees and several other defined benefit plans located outside of the U.S. that are country specific. The most significant of these plans is in the U.S. which is no longer open to new employees. Amounts relating to these plans are recorded based on actuarial calculations, which use various assumptions, such as discount rates and expected return on assets. See Note 30 -
Employee Retirement and Pension Benefits
.
Recently Adopted Accounting Standards
–
In May 2017, the FASB issued ASU No. 2017-09,
Compensation - Stock Compensation (Topic 718): Scope of Modification Accounting
. The ASU provides guidance as to which changes to the terms or conditions of a share-based payment award require an entity to apply modification accounting in Topic 718. We adopted this ASU in the first quarter of 2018 and the adoption of this standard did not impact our consolidated financial statements; however, modification accounting is now required only if the fair value, the vesting conditions, or the classification of the award (as equity or liability) changes as a result of the change in terms or conditions.
In March 2017, the FASB issued ASU No. 2017-07,
Improving the Presentation of Net Periodic Pension Cost and Net Periodic Postretirement Benefit Cost,
which changes how employers that sponsor defined benefit pension or other postretirement benefit plans present the net periodic benefit cost in the income statement. We adopted this ASU using the retrospective transition method in the first quarter of 2018 and applied the practical expedient that permits an employer to use the amounts disclosed in its pension and other postretirement benefit plan note for the prior comparative periods as the estimation basis for applying the retrospective presentation requirements. We report the service cost component of the net periodic pension and post-retirement costs in the same line item in our statement of operations as other compensation costs arising from services rendered by the employees during the period for both our U.S. and Non-U.S. plans. The other components of net periodic pension and post-retirement costs are presented in other income in the consolidated statements of operations. We adjusted our consolidated statements of operations in all comparative periods presented as noted in “Basis of Presentation,” above and within Note 32 -
Quarterly Financial Data (unaudited)
.
F-16
In January 2017, the FASB issued ASU No. 2017-01,
Business Combinations (Topic 805)
:
Clarifying the Definition of a Business
. The amendments in this ASU provide new guidance to determine when a set of transferred assets and activities is a business. The guidance requires an entity to evaluate if substantially all of the fair value of the gross assets acquired is concentrated in an identifiable asset or group of similar identifiable assets. If this threshold is met, the set of transferred assets is not a business. If the threshold is not met, the entity then must evaluate whether the set includes, at a minimum, an input and a substantive process that together significantly contribute to the ability to create outputs. This ASU removes the evaluation of whether a market participant could replace missing elements. The amendments also narrow the definition of the term output so that the term is consistent with how outputs are described in Topic 606. We adopted this standard prospectively in the first quarter of 2018.
In
October 2016
, the FASB issued ASU No. 2016-16,
Income Taxes (Topic 740): Intra-Entity Transfers of Assets Other Than Inventory.
The standard requires an entity to recognize the income tax consequences of an intra-entity transfer of an asset other than inventory when the transfer occurs. The amendments in this update eliminate the exception for an intra-entity transfer of an asset other than inventory. The amendments do not include new disclosure requirements; however, existing disclosure requirements might be applicable when accounting for the current and deferred income taxes for an intra-entity transfer of an asset other than inventory. We adopted this ASU in the first quarter of 2018 on a modified retrospective basis and the adoption did not have a material impact on our consolidated financial statements.
In January 2016, the FASB issued ASU No. 2016-01,
Financial Instruments (Subtopic 825-10): Recognition and Measurement of Financial Assets and Financial Liabilities
. This ASU enhances the reporting model for financial instruments to provide users of financial statements with more decision-useful information by requiring equity investments to be measured at fair value with changes in fair value recognized in net income. It simplifies the impairment assessment of equity investments without readily determinable fair values by requiring a qualitative assessment to identify impairment and eliminates the requirement to disclose the fair value of financial instruments measured at amortized cost for entities that are not public business entities. It also requires an entity to present separately in other comprehensive income (loss) the portion of the total change in the fair value of a liability resulting from a change in the instrument-specific credit risk when the entity has elected to measure the liability at fair value in accordance with the fair value option for financial instruments and requires separate presentation of financial assets and financial liabilities by measurement category and form of financial asset on the balance sheet or the accompanying notes to the consolidated financial statements. We adopted this ASU in the first quarter of 2018 and the adoption did not have a material impact on our consolidated financial statements.
In May 2014, the FASB issued ASU No. 2014-09,
Revenue from Contracts with Customers (ASC 606)
as modified by subsequently issued ASU No. 2016-08 -
Principal versus Agent Considerations (Reporting Revenue Gross versus Net)
and ASU Nos. 2015-14, 2016-10, 2016-12 and 2016-20 (collectively ASU No. 2014-09). ASU No. 2014-09 superseded existing revenue recognition standards with a single model unless those contracts were within the scope of other standards. ASC 606 is a comprehensive new revenue recognition model that requires revenue to be recognized in a manner to depict the transfer of goods or services and satisfaction of performance obligations to a customer at an amount that reflects the consideration expected to be received in exchange for those goods or services.
We adopted ASU No. 2014-09 in the first quarter of 2018, using the modified retrospective transition practical expedient that allows us to evaluate the impact of contracts as of the adoption date rather than evaluating the impact of the contracts at the time they occurred prior to the adoption date. There was no material effect associated with the election of this practical expedient. As a practical expedient, shipping and handling fee revenues and the related expenses are reported as fulfillment revenues and expenses for all customers. Therefore, all shipping and handling costs associated with outbound freight are accounted for as fulfillment costs and are included in cost of sales. As a practical expedient, we do not adjust the promised amount of consideration for the effects of a significant financing component when we expect, at contract inception, that the period between our transfer of a promised product or service to a customer and when the customer pays for that product or service will be one year or less. We do not typically include extended payment terms in our contracts with customers. We have also elected not to provide the remaining performance obligations disclosures related to service contracts in accordance with the practical expedient in ASC 606-10-50-14. We recognize revenue in the amount to which the entity has a right to invoice and have adopted this election to not provide the remaining performance obligations related to service contracts. See Note 21 -
Revenue Recognition
for additional information.
Recent Accounting Standards Not Yet Adopted
– In August 2018, the FASB issued ASU No. 2018-15,
Intangibles - Goodwill and Other - Internal-Use Software (Subtopic 350-40): Customer’s Accounting for Implementation Costs Incurred in a Cloud Computing Arrangement That is a Service Contract,
which
clarifies the accounting treatment for implementation costs for cloud computing arrangements (hosting arrangements) that are service contracts. This guidance is effective for fiscal years beginning after December 15, 2019, including interim periods within that fiscal year. Early adoption is permitted. We are currently assessing the effect that this ASU will have on our financial statements and disclosures.
F-17
In August 2018, the FASB issued ASU No. 2018-14,
Compensation - Retirement Benefits - Defined Benefit Plans - General (Subtopic 715-20): Disclosure Framework - Changes to the Disclosure Requirements for Defined Benefit Plans,
which
adds, modifies and clarifies several disclosure requirements for employers that sponsor defined benefit pension or other post retirement plans. This guidance is effective for fiscal years ending after December 15, 2020. Early adoption is permitted. We are currently assessing the effect that this ASU will have on our disclosures.
In August 2018, the FASB issued ASU No. 2018-13,
Fair Value Measurement (Topic 820): Disclosure Framework - Changes to the Disclosure Requirements for Fair Value Measurement,
which
adds, modifies and removes several disclosure requirements relative to the three levels of inputs used to measure fair value in accordance with
Topic 820, Fair Value Measurement
. This guidance is effective for fiscal years beginning after December 15, 2019, including interim periods within that fiscal year. Early adoption is permitted. We are currently assessing the effect that this ASU will have on our disclosures.
In June 2018, the FASB issued ASU No. 2018-07 -
Compensation - Stock Compensation (Topic 718) Improvements to Non-employee Share-Based Payment Accounting,
which simplifies the accounting for share-based payments granted to nonemployees for goods and services. Under ASU No. 2018-07, most of the guidance on such payments to non-employees would be aligned with the requirements for share-based payments granted to employees. The standard is effective for fiscal years beginning after December 15, 2018, including interim periods within those fiscal years. Early adoption is permitted for any interim and annual financial statements that have not yet been issued. The adoption of this guidance is not expected to have a material impact on our consolidated financial statements.
In February 2018, the FASB issued ASU No. 2018-02,
Income Statement - Reporting Comprehensive Income (Topic 220): Reclassification of Certain Tax Effects from Accumulated Other Comprehensive Income,
which allows a reclassification from accumulated other comprehensive income (loss) to retained earnings for stranded tax effects resulting from the Tax Act. The standard is effective for fiscal years beginning after December 15, 2018, including interim periods within those fiscal years. Early adoption is permitted for any interim and annual financial statements that have not yet been issued. The adoption of this guidance is not expected to have a material impact on our consolidated financial statements.
In August 2017, the FASB issued ASU No. 2017-12,
Derivatives and Hedging (Topic 815): Targeted Improvements to Accounting for Hedging Activities
. The targeted amendments help simplify certain aspects of hedge accounting and result in a more accurate portrayal of the economics of an entity’s risk management activities in its financial statements. For cash flow and net investment hedges as of the adoption date, the guidance requires a modified retrospective approach. In October 2018, the FASB issued ASU No. 2018-16,
ASU 2018-16, Derivatives and Hedging (Topic 815): Inclusion of the Secured Overnight Financing Rate (SOFR) Overnight Index Swap (OIS) Rate as a Benchmark Interest Rate for Hedge Accounting Purposes,
which adds the overnight index swap rate (OIS) rate based on the secured overnight financing rate as a fifth U.S. benchmark interest rate. The guidance is effective for annual periods beginning after December 15, 2018 and interim periods within those years, with early adoption permitted. The adoption of this guidance is not expected to have a material impact on our consolidated financial statements.
In January 2017, the FASB issued ASU No. 2017-04,
Intangibles—Goodwill and Other (Topic 350): Simplifying the Test for Goodwill Impairment
. To simplify the measurement of goodwill impairments, this ASU eliminates Step 2 from the goodwill impairment test, which required the calculation of the implied fair value of goodwill. Instead, under the amendments in this ASU, an entity should perform its annual, or interim, goodwill impairment test by comparing the fair value of a reporting unit with its carrying amount. The guidance will be effective for annual or any interim goodwill impairment tests in fiscal years beginning after December 15, 2019. Early adoption is permitted for interim or annual goodwill impairment tests performed on testing dates after January 1, 2017. The adoption of this guidance is not expected to have a material impact on our consolidated financial statements.
In June 2016, the FASB issued ASU No. 2016-13,
Financial Instruments-Credit Losses (Topic 326): Measurement of Credit Losses on Financial Instruments.
The standard requires the measurement and recognition of expected credit losses for financial assets held at amortized cost and adds an impairment model that is based on expected losses rather than incurred losses. This guidance is effective for fiscal years beginning after December 15, 2019. Early adoption is permitted. We are currently assessing the effect that this ASU will have on internal processes and our disclosures.
In February 2016, the FASB issued ASU No. 2016-02,
Leases (Topic 842) Section A - Leases: Amendments to the FASB Accounting Standards Codification
. The standard requires lessees to recognize the assets and liabilities arising from leases on the balance sheet and retains a distinction between finance leases and operating leases. The classification criteria for distinguishing between finance leases and operating leases are substantially similar to the classification criteria for distinguishing between capital leases and operating leases in the previous lease guidance. The accounting standard is effective for annual periods beginning after December 15, 2018, including interim periods within those fiscal years, with
F-18
early adoption permitted. We are currently finalizing our lease population, reviewing key terms and information of lease data included within our technology solution and evaluating and testing financial outputs that will impact our financial statements. We will adopt the practical expedients outlined in ASU 2018-01,
Leases (Topic 842) Land Easement Practical Expedient for transition to ASC 842
, the additional transition method outlined in ASU 2018-11,
Leases (Topic 842) Targeted Improvements,
and the accounting policy election outlined in ASU 2018-20,
Leases (Topic 842) Narrow-scope Improvements for Lessors
. Under this new transition method, we will apply the new standard at the adoption date and recognize a cumulative-effect adjustment to the opening balance of retained earnings in the period of adoption. The adoption of this standard will result in the recognition of a lease liability and related right-of-use asset (at their present values) related to predominantly all of the annual minimum lease payments disclosed in Note 29 -
Commitments and Contingencies
. These balances will be materially adjusted for renewal options applied on the date of adoption relating to leases we plan to extend beyond the minimum term on the lease. We expect the adoption of this standard will materially impact our consolidated balance sheet.
Note 2. Acquisitions
For the
year
ended
December 31, 2018
, we completed the following acquisitions:
|
•
|
In April 2018, we acquired the assets of D&K, a long-standing supplier of cavity sliders to our Corinthian Doors business. D&K is now part of our Australasia segment.
|
|
•
|
In March 2018, we acquired the remaining issued and outstanding shares and membership interests of ABS, a premier supplier of value-added services for the millwork industry located in Sacramento, California. ABS is now part of our North America segment.
|
|
•
|
In February 2018, we acquired all of the issued and outstanding shares of A&L, a leading manufacturer of residential aluminum windows and patio doors. A&L is now part of our Australasia segment.
|
|
•
|
In February 2018, we acquired the Domoferm Group of companies from Domoferm International GmbH. The Domoferm Group of companies is a leading provider of steel doors, steel door frames, and fire doors for commercial and residential markets. Domoferm is now part of our Europe segment.
|
F-19
The preliminary fair values of the assets and liabilities acquired of the completed acquisitions are summarized below:
|
(amounts in thousands)
|
Preliminary Allocation
|
Measurement Period Adjustment
|
Revised Preliminary Allocation
|
||||||||
|
Fair value of identifiable assets and liabilities:
|
|||||||||||
|
Accounts receivable
|
$
|
58,714
|
|
$
|
(1,016
|
)
|
$
|
57,698
|
|
||
|
Inventories
|
97,305
|
|
(8,069
|
)
|
89,236
|
|
|||||
|
Other current assets
|
14,910
|
|
(6,137
|
)
|
8,773
|
|
|||||
|
Property and equipment
|
53,128
|
|
26,170
|
|
79,298
|
|
|||||
|
Identifiable intangible assets
|
70,057
|
|
(1,363
|
)
|
68,694
|
|
|||||
|
Goodwill
|
64,950
|
|
(4,600
|
)
|
60,350
|
|
|||||
|
Other assets
|
7,283
|
|
(2,993
|
)
|
4,290
|
|
|||||
|
Total assets
|
$
|
366,347
|
|
$
|
1,992
|
|
$
|
368,339
|
|
||
|
Accounts payable
|
29,512
|
|
(6,097
|
)
|
23,415
|
|
|||||
|
Current maturities of long-term debt
|
17,278
|
|
803
|
|
18,081
|
|
|||||
|
Other current liabilities
|
27,595
|
|
4,041
|
|
31,636
|
|
|||||
|
Long-term debt
|
47,369
|
|
5,129
|
|
52,498
|
|
|||||
|
Other liabilities
|
17,735
|
|
(805
|
)
|
16,930
|
|
|||||
|
Non-controlling interest
|
(184
|
)
|
235
|
|
51
|
|
|||||
|
Total liabilities
|
$
|
139,305
|
|
$
|
3,306
|
|
$
|
142,611
|
|
||
|
Purchase price:
|
|||||||||||
|
Cash consideration, net of cash acquired
|
$
|
169,002
|
|
$
|
(1,314
|
)
|
$
|
167,688
|
|
||
|
Contingent consideration
|
3,898
|
|
—
|
|
3,898
|
|
|||||
|
Gain on previously held shares
|
20,767
|
|
—
|
|
20,767
|
|
|||||
|
Existing investment in acquired entity
|
33,483
|
|
—
|
|
33,483
|
|
|||||
|
Non-cash consideration related to acquired intercompany balances
|
(108
|
)
|
—
|
|
(108
|
)
|
|||||
|
Total consideration, net of cash acquired
|
$
|
227,042
|
|
$
|
(1,314
|
)
|
$
|
225,728
|
|
||
Preliminary goodwill of
$60.4 million
, calculated as the excess of the purchase price over the fair value of net assets, represents operational efficiencies and sales synergies, and no amount is expected to be tax-deductible. The intangible assets include customer relationships, tradenames, patents and software and will be amortized over a preliminary estimated weighted average amortization period of
16
years. Acquisition-related costs of
$8.1 million
were expensed as incurred and are included in SG&A expense in our accompanying consolidated statements of operations for the
year
ended
December 31, 2018
. The contingent consideration relating to the A&L acquisition was based on underlying business performance through June 2018 and was paid in the third quarter of 2018 in the amount of
$3.7 million
. The gain on previously held shares relates to the remeasurement of our existing
50%
ownership interest to fair value for one of the recent acquisitions. Since their dates of acquisition, the cumulative net revenues and net loss of our 2018 acquisitions were
$508.9 million
and
$26.8 million
, respectively. In December 2018, upon further analysis of the purchase price allocation accounting for the ABS acquisition, we recorded a measurement period adjustment to reverse a
$11.4 million
previously amortized inventory step-up which had been recorded in the initial purchase price allocation for ABS. This amount had previously been amortized to cost of sales during the second quarter. The impact of this adjustment was an increase in goodwill attributed to our acquisition of ABS and a decrease in cost of sales in the fourth quarter of
$11.4 million
. Further, we reclassified purchased finished goods to raw materials in order to conform ABS’s classification with our existing inventory accounting policy.
We evaluated these acquisitions quantitatively and qualitatively and determined them to be insignificant both individually and in the aggregate. Therefore, certain pro forma disclosures under ASC 805-10-50 have been omitted.
During the second and third quarters of 2017, we completed
three
acquisitions for total consideration of approximately
$131.7 million
, net of cash acquired. The excess purchase price over the fair value of net assets acquired of
$25.1 million
and
$46.7 million
was allocated to goodwill and intangible assets, respectively. Goodwill is the excess of the purchase price over the fair value of net assets acquired in business combinations and represents operational efficiencies and sales synergies, and
$14.2 million
is expected to be tax-deductible. The intangible assets include tradenames,
F-20
software, and customer relationships and will be amortized over an estimated weighted average amortization period of
18
years. There were
$1.8 million
of acquisition-related costs included in SG&A expense in the accompanying consolidated statements of operations for the year ended
December 31, 2017
. In 2017, the measurement period adjustment reduced the preliminary allocation of goodwill by
$23.6 million
and increased the preliminary allocation of property and equipment, intangible assets, and cash consideration, net of cash acquired by
$16.7 million
,
$16.3 million
and
$7.7 million
, respectively, with the remaining preliminary allocation changes related to other working capital accounts. In 2018, the measurement period adjustment increased the preliminary allocation of goodwill by
$0.9 million
with the offset primarily to working capital accounts. The purchase price allocation was considered completed within the appropriate remeasurement period for all
three
acquisitions.
During 2016, we completed
two
acquisitions for total consideration of approximately
$85.9 million
, net of cash acquired. The excess purchase price over the fair value of net assets acquired of
$16.8 million
and
$48.0 million
was allocated to goodwill and intangible assets, respectively. Goodwill is the excess of the purchase price over the fair value of net assets acquired in business combinations and represents cost savings from reduced overhead and operational expenses by leveraging our manufacturing footprint, supply chain savings and sales synergies and is not expected to be fully tax-deductible. The intangible assets include technology, tradenames, trademarks, software, permits and customer relationships and are being amortized over a weighted average amortization period of
20
years. Acquisition-related costs of
$1.3 million
were expensed as incurred and are included in SG&A expense in our consolidated statements of operations. In 2016, the measurement period adjustment reduced the preliminary allocation of goodwill and deferred tax liabilities by
$5.9 million
and
$2.2 million
, respectively, and increased the preliminary allocation of intangible assets and property and equipment by
$3.1 million
and
$1.5 million
, respectively, with the remaining preliminary allocation changes related to other working capital accounts. As of September 30, 2017, the purchase price allocation was considered complete for both acquisitions.
The results of the acquisitions are included in our consolidated financial statements from the date of their acquisition.
Note 3. Discontinued Operations and Divestitures
Our discontinued operations consisted primarily of our Silver Mountain resort and real estate located in Idaho which was sold in November 2016 and was included in our Corporate and unallocated cost segment’s assets presented in the accompanying consolidated financial statements. The results of these operations have been removed from the results of continuing operations for all periods presented. As of December 31, 2016, there were no remaining assets or liabilities of discontinued operations separately presented in the consolidated balance sheets.
The results of discontinued operations including the loss on sale of discontinued operations are summarized as follows for the years ended December 31:
|
(amounts in thousands)
|
2018
|
2017
|
2016
|
|||||||||
|
Net revenues
|
$
|
—
|
|
$
|
—
|
|
$
|
7,593
|
|
|||
|
Loss before tax and non-controlling interest
|
—
|
|
—
|
|
(3,513
|
)
|
||||||
|
Loss from discontinued operations, net of tax
|
—
|
|
—
|
|
(3,324
|
)
|
||||||
Note 4. Accounts Receivable
We sell our manufactured products to a large number of customers, primarily in the residential housing construction and remodel sectors, broadly dispersed across many domestic and foreign geographic regions. We perform ongoing credit evaluations of our customers to minimize credit risk. We do not usually require collateral for accounts receivable but will require advance payment, guarantees, a security interest in the products sold to a customer, and/or letters of credit in certain situations. Customer accounts receivable converted to notes receivable are primarily collateralized by inventory or other collateral. One window and door customer from our North America segment represents
14.2%
,
16.8%
, and
16.3%
of net revenues in
2018
,
2017
, and
2016
, respectively.
The following is a roll forward of our allowance for doubtful accounts as of December 31:
|
(amounts in thousands)
|
2018
|
2017
|
2016
|
||||||||
|
Balance as of January 1,
|
$
|
(4,446
|
)
|
$
|
(3,839
|
)
|
$
|
(3,664
|
)
|
||
|
Acquisitions
(Note 2)
|
(1,668
|
)
|
(268
|
)
|
(755
|
)
|
|||||
|
Additions charged to expense
|
(2,470
|
)
|
(1,227
|
)
|
(410
|
)
|
|||||
|
Deductions
|
2,210
|
|
1,260
|
|
1,057
|
|
|||||
|
Currency translation
|
384
|
|
(372
|
)
|
(67
|
)
|
|||||
|
Balance at period end
|
$
|
(5,990
|
)
|
$
|
(4,446
|
)
|
$
|
(3,839
|
)
|
||
Note 5. Inventories
Inventories are stated at the lower of cost or net realizable value. Finished goods and work-in-process inventories include material, labor and manufacturing overhead costs.
|
(amounts in thousands)
|
2018
|
2017
|
|||||
|
Raw materials
|
$
|
371,168
|
|
$
|
283,772
|
|
|
|
Work in process
|
42,822
|
|
35,734
|
|
|||
|
Finished goods
|
99,248
|
|
85,847
|
|
|||
|
Total inventories
|
$
|
513,238
|
|
$
|
405,353
|
|
|
The increase in inventories was due primarily to our recent acquisitions. For further information, see Note 2 -
Acquisitions
.
Note 6. Other Current Assets
|
(amounts in thousands)
|
2018
|
2017
|
|||||
|
Prepaid assets
|
$
|
30,974
|
|
$
|
22,782
|
|
|
|
Refundable income taxes
|
9,677
|
|
4,234
|
|
|||
|
Fair value of derivative instruments
(Note 27)
|
8,234
|
|
2,235
|
|
|||
|
Other
|
76
|
|
1,152
|
|
|||
|
Total other current assets
|
$
|
48,961
|
|
$
|
30,403
|
|
|
Note 7. Property and Equipment, Net
|
(amounts in thousands)
|
2018
|
2017
|
|||||
|
Land improvements
|
$
|
34,060
|
|
$
|
33,026
|
|
|
|
Buildings
|
501,659
|
|
468,355
|
|
|||
|
Machinery and equipment
|
1,306,555
|
|
1,237,915
|
|
|||
|
Total depreciable assets
|
1,842,274
|
|
1,739,296
|
|
|||
|
Accumulated depreciation
|
(1,138,898
|
)
|
(1,106,913
|
)
|
|||
|
703,376
|
|
632,383
|
|
||||
|
Land
|
69,188
|
|
68,312
|
|
|||
|
Construction in progress
|
70,839
|
|
56,016
|
|
|||
|
Total property and equipment, net
|
$
|
843,403
|
|
$
|
756,711
|
|
|
We monitor all property and equipment for any indicators of potential impairment. We recorded impairment charges of
$1.1 million
,
$1.5 million
and
$3.0 million
during the years ended
December 31, 2018
,
2017
and 2016 respectively.
The effect on our carrying value of property and equipment due to currency translations for foreign assets was a decrease of
$23.1 million
and an increase of
$27.9 million
for the years ended
December 31, 2018
and
2017
, respectively.
F-21
In November 2016, we entered into a
17
-year, non-cancelable build-to-suit arrangement for a corporate headquarters facility in Charlotte, North Carolina that is accounted for under the build-to-suit guidance contained in ASC 840,
Leases
. The lease commenced upon completion of construction in February 2018. Since we were involved in the construction of structural improvements prior to the commencement of the lease and took some level of construction risk, we were considered the accounting owner of the assets and land during the construction period. Further, since certain terms of the lease do not meet normal sale-leaseback criteria, we are considered the accounting owner after the construction period as well. During the first quarter of 2018, we recorded
$20.0 million
of build-to-suit assets included in property and equipment, net, and set up a corresponding financial obligation of
$20.4 million
included in long-term debt in the accompanying consolidated balance sheet. In the second quarter of 2018, we received a tenant improvement allowance, increasing long-term debt by
$4.2 million
. The build-to-suit asset is being depreciated over its estimated useful life and lease payments are being applied as debt service against the liability.
Depreciation expense was recorded as follows:
|
(amounts in thousands)
|
2018
|
2017
|
2016
|
||||||||
|
Cost of sales
|
$
|
85,357
|
|
$
|
78,975
|
|
$
|
78,608
|
|
||
|
Selling, general and administrative
|
8,699
|
|
7,835
|
|
7,839
|
|
|||||
|
Total depreciation expense
|
$
|
94,056
|
|
$
|
86,810
|
|
$
|
86,447
|
|
||
Note 8. Goodwill
The following table summarizes the changes in goodwill by reportable segment:
|
(amounts in thousands)
|
North
America
|
Europe
|
Australasia
|
Total
Reportable
Segments
|
|||||||||||
|
Balance as of December 31, 2016
|
$
|
187,376
|
|
$
|
229,977
|
|
$
|
69,567
|
|
$
|
486,920
|
|
|||
|
Acquisitions
|
30,251
|
|
8,569
|
|
8,934
|
|
47,754
|
|
|||||||
|
Acquisition remeasurements
|
(16,504
|
)
|
(2,734
|
)
|
(4,376
|
)
|
(23,614
|
)
|
|||||||
|
Currency translation
|
437
|
|
32,350
|
|
5,216
|
|
38,003
|
|
|||||||
|
Balance as of December 31, 2017
|
$
|
201,560
|
|
$
|
268,162
|
|
$
|
79,341
|
|
$
|
549,063
|
|
|||
|
Acquisitions - preliminary allocation
|
17,645
|
|
30,167
|
|
17,138
|
|
64,950
|
|
|||||||
|
Acquisition remeasurements
|
4,881
|
|
(3,317
|
)
|
(5,227
|
)
|
(3,663
|
)
|
|||||||
|
Currency translation
|
(524
|
)
|
(15,324
|
)
|
(8,560
|
)
|
(24,408
|
)
|
|||||||
|
Balance as of December 31, 2018
|
$
|
223,562
|
|
$
|
279,688
|
|
$
|
82,692
|
|
$
|
585,942
|
|
|||
We have recorded impairments in prior periods related to the divestiture of certain operations. Cumulative impairments of goodwill totaled
$1.6 million
at
December 31, 2018
,
2017
and
2016
.
In accordance with current accounting guidance, we identified
three
reporting units for the purpose of conducting our goodwill impairment review. In determining our reporting units, we considered (i) whether an operating segment or a component of an operating segment was a business, (ii) whether discrete financial information was available, and (iii) whether the financial information is regularly reviewed by management of the operating segment. We performed our annual impairment assessment during the beginning of the December fiscal month of
2018
. The excess of the fair value of our reporting units over their respective carrying values for the
three
reporting units exceeded
16%
.
No
impairment loss was recorded in
2018
,
2017
or
2016
.
F-22
Note 9. Intangible Assets, Net
Changes in the carrying amount of intangible assets were as follows for the periods indicated:
|
(amounts in thousands)
|
|||
|
Balance as of December 31, 2016
|
$
|
115,725
|
|
|
Acquisitions
|
30,430
|
|
|
|
Acquisition remeasurements
|
16,282
|
|
|
|
Additions, (net of $137 write-offs)
|
12,719
|
|
|
|
Amortization
|
(15,896
|
)
|
|
|
Currency translation
|
7,053
|
|
|
|
Balance as of December 31, 2017
|
$
|
166,313
|
|
|
Acquisitions
|
70,057
|
|
|
|
Acquisition remeasurements
|
(1,363
|
)
|
|
|
Additions, (net of $172 write-offs)
|
24,553
|
|
|
|
Amortization
|
(22,208
|
)
|
|
|
Currency translation
|
(11,799
|
)
|
|
|
Balance as of December 31, 2018
|
$
|
225,553
|
|
The cost and accumulated amortization values of our intangible assets were as follows as of December 31:
|
(amounts in thousands)
|
2018
|
||||||||||
|
Cost
|
Accumulated
Amortization
|
Net
Book Value
|
|||||||||
|
Customer relationships and agreements
|
$
|
134,999
|
|
$
|
(45,418
|
)
|
$
|
89,581
|
|
||
|
Software
|
62,147
|
|
(14,053
|
)
|
48,094
|
|
|||||
|
Trademarks and trade names
|
57,513
|
|
$
|
(5,050
|
)
|
$
|
52,463
|
|
|||
|
Patents, licenses and rights
|
47,804
|
|
(12,389
|
)
|
35,415
|
|
|||||
|
Total amortizable intangibles
|
$
|
302,463
|
|
$
|
(76,910
|
)
|
$
|
225,553
|
|
||
|
(amounts in thousands)
|
2017
|
||||||||||
|
Cost
|
Accumulated
Amortization
|
Net
Book Value
|
|||||||||
|
Customer relationships and agreements
|
$
|
105,485
|
|
$
|
(38,210
|
)
|
$
|
67,275
|
|
||
|
Software
|
35,191
|
|
(10,814
|
)
|
24,377
|
|
|||||
|
Trademarks and trade names
|
38,600
|
|
(3,544
|
)
|
35,056
|
|
|||||
|
Patents, licenses and rights
|
47,385
|
|
(7,780
|
)
|
39,605
|
|
|||||
|
Total amortizable intangibles
|
$
|
226,661
|
|
$
|
(60,348
|
)
|
$
|
166,313
|
|
||
We have capitalized
$20.2 million
and
$8.2 million
in 2018 and 2017, respectively, relating to the application development stage for the implementation of our global ERP system.
Intangible assets are reviewed for impairment whenever events or changes in circumstances indicate the carrying amount of such assets may not be recoverable. Intangible assets that become fully amortized are removed from the accounts in the period that they become fully amortized. Amortization expense was recorded as follows:
|
(amounts in thousands)
|
2018
|
2017
|
2016
|
||||||||
|
Amortization expense
|
$
|
22,208
|
|
$
|
15,896
|
|
$
|
12,733
|
|
||
F-23
Estimated future amortization expense (amounts in thousands):
|
2019
|
$
|
23,510
|
|
|
2020
|
24,045
|
|
|
|
2021
|
23,001
|
|
|
|
2022
|
21,981
|
|
|
|
2023
|
20,379
|
|
|
|
Thereafter
|
112,637
|
|
|
|
$
|
225,553
|
|
|
Note 10. Other Assets
|
(amounts in thousands)
|
2018
|
2017
|
|||||
|
Customer displays
|
$
|
15,069
|
|
$
|
12,702
|
|
|
|
Deposits
|
6,627
|
|
3,640
|
|
|||
|
Long-term notes receivable
|
4,902
|
|
4,984
|
|
|||
|
Overfunded pension benefit obligation
|
1,517
|
|
1,903
|
|
|||
|
Other prepaid expenses
|
5,331
|
|
1,869
|
|
|||
|
Other long-term accounts receivable
|
1,451
|
|
1,556
|
|
|||
|
Debt issuance costs on unused portion of revolver facility
|
1,552
|
|
2,045
|
|
|||
|
Long-term taxes receivable
|
800
|
|
—
|
|
|||
|
Investments
(Note 11)
|
366
|
|
33,187
|
|
|||
|
Total other assets
|
$
|
37,615
|
|
$
|
61,886
|
|
|
As of December 31, 2017, our investments consisted primarily of one of our
50%
owned investments that was accounted for under the equity method as well as eight investments accounted for under the cost method. During the first quarter of 2018, we purchased the remaining outstanding shares of an acquired entity, and we recognized a gain of
$20.8 million
on the previously held shares. This investment is now eliminated in consolidation.
Domestic debt issuance costs associated with revolving credit facilities are capitalized and amortized according to the effective interest rate method over the life of the new debt agreements. Non-cash additions are disclosed in Note 31 -
Supplemental Cash Flow Information
. Customer displays are amortized over the life of the product line and
$9.0 million
,
$8.6 million
and
$8.8 million
of amortization is included in total depreciation and amortization in SG&A expense for the years ended
December 31, 2018
,
2017
and
2016
, respectively.
Prior period balances in the table above have been reclassified to conform to current-period presentation.
F-24
Note 11. Investments
As of
December 31, 2018
, our investments consist of
six
investments accounted for under the cost method. As of December 31, 2017, our investments consisted primarily of a
50%
owned investment that was accounted for under the equity method as well as eight investments accounted for under the cost method. During the first quarter of 2018, we purchased the remaining outstanding shares of that entity, and we recognized a gain of
$20.8 million
on the previously held shares. This investment is now eliminated in consolidation.
A summary of our equity and cost method investments, which are included in other assets in the accompanying consolidated balance sheets, is as follows:
|
(amounts in thousands)
|
Equity
|
Cost
|
Total
|
||||||||
|
Ending balance, December 31, 2016
|
$
|
29,106
|
|
$
|
370
|
|
$
|
29,476
|
|
||
|
Equity earnings
|
3,639
|
|
—
|
|
3,639
|
|
|||||
|
Additions
|
—
|
|
6
|
|
6
|
|
|||||
|
Other
|
—
|
|
66
|
|
66
|
|
|||||
|
Ending balance, December 31, 2017
|
$
|
32,745
|
|
$
|
442
|
|
$
|
33,187
|
|
||
|
Equity earnings
|
738
|
|
—
|
|
738
|
|
|||||
|
Acquired equity method investment
|
(33,483
|
)
|
—
|
|
(33,483
|
)
|
|||||
|
Other
|
—
|
|
(76
|
)
|
(76
|
)
|
|||||
|
Ending balance, December 31, 2018
|
$
|
—
|
|
$
|
366
|
|
$
|
366
|
|
||
|
Net loans and advances to affiliates at
|
|||||||||||
|
December 31, 2017
|
$
|
720
|
|
$
|
—
|
|
$
|
720
|
|
||
|
December 31, 2018
|
$
|
—
|
|
$
|
—
|
|
$
|
—
|
|
||
The combined financial position and results of operations for the equity method investment as of
December 31
is summarized below:
|
(amounts in thousands)
|
2018
|
2017
|
|||||
|
Assets
|
|||||||
|
Current assets
|
$
|
—
|
|
$
|
96,127
|
|
|
|
Non-current assets
|
—
|
|
23,539
|
|
|||
|
Total assets
|
$
|
—
|
|
$
|
119,666
|
|
|
|
Liabilities
|
|||||||
|
Current liabilities
|
$
|
—
|
|
$
|
18,151
|
|
|
|
Non-current liabilities
|
—
|
|
35,632
|
|
|||
|
Total liabilities
|
—
|
|
53,783
|
|
|||
|
Net worth
|
$
|
—
|
|
$
|
65,883
|
|
|
|
(amounts in thousands)
|
2018
|
2017
|
2016
|
||||||||
|
Net sales
|
$
|
91,234
|
|
$
|
354,964
|
|
$
|
314,036
|
|
||
|
Gross profit
|
18,261
|
|
74,399
|
|
66,417
|
|
|||||
|
Net income
|
1,752
|
|
6,870
|
|
7,750
|
|
|||||
|
Adjustment for profit (loss) in inventory
|
(138
|
)
|
204
|
|
(84
|
)
|
|||||
|
Net income attributable to Company
|
738
|
|
3,639
|
|
3,791
|
|
|||||
Sales to affiliates totaled
$16.5 million
in
2018
,
$59.3 million
in
2017
and
$61.7 million
in
2016
and purchases from affiliates totaled
$1.0 million
,
$4.0 million
and
$3.5 million
for
2018
,
2017
and
2016
, respectively.
No
impairments were recorded during fiscal years
2018
,
2017
, or
2016
.
F-25
Note 12. Accrued Payroll and Benefits
|
(amounts in thousands)
|
2018
|
2017
|
|||||
|
Accrued vacation
|
$
|
48,742
|
|
$
|
49,398
|
|
|
|
Accrued payroll and commissions
|
23,746
|
|
16,421
|
|
|||
|
Accrued bonuses
|
11,035
|
|
16,487
|
|
|||
|
Accrued payroll taxes
|
11,214
|
|
15,974
|
|
|||
|
Other accrued benefits
|
10,325
|
|
13,623
|
|
|||
|
Non-U.S. defined contributions and other accrued benefits
|
9,722
|
|
10,309
|
|
|||
|
Total accrued payroll and benefits
|
$
|
114,784
|
|
$
|
122,212
|
|
|
Note 13. Accrued Expenses and Other Current Liabilities
|
(amounts in thousands)
|
2018
|
2017
|
|||||
|
Current portion of legal claims provision
|
$
|
79,356
|
|
$
|
4,137
|
|
|
|
Accrued sales and advertising rebates
|
69,199
|
|
73,585
|
|
|||
|
Accrued expenses
|
25,434
|
|
23,530
|
|
|||
|
Non-income related taxes
|
21,643
|
|
19,996
|
|
|||
|
Current portion of warranty liability
(Note 14)
|
20,529
|
|
19,547
|
|
|||
|
Current portion of accrued claim costs relating to self-insurance programs
|
12,319
|
|
12,866
|
|
|||
|
Current portion of deferred revenue
(Note 21)
|
9,854
|
|
9,970
|
|
|||
|
Current portion of restructuring accrual
(Note 24)
|
6,635
|
|
7,162
|
|
|||
|
Current portion of accrued income taxes payable
|
2,128
|
|
10,962
|
|
|||
|
Accrued interest payable
|
2,016
|
|
1,945
|
|
|||
|
Current portion of derivative liability
(Note 27)
|
1,161
|
|
2,905
|
|
|||
|
Total accrued expenses and other current liabilities
|
$
|
250,274
|
|
$
|
186,605
|
|
|
In the table above, the legal claims provision balance in the current period relates primarily to the
$76.5 million
litigation contingency associated with the ongoing antitrust and trade secrets litigation with Steves & Sons, Inc. For further information regarding this litigation, see Note 29 -
Commitments and Contingencies
.
The accrued sales and advertising rebates, accrued interest payable, and non-income related taxes can fluctuate significantly period over period due to timing of payments.
Prior period balances in the table above have been reclassified to conform to current-period presentation.
Note 14. Warranty Liability
Warranty terms vary from
one year
to lifetime on certain window and door components. Warranties are normally limited to servicing or replacing defective components for the original customer. Some warranties are transferable to subsequent owners and are either limited to
10 years
from the date of manufacture or require pro-rata payments from the customer. A provision for estimated warranty costs is recorded at the time of sale based on historical experience, and we periodically adjust these provisions to reflect actual experience.
F-26
An analysis of our warranty liability is as follows:
|
(amounts in thousands)
|
2018
|
2017
|
2016
|
||||||||
|
Balance as of January 1
|
$
|
46,256
|
|
$
|
45,398
|
|
$
|
44,891
|
|
||
|
Current period expense
|
21,822
|
|
17,674
|
|
17,992
|
|
|||||
|
Liabilities assumed due to acquisition
|
1,550
|
|
95
|
|
—
|
|
|||||
|
Experience adjustments
|
1,227
|
|
(614
|
)
|
(3,846
|
)
|
|||||
|
Payments
|
(23,410
|
)
|
(17,255
|
)
|
(13,527
|
)
|
|||||
|
Currency translation
|
(977
|
)
|
958
|
|
(112
|
)
|
|||||
|
Balance at period end
|
46,468
|
|
46,256
|
|
45,398
|
|
|||||
|
Current portion
|
(20,529
|
)
|
(19,547
|
)
|
(18,240
|
)
|
|||||
|
Long-term portion
|
$
|
25,939
|
|
$
|
26,709
|
|
$
|
27,158
|
|
||
The most significant component of our warranty liability is in the North America segment, which totaled
$40.9 million
at
December 31, 2018
after discounting future estimated cash flows at rates between
0.76%
and
4.75%
. Without discounting, the liability would have been higher by approximately
$2.7 million
.
Note 15. Long-Term Debt
Our long-term debt, net of original issue discount and unamortized debt issuance costs, consisted of the following:
|
(amounts in thousands)
|
December 31, 2018 Interest Rate
|
December 31,
2018 |
December 31,
2017 |
||||||
|
Senior notes
|
4.63% - 4.88%
|
$
|
800,000
|
|
$
|
800,000
|
|
||
|
Term loans
|
1.25% - 4.80%
|
474,058
|
|
440,568
|
|
||||
|
Installment notes
|
1.90% - 8.10%
|
98,914
|
|
10,290
|
|
||||
|
Revolving credit facilities
|
3.94% - 4.02%
|
85,000
|
|
—
|
|
||||
|
Mortgage notes
|
1.65%
|
30,375
|
|
33,517
|
|
||||
|
Installment notes for stock
|
3.50% - 5.50%
|
962
|
|
1,944
|
|
||||
|
Unamortized debt issuance costs
|
(11,417
|
)
|
(12,616
|
)
|
|||||
|
1,477,892
|
|
1,273,703
|
|
||||||
|
Current maturities of long-term debt
|
(54,930
|
)
|
(8,770
|
)
|
|||||
|
Long-term debt
|
$
|
1,422,962
|
|
$
|
1,264,933
|
|
|||
|
Maturities by year:
|
||||
|
2019
|
$
|
54,930
|
|
|
|
2020
|
15,223
|
|
||
|
2021
|
20,063
|
|
||
|
2022
|
94,968
|
|
||
|
2023
|
43,247
|
|
||
|
Thereafter
|
1,249,461
|
|
||
|
$
|
1,477,892
|
|
||
Summaries of our outstanding debt agreements as of
December 31, 2018
are as follows:
Senior Notes
– In December 2017, we issued
$800.0 million
of unsecured Senior Notes in
two
tranches:
$400.0 million
bearing interest at
4.63%
and maturing in December 2025, and
$400.0 million
bearing interest at
4.88%
and maturing in December 2027 in a private placement for resale to qualified institutional buyers pursuant to Rule 144A under the Securities Act. Each tranche was issued at par. Interest is payable semiannually in arrears each June and December through maturity. Debt issuance costs of
$11.7 million
are being amortized to interest expense over the life of the notes using the effective interest method.
F-27
Term Loans
U.S. Facility
- In November 2016, we borrowed
$375.0 million
, and refinanced and amended certain terms and provisions of the Term Loan Facility. The proceeds, along with cash on hand and borrowings on our ABL Facility, were used to fund a distribution to shareholders and holders of equity awards. We incurred
$8.1 million
of debt issuance costs related to this amendment.
In February 2017, we prepaid
$375.0 million
of outstanding principal with the proceeds from our IPO. As a result, we recorded a proportional write-off of
$5.2 million
of unamortized debt issuance costs and
$0.9 million
of original issue discount to interest expense.
In March 2017, we amended the facility to reduce the interest rate and remove the cap on the amount of cash used in the calculation of net debt. The offering price of the amended term loans was par. Pursuant to this amendment, certain lenders converted their commitments in an aggregate amount, along with an additional commitment advanced by a replacement lender. We incurred
$1.1 million
of debt issuance costs related to this term loan amendment, which is included as an offset to long-term debt in the accompanying consolidated balance sheets.
In December 2017, along with the issuance of the Senior Notes, we re-priced and amended the facility and repaid
$787.4 million
of outstanding borrowings with the net proceeds from the Senior Notes, which resulted in a principal balance of
$440.0 million
. In connection with the debt extinguishment, we expensed the related unamortized original discount of
$5.9 million
, unamortized debt issuance costs of
$15.4 million
, and bank fees of
$1.7 million
as a loss on extinguishment of debt in our consolidated statements of operations.
The re-priced term loans were offered at par, will mature in December 2024 (extended from July 2022), and bear interest at LIBOR (subject to a floor of
0.00%
) plus a margin of
1.75%
to
2.00%
, determined by our corporate credit ratings. This compares favorably to the previous rate of LIBOR (subject to a floor of
1.00%
) plus a margin of
2.75%
to
3.00%
, determined by our net leverage ratio, under the prior amendment. This amendment also modifies other terms and provisions, including providing for additional covenant flexibility and additional capacity under the facility, and conforming to certain terms and provisions of the Senior Notes. This amendment requires that
0.25%
(or
$1.1 million
) of the aggregate principal amount be repaid quarterly prior to the final maturity date. The facility is secured by the same collateral and guaranteed by the same guarantors as it was under each of the prior amendments, and we incurred
$0.7 million
of debt issuance costs related to this amendment, which are being amortized to interest expense over the life of the facility using the effective interest method. At
December 31, 2018
, the outstanding principal balance under the facility was
$435.6 million
.
In February 2019, the Company purchased interest rate caps in order to effectively fix a
3.0%
per annum ceiling on the LIBOR component of an aggregate
$150 million
of its term loans. The caps become effective March 29, 2019 and expire December 31, 2021.
Australia Facility -
In February 2018, we amended the Australia Senior Secured Credit Facility to include an additional AUD
$55.0 million
floating rate term loan facility with a base rate of BBSY plus a margin ranging from
1.00%
to
1.10%
which matures in February 2023. We pay a commitment fee of
1.25%
on the unused portion of the facility. This facility is secured by guarantees of JWA and had an outstanding principal balance of
$35.2 million
as of
December 31, 2018
.
Other Acquired Facilities -
We acquired a
$11.6 million
term loan facility associated with our ABS acquisition, as well as
$9.6 million
in various term loan facilities associated with our Domoferm acquisition. As of
December 31, 2018
, we have closed the ABS facility with no outstanding borrowings and have $
2.9 million
outstanding under the Domoferm term loan facilities.
Revolving Credit Facilities
ABL Facility -
In December 2017, along with the offering of the Senior Notes and repricing of the Term Loan Facility, we amended our
$300.0 million
ABL Facility. The facility will mature in December 2022 (extended from October 2019) and bears interest primarily at LIBOR (subject to a floor of
0.00%
) plus a margin of
1.25%
to
1.75%
, determined by availability. This compares favorably to the rate of LIBOR (subject to a floor of
0.00%
) plus a margin of
1.50%
to
2.00%
under the previous amendment. This amendment also made certain adjustments to the borrowing base and modified other terms and provisions, including providing for additional covenant flexibility and additional flexibility under the facility, and conforming to certain terms and provisions of the Senior Notes and Term Loan Facility. In connection with the amendment to the ABL Facility, we expensed
$0.2 million
of unamortized loan fees as a loss on
F-28
extinguishment of debt in our consolidated statements of operations. Debt issuance costs related to the ABL Facility are reclassified to other assets in the consolidated balance sheets, in proportion to the commitment amount, less loan utilization. In December 2018, we amended this facility, providing for a
$100.0 million
increase in the U.S. revolving credit commitments.
Extensions of credit under the ABL Facility are limited by a borrowing base calculated periodically based on specified percentages of the value of eligible accounts receivable and eligible inventory, subject to certain reserves and other adjustments. We pay a fee of
0.25%
on the unused portion of the commitments under the facility. As of
December 31, 2018
, we had
$85.0 million
in borrowings,
$39.2 million
in letters of credit and
$208.6 million
available under the ABL Facility.
The ABL Facility has a minimum fixed charge coverage ratio that we are obligated to comply with under certain circumstances. The ABL Facility has various non-financial covenants, including restrictions on liens, indebtedness, and dividends, customary representations and warranties, and customary events of defaults and remedies.
Australia Senior Secured Credit Facility -
In February 2018, we amended the Australia Senior Secured Credit Facility to provide for an AUD
$15.0 million
floating rate revolving loan facility, an AUD
$12.0 million
interchangeable facility for guarantees and letters of credit, an AUD
$7.0 million
electronic payaway facility, an AUD
$2.5 million
asset finance facility, an AUD
$1.0 million
commercial card facility and an AUD
$5.0 million
overdraft line of credit. Apart from the AUD
$55.0 million
floating rate term loan facility mentioned above, the Australia Senior Secured Credit Facility matures in June
2019
. Loans under the revolving loan facility bear interest at BBSY plus a margin of
0.75%
, and a line fee of
1.15%
is also paid on the revolving facility limit. Overdraft balances bear interest at the bank’s reference rate minus a margin of
1.00%
, and a line fee of
1.15%
is paid on the overdraft facility limit. At
December 31, 2018
, we had AUD
$15.0 million
(or
$10.6 million
) available under the revolving loan facility, AUD
$1.9 million
(or
$1.3 million
) under the interchangeable facility, AUD
$7.0 million
(or
$4.9 million
) under the electronic payaway facility, AUD
$0.6 million
(or
$0.4 million
) under the asset finance facility, AUD
$0.8 million
(or
$0.6 million
) under the commercial card facility and AUD
$5.0 million
(or
$3.5 million
) available under the overdraft line of credit. The credit facility is secured by guarantees of the subsidiaries of JWA, fixed and floating charges on the assets of the JWA group, and mortgages on certain real properties owned by the JWA group. The agreement requires that JWA maintain certain financial ratios, including a minimum consolidated interest coverage ratio and a maximum consolidated debt to EBITDA ratio. The agreement limits dividends and repayments of intercompany loans where the JWA group is the borrower and limits acquisitions without the bank’s consent.
Euro Revolving Facility -
In January 2015, we entered into the Euro Revolving Facility, a
€39 million
revolving credit facility, which included an option to increase the commitment by an amount of up to
€10 million
, with a syndicate of lenders and Danske Bank A/S, as agent. Loans under the Euro Revolving Facility bore interest at an IBOR, specific to the borrowing currency, (subject to a floor of
0.00%
), plus a margin of
2.50%
. A commitment fee of
1.00%
was paid on the unutilized amount of the facility. As of
December 31, 2018
, we had
no
outstanding borrowings, €
0.6 million
(or $
0.6 million
) of bank guarantees outstanding, and €
38.4 million
(or
$44.0 million
) available under this facility. The facility required JELD-WEN ApS to maintain certain financial ratios, including a maximum ratio of senior leverage to Adjusted EBITDA (as calculated therein), and a minimum ratio of Adjusted EBITDA (as calculated therein) to net finance charges. In addition, the facility had various non-financial covenants including restrictions on liens, indebtedness, and dividends, customary representations and warranties, and customary events of default and remedies. In January 2019, we did not extend the Euro Revolving Facility and allowed it to expire due to our strong cash position in Europe and expenses and restrictions associated with this facility.
Other Acquired Facilities -
We acquired a $45.0 million revolving credit facility associated with our ABS acquisition and €8.5 million in various overdraft facilities associated with our Domoferm acquisition. As of
December 31, 2018
, we have closed these facilities and have no outstanding borrowings.
At
December 31, 2018
, we had combined borrowing availability of
$263.2 million
under our revolving facilities.
Mortgage Notes
– In December 2007, we entered into
thirty
-year mortgage notes secured by land and buildings with principal payments beginning in 2018. As of
December 31, 2018
, we had DKK
198.2 million
(or
$30.4 million
) outstanding under these notes.
Installment Notes
–
Installment notes represent insurance premium financing, capitalized lease obligations, and loans secured by equipment. During 2018, we acquired
$11.0 million
in various installment notes associated with our Domoferm and A&L acquisitions. These notes mature between 2019 and 2022, with both fixed and variable interest
F-29
rates which range from
1.90%
to
4.87%
. At
December 31, 2018
, we had
$98.9 million
outstanding in installment notes, including
$9.0 million
from the notes acquired with the Domoferm and A&L acquisitions. The increase in installment notes during 2018 was primarily due to the addition of the build-to-suit lease in the first quarter (Note 7 -
Property and Equipment, Net
), and the addition of equipment and software financing that was entered into during the second, third and fourth quarters. Maturities of installment notes range from 2019 to 2035.
Installment Notes for Stock
– We entered into installment notes for stock representing amounts due to former or retired employees for repurchases of our stock that are payable over
5
or
10 years
depending on the amount, with payments through 2020. As of
December 31, 2018
, we had
$1.0 million
outstanding under these notes.
As of
December 31, 2018
, we were in compliance with the terms of all of our credit facilities.
Note 16. Deferred Credits and Other Liabilities
Included in deferred credits and other liabilities is the long-term portion of the following liabilities as of December 31:
|
(amounts in thousands)
|
2018
|
2017
|
|||||
|
Warranty liability
(Note 14)
|
$
|
25,939
|
|
$
|
26,709
|
|
|
|
Headquarter lease liability
(Note 7)
|
—
|
|
19,860
|
|
|||
|
Uncertain tax positions
(Note 17)
|
18,951
|
|
14,519
|
|
|||
|
Workers' compensation claims accrual
|
14,977
|
|
14,179
|
|
|||
|
Other liabilities
|
8,971
|
|
9,444
|
|
|||
|
Restructuring accrual
(Note 24)
|
2,005
|
|
3,877
|
|
|||
|
Over-market lease liabilities
|
1,126
|
|
2,142
|
|
|||
|
Deferred income
|
69
|
|
609
|
|
|||
|
Long term accrued income taxes payable
(Note 17)
|
—
|
|
11,275
|
|
|||
|
Total deferred credits and other liabilities
|
$
|
72,038
|
|
$
|
102,614
|
|
|
The over-market lease liabilities relate to our Melton operations in the U.K. and the related market value lease payments are included in the minimum annual lease payments schedule. The non-cash impact to expense of the change in the lease liability for the discount factor is reported in other income (expense) in the consolidated statements of operations and totaled
$0.5 million
in each of the years ended
2018
,
2017
and
2016
.
The headquarter lease liability related to our build-to-suit arrangement and as of December 31, 2017, we recorded a financial obligation of
$19.9 million
, including accrued interest. During the first quarter of 2018, this amount was reclassified to long-term debt. For further information on this arrangement, see Note 7 -
Property and Equipment, Net
and Note 15 -
Long Term Debt
.
The long term accrued income taxes payable related to a one-time deemed repatriation tax of
$11.3 million
as of December 31, 2017. Due to changes in our provisional estimates related to the Tax Act this amount was adjusted to zero, in the fourth quarter of 2018. See Note 17 -
Income Taxes
for further information.
Note 17. Income Taxes
Income (loss) before taxes, equity earnings and discontinued operations was comprised of the following for the years ended December 31:
|
(amounts in thousands)
|
2018
|
2017
|
2016
|
||||||||
|
Domestic (loss) income
|
$
|
(1,679
|
)
|
$
|
(7,346
|
)
|
$
|
25,042
|
|
||
|
Foreign income
|
137,256
|
|
153,101
|
|
105,278
|
|
|||||
|
Total income before taxes, equity earnings
|
$
|
135,577
|
|
$
|
145,755
|
|
$
|
130,320
|
|
||
F-30
Our foreign income is primarily driven by our subsidiaries in Australia, Canada and the U.K. The statutory tax rates are
30%
,
27%
and
19%
respectively.
Significant components of the provision for income taxes are as follows for the years ended December 31:
|
(amounts in thousands)
|
2018
|
2017
|
2016
|
||||||||
|
Federal
|
$
|
(9,760
|
)
|
$
|
11,699
|
|
$
|
1,015
|
|
||
|
State
|
764
|
|
667
|
|
72
|
|
|||||
|
Foreign
|
35,714
|
|
29,461
|
|
18,274
|
|
|||||
|
Current taxes
|
26,718
|
|
41,827
|
|
19,361
|
|
|||||
|
Federal
|
(23,475
|
)
|
60,618
|
|
(164,765
|
)
|
|||||
|
State
|
(12,847
|
)
|
27,241
|
|
(74,882
|
)
|
|||||
|
Foreign
|
1,646
|
|
8,917
|
|
(26,108
|
)
|
|||||
|
Deferred taxes
|
(34,676
|
)
|
96,776
|
|
(265,755
|
)
|
|||||
|
Total (benefit) provision for income taxes
|
$
|
(7,958
|
)
|
$
|
138,603
|
|
$
|
(246,394
|
)
|
||
On December 22, 2017, the Tax Act was enacted in the U.S. The specific provisions of the Tax Act had both direct and indirect impacts on our 2017 and 2018 results and may continue to materially affect our financial results in the future as regulations continue to be finalized. The direct impacts recorded as provisional estimates in 2017 were due primarily to the change in the U.S. corporate income tax rate from 35% to 21% for tax years beginning after December 31, 2017 and the one-time deemed repatriation tax. As a result of the lowering of the U.S. federal tax rate, we revalued our net deferred tax assets in the U.S. reflecting the lower expected benefit in the U.S. in the future. This revaluation resulted in an estimated additional tax expense totaling approximately
$21.1 million
. Our provisional estimate of the one-time deemed repatriation tax, which effectively subjected the Company’s net aggregate historic foreign earnings to taxation in the U.S., resulted in a further tax charge of
$11.3 million
. During the fourth quarter of 2017, the Company undertook certain transactions which premised the repatriation of certain earnings from foreign subsidiaries. While these transactions were not undertaken as a direct result of tax reform, the U.S. tax implications were heavily impacted due to the timing of the transactions and the measurement dates as outlined in the Tax Act. We recorded a provisional estimate of the effects of certain steps completed in 2017 as well as further steps premised to be completed in 2018 which would have retroactive effect into 2017 resulting in a net increase to tax expense of
$65.8 million
related to these transactions and their impacts under the Tax Act.
As of December 31, 2018, we have completed our accounting for the income tax effects of the Tax Act as of the enactment date. As further discussed below, we recognized a tax benefit of
$40.2 million
in 2018 which effectively reduced the net charges recorded at December 31, 2017. These adjustments were accounted for as a component of income tax expense from continuing operations. The specific adjustments recorded were (i) an increase to the tax expense recorded related to the revaluation of our net deferred tax assets from
$21.1 million
to
$55.3 million
resulting in an additional charge to 2018 earnings of
$34.2 million
, (ii) a reduction of the estimate of the one-time deemed repatriation tax from
$11.3 million
to
zero
resulting in a tax benefit recorded in 2018 earnings of
$11.3 million
, (iii) a reduction of the additional tax expense recorded related to the premised repatriation of funds from foreign subsidiaries from
$65.8 million
to
$2.7 million
resulting in a tax benefit recorded in 2018 earnings of
$63.1 million
.
The completion of the Company’s accounting for the enactment of the Tax Act reflects, among other things, (i) the issuance of guidance by the U.S. Treasury regarding provisions of the Tax Act, (ii) certain elections and accounting policy decisions pursuant to the Tax Act, (iii) adjustments to historic foreign earnings and profits or the associated tax credit pools which are significant factors in the calculation of the repatriation tax, and (iv) changes in interpretations and assumptions that we have made. We note that final guidance and regulations surrounding the implementation of all provisions in the Tax Act have not been issued to date. This guidance, once issued, may materially affect our conclusions regarding the net related effects of the Tax Act on our financial statements.
Further, the Tax Act subjects a U.S. shareholder to current U.S. tax on GILTI earned by certain foreign subsidiaries. GILTI had a material effect on our effective tax rate in 2018 and will likely continue to have such an effect in future periods. The FASB Staff Q&A, Topic 740, No. 5, Accounting for Global Intangible Low-Taxed Income, states that we are permitted to make an accounting policy election to either recognize deferred taxes for temporary basis differences expected to reverse as GILTI in future years or provide for the tax expense related to such income in the year the tax is incurred. We have elected to account for the impact of GILTI in the period in which it is incurred.
F-31
The significant components of the deferred income tax benefit attributed to income from continuing operations for the year ended December 31, 2018, were the adjustments related to the provisional amounts of the income tax effects of the Tax Act and the additional release of valuation allowances, primarily in the U.S. The significant components of the deferred income tax expense attributed to income from continuing operations for the year ended December 31, 2017, was the revaluation of our U.S. deferred tax assets under the Tax Act and the increases in valuation allowances for deferred tax assets, primarily in the U.S.
Reconciliation of the U.S. federal statutory income tax rate to our effective tax rate is as follows for the years ended December 31:
|
2018
|
2017
|
2016
|
|||||||||||||||
|
(amounts in thousands)
|
Amount
|
%
|
Amount
|
%
|
Amount
|
%
|
|||||||||||
|
Statutory rate
|
$
|
28,471
|
|
21.0
|
$
|
51,015
|
|
35.0
|
$
|
45,612
|
|
35.0
|
|||||
|
State income tax, net of federal benefit
|
(1,294
|
)
|
(1.0)
|
(4,784
|
)
|
(3.3)
|
221
|
|
0.2
|
||||||||
|
Nondeductible expenses
|
1,097
|
|
0.8
|
1,950
|
|
1.3
|
1,797
|
|
1.4
|
||||||||
|
Acquisition of ABS
|
(10,189
|
)
|
(7.5)
|
—
|
|
—
|
—
|
|
—
|
||||||||
|
Equity based compensation
|
54
|
|
—
|
(12,718
|
)
|
(8.7)
|
826
|
|
0.6
|
||||||||
|
Deferred benefit on acquisitions
|
—
|
|
—
|
(6,201
|
)
|
(4.2)
|
—
|
|
—
|
||||||||
|
Foreign tax rate differential
|
3,426
|
|
2.5
|
(17,959
|
)
|
(12.3)
|
(12,237
|
)
|
(9.4)
|
||||||||
|
Tax rate differences and credits
|
96,231
|
|
71.0
|
(91,109
|
)
|
(62.5)
|
382
|
|
0.3
|
||||||||
|
Uncertain tax positions
|
5,443
|
|
4.0
|
736
|
|
0.5
|
406
|
|
0.3
|
||||||||
|
Foreign source dividends and deemed inclusions
|
17,657
|
|
13.0
|
86,119
|
|
59.1
|
1,992
|
|
1.5
|
||||||||
|
Valuation allowance
|
(85,876
|
)
|
(63.3)
|
98,156
|
|
67.3
|
(282,616
|
)
|
(216.9)
|
||||||||
|
IRS audit adjustments
|
—
|
|
—
|
(699
|
)
|
(0.5)
|
113
|
|
0.1
|
||||||||
|
Prior year correction
|
—
|
|
—
|
—
|
|
—
|
(1,392
|
)
|
(1.1)
|
||||||||
|
U.S. Tax Reform
|
(62,836
|
)
|
(46.3)
|
32,414
|
|
22.2
|
—
|
|
—
|
||||||||
|
Other
|
(142
|
)
|
(0.1)
|
1,683
|
|
1.2
|
(1,498
|
)
|
(1.1)
|
||||||||
|
Effective rate for continuing operations
|
$
|
(7,958
|
)
|
(5.9)
|
$
|
138,603
|
|
95.1
|
$
|
(246,394
|
)
|
(189.1)
|
|||||
|
Effective rate including discontinued operations
|
$
|
(7,958
|
)
|
(5.9)
|
$
|
138,603
|
|
95.1
|
$
|
(246,394
|
)
|
(189.1)
|
|||||
In the current period, we recorded a tax benefit of
$40.2 million
to revise the provisional estimates recorded under the Tax Act. Included in the “U.S. Tax Reform” line in the reconciliation of tax expense above is comprised of tax benefit of
$11.3 million
for the reduction of the estimated one-time deemed repatriation tax, tax benefit of
$85.7 million
attributed to the restoration of the Company’s net operating losses, offset by tax expense of
$34.2 million
for the revaluation of our deferred tax assets. The remaining tax expense is comprised of: additional tax expense of
$97.6 million
for the reduction of foreign tax credits included in “Tax rate differences and credits”, offset by tax benefit of
$75.0 million
included above as “Valuation allowance”.
We recorded a benefit of
$10.2 million
related to certain tax effects of ABS transitioning to a wholly-owned subsidiary and the tax effects of the gain recognized on the acquisition.
For the year ended
December 31, 2017
, we recorded provisional estimates of the items directly impacted by the Tax Act within the “U.S. Tax Reform” line in the reconciliation of tax expense above. The tax charge of
$32.4 million
is comprised of (i) the repricing our U.S. deferred tax balances of
$21.1 million
from 35% to 21%, and (ii) one-time deemed repatriation tax of
$11.3 million
. As previously, discussed, certain other transactions undertaken by the Company in the fourth quarter of 2017 were indirectly impacted by the Tax Act and the measurement periods as outlined therein. The provisional estimates of the following amounts are included in the Company’s tax expense for the year: additional tax expense of
$85.5 million
included as “Foreign Source Dividends”, a tax benefit of
$90.8 million
included as “Tax rate differences and credits”, and additional tax expense of
$71.1 million
included as “Valuation allowance” above.
We recorded a benefit of
$0.7 million
and a charge of
$0.1 million
in
2017
and
2016
, respectively, as a result of favorable audit settlements in the U.S., which allowed the use of tax attributes that previously had a valuation allowance reserve.
F-32
We recorded a tax benefit of
$6.2 million
primarily relating to the change in disposition for certain intellectual property in the “Deferred benefit on acquisitions” line and a corresponding tax charge in the same amount in the “Valuation allowance” line, resulting in no impact to the effective rate for continuing operations in 2017. We did not incur or recognize tax expense or benefit associated with these categories in 2018.
During the fourth quarter of 2016, we recorded an out-of-period correction to previously overstated international deferred tax asset balances which resulted in a benefit of
$5.4 million
,
$1.4 million
of which is shown above on the line "Prior year correction", and the remaining amount of which is within the "Valuation allowance" and “Other” line items in the reconciliation of tax expense above. This correction was not material to 2016 or prior periods.
Deferred income taxes are provided for the temporary differences between the financial reporting basis and tax basis of our assets, liabilities and operating loss carryforwards. Significant deferred tax assets and liabilities are as follows as of December 31:
|
(amounts in thousands)
|
2018
|
2017
|
|||||
|
Allowance for doubtful accounts and notes receivable
|
$
|
1,573
|
|
$
|
1,102
|
|
|
|
Employee benefits and compensation
|
50,665
|
|
54,961
|
|
|||
|
Net operating loss and tax credit carryforwards
|
214,828
|
|
292,957
|
|
|||
|
Inventory
|
5,920
|
|
4,125
|
|
|||
|
Deferred credits
|
635
|
|
889
|
|
|||
|
Accrued liabilities and other
|
38,526
|
|
17,478
|
|
|||
|
Gross deferred tax assets
|
312,147
|
|
371,512
|
|
|||
|
Valuation allowance
|
(57,571
|
)
|
(144,701
|
)
|
|||
|
Deferred tax assets
|
254,576
|
|
226,811
|
|
|||
|
Depreciation and amortization
|
(58,441
|
)
|
(42,632
|
)
|
|||
|
Investments and marketable securities
|
473
|
|
(9,702
|
)
|
|||
|
Deferred tax liabilities
|
(57,968
|
)
|
(52,334
|
)
|
|||
|
Net deferred tax assets
|
$
|
196,608
|
|
$
|
174,477
|
|
|
|
Balance sheet presentation:
|
|||||||
|
Long-term assets
|
$
|
207,065
|
|
$
|
183,726
|
|
|
|
Long-term liabilities
|
(10,457
|
)
|
(9,249
|
)
|
|||
|
Net deferred tax assets
|
$
|
196,608
|
|
$
|
174,477
|
|
|
Impact of Divestitures and Acquisitions
– As discussed in Note 2 -
Acquisitions
, we completed four acquisitions in fiscal year
2018
and
three
acquisitions in fiscal 2017 that impacted our income tax assets and liabilities. As discussed in Note 3 -
Discontinued Operations and Divestitures
, we sold the assets of our Silver Mountain resort and real estate development in Idaho, which closed on October 20, 2016.
Valuation Allowance
– The realization of deferred tax assets is based on historical tax positions and estimates of future taxable income. We evaluate both the positive and negative evidence that we believe is relevant in assessing whether we will realize the deferred tax assets. A valuation allowance is recorded when it is more likely than not that some portion of the deferred tax assets will not be realized.
Our valuation allowance was
$57.6 million
as of
December 31, 2018
, which represents a decrease of
$87.1 million
from
December 31, 2017
and was allocated to continuing operations. The decrease in the valuation allowance primarily relates to the following: (i) a decrease of
$75.0 million
relating to the Company’s finalization of the accounting for the effects of the Tax Act, (ii) a decrease of
$2.2 million
due to expiring foreign tax credits, (iii) a decrease of
$8.3 million
for state net operating losses ("NOL") and credits due to the impact of increase in forecasted taxable income in the carry-forward period, and (iv) other changes to existing valuations totaling approximately
$1.6 million
for changes in current year earnings for certain other subsidiaries and foreign exchange.
The ultimate realization of deferred tax assets depends on the generation of future taxable income during the periods in which those temporary differences are deductible. We consider the scheduled reversal of deferred tax liabilities (including the effect of available carryback and carryforward periods), and projected taxable income in making this assessment. To
F-33
fully utilize the NOL and tax credits carryforwards we will need to generate sufficient future taxable income in each respective jurisdiction before the expiration of the deferred tax assets governed by the applicable tax code.
Our valuation allowance was
$144.7 million
as of
December 31, 2017
, which represents an increase of
$104.6 million
from December 31, 2016 and was allocated to continuing operations. The increase in the valuation allowance primarily related to the following: (i) an increase of
$71.1 million
relating to U.S. foreign tax credits generated in 2017 which constituted a portion of the provisional charge recorded to the enactment of the Tax Act, (ii) an increase of
$28.3 million
for state NOL and credits due to the impact of reductions in forecasted taxable income in the carry-forward period, (iii) a release of
$2.0 million
for our Canadian subsidiary due to its continued profitability in recent years, (iv) an increase of
$6.7 million
for our Australian subsidiary relating to certain deferred tax assets recognized on capital assets, and (v) other changes to existing valuations totaling approximately
$0.5 million
for changes in current year earnings for certain other subsidiaries and foreign exchange.
The following is the activity in our valuation allowance:
|
(amounts in thousands)
|
2018
|
2017
|
2016
|
||||||||
|
Balance as of January 1,
|
$
|
(144,701
|
)
|
$
|
(40,118
|
)
|
$
|
(318,480
|
)
|
||
|
Valuation allowances established
|
(260
|
)
|
—
|
|
(1,489
|
)
|
|||||
|
Changes to existing valuation allowances
|
85,828
|
|
(105,453
|
)
|
5,006
|
|
|||||
|
Release of valuation allowances
|
—
|
|
2,006
|
|
272,291
|
|
|||||
|
Currency translation
|
1,562
|
|
(1,136
|
)
|
2,554
|
|
|||||
|
Balance as of December 31,
|
$
|
(57,571
|
)
|
$
|
(144,701
|
)
|
$
|
(40,118
|
)
|
||
There were
no
valuation allowances included in discontinued operations for the years ended
December 31, 2018
,
December 31, 2017
and December 31, 2016, respectively.
Loss Carryforwards
– We reduced our income tax payments by utilizing NOL carryforwards of
$172.1 million
in
2018
,
$19.3 million
in
2017
and
$256.2 million
in
2016
. At
December 31, 2018
, our federal, state and foreign NOL carryforwards totaled
$1,477.7 million
, of which
$85.6 million
does not expire and the remainder expires as follows (amounts in thousands):
|
2019
|
$
|
9,254
|
|
|
2020
|
2,771
|
|
|
|
2021
|
11,955
|
|
|
|
2022
|
15,871
|
|
|
|
Thereafter
|
1,352,261
|
|
|
|
Total loss carryforwards
|
$
|
1,392,112
|
|
We utilized approximately
$124.8 million
of NOL carryforwards in the US in 2018; however, the deferred tax asset related to these NOLs actually increased due to the restoration of certain loss carryforwards upon the finalization of the accounting for effects of the Tax Act. We have revised the total amount of NOLs utilized in 2017 to reflect the reduced income recognized under the Tax Act. We utilized
$1.2 million
capital loss carryforwards in 2016. We did not utilize capital loss carryforwards in
2018
and 2017. At
December 31, 2018
, our capital loss carryforwards totaled
$21.2 million
. All of the capital losses are foreign and do not expire.
Section 382 Net Operating Loss Limitation
– On
November 20, 2017
and
October 3, 2011
, we had a change in ownership pursuant to Section 382 of the Internal Revenue Code of 1986 as amended (“Code”). Under this provision of the Code, the utilization of any of our NOL or tax credit carryforwards, incurred prior to the date of ownership change, may be limited. Analyses of the respective limits for each ownership change indicated no reason to believe the annual limitation would impair our ability to utilize our NOL carryforward or net tax credit carryforwards as provided. We have concluded the limitation under Section 382 should not prevent us from fully utilizing these historical NOLs.
F-34
Tax Credit Carryforwards
– Our tax credit carryforwards expire as follows:
|
(amounts in thousands)
|
EZ Credit
|
R & E credit
|
Foreign Tax Credit
|
Work Opportunity & Welfare to Work Credit
|
State Investment Tax Credits
|
Tip Credit
|
TOTAL
|
||||||||||||||||||||
|
2019
|
$
|
—
|
|
$
|
—
|
|
$
|
—
|
|
$
|
—
|
|
$
|
—
|
|
$
|
—
|
|
$
|
—
|
|
||||||
|
2020
|
—
|
|
—
|
|
12,975
|
|
—
|
|
—
|
|
—
|
|
12,975
|
|
|||||||||||||
|
2021
|
—
|
|
—
|
|
14,990
|
|
—
|
|
76
|
|
—
|
|
15,066
|
|
|||||||||||||
|
2022
|
—
|
|
—
|
|
1,061
|
|
—
|
|
1
|
|
—
|
|
1,062
|
|
|||||||||||||
|
2023
|
—
|
|
—
|
|
5,735
|
|
—
|
|
1,797
|
|
—
|
|
7,532
|
|
|||||||||||||
|
Thereafter
|
68
|
|
6,614
|
|
11,485
|
|
6,823
|
|
1,720
|
|
102
|
|
26,812
|
|
|||||||||||||
|
$
|
68
|
|
$
|
6,614
|
|
$
|
46,246
|
|
$
|
6,823
|
|
$
|
3,594
|
|
$
|
102
|
|
$
|
63,447
|
|
|||||||
Earnings of Foreign Subsidiaries
– Historically, the Company has not provided for US tax impacts of any unremitted earnings of its foreign subsidiaries. The Tax Act made significant changes to the taxation of undistributed foreign earnings, including that all previously untaxed earnings and profits of our controlled foreign corporations be subjected to a one-time deemed repatriation tax in 2017. In its final analysis of the effects of the Tax Act, the Company provided for US income taxes on approximately
$121.0 million
of earnings of our foreign subsidiaries deemed to be repatriated. Beginning in 2018, the Tax Act provides for a 100% dividends received deduction for untaxed earnings received from most foreign corporations. The repatriation tax substantially eliminated the basis difference that existed previously for purposes of ASC Topic 740. Although dividend income is now generally exempt from U.S. federal income tax in the hands of U.S. corporate shareholders, the guidance of ASC 740-30 still applies to account for the tax consequences of outside basis differences and other tax impacts of investments in non-U.S. subsidiaries. Although likely not subject to U.S. federal taxation, there are limited other taxes that could continue to apply such as foreign income and withholding as well as certain state taxes.
The Company completed its evaluation of its indefinite reinvestment assertion as a result of the Tax Act during the fourth quarter of 2018. As of December 31, 2018, we have not recorded deferred tax liabilities or assets for the outside basis difference, as we have concluded that the unremitted earnings of our foreign subsidiaries are indefinitely reinvested with certain minor exceptions and do not anticipate the outside basis difference to reverse in the foreseeable future. We hold a combined book-over-tax outside basis difference of
$202.5 million
in our investment in foreign subsidiaries and may incur up to
$5.7 million
of local country income and withholding taxes in case of distribution of unremitted earnings.
Dual-Rate Jurisdiction
– Estonia taxes the corporate profits of resident corporations at different rates depending upon whether the profits are distributed. The undistributed profits of resident corporations are exempt from taxation while any distributed profits are subject to a
20%
corporate income tax rate. The liability for the tax on distributed profits is recorded as an income tax expense in the period in which a dividend is declared. The amount of undistributed earnings at
December 31, 2018
and 2017 which, if distributed, would be subject to this tax was
$68.1 million
and
$66.3 million
, respectively. During 2017, Latvia enacted a similar system in which an entity’s local earnings are not subject to tax until distributed. The amount of undistributed earnings at December 31, 2018 for our Latvian subsidiary which, if distributed, would be subject to a
20%
corporate income tax rate is
$19.9 million
.
Tax Payments and Balances
– We made tax payments of
$49.7 million
in
2018
,
$29.0 million
in
2017
and
$34.7 million
in
2016
primarily for foreign liabilities. We received tax refunds of
$3.3 million
in
2018
,
$6.5 million
in
2017
and
$7.9 million
in
2016
primarily related to U.S., Sweden and Estonia. We recorded receivables for U.S. federal, foreign and state refunds of
$9.7 million
at
December 31, 2018
and
$4.2 million
at
December 31, 2017
which is included in other current assets on the accompanying consolidated balance sheets. We recorded payables for U.S. federal, foreign and state taxes of
$2.1 million
at
December 31, 2018
and
11.0 million
at
December 31, 2017
which is included in accrued income taxes payable in the accompanying consolidated balance sheets. We recorded a non-current U.S. receivable of
$0.8 million
at
December 31, 2018
and a non-current U.S. payables of
$11.3 million
at December 31, 2017, related to the one-time deemed repatriation tax liability. This is included in other assets and long term liabilities in the accompanying consolidated balance sheets.
F-35
Accounting for Uncertain Tax Positions
– A reconciliation of the beginning and ending amounts of unrecognized tax benefits excluding interest and penalties is as follows:
|
(amounts in thousands)
|
2018
|
2017
|
2016
|
||||||||
|
Balance as of January 1,
|
$
|
14,519
|
|
$
|
12,054
|
|
$
|
11,634
|
|
||
|
Increase for tax positions taken during the prior period
|
2,620
|
|
252
|
|
359
|
|
|||||
|
Decrease for settlements with taxing authorities
|
(157
|
)
|
(788
|
)
|
—
|
|
|||||
|
Increase for tax positions taken during the current period
|
300
|
|
107
|
|
—
|
|
|||||
|
Currency translation
|
(707
|
)
|
1,626
|
|
(345
|
)
|
|||||
|
Balance at period end - unrecognized tax benefit
|
16,575
|
|
13,251
|
|
11,648
|
|
|||||
|
Accrued interest and penalties
|
2,376
|
|
1,268
|
|
406
|
|
|||||
|
$
|
18,951
|
|
$
|
14,519
|
|
$
|
12,054
|
|
|||
Unrecognized tax benefits were
$16.6 million
,
$13.3 million
and
$11.6 million
at
December 31, 2018
,
2017
and 2016, respectively. The changes during the current period relate to the establishment of an uncertain tax positions for certain tax examinations offset by currency translation during the period. Interest and penalties related to uncertain tax positions are reported as a component of tax expense and included in the total uncertain tax position balance within deferred credits and other liabilities in the accompanying consolidated balance sheets.
A significant portion of our uncertain tax positions relates to the implementation of the Capacity Management Agreements within the European business (“CMA”) which took place in January 1, 2015. The CMA changed the manner in which we manage our manufacturing capacity and the distribution and sale of our products in Europe. The reorganization of our Europe segment was part of our review of our operations structure and management that began in 2014 and resulted in changes in taxable income for certain of our subsidiaries within that reportable segment. Effective January 1, 2015, our subsidiary JELD-WEN U.K. Limited (the “Managing Subsidiary”) entered into an agreement (the “Managing Agreement”) with several of our other subsidiaries in Europe (collectively, the “Operating Subsidiaries”). The Managing Agreement provides that the Managing Subsidiary will receive a fee from the Operating Subsidiaries in exchange for performing various management and decision-making services for the Operating Subsidiaries. As a result, the Managing Agreement shifts certain risks (and correlated benefits) from the Operating Subsidiaries to the Managing Subsidiary. In exchange, the Managing Subsidiary guarantees a specific return to each Operating Subsidiary on a before interest and taxes basis, commensurate with such Operating Subsidiary’s functions and risk profile. While there is no impact on the consolidated reporting of the Europe segment due to the Managing Agreement, there may be changes in taxable income of the Operating Subsidiaries. Therefore, we have reserved for a potential loss resulting from such uncertainty.
Included in the balance of unrecognized tax benefits as of
December 31, 2018
,
2017
, and
2016
, are
$16.6 million
,
$13.3 million
, and
$11.6 million
respectively, of tax benefits that, if recognized, would affect the effective tax rate. We cannot reasonably estimate the conclusion of certain non-US income tax examinations and its outcome at this time.
We operate in multiple foreign tax jurisdictions and are generally open to examination for tax years 2012 and forward. In the U.S., we are open to examination at the federal level for tax years 2013 and forward and at state and local jurisdictions for tax years 2013 and forward. We are under examination in the United Kingdom, Switzerland, the Czech Republic, Austria, Denmark, France, Germany, Indonesia and Latvia for tax years 2011 through 2017, and generally remain open to examination for other non-US jurisdictions for tax years 2012 forward.
Note 18. Segment Information
We report our segment information in the same way management internally organizes the business in assessing performance and making decisions regarding allocation of resources in accordance with ASC 280-10-
Segment Reporting
. We determined that we have
three
reportable segments, organized and managed principally by geographic region. Our reportable segments are North America, Europe and Australasia. We report all other business activities in Corporate and unallocated costs. Factors considered in determining the
three
reportable segments include the nature of business activities, the management structure accountable directly to the CODM, the discrete financial information available and the information regularly reviewed by the CODM. Management reviews net revenues and Adjusted EBITDA to evaluate segment performance and allocate resources. We define Adjusted EBITDA as net income (loss), adjusted for the following items: loss from discontinued operations, net of tax; equity earnings of non-consolidated entities; income tax (benefit) expense; depreciation and amortization; interest expense, net; impairment and restructuring charges; gain on previously held shares of equity investment; (gain) loss on sale of property and equipment; share-based compensation expense; non-
F-36
cash foreign exchange transaction/translation (income) loss; other non-cash items; other items; and costs related to debt restructuring and debt refinancing.
Prior year balances have been revised with the activity being adjusted through the “Net revenues from external customers - North America” line below. See detail in Note 1 -
Description of Company and Summary of Significant Accounting Policies
.
The following tables set forth certain information relating to our segments’ operations.
|
(amounts in thousands)
|
North
America
|
Europe
|
Australasia
|
Total Operating
Segments
|
Corporate
and
Unallocated
Costs
|
Total
Consolidated
|
|||||||||||||||||
|
Year Ended December 31, 2018
|
|||||||||||||||||||||||
|
Total net revenues
|
$
|
2,462,268
|
|
$
|
1,216,706
|
|
$
|
681,160
|
|
$
|
4,360,134
|
|
$
|
—
|
|
$
|
4,360,134
|
|
|||||
|
Intersegment net revenues
|
(1,281
|
)
|
(905
|
)
|
(11,245
|
)
|
(13,431
|
)
|
—
|
|
(13,431
|
)
|
|||||||||||
|
Net revenues from external customers
|
$
|
2,460,987
|
|
$
|
1,215,801
|
|
$
|
669,915
|
|
$
|
4,346,703
|
|
$
|
—
|
|
$
|
4,346,703
|
|
|||||
|
Depreciation and amortization
|
$
|
71,945
|
|
$
|
31,132
|
|
$
|
17,730
|
|
$
|
120,807
|
|
$
|
4,293
|
|
$
|
125,100
|
|
|||||
|
Impairment and restructuring charges
|
4,933
|
|
6,111
|
|
7,170
|
|
18,214
|
|
(886
|
)
|
17,328
|
|
|||||||||||
|
Adjusted EBITDA
|
278,975
|
|
129,202
|
|
91,172
|
|
499,349
|
|
(34,003
|
)
|
465,346
|
|
|||||||||||
|
Capital expenditures
|
57,805
|
|
25,369
|
|
12,146
|
|
95,320
|
|
23,380
|
|
118,700
|
|
|||||||||||
|
Segment assets
|
$
|
1,355,730
|
|
$
|
902,684
|
|
$
|
482,493
|
|
$
|
2,740,907
|
|
$
|
310,148
|
|
$
|
3,051,055
|
|
|||||
|
Year Ended December 31, 2017
|
|||||||||||||||||||||||
|
Total net revenues
|
$
|
2,159,919
|
|
$
|
1,045,036
|
|
$
|
572,518
|
|
$
|
3,777,473
|
|
$
|
—
|
|
$
|
3,777,473
|
|
|||||
|
Intersegment net revenues
|
(2,021
|
)
|
(2,269
|
)
|
(9,434
|
)
|
(13,724
|
)
|
—
|
|
(13,724
|
)
|
|||||||||||
|
Net revenues from external customers
|
$
|
2,157,898
|
|
$
|
1,042,767
|
|
$
|
563,084
|
|
$
|
3,763,749
|
|
$
|
—
|
|
$
|
3,763,749
|
|
|||||
|
Depreciation and amortization
|
$
|
66,990
|
|
$
|
27,979
|
|
$
|
13,248
|
|
$
|
108,217
|
|
$
|
3,056
|
|
$
|
111,273
|
|
|||||
|
Impairment and restructuring charges
|
8,471
|
|
3,592
|
|
(49
|
)
|
12,014
|
|
1,042
|
|
13,056
|
|
|||||||||||
|
Adjusted EBITDA
|
273,594
|
|
132,929
|
|
74,706
|
|
481,229
|
|
(43,616
|
)
|
437,613
|
|
|||||||||||
|
Capital expenditures
|
34,769
|
|
14,889
|
|
6,019
|
|
55,677
|
|
7,372
|
|
63,049
|
|
|||||||||||
|
Segment assets
|
$
|
1,207,539
|
|
$
|
920,222
|
|
$
|
447,734
|
|
$
|
2,575,495
|
|
$
|
287,445
|
|
$
|
2,862,940
|
|
|||||
|
Year Ended December 31, 2016
|
|||||||||||||||||||||||
|
Total net revenues
|
$
|
2,153,154
|
|
$
|
1,009,545
|
|
$
|
517,990
|
|
$
|
3,680,689
|
|
$
|
—
|
|
$
|
3,680,689
|
|
|||||
|
Intersegment net revenues
|
(3,843
|
)
|
(816
|
)
|
(9,088
|
)
|
(13,747
|
)
|
—
|
|
(13,747
|
)
|
|||||||||||
|
Net revenues from external customers
|
$
|
2,149,311
|
|
$
|
1,008,729
|
|
$
|
508,902
|
|
$
|
3,666,942
|
|
$
|
—
|
|
$
|
3,666,942
|
|
|||||
|
Depreciation and amortization
|
$
|
68,207
|
|
$
|
26,657
|
|
$
|
8,944
|
|
$
|
103,808
|
|
$
|
4,187
|
|
$
|
107,995
|
|
|||||
|
Impairment and restructuring charges
|
3,584
|
|
6,777
|
|
2,448
|
|
12,809
|
|
1,038
|
|
13,847
|
|
|||||||||||
|
Adjusted EBITDA
|
251,831
|
|
122,574
|
|
59,519
|
|
433,924
|
|
(40,242
|
)
|
393,682
|
|
|||||||||||
|
Capital expenditures
|
39,775
|
|
14,991
|
|
21,610
|
|
76,376
|
|
3,121
|
|
79,497
|
|
|||||||||||
|
Segment assets
|
$
|
1,099,845
|
|
$
|
751,749
|
|
$
|
377,410
|
|
$
|
2,229,004
|
|
$
|
307,042
|
|
$
|
2,536,046
|
|
|||||
F-37
Reconciliations of net income to Adjusted EBITDA are as follows:
|
Years Ended December 31,
|
|||||||||||
|
(amounts in thousands)
|
2018
|
2017
|
2016
|
||||||||
|
Net income
|
$
|
144,273
|
|
$
|
10,791
|
|
$
|
377,181
|
|
||
|
Loss from discontinued operations, net of tax
|
—
|
|
—
|
|
3,324
|
|
|||||
|
Equity earnings of non-consolidated entities
|
(738
|
)
|
(3,639
|
)
|
(3,791
|
)
|
|||||
|
Income tax (benefit) expense
|
(7,958
|
)
|
138,603
|
|
(246,394
|
)
|
|||||
|
Depreciation and amortization
|
125,100
|
|
111,273
|
|
107,995
|
|
|||||
|
Interest expense, net
(a)
|
70,818
|
|
79,034
|
|
77,590
|
|
|||||
|
Impairment and restructuring charges
(b)
|
17,328
|
|
13,057
|
|
18,353
|
|
|||||
|
Gain on previously held shares of equity investment
|
(20,767
|
)
|
—
|
|
—
|
|
|||||
|
Loss (gain) on sale of property and equipment
|
144
|
|
(299
|
)
|
(3,275
|
)
|
|||||
|
Share-based compensation expense
|
15,052
|
|
19,785
|
|
22,464
|
|
|||||
|
Non-cash foreign exchange transaction/translation loss (income)
|
8
|
|
(2,181
|
)
|
5,734
|
|
|||||
|
Other non-cash items
(c)
|
3,859
|
|
526
|
|
2,843
|
|
|||||
|
Other items
(d)
|
117,933
|
|
47,000
|
|
30,585
|
|
|||||
|
Costs relating to debt restructuring and debt refinancing
(e)
|
294
|
|
23,663
|
|
1,073
|
|
|||||
|
Adjusted EBITDA
|
$
|
465,346
|
|
$
|
437,613
|
|
$
|
393,682
|
|
||
|
(a)
|
Interest expense for the year ended
December 31, 2017
includes
$6,097
related to the write-off of a portion of the unamortized debt issuance costs and original issue discount associated with the Term Loan Facility.
|
|
(b)
|
Impairment and restructuring charges consist of (i) impairment and restructuring charges that are included in our consolidated statements of operations plus (ii) additional charges relating to inventory and/or manufacturing of our products that are included in cost of sales in the accompanying consolidated statements of operations in the amount of
$1
and
$4,506
for the years ended
December 31, 2017
, and 2016, respectively. There were no charges for the year ended
December 31, 2018
. For further explanation of impairment and restructuring charges that are included in our consolidated statements of operations, see Note 24 -
Impairment and Restructuring Charges
in our financial statements.
|
|
(c)
|
Other non-cash items include; (i) charges of
$3,740
for the fair value adjustment to the inventory acquired as part of our Domoferm acquisitions in the year ended
December 31, 2018
; (ii) charges of
$439
for the fair value adjustment to the inventory acquired as part of our Mattiovi acquisition in the year ended
December 31, 2017
; (iii) charges of
$357
for the fair value adjustment to the inventory acquired as part of our Trend acquisition in the year ended December 31, 2016 and (iv) other non-cash items include charges of
$2,153
for the out-of-period European warranty liability adjustment for the year ended December 31, 2016.
|
|
(d)
|
Other items not core to business activity include: (i) in the
year
ended
December 31, 2018
(1)
$76,500
in litigation contingency accruals, (2)
$25,444
in legal costs, (3)
$10,324
in acquisition costs, (4)
$3,381
in costs related to the departure of the former CEO and CFO, and (5)
$2,901
in entity consolidation and reorganization costs, and (6)
$(5,396)
in realized gain on hedges; (ii) in the
year
ended
December 31, 2017
(1)
$34,178
in legal costs, (2)
$4,176
in realized loss on hedges, (3)
$3,484
in acquisition costs, (4)
$2,202
in secondary offering costs, (5)
$754
in tax consulting fees (6)
$678
in legal entity consolidation costs, (7)
$649
in taxes related to equity-based compensation, (8)
$578
in facility shut down costs, and (9)
$(2,247)
gain on settlement of contract escrow; and (iii) in the year ended December 31, 2016, (1)
$20,695
in payments to holders of vested options and restricted shares in connection with the November 2016 dividend, (2)
$3,721
of professional fees related to the IPO of our common stock, (3)
$1,626
of acquisition costs, (4)
$584
in legal costs associated with disposition of non-core properties, (5)
$507
of dividend-related costs, (6)
$500
of costs related to the recruitment of executive management employees, (7)
$450
in legal costs, and (8)
$346
in Dooria plant closure costs.
|
|
(e)
|
Includes non-recurring fees and expenses related to professional advisors, financial advisors and financial monitors retained in connection with the refinancing of our debt obligations. Included in the year ended December 31, 2017 is a loss on debt extinguishment of $23,262 associated with the refinancing of our term loan.
|
F-38
Net revenues by locality are as follows for the years ended
December 31,
:
|
(amounts in thousands)
|
2018
|
2017
|
2016
|
||||||||
|
Net revenues by location of external customer
|
|||||||||||
|
Canada
|
$
|
201,134
|
|
$
|
219,877
|
|
$
|
218,947
|
|
||
|
U.S.
|
2,228,102
|
|
1,904,754
|
|
1,893,728
|
|
|||||
|
South America (including Mexico)
|
34,422
|
|
35,280
|
|
34,518
|
|
|||||
|
Europe
|
1,240,234
|
|
1,063,344
|
|
1,035,398
|
|
|||||
|
Australia
|
634,976
|
|
530,521
|
|
476,251
|
|
|||||
|
Africa and other
|
7,835
|
|
9,973
|
|
8,100
|
|
|||||
|
Total
|
$
|
4,346,703
|
|
$
|
3,763,749
|
|
$
|
3,666,942
|
|
||
Geographic information regarding property, plant, and equipment which exceed
10%
of consolidated property, plant, and equipment used in continuing operations is as follows for the years ended
December 31,
|
(amounts in thousands)
|
2018
|
2017
|
2016
|
||||||||
|
North America:
|
|||||||||||
|
U.S.
|
$
|
459,506
|
|
$
|
402,338
|
|
$
|
400,023
|
|
||
|
Other
|
24,911
|
|
25,876
|
|
25,371
|
|
|||||
|
484,417
|
|
428,214
|
|
425,394
|
|
||||||
|
Europe
|
181,038
|
|
153,492
|
|
145,470
|
|
|||||
|
Australasia:
|
|||||||||||
|
Australia
|
113,922
|
|
118,568
|
|
104,063
|
|
|||||
|
Other
|
10,297
|
|
7,818
|
|
8,259
|
|
|||||
|
124,219
|
|
126,386
|
|
112,322
|
|
||||||
|
Corporate:
|
|||||||||||
|
U.S.
|
53,729
|
|
48,619
|
|
21,465
|
|
|||||
|
Total property and equipment, net
|
$
|
843,403
|
|
$
|
756,711
|
|
$
|
704,651
|
|
||
Note 19. Series A Convertible Preferred Shares
Prior to the IPO, we had the authority to issue up to
8,750,000
shares of preferred stock, par value of
$0.01
, of which
8,749,999
shares were designated as Series A Convertible Preferred Stock and
one
share was designated as Series B Preferred Stock. Series A Convertible Preferred Stock consisted of
2,922,634
shares of Series A-1 Stock,
208,760
shares of Series A-2 Stock,
843,132
shares of Series A-3 Stock, and
4,775,473
shares of Series A-4 Stock. At December 31, 2016, all of the authorized shares of Series A-1, Series A-2, and Series A-3 Stock and
one
Series B Stock were issued and outstanding.
Immediately prior to the closing of our IPO, the outstanding shares and accumulated and unpaid dividends of the Series A Convertible Preferred Stock converted into
64,211,172
common shares by applying the applicable conversion rates as prescribed in our then-existing certificate of incorporation.
Dividend
- Prior to converting to common stock, the Series A Stock had a preferred annual dividend of
10%
per annum on the Equity Constant, with the Equity Constant being
$21.77
for dividends accruing prior to April 30, 2013. The cumulative dividends accrued continually and compounded annually at the rate of
10%
whether or not they had been declared and whether or not there were funds available for the payment.
In October of 2016, the Board of Directors authorized
$256.3 million
in distributions to the holders of the
3,974,525
shares of Series A Stock (
62,645,538
as-converted common shares) through participation in the
$4.09
per share of Common Stock distribution (see Note 20 -
Capital Stock
). The Board of Directors authorized an additional distribution of
$51.0 million
to holders of Series A Stock representing dividends accruing between May 31, 2016 and November 3, 2016. Total
F-39
distributions paid to holders of our Series A Stock were
$306.7 million
and were paid on or about November 3, 2016. Cumulative unpaid dividends were approximately
$390.6 million
at December 31, 2016. The Series A Stock and cumulative unpaid dividends converted into
64,211,172
shares of our common stock on February 1, 2017.
Other
- In June 2016, the Company, represented by directors not appointed by Onex, settled indemnification claims under the 2011 and 2012 Stock Purchase Agreements with Onex. As a result of this settlement, we refunded
$23.7 million
of the issuance price agreed to in the 2011 and 2012 Stock Purchase Agreements in August 2016. The refund was recorded as a reduction in the carrying value of the Convertible Preferred shares in the accompanying consolidated balance sheets.
Note 20. Capital Stock
On February 1, 2017, immediately prior to the closing of the IPO, the Company filed its Charter with the Secretary of State of the State of Delaware, and the Company’s Bylaws became effective, each as contemplated by the registration statement we filed in connection with our IPO. The Charter, among other things, provides that the Company’s authorized capital stock consists of
900,000,000
shares of common stock, par value
$0.01
per share and
90,000,000
shares of preferred stock, par value
$0.01
per share.
Preferred Stock -
Our Board of Directors is authorized to issue Preferred Stock from time to time in one or more series and with such rights, privileges, and preferences as the Board of Directors shall from time to time determine. We have not issued any shares of preferred stock.
Common Stock -
As of December 31, 2016, we were governed by our pre-IPO charter, which provided the authority to issue
22,810,000
shares of common stock, with a par value of
$0.01
per share, of which
22,379,800
shares were designated common stock and
430,200
shares were designated as Class B-1 Common Stock. On January 3, 2017, our pre-IPO charter was amended authorizing us to issue
904,732,200
shares of common stock, with a par value of
$0.01
per share, of which
900,000,000
shares were designated common stock and
4,732,200
shares were designated as Class B-1 Common Stock. Each share of common stock (whether common stock or Class B-1 Common Stock) had the same rights, privileges, interest and attributes and was subject to the same limitations as every other share treating the Class B-1 Common Stock on an as-converted basis. Each share of Class B-1 Common Stock was convertible at the option of the holder into shares of common stock at the same ratio on the date of conversion as a share of Series A-1 Stock would have been convertible on such date of conversion, assuming that no cash dividends had been paid on the Series A-1 Stock (or its predecessor security) since the date of initial issuance. Immediately prior to the closing of our IPO, all of the outstanding shares of Class B-1 Common Stock were converted into
309,404
shares of common stock.
Common stock includes the basis of shares outstanding plus amounts recorded as additional paid-in capital. Shares outstanding exclude the shares issued to the Employee Benefit Trust that are considered similar to treasury shares and total
193,941
shares at both
December 31, 2018
and
December 31, 2017
with a total original issuance value of
$12.4 million
.
On October 31, 2016, our Board of Directors authorized a distribution of
$4.09
per share of common stock in which the Series A Convertible Preferred Stock and Class B-1 Common Stock would participate on an as-converted basis. The record date for the distribution was November 1, 2016 and totaled
$74.0 million
for holders of our common stock and Class B-1 Common Stock. We applied distributions totaling
$0.2 million
against principal and accrued interest on outstanding employees. Participating in the distribution were
17,845,927
common shares and
136,565
B-1 Common shares (
232,373
as-converted common shares). The distributions were paid on or about November 3, 2016.
On February 1, 2017, we closed our IPO and received
$480.3 million
in proceeds, net of underwriting discounts and commissions. Costs associated with our initial public offering of
$7.9 million
, including
$5.9 million
of capitalized costs included in “other assets” as of December 31, 2016 were charged to equity upon completion of the IPO.
In April 2018, our Board of Directors authorized the repurchase of up to
$250.0 million
of our Common Stock. Purchases are made in accordance with all applicable securities laws and regulations and may be funded from available liquidity including available cash or borrowings under existing or future credit facilities. The timing and amount of any repurchases of Common Stock will be based on JELD-WEN’s liquidity, general business and market conditions and other factors, including alternative investment opportunities. The term of the repurchase program extends through December 31, 2019. As of
December 31, 2018
, we repurchased
5,287,964
shares of our Common Stock at an average purchase price per share of
$23.64
.
F-40
Note 21. Revenue Recognition
Revenue is recognized when obligations under the terms of a contract with our customer are satisfied. Generally, this occurs with the transfer of control of our products or services. Revenue is measured as the amount of consideration we expect to receive in exchange for transferring goods or providing services. The taxes we collect concurrent with revenue-producing activities (e.g., sales tax, value added tax, and other taxes) are excluded from revenue. Incentive payments to customers that directly relate to future business are recorded as a reduction of net revenues over the periods benefited.
Shipping and handling costs and the related expenses are reported as fulfillment revenues and expenses for all customers. Therefore all shipping and handling costs associated with outbound freight are accounted for as fulfillment costs and are included in cost of sales. The expected costs associated with our base warranties and field service actions continue to be recognized as expense when the products are sold (see Note 14 -
Warranty Liabilities
). Since payment is due at or shortly after the point of sale, the contract asset is classified as a receivable.
We do not adjust the promised amount of consideration for the effects of a significant financing component when we expect, at contract inception, that the period between our transfer of a promised product or service to a customer and when the customer pays for that product or service will be one year or less. We do not typically include extended payment terms in our contracts with customers. Incidental items that are immaterial in the context of the contract are recognized as expense.
We disaggregate revenues based on geographical location. See Note 18 -
Segment Information
for further information on disaggregated revenue.
Deferred Revenue
– We record deferred revenue when we collect pre-payments from customers for performance obligations we expect to fulfill through future performance of a service or delivery of a product. We classify our deferred revenue based on our estimate as to when we expect to satisfy the related performance obligations. Current deferred revenues are included in accrued expenses and other current liabilities in the accompanying consolidated balance sheets.
Significant changes in the deferred revenue balances during the period are as follows:
|
(amounts in thousands)
|
2018
|
||
|
Balance as of January 1
|
$
|
9,970
|
|
|
Increases due to cash received
|
74,936
|
|
|
|
Liabilities assumed due to acquisition
|
2,374
|
|
|
|
Revenue recognized during the period
|
(76,388
|
)
|
|
|
Currency translation
|
(1,038
|
)
|
|
|
Balance at period end
|
$
|
9,854
|
|
Note 22. Earnings Per Share
Basic earnings per share is calculated by dividing net earnings attributable to common shareholders by the weighted average shares outstanding during the period, without consideration for common stock equivalents. Diluted net earnings per share is calculated by adjusting weighted average shares outstanding for the dilutive effect of common share equivalents outstanding for the period, determined using the treasury-stock method. Common stock options, unvested Common Restricted Stock Units and unvested Common Performance Share Units are considered to be common stock equivalents included in the calculation of diluted net income (loss) per share.
F-41
The basic and diluted income (loss) per share calculations for the year ended December 31, are presented below
:
|
(amounts in thousands, except share and per share amounts)
|
2018
|
2017
|
2016
|
||||||||
|
Earnings per share basic:
|
|||||||||||
|
Income from continuing operations
|
$
|
143,535
|
|
$
|
7,152
|
|
$
|
376,714
|
|
||
|
Equity earnings of non-consolidated entities
|
738
|
|
3,639
|
|
3,791
|
|
|||||
|
Income from continuing operations and equity earnings of non-consolidated entities
|
144,273
|
|
10,791
|
|
380,505
|
|
|||||
|
Undeclared Series A Convertible Preferred Stock dividends
|
—
|
|
(10,462
|
)
|
(65,667
|
)
|
|||||
|
Series A Convertible Preferred Stock distributions and dividends paid
|
—
|
|
—
|
|
(307,279
|
)
|
|||||
|
Deemed Dividend on Series A Convertible Preferred Stock from Settlement Agreement
|
—
|
|
—
|
|
(23,701
|
)
|
|||||
|
Net loss attributable to non-controlling interest
|
(87
|
)
|
—
|
|
—
|
|
|||||
|
Income (loss) attributable to common shareholders from continuing operations
|
144,360
|
|
329
|
|
(16,142
|
)
|
|||||
|
Loss from discontinued operations, net of tax
|
—
|
|
—
|
|
(3,324
|
)
|
|||||
|
Net income (loss) attributable to common shareholders
|
$
|
144,360
|
|
$
|
329
|
|
$
|
(19,466
|
)
|
||
|
Weighted average outstanding shares of common stock basic
|
104,530,572
|
97,460,676
|
17,992,879
|
||||||||
|
Basic income (loss) per share
|
|||||||||||
|
Income (loss) from continuing operations
|
$
|
1.38
|
|
$
|
0.00
|
|
$
|
(0.90
|
)
|
||
|
Loss from discontinued operations
|
0.00
|
|
0.00
|
|
(0.18
|
)
|
|||||
|
Net income (loss) per share - basic
|
$
|
1.38
|
|
$
|
0.00
|
|
$
|
(1.08
|
)
|
||
|
(amounts in thousands, except share and per share amounts)
|
2018
|
2017
|
2016
|
||||||||
|
Earnings per share diluted:
|
|||||||||||
|
Net income attributable to common shareholders - basic and diluted
|
$
|
144,360
|
|
$
|
329
|
|
$
|
(19,466
|
)
|
||
|
Weighted average outstanding shares of common stock basic
|
104,530,572
|
97,460,676
|
17,992,879
|
||||||||
|
Restricted stock units, performance share units and options to purchase common stock
|
1,830,085
|
4,001,459
|
—
|
||||||||
|
Weighted average outstanding shares of common stock diluted
|
106,360,657
|
101,462,135
|
17,992,879
|
||||||||
|
Dilutive income (loss) per share
|
|||||||||||
|
Income (loss) from continuing operations
|
$
|
1.36
|
|
$
|
0.00
|
|
$
|
(0.90
|
)
|
||
|
Loss from discontinued operations
|
0.00
|
|
0.00
|
|
(0.18
|
)
|
|||||
|
Net income (loss) per share - diluted
|
$
|
1.36
|
|
$
|
0.00
|
|
$
|
(1.08
|
)
|
||
The following table provides the securities that could potentially dilute basic earnings per share in the future, but were not included in the computation of diluted earnings per share because to do so would have been anti-dilutive:
|
2018
|
2017
|
2016
|
|||
|
Series A Convertible Preferred Stock
|
—
|
—
|
3,974,525
|
||
|
Common stock options
|
1,019,390
|
545,693
|
1,812,404
|
||
|
Class B-1 Common Stock Options
|
—
|
—
|
3,344,572
|
||
|
Restricted stock units
|
87,720
|
537
|
385,220
|
||
|
Performance share units
|
84,809
|
—
|
—
|
||
F-42
Note 23. Stock Compensation
Prior to the IPO, our Amended and Restated Stock Incentive Plan, (the “Stock Incentive Plan”), allowed us to offer common options, B-1 common options and common RSUs for the benefit of our employees, affiliate employees and key non-employees. Under the Stock Incentive Plan, we could award up to an aggregate of
2,761,000
common shares and
4,732,200
B-1 common shares. The Stock Incentive Plan provided for accelerated vesting of awards upon the occurrence of certain events. Through December 31, 2016, we issued
5,156,976
options and
385,220
RSUs under the Stock Incentive Plan.
In connection with our IPO, the Board adopted and our shareholders approved the JELD-WEN Holding, Inc. 2017 Omnibus Equity Plan, (the “Omnibus Equity Plan”). Under the Omnibus Equity Plan, equity awards may be made in respect of
7,500,000
shares of our common stock and may be granted in the form of options, restricted stock, RSUs, stock appreciation rights, dividend equivalent rights, share awards and performance-based awards (including performance share units and performance-based restricted stock).
Share-based compensation expense included in SG&A expenses totaled
$15.1 million
in
2018
,
$19.8 million
in
2017
and
$43.2 million
in
2016
. We recognized a windfall tax benefit of
$12.7 million
in 2017, which includes a benefit of
$14.1 million
in the U.S. offset by disallowances in our foreign subsidiaries of
$1.4 million
. There were
no
material related tax benefits for the years
2018
or
2016
. As of
December 31, 2018
, there were $
21.2 million
of total unrecognized compensation expense related to non-vested share-based compensation arrangements. This cost is expected to be recognized over the remaining weighted-average vesting period of
2.0
years.
During the fourth quarter of
2016
, we recorded
$21.3 million
of share-based compensation associated with cash payments to participants of our stock incentive plan. These payments consisted of
$4.09
per vested common option,
$6.96
per vested B-1 common option and
$4.09
per restricted stock unit. In addition, we modified the terms of most unvested options, reducing the exercise prices by
$4.09
and
$6.96
for common and B-1 common options, respectively, resulting in additional share-based compensation expense of
$0.9 million
in
2016
. Key assumptions used in valuing the option modification were as follows:
|
Expected volatility range
|
34.56% - 48.09%
|
|
Expected dividend yield rate
|
0.00%
|
|
Weighted average term (in years)
|
2.57 - 7.06
|
|
Risk free rate
|
0.94% - 1.63%
|
Stock Options
– Generally, stock option awards vest ratably each year on the anniversary date over a
3
to
5
-year period, have an exercise term of
10 years
and any vested options must be exercised within
90 days
of the employee leaving the Company. The compensation cost of option awards is charged to expense based upon the graded-vesting method over the vesting periods applicable to the option awards. The graded-vesting method provides for vesting of portions of the overall awards at interim dates and results in greater expense in earlier years than the straight-line method.
When options are granted, we calculate the fair value of common and Class B-1 Common Stock options using multiple Black-Scholes option valuation models. Expected volatilities are based upon a selection of public guideline companies. The risk-free rate was based upon U.S. Treasury rates.
Key assumptions used in the valuation models were as follows for the years ended December 31:
|
2018
|
2017
|
2016
|
|||
|
Expected volatility
|
34.81% - 39.68%
|
37.36% - 42.83%
|
43.57% - 52.72%
|
||
|
Expected dividend yield rate
|
0.00%
|
0.00%
|
0.00%
|
||
|
Weighted average term (in years)
|
5.50 - 6.50
|
5.50 - 6.50
|
5.50 - 7.50
|
||
|
Weighted average grant date fair value
|
$12.98
|
$11.51
|
$17.84
|
||
|
Risk free rate
|
2.04% - 2.96%
|
1.83% - 2.19%
|
1.47% - 1.77%
|
||
F-43
The following table represents stock option activity:
|
Shares
|
Weighted Average Exercise Price Per Share
|
Aggregate Intrinsic Value (millions)
|
Weighted Average Remaining Contract Term in Years
|
||||||||
|
Outstanding as of January 1, 2016
|
5,288,096
|
$
|
19.06
|
|
|
||||||
|
Granted
|
367,400
|
37.12
|
|
||||||||
|
Exercised
|
(245,014)
|
19.91
|
|
||||||||
|
Forfeited
|
(253,506)
|
16.82
|
|
||||||||
|
Balance as of December 31, 2016
|
5,156,976
|
$
|
20.40
|
|
|
||||||
|
Issued upon conversion of class B-1 common stock
|
2,494,553
|
11.13
|
|
||||||||
|
Granted
|
505,122
|
27.78
|
|
||||||||
|
Exercised
|
(2,781,055)
|
11.67
|
|
||||||||
|
Forfeited
|
(448,928)
|
15.01
|
|
||||||||
|
Balance as of December 31, 2017
|
4,926,668
|
$
|
14.56
|
|
|
||||||
|
Granted
|
838,912
|
32.16
|
|
||||||||
|
Exercised
|
(1,548,484)
|
13.79
|
|
||||||||
|
Forfeited
|
(884,391)
|
18.80
|
|
||||||||
|
Balance as of December 31, 2018
|
3,332,705
|
$
|
18.22
|
|
$
|
7.2
|
|
6.3
|
|||
|
Exercisable as of December 31, 2018
|
1,898,585
|
$
|
13.37
|
|
$
|
5.8
|
|
5.0
|
|||
RSUs
– RSUs are subject to the continued service of the recipient through the vesting date, which is generally
12
to
60 months
from issuance. Once vested, the recipient will receive one share of common stock for each restricted stock unit. Prior to the IPO, the grant-date fair value per share used for RSUs was determined using the aggregate value of our common equity, as determined by a third-party valuation firm, as of the most recent calendar quarter-end and applying a
10%
discount based upon reflecting the differential economic rights and preferences of the Preferred or the ESOP common shares relative to the common shares, with that amount rounded down to the nearest whole percent. After the IPO, the grant-date fair value per share used for RSUs was determined using the closing price of our common stock on the NYSE on the date of the grant. We apply this grant-date fair value per share to the total number of shares that we anticipate will fully vest and amortize the fair value to compensation expense over the vesting period using the straight-line method. In February 2018, we granted
314,267
RSUs to our Chairman of the Board and interim CEO which vested daily through the first anniversary of the date of grant, subject to continuous employment. On June 30, 2018,
208,364
RSUs were forfeited at the end of his interim service.
The following table represents RSU activity:
|
Shares
|
Weighted Average Grant-Date Fair Value Per Share
|
||||
|
Outstanding January 1, 2017
|
385,220
|
$
|
22.00
|
|
|
|
Granted - non-employee directors
|
23,245
|
31.22
|
|
||
|
Granted - employee
|
342,727
|
28.73
|
|
||
|
Vested
|
(175,110)
|
18.40
|
|
||
|
Forfeited
|
(13,714)
|
26.02
|
|
||
|
Balance as of December 31, 2017
|
562,368
|
$
|
27.51
|
|
|
|
Granted - non-employee directors
|
341,983
|
31.62
|
|
||
|
Granted - employee
|
424,944
|
27.15
|
|
||
|
Vested
|
(124,560)
|
25.21
|
|
||
|
Forfeited
|
(530,867)
|
29.69
|
|
||
|
Balance as of December 31, 2018
|
673,868
|
$
|
28.07
|
|
|
F-44
PSUs
– In the first quarter of 2018, we issued PSUs pursuant to the Omnibus Equity Plan. The PSUs are subject to continued employment of the recipient through the vesting date, which is on the third anniversary of the grant. Once vested, the recipient will receive one share of common stock for each vested PSU.
The number of PSUs that vest is determined by a payout factor consisting of equally weighted performance measures of Adjusted EBITDA and free cash flow and is adjusted based upon a market condition measured by our relative total shareholder return (“TSR”) as compared to the TSR of the Russell 3000 index. The fair value of the award is estimated using a Monte Carlo simulation approach in a risk-neutral framework to model future stock price movements based on historical volatility, risk free rates of return and correlation matrix.
The following table represents PSU activity for the awarded shares at target performance measures.
|
Shares
|
Weighted Average Grant-Date Fair Value Per Share
|
||||
|
Outstanding as of December 31, 2017
|
—
|
$
|
—
|
|
|
|
Granted - employee
|
193,763
|
31.60
|
|
||
|
Forfeited
|
(19,093)
|
33.31
|
|
||
|
Balance as of December 31, 2018
|
174,670
|
$
|
31.41
|
|
|
Note 24. Impairment and Restructuring Charges
Closure costs and impairment charges for operations not qualifying as discontinued operations are classified as impairment and restructuring charges in our consolidated statements of operations.
In
2018
, we recorded
$7.2 million
of charges in Australia related to plant consolidations and personnel restructuring. In Europe, we recorded
$6.1 million
of charges primarily related to personnel restructuring. In North America, we recorded
$6.1 million
of charges related to plant consolidations and personnel restructuring as well as exiting two leased corporate buildings offset by
$2.1 million
of reduction in expense due to a favorable tax ruling related to a prior divestiture.
In
2017
, we recorded
$6.8 million
of restructuring charges in the U.S. mostly related to a reduction in work force in the fourth quarter. In Europe we recorded charges of
$3.6 million
related to
two
building impairments and various personnel restructuring. In Canada we recorded charges of
$2.7 million
mostly related to consolidation of operations.
In
2016
, we recorded
$6.8 million
of impairment and restructuring charges in Europe, including
$3.8 million
related to restructuring and plant closures of a recent acquisition and
$3.0 million
related to various personnel restructuring across Europe. In Australasia, we recorded charges of
$2.4 million
mostly related to a site closure and restructuring of a recent acquisition. In North America, we recorded
$4.6 million
of charges including
$2.5 million
of various termination benefits and
$2.1 million
of other impairment and restructuring charges.
The table below summarizes the amounts included in impairment and restructuring charges in the accompanying consolidated statements of operations:
|
(amounts in thousands)
|
2018
|
2017
|
2016
|
||||||||
|
Closed operations
|
$
|
360
|
|
$
|
1,479
|
|
$
|
1,778
|
|
||
|
Continuing operations
|
870
|
|
—
|
|
1,203
|
|
|||||
|
Impairments
|
$
|
1,230
|
|
$
|
1,479
|
|
$
|
2,981
|
|
||
|
Restructuring charges, net of fair value adjustment gains
|
16,098
|
|
11,577
|
|
10,866
|
|
|||||
|
Total impairment and restructuring charges
|
$
|
17,328
|
|
$
|
13,056
|
|
$
|
13,847
|
|
||
Short-term restructuring accruals are recorded in accrued expenses and totaled
$6.6 million
and
$7.2 million
as of
December 31, 2018
and
December 31, 2017
, respectively. Long-term restructuring accruals are recorded in deferred credits and other liabilities and totaled
$2.0 million
and
$3.9 million
as of
December 31, 2018
and
December 31, 2017
, respectively.
F-45
The following is a summary of the restructuring accruals recorded and charges incurred:
|
(amounts in thousands)
|
Beginning
Accrual
Balance
|
Additions
Charged to
Expense
|
Payments
or
Utilization
|
Ending
Accrual
Balance
|
|||||||||||
|
December 31, 2018
|
|||||||||||||||
|
Severance and sales restructuring costs
|
$
|
7,232
|
|
$
|
11,767
|
|
$
|
(13,646
|
)
|
$
|
5,353
|
|
|||
|
Disposal of property and equipment
|
—
|
|
289
|
|
(289
|
)
|
—
|
|
|||||||
|
Lease obligations and other
|
3,807
|
|
4,043
|
|
(4,563
|
)
|
3,287
|
|
|||||||
|
Total
|
$
|
11,039
|
|
$
|
16,099
|
|
$
|
(18,498
|
)
|
$
|
8,640
|
|
|||
|
December 31, 2017
|
|||||||||||||||
|
Severance and sales restructuring costs
|
$
|
836
|
|
$
|
9,492
|
|
$
|
(3,096
|
)
|
$
|
7,232
|
|
|||
|
Disposal of property and equipment
|
—
|
|
190
|
|
(190
|
)
|
—
|
|
|||||||
|
Lease obligations and other
|
4,183
|
|
1,895
|
|
(2,271
|
)
|
3,807
|
|
|||||||
|
Total
|
$
|
5,019
|
|
$
|
11,577
|
|
$
|
(5,557
|
)
|
$
|
11,039
|
|
|||
|
December 31, 2016
|
|||||||||||||||
|
Severance and sales restructuring costs
|
$
|
5,424
|
|
$
|
7,448
|
|
$
|
(12,036
|
)
|
$
|
836
|
|
|||
|
Disposal of property and equipment
|
—
|
|
(71
|
)
|
71
|
|
—
|
|
|||||||
|
Lease obligations and other
|
3,083
|
|
3,489
|
|
(2,389
|
)
|
4,183
|
|
|||||||
|
Total
|
$
|
8,507
|
|
$
|
10,866
|
|
$
|
(14,354
|
)
|
$
|
5,019
|
|
|||
Note 25. Interest Expense
Interest expense is net of capitalized interest. Capitalized interest incurred during the construction phase of significant property and equipment additions totaled
$1.8 million
in
2018
,
$0.9 million
in
2017
and
$1.7 million
in
2016
. We made interest payments of
$68.9 million
in
2018
,
$66.1 million
in
2017
and
$73.9 million
in
2016
. Interest expense also includes debt issuance costs that are amortized using the effective interest method. We allocated interest expense to discontinued operations of
$0.6 million
in
2016
.
Note 26. Other (Income) Expense
The table below summarizes the amounts included in other (income) expense in the accompanying consolidated statements of operations:
|
(amounts in thousands)
|
2018
|
2017
|
2016
|
||||||||
|
Foreign currency (gains) losses
|
$
|
(10,196
|
)
|
$
|
10,426
|
|
$
|
3,580
|
|
||
|
Legal settlement income
|
(7,541
|
)
|
(2,456
|
)
|
(9,671
|
)
|
|||||
|
Pension benefit expense
|
6,975
|
|
12,616
|
|
12,738
|
|
|||||
|
Other items
|
(2,208
|
)
|
(2,482
|
)
|
(5,237
|
)
|
|||||
|
Settlement of contract escrow
|
—
|
|
(2,247
|
)
|
—
|
|
|||||
|
Total other (income) expense
|
$
|
(12,970
|
)
|
$
|
15,857
|
|
$
|
1,410
|
|
||
In accordance with our adoption of ASU 2017-07, prior year balances have been revised with the activity being adjusted through the “Pension benefit expense” line above. See detail in Note 1 -
Description of Company and Summary of Significant Accounting Policies.
In July 2016, we entered into a confidential settlement agreement on a commercial matter in our North America segment that originated in 2011, pursuant to which we received
$8.4 million
. We recorded the gain associated with this settlement in other income in the accompanying consolidated statements of operations.
Prior period balances in the table above have been reclassified to conform to current-period presentation.
F-46
Note 27. Derivative Financial Instruments
All derivatives are recorded as assets or liabilities in the consolidated balance sheets at their respective fair values. For derivatives that qualify for hedge accounting, changes in the fair value related to the effective portion of the hedge are recognized in earnings at the same time as either the change in fair value of the underlying hedged item or the effect of the hedged item’s exposure to the variability of cash flows. Changes in fair value related to the ineffective portion of the hedge are recognized immediately in earnings. Changes in the fair value of derivatives that do not qualify for hedge accounting, or fail to meet the criteria thereafter, are also recognized in the consolidated statements of operations. See Note 28 -
Fair Value Measurements
for additional information on the fair value of our derivative assets and liabilities.
Foreign currency derivatives
– We are exposed to the impact of foreign currency fluctuations in certain countries in which we operate. In most of these countries, the exposure to foreign currency movements is limited because the operating revenues and expenses of our business units are substantially denominated in the local currency. To the extent borrowings, sales, purchases or other transactions are not executed in the local currency of the operating unit, we are exposed to foreign currency risk. To mitigate the exposure, we enter into a variety of foreign currency derivative contracts, such as forward contracts, option collars, and cross-currency hedges. We use foreign currency derivative contracts, with a total notional amount of
$127.3 million
, to manage the effect of exchange fluctuations on forecasted sales, purchases, acquisitions, inventory and capital expenditures and certain intercompany transactions that are denominated in foreign currencies. We use foreign currency derivative contracts, with a total notional amount of
$72.1 million
, to hedge the effects of translation gains and losses on intercompany loans and interest. We also use foreign currency derivative contracts, with a total notional amount of
$185.3 million
, to mitigate the impact to the consolidated earnings of the Company from the effect of the translation of certain subsidiaries’ local currency results into U.S. dollars. We do not use derivative financial instruments for trading or speculative purposes. Hedge accounting has not been elected for any foreign currency derivative contracts. We record mark-to-market changes in the values of these derivatives in other (income) expense. We recorded mark-to-market gains of
$7.8 million
at
December 31, 2018
and losses of
$6.3 million
, and
$0.9 million
at
December 31, 2017
, and 2016, respectively.
Interest rate derivatives
– We are exposed to interest rate risk in connection with our variable rate long-term debt. During the fourth quarter of 2014, we entered into interest rate swap agreements to manage this risk. These interest rate swaps were set to mature in
September 2019
with half of the
$488.3 million
amortized aggregate notional amount having become effective in September 2015, and the other half having become effective in September 2016. On
July 1, 2015
, we amended our Term Loan Facility, and we received an additional
$480.0 million
in long-term borrowings. In conjunction with the issuance of the incremental term loan debt, we entered into additional interest rate swap agreements to manage our increased exposure to the interest rate risk associated with variable rate long-term debt. The additional interest rate swaps were set to mature in
September 2019
with half of the
$426.0 million
aggregate notional amount having become effective in
June 2016
and the other half having become effective in December 2016. In conjunction with the December 2017 refinancing of the Term Loan Facility (see Note 15 -
Long-Term Debt
), we terminated all of the interest rate swaps which had outstanding notional amounts aggregating to
$914.3 million
and recorded a loss on termination of
$3.6 million
in consolidated other comprehensive income (loss), which will be amortized as interest expense over the life of the original interest rate swaps. The unamortized, pre-tax balance of this loss recorded in consolidated other comprehensive income (loss) was
$1.3 million
and
$3.4 million
at
December 31, 2018
and 2017, respectively.
The interest rate swap agreements were designated as cash flow hedges and, prior to their termination in December 2017, effectively changed the LIBOR-based portion of the interest rate (or “base rate”) on a portion of the debt outstanding under our Term Loan Facility to the weighted average fixed rates per the time frames below:
|
(amounts in thousands)
|
Notional
(1)
|
Weighted Average Rate
|
|
|
December 2015 - June 2016
|
$273,000
|
1.997%
|
|
|
June 2016 - September 2016
|
$486,000
|
2.054%
|
|
|
September 2016 - December 2016
|
$759,000
|
2.161%
|
|
|
December 2016 - December 2017
|
$914,250
|
2.188%
|
|
|
(1)
|
Aggregate notional amounts in effect during the period shown.
|
We recorded
$2.1 million
,
$8.9 million
and
$5.0 million
of interest expense deriving from the interest rate swaps during the years ended
December 31, 2018
,
2017
, and
2016
respectively.
F-47
The agreements with our counterparties contained a provision where we could be declared in default on our derivative obligations if we either default or, in certain cases, are capable of being declared in default on any of our indebtedness greater than specified thresholds. These agreements also contained a provision where we could be declared in default subsequent to a merger or restructuring type event if the creditworthiness of the resulting entity is materially weaker.
The fair values of derivative instruments held are as follows:
|
Derivative assets
|
|||||||||
|
(amounts in thousands)
|
Balance Sheet Location
|
2018
|
2017
|
||||||
|
Derivatives not designated as hedging instruments:
|
|||||||||
|
Foreign currency forward contracts
|
Other current assets
|
$
|
8,234
|
|
$
|
2,235
|
|
||
|
Derivatives liabilities
|
|||||||||
|
(amounts in thousands)
|
Balance Sheet Location
|
2018
|
2017
|
||||||
|
Derivatives not designated as hedging instruments:
|
|||||||||
|
Foreign currency forward contracts
|
Accrued expenses and other current liabilities
|
$
|
1,161
|
|
$
|
2,905
|
|
||
Note 28. Fair Value of Financial Instruments
We record financial assets and liabilities at fair value based on FASB guidance related to fair value measurements. The guidance requires fair value to be determined based on the exchange price that would be received for an asset or paid to transfer a liability (an exit price) in the principal or most advantageous market for the asset or liability in an orderly transaction between market participants at the measurement date. There are
three
levels of inputs that may be used to measure fair value:
Level 1 – Quoted prices in active markets for identical assets or liabilities.
Level 2 – Quoted market-based inputs or unobservable inputs that are corroborated by market data.
Level 3 – Unobservable inputs that are not corroborated by market data.
The recorded carrying amounts and fair values of these instruments were as follows:
|
2018
|
|||||||||||||||||||||||
|
(amounts in thousands)
|
Carrying Amount
|
Total
Fair Value
|
Level 1
|
Level 2
|
Level 3
|
Assets measured at NAV
(a)
|
|||||||||||||||||
|
Assets:
|
|||||||||||||||||||||||
|
Cash equivalents
|
$
|
30
|
|
$
|
30
|
|
$
|
—
|
|
$
|
30
|
|
$
|
—
|
|
$
|
—
|
|
|||||
|
Derivative assets, recorded in other current assets
|
8,234
|
|
8,234
|
|
—
|
|
8,234
|
|
—
|
|
—
|
|
|||||||||||
|
Pension plan assets:
|
|||||||||||||||||||||||
|
Cash and short-term investments
|
7,254
|
|
7,254
|
|
—
|
|
7,254
|
|
—
|
|
—
|
|
|||||||||||
|
U.S. Government and agency obligations
|
24,622
|
|
24,622
|
|
24,622
|
|
—
|
|
—
|
|
—
|
|
|||||||||||
|
Corporate and foreign bonds
|
90,490
|
|
90,490
|
|
—
|
|
90,490
|
|
—
|
|
—
|
|
|||||||||||
|
Asset-backed securities
|
—
|
|
—
|
|
—
|
|
—
|
|
—
|
|
—
|
|
|||||||||||
|
Equity securities
|
22,378
|
|
22,378
|
|
22,378
|
|
—
|
|
—
|
|
—
|
|
|||||||||||
|
Mutual funds
|
60,099
|
|
60,099
|
|
—
|
|
60,099
|
|
—
|
|
—
|
|
|||||||||||
|
Common and collective funds
|
110,596
|
|
110,596
|
|
—
|
|
—
|
|
—
|
|
110,596
|
|
|||||||||||
|
Liabilities:
|
|||||||||||||||||||||||
|
Senior notes
|
$
|
800,000
|
|
$
|
692,000
|
|
$
|
—
|
|
$
|
692,000
|
|
$
|
—
|
|
$
|
—
|
|
|||||
|
Term loans
|
474,058
|
|
455,545
|
|
—
|
|
455,545
|
|
—
|
|
—
|
|
|||||||||||
|
Derivative liabilities, recorded in accrued expenses and deferred credits
|
1,161
|
|
1,161
|
|
—
|
|
1,161
|
|
—
|
|
—
|
|
|||||||||||
F-48
|
2017
|
|||||||||||||||||||||||
|
(amounts in thousands)
|
Carrying Amount
|
Total
Fair Value
|
Level 1
|
Level 2
|
Level 3
|
Assets measured at NAV
(a)
|
|||||||||||||||||
|
Assets:
|
|||||||||||||||||||||||
|
Cash equivalents
|
$
|
44,091
|
|
$
|
44,091
|
|
$
|
—
|
|
$
|
44,091
|
|
$
|
—
|
|
$
|
—
|
|
|||||
|
Derivative assets, recorded in other current assets
|
2,235
|
|
2,235
|
|
—
|
|
2,235
|
|
—
|
|
—
|
|
|||||||||||
|
Pension plan assets:
|
|||||||||||||||||||||||
|
Cash and short-term investments
|
17,859
|
|
17,859
|
|
—
|
|
17,859
|
|
—
|
|
—
|
|
|||||||||||
|
U.S. Government and agency obligations
|
25,122
|
|
25,122
|
|
25,122
|
|
—
|
|
—
|
|
—
|
|
|||||||||||
|
Corporate and foreign bonds
|
98,432
|
|
98,432
|
|
—
|
|
98,432
|
|
—
|
|
—
|
|
|||||||||||
|
Asset-backed securities
|
839
|
|
839
|
|
—
|
|
839
|
|
—
|
|
—
|
|
|||||||||||
|
Equity securities
|
32,444
|
|
32,444
|
|
32,444
|
|
—
|
|
—
|
|
—
|
|
|||||||||||
|
Mutual funds
|
80,352
|
|
80,352
|
|
—
|
|
80,352
|
|
—
|
|
—
|
|
|||||||||||
|
Common and collective funds
|
100,697
|
|
100,697
|
|
—
|
|
—
|
|
—
|
|
100,697
|
|
|||||||||||
|
Liabilities:
|
|||||||||||||||||||||||
|
Senior notes
|
$
|
800,000
|
|
$
|
807,000
|
|
$
|
—
|
|
$
|
807,000
|
|
$
|
—
|
|
$
|
—
|
|
|||||
|
Term loans
|
440,568
|
|
442,218
|
|
—
|
|
442,218
|
|
—
|
|
—
|
|
|||||||||||
|
Derivative liabilities, recorded in accrued expenses and deferred credits
|
2,905
|
|
2,905
|
|
—
|
|
2,905
|
|
—
|
|
—
|
|
|||||||||||
|
(a)
|
Certain pension assets that are measured at fair value using the NAV per share (or its equivalent) practical expedient have not been classified in the fair value hierarchy. These include investments in large cap equity and commingled real estate funds. Redemption of these funds is not subject to restriction.
|
Derivative assets and liabilities reported in level
2
include foreign currency contracts. See Note 27-
Derivative Financial Instruments
for additional information about our derivative assets and liabilities.
The non-financial assets that are measured at fair value on a non-recurring basis are presented below:
|
2018
|
|||||||||||||||||||||||
|
(amounts in thousands)
|
Carrying Value
|
Total
Fair Value
|
Level 1
|
Level 2
|
Level 3
|
Total Losses
|
|||||||||||||||||
|
Continuing operations
|
$
|
48
|
|
$
|
48
|
|
|
—
|
|
|
—
|
|
$
|
48
|
|
|
$
|
175
|
|
||||
|
Total
|
$
|
48
|
|
$
|
48
|
|
$
|
—
|
|
$
|
—
|
|
$
|
48
|
|
$
|
175
|
|
|||||
|
2017
|
|||||||||||||||||||||||
|
(amounts in thousands)
|
Carrying Value
|
Total
Fair Value
|
Level 1
|
Level 2
|
Level 3
|
Total Losses
|
|||||||||||||||||
|
Closed operations
|
$
|
914
|
|
$
|
914
|
|
$
|
—
|
|
$
|
—
|
|
$
|
914
|
|
$
|
1,473
|
|
|||||
|
Total
|
$
|
914
|
|
$
|
914
|
|
$
|
—
|
|
$
|
—
|
|
$
|
914
|
|
$
|
1,473
|
|
|||||
Note 29. Commitments and Contingencies
Litigation
– We are involved in various legal proceedings, claims, and government audits arising in the ordinary course of business. We record our best estimate of a loss when the loss is considered probable and the amount of such loss can be reasonably estimated. Legal judgments and estimated settlements have been included in accrued expenses in the accompanying consolidated balance sheets. When a loss is probable and there is a range of estimated loss with no best estimate within the range, we record the minimum estimated liability related to the lawsuit or claim. As additional information becomes available, we assess the potential liability related to pending litigation and claims and revise our accruals if necessary. Because of uncertainties related to the resolution of lawsuits and claims, the ultimate outcome may differ materially from our estimates.
In the opinion of management and based on the liability accruals provided, other than as described below, as of
December 31, 2018
, there are no current proceedings or litigation matters involving the Company or its property that
F-49
we believe would have a material adverse effect on our consolidated financial position or cash flows, although they could have a material adverse effect on our operating results for a particular reporting period.
Steves & Sons, Inc. vs JELD-WEN
– We sell molded door skins to certain customers pursuant to long-term contracts, and these customers in turn use the molded door skins to manufacture interior doors and compete directly against us in the marketplace. We have given notice of termination of one of these contracts and, on
June 29, 2016
, the counterparty to the agreement, Steves and Sons, Inc. (“Steves”) filed a claim against JWI in the U.S. District Court for the Eastern District of Virginia, Richmond Division (“Eastern District of Virginia”). The complaint alleges that our acquisition of CMI, a competitor in the molded door skins market, together with subsequent price increases and other alleged acts and omissions, violated antitrust laws and constituted a breach of contract and breach of warranty. Specifically, the complaint alleges that our acquisition of CMI substantially lessened competition in the molded door skins market. The complaint seeks declaratory relief, ordinary and treble damages, and injunctive relief, including divestiture of certain assets acquired in the CMI acquisition.
In February 2018, a jury in the Eastern District of Virginia returned a verdict that was unfavorable to JWI with respect to Steves’ claims that our acquisition of CMI violated Section 7 of the Clayton Act and found that JWI breached the supply agreement between the parties. The verdict awarded Steves
$12.2 million
for past damages under both the Clayton Act and breach of contract claims and
$46.5 million
in future lost profits under the Clayton Act claim.
In October 2018, the presiding judge vacated a portion of the jury verdict, reducing the contract damages award by
$2.2 million
. We expect that Steves will be required to elect to recover its past damages either under the Clayton Act claims or the contract claims, but not both. If a judgment is entered under the Clayton Act, any damages awarded will be trebled. In addition, if a judgment is entered under either theory in accordance with the verdict, Steves will be entitled to an award of attorney’s fees, which amounts have not yet been quantified. We asserted a position that, because future lost profits were awarded, Steves is not permitted to pursue its claim for divestiture of certain assets acquired in the CMI acquisition. An evidentiary hearing on equitable remedies, including divestiture, was held in April 2018. On October 5, 2018, the presiding judge issued an opinion finding that a remedy of divestiture is an appropriate remedy. On December 7, 2018, the presiding judge granted in part and denied in part Steves’ request for declaratory relief. On December 20, 2018, the presiding judge entered a Final Judgment Order, granting divestiture and conditionally awarding monetary damages in the event the divestiture order is overturned. Steves moved to amend on January 11, 2019.
JELD-WEN has filed a renewed motion for judgment as a matter of law and a motion for a new trial, and we intend to vigorously oppose entry of an adverse judgment, and to appeal any adverse judgment that may be entered. We continue to believe that Steves’ claims lack merit, Steves’ damages calculations are speculative and excessive, and Steves is not entitled in any event to the extraordinary remedy of divestiture. We believe that multiple pretrial and trial rulings were erroneous and improperly limited the Company’s defenses, and that judgment in accordance with the verdict would be improper for several reasons under applicable law. However, based upon the recent rulings described above, in the third quarter of 2018 the Company recorded a charge of
$76.5 million
associated with this loss contingency included in SG&A in the accompanying consolidated statement of operations. The charge reflects the judgment anticipated to be entered against the Company, including the trebling of
$12.2 million
of past damages under the Clayton Act, and estimated legal fees. The charge does not include any amount for lost profits or divestiture. Steves has indicated its intention to elect divestiture, rather than lost profits. Any judgment entered that awards lost profits, if ultimately upheld after exhaustion of our appellate remedies, could have a material adverse effect on our financial position, operating results, or cash flows, particularly for the reporting period in which a loss is recorded. Because the operations acquired from CMI have been fully integrated into the Company’s other operations, divestiture of those operations would be difficult if not impossible and, therefore, it is not possible to estimate the cost of any final divestiture order or the extent to which such an order would have a material adverse effect on our financial position, operating results or cash flows.
During the course of the proceedings in the Eastern District of Virginia, we discovered certain facts that led us to conclude that Steves, its principals and certain former employees of the Company had misappropriated Company trade secrets, violated the terms of various agreements between the Company and those parties and violated other laws. On May 11, 2018, a jury in the Eastern District of Virginia returned a verdict on our trade secrets claims against Steves and awarded damages in the amount of
$1.2 million
. The presiding judge has entered a judgment in our favor for those amounts. On November 30, 2018, the presiding judge denied our request for a permanent injunction. Our other claims remain pending in Bexar County, Texas.
F-50
In Re: Interior Molded Doors Antitrust Litigation
- On October 19, 2018, Grubb Lumber Company, on behalf of itself and others similarly situated, filed a putative class action lawsuit against us and one of our competitors in the doors market, Masonite Corporation (“Masonite”) in the Eastern District of Virginia. We subsequently received additional complaints from and on behalf of direct and indirect purchasers of interior molded doors. The suits have been consolidated into two separate actions, a Direct Purchaser Action and an Indirect Purchaser Action. The suits allege that Masonite and we violated Section 1 of the Sherman Act, and in the Indirect Purchaser Action, related state law antitrust and consumer protection laws, by engaging in a scheme to artificially raise, fix, maintain, or stabilize the prices of interior molded doors in the United States. The complaints seek unquantified ordinary and treble damages, declaratory relief, interest, costs and attorneys’ fees. The Company believes the claims lack merit and intends to vigorously defend against the actions. At this early stage of the proceedings, we are unable to conclude that a loss is probable or to estimate the potential magnitude of any loss in the matters, although a loss could have a material adverse effect on our operating results, consolidated financial position or cash flows.
Self-Insured Risk
– We self-insure substantially all of our domestic business liability risks including general liability, product liability, warranty, personal injury, auto liability, workers’ compensation and employee medical benefits. Excess insurance policies from independent insurance companies generally cover exposures between
$3.0 million
and
$250.0 million
for domestic product liability risk and exposures between
$0.5 million
and
$250.0 million
for auto, general liability, personal injury and workers’ compensation. We have no stop-gap coverage on claims covered by our self-insured domestic employee medical plan and are responsible for all claims thereunder. We estimate our provision for self-insured losses based upon an evaluation of current claim exposure and historical loss experience. Actual self-insurance losses may vary significantly from these estimates. At
December 31, 2018
and
December 31, 2017
, our accrued liability for self-insured risks was
$73.8 million
and
$73.3 million
respectively.
Indemnifications
– At
December 31, 2018
, we had commitments related to certain representations made in contracts for the purchase or sale of businesses or property. These representations primarily relate to past actions such as responsibility for transfer taxes if they should be claimed, and the adequacy of recorded liabilities, warranty matters, employment benefit plans, income tax matters or environmental exposures. These guarantees or indemnification responsibilities typically expire within
one
to
three years
. We are not aware of any material amounts claimed or expected to be claimed under these indemnities. From time to time and in limited geographic areas, we have entered into agreements for the sale of our products to certain customers that provide additional indemnifications for liabilities arising from construction or product defects. We cannot estimate the potential magnitude of such exposures, but to the extent specific liabilities have been identified related to product sales, liabilities have been provided in the warranty accrual in the accompanying consolidated balance sheets.
Performance Bonds and Letters of Credit
– At times, we are required to provide letters of credit, surety bonds or guarantees to customers, vendors and others. Stand-by letters of credit are provided to certain customers and counterparties in the ordinary course of business as credit support for contractual performance guarantees, advanced payments received from customers and future funding commitments. The outstanding performance bonds and stand-by letters of credit were as follows:
|
(amounts in thousands)
|
December 31,
2018 |
December 31,
2017 |
|||||
|
Self-insurance workers’ compensation
|
$
|
22,312
|
|
$
|
21,072
|
|
|
|
Environmental
|
14,552
|
|
14,452
|
|
|||
|
Liability and other insurance
|
18,988
|
|
12,900
|
|
|||
|
Other
|
10,870
|
|
6,650
|
|
|||
|
Total outstanding performance bonds and stand-by letters of credit
|
$
|
66,722
|
|
$
|
55,074
|
|
|
Environmental Contingencies
– We periodically incur environmental liabilities associated with remediating our current and former manufacturing sites as well as penalties for not complying with environmental rules and regulations. We record a liability for remediation costs when it is probable that we will be responsible for such costs and the costs can be reasonably estimated. These environmental liabilities are estimated based on current available facts and current laws and regulations. Accordingly, it is likely that adjustments to the estimated liabilities will be necessary as additional information becomes available. Short-term environmental liabilities and settlements are recorded in accrued expenses in the accompanying consolidated balance sheets and totaled
$0.5 million
at both
December 31, 2018
and
December 31, 2017
. Long-term environmental liabilities are recorded in deferred credits and other liabilities in the accompanying consolidated balance sheets.
No
long-term environmental liabilities were recorded at
December 31, 2018
and
$0.1 million
were recorded at
December 31, 2017
.
F-51
Everett, Washington WADOE Action -
In
2008
, we entered into an Agreed Order with the WADOE to assess historic environmental contamination and remediation feasibility at our former manufacturing site in Everett, Washington. As part of this agreement, we also agreed to develop a CAP, arising from the feasibility assessment. We are currently working with WADOE to finalize our RI/FS (Remedial Investigation and Feasibility Study), and, once final, we will develop the CAP. We estimate the remaining cost to complete our RI/FS and develop the CAP at
$0.5 million
, which we have fully accrued. However, because we cannot at this time we cannot reasonably estimate the cost associated with any remedial actions we would be required to undertake and have not provided accruals for any remedial action in our accompanying consolidated financial statements.
Towanda, Pennsylvania Consent Order -
In 2015, we entered into a COA with the PaDEP to remove a pile of wood fiber waste from our site in Towanda, Pennsylvania, which we acquired in connection with our acquisition of CMI in 2013, by using it as fuel for a boiler at that site. The COA replaced a
1995
Consent Decree between CMI’s predecessor Masonite, Inc. and PaDEP. Under the COA, we are required to achieve certain periodic removal objectives and ultimately remove the entire pile by
August 31, 2022
. There are currently
$11.0 million
in bonds posted in connection with these obligations. If we are unable to remove this pile by
August 31, 2022
, then the bonds will be forfeited and we may be subject to penalties by PaDEP. We currently anticipate meeting all applicable removal deadlines; however, if our operations at this site decrease and we burn less fuel than currently anticipated, we may not be able to meet such deadlines.
Service Agreements
– In February 2015, we entered into a strategic servicing agreement with a third-party vendor to identify and execute cost reduction opportunities. The agreement provided for a tiered fee structure directly tied to cost savings realized. This contract terminated pursuant to its own terms on December 31, 2015, and we made a final payment of
$6.3 million
on January 2, 2018. We expect no further costs related to this issue.
Employee Stock Ownership Plan
– We have historically provided cash to our U.S. ESOP in order to fund required distributions to participants through the repurchase of shares of our common stock. Following our February 2017 IPO, the value of a share of Common Stock held through the ESOP is now based on our public share price. We do not anticipate that we will fund future distributions.
Purchase Obligations
- As of December 31, 2018, we have purchase obligations of $
6.5 million
due in 2019 and $
2.5 million
due in 2020-2021. These purchase obligations are primarily relating to raw materials purchase agreements and software hosting services. Purchase obligations are defined as purchase agreements that are enforceable and legally binding and that specify all significant terms, including quantity, price, and the approximate timing of the transaction.
Lease Commitments
– We have various operating lease agreements primarily for facilities, manufacturing equipment, airplanes and vehicles. These obligations generally have remaining non-cancelable terms. Minimum annual lease payments are as follows (amounts in thousands):
|
Continuing
Operations
|
|||
|
2019
|
$
|
49,128
|
|
|
2020
|
43,794
|
|
|
|
2021
|
30,885
|
|
|
|
2022
|
24,020
|
|
|
|
2023
|
19,352
|
|
|
|
Thereafter
|
33,943
|
|
|
|
$
|
201,122
|
|
|
Rent expense from continuing operations was
$63.7 million
in
2018
,
$50.0 million
in
2017
and
$45.8 million
in
2016
. Rent expense from discontinued operations was
$0.1 million
in
2016
. There was
no
rent expense from discontinued operations in
2018
or
2017
.
F-52
Note 30. Employee Retirement and Pension Benefits
U.S. Defined Benefit Pension Plan
Certain U.S. hourly employees participate in our defined benefit pension plan. The plan is not open to new employees.
Beginning in 2017, we moved from utilizing a weighted average discount rate, which was derived from the yield curve used to measure the pension benefit obligation at the beginning of the period, to a spot rate yield curve to estimate the pension benefit obligation and net periodic benefits costs. The change in estimate provides a more accurate measurement of service and interest cost by applying the spot rate that could be used to settle each projected cash flow individually. This change in estimate did not have a material effect on net periodic benefit costs for the
year
s ended
December 31, 2018
or
2017
.
The components of net periodic benefit cost are summarized as follows for the years ended December 31:
|
(amounts in thousands)
|
||||||||||||
|
Components of pension benefit expense - U.S. benefit plan
|
2018
|
2017
|
2016
|
|||||||||
|
Service cost
|
$
|
4,170
|
|
$
|
3,870
|
|
$
|
3,320
|
|
|||
|
Interest cost
|
13,180
|
|
13,371
|
|
16,387
|
|
||||||
|
Expected return on plan assets
|
(20,769
|
)
|
(17,940
|
)
|
(19,990
|
)
|
||||||
|
Amortization of net actuarial pension loss
|
9,314
|
|
12,680
|
|
12,264
|
|
||||||
|
Pension benefit expense
|
$
|
5,895
|
|
$
|
11,981
|
|
$
|
11,981
|
|
|||
|
Discount rate
|
3.47%
|
3.94%
|
4.25%
|
|||||||||
|
Expected long-term rate of return on assets
|
6.25%
|
6.25%
|
7.00%
|
|||||||||
|
Compensation increase rate
|
N/A
|
N/A
|
N/A
|
|||||||||
The new mortality tables published by the Society of Actuaries in 2014 were adopted in
2014
and represent our best estimate of future experience for the base mortality table. The Society of Actuaries has released annual updates to the mortality improvement projection scale that was first released in 2014, with the most recent annual update being Scale MP-2018. We adopted the use of Scale MP-2018 as of December 31, 2018 as it represents our best estimate of future mortality improvement projection experience as of the measurement date.
We developed the discount rate based on the plan’s expected benefit payments using the Willis Towers Watson RATE:Link 10:90 Yield Curve. Based on this analysis, we selected a
4.27%
discount rate for our projected benefit obligation. As the discount rate is reduced or increased, the pension obligation would increase or decrease, respectively, and future pension expense would increase or decrease, respectively.
In the fourth quarter of 2016, we corrected through other comprehensive income a
$3.7 million
increase to our pension liability for a change in the retirement age assumption for vested terminated participants based upon a 2015 experience study. The change in retirement age should have been reflected in our 2015 actuarial estimate and was immaterial to the current and prior periods.
Pension benefit expense from amortization of net actuarial pension loss is estimated to be
$8.9 million
in
2019
.
We maintain policies for investment of pension plan assets. The policies set forth stated objectives and a structure for managing assets, which includes various asset classes and investment management styles that, in the aggregate, are expected to produce a sufficient level of diversification and investment return over time and provide for the availability of funds for benefits as they become due. The policies also provide guidelines for each investment portfolio that control the level of risk assumed in the portfolio and ensure that assets are managed in accordance with stated objectives. The plan invests primarily in publicly-traded equity and debt securities as directed by the plan’s investment committee. The pension plan’s expected return assumption is based on the weighted average aggregate long-term expected returns of various actively managed asset classes corresponding to the plan’s asset allocation. We have selected an expected return on plan assets based on a historical analysis of rates of return, our investment mix, market conditions and other factors. The fair value of plan assets decreased in
2018
due primarily to investment losses and benefit payments in excess of our discretionary contribution and increased in
2017
due primarily to investment returns in excess of benefit payments and our discretionary contribution.
F-53
|
(amounts in thousands)
|
|||||||
|
Change in fair value of plan assets - U.S. benefit plan
|
2018
|
2017
|
|||||
|
Balance as of January 1,
|
$
|
339,751
|
|
$
|
295,995
|
|
|
|
Actual return on plan assets
|
(20,466
|
)
|
52,559
|
|
|||
|
Company contribution
|
4,125
|
|
10,000
|
|
|||
|
Benefits paid
|
(15,965
|
)
|
(14,948
|
)
|
|||
|
Administrative expenses paid
|
(4,682
|
)
|
(3,855
|
)
|
|||
|
Balance at period end
|
$
|
302,763
|
|
$
|
339,751
|
|
|
The plan’s investments as of December 31 are summarized below:
|
% of Plan Assets
|
|||
|
Summary of plan investments - U.S. benefit plan
|
2018
|
2017
|
|
|
Equity securities
|
7.4
|
7.3
|
|
|
Debt securities
|
38.0
|
35.3
|
|
|
Other
|
54.6
|
57.4
|
|
|
100.0
|
100.0
|
||
The plan’s projected benefit obligation is determined by using weighted-average assumptions made on
December 31,
of each year as summarized below:
|
(amounts in thousands)
|
|||||||
|
Change in projected benefit obligation - U.S. benefit plan
|
2018
|
2017
|
|||||
|
Balance as of January 1,
|
$
|
435,696
|
|
$
|
405,310
|
|
|
|
Service cost
|
4,170
|
|
3,870
|
|
|||
|
Interest cost
|
13,180
|
|
13,371
|
|
|||
|
Actuarial loss
|
(48,463
|
)
|
31,948
|
|
|||
|
Benefits paid
|
(15,965
|
)
|
(14,948
|
)
|
|||
|
Administrative expenses paid
|
(4,682
|
)
|
(3,855
|
)
|
|||
|
Balance at period end
|
$
|
383,936
|
|
$
|
435,696
|
|
|
|
Discount rate
|
4.27%
|
3.47%
|
|||||
|
Compensation increase rate
|
N/A
|
N/A
|
|||||
As of
December 31, 2018
, the plan’s estimated benefit payments for the next ten years are as follows (amounts in thousands):
|
2019
|
$
|
17,623
|
|
|
2020
|
18,376
|
|
|
|
2021
|
19,232
|
|
|
|
2022
|
20,002
|
|
|
|
2023
|
20,667
|
|
|
|
2024-2028
|
111,159
|
|
|
The company made cash contributions to the plan of
$4.1 million
and
$10.0 million
for the year ended
December 31, 2018
and 2017, respectively. During fiscal year
2019
, we expect to make cash contributions to the plan of approximately
$7.7 million
.
F-54
The plan’s accumulated benefit obligation of
$383.9 million
is determined by taking the projected benefit obligation and removing the impact of the assumed compensation increases. The plan’s funded status as of December 31 is as follows:
|
(amounts in thousands)
|
|||||||
|
Unfunded pension liability - U.S. benefit plan
|
2018
|
2017
|
|||||
|
Projected benefit obligation at end of period
|
$
|
383,936
|
|
$
|
435,696
|
|
|
|
Fair value of plan assets at end of period
|
(302,763
|
)
|
(339,751
|
)
|
|||
|
Unfunded pension liability
|
81,173
|
|
95,945
|
|
|||
|
Current portion
|
—
|
|
—
|
|
|||
|
Long-term unfunded pension liability
|
$
|
81,173
|
|
$
|
95,945
|
|
|
The current portion of the unfunded pension liability is recorded in accrued payroll and benefits and is equal to the expected employer contributions in the following year.
Net actuarial pension losses are recorded in consolidated other comprehensive income (loss) for the years ended December 31 are as follows:
|
(amounts in thousands)
|
|||||||||||
|
Accumulated other comprehensive income (loss) - U.S. benefit plan
|
2018
|
2017
|
2016
|
||||||||
|
Net actuarial pension loss beginning of period
|
$
|
112,632
|
|
$
|
127,982
|
|
$
|
130,052
|
|
||
|
Amortization of net actuarial loss
|
(9,314
|
)
|
(12,680
|
)
|
(12,264
|
)
|
|||||
|
Net (gain) loss occurring during year
|
(7,228
|
)
|
(2,670
|
)
|
10,194
|
|
|||||
|
Net actuarial pension loss at end of period
|
96,090
|
|
112,632
|
|
127,982
|
|
|||||
|
Tax benefit
|
(5,344
|
)
|
(9,583
|
)
|
(15,041
|
)
|
|||||
|
Net actuarial pension loss at end of period, net of tax
|
$
|
90,746
|
|
$
|
103,049
|
|
$
|
112,941
|
|
||
Non-U.S. Defined Benefit Plans
– We have several other defined benefit plans located outside the U.S. that are country specific. Some of these plans remain open to participants and others are closed. The expenses related to these plans are recorded in the consolidated statements of operations and are determined by using weighted-average assumptions made on January 1 of each year as summarized below for the years ended December 31.
During 2018, we discovered that certain expenses and benefit obligations related to defined benefit plans in Europe had been omitted from the certain prior year disclosures. The disclosures below have been revised to include these plans for the years ended December 31, 2017 and 2016. The revision had no impact on the consolidated balance sheets, statements of operations or cash flows as there was no change in the amounts recorded.
|
(amounts in thousands)
|
|||||||||||
|
Components of pension benefit expense - Non-U.S. benefit plans
|
2018
|
2017
|
2016
|
||||||||
|
Service cost
|
$
|
2,070
|
|
$
|
1,668
|
|
$
|
1,341
|
|
||
|
Interest cost
|
1,417
|
|
1,272
|
|
1,218
|
|
|||||
|
Expected return on plan assets
|
(833
|
)
|
(700
|
)
|
(714
|
)
|
|||||
|
Amortization of net actuarial pension loss
|
189
|
|
145
|
|
351
|
|
|||||
|
Pension benefit expense
|
$
|
2,843
|
|
$
|
2,385
|
|
$
|
2,196
|
|
||
|
Discount rate
|
0.2% - 9.0%
|
0.8% - 7.2%
|
0.7% - 8.3%
|
||||||||
|
Expected long-term rate of return on assets
|
0.0% - 5.3%
|
0.0% - 5.7%
|
0.0% - 5.3%
|
||||||||
|
Compensation increase rate
|
0.5% - 7.0%
|
0.5% - 7.0%
|
0.5% - 7.0%
|
||||||||
F-55
Non-U.S. pension benefit expenses from amortization of net actuarial pension losses are estimated to be
$0.7 million
in
2019
.
|
(amounts in thousands)
|
|||||||
|
Change in fair value of plan assets - Non-U.S. benefit plans
|
2018
|
2017
|
|||||
|
Balance as of January 1,
|
$
|
15,994
|
|
$
|
13,596
|
|
|
|
Actual return on plan assets
|
(33
|
)
|
1,232
|
|
|||
|
Company contribution
|
250
|
|
277
|
|
|||
|
Benefits paid
|
(2,046
|
)
|
(198
|
)
|
|||
|
Administrative expenses paid
|
(25
|
)
|
(49
|
)
|
|||
|
Cumulative translation adjustment
|
(1,464
|
)
|
1,136
|
|
|||
|
Balance at period end
|
$
|
12,676
|
|
$
|
15,994
|
|
|
The investments of the non-U.S. plans as of December 31 are summarized below:
|
% of Plan Assets
|
|||
|
Summary of plan investments - Non-U.S. benefit plans
|
2018
|
2017
|
|
|
Equity securities
|
48.4
|
48.3
|
|
|
Debt securities
|
20.8
|
22.0
|
|
|
Other
|
30.8
|
29.7
|
|
|
100.0
|
100.0
|
||
The projected benefit obligation for the non-U.S. plans is determined by using weighted-average assumptions made on
December 31,
of each year as summarized below:
|
(amounts in thousands)
|
|||||||
|
Change in projected benefit obligation - Non-U.S. benefit plans
|
2018
|
2017
|
|||||
|
Balance as of January 1,
|
$
|
41,406
|
|
$
|
35,113
|
|
|
|
Pension obligation acquired
|
4,891
|
|
—
|
|
|||
|
Service cost
|
2,242
|
|
1,683
|
|
|||
|
Interest cost
|
956
|
|
1,251
|
|
|||
|
Actuarial loss
|
776
|
|
1,250
|
|
|||
|
Benefits paid
|
(4,481
|
)
|
(1,143
|
)
|
|||
|
Administrative expenses paid
|
(25
|
)
|
(49
|
)
|
|||
|
Cumulative translation adjustment
|
(2,962
|
)
|
3,301
|
|
|||
|
Balance at period end
|
$
|
42,803
|
|
$
|
41,406
|
|
|
|
Discount rate
|
0.2% - 3.1%
|
0.8% - 5.1%
|
|||||
|
Compensation increase rate
|
0.5% - 2.5%
|
0.5% - 2.8%
|
|||||
As of
December 31, 2018
, the estimated benefit payments for the non-U.S. plans over the next
ten years
are as follows (amounts in thousands):
|
2019
|
$
|
2,600
|
|
|
2020
|
2,386
|
|
|
|
2021
|
2,849
|
|
|
|
2022
|
2,476
|
|
|
|
2023
|
2,788
|
|
|
|
2024-2028
|
68,462
|
|
|
The accumulated benefit obligations of
$32.5 million
for the non-U.S. plans are determined by taking the projected benefit obligation and removing the impact of the assumed compensation increases. We expect to contribute
$10.6 million
to the non-U.S. plans in
2019
.
F-56
The funded status of these plans as of December 31 are as follows:
|
(amounts in thousands)
|
|||||||
|
Unfunded pension liability - Non-U.S. benefit plans
|
2018
|
2017
|
|||||
|
Projected benefit obligation at end of period
|
$
|
42,803
|
|
$
|
41,406
|
|
|
|
Fair value of plan assets at end of period
|
(12,676
|
)
|
(15,994
|
)
|
|||
|
Net pension liability
|
$
|
30,127
|
|
$
|
25,412
|
|
|
|
Long-term unfunded pension liability
|
$
|
26,349
|
|
$
|
20,641
|
|
|
|
Current portion
|
5,295
|
|
6,674
|
|
|||
|
Total unfunded pension liability
|
$
|
31,644
|
|
$
|
27,315
|
|
|
|
Total overfunded pension liability
|
$
|
1,517
|
|
$
|
1,903
|
|
|
The current portion of the unfunded pension liability is recorded in accrued payroll and benefits in the accompanying consolidated balance sheets and is equal to the expected employer contributions in the following year. The overfunded pension liability is recorded in long-term other assets in the accompanying consolidated balance sheets.
Net actuarial pension losses are recorded in consolidated other comprehensive income (loss) for the years ended December 31 are as follows:
|
(amounts in thousands)
|
|||||||||||
|
Accumulated other comprehensive income (loss) - Non-U.S. benefit plans
|
2018
|
2017
|
2016
|
||||||||
|
Net actuarial pension loss beginning of period
|
$
|
7,359
|
|
$
|
6,781
|
|
$
|
5,160
|
|
||
|
Amortization of net actuarial loss
|
(1,442
|
)
|
(149
|
)
|
(10
|
)
|
|||||
|
Net gain occurring during year
|
1,462
|
|
742
|
|
1,621
|
|
|||||
|
Cumulative translation adjustment
|
71
|
|
(15
|
)
|
10
|
|
|||||
|
Net actuarial pension loss at end of period
|
7,450
|
|
7,359
|
|
6,781
|
|
|||||
|
Tax benefit
|
(1,911
|
)
|
(1,886
|
)
|
(1,785
|
)
|
|||||
|
Net actuarial pension loss at end of period, net of tax
|
$
|
5,539
|
|
$
|
5,473
|
|
$
|
4,996
|
|
||
Other Defined Contribution Plans
–We have several other defined contribution plans located outside the U.S. that are country specific. Other plans that are characteristically defined contribution plans have accrued liabilities of
$2.6 million
and
$2.1 million
, respectively, at
December 31, 2018
and
December 31, 2017
. The total compensation expense for non-U.S. defined contribution plans was
$27.0 million
in
2018
,
$23.8 million
in
2017
and
$23.3 million
in
2016
.
F-57
Note 31. Supplemental Cash Flow Information
|
(amounts in thousands)
|
2018
|
2017
|
2016
|
||||||||
|
Cash Investing Activities:
|
|||||||||||
|
Change in notes receivable
|
|||||||||||
|
Issuances of notes receivable
|
$
|
(77
|
)
|
$
|
(61
|
)
|
$
|
(68
|
)
|
||
|
Cash received on notes receivable
|
351
|
|
2,052
|
|
1,035
|
|
|||||
|
$
|
274
|
|
$
|
1,991
|
|
$
|
967
|
|
|||
|
Non-cash Investing Activities:
|
|||||||||||
|
Property, equipment and intangibles purchased in accounts payable
|
$
|
6,961
|
|
$
|
15,099
|
|
$
|
1,340
|
|
||
|
Property and equipment purchased for debt
|
32,262
|
|
791
|
|
1,438
|
|
|||||
|
Notes receivable and accrued interest from employees and directors settled with return of JWH stock
|
—
|
|
183
|
|
—
|
|
|||||
|
Customer accounts receivable converted to notes receivable
|
110
|
|
393
|
|
1,276
|
|
|||||
|
Cash Financing Activities:
|
|||||||||||
|
Proceeds from issuance of new debt, net of discount
|
$
|
38,823
|
|
$
|
1,240,000
|
|
$
|
374,063
|
|
||
|
Borrowings on long-term debt
|
104,419
|
|
5,334
|
|
763
|
|
|||||
|
Payments of long-term debt
|
(72,422
|
)
|
(1,618,641
|
)
|
(16,844
|
)
|
|||||
|
Payments of debt issuance and extinguishment costs, including underwriting fees
|
(352
|
)
|
(16,358
|
)
|
(8,146
|
)
|
|||||
|
Change in long-term debt
|
$
|
70,468
|
|
$
|
(389,665
|
)
|
$
|
349,836
|
|
||
|
Change in notes payable
|
|||||||||||
|
Payments on notes payable
|
—
|
|
(205
|
)
|
(180
|
)
|
|||||
|
$
|
—
|
|
(205
|
)
|
(180
|
)
|
|||||
|
Non-cash Financing Activities:
|
|||||||||||
|
Prepaid insurance funded through short-term debt borrowings
|
$
|
2,757
|
|
$
|
2,662
|
|
2,954
|
|
|||
|
Shares surrendered for tax obligations for employee share-based transactions in accrued liabilities
|
7
|
|
569
|
|
—
|
|
|||||
|
Accounts payable converted to installment notes
|
12,886
|
|
—
|
|
—
|
|
|||||
|
Other Supplemental Cash Flow Information:
|
|||||||||||
|
Cash taxes paid, net of refunds
|
$
|
46,295
|
|
$
|
22,532
|
|
$
|
26,797
|
|
||
|
Cash interest paid
|
68,892
|
|
66,060
|
|
73,920
|
|
|||||
F-58
Note 32. Quarterly Financial Data (unaudited)
Summarized quarterly financial data for the years ended
December 31, 2018
and
2017
are as follows:
|
Three Months Ended
|
||||||||||||||||
|
Mar. 31,
2018
|
Jun. 30,
2018
|
Sep. 29,
2018
|
Dec. 31,
2018
|
|||||||||||||
|
(dollars in thousands)
|
||||||||||||||||
|
Statements of Operations Data:
|
||||||||||||||||
|
Net revenues
|
$
|
946,179
|
|
$
|
1,172,497
|
|
$
|
1,136,949
|
|
$
|
1,091,078
|
|
||||
|
Gross margin
|
205,853
|
|
248,807
|
|
241,789
|
|
227,285
|
|
||||||||
|
Operating income
|
38,165
|
|
71,098
|
|
7,613
|
|
55,782
|
|
||||||||
|
Income before taxes and equity earnings
|
35,508
|
|
58,641
|
|
(2,721
|
)
|
44,149
|
|
||||||||
|
Net income
|
40,271
|
|
35,452
|
|
28,885
|
|
39,665
|
|
||||||||
|
Net income attributable to common shareholders
|
40,265
|
|
35,511
|
|
28,879
|
|
39,705
|
|
||||||||
|
Net income per share basic
|
$
|
0.38
|
|
$
|
0.34
|
|
$
|
0.28
|
|
$
|
0.39
|
|
||||
|
Net income per share diluted
|
$
|
0.37
|
|
$
|
0.33
|
|
$
|
0.27
|
|
$
|
0.38
|
|
||||
|
Three Months Ended
|
||||||||||||||||
|
Apr. 1,
2017
|
Jul. 1,
2017
|
Sep. 30,
2017
|
Dec. 31,
2017
|
|||||||||||||
|
(dollars in thousands)
|
||||||||||||||||
|
Statements of Operations Data:
|
||||||||||||||||
|
Net revenues
(a)
|
$
|
847,853
|
|
$
|
948,788
|
|
$
|
991,325
|
|
$
|
975,783
|
|
||||
|
Gross margin
(b)
|
181,687
|
|
231,295
|
|
227,894
|
|
208,546
|
|
||||||||
|
Operating income
(c)
|
40,821
|
|
86,823
|
|
86,446
|
|
49,818
|
|
||||||||
|
Income before taxes and equity earnings
|
8,199
|
|
63,408
|
|
63,242
|
|
10,906
|
|
||||||||
|
Net income (loss)
|
6,428
|
|
46,778
|
|
51,275
|
|
(93,690
|
)
|
||||||||
|
Net (loss) income attributable to common shareholders
|
(4,034
|
)
|
46,778
|
|
51,275
|
|
(93,690
|
)
|
||||||||
|
Net (loss) income per share basic
|
$
|
(0.05
|
)
|
$
|
0.45
|
|
$
|
0.49
|
|
$
|
(0.89
|
)
|
||||
|
Net (loss) income per share diluted
|
$
|
(0.05
|
)
|
$
|
0.43
|
|
$
|
0.47
|
|
$
|
(0.89
|
)
|
||||
|
(a)
|
As a result of our retrospective application of ASU 2017-07,
Improving the Presentation of Net Periodic Pension Cost and Net Periodic Postretirement Benefit Cost
and to conform with current-period presentation of revenues, we reclassified certain amounts in our statement of operations that were previously reported in our quarterly periods. These revisions were
$66
for April 1, 2017,
$52
for July 1, 2017,
$(83)
for September 30, 2017,
$(220)
for December 31, 2017.
|
|
(b)
|
As a result of our retrospective application of ASU 2017-07,
Improving the Presentation of Net Periodic Pension Cost and Net Periodic Postretirement Benefit Cost
and to conform with current-period presentation of revenues, we reclassified certain amounts in our statement of operations that were previously reported in our quarterly periods. These revisions were
$322
for April 1, 2017,
$294
for July 1, 2017,
$303
for September 30, 2017,
$305
for December 31, 2017.
|
|
(c)
|
As a result of our retrospective application of ASU 2017-07,
Improving the Presentation of Net Periodic Pension Cost and Net Periodic Postretirement Benefit Cost
and to conform with current-period presentation of revenues, we reclassified certain amounts in our statement of operations that were previously reported in our quarterly periods. These revisions were
$3,131
for April 1, 2017,
$3,103
for July 1, 2017,
$3,111
for September 30, 2017,
$4,495
for December 31, 2017.
|
During the fourth quarter of 2017, the Tax Act lowered our U.S. federal tax rate which reduced the valuation of our net deferred tax assets, resulting in an additional tax expense of approximately
$21.1 million
. In addition, the Tax Act resulted in an additional estimated foreign repatriation tax charge of
$11.3 million
. See Note 17 -
Income Taxes
for further detail.
SCHEDULE I - CONDENSED FINANCIAL INFORMATION OF JELD-WEN HOLDING, INC.
Parent Company Information
F-59
CONDENSED STATEMENTS OF OPERATIONS AND COMPREHENSIVE INCOME (LOSS)
|
For the Years Ended December 31,
|
||||||||||||
|
(amounts in thousands, except share and per share data)
|
2018
|
2017
|
2016
|
|||||||||
|
Selling, general and administrative
|
$
|
15,924
|
|
$
|
23,457
|
|
$
|
48,195
|
|
|||
|
Equity in earnings of subsidiaries
|
159,882
|
|
33,860
|
|
424,946
|
|
||||||
|
Other (income) expense
|
||||||||||||
|
Interest income
|
(36
|
)
|
(35
|
)
|
(57
|
)
|
||||||
|
Interest expense
|
45
|
|
73
|
|
65
|
|
||||||
|
Other
|
(411
|
)
|
(426
|
)
|
(438
|
)
|
||||||
|
Income before taxes
|
144,360
|
|
10,791
|
|
377,181
|
|
||||||
|
Income tax (benefit) expense
|
—
|
|
—
|
|
—
|
|
||||||
|
Net income
|
$
|
144,360
|
|
$
|
10,791
|
|
$
|
377,181
|
|
|||
|
Comprehensive income (loss):
|
||||||||||||
|
Net income
|
$
|
144,360
|
|
$
|
10,791
|
|
$
|
377,181
|
|
|||
|
Other comprehensive (loss) income, net of tax
|
||||||||||||
|
Equity in comprehensive (loss) income of subsidiaries
|
(49,476
|
)
|
101,835
|
|
(34,194
|
)
|
||||||
|
Total other comprehensive (loss) income, net of tax
|
(49,476
|
)
|
101,835
|
|
(34,194
|
)
|
||||||
|
Total comprehensive income
|
$
|
94,884
|
|
$
|
112,626
|
|
$
|
342,987
|
|
|||
See Notes to Condensed Financial Information
SCHEDULE I - CONDENSED FINANCIAL INFORMATION OF JELD-WEN HOLDING, INC.
Parent Company Information
CONDENSED BALANCE SHEETS
F-60
|
(amounts in thousands, except share and per share data)
|
December 31, 2018
|
December 31, 2017
|
||||||
|
ASSETS
|
||||||||
|
Current assets
|
||||||||
|
Cash and cash equivalents
|
$
|
2,289
|
|
$
|
3,830
|
|
||
|
Receivable from subsidiaries
|
1,000
|
|
—
|
|
||||
|
Other current assets
|
20
|
|
15
|
|
||||
|
Total current assets
|
3,309
|
|
3,845
|
|
||||
|
Property and equipment, net
|
3,202
|
|
3,363
|
|
||||
|
Investment in subsidiaries
|
909,712
|
|
885,070
|
|
||||
|
Long-term notes receivable
|
147
|
|
147
|
|
||||
|
Total assets
|
$
|
916,370
|
|
$
|
892,425
|
|
||
|
LIABILITIES AND EQUITY
|
||||||||
|
Current liabilities
|
||||||||
|
Accounts payable
|
$
|
37
|
|
$
|
744
|
|
||
|
Current payable to subsidiaries
|
2,649
|
|
2,126
|
|
||||
|
Accrued expenses and other current liabilities
|
75
|
|
227
|
|
||||
|
Notes payable and current maturities of long-term debt
|
757
|
|
981
|
|
||||
|
Total current liabilities
|
3,518
|
|
4,078
|
|
||||
|
Long-term debt
|
205
|
|
963
|
|
||||
|
Total liabilities
|
3,723
|
|
5,041
|
|
||||
|
Commitments and contingencies
(Note 5)
|
|
|
||||||
|
Shareholders’ equity
|
||||||||
|
Common Stock: 900,000,000 shares authorized, par value $0.01 per share, 101,310,862 shares outstanding as of December 31, 2018; 900,000,000 shares authorized, par value $0.01 per share, 105,990,483 shares outstanding as of December 31, 2017
|
1,013
|
|
1,060
|
|
||||
|
Additional paid-in capital
|
658,593
|
|
652,666
|
|
||||
|
Retained earnings
|
253,041
|
|
233,658
|
|
||||
|
Total shareholders’ equity
|
912,647
|
|
887,384
|
|
||||
|
Total liabilities, convertible preferred shares, and shareholders’ equity
|
$
|
916,370
|
|
$
|
892,425
|
|
||
See Notes to Condensed Financial Information
F-61
SCHEDULE I - CONDENSED FINANCIAL INFORMATION OF JELD-WEN HOLDING, INC.
Parent Company Information
CONDENSED STATEMENTS OF CASH FLOWS
|
For the Years Ended December 31,
|
||||||||||||
|
(amounts in thousands)
|
2018
|
2017
|
2016
|
|||||||||
|
OPERATING ACTIVITIES
|
||||||||||||
|
Net income
|
$
|
144,360
|
|
$
|
10,791
|
|
$
|
377,181
|
|
|||
|
Adjustments to reconcile net income to cash used in operating activities:
|
||||||||||||
|
Depreciation
|
161
|
|
139
|
|
139
|
|
||||||
|
Litigation settlement funded by subsidiaries
|
—
|
|
—
|
|
—
|
|
||||||
|
Income from subsidiaries investment
|
(159,882
|
)
|
(33,860
|
)
|
(424,946
|
)
|
||||||
|
Other items, net
|
538
|
|
191
|
|
(205
|
)
|
||||||
|
Payment to option holders funded by subsidiaries
|
—
|
|
—
|
|
20,739
|
|
||||||
|
Stock-based compensation
|
15,052
|
|
19,785
|
|
22,464
|
|
||||||
|
Net change in operating assets and liabilities, net of effect of acquisitions:
|
||||||||||||
|
Receivables and payables from subsidiaries
|
123,366
|
|
(24,020
|
)
|
(1,296
|
)
|
||||||
|
Other assets
|
(5
|
)
|
(15
|
)
|
(5,253
|
)
|
||||||
|
Accounts payable and accrued expenses
|
(859
|
)
|
(882
|
)
|
1,092
|
|
||||||
|
Net cash provided by (used in) operating activities
|
122,731
|
|
(27,871
|
)
|
(10,085
|
)
|
||||||
|
INVESTING ACTIVITIES
|
||||||||||||
|
Additional Investment in subsidiaries
|
—
|
|
(480,306
|
)
|
—
|
|
||||||
|
Cash received on notes receivable
|
—
|
|
17
|
|
16
|
|
||||||
|
Proceeds from sales of subsidiaries' shares
|
—
|
|
30,181
|
|
32,605
|
|
||||||
|
Distribution received from subsidiaries
|
1,500
|
|
1,000
|
|
382,400
|
|
||||||
|
Net cash provided by (used in) investing activities
|
1,500
|
|
(449,108
|
)
|
415,021
|
|
||||||
|
FINANCING ACTIVITIES
|
||||||||||||
|
Distributions paid
|
—
|
|
—
|
|
(404,198
|
)
|
||||||
|
Payments of long-term debt
|
(982
|
)
|
(861
|
)
|
(728
|
)
|
||||||
|
Employee note repayments
|
39
|
|
26
|
|
223
|
|
||||||
|
Common stock issued for exercise of options
|
201
|
|
1,029
|
|
1,187
|
|
||||||
|
Common stock repurchased
|
(125,030
|
)
|
—
|
|
—
|
|
||||||
|
Proceeds from sale of common stock, net of underwriting fees and commissions
|
—
|
|
480,306
|
|
—
|
|
||||||
|
Payments associated with initial public offering
|
—
|
|
(2,066
|
)
|
—
|
|
||||||
|
Net cash (used in) provided by financing activities
|
(125,772
|
)
|
478,434
|
|
(403,516
|
)
|
||||||
|
Net (decrease) increase in cash and cash equivalents
|
(1,541
|
)
|
1,455
|
|
1,420
|
|
||||||
|
Cash, cash equivalents and restricted cash, beginning
|
3,830
|
|
2,375
|
|
955
|
|
||||||
|
Cash, cash equivalents and restricted cash, ending
|
$
|
2,289
|
|
$
|
3,830
|
|
$
|
2,375
|
|
|||
See Notes to Condensed Financial Information
F-62
SCHEDULE I - CONDENSED FINANCIAL INFORMATION OF JELD-WEN HOLDING, INC.
Parent Company Information
NOTES TO CONDENSED FINANCIAL INFORMATION
Note 1. Description of Company and Summary of Significant Accounting Policies
Accounting policies adopted in the preparation of this condensed parent company only financial information are the same as those adopted in the consolidated financial statements and described in Note 1 -
Description of Company and Summary of Significant Accounting Policies,
of the consolidated financial statements included in this Form 10-K.
Nature of Business
– JELD-WEN Holding, Inc., (the “Parent Company”) (a Delaware corporation) was formed by Onex Partners III LP to effect the acquisition of JELD-WEN, Inc. and had no activities prior to the acquisition of JELD-WEN, Inc. on October 3, 2011. The Parent Company is a holding company with no material operations of its own that conducts substantially all of its activities through its direct subsidiary, JELD-WEN Inc. and its subsidiaries.
The accompanying condensed parent-only financial information includes the accounts of the Parent Company and, on an equity basis, its direct and indirect subsidiaries and affiliates. Accordingly, these condensed financial statements have been presented on a “parent-only” basis. Under a parent-only presentation, the Parent Company’s investments in subsidiaries are presented under the equity method of accounting. These parent-only financial statements should be read in conjunction with the JELD-WEN Holding, Inc. and subsidiaries consolidated financial statements included elsewhere herein.
The condensed parent-only financial statements have been prepared in accordance with Rule 12-04, Schedule I of Regulation S-X as the restricted net assets of the subsidiaries of the Company exceed 25% of the consolidated net assets of the Company. The ability of the Company’s operating subsidiaries to pay dividends may be restricted due to the terms of the subsidiaries’ financing arrangements (see Note 15 -
Long-Term Debt
to the consolidated financial statements).
Property and Equipment
– Property and equipment is recorded at cost. The cost of major additions and betterments are capitalized and depreciated using the straight-line method over their estimated useful lives while replacements, maintenance and repairs that do not improve or extend the useful lives of the related assets or adapt the property to a new or different use are expensed as incurred.
Depreciation is generally provided over the following estimated useful service lives:
|
Buildings
|
15 - 45 years
|
Note 2. Property and Equipment, Net
|
(amounts in thousands)
|
2018
|
2017
|
|||||
|
Buildings
|
$
|
3,632
|
|
$
|
3,636
|
|
|
|
Total depreciable assets
|
3,632
|
|
3,636
|
|
|||
|
Accumulated depreciation
|
(430
|
)
|
(273
|
)
|
|||
|
Total property and equipment, net
|
$
|
3,202
|
|
$
|
3,363
|
|
|
Depreciation expense was
$0.2 million
in the years ended
December 31, 2018
, and
$0.1 million
in the years ended
2017
and
2016
, respectively.
F-63
Note 3. Long-Term Debt
|
(amounts in thousands)
|
2018 Year-end Effective Interest Rate
|
2018
|
2017
|
||||||
|
Installment notes for stock
|
3.50% - 5.50%
|
$
|
962
|
|
$
|
1,944
|
|
||
|
Current maturities of long-term debt
|
(757
|
)
|
(981
|
)
|
|||||
|
$
|
205
|
|
$
|
963
|
|
||||
|
Maturities by year:
|
||||
|
2019
|
$
|
757
|
|
|
|
2020
|
205
|
|
||
|
2021
|
—
|
|
||
|
2022
|
—
|
|
||
|
2023
|
—
|
|
||
|
Thereafter
|
—
|
|
||
|
$
|
962
|
|
||
Installment Notes for Stock
- We entered into installment notes for stock representing amounts due to former or retired employees for repurchases of our stock that are payable over
5
or
10 years
depending on the amount with payments through 2020. As of
December 31, 2018
, we had
$1.0 million
outstanding under these notes.
Note 4. Stock Compensation
For discussion of stock compensation expense of the Parent Company and its subsidiaries, see Note 23 -
Stock Compensation
, to the consolidated financial statements.
Note 5. Commitments and Contingencies
For discussion of the commitments and contingencies of the subsidiaries of the Parent Company see Note 29 -
Commitments and Contingencies
, to the consolidated financial statements.
Note 6. Supplemental Cash Flow
|
(amounts in thousands)
|
2018
|
2017
|
2016
|
||||||||
|
Non-cash Investing Activities:
|
|||||||||||
|
Notes receivable and accrued interest from employees and directors settled with return of JWH stock
|
$
|
—
|
|
$
|
183
|
|
$
|
—
|
|
||
|
Dividend from subsidiary settled with payable to subsidiary
|
132,295
|
|
—
|
|
—
|
|
|||||
|
Non-cash Financing Activities:
|
|||||||||||
|
Shares surrendered for tax obligations for employee share-based transactions in accrued liabilities
|
$
|
7
|
|
$
|
569
|
|
$
|
—
|
|
||
|
Costs associated with initial public offering formerly capitalized in prepaid expenses
|
—
|
|
5,857
|
|
—
|
|
|||||
|
Subsidiary non-cash director notes and accrued interest activity
|
—
|
|
—
|
|
2,068
|
|
|||||
F-64
TABLE OF CONTENTS
Part I - Financial InformationItem 1 - BusinessItem 1A - Risk FactorsItem 1B - Unresolved Staff CommentsItem 2 - PropertiesItem 3 - Legal ProceedingsItem 4 - Mine Safety DisclosuresPart II - Other InformationItem 5 - Market For Registrant's Common Equity, Related Shareholder Matters and Issuer Purchases Of Equity SecuritiesItem 6 - Selected Financial DataItem 7 - Management S Discussion and Analysis Of Financial Condition and Results Of OperationsItem 7A - Quantitative and Qualitative Disclosures About Market RiskItem 8 - Financial StatementsItem 9 - Changes in and Disagreements with Accountants on Accounting and Financial DisclosureItem 9A - Controls and ProceduresItem 9B - Other InformationItem 10 - Directors, Executive Officers and Corporate GovernanceItem 11 - Executive CompensationItem 12 - Security Ownership Of Certain Beneficial Owners and Management and Related Shareholder MattersItem 13 - Certain Relationships and Related Transactions, and Director IndependenceItem 14 - Principal Accounting Fees and ServicesItem 15 - Exhibits and Financial Statement SchedulesItem 16 - Form 10-k SummaryItem 1 - Financial StatementsNote 1. Description Of Company and Summary Of Significant Accounting PoliciesNote 2. AcquisitionsNote 3. Discontinued Operations and DivestituresNote 4. Accounts ReceivableNote 5. InventoriesNote 6. Other Current AssetsNote 7. Property and Equipment, NetNote 8. GoodwillNote 9. Intangible Assets, NetNote 10. Other AssetsNote 11. InvestmentsNote 12. Accrued Payroll and BenefitsNote 13. Accrued Expenses and Other Current LiabilitiesNote 14. Warranty LiabilityNote 15. Long-term DebtNote 16. Deferred Credits and Other LiabilitiesNote 17. Income TaxesNote 18. Segment InformationNote 19. Series A Convertible Preferred SharesNote 20. Capital StockNote 21. Revenue RecognitionNote 22. Earnings Per ShareNote 23. Stock CompensationNote 24. Impairment and Restructuring ChargesNote 25. Interest ExpenseNote 26. Other (income) ExpenseNote 27. Derivative Financial InstrumentsNote 28. Fair Value Of Financial InstrumentsNote 29. Commitments and ContingenciesNote 30. Employee Retirement and Pension BenefitsNote 31. Supplemental Cash Flow InformationNote 32. Quarterly Financial Data (unaudited)Note 2. Property and Equipment, NetNote 3. Long-term DebtNote 4. Stock CompensationNote 5. Commitments and ContingenciesNote 6. Supplemental Cash Flow