HENRY JACK & ASSOCIATES INC
10-Ks and 10-Qs
|
|
|
|
|
|
|
|
|
|
|
|
|
|
|
|
|
|
|
|
|
|
|
|
|
|
|
|
|
|
|
|
|
|
|
|
|
|
|
|
|
|
|
|
|
|
|
|
|
|
|
|
|
|
|
|
|
|
|
UNITED STATES
SECURITIES AND EXCHANGE COMMISSION
WASHINGTON, D.C. 20549
FORM 10-K
ANNUAL REPORT
PURSUANT TO SECTION 13 OR 15(d)
OF THE SECURITIES EXCHANGE ACT OF 1934
(Mark One)
|
(X)
|
ANNUAL REPORT PURSUANT TO SECTION 13 OR 15(d) OF THE SECURITIES EXCHANGE ACT OF 1934
|
|
For the fiscal year ended June 30, 2019
|
|
|
OR
|
|
|
( )
|
TRANSITION REPORT PURSUANT TO SECTION 13 OR 15(d) OF THE SECURITIES EXCHANGE ACT OF 1934
|
|
For the transition period from ______________ to ________________
|
|
Commission file number
0-14112
JACK HENRY & ASSOCIATES, INC.
(Exact name of registrant as specified in its charter)
|
Delaware
|
|
43-1128385
|
|
(State or Other Jurisdiction of Incorporation)
|
|
(I.R.S Employer Identification No.)
|
663 Highway 60, P.O. Box 807, Monett, MO 65708
(Address of Principle Executive Offices)
(Zip Code)
417-235-6652
(Registrant’s telephone number, including area code)
Securities registered pursuant to Section 12(b) of the Act:
|
Title of each class
|
Trading Symbol
|
Name of each exchange on which registered
|
|
Common Stock ($0.01 par value)
|
JKHY
|
NASDAQ Global Select Market
|
Securities registered pursuant to Section 12(g) of the Act:
None
Indicate by check mark if the registrant is a well-known seasoned issuer, as defined in Rule 405 of the Securities Act.
Yes [ X ] No [ ]
Indicate by check mark if the registrant is not required to file reports pursuant to Section 13 or 15(d) of the Act.
Yes [ ] No [ X ]
Indicate by check mark whether the registrant (1) has filed all reports required to be filed by Section 13 or 15(d) of the Securities Exchange Act of 1934 during the preceding 12 months (or for such shorter period that the registrant was required to file such reports), and (2) has been subject to such filing requirements for the past 90 days.
Yes [ X ] No [ ]
Indicate by check mark whether the registrant has submitted electronically every Interactive Data File required to be submitted pursuant to Rule 405 of Regulation S-T during the preceding 12 months (or for such shorter period that the registrant was required to submit such files).
Yes [ X ] No [ ]
Indicate by check mark if disclosure of delinquent filers pursuant to Item 405 of Regulation S-K is not contained herein, and will not be contained, to the best of registrant’s knowledge, in definitive proxy or information statements incorporated by reference in Part III of this Form 10-K or any amendment to this Form 10-K. [X]
Indicate by check mark whether the registrant is a large accelerated filer, an accelerated filer, a non-accelerated filer, smaller reporting company, or an emerging growth company. See the definitions of “large accelerated filer,” ”accelerated filer,” “smaller reporting company,” and "emerging growth company" in Rule 12b-2 of the Exchange Act.
|
Large accelerated filer
|
[X]
|
Accelerated filer
|
[ ]
|
|
|
|
||
|
Non-accelerated filer
|
[ ]
|
Smaller reporting company
|
[ ]
|
|
Emerging Growth Company
|
[ ]
|
||
If an emerging growth company, indicate by check mark if the registrant has elected not to use the extended transition period for complying with any new or revised financial accounting standards provided pursuant to Section 13(a) of the Exchange Act. [ ]
Indicate by check mark whether the Registrant is a shell company (as defined in Rule 12b-2 of the Exchange Act)
Yes [ ] No [ X ]
On
December 31, 2018
, the aggregate market value of the Common Stock held by persons other than those who may be deemed affiliates of Registrant was
$10,791,330,916
(based on the average of the reported high and low sales prices on NASDAQ on
December 31, 2018
).
As of
August 15, 2019
, the Registrant had
77,000,307
shares of Common Stock outstanding ($0.01 par value).
DOCUMENTS INCORPORATED BY REFERENCE
Portions of the Company's Notice of Annual Meeting of Stockholders and Proxy Statement for its
2019
Annual Meeting of Stockholders (the "Proxy Statement") are incorporated by reference into Part III of this Report to the extent stated herein. Such proxy statement will be filed with the Securities and Exchange Commission within 120 days of the Company's fiscal year ended
June 30, 2019
.
TABLE OF CONTENTS
|
Page Reference
|
||
|
PART I
|
||
|
ITEM 1.
|
BUSINESS
|
|
|
ITEM 1A.
|
RISK FACTORS
|
|
|
ITEM 1B.
|
UNRESOLVED STAFF COMMENTS
|
|
|
ITEM 2.
|
PROPERTIES
|
|
|
ITEM 3.
|
LEGAL PROCEEDINGS
|
|
|
ITEM 4.
|
MINE SAFETY DISCLOSURES
|
|
|
PART II
|
||
|
ITEM 5.
|
MARKET FOR REGISTRANT'S COMMON EQUITY, RELATED STOCKHOLDER MATTERS AND ISSUER PURCHASES OF EQUITY SECURITIES
|
|
|
ITEM 6.
|
SELECTED FINANCIAL DATA
|
|
|
ITEM 7.
|
MANAGEMENT'S DISCUSSION AND ANALYSIS OF FINANCIAL CONDITION AND RESULTS OF OPERATIONS
|
|
|
ITEM 7A.
|
QUANTITATIVE AND QUALITATIVE DISCLOSURES ABOUT MARKET RISK
|
|
|
ITEM 8.
|
FINANCIAL STATEMENTS AND SUPPLEMENTARY DATA
|
|
|
|
|
|
|
ITEM 9.
|
CHANGES IN AND DISAGREEMENTS WITH ACCOUNTANTS ON ACCOUNTING AND FINANCIAL DISCLOSURE
|
|
|
ITEM 9A.
|
CONTROLS AND PROCEDURES
|
|
|
ITEM 9B.
|
OTHER INFORMATION
|
|
|
|
|
|
|
PART III
|
||
|
|
|
|
|
ITEM 10.
|
DIRECTORS, EXECUTIVE OFFICERS AND CORPORATE GOVERNANCE
|
|
|
ITEM 11.
|
EXECUTIVE COMPENSATION
|
|
|
ITEM 12.
|
SECURITY OWNERSHIP OF CERTAIN BENEFICIAL OWNERS AND MANAGEMENT AND RELATED STOCKHOLDER MATTERS
|
|
|
ITEM 13.
|
CERTAIN RELATIONSHIPS AND RELATED TRANSACTIONS, AND DIRECTOR INDEPENDENCE
|
|
|
ITEM 14.
|
PRINCIPAL ACCOUNTANT FEES AND SERVICES
|
|
|
PART IV
|
||
|
ITEM 15
|
EXHIBITS AND FINANCIAL STATEMENT SCHEDULES
|
|
|
ITEM 16
|
FORM 10-K SUMMARY
|
|
3
In this report, all references to “JHA”, the “Company”, “we”, “us”, and “our”, refer to Jack Henry & Associates, Inc., and its wholly owned subsidiaries. Unless otherwise stated, references to particular years, quarters, months, or periods refer to the Company's fiscal years ended in June and the associated quarters, months, and periods of those fiscal years.
FORWARD LOOKING STATEMENTS
Certain statements in this report, other than purely historical information, including estimates, projections, statements relating to our business plans, objectives and expected operating results, and the assumptions upon which those statements are based, are “forward-looking statements” within the meaning of the Private Securities Litigation Reform Act of 1995, Section 27A of the Securities Act of 1933 and Section 21E of the Securities Exchange Act of 1934 (the "Exchange Act"). Forward-looking statements may appear throughout this report, including without limitation, in Management's Discussion and Analysis of Financial Condition and Results of Operations. Forward-looking statements generally are identified by the words “believe,” “project,” “expect,” “anticipate,” “estimate,” "future," "intend," "plan," "predict," "will," "would," "could," "can," "may," and similar expressions. Forward-looking statements are based on current expectations and assumptions that are subject to risks and uncertainties which may cause actual results to differ materially from the forward-looking statements. A detailed discussion of risks and uncertainties that could cause actual results and events to differ materially from such forward-looking statements is included in the section titled “Risk Factors” (Part I, Item 1A of this Form 10-K). We undertake no obligation to update or revise publicly any forward-looking statements, whether as a result of new information, future events, or otherwise, except as required by law.
4
PART I
ITEM 1. BUSINESS
Jack Henry & Associates, Inc. (JHA) was founded in 1976 as a provider of core information processing solutions for community banks. Today, the Company’s extensive array of products and services includes processing transactions, automating business processes, and managing information for
over
9,000
financial institutions and diverse corporate entities.
JHA provides its products and services through three primary business brands:
|
•
|
Jack Henry Banking
is a leading provider of integrated data processing systems to
nearly
1,030
banks ranging from community banks to multi-billion-dollar institutions with assets of up to
$50 billion
. The number of banks we serve has decreased in the last year due to acquisitions and mergers within the banking industry, which are discussed further under the heading "Industry Background" in this Item 1. Our banking solutions support both in-house and outsourced operating environments with three functionally distinct core processing platforms and
more than
140
integrated complementary solutions.
|
|
•
|
Symitar
is a leading provider of core data processing solutions for credit unions of all sizes, with
over
830
credit union customers. Symitar markets two functionally distinct core processing platforms and
more than
100
integrated complementary solutions that support both in-house and outsourced operating environments.
|
|
•
|
ProfitStars
is a leading provider of highly specialized core agnostic products and services to financial institutions that are primarily not core customers of the Company. ProfitStars offers highly specialized financial performance, imaging and payments processing, information security and risk management, retail delivery, and online and mobile solutions. ProfitStars’ products and services enhance the performance of traditional financial services organizations of all asset sizes and charters, and non-traditional diverse corporate entities with
over
9,000
customers, including
over
7,200
non-core customers.
|
Our products and services provide our customers solutions that can be tailored to support their unique growth, service, operational, and performance goals. Our solutions also enable financial institutions to offer the high-demand products and services required by their customers to compete more successfully, and to capitalize on evolving trends shaping the financial services industry.
We are committed to exceeding our customers’ service-related expectations. We measure and monitor customer satisfaction using formal annual surveys and online surveys initiated each day randomly by routine support requests. We believe the results of this extensive survey process confirm that our service consistently exceeds our customers’ expectations and generates excellent customer retention rates.
We also focus on establishing long-term customer relationships, continually expanding and strengthening those relationships with cross sales of additional products and services, earning new traditional and nontraditional clients, and ensuring each product offering is highly competitive.
The majority of our revenue is derived from support and services provided to our in-house customers that are typically on a one-year contract, outsourcing services that are typically on a five-year or greater contract, and recurring electronic payment solutions that are also generally on a contract term of five years or greater. Less predictable software license fees, paid by customers implementing our software solutions in-house, and hardware sales, including all non-software products that we re-market in order to support our software systems, complement our primary revenue sources. Information regarding the classification of our business into four separate segments is set forth in Note 13 to the Consolidated Financial Statements (see Item 8).
JHA’s progress and performance have been guided by the focused work ethic and fundamental ideals fostered by the Company’s founders
43
years ago:
|
•
|
Do the right thing,
|
|
•
|
Do whatever it takes, and
|
|
•
|
Have fun.
|
We recognize that our associates and their collective contribution are ultimately responsible for JHA’s past, present, and future success. Recruiting and retaining high-quality employees is essential to our ongoing growth and financial performance, and we have established a corporate culture that sustains high levels of employee satisfaction.
Industry Background
Jack Henry Banking primarily serves commercial banks and savings institutions with up to
$50 billion
in assets. According to the Federal Deposit Insurance Corporation (“FDIC”), there were
approximately
5,360
commercial banks
5
and savings institutions in this asset range as of
December 31, 2018
. Jack Henry Banking currently supports
nearly
1,030
of these banks with its core information processing platforms and complementary products and services.
Symitar serves credit unions of all asset sizes. According to the Credit Union National Association (“CUNA”), there were
more than
5,480
domestic credit unions as of
December 31, 2018
. Symitar currently supports
over
830
of these credit unions with core information processing platforms and complementary products and services.
ProfitStars serves financial services organizations of all asset sizes and charters and other diverse corporate entities. ProfitStars currently supports
over
9,000
institutions with specialized solutions for generating additional revenue and growth, increasing security, mitigating operational risks, and controlling operating costs.
The FDIC reports the number of commercial banks and savings institutions declined
21%
from the beginning of calendar year
2014
to the end of calendar year
2018
, due mainly to mergers. Although the number of banks declined at a
5%
compound annual rate during this period, aggregate assets increased at a compound annual rate of
4%
and totaled
$16.7 trillion
as of
December 31, 2018
. There were
eight
new bank charters issued in calendar year
2018
, compared to
five
in the
2017
calendar year. Comparing calendar years
2018
to
2017
, the number of mergers increased
13%
.
CUNA reports the number of credit unions declined
18%
from the beginning of calendar year
2014
to the end of calendar year
2018
. Although the number of credit unions declined at a
4%
compound annual rate during this period, aggregate assets increased at a compound annual rate of
6%
and totaled
$1.5 trillion
as of
December 31, 2018
.
Community and mid-tier banks and credit unions are important in the communities and to the consumers they serve. Bank customers and credit union members rely on these institutions to provide personalized, relationship-based service and competitive financial products and services available through the customer’s delivery channel of choice. Institutions are recognizing that attracting and retaining customers/members in today’s highly competitive financial industry and realizing near-term and long-term performance goals are often technology-dependent. Financial institutions must implement technological solutions that enable them to:
|
•
|
Implement e-commerce, mobile, and digital strategies that provide the convenience-driven services required in today’s financial services industry;
|
|
•
|
Maximize performance with accessible, accurate, and timely business intelligence information;
|
|
•
|
Offer the high-demand products and services needed to successfully compete with traditional competitors and non-traditional competitors created by convergence within the financial services industry;
|
|
•
|
Enhance the customer/member experience at varied points of contact;
|
|
•
|
Expand existing customer/member relationships and strengthen exit barriers by cross selling additional products and services;
|
|
•
|
Capitalize on new revenue and deposit growth opportunities;
|
|
•
|
Increase operating efficiencies and reduce operating costs;
|
|
•
|
Protect mission-critical information assets and operational infrastructure;
|
|
•
|
Protect customers/members with various security tools from fraud and related financial losses;
|
|
•
|
Maximize the day-to-day use of technology and return on technology investments; and
|
|
•
|
Ensure full regulatory compliance.
|
JHA’s extensive product and service offering enables diverse financial institutions to capitalize on these business opportunities and respond to these business challenges. We strive to establish a long-term, value-added technology partnership with each customer, and to continually expand our offering with the specific solutions our customers need to prosper in the evolving financial services industry.
Mission Statement
Our mission is to protect and increase the value of our stockholders' investment by providing quality solutions and industry-leading service to our customers. In accomplishing this, we feel that it is important to:
|
•
|
Maintain a work environment that is personally, professionally, and financially rewarding for our employees.
|
|
•
|
Concentrate our activities on what we know best - technology solutions and services for financial institutions.
|
|
•
|
Provide outstanding commitment and service to our customers so that the perceived value of our solutions and services is consistent with the real value.
|
Business Strategy
Our fundamental business strategy is to generate organic revenue and earnings growth supplemented by strategic acquisitions. We execute this strategy by:
6
|
•
|
Providing commercial banks and credit unions with core operating systems that provide excellent functionality, and support in-house and outsourced delivery environments with identical functionality.
|
|
•
|
Expanding each core customer relationship by cross-selling complementary products and services that enhance the functionality provided by our core information processing systems.
|
|
•
|
Providing highly specialized core agnostic complementary products and services to financial institutions, including institutions not utilizing a Jack Henry core operating system, and diverse corporate entities.
|
|
•
|
Maintaining a company-wide commitment to customer service that consistently exceeds our customers’ expectations and generates high levels of customer retention.
|
|
•
|
Capitalizing on our acquisition strategy.
|
Acquisition Strategy
We have a disciplined approach to acquisitions and have been successful in supplementing our organic growth with 33 strategic acquisitions since the end of fiscal 1999. We continue to explore acquisitions that have the potential to:
|
•
|
Expand our suite of complementary products and services;
|
|
•
|
Provide products and services that can be sold to both existing core and non-core customers and outside our base to new customers; and /or
|
|
•
|
Provide selective opportunities to sell outside our traditional markets in the financial services industry.
|
We have completed
four
acquisitions in the last 3 years. After
43
years in business, we have very few gaps in our product line, so it is increasingly difficult to find proven products or services that would enable our clients and prospects to better optimize their business opportunities or solve specific operational issues. In addition, we see few acquisition opportunities that would expand our market or enable our entry into adjacent markets within the financial services industry that are fairly priced or that we could assimilate into our company without material distractions.
We have a solid track record of executing acquisitions from both a financial and operational standpoint and we will continue to pursue acquisition opportunities that support our strategic direction, complement and accelerate our organic growth, and generate long-term profitable growth for our shareholders. Until we identify appropriate acquisition opportunities, we will continue to find alternative ways to leverage our cash position and balance sheet to the benefit of our shareholders, such as continued investment in new products and services for our customers, repurchases of our stock, and continued payment of dividends.
Our five most recent acquisitions were:
|
Fiscal Year
|
Company or Product Name
|
Products and Services
|
|
2019
|
BOLTS Technologies, Inc
|
Developer of boltsOPEN, a digital account opening solution
|
|
2019
|
Agiletics, Inc.
|
Provider of escrow, investment, and liquidity management solutions for banks serving commercial customers
|
|
2018
|
Ensenta Corporation
|
Real-time, cloud-based solutions for mobile and online payments and deposits
|
|
2018
|
Vanguard Software Group
|
Underwriting, spreading, and online decisioning of commercial loans
|
Solutions
Our proprietary solutions are marketed through three primary business brands:
|
•
|
Jack Henry Banking
supports commercial banks with information and transaction processing platforms that provide enterprise-wide automation. We have three functionally distinct core bank processing systems and
more than
140
fully-integrated complementary solutions, including business intelligence and bank management, retail and business banking, digital and mobile internet banking and electronic payment solutions, risk management and protection, and item and document imaging solutions. Our banking solutions have state-of-the-art functional capabilities, and we can re-market the hardware required by each software system. Our banking solutions can be delivered in-house or through outsourced delivery model in our private cloud and are backed by a company-wide commitment to provide exceptional personal service. Jack Henry Banking is a recognized market leader, currently supporting
nearly
1,030
banks with its technology platforms.
|
|
•
|
Symitar
supports credit unions of all sizes with information and transaction processing platforms that provide enterprise-wide automation. Our solutions include two functionally distinct core processing systems and
more than
100
fully-integrated complementary solutions, including business intelligence and credit union management, member and member business services, digital and mobile internet banking and electronic payment solutions, risk management and protection, and item and document imaging solutions. Our credit union solutions also have state-
|
7
of-the-art functional capabilities. We also re-market the hardware required by each software system. Our credit union solutions can be delivered in-house or through an outsourced delivery model in our private cloud, and they are also backed by our company-wide commitment to provide exceptional personal service. Symitar currently supports
over
830
credit union customers.
|
•
|
ProfitStars
is a leading provider of specialized products and services assembled primarily through our focused diversification acquisition strategy. These core agnostic solutions are compatible with a wide variety of information technology platforms and operating environments, and include proven solutions for generating additional revenue and growth, increasing security and mitigating operational risks, and/or controlling operating costs. ProfitStars’ products and services enhance the performance of financial services organizations of all asset sizes and charters, and diverse corporate entities. Profitstars has
over
9,000
customers, including
over
7,200
non-core customers. These distinct products and services can be implemented individually or as solution suites to address specific business problems or needs and enable effective responses to dynamic industry trends.
|
We will continue to develop and maintain functionally robust, integrated solutions that are supported with high service levels, regularly updating and improving those solutions using an interactive customer enhancement process; ensuring compliance with relevant regulations; updated with proven advances in technology; and consistent with JHA’s reputation as a premium product and service provider.
Core Software Systems
Core software systems primarily consist of the integrated applications required to process deposit, loan, and general ledger transactions, and to maintain centralized customer/member information.
Jack Henry Banking markets three core software systems to banks and Symitar markets two core software systems to credit unions. These core systems are available for in-house installation at customer sites, or financial institutions can outsource ongoing information processing to JHA.
Jack Henry Banking’s three core banking platforms are:
|
•
|
SilverLake®,
a robust IBM Power System™ (i/OS) based system primarily designed for commercial-focused banks with assets ranging from $500 million to $50 billion. However, some progressive smaller banks and de novo (start-up) banks also select SilverLake. This system is in use by
over
410
banks, and now automates
over
7%
of the domestic banks with assets less than
$50 billion
.
|
|
•
|
CIF 20/20®,
a parameter-driven, easy-to-use system that now supports
over
410
banks ranging from de novo institutions to those with assets exceeding $2 billion. CIF 20/20 is among the most widely used IBM Power System™ (i/OS) core processing systems in the United States ("U.S.") community bank market.
|
|
•
|
Core Director®,
a Windows®-based, client/server system that now supports
nearly
200
banks ranging from de novo institutions to those with assets exceeding $1 billion. Core Director is a cost-efficient operating platform and provides intuitive point-and-click operation.
|
Symitar’s two core credit union platforms are:
|
•
|
Episys®,
a robust IBM Power System™ (AIX®) based system primarily designed for credit unions with more than $50 million in assets. It has been implemented by
nearly
680
credit unions and according to National Credit Union Administration data, is the system implemented by more credit unions with assets exceeding $25 million than any other alternative system.
|
|
•
|
CruiseNet®,
a Windows-based, client/server system designed primarily for credit unions with less than $50 million in assets. It has been implemented by
over
150
credit unions, is cost-efficient, and provides intuitive point-and-click, drag-and-drop operation.
|
Customers electing to install our solutions in-house license the proprietary software systems. The large majority of these customers pay ongoing annual software maintenance fees. We also re-market the hardware and peripheral equipment that is required by our software solutions; and we contract to perform software implementation, data conversion, training, ongoing support, and other related services. In-house customers generally license our core software systems under a standard license agreement that provides a fully-paid, nonexclusive, nontransferable right to use the software on a single computer at a single location.
Customers can eliminate the significant up-front capital expenditures required by in-house installations and the responsibility for operating information and transaction processing infrastructures by outsourcing these functions to JHA. Our core outsourcing services are provided through a national network of
four
data centers located in
four
physical locations. We also provide image item processing services from
two
host/archive sites and several key entry and balancing locations throughout the country. We print and mail customer statements for financial institutions from
three
regional printing and rendering centers. Customers electing to outsource their core processing typically sign contracts
8
for
five
or more years that include transaction-based processing fees and minimum guaranteed payments during the contract period.
We support the dynamic business requirements of our core bank and credit union clients with ongoing enhancements to each core system, the regular introduction of new integrated complementary products, the ongoing integration of practical new technologies, and regulatory compliance initiatives. JHA also serves each core customer as a single point of contact, support, and accountability.
Complementary Products and Services
We provide
more than
140
complementary products and services that are sold to our core bank and credit union customers, and selectively sold by our ProfitStars division to financial services organizations that use other core processing systems.
These complementary solutions enable core bank and credit union clients to respond to evolving customer/member demands, expedite speed-to-market with competitive offerings, increase operating efficiency, address specific operational issues, and generate new revenue streams. The highly specialized solutions sold by ProfitStars enable diverse financial services organizations and corporate entities to generate additional revenue and growth opportunities, increase security and mitigate operational risks, and control operating costs.
JHA regularly introduces new products and services based on demand for integrated complementary solutions from our existing core clients, and based on the growing demand among financial services organizations and corporate entities for specialized solutions capable of increasing revenue and growth opportunities, mitigating and controlling operational risks, and/or containing costs. The Company’s Industry Research department solicits customer guidance on the business solutions they need, evaluates available solutions and competitive offerings, and manages the introduction of new product offerings. JHA’s new complementary products and services are developed internally, acquired, or provided through strategic alliances.
Implementation and Training
Most of our core bank and credit union customers contract with us for implementation and training services in connection with their systems and additional complementary products.
A complete core system implementation typically includes detailed planning, project management, data conversion, and testing. Our experienced implementation teams travel to customer facilities to help manage the process and ensure that all data is transferred from the legacy system to the JHA system. Our implementation fees are fixed or hourly based on the core system being installed.
We also provide extensive initial and ongoing education to our customers. Know-It-All Education is a comprehensive training program that supports new customers with basic training and longtime customers with continuing education. The curricula provide the ongoing training financial institutions need to maximize the use of JHA’s core and complementary products, to optimize ongoing system enhancements, and to fully understand dynamic year-end legislative and regulatory requirements. Each basic, intermediate, and advanced course is delivered by system experts, supported by professional materials and training tools, and incorporates different educational media in a blended learning approach. Know-It-All Education supports distinct learning preferences with a variety of delivery channels, including classroom-based courses offered in JHA’s regional training centers, Internet-based live instruction, eLearning courses, on-site training, and train-the-trainer programs.
Support and Services
We serve our customers as a single point of contact and support for the complex solutions we provide. Our comprehensive support infrastructure incorporates:
|
•
|
Exacting service standards;
|
|
•
|
Trained support staff available 24 hours a day, 365 days a year;
|
|
•
|
Assigned account managers;
|
|
•
|
Sophisticated support tools, resources, and technology;
|
|
•
|
Broad experience converting diverse banks and credit unions to our core platforms from every competitive platform;
|
|
•
|
Highly effective change management and control processes; and
|
|
•
|
A best practices methodology developed and refined through the company-wide, day-to-day experience supporting
over
9,000
diverse clients.
|
Most in-house customers contract for annual software support services, and this represents a significant source of recurring revenue for JHA. These support services are typically priced at approximately 20% of the respective product’s software license fee. The subsequent years' service fees generally increase as customer assets increase and as
9
additional complementary products are purchased. Annual software support fees are typically billed during June and are paid in advance for the entire fiscal year, with pro-ration for new product implementations that occur during the fiscal year. Hardware support fees also are usually paid in advance for entire contract periods which typically range from one to five years. Most support contracts automatically renew unless the customer or JHA gives notice of termination at least 30 days prior to contract expiration.
High levels of support are provided to our outsourced customers by the same support infrastructure utilized for in-house customers. However, these support fees are included as part of monthly outsourcing fees.
JHA regularly measures customer satisfaction using formal annual surveys and more frequent online surveys initiated randomly by routine support requests. We believe this process confirms that we consistently exceed our customers’ service-related expectations.
Hardware Systems
Our software systems operate on a variety of hardware platforms. We have established remarketing agreements with IBM Corporation (fulfilled directly and through IBM distributors), and many other hardware providers that allow JHA to purchase hardware and related maintenance services at a discount and resell them directly to our customers.
W
e currently sell IBM Power Systems; Lenovo, Dell, and HP servers and workstations; Canon, Digital Check, Epson, and Panini check scanners; and other devices that complement our software solutions.
Electronic Payment Solutions
Electronic payment solutions provide our customers with the tools necessary to be at the forefront of payment innovation with secure payment processing designed to simplify complex payment processing, attract profitable retail and commercial accounts, increase operating efficiencies, comply with regulatory mandates, and proactively mitigate and manage payment-related risk.
Jack Henry identifies four components of Electronic Payment Solutions:
|
•
|
Card Services
provides a comprehensive suite of Automated Teller Machine ("ATM"), debit / credit card transaction processing and fraud management solutions. The card processing solutions include loyalty / rewards, fraud detection, cardholder alert and controls, and other key components that are fully integrated with JHA's core and complementary solutions.
|
|
•
|
Bill Pay and Mobile
banking platforms are offered through our iPay and Banno product offerings. iPay offers iPay Business Bill Pay™, a full suite of online financial management solutions designed to meet the distinct needs of small businesses, as well as iPay Consumer Bill Pay™, a solution that supports single or recurring payments, allows customers to receive full bills electronically, and easily integrates with any internet banking provider. Banno Mobile™ offers a native mobile banking application for both iOS and Android that offers innovative and cost-effective mobile services that can be marketed with customer's own brand identity. It allows customers to aggregate all of their account balances and transactional data from multiple financial institutions and empowers them with the convenience of anytime, anywhere account access.
|
|
•
|
Faster Payments
includes the development of JHA PayCenter, a payments hub that provides streamlined, secure payment capabilities for sending and receiving transactions instantly 24 hours a day, 365 days a year, through JHA’s core and complementary solutions with direct connections to real-time networks.
|
|
•
|
Processing/ Other
includes Enterprise Payment Solutions (EPS), a comprehensive payments engine and one of the leading total payments solutions on the market today. EPS offers an integrated suite of remote deposit capture, ACH and card transaction processing solutions, risk management tools, reporting capabilities, and more for financial institutions of all sizes. EPS helps financial institutions succeed in today’s competitive market to increase revenue, improve efficiencies, better manage compliance, and enhance customer relationships. Furthermore, Commercial Lending Solutions help financial institutions securely transition from a traditional lending portfolio (focused on real estate-based consumer lending) to a more fully-diversified portfolio developed via commercial and industrial lending. Our solutions also provide reliable ways to retain creditworthy business customers facing financial hurdles, without the risk of loan loss.
|
Backlog
Backlog consists of contracted in-house products and services that have not been delivered. Backlog also includes the minimum monthly payments for the remaining portion of multi-year outsourcing contracts, and typically includes the minimum payments guaranteed for the remainder of the contract period.
Backlog as of
June 30, 2019
totaled
$785.2 million
, consisting of contracts signed for future delivery of software, hardware, and implementation services (in-house backlog) of
$77.6 million
, and outsourcing services of
$707.6 million
. Approximately
$514.0 million
of the outsourcing services backlog as of
June 30, 2019
is not expected to be realized
10
during fiscal
2020
due to the long-term nature of our outsourcing contracts. Backlog as of
June 30, 2018
totaled
$676.2 million
, consisting of
$76.3 million
for future delivery of in-house software, hardware, and implementation services (in-house backlog), and
$599.9 million
for outsourcing services.
Our outsourcing backlog continues to experience growth based on new contracting activities and renewals of multi-year contracts, and although the appropriate portion of this revenue will be recognized during fiscal
2020
, the backlog is expected to trend up gradually for the foreseeable future due to renewals of existing relationships, existing in-house customers electing to migrate to the outsourced model, and new contracting activities.
Research and Development
We invest significant resources in ongoing research and development to develop new software solutions and services, and enhance existing solutions with additional functionality and features required to ensure regulatory compliance. Our core and complementary systems are enhanced a minimum of once each year. Product-specific enhancements are largely customer-driven with recommended enhancements formally gathered through focus groups, change control boards, strategic initiatives meetings, annual user group meetings, and ongoing customer contact. We also continually evaluate and implement process improvements that expedite the delivery of new products and enhancements to our customers, and reduce related costs.
Research and development expenses for fiscal years
2019
,
2018
, and
2017
were
$96.4 million
,
$90.3 million
, and
$84.8 million
, respectively. We recorded capitalized software in fiscal years
2019
,
2018
, and
2017
of
$111.1 million
,
$96.6 million
, and
$89.6 million
, respectively.
Sales and Marketing
JHA serves established, well defined markets that provide ongoing sales and cross-sales opportunities.
The marketing and sales initiatives within the Jack Henry Banking and Symitar business lines are primarily focused on identifying banks and credit unions evaluating alternative core information and transaction processing solutions. ProfitStars sells specialized core agnostic niche solutions that complement existing technology platforms to domestic financial services organizations of all asset sizes and charters.
Dedicated sales forces support each of JHA’s three primary marketed brands. Sales executives are responsible for the activities required to earn new customers in assigned territories, and regional account executives are responsible for nurturing customer relationships and cross selling additional products and services. Our sales professionals receive base salaries and performance-based commission compensation. Brand-specific sales support staff provide a variety of services, including product and service demonstrations, responses to prospect-issued requests-for-proposals, and proposal and contract generation. Our marketing department supports all of our brands with lead generation and brand-building activities, including participation in state-specific, regional, and national trade shows; print and online advertising; telemarketing; customer newsletters; ongoing promotional campaigns; and media relations. JHA also hosts annual national education conferences which provide opportunities to network with existing clients and demonstrate new products and services.
JHA has sold select products and services in the Caribbean, Canada, Europe, and South America. International sales accounted for
less than
1%
of JHA’s total revenue in the fiscal years
2019
,
2018
, and
2017
.
Competition
The market for companies providing technology solutions to financial services organizations is competitive, and we expect that competition from both existing competitors and companies entering our existing or future markets will remain strong. Some of JHA’s current competitors have longer operating histories, larger customer bases, and greater financial resources. The principal competitive factors affecting the market for technology solutions include product/service functionality, price, operating flexibility and ease-of-use, customer support, and existing customer references. For more than a decade there has been significant consolidation among providers of products and services designed for financial institutions, and this consolidation is expected to continue in the future.
Jack Henry Banking and Symitar compete with large vendors that provide information and transaction processing solutions to banks and credit unions, including Fidelity National Information Services, Inc.; Fiserv, Inc.; and Finastra. ProfitStars competes with an array of disparate vendors that provide niche solutions to financial services organizations and corporate entities.
Intellectual Property, Patents, and Trademarks
Although we believe our success depends upon our technical expertise more than our proprietary rights, our future success and ability to compete depend in part upon our proprietary technology. We have registered or filed applications for our primary trademarks. Most of our technology is not patented. Instead, we rely on a combination of contractual rights, copyrights, trademarks, and trade secrets to establish and protect our proprietary technology. We generally
11
enter into confidentiality agreements with our employees, consultants, resellers, customers, and potential customers. Access to and distribution of our Company’s source code is restricted, and the disclosure and use of other proprietary information is further limited. Despite our efforts to protect our proprietary rights, unauthorized parties can attempt to copy or otherwise obtain, or use our products or technology. We cannot be certain that the steps taken in this regard will be adequate to prevent misappropriation of our technology or that our competitors will not independently develop technologies that are substantially equivalent or superior to our technology.
Regulatory Compliance
JHA maintains a corporate commitment to address compliance issues and implement requirements imposed by federal regulators prior to the effective date of such requirements when adequate prior notice is given. JHA’s compliance program is provided by a team of compliance analysts and auditors that possess extensive regulatory agency and financial institution experience, and a thorough working knowledge of JHA and our solutions. These compliance professionals leverage multiple channels to remain informed about potential and recently enacted regulatory requirements, including regular discussions on emerging topics with the Federal Financial Institutions Examination Council (“FFIEC”) examination team and training sessions sponsored by various professional associations.
JHA has a process to inform internal departments of new and revised regulatory requirements. Upcoming regulatory changes also are presented to the Company’s development teams through monthly regulatory compliance meetings and the necessary product changes are included in the ongoing product development cycle. JHA publishes newsletters to keep our customers informed of regulatory changes that could impact their operations. Periodically, customer advisory groups are assembled to discuss significant regulatory changes.
Internal audits of our systems, networks, operations, business recovery plans, and applications are conducted and specialized outside firms are periodically engaged to perform testing and validation of our systems, processes, plans and security. Ensuring that confidential information remains private is a high priority, and JHA’s initiatives to protect confidential information include regular third-party application reviews intended to better secure information access. Additional third-party reviews are performed throughout the organization, such as vulnerability tests, intrusion tests, and System and Organizations Controls (SOC) 1 or SOC 2 reports. The FFIEC conducts annual reviews throughout the Company and issues a Report of Examination. The Board of Directors provides oversight of these activities through the Risk and Compliance Committee and the Audit Committee.
Government Regulation
The financial services industry is subject to extensive and complex federal and state regulation. All financial institutions are subject to substantial regulatory oversight and supervision. Our products and services must comply with the extensive and evolving regulatory requirements applicable to our customers, including but not limited to those mandated by federal truth-in-lending and truth-in-savings rules, the Privacy of Consumer Financial Information regulations, usury laws, the Equal Credit Opportunity Act, the Fair Housing Act, the Electronic Funds Transfer Act, the Fair Credit Reporting Act, the Bank Secrecy Act, the USA Patriot Act, the Gramm-Leach-Bliley Act, the Community Reinvestment Act and the Dodd-Frank Wall Street Reform and Consumer Protection Act. The compliance of JHA’s products and services with these requirements depends on a variety of factors, including the particular functionality, the interactive design, the classification of customers, and the manner in which the customer utilizes the products and services. Our customers are contractually responsible for assessing and determining what is required of them under these regulations and then we assist them in meeting their regulatory needs through our products and services. The impact of the Dodd-Frank Wall Street Reform and Consumer Protection Act continues to evolve as the regulations are written to implement the various provisions of the law. We cannot predict the impact these regulations, any future amendments to these regulations or any newly implemented regulations will have on our business in the future.
JHA is not chartered by the Office of the Comptroller of Currency, the Board of Governors of the Federal Reserve System, the Federal Deposit Insurance Corporation, the National Credit Union Administration or other federal or state agencies that regulate or supervise depository institutions. However, operating as a service provider to financial institutions, JHA’s operations are governed by the same regulatory requirements as those imposed on financial institutions, and subject to periodic reviews by FFIEC regulators who have broad supervisory authority to remedy any shortcomings identified in such reviews.
JHA provides outsourced services through OutLink
™
Data Centers, electronic transaction processing through Card Processing Solutions, Internet banking through NetTeller and Banno online solutions, bill payment through iPay, network security monitoring and Hosted Network Solutions (HNS) through our Gladiator unit, Cloud Services through Hosted Partner Services and Enterprise Integration Services, and business recovery services through Centurion Disaster Recovery.
The outsourcing services provided by JHA are subject to examination by FFIEC regulators under the Bank Service Company Act. These examinations cover a wide variety of subjects, including system development, functionality,
12
reliability, and security, as well as disaster preparedness and business recovery planning. Our outsourcing services are also subject to examination by state banking authorities on occasion.
Employees
As of
June 30, 2019
and
2018
, JHA had
6,402
and
6,307
full-time employees, respectively. Our employees are not covered by a collective bargaining agreement and there have been no labor-related work stoppages.
Available Information
JHA’s Website is easily accessible to the public at
www.jackhenry.com
. The “For Investors" portion of the Website provides key corporate governance documents, the code of conduct, an archive of press releases, and other relevant Company information. Our annual report on Form 10-K, quarterly reports on Form 10-Q, current reports on Form 8-K, and other filings and amendments thereto that are made with the U.S. Securities and Exchange Commission ("SEC") also are available free of charge on our Website as soon as reasonably practical after these reports have been filed with or furnished to the SEC. The SEC also maintains a website that contains reports, proxy and information statements, and other information regarding issuers that file electronically with the SEC at
https://www.sec.gov
.
ITEM 1A. RISK FACTORS
The Company's business and the results of its operations are affected by numerous factors and uncertainties, some of which are beyond our control. The following is a description of some of the important risks and uncertainties that may cause our actual results of operations in future periods to differ materially from those expected or desired.
Security problems could damage our reputation and business.
We rely on industry-standard encryption, network and Internet security systems, most of which we license from third parties, to provide the security and authentication necessary to effect secure transmission of data and to prevent unauthorized access to our computer networks, systems and data. Our services and infrastructure are increasingly reliant on the Internet. Computer networks and the Internet are vulnerable to unauthorized access, computer viruses and other disruptive problems such as denial of service attacks. Other potential attacks include attempts to obtain unauthorized access to confidential information or destroy data, often through the introduction of computer viruses, ransomware or malware, cyber-attacks and other means. To date, none of these types of attacks have had a material effect on our business or operations. Such security attacks can originate from a wide variety of sources, including persons who are involved with organized crime or who may be linked to terrorist organizations or hostile foreign governments. Those same parties may also attempt to fraudulently induce employees, customers, suppliers, or other users of our systems to disclose sensitive information in order to gain access to our data or that of our customers or clients. We are also subject to the risk that our employees may intercept and transmit unauthorized confidential or proprietary information. An interception, misuse or mishandling of personal, confidential or proprietary information being sent to or received from a customer or third party could result in legal liability, remediation costs, regulatory action and reputational harm, any of which could adversely affect our results of operations and financial condition. Individual personal computers can be stolen, and customer data media can be lost in shipment. Under state, federal and foreign laws requiring consumer notification of security breaches, the costs to remediate security breaches can be substantial. Advances in computer capabilities, new discoveries in the field of cryptography or other events or developments may render our security measures inadequate. Security risks may result in liability to our customers or other third parties, damage to our reputation, and may deter financial institutions from purchasing our products. We will continue to expend significant capital and other resources protecting against the threat of security breaches, and, in the event of a breach, we may need to expend resources alleviating problems caused by such breach. Addressing security problems may result in interruptions, delays or cessation of service to users, any of which could harm our business.
Operational failure in our outsourcing facilities could expose us to damage claims, increase regulatory scrutiny and cause us to lose customers.
Damage or destruction that interrupts our outsourcing operations could cause delays and failures in customer processing which could hurt our relationship with customers, damage our reputation, expose us to damage claims, and cause us to incur substantial additional expense to relocate operations and repair or replace damaged equipment. Our back-up systems and procedures may not prevent disruption, such as a prolonged interruption of our transaction processing services. In the event that an interruption extends for more than several hours, we may experience data loss or a reduction in revenues by reason of such interruption. Any significant interruption of service could reduce revenue, have a negative impact on our reputation, result in damage claims, lead our present and potential customers to choose other service providers, and lead to increased regulatory scrutiny of the critical services we provide to financial institutions, with resulting increases in compliance burdens and costs.
Failures associated with payment transactions could result in financial loss.
The volume and dollar amount of payment transactions that we process is significant and continues to grow. We settle funds on behalf of financial institutions, other businesses and consumers and receive funds from clients, card issuers, payment networks and
13
consumers on a daily basis for a variety of transaction types. Transactions facilitated by us include debit card, credit card, electronic bill payment transactions, Automated Clearing House (“ACH”) payments, real-time payments through faster payment networks and check clearing that support consumers, financial institutions and other businesses. If the continuity of operations, integrity of processing, or ability to detect or prevent fraudulent payments were compromised in connection with payments transactions, this could result in financial as well as reputational loss to us. In addition, we rely on various third parties to process transactions and provide services in support of the processing of transactions and funds settlement for certain of our products and services. If we are unable to obtain such services in the future, that could have a material adverse effect on our business, financial position and results of operations. In addition, we may issue credit to consumers, financial institutions or other businesses as part of the funds settlement. A default on this credit by a counterparty could result in a financial loss to us.
Failures of third party service providers we rely upon could lead to financial loss.
We rely on third party service providers to support key portions of our operations. We also rely on third party service providers to provide part or all of certain services we deliver to customers. While we have selected these third party vendors carefully, we do not control their actions. A failure of these services by a third party could have a material impact upon our delivery of services to customers. Such a failure could lead to damages claims, loss of customers, and reputational harm, depending on the duration and severity of the failure. Third parties perform significant operational services on our behalf. These third-party vendors are subject to similar risks as us relating to cybersecurity, breakdowns or failures of their own systems or employees. One or more of our vendors may experience a cybersecurity event or operational disruption and, if any such event does occur, it may not be adequately addressed, either operationally or financially, by the third-party vendor. Certain of our vendors may have limited indemnification obligations or may not have the financial capacity to satisfy their indemnification obligations. If a critical vendor is unable to meet our needs in a timely manner or if the services or products provided by such a vendor are terminated or otherwise delayed and if we are not able to develop alternative sources for these services and products quickly and cost-effectively, it could have a material adverse effect on our business.
The software and services we provide to our customers are subject to government regulation that could hinder the development of our business, increase costs, or impose constraints on the way we conduct our operations.
The financial services industry is subject to extensive and complex federal and state regulation. As a supplier of software and services to financial institutions, portions of our operations are examined by the Office of the Comptroller of the Currency, the Federal Reserve Board, the Federal Deposit Insurance Corporation, and the National Credit Union Association, among other regulatory agencies. These agencies regulate services we provide and the manner in which we operate, and we are required to comply with a broad range of applicable laws and regulations.
In addition, existing laws, regulations, and policies could be amended or interpreted differently by regulators in a manner that imposes additional costs and has a negative impact on our existing operations or that limits our future growth or expansion. New regulations could require additional programming or other costly changes in our processes or personnel. Our customers are also regulated entities, and actions by regulatory authorities could determine both the decisions they make concerning the purchase of data processing and other services and the timing and implementation of these decisions. Substantial research and development and other corporate resources have been and will continue to be applied to adapt our products to this evolving, complex and often unpredictable regulatory environment. Our failure to provide compliant solutions could result in significant fines or consumer liability on our customers, for which we may bear ultimate liability.
Compliance with new and existing privacy laws, regulations, and rules may adversely impact our expenses, development, and strategy.
Concerns are growing with respect to the use, confidentiality, and security of private customer information. Regulatory agencies, Congress and state legislatures are considering numerous regulatory and statutory proposals to protect the interests of consumers and to require compliance with standards and policies that have not been defined. This includes rules enacted by the New York Department of Financial Services that require covered financial institutions to have a cybersecurity program along with other compliance requirements. The unique data protection regulations issued by multiple agencies has created a fragmented series of requirements that makes it increasingly complex to comply with all of the mandates in an efficient manner and may increase costs to deliver affected products and services as those requirements are established.
Our business may be adversely impacted by U.S. and global market and economic conditions.
We derive most of our revenue from products and services we provide to the financial services industry. If the economic environment worsens, we could face a reduction in demand from current and potential clients for our products and services, which could have a material adverse effect on our business, results of operations and financial condition. In addition, a growing portion of our revenue is derived from transaction processing fees, which depend heavily on levels of consumer and business spending. Deterioration in general economic conditions could reduce transaction volumes and our related revenues.
14
Changes in the banking and credit union industry could reduce demand for our products
. Cyclical fluctuations in economic conditions affect profitability and revenue growth at commercial banks and credit unions. Because our business is concentrated in financial institutions, unfavorable economic conditions negatively affect the spending of banks and credit unions, including spending on computer software and hardware. Such conditions could reduce both our sales to new customers and upgrade/complementary product sales to existing customers. We could also experience the loss of customers due to their acquisition or financial failure.
Competition or general economic conditions may result in decreased demand or require price reductions or other concessions to customers which could result in lower margins and reduce income.
We vigorously compete with a variety of software vendors and service providers in all of our major product lines. We compete on the basis of product quality, reliability, performance, ease of use, quality of support and services, integration with other products and pricing. Some of our competitors may have advantages over us due to their size, product lines, greater marketing resources, or exclusive intellectual property rights. New competitors regularly appear with new products, services and technology for financial institutions. If competitors offer more favorable pricing, payment or other contractual terms, warranties, or functionality, or if general economic conditions decline such that customers are less willing or able to pay the cost of our products and services, we may need to lower prices or offer favorable terms in order to successfully compete.
Our failure to comply with regulations or to meet regulatory expectations could adversely affect our business and results of operations.
While much of our operations are not directly subject to regulations applicable to financial institutions, as a provider of processing services to such institutions, we are examined on a regular basis by various regulatory authorities. If we fail to comply with applicable regulations or guidelines, we could be subject to regulatory actions or rating changes and suffer harm to our customer relationships and reputation. Such failures could require significant expenditures to correct and could negatively affect our ability to retain customers and obtain new customers.
A material weakness in our internal controls could have a material adverse effect on us.
Effective internal controls are necessary for us to provide reasonable assurance with respect to our financial reports and to mitigate risk of fraud. If material weaknesses in our internal control are discovered or occur in the future, our consolidated financial statements may contain material misstatements and we could be required to restate our financial results, which could materially and adversely affect our business and results of operations or financial condition, restrict our ability to access the capital markets, require us to expend significant resources to correct the weaknesses or deficiencies, subject us to fines, penalties or judgments, harm our reputation or otherwise cause a decline in investor confidence.
Failure to achieve favorable renewals of service contracts could negatively affect our outsourcing business.
Our contracts with our customers for outsourced data processing and electronic payment transaction processing services generally run for a period of five or more years. We will continue to experience greater numbers of these contracts coming up for renewal each year. Renewal time presents our customers with the opportunity to consider other providers or to renegotiate their contracts with us. If we are not successful in achieving high renewal rates upon favorable terms, our outsourcing revenues and profit margins will suffer.
The loss of key employees could adversely affect our business.
We depend on the contributions and abilities of our senior management and other key employees. Our Company has grown significantly in recent years and our management remains concentrated in a small number of highly qualified individuals. If we lose one or more of our key employees, we could suffer a loss of managerial experience, and management resources would have to be diverted from other activities to compensate for this loss. We do not have employment agreements with any of our executive officers.
Our failure to comply with the rules of the payment card networks or changes made by the networks could adversely affect our business.
We are subject to card association and network rules governing Visa, MasterCard, Zelle, The Clearing House’s RTP network, and all rules governing the Payment Card Data Security Standards. If we fail to comply with these rules we could be fined or our certifications could be suspended or terminated, which could limit our ability to service our customers and result in reductions in revenues and increased costs of operations. Changes made by the networks, even if complied with, may result in reduction in revenues and increased cost of operations.
If we fail to adapt our products and services to changes in technology and the markets we serve, we could lose existing customers and be unable to attract new business.
The markets for our software and hardware products and services are characterized by changing customer and regulatory requirements and rapid technological changes. These factors and new product introductions by our existing competitors or by new market entrants could reduce the demand for our existing products and services and we may be required to develop or acquire new products and services. Our future success is dependent on our ability to enhance our existing products and services in a timely manner and to develop or acquire new products and services. If we are unable to develop or acquire new products and services as planned, or if we fail to sell our new or enhanced products and services, we may incur unanticipated expenses or fail to achieve anticipated revenues, as well as lose prospective sales.
15
Our growth may be affected if we are unable to find or complete suitable acquisitions.
We have augmented the growth of our business with a number of acquisitions and we plan to continue to acquire appropriate businesses, products and services. This strategy depends on our ability to identify, negotiate and finance suitable acquisitions. Merger and acquisition activity in our industry has affected the availability and pricing of such acquisitions. If we are unable to acquire suitable acquisition candidates, we may experience slower growth.
If others claim that we have infringed their intellectual property rights, we could be liable for significant damages or could be required to change our processes.
We have agreed to indemnify many of our customers against claims that our products and services infringe on the proprietary rights of others. Infringement claims have been and will in the future be asserted with regard to our software solutions and services. Such claims, whether with or without merit, are time-consuming, may result in costly litigation and may not be resolved on terms favorable to us. If our defense of such claims is not successful, we could be forced to pay damages or could be subject to injunctions that would cause us to cease making or selling certain applications or force us to redesign applications.
Consolidation and failures of financial institutions will continue to reduce the number of our customers and potential customers.
Our primary market consists of
approximately
5,363
commercial and savings banks and
more than
5,480
credit unions. The number of commercial banks and credit unions has decreased because of failures and mergers and acquisitions and is expected to continue to decrease as more consolidation occurs.
Acquisitions may be costly and difficult to integrate.
We may not be able to successfully integrate acquired companies. We may encounter problems with the integration of new businesses including: financial control and computer system compatibility; unanticipated costs and liabilities; unanticipated quality or customer problems with acquired products or services; differing regulatory and industry standards; diversion of management's attention; adverse effects on existing business relationships with suppliers and customers; loss of key employees; and significant depreciation and amortization expenses related to acquired assets. To finance future acquisitions, we may have to increase our borrowing or sell equity or debt securities to the public. If we fail to integrate our acquisitions, our business, financial condition and results of operations could be materially and adversely affected. Failed acquisitions could also produce material and unpredictable impairment charges as we review our acquired assets.
Expansion of services to non-traditional customers could expose us to new risks.
We have expanded our services to business lines that are marketed outside our traditional, regulated, and litigation-averse base of financial institution customers. These non-regulated customers may entail greater operational, credit and litigation risks than we have faced before and could result in increases in bad debts and litigation costs.
The impairment of a significant portion of our goodwill and intangible assets would adversely affect our results of operations.
Our balance sheet includes goodwill and intangible assets that represent a significant portion of our total assets at
June 30, 2019
. On an annual basis, and whenever circumstances require, we review our intangible assets for impairment. If the carrying value of a material asset is determined to be impaired, it will be written down to fair value by a charge to operating earnings. An impairment of a significant portion of these intangible assets could have a material negative effect on our operating results.
ITEM 1B. UNRESOLVED STAFF COMMENTS
None.
ITEM 2. PROPERTIES
We own
154
acres located in Monett, Missouri on which we maintain
eight
office buildings, plus shipping & receiving, security, and maintenance buildings. We also own buildings in Houston, Texas; Allen, Texas; Albuquerque, New Mexico; Birmingham, Alabama; Lenexa, Kansas; Angola, Indiana; Shawnee Mission, Kansas; Rogers, Arkansas; Oklahoma City, Oklahoma; Elizabethtown, Kentucky; Springfield, Missouri and San Diego, California. Our owned facilities represent approximately
1,000,000
square feet of office space in
ten
states. We have
39
leased office facilities in
23
states, which total approximately
722,275
square feet. All of our owned and leased office facilities are for normal business purposes.
We own
five
aircraft. Many of our customers are located in communities that do not have an easily accessible commercial airline service. We primarily use our airplanes in connection with implementation, sales of systems and internal requirements for day-to-day operations. Transportation costs for implementation and other customer services are billed to our customers. We lease property, including real estate and related facilities, at the Monett, Missouri regional airport.
16
ITEM 3. LEGAL PROCEEDINGS
We are subject to various routine legal proceedings and claims arising in the ordinary course of our business. In the opinion of management, any liabilities resulting from current lawsuits are not expected, either individually or in the aggregate, to have a material adverse effect on our consolidated financial statements. In accordance with U.S. generally accepted accounting principles ("U.S. GAAP"), we record a liability when it is both probable that a liability has been incurred and the amount of the loss can be reasonably estimated. These liabilities are reviewed at least quarterly and adjusted to reflect the impacts of negotiations, settlements, rulings, advice of legal counsel, and other information and events pertaining to a particular case or proceeding.
ITEM 4. MINE SAFETY DISCLOSURES
None.
17
PART II
ITEM 5. MARKET FOR REGISTRANT'S COMMON EQUITY, RELATED STOCKHOLDER MATTERS AND ISSUER PURCHASES OF EQUITY SECURITIES
The Company's common stock is quoted on the NASDAQ Global Select Market (“NASDAQ”) under the symbol “JKHY”.
The Company established a practice of paying quarterly dividends at the end of fiscal 1990 and has paid dividends with respect to every quarter since that time. The declaration and payment of any future dividends will continue to be at the discretion of our Board of Directors and will depend upon, among other factors, our earnings, capital requirements, contractual restrictions, and operating and financial condition. The Company does not currently foresee any changes in its dividend practices.
On
August 15, 2019
, there were approximately
145,300
holders of the Company’s common stock, including individual participants in security position listings. On that same date the last sale price of the common shares as reported on NASDAQ was
$141.94
per share.
Issuer Purchases of Equity Securities
The following shares of the Company were repurchased during the quarter ended
June 30, 2019
:
|
Total Number of Shares Purchased
(1)
|
Average Price of Share
|
Total Number of Shares Purchased as Part of Publicly Announced Plans
(1)
|
Maximum Number of Shares that May Yet Be Purchased Under the Plans
(2)
|
|||||||||
|
April 1- April 30, 2019
|
—
|
|
$
|
—
|
|
—
|
|
3,732,713
|
|
|||
|
May 1- May 31, 2019
|
250,000
|
|
$
|
134.35
|
|
250,000
|
|
3,482,713
|
|
|||
|
June 1- June 30, 2019
|
—
|
|
$
|
—
|
|
—
|
|
3,482,713
|
|
|||
|
Total
|
250,000
|
|
$
|
134.35
|
|
250,000
|
|
3,482,713
|
|
|||
(1)
250,000
shares were purchased through a publicly announced repurchase plan. There were
no
shares surrendered to the Company to satisfy tax withholding obligations in connection with employee restricted stock awards.
(2)
Total stock repurchase authorizations approved by the Company's Board of Directors as of
February 17, 2015
were for
30.0 million
shares. These authorizations have no specific dollar or share price targets and no expiration dates.
18
Performance Graph
The following chart presents a comparison for the five-year period ended
June 30, 2019
, of the market performance of the Company’s common stock with the S&P 500 Index and an index of peer companies selected by the Company. Historic stock price performance is not necessarily indicative of future stock price performance.
COMPARISON OF 5 YEAR CUMULATIVE TOTAL RETURN
Among Jack Henry & Associates, Inc., the S&P 500 Index, and a Peer Group
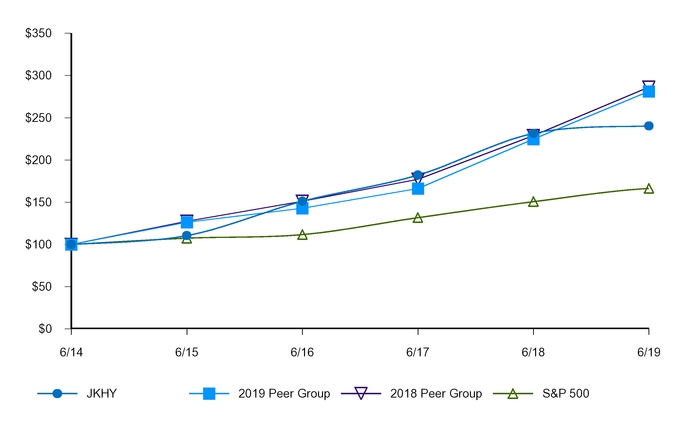
The following information depicts a line graph with the following values:
|
2014
|
|
2015
|
|
2016
|
|
2017
|
|
2018
|
|
2019
|
|
|
|
JKHY
|
100.00
|
|
110.51
|
|
151.12
|
|
182.15
|
|
231.36
|
|
240.29
|
|
|
2019 Peer Group
|
100.00
|
|
126.23
|
|
142.94
|
|
166.15
|
|
224.73
|
|
281.09
|
|
|
2018 Peer Group
|
100.00
|
|
127.40
|
|
151.16
|
|
177.26
|
|
228.97
|
|
286.22
|
|
|
S&P 500
|
100.00
|
|
107.42
|
|
111.71
|
|
131.70
|
|
150.64
|
|
166.33
|
|
This comparison assumes $100 was invested on
June 30, 2014
, and assumes reinvestments of dividends. Total returns are calculated according to market capitalization of peer group members at the beginning of each period. Peer companies selected are in the business of providing specialized computer software, hardware and related services to financial institutions and other businesses.
Some peer participant companies were different for fiscal year ended
2019
compared to fiscal year ended
2018
. The Company's Compensation Committee of the Board of Directors adjusted the peer participants due to consolidations within the industry during the 2019 fiscal year.
Companies in the 2019 peer group are ACI Worldwide, Inc.; Black Knight, Inc.; Bottomline Technologies, Inc.; Broadridge Financial Solutions, Inc.; Cardtronics plc; CoreLogic, Inc.; Euronet Worldwide, Inc.; ExlService Holdings, Inc.; Fair Isaac Corp.; Fidelity National Information Services, Inc.; Fiserv, Inc.; Fleetcor Technologies, Inc.; Global Payments, Inc.; Square, Inc.; SS&C Technologies Holdings, Inc.; Total System Services, Inc.; Tyler Technologies, Inc.; Verint Systems, Inc.; and WEX, Inc.
19
Companies in the 2018 peer group were ACI Worldwide, Inc.; Bottomline Technology, Inc.; Broadridge Financial Solutions; Cardtronics, Inc.; Corelogic, Inc.; Euronet Worldwide, Inc.; Fair Isaac Corp.; Fidelity National Information Services, Inc.; Fiserv, Inc.; Global Payments, Inc.; Moneygram International, Inc.; SS&C Technologies Holdings, Inc.; Total Systems Services, Inc.; Tyler Technologies, Inc.; Verifone Systems, Inc.; and WEX, Inc. DST Systems, Inc., which had previously been part of the 2018 peer group, was acquired in 2018 and is no longer a public company. As a result, DST Systems, Inc. was removed from the 2018 peer group and stock performance graph.
The stock performance graph shall not be deemed “filed” for purposes of Section 18 of the Exchange Act, or incorporated by reference into any filing of the Company under the Securities Act of 1933, as amended, or the Exchange Act, except as shall be expressly set forth by specific reference in such filing.
ITEM 6. SELECTED FINANCIAL DATA
The following data should be read in conjunction with the consolidated financial statements and accompanying notes included elsewhere in the Annual Report on Form 10-K. Fiscal
2018
and
2017
have been recast to reflect the Company's retrospective adoption of Accounting Standards Update ("ASU") 2014-09,
Revenue from Contracts with Customers,
and related amendments, collectively referred to as Accounting Standards Codification ("ASC") 606. Fiscal
2016
and
2015
were not recast. Net income for fiscal
2018
and
2019
has been impacted by the reduced U.S. corporate tax rate enacted by the Tax Cuts and Jobs Act ("TCJA") of 2017, and fiscal
2018
net income contains the related adjustment for the re-measurement of deferred taxes. Acquisitions have affected revenue and net income in fiscal
2019
as well as the historical periods presented.
|
Selected Financial Data
|
||||||||||||||||||||
|
(In Thousands, Except Per Share Data)
|
||||||||||||||||||||
|
|
YEAR ENDED JUNE 30,
|
|||||||||||||||||||
|
Income Statement Data
|
2019
|
2018
|
2017
|
2016
|
2015
|
|||||||||||||||
|
*Unadjusted
|
*Unadjusted
|
|||||||||||||||||||
|
Revenue
(1)
|
$
|
1,552,691
|
|
$
|
1,470,797
|
|
$
|
1,388,290
|
|
$
|
1,354,646
|
|
$
|
1,256,190
|
|
|||||
|
Net Income
|
$
|
271,885
|
|
$
|
365,034
|
|
$
|
229,561
|
|
$
|
248,867
|
|
$
|
211,221
|
|
|||||
|
Basic earnings per share
|
$
|
3.52
|
|
$
|
4.73
|
|
$
|
2.95
|
|
$
|
3.13
|
|
$
|
2.60
|
|
|||||
|
Diluted earnings per share
|
$
|
3.52
|
|
$
|
4.70
|
|
$
|
2.93
|
|
$
|
3.12
|
|
$
|
2.59
|
|
|||||
|
Dividends declared per share
|
$
|
1.54
|
|
$
|
1.36
|
|
$
|
1.18
|
|
$
|
1.06
|
|
$
|
0.94
|
|
|||||
|
Balance Sheet Data
|
|
|
|
|
|
|||||||||||||||
|
Total deferred revenue
|
$
|
394,306
|
|
$
|
369,915
|
|
$
|
368,151
|
|
$
|
521,054
|
|
$
|
531,987
|
|
|||||
|
Total assets
|
$
|
2,184,829
|
|
$
|
2,033,058
|
|
$
|
1,868,199
|
|
$
|
1,815,512
|
|
$
|
1,836,835
|
|
|||||
|
Long-term debt
|
$
|
—
|
|
$
|
—
|
|
$
|
50,000
|
|
$
|
—
|
|
$
|
50,102
|
|
|||||
|
Stockholders’ equity
|
$
|
1,429,013
|
|
$
|
1,322,844
|
|
$
|
1,099,693
|
|
$
|
996,210
|
|
$
|
991,534
|
|
|||||
(1)
Revenue includes license sales, support and service revenues, and hardware sales, less returns and allowances.
ITEM 7. MANAGEMENT’S DISCUSSION AND ANALYSIS OF FINANCIAL CONDITION AND RESULTS OF OPERATIONS
The following section provides management's view of the Company's financial condition and results of operations and should be read in conjunction with the Selected Financial Data, the audited Consolidated Financial Statements, and related notes included elsewhere in this report. All dollar and share amounts, except per share amounts, are in thousands and discussions compare fiscal
2019
to fiscal
2018
and compare fiscal
2018
to fiscal
2017
.
OVERVIEW
Jack Henry & Associates, Inc. (JHA) is headquartered in Monett, Missouri, employs approximately
6,500
associates nationwide, and is a leading provider of technology solutions and payment processing services primarily for financial services organizations. Its solutions serve
over
9,000
customers and are marketed and supported through three primary brands. Jack Henry Banking® is a top provider of information and transaction processing solutions to U.S. banks ranging from community banks to multi-billion-dollar asset institutions with assets up to
$50 billion
. Symitar® is a leading provider of information and transaction processing solutions for credit unions of all sizes. ProfitStars® provides
20
highly specialized products and services that enable financial institutions of every asset size and charter, and diverse corporate entities outside the financial services industry, to mitigate and control risks, optimize revenue and growth opportunities, and contain costs. JHA's integrated solutions are available for in-house installation and outsourced delivery in our private cloud.
Each of our brands share the fundamental commitment to provide high-quality business solutions, service levels that consistently exceed customer expectations, integration of solutions and practical new technologies. The quality of our solutions, our high service standards, and the fundamental way we do business typically foster long-term customer relationships, attract prospective customers, and have enabled us to capture substantial market share.
Through internal product development, disciplined acquisitions, and alliances with companies offering niche solutions that complement our proprietary solutions, we regularly introduce new products and services and generate new cross-sales opportunities across our three primary marketed brands. We provide compatible computer hardware for our in-house installations and secure processing environments for our outsourced solutions in our private cloud. We perform data conversions, software implementations, initial and ongoing customer training, and ongoing customer support services.
We believe our primary competitive advantage is customer service. Our support infrastructure and strict standards provide service levels we believe to be the highest in the markets we serve and generate high levels of customer satisfaction and retention. We consistently measure customer satisfaction using comprehensive annual surveys and randomly generated daily surveys we receive in our everyday business. Dedicated surveys are also used to grade specific aspects of our customer experience, including product implementation, education, and consulting services.
Our two primary revenue streams are "Services and support" and "Processing". Services and support includes: "Outsourcing and cloud" fees that predominantly have contract terms of five years or longer at inception; "Product delivery and services" revenue, which includes revenue from the sales of licenses, implementation services, deconversion fees, consulting, and hardware; and "In-house support" revenue, which is composed of maintenance fees which primarily contain annual contract terms. Processing revenue includes: "Remittance" revenue from payment processing, remote capture, and automated clearing house (ACH) transactions; "Card" fees, including card transaction processing and monthly fees; and "Transaction and digital" revenue, which includes transaction and mobile processing fees. We continually seek opportunities to increase revenue while at the same time containing costs to expand margins.
We have four reportable segments: Core, Payments, Complementary, and Corporate and Other. The respective segments include all related revenues along with the related cost of sales.
We continue to focus on our objective of providing the best integrated solutions, products and customer service to our clients. We are cautiously optimistic regarding ongoing economic improvement and expect our clients to continue investing in our products and services to improve their operating efficiencies and performance. We anticipate that consolidation within the financial services industry will continue. Regulatory conditions and legislation will continue to impact financial institutions' discretionary spending.
A detailed discussion of the major components of the results of operations follows.
RESULTS OF OPERATIONS
FISCAL
2019
COMPARED TO FISCAL
2018
In fiscal
2019
, revenues increased
6%
or
$81,894
compared to fiscal
2018
. Deconversion fees decreased
$15,941
compared to the prior fiscal year. Revenue from fiscal
2019
acquisitions totaled
$1,052
. Excluding these factors, total revenue increased
7%
, with growth in each of our revenue streams as discussed in detail below.
Operating expenses increased
8%
year over year, primarily due to increased salaries and benefits in fiscal
2019
, partly due to increased headcount compared to fiscal
2018
, costs related to our new card payment processing platform, bonuses provided by the Company in response to the lower tax rate resulting from the TCJA, the Ensenta acquisition, increased rent expense related to new facilities, and increased amortization expense.
The TCJA had a large impact on our fiscal
2018
provision/ (benefit) for income taxes and net income, which impacted year-over-year comparison as discussed below.
We move into fiscal
2020
following a strong performance in fiscal
2019
. Significant portions of our business continue to provide recurring revenue and our healthy sales pipeline is also encouraging. Our customers continue to face regulatory and operational challenges which our products and services address, and in these times, they have an even greater need for our solutions that directly address institutional profitability, efficiency, and security. We believe our strong balance sheet, access to extensive lines of credit, the strength of our existing product line and an unwavering commitment to superior customer service position us well to address current and future opportunities.
21
A detailed discussion of the major components of the results of operations for the
fiscal year ended
June 30, 2019
follows. Fiscal years
2018
and
2017
have been recast to reflect our retrospective adoption of Accounting Standards Update ("ASU") 2014-09,
Revenue from Contracts with Customers,
and related amendments, collectively referred to as Accounting Standards Codification ("ASC") 606.
REVENUE
|
Services and Support Revenue
|
Year Ended June 30,
|
%
Change
|
||||||||
|
|
2019
|
2018
|
||||||||
|
Services and Support
|
$
|
958,489
|
|
$
|
920,739
|
|
4
|
%
|
||
|
Percentage of total revenue
|
62
|
%
|
63
|
%
|
|
|
||||
Services and support includes: "Outsourcing and cloud" fees that predominantly have contract terms of five years or greater at inception; "Product delivery & services" revenue, which includes revenue from the sales of licenses, implementation services, deconversion fees, consulting, and hardware; and "In-house support" revenue, which is composed of maintenance fees which primarily contain annual contract terms.
In the
fiscal year ended
June 30, 2019
, services and support revenue grew
4%
over the prior fiscal year. Excluding deconversion fees, which totaled
$30,230
in fiscal
2019
and
$46,171
in fiscal
2018
, and excluding revenue from fiscal
2019
acquisitions totaling
$944
, services and support revenue grew
6%
. The increase was primarily driven by an increase in outsourcing and cloud revenue resulting from organic growth in hosting and data processing fees complemented by added revenue from Ensenta. In-house support revenue also contributed to the increase, primarily from higher software usage revenue resulting partially from the addition of new customers. These increases were partially offset by decreased product delivery and services revenue due to reduced license and in-house implementation revenue as more customers opted for outsourced delivery.
|
Processing Revenue
|
Year Ended June 30,
|
%
Change
|
||||||||
|
|
2019
|
2018
|
|
|||||||
|
Processing
|
$
|
594,202
|
|
$
|
550,058
|
|
8
|
%
|
||
|
Percentage of total revenue
|
38
|
%
|
37
|
%
|
|
|||||
Processing revenue includes: "Remittance" revenue from payment processing, remote capture, and automated clearing house (ACH) transactions; "Card" fees, including card transaction processing and monthly fees; and "Transaction and digital" revenue, which includes transaction and mobile processing fees. We continually seek opportunities to increase revenue while at the same time containing costs to expand margins.
Processing revenue increased
8%
for the
fiscal year ended
June 30, 2019
as compared to the
fiscal year ended
June 30, 2018
, with strong organic growth in each component, complemented by added remittance revenue from Ensenta.
OPERATING EXPENSES
|
Cost of Revenue
|
Year Ended June 30,
|
%
Change |
||||||||
|
|
2019
|
2018
|
|
|||||||
|
Cost of Revenue
|
$
|
923,030
|
|
$
|
853,138
|
|
8
|
%
|
||
|
Percentage of total revenue
|
59
|
%
|
58
|
%
|
|
|||||
Cost of Revenue increased
8%
compared to fiscal
2018
, and increased
1%
as a percentage of total revenue. Excluding costs related to deconversions, fiscal 2019 acquisitions, and bonuses provided by the Company in response to the lower tax rate resulting from the TCJA, cost of revenue increased
7%
. The increase was driven by increased salaries and benefits; higher direct costs of product, including spending related to the ongoing project to expand our credit and debit card platform; increased amortization expense; and higher rent expense related to new facilities. The Company continues to focus on cost management.
22
|
Research & Development
|
Year Ended June 30,
|
%
Change |
||||||||
|
|
2019
|
2018
|
|
|||||||
|
Research & Development
|
$
|
96,378
|
|
$
|
90,340
|
|
7
|
%
|
||
|
Percentage of total revenue
|
6
|
%
|
6
|
%
|
|
|||||
We devote significant effort and expense to develop new software, service products and continually upgrade and enhance our existing offerings. We believe our research and development efforts are highly efficient because of the extensive experience of our research and development staff and because our product development is highly customer-driven.
Research and development expenses increased
7%
primarily due to increased salary and benefit expenses, in part due to a
3%
increase in headcount, but were consistent with the prior year as a percentage of total revenue. Excluding the bonuses provided by the Company in response to the lower tax rate following the TCJA and costs attributable to companies acquired in fiscal 2019, research and development expense increased
4%
.
|
Selling, General, and Administrative
|
Year Ended June 30,
|
%
Change |
||||||||
|
|
2019
|
2018
|
|
|||||||
|
Selling, General, and Administrative
|
$
|
185,998
|
|
$
|
171,710
|
|
8
|
%
|
||
|
Percentage of total revenue
|
12
|
%
|
12
|
%
|
|
|||||
Selling, general and administrative costs included all expenses related to sales efforts, commissions, finance, legal, and human resources, plus all administrative costs. Excluding bonuses provided by the Company in response to the lower tax rate resulting from the TCJA, selling, general, and administrative expense increased
6%
. These expenses increased primarily due to increased commissions, salaries, and benefits.
Gains on Disposal of Businesses
No businesses were disposed during fiscal
2019
. In fiscal
2018
, we recognized gains on the disposal of businesses totaling
$1,894
due to the sales of our ATM Manager and jhaDirect product lines.
|
INTEREST INCOME AND EXPENSE
|
Year Ended June 30,
|
%
Change
|
||||||||
|
|
2019
|
2018
|
|
|||||||
|
Interest Income
|
$
|
876
|
|
$
|
575
|
|
52
|
%
|
||
|
Interest Expense
|
$
|
(926
|
)
|
$
|
(1,920
|
)
|
(52
|
)%
|
||
Interest income fluctuated due to changes in invested balances and yields on invested balances. Interest expense decreased in fiscal
2019
due mainly to lower amounts borrowed on our revolving credit facility during the year.
|
PROVISION/ (BENEFIT) FOR INCOME TAXES
|
Year Ended June 30,
|
%
Change |
||||||||
|
|
2019
|
2018
|
||||||||
|
Provision/ (Benefit) for Income Taxes
|
$
|
75,350
|
|
$
|
(8,876
|
)
|
949
|
%
|
||
|
Effective Rate
|
21.7
|
%
|
(2.5
|
)%
|
||||||
The increase in the effective tax rate was primarily the result of the significant tax benefit recognized in the prior fiscal year as a result of the re-measurement of net deferred tax liabilities upon enactment of the TCJA on December 22, 2017. That increase in the provision/ (benefit) for income taxes is partially offset by the reduced U.S. federal corporate tax rate of
21%
effective for the current year, and increased excess tax benefits from share-based payments recognized during fiscal 2019.
Excluding the fiscal 2018 TCJA tax benefit resulting from the re-measurement of net deferred tax liabilities, provision/ (benefit) for income taxes
decrease
d
23%
.
NET INCOME
Net income decreased
26%
to
$271,885
, or
$3.52
per diluted share, in fiscal
2019
from
$365,034
, or
$4.70
per diluted share, in fiscal
2018
. The significant decrease is primarily attributable to the TCJA impacts on the prior year provision/ (benefit) for income taxes, as well as decreased deconversion revenue in fiscal
2019
.
23
FISCAL
2018
COMPARED TO FISCAL
2017
In fiscal
2018
, revenues increased
6%
or
$82,507
compared to fiscal
2017
. Deconversion fees increased
$7,343
compared to the prior fiscal year. Revenue from fiscal
2018
acquisitions totaled
$17,368
. Fiscal
2017
included
$10,897
of revenue from divested companies. Excluding these factors, total revenue increased
5%
, with growth in each of our revenue streams as discussed in detail below.
Operating expenses increased
6%
, due to increased headcount driving increased salaries and benefits, costs related to fiscal
2018
acquisitions, and professional services expenses incurred due to contracting with outside experts in preparation for our adoption of the new Accounting Standards Codification ("ASC") Topic 606 revenue standard. Excluding costs related to deconversion fees from each year, expenses related to fiscal 2018 acquisitions, fiscal 2017 costs related to divestitures, and gains on the disposal of businesses from each year, operating expenses increased
5%
.
The TCJA had a large impact on our provision/ (benefit) for income taxes and net income, which are discussed below.
REVENUE
|
Services and Support
|
Year Ended June 30,
|
%
Change
|
||||||||
|
|
2018
|
2017
|
|
|||||||
|
Services and Support
|
$
|
920,739
|
|
$
|
881,735
|
|
4
|
%
|
||
|
Percentage of total revenue
|
63
|
%
|
64
|
%
|
|
|||||
Services and support revenue grew
4%
in fiscal
2018
. Excluding deconversion fees, revenue from fiscal
2018
acquisitions totaling
$9,074
, and fiscal
2017
revenue related to divestitures of
$10,745
, services and support revenue grew
4%
. The growth was due mainly to increased outsourcing and cloud revenue, as well as growth within our in-house support revenue component due to higher software usage revenue.
|
Processing
|
Year Ended June 30,
|
%
Change
|
||||||||
|
|
2018
|
2017
|
|
|||||||
|
Processing
|
$
|
550,058
|
|
$
|
506,555
|
|
9
|
%
|
||
|
Percentage of total revenue
|
37
|
%
|
36
|
%
|
|
|||||
Processing revenue increased
9%
in fiscal
2018
, with strong growth in each of its three components. Ensenta contributed to the growth with added remittance revenue. Excluding
$8,294
of revenue from fiscal
2018
acquisitions, and excluding fiscal
2017
revenue related to divestitures totaling
$152
, processing revenue increased
7%
for the year with significant increases in each of its three components.
OPERATING EXPENSES
|
Cost of Revenue
|
Year Ended June 30,
|
%
Change
|
||||||||
|
|
2018
|
2017
|
|
|||||||
|
Cost of Revenue
|
$
|
853,138
|
|
$
|
805,855
|
|
6
|
%
|
||
|
Percentage of total revenue
|
58
|
%
|
58
|
%
|
|
|||||
Cost of revenue for fiscal
2018
increased
6%
compared to fiscal
2017
, in line with the revenue increase, and remained a consistent percentage of total revenue in each year.
|
Research and Development
|
Year Ended June 30,
|
%
Change
|
||||||||
|
|
2018
|
2017
|
|
|||||||
|
Research and Development
|
$
|
90,340
|
|
$
|
84,753
|
|
7
|
%
|
||
|
Percentage of total revenue
|
6
|
%
|
6
|
%
|
|
|||||
Research and development expenses increased primarily due to a 4% increase in headcount, but were consistent
with the prior year as a percentage of total revenue.
24
|
Selling, General, and Administrative
|
Year Ended June 30,
|
%
Change
|
||||||||
|
|
2018
|
2017
|
|
|||||||
|
Selling, General, and Administrative
|
$
|
171,710
|
|
$
|
159,235
|
|
8
|
%
|
||
|
Percentage of total revenue
|
12
|
%
|
11
|
%
|
|
|||||
Selling, general, and administrative expenses increased in fiscal
2018
primarily due to increased commissions, salaries, and benefits, and higher professional services expenses incurred due to contracting with outside experts in preparation for our adoption of the ASC 606 revenue standard.
Gain on Disposal of Businesses
In fiscal
2018
, we recognized gains on disposal of businesses totaling
$1,894
, due to the sales of our ATM Manager and jhaDirect product lines.
In fiscal
2017
, we recognized gains on the disposal of businesses totaling
$3,270
. $2,136 was related to the fiscal 2016 sale of Alogent, and $1,134 related to the sale of our Regulatory Filing products to Fed Reporter on May 1, 2017.
|
INTEREST INCOME AND EXPENSE
|
Year Ended June 30,
|
%
Change
|
||||||||
|
|
2018
|
2017
|
|
|||||||
|
Interest Income
|
$
|
575
|
|
$
|
248
|
|
132
|
%
|
||
|
Interest Expense
|
$
|
(1,920
|
)
|
$
|
(996
|
)
|
93
|
%
|
||
Interest income fluctuated due to changes in invested balances and yields on invested balances. Interest expense increased in fiscal 2018 due mainly to increased borrowing, which was primarily used for the acquisition of Ensenta Corporation, and has now been re-paid.
|
PROVISION/ (BENEFIT) FOR INCOME TAXES
|
Year Ended June 30,
|
%
Change |
||||||||
|
|
2018
|
2017
|
||||||||
|
Provision/ (Benefit) for Income Taxes
|
$
|
(8,876
|
)
|
$
|
111,408
|
|
(108
|
)%
|
||
|
Effective Rate
|
(2.5
|
)%
|
32.7
|
%
|
||||||
The significant decrease in the effective tax rate was primarily a result of the TCJA enacted December 22, 2017, which included a reduction to the U.S. federal statutory income tax rate to 21% effective January 1, 2018. A blended 28% U.S federal statutory income tax rate was applied to fiscal 2018. We recorded a net tax benefit of
$106,801
related to the re-measurement of our net deferred tax liabilities and
$21,551
related to the impacts on current year operations.
NET INCOME
Net income increased
59%
to
$365,034
, or
$4.70
per diluted share, in fiscal
2018
from
$229,561
, or
$2.93
per diluted share, in fiscal
2017
. The significant increase is primarily attributable to the TCJA.
REPORTABLE SEGMENT DISCUSSION
The Company is a leading provider of technology solutions and payment processing services primarily for financial services organizations.
Beginning in the first quarter of fiscal 2018, JHA changed its reportable segment structure from two customer-centric segments, Bank and Credit Union, to four product-centric segments. The change was made based on the view of our Chief Executive Officer, who is also our Chief Operating Decision Maker, that the Company could be more effectively managed using a product-centric approach and was driven by the first budgetary process under his administration.
The Company’s operations are classified into four reportable segments: Core, Payments, Complementary, and Corporate and Other. The Core segment provides core information processing platforms to banks and credit unions, which consist of integrated applications required to process deposit, loan, and general ledger transactions, and maintain centralized customer/member information. The Payments segment provides secure payment processing tools and services, including ATM, debit, and credit card processing services; online and mobile bill pay solutions; ACH origination and remote deposit capture processing; and risk management products and services. The Complementary segment
25
provides additional software, processing platforms, and services that can be integrated with our core solutions or used independently. The Corporate & Other segment includes revenue and costs from hardware and other products not attributed to any of the other three segments, as well as operating costs not directly attributable to the other three segments.
The fiscal
2017
period presented below has been retroactively recast to conform to the new segment structure adopted July 1, 2017. Both prior year periods presented have also been recast to reflect the Company's retrospective adoption of ASC 606.
|
Core
|
|||||||||||||||||
|
|
2019
|
% Change
|
2018
|
% Change
|
2017
|
||||||||||||
|
Revenue
|
$
|
534,429
|
|
5
|
%
|
$
|
509,821
|
|
7
|
%
|
$
|
477,605
|
|
||||
|
Cost of Revenue
|
$
|
243,989
|
|
5
|
%
|
$
|
232,868
|
|
6
|
%
|
$
|
219,440
|
|
||||
In fiscal
2019
, revenue in the Core segment increased
5%
compared to fiscal
2018
, driven by increases in outsourcing and cloud revenue and in-house support revenue. Excluding deconversion fees, which totaled
$14,907
and
$22,161
, for fiscal
2019
and
2018
, respectively, and excluding revenue of
$923
from fiscal
2019
acquisitions, revenue in the Core segment increased
6%
, due to increased outsourcing and cloud and in-house support revenue. Cost of revenue remained a consistent percentage of revenue for fiscal
2019
and fiscal
2018
.
In fiscal
2018
, revenue in the Core segment increased
7%
, primarily due to increased revenue within each component of our services and support revenue stream. Cost of revenue increased
6%
for fiscal
2018
compared to fiscal
2017
, but remained consistent as a percentage of revenue.
|
Payments
|
|||||||||||||||||
|
|
2019
|
% Change
|
2018
|
% Change
|
2017
|
||||||||||||
|
Revenue
|
$
|
548,319
|
|
8
|
%
|
$
|
508,331
|
|
8
|
%
|
$
|
471,988
|
|
||||
|
Cost of Revenue
|
$
|
273,261
|
|
11
|
%
|
$
|
245,269
|
|
10
|
%
|
$
|
222,685
|
|
||||
In fiscal
2019
, revenue in the Payments segment increased
8%
compared to fiscal
2018
. Excluding deconversion revenue of
$8,603
and
$13,004
, respectively, revenue increased
9%
in the Payments segment, due to organic growth within remittance and card processing, as well as added revenue from Ensenta. Cost of revenue
increased
11%
, partially due to increased headcount and amortization expenses related to Ensenta, as well as increased spending related to the ongoing project to expand our credit and debit card platform. Cost of revenue
increased
2%
as a percentage of revenue in fiscal
2019
as compared to fiscal
2018
.
In fiscal
2018
, revenue in the Payments segment increased compared to fiscal
2017
, due primarily to increased card and remittance processing revenue. The increases were partially due to the acquisition of Ensenta. Cost of revenue increased
10%
, and increased 1% as a percentage of revenue.
|
Complementary
|
|||||||||||||||||
|
|
2019
|
% Change
|
2018
|
% Change
|
2017
|
||||||||||||
|
Revenue
|
$
|
418,215
|
|
6
|
%
|
$
|
395,419
|
|
5
|
%
|
$
|
375,811
|
|
||||
|
Cost of Revenue
|
$
|
175,737
|
|
7
|
%
|
$
|
163,905
|
|
6
|
%
|
$
|
155,084
|
|
||||
Revenue in the Complementary segment increased
6%
for the
fiscal year ended
June 30, 2019
compared to the prior year. After excluding deconversion revenue from each period, which totaled
$6,672
and
$10,855
for the fiscal years ended
June 30, 2019
and
2018
, respectively, and excluding revenue of
$126
from fiscal
2019
acquisitions, revenue increased
7%
. The increase was driven by increases in outsourcing and cloud revenue and in-house support within our services and support revenue stream, as well as transaction and digital processing revenue within our processing revenue stream. Cost of revenue
increased
7%
for the year, and
increased
1%
as a percentage of revenue.
In fiscal
2018
, revenue in the Complementary segment increased
5%
, due to higher outsourcing and cloud revenue within services and support, as well as increased transaction and digital processing revenue. Cost of revenue increased
6%
for fiscal
2018
compared to fiscal
2017
, but remained a consistent percentage of revenue.
|
Corporate and Other
|
|||||||||||||||||
|
|
2019
|
% Change
|
2018
|
% Change
|
2017
|
||||||||||||
|
Revenue
|
$
|
51,728
|
|
(10
|
)%
|
$
|
57,226
|
|
(9
|
)%
|
$
|
62,886
|
|
||||
|
Cost of Revenue
|
$
|
230,043
|
|
9
|
%
|
$
|
211,096
|
|
1
|
%
|
$
|
208,646
|
|
||||
26
The decrease in revenue in the Corporate and Other segment for the
fiscal year ended
June 30, 2019
was due to decreased services and support revenue. This is in part due to the sale of our jhaDirect product line, which was sold during the first quarter of fiscal
2018
.
The decreased revenue in fiscal
2018
compared to fiscal
2017
in the Corporate and Other segment is largely due to the loss of revenue following the sale of our jhaDirect product. Fiscal
2017
included revenue from jhaDirect totaling
$6,571
.
Cost of revenue for the Corporate and Other segment includes operating costs not directly attributable to any of the other three segments. The increased cost of revenue in fiscal
2019
is primarily related to bonuses provided by the Company in response to the lower tax rate resulting from the TCJA and increased rent and maintenance contract expenses related to new facilities.
LIQUIDITY AND CAPITAL RESOURCES
The Company's cash and cash equivalents increased to
$93,628
at
June 30, 2019
from
$31,440
at
June 30, 2018
. Cash at the end of fiscal
2018
was lower due primarily to the acquisition of Ensenta and higher repayment of debt in fiscal
2018
.
The following table summarizes net cash from operating activities in the statement of cash flows:
|
Year Ended
|
|||||||
|
June 30,
|
|||||||
|
2019
|
2018
|
||||||
|
Net income
|
$
|
271,885
|
|
$
|
365,034
|
|
|
|
Non-cash expenses
|
180,987
|
|
87,906
|
|
|||
|
Change in receivables
|
(11,777
|
)
|
21,489
|
|
|||
|
Change in deferred revenue
|
23,656
|
|
1,255
|
|
|||
|
Change in other assets and liabilities
|
(33,623
|
)
|
(63,542
|
)
|
|||
|
Net cash provided by operating activities
|
$
|
431,128
|
|
$
|
412,142
|
|
|
Cash provided by operating activities increased
5%
compared to fiscal
2018
. Cash from operations is primarily used to repay debt, pay dividends and repurchase stock, and for capital expenditures.
Cash used in investing activities for fiscal
2019
totaled
$190,635
and included:
$111,114
for the ongoing enhancements and development of existing and new product and service offerings; capital expenditures on facilities and equipment of
$53,598
, mainly for the purchase of computer equipment;
$19,981
, net of cash acquired, for the purchases of BOLTS Technologies, Inc. and Agiletics, Inc.;
$6,049
for the purchase and development of internal use software; and
$20
for customer contracts. This was partially offset by
$127
of proceeds from asset sales.
Cash used in investing activities for fiscal
2018
totaled
$291,826
and included:
$137,562
, net of cash acquired, for the purchases of Ensenta Corporation and Vanguard Software Group;
$96,647
for the development of software; capital expenditures on facilities and equipment of
$40,135
, mainly for the purchase of computer equipment;
$13,138
for the purchase and development of internal use software; and
$5,000
for the purchase of preferred stock of Automated Bookkeeping, Inc. These expenditures were partially offset by
$350
of proceeds from the sale of businesses and
$306
of proceeds from the sale of assets.
Financing activities used cash of
$178,305
for fiscal
2019
. Cash used was
$118,745
for dividends paid to stockholders;
$54,864
for the purchase of treasury shares; and
$4,696
of net cash outflow from the issuance of stock and tax related to stock-based compensation. Borrowings and re-payments on our revolving credit facility netted to $0.
Financing activities used cash in fiscal
2018
of
$203,641
. Cash used was
$175,000
for repayment on our revolving credit facility; dividends paid to stockholders of
$105,021
; and
$48,986
for the purchase of treasury shares. This was partially offset by borrowings of
$125,000
on our revolving credit facility and
$366
of net cash inflow from the issuance of stock and tax related to stock-based compensation.
Capital Requirements and Resources
The Company generally uses existing resources and funds generated from operations to meet its capital requirements. Capital expenditures totaling
$53,598
and
$40,135
for fiscal years ended
June 30, 2019
and
June 30, 2018
, respectively, were made primarily for additional equipment and the improvement of existing facilities. These additions
27
were funded from cash generated by operations. At
June 30, 2019
, the Company had an estimated
$2,673
of outstanding purchase commitments related to property and equipment.
The Board of Directors has authorized the Company to repurchase shares of its common stock. Under this authorization, the Company may finance its share repurchases with available cash reserves or short-term borrowings on its existing credit facilities. The share repurchase program does not include specific price targets or timetables and may be suspended at any time. At
June 30, 2019
, there were
26,508
shares in treasury stock and the Company had the remaining authority to repurchase up to
3,483
additional shares. The total cost of treasury shares at
June 30, 2019
is
$1,110,124
. During fiscal
2019
, the Company repurchased
400
treasury shares for
$54,864
. At
June 30, 2018
, there were
26,108
shares in treasury stock and the Company had authority to repurchase up to
3,883
additional shares.
Revolving credit facility
The revolving credit facility allows for borrowings of up to
$300,000
, which may be increased by the Company at any time until maturity to
$600,000
. The credit facility bears interest at a variable rate equal to (a) a rate based on LIBOR or (b) an alternate base rate (the highest of (i) the Prime Rate for such day, (ii) the sum of the Federal Funds Effective Rate for such day plus
0.50%
and (iii) the Eurocurrency Rate for a one-month Interest Period on such day for dollars plus
1.0%
), plus an applicable percentage in each case determined by the Company's leverage ratio. The credit facility is guaranteed by certain subsidiaries of the Company. The credit facility is subject to various financial covenants that require the Company to maintain certain financial ratios as defined in the agreement. As of
June 30, 2019
, the Company was in compliance with all such covenants. The revolving credit facility terminates
February 20, 2020
and at
June 30, 2019
there was
no
outstanding balance. Prior to termination, the Company plans to renew the current credit facility or replace it with a similar credit facility.
Other lines of credit
The Company renewed an unsecured bank credit line on
May 1, 2019
which provides for funding of up to
$5,000
and bears interest at the prime rate less
1%
. The credit line was renewed through
April 30, 2021
. At
June 30, 2019
,
no
amount was outstanding.
OFF-BALANCE SHEET ARRANGEMENTS AND CONTRACTUAL OBLIGATIONS
At
June 30, 2019
, the Company’s total off-balance sheet contractual obligations were
$665,107
. This balance consists of
$71,633
of long-term operating leases for various facilities and equipment which expire from
2020
to
2030
and
$593,474
of purchase commitments. In fiscal 2017, JHA entered a strategic services agreement with First Data® and PSCU® to provide full-service debit and credit card processing on a single platform to all existing core bank and credit union customers, as well as expand its card processing platform to financial institutions outside our core customer base. This agreement includes a purchase commitment of
$555,754
over the remaining term of the contract. The remainder of the purchase commitments relate mainly to open purchase orders. The contractual obligations table below excludes
$12,009
of liabilities for uncertain tax positions as we are unable to reasonably estimate the ultimate amount or timing of settlement.
|
Contractual obligations by period as of June 30, 2019
|
Less than
1 year
|
1-3 years
|
3-5 years
|
More than
5 years
|
TOTAL
|
|
||||||||||||||
|
Operating lease obligations
|
$
|
15,559
|
|
$
|
25,399
|
|
$
|
19,004
|
|
$
|
11,671
|
|
$
|
71,633
|
|
|||||
|
Purchase obligations
|
62,637
|
|
86,875
|
|
107,188
|
|
336,774
|
|
593,474
|
|
||||||||||
|
Total
|
$
|
78,196
|
|
$
|
112,274
|
|
$
|
126,192
|
|
$
|
348,445
|
|
$
|
665,107
|
|
|||||
The operating lease obligations included on this table will be recorded on the balance sheet beginning in fiscal 2020 due to the Company's adoption of ASU No. 2016-02, issued by the FASB in February 2016 and effective for the Company on July 1, 2019.
RECENT ACCOUNTING PRONOUNCEMENTS
Recently Adopted Accounting Guidance
The Financial Accounting Standards Board (“FASB”) issued ASU No. 2014-09,
Revenue from Contracts with Customers
, in May 2014. This standard (and related amendments collectively referred to as “ASC 606”) is part of an effort to create a common revenue standard for U.S. GAAP and International Financial Reporting Standards (“IFRS”). The new standard has superseded much of the authoritative literature for revenue recognition. The new model enacts a five-step process for achieving the core principle, which is that an entity should recognize revenue to depict the transfer of promised goods or services to customers in an amount that reflects the consideration to which the entity
28
expects to be entitled in exchange for those goods or services. The standard was effective for the Company on July 1, 2018. Entities are allowed to transition to the new standard by either recasting prior periods (full retrospective) or recognizing the cumulative effect as of the beginning of the period of adoption (modified retrospective).
The Company adopted the new standard using the full retrospective transition approach, using certain practical expedients. The Company has not disclosed the amount of transaction price allocated to remaining performance obligations for reporting periods presented before the date of initial application. Also, the Company did not separately consider the effects of contract modifications that occurred before the beginning of the earliest reporting period presented, but reflects the aggregate effect of all modifications that occurred before the beginning of the earliest period presented. As a result, all fiscal 2018 and fiscal 2017 financial information has been adjusted for the effects of applying ASC 606. The details of the significant changes are disclosed below:
Software Revenue Recognition
The Company previously recognized software license and related services within the scope of ASC Topic 985-605, which required the establishment of vendor-specific objective evidence (“VSOE”) of fair value in order to separately recognize revenue for each software-related good or service. Due to the inability to establish VSOE, the Company had previously deferred all revenue on software-related goods and services on a master contract until all the goods and services had been delivered. Under ASC 606, VSOE is no longer required for separation of otherwise distinct performance obligations within a revenue arrangement. This change has resulted in earlier recognition of revenue for the Company’s software-related goods and services, leading to a decrease in deferred revenue balances within its adjusted consolidated balance sheets.
Impacts on Financial Statements
See tables in Item 8, Note 1 to the Consolidated Financial Statements for the impacts ASC 606 had on prior period financial statements.
ASU 2016-15 issued by the FASB in August 2016 clarifies cash flow classification of eight specific cash flow issues and is effective for our annual reporting period beginning July 1, 2018. The adoption of this standard did not have any impact on our financial statements.
Not Yet Adopted
The FASB issued ASU No. 2016-02, Leases, in February 2016. This ASU aims to increase transparency and comparability among organizations by recognizing lease assets and liabilities on the balance sheet and requiring disclosure of key information regarding leasing arrangements to enable users of financial statements to assess the amount, timing, and uncertainty of cash flows arising from leases. Specifically, the standard requires operating lease commitments to be recorded on the balance sheet as operating lease liabilities and right-of-use assets, and the cost of those operating leases to be amortized on a straight-line basis. ASU No. 2016-02 will be effective for JHA's annual reporting period beginning July 1, 2019. The Company established a cross-functional team to implement this standard and evaluated arrangements that would be subject to the standard, implemented software to meet the reporting and disclosure requirements of the standard, and assessed the impact of the standard on its processes and internal controls. The Company will adopt the new standard using the optional transition method in ASU 2018-11. Under this method, the Company will not adjust its comparative period financial statements for the effects of the new standard or make the new, expanded required disclosures for periods prior to the effective date. The Company will recognize a cumulative-effect adjustment, as necessary, to the opening balance of retained earnings for fiscal 2020 upon adoption of the standard.
We will take advantage of the transition package of practical expedients permitted within the new standard, which among other things, allows us to carryforward the historical lease classification. In addition, we will make an accounting policy election that will keep leases with an initial term of twelve months or less off of the balance sheet. The Company also elected the practical expedient not to separate the non-lease components of a contract from the lease component to which they relate.
Upon adoption of the standard, the Company will record right-of-use assets of
approximately
$70,000
to
$73,000
and lease obligations of
approximately
$73,000
to
$75,000
on the its balance sheet as of July 1, 2019. Adoption of the standard is not expected to significantly impact the Company's net income and is not expected to have a material impact on the Company's compliance with the financial covenants under its credit facility.
29
In August of 2018, the FASB issued ASU No. 2018-15, Intangibles, Goodwill and Other - Internal-Use Software (Subtopic 350-40), which broadens the scope of Subtopic 350-40 to include costs incurred to implement a hosting arrangement that is a service contract. The costs are capitalized or expensed depending on the nature of the costs and the project stage during which they are incurred, consistent with costs for internal-use software. The amendments in this update can be applied either retrospectively or prospectively to all implementation costs incurred after the date of adoption. The ASU will be effective for the Company on July 1, 2020, with early adoption permitted. The Company is currently evaluating the impact that the guidance will have on its financial statements.
CRITICAL ACCOUNTING POLICIES
We prepare our consolidated financial statements in accordance with U.S. GAAP. The significant accounting policies are discussed in Note 1 to the consolidated financial statements. The preparation of consolidated financial statements in accordance with U.S. GAAP requires us to make estimates and judgments that affect the reported amounts of assets, liabilities, revenue and expenses, as well as disclosure of contingent assets and liabilities. We base our estimates and judgments upon historical experience and other factors believed to be reasonable under the circumstances. Changes in estimates or assumptions could result in a material adjustment to the consolidated financial statements.
We have identified several critical accounting estimates. An accounting estimate is considered critical if both: (a) the nature of the estimates or assumptions is material due to the levels of subjectivity and judgment involved, and (b) the impact of changes in the estimates and assumptions would have a material effect on the consolidated financial statements.
Revenue Recognition
We generate revenue from data processing, transaction processing, software licensing and related services, professional services, and hardware sales.
Significant Judgments in Application of the Guidance
Identification of Performance Obligations
We enter into contracts with customers that may include multiple types of goods and services. At contract inception, we assess the solutions and services promised in its contracts with customers and identifies a performance obligation for each promise to transfer to the customer a solution or service (or bundle of solutions or services) that is distinct - that is, if the solution or service is separately identifiable from other items in the arrangement and if the customer can benefit from the solution or service on its own or together with other resources that are readily available. Significant judgment is used in the identification and accounting for all performance obligations. We recognize revenue when or as we satisfy each performance obligation by transferring control of a solution or service to the customer.
Determination of Transaction Price
The amount of revenue recognized is based on the consideration we expect to receive in exchange for transferring goods and services to the customer. Our contracts with our customers frequently contain some component of variable consideration. We estimate variable consideration in our contracts primarily using the expected value method, based on both historical and current information. Where appropriate, we may constrain the estimated variable consideration included in the transaction price in the event of a high degree of uncertainty as to the final consideration amount. Significant judgment is used in the estimate of variable consideration of customer contracts that are long-term and include uncertain transactional volumes.
Taxes collected from customers and remitted to governmental authorities are not included in revenue. We include reimbursements from customers for expenses incurred in providing services (such as for postage, travel and telecommunications costs) in revenue, while the related costs are included in cost of revenue.
Technology or service components from third parties are frequently included in or combined with our applications or service offerings. Whether we recognize revenue based on the gross amount billed to the customer or the net amount retained involves judgment in determining whether we control the good or service before it is transferred to the customer. This assessment is made at the performance obligation level.
Allocation of Transaction Price
The transaction price, once determined, is allocated between the various performance obligations in the contract based upon their relative standalone selling prices. The standalone selling prices are determined based on the prices at which we separately sell each good or service. For items that are not sold separately, we estimate the standalone selling prices using all information that is reasonably available, including reference to historical pricing data.
The following describes the nature of our primary types of revenue:
30
Processing
Processing revenue is generated from transaction-based fees for electronic deposit and payment services, electronic funds transfers and debit and credit card processing. Our arrangements for these services typically require us to “stand-ready” to provide specific services on a when and if needed basis by processing an unspecified number of transactions over the contractual term. The fees for these services may be fixed or variable (based upon performing an unspecified quantity of services), and pricing may include tiered pricing structures. Amounts of revenue allocated to these services are recognized as those services are performed. Customers are typically billed monthly for transactions processed during the month. We evaluate tiered pricing to determine if a material right exists. If, after that evaluation, we determine a material right does exist, we assign value to the material right based upon standalone selling price after estimation of breakage associated with the material right.
Outsourcing and Cloud
Outsourcing and cloud revenue is generated from data and item processing services and hosting fees. Our arrangements for these services typically require us to “stand-ready” to provide specific services on a when and if needed basis. The fees for these services may be fixed or variable (based upon performing an unspecified quantity of services), and pricing may include tiered pricing structures. Amounts of revenue allocated to these services are recognized as those services are performed. Data and item processing services are typically billed monthly. We evaluate tiered pricing to determine if a material right exists. If, after that evaluation, we determine a material right does exist, we assign value to the material right based upon standalone selling price.
Product Delivery and Services
Product delivery and services revenue is generated primarily from software licensing and related professional services and hardware delivery. Software licenses, along with any professional services from which they are not considered distinct, are recognized as they are delivered to the customer. Hardware revenue is recognized upon delivery. Professional services that are distinct are recognized as the services are performed. Deconversion fees are also included within product delivery and services, and are considered a contract modification. Therefore, we recognize these fees over the remaining modified contract term.
In-House Support
In-house support revenue is generated from software maintenance for ongoing client support and software usage, which includes a license and ongoing client support. Our arrangements for these services typically require us to “stand-ready” to provide specific services on a when and if needed basis. The fees for these services may be fixed or variable (based upon performing an unspecified quantity of services). Software maintenance fees are typically billed to the customer annually in advance and recognized ratably over the maintenance term. Software usage is typically billed annually in advance, with the license delivered and recognized at the outset, and the maintenance fee recognized ratably over the maintenance term. Accordingly, we utilize the practical expedient which allows entities to disregard the effects of a financing component when the contract period is one year or less.
Contract Costs
We incur incremental costs to obtain a contract as well as costs to fulfill contracts with customers that are expected to be recovered. These costs consist primarily of sales commissions, which are incurred only if a contract is obtained, and customer conversion or implementation-related costs.
Capitalized costs are amortized based on the transfer of goods or services to which the asset relates, in line with the percentage of revenue recognized for each performance obligation to which the costs are allocated.
Depreciation and Amortization Expense
The calculation of depreciation and amortization expense is based on the estimated economic lives of the underlying property, plant and equipment and intangible assets, which have been examined for their useful life and determined that no impairment exists. We believe it is unlikely that any significant changes to the useful lives of our tangible and intangible assets will occur in the near term, but rapid changes in technology or changes in market conditions could result in revisions to such estimates that could materially affect the carrying value of these assets and our future consolidated operating results. For long-lived assets, we consider whether any impairment indicators are present. If impairment indicators are identified, we test the recoverability of the long-lived assets. If this recoverability test is failed, we determine the fair value of the long-lived assets and recognize an impairment loss if the fair value is less than its carrying value.
Capitalization of software development costs
We capitalize certain costs incurred to develop commercial software products. For software that is to be sold, significant areas of judgment include: establishing when technological feasibility has been met and costs should be capitalized,
31
determining the appropriate period over which to amortize the capitalized costs based on the estimated useful lives, estimating the marketability of the commercial software products and related future revenues, and assessing the unamortized cost balances for impairment. Costs incurred prior to establishing technological feasibility are expensed as incurred. Amortization begins on the date of general release and the appropriate amortization period is based on estimates of future revenues from sales of the products. We consider various factors to project marketability and future revenues, including an assessment of alternative solutions or products, current and historical demand for the product, and anticipated changes in technology that may make the product obsolete.
For internal use software, capitalization begins at the beginning of application development. Costs incurred prior to this are expensed as incurred. Significant estimates and assumptions include determining the appropriate amortization period based on the estimated useful life and assessing the unamortized cost balances for impairment. Amortization begins on the date the software is placed in service and the amortization period is based on estimated useful life.
A significant change in an estimate related to one or more software products could result in a material change to our results of operations.
Estimates used to determine current and deferred income taxes
We make certain estimates and judgments in determining income tax expense for financial statement purposes. These estimates and judgments occur in the calculation of certain tax assets and liabilities, which arise from differences in the timing of recognition of revenue and expense for tax and financial statement purposes. We also must determine the likelihood of recoverability of deferred tax assets, and adjust any valuation allowances accordingly. Considerations include the period of expiration of the tax asset, planned use of the tax asset, and historical and projected taxable income as well as tax liabilities for the tax jurisdiction to which the tax asset relates. Valuation allowances are evaluated periodically and will be subject to change in each future reporting period as a result of changes in one or more of these factors. Also, liabilities for uncertain tax positions require significant judgment in determining what constitutes an individual tax position as well as assessing the outcome of each tax position. Changes in judgment as to recognition or measurement of tax positions can materially affect the estimate of the effective tax rate and consequently, affect our financial results.
Assumptions related to purchase accounting and goodwill
We account for our acquisitions using the purchase method of accounting. This method requires estimates to determine the fair values of assets and liabilities acquired, including judgments to determine any acquired intangible assets such as customer-related intangibles, as well as assessments of the fair value of existing assets such as property and equipment. Liabilities acquired can include balances for litigation and other contingency reserves established prior to or at the time of acquisition, and require judgment in ascertaining a reasonable value. Third-party valuation firms may be used to assist in the appraisal of certain assets and liabilities, but even those determinations would be based on significant estimates provided by us, such as forecast revenues or profits on contract-related intangibles. Numerous factors are typically considered in the purchase accounting assessments, which are conducted by Company professionals from legal, finance, human resources, information systems, program management and other disciplines. Changes in assumptions and estimates of the acquired assets and liabilities would result in changes to the fair values, resulting in an offsetting change to the goodwill balance associated with the business acquired.
As goodwill is not amortized, goodwill balances are regularly assessed for potential impairment. Such assessments include a qualitative assessment of factors that may indicate a potential for impairment, such as: macroeconomic conditions, industry and market changes, our overall financial performance, changes in share price, and an assessment of other events or changes in circumstances that could negatively impact us. If that qualitative assessment indicates a potential for impairment, a quantitative assessment is then required, including an analysis of future cash flow projections as well as a determination of an appropriate discount rate to calculate present values. Cash flow projections are based on management-approved estimates, which involve the input of numerous Company professionals from finance, operations and program management. Key factors used in estimating future cash flows include assessments of labor and other direct costs on existing contracts, estimates of overhead costs and other indirect costs, and assessments of new business prospects and projected win rates. Our most recent assessment indicates that no reporting units are currently at risk of impairment as the fair value of each reporting unit is significantly in excess of the carrying value. However, significant changes in the estimates and assumptions used in purchase accounting and goodwill impairment testing could have a material effect on the consolidated financial statements.
ITEM 7A. QUANTITATIVE AND QUALITATIVE DISCLOSURES ABOUT MARKET RISK
Market risk refers to the risk that a change in the level of one or more market prices, interest rates, indices, volatilities, correlations or other market factors such as liquidity, will result in losses for a certain financial instrument or group of financial instruments. We are currently exposed to credit risk on credit extended to customers and interest risk on
32
outstanding debt. We do not currently use any derivative financial instruments. We actively monitor these risks through a variety of controlled procedures involving senior management.
Based on the controls in place and the credit worthiness of the customer base, we believe the credit risk associated with the extension of credit to our customers will not have a material adverse effect on our consolidated financial position, results of operations, or cash flows.
We have
no
outstanding debt with variable interest rates as of
June 30, 2019
, and are therefore not currently exposed to interest rate risk.
ITEM 8. FINANCIAL STATEMENTS AND SUPPLEMENTARY DATA
Index to Financial Statements
|
|
||
|
|
|
|
|
|
||
|
|
|
|
|
|
Financial Statements
|
|
|
|
|
|
|
|
|
|
|
|
Years Ended June 30, 2019, 2018, and 2017
|
|
|
|
|
|
|
|
||
|
|
June 30, 2019 and 2018
|
|
|
|
|
|
|
|
Years Ended June 30, 2019, 2018, and 2017
|
|
|
|
|
|
|
|
|
|
|
|
Years Ended June 30, 2019, 2018, and 2017
|
|
|
|
|
|
|
|
||
Financial Statement Schedules
There are no schedules included because they are not applicable or the required information is shown in the consolidated financial statements or notes thereto.
34
REPORT OF INDEPENDENT REGISTERED PUBLIC ACCOUNTING FIRM
To the Board of Directors and Stockholders of Jack Henry & Associates, Inc.
Opinions on the Financial Statements and Internal Control over Financial Reporting
We have audited the accompanying consolidated
balance sheets of Jack Henry & Associates, Inc. and its subsidiaries (the “Company”) as of June 30, 2019 and 2018, and the related consolidated statements of income, changes in stockholders’ equity and cash flows for each of the three years in the period ended June 30, 2019, including the related notes (collectively referred to as the “consolidated financial statements”). We also have audited the Company’s internal control over financial reporting as of June 30, 2019, based on criteria established in
Internal Control - Integrated Framework
(2013) issued by the Committee of Sponsoring Organizations of the Treadway Commission (COSO).
In our opinion, the consolidated financial statements referred to above present fairly, in all material respects, the financial position of the Company
as of June 30, 2019
and 2018, and the results of its operations and its cash flows for each of the three years in the period ended June 30, 2019
in conformity with accounting principles generally accepted in the United States of America. Also in our opinion, the Company maintained, in all material respects, effective internal control over financial reporting as of June 30, 2019, based on criteria established in
Internal Control - Integrated Framework
(2013)
issued by the COSO.
Change in Accounting Principle
As discussed in Note 1 to the consolidated financial statements, the Company changed the manner in which it accounts for revenue from contracts with customers as of July 1, 2018.
Basis for Opinions
The Company's management is responsible for these consolidated financial statements, for maintaining effective internal control over financial reporting, and for its assessment of the effectiveness of internal control over financial reporting, included in the accompanying Management’s Annual Report on Internal Control over Financial Reporting. Our responsibility is to express opinions on the Company’s consolidated
financial statements and on the Company's internal control over financial reporting based on our audits. We are a public accounting firm registered with the Public Company Accounting Oversight Board (United States) (PCAOB) and are required to be independent with respect to the Company in accordance with the U.S. federal securities laws and the applicable rules and regulations of the Securities and Exchange Commission and the PCAOB.
We conducted our audits in accordance with the standards of the PCAOB. Those standards require that we plan and perform the audits to obtain reasonable assurance about whether the consolidated
financial statements are free of material misstatement, whether due to error or fraud, and whether effective internal control over financial reporting was maintained in all material respects.
Our audits of the consolidated
financial statements included performing procedures to assess the risks of material misstatement of the consolidated
financial statements, whether due to error or fraud, and performing procedures that respond to those risks. Such procedures included examining, on a test basis, evidence regarding the amounts and disclosures in the consolidated
financial statements. Our audits also included evaluating the accounting principles used and significant estimates made by management, as well as evaluating the overall presentation of the consolidated
financial statements. Our audit of internal control over financial reporting included obtaining an understanding of internal control over financial reporting, assessing the risk that a material weakness exists, and testing and evaluating the design and operating effectiveness of internal control based on the assessed risk. Our audits also included performing such other procedures as we considered necessary in the circumstances. We believe that our audits provide a reasonable basis for our opinions.
Definition and Limitations of Internal Control over Financial Reporting
A company’s internal control over financial reporting is a process designed to provide reasonable assurance regarding the reliability of financial reporting and the preparation of financial statements for external purposes in accordance with generally accepted accounting principles. A company’s internal control over financial reporting includes those policies and procedures that (i) pertain to the maintenance of records that, in reasonable detail, accurately and fairly reflect the transactions and dispositions of the assets of the company; (ii) provide reasonable assurance that transactions are recorded as necessary to permit preparation of financial statements in accordance with generally accepted accounting principles, and that receipts and expenditures of the company are being made only in accordance with authorizations of management and directors of the company; and (iii) provide reasonable assurance regarding
35
prevention or timely detection of unauthorized acquisition, use, or disposition of the company’s assets that could have a material effect on the financial statements.
Because of its inherent limitations, internal control over financial reporting may not prevent or detect misstatements. Also, projections of any evaluation of effectiveness to future periods are subject to the risk that controls may become inadequate because of changes in conditions, or that the degree of compliance with the policies or procedures may deteriorate.
Critical Audit Matters
The critical audit matter communicated below is a matter arising from the current period audit of the consolidated financial statements that was communicated or required to be communicated to the audit committee and that (i) relates to accounts or disclosures that are material to the consolidated financial statements and (ii) involved our especially challenging, subjective, or complex judgments. The communication of critical audit matters does not alter in any way our opinion on the consolidated financial statements, taken as a whole, and we are not, by communicating the critical audit matter below, providing a separate opinion on the critical audit matter or on the accounts or disclosures to which it relates.
Revenue Recognition - estimating variable consideration and identification of and accounting for performance obligations
As discussed in Note 1 to the consolidated financial statements, the Company recorded revenue of $1.553 billion for the year ended June 30, 2019. The Company enters into contracts with its customers, which frequently contain multiple performance obligations and variable contract consideration. The amount of revenue recognized is based on the consideration the Company expects to receive in exchange for transferring goods and services to the customer. The Company’s contracts with its customers frequently contain some component of variable consideration. Management estimates variable consideration in its contract primarily using the expected value method, based on both historical and current information. Where appropriate, the Company may constrain the estimated variable consideration included in the transaction price in the event of a high degree of uncertainty as to the final consideration amount. At contract inception, management assesses the solutions and services promised in its contracts with customers and identifies a performance obligation for each promise to transfer to the customer a solution or service (or bundle of solutions or services) that is distinct - that is, if the solution or service is separately identifiable from other items in the arrangement and if the customer can benefit from the solution or service on its own or together with other resources that are readily available. The Company recognizes revenue when or as it satisfies each performance obligation by transferring control of a solution or service to the customer. Significant judgment in revenue recognition for these customer contracts include, where relevant, (i) the estimation of variable consideration, principally, the varying volume of transactional activity over long-term contracts, and (ii) the identification of and accounting for all performance obligations.
The principal considerations for our determination that performing procedures relating to revenue recognition - specifically the estimation of variable consideration and identification of and accounting for performance obligations - is a critical audit matter are there was significant judgment by management to estimate the variable consideration, principally, the varying volume of transactional activity and the identification of and accounting for all performance obligations in a contract. This in turn resulted in significant audit effort, a high degree of auditor judgment and subjectivity, in performing our audit procedures and in evaluating the audit evidence obtained.
Addressing the matter involved performing procedures and evaluating audit evidence in connection with forming our overall opinion on the consolidated financial statements. These procedures included testing the effectiveness of controls relating to the revenue recognition process, including the estimation of variable consideration and identification of and accounting for each performance obligation. The procedures also included, among others, evaluating and testing management’s process for determining the variable consideration and testing the reasonableness of management’s estimation of variable consideration. Testing the estimation of variable consideration included evaluating the terms and conditions of the long-term contracts and the related significant assumptions used in the estimate of the variable consideration, principally, the varying volume of transactional activity. The procedures for testing the performance obligations and variable consideration included evaluation of the terms and conditions for a sample of contracts.
/s/ PricewaterhouseCoopers LLP
Kansas City, Missouri
August 26, 2019
We have served as the Company’s auditor since 2015.
36
MANAGEMENT’S ANNUAL REPORT ON INTERNAL CONTROL OVER FINANCIAL REPORTING
The management of Jack Henry & Associates, Inc. is responsible for establishing and maintaining adequate internal control over financial reporting, as such term is defined in Exchange Act Rule 13a-15(f). The Company’s internal control over financial reporting is a process designed to provide reasonable assurance regarding the reliability of financial reporting and the preparation of the Company’s consolidated financial statements for external reporting purposes in accordance with U.S. GAAP.
The Company’s internal control over financial reporting includes policies and procedures pertaining to the maintenance of records that, in reasonable detail, accurately and fairly reflect transactions and dispositions of assets of the Company; provide reasonable assurance transactions are recorded as necessary to permit preparation of consolidated financial statements in accordance with U.S. GAAP, and receipts and expenditures of the Company are being made only in accordance with authorizations of management and the directors of the Company; and provide reasonable assurance regarding prevention or timely detection of unauthorized acquisition, use, or disposition of the Company’s assets that could have a material effect on the Company’s consolidated financial statements. All internal controls, no matter how well designed, have inherent limitations. Therefore, even where internal control over financial reporting is determined to be effective, it can provide only reasonable assurance. Projections of any evaluation of effectiveness to future periods are subject to the risk controls may become inadequate because of changes in conditions, or the degree of compliance with the policies or procedures may deteriorate.
As of
June 30, 2019
, management conducted an assessment of the effectiveness of the Company’s internal control over financial reporting based on the framework established in Internal Control-Integrated Framework (2013) issued by the Committee of Sponsoring Organizations of the Treadway Commission (COSO). Based on this assessment, management has concluded the Company’s internal control over financial reporting as of
June 30, 2019
was effective.
The Company’s internal control over financial reporting as of
June 30, 2019
has been audited by the Company’s independent registered public accounting firm, as stated in their report appearing in this Item 8.
37
|
JACK HENRY & ASSOCIATES, INC. AND SUBSIDIARIES
|
|||||||||||
|
CONSOLIDATED STATEMENTS OF INCOME
|
|||||||||||
|
(In Thousands, Except Per Share Data)
|
|||||||||||
|
Year Ended
|
|||||||||||
|
|
June 30,
|
||||||||||
|
|
2019
|
2018
|
2017
|
||||||||
|
REVENUE
|
$
|
1,552,691
|
|
$
|
1,470,797
|
|
$
|
1,388,290
|
|
||
|
EXPENSES
|
|
|
|||||||||
|
Cost of Revenue
|
923,030
|
|
853,138
|
|
805,855
|
|
|||||
|
Research and Development
|
96,378
|
|
90,340
|
|
84,753
|
|
|||||
|
Selling, General, and Administrative
|
185,998
|
|
171,710
|
|
159,235
|
|
|||||
|
Gain on Disposal of Businesses
|
—
|
|
(1,894
|
)
|
(3,270
|
)
|
|||||
|
Total Expenses
|
1,205,406
|
|
1,113,294
|
|
1,046,573
|
|
|||||
|
OPERATING INCOME
|
347,285
|
|
357,503
|
|
341,717
|
|
|||||
|
INTEREST INCOME (EXPENSE)
|
|
|
|||||||||
|
Interest Income
|
876
|
|
575
|
|
248
|
|
|||||
|
Interest Expense
|
(926
|
)
|
(1,920
|
)
|
(996
|
)
|
|||||
|
Total Interest Income (Expense)
|
(50
|
)
|
(1,345
|
)
|
(748
|
)
|
|||||
|
INCOME BEFORE INCOME TAXES
|
347,235
|
|
356,158
|
|
340,969
|
|
|||||
|
PROVISION/ (BENEFIT) FOR INCOME TAXES
|
75,350
|
|
(8,876
|
)
|
111,408
|
|
|||||
|
NET INCOME
|
$
|
271,885
|
|
$
|
365,034
|
|
$
|
229,561
|
|
||
|
Basic earnings per share
|
$
|
3.52
|
|
$
|
4.73
|
|
$
|
2.95
|
|
||
|
Basic weighted average shares outstanding
|
77,160
|
|
77,252
|
|
77,856
|
|
|||||
|
Diluted earnings per share
|
$
|
3.52
|
|
$
|
4.70
|
|
$
|
2.93
|
|
||
|
Diluted weighted average shares outstanding
|
77,347
|
|
77,585
|
|
78,255
|
|
|||||
See notes to consolidated financial statements
38
|
JACK HENRY & ASSOCIATES, INC. AND SUBSIDIARIES
|
|||||||
|
CONSOLIDATED BALANCE SHEETS
|
|||||||
|
(In Thousands, Except Share and Per Share Data)
|
|||||||
|
|
June 30,
2019 |
June 30,
2018 |
|||||
|
ASSETS
|
|
|
|||||
|
CURRENT ASSETS:
|
|
|
|||||
|
Cash and cash equivalents
|
$
|
93,628
|
|
$
|
31,440
|
|
|
|
Receivables, net
|
310,080
|
|
297,271
|
|
|||
|
Income tax receivable
|
17,817
|
|
21,671
|
|
|||
|
Prepaid expenses and other
|
106,466
|
|
96,069
|
|
|||
|
Deferred costs
|
35,102
|
|
22,991
|
|
|||
|
Assets held for sale
|
6,355
|
|
1,300
|
|
|||
|
Total current assets
|
569,448
|
|
470,742
|
|
|||
|
PROPERTY AND EQUIPMENT, net
|
272,474
|
|
285,550
|
|
|||
|
OTHER ASSETS:
|
|
|
|||||
|
Non-current deferred costs
|
90,084
|
|
74,865
|
|
|||
|
Computer software, net of amortization
|
318,969
|
|
288,172
|
|
|||
|
Other non-current assets
|
134,743
|
|
110,299
|
|
|||
|
Customer relationships, net of amortization
|
100,653
|
|
115,034
|
|
|||
|
Other intangible assets, net of amortization
|
31,514
|
|
38,467
|
|
|||
|
Goodwill
|
666,944
|
|
649,929
|
|
|||
|
Total other assets
|
1,342,907
|
|
1,276,766
|
|
|||
|
Total assets
|
$
|
2,184,829
|
|
$
|
2,033,058
|
|
|
|
LIABILITIES AND STOCKHOLDERS' EQUITY
|
|
|
|||||
|
CURRENT LIABILITIES:
|
|
|
|||||
|
Accounts payable
|
$
|
9,850
|
|
$
|
30,360
|
|
|
|
Accrued expenses
|
120,360
|
|
88,764
|
|
|||
|
Deferred revenues
|
339,752
|
|
328,931
|
|
|||
|
Total current liabilities
|
469,962
|
|
448,055
|
|
|||
|
LONG-TERM LIABILITIES:
|
|
|
|||||
|
Non-current deferred revenues
|
54,554
|
|
40,984
|
|
|||
|
Deferred income tax liability
|
217,010
|
|
208,303
|
|
|||
|
Other long-term liabilities
|
14,290
|
|
12,872
|
|
|||
|
Total long-term liabilities
|
285,854
|
|
262,159
|
|
|||
|
Total liabilities
|
755,816
|
|
710,214
|
|
|||
|
STOCKHOLDERS' EQUITY
|
|
|
|||||
|
Preferred stock - $1 par value; 500,000 shares authorized, none issued
|
—
|
|
—
|
|
|||
|
Common stock - $0.01 par value; 250,000,000 shares authorized;
103,496,026 shares issued at June 30, 2019; 103,278,562 shares issued at June 30, 2018 |
1,035
|
|
1,033
|
|
|||
|
Additional paid-in capital
|
472,029
|
|
464,138
|
|
|||
|
Retained earnings
|
2,066,073
|
|
1,912,933
|
|
|||
|
Less treasury stock at cost
26,507,903 shares at June 30, 2019; 26,107,903 shares at June 30, 2018 |
(1,110,124
|
)
|
(1,055,260
|
)
|
|||
|
Total stockholders' equity
|
1,429,013
|
|
1,322,844
|
|
|||
|
Total liabilities and equity
|
$
|
2,184,829
|
|
$
|
2,033,058
|
|
|
See notes to consolidated financial statements
39
|
JACK HENRY & ASSOCIATES, INC. AND SUBSIDIARIES
|
|||||||||||
|
CONSOLIDATED STATEMENTS OF CHANGES IN STOCKHOLDERS' EQUITY
|
|||||||||||
|
(In Thousands, Except Share and Per Share Data)
|
|||||||||||
|
|
Year Ended June 30,
|
||||||||||
|
|
2019
|
2018
|
2017
|
||||||||
|
PREFERRED SHARES:
|
—
|
|
—
|
|
—
|
|
|||||
|
COMMON SHARES:
|
|
|
|
||||||||
|
Shares, beginning of year
|
103,278,562
|
|
103,083,299
|
|
102,903,971
|
|
|||||
|
Shares issued for equity-based payment arrangements
|
141,071
|
|
118,865
|
|
98,781
|
|
|||||
|
Shares issued for Employee Stock Purchase Plan
|
76,393
|
|
76,398
|
|
80,547
|
|
|||||
|
Shares, end of year
|
103,496,026
|
|
103,278,562
|
|
103,083,299
|
|
|||||
|
COMMON STOCK - PAR VALUE $0.01 PER SHARE:
|
|
|
|
||||||||
|
Balance, beginning of year
|
$
|
1,033
|
|
$
|
1,031
|
|
$
|
1,029
|
|
||
|
Shares issued for equity-based payment arrangements
|
1
|
|
1
|
|
1
|
|
|||||
|
Shares issued for Employee Stock Purchase Plan
|
1
|
|
1
|
|
1
|
|
|||||
|
Balance, end of year
|
$
|
1,035
|
|
$
|
1,033
|
|
$
|
1,031
|
|
||
|
ADDITIONAL PAID-IN CAPITAL:
|
|
|
|
||||||||
|
Balance, beginning of year
|
$
|
464,138
|
|
$
|
452,016
|
|
$
|
440,123
|
|
||
|
Shares issued for equity-based payment arrangements
|
235
|
|
174
|
|
(1
|
)
|
|||||
|
Tax withholding related to share based compensation
|
(13,972
|
)
|
(7,332
|
)
|
(5,479
|
)
|
|||||
|
Shares issued for Employee Stock Purchase Plan
|
9,039
|
|
7,522
|
|
6,244
|
|
|||||
|
Stock-based compensation expense
|
12,589
|
|
11,758
|
|
11,129
|
|
|||||
|
Balance, end of year
|
$
|
472,029
|
|
$
|
464,138
|
|
$
|
452,016
|
|
||
|
RETAINED EARNINGS:
|
|
|
|
||||||||
|
Balance, beginning of year
|
$
|
1,912,933
|
|
$
|
1,652,920
|
|
$
|
1,431,192
|
|
||
|
Cumulative effect of ASC 606 adoption*
|
—
|
|
—
|
|
83,874
|
|
|||||
|
Net income*
|
271,885
|
|
365,034
|
|
229,561
|
|
|||||
|
Dividends
|
(118,745
|
)
|
(105,021
|
)
|
(91,707
|
)
|
|||||
|
Balance, end of year
|
$
|
2,066,073
|
|
$
|
1,912,933
|
|
$
|
1,652,920
|
|
||
|
TREASURY STOCK:
|
|
|
|
||||||||
|
Balance, beginning of year
|
$
|
(1,055,260
|
)
|
$
|
(1,006,274
|
)
|
$
|
(876,134
|
)
|
||
|
Purchase of treasury shares
|
(54,864
|
)
|
(48,986
|
)
|
(130,140
|
)
|
|||||
|
Balance, end of year
|
$
|
(1,110,124
|
)
|
$
|
(1,055,260
|
)
|
$
|
(1,006,274
|
)
|
||
|
TOTAL STOCKHOLDERS' EQUITY
|
$
|
1,429,013
|
|
$
|
1,322,844
|
|
$
|
1,099,693
|
|
||
|
Dividends declared per share
|
$
|
1.54
|
|
$
|
1.36
|
|
$
|
1.18
|
|
||
See notes to consolidated financial statements.
*Retained earnings as of
June 30, 2018
and
2017
and net income for the fiscal years ended
June 30, 2018
and
2017
have been adjusted as a result of the adoption of ASC 606. Refer to Note 1 for the impact to previously presented Consolidated Balance Sheets and Consolidated Statements of Income. Other components of stockholders' equity were not impacted.
40
|
JACK HENRY & ASSOCIATES, INC. AND SUBSIDIARIES
|
|||||||||||
|
CONSOLIDATED STATEMENTS OF CASH FLOWS
|
|||||||||||
|
(In Thousands)
|
|||||||||||
|
|
Year Ended
|
||||||||||
|
|
June 30,
|
||||||||||
|
|
2019
|
2018
|
2017
|
||||||||
|
CASH FLOWS FROM OPERATING ACTIVITIES:
|
|
|
|||||||||
|
Net Income
|
$
|
271,885
|
|
$
|
365,034
|
|
$
|
229,561
|
|
||
|
Adjustments to reconcile net income from operations
to net cash from operating activities:
|
|
|
|||||||||
|
Depreciation
|
47,378
|
|
47,975
|
|
49,677
|
|
|||||
|
Amortization
|
113,255
|
|
104,011
|
|
90,109
|
|
|||||
|
Change in deferred income taxes
|
7,604
|
|
(74,884
|
)
|
21,187
|
|
|||||
|
Expense for stock-based compensation
|
12,589
|
|
11,758
|
|
11,129
|
|
|||||
|
(Gain)/loss on disposal of assets and businesses
|
161
|
|
(954
|
)
|
4,771
|
|
|||||
|
Changes in operating assets and liabilities:
|
|
|
|||||||||
|
Change in receivables
|
(11,777
|
)
|
21,489
|
|
(33,096
|
)
|
|||||
|
Change in prepaid expenses, deferred costs and other
|
(62,165
|
)
|
(82,663
|
)
|
(24,992
|
)
|
|||||
|
Change in accounts payable
|
(7,526
|
)
|
6,922
|
|
(7,812
|
)
|
|||||
|
Change in accrued expenses
|
31,889
|
|
7,091
|
|
(11,966
|
)
|
|||||
|
Change in income taxes
|
4,179
|
|
5,108
|
|
(6,444
|
)
|
|||||
|
Change in deferred revenues
|
23,656
|
|
1,255
|
|
35,198
|
|
|||||
|
Net cash from operating activities
|
431,128
|
|
412,142
|
|
357,322
|
|
|||||
|
CASH FLOWS FROM INVESTING ACTIVITIES:
|
|
|
|||||||||
|
Payment for acquisitions, net of cash acquired
|
(19,981
|
)
|
(137,562
|
)
|
—
|
|
|||||
|
Capital expenditures
|
(53,598
|
)
|
(40,135
|
)
|
(41,947
|
)
|
|||||
|
Proceeds from the sale of businesses
|
—
|
|
350
|
|
5,632
|
|
|||||
|
Proceeds from the sale of assets
|
127
|
|
306
|
|
968
|
|
|||||
|
Customer contracts acquired
|
(20
|
)
|
—
|
|
—
|
|
|||||
|
Purchased software
|
(6,049
|
)
|
(13,138
|
)
|
(16,608
|
)
|
|||||
|
Computer software developed
|
(111,114
|
)
|
(96,647
|
)
|
(89,631
|
)
|
|||||
|
Purchase of investments
|
—
|
|
(5,000
|
)
|
—
|
|
|||||
|
Net cash from investing activities
|
(190,635
|
)
|
(291,826
|
)
|
(141,586
|
)
|
|||||
|
CASH FLOWS FROM FINANCING ACTIVITIES:
|
|
|
|||||||||
|
Borrowings on credit facilities
|
35,000
|
|
125,000
|
|
80,000
|
|
|||||
|
Repayments on credit facilities
|
(35,000
|
)
|
(175,000
|
)
|
(30,200
|
)
|
|||||
|
Purchase of treasury stock
|
(54,864
|
)
|
(48,986
|
)
|
(130,140
|
)
|
|||||
|
Dividends paid
|
(118,745
|
)
|
(105,021
|
)
|
(91,707
|
)
|
|||||
|
Proceeds from issuance of common stock upon exercise of stock options
|
237
|
|
176
|
|
1
|
|
|||||
|
Tax withholding payments related to share based compensation
|
(13,973
|
)
|
(7,333
|
)
|
(5,480
|
)
|
|||||
|
Proceeds from sale of common stock
|
9,040
|
|
7,523
|
|
6,245
|
|
|||||
|
Net cash from financing activities
|
(178,305
|
)
|
(203,641
|
)
|
(171,281
|
)
|
|||||
|
NET CHANGE IN CASH AND CASH EQUIVALENTS
|
$
|
62,188
|
|
$
|
(83,325
|
)
|
$
|
44,455
|
|
||
|
CASH AND CASH EQUIVALENTS, BEGINNING OF PERIOD
|
$
|
31,440
|
|
$
|
114,765
|
|
$
|
70,310
|
|
||
|
CASH AND CASH EQUIVALENTS, END OF PERIOD
|
$
|
93,628
|
|
$
|
31,440
|
|
$
|
114,765
|
|
||
See notes to consolidated financial statements
41
JACK HENRY & ASSOCIATES, INC. AND SUBSIDIARIES
NOTES TO CONSOLIDATED FINANCIAL STATEMENTS
(In Thousands, Except Per Share Amounts)
|
NOTE 1.
|
NATURE OF OPERATIONS AND SUMMARY OF SIGNIFICANT ACCOUNTING POLICIES
|
DESCRIPTION OF THE COMPANY
Jack Henry & Associates, Inc. and subsidiaries (“JHA” or the “Company”) is a provider of integrated computer systems and services that has developed and acquired a number of banking and credit union software systems. The Company's revenues are predominately earned by marketing those systems to financial institutions nationwide together with computer equipment (hardware), by providing the conversion and implementation services for financial institutions to utilize JHA systems, and by providing other related services. JHA also provides continuing support and services to customers using in-house or outsourced systems.
CONSOLIDATION
The consolidated financial statements include the accounts of JHA and all of its subsidiaries, which are wholly-owned, and all intercompany accounts and transactions have been eliminated.
USE OF ESTIMATES
The preparation of financial statements in conformity with accounting principles generally accepted in the United States of America ("U.S. GAAP") requires management to make estimates and assumptions that affect the reported amounts of assets and liabilities and disclosure of contingent assets and liabilities as of the date of the financial statements and the reported amounts of revenues and expenses during the reporting period. Actual results could differ from those estimates.
PRIOR PERIOD RECLASSIFICATION
The prior year periods have been recast to reflect the Company's retrospective adoption of Accounting Standards Update ("ASU") 2014-09,
Revenue from Contracts with Customers,
and related amendments, collectively referred to as Accounting Standards Codification ("ASC") 606.
We also recorded a prior period re-classification of
$1,300
to a new assets held for sale caption as of
June 30, 2018
. These assets were previously recorded under Property and Equipment, net.
PRIOR PERIOD MISCLASSIFICATION
In connection with the preparation of the Company’s 2019 annual financial statements, the Company identified an immaterial prior period misclassification which overstated accounts payable by
$4,150
, overstated deferred costs by
$4,078
, and overstated prepaid expenses and other by
$72
. The Company has corrected for this misclassification in the accompanying Consolidated Balance Sheet by revising the fiscal 2018 balances.
REVENUE RECOGNITION
The Company generates "Services and Support" revenue through software licensing and related services, outsourcing core & complementary software solutions, professional services, and hardware sales. The Company generates "Processing" revenue through processing of remittance transactions, card transactions and monthly fees, and digital transactions.
Significant Judgments in Application of the Guidance
Identification of Performance Obligations
The Company enters into contracts with customers that may include multiple types of goods and services. At contract inception, the Company assesses the solutions and services promised in its contracts with customers and identifies a performance obligation for each promise to transfer to the customer a solution or service (or bundle of solutions or services) that is distinct - that is, if the solution or service is separately identifiable from other items in the arrangement and if the customer can benefit from the solution or service on its own or together with other resources that are readily available. Significant judgment is used in the identification and accounting for all performance obligations. The Company recognizes revenue when or as it satisfies each performance obligation by transferring control of a solution or service to the customer.
Determination of Transaction Price
The amount of revenue recognized is based on the consideration the Company expects to receive in exchange for transferring goods and services to the customer. The Company’s contracts with its customers frequently contain some component of variable consideration. The Company estimates variable consideration in its contracts primarily using
42
the expected value method, based on both historical and current information. Where appropriate, the Company may constrain the estimated variable consideration included in the transaction price in the event of a high degree of uncertainty as to the final consideration amount. Significant judgment is used in the estimate of variable consideration of customer contracts that are long-term and include uncertain transactional volumes.
Taxes collected from customers and remitted to governmental authorities are not included in revenue. The Company includes reimbursements from customers for expenses incurred in providing services (such as for postage, travel and telecommunications costs) in revenue, while the related costs are included in cost of revenue.
Technology or service components from third parties are frequently included in or combined with the Company’s applications or service offerings. Whether the Company recognizes revenue based on the gross amount billed to the customer or the net amount retained involves judgment in determining whether the Company controls the good or service before it is transferred to the customer. This assessment is made at the performance obligation level.
Allocation of Transaction Price
The transaction price, once determined, is allocated between the various performance obligations in the contract based upon their relative standalone selling prices. The standalone selling prices are determined based on the prices at which the Company separately sells each good or service. For items that are not sold separately, the Company estimates the standalone selling prices using all information that is reasonably available, including reference to historical pricing data.
The following describes the nature of the Company’s primary types of revenue:
Processing
Processing revenue is generated from transaction-based fees for electronic deposit and payment services, electronic funds transfers and debit and credit card processing. The Company’s arrangements for these services typically require the Company to “stand-ready” to provide specific services on a when and if needed basis by processing an unspecified number of transactions over the contractual term. The fees for these services may be fixed or variable (based upon performing an unspecified quantity of services), and pricing may include tiered pricing structures. Amounts of revenue allocated to these services are recognized as those services are performed. Customers are typically billed monthly for transactions processed during the month. The Company evaluates tiered pricing to determine if a material right exists. If, after that evaluation, it determines a material right does exist, it assigns value to the material right based upon standalone selling price after estimation of breakage associated with the material right.
Outsourcing and Cloud
Outsourcing and cloud revenue is generated from data and item processing services and hosting fees. The Company’s arrangements for these services typically require the Company to “stand-ready” to provide specific services on a when and if needed basis. The fees for these services may be fixed or variable (based upon performing an unspecified quantity of services), and pricing may include tiered pricing structures. Amounts of revenue allocated to these services are recognized as those services are performed. Data and item processing services are typically billed monthly. The Company evaluates tiered pricing to determine if a material right exists. If, after that evaluation, it determines a material right does exist, it assigns value to the material right based upon standalone selling price.
Product Delivery and Services
Product delivery and services revenue is generated primarily from software licensing and related professional services and hardware delivery. Software licenses, along with any professional services from which they are not considered distinct, are recognized as they are delivered to the customer. Hardware revenue is recognized upon delivery. Professional services that are distinct are recognized as the services are performed. Deconversion fees are also included within product delivery and services, and are considered a contract modification. Therefore, the Company recognizes these fees over the remaining modified contract term.
In-House Support
In-house support revenue is generated from software maintenance for ongoing client support and software usage, which includes a license and ongoing client support. The Company’s arrangements for these services typically require the Company to “stand-ready” to provide specific services on a when and if needed basis. The fees for these services may be fixed or variable (based upon performing an unspecified quantity of services). Software maintenance fees are typically billed to the customer annually in advance and recognized ratably over the maintenance term. Software usage is typically billed annually in advance, with the license delivered and recognized at the outset, and the maintenance fee recognized ratably over the maintenance term. Accordingly, the Company utilizes the practical expedient which allows entities to disregard the effects of a financing component when the contract period is one year or less.
43
Disaggregation of Revenue
The tables below present the Company's revenue disaggregated by type of revenue. Refer to Note 13, Reportable Segment Information, for disaggregated revenue by type and reportable segment. The majority of the Company’s revenue is earned domestically, with revenue from customers outside the United States comprising
less than
1%
of total revenue.
|
Year Ended June 30,
|
|||||||||||
|
2019
|
2018
|
2017
|
|||||||||
|
Processing
|
$
|
594,202
|
|
$
|
550,058
|
|
$
|
506,555
|
|
||
|
Outsourcing & Cloud
|
405,359
|
|
361,922
|
|
327,738
|
|
|||||
|
Product Delivery & Services
|
231,982
|
|
251,743
|
|
256,794
|
|
|||||
|
In-House Support
|
321,148
|
|
307,074
|
|
297,203
|
|
|||||
|
Services & Support
|
958,489
|
|
920,739
|
|
$
|
881,735
|
|
||||
|
Total Revenue
|
$
|
1,552,691
|
|
$
|
1,470,797
|
|
$
|
1,388,290
|
|
||
Contract Balances
The following table provides information about contract assets and contract liabilities from contracts with customers.
|
June 30,
2019 |
June 30,
2018 |
||||||
|
Receivables, net
|
$
|
310,080
|
|
$
|
297,271
|
|
|
|
Contract Assets- Current
|
21,446
|
|
14,063
|
|
|||
|
Contract Assets- Non-current
|
50,640
|
|
35,630
|
|
|||
|
Contract Liabilities (Deferred Revenue)- Current
|
339,752
|
|
328,931
|
|
|||
|
Contract Liabilities (Deferred Revenue)- Non-current
|
54,554
|
|
40,984
|
|
|||
Contract assets primarily result from revenue being recognized when or as control of a solution or service is transferred to the customer, but where invoicing is delayed until the completion of other performance obligations or payment terms differ from the provisioning of services. The current portion of contract assets is reported within prepaid expenses and other in the consolidated balance sheet, and the non-current portion is included in other non-current assets. Contract liabilities (deferred revenue) primarily relate to consideration received from customers in advance of delivery of the related goods and services to the customer. Contract balances are reported in a net contract asset or liability position on a contract-by-contract basis at the end of each reporting period.
The Company analyzes contract language to identify if a significant financing component does exist, and would adjust the transaction price for any material effects of the time value of money if the timing of payments provides either party to the contract with a significant benefit of financing the transaction.
During the fiscal years ended
June 30, 2019
,
2018
, and
2017
, the Company recognized revenue of
$265,946
,
$269,593
, and
$264,517
, respectively, that was included in the corresponding deferred revenue balance at the beginning of the periods.
Revenue recognized that related to performance obligations satisfied (or partially satisfied) in prior periods were immaterial for each period presented. These adjustments are primarily the result of transaction price adjustments and re-allocations due to changes in estimates of variable consideration.
Transaction Price Allocated to Remaining Performance Obligations
As of
June 30, 2019
, estimated revenue expected to be recognized in the future related to performance obligations that are unsatisfied (or partially unsatisfied) at the end of the reporting period totaled
$3,640,955
. The Company expects to recognize approximately
30%
over the next
12 months
and
18%
in 13-24 months, and the balance thereafter.
44
Contract Costs
The Company incurs incremental costs to obtain a contract as well as costs to fulfill contracts with customers that are expected to be recovered. These costs consist primarily of sales commissions, which are incurred only if a contract is obtained, and customer conversion or implementation-related costs. Capitalized costs are amortized based on the transfer of goods or services to which the asset relates, in line with the percentage of revenue recognized for each performance obligation to which the costs are allocated.
Capitalized costs totaled
$231,273
and
$176,954
at
June 30, 2019
and
2018
, respectively.
For the fiscal years ended
June 30, 2019
,
2018
, and,
2017
amortization of deferred contract costs totaled
$110,894
,
$94,337
, and
$88,064
, respectively. There were no impairment losses in relation to capitalized costs for the periods presented.
COMPUTER SOFTWARE DEVELOPMENT
The Company capitalizes new product development costs incurred for software to be sold from the point at which technological feasibility has been established through the point at which the product is ready for general availability. Software development costs that are capitalized are evaluated on a product-by-product basis annually and are assigned an estimated economic life based on the type of product, market characteristics, and maturity of the market for that particular product. These costs are amortized based on current and estimated future revenue from the product or on a straight-line basis, whichever yields greater amortization expense. All of this amortization expense is included within components of operating income, primarily cost of revenue.
The Company capitalizes development costs for internal use software beginning at the start of application development. Amortization begins on the date the software is placed in service and the amortization period is based on estimated useful life.
CASH EQUIVALENTS
The Company considers all highly liquid investments with maturities of three months or less at the time of acquisition to be cash equivalents.
ACCOUNTS RECEIVABLE
Receivables are recorded at the time of billing. A reasonable estimate of the realizability of customer receivables is made through the establishment of an allowance for doubtful accounts, which is estimated based on a combination of write-off history, aging analysis, and any specifically known collection issues.
PROPERTY AND EQUIPMENT AND INTANGIBLE ASSETS
Property and equipment is stated at cost and depreciated using the straight-line method over the estimated useful lives of the assets.
Intangible assets consist of goodwill, customer relationships, computer software, and trade names acquired in business acquisitions in addition to internally developed computer software. The amounts are amortized, with the exception of those with an indefinite life (goodwill), over an estimated economic benefit period, generally three to twenty years.
The Company reviews its long-lived assets and identifiable intangible assets with finite lives for impairment whenever events or changes in circumstances have indicated that the carrying amount of its assets might not be recoverable. The Company evaluates goodwill for impairment of value on an annual basis as of January 1 and between annual tests if events or changes in circumstances indicate that the asset might be impaired.
PURCHASE OF INVESTMENT
In the third quarter of fiscal 2018, the Company made an investment totaling
$5,000
for the purchase of preferred stock of Automated Bookkeeping, Inc ("Autobooks"), representing a non-controlling share of the voting equity of Autobooks as of that date. This investment was recorded at cost and is included within other non-current assets on the Company's balance sheet. The fair value of this investment has not been estimated, as estimation is not practicable. There have been no events or changes in circumstances that would indicate an impairment and no price changes resulting from observing a similar or identical investment. An impairment and/or an observable price change would be an adjustment to recorded cost. Fair value will not be estimated unless there are identified events or changes in circumstances that may have a significant adverse effect on the fair value of the investment.
45
COMPREHENSIVE INCOME
Comprehensive income for each of the fiscal years ending
June 30, 2019
,
2018
, and
2017
equals the Company’s net income.
REPORTABLE SEGMENT INFORMATION
In accordance with U.S. GAAP, the Company's operations are classified as
four
reportable segments: Core, Payments, Complementary, and Corporate and Other (see Note 13). Substantially all the Company’s revenues are derived from operations and assets located within the United States of America.
COMMON STOCK
The Board of Directors has authorized the Company to repurchase shares of its common stock. Under this authorization, the Company may finance its share repurchases with available cash reserves or short-term borrowings on its existing credit facilities. The share repurchase program does not include specific price targets or timetables and may be suspended at any time. At
June 30, 2019
, there were
26,508
shares in treasury stock and the Company had the remaining authority to repurchase up to
3,483
additional shares. The total cost of treasury shares at
June 30, 2019
is
$1,110,124
. During fiscal
2019
, the Company repurchased
400
treasury shares for
$54,864
. At
June 30, 2018
, there were
26,108
shares in treasury stock and the Company had authority to repurchase up to
3,883
additional shares.
EARNINGS PER SHARE
Per share information is based on the weighted average number of common shares outstanding during the year. Stock options and restricted stock have been included in the calculation of income per diluted share to the extent they are dilutive. The difference between basic and diluted weighted average shares outstanding is the dilutive effect of outstanding stock options and restricted stock (see Note 10).
INCOME TAXES
Deferred tax liabilities and assets are recognized for the tax effects of differences between the financial statement and tax bases of assets and liabilities. A valuation allowance would be established to reduce deferred tax assets if it is more likely than not that a deferred tax asset will not be realized.
The Company recognizes the tax benefit from an uncertain tax position only if it is more likely than not that the tax position will be sustained on examination by the taxing authorities, based upon the technical merits of the position. The tax benefit recognized in the financial statements from such a position is measured based on the largest benefit that has a greater than 50% likelihood of being realized upon ultimate settlement. Also, interest and penalties expense are recognized on the full amount of deferred benefits for uncertain tax positions. The Company's policy is to include interest and penalties related to unrecognized tax benefits in income tax expense.
RECENT ACCOUNTING PRONOUNCEMENTS
Recently Adopted Accounting Guidance
The Financial Accounting Standards Board (“FASB”) issued ASU No. 2014-09,
Revenue from Contracts with Customers
, in May 2014. This standard (and related amendments collectively referred to as “ASC 606”) is part of an effort to create a common revenue standard for U.S. GAAP and International Financial Reporting Standards (“IFRS”). The new standard has superseded much of the authoritative literature for revenue recognition. The new model enacts a five-step process for achieving the core principle, which is that an entity should recognize revenue to depict the transfer of promised goods or services to customers in an amount that reflects the consideration to which the entity expects to be entitled in exchange for those goods or services. The standard was effective for the Company on July 1, 2018. Entities are allowed to transition to the new standard by either recasting prior periods (full retrospective) or recognizing the cumulative effect as of the beginning of the period of adoption (modified retrospective).
The Company adopted the new standard using the full retrospective transition approach, using certain practical expedients. The Company has not disclosed the amount of transaction price allocated to remaining performance obligations for reporting periods presented before the date of initial application. Also, the Company did not separately consider the effects of contract modifications that occurred before the beginning of the earliest reporting period presented, but reflects the aggregate effect of all modifications that occurred before the beginning of the earliest period presented. As a result, all fiscal 2018 and fiscal 2017 financial information has been adjusted for the effects of applying ASC 606. The details of the significant changes are disclosed below:
46
Software Revenue Recognition
The Company previously recognized software license and related services within the scope of ASC Topic 985-605, which required the establishment of vendor-specific objective evidence (“VSOE”) of fair value in order to separately recognize revenue for each software-related good or service. Due to the inability to establish VSOE, the Company had previously deferred all revenue on software-related goods and services on a master contract until all the goods and services had been delivered. Under ASC 606, VSOE is no longer required for separation of otherwise distinct performance obligations within a revenue arrangement. This change has resulted in earlier recognition of revenue for the Company’s software-related goods and services, leading to a decrease in deferred revenue balances within its adjusted consolidated balance sheets.
Impacts on Financial Statements
The following tables summarize the impacts of ASC 606 adoption on the Company’s Consolidated Financial Statements:
47
Consolidated Balance Sheet as of June 30, 2018:
|
|
As Previously Reported (Adjusted)*
|
Adjustments
|
As Adjusted
|
||||||
|
ASSETS
|
|
|
|||||||
|
CURRENT ASSETS:
|
|
|
|||||||
|
Cash and cash equivalents
|
$
|
31,440
|
|
$
|
—
|
|
$
|
31,440
|
|
|
Receivables, net
|
291,630
|
|
5,641
|
|
297,271
|
|
|||
|
Income tax receivable
|
21,671
|
|
—
|
|
21,671
|
|
|||
|
Prepaid expenses and other*
|
84,738
|
|
11,331
|
|
96,069
|
|
|||
|
Deferred costs*
|
34,907
|
|
(11,916
|
)
|
22,991
|
|
|||
|
Assets held for sale*
|
1,300
|
|
—
|
|
1,300
|
|
|||
|
Total current assets
|
465,686
|
|
5,056
|
|
470,742
|
|
|||
|
PROPERTY AND EQUIPMENT, net*
|
285,550
|
|
—
|
|
285,550
|
|
|||
|
OTHER ASSETS:
|
|||||||||
|
Non-current deferred costs
|
95,540
|
|
(20,675
|
)
|
74,865
|
|
|||
|
Computer software, net of amortization
|
288,172
|
|
—
|
|
288,172
|
|
|||
|
Other non-current assets
|
107,775
|
|
2,524
|
|
110,299
|
|
|||
|
Customer relationships, net of amortization
|
115,034
|
|
—
|
|
115,034
|
|
|||
|
Other intangible assets, net of amortization
|
38,467
|
|
—
|
|
38,467
|
|
|||
|
Goodwill
|
649,929
|
|
—
|
|
649,929
|
|
|||
|
Total other assets
|
1,294,917
|
|
(18,151
|
)
|
1,276,766
|
|
|||
|
Total assets
|
$
|
2,046,153
|
|
$
|
(13,095
|
)
|
$
|
2,033,058
|
|
|
LIABILITIES AND STOCKHOLDERS' EQUITY
|
|||||||||
|
CURRENT LIABILITIES:
|
|||||||||
|
Accounts payable*
|
$
|
30,360
|
|
$
|
—
|
|
$
|
30,360
|
|
|
Accrued expenses
|
97,848
|
|
(9,084
|
)
|
88,764
|
|
|||
|
Deferred revenues
|
355,538
|
|
(26,607
|
)
|
328,931
|
|
|||
|
Total current liabilities
|
483,746
|
|
(35,691
|
)
|
448,055
|
|
|||
|
LONG-TERM LIABILITIES:
|
|||||||||
|
Non-current deferred revenues
|
93,094
|
|
(52,110
|
)
|
40,984
|
|
|||
|
Non-current deferred income tax liability
|
189,613
|
|
18,690
|
|
208,303
|
|
|||
|
Other long-term liabilities
|
12,872
|
|
—
|
|
12,872
|
|
|||
|
Total long-term liabilities
|
295,579
|
|
(33,420
|
)
|
262,159
|
|
|||
|
Total liabilities
|
779,325
|
|
(69,111
|
)
|
710,214
|
|
|||
|
STOCKHOLDERS' EQUITY
|
|||||||||
|
Preferred stock - $1 par value; 500,000 shares authorized, none issued
|
—
|
|
—
|
|
—
|
|
|||
|
Common stock - $0.01 par value; 250,000,000 shares authorized;
103,278,562 shares issued at June 30, 2018 |
1,033
|
|
—
|
|
1,033
|
|
|||
|
Additional paid-in capital
|
464,138
|
|
—
|
|
464,138
|
|
|||
|
Retained earnings
|
1,856,917
|
|
56,016
|
|
1,912,933
|
|
|||
|
Less treasury stock at cost
26,107,903 shares at June 30, 2018 |
(1,055,260
|
)
|
—
|
|
(1,055,260
|
)
|
|||
|
Total stockholders' equity
|
1,266,828
|
|
56,016
|
|
1,322,844
|
|
|||
|
Total liabilities and equity
|
$
|
2,046,153
|
|
$
|
(13,095
|
)
|
$
|
2,033,058
|
|
|
*
Adjusted for reclassifications and corrections not related to ASC 606 adoption. See comments under "Prior Period Reclassification" and "Prior Period Misclassification" headings in this Note 1 to the Consolidated Financial Statements.
|
|||||||||
48
Consolidated Statements of Income for the fiscal years ended ended
June 30, 2018
and
June 30, 2017
:
|
Year Ended June 30, 2018
|
Year Ended June 30, 2017
|
||||||||||||||||||
|
As Previously Reported
|
Adjustments
|
As Adjusted
|
As Previously Reported
|
Adjustments
|
As Adjusted
|
||||||||||||||
|
REVENUE
|
$
|
1,536,603
|
|
$
|
(65,806
|
)
|
$
|
1,470,797
|
|
$
|
1,431,117
|
|
$
|
(42,827
|
)
|
$
|
1,388,290
|
|
|
|
EXPENSES
|
|||||||||||||||||||
|
Cost of Revenue
|
873,642
|
|
(20,504
|
)
|
853,138
|
|
819,034
|
|
(13,179
|
)
|
805,855
|
|
|||||||
|
Research and Development
|
90,340
|
|
—
|
|
90,340
|
|
84,753
|
|
—
|
|
84,753
|
|
|||||||
|
Selling, General, and Administrative
|
182,146
|
|
(10,436
|
)
|
171,710
|
|
162,898
|
|
(3,663
|
)
|
159,235
|
|
|||||||
|
Gain on Disposal of a Business
|
(1,894
|
)
|
—
|
|
(1,894
|
)
|
(3,270
|
)
|
—
|
|
(3,270
|
)
|
|||||||
|
Total Expenses
|
1,144,234
|
|
(30,940
|
)
|
1,113,294
|
|
1,063,415
|
|
(16,842
|
)
|
1,046,573
|
|
|||||||
|
OPERATING INCOME
|
392,369
|
|
(34,866
|
)
|
357,503
|
|
367,702
|
|
(25,985
|
)
|
341,717
|
|
|||||||
|
INTEREST INCOME (EXPENSE)
|
|||||||||||||||||||
|
Interest Income
|
575
|
|
—
|
|
575
|
|
248
|
|
—
|
|
248
|
|
|||||||
|
Interest Expense
|
(1,920
|
)
|
—
|
|
(1,920
|
)
|
(996
|
)
|
—
|
|
(996
|
)
|
|||||||
|
Total Interest Income (Expense)
|
(1,345
|
)
|
—
|
|
(1,345
|
)
|
(748
|
)
|
—
|
|
(748
|
)
|
|||||||
|
INCOME BEFORE INCOME TAXES
|
391,024
|
|
(34,866
|
)
|
356,158
|
|
366,954
|
|
(25,985
|
)
|
340,969
|
|
|||||||
|
PROVISION/ (BENEFIT) FOR INCOME TAXES
|
14,364
|
|
(23,240
|
)
|
(8,876
|
)
|
121,161
|
|
(9,753
|
)
|
111,408
|
|
|||||||
|
NET INCOME
|
$
|
376,660
|
|
$
|
(11,626
|
)
|
$
|
365,034
|
|
$
|
245,793
|
|
$
|
(16,232
|
)
|
$
|
229,561
|
|
|
|
Basic earnings per share
|
$
|
4.88
|
|
$
|
4.73
|
|
$
|
3.16
|
|
$
|
2.95
|
|
|||||||
|
Basic weighted average shares outstanding
|
77,252
|
|
77,252
|
|
77,856
|
|
77,856
|
|
|||||||||||
|
Diluted earnings per share
|
$
|
4.85
|
|
$
|
4.70
|
|
$
|
3.14
|
|
$
|
2.93
|
|
|||||||
|
Diluted weighted average shares outstanding
|
77,585
|
|
77,585
|
|
78,255
|
|
78,255
|
|
|||||||||||
49
Consolidated Statement of Cash Flows for the fiscal years ended
June 30, 2018
and
June 30, 2017
:
|
Year Ended June 30, 2018
|
Year Ended June 30, 2017
|
||||||||||||||||||
|
|
As Previously Reported*
|
Adjustments
|
As Adjusted
|
As Previously Reported
|
Adjustments
|
As Adjusted
|
|||||||||||||
|
CASH FLOWS FROM OPERATING ACTIVITIES:
|
|
|
|||||||||||||||||
|
Net Income
|
$
|
376,660
|
|
$
|
(11,626
|
)
|
$
|
365,034
|
|
$
|
245,793
|
|
$
|
(16,232
|
)
|
$
|
229,561
|
|
|
|
Adjustments to reconcile net income from operations to net cash from operating activities:
|
|||||||||||||||||||
|
Depreciation
|
47,975
|
|
—
|
|
47,975
|
|
49,677
|
|
—
|
|
49,677
|
|
|||||||
|
Amortization
|
104,011
|
|
—
|
|
104,011
|
|
90,109
|
|
—
|
|
90,109
|
|
|||||||
|
Change in deferred income taxes
|
(51,644
|
)
|
(23,240
|
)
|
(74,884
|
)
|
30,940
|
|
(9,753
|
)
|
21,187
|
|
|||||||
|
Expense for stock-based compensation
|
11,758
|
|
—
|
|
11,758
|
|
11,129
|
|
—
|
|
11,129
|
|
|||||||
|
(Gain)/loss on disposal of assets and businesses
|
(954
|
)
|
—
|
|
(954
|
)
|
4,771
|
|
—
|
|
4,771
|
|
|||||||
|
Changes in operating assets and liabilities:
|
|||||||||||||||||||
|
Change in receivables
|
(9,219
|
)
|
30,708
|
|
21,489
|
|
(22,499
|
)
|
(10,597
|
)
|
(33,096
|
)
|
|||||||
|
Change in prepaid expenses, deferred costs and other*
|
(24,304
|
)
|
(58,359
|
)
|
(82,663
|
)
|
(25,088
|
)
|
96
|
|
(24,992
|
)
|
|||||||
|
Change in accounts payable*
|
6,922
|
|
—
|
|
6,922
|
|
(7,812
|
)
|
—
|
|
(7,812
|
)
|
|||||||
|
Change in accrued expenses
|
9,091
|
|
(2,000
|
)
|
7,091
|
|
(4,454
|
)
|
(7,512
|
)
|
(11,966
|
)
|
|||||||
|
Change in income taxes
|
5,108
|
|
—
|
|
5,108
|
|
(6,444
|
)
|
—
|
|
(6,444
|
)
|
|||||||
|
Change in deferred revenues
|
(63,262
|
)
|
64,517
|
|
1,255
|
|
(8,800
|
)
|
43,998
|
|
35,198
|
|
|||||||
|
Net cash from operating activities
|
412,142
|
|
—
|
|
412,142
|
|
357,322
|
|
—
|
|
357,322
|
|
|||||||
|
CASH FLOWS FROM INVESTING ACTIVITIES:
|
|||||||||||||||||||
|
Payment for acquisitions, net of cash acquired
|
(137,562
|
)
|
—
|
|
(137,562
|
)
|
—
|
|
—
|
|
—
|
|
|||||||
|
Capital expenditures
|
(40,135
|
)
|
—
|
|
(40,135
|
)
|
(41,947
|
)
|
—
|
|
(41,947
|
)
|
|||||||
|
Proceeds from the sale of businesses
|
350
|
|
—
|
|
350
|
|
5,632
|
|
—
|
|
5,632
|
|
|||||||
|
Proceeds from the sale of assets
|
306
|
|
—
|
|
306
|
|
968
|
|
—
|
|
968
|
|
|||||||
|
Purchased software
|
(13,138
|
)
|
—
|
|
(13,138
|
)
|
(16,608
|
)
|
—
|
|
(16,608
|
)
|
|||||||
|
Computer software developed
|
(96,647
|
)
|
—
|
|
(96,647
|
)
|
(89,631
|
)
|
—
|
|
(89,631
|
)
|
|||||||
|
Purchase of investments
|
(5,000
|
)
|
—
|
|
(5,000
|
)
|
—
|
|
—
|
|
—
|
|
|||||||
|
Net cash from investing activities
|
(291,826
|
)
|
—
|
|
(291,826
|
)
|
(141,586
|
)
|
—
|
|
(141,586
|
)
|
|||||||
|
CASH FLOWS FROM FINANCING ACTIVITIES:
|
|||||||||||||||||||
|
Borrowings on credit facilities
|
125,000
|
|
—
|
|
125,000
|
|
80,000
|
|
—
|
|
80,000
|
|
|||||||
|
Repayments on credit facilities
|
(175,000
|
)
|
—
|
|
(175,000
|
)
|
(30,200
|
)
|
—
|
|
(30,200
|
)
|
|||||||
|
Purchase of treasury stock
|
(48,986
|
)
|
—
|
|
(48,986
|
)
|
(130,140
|
)
|
—
|
|
(130,140
|
)
|
|||||||
|
Dividends paid
|
(105,021
|
)
|
—
|
|
(105,021
|
)
|
(91,707
|
)
|
—
|
|
(91,707
|
)
|
|||||||
|
Proceeds from issuance of common stock upon exercise of stock options
|
176
|
|
—
|
|
176
|
|
1
|
|
—
|
|
1
|
|
|||||||
|
Tax withholding payments related to share based compensation
|
(7,333
|
)
|
—
|
|
(7,333
|
)
|
(5,480
|
)
|
—
|
|
(5,480
|
)
|
|||||||
|
Proceeds from sale of common stock
|
7,523
|
|
—
|
|
7,523
|
|
6,245
|
|
—
|
|
6,245
|
|
|||||||
|
Net cash from financing activities
|
(203,641
|
)
|
—
|
|
(203,641
|
)
|
(171,281
|
)
|
—
|
|
(171,281
|
)
|
|||||||
|
NET CHANGE IN CASH AND CASH EQUIVALENTS
|
$
|
(83,325
|
)
|
$
|
—
|
|
$
|
(83,325
|
)
|
$
|
44,455
|
|
$
|
—
|
|
$
|
44,455
|
|
|
|
CASH AND CASH EQUIVALENTS, BEGINNING OF PERIOD
|
$
|
114,765
|
|
$
|
—
|
|
$
|
114,765
|
|
$
|
70,310
|
|
$
|
—
|
|
$
|
70,310
|
|
|
|
CASH AND CASH EQUIVALENTS, END OF PERIOD
|
$
|
31,440
|
|
$
|
—
|
|
$
|
31,440
|
|
$
|
114,765
|
|
$
|
—
|
|
$
|
114,765
|
|
|
|
*
Adjusted for reclassifications and corrections not related to ASC 606 adoption. See comments under "Prior Period Reclassification" and "Prior Period Misclassification" headings in this Note 1 to the Consolidated Financial Statements.
|
|||||||||||||||||||
50
ASU 2016-15 issued by the FASB in August 2016 clarifies cash flow classification of eight specific cash flow issues and was effective for the Company's annual reporting period beginning July 1, 2018. The adoption of this standard did not have any impact on its financial statements.
Not Yet Adopted
The FASB issued ASU No. 2016-02, Leases, in February 2016. This ASU aims to increase transparency and comparability among organizations by recognizing lease assets and liabilities on the balance sheet and requiring disclosure of key information regarding leasing arrangements to enable users of financial statements to assess the amount, timing, and uncertainty of cash flows arising from leases. Specifically, the standard requires operating lease commitments to be recorded on the balance sheet as operating lease liabilities and right-of-use assets, and the cost of those operating leases to be amortized on a straight-line basis. ASU No. 2016-02 will be effective for JHA's annual reporting period beginning July 1, 2019. The Company established a cross-functional team to implement this standard and evaluated arrangements that would be subject to the standard, implemented software to meet the reporting and disclosure requirements of the standard, and assessed the impact of the standard on its processes and internal controls. The Company will adopt the new standard using the optional transition method in ASU 2018-11. Under this method, the Company will not adjust its comparative period financial statements for the effects of the new standard or make the new, expanded required disclosures for periods prior to the effective date. The Company will recognize a cumulative-effect adjustment, as necessary, to the opening balance of retained earnings for fiscal 2020 in connection with the adoption of the standard.
The Company will take advantage of the transition package of practical expedients permitted within the new standard, which among other things, allows it to carryforward the historical lease classification. In addition, the Company will make an accounting policy election that will keep leases with an initial term of twelve months or less off of the balance sheet. The Company also elected the practical expedient not to separate the non-lease components of a contract from the lease component to which they relate.
Upon adoption of the standard, the Company will record right-of-use assets of
approximately
$70,000
to
$73,000
and lease obligations of
approximately
$73,000
to
$75,000
on the Company's balance sheet as of July 1, 2019. Adoption of the standard is not expected to significantly impact the Company's net income and is not expected to have a material impact on the Company's compliance with the financial covenants under its credit facility.
In August of 2018, the FASB issued ASU No. 2018-15, Intangibles, Goodwill and Other - Internal-Use Software (Subtopic 350-40), which broadens the scope of Subtopic 350-40 to include costs incurred to implement a hosting arrangement that is a service contract. The costs are capitalized or expensed depending on the nature of the costs and the project stage during which they are incurred, consistent with costs for internal-use software. The amendments in this update can be applied either retrospectively or prospectively to all implementation costs incurred after the date of adoption. The ASU will be effective for the Company on July 1, 2020, with early adoption permitted. The Company is currently evaluating the impact that the guidance will have on its financial statements.
NOTE 2. FAIR VALUE OF FINANCIAL INSTRUMENTS
For cash equivalents, amounts receivable or payable and short-term borrowings, fair values approximate carrying value, based on the short-term nature of the assets and liabilities.
The Company's estimates of the fair value for financial assets and financial liabilities are based on the framework established in the fair value accounting guidance. The framework is based on the inputs used in valuation, gives the highest priority to quoted prices in active markets, and requires that observable inputs be used in the valuations when available. The three levels of the hierarchy are as follows:
Level 1: inputs to the valuation are quoted prices in an active market for identical assets
Level 2: inputs to the valuation include quoted prices for similar assets in active markets that are observable either directly or indirectly
Level 3: valuation is based on significant inputs that are unobservable in the market and the Company's own estimates of assumptions that it believes market participants would use in pricing the asset
51
Fair value of financial assets, included in cash and cash equivalents, and financial liabilities is as follows:
|
Estimated Fair Value Measurements
|
Total Fair
|
|||||||||||||||
|
Recurring Fair Value Measurements
|
Level 1
|
Level 2
|
Level 3
|
Value
|
||||||||||||
|
June 30, 2019
|
|
|
|
|||||||||||||
|
Financial Assets:
|
||||||||||||||||
|
Money market funds
|
$
|
81,945
|
|
$
|
—
|
|
$
|
—
|
|
$
|
81,945
|
|
||||
|
June 30, 2018
|
|
|
|
|
|
|||||||||||
|
Financial Assets:
|
||||||||||||||||
|
Money market funds
|
$
|
14,918
|
|
$
|
—
|
|
$
|
—
|
|
$
|
14,918
|
|
||||
|
Non-Recurring Fair Value Measurements
|
||||||||||||||||
|
June 30, 2019
|
||||||||||||||||
|
Long-lived assets held for sale
|
$
|
—
|
|
$
|
1,300
|
|
$
|
—
|
|
$
|
1,300
|
|
||||
|
June 30, 2018
|
||||||||||||||||
|
Long-lived assets held for sale
(a)
|
$
|
—
|
|
$
|
1,300
|
|
$
|
—
|
|
$
|
1,300
|
|
||||
(a)
In accordance with ASC Subtopic 360-10, long-lived assets held for sale with a carrying value of
$4,575
were written down to their fair value of
$1,300
, resulting in an impairment totaling
$3,275
, which was included in earnings for the fiscal year ended June 30, 2017. The Company has entered into an agreement to sell these assets. That sale is expected to be completed during the second quarter of fiscal 2020.
NOTE 3. PROPERTY AND EQUIPMENT
The classification of property and equipment, together with their estimated useful lives is as follows:
|
|
June 30,
|
|
||||||||
|
|
2019
|
2018
|
Estimated Useful Life
|
|||||||
|
Land
(1)
|
$
|
23,243
|
|
$
|
24,845
|
|
|
|||
|
Land improvements
(1)
|
25,209
|
|
25,383
|
|
5 - 20 years
|
|||||
|
Buildings
(1)
|
147,220
|
|
143,918
|
|
20 - 30 years
|
|||||
|
Leasehold improvements
|
48,478
|
|
48,060
|
|
5 - 30 years
|
(2)
|
||||
|
Equipment and furniture
|
365,101
|
|
328,864
|
|
3 - 10 years
|
|||||
|
Aircraft and equipment
|
39,293
|
|
38,761
|
|
4 - 10 years
|
|||||
|
Construction in progress
|
12,411
|
|
39,872
|
|
|
|||||
|
|
660,955
|
|
649,703
|
|
|
|||||
|
Less accumulated depreciation
|
388,481
|
|
364,153
|
|
|
|||||
|
Property and equipment, net
|
$
|
272,474
|
|
$
|
285,550
|
|
|
|||
(1)
Excludes assets held for sale
(2)
Lesser of lease term or estimated useful life
The change in property and equipment in accrued liabilities was
$14,315
and
$15,674
for the fiscal years ended
June 30, 2019
and
2018
, respectively. These amounts were excluded from capital expenditures on the statements of cash flows.
No
impairments of property and equipment were recorded in fiscal
2019
or
2018
.
During the third quarter of fiscal 2019, the Company received an unsolicited offer to purchase its Houston, TX, facility. At
June 30, 2019
, the facility included assets with a carrying value of approximately
$5,055
. Although management has not committed to the sale, a sale of the facility during fiscal 2020 is likely and the Company expects to record a gain on the sale upon closing, since the offer represents full appraisal value for the facility. Therefore, the assets are considered held for sale at
June 30, 2019
. Also held for sale at
June 30, 2019
, was the Company's Elizabethtown, KY facility. During the third quarter of fiscal 2018, the Company reached a definitive agreement to sell the property for
$1,300
pending an expected closing date during the second quarter of fiscal 2020. An impairment loss was recorded on this facility during fiscal
2017
as disclosed in Note 2 to the Company's
52
consolidated financial statements. Total assets held for sale by the Company at
June 30, 2019
and
2018
were
$6,355
and
$1,300
, respectively, and were included in assets held for sale on the Company's consolidated balance sheet for each year. Those balances are not included on the above table.
NOTE 4. OTHER ASSETS
Goodwill
The carrying amount of goodwill for the fiscal years ended
June 30, 2019
and
2018
, by reportable segments, is as follows:
|
|
June 30,
|
||||||
|
Core
|
2019
|
2018
|
|||||
|
Beginning balance
|
$
|
195,956
|
|
$
|
195,956
|
|
|
|
Goodwill, acquired during the year
|
4,000
|
|
—
|
|
|||
|
Goodwill, adjustments related to dispositions
|
—
|
|
—
|
|
|||
|
Ending balance
|
$
|
199,956
|
|
$
|
195,956
|
|
|
|
Payments
|
|||||||
|
Beginning balance
|
$
|
325,204
|
|
$
|
234,106
|
|
|
|
Goodwill, acquired during the year
|
122
|
|
91,098
|
|
|||
|
Goodwill, adjustments related to dispositions
|
—
|
|
—
|
|
|||
|
Ending balance
|
$
|
325,326
|
|
$
|
325,204
|
|
|
|
Complementary
|
|||||||
|
Beginning balance
|
$
|
128,769
|
|
$
|
122,403
|
|
|
|
Goodwill, acquired during the year
|
12,893
|
|
6,499
|
|
|||
|
Goodwill, adjustments related to dispositions
|
—
|
|
(133
|
)
|
|||
|
Ending balance
|
$
|
141,662
|
|
$
|
128,769
|
|
|
Goodwill acquired during fiscal
2019
totaled
$17,015
,
with
$12,893
of that resulting from the purchase of BOLTS Technologies, Inc.,
$3,999
resulting from the purchase of Agiletics, Inc., and the remainder resulting from a measurement period adjustment on the Ensenta valuation. The goodwill arising from these acquisitions consists largely of the growth potential, synergies and economies of scale expected from combining the operations of the Company with those of BOLTS Technologies and Agiletics, together with the value of their assembled workforces. No goodwill was assigned to the Company's Corporate and Other reportable segment.
Goodwill acquired during fiscal
2018
totaled
$97,597
, with
$91,098
of that resulting from the purchase of Ensenta Corporation, included in the Payments segment. The remaining
$6,499
of goodwill acquired during fiscal
2018
resulted from the purchase of Vanguard Software Group, which was added to the Company's Complementary segment. The goodwill arising from these acquisitions consists largely of the growth potential, synergies and economies of scale expected from combining the operations of the Company with those of Ensenta and Vanguard, together with the value of their assembled workforces. No goodwill was assigned to the Company's Corporate and Other reportable segment.
The Goodwill reduction during fiscal 2018 was a result of the Company's sale of jhaDirect product line in the first quarter. Goodwill allocated to the carrying amount of the net assets sold was calculated based on the relative fair values of the business disposed and the portion of the reporting unit that was retained.
53
Other Intangible Assets
Information regarding other identifiable intangible assets is as follows:
|
|
June 30, 2019
|
||||||||||
|
Gross Carrying Amount
|
Accumulated Amortization
|
Net
|
|||||||||
|
Customer relationships
|
$
|
305,512
|
|
$
|
(204,859
|
)
|
$
|
100,653
|
|
||
|
Computer software
|
$
|
759,671
|
|
$
|
(440,702
|
)
|
$
|
318,969
|
|
||
|
Other intangible assets:
|
$
|
93,471
|
|
$
|
(61,957
|
)
|
$
|
31,514
|
|
||
|
|
June 30, 2018
|
||||||||||
|
Gross Carrying Amount
|
Accumulated Amortization
|
Net
|
|||||||||
|
Customer relationships
|
$
|
302,727
|
|
$
|
(187,693
|
)
|
$
|
115,034
|
|
||
|
Computer software
|
$
|
653,407
|
|
$
|
(365,235
|
)
|
$
|
288,172
|
|
||
|
Other intangible assets:
|
$
|
88,017
|
|
$
|
(49,550
|
)
|
$
|
38,467
|
|
||
Customer relationships have useful lives ranging from
5
to
20
years.
Computer software includes cost of software to be sold, leased, or marketed of
$135,743
and costs of internal-use software of
$183,226
at
June 30, 2019
. At
June 30, 2018
, costs of software to be sold, leased, or marketed totaled
$125,223
, and costs of internal-use software totaled
$162,949
.
Computer software includes the unamortized cost of commercial software products developed or acquired by the Company, which are capitalized and amortized over useful lives generally ranging from
5
to
15
years. Amortization expense for computer software totaled
$82,605
,
$72,859
, and
$60,880
for the fiscal years ended
June 30, 2019
,
2018
, and
2017
, respectively. There were
no
material impairments in any of the fiscal years presented.
The Company's other intangible assets have useful lives ranging from
3
to
20
years.
Amortization expense for all intangible assets was
$113,255
,
$104,011
, and
$90,109
for the fiscal years ended
June 30, 2019
,
2018
, and
2017
, respectively. The estimated aggregate future amortization expense for each of the next five years for all intangible assets remaining as of
June 30, 2019
, is as follows:
|
Years Ending June 30,
|
Computer Software
|
Customer
Relationships
|
Other Intangible Assets
|
Total
|
|||||||||||
|
2020
|
$
|
77,020
|
|
$
|
14,665
|
|
$
|
9,186
|
|
$
|
100,871
|
|
|||
|
2021
|
58,153
|
|
12,409
|
|
6,345
|
|
76,907
|
|
|||||||
|
2022
|
42,981
|
|
11,260
|
|
3,437
|
|
57,678
|
|
|||||||
|
2023
|
27,454
|
|
8,808
|
|
1,963
|
|
38,225
|
|
|||||||
|
2024
|
10,975
|
|
7,547
|
|
1,315
|
|
19,837
|
|
|||||||
NOTE 5. DEBT
The Company had
no
outstanding long-term or short-term debt at
June 30, 2019
or
June 30, 2018
.
Revolving credit facility
The revolving credit facility provides for borrowings of up to
$300,000
, which may be increased by the Company at any time until maturity to
$600,000
. The credit facility bears interest at a variable rate equal to (a) a rate based on LIBOR or (b) an alternate base rate (the highest of (i) the Prime Rate for such day, (ii) the sum of the Federal Funds Effective Rate for such day plus
0.50%
and (iii) the Eurocurrency Rate for a one-month Interest Period on such day for dollars plus
1.0%
), plus an applicable percentage in each case determined by the Company's leverage ratio. The credit facility is guaranteed by certain subsidiaries of the Company. The credit facility is subject to various financial covenants that require the Company to maintain certain financial ratios as defined in the agreement. As of
June 30, 2019
, the Company was in compliance with all such covenants. The revolving loan terminates
February 20, 2020
and at
June 30, 2019
there was
no
outstanding balance. Prior to termination, the Company plans to renew the current credit facility or replace it with a similar credit facility.
54
Other lines of credit
The Company renewed an unsecured bank credit line on
May 1, 2019
which provides for funding of up to
$5,000
and bears interest at the prime rate less
1.0%
. The credit line was renewed through
April 30, 2021
. At
June 30, 2019
,
no
amount was outstanding.
Interest
The Company paid interest of
$691
,
$1,747
, and
$767
during the fiscal years ended
June 30, 2019
,
2018
, and
2017
, respectively.
NOTE 6. COMMITMENTS AND CONTINGENCIES
Property and Equipment
The Company had an estimated
$2,673
and
$2,076
of commitments at
June 30, 2019
and
2018
, respectively, to purchase property and equipment.
Leases
The Company leases certain property under operating leases which expire over the next
11 years
, but certain of the leases contain options to extend the lease term. All lease payments are based on the lapse of time but include, in some cases, payments for operating expenses and property taxes. There are no purchase options on real estate leases at this time. Certain leases on real estate are subject to annual escalations for increases in operating expenses and property taxes.
As of
June 30, 2019
, net future minimum lease payments are as follows:
|
Years Ending June 30,
|
Lease Payments
|
||
|
2020
|
$
|
15,559
|
|
|
2021
|
13,539
|
|
|
|
2022
|
11,860
|
|
|
|
2023
|
10,169
|
|
|
|
2024
|
8,835
|
|
|
|
Thereafter
|
11,671
|
|
|
|
Total
|
$
|
71,633
|
|
Rent expense was
$15,196
,
$10,835
, and
$10,195
in fiscal
2019
,
2018
, and
2017
, respectively.
NOTE 7. INCOME TAXES
The provision/ (benefit) for income taxes consists of the following:
|
|
Year Ended June 30,
|
||||||||||
|
|
2019
|
2018
|
2017
|
||||||||
|
Current:
|
|
|
|
||||||||
|
Federal
|
$
|
54,800
|
|
$
|
56,060
|
|
$
|
80,752
|
|
||
|
State
|
12,946
|
|
9,948
|
|
9,469
|
|
|||||
|
Deferred:
|
|
||||||||||
|
Federal
|
4,177
|
|
(80,509
|
)
|
17,017
|
|
|||||
|
State
|
3,427
|
|
5,625
|
|
4,170
|
|
|||||
|
|
$
|
75,350
|
|
$
|
(8,876
|
)
|
$
|
111,408
|
|
||
55
The tax effects of temporary differences related to deferred taxes shown on the balance sheets were:
|
|
June 30,
|
||||||
|
|
2019
|
2018
|
|||||
|
Deferred tax assets:
|
|
|
|||||
|
Contract and service revenues
|
$
|
13,450
|
|
$
|
—
|
|
|
|
Expense reserves (bad debts, insurance, franchise tax and vacation)
|
14,325
|
|
11,164
|
|
|||
|
Net operating loss and tax credit carryforwards
|
2,713
|
|
2,759
|
|
|||
|
Other, net
|
851
|
|
2,711
|
|
|||
|
Total gross deferred tax assets
|
31,339
|
|
16,634
|
|
|||
|
Valuation allowance
|
(415
|
)
|
(515
|
)
|
|||
|
Net deferred tax assets
|
30,924
|
|
16,119
|
|
|||
|
Deferred tax liabilities:
|
|
|
|||||
|
Accelerated tax depreciation
|
(31,846
|
)
|
(32,026
|
)
|
|||
|
Accelerated tax amortization
|
(154,633
|
)
|
(141,274
|
)
|
|||
|
Contract and service revenues
|
—
|
|
(5,067
|
)
|
|||
|
Contract and service costs
|
(61,455
|
)
|
(46,055
|
)
|
|||
|
Total gross deferred liabilities
|
(247,934
|
)
|
(224,422
|
)
|
|||
|
Net deferred tax liability
|
$
|
(217,010
|
)
|
$
|
(208,303
|
)
|
|
The following analysis reconciles the statutory federal income tax rate to the effective income tax rates reflected above:
|
|
Year Ended June 30,
|
|||||||
|
2019
|
2018
|
2017
|
||||||
|
Computed "expected" tax expense
|
21.0
|
%
|
28.1
|
%
|
35.0
|
%
|
||
|
Increase (reduction) in taxes resulting from:
|
|
|
|
|||||
|
State income taxes, net of federal income tax benefits
|
3.7
|
%
|
2.9
|
%
|
2.6
|
%
|
||
|
Research and development credit
|
(2.5
|
)%
|
(2.0
|
)%
|
(2.1
|
)%
|
||
|
Domestic production activities deduction
|
—
|
%
|
(1.4
|
)%
|
(2.3
|
)%
|
||
|
TCJA deferred tax rate re-measurement
|
—
|
%
|
(30.0
|
)%
|
—
|
%
|
||
|
Tax effects of share-based payments
|
(1.4
|
)%
|
(0.8
|
)%
|
(0.8
|
)%
|
||
|
Other (net)
|
0.9
|
%
|
0.7
|
%
|
0.3
|
%
|
||
|
|
21.7
|
%
|
(2.5
|
)%
|
32.7
|
%
|
||
On December 22, 2017, the Tax Cuts and Jobs Act of 2017 ("TCJA") was enacted into law. The TCJA included numerous provisions that impacted the Company, including reducing the U.S. federal tax rate, eliminating the Domestic Production Activities Deduction, and providing expanded asset expensing. The TCJA reduced the U.S. federal statutory corporate income tax rate from
35%
to
21%
, effective January 1, 2018. For fiscal 2018, a blended U.S. federal statutory tax rate of approximately
28%
applied to the Company.
As of
June 30, 2019
, the Company has
$4,542
of gross federal net operating loss (“NOL”) carryforwards pertaining to the acquisition of Goldleaf Financial Solutions, Inc. and Bolts Technologies, Inc., which are expected to be utilized after the application of IRC Section 382. Separately, as of
June 30, 2019
, the Company has state NOL carryforwards with a tax-effected value of
$651
. The federal and state losses have varying expiration dates, ranging from fiscal
2019 to 2037
. Based on state tax rules which restrict utilization of these losses, the Company believes it is more likely than not that
$415
of these losses will expire unutilized. Accordingly, a valuation allowance of
$415
and
$515
has been recorded against the state net operating losses as of
June 30, 2019
and
2018
, respectively.
The Company paid income taxes, net of refunds, of
$62,005
,
$60,382
, and
$96,074
in fiscal
2019
,
2018
, and
2017
, respectively.
At
June 30, 2019
, the Company had
$10,495
of gross unrecognized tax benefits,
$9,892
of which, if recognized, would affect its effective tax rate. At
June 30, 2018
, the Company had
$10,227
of unrecognized tax benefits,
$9,366
of which, if recognized, would affect its effective tax rate. The Company had accrued interest and penalties of
$1,514
and
$1,279
related to uncertain tax positions at
June 30, 2019
and
2018
, respectively. The income tax provision included interest
56
expense and penalties (or benefits) on unrecognized tax benefits of
$128
,
$165
, and
$(105)
in the fiscal years ended
June 30, 2019
,
2018
, and
2017
, respectively.
A reconciliation of the unrecognized tax benefits for the fiscal years ended
June 30, 2019
and
2018
follows:
|
|
Unrecognized Tax Benefits
|
||
|
Balance at July 1, 2017
|
$
|
5,449
|
|
|
Additions for current year tax positions
|
2,157
|
|
|
|
Reductions for current year tax positions
|
—
|
|
|
|
Additions for prior year tax positions
|
3,130
|
|
|
|
Reductions for prior year tax positions
|
(55
|
)
|
|
|
Additions related to business combinations
|
510
|
|
|
|
Settlements
|
(161
|
)
|
|
|
Reductions related to expirations of statute of limitations
|
(803
|
)
|
|
|
Balance at June 30, 2018
|
10,227
|
|
|
|
Additions for current year tax positions
|
1,135
|
|
|
|
Reductions for current year tax positions
|
(40
|
)
|
|
|
Additions for prior year tax positions
|
562
|
|
|
|
Reductions for prior year tax positions
|
(531
|
)
|
|
|
Additions related to business combinations
|
43
|
|
|
|
Settlements
|
(25
|
)
|
|
|
Reductions related to expirations of statute of limitations
|
(876
|
)
|
|
|
Balance at June 30, 2019
|
$
|
10,495
|
|
The U.S. federal and state income tax returns for fiscal
2016
and all subsequent years remain subject to examination as of
June 30, 2019
under statute of limitations rules. The Company anticipates that potential changes due to lapsing statutes of limitations and examination closures could reduce the unrecognized tax benefits balance by
$3,000
-
$4,000
within twelve months of
June 30, 2019
.
NOTE 8. INDUSTRY AND SUPPLIER CONCENTRATIONS
The Company sells its products to banks, credit unions, and financial institutions throughout the United States and generally does not require collateral. All billings to customers are due 30 days from date of billing. Reserves (which are insignificant at June 30, 2019 and 2018) are maintained for potential credit losses. Customer-related risks are moderated through the inclusion of credit mitigation clauses in the Company's contracts and through the monitoring of timely payments.
In addition, some of the Company’s key solutions are dependent on technology manufactured by IBM Corporation and Microsoft. Termination of the Company’s relationship with either IBM or Microsoft could have a negative impact on the operations of the Company.
NOTE 9. STOCK-BASED COMPENSATION
The Company's pre-tax operating income for the fiscal years ended
June 30, 2019
,
2018
, and
2017
includes
$12,589
,
$11,758
, and
$11,129
of equity-based compensation costs, respectively, of which
$10,828
,
$10,256
, and
$9,861
relates to the restricted stock plans, respectively. Costs are recorded net of estimated forfeitures. The income tax benefits from stock option exercises and restricted stock vests totaled
$6,191
,
$3,274
, and
$2,638
for the fiscal years ended
June 30, 2019
,
2018
, and
2017
, respectively.
57
2015 Equity Incentive Plan and 2005 Non-Qualified Stock Option Plan
On
November 10, 2015
, the Company adopted the 2015 Equity Incentive Plan ("2015 EIP") for its employees and non-employee directors. The plan allows for grants of stock options, stock appreciation rights, restricted stock shares or units, and performance shares or units. The maximum number of shares authorized for issuance under the plan is
3,000
. For stock options, terms and vesting periods of the options were determined by the Compensation Committee of the Board of Directors when granted. The option period must expire not more than ten years from the options grant date. The options granted under this plan are exercisable beginning
three years
after grant at an exercise price equal to 100% of the fair market value of the stock at the grant date. The options terminate upon surrender of the option,
ninety days
after termination of employment, upon the expiration of
one year
following notification of a deceased optionee, or
10 years
after grant.
The Company previously issued options to outside directors under the 2005 Non-Qualified Stock Option Plan (“2005 NSOP”). No additional stock options may be issued under this plan.
The 2005 NSOP was adopted by the Company on
September 23, 2005
, for its outside directors. Generally, options were exercisable beginning
6 months
after grant at an exercise price equal to the fair market value of the stock at the grant date. For individuals who have served less than
four
continuous years,
25%
of all options will vest after one year of service,
50%
shall vest after two years, and
75%
shall vest after three years of service on the Board. The options terminate upon surrender of the option, upon the expiration of
one year
following notification of a deceased optionee, or
10 years
after grant.
700
shares of common stock were reserved for issuance under this plan with a maximum of
100
for each director.
A summary of option plan activity under the plans is as follows:
|
|
Number of Shares
|
Weighted Average Exercise Price
|
Aggregate
Intrinsic
Value
|
|||||||
|
Outstanding July 1, 2016
|
50
|
|
$
|
22.14
|
|
|||||
|
Granted
|
32
|
|
87.27
|
|
||||||
|
Forfeited
|
—
|
|
—
|
|
||||||
|
Exercised
|
(10
|
)
|
28.52
|
|
||||||
|
Outstanding July 1, 2017
|
72
|
|
50.04
|
|
||||||
|
Granted
|
—
|
|
—
|
|
||||||
|
Forfeited
|
—
|
|
—
|
|
||||||
|
Exercised
|
(20
|
)
|
17.45
|
|
||||||
|
Outstanding July 1, 2018
|
52
|
|
62.65
|
|
|
|||||
|
Granted
|
—
|
|
—
|
|
|
|||||
|
Forfeited
|
—
|
|
—
|
|
|
|||||
|
Exercised
|
(20
|
)
|
23.65
|
|
|
|||||
|
Outstanding June 30, 2019
|
32
|
|
$
|
87.27
|
|
$
|
1,478
|
|
||
|
Vested and Expected to Vest June 30, 2019
|
32
|
|
$
|
87.27
|
|
$
|
1,478
|
|
||
|
Exercisable June 30, 2019
|
—
|
|
$
|
—
|
|
$
|
—
|
|
||
There were
no
options granted in fiscal
2019
,
no
options granted during fiscal
2018
, and
32
options granted during fiscal
2017
. The weighted-average fair value at the grant date of options granted during fiscal
2017
was
$15.78
.
The Company utilized a Black-Scholes option pricing model to estimate fair value of the stock option grants at the grant date. All
32
options granted during fiscal
2017
were granted on
July 1, 2016
. Assumptions such as expected life, volatility, risk-free interest rate, and dividend yield impact the fair value estimate. These assumptions are subjective and generally require significant analysis and judgment to develop. The risk-free interest rate used in the Company's estimate was determined from external data, while volatility, expected life, and dividend yield assumptions were derived from its historical experience with share-based payment arrangements. The appropriate weight to place on historical experience is a matter of judgment, based on relevant facts and circumstances. The assumptions used in estimating fair value and resulting compensation expenses at the grant dates are as follows:
58
|
Expected Life (years)
|
6.50 years
|
|
|
Volatility
|
19.60
|
%
|
|
Risk-free interest rate
|
1.24
|
%
|
|
Dividend yield
|
1.28
|
%
|
At
June 30, 2019
, there was
no
compensation cost yet to be recognized related to outstanding options.
The total intrinsic value of options exercised was
$2,289
,
$2,165
, and
$747
for the fiscal years ended
June 30, 2019
,
2018
, and
2017
, respectively.
Restricted Stock Plan and 2015 Equity Incentive Plan
The Restricted Stock Plan was adopted by the Company on
November 1, 2005
, for its employees. The plan expired on
November 1, 2015
. Up to
3,000
shares of common stock were available for issuance under the plan. The 2015 EIP was adopted by the Company on
November 10, 2015
for its employees. Up to
3,000
shares of common stock are available for issuance under the 2015 Equity Incentive Plan. Upon issuance, shares of restricted stock are subject to forfeiture and to restrictions which limit the sale or transfer of the shares during the restriction period. The restrictions are lifted over periods ranging from
3 years
to
5 years
from grant date.
The following table summarizes non-vested share awards activity:
|
Share awards
|
Shares
|
Weighted
Average
Grant Date
Fair Value
|
||||
|
Outstanding July 1, 2016
|
58
|
|
$
|
44.95
|
|
|
|
Granted
|
17
|
|
87.27
|
|
||
|
Vested
|
(38
|
)
|
37.00
|
|
||
|
Forfeited
|
(1
|
)
|
65.52
|
|
||
|
Outstanding July 1, 2017
|
36
|
|
73.66
|
|
||
|
Granted
|
—
|
|
—
|
|
||
|
Vested
|
(12
|
)
|
58.61
|
|
||
|
Forfeited
|
(1
|
)
|
64.60
|
|
||
|
Outstanding July 1, 2018
|
23
|
|
81.33
|
|
||
|
Granted
|
—
|
|
—
|
|
||
|
Vested
|
(17
|
)
|
79.41
|
|
||
|
Forfeited
|
—
|
|
—
|
|
||
|
Outstanding June 30, 2019
|
6
|
|
$
|
87.27
|
|
|
The non-vested share awards granted prior to July 1, 2016 do not participate in dividends during the restriction period. As a result, the weighted-average fair value of the non-vested share awards was based on the fair market value of the Company’s equity shares on the grant date, less the present value of the expected future dividends to be declared during the restriction period, consistent with the methodology for calculating compensation expense on such awards. The non-vested share awards granted during the fiscal year ended
June 30, 2017
do participate in dividends during the restriction period. The weighted-average fair value of such participating awards was based on the fair market value on the grant date.
At
June 30, 2019
, there was
no
compensation expense yet to be recognized related to non-vested restricted stock share awards.
An amendment to the Restricted Stock Plan was adopted by the Company on
August 20, 2010
. Unit awards were made to employees remaining in continuous employment throughout the performance period and vary based on the Company’s percentile ranking in Total Shareholder Return (“TSR”) over the performance period compared to a peer group of companies. TSR is defined as the change in the stock price through the performance period plus dividends per share paid during the performance period, all divided by the stock price at the beginning of the performance period. It is the intention of the Company to settle the unit awards in shares of the Company’s stock. Certain Restricted Stock Unit awards are not tied to performance goals, and for such awards, vesting occurs over a period of
1
to
3
years.
59
The following table summarizes non-vested unit awards as of
June 30, 2019
, as well as activity for the fiscal year then ended:
|
Unit awards
|
Shares
|
Weighted
Average
Grant Date
Fair Value
|
Aggregate
Intrinsic Value |
|||||
|
Outstanding July 1, 2016
|
429
|
|
$
|
58.06
|
|
|||
|
Granted
|
130
|
|
77.75
|
|
||||
|
Vested
|
(136
|
)
|
50.12
|
|
||||
|
Forfeited
|
(37
|
)
|
54.30
|
|
||||
|
Outstanding July 1, 2017
|
386
|
|
67.84
|
|
||||
|
Granted
|
125
|
|
98.41
|
|
||||
|
Vested
|
(156
|
)
|
57.00
|
|
||||
|
Forfeited
|
(4
|
)
|
81.83
|
|
||||
|
Outstanding July 1, 2018
|
351
|
|
83.37
|
|
||||
|
Granted
|
80
|
|
169.53
|
|
||||
|
Vested
|
(129
|
)
|
82.06
|
|
||||
|
Forfeited
|
(4
|
)
|
92.32
|
|
||||
|
Outstanding June 30, 2019
|
298
|
|
$107.00
|
$39,867
|
||||
The Company utilized a Monte Carlo pricing model customized to the specific provisions of the Company’s plan design to value unit awards subject to performance targets on the grant dates. The weighted average assumptions used in this model to estimate fair value at the grant dates are as follows:
|
Year Ended June 30,
|
||||||||
|
2019
|
|
2018
|
|
2017
|
|
|||
|
Volatility
|
15.3
|
%
|
15.6
|
%
|
16.0
|
%
|
||
|
Risk free interest rate
|
2.89
|
%
|
1.55
|
%
|
0.93
|
%
|
||
|
Dividend yield
|
0.9
|
%
|
1.2
|
%
|
1.3
|
%
|
||
|
Stock Beta
|
0.669
|
|
0.687
|
|
0.684
|
|
||
For the fiscal year ended
June 30, 2019
,
39
unit awards were granted and measured using the above assumptions. The remaining
41
unit awards granted are not subject to performance targets, and therefore the estimated fair value at measurement date is valued in the same manner as restricted stock award grants.
At
June 30, 2019
, there was
$13,444
of compensation expense that has yet to be recognized related to non-vested restricted stock unit awards, which will be recognized over a weighted-average period of
1.04 years
.
The fair value of restricted shares and units at vest date totaled
$34,645
,
$17,951
, and
$15,085
for the fiscal years ended
June 30, 2019
,
2018
, and
2017
, respectively.
60
NOTE 10. EARNINGS PER SHARE
The following table reflects the reconciliation between basic and diluted earnings per share.
|
Year Ended June 30,
|
|||||||||||
|
|
2019
|
2018
|
2017
|
||||||||
|
Net Income
|
$
|
271,885
|
|
$
|
365,034
|
|
$
|
229,561
|
|
||
|
Common share information:
|
|||||||||||
|
Weighted average shares outstanding for basic earnings per share
|
77,160
|
|
77,252
|
|
77,856
|
|
|||||
|
Dilutive effect of stock options and restricted stock
|
187
|
|
333
|
|
399
|
|
|||||
|
Weighted average shares outstanding for diluted earnings per share
|
77,347
|
|
77,585
|
|
78,255
|
|
|||||
|
Basic earnings per share
|
$
|
3.52
|
|
$
|
4.73
|
|
$
|
2.95
|
|
||
|
Diluted earnings per share
|
$
|
3.52
|
|
$
|
4.70
|
|
$
|
2.93
|
|
||
Per share information is based on the weighted average number of common shares outstanding for each of the fiscal years. Stock options and restricted stock have been included in the calculation of earnings per share to the extent they are dilutive. The two-class method for computing EPS has not been applied because no outstanding awards contain non-forfeitable rights to participate in dividends. There were
no
anti-dilutive stock options and restricted stock excluded for fiscal
2019
,
41
shares excluded for fiscal
2018
, and
32
shares excluded for fiscal
2017
.
NOTE 11. EMPLOYEE BENEFIT PLANS
The Company established an employee stock purchase plan in
2006
. The plan allows the majority of employees the opportunity to directly purchase shares of the Company at
85%
of the closing price of the Company's stock on or around the fifteenth day of each month. During the fiscal years ended
June 30, 2019
,
2018
and
2017
, employees purchased
76
,
76
, and
81
shares under this plan at average prices of
$118.32
,
$98.46
, and
$77.52
, respectively. As of
June 30, 2019
, approximately
1,304
shares remained available for future issuance under the plan. The plan does not meet the criteria as a non-compensatory plan. As a result, the Company records the total dollar value of the stock discount given to employees under the plan as expense.
The Company has a defined contribution plan for its employees: the 401(k) Retirement Savings Plan (the “Plan”). The Plan is subject to the Employee Retirement Income Security Act of 1975 (“ERISA”) as amended. Under the Plan, the Company matches
100%
of full time employee contributions up to
5%
of eligible compensation. Prior to January 1, 2019, the Company match was subject to a maximum of
$5
per year. On January 1, 2019, the maximum limit was removed. In order to receive matching contributions, employees must be
18
years of age and be employed for at least
six months
. The Company has the option of making a discretionary contribution; however,
none
has been made for any of the three most recent fiscal years. The total matching contributions for the Plan were
$21,003
,
$18,821
, and
$17,550
for fiscal
2019
,
2018
and
2017
, respectively.
61
NOTE 12. BUSINESS ACQUISITIONS
BOLTS Technologies, Inc
On
October 5, 2018
, the Company acquired all of the equity interest of BOLTS Technologies, Inc. for
$15,046
paid in cash. The acquisition was funded by cash generated from operations. BOLTS Technologies is the developer of boltsOPEN, a digital account opening solution.
Management has completed a purchase price allocation and its assessment of the fair value of acquired assets and liabilities assumed. The recognized amounts of identifiable assets acquired and liabilities assumed, based on their fair values as of
October 5, 2018
are set forth below:
|
Current assets
|
$
|
1,384
|
|
|
Identifiable intangible assets
|
2,274
|
|
|
|
Total other liabilities assumed
|
(1,505
|
)
|
|
|
Total identifiable net assets
|
2,153
|
|
|
|
Goodwill
|
12,893
|
|
|
|
Net assets acquired
|
$
|
15,046
|
|
The amounts shown above include measurement period adjustments made during fiscal
2019
related to income taxes.
The goodwill of
$12,893
arising from this acquisition consists largely of the growth potential, synergies and economies of scale expected from combining the operations of the Company with those of BOLTS, together with the value of BOLTS' assembled workforce. The goodwill from this acquisition has been allocated to the Company's Complementary segment and is not deductible for income tax purposes.
Identifiable intangible assets from this acquisition consist of customer relationships of
$567
, computer software of
$1,409
, and other intangible assets of
$298
. The weighted average amortization period for acquired customer relationships, computer software, and other intangible assets is
15 years
,
10 years
, and
10 years
, respectively.
Current assets were inclusive of cash acquired of
$1,365
. The fair value of current assets acquired included accounts receivable of
$14
,
none
of which were expected to be uncollectible.
Costs incurred related to the acquisition of BOLTS in fiscal
2019
totaled
$23
for legal, valuation, and other fees, and were expensed as incurred within selling, general, and administrative expense.
For the fiscal
year ended
June 30, 2019
, the Company's consolidated statements of income included revenue of
$126
and after-tax net loss of
$895
resulting from BOLTS' operations.
The accompanying consolidated statements of income for the fiscal years ended
June 30, 2019
and
2018
do not include any revenues and expenses related to this acquisition prior to the acquisition date. The impact of this acquisition was considered immaterial to both the current and prior periods of the Company's consolidated financial statements and, accordingly, pro forma financial information has not been provided.
Agiletics, Inc.
On
October 1, 2018
, the Company acquired all of the equity interest of Agiletics, Inc. for
$7,649
paid in cash. The acquisition was funded by cash generated from operations. Agiletics is a provider of escrow, investment, and liquidity management solutions for banks serving commercial customers.
Management has completed a purchase price allocation and its assessment of the fair value of acquired assets and liabilities assumed. The recognized amounts of identifiable assets acquired and liabilities assumed, based on their fair values as of
October 1, 2018
are set forth below:
|
Current assets
|
$
|
2,170
|
|
|
Identifiable intangible assets
|
3,090
|
|
|
|
Non-current deferred income tax liability
|
(872
|
)
|
|
|
Total other liabilities assumed
|
(738
|
)
|
|
|
Total identifiable net assets
|
3,650
|
|
|
|
Goodwill
|
3,999
|
|
|
|
Net assets acquired
|
$
|
7,649
|
|
The amounts shown above include measurement period adjustments made during fiscal
2019
related to income taxes.
62
The goodwill of
$3,999
arising from this acquisition consists largely of the growth potential, synergies and economies of scale expected from combining the operations of the Company with those of Agiletics. The goodwill from this acquisition has been allocated to the Company's Core segment and is not deductible for income tax purposes.
Identifiable intangible assets from this acquisition consist of customer relationships of
$2,198
, computer software of
$701
, and other intangible assets of
$191
. The weighted average amortization period for acquired customer relationships, computer software, and other intangible assets is
15 years
,
10 years
, and
10 years
, respectively.
Current assets were inclusive of cash acquired of
$1,349
. The fair value of current assets acquired included accounts receivable of
$302
,
none
of which were expected to be uncollectible.
Costs incurred related to the acquisition of Agiletics in fiscal
2019
totaled
$36
for legal, valuation, and other fees, and were expensed as incurred within selling, general, and administrative expense.
For the fiscal
year ended
June 30, 2019
, the Company's consolidated statements of income included revenue of
$926
and after-tax net loss of
$192
resulting from Agiletics' operations.
The accompanying consolidated statements of income for the fiscal years ended
June 30, 2019
and
2018
do not include any revenues and expenses related to this acquisition prior to the acquisition date. The impact of this acquisition was considered immaterial to both the current and prior periods of the Company's consolidated financial statements and, accordingly, pro forma financial information has not been provided.
Ensenta Corporation
On
December 21, 2017
, the Company acquired all of the equity interest of EST Holdings, Inc. and its wholly-owned subsidiary, EST Interco, Inc., for
$134,381
paid in cash. EST Holdings, Inc. and EST Interco, Inc. jointly own all of the outstanding equity of Ensenta Corporation ("Ensenta"), a California-based provider of real-time, cloud-based solutions for mobile and online payments and deposits. This acquisition was partially funded by a draw on the Company's revolving credit facility, with the remaining amount funded by existing operating cash. The addition of Ensenta Corporation to the JHA Payment Solutions Group expands the Company’s ability to conduct real-time transactions with third-party platforms, extending its presence in the credit union market through shared branching technology.
Management has completed a purchase price allocation of Ensenta and its assessment of the fair value of acquired assets and liabilities assumed. The recognized amounts of identifiable assets acquired and liabilities assumed, based upon their fair values as of
December 21, 2017
are set forth below:
|
Current assets
|
$
|
14,125
|
|
|
Long-term assets
|
586
|
|
|
|
Identifiable intangible assets
|
58,806
|
|
|
|
Non-current deferred income tax liability
|
(21,859
|
)
|
|
|
Total other liabilities assumed
|
(8,496
|
)
|
|
|
Total identifiable net assets
|
43,162
|
|
|
|
Goodwill
|
91,219
|
|
|
|
Net assets acquired
|
$
|
134,381
|
|
The amounts shown above include measurement period adjustments made during the third and fourth quarters of fiscal
2018
, and the second quarter of fiscal
2019
, related to income tax adjustments and a fair value assessment.
The goodwill of
$91,219
arising from this acquisition consists largely of the growth potential, synergies and economies of scale expected from combining the operations of the Company with those of Ensenta, together with the value of Ensenta's assembled workforce. The goodwill from this acquisition has been allocated to the Company's Payments segment and is not expected to be deductible for income tax purposes.
Identifiable intangible assets from this acquisition consist of customer relationships of
$37,800
, computer software of
$16,505
, and other intangible assets of
$4,501
. The weighted average amortization period for acquired customer relationships, computer software, and other intangible assets is
15 years
,
10 years
, and
10 years
, respectively.
Current assets were inclusive of cash acquired of
$7,274
. The fair value of current assets acquired included accounts receivable of
$4,668
,
none
of which were expected to be uncollectible.
Costs incurred related to the acquisition of Ensenta in fiscal
2018
totaled
$339
for legal, valuation, and other fees, and were expensed as incurred within selling, general, and administrative expense.
For the fiscal
year ended
June 30, 2019
, the Company's consolidated statements of income included revenue of
$35,688
and after-tax net income of
$11,163
.
For the fiscal
year ended
June 30, 2018
, Ensenta contributed revenue
63
of
$15,776
and after-tax net income of
$8,197
. The after-tax net income for the fiscal
year ended
June 30, 2018
included a large tax benefit recorded as a result of the TCJA. Excluding that benefit, the Company's after tax net income resulting from Ensenta's operations totaled
$536
.
The accompanying consolidated statements of income for the fiscal
year ended
June 30, 2019
do not include any revenues and expenses related to this acquisition prior to the acquisition date. The following unaudited pro forma consolidated financial information is presented as if this acquisition had occurred at the beginning of the prior period presented. In addition, this unaudited pro forma financial information is provided for illustrative purposes only and should not be relied upon as necessarily being indicative of the historical results that would have been obtained if the acquisition had actually occurred during this period, or the results that may be obtained in the future as a result of the acquisition.
|
Year Ended
|
|||||||||||
|
|
June 30,
|
||||||||||
|
|
2019
|
2018
|
2017
|
||||||||
|
Actuals
|
Proforma
|
Proforma
|
|||||||||
|
Revenue
|
$
|
1,552,691
|
|
$
|
1,483,915
|
|
$
|
1,411,873
|
|
||
|
Net Income
|
271,885
|
|
366,544
|
|
231,696
|
|
|||||
|
Basic Earnings Per Share
|
$
|
3.52
|
|
$
|
4.74
|
|
$
|
2.98
|
|
||
|
Diluted Earnings Per Share
|
$
|
3.52
|
|
$
|
4.72
|
|
$
|
2.96
|
|
||
Vanguard Software Group
On
August 31, 2017
, the Company acquired all of the equity interest of Vanguard Software Group, a Florida-based company specializing in the underwriting, spreading, and online decisioning of commercial loans, for
$10,744
paid in cash. This acquisition was funded using existing operating cash. The addition of Vanguard Software Group to the Company's ProfitStars® Lending Solutions Group expands functionality offered to clients, allowing for near-real-time communication with JHA's core processing and ancillary solutions, and also enhances cross-sell opportunities.
Management has completed a purchase price allocation of Vanguard Software Group and its assessment of the fair value of acquired assets and liabilities assumed. The recognized amounts of identifiable assets acquired and liabilities assumed, based upon their fair values as of
August 31, 2017
are set forth below:
|
Current assets
|
$
|
1,153
|
|
|
Long-term assets
|
9
|
|
|
|
Identifiable intangible assets
|
4,200
|
|
|
|
Total liabilities assumed
|
(1,117
|
)
|
|
|
Total identifiable net assets
|
4,245
|
|
|
|
Goodwill
|
6,499
|
|
|
|
Net assets acquired
|
$
|
10,744
|
|
The goodwill of
$6,499
arising from this acquisition consists largely of the growth potential, synergies and economies of scale expected from combining the operations of the Company with those of Vanguard Software Group, together with the value of Vanguard Software Group's assembled workforce. The goodwill from this acquisition has been allocated to the Company's Complementary segment and is expected to be deductible for income tax purposes.
Identifiable intangible assets from this acquisition consist of customer relationships of
$2,234
, computer software of
$1,426
, and other intangible assets of
$540
. The weighted average amortization periods for acquired customer relationships, computer software, and other intangible assets are
15 years
,
10 years
, and
10 years
, respectively.
Current assets were inclusive of cash acquired of
$289
. The fair value of current assets acquired included accounts receivable of
$847
,
none
of which were expected to be uncollectible.
Costs incurred related to the acquisition of Vanguard Software Group were immaterial for the periods presented.
For the fiscal
year ended
June 30, 2019
, the Company's consolidated statements of income included revenue of
$3,120
and after-tax net loss of
$243
. For the fiscal year ended
June 30, 2018
, Vanguard contributed revenue of
$1,486
and after-tax net loss of
$870
.
The accompanying consolidated statements of income for the fiscal
year ended
June 30, 2019
do not include any revenues and expenses related to this acquisition prior to the acquisition date. The impact of this acquisition was
64
considered immaterial to both the current and prior periods of the Company's consolidated financial statements and, accordingly, pro forma financial information has not been provided.
NOTE 13. REPORTABLE SEGMENT INFORMATION
The Company is a leading provider of technology solutions and payment processing services primarily for financial services organizations.
Beginning in the first quarter of fiscal 2018, JHA changed its reportable segment structure from two customer-centric segments, Bank and Credit Union, to four product-centric segments. The change was made based on the view of its Chief Executive Officer, who is also the Chief Operating Decision Maker, that the Company could be more effectively managed using a product-centric approach and was driven by the first budgetary process under his administration.
The Company’s operations are classified into
four
reportable segments: Core, Payments, Complementary, and Corporate and Other. The Core segment provides core information processing platforms to banks and credit unions, which consist of integrated applications required to process deposit, loan, and general ledger transactions, and maintain centralized customer/member information. The Payments segment provides secure payment processing tools and services, including ATM, debit, and credit card processing services, online and mobile bill pay solutions, and risk management products and services. The Complementary segment provides additional software and services that can be integrated with the Company's core solutions or used independently. The Corporate & Other segment includes revenue and costs from hardware and other products not attributable to the other three segments, as well as operating costs not directly attributable to the other three segments.
The Company evaluates the performance of its segments and allocates resources to them based on various factors, including performance against trend, budget, and forecast. Only revenue and costs of revenue are considered in the evaluation for each segment.
An immaterial adjustment was made to reclassify revenue recognized in fiscal 2018 from the Core to the Corporate and Other Segment. For the
fiscal year ended
June 30, 2018
, the amount reclassified totaled
$2,968
.
|
Year Ended
|
|||||||||||||||||||
|
June 30, 2019
|
|||||||||||||||||||
|
Core
|
Payments
|
Complementary
|
Corporate & Other
|
Total
|
|||||||||||||||
|
REVENUE
|
|||||||||||||||||||
|
Services and Support
|
$
|
506,007
|
|
$
|
52,756
|
|
$
|
348,631
|
|
$
|
51,095
|
|
$
|
958,489
|
|
||||
|
Processing
|
28,422
|
|
495,563
|
|
69,584
|
|
633
|
|
594,202
|
|
|||||||||
|
Total Revenue
|
534,429
|
|
548,319
|
|
418,215
|
|
51,728
|
|
1,552,691
|
|
|||||||||
|
|
|||||||||||||||||||
|
Cost of Revenue
|
243,989
|
|
273,261
|
|
175,737
|
|
230,043
|
|
923,030
|
|
|||||||||
|
Research and Development
|
96,378
|
|
|||||||||||||||||
|
Selling, General, and Administrative
|
185,998
|
|
|||||||||||||||||
|
Gain on Disposal of Businesses
|
—
|
|
|||||||||||||||||
|
Total Expenses
|
1,205,406
|
|
|||||||||||||||||
|
SEGMENT INCOME
|
$
|
290,440
|
|
$
|
275,058
|
|
$
|
242,478
|
|
$
|
(178,315
|
)
|
|||||||
|
OPERATING INCOME
|
347,285
|
|
|||||||||||||||||
|
INTEREST INCOME (EXPENSE)
|
(50
|
)
|
|||||||||||||||||
|
INCOME BEFORE INCOME TAXES
|
$
|
347,235
|
|
||||||||||||||||
65
|
Year Ended
|
|||||||||||||||||||
|
June 30, 2018
|
|||||||||||||||||||
|
Core
|
Payments
|
Complementary
|
Corporate & Other
|
Total
|
|||||||||||||||
|
REVENUE
|
|||||||||||||||||||
|
Services and Support
|
$
|
482,216
|
|
$
|
47,641
|
|
$
|
333,812
|
|
$
|
57,070
|
|
$
|
920,739
|
|
||||
|
Processing
|
27,605
|
|
460,690
|
|
61,607
|
|
156
|
|
550,058
|
|
|||||||||
|
Total Revenue
|
509,821
|
|
508,331
|
|
395,419
|
|
57,226
|
|
1,470,797
|
|
|||||||||
|
Cost of Revenue
|
232,868
|
|
245,269
|
|
163,905
|
|
211,096
|
|
853,138
|
|
|||||||||
|
Research and Development
|
90,340
|
|
|||||||||||||||||
|
Selling, General, and Administrative
|
171,710
|
|
|||||||||||||||||
|
Gain on Disposal of Businesses
|
(1,894
|
)
|
|||||||||||||||||
|
Total Expenses
|
1,113,294
|
|
|||||||||||||||||
|
SEGMENT INCOME
|
$
|
276,953
|
|
$
|
263,062
|
|
$
|
231,514
|
|
$
|
(153,870
|
)
|
|||||||
|
OPERATING INCOME
|
357,503
|
|
|||||||||||||||||
|
INTEREST INCOME (EXPENSE)
|
(1,345
|
)
|
|||||||||||||||||
|
INCOME BEFORE INCOME TAXES
|
$
|
356,158
|
|
||||||||||||||||
|
Year Ended
|
|||||||||||||||||||
|
June 30, 2017
|
|||||||||||||||||||
|
Core
|
Payments
|
Complementary
|
Corporate & Other
|
Total
|
|||||||||||||||
|
REVENUE
|
|||||||||||||||||||
|
Services and Support
|
$
|
452,712
|
|
$
|
43,477
|
|
$
|
322,784
|
|
$
|
62,762
|
|
$
|
881,735
|
|
||||
|
Processing
|
24,893
|
|
428,511
|
|
53,027
|
|
124
|
|
506,555
|
|
|||||||||
|
Total Revenue
|
477,605
|
|
471,988
|
|
375,811
|
|
62,886
|
|
1,388,290
|
|
|||||||||
|
Cost of Revenue
|
219,440
|
|
222,685
|
|
155,084
|
|
208,646
|
|
805,855
|
|
|||||||||
|
Research and Development
|
84,753
|
|
|||||||||||||||||
|
Selling, General, and Administrative
|
159,235
|
|
|||||||||||||||||
|
Gain on Disposal of Businesses
|
(3,270
|
)
|
|||||||||||||||||
|
Total Expenses
|
1,046,573
|
|
|||||||||||||||||
|
SEGMENT INCOME
|
$
|
258,165
|
|
$
|
249,303
|
|
$
|
220,727
|
|
$
|
(145,760
|
)
|
|||||||
|
OPERATING INCOME
|
341,717
|
|
|||||||||||||||||
|
INTEREST INCOME (EXPENSE)
|
(748
|
)
|
|||||||||||||||||
|
INCOME BEFORE INCOME TAXES
|
$
|
340,969
|
|
||||||||||||||||
The Company has not disclosed any additional asset information by segment, as the information is not produced internally and its preparation is impracticable.
66
NOTE 14: SUBSEQUENT EVENTS
Dividends
On
August 23, 2019
, the Company's Board of Directors declared a cash dividend of
$0.40
per share on its common stock, payable on
September 30, 2019
to shareholders of record on
September 9, 2019
.
Acquisition
On
July 1, 2019
, the Company acquired
100%
of the equity interest in
Geezeo
for a net cash outlay of
$37,776
. The Company has not yet completed its purchase price allocation for this acquisition. Geezeo is a Boston-based provider of retail and business digital financial management solutions and was a privately-held company.
The acquisition was funded with operating cash. Due to the timing of the acquisition, the Company has not yet completed its purchase accounting procedures with respect to this transaction. Geezeo's historical operating results would not materially affect the Company's consolidated financial statements and, accordingly, pro forma financial information has not been provided.
67
QUARTERLY FINANCIAL INFORMATION
(unaudited)
|
|
For the Year Ended June 30, 2019
|
||||||||||||||||||
|
|
Quarter 1
|
Quarter 2
|
Quarter 3
|
Quarter 4
|
Total
|
||||||||||||||
|
REVENUE
|
$
|
392,543
|
|
$
|
386,275
|
|
$
|
380,364
|
|
$
|
393,509
|
|
$
|
1,552,691
|
|
||||
|
EXPENSES
|
|
|
|
|
|||||||||||||||
|
Cost of Revenue
|
220,112
|
|
227,284
|
|
235,594
|
|
240,040
|
|
923,030
|
|
|||||||||
|
Research & Development
|
24,026
|
|
23,990
|
|
23,442
|
|
24,920
|
|
96,378
|
|
|||||||||
|
Selling, General, & Administrative
|
45,183
|
|
46,797
|
|
44,887
|
|
49,131
|
|
185,998
|
|
|||||||||
|
Total Expenses
|
289,321
|
|
298,071
|
|
303,923
|
|
314,091
|
|
1,205,406
|
|
|||||||||
|
OPERATING INCOME
|
103,222
|
|
88,204
|
|
76,441
|
|
79,418
|
|
347,285
|
|
|||||||||
|
INTEREST INCOME (EXPENSE)
|
|
|
|
|
|||||||||||||||
|
Interest income
|
291
|
|
252
|
|
155
|
|
178
|
|
876
|
|
|||||||||
|
Interest expense
|
(147
|
)
|
(148
|
)
|
(224
|
)
|
(407
|
)
|
(926
|
)
|
|||||||||
|
Total interest income (expense)
|
144
|
|
104
|
|
(69
|
)
|
(229
|
)
|
(50
|
)
|
|||||||||
|
INCOME BEFORE INCOME TAXES
|
103,366
|
|
88,308
|
|
76,372
|
|
79,189
|
|
347,235
|
|
|||||||||
|
PROVISION/ (BENEFIT) FOR INCOME TAXES
|
19,815
|
|
20,219
|
|
17,120
|
|
18,196
|
|
75,350
|
|
|||||||||
|
NET INCOME
|
$
|
83,551
|
|
$
|
68,089
|
|
$
|
59,252
|
|
$
|
60,993
|
|
$
|
271,885
|
|
||||
|
|
|
||||||||||||||||||
|
Basic earnings per share
|
$
|
1.08
|
|
$
|
0.88
|
|
$
|
0.77
|
|
$
|
0.79
|
|
$
|
3.52
|
|
||||
|
Basic weighted average shares outstanding
|
77,188
|
|
77,216
|
|
77,177
|
|
77,060
|
|
77,160
|
|
|||||||||
|
Diluted earnings per share
|
$
|
1.08
|
|
$
|
0.88
|
|
$
|
0.77
|
|
$
|
0.79
|
|
$
|
3.52
|
|
||||
|
Diluted weighted average shares outstanding
|
77,537
|
|
77,409
|
|
77,286
|
|
77,157
|
|
77,347
|
|
|||||||||
68
|
|
For the Year Ended June 30, 2018*
|
||||||||||||||||||
|
|
Quarter 1
|
Quarter 2
|
Quarter 3
|
Quarter 4
|
Total
|
||||||||||||||
|
REVENUE
|
$
|
361,284
|
|
$
|
357,209
|
|
$
|
374,048
|
|
$
|
378,256
|
|
$
|
1,470,797
|
|
||||
|
EXPENSES
|
|
|
|
||||||||||||||||
|
Cost of Revenue
|
203,915
|
|
207,100
|
|
218,517
|
|
223,606
|
|
853,138
|
|
|||||||||
|
Research & Development
|
20,929
|
|
22,414
|
|
22,591
|
|
24,406
|
|
90,340
|
|
|||||||||
|
Selling, General, & Administrative
|
41,088
|
|
43,094
|
|
42,234
|
|
45,294
|
|
171,710
|
|
|||||||||
|
Gain on disposal of businesses
|
(1,705
|
)
|
(189
|
)
|
—
|
|
—
|
|
(1,894
|
)
|
|||||||||
|
Total Expenses
|
264,227
|
|
272,419
|
|
283,342
|
|
293,306
|
|
1,113,294
|
|
|||||||||
|
OPERATING INCOME
|
97,057
|
|
84,790
|
|
90,706
|
|
84,950
|
|
357,503
|
|
|||||||||
|
INTEREST INCOME (EXPENSE)
|
|
|
|
|
|||||||||||||||
|
Interest income
|
147
|
|
146
|
|
130
|
|
152
|
|
575
|
|
|||||||||
|
Interest expense
|
(189
|
)
|
(250
|
)
|
(734
|
)
|
(747
|
)
|
(1,920
|
)
|
|||||||||
|
Total interest income (expense)
|
(42
|
)
|
(104
|
)
|
(604
|
)
|
(595
|
)
|
(1,345
|
)
|
|||||||||
|
INCOME BEFORE INCOME TAXES
|
97,015
|
|
84,686
|
|
90,102
|
|
84,355
|
|
356,158
|
|
|||||||||
|
PROVISION/ (BENEFIT) FOR INCOME TAXES
|
30,145
|
|
(76,557
|
)
|
21,017
|
|
16,519
|
|
(8,876
|
)
|
|||||||||
|
NET INCOME
|
$
|
66,870
|
|
$
|
161,243
|
|
$
|
69,085
|
|
$
|
67,836
|
|
$
|
365,034
|
|
||||
|
|
|
||||||||||||||||||
|
Basic net income per share
|
$
|
0.87
|
|
$
|
2.09
|
|
$
|
0.89
|
|
$
|
0.88
|
|
$
|
4.73
|
|
||||
|
Basic weighted average shares outstanding
|
77,283
|
|
77,218
|
|
77,247
|
|
77,261
|
|
77,252
|
|
|||||||||
|
Diluted net income per share
|
$
|
0.86
|
|
$
|
2.08
|
|
$
|
0.89
|
|
$
|
0.87
|
|
$
|
4.70
|
|
||||
|
Diluted weighted average shares outstanding
|
77,646
|
|
77,565
|
|
77,546
|
|
77,585
|
|
77,585
|
|
|||||||||
*As previously disclosed, the Company adopted ASU 2014-09 effective July 1, 2018 using the full retrospective approach. In connection therewith, in its previously filed fiscal 2019 Form 10-Q's, the Company adjusted its comparative fiscal 2018 financial information, including its June 30, 2018 balance sheet, to reflect the retrospective effects of applying ASC 606. In connection with the preparation of the Company's consolidated financial statements for the year ended June 30, 2019, the Company identified a
$23,500
error in the as adjusted June 30, 2018 balance sheet that was disclosed within the previously filed fiscal 2019 Form 10-Q's, which resulted in an overstatement of current deferred revenues and a corresponding understatement of non-current deferred revenues in such unaudited quarterly filings. Management has determined that such misclassification error did not result in the previously filed 2019 Form 10-Q's being materially misstated.
69
ITEM 9. CHANGES IN AND DISAGREEMENTS WITH ACCOUNTANTS ON ACCOUNTING AND FINANCIAL DISCLOSURES
None.
ITEM 9A. CONTROLS AND PROCEDURES
Disclosure Controls and Procedures
As of the end of the period covered by this Annual Report on Form 10-K, an evaluation was carried out under the supervision and with the participation of our management, including our Company’s Chief Executive Officer (CEO) and Chief Financial Officer (CFO), of the effectiveness of the design and operation of our disclosure controls and procedures pursuant to Exchange Act Rules 13a-15 and 15d-15. Based upon that evaluation, the CEO and CFO concluded that our disclosure controls and procedures are effective to ensure that information we are required to disclose in reports that we file or submit under the Exchange Act is recorded, processed, summarized and reported within the time periods specified in SEC rules and forms. For this purpose, disclosure controls and procedures include controls and procedures designed to ensure that information required to be disclosed under the Exchange Act is accumulated and communicated to the Company’s management, including the CEO and CFO, as appropriate to allow timely decisions regarding required disclosure.
Management’s Report on Internal Control over Financial Reporting
The Management’s Report on Internal Control over Financial Reporting required by this Item 9A is in Item 8, “Financial Statements and Supplementary Data.” The Company's independent registered public accounting firm has audited our internal control over financial reporting as of
June 30, 2019
; their report is included in Item 8 of this Form 10-K.
Changes in Internal Control over Financial Reporting
There has been no change in internal control over financial reporting that has materially affected, or is reasonably likely to affect, the Company’s internal control over financial reporting.
ITEM 9B. OTHER INFORMATION
None.
70
PART III
Information required by Items 10, 11, 12, 13 and 14 of Part III is omitted from this report and will be filed within 120 days after the Company's
June 30, 2019
fiscal year end in the definitive proxy statement for our
2019
Annual Meeting of Stockholders (the “Proxy Statement”).
ITEM 10. DIRECTORS, EXECUTIVE OFFICERS AND CORPORATE GOVERNANCE
See the information under the captions “Election of Directors”, “Corporate Governance”, “Section 16(a) Beneficial Ownership Reporting Compliance”, and
“
Executive Officers and Significant Employees
”
in the Proxy Statement, which is incorporated herein by reference.
ITEM 11. EXECUTIVE COMPENSATION
See the information under captions “Corporate Governance”, “Compensation Committee Report”, “Compensation Discussion and Analysis”, "Compensation and Risk", and “Executive Compensation” in the Proxy Statement, which is incorporated herein by reference.
ITEM 12. SECURITY OWNERSHIP OF CERTAIN BENEFICIAL OWNERS AND MANAGEMENT AND RELATED STOCKHOLDER MATTERS
See the information under the captions “Stock Ownership of Certain Stockholders” and “Equity Compensation Plan Information” in the Proxy Statement, which is incorporated herein by reference.
ITEM 13. CERTAIN RELATIONSHIPS AND RELATED TRANSACTIONS, AND DIRECTOR INDEPENDENCE
See the information under the captions “Election of Directors - Director Independence” and “Certain Relationships and Related Transactions” in the Proxy Statement, which is incorporated herein by reference.
ITEM 14. PRINCIPAL ACCOUNTANT FEES AND SERVICES
See the information under the captions ”Audit Committee Report” and “Ratification of the Selection of Independent Registered Public Accounting Firm” in the Proxy Statement, which is incorporated herein by reference.
71
PART IV
ITEM 15. EXHIBITS AND FINANCIAL STATEMENT SCHEDULES
(a) The following documents are filed as part of this Report:
(1) The following Consolidated Financial Statements of the Company and its subsidiaries and the Report of Independent Registered Public Accounting Firm thereon appear under Item 8 of this Report:
- Reports of Independent Registered Public Accounting Firm
- Consolidated Statements of Income for the fiscal years ended
June 30, 2019
,
2018
and
2017
- Consolidated Balance Sheets as of
June 30, 2019
and
2018
- Consolidated Statements of Changes in Stockholders’ Equity for the fiscal years ended
June 30, 2019
,
2018
and
2017
- Consolidated Statements of Cash Flows for the fiscal years ended
June 30, 2019
,
2018
and
2017
- Notes to the Consolidated Financial Statements
(2) The following Financial Statement Schedules filed as part of this Report appear under Item 8 of this Report:
There are no schedules included because they are not applicable or the required information is shown in the Consolidated Financial Statements or Notes thereto.
(3) See “Index to Exhibits” set forth below.
All exhibits not attached hereto are incorporated by reference to a prior filing as indicated.
Index to Exhibits
Exhibit No.
Description
|
3.1.7
|
|
3.2.7
|
|
10.8
|
|
10.32*
|
|
10.38*
|
|
10.39*
|
|
10.43*
|
|
10.44*
|
|
10.46*
|
72
|
10.47*
|
|
10.48*
|
|
10.49*
|
|
10.50*
|
|
10.51*
|
|
10.52
|
|
10.53*
|
|
10.54
|
|
10.55
|
|
10.56*
|
|
10.57*
|
|
10.58*
|
|
10.59*
|
|
10.60*
|
|
10.61*
|
|
10.62*
|
|
10.63*
|
|
21.1**
|
|
23.1**
|
73
|
31.1**
|
|
31.2**
|
|
32.1***
|
|
32.2***
|
|
101.INS****
|
XBRL Instance Document
|
|
101.SCH****
|
XBRL Taxonomy Extension Schema Document
|
|
101.CAL****
|
XBRL Taxonomy Extension Calculation Linkbase Document
|
|
101.DEF****
|
XBRL Taxonomy Extension Definition Linkbase Document
|
|
101.LAB****
|
XBRL Taxonomy Extension Label Linkbase Document
|
|
101.PRE****
|
XBRL Taxonomy Extension Presentation Linkbase Document
|
* Indicates management contract or compensatory plan or arrangement.
** Filed with this report on Form 10-K
*** Furnished with this report on Form 10-K.
**** Filed with this report on Form 10-K are the following documents formatted in XBRL (Extensible Business Reporting Language): (i) the Consolidated Balance Sheets at
June 30, 2019
and
June 30, 2018
, (ii) the Consolidated Statements of Income for the years ended
June 30, 2019
,
2018
and
2017
, (iii) the Consolidated Statements of Shareholders’ Equity for the years ended
June 30, 2019
,
2018
and
2017
, (iv) the Consolidated Statements of Cash Flows for the years ended
June 30, 2019
,
2018
and
2017
, and (v) Notes to Consolidated Financial Statements.
ITEM 16. FORM 10-K SUMMARY
None.
74
SIGNATURES
Pursuant to the requirements of Section 13 or 15(d) of the Securities Exchange Act of 1934, the registrant has duly caused this report to be signed on its behalf by the undersigned, thereunto duly authorized this
26th day of August, 2019
.
JACK HENRY & ASSOCIATES, INC., Registrant
By /s/ David B. Foss
Chief Executive Officer
Pursuant to the requirements of the Securities Exchange Act of 1934, this report has been signed below by the following persons on behalf of the registrant and in the capacities and on the dates indicated:
|
Signature
|
Capacity
|
Date
|
|
|
|
|
|
/s/ David B. Foss
David B. Foss
|
President, Chief Executive Officer, and Director (Principal Executive Officer)
|
August 26, 2019
|
|
|
|
|
|
/s/ Kevin D. Williams
Kevin D. Williams
|
Chief Financial Officer and Treasurer
(Principal Financial and Accounting Officer)
|
August 26, 2019
|
|
|
|
|
|
/s/ John F. Prim
John F. Prim |
Director
|
August 26, 2019
|
|
/s/ Matthew Flanigan
Matthew Flanigan
|
Director
|
August 26, 2019
|
|
|
|
|
|
/s/ Tom H. Wilson, Jr
Tom H. Wilson, Jr
|
Director
|
August 26, 2019
|
|
|
|
|
|
/s/ Jacqueline R. Fiegel
Jacqueline R. Fiegel
|
Director
|
August 26, 2019
|
|
|
|
|
|
/s/ Thomas A. Wimsett
Thomas A. Wimsett
|
Director
|
August 26, 2019
|
|
/s/ Laura G. Kelly
Laura G. Kelly
|
Director
|
August 26, 2019
|
|
/s/ Shruti Miyashiro
Shruti S. Miyashiro
|
Director
|
August 26, 2019
|
|
/s/ Wesley A. Brown
Wesley A. Brown
|
Director
|
August 26, 2019
|
75
TABLE OF CONTENTS
Part IItem 1. BusinessItem 1A. Risk FactorsItem 1B. Unresolved Staff CommentsItem 2. PropertiesItem 3. Legal ProceedingsItem 4. Mine Safety DisclosuresPart IIItem 5. Market For Registrant's Common Equity, Related Stockholder Matters and Issuer Purchases Of Equity SecuritiesItem 6. Selected Financial DataItem 7. Management S Discussion and Analysis Of Financial Condition and Results Of OperationsItem 7A. Quantitative and Qualitative Disclosures About Market RiskItem 8. Financial Statements and Supplementary DataNote 1. Nature Of Operations and Summary Of Significant Accounting PoliciesNote 2. Fair Value Of Financial InstrumentsNote 3. Property and EquipmentNote 4. Other AssetsNote 5. DebtNote 6. Commitments and ContingenciesNote 7. Income TaxesNote 8. Industry and Supplier ConcentrationsNote 9. Stock-based CompensationNote 10. Earnings Per ShareNote 11. Employee Benefit PlansNote 12. Business AcquisitionsNote 13. Reportable Segment InformationNote 14: Subsequent EventsItem 9. Changes in and Disagreements with Accountants on Accounting and Financial DisclosuresItem 9A. Controls and ProceduresItem 9B. Other InformationPart IIIItem 10. Directors, Executive Officers and Corporate GovernanceItem 11. Executive CompensationItem 12. Security Ownership Of Certain Beneficial Owners and Management and Related Stockholder MattersItem 13. Certain Relationships and Related Transactions, and Director IndependenceItem 14. Principal Accountant Fees and ServicesPart IVItem 15. Exhibits and Financial Statement SchedulesItem 16. Form 10-k Summary