JONES LANG LASALLE INC
10-Ks and 10-Qs
|
|
|
|
|
|
|
|
|
|
|
|
|
|
|
|
|
|
|
|
|
|
|
|
|
|
|
|
|
|
|
|
|
|
|
|
|
|
|
|
|
|
|
|
|
|
|
|
|
|
|
|
|
|
|
|
United States
Securities and Exchange Commission
Washington, D.C. 20549
Form
10-Q
For the quarterly period ended
September 30, 2023
Or
For the transition period from _____ to _____
Commission File Number
1-13145

(Exact name of registrant as specified in its charter)
|
|
|
|||||||||||||||||||||||||||||||||||||||||||
| (State or other jurisdiction of incorporation or organization) | (I.R.S. Employer Identification No.) | |||||||||||||||||||||||||||||||||||||||||||
|
|
|
|
|
|||||||||||||||||||||||||||||||||||||||||
| (Address of principal executive offices) | (Zip Code) | |||||||||||||||||||||||||||||||||||||||||||
| Registrant's telephone number, including area code: |
|
|
||||||||||||||||||||||||||||||||||||||||||
|
Former name, former address and former fiscal year, if changed since last report:
Not Applicable
|
||||||||||||||||||||||||||||||||||||||||||||
Securities registered pursuant to Section 12(b) of the Act:
| Title of each class | Trading Symbol | Name of each exchange on which registered | ||||||||||||
|
|
|
|
||||||||||||
Indicate by check mark whether the registrant (1) has filed all reports required to be filed by Section 13 or 15(d) of the Securities Exchange Act of 1934 during the preceding 12 months (or for such shorter period that the registrant was required to file such reports), and (2) has been subject to such filing requirements for the past 90 days.
Yes
☑
No
☐
Indicate by check mark whether the registrant has submitted electronically, every Interactive Data File required to be submitted pursuant to Rule 405 of Regulation S-T (§232.405 of this chapter) during the preceding 12 months (or for such shorter period that the registrant was required to submit such files).
Yes
☑
No
☐
Indicate by check mark whether the registrant is a large accelerated filer, an accelerated filer, a non-accelerated filer, a smaller reporting company, or an emerging growth company. See the definitions of "large accelerated filer," "accelerated filer," "smaller reporting company" and "emerging growth company" in Rule 12b-2 of the Exchange Act.
|
|
☑ | Accelerated filer | ☐ | |||||||||||
| Non-accelerated filer | ☐ | Smaller reporting company |
|
|||||||||||
| Emerging growth company |
|
|||||||||||||
If an emerging growth company, indicate by check mark if the registrant has elected not to use the extended transition period for complying with any new or revised financial accounting standards provided pursuant to Section 13(a) of the Exchange Act.
☐
Indicate by check mark whether the registrant is a shell company (as defined in Rule 12b-2 of the Exchange Act). Yes
☐
No
☑
The number of shares outstanding of the registrant's common stock (par value $0.01) as of the close of business on October 30, 2023 was
47,572,944
.
Table of Contents
| Part I | ||||||||
| Item 1. | ||||||||
| Item 2. | ||||||||
| Item 3. | ||||||||
| Item 4. | ||||||||
| Part II | ||||||||
| Item 1. | ||||||||
| Item 1A. | ||||||||
| Item 6. | ||||||||
2
Part I. Financial Information
Item 1. Financial Statements
JONES LANG LASALLE INCORPORATED
CONDENSED CONSOLIDATED BALANCE SHEETS
| (in millions, except share and per share data) | September 30, 2023 | December 31, 2022 | ||||||
| Assets | (unaudited) | |||||||
| Current assets: | ||||||||
| Cash and cash equivalents | $ |
|
|
|||||
|
Trade receivables, net of allowance of $
|
|
|
||||||
| Notes and other receivables |
|
|
||||||
| Reimbursable receivables |
|
|
||||||
| Warehouse receivables |
|
|
||||||
|
Short-term contract assets, net of allowance of $
|
|
|
||||||
| Prepaid and other |
|
|
||||||
| Total current assets |
|
|
||||||
|
Property and equipment, net of accumulated depreciation of $
|
|
|
||||||
| Operating lease right-of-use assets |
|
|
||||||
| Goodwill |
|
|
||||||
|
Identified intangibles, net of accumulated amortization of $
|
|
|
||||||
|
Investments, including $
|
|
|
||||||
| Long-term receivables |
|
|
||||||
| Deferred tax assets, net |
|
|
||||||
| Deferred compensation plan |
|
|
||||||
| Other |
|
|
||||||
| Total assets | $ |
|
|
|||||
| Liabilities and Equity | ||||||||
| Current liabilities: | ||||||||
| Accounts payable and accrued liabilities | $ |
|
|
|||||
| Reimbursable payables |
|
|
||||||
| Accrued compensation and benefits |
|
|
||||||
| Short-term borrowings |
|
|
||||||
| Short-term contract liabilities and deferred income |
|
|
||||||
| Short-term acquisition-related obligations |
|
|
||||||
| Warehouse facilities |
|
|
||||||
| Short-term operating lease liabilities |
|
|
||||||
| Other |
|
|
||||||
| Total current liabilities |
|
|
||||||
|
Credit facility, net of debt issuance costs of $
|
|
|
||||||
|
Long-term debt, net of debt issuance costs of $
|
|
|
||||||
| Deferred tax liabilities, net |
|
|
||||||
| Deferred compensation |
|
|
||||||
| Long-term acquisition-related obligations |
|
|
||||||
| Long-term operating lease liabilities |
|
|
||||||
| Other |
|
|
||||||
| Total liabilities |
|
|
||||||
| Redeemable noncontrolling interest |
|
|
||||||
| Company shareholders' equity: | ||||||||
|
Common stock, $
|
|
|
||||||
| Additional paid-in capital |
|
|
||||||
| Retained earnings |
|
|
||||||
|
Treasury stock, at cost,
|
(
|
(
|
||||||
| Shares held in trust |
(
|
(
|
||||||
| Accumulated other comprehensive loss |
(
|
(
|
||||||
| Total Company shareholders’ equity |
|
|
||||||
| Noncontrolling interest |
|
|
||||||
| Total equity |
|
|
||||||
| Total liabilities, redeemable noncontrolling interest and equity | $ |
|
|
|||||
3
JONES LANG LASALLE INCORPORATED
CONDENSED CONSOLIDATED STATEMENTS OF COMPREHENSIVE INCOME
| (in millions, except share and per share data) (unaudited) | Three Months Ended September 30, | Nine Months Ended September 30, | |||||||||||||||
| 2023 | 2022 | 2023 | 2022 | ||||||||||||||
| Revenue | $ |
|
|
$ |
|
|
|||||||||||
| Operating expenses: | |||||||||||||||||
| Compensation and benefits | $ |
|
|
$ |
|
|
|||||||||||
| Operating, administrative and other |
|
|
|
|
|||||||||||||
| Depreciation and amortization |
|
|
|
|
|||||||||||||
| Restructuring and acquisition charges |
|
|
|
|
|||||||||||||
| Total operating expenses | $ |
|
|
$ |
|
|
|||||||||||
| Operating income | $ |
|
|
$ |
|
|
|||||||||||
| Interest expense, net of interest income |
|
|
|
|
|||||||||||||
| Equity (losses) earnings |
(
|
|
(
|
|
|||||||||||||
| Other income |
|
|
|
|
|||||||||||||
| Income before income taxes and noncontrolling interest |
|
|
|
|
|||||||||||||
| Income tax provision |
|
|
|
|
|||||||||||||
| Net income |
|
|
|
|
|||||||||||||
| Net (loss) income attributable to noncontrolling interest |
(
|
(
|
|
|
|||||||||||||
| Net income attributable to common shareholders | $ |
|
|
$ |
|
|
|||||||||||
| Basic earnings per common share | $ |
|
|
$ |
|
|
|||||||||||
| Basic weighted average shares outstanding (in 000's) |
|
|
|
|
|||||||||||||
| Diluted earnings per common share | $ |
|
|
$ |
|
|
|||||||||||
| Diluted weighted average shares outstanding (in 000's) |
|
|
|
|
|||||||||||||
| Net income attributable to common shareholders | $ |
|
|
$ |
|
|
|||||||||||
| Change in pension liabilities, net of tax |
|
|
(
|
|
|||||||||||||
| Foreign currency translation adjustments |
(
|
(
|
(
|
(
|
|||||||||||||
| Comprehensive (loss) income attributable to common shareholders | $ |
(
|
|
$ |
|
|
|||||||||||
See accompanying notes to Condensed Consolidated Financial Statements.
4
JONES LANG LASALLE INCORPORATED
CONDENSED CONSOLIDATED STATEMENTS OF CHANGES IN EQUITY
FOR THE THREE AND NINE MONTHS ENDED SEPTEMBER 30, 2023 AND 2022
| Company Shareholders' Equity | ||||||||||||||||||||||||||||||||
| Common Stock | Additional | Shares | ||||||||||||||||||||||||||||||
|
(in millions, except share and
per share data) (unaudited) |
Shares Outstanding | Amount | Paid-In | Retained | Held in | Treasury | Total | |||||||||||||||||||||||||
| Capital | Earnings | Trust | Stock |
AOCI
(1)
|
NCI
(2)
|
Equity | ||||||||||||||||||||||||||
| December 31, 2022 |
|
$ |
|
|
|
(
|
(
|
(
|
|
$ |
|
|||||||||||||||||||||
| Net (loss) income | — | — | — |
(
|
— | — | — |
|
(
|
|||||||||||||||||||||||
| Shares issued under stock-based compensation programs |
|
— |
(
|
(
|
— |
|
— | — |
|
|||||||||||||||||||||||
| Shares repurchased for payment of taxes on stock-based compensation |
(
|
— |
|
— | — |
(
|
— | — |
(
|
|||||||||||||||||||||||
| Amortization of stock-based compensation | — | — |
|
— | — | — | — | — |
|
|||||||||||||||||||||||
| Foreign currency translation adjustments | — | — | — | — | — | — |
|
— |
|
|||||||||||||||||||||||
| Decrease in amounts attributable to noncontrolling interest | — | — | — | — | — | — | — |
(
|
(
|
|||||||||||||||||||||||
| March 31, 2023 |
|
$ |
|
|
|
(
|
(
|
(
|
|
$ |
|
|||||||||||||||||||||
|
Net income
(3)
|
— | — | — |
|
— | — | — |
|
|
|||||||||||||||||||||||
| Shares issued under stock-based compensation programs |
|
— |
(
|
(
|
— |
|
— | — |
|
|||||||||||||||||||||||
| Shares repurchased for payment of taxes on stock-based compensation |
(
|
— | — | — | — |
|
— | — |
|
|||||||||||||||||||||||
| Amortization of stock-based compensation | — | — |
|
— | — | — | — | — |
|
|||||||||||||||||||||||
| Shares held in trust | — | — | — | — |
(
|
— | — | — |
(
|
|||||||||||||||||||||||
| Repurchase of common stock |
(
|
— | — | — | — |
(
|
— | — |
(
|
|||||||||||||||||||||||
| Change in pension liabilities, net of tax | — | — | — | — | — | — |
(
|
— |
(
|
|||||||||||||||||||||||
| Foreign currency translation adjustments | — | — | — | — | — | — |
|
— |
|
|||||||||||||||||||||||
| Decrease in amounts attributable to noncontrolling interest | — | — | — | — | — | — | — |
(
|
(
|
|||||||||||||||||||||||
| June 30, 2023 |
|
$ |
|
|
|
(
|
(
|
(
|
|
$ |
|
|||||||||||||||||||||
|
Net income (loss)
(3)
|
— | — | — |
|
— | — | — |
(
|
|
|||||||||||||||||||||||
| Shares issued under stock-based compensation programs |
|
— |
(
|
(
|
— |
|
— | — |
(
|
|||||||||||||||||||||||
| Shares repurchased for payment of taxes on stock-based compensation |
(
|
— | — | — | — |
(
|
— | — |
(
|
|||||||||||||||||||||||
| Amortization of stock-based compensation | — | — |
|
— | — | — | — | — |
|
|||||||||||||||||||||||
| Shares held in trust | — | — | — | — |
|
— | — | — |
|
|||||||||||||||||||||||
| Repurchase of common stock |
(
|
— | — | — | — |
(
|
— | — |
(
|
|||||||||||||||||||||||
| Foreign currency translation adjustments | — | — | — | — | — | — |
(
|
— |
(
|
|||||||||||||||||||||||
| Decrease in amounts attributable to noncontrolling interest | — | — | — | — | — | — | — |
(
|
(
|
|||||||||||||||||||||||
| September 30, 2023 |
|
$ |
|
|
|
(
|
(
|
(
|
|
$ |
|
|||||||||||||||||||||
(1) AOCI: Accumulated other comprehensive income (loss)
(2) NCI: Noncontrolling interest
(3)
Excludes net (loss) income attributable to redeemable noncontrolling interest of $(
0.3
) million and $
0.1
million for the three months ended September 30, 2023 and June 30, 2023.
5
JONES LANG LASALLE INCORPORATED
CONDENSED CONSOLIDATED STATEMENTS OF CHANGES IN EQUITY (CONTINUED)
FOR THE THREE AND NINE MONTHS ENDED SEPTEMBER 30, 2023 AND 2022
| Company Shareholders' Equity | ||||||||||||||||||||||||||||||||
| Common Stock | Additional | Shares | ||||||||||||||||||||||||||||||
|
(in millions, except share and
per share data) (unaudited) |
Shares Outstanding | Amount | Paid-In | Retained | Held in | Treasury | Total | |||||||||||||||||||||||||
| Capital | Earnings | Trust | Stock |
AOCI
(1)
|
NCI
(2)
|
Equity | ||||||||||||||||||||||||||
| December 31, 2021 |
|
$ |
|
|
|
(
|
(
|
(
|
|
$ |
|
|||||||||||||||||||||
|
Net income (loss)
|
— | — | — |
|
— | — | — |
(
|
|
|||||||||||||||||||||||
| Shares issued under stock-based compensation programs |
|
— |
(
|
— | — |
|
— | — |
|
|||||||||||||||||||||||
| Shares repurchased for payment of taxes on stock-based compensation |
(
|
— |
(
|
— | — |
(
|
— | — |
(
|
|||||||||||||||||||||||
| Amortization of stock-based compensation | — | — |
|
— | — | — | — | — |
|
|||||||||||||||||||||||
| Shares held in trust | — | — | — | — |
|
— | — | — |
|
|||||||||||||||||||||||
| Repurchase of common stock |
(
|
— | — | — | — |
(
|
— | — |
(
|
|||||||||||||||||||||||
| Foreign currency translation adjustments | — | — | — | — | — | — |
(
|
— |
(
|
|||||||||||||||||||||||
| Increase in amounts attributable to noncontrolling interest | — | — | — | — | — | — | — |
|
|
|||||||||||||||||||||||
| March 31, 2022 |
|
$ |
|
|
|
(
|
(
|
(
|
|
$ |
|
|||||||||||||||||||||
|
Net income
(3)
|
— | — | — |
|
— | — | — |
|
|
|||||||||||||||||||||||
| Shares issued under stock-based compensation programs |
|
— |
(
|
(
|
— |
|
— | — |
|
|||||||||||||||||||||||
| Shares repurchased for payment of taxes on stock-based compensation |
(
|
— |
(
|
— | — |
(
|
— | — |
(
|
|||||||||||||||||||||||
| Amortization of stock-based compensation | — | — |
|
— | — | — | — | — |
|
|||||||||||||||||||||||
| Repurchase of common stock |
(
|
— | — | — | — |
(
|
— | — |
(
|
|||||||||||||||||||||||
| Foreign currency translation adjustments | — | — | — | — | — | — |
(
|
— |
(
|
|||||||||||||||||||||||
| Decrease in amounts attributable to noncontrolling interest | — | — | — | — | — | — | — |
(
|
(
|
|||||||||||||||||||||||
| June 30, 2022 |
|
$ |
|
|
|
(
|
(
|
(
|
|
$ |
|
|||||||||||||||||||||
|
Net income (loss)
(3)
|
— | — | — |
|
— | — | — |
(
|
|
|||||||||||||||||||||||
| Shares issued under stock-based compensation programs |
|
— |
(
|
|
— |
|
— | — |
|
|||||||||||||||||||||||
| Shares repurchased for payment of taxes on stock-based compensation |
(
|
— |
(
|
— | — |
(
|
— | — |
(
|
|||||||||||||||||||||||
| Amortization of stock-based compensation | — | — |
|
— | — | — | — | — |
|
|||||||||||||||||||||||
| Repurchase of common stock |
(
|
— | — | — | — |
(
|
— | — |
(
|
|||||||||||||||||||||||
| Foreign currency translation adjustments | — | — | — | — | — | — |
(
|
— |
(
|
|||||||||||||||||||||||
| Decrease in amounts attributable to noncontrolling interest | — | — | — | — | — | — | — |
(
|
(
|
|||||||||||||||||||||||
| September 30, 2022 |
|
$ |
|
|
|
(
|
(
|
(
|
|
$ |
|
|||||||||||||||||||||
(1) AOCI: Accumulated other comprehensive income (loss)
(2) NCI: Noncontrolling interest
(3)
Excludes net loss attributable to redeemable noncontrolling interest of $
0.1
million for both the three months ended September 30, 2022 and June 30, 2022.
See accompanying notes to Condensed Consolidated Financial Statements.
6
JONES LANG LASALLE INCORPORATED
CONDENSED CONSOLIDATED STATEMENTS OF CASH FLOWS
See accompanying notes to Condensed Consolidated Financial Statements.
| Nine Months Ended September 30, | ||||||||
| (in millions) (unaudited) | 2023 | 2022 | ||||||
| Cash flows from operating activities: | ||||||||
| Net income | $ |
|
|
|||||
| Reconciliation of net income to net cash used in operating activities: | ||||||||
| Depreciation and amortization |
|
|
||||||
| Equity losses (earnings) |
|
(
|
||||||
| Net loss (gain) on dispositions |
|
(
|
||||||
| Distributions of earnings from investments |
|
|
||||||
| Provision for loss on receivables and other assets |
|
|
||||||
| Amortization of stock-based compensation |
|
|
||||||
| Net non-cash mortgage servicing rights and mortgage banking derivative activity |
|
(
|
||||||
| Accretion of interest and amortization of debt issuance costs |
|
|
||||||
| Other, net |
|
|
||||||
| Change in: | ||||||||
| Receivables |
|
(
|
||||||
| Reimbursable receivables and reimbursable payables |
(
|
(
|
||||||
| Prepaid expenses and other assets |
(
|
(
|
||||||
| Deferred tax assets, net |
(
|
|
||||||
| Accounts payable and accrued liabilities |
(
|
(
|
||||||
| Accrued compensation |
(
|
(
|
||||||
| Net cash used in operating activities |
(
|
(
|
||||||
| Cash flows from investing activities: | ||||||||
| Net capital additions – property and equipment |
(
|
(
|
||||||
| Net investment asset activity (less than wholly-owned) |
|
|
||||||
| Business acquisitions, net of cash acquired |
(
|
(
|
||||||
| Capital contributions to investments |
(
|
(
|
||||||
| Distributions of capital from investments |
|
|
||||||
| Other, net |
(
|
(
|
||||||
| Net cash used in investing activities |
(
|
(
|
||||||
| Cash flows from financing activities: | ||||||||
| Proceeds from borrowings under credit facility |
|
|
||||||
| Repayments of borrowings under credit facility |
(
|
(
|
||||||
| Repayment of senior notes |
|
(
|
||||||
| Net (repayments of) proceeds from short-term borrowings |
(
|
|
||||||
| Payments of deferred business acquisition obligations and earn-outs |
(
|
(
|
||||||
| Repurchase of common stock |
(
|
(
|
||||||
| Noncontrolling interest distributions, net |
(
|
(
|
||||||
| Other, net |
(
|
(
|
||||||
| Net cash provided by financing activities |
|
|
||||||
| Effect of currency exchange rate changes on cash, cash equivalents and restricted cash |
(
|
(
|
||||||
| Net change in cash, cash equivalents and restricted cash |
(
|
(
|
||||||
| Cash, cash equivalents and restricted cash, beginning of the period |
|
|
||||||
| Cash, cash equivalents and restricted cash, end of the period | $ |
|
|
|||||
| Supplemental disclosure of cash flow information: | ||||||||
| Restricted cash, beginning of period | $ |
|
|
|||||
| Restricted cash, end of period |
|
|
||||||
| Cash paid during the period for: | ||||||||
| Interest | $ |
|
|
|||||
| Income taxes, net of refunds |
|
|
||||||
| Operating leases |
|
|
||||||
| Non-cash activities: | ||||||||
| Business acquisitions (including contingent consideration) | $ |
|
|
|||||
| Non-cash consideration received for disposition |
|
|
||||||
| Deferred business acquisition obligations |
|
|
||||||
7
JONES LANG LASALLE INCORPORATED
NOTES TO CONDENSED CONSOLIDATED FINANCIAL STATEMENTS (UNAUDITED)
1.
INTERIM INFORMATION
Readers of this quarterly report should refer to the audited financial statements of Jones Lang LaSalle Incorporated ("JLL," which may also be referred to as "the Company," "we," "us" or "our") for the year ended December 31, 2022, which are included in our 2022 Annual Report on Form 10-K, filed with the United States Securities and Exchange Commission ("SEC") and also available on our website (
www.jll.com
), since we have omitted from this quarterly report certain footnote disclosures which would substantially duplicate those contained in such audited financial statements. You should also refer to the "Summary of Critical Accounting Policies and Estimates" section within Item 7. Management's Discussion and Analysis of Financial Condition and Results of Operations and to Note 2, Summary of Significant Accounting Policies, in the Notes to Consolidated Financial Statements in our 2022 Annual Report on Form 10-K for further discussion of our significant accounting policies and estimates.
Our Condensed Consolidated Financial Statements as of September 30, 2023, and for the periods ended September 30, 2023 and 2022, are unaudited. In the opinion of management, we have included all adjustments (consisting solely of normal recurring adjustments) necessary for a fair presentation of the Condensed Consolidated Financial Statements for these interim periods.
Historically, our quarterly revenue and profits have tended to increase from quarter to quarter as the year progresses. This is the result of a general focus in the real estate industry on completing transactions by calendar year end, while certain expenses are recognized evenly throughout the year. Growth in our Property Management and Workplace Management businesses as well as other annuity-based services has, to an extent, lessened the seasonality in our revenue and profits during the past several years. Within our Markets Advisory and Capital Markets segments, revenue from transaction-based activities is driven by the size and timing of our clients' transactions and can fluctuate significantly from period to period. Our LaSalle Investment Management ("LaSalle") segment generally earns investment-generated performance fees on clients' real estate investment returns when assets are sold, the timing of which is geared toward the benefit of our clients, as well as co-investment equity gains and losses, primarily dependent on underlying valuations.
A significant portion of our compensation and benefits expense is from incentive compensation plans, which we generally accrue throughout the year based on progress toward annual performance targets. This process can result in significant fluctuations in quarterly compensation and benefits expense from period to period. Non-variable operating expenses, which we recognize when incurred during the year, are relatively constant on a quarterly basis.
We provide for the effects of income taxes on interim financial statements based on our estimate of the effective tax rate for the full year, which we base on forecasted income by country and expected enacted tax rates. As required, we adjust for the impact of discrete items in the quarters in which they occur. Changes in the geographic mix of income can impact our estimated effective tax rate.
As a result of the items mentioned above, the results for the periods ended September 30 are not fully indicative of what our results will be for the full fiscal year.
8
2.
NEW ACCOUNTING STANDARDS
3.
REVENUE RECOGNITION
Capital Markets revenue excluded from the scope of Accounting Standards Codification Topic 606, Revenue from Contracts with Customers ("ASC Topic 606")
Our mortgage banking and servicing operations, comprised of (i) all Loan Servicing revenue and (ii) activities related to mortgage servicing rights ("MSR" or "MSRs") and loan origination fees (included in Investment Sales, Debt/Equity Advisory and Other), are not considered revenue from contracts with customers, and accordingly are excluded from the scope of ASC Topic 606. Such out-of-scope revenue is presented below.
| Three Months Ended September 30, | Nine Months Ended September 30, | ||||||||||||||||
| (in millions) | 2023 | 2022 | 2023 | 2022 | |||||||||||||
| Revenue excluded from scope of ASC Topic 606 | $ |
|
|
$ |
|
|
|||||||||||
Contract assets and liabilities
Our contract assets, net of allowance, are included in Short-term contract assets and Other assets and our contract liabilities are included in Short-term contract liabilities and deferred income on our Condensed Consolidated Balance Sheets. The majority of contract liabilities are recognized as revenue within 90 days.
Such contract assets and liabilities are presented below.
| (in millions) | September 30, 2023 | December 31, 2022 | ||||||
| Contract assets, gross | $ |
|
|
|||||
| Contract asset allowance |
(
|
(
|
||||||
| Contract assets, net | $ |
|
|
|||||
| Contract liabilities | $ |
|
|
|||||
Remaining performance obligations
Remaining performance obligations represent the aggregate transaction price for contracts where our performance obligations have not yet been satisfied. As of September 30, 2023, the aggregate amount of transaction price allocated to remaining performance obligations represented less than
5
% of our total revenue. In accordance with ASC Topic 606, excluded from the aforementioned remaining performance obligations are (i) amounts attributable to contracts expected to be completed within 12 months and (ii) variable consideration for services performed as a series of daily performance obligations, such as facilities management, property management and LaSalle contracts. A significant portion of our customer contracts, which are not expected to be fulfilled within 12 months, are represented by the contracts within these businesses.
9
4.
BUSINESS SEGMENTS
We manage and report our operations as five global business segments:
(1) Markets Advisory,
(2) Capital Markets,
(3) Work Dynamics,
(4) JLL Technologies and
(5) LaSalle.
Markets Advisory offers a wide range of real estate services, including agency leasing and tenant representation, property management, advisory and consulting services. Capital Markets service offerings include investment sales, debt and equity advisory, value and risk advisory, and loan servicing. Our Work Dynamics business provides a broad suite of integrated services to occupiers of real estate, including facility and project management, as well as portfolio and other services. Our JLL Technologies segment offers software products, solutions and services, while LaSalle provides investment management services on a global basis to institutional investors and high-net-worth individuals.
We allocate all indirect expenses to our segments, other than interest and income taxes, as nearly all expenses incurred benefit one or more of the segments. Allocated expenses primarily consist of corporate functional costs across the globe, which we allocate to the business segments using an expense-specific driver-based methodology.
Adjusted EBITDA does not include (i) Restructuring and acquisition charges, (ii) gain/loss on disposal, (iii) interest on employee loans, net of forgiveness, (iv) net non-cash MSR and mortgage banking derivative activity, (v) Interest expense, net of interest income, (vi) Income tax provision and (vii) Depreciation and amortization, which are otherwise included in Net income on the Condensed Consolidated Statements of Comprehensive Income.
The Chief Operating Decision Maker ("CODM") of JLL measures and evaluates the segment results based on Adjusted EBITDA for purposes of making decisions about allocating resources and assessing performance. Our CODM is not provided with total asset information by segment and accordingly does not measure or allocate resources based on total assets information. Therefore, we have not disclosed asset information by segment.
10
| Three Months Ended September 30, | Nine Months Ended September 30, | |||||||||||||
| (in millions) | 2023 | 2022 | 2023 | 2022 | ||||||||||
| Markets Advisory | ||||||||||||||
| Leasing | $ |
|
|
$ |
|
|
||||||||
| Property Management |
|
|
|
|
||||||||||
| Advisory, Consulting and Other |
|
|
|
|
||||||||||
| Revenue | $ |
|
|
$ |
|
|
||||||||
|
Depreciation and amortization
(1)
|
$ |
|
|
$ |
|
|
||||||||
| Equity earnings (losses) | $ |
|
(
|
$ |
|
|
||||||||
| Adjusted EBITDA | $ |
|
|
$ |
|
|
||||||||
| Capital Markets | ||||||||||||||
| Investment Sales, Debt/Equity Advisory and Other | $ |
|
|
$ |
|
|
||||||||
| Value and Risk Advisory |
|
|
|
|
||||||||||
| Loan Servicing |
|
|
|
|
||||||||||
| Revenue | $ |
|
|
$ |
|
|
||||||||
| Depreciation and amortization | $ |
|
|
$ |
|
|
||||||||
| Equity earnings | $ |
|
|
$ |
|
|
||||||||
| Adjusted EBITDA | $ |
|
|
$ |
|
|
||||||||
| Work Dynamics | ||||||||||||||
| Workplace Management | $ |
|
|
$ |
|
|
||||||||
| Project Management |
|
|
|
|
||||||||||
| Portfolio Services and Other |
|
|
|
|
||||||||||
| Revenue | $ |
|
|
$ |
|
|
||||||||
| Depreciation and amortization | $ |
|
|
$ |
|
|
||||||||
| Equity earnings | $ |
|
|
$ |
|
|
||||||||
| Adjusted EBITDA | $ |
|
|
$ |
|
|
||||||||
| JLL Technologies | ||||||||||||||
| Revenue | $ |
|
|
$ |
|
|
||||||||
| Depreciation and amortization | $ |
|
|
$ |
|
|
||||||||
| Equity (losses) earnings | $ |
(
|
|
$ |
(
|
|
||||||||
| Adjusted EBITDA | $ |
(
|
(
|
$ |
(
|
(
|
||||||||
| LaSalle | ||||||||||||||
| Advisory fees | $ |
|
|
$ |
|
|
||||||||
| Transaction fees and other |
|
|
|
|
||||||||||
| Incentive fees |
|
|
|
|
||||||||||
| Revenue | $ |
|
|
$ |
|
|
||||||||
| Depreciation and amortization | $ |
|
|
$ |
|
|
||||||||
| Equity (losses) earnings | $ |
(
|
(
|
$ |
(
|
|
||||||||
| Adjusted EBITDA | $ |
|
|
$ |
|
|
||||||||
11
The following table is a reconciliation of Adjusted EBITDA to Net income attributable to common shareholders.
| Three Months Ended September 30, | Nine Months Ended September 30, | |||||||||||||
| (in millions) | 2023 | 2022 | 2023 | 2022 | ||||||||||
| Adjusted EBITDA - Markets Advisory | $ |
|
|
$ |
|
|
||||||||
| Adjusted EBITDA - Capital Markets |
|
|
|
|
||||||||||
| Adjusted EBITDA - Work Dynamics |
|
|
|
|
||||||||||
| Adjusted EBITDA - JLL Technologies |
(
|
(
|
(
|
(
|
||||||||||
| Adjusted EBITDA - LaSalle |
|
|
|
|
||||||||||
| Adjusted EBITDA - Consolidated | $ |
|
|
$ |
|
|
||||||||
| Adjustments: | ||||||||||||||
| Restructuring and acquisition charges | $ |
(
|
(
|
$ |
(
|
(
|
||||||||
| Net gain (loss) on disposition |
|
|
(
|
(
|
||||||||||
| Interest on employee loans, net of forgiveness |
|
|
|
|
||||||||||
| Net non-cash MSR and mortgage banking derivative activity |
(
|
|
(
|
|
||||||||||
| Interest expense, net of interest income |
(
|
(
|
(
|
(
|
||||||||||
| Income tax provision |
(
|
(
|
(
|
(
|
||||||||||
|
Depreciation and amortization
(1)
|
(
|
(
|
(
|
(
|
||||||||||
| Net income attributable to common shareholders | $ |
|
|
$ |
|
|
||||||||
(1) This adjustment excludes the noncontrolling interest portion of amortization of acquisition-related intangibles which is not attributable to common shareholders.
5.
BUSINESS COMBINATIONS, GOODWILL AND OTHER INTANGIBLE ASSETS
2023 Business Combinations Activity
During the nine months ended September 30, 2023, we completed one strategic acquisition. This strategic acquisition is presented below.
| Acquired Company | Quarter of Acquisition | Country | Primary Segment | ||||||||
| Kensington Capital Advisors (KCA) | Q2 | United States | Capital Markets | ||||||||
Aggregate terms of our acquisition included: (1) cash paid at closing of $
13.6
million and (2) prior 50.0% ownership previously accounted for as an equity method investment which had a fair value of $
10.0
million.
A preliminary allocation of purchase consideration resulted in goodwill of $
18.7
million, identifiable intangibles of $
2.1
million and other net assets (acquired assets less assumed liabilities) of $
2.8
million. As of September 30, 2023, we have not completed our analysis to assign fair values to all of the identifiable intangible and tangible assets acquired and, therefore, we may further refine the purchase price allocations for this acquisition during the open measurement period.
During the nine months ended September 30, 2023, we paid $
22.8
million for deferred business acquisition and earn-out obligations for acquisitions completed in prior years.
2022 Business Combinations Activity
During the nine months ended September 30, 2022, we completed no strategic acquisitions.
12
Earn-Out Payments
| ($ in millions) | September 30, 2023 | December 31, 2022 | |||||||||
| Number of acquisitions with earn-out payments subject to the achievement of certain performance criteria |
|
|
|||||||||
| Maximum earn-out payments (undiscounted) | $ |
|
|
||||||||
|
Short-term earn-out liabilities (fair value)
(1)
|
|
|
|||||||||
|
Long-term earn-out liabilities (fair value)
(1)
|
|
|
|||||||||
(1)
Included in Short-term and Long-term acquisition-related obligations on the Condensed Consolidated Balance Sheets.
Assuming the achievement of the applicable performance criteria, we anticipate making these earn-out payments over the next five years. Refer to Note 8, Fair Value Measurements, and Note 11, Restructuring and Acquisition Charges, for additional discussion of our earn-out liabilities.
Goodwill and Other Intangible Assets
Goodwill and unamortized intangibles as of September 30, 2023 consisted of: (1) goodwill of $
4,541.8
million, (2) identifiable intangibles of $
803.2
million amortized over their remaining finite useful lives and (3) $
47.8
million of identifiable intangibles with indefinite useful lives that are not amortized. Notable portions of our goodwill and unamortized intangibles are denominated in currencies other than the U.S. dollar, which means a portion of the movements in the reported book value of these balances is attributable to movements in foreign currency exchange rates.
The following table details, by reporting segment, movements in goodwill.
| (in millions) | Markets Advisory | Capital Markets | Work Dynamics | JLL Technologies | LaSalle | Consolidated | |||||||||||||||||
| Balance as of December 31, 2022 | $ |
|
|
|
|
|
$ |
|
|||||||||||||||
| Additions, net of adjustments |
|
|
|
|
|
|
|||||||||||||||||
| Dispositions |
(
|
(
|
|
|
|
(
|
|||||||||||||||||
| Impact of exchange rate movements |
(
|
(
|
(
|
(
|
|
(
|
|||||||||||||||||
| Balance as of September 30, 2023 | $ |
|
|
|
|
|
$ |
|
|||||||||||||||
| (in millions) | Markets Advisory | Capital Markets | Work Dynamics | JLL Technologies | LaSalle | Consolidated | |||||||||||||||||
| Balance as of January 1, 2022 | $ |
|
|
|
|
|
$ |
|
|||||||||||||||
| Additions, net of adjustments |
|
|
|
|
|
|
|||||||||||||||||
| Impact of exchange rate movements |
(
|
(
|
(
|
(
|
(
|
(
|
|||||||||||||||||
| Balance as of September 30, 2022 | $ |
|
|
|
|
|
$ |
|
|||||||||||||||
13
The following tables detail, by intangible type, movements in the gross carrying amount and accumulated amortization of our identifiable intangibles.
| (in millions) | MSRs | Other Intangibles | Consolidated | |||||||||||
| Gross Carrying Amount | ||||||||||||||
| Balance as of December 31, 2022 | $ |
|
|
$ |
|
|||||||||
|
Additions, net of adjustments
(1)
|
|
|
|
|||||||||||
| Adjustment for fully amortized intangibles |
(
|
(
|
(
|
|||||||||||
| Impact of exchange rate movements |
|
(
|
(
|
|||||||||||
| Balance as of September 30, 2023 | $ |
|
|
$ |
|
|||||||||
| Accumulated Amortization | ||||||||||||||
| Balance as of December 31, 2022 | $ |
(
|
(
|
$ |
(
|
|||||||||
|
Amortization, net
(2)
|
(
|
(
|
(
|
|||||||||||
| Adjustment for fully amortized intangibles |
|
|
|
|||||||||||
| Impact of exchange rate movements |
|
|
|
|||||||||||
| Balance as of September 30, 2023 | $ |
(
|
(
|
$ |
(
|
|||||||||
| Net book value as of September 30, 2023 | $ |
|
|
$ |
|
|||||||||
(1) Included in this amount for MSRs was $
8.4
million relating to prepayments/write-offs due to prepayments of the underlying obligation for which we assumed, acquired or retained the servicing rights.
(2) Amortization of MSRs is included in Revenue within the Condensed Consolidated Statements of Comprehensive Income.
| (in millions) | MSRs | Other Intangibles | Total | |||||||||||
| Gross Carrying Amount | ||||||||||||||
| Balance as of December 31, 2021 | $ |
|
|
$ |
|
|||||||||
|
Additions, net of adjustments
(1)
|
|
|
|
|||||||||||
| Adjustment for fully amortized intangibles |
(
|
(
|
(
|
|||||||||||
| Impact of exchange rate movements |
|
(
|
(
|
|||||||||||
| Balance as of September 30, 2022 | $ |
|
|
$ |
|
|||||||||
| Accumulated Amortization | ||||||||||||||
| Balance as of December 31, 2021 | $ |
(
|
(
|
$ |
(
|
|||||||||
|
Amortization, net
(2)
|
(
|
(
|
(
|
|||||||||||
| Adjustment for fully amortized intangibles |
|
|
|
|||||||||||
| Impact of exchange rate movements |
|
|
|
|||||||||||
| Balance as of September 30, 2022 | $ |
(
|
(
|
$ |
(
|
|||||||||
| Net book value as of September 30, 2022 | $ |
|
|
$ |
|
|||||||||
(1) Included in this amount for MSRs was $
22.5
million relating to prepayments/write-offs due to prepayments of the underlying obligation for which we assumed, acquired or retained the servicing rights.
(2) Amortization of MSRs is included in Revenue within the Condensed Consolidated Statements of Comprehensive Income.
14
6.
INVESTMENTS
Summarized investment balances as of September 30, 2023 and December 31, 2022 are presented in the following table.
| (in millions) | September 30, 2023 | December 31, 2022 | |||||||||
| JLL Technologies investments | $ |
|
|
||||||||
| LaSalle co-investments |
|
|
|||||||||
| Other investments |
|
|
|||||||||
| Total | $ |
|
|
||||||||
Our JLL Technologies investments are, generally, investments in early to mid-stage proptech companies as well as proptech funds, while our LaSalle co-investments are, primarily, direct investments in
49
separate property or commingled funds, where we co-invest alongside our clients and for which we also have an advisory agreement.
We have maximum potential unfunded commitments to direct investments or investment vehicles of $
361.9
million and $
14.2
million as of September 30, 2023 for our LaSalle Investment Management business and JLL Technologies, respectively. Of the $
361.9
million related to LaSalle, while we remain contractually obligated, we do not expect a call on the $
60.3
million relating to a specific investment since the underlying fund moved into its liquidation phase in January 2020.
We evaluate our less-than-wholly-owned investments to determine whether the underlying entities are classified as variable interest entities ("VIEs"); we assess each identified VIE to determine whether we are the primary beneficiary. In prior periods, we determined we were the primary beneficiary of certain VIEs and, accordingly, we consolidated such entities. In December of 2022, as a result of a reconsideration event, we concluded we were no longer the primary beneficiary of these VIEs and, therefore, no longer consolidate these VIEs.
Summarized financial information for our consolidated VIEs is presented in the following table. As a result of the reconsideration event described above, there were no consolidated VIE balances as of September 30, 2023 and December 31, 2022; net income was consolidated up to the reconsideration date.
| Three Months Ended September 30, | Nine Months Ended September 30, | ||||||||||||||||
| (in millions) | 2023 | 2022 | 2023 | 2022 | |||||||||||||
| Revenue | $ |
|
|
$ |
|
|
|||||||||||
| Operating and other expenses |
|
(
|
|
(
|
|||||||||||||
|
Net gains on sale of investments
(1)
|
|
|
|
|
|||||||||||||
| Net (loss) income | $ |
|
(
|
$ |
|
|
|||||||||||
(1) The gain was included in Other income on the Condensed Consolidated Statements of Comprehensive Income.
We allocated the net (loss) income of the consolidated VIEs to the noncontrolling interest holders as Net (loss) income attributable to noncontrolling interest in our Condensed Consolidated Statements of Comprehensive Income.
Impairment
There were no significant other-than-temporary impairment charges on investments for the nine months ended September 30, 2023 and 2022.
15
Fair Value
We report a majority of our investments at fair value. For such investments, we increase or decrease our investment each reporting period by the change in the fair value and we report these fair value adjustments in our Condensed Consolidated Statements of Comprehensive Income within Equity (losses) earnings.
The table below shows the movement in our investments reported at fair value.
| (in millions) | 2023 | 2022 | ||||||
| Fair value investments as of January 1, | $ |
|
|
|||||
|
Investments
(1)
|
|
|
||||||
| Distributions |
(
|
(
|
||||||
| Change in fair value, net |
(
|
|
||||||
| Foreign currency translation adjustments, net |
(
|
(
|
||||||
| Fair value investments as of September 30, | $ |
|
|
|||||
(1) In 2023, $66.9 million in Notes receivable matured and (inclusive of accrued interest) converted to equity.
See Note 8, Fair Value Measurements, for additional discussion of our investments reported at fair value.
16
7.
STOCK-BASED COMPENSATION
Stock Unit Awards
Restricted stock unit ("RSU") and performance stock unit ("PSU") awards activity is presented in the following tables.
|
RSU Shares
(in 000's) |
PSU Shares
(in 000's) |
Total Shares
(in 000's) |
Weighted Average
Grant Date Fair Value |
Weighted Average
Remaining Contractual Life (in years) |
|||||||||||||||||||
|
Unvested as of June 30, 2023
|
|
|
|
$ |
|
|
|||||||||||||||||
| Granted |
|
|
|
|
|||||||||||||||||||
| Vested |
(
|
|
(
|
|
|||||||||||||||||||
| Forfeited |
(
|
(
|
(
|
|
|||||||||||||||||||
|
Unvested as of September 30, 2023
|
|
|
|
$ |
|
|
|||||||||||||||||
|
Unvested as of June 30, 2022
|
|
|
|
$ |
|
|
|||||||||||||||||
| Granted |
|
|
|
|
|||||||||||||||||||
| Vested |
(
|
|
(
|
|
|||||||||||||||||||
| Forfeited |
(
|
(
|
(
|
|
|||||||||||||||||||
|
Unvested as of September 30, 2022
|
|
|
|
$ |
|
|
|||||||||||||||||
|
RSU Shares
(in 000's) |
PSU Shares
(in 000's) |
Total Shares
(in 000's) |
Weighted Average
Grant Date Fair Value |
Weighted Average
Remaining Contractual Life (in years) |
|||||||||||||||||||
|
Unvested as of December 31, 2022
|
|
|
|
$ |
|
|
|||||||||||||||||
| Granted |
|
|
|
|
|||||||||||||||||||
| Vested |
(
|
(
|
(
|
|
|||||||||||||||||||
| Forfeited |
(
|
(
|
(
|
|
|||||||||||||||||||
|
Unvested as of September 30, 2023
|
|
|
|
$ |
|
|
|||||||||||||||||
|
Unvested as of December 31, 2021
|
|
|
|
$ |
|
|
|||||||||||||||||
| Granted |
|
|
|
|
|||||||||||||||||||
| Vested |
(
|
(
|
(
|
|
|||||||||||||||||||
| Forfeited |
(
|
(
|
(
|
|
|||||||||||||||||||
|
Unvested as of September 30, 2022
|
|
|
|
$ |
|
|
|||||||||||||||||
As of September 30, 2023, we had $
99.4
million of unamortized deferred compensation related to unvested RSUs and PSUs, which we anticipate recognizing over varying periods into 2027.
For the three and nine months ended September 30, 2023, we recorded $
13.5
million of stock-based compensation expense reversal associated with the expected achievement against performance measures of certain PSU awards.
17
8.
FAIR VALUE MEASUREMENTS
We measure certain assets and liabilities in accordance with ASC Topic 820,
Fair Value Measurements and Disclosures
, which defines fair value as the price that would be received for an asset, or paid to transfer a liability, in an orderly transaction between market participants on the measurement date. In addition, it establishes a framework for measuring fair value according to the following three-tier fair value hierarchy:
•
Level 1 - Quoted prices for identical assets or liabilities in active markets accessible as of the measurement date;
•
Level 2 - Inputs, other than quoted prices in active markets, that are observable either directly or indirectly; and
•
Level 3 - Unobservable inputs in which there is little or no market data, which require the reporting entity to develop its own assumptions.
Financial Instruments
Our financial instruments include Cash and cash equivalents, Trade receivables, Notes and other receivables, Reimbursable receivables, Warehouse receivables, restricted cash, contract assets, Accounts payable, Reimbursable payables, Short-term borrowings, contract liabilities, Warehouse facilities, Credit facility, Long-term debt and foreign currency forward contracts. The carrying amounts of Cash and cash equivalents, Trade receivables, Notes and other receivables, Reimbursable receivables, restricted cash, contract assets, Accounts payable, Reimbursable payables, contract liabilities and the Warehouse facilities approximate their estimated fair values due to the short-term nature of these instruments. The carrying values of our Credit facility and Short-term borrowings approximate their estimated fair values given the variable interest rate terms and market spreads.
We estimated the fair value of our Long-term debt using dealer quotes that are Level 2 inputs in the fair value hierarchy.
The fair value and carrying value of our debt are presented in the following table.
| (in millions) | September 30, 2023 | December 31, 2022 | |||||||||
| Long-term debt, fair value | $ |
|
|
||||||||
| Long-term debt, carrying value, net of debt issuance costs |
|
|
|||||||||
Investments at Fair Value - Net Asset Value ("NAV")
We report a significant portion of our investments at fair value. For such investments, we increase or decrease our investment each reporting period by the change in the fair value, and we report these fair value adjustments in our Condensed Consolidated Statements of Comprehensive Income within Equity (losses) earnings.
For a subset of our investments reported at fair value, we estimate the fair value using the NAV per share (or its equivalent) our investees provide. Critical inputs to NAV estimates included valuations of the underlying real estate assets and borrowings, which incorporate investment-specific assumptions such as discount rates, capitalization rates, rental and expense growth rates, and asset-specific market borrowing rates. We did not consider any adjustments to NAV estimates provided by investees, including adjustments for any restrictions to the transferability of ownership interests embedded within investment agreements to which we are a party, to be necessary based upon (i) our understanding of the methodology utilized and inputs incorporated to estimate NAV at the investee level, (ii) consideration of market demand for the specific types of real estate assets held by each venture and (iii) contemplation of real estate and capital markets conditions in the localities in which these ventures operate. As of September 30, 2023 and December 31, 2022, investments at fair value using NAV were $
307.8
million and $
284.6
million, respectively. As these investments are not required to be classified in the fair value hierarchy, they have been excluded from the following table.
18
Recurring Fair Value Measurements
The following table categorizes by level in the fair value hierarchy the estimated fair value of our assets and liabilities measured at fair value on a recurring basis.
| September 30, 2023 | December 31, 2022 | ||||||||||||||||||||||
| (in millions) | Level 1 | Level 2 | Level 3 | Level 1 | Level 2 | Level 3 | |||||||||||||||||
| Assets | |||||||||||||||||||||||
| Investments - fair value | $ |
|
|
|
|
|
|
||||||||||||||||
| Foreign currency forward contracts receivable |
|
|
|
|
|
|
|||||||||||||||||
| Warehouse receivables |
|
|
|
|
|
|
|||||||||||||||||
| Deferred compensation plan assets |
|
|
|
|
|
|
|||||||||||||||||
| Mortgage banking derivative assets |
|
|
|
|
|
|
|||||||||||||||||
| Total assets at fair value | $ |
|
|
|
|
|
|
||||||||||||||||
| Liabilities | |||||||||||||||||||||||
| Foreign currency forward contracts payable | $ |
|
|
|
|
|
|
||||||||||||||||
| Deferred compensation plan liabilities |
|
|
|
|
|
|
|||||||||||||||||
| Earn-out liabilities |
|
|
|
|
|
|
|||||||||||||||||
| Mortgage banking derivative liabilities |
|
|
|
|
|
|
|||||||||||||||||
| Total liabilities at fair value | $ |
|
|
|
|
|
|
||||||||||||||||
Investments
We classify one investment as Level 1 in the fair value hierarchy as a quoted price is readily available. We increase or decrease our investment each reporting period by the change in the fair value of the investment. We report the fair value adjustments in our Condensed Consolidated Statements of Comprehensive Income within Equity (losses) earnings.
Investments classified as Level 3 in the fair value hierarchy represent investments in early to mid-stage non-public entities where we elected the fair value option. To the extent there are changes in fair value, we recognize such changes through Equity (losses) earnings. Such changes are generally the result of pricing in subsequent funding rounds, changes in business strategy or performance updates from the investee. For most of our investments, the carrying value was deemed to approximate fair value due to the proximity of the investment date, or date of most recent financing raise, to the balance sheet date, as well as consideration of investee-level performance updates.
Foreign Currency Forward Contracts
We regularly use foreign currency forward contracts to manage our currency exchange rate risk related to intercompany lending and cash management practices. We determine the fair values of these contracts based on current market rates. The inputs for these valuations are Level 2 inputs in the fair value hierarchy.
The following table details the gross notional value and net basis of these contracts.
| (in billions) | September 30, 2023 | December 31, 2022 | |||||||||
| Foreign currency forward contracts, gross notional value | $ |
|
|
||||||||
| Foreign currency forward contracts, net basis |
|
|
|||||||||
19
We record the asset and liability positions for our foreign currency forward contracts based on the net payable or net receivable position with the financial institutions from which we purchase these contracts.
The outstanding balances of these contracts are presented in the following table.
| (in millions) | September 30, 2023 | December 31, 2022 | |||||||||
| Net asset, receivable positions | $ |
|
|
||||||||
| Net asset, payable positions |
(
|
(
|
|||||||||
| Foreign currency forward contracts receivable | $ |
|
|
||||||||
| Net liability, receivable positions | $ |
(
|
(
|
||||||||
| Net liability, payable positions |
|
|
|||||||||
| Foreign currency forward contracts payable | $ |
|
|
||||||||
Warehouse Receivables
As of September 30, 2023 and December 31, 2022, all of our Warehouse receivables were under commitment to be purchased by government-sponsored enterprises ("GSEs") or by a qualifying investor as part of a U.S. government or GSE mortgage-backed security program.
Deferred Compensation
We maintain a deferred compensation plan for certain of our U.S. employees that allows them to defer portions of their compensation. We recorded this plan on our Condensed Consolidated Balance Sheet as Deferred compensation plan assets, long-term deferred compensation plan liabilities, included in Deferred compensation, and as a reduction of equity, Shares held in trust.
The components of the plan are presented in the following table.
| (in millions) | September 30, 2023 | December 31, 2022 | |||||||||
| Deferred compensation plan assets | $ |
|
|
||||||||
| Long-term deferred compensation plan liabilities |
|
|
|||||||||
| Shares held in trust |
|
|
|||||||||
Earn-Out Liabilities
We classify our Earn-out liabilities within Level 3 in the fair value hierarchy because the inputs we use to develop the estimated fair value include unobservable inputs. See Note 5, Business Combinations, Goodwill and Other Intangible Assets, for additional discussion of our Earn-out liabilities.
Mortgage Banking Derivatives
Both our interest rate lock commitments to prospective borrowers and forward sale contracts with prospective investors are undesignated derivatives and considered Level 3 valuations due to significant unobservable inputs related to counterparty credit risk. An increase in counterparty credit risk assumptions would result in a lower fair value measurement.
20
The tables below present a reconciliation for assets and liabilities measured at fair value on a recurring basis using significant unobservable inputs (Level 3).
| (in millions) | Balance as of June 30, 2023 | Net change in fair value |
Foreign CTA
(1)
|
Purchases / Additions | Settlements |
Transfers in
(2)
|
Balance as of
September 30, 2023 |
|||||||||||||||||||
| Investments | $ |
|
(
|
(
|
|
|
|
$ |
|
|||||||||||||||||
| Mortgage banking derivative assets and liabilities, net |
|
|
|
|
(
|
|
|
|||||||||||||||||||
| Earn-out liabilities |
|
|
(
|
|
(
|
|
|
|||||||||||||||||||
| (in millions) | Balance as of June 30, 2022 | Net change in fair value |
Foreign CTA
(1)
|
Purchases / Additions | Settlements | Transfers out | Balance as of September 30, 2022 | |||||||||||||||||||
| Investments | $ |
|
|
|
|
|
(
|
$ |
|
|||||||||||||||||
| Mortgage banking derivative assets and liabilities, net |
|
|
|
|
(
|
|
|
|||||||||||||||||||
| Earn-out liabilities |
|
(
|
(
|
|
(
|
|
|
|||||||||||||||||||
| (in millions) | Balance as of December 31, 2022 | Net change in fair value |
Foreign CTA
(1)
|
Purchases / Additions | Settlements |
Transfers in
(2)
|
Balance as of
September 30, 2023 |
|||||||||||||||||||
| Investments | $ |
|
(
|
|
|
|
|
$ |
|
|||||||||||||||||
| Mortgage banking derivative assets and liabilities, net |
|
|
|
|
(
|
|
|
|||||||||||||||||||
| Earn-out liabilities |
|
(
|
|
|
(
|
|
|
|||||||||||||||||||
| (in millions) | Balance as of December 31, 2021 | Net change in fair value |
Foreign CTA
(1)
|
Purchases / Additions | Settlements | Transfers out | Balance as of September 30, 2022 | |||||||||||||||||||
| Investments | $ |
|
|
|
|
|
(
|
$ |
|
|||||||||||||||||
| Mortgage banking derivative assets and liabilities, net |
|
|
|
|
(
|
|
|
|||||||||||||||||||
| Earn-out liabilities |
|
|
(
|
|
(
|
|
|
|||||||||||||||||||
(1) CTA: Currency translation adjustments
(2) Notes receivable (inclusive of accrued interest) converted to equity upon maturity and was classified as a Level 3 investment immediately.
Net change in fair value, included in the tables above, is reported in Net income as follows.
| Category of Assets/Liabilities using Unobservable Inputs |
Condensed Consolidated Statements
of Comprehensive Income Account Caption |
||||
| Earn-out liabilities (Short-term and Long-term) | Restructuring and acquisition charges | ||||
| Investments | Equity (losses) earnings | ||||
| Other current assets - Mortgage banking derivative assets | Revenue | ||||
| Other current liabilities - Mortgage banking derivative liabilities | Revenue | ||||
21
Non-Recurring Fair Value Measurements
We review our investments, except those investments otherwise reported at fair value, on a quarterly basis, or as otherwise deemed necessary, for indications of whether we may be unable to recover the carrying value of our investments and whether such investments are other than temporarily impaired. When the carrying amount of the investment is in excess of the estimated future undiscounted cash flows, we use a discounted cash flow approach or other acceptable method to determine the fair value of the investment in computing the amount of the impairment. Our determination of fair value primarily relies on Level 3 inputs. We did not recognize any significant investment-level impairment losses during either of the nine months ended September 30, 2023 or 2022. See Note 6, Investments, for additional information, including information related to impairment charges recorded at the investee level.
9.
DEBT
Debt is composed of the following obligations.
| ($ in millions) | September 30, 2023 | December 31, 2022 | ||||||
| Local overdraft facilities | $ |
|
|
|||||
| Other short-term borrowings |
|
|
||||||
| Short-term borrowings | $ |
|
|
|||||
|
Credit facility, net of debt issuance costs of $
|
|
|
||||||
|
Long-term senior notes,
|
|
|
||||||
|
Long-term senior notes,
|
|
|
||||||
| Total debt | $ |
|
|
|||||
Credit Facilities
We have a $
3.35
billion unsecured revolving credit facility (the "Facility") that matures on April 14, 2026. Pricing on the Facility ranges from Adjusted Term Secured Overnight Financing Rate
("SOFR") plus 0.875% to 1.35%
, with pricing as of September 30, 2023 at Adjusted Term
SOFR
plus
0.98
%. In addition to outstanding borrowings under the Facility presented in the above table, we had outstanding letters of credit under the Facility of $
0.4
million as of both September 30, 2023 and December 31, 2022.
In addition, we have an uncommitted credit agreement (the "Uncommitted Facility"), which allows for discretionary short-term liquidity of up to $
400.0
million. Interest and fees are set at the time of utilization and calculated on a 360-day basis. Between quarter-end dates, we intend to use the proceeds to reduce indebtedness under the Facility at a lower interest rate. As such, the Uncommitted Facility had no outstanding balance as of both September 30, 2023 and December 31, 2022.
The following table provides additional information on our Facility and Uncommitted Facility, collectively.
| Three Months Ended September 30, | Nine Months Ended September 30, | |||||||||||||
| ($ in millions) | 2023 | 2022 | 2023 | 2022 | ||||||||||
| Average outstanding borrowings | $ |
|
|
$ |
|
|
||||||||
| Average effective interest rate |
|
% |
|
% |
|
% |
|
% | ||||||
We will continue to use the Facility for, but not limited to, business acquisitions, working capital needs (including payment of accrued incentive compensation), co-investment activities, share repurchases and capital expenditures.
Short-Term and Long-Term Debt
In addition to our credit facilities, we have the capacity to borrow up to an additional $
52.9
million under local overdraft facilities. Amounts outstanding are presented in the debt table above.
As of September 30, 2023, our issuer and senior unsecured ratings are investment grade: Baa1 from Moody’s Investors Service, Inc. and BBB+ from Standard & Poor’s Ratings Services.
22
Covenants
Our Facility and senior notes are subject to customary financial and other covenants, including cash interest coverage ratios and leverage ratios, as well as event of default conditions. We remained in compliance with all covenants as of September 30, 2023.
Warehouse Facilities
| September 30, 2023 | December 31, 2022 | ||||||||||||||||
| ($ in millions) | Outstanding Balance | Maximum Capacity | Outstanding Balance | Maximum Capacity | |||||||||||||
| Warehouse facilities: | |||||||||||||||||
|
|
$ |
|
|
|
|
||||||||||||
|
|
|
|
|
|
|||||||||||||
|
|
|
|
|
|
|||||||||||||
|
Fannie Mae ASAP
(5)
program,
|
|
n/a |
|
n/a | |||||||||||||
| Gross warehouse facilities |
|
|
|
|
|||||||||||||
| Debt issuance costs |
(
|
n/a |
(
|
n/a | |||||||||||||
| Total warehouse facilities | $ |
|
|
|
|
||||||||||||
(1) Bloomberg Short-Term Bank Yield Index rate ("BSBY")
(2) In the third quarter of 2023, JLL extended the Warehouse facility; previously, the facility had a maturity date of September 18, 2023.
(3) In the third quarter of 2023, JLL extended the Warehouse facility; previously, the facility had a maturity date of September 15, 2023.
(4) In the third quarter of 2023, JLL extended the Warehouse facility; previously, the facility had a maturity date of July 28, 2023.
(5) As Soon As Pooled ("ASAP") funding program.
We have lines of credit established for the sole purpose of funding our Warehouse receivables. These lines of credit exist with financial institutions and are secured by the related warehouse receivables. Pursuant to these facilities, we are required to comply with certain financial covenants regarding (i) minimum net worth, (ii) minimum servicing-related loans and (iii) minimum adjusted leverage ratios. We remained in compliance with all covenants under our facilities as of September 30, 2023.
23
10.
COMMITMENTS AND CONTINGENCIES
We are a defendant in various litigation matters arising in the ordinary course of business, some of which involve claims for damages that are substantial in amount.
Professional Indemnity Insurance
In order to better manage our global insurance program and support our risk management efforts, we supplement our traditional insurance coverage for certain types of claims by using a wholly-owned captive insurance company. The level of risk retained by our captive insurance company, with respect to professional indemnity claims, is up to $
10.0
million per claim, inclusive of the deductible. We contract third-party insurance companies to provide coverage of risk in excess of this amount. When a potential loss event occurs, we estimate the ultimate cost of the claim and accrue the amount in Other current and long-term liabilities on our Condensed Consolidated Balance Sheets when probable and estimable. In addition, we have established receivables from third-party insurance providers for claim amounts in excess of the risk retained by our captive insurance company. As of September 30, 2023 and December 31, 2022, these receivables were $
2.2
million and $
22.5
million, respectively, and are included in Notes and other receivables on our Condensed Consolidated Balance Sheets.
The following table shows the professional indemnity accrual activity and related payments.
| (in millions) | |||||
| December 31, 2022 | $ |
|
|||
| New claims |
|
||||
| Prior year claims adjustments (including foreign currency changes) |
|
||||
| Claims paid |
(
|
||||
| September 30, 2023 | $ |
|
|||
| December 31, 2021 | $ |
|
|||
| New claims |
|
||||
| Prior year claims adjustments (including foreign currency changes) |
(
|
||||
| Claims paid |
(
|
||||
| September 30, 2022 | $ |
|
|||
Delegated Underwriting and Servicing ("DUS") Program Loan Loss-Sharing
As a participant in the DUS program, we retain a portion of the risk of loss for loans that are originated and sold under the DUS program. Net losses on defaulted loans are shared with Fannie Mae based upon established loss-sharing ratios. Generally, we share approximately one-third of incurred losses, subject to a cap of 20% of the principal balance of the mortgage at origination. As of September 30, 2023 and December 31, 2022, we had loans, funded and sold, subject to such loss-sharing arrangements with an aggregate unpaid principal balance of $
20.5
billion and $
18.3
billion, respectively.
For all DUS program loans with loss-sharing obligations, we record a non-contingent liability equal to the estimated fair value of the guarantee obligations undertaken upon sale of the loan, which reduces our gain on sale of the loan. Subsequently, this liability is amortized over the estimated life of the loan and recognized as Revenue on the Condensed Consolidated Statements of Comprehensive Income. As of September 30, 2023 and December 31, 2022, the loss-sharing guarantee obligations were $
31.1
million and $
29.0
million, respectively, and are included in Other liabilities on our Condensed Consolidated Balance Sheets. There were no loan losses incurred during the nine months ended September 30, 2023 and 2022.
24
11.
RESTRUCTURING AND ACQUISITION CHARGES
Restructuring and acquisition charges include cash and non-cash expenses. Cash-based charges primarily consist of (i) severance and employment-related charges, including those related to external service providers, incurred in conjunction with a structural business shift, which can be represented by a notable change in headcount, change in leadership, or transformation of business processes, (ii) acquisition, transaction and integration-related charges and (iii) other restructuring including lease exit charges. Non-cash charges include (i) stock-based compensation expense for retention awards issued in conjunction with prior-period acquisitions and (ii) fair value adjustments to earn-out liabilities relating to prior-period acquisition activity.
Restructuring and acquisition charges are presented in the table below.
| Three Months Ended September 30, | Nine Months Ended September 30, | ||||||||||||||||
| (in millions) | 2023 | 2022 | 2023 | 2022 | |||||||||||||
| Severance and other employment-related charges | $ |
|
|
$ |
|
|
|||||||||||
| Restructuring, pre-acquisition and post-acquisition charges |
|
|
|
|
|||||||||||||
|
Stock-based compensation expense for post-acquisition retention awards
(1)
|
(
|
|
|
|
|||||||||||||
| Fair value adjustments to earn-out liabilities |
|
(
|
(
|
|
|||||||||||||
| Restructuring and acquisition charges | $ |
|
|
$ |
|
|
|||||||||||
(1) Includes the impact of shares forfeited during the third quarter.
We expect nearly all expenses related to (i) severance and other employment-related charges and (ii) restructuring, pre-acquisition and post-acquisition charges as of September 30, 2023 will be paid during the next twelve months.
25
12.
ACCUMULATED OTHER COMPREHENSIVE INCOME (LOSS) BY COMPONENT
The tables below present the changes in Accumulated other comprehensive income (loss) ("AOCI") by component.
| (in millions) | Pension and postretirement benefit | Cumulative foreign currency translation adjustment | Total | |||||||||||
| Balance as of June 30, 2023 | $ |
(
|
(
|
$ |
(
|
|||||||||
| Other comprehensive loss before reclassification |
|
(
|
(
|
|||||||||||
|
Amounts reclassified from AOCI after tax expense of
$ -, $ - and $ -
|
|
|
|
|||||||||||
| Other comprehensive loss after tax expense of $ - , $ - and $ - |
|
(
|
(
|
|||||||||||
| Balance as of September 30, 2023 | $ |
(
|
(
|
$ |
(
|
|||||||||
| (in millions) | Pension and postretirement benefit | Cumulative foreign currency translation adjustment | Total | |||||||||||
| Balance as of June 30, 2022 | $ |
(
|
(
|
$ |
(
|
|||||||||
| Other comprehensive loss before reclassification |
|
(
|
(
|
|||||||||||
|
Amounts reclassified from AOCI after tax expense of
$ - , $ - and $ - |
|
|
|
|||||||||||
| Other comprehensive loss after tax expense of $ - , $ - and $ - |
|
(
|
(
|
|||||||||||
| Balance as of September 30, 2022 | $ |
(
|
(
|
$ |
(
|
|||||||||
| (in millions) | Pension and postretirement benefit | Cumulative foreign currency translation adjustment | Total | |||||||||||
| Balance as of December 31, 2022 | $ |
(
|
(
|
$ |
(
|
|||||||||
| Other comprehensive loss before reclassification |
(
|
(
|
(
|
|||||||||||
|
Amounts reclassified from AOCI after tax expense of
$ - , $ - and $ - |
|
|
|
|||||||||||
| Other comprehensive loss after tax expense of $ - , $ - and $ - |
(
|
(
|
(
|
|||||||||||
| Balance as of September 30, 2023 | $ |
(
|
(
|
$ |
(
|
|||||||||
| (in millions) | Pension and postretirement benefit | Cumulative foreign currency translation adjustment | Total | |||||||||||
| Balance as of December 31, 2021 | $ |
(
|
(
|
$ |
(
|
|||||||||
| Other comprehensive loss before reclassification |
|
(
|
(
|
|||||||||||
|
Amounts reclassified from AOCI after tax expense of
$ - , $ - and $ - |
|
|
|
|||||||||||
| Other comprehensive loss after tax expense of $ - , $ - and $ - |
|
(
|
(
|
|||||||||||
| Balance as of September 30, 2022 | $ |
(
|
(
|
$ |
(
|
|||||||||
For pension and postretirement benefits, we report amounts reclassified from Accumulated other comprehensive income (loss) in Other income within the Condensed Consolidated Statements of Comprehensive Income.
26
Item 2. Management's Discussion and Analysis of Financial Condition and Results of Operations
The following discussion and analysis should be read in conjunction with the Condensed Consolidated Financial Statements, including the notes thereto, for the three and nine months ended September 30, 2023, and our audited Consolidated Financial Statements, including the notes thereto, for the fiscal year ended December 31, 2022, which are included in our 2022 Annual Report on Form 10-K, filed with the SEC and also available on our website (
www.jll.com
). You should also refer to Item 7. Management's Discussion and Analysis of Financial Condition and Results of Operations contained in our 2022 Annual Report on Form 10-K.
The following discussion and analysis contains certain forward-looking statements generally identified by the words anticipates, believes, estimates, expects, forecasts, plans, intends and other similar expressions. Such forward-looking statements involve known and unknown risks, uncertainties and other factors that may cause JLL's actual results, performance, achievements, plans and objectives to be materially different from any future results, performance, achievements, plans and objectives expressed or implied by such forward-looking statements. See the Cautionary Note Regarding Forward-Looking Statements included within this section for further information.
We present our quarterly Management's Discussion and Analysis in the following sections:
(1)
A summary of our critical accounting policies and estimates;
(2)
Certain items affecting the comparability of results and certain market and other risks we face;
(3)
The results of our operations, first on a consolidated basis and then for each of our business segments; and
(4)
Liquidity and capital resources.
SUMMARY OF CRITICAL ACCOUNTING POLICIES AND ESTIMATES
An understanding of our accounting policies is necessary for a complete analysis of our results, financial position, liquidity and trends. See Note 2, Summary of Significant Accounting Policies, of the Notes to Consolidated Financial Statements in our 2022 Annual Report on Form 10-K for a complete summary of our significant accounting policies.
The preparation of our financial statements requires management to make certain critical accounting estimates and judgments that impact (1) the stated amount of assets and liabilities, (2) disclosure of contingent assets and liabilities at the date of the financial statements and (3) the reported amount of revenue and expenses during the reporting periods. These accounting estimates are based on management's judgment. We consider them to be critical because of their significance to the financial statements and the possibility that future events may differ from current judgments or that the use of different assumptions could result in materially different estimates. We review these estimates on a periodic basis to ensure reasonableness. Although actual amounts likely differ from such estimated amounts, we believe such differences are not likely to be material.
A discussion of our critical accounting policies and estimates used in the preparation of our Condensed Consolidated Financial Statements included in Part I, Item 1 of this Quarterly Report on Form 10-Q can be found in Item 7. Management's Discussion and Analysis of Financial Condition and Results of Operations of our Annual Report on Form 10-K for the year ended December 31, 2022. There have been no material changes to these critical accounting policies and estimates during the nine months ended September 30, 2023.
ITEMS AFFECTING COMPARABILITY
Macroeconomic Conditions
Our results of operations and the variability of these results are significantly influenced by (i) macroeconomic trends, (ii) the geopolitical environment, (iii) the global and regional real estate markets and (iv) the financial and credit markets. These macroeconomic and other conditions have had, and we expect will continue to have, a significant impact on the variability of our results of operations.
27
Acquisitions and Dispositions
The timing of acquisitions and dispositions may impact the comparability of our results on a year-over-year basis. Our results include incremental revenues and expenses following the completion date of an acquisition. Relating to dispositions, comparable results will include the revenues and expenses of recent dispositions and results may also include gains (losses) on the disposition. In addition, there is generally an initial adverse impact on net income from an acquisition as a result of pre-acquisition due diligence expenditures, transaction/deal costs and post-acquisition integration costs, such as fees from third-party advisors engaged to assist with onboarding and process alignment, retention and severance expense, early lease termination costs and other integration expenses. For dispositions, we may also incur such incremental costs during the disposition process and these costs could have an adverse impact on net income.
Equity Earnings and Incentive Fees
Equity earnings may vary substantially from period to period for a variety of reasons, including as a result of (i) valuation increases (decreases) on investments reported at fair value, (ii) gains (losses) on asset dispositions and (iii) impairment charges. The timing of recognition of these items may impact comparability between quarters, in any one year, or compared with a prior year.
LaSalle, our investment management business, is in part compensated through incentive fees where performance of underlying funds' investments exceeds agreed-to return hurdles. Depending upon performance, disposition activity and the contractual timing of measurement periods with clients, these fees can be significant and may vary substantially from period to period.
The comparability of these items can be seen in Note 4, Business Segments, of the Notes to Condensed Consolidated Financial Statements and is discussed further in Segment Operating Results included herein.
Foreign Currency
We conduct business using a variety of currencies, but we report our results in U.S. dollars. As a result, the volatility of currencies against the U.S. dollar may positively or negatively impact our results. This volatility can make it more difficult to perform period-to-period comparisons of the reported U.S. dollar results of operations, because such results may indicate a growth or decline rate that might not have been consistent with the real underlying growth or decline rates in the local operations. Consequently, we provide information about the impact of foreign currencies in the period-to-period comparisons of the reported results of operations in our discussion and analysis of financial condition in the Results of Operations section below.
Transaction-Based Revenue
Transaction-based fees, which are impacted by the size and timing of our clients' transactions, from real estate investment banking, capital markets activities and other services within our segments, increase the variability of the revenue we earn. The timing and the magnitude of these fees can vary significantly from year to year and quarter to quarter, and from region to region.
Seasonality
Historically, our quarterly revenue and profits have tended to increase from quarter to quarter as the year progresses. This is a result of a general focus in the real estate industry on completing or documenting transactions by calendar year end and the fact that certain expenses are constant through the year. In addition, this seasonality excludes the recognition of investment-generated performance fees as well as realized and unrealized co-investment equity earnings and losses (the timing of each of these can fluctuate based on a variety of factors). Generally, we recognize incentive fees when assets are sold, the timing of which is geared toward the benefit of our clients. In addition, co-investment equity gains and losses are primarily dependent on valuations of underlying investments, the direction and magnitude of changes to such valuations fluctuate based on a variety of factors. Non-variable operating expenses, which we treat as expenses when incurred during the year, are relatively constant on a quarterly basis.
A significant portion of our Compensation and benefits expense is from incentive compensation plans, which we generally accrue throughout the year based on progress toward annual performance targets. This quarterly estimation can result in significant fluctuations in quarterly Compensation and benefits expense from period to period. Consequently, the results for the periods ended September 30, 2023 and 2022 are not fully indicative of the results we expect to realize for the full fiscal year.
28
RESULTS OF OPERATIONS
Definitions
•
Assets under management data for LaSalle is reported on a one-quarter lag.
•
MENA: Middle East & North Africa
•
n.m.: not meaningful, represented by a percentage change of greater than 1,000% or a change in margin of greater than 10,000 basis points ("bps"), favorable or unfavorable.
Consolidated Operating Results
| Three Months Ended September 30, | Change in | % Change in Local Currency | |||||||||||||||
| ($ in millions) | 2023 | 2022 | U.S. dollars | ||||||||||||||
| Markets Advisory | $ | 992.4 | 1,111.5 | (119.1) | (11) | % | (11) | % | |||||||||
| Capital Markets | 435.8 | 595.2 | (159.4) | (27) | (28) | ||||||||||||
| Work Dynamics | 3,514.2 | 3,289.8 | 224.4 | 7 | 6 | ||||||||||||
| JLL Technologies | 58.9 | 56.5 | 2.4 | 4 | 4 | ||||||||||||
| LaSalle | 110.1 | 124.5 | (14.4) | (12) | (13) | ||||||||||||
| Revenue | $ | 5,111.4 | 5,177.5 | (66.1) | (1) | % | (2) | % | |||||||||
| Gross contract costs | (3,327.1) | (3,123.7) | (203.4) | 7 | 6 | ||||||||||||
| Net non-cash MSR and mortgage banking derivative activity | 7.1 | (5.2) | 12.3 | (237) | (236) | ||||||||||||
| Fee revenue | $ | 1,791.4 | 2,048.6 | (257.2) | (13) | % | (13) | % | |||||||||
| Markets Advisory | 704.0 | 847.9 | (143.9) | (17) | (17) | ||||||||||||
| Capital Markets | 431.4 | 579.1 | (147.7) | (26) | (27) | ||||||||||||
| Work Dynamics | 497.7 | 452.9 | 44.8 | 10 | 9 | ||||||||||||
| JLL Technologies | 55.6 | 52.7 | 2.9 | 6 | 5 | ||||||||||||
| LaSalle | 102.7 | 116.0 | (13.3) | (11) | (13) | ||||||||||||
| Compensation and benefits, excluding gross contract costs | $ | 1,299.8 | 1,472.4 | (172.6) | (12) | % | (13) | % | |||||||||
| Operating, administrative and other expenses, excluding gross contract costs | 274.7 | 302.1 | (27.4) | (9) | (12) | ||||||||||||
| Depreciation and amortization | 59.1 | 55.7 | 3.4 | 6 | 5 | ||||||||||||
| Restructuring and acquisition charges | 31.6 | 21.0 | 10.6 | 50 | 46 | ||||||||||||
| Total fee-based operating expenses | 1,665.2 | 1,851.2 | (186.0) | (10) | (11) | ||||||||||||
| Gross contract costs | 3,327.1 | 3,123.7 | 203.4 | 7 | 6 | ||||||||||||
| Total operating expenses | $ | 4,992.3 | 4,974.9 | 17.4 | — | % | (1) | % | |||||||||
| Operating income | $ | 119.1 | 202.6 | (83.5) | (41) | % | (39) | % | |||||||||
| Equity (losses) earnings | $ | (11.2) | 0.5 | (11.7) | n.m. | n.m. | |||||||||||
| Adjusted EBITDA | $ | 205.2 | 276.2 | (71.0) | (26) | % | (23) | % | |||||||||
| Net income margin attributable to common shareholders (USD basis) | 1.2 | % | 2.7 | % | (150) bps | n/a | |||||||||||
| Adjusted EBITDA margin (local currency basis) | 12.0 | % | 13.5 | % | (200) bps | (150) bps | |||||||||||
| Adjusted EBITDA margin (USD basis) | 11.5 | % | |||||||||||||||
29
Consolidated Operating Results (continued)
| Nine Months Ended September 30, | Change in | % Change in Local Currency | |||||||||||||||
| ($ in millions) | 2023 | 2022 | U.S. dollars | ||||||||||||||
| Markets Advisory | $ | 2,924.2 | 3,229.2 | (305.0) | (9) | % | (9) | % | |||||||||
| Capital Markets | 1,240.9 | 1,880.3 | (639.4) | (34) | (34) | ||||||||||||
| Work Dynamics | 10,165.0 | 9,633.9 | 531.1 | 6 | 6 | ||||||||||||
| JLL Technologies | 180.9 | 156.6 | 24.3 | 16 | 16 | ||||||||||||
| LaSalle | 368.4 | 357.3 | 11.1 | 3 | 4 | ||||||||||||
| Revenue | $ | 14,879.4 | 15,257.3 | (377.9) | (2) | % | (2) | % | |||||||||
| Gross contract costs | (9,666.2) | (9,156.6) | (509.6) | 6 | 7 | ||||||||||||
| Net non-cash MSR and mortgage banking derivative activity | 9.5 | (12.8) | 22.3 | (174) | (174) | ||||||||||||
| Fee revenue | $ | 5,222.7 | 6,087.9 | (865.2) | (14) | % | (14) | % | |||||||||
| Markets Advisory | 2,072.4 | 2,444.9 | (372.5) | (15) | (15) | ||||||||||||
| Capital Markets | 1,216.5 | 1,831.3 | (614.8) | (34) | (33) | ||||||||||||
| Work Dynamics | 1,417.5 | 1,330.4 | 87.1 | 7 | 7 | ||||||||||||
| JLL Technologies | 169.9 | 146.0 | 23.9 | 16 | 16 | ||||||||||||
| LaSalle | 346.4 | 335.3 | 11.1 | 3 | 4 | ||||||||||||
| Compensation and benefits, excluding gross contract costs | $ | 3,812.4 | 4,380.6 | (568.2) | (13) | % | (12) | % | |||||||||
| Operating, administrative and other expenses, excluding gross contract costs | 859.1 | 874.8 | (15.7) | (2) | (2) | ||||||||||||
| Depreciation and amortization | 176.5 | 165.5 | 11.0 | 7 | 8 | ||||||||||||
| Restructuring and acquisition charges | 79.1 | 66.4 | 12.7 | 19 | 18 | ||||||||||||
| Total fee-based operating expenses | 4,927.1 | 5,487.3 | (560.2) | (10) | (10) | ||||||||||||
| Gross contract costs | 9,666.2 | 9,156.6 | 509.6 | 6 | 7 | ||||||||||||
| Total operating expenses | $ | 14,593.3 | 14,643.9 | (50.6) | — | % | — | % | |||||||||
| Operating income | $ | 286.1 | 613.4 | (327.3) | (53) | % | (53) | % | |||||||||
| Equity (losses) earnings | $ | (117.3) | 72.6 | (189.9) | (262) | % | (262) | % | |||||||||
| Adjusted EBITDA | $ | 430.3 | 908.8 | (478.5) | (53) | % | (52) | % | |||||||||
| Net income margin attributable to common shareholders (USD basis) | 0.4 | % | 3.1 | % | (270) bps | n/a | |||||||||||
| Adjusted EBITDA margin (local currency basis) | 8.3 | % | 14.9 | % | (670) bps | (660) bps | |||||||||||
| Adjusted EBITDA margin (USD basis) | 8.2 | % | |||||||||||||||
30
Non-GAAP Financial Measures
Management uses certain non-GAAP financial measures to develop budgets and forecasts, measure and reward performance against those budgets and forecasts, and enhance comparability to prior periods. These measures are believed to be useful to investors and other external stakeholders as supplemental measures of core operating performance and include the following:
•
Fee revenue and Fee-based operating expenses;
•
Adjusted EBITDA attributable to common shareholders ("Adjusted EBITDA") and Adjusted EBITDA margin (measured on fee revenue); and
•
Percentage changes against prior periods, presented on a local currency basis.
However, non-GAAP financial measures should not be considered alternatives to measures determined in accordance with U.S. GAAP. Any measure that eliminates components of a company’s capital structure, cost of operations or investments, or other results has limitations as a performance measure. In light of these limitations, management also considers U.S. GAAP financial measures and does not rely solely on non-GAAP financial measures. Because our non-GAAP financial measures are not calculated in accordance with U.S. GAAP, they may not be comparable to similarly titled measures used by other companies.
Adjustments to U.S. GAAP Financial Measures Used to Calculate non-GAAP Financial Measures
Gross contract costs
represent certain costs associated with client-dedicated employees and third-party vendors and subcontractors and are directly or indirectly reimbursed through the fees we receive. These costs are presented on a gross basis in Operating expenses with the equal amount of corresponding fees in Revenue. Excluding gross contract costs from both Fee revenue and Fee-based operating expenses more accurately reflects how we manage our expense base and operating margins and also enables a more consistent performance assessment across a portfolio of contracts with varying payment terms and structures.
Net non-cash MSR and mortgage banking derivative activity
consists of the balances presented within Revenue composed of (i) derivative gains/losses resulting from mortgage banking loan commitment and warehousing activity and (ii) gains recognized from the retention of MSR upon origination and sale of mortgage loans, offset by (iii) amortization of MSR intangible assets over the period that net servicing income is projected to be received. Non-cash derivative gains/losses resulting from mortgage banking loan commitment and warehousing activity are calculated as the estimated fair value of loan commitments and subsequent changes thereof, primarily represented by the estimated net cash flows associated with future servicing rights. MSR gains and corresponding MSR intangible assets are calculated as the present value of estimated net cash flows over the estimated mortgage servicing periods. The above activity is reported entirely within Revenue of the Capital Markets segment. Excluding net non-cash MSR and mortgage banking derivative activity reflects how we manage and evaluate performance because the excluded activity is non-cash in nature.
Restructuring and acquisition charges
primarily consist of (i) severance and employment-related charges, including those related to external service providers, incurred in conjunction with a structural business shift, which can be represented by a notable change in headcount, change in leadership or transformation of business processes; (ii) acquisition, transaction and integration-related charges, including fair value adjustments, which are generally non-cash in the periods such adjustments are made, to assets and liabilities recorded in purchase accounting such as earn-out liabilities and intangible assets; and (iii) other restructuring, including lease exit charges. Such activity is excluded as the amounts are generally either non-cash in nature or the anticipated benefits from the expenditures would not likely be fully realized until future periods. Restructuring and acquisition charges are excluded from segment operating results and therefore not a line item in the segments’ reconciliation to Adjusted EBITDA.
Gain/loss on disposition
reflects the gain or loss recognized on the sale or disposition of businesses. Given the low frequency of business disposals by the company historically, the gain or loss directly associated with such activity is excluded as it is not considered indicative of core operating performance. In 2023, the $0.5 million net loss included $1.8 million of loss related to the disposition of a business in Markets Advisory, partially offset by a $1.3 million gain related to the disposition of a business in Markets Advisory and Capital Markets. In 2022, the $7.5 million net loss included $10.5 million of loss related to the disposition of the Russia business, partially offset by a $3.0 million gain related to a disposition within JLL Technologies.
31
Interest on Employee Loans, Net of Forgiveness
reflects interest accrued on employee loans less the amount of accrued interest forgiven. Certain employees (predominantly in Leasing and Capital Markets) receive cash payments structured as loans, with interest. Employees earn forgiveness of the loan based on performance, generally calculated as a percentage of revenue production. Such forgiven amounts are reflected in Compensation and benefits expense. Given the interest accrued on these employee loans and subsequent forgiveness are non-cash and the amounts perfectly offset over the life of the loan, the activity is not indicative of core operating performance and is excluded from non-GAAP measures.
Reconciliation of Non-GAAP Financial Measures
Below are reconciliations of (i) Revenue to Fee revenue and (ii) Operating expenses to Fee-based operating expenses.
| Three Months Ended September 30, | Nine Months Ended September 30, | |||||||||||||
| (in millions) | 2023 | 2022 | 2023 | 2022 | ||||||||||
| Revenue | $ | 5,111.4 | 5,177.5 | $ | 14,879.4 | 15,257.3 | ||||||||
| Adjustments: | ||||||||||||||
| Gross contract costs | (3,327.1) | (3,123.7) | (9,666.2) | (9,156.6) | ||||||||||
| Net non-cash MSR and mortgage banking derivative activity | 7.1 | (5.2) | 9.5 | (12.8) | ||||||||||
| Fee revenue | $ | 1,791.4 | 2,048.6 | $ | 5,222.7 | 6,087.9 | ||||||||
| Operating expenses | $ | 4,992.3 | 4,974.9 | $ | 14,593.3 | 14,643.9 | ||||||||
|
Less:
Gross contract costs
|
(3,327.1) | (3,123.7) | (9,666.2) | (9,156.6) | ||||||||||
| Fee-based operating expenses | $ | 1,665.2 | 1,851.2 | $ | 4,927.1 | 5,487.3 | ||||||||
| Operating income | $ | 119.1 | 202.6 | $ | 286.1 | 613.4 | ||||||||
Below is a reconciliation of Net income attributable to common shareholders to EBITDA and Adjusted EBITDA.
| Three Months Ended September 30, | Nine Months Ended September 30, | |||||||||||||
| (in millions) | 2023 | 2022 | 2023 | 2022 | ||||||||||
| Net income attributable to common shareholders | $ | 59.7 | 140.2 | $ | 53.0 | 479.7 | ||||||||
| Add: | ||||||||||||||
| Interest expense, net of interest income | 37.1 | 23.2 | 103.9 | 49.1 | ||||||||||
| Income tax provision | 14.5 | 42.3 | 13.0 | 155.4 | ||||||||||
|
Depreciation and amortization
(1)
|
58.1 | 54.7 | 173.6 | 163.5 | ||||||||||
| EBITDA | $ | 169.4 | 260.4 | $ | 343.5 | 847.7 | ||||||||
| Adjustments: | ||||||||||||||
| Restructuring and acquisition charges | 31.6 | 21.0 | 79.1 | 66.4 | ||||||||||
| Net (gain) loss on disposition | (1.3) | — | 0.5 | 7.5 | ||||||||||
| Net non-cash MSR and mortgage banking derivative activity | 7.1 | (5.2) | 9.5 | (12.8) | ||||||||||
| Interest on employee loans, net of forgiveness | (1.6) | — | (2.3) | — | ||||||||||
| Adjusted EBITDA | $ | 205.2 | 276.2 | $ | 430.3 | 908.8 | ||||||||
(1) This adjustment excludes the noncontrolling interest portion of amortization of acquisition-related intangibles which is not attributable to common shareholders.
32
In discussing our operating results, we report Adjusted EBITDA margins and refer to percentage changes in local currency, unless otherwise noted. Amounts presented on a local currency basis are calculated by translating the current period results of our foreign operations to U.S. dollars using the foreign currency exchange rates from the comparative period. We believe this methodology provides a framework for assessing performance and operations excluding the effect of foreign currency fluctuations.
The following table reflects the reconciliation to local currency amounts for consolidated (i) Revenue, (ii) Fee revenue, (iii) Operating income and (iv) Adjusted EBITDA.
| Three Months Ended September 30, | Nine Months Ended September 30, | ||||||||||||||||
| ($ in millions) | 2023 | % Change | 2023 | % Change | |||||||||||||
| Revenue: | |||||||||||||||||
| At current period exchange rates | $ | 5,111.4 | (1) | % | $ | 14,879.4 | (2) | % | |||||||||
| Impact of change in exchange rates | (39.6) | n/a | 118.5 | n/a | |||||||||||||
| At comparative period exchange rates | $ | 5,071.8 | (2) | % | $ | 14,997.9 | (2) | % | |||||||||
| Fee revenue: | |||||||||||||||||
| At current period exchange rates | $ | 1,791.4 | (13) | % | $ | 5,222.7 | (14) | % | |||||||||
| Impact of change in exchange rates | (18.4) | n/a | 31.9 | n/a | |||||||||||||
| At comparative period exchange rates | $ | 1,773.0 | (13) | % | $ | 5,254.6 | (14) | % | |||||||||
| Operating income: | |||||||||||||||||
| At current period exchange rates | $ | 119.1 | (41) | % | $ | 286.1 | (53) | % | |||||||||
| Impact of change in exchange rates | 5.0 | n/a | 1.6 | n/a | |||||||||||||
| At comparative period exchange rates | $ | 124.1 | (39) | % | $ | 287.7 | (53) | % | |||||||||
| Adjusted EBITDA: | |||||||||||||||||
| At current period exchange rates | $ | 205.2 | (26) | % | $ | 430.3 | (53) | % | |||||||||
| Impact of change in exchange rates | 6.8 | n/a | 5.9 | n/a | |||||||||||||
| At comparative period exchange rates | $ | 212.0 | (23) | % | $ | 436.2 | (52) | % | |||||||||
33
Revenue
For the third quarter, Revenue and fee revenue decreased 2% and 13%, respectively, compared with the prior-year quarter. Businesses with resilient revenues continued to deliver fee revenue growth for the quarter, as Property Management, within Markets Advisory, grew 12%; Workplace Management, within Work Dynamics, grew 5%; and JLL Technologies grew 5%. Consistent with the first half of the year, economic uncertainty and elevated interest rates along with geopolitical instability in several geographies adversely impacted most of our transaction-based businesses, notably Investment Sales and Debt/Equity Advisory within Capital Markets, and Leasing within Markets Advisory. However, Project Management, within Work Dynamics, was up 8% due to continued project execution in several geographies, and Portfolio Services and Other within Work Dynamics benefited from outsized transaction activity in the current quarter. The decline in LaSalle's revenue was largely due to the absence of incentive fees.
For the first nine months of 2023, consolidated Revenue and fee revenue were down 2% and 14%, respectively, compared with 2022. The year-to-date drivers of change between the two years were similar to the quarter-to-date drivers noted above except for Portfolio Services and Other, which had a year-over-year drop in revenue for the first half of 2023 reflecting the general correlation to leasing activity.
The following highlights Revenue and fee revenue by segment, for the current and prior-year quarters ($ in millions). Refer to segment operating results for further detail.
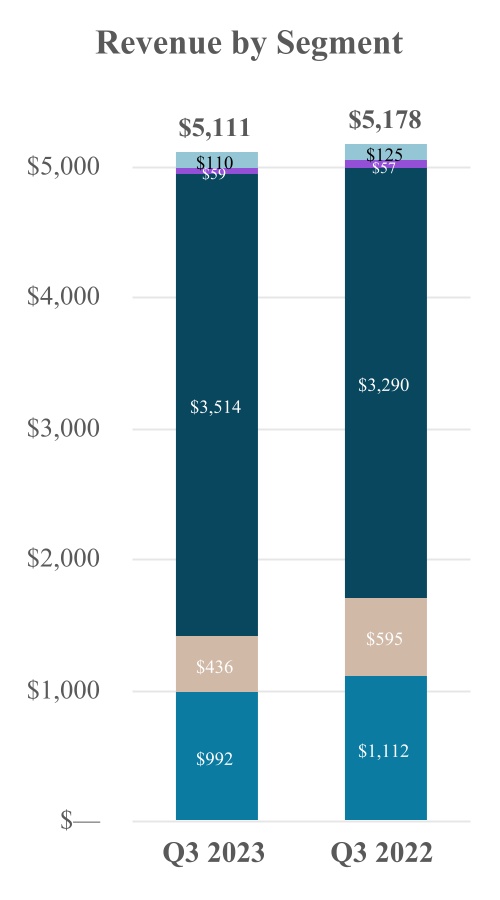
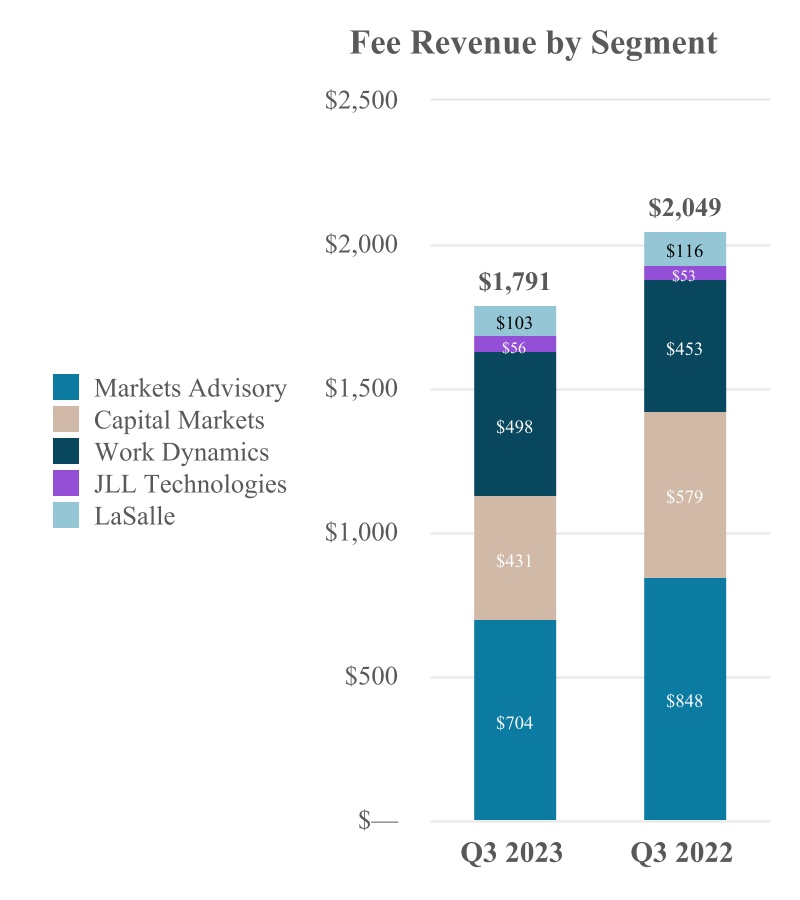
Our consolidated fee revenue declined 13% in U.S. dollars (“USD”) and 13% in local currency for the third quarter of 2023, compared with 2022. Year-to-date, consolidated fee revenue declined 14% in USD and 14% in local currency compared with last year. The quarter-to-date and year-to-date spreads were relatively consistent given the mix of currencies which strengthened or weakened against the U.S. dollar.
34
Operating Expenses
Consolidated operating expenses were $5.0 billion for the third quarter, a slight decrease from the same period in 2022, and $14.6 billion for the first nine months of 2023, which was relatively flat to 2022, while consolidated fee-based operating expenses were $1.7 billion for the third quarter, down 11% from the prior-year quarter, and $4.9 billion for the first nine months of 2023, down 10%. The decrease in fee-based operating expenses was primarily attributable to our Capital Markets and Markets Advisory segments, partially offset by revenue-related expense growth in Work Dynamics.
For the third quarter of 2023, Restructuring and acquisition charges increased compared with the prior-year period, driven by (i) higher severance and other employment-related charges from cost-out actions and (ii) expenses associated with rationalizing our real estate footprint in certain geographies; refer to following table for further detail.
| Three Months Ended September 30, | Nine Months Ended September 30, | ||||||||||||||||
| (in millions) | 2023 | 2022 | 2023 | 2022 | |||||||||||||
| Severance and other employment-related charges | $ | 16.4 | 9.4 | $ | 47.9 | 21.0 | |||||||||||
| Restructuring, pre-acquisition and post-acquisition charges | 15.1 | 11.7 | 31.7 | 45.2 | |||||||||||||
| Fair value adjustments that resulted in a net increase (decrease) to earn-out liabilities from prior-period acquisition activity | 0.1 | (0.1) | (0.5) | 0.2 | |||||||||||||
| Restructuring and acquisition charges | $ | 31.6 | 21.0 | $ | 79.1 | 66.4 | |||||||||||
Interest Expense
Interest expense, net of interest income, for the three and nine months ended September 30, 2023 was $37.1 million and $103.9 million compared with $23.2 million and $49.1 million in the prior-year periods. The increase primarily reflected a higher effective interest rate on our facilities but also an increase in the average outstanding borrowings. Refer to the Liquidity and Capital Resources section for additional details on our debt.
Equity (Losses) Earnings
The following details Equity (losses) earnings by relevant segment. Refer to the segment discussions for additional details.
| Three Months Ended September 30, | Nine Months Ended September 30, | ||||||||||||||||
| (in millions) | 2023 | 2022 | 2023 | 2022 | |||||||||||||
| JLL Technologies | $ | (3.0) | 1.0 | $ | (102.0) | 64.5 | |||||||||||
| LaSalle | (9.1) | (1.1) | (23.0) | 4.0 | |||||||||||||
| Other | 0.9 | 0.6 | 7.7 | 4.1 | |||||||||||||
| Equity (losses) earnings | $ | (11.2) | 0.5 | $ | (117.3) | 72.6 | |||||||||||
Other Income
Other non-operating income was $3.0 million and $1.9 million for the three and nine months ended September 30, 2023, compared with income of $0.5 million and $136.0 million for the comparable periods in 2022. During the second quarter of 2022, Other income included a $142.3 million gain by a consolidated variable interest entity in which we held no equity interest. This gain, therefore, is also included in Net income attributable to noncontrolling interest, and as a result, there is no net impact to Net income attributable to common shareholders (or other measures like Adjusted EBITDA, Adjusted net income and Adjusted diluted earnings per share). Also in the second quarter of 2022, we recognized a $10.5 million loss related to the disposition of our Russia business.
Income Taxes
The Income tax provision was $14.5 million and $13.0 million for the three and nine months ended September 30, 2023, representing an effective tax rate ("ETR") of 19.6% and 19.3%, respectively. For the three and nine months ended September 30, 2022, the income tax provision was $42.3 million and $155.4 million, representing an ETR of 23.4% and 20.1%, respectively.
35
Net Income and Adjusted EBITDA
Net income attributable to common shareholders was $59.7 million for the three months ended September 30, 2023, compared with $140.2 million in the prior-year quarter. For the first nine months of 2023, Net income attributable to common shareholders was $53.0 million, compared with $479.7 million in 2022. Adjusted EBITDA was $205.2 million and $430.3 million for the third quarter and first nine months of 2023, compared with $276.2 million and $908.8 million in the respective prior-year periods.
Net income margin attributable to common shareholders for the third quarter was 1.2%, compared with 2.7% in the prior-year quarter. Adjusted EBITDA margin for the third quarter, calculated on a fee-revenue basis, was 11.5% in USD (12.0% in local currency), compared with 13.5% in 2022.
Margin was impacted by lower transaction-based revenue and the change in Equity earnings/losses, net of carried interest. Partially offsetting these items were benefits of recent cost reduction actions and lower variable compensation expense.
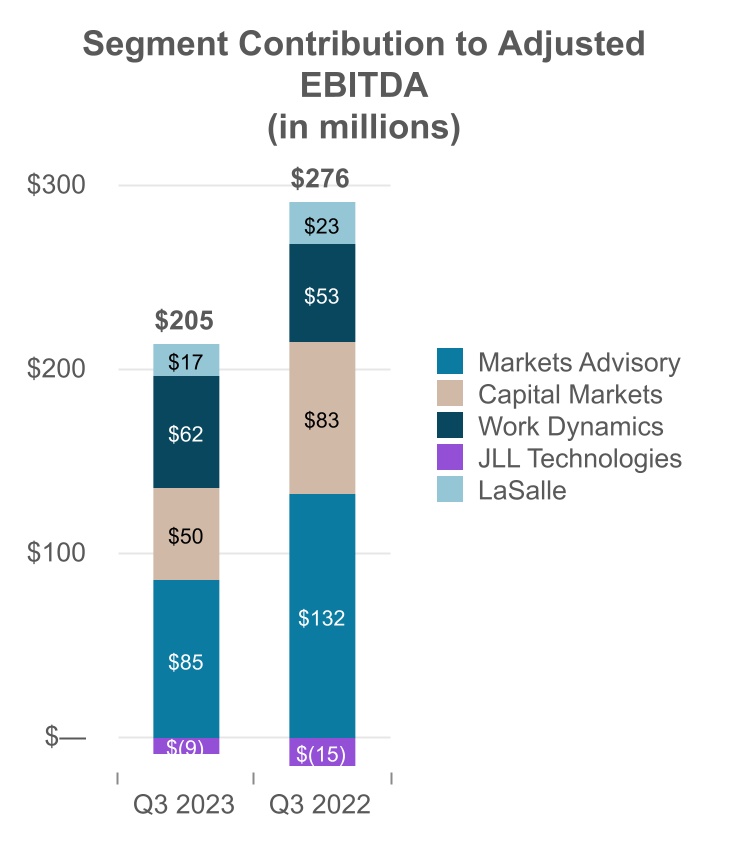
Segment Operating Results
We manage and report our operations as five business segments: Markets Advisory, Capital Markets, Work Dynamics, JLL Technologies and LaSalle. Markets Advisory offers a wide range of real estate services, including agency leasing and tenant representation, property management, and advisory and consulting services. Our Capital Markets service offerings include investment sales, debt and equity advisory, value and risk advisory, and loan servicing. Our Work Dynamics business provides a broad suite of integrated services to occupiers of real estate, including facility and project management, as well as portfolio and other services. We consider "Property Management" to be services provided to non-occupying property investors and "Workplace Management" to be services provided to owner-occupiers. Our JLL Technologies segment offers software products, solutions and services, while LaSalle provides investment management services on a global basis to institutional investors and high-net-worth individuals.
For segment reporting, (i) gross contract costs and (ii) net non-cash MSR and mortgage banking derivative activity are both excluded from revenue in determining Fee revenue. Gross contract costs are excluded from operating expenses in determining Fee-based operating expenses. In addition, our measure of segment results also excludes Restructuring and acquisition charges.
36
Markets Advisory
| % Change | |||||||||||||||||
| Three Months Ended September 30, | Change in | in Local | |||||||||||||||
| ($ in millions) | 2023 | 2022 | U.S. dollars | Currency | |||||||||||||
| Revenue | $ | 992.4 | 1,111.5 | (119.1) | (11) | % | (11) | % | |||||||||
| Gross contract costs | (288.4) | (263.6) | (24.8) | 9 | 10 | ||||||||||||
| Fee revenue | $ | 704.0 | 847.9 | (143.9) | (17) | % | (17) | % | |||||||||
| Leasing | 542.5 | 696.4 | (153.9) | (22) | (22) | ||||||||||||
| Property Management | 138.4 | 122.9 | 15.5 | 13 | 12 | ||||||||||||
| Advisory, Consulting and Other | 23.1 | 28.6 | (5.5) | (19) | (19) | ||||||||||||
| Compensation and benefits, excluding gross contract costs | $ | 531.2 | 620.4 | (89.2) | (14) | % | (15) | % | |||||||||
| Operating, administrative and other expenses, excluding gross contract costs | 86.5 | 96.9 | (10.4) | (11) | (11) | ||||||||||||
| Depreciation and amortization | 16.9 | 17.6 | (0.7) | (4) | (4) | ||||||||||||
| Segment fee-based operating expenses (excluding restructuring and acquisition charges) | 634.6 | 734.9 | (100.3) | (14) | (14) | ||||||||||||
| Gross contract costs | 288.4 | 263.6 | 24.8 | 9 | 10 | ||||||||||||
| Segment operating expenses | $ | 923.0 | 998.5 | (75.5) | (8) | % | (8) | % | |||||||||
| Equity earnings (losses) | $ | 0.1 | (0.2) | 0.3 | 150 | % | 120 | % | |||||||||
| Adjusted EBITDA | $ | 85.1 | 132.1 | (47.0) | (36) | % | (33) | % | |||||||||
| Adjusted EBITDA margin (local currency basis) | 12.6 | % | 15.6 | % | (350) bps | (300) bps | |||||||||||
| Adjusted EBITDA margin (USD basis) | 12.1 | % | |||||||||||||||
37
Markets Advisory (continued)
| % Change | |||||||||||||||||
| Nine Months Ended September 30, | Change in | in Local | |||||||||||||||
| ($ in millions) | 2023 | 2022 | U.S. dollars | Currency | |||||||||||||
| Revenue | $ | 2,924.2 | 3,229.2 | (305.0) | (9) | % | (9) | % | |||||||||
| Gross contract costs | (851.8) | (784.3) | (67.5) | 9 | 11 | ||||||||||||
| Fee revenue | $ | 2,072.4 | 2,444.9 | (372.5) | (15) | % | (15) | % | |||||||||
| Leasing | 1,613.0 | 1,996.8 | (383.8) | (19) | (19) | ||||||||||||
| Property Management | 396.5 | 363.7 | 32.8 | 9 | 11 | ||||||||||||
| Advisory, Consulting and Other | 62.9 | 84.4 | (21.5) | (25) | (24) | ||||||||||||
| Compensation and benefits, excluding gross contract costs | $ | 1,538.6 | 1,779.7 | (241.1) | (14) | % | (13) | % | |||||||||
| Operating, administrative and other expenses, excluding gross contract costs | 273.4 | 292.6 | (19.2) | (7) | (6) | ||||||||||||
| Depreciation and amortization | 51.4 | 52.0 | (0.6) | (1) | — | ||||||||||||
| Segment fee-based operating expenses | 1,863.4 | 2,124.3 | (260.9) | (12) | (12) | ||||||||||||
| Gross contract costs | 851.8 | 784.3 | 67.5 | 9 | 11 | ||||||||||||
| Segment operating expenses | $ | 2,715.2 | 2,908.6 | (193.4) | (7) | % | (6) | % | |||||||||
| Equity earnings | $ | 0.3 | 0.7 | (0.4) | (57) | % | (58) | % | |||||||||
| Adjusted EBITDA | $ | 256.1 | 377.3 | (121.2) | (32) | % | (31) | % | |||||||||
| Adjusted EBITDA margin (local currency basis) | 12.4 | % | 15.4 | % | (300) bps | (300) bps | |||||||||||
| Adjusted EBITDA margin (USD basis) | 12.4 | % | |||||||||||||||
The declines in Markets Advisory revenue and fee revenue were largely driven by Leasing, both on a year-to-date and quarter-to-date basis, and reflected lower transaction volumes and a decline in average deal size across nearly all asset types, particularly in the office sector. Continued economic uncertainty has delayed commercial real estate decision making, particularly for large-scale leasing actions. The decreases in Advisory, Consulting and Other for the quarter and first nine months were substantially driven by the absence of revenues associated with a business exited during the fourth quarter of 2022. Property Management achieved top-line growth for the quarter and year-to-date, primarily attributable to portfolio expansion in the Americas and incremental fees from interest-rate sensitive contract terms in the U.K.
The net decreases in segment operating expenses and segment fee-based operating expenses for the third quarter and first nine months of 2023 were primarily due to (i) lower commissions and other revenue-related expenses, (ii) lower incentive compensation expense, reflecting segment performance and (iii) cost containment measures.
The margin decrease was predominantly attributable to the lower Leasing fee revenue, net of the lower operating expenses noted above.
38
Capital Markets
| % Change | |||||||||||||||||
| Three Months Ended September 30, | Change in | in Local | |||||||||||||||
| ($ in millions) | 2023 | 2022 | U.S. dollars | Currency | |||||||||||||
| Revenue | $ | 435.8 | 595.2 | (159.4) | (27) | % | (28) | % | |||||||||
| Gross contract costs | (11.5) | (10.9) | (0.6) | 6 | 1 | ||||||||||||
| Net non-cash MSR and mortgage banking derivative activity | 7.1 | (5.2) | 12.3 | (237) | (236) | ||||||||||||
| Fee revenue | $ | 431.4 | 579.1 | (147.7) | (26) | % | (27) | % | |||||||||
| Investment Sales, Debt/Equity Advisory and Other | 308.9 | 452.1 | (143.2) | (32) | (33) | ||||||||||||
| Value and Risk Advisory | 84.4 | 86.5 | (2.1) | (2) | (4) | ||||||||||||
| Loan Servicing | 38.1 | 40.5 | (2.4) | (6) | (6) | ||||||||||||
| Compensation and benefits, excluding gross contract costs | $ | 323.8 | 430.6 | (106.8) | (25) | % | (26) | % | |||||||||
| Operating, administrative and other expenses, excluding gross contract costs | 58.3 | 66.0 | (7.7) | (12) | (13) | ||||||||||||
| Depreciation and amortization | 16.4 | 15.2 | 1.2 | 8 | 8 | ||||||||||||
| Segment fee-based operating expenses (excluding restructuring and acquisition charges) | 398.5 | 511.8 | (113.3) | (22) | (23) | ||||||||||||
| Gross contract costs | 11.5 | 10.9 | 0.6 | 6 | 1 | ||||||||||||
| Segment operating expenses | $ | 410.0 | 522.7 | (112.7) | (22) | % | (23 | %) | |||||||||
| Equity earnings | $ | 0.7 | 0.7 | — | 0 | % | 12 | % | |||||||||
| Adjusted EBITDA | $ | 50.3 | 83.2 | (32.9) | (40) | % | (40) | % | |||||||||
| Adjusted EBITDA margin (local currency basis) | 11.7 | % | 14.4 | % | (270) bps | (270) bps | |||||||||||
| Adjusted EBITDA margin (USD basis) | 11.7 | % | |||||||||||||||
39
Capital Markets (continued)
| % Change | |||||||||||||||||
| Nine Months Ended September 30, | Change in | in Local | |||||||||||||||
| ($ in millions) | 2023 | 2022 | U.S. dollars | Currency | |||||||||||||
| Revenue | $ | 1,240.9 | 1,880.3 | (639.4) | (34) | % | (34) | % | |||||||||
| Gross contract costs | (33.9) | (36.2) | 2.3 | (6) | (6) | ||||||||||||
| Net non-cash MSR and mortgage banking derivative activity | 9.5 | (12.8) | 22.3 | (174) | (174) | ||||||||||||
| Fee revenue | $ | 1,216.5 | 1,831.3 | (614.8) | (34) | % | (33) | % | |||||||||
| Investment Sales, Debt/Equity Advisory and Other | 854.0 | 1,448.6 | (594.6) | (41) | (41) | ||||||||||||
| Value and Risk Advisory | 248.0 | 261.9 | (13.9) | (5) | (4) | ||||||||||||
| Loan Servicing | 114.5 | 120.8 | (6.3) | (5) | (5) | ||||||||||||
| Compensation and benefits, excluding gross contract costs | $ | 943.1 | 1,318.7 | (375.6) | (28) | % | (28) | % | |||||||||
| Operating, administrative and other expenses, excluding gross contract costs | 183.6 | 186.7 | (3.1) | (2) | (1) | ||||||||||||
| Depreciation and amortization | 48.5 | 46.2 | 2.3 | 5 | 6 | ||||||||||||
| Segment fee-based operating expenses | 1,175.2 | 1,551.6 | (376.4) | (24) | (24) | ||||||||||||
| Gross contract costs | 33.9 | 36.2 | (2.3) | (6) | (6) | ||||||||||||
| Segment operating expenses | $ | 1,209.1 | 1,587.8 | (378.7) | (24) | % | (23) | % | |||||||||
| Equity earnings | $ | 6.1 | 2.1 | 4.0 | 190 | % | 195 | % | |||||||||
| Adjusted EBITDA | $ | 97.0 | 328.1 | (231.1) | (70) | % | (71) | % | |||||||||
| Adjusted EBITDA margin (local currency basis) | 7.9 | % | 17.9 | % | (990) bps | (1,000) bps | |||||||||||
| Adjusted EBITDA margin (USD basis) | 8.0 | % | |||||||||||||||
The lower Capital Markets revenue and fee revenue continued to reflect the meaningful drop in transaction volumes compared with 2022, both on a year-to-date and quarter-to-date basis, as ample capital continues to remain heavily sidelined with economic and interest rate uncertainty. This impact was most pronounced in Investment Sales and Debt/Equity Advisory, which experienced declines across nearly all asset sectors and geographies compared with the prior year. Our performance outpaced broader market trends for the quarter and first nine months of 2023, as global market volumes for investment sales were down 46% in USD (48% in local currency) on a quarter-to-date basis, and 50% in USD (and local currency) on a year-to-date basis, according to JLL Research. The decline in Loan Servicing was attributable to lower prepayment fees (down $3.8 million for the quarter and $12.0 million for the first nine months of the year), as refinancing activity slowed over the last twelve months, overshadowing continued growth in servicing fees from the portfolio originated under the Fannie Mae DUS program.
The net decreases in segment operating expenses and segment fee-based operating expenses for the quarter and first nine months of the year, against the comparative periods, were almost entirely due to lower revenue-related expenses, as well as lower incentive compensation expense, reflecting segment performance.
The margin reduction for the quarter was predominantly driven by lower Investment Sales and Debt/Equity Advisory revenue described above.
40
Work Dynamics
| % Change | |||||||||||||||||
| Three Months Ended September 30, | Change in | in Local | |||||||||||||||
| ($ in millions) | 2023 | 2022 | U.S. dollars | Currency | |||||||||||||
| Revenue | $ | 3,514.2 | 3,289.8 | 224.4 | 7 | % | 6 | % | |||||||||
| Gross contract costs | (3,016.5) | (2,836.9) | (179.6) | 6 | 6 | ||||||||||||
| Fee revenue | $ | 497.7 | 452.9 | 44.8 | 10 | % | 9 | % | |||||||||
| Workplace Management | 195.1 | 183.6 | 11.5 | 6 | 5 | ||||||||||||
| Project Management | 229.6 | 210.0 | 19.6 | 9 | 8 | ||||||||||||
| Portfolio Services and Other | 73.0 | 59.3 | 13.7 | 23 | 21 | ||||||||||||
| Compensation and benefits, excluding gross contract costs | $ | 332.9 | 285.0 | 47.9 | 17 | % | 15 | % | |||||||||
| Operating, administrative and other expenses, excluding gross contract costs | 103.3 | 114.6 | (11.3) | (10) | (12) | ||||||||||||
| Depreciation and amortization | 19.7 | 17.6 | 2.1 | 12 | 9 | ||||||||||||
| Segment fee-based operating expenses (excluding restructuring and acquisition charges) | 455.9 | 417.2 | 38.7 | 9 | 7 | ||||||||||||
| Gross contract costs | 3,016.5 | 2,836.9 | 179.6 | 6 | 6 | ||||||||||||
| Segment operating expenses | $ | 3,472.4 | 3,254.1 | 218.3 | 7 | % | 6 | % | |||||||||
| Equity earnings | $ | 0.1 | 0.1 | — | — | % | (34) | % | |||||||||
| Adjusted EBITDA | $ | 61.6 | 53.4 | 8.2 | 15 | % | 17 | % | |||||||||
| Adjusted EBITDA margin (local currency basis) | 12.7 | % | 11.8 | % | 60 bps | 90 bps | |||||||||||
| Adjusted EBITDA margin (USD basis) | 12.4 | % | |||||||||||||||
41
Work Dynamics (continued)
| % Change | |||||||||||||||||
| Nine Months Ended September 30, | Change in | in Local | |||||||||||||||
| ($ in millions) | 2023 | 2022 | U.S. dollars | Currency | |||||||||||||
| Revenue | $ | 10,165.0 | 9,633.9 | 531.1 | 6 | % | 6 | % | |||||||||
| Gross contract costs | (8,747.5) | (8,303.5) | (444.0) | 5 | 6 | ||||||||||||
| Fee revenue | $ | 1,417.5 | 1,330.4 | 87.1 | 7 | % | 7 | % | |||||||||
| Workplace Management | 566.5 | 550.5 | 16.0 | 3 | 4 | ||||||||||||
| Project Management | 670.2 | 600.6 | 69.6 | 12 | 13 | ||||||||||||
| Portfolio Services and Other | 180.8 | 179.3 | 1.5 | 1 | 1 | ||||||||||||
| Compensation and benefits, excluding gross contract costs | $ | 958.9 | 870.8 | 88.1 | 10 | % | 11 | % | |||||||||
| Operating, administrative and other expenses, excluding gross contract costs | 316.0 | 314.7 | 1.3 | — | 2 | ||||||||||||
| Depreciation and amortization | 58.9 | 51.1 | 7.8 | 15 | 16 | ||||||||||||
| Segment fee-based operating expenses | 1,333.8 | 1,236.6 | 97.2 | 8 | 9 | ||||||||||||
| Gross contract costs | 8,747.5 | 8,303.5 | 444.0 | 5 | 6 | ||||||||||||
| Segment operating expenses | $ | 10,081.3 | 9,540.1 | 541.2 | 6 | % | 7 | % | |||||||||
| Equity earnings | $ | 1.3 | 1.3 | — | — | % | (3) | % | |||||||||
| Adjusted EBITDA | $ | 143.5 | 146.2 | (2.7) | (2) | % | (3) | % | |||||||||
| Adjusted EBITDA margin (local currency basis) | 9.9 | % | 11.0 | % | (90) bps | (110) bps | |||||||||||
| Adjusted EBITDA margin (USD basis) | 10.1 | % | |||||||||||||||
Work Dynamics revenue and fee revenue growth was broad-based across service lines and included strong Project Management results from ongoing project execution in certain geographies, most notably the U.K., MENA, Italy and Southeast Asia for the third quarter (the United States, France, the U.K. and MENA for the first nine months of 2023). Portfolio Services outperformed the prior year quarter primarily due to one large transaction on behalf of a client in the United States; the first half of the year was lower given the meaningful correlation with leasing activity. Workplace Management continued to deliver growth, highlighted by the ramp-up of new, global client wins that began in the third quarter.
The increases in segment operating expenses and segment fee-based operating expenses for the third quarter and first nine months of 2023, compared with the prior-year periods, were primarily due to revenue-related expense growth over the trailing twelve months. For the first nine months of 2023, contract losses in the first half of the year related to certain Project Management contracts in Europe also contributed to the expense growth. These increases were partially offset with continued management of costs unrelated to revenue.
The net margin expansion in the current quarter was primarily attributable to the revenue growth, notably from Portfolio Services, together with continued cost management, both as described above.
42
JLL Technologies
| % Change | |||||||||||||||||
| Three Months Ended September 30, | Change in | in Local | |||||||||||||||
| ($ in millions) | 2023 | 2022 | U.S. dollars | Currency | |||||||||||||
| Revenue | $ | 58.9 | 56.5 | 2.4 | 4 | % | 4 | % | |||||||||
| Gross contract costs | (3.3) | (3.8) | 0.5 | (13) | (12) | ||||||||||||
| Fee revenue | $ | 55.6 | 52.7 | 2.9 | 6 | % | 5 | % | |||||||||
|
Compensation and benefits, excluding gross contract costs
(1)
|
$ | 48.7 | 57.7 | (9.0) | (16) | % | (16 | %) | |||||||||
| Operating, administrative and other expenses, excluding gross contract costs | 12.6 | 11.3 | 1.3 | 12 | 11 | ||||||||||||
| Depreciation and amortization | 3.9 | 3.7 | 0.2 | 5 | 3 | ||||||||||||
| Segment fee-based operating expenses (excluding restructuring and acquisition charges) | 65.2 | 72.7 | (7.5) | (10) | (11) | ||||||||||||
| Gross contract costs | 3.3 | 3.8 | (0.5) | (13) | (12) | ||||||||||||
| Segment operating expenses | $ | 68.5 | 76.5 | (8.0) | (10 | %) | (11 | %) | |||||||||
| Equity (losses) earnings | $ | (3.0) | 1.0 | (4.0) | (400) | % | (394) | % | |||||||||
| Adjusted EBITDA | $ | (8.7) | (15.3) | 6.6 | 43 | % | 44 | % | |||||||||
| Adjusted EBITDA margin (local currency basis) | (15.5) | % | (29.0) | % | 1,340 bps | 1,350 bps | |||||||||||
| Adjusted EBITDA margin (USD basis) | (15.6) | % | |||||||||||||||
43
JLL Technologies (continued)
| % Change | ||||||||||||||||||||
| Nine Months Ended September 30, | Change in | in Local | ||||||||||||||||||
| ($ in millions) | 2023 | 2022 | U.S. dollars | Currency | ||||||||||||||||
| Revenue | $ | 180.9 | 156.6 | 24.3 | 16 | % | 16 | % | ||||||||||||
| Gross contract costs | (11.0) | (10.6) | (0.4) | 4 | 4 | |||||||||||||||
| Fee revenue | $ | 169.9 | 146.0 | 23.9 | 16 | % | 16 | % | ||||||||||||
|
Compensation and benefits, excluding gross contract costs
(1)
|
$ | 155.3 | 185.7 | (30.4) | (16) | % | (16 | %) | ||||||||||||
| Operating, administrative and other expenses, excluding gross contract costs | 39.8 | 39.4 | 0.4 | 1 | 1 | |||||||||||||||
| Depreciation and amortization | 11.9 | 11.4 | 0.5 | 4 | 5 | |||||||||||||||
| Segment fee-based operating expenses | 207.0 | 236.5 | (29.5) | (12) | (12) | |||||||||||||||
| Gross contract costs | 11.0 | 10.6 | 0.4 | 4 | 4 | |||||||||||||||
| Segment operating expenses | $ | 218.0 | 247.1 | (29.1) | (12) | % | (11 | %) | ||||||||||||
| Equity (losses) earnings | $ | (102.0) | 64.5 | (166.5) | (258) | % | (258) | % | ||||||||||||
| Adjusted EBITDA | $ | (127.2) | (14.7) | (112.5) | (765) | % | (773) | % | ||||||||||||
| Adjusted EBITDA margin (local currency basis) | (75.2) | % | (10.1) | % | (6,480) bps | (6,510) bps | ||||||||||||||
| Adjusted EBITDA margin (USD basis) | (74.9) | % | ||||||||||||||||||
(1) Included in Compensation and benefits expense for JLL Technologies is a reduction in carried interest expense of $0.1 million and $9.4 million for the three and nine months ended September 30, 2023, respectively, and a carried interest expense of $0.6 million and $16.6 million for the three and nine months ended September 30, 2022, related to Equity earnings of the segment.
For the third quarter and first nine months of 2023, JLL Technologies revenue and fee revenue increased over the prior-year periods led by growth in solutions and service offerings, largely from existing enterprise clients.
Equity losses for the quarter and first nine months of 2023 resulted from valuation declines in JLL Technologies' investments due to subsequent financing rounds at decreased per-share values. The most significant equity losses, recognized in the second quarter of 2023, were predominantly driven by two investments for which we previously recognized significant equity earnings.
The decrease in current-quarter segment operating expenses and segment fee-based operating expenses included an approximate $5 million reduction to incentive compensation expense, which related to true-ups based on performance achievement, and improved operating efficiencies. Further driving a reduction in expenses for the first nine months of 2023, carried interest expense decreased $9.4 million (only $0.1 million in the third quarter) in response to the equity losses described above.
Margin improvement for the quarter was attributable to fee revenue growth and the expense drivers noted above, partially offset by the change in equity earnings/losses.
44
LaSalle
| % Change | |||||||||||||||||
| Three Months Ended September 30, | Change in | in Local | |||||||||||||||
| ($ in millions) | 2023 | 2022 | U.S. dollars | Currency | |||||||||||||
| Revenue | $ | 110.1 | 124.5 | (14.4) | (12) | % | (13) | % | |||||||||
| Gross contract costs | (7.4) | (8.5) | 1.1 | (13) | (13) | ||||||||||||
| Fee revenue | $ | 102.7 | 116.0 | (13.3) | (11) | % | (13) | % | |||||||||
| Advisory fees | 95.3 | 95.4 | (0.1) | — | (2) | ||||||||||||
| Transaction fees and other | 7.4 | 8.7 | (1.3) | (15) | (14) | ||||||||||||
| Incentive fees | — | 11.9 | (11.9) | (100) | (105) | ||||||||||||
| Compensation and benefits, excluding gross contract costs | $ | 63.2 | 78.7 | (15.5) | (20) | % | (21) | % | |||||||||
| Operating, administrative and other expenses, excluding gross contract costs | 14.0 | 13.3 | 0.7 | 5 | 2 | ||||||||||||
| Depreciation and amortization | 2.2 | 1.6 | 0.6 | 38 | 37 | ||||||||||||
| Segment fee-based operating expenses (excluding restructuring & acquisition charges) | 79.4 | 93.6 | (14.2) | (15) | (17) | ||||||||||||
| Gross contract costs | 7.4 | 8.5 | (1.1) | (13) | (13) | ||||||||||||
| Segment operating expenses | $ | 86.8 | 102.1 | (15.3) | (15) | % | (17) | % | |||||||||
| Equity losses | $ | (9.1) | (1.1) | (8.0) | (727) | % | (667) | % | |||||||||
| Adjusted EBITDA | $ | 16.9 | 22.8 | (5.9) | (26) | % | (28) | % | |||||||||
| Adjusted EBITDA margin (local currency basis) | 16.3 | % | 19.7 | % | (320) bps | (340) bps | |||||||||||
| Adjusted EBITDA margin (USD basis) | 16.5 | % | |||||||||||||||
45
LaSalle (continued)
| % Change | |||||||||||||||||
| Nine Months Ended September 30, | Change in | in Local | |||||||||||||||
| ($ in millions) | 2023 | 2022 | U.S. dollars | Currency | |||||||||||||
| Revenue | $ | 368.4 | 357.3 | 11.1 | 3 | % | 4 | % | |||||||||
| Gross contract costs | (22.0) | (22.0) | — | — | — | ||||||||||||
| Fee revenue | $ | 346.4 | 335.3 | 11.1 | 3 | % | 4 | % | |||||||||
| Advisory fees | 284.4 | 284.3 | 0.1 | — | 1 | ||||||||||||
| Transaction fees and other | 22.7 | 33.9 | (11.2) | (33) | (30) | ||||||||||||
| Incentive fees | 39.3 | 17.1 | 22.2 | 130 | 130 | ||||||||||||
| Compensation and benefits, excluding gross contract costs | $ | 216.5 | 225.7 | (9.2) | (4) | % | (3) | % | |||||||||
| Operating, administrative and other expenses, excluding gross contract costs | 46.3 | 41.4 | 4.9 | 12 | 13 | ||||||||||||
| Depreciation and amortization | 5.8 | 4.8 | 1.0 | 21 | 21 | ||||||||||||
| Segment fee-based operating expenses | 268.6 | 271.9 | (3.3) | (1) | — | ||||||||||||
| Gross contract costs | 22.0 | 22.0 | — | — | — | ||||||||||||
| Segment operating expenses | $ | 290.6 | 293.9 | (3.3) | (1) | % | — | % | |||||||||
| Equity (losses) earnings | $ | (23.0) | 4.0 | (27.0) | (675) | % | (680) | % | |||||||||
| Adjusted EBITDA | $ | 60.9 | 71.9 | (11.0) | (15) | % | (15) | % | |||||||||
| Adjusted EBITDA margin (local currency basis) | 17.4 | % | 21.4 | % | (380) bps | (400) bps | |||||||||||
| Adjusted EBITDA margin (USD basis) | 17.6 | % | |||||||||||||||
Subdued transaction volumes in the market contributed to the decrease in LaSalle transaction fees for both the quarter and first nine months as well as incentive fees for the third quarter. For the first nine months of 2023, top-line growth was driven by incentive fees, specifically in Japan and United States. Quarter-to-date and year-to-date, advisory fee performance remained resilient despite declines in real estate valuations over the trailing twelve months, impacting assets under management.
The equity losses on both a quarter and year-to-date basis were primarily attributable to net valuation declines in the co-investment portfolio. For the first half of 2023, this decline was partially offset by the co-investment in a LaSalle-managed publicly-traded REIT in Japan, which had a greater negative share price movement in 2022.
Current-quarter segment operating expenses and segment fee-based operating expenses were lower than the prior-year quarter due to the absence of expenses associated with the loss of a client mandate in the U.K., as well as lower incentive compensation expense. For the first nine months of 2023, this current-quarter decrease was largely offset by variable compensation expense associated with the higher incentive fees earned in the first half of 2023.
The third quarter margin decline was driven by the equity losses and an absence of incentive fees, partially offset by the expense drivers noted above.
As of September 30, 2023, LaSalle had $77.7 billion of AUM, a decrease of 1% in USD (with no change in local currency) from $78.2 billion as of June 30, 2023. The AUM change resulted from (i) $0.7 billion of foreign currency decreases, (ii) $0.5 billion of net valuation decreases and (iii) $0.4 billion of dispositions and withdrawals, partially offset by (iv) $1.1 billion of acquisitions.
46
LIQUIDITY AND CAPITAL RESOURCES
We finance our operations, co-investment activity, share repurchases, capital expenditures and business acquisitions with internally generated funds, borrowings on our Facility, and through issuance of Long-term debt.
Cash Flows from Operating Activities
Operating activities used $153.6 million of cash in the first nine months of 2023, compared with $401.9 million of cash used in operating activities during the same period in 2022. The year-over-year decrease in cash used in operating activities was primarily due to (i) incremental cash inflow associated with trade receivables, (ii) lower incentive compensation and commission payments in 2023 and (iii) $157.3 million of lower cash taxes paid compared with last year. This is partially offset by lower cash provided by earnings, largely attributable to the change in business performance for Capital Markets and Markets Advisory.
Cash Flows from Investing Activities
We used $220.4 million of cash for investing activities during the first nine months of 2023, compared with $147.8 million used during the same period in 2022. The prior year included $132.4 million of net capital proceeds relating to less than wholly-owned subsidiaries that did not recur in 2023. In addition, net capital contributions to investments were lower in the first nine months of 2023 compared with 2022. There was no such activity in the current year.
We discuss these drivers, along with other investing activities, individually below in further detail.
Cash Flows from Financing Activities
Financing activities provided $231.2 million of cash during the first nine months of 2023, compared with $500.5 million provided during the same period in 2022. The net decrease of $269.3 million in cash inflows from financing activities was substantially driven by a decrease in net borrowings on our Facility. This decrease in borrowings against the prior year was a product of less cash used in operating activities as well as lower share repurchases in 2023 (refer to the Share Repurchases section below). Finally, the 2022 cash outflow relating to noncontrolling interest distributions included a $142.3 million gain by a consolidated variable interest entity in which we held no equity interest that was also distributed in the second quarter of 2022 (offsetting the net capital proceeds from less than wholly-owned subsidiaries noted in cash flows from investing activities).
Debt
Our $3.35 billion Facility matures on April 14, 2026 and bears a variable interest rate. Outstanding borrowings, including the balance of the Facility and Short-term borrowings (financing lease obligations, overdrawn bank accounts and local overdraft facilities) are presented below.
| (in millions) | September 30, 2023 | December 31, 2022 | |||||||||
| Outstanding borrowings under the Facility | $ | 1,600.0 | $ | 1,225.0 | |||||||
| Short-term borrowings | 117.6 | 164.2 | |||||||||
In addition to our Facility, we had the capacity to borrow up to $52.9 million under local overdraft facilities as of September 30, 2023.
The following table provides additional information on our Facility and Uncommitted Facility, collectively.
| Three Months Ended September 30, | Nine Months Ended September 30, | |||||||||||||
| ($ in millions) | 2023 | 2022 | 2023 | 2022 | ||||||||||
| Average outstanding borrowings | $ | 2,011.9 | 1,599.8 | $ | 2,017.0 | 1,295.9 | ||||||||
| Average effective interest rate | 6.1 | % | 3.2 | % | 5.8 | % | 2.2 | % | ||||||
We will continue to use the Facility for working capital needs (including payment of accrued incentive compensation), co-investment activities, share repurchases, capital expenditures and acquisitions.
Refer to Note 9, Debt, in the Notes to Condensed Consolidated Financial Statements for additional information on our debt.
47
Investment Activity
As of September 30, 2023, we had a carrying value of $865.2 million in investments, primarily related to investments by JLL Technologies in early to mid-stage proptech companies as well as proptech funds, and LaSalle co-investments. For the first nine months of 2023 and 2022, funding of investments exceeded return of capital by $65.3 million and $123.2 million, respectively. We expect continued investments by JLL Technologies as well as strategic co-investment opportunities with our investment management clients globally as co-investment remains an important foundation to the continued growth of LaSalle's business.
See Note 6, Investments, in the Notes to Condensed Consolidated Financial Statements for additional information on our investment activity.
Capital Expenditures
Net capital additions for the nine months ended September 30, 2023 and 2022 were $137.7 million and $136.0 million, respectively. Our capital expenditures in 2023 were primarily for purchased/developed software and leased office space improvements.
Investment Asset Activity of Consolidated Less Than Wholly-Owned Entities
Net capital proceeds related to consolidated VIEs in which we held no equity interest for the nine months ended September 30, 2022 were $132.4 million. The distribution of proceeds from the sale of this investment (the initial acquisition of which was largely funded from employee-investors and related third-party debt) also occurred in 2022 and is included within financing activities.
Business Acquisitions
During the nine months ended September 30, 2023, we paid $36.4 million relating to business acquisitions. This included $13.6 million of payments associated with 2023 acquisitions and $22.8 million for deferred business acquisition and earn-out obligations for acquisitions completed in prior years, which are primarily reflected in cash flows from financing activities.
Terms for many of our past acquisitions have typically included cash paid at closing with provisions for additional deferred consideration and earn-out payments subject to certain contract requirements, including the passage of time and performance, respectively. Deferred business acquisition obligations totaled $14.3 million as of September 30, 2023. These obligations represent the current discounted values of payments due to sellers of businesses for which our acquisition had been completed as of the balance sheet date and for which the only remaining condition on those payments is the passage of time. As of September 30, 2023, we had the potential to make earn-out payments for a maximum of $103.8 million on 16 completed acquisitions subject to the achievement of certain performance conditions. Refer to Note 5, Business Combinations, Goodwill and Other Intangible Assets, in the Notes to the Condensed Consolidated Financial Statements for further information on Business Acquisitions.
We will continue to consider acquisitions that we believe will strengthen our market position, increase our profitability, and supplement our organic growth.
Share Repurchase and Dividend Programs
In February 2022, our Board of Directors authorized an additional $1.5 billion for the repurchase of our common stock in the open market and privately negotiated transactions. The number of shares repurchased and cash paid for repurchases is noted
in the following table.
| Three Months Ended September 30, | Nine Months Ended September 30, | ||||||||||||||||
| ($ in millions) | 2023 | 2022 | 2023 | 2022 | |||||||||||||
| Total number of shares repurchased (in 000's) | 123.2 | 909.2 | 262.5 | 2,922.4 | |||||||||||||
| Total paid for shares repurchased | $ | 20.1 | 153.5 | $ | 40.1 | 601.2 | |||||||||||
As of September 30, 2023, $1,115.5 million remained authorized for repurchases under our share repurchase program.
48
Repatriation of Foreign Earnings
Based on our historical experience and future business plans, we do not expect to repatriate our foreign-sourced earnings to the United States. We believe our policy of permanently investing earnings of foreign subsidiaries does not significantly impact our liquidity. As of September 30, 2023, and December 31, 2022, we had total cash and cash equivalents of $389.5 million and $519.3 million, respectively, of which approximately $301.7 million and $400.8 million, respectively, was held by foreign subsidiaries.
Restricted Net Assets
We face regulatory restrictions in certain countries that limit or prevent the transfer of funds to other countries or the exchange of the local currency to other currencies. However, we generally face no such restrictions with regard to the use or application of funds for ordinary course business activities within such countries. The assets of these countries aggregated to approximately 4% of our total assets as of both September 30, 2023, and December 31, 2022.
CAUTIONARY NOTE REGARDING FORWARD-LOOKING STATEMENTS
This report, including this Management's Discussion and Analysis of Financial Condition and Results of Operations, contains “forward-looking statements” within the meaning of the federal securities laws. All such statements are qualified by this cautionary note, which is provided pursuant to the safe harbor provisions of Section 27A of the Securities Act of 1933, as amended, and Section 21E of the Securities Exchange Act of 1934, as amended. Forward-looking statements may also be included in our other public filings, press releases, our website, and oral and written presentations by management.
Statements in the future tense, and all statements accompanied by terms such as “believe,” “will,” “may,” “could,” “project,” “expect,” “estimate,” “assume,” “intend,” “anticipate,” “target,” “plan” and variations thereof and similar terms, are intended to be forward-looking statements. Such statements do not relate strictly to historical or current facts as they relate to our intent, belief and current expectations about our strategic direction, prospects and future results, and give our current expectations or forecasts of future events. Management believes that these forward-looking statements are reasonable as and when made. However, caution should be taken not to place undue reliance on any such forward-looking statements because such statements speak only as of the date when made.
49
Item 3. Quantitative and Qualitative Disclosures About Market Risk
MARKET AND OTHER RISK FACTORS
Interest Rates
We assess interest rate sensitivity to estimate the potential effect of rising short-term interest rates on our variable-rate debt. If short-term interest rates were 50 basis points higher during 2023 on our variable-rate debt, our results would reflect an incremental $7.6 million of interest expense for the nine months ended September 30, 2023.
Foreign Exchange
The following outlines the significant functional currencies of our revenue, highlighting where exposure to movements in foreign exchange impact our operations in international markets.
| Nine Months Ended September 30, | |||||||||||
| 2023 | 2022 | ||||||||||
| British pound | 8 | % | 8 | % | |||||||
| Euro | 7 | 7 | |||||||||
| Australian dollar | 5 | 6 | |||||||||
|
Other
(1)
|
21 | 19 | |||||||||
| Revenue exposed to foreign exchange rates | 41 | % | 40 | % | |||||||
| United States dollar | 59 | 60 | |||||||||
| Total revenue | 100 | % | 100 | % | |||||||
(1) No other functional currency exceeds 5% of total revenue.
To show the impact foreign currencies have on our results of operations, we present the change in local currency for revenue and operating expenses on a consolidated basis and by operating segment in Management's Discussion and Analysis of Financial Condition and Results of Operations included herein. For additional detail of the impact of foreign exchange rates on our results of operations, see Management's Discussion and Analysis of Financial Condition and Results of Operations included herein.
We enter into forward foreign currency exchange contracts to manage currency risks associated with intercompany lending and cash management practices. See Note 8, Fair Value Measurements, in the Notes to the Condensed Consolidated Financial Statements for further discussion of our forward contracts.
Item 4. Controls and Procedures
The Company has established disclosure controls and procedures to ensure material information relating to the Company, including its consolidated subsidiaries, is made known to the officers who certify the Company's financial reports and to the other members of senior management and the Board of Directors.
Under the supervision and with the participation of the Company's management, including our Chief Executive Officer and Chief Financial Officer, we conducted an evaluation of the Company's disclosure controls and procedures (as defined in Rules 13a-15(e) and 15d-15(e) under the Securities Exchange Act of 1934). Based on this evaluation, our Chief Executive Officer and Chief Financial Officer concluded our disclosure controls and procedures were effective as of the end of the period covered by this report. There were no changes in the Company's internal control over financial reporting during the quarter ended September 30, 2023, that have materially affected, or are reasonably likely to materially affect, the Company's internal control over financial reporting.
50
Part II. Other Information
Item 1. Legal Proceedings
We are a defendant or plaintiff in various litigation matters arising in the ordinary course of business, some of which involve claims for damages that are substantial in amount. Many of these litigation matters are covered by insurance, including insurance provided through a captive insurance company, although they may nevertheless be subject to large deductibles and the amounts being claimed may exceed the available insurance. Although we cannot determine the ultimate liability for these matters based upon information currently available, we believe the ultimate resolution of such claims and litigation will not have a material adverse effect on our financial position, results of operations or liquidity.
Item 1A. Risk Factors
There have been no material changes to our risk factors as previously disclosed in our Annual Report on Form 10-K for the year ended December 31, 2022.
Item 2. Unregistered Sales of Equity Securities and Use of Proceeds
The following table provides information about our purchases of equity securities that are registered by us pursuant to Section 12 of the Exchange Act during the quarter ended September 30, 2023.
| Period | Total number of shares purchased | Weighted average price paid per share | Total number of shares purchased as part of publicly announced plan | Approximate dollar value of shares that may yet be purchased under the plan (in millions) | ||||||||||||||||
| July 1, 2023 - July 31, 2023 | 27,035 | $ | 168.80 | 27,035 | ||||||||||||||||
| August 1, 2023 - August 31, 2023 | 56,152 | $ | 168.05 | 56,152 | ||||||||||||||||
| September 1, 2023 - September 30, 2023 | 39,973 | $ | 153.06 | 39,973 | $ | 1,115.5 | ||||||||||||||
| Total | 123,160 | 123,160 | ||||||||||||||||||
51
Item 6. Exhibits
| Exhibit Number | Description | ||||
|
31.1
*
|
Certification of Chief Executive Officer pursuant to Section 302 of the Sarbanes-Oxley Act of 2002 | ||||
|
31.2
*
|
Certification of Chief Financial Officer pursuant to Section 302 of the Sarbanes-Oxley Act of 2002 | ||||
|
32
*
|
Certification of Chief Executive Officer and Chief Financial Officer pursuant to 18 U.S.C. Section 1350, as adopted pursuant to Section 906 of the Sarbanes-Oxley Act of 2002 | ||||
| 101.INS | Inline XBRL Instance Document - the instance document does not appear in the Interactive Data File because its XBRL tags are embedded within the Inline XBRL document | ||||
| 101.SCH | Inline XBRL Taxonomy Extension Schema Document | ||||
| 101.CAL | Inline XBRL Taxonomy Extension Calculation Linkbase Document | ||||
| 101.DEF | Inline XBRL Taxonomy Extension Definition Linkbase Document | ||||
| 101.LAB | Inline XBRL Taxonomy Extension Label Linkbase Document | ||||
| 101.PRE | Inline XBRL Taxonomy Extension Presentation Linkbase Document | ||||
| 104 | Cover Page Interactive Data File (formatted as Inline XBRL and contained in Exhibit 101) | ||||
*Filed herewith
52
Signature
Pursuant to the requirements of Section 13 or 15(d) of the Securities Exchange Act of 1934, the Registrant has duly caused this report to be signed on its behalf by the undersigned, thereunto duly authorized, on the 2nd day of November, 2023.
| JONES LANG LASALLE INCORPORATED | |||||||||||
| By: | /s/ Karen Brennan | ||||||||||
| Karen Brennan | |||||||||||
| Chief Financial Officer | |||||||||||
| (Authorized Officer and Principal Financial Officer) | |||||||||||
53
TABLE OF CONTENTS
Part I. Financial InformationItem 1. Financial StatementsItem 2. Management's Discussion and Analysis Of Financial Condition and Results Of OperationsItem 3. Quantitative and Qualitative Disclosures About Market RiskItem 4. Controls and ProceduresPart II. Other InformationItem 1. Legal ProceedingsItem 1A. Risk FactorsItem 2. Unregistered Sales Of Equity Securities and Use Of ProceedsItem 6. Exhibits