JOHNSON & JOHNSON
10-Ks and 10-Qs
|
|
|
|
|
|
|
|
|
|
|
|
|
|
|
|
|
|
|
|
|
|
|
|
|
|
|
|
|
|
|
|
|
|
|
|
|
|
|
|
|
|
|
|
|
|
|
|
|
|
UNITED STATES
SECURITIES AND EXCHANGE COMMISSION
Washington, D.C. 20549
FORM 10-K
ANNUAL REPORT PURSUANT TO SECTION 13 OF
THE SECURITIES EXCHANGE ACT OF 1934
|
For the fiscal year ended January 1, 2017
|
Commission file number 1-3215
|
JOHNSON & JOHNSON
(Exact name of registrant as specified in its charter)
|
New Jersey
|
|
22-1024240
|
|
(State of incorporation)
|
|
(I.R.S. Employer Identification No.)
|
|
One Johnson & Johnson Plaza
New Brunswick, New Jersey
|
|
08933
|
|
(Address of principal executive offices)
|
|
(Zip Code)
|
Registrant’s telephone number, including area code:
(732) 524-0400
SECURITIES REGISTERED PURSUANT TO SECTION 12(b) OF THE ACT
|
Title of each class
|
|
Name of each exchange on which registered
|
|
Common Stock, Par Value $1.00
|
New York Stock Exchange
New York Stock Exchange
|
|
|
4.75% Notes Due November 2019
|
New York Stock Exchange
|
|
|
0.250% Notes Due January 2022
|
New York Stock Exchange
|
|
|
0.650% Notes Due May 2024
|
New York Stock Exchange
|
|
|
5.50% Notes Due November 2024
|
New York Stock Exchange
|
|
|
1.150% Notes Due November 2028
|
New York Stock Exchange
|
|
|
1.650% Notes Due May 2035
|
New York Stock Exchange
|
|
Indicate by check mark if the registrant is a well-known seasoned issuer, as defined in Rule 405 of the Securities Act. Yes
þ
No
o
Indicate by check mark if the registrant is not required to file reports pursuant to Section 13 or Section 15(d) of the Exchange Act. Yes
o
No
þ
Indicate by check mark whether the registrant (1) has filed all reports required to be filed by Section 13 or 15(d) of the Exchange Act during the preceding 12 months (or for such shorter period that the registrant was required to file such reports), and (2) has been subject to such filing requirements for the past 90 days. Yes
þ
No
o
Indicate by check mark whether the registrant has submitted electronically and posted on its corporate website, if any, every Interactive Data File required to be submitted and posted pursuant to Rule 405 of Regulation S-T during the preceding 12 months (or for such shorter period that the registrant was required to submit and post such files). Yes
þ
No
o
Indicate by check mark if disclosure of delinquent filers pursuant to Item 405 of Regulation S-K is not contained herein, and will not be contained, to the best of registrant’s knowledge, in definitive proxy or information statements incorporated by reference in Part III of this Form 10-K or any amendment to this Form 10-K.
o
Indicate by check mark whether the registrant is a large accelerated filer, an accelerated filer, a non-accelerated filer, or a smaller reporting company. See the definitions of “large accelerated filer,” “accelerated filer” and “smaller reporting company” in Rule 12b-2 of the Exchange Act.
Large accelerated filer
þ
Accelerated filer
o
Non-accelerated filer
o
Smaller reporting company
o
(Do not check if a smaller reporting company)
Indicate by check mark whether the registrant is a shell company (as defined in Rule 12b-2 of the Exchange Act). Yes
o
No
þ
The aggregate market value of the Common Stock held by non-affiliates computed by reference to the price at which the Common Stock was last sold as of the last business day of the registrant’s most recently completed second fiscal quarter was approximately $332 billion.
On February 23, 2017, there were 2,713,346,602 shares of Common Stock outstanding.
DOCUMENTS INCORPORATED BY REFERENCE
|
Parts I and III:
|
Portions of registrant’s proxy statement for its 2017 annual meeting of shareholders filed within 120 days after the close of the registrant’s fiscal year (the "Proxy Statement"), are incorporated by reference to this report on Form 10-K (this "Report").
|
|
Item
|
|
Page
|
|
1
|
||
|
|
||
|
|
||
|
|
||
|
|
||
|
|
||
|
|
||
|
|
||
|
|
||
|
|
||
|
|
||
|
|
||
|
1A.
|
||
|
1B.
|
||
|
2
|
||
|
3
|
||
|
4
|
||
|
|
||
|
|
||
|
5
|
||
|
6
|
||
|
7
|
||
|
7A.
|
||
|
8
|
||
|
9
|
||
|
9A.
|
||
|
9B.
|
||
|
|
||
|
10
|
||
|
11
|
||
|
12
|
||
|
13
|
||
|
14
|
||
|
|
||
|
15
|
||
|
16
|
||
|
|
||
|
|
||
CAUTIONARY NOTE REGARDING FORWARD-LOOKING STATEMENTS
This Annual Report on Form 10-K
and Johnson & Johnson's other publicly available documents contain "forward-looking statements" within the meaning of the safe harbor provisions of the U.S. Private Securities Litigation Reform Act of 1995. Management and representatives of Johnson & Johnson and its subsidiaries (the "Company") also may from time to time make forward-looking statements.
Forward-looking statements do not relate strictly to historical or current facts and reflect management’s assumptions, views, plans, objectives and projections about the future. Forward-looking statements may be identified by the use of words such as “plans,” “expects,” “will,” “anticipates,” “estimates” and other words of similar meaning in conjunction with, among other things: discussions of future operations; expected operating results and financial performance; impact of planned acquisitions and dispositions; the Company’s strategy for growth; product development; regulatory approvals; market position and expenditures.
Because forward-looking statements are based on current beliefs, expectations and assumptions regarding future events, they are subject to uncertainties, risks and changes that are difficult to predict and many of which are outside of the Company's control. Investors should realize that if underlying assumptions prove inaccurate, or known or unknown risks or uncertainties materialize, the Company’s actual results and financial condition could vary materially from expectations and projections expressed or implied in its forward-looking statements. Investors are therefore cautioned not to rely on these forward-looking statements. Risks and uncertainties include, but are not limited to:
Risks Related to Product Development, Market Success and Competition
|
•
|
Challenges and uncertainties inherent in innovation and development of new and improved products and technologies on which the Company’s continued growth and success depend, including uncertainty of clinical outcomes, obtaining regulatory approvals, health plan coverage and customer access, and initial and continued commercial success;
|
|
•
|
Challenges to the Company’s ability to obtain and protect adequate patent and other intellectual property rights for new and existing products and technologies in the U.S. and other important markets;
|
|
•
|
The impact of patent expirations, typically followed by the introduction of competing biosimilars and generics and resulting revenue and market share losses;
|
|
•
|
Increasingly aggressive and frequent challenges to the Company’s patents by competitors and others seeking to launch competing generic, biosimilar or other products, potentially resulting in loss of market exclusivity and rapid decline in sales for the relevant product;
|
|
•
|
Competition in research and development of new and improved products, processes and technologies, which can result in product and process obsolescence;
|
|
•
|
Competition to reach agreement with third parties for collaboration, licensing, development and marketing agreements for products and technologies;
|
|
•
|
Competition on the basis of cost-effectiveness, product performance, technological advances and patents attained by competitors; and
|
|
•
|
Allegations that the Company’s products infringe the patents and other intellectual property rights of third parties, which could adversely affect the Company’s ability to sell the products in question and require the payment of money damages and future royalties.
|
Risks Related to Product Liability, Litigation and Regulatory Activity
|
•
|
Product efficacy or safety concerns, whether or not based on scientific evidence, potentially resulting in product withdrawals, recalls, regulatory action on the part of the U.S. Food and Drug Administration (or international counterparts), declining sales and reputational damage;
|
|
•
|
Impact of significant litigation or government action adverse to the Company, including product liability claims;
|
|
•
|
Increased scrutiny of the health care industry by government agencies and state attorneys general resulting in investigations and prosecutions, which carry the risk of significant civil and criminal penalties, including, but not limited to, debarment from government business;
|
|
•
|
Failure to meet compliance obligations in the McNEIL-PPC, Inc. Consent Decree or the Corporate Integrity Agreements of the Johnson & Johnson Pharmaceutical Affiliates, or any other compliance agreements with governments or government agencies, which could result in significant sanctions;
|
|
•
|
Potential changes to applicable laws and regulations affecting U.S. and international operations, including relating to: approval of new products; licensing and patent rights; sales and promotion of health care products; access to, and reimbursement and pricing for, health care products and services; environmental protection and sourcing of raw materials;
|
|
•
|
Changes in tax laws and regulations, increasing audit scrutiny by tax authorities around the world and exposures to additional tax liabilities potentially in excess of reserves; and
|
|
•
|
Issuance of new or revised accounting standards by the Financial Accounting Standards Board and the Securities and Exchange Commission.
|
Risks Related to the Company’s Strategic Initiatives and Health Care Market Trends
|
•
|
Pricing pressures resulting from trends toward health care cost containment, including the continued consolidation among health care providers, trends toward managed care and the shift toward governments increasingly becoming the primary payers of health care expenses;
|
|
•
|
Restricted spending patterns of individual, institutional and governmental purchasers of health care products and services due to economic hardship and budgetary constraints;
|
|
•
|
Challenges to the Company’s ability to realize its strategy for growth including through externally sourced innovations, such as development collaborations, strategic acquisitions, licensing and marketing agreements, and the potential heightened costs of any such external arrangements due to competitive pressures;
|
|
•
|
The potential that the expected strategic benefits and opportunities from any planned or completed acquisition or divestiture by the Company, including the planned acquisition of Actelion Ltd., may not be realized or may take longer to realize than expected;
|
|
•
|
The potential that the expected benefits and opportunities related to the planned restructuring actions in the Medical Device segment may not be realized or may take longer to realize than expected, including due to any required consultation procedures relating to restructuring of workforce; and
|
|
•
|
Market conditions and the possibility that the Company’s share repurchase program may be delayed, suspended or discontinued.
|
Risks Related to Economic Conditions, Financial Markets and Operating Internationally
|
•
|
Impact of inflation and fluctuations in interest rates and currency exchange rates and the potential effect of such fluctuations on revenues, expenses and resulting margins;
|
|
•
|
Potential changes in export/import and trade laws, regulations and policies of the U.S., U.K. and other countries, including any increased trade restrictions and potential drug reimportation legislation;
|
|
•
|
The impact on international operations from financial instability in international economies, sovereign risk, possible imposition of governmental controls and restrictive economic policies, and unstable international governments and legal systems;
|
|
•
|
Changes to global climate, extreme weather and natural disasters that could affect demand for the Company's products and services, cause disruptions in manufacturing and distribution networks, alter the availability of goods and services within the supply chain, and affect the overall design and integrity of the Company's products and operations; and
|
|
•
|
The impact of armed conflicts and terrorist attacks in the U.S. and other parts of the world including social and economic disruptions and instability of financial and other markets.
|
Risks Related to Supply Chain and Operations
|
•
|
Difficulties and delays in manufacturing, internally or within the supply chain, that may lead to voluntary or involuntary business interruptions or shutdowns, product shortages, withdrawals or suspensions of products from the market, and potential regulatory action;
|
|
•
|
Interruptions and breaches of the Company's information technology systems, and those of the Company's vendors, could result in reputational, competitive, operational or other business harm as well as financial costs and regulatory action; and
|
|
•
|
Reliance on global supply chains and production and distribution processes that are complex and subject to increasing regulatory requirements that may adversely affect supply, sourcing and pricing of materials used in the Company’s products.
|
Investors also should carefully read the Risk Factors described in Item 1A of this Annual Report on Form 10-K for a description of certain risks that could, among other things, cause the Company’s actual results to differ materially from those expressed in its forward-looking statements. Investors should understand that it is not possible to predict or identify all such factors and should not consider the risks described above and in Item 1A to be a complete statement of all potential risks and
uncertainties. The Company does not undertake to publicly update any forward-looking statement that may be made from time to time, whether as a result of new information or future events or developments.
|
Item 1.
|
BUSINESS
|
General
Johnson & Johnson and its subsidiaries (the "Company") have approximately 126,400 employees worldwide engaged in the research and development, manufacture and sale of a broad range of products in the health care field. Johnson & Johnson is a holding company, which has more than 230 operating companies conducting business in virtually all countries of the world. The Company’s primary focus is products related to human health and well-being. Johnson & Johnson was incorporated in the State of New Jersey in 1887.
The Executive Committee of Johnson & Johnson is the principal management group responsible for the strategic operations and allocation of the resources of the Company. This Committee oversees and coordinates the activities of the Company's three business segments: Consumer, Pharmaceutical and Medical Devices. Within the strategic parameters provided by the Committee, senior management groups at U.S. and international operating companies are each responsible for their own strategic plans and the day-to-day operations of those companies. Each subsidiary within the business segments is, with limited exceptions, managed by residents of the country where located.
Segments of Business
The Company is organized into three business segments: Consumer, Pharmaceutical and Medical Devices. Additional information required by this item is incorporated herein by reference to the narrative and tabular descriptions of segments and operating results under: “Item 7. Management’s Discussion and Analysis of Results of Operations and Financial Condition” of this Report; and Note 18 “Segments of Business and Geographic Areas” of the Notes to Consolidated Financial Statements included in Item 8 of this Report.
Consumer
The Consumer segment includes a broad range of products used in the baby care, oral care, beauty (previously referred to as skin care), over-the-counter pharmaceutical, women’s health and wound care markets. Baby Care includes the JOHNSON’S
®
line of products. Oral Care includes the LISTERINE
®
product line. Major brands in Beauty include the AVEENO
®
; CLEAN & CLEAR
®
; DABAO
™
; JOHNSON’S
®
Adult; LE PETITE MARSEILLAIS
®
; NEUTROGENA
®
; RoC
®
and OGX
®
product lines. Over-the-counter medicines include the broad family of TYLENOL
®
acetaminophen products; SUDAFED
®
cold, flu and allergy products; BENADRYL
®
and ZYRTEC
®
allergy products; MOTRIN
®
IB ibuprofen products; and the PEPCID
®
line of acid reflux products. Major brands in Women’s Health outside of North America are STAYFREE
®
and CAREFREE
®
sanitary pads and o.b.
®
tampon brands. Wound Care brands include the BAND-AID
®
Brand Adhesive Bandages and NEOSPORIN
®
First Aid product lines. These products are marketed to the general public and sold both to retail outlets and distributors throughout the world.
Pharmaceutical
The Pharmaceutical segment is focused on five therapeutic areas: immunology (e.g., rheumatoid arthritis, inflammatory bowel disease and psoriasis), infectious diseases and vaccines (e.g., HIV, hepatitis, respiratory infections and tuberculosis), neuroscience (e.g., Alzheimer's disease, mood disorders and schizophrenia), oncology (e.g., prostate cancer, hematologic malignancies and lung cancer), and cardiovascular and metabolic diseases (e.g., thrombosis and diabetes). Products in this segment are distributed directly to retailers, wholesalers, hospitals and health care professionals for prescription use. Key products in the Pharmaceutical segment include: REMICADE
®
(infliximab), a treatment for a number of immune-mediated inflammatory diseases; SIMPONI
®
(golimumab), a subcutaneous treatment for adults with moderate to severe rheumatoid arthritis, active psoriatic arthritis, active ankylosing spondylitis and moderately active to severely active ulcerative colitis; SIMPONI ARIA
®
(golimumab), an intravenous treatment for adults with moderate to severe rheumatoid arthritis; STELARA
®
(ustekinumab), a treatment for adults with moderate to severe plaque psoriasis and active psoriatic arthritis, and for adults with moderately to severely active Crohn's disease; PREZISTA
®
(darunavir), EDURANT
®
(rilpivirine), and PREZCOBIX
®
/REZOLSTA
®
(darunavir/cobicistat), antiretroviral medicines for the treatment of human immunodeficiency virus (HIV-1) in combination with other antiretroviral products; CONCERTA
®
(methylphenidate HCl) extended-release tablets CII, a treatment for attention deficit hyperactivity disorder; INVEGA
®
(paliperidone) extended-release tablets, for the treatment of schizophrenia and schizoaffective disorder; INVEGA SUSTENNA
®
/XEPLION
®
(paliperidone palmitate), for the treatment of schizophrenia and schizoaffective disorder in adults; INVEGA TRINZA
®
/TREVICTA
®
(paliperidone palmitate), for the treatment of schizophrenia in patients after they have been adequately treated with INVEGA SUSTENNA
®
for at least four months; RISPERDAL CONSTA
®
(risperidone long-acting injection), for the treatment of schizophrenia and the maintenance treatment of Bipolar 1 Disorder in adults; VELCADE
®
(bortezomib), a treatment for multiple myeloma and for use in combination with rituximab, cyclophosphamide, doxorubicin and prednisone for the treatment of adult patients with previously
|
1
|
||
untreated mantle cell lymphoma; ZYTIGA
®
(abiraterone acetate), used in combination with prednisone as a treatment for metastatic castration-resistant prostate cancer; IMBRUVICA
®
(ibrutinib), an oral, once-daily therapy approved for use in treating certain B-cell malignancies, or blood cancers, and Waldenström's Macroglobulinemia; DARZALEX
®
(daratumumab), for the treatment of relapsed/refractory multiple myeloma; PROCRIT
®
(epoetin alfa, sold outside the U.S. as EPREX
®
), to stimulate red blood cell production; XARELTO
®
(rivaroxaban), an oral anticoagulant for the prevention of deep vein thrombosis (DVT), which may lead to pulmonary embolism (PE) in patients undergoing hip or knee replacement surgery, to reduce the risk of stroke and systemic embolism in patients with nonvalvular atrial fibrillation, for the treatment and reduction of risk of recurrence of DVT and PE; INVOKANA
®
(canagliflozin), for the treatment of adults with type 2 diabetes; INVOKAMET
®
/VOKANAMET
®
(canagliflozin/metformin HCl), a combination therapy of fixed doses of canagliflozin and metformin hydrochloride for the treatment of adults with type 2 diabetes; and INVOKAMET
®
XR (canagliflozin/metformin hydrochloride extended-release), a once-daily, fixed-dose combination therapy of canagliflozin and metformin hydrochloride extended-release, for the treatment of adults with type 2 diabetes. Many of these medicines were developed in collaboration with strategic partners or are licensed from other companies and maintain active lifecycle development programs.
Medical Devices
The Medical Devices segment includes a broad range of products used in the orthopaedic, surgery, cardiovascular, diabetes care and vision care fields. These products are distributed to wholesalers, hospitals and retailers, and used principally in the professional fields by physicians, nurses, hospitals, eye care professionals and clinics. They include orthopaedic products; general surgery, biosurgical, endomechanical and energy products; electrophysiology products to treat cardiovascular disease; sterilization and disinfection products to reduce surgical infection; diabetes care products, such as blood glucose monitoring and insulin delivery products; and disposable contact lenses.
For details regarding acquisitions and divestitures see Note 20 to the Consolidated Financial Statements included in Item 8.
Geographic Areas
The business of Johnson & Johnson is conducted by more than 230 operating companies located in 60 countries, including the U.S., in virtually all countries throughout the world. The products made and sold in the international business include many of those described above under “– Segments of Business – Consumer,” “– Pharmaceutical” and “– Medical Devices.” However, the principal markets, products and methods of distribution in the international business vary with the country and the culture. The products sold in international business include those developed in the U.S. and by subsidiaries abroad.
Investments and activities in some countries outside the U.S. are subject to higher risks than comparable U.S. activities because the investment and commercial climate may be influenced by financial instability in international economies, restrictive economic policies and political and legal system uncertainties.
Raw Materials
Raw materials essential to the Company's business are generally readily available from multiple sources. Where there are exceptions, the temporary unavailability of those raw materials would not likely have a material adverse effect on the financial results of the Company.
Patents
The Company's subsidiaries have made a practice of obtaining patent protection on their products and processes where possible. They own, or are licensed under, a significant number of patents in the U.S. and other countries relating to their products, product uses, formulations and manufacturing processes, which in the aggregate are believed to be of material importance to the Company in the operation of its businesses. The Company’s subsidiaries face patent challenges from third parties, including challenges seeking to manufacture and market generic and biosimilar versions of the Company's key pharmaceutical products prior to expiration of the applicable patents covering those products. Significant legal proceedings and claims involving the Company's patent and other intellectual property are described in Note 21, “Legal Proceedings—Intellectual Property” of the Notes to Consolidated Financial Statements included in Item 8 of this Report.
Sales of the Company’s largest product, REMICADE
®
(infliximab), accounted for approximately 9.7% of the Company's total revenues for fiscal 2016. Accordingly, the patents related to this product are believed to be material to the Company.
There are two sets of patents related specifically to REMICADE
®
. The first set of patents is co-owned by Janssen Biotech, Inc., a wholly-owned subsidiary of Johnson & Johnson, and NYU Langone Medical Center (NYU). Janssen Biotech, Inc. has an exclusive license to NYU's interests in the patents. These patents have expired in all countries outside the United States.
In the United States, the one remaining patent, which expires in September 2018, stands rejected following
|
2
|
||
reexamination proceedings instituted by a third party in the United States Patent and Trademark Office (USPTO). The patent has also been held invalid by the Federal District Court in the District of Massachusetts. The decisions by the USPTO and the Federal District Court have been appealed to the U.S. Court of Appeals for the Federal Circuit. The appeals are pending.
The second set of patents specifically related to REMICADE
®
was granted to The Kennedy Institute of Rheumatology in Europe, Canada, Australia and the United States. Janssen Biotech, Inc. has licenses (exclusive for human anti-TNF antibodies and semi-exclusive for non-human anti-TNF antibodies) to these patents, which expire in 2017 outside of the United States and 2018 in the United States. Certain of these patents have been successfully challenged and invalidated, and others are under review in various patent offices around the world and are also subject to litigation in Canada.
The Company does not expect that any extensions will be available for the above described patents specifically related to REMICADE
®
. In 2016, a third party received approval from the Food and Drug Administration for sale of its infliximab biosimilar in the United States and introduced its biosimilar to the U.S. market in late 2016. For a more extensive description of legal matters regarding the patents related to REMICADE
®
, see Note 21 “Legal Proceedings – Intellectual Property – Pharmaceutical – REMICADE
®
Related Cases” of the Notes to Consolidated Financial Statements included in Item 8 of this Report.
In addition to competing in the immunology market with REMICADE
®
, the Company is currently marketing STELARA
®
(ustekinumab), SIMPONI
®
(golimumab) and SIMPONI ARIA
®
(golimumab), next generation immunology products with remaining patent lives of up to seven years.
Trademarks
The Company’s subsidiaries have made a practice of selling their products under trademarks and of obtaining protection for these trademarks by all available means. These trademarks are protected by registration in the U.S. and other countries where such products are marketed. The Company considers these trademarks in the aggregate to be of material importance in the operation of its businesses.
Seasonality
Worldwide sales do not reflect any significant degree of seasonality; however, spending has been heavier in the fourth quarter of each year than in other quarters. This reflects increased spending decisions, principally for advertising and research and development activity.
Competition
In all of their product lines, the Company's subsidiaries compete with companies both locally and globally. Competition exists in all product lines without regard to the number and size of the competing companies involved. Competition in research, both internally and externally sourced, involving the development and the improvement of new and existing products and processes, is particularly significant. The development of new and innovative products, as well as protecting the underlying intellectual property of the Company’s product portfolio, is important to the Company's success in all areas of its business. The competitive environment requires substantial investments in continuing research. In addition, the development and maintenance of customer demand for the Company’s consumer products involve significant expenditures for advertising and promotion.
Research and Development
Research activities represent a significant part of the Company’s businesses. Research and development expenditures relate to the processes of discovering, testing and developing new products, improving existing products, as well as demonstrating product efficacy and regulatory compliance prior to launch. The Company remains committed to investing in research and development with the aim of delivering high quality and innovative products. Worldwide costs of research and development activities amounted to $9.1 billion, $9.0 billion and $8.5 billion for fiscal years 2016, 2015 and 2014, respectively. Research facilities are located in the United States, Belgium, Brazil, Canada, China, France, Germany, India, Israel, Japan, the Netherlands, Singapore, Switzerland and the United Kingdom.
Environment
The Company is subject to a variety of U.S. and international environmental protection measures. The Company believes that its operations comply in all material respects with applicable environmental laws and regulations. The Company’s compliance with these requirements did not change during the past year, and is not expected to have a material effect upon its capital expenditures, cash flows, earnings or competitive position.
|
3
|
||
Regulation
The Company’s businesses are subject to varying degrees of governmental regulation in the countries in which operations are conducted, and the general trend is toward increasingly stringent regulation. In the U.S., the drug, device and cosmetic industries have long been subject to regulation by various federal and state agencies, primarily as to product safety, efficacy, manufacturing, advertising, labeling and safety reporting. The exercise of broad regulatory powers by the U.S. Food and Drug Administration (the "FDA") continues to result in increases in the amounts of testing and documentation required for FDA approval of new drugs and devices and a corresponding increase in the expense of product introduction. Similar trends are also evident in major markets outside of the U.S.
The costs of human health care have been and continue to be a subject of study, investigation and regulation by governmental agencies and legislative bodies around the world. In the U.S., attention has been focused on drug prices and profits and programs that encourage doctors to write prescriptions for particular drugs, or to recommend, use or purchase particular medical devices. Payers have become a more potent force in the market place and increased attention is being paid to drug and medical device pricing, appropriate drug and medical device utilization and the quality and costs of health care generally.
U.S. government agencies continue to implement the extensive requirements of the Patient Protection and Affordable Care Act (the "ACA"). These have both positive and negative impacts on the U.S. healthcare industry with much remaining uncertain as to how various provisions of the ACA, and potential modification or repeal of ACA provisions, will ultimately affect the industry.
The regulatory agencies under whose purview the Company operates have administrative powers that may subject it to actions such as product withdrawals, recalls, seizure of products and other civil and criminal sanctions. In some cases, the Company’s subsidiaries may deem it advisable to initiate product recalls.
In addition, business practices in the health care industry have come under increased scrutiny, particularly in the United States, by government agencies and state attorneys general, and resulting investigations and prosecutions carry the risk of significant civil and criminal penalties.
Further, the Company relies on global supply chains, and production and distribution processes, that are complex, are subject to increasing regulatory requirements that may affect sourcing, supply and pricing of materials used in the Company's products. These processes also are subject to lengthy regulatory approvals.
Available Information
The Company’s main corporate website address is
www.jnj.com.
Copies of the Company’s Quarterly Reports on Form 10-Q, Annual Report on Form 10-K and Current Reports on Form 8-K filed or furnished to the U.S. Securities and Exchange Commission (the "SEC"), and any amendments to the foregoing, will be provided without charge to any shareholder submitting a written request to the Secretary at the principal executive offices of the Company or by calling 1-800-950-5089. All of the Company’s SEC filings are also available on the Company’s website at
www.investor.jnj.com/sec.cfm
, as soon as reasonably practicable after having been electronically filed or furnished to the SEC. All SEC filings are also available at the SEC’s website at
www.sec.gov
. In addition, the written charters of the Audit Committee, the Compensation & Benefits Committee, the Nominating & Corporate Governance Committee, the Regulatory, Compliance & Government Affairs Committee and the Science, Technology & Sustainability Committee of the Board of Directors and the Company’s Principles of Corporate Governance, Code of Business Conduct (for employees), Code of Business Conduct & Ethics for Members of the Board of Directors and Executive Officers, and other corporate governance materials, are available at
www.investor.jnj.com/gov.cfm
on the Company's website and will be provided without charge to any shareholder submitting a written request, as provided above. The information on the Company’s website is not, and will not be deemed, a part of this Report or incorporated into any other filings the Company makes with the SEC.
|
Item 1A.
|
RISK FACTORS
|
The Company faces a number of uncertainties and risks that are difficult to predict and many of which are outside of the Company's control. In addition to the other information in this report and the Company’s other filings with the SEC, investors should consider carefully the factors set forth below. Investors should be aware that it is not possible to predict or identify all such factors and that the following is not meant to be a complete discussion of all potential risks or uncertainties. If known or unknown risks or uncertainties materialize, the Company’s business, results of operations or financial condition could be adversely affected, potentially in a material way.
|
4
|
||
One of the Company’s key products, REMICADE
®
(infliximab), is experiencing biosimilar competition, which will result in a reduction in U.S. sales of REMICADE
®
.
The Company has experienced significant challenges to patents covering its largest product, REMICADE
®
(infliximab) (accounting for approximately 9.7% of the Company’s total revenues for fiscal 2016), and continues to assert certain patents related to the product. In April 2016, the FDA approved for sale in the United States an infliximab biosimilar to be marketed by a subsidiary of Pfizer Inc. In October 2016, the notice of launch period under the U.S. Biologics Price Competition and Innovation Act (the BPCIA) passed and in November 2016 Pfizer began shipment of an infliximab biosimilar to wholesalers in the United States. Sales of an infliximab biosimilar in the U.S. market will result in a reduction in U.S. sales of REMICADE
®
.
Global sales in the Company’s pharmaceutical and medical devices segments may be negatively impacted by healthcare reforms and increasing pricing pressures.
Sales of the Company’s pharmaceutical and medical device products are significantly affected by reimbursements by third-party payers such as government healthcare programs, private insurance plans and managed care organizations. As part of various efforts to contain healthcare costs, these payers are putting downward pressure on prices at which products will be reimbursed. In the United States, increased purchasing power of entities that negotiate on behalf of Medicare, Medicaid, and private sector beneficiaries, in part due to continued consolidation among health care providers, could result in further pricing pressures. Outside the United States, numerous major markets, including the EU and Japan, have pervasive government involvement in funding healthcare and, in that regard, directly or indirectly impose price controls, limit access to, or reimbursement for, the Company’s products, or reduce the value of its intellectual property protection.
The Company is subject to significant legal proceedings that can result in significant expenses, fines and reputational damage.
In the ordinary course of business, Johnson & Johnson and its subsidiaries are subject to numerous claims and lawsuits involving various issues such as patent disputes, product liability and claims that their product sales, marketing and pricing practices violate various antitrust, unfair trade practices and/or consumer protection laws. The most significant of these proceedings are described in Note 21, “Legal Proceedings” under Notes to the Consolidated Financial Statements included in Item 8 of this Report. While the Company believes it has substantial defenses in these matters, it is not feasible to predict the ultimate outcome of litigation. The Company could in the future be required to pay significant amounts as a result of settlements or judgments in these matters, potentially in excess of accruals. The resolution of, or increase in accruals for, one or more of these matters in any reporting period could have a material adverse effect on the Company's results of operations and cash flows for that period. Furthermore, as a result of cost and availability factors, effective November 1, 2005, the Company ceased purchasing third-party product liability insurance.
Product reliability, safety and effectiveness concerns can have significant negative impacts on sales and results of operations, lead to litigation and cause reputational damage.
Concerns about product safety, whether raised internally or by regulators or consumer advocates, and whether or not based on scientific evidence, can result in safety alerts, product recalls, governmental investigations, regulatory action on the part of the FDA (or its counterpart in other countries), private claims and lawsuits, payment of fines and settlements, declining sales and reputational damage. These circumstances can also result in damage to brand image, brand equity and consumer trust in the Company’s products. Product recalls have in the past, and could in the future, prompt government investigations and inspections, the shutdown of manufacturing facilities, continued product shortages and related sales declines, significant remediation costs, reputational damage, possible civil penalties and criminal prosecution.
Changes in tax laws or exposures to additional tax liabilities could negatively impact the Company’s operating results.
Changes in tax laws or regulations, including tax reform proposals in the U.S., Belgium and Switzerland, could negatively impact the Company’s effective tax rate and results of operations. A change in statutory tax rate may result in the revaluation of the Company’s deferred tax assets and liabilities related to the relevant jurisdiction in the period in which the new tax law is enacted, potentially resulting in a material expense or benefit recorded to the Company’s Consolidated Statement of Earnings for that period. For a discussion of risks of changes in tax rates in other countries, including Belgium, please see “Management’s Discussion and Analysis of Results of Operations and Financial Condition—Other Information—Economic and Market Factors” in Item 7 of this Report.
The Company conducts business and files tax returns in numerous countries and currently has tax audits in progress with many tax authorities. In connection with the Organization for Economic Cooperation and Development Base Erosion and Profit Shifting (BEPS) project, starting in 2017, companies are required to disclose more information to tax authorities on operations around the world, which may lead to greater audit scrutiny of profits earned in other countries. The Company regularly assesses the likely outcomes of its tax audits to determine the appropriateness of its tax reserves. However, any tax authority
|
5
|
||
could take a position on tax treatment that is contrary to the Company’s expectations, which could result in tax liabilities in excess of reserves.
The Company may not be able to successfully secure and defend intellectual property rights essential to the Company’s businesses.
The Company owns or licenses a significant number of patents and other proprietary rights, determined by patent offices, courts and lawmakers in various countries, relating to its products and manufacturing processes. These rights are essential to the Company’s businesses and materially important to the Company’s results of operations. Public policy, both within and outside the U.S., has become increasingly unfavorable toward intellectual property rights. The Company cannot be certain that it will obtain adequate patent protection for new products and technologies in the U.S. and other important markets or that such protections, once granted, will last as long as originally anticipated.
Competitors routinely challenge the validity or extent of the Company’s owned or licensed patents and proprietary rights through litigation, interferences, oppositions and other proceedings. These proceedings absorb resources and can be protracted as well as unpredictable. In addition, challenges that the Company’s products infringe the patents of third parties could result in the need to pay past damages and future royalties and adversely affect the competitive position and sales of the products in question.
The Company has faced increasing patent challenges from third parties seeking to manufacture and market generic and biosimilar versions of the Company's key pharmaceutical products prior to expiration of the applicable patents covering those products. In the United States, manufacturers of generic versions of innovative human pharmaceutical products may challenge the validity, or claim non-infringement, of innovator products through the Abbreviated New Drug Application, or ANDA, process with the FDA. The BPCIA, enacted in 2010, which created a new regulatory pathway for the approval by the FDA of biosimilar alternatives to innovator-developed biological products, also created mechanisms for biosimilar applicants to challenge the patents on the innovator biologics. The inter partes review (IPR) process with the USPTO, created under the 2011 America Invents Act, is also being used by competitors to challenge patents held by the Company’s subsidiaries. For example, a key patent for ZYTIGA
®
is currently subject to patent litigation and several IPR proceedings brought by generic companies seeking to invalidate the patent.
In the event the Company is not successful in defending its patents against such challenges, or upon the “at-risk” launch (despite pending patent infringement litigation) by the generic or biosimilar firm of its product, the Company can lose a major portion of revenues for the referenced product in a very short period of time. Current legal proceedings involving the Company’s patents and other intellectual property rights are described in Note 21, “Legal Proceedings—Intellectual Property” of the Notes to the Consolidated Financial Statements included in Item 8 of this Report.
The Company’s businesses operate in highly competitive product markets and competitive pressures could adversely affect the Company’s earnings.
The Company faces substantial competition in all three operating segments and in all geographic markets. The Company’s businesses compete with companies of all sizes on the basis of cost-effectiveness, technological innovations, intellectual property rights, product performance, real or perceived product advantages, pricing and availability and rate of reimbursement. The Company also competes with other market participants in securing rights to acquisitions, collaborations and licensing agreements with third parties. Competition for rights to product candidates and technologies may result in significant investment and acquisition costs and onerous agreement terms for the Company. Competitors’ development of more effective or less costly products, and/or their ability to secure patent and other intellectual property rights and successfully market products ahead of us, could negatively impact sales of the Company’s existing products as well as its ability to bring new products to market despite significant prior investment in the related product development.
For the Company’s pharmaceutical businesses, loss of patent exclusivity for a product often is followed by a substantial reduction in sales as competitors gain regulatory approval for generic and other competing products and enter the market. Similar competition can be triggered by the loss of exclusivity for a biological product. For the Company’s medical device businesses, technological innovation, product quality, reputation and customer service are especially important to competitiveness. Development by other companies of new or improved products, processes and technologies could threaten to make the Company’s products or technologies less desirable, less economical or obsolete. The Company’s consumer businesses face intense competition from other branded products and retailers’ private-label brands. If the Company fails to sufficiently differentiate and market its brand name consumer products, this could adversely affect revenues and profitability of those products.
|
6
|
||
Significant challenges or delays in the Company’s innovation and development of new products, technologies and indications could have an adverse impact on the Company’s long-term success.
The Company’s continued growth and success depends on its ability to innovate and develop new and differentiated products and services that address the evolving health care needs of patients, providers and consumers. Development of successful products and technologies is also necessary to offset revenue losses when the Company’s existing products lose market share due to various factors such as competition and loss of patent exclusivity. New products introduced within the past five years accounted for approximately 22% of 2016 sales. The Company cannot be certain when or whether it will be able to develop, license or otherwise acquire companies, products and technologies, whether particular product candidates will be granted regulatory approval, and, if approved, whether the products will be commercially successful.
The Company pursues product development through internal research and development as well as through collaborations, acquisitions, joint ventures and licensing or other arrangements with third parties. In all of these contexts, developing new products, particularly pharmaceutical and biotechnology products and medical devices, requires significant investment of resources over many years. Only a very few biopharmaceutical research and development programs result in commercially viable products. The process depends on many factors including the ability to discern patients’ and health care providers’ future needs; develop promising new compounds, strategies and technologies; achieve successful clinical trial results; secure effective intellectual property protection; obtain regulatory approvals on a timely basis; and, if and when they reach the market, successfully differentiate the Company’s products from competing products and approaches to treatment. New products or enhancements to existing products may not be accepted quickly or significantly in the marketplace due to product and price competition, changes in customer preferences or healthcare purchasing patterns, resistance by healthcare providers or uncertainty over third-party reimbursement. Even following initial regulatory approval, the success of a product can be adversely impacted by safety and efficacy findings in larger real world patient populations, as well as market entry of competitive products.
The Company faces increasing regulatory scrutiny which imposes significant compliance costs and exposes the Company to government investigations, legal actions and penalties.
Like other companies in the healthcare industry, the Company is subject to extensive regulation, investigations and legal action, by national, state and local government agencies in the United States and other countries in which they operate. Regulatory issues regarding compliance with Good Manufacturing Practices (cGMP) (and comparable quality regulations in foreign countries) by manufacturers of drugs, devices and consumer products can lead to fines and penalties, product recalls, product shortages, interruptions in production, delays in new product approvals and litigation. In addition, the marketing, pricing and sale of the Company’s products are subject to regulation, investigations and legal actions including under the Federal Food, Drug, and Cosmetic Act, the Medicaid Rebate Program, federal and state false claims acts, state unfair trade practices acts and consumer protection laws. Increased scrutiny of health care industry business practices in recent years by government agencies and state attorneys general in the U.S., and any resulting investigations and prosecutions, carry risk of significant civil and criminal penalties including, but not limited to, debarment from participation in government healthcare programs. Any such debarment could have a material adverse effect on the Company’s business and results of operations. The most significant current investigations and litigation brought by government agencies are described in Note 21, “Legal Proceedings-Government Proceedings” under Notes to the Consolidated Financial Statements included in Item 8 of this Report.
The Company faces a variety of risks associated with conducting business internationally.
The Company’s extensive operations and business activity outside the U.S. are accompanied by certain financial, economic and political risks, including those listed below.
Foreign Currency Exchange
: In fiscal 2016, approximately 47% of the Company’s sales occurred outside of the U.S., with approximately 22% in Europe, 8% in the Western Hemisphere, excluding the U.S., and 17% in the Asia-Pacific and Africa region. Changes in non-U.S. currencies relative to the U.S. dollar impact the Company’s revenues and expenses. While the Company uses financial instruments to mitigate the impact of fluctuations in currency exchange rates on its cash flows, unhedged exposures continue to be subject to currency fluctuations. In addition, the weakening or strengthening of the U.S. dollar may result in significant favorable or unfavorable translation effects when the operating results of the Company’s non-U.S. business activity are translated into U.S. dollars.
Inflation and Currency Devaluation Risks
: The Company faces challenges in maintaining profitability of operations in economies experiencing high inflation rates. The Company has accounted for operations in Venezuela as highly inflationary, as the prior three-year cumulative inflation rate surpassed 100%. While the Company strives to maintain profit margins in these areas through cost reduction programs, productivity improvements and periodic price increases, it might experience operating losses as a result of continued inflation. In addition, the impact of currency devaluations in countries experiencing high inflation rates or significant currency exchange fluctuations could negatively impact the Company’s operating results.
|
7
|
||
Illegal Importation of Pharmaceutical Products
: The illegal importation of pharmaceutical products from countries where government price controls or other market dynamics result in lower prices may adversely affect the Company’s sales and profitability in the U.S. and other countries in which the Company operates. With the exception of limited quantities of prescription drugs for personal use, foreign imports of pharmaceutical products are illegal under current U.S. law. However, the volume of illegal imports continues to rise as the ability of patients and other customers to obtain the lower-priced imports has grown significantly.
Anti-Bribery and Other Regulations:
The Company is subject to various federal and foreign laws that govern its international business practices with respect to payments to government officials. Those laws include the U.S. Foreign Corrupt Practices Act (FCPA), which prohibits U.S. publicly traded companies, from promising, offering, or giving anything of value to foreign officials with the corrupt intent of influencing the foreign official for the purpose of helping the Company obtain or retain business or gain any improper advantage. The Company’s business is heavily regulated and therefore involves significant interaction with foreign officials. Also, in many countries outside the U.S., the health care providers who prescribe human pharmaceuticals are employed by the government and the purchasers of human pharmaceuticals are government entities; therefore, the Company’s interactions with these prescribers and purchasers are subject to regulation under the FCPA. In addition to the U.S. application and enforcement of the FCPA, various jurisdictions in which the Company operates have laws and regulations, including the U.K Bribery Act 2010, aimed at preventing and penalizing corrupt and anticompetitive behavior. Enforcement activities under these laws could subject the Company to additional administrative and legal proceedings and actions, which could include claims for civil penalties, criminal sanctions, and administrative remedies, including exclusion from health care programs.
Other Legal, Social and Political Risks
. Other risks inherent in conducting business globally include:
|
•
|
protective economic policies taken by governments such as trade protection measures and import/export licensing requirements;
|
|
•
|
compliance with local regulations and laws including, in some countries, regulatory requirements restricting the Company’s ability to manufacture or sell its products in the relevant market;
|
|
•
|
diminished protection of intellectual property and contractual rights in certain jurisdictions;
|
|
•
|
potential nationalization or expropriation of the Company’s foreign assets; and
|
|
•
|
disruptions to markets due to war, armed conflict, terrorism, social upheavals or pandemics.
|
Interruptions and delays in manufacturing operations could adversely affect the Company’s business, sales and reputation.
The Company’s manufacture of products requires the timely delivery of sufficient amounts of complex, high-quality components and materials. These subsidiaries operate 119 manufacturing facilities as well as sourcing from hundreds of suppliers around the world. The Company has in the past, and may in the future, face unanticipated interruptions and delays in manufacturing through its internal or external supply chain. Manufacturing disruptions can occur for many reasons including regulatory action, production quality deviations or safety issues, labor disputes, site-specific incidents (such as fires), natural disasters, raw material shortages, political unrest and terrorist attacks. Such delays and difficulties in manufacturing can result in product shortages, declines in sales and reputational impact as well as significant remediation and related costs associated with addressing the shortage.
An information security incident, including a cybersecurity breach, could have a negative impact to the Company’s business or reputation
To meet business objectives, the Company relies on both internal information technology (IT) systems and networks, and those of third parties and their vendors, to process and store sensitive data, including confidential research, business plans, financial information, intellectual property, and personal data. The extensive information security and cybersecurity threats, which affect companies globally, pose a risk to the security and availability of these IT systems and networks, and the confidentiality, integrity, and availability of the Company’s sensitive data. The Company continually assesses these threats and makes investments to increase internal protection, detection, and response capabilities, as well as ensure the Company’s third party providers have required capabilities and controls, to address this risk. To date, the Company has not experienced any material impact to our business or operations resulting from information or cybersecurity attacks; however, because of the frequently changing attack techniques, along with the increased volume and sophistication of the attacks, there is the potential for the Company to be adversely impacted. This impact could result in reputational, competitive, operational or other business harm as well as financial costs and regulatory action.
|
8
|
||
|
Item 1B.
|
UNRESOLVED STAFF COMMENTS
|
Not applicable.
Item 2.
PROPERTIES
The Company's subsidiaries operate 119 manufacturing facilities occupying approximately 21.5 million square feet of floor space. The manufacturing facilities are used by the industry segments of the Company’s business approximately as follows:
|
Segment
|
Square Feet
(in thousands)
|
||
|
Consumer
|
6,928
|
|
|
|
Pharmaceutical
|
7,463
|
|
|
|
Medical Devices
|
7,087
|
|
|
|
Worldwide Total
|
21,478
|
|
|
Within the United States, seven facilities are used by the Consumer segment, seven by the Pharmaceutical segment and 21 by the Medical Devices segment. Outside of the United States, 30 facilities are used by the Consumer segment, 17 by the Pharmaceutical segment and 37 by the Medical Devices segment.
The locations of the manufacturing facilities by major geographic areas of the world are as follows:
|
Geographic Area
|
Number of Facilities
|
Square Feet
(in thousands)
|
||||
|
United States
|
35
|
|
6,015
|
|
||
|
Europe
|
37
|
|
7,770
|
|
||
|
Western Hemisphere, excluding U.S.
|
14
|
|
2,862
|
|
||
|
Africa, Asia and Pacific
|
33
|
|
4,831
|
|
||
|
Worldwide Total
|
119
|
|
21,478
|
|
||
In addition to the manufacturing facilities discussed above, the Company maintains numerous office and warehouse facilities throughout the world. Research facilities are also discussed in Item 1 of this Report under “Business – Research and Development.”
The Company's subsidiaries generally seek to own their manufacturing facilities, although some, principally in non-U.S. locations, are leased. Office and warehouse facilities are often leased. The Company also engages contract manufacturers.
The Company is committed to maintaining all of its properties in good operating condition and repair, and the facilities are well utilized.
McNEIL-PPC, Inc. (now Johnson & Johnson Consumer Inc.) (McNEIL-PPC) continues to operate under a consent decree, signed in 2011 with the FDA, which governs certain McNeil Consumer Healthcare manufacturing operations, and requires McNEIL-PPC to remediate the facilities it operates in Lancaster, Pennsylvania, Fort Washington, Pennsylvania, and Las Piedras, Puerto Rico (the "Consent Decree"). The Fort Washington facility was voluntarily shut down in April 2010, and subsequently many products were transferred to other manufacturing sites and successfully reintroduced to the market. After McNEIL-PPC successfully completed all requirements contained in the Consent Decree Workplans for the Lancaster and Las Piedras manufacturing sites and completed the steps required for third-party certification of the Fort Washington plant, a third-party cGMP expert submitted written certifications to the FDA for all three manufacturing sites. Following FDA inspections in 2015, McNEIL-PPC received notifications from the FDA that all three manufacturing facilities are in conformity with applicable laws and regulations. Commercial production in Fort Washington started as of September 2015.
Under the Consent Decree, after receiving notice from the FDA of being in compliance with applicable laws and regulations, each of the three facilities is subject to a five-year audit period by a third-party cGMP expert. Thus, a third-party expert will continue to reassess the sites at various times for at least five years. A discussion of legal proceedings related to this matter can be found in Note 21 “Legal Proceedings – Government Proceedings – McNeil Consumer Healthcare” of the Notes to Consolidated Financial Statements included in Item 8 of this Report.
|
9
|
||
For information regarding lease obligations, see Note 16 “Rental Expense and Lease Commitments” of the Notes to Consolidated Financial Statements included in Item 8 of this Report. Segment information on additions to property, plant and equipment is contained in Note 18 “Segments of Business and Geographic Areas” of the Notes to Consolidated Financial Statements included in Item 8 of this Report.
|
Item 3.
|
LEGAL PROCEEDINGS
|
The information called for by this item is incorporated herein by reference to the information set forth in Note 21 “Legal Proceedings” of the Notes to Consolidated Financial Statements included in Item 8 of this Report.
In addition, Johnson & Johnson and its subsidiaries are from time to time party to government investigations, inspections or other proceedings relating to environmental matters, including their compliance with applicable environmental laws.
|
Item 4.
|
MINE SAFETY DISCLOSURES
|
Not applicable.
EXECUTIVE OFFICERS OF THE REGISTRANT
Listed below are the executive officers of the Company. There are no family relationships between any of the executive officers, and there is no arrangement or understanding between any executive officer and any other person pursuant to which the executive officer was selected. At the annual meeting of the Board of Directors, the executive officers are elected by the Board to hold office for one year and until their respective successors are elected and qualified, or until earlier resignation or removal.
Information with regard to the directors of the Company, including information for Alex Gorsky, is incorporated herein by reference to the material captioned “Item 1. Election of Directors” in the Proxy Statement.
|
Name
|
Age
|
Position
|
||
|
Dominic J. Caruso
|
59
|
Member, Executive Committee; Executive Vice President; Chief Financial Officer(a)
|
||
|
Joaquin Duato
|
54
|
Member, Executive Committee; Executive Vice President, Worldwide Chairman, Pharmaceuticals(b)
|
||
|
Peter M. Fasolo
|
54
|
Member, Executive Committee; Executive Vice President, Chief Human Resources Officer(c)
|
||
|
Alex Gorsky
|
56
|
Chairman, Board of Directors; Chairman, Executive Committee; Chief Executive Officer
|
||
|
Jorge Mesquita
|
55
|
Member, Executive Committee; Executive Vice President, Worldwide Chairman, Consumer(d)
|
||
|
Sandra E. Peterson
|
58
|
Member, Executive Committee; Executive Vice President, Group Worldwide Chairman(e)
|
||
|
Gary Pruden
|
55
|
Member, Executive Committee; Executive Vice President, Worldwide Chairman, Medical Devices(f)
|
||
|
Paulus Stoffels
|
55
|
Member, Executive Committee; Executive Vice President, Chief Scientific Officer(g)
|
||
|
Michael H. Ullmann
|
58
|
Member, Executive Committee; Executive Vice President, General Counsel(h)
|
||
|
(a)
|
Mr. D. J. Caruso joined the Company in 1999 when the Company acquired Centocor, Inc. At the time of that acquisition, he had been Senior Vice President, Finance of Centocor. Mr. Caruso was named Vice President, Finance of Ortho-McNeil Pharmaceutical, Inc., a subsidiary of the Company, in 2001 and Vice President, Group Finance of the Company’s Medical Devices and Diagnostics Group in 2003. In 2005, Mr. Caruso was named Vice President of the Company’s Group Finance organization. Mr. Caruso became a member of the Executive Committee and Vice President, Finance and Chief Financial Officer in 2007. In April 2016, he was named Executive Vice President, Chief Financial Officer.
|
|
(b)
|
Mr. J. Duato joined the Company in 1989 with Janssen-Farmaceutica S.A. (Spain) and in 1997 became Managing Director of Janssen-Cilag S.p.A. (Italy). In 2000, he led Ortho Biotech Europe before relocating to the United States in 2002 to serve as Vice President, and, in 2005, President of Ortho Biotech Inc. In 2008, he was named Company Group Chairman, Ortho-Clinical Diagnostics, and in 2009 Company Group Chairman, Pharmaceuticals, where he oversaw
|
|
10
|
||
pharmaceutical product launches and the major therapeutic franchises in Canada, the United States and Latin America. In 2011, he was named Worldwide Chairman, Pharmaceuticals, responsible for the global commercial businesses of the Janssen Pharmaceutical Companies, including functional support for the research & development organizations. In April 2016. Mr. Duato became a member of the Executive Committee and was named Executive Vice President, Worldwide Chairman, Pharmaceuticals.
|
(c)
|
Dr. P. M. Fasolo joined the Company in 2004 as Vice President, Worldwide Human Resources for Cordis Corporation, a subsidiary of the Company. He was then named Vice President, Global Talent Management for the Company. He left Johnson & Johnson in 2007 to join Kohlberg Kravis Roberts & Co., as Chief Talent Officer. Dr. Fasolo returned to the Company in 2010 as the Vice President, Global Human Resources, and in 2011, he became a member of the Executive Committee. In April 2016, he was named Executive Vice President, Chief Human Resources Officer.
|
|
(d)
|
Mr. J. Mesquita joined the Company in 2014 as Worldwide Chairman, Consumer. Prior to joining the Company, he served in various marketing and leadership capacities across Latin America, including roles in Oral Care and Beauty, at The Procter & Gamble Company from 1984 to 2013. In April 2016, Mr. Mesquita became a member of the Executive Committee and was named as Executive Vice President, Worldwide Chairman, Consumer.
|
|
(e)
|
Ms. S. E. Peterson joined the Company in 2012 as Group Worldwide Chairman and a member of the Executive Committee. She oversees the Consumer and Consumer Medical Device businesses; the Company's operating infrastructure — Supply Chain, Information Technology, Global Services; Health & Wellness; Global Design; and Health Technology. Prior to joining the Company, Ms. Peterson was Chairman and Chief Executive Officer of Bayer CropScience AG in Germany, previously serving as President and Chief Executive Officer of Bayer Medical Care and President of Bayer HealthCare AG's Diabetes Care Division. Before joining Bayer in 2005, Ms. Peterson held a number of leadership roles at Medco Health Solutions (previously known as Merck-Medco). In April 2016. Ms. Peterson was named Executive Vice President, Group Worldwide Chairman of Johnson & Johnson. Effective June 1, 2017, Ms. Peterson will assume leadership of the Hospital Medical Device business, in addition to her current responsibilities.
|
|
(f)
|
Mr. G. Pruden joined the Company in 1985 with Janssen Pharmaceutica.Inc. and held a number of senior positions in sales, marketing, and strategic account management. In April 2004, he became President of Janssen-Ortho Inc. in Canada. In January 2006, Mr. Pruden was appointed Worldwide President, Ethicon Products, and in 2009 became Company Group Chairman, Ethicon. In 2012, he was named Worldwide Chairman, Global Surgery Group, and in 2015, Worldwide Chairman, Medical Devices. In April 2016. Mr. Pruden became a member of the Executive Committee and was named Executive Vice President, Worldwide Chairman, Medical Devices. Mr. Pruden has announced his intention to retire from the Company effective June 1, 2017.
|
|
(g)
|
Dr. P. Stoffels joined the Company in 2002 with the acquisition of Tibotec Virco NV, where he was Chief Executive Officer of Virco NV and Chairman of Tibotec NV. In 2005, he was appointed Company Group Chairman, Global Virology. In 2006, he assumed the role of Company Group Chairman, Pharmaceuticals, with responsibility for worldwide research and development for the Central Nervous System and Internal Medicine Franchises. Dr. Stoffels was appointed Global Head, Research & Development, Pharmaceuticals in 2009, and in 2011, became Worldwide Chairman, Pharmaceuticals, with responsibility for the Company's therapeutic pipeline through global research and development and strategic business development. In 2012, Dr. Stoffels was also appointed Chief Scientific Officer, with responsibility for enterprise-wide innovation and product safety, and a member of the Executive Committee. In April 2016. Dr. Stoffels was named Executive Vice President, Chief Scientific Officer.
|
|
(h)
|
Mr. M. H. Ullmann joined the Company in 1989 as a corporate attorney in the Law Department. He was appointed Corporate Secretary in 1999 and served in that role until 2006. During that time, he also held various management positions in the Law Department. In 2006, he was named General Counsel, Medical Devices and Diagnostics and was appointed Vice President, General Counsel and a member of the Executive Committee in 2012. In April 2016, Mr. Ullmann was named Executive Vice President, General Counsel.
|
|
11
|
||
|
Item 5.
|
MARKET FOR REGISTRANT’S COMMON EQUITY, RELATED STOCKHOLDER MATTERS AND ISSUER PURCHASES OF EQUITY SECURITIES
|
As of February 17, 2017, there were 156,073
record holders of common stock of the Company. Additional information called for by this item is incorporated herein by reference to the following sections of this Report: “Item 7. Management’s Discussion and Analysis of Results of Operations and Financial Condition – Liquidity and Capital Resources – Dividends” and “— Other Information — Common Stock Market Prices”; Note 17 “Common Stock, Stock Option Plans and Stock Compensation Agreements” of the Notes to Consolidated Financial Statements included in Item 8; and Item 12 “Security Ownership of Certain Beneficial Owners and Management and Related Stockholder Matters – Equity Compensation Plan Information”.
Issuer Purchases of Equity Securities
On October 13, 2015, the Company announced that its Board of Directors approved a share repurchase program, authorizing the Company to purchase up to $10.0 billion of the Company's Common Stock. Share repurchases take place on the open market from time to time based on market conditions. The repurchase program has no time limit and may be delayed or suspended for periods or discontinued at any time.
The following table provides information with respect to common stock purchases by the Company during the fiscal fourth quarter of 2016. Common stock purchases on the open market are made as part of a systematic plan to meet the needs of the Company’s compensation programs. The repurchases below also include the stock-for-stock option exercises that settled in the fiscal fourth quarter.
|
Period
|
Total Number
of Shares Purchased
(1)
|
Avg. Price
Paid Per Share
|
Total Number of Shares (or Units) Purchased as Part of Publicly Announced Plans or Programs
(2)
|
Maximum Number (or Approximate Dollar Value) of Shares (or Units) that May Yet Be Purchased Under the Plans or Programs
(3)
|
|||||||
|
October 3, 2016 through October 30, 2016
|
2,485,016
|
|
$
|
116.76
|
|
-
|
-
|
||||
|
October 31, 2016 through November 27, 2016
|
9,324,574
|
|
116.53
|
|
8,775,704
|
-
|
|||||
|
November 28, 2016 through January 1, 2017
|
5,739,190
|
|
113.35
|
|
3,400,003
|
-
|
|||||
|
Total
|
17,548,780
|
|
12,175,707
|
23,543,007
|
|||||||
|
(1)
|
During the fiscal fourth quarter of 2016, the Company repurchased an aggregate of 17,548,780 shares of Johnson & Johnson Common Stock in open-market transactions, of which 12,175,707 shares were purchased pursuant to the repurchase program that was publicly announced on October 13, 2015, and of which 5,373,073 shares were purchased in open-market transactions as part of a systematic plan to meet the needs of the Company’s compensation programs.
|
|
(2)
|
As of January 1, 2017, an aggregate of 65,362,675 shares were purchased for a total of $7.3 billion since the inception of the repurchase program announced on October 13, 2015.
|
|
(3)
|
As of January 1, 2017, the maximum number of shares that may yet be purchased under the plan is 23,543,007 based on the closing price of Johnson & Johnson Common Stock on the New York Stock Exchange on December 30, 2016 of $115.21 per share.
|
|
12
|
||
|
Item 6.
|
SELECTED FINANCIAL DATA
|
Summary of Operations and Statistical Data 2006-2016
|
(Dollars in Millions Except Per Share Amounts)
|
2016
|
2015
|
2014
|
2013
|
2012
|
2011
|
2010
|
2009
|
2008
|
2007
|
2006
|
|||||||||||||||||||
|
Sales to customers — U.S.
|
$37,811
|
35,687
|
34,782
|
|
31,910
|
|
29,830
|
|
28,908
|
|
29,450
|
|
30,889
|
|
32,309
|
|
32,444
|
|
29,775
|
|
||||||||||
|
Sales to customers — International
|
34,079
|
34,387
|
39,549
|
|
39,402
|
|
37,394
|
|
36,122
|
|
32,137
|
|
31,008
|
|
31,438
|
|
28,651
|
|
23,549
|
|
||||||||||
|
Total sales
|
71,890
|
70,074
|
74,331
|
|
71,312
|
|
67,224
|
|
65,030
|
|
61,587
|
|
61,897
|
|
63,747
|
|
61,095
|
|
53,324
|
|
||||||||||
|
Cost of products sold
|
21,685
|
21,536
|
22,746
|
|
22,342
|
|
21,658
|
|
20,360
|
|
18,792
|
|
18,447
|
|
18,511
|
|
17,751
|
|
15,057
|
|
||||||||||
|
Selling, marketing and administrative expenses
|
19,945
|
21,203
|
21,954
|
|
21,830
|
|
20,869
|
|
20,969
|
|
19,424
|
|
19,801
|
|
21,490
|
|
20,451
|
|
17,433
|
|
||||||||||
|
Research and development expense
|
9,095
|
9,046
|
8,494
|
|
8,183
|
|
7,665
|
|
7,548
|
|
6,844
|
|
6,986
|
|
7,577
|
|
7,680
|
|
7,125
|
|
||||||||||
|
In-process research and development
|
29
|
224
|
178
|
|
580
|
|
1,163
|
|
—
|
|
—
|
|
—
|
|
181
|
|
807
|
|
559
|
|
||||||||||
|
Interest income
|
(368)
|
(128)
|
(67
|
)
|
(74
|
)
|
(64
|
)
|
(91
|
)
|
(107
|
)
|
(90
|
)
|
(361
|
)
|
(452
|
)
|
(829
|
)
|
||||||||||
|
Interest expense, net of portion capitalized
|
726
|
552
|
533
|
|
482
|
|
532
|
|
571
|
|
455
|
|
451
|
|
435
|
|
296
|
|
63
|
|
||||||||||
|
Other (income) expense, net
|
484
|
(2,064)
|
(70
|
)
|
2,498
|
|
1,626
|
|
2,743
|
|
(768
|
)
|
(526
|
)
|
(1,015
|
)
|
534
|
|
(671
|
)
|
||||||||||
|
Restructuring
|
491
|
509
|
—
|
|
—
|
|
—
|
|
569
|
|
—
|
|
1,073
|
|
—
|
|
745
|
|
—
|
|
||||||||||
|
|
52,087
|
50,878
|
53,768
|
|
55,841
|
|
53,449
|
|
52,669
|
|
44,640
|
|
46,142
|
|
46,818
|
|
47,812
|
|
38,737
|
|
||||||||||
|
Earnings before provision for taxes on income
|
$19,803
|
19,196
|
20,563
|
|
15,471
|
|
13,775
|
|
12,361
|
|
16,947
|
|
15,755
|
|
16,929
|
|
13,283
|
|
14,587
|
|
||||||||||
|
Provision for taxes on income
|
3,263
|
3,787
|
4,240
|
|
1,640
|
|
3,261
|
|
2,689
|
|
3,613
|
|
3,489
|
|
3,980
|
|
2,707
|
|
3,534
|
|
||||||||||
|
Net earnings
|
16,540
|
15,409
|
16,323
|
|
13,831
|
|
10,514
|
|
9,672
|
|
13,334
|
|
12,266
|
|
12,949
|
|
10,576
|
|
11,053
|
|
||||||||||
|
Add: Net loss attributable to noncontrolling interest
|
—
|
—
|
—
|
|
—
|
|
339
|
|
—
|
|
—
|
|
—
|
|
—
|
|
—
|
|
—
|
|
||||||||||
|
Net earnings attributable to Johnson & Johnson
|
16,540
|
15,409
|
16,323
|
|
13,831
|
|
10,853
|
|
9,672
|
|
13,334
|
|
12,266
|
|
12,949
|
|
10,576
|
|
11,053
|
|
||||||||||
|
Percent of sales to customers
|
23.0%
|
22.0
|
22.0
|
|
19.4
|
|
16.1
|
|
14.9
|
|
21.7
|
|
19.8
|
|
20.3
|
|
17.3
|
|
20.7
|
|
||||||||||
|
Diluted net earnings per share of common stock
(1)
|
$5.93
|
5.48
|
5.70
|
|
4.81
|
|
3.86
|
|
3.49
|
|
4.78
|
|
4.40
|
|
4.57
|
|
3.63
|
|
3.73
|
|
||||||||||
|
Percent return on average shareholders’ equity
|
23.4%
|
21.9
|
22.7
|
|
19.9
|
|
17.8
|
|
17.0
|
|
24.9
|
|
26.4
|
|
30.2
|
|
25.6
|
|
28.3
|
|
||||||||||
|
Percent increase (decrease) over previous year:
|
|
|
|
|
|
|
|
|
|
|
|
|
||||||||||||||||||
|
Sales to customers
|
2.6%
|
(5.7)
|
4.2
|
|
6.1
|
|
3.4
|
|
5.6
|
|
(0.5
|
)
|
(2.9
|
)
|
4.3
|
|
14.6
|
|
5.6
|
|
||||||||||
|
Diluted net earnings per share
|
8.2%
|
(3.9)
|
18.5
|
|
24.6
|
|
10.6
|
|
(27.0
|
)
|
8.6
|
|
(3.7
|
)
|
25.9
|
|
(2.7
|
)
|
11.3
|
|
||||||||||
|
Supplementary balance sheet data:
|
|
|
|
|
|
|
|
|
|
|
|
|
||||||||||||||||||
|
Property, plant and equipment, net
|
15,912
|
15,905
|
16,126
|
|
16,710
|
|
16,097
|
|
14,739
|
|
14,553
|
|
14,759
|
|
14,365
|
|
14,185
|
|
13,044
|
|
||||||||||
|
Additions to property, plant and equipment
|
3,226
|
3,463
|
3,714
|
|
3,595
|
|
2,934
|
|
2,893
|
|
2,384
|
|
2,365
|
|
3,066
|
|
2,942
|
|
2,666
|
|
||||||||||
|
Total assets
|
141,208
|
133,411
|
130,358
|
|
131,754
|
|
121,347
|
|
113,644
|
|
102,908
|
|
94,682
|
|
84,912
|
|
80,954
|
|
70,556
|
|
||||||||||
|
Long-term debt
|
22,442
|
12,857
|
15,122
|
|
13,328
|
|
11,489
|
|
12,969
|
|
9,156
|
|
8,223
|
|
8,120
|
|
7,074
|
|
2,014
|
|
||||||||||
|
Operating cash flow
(2)
|
18,767
|
19,569
|
18,710
|
|
17,414
|
|
15,396
|
|
14,298
|
|
16,385
|
|
16,571
|
|
14,972
|
|
15,022
|
|
14,248
|
|
||||||||||
|
Common stock information
|
|
|
|
|
|
|
|
|
|
|
|
|
||||||||||||||||||
|
Dividends paid per share
|
$3.15
|
2.95
|
2.76
|
|
2.59
|
|
2.40
|
|
2.25
|
|
2.11
|
|
1.93
|
|
1.795
|
|
1.62
|
|
1.455
|
|
||||||||||
|
Shareholders’ equity per share
|
26.02
|
25.82
|
25.06
|
|
26.25
|
|
23.33
|
|
20.95
|
|
20.66
|
|
18.37
|
|
15.35
|
|
15.25
|
|
13.59
|
|
||||||||||
|
Market price per share (year-end close)
|
$115.21
|
102.72
|
105.06
|
|
92.35
|
|
69.48
|
|
65.58
|
|
61.85
|
|
64.41
|
|
58.56
|
|
67.38
|
|
66.02
|
|
||||||||||
|
Average shares outstanding (millions)
|
||||||||||||||||||||||||||||||
|
— basic
|
2,737.3
|
2,771.8
|
2,815.2
|
|
2,809.2
|
|
2,753.3
|
|
2,736.0
|
|
2,751.4
|
|
2,759.5
|
|
2,802.5
|
|
2,882.9
|
|
2,936.4
|
|
||||||||||
|
— diluted
|
2,788.9
|
2,812.9
|
2,863.9
|
|
2,877.0
|
|
2,812.6
|
|
2,775.3
|
|
2,788.8
|
|
2,789.1
|
|
2,835.6
|
|
2,910.7
|
|
2,961.0
|
|
||||||||||
|
Employees (thousands)
|
126.4
|
127.1
|
126.5
|
|
128.1
|
|
127.6
|
|
117.9
|
|
114.0
|
|
115.5
|
|
118.7
|
|
119.2
|
|
122.2
|
|
||||||||||
(1)
Attributable to Johnson & Johnson.
(2)
Amounts have been reclassified to conform to current year presentation.
|
13
|
||
|
Item 7.
|
MANAGEMENT’S DISCUSSION AND ANALYSIS OF RESULTS OF OPERATIONS AND FINANCIAL CONDITION
|
Organization and Business Segments
Description of the Company and Business Segments
Johnson & Johnson and its subsidiaries (the Company) have approximately 126,400 employees worldwide engaged in the research and development, manufacture and sale of a broad range of products in the health care field. The Company conducts business in virtually all countries of the world with the primary focus on products related to human health and well-being.
The Company is organized into three business segments: Consumer, Pharmaceutical and Medical Devices. The Consumer segment includes a broad range of products used in the baby care, oral care, beauty (previously referred to as skin care), over-the-counter pharmaceutical, women’s health and wound care markets. These products are marketed to the general public and sold both to retail outlets and distributors throughout the world. The Pharmaceutical segment is focused on five therapeutic areas, including immunology, infectious diseases, neuroscience, oncology, and cardiovascular and metabolic diseases. Products in this segment are distributed directly to retailers, wholesalers, hospitals and health care professionals for prescription use. The Medical Devices segment includes a broad range of products used in the orthopaedic, surgery, cardiovascular, diabetes care and vision care fields which are distributed to wholesalers, hospitals and retailers, and used principally in the professional fields by physicians, nurses, hospitals, eye care professionals and clinics.
The Executive Committee of Johnson & Johnson is the principal management group responsible for the strategic operations and allocation of the resources of the Company. This Committee oversees and coordinates the activities of the Consumer, Pharmaceutical and Medical Devices business segments.
In all of its product lines, the Company competes with companies both locally and globally, throughout the world. Competition exists in all product lines without regard to the number and size of the competing companies involved. Competition in research, involving the development and the improvement of new and existing products and processes, is particularly significant. The development of new and innovative products, as well as protecting the underlying intellectual property of the Company's product portfolio, is important to the Company’s success in all areas of its business. The competitive environment requires substantial investments in continuing research. In addition, the development and maintenance of customer demand for the Company’s consumer products involves significant expenditures for advertising and promotion.
Management’s Objectives
The Company manages within a strategic framework with Our Credo as the foundation. The Company believes that our strategic operating principles: being broadly based in human health care, managing the business for the long term, having a decentralized management approach, and being committed to our people and values, are crucial to successfully meeting the demands of the rapidly evolving markets in which we compete. To this end, management is focused on our long-term strategic growth drivers: creating value through innovation, expanding our global reach with a local focus, excellence in execution and leading with purpose.
The Company is broadly based in human health care, and is committed to creating value by developing accessible, high quality, innovative products and services. New products introduced within the past five years accounted for approximately 22% of 2016 sales. In 2016, $9.1 billion, or 12.7% of sales, was invested in research and development, reflecting management’s commitment to delivering new and differentiated products and services to meet evolving health care needs and sustain the Company’s long-term growth.
Our diverse businesses with more than 230 operating companies located in 60 countries are the key drivers of the Company’s success. Maintaining the Company’s decentralized management approach, while at the same time leveraging the extensive resources of the enterprise, positions the Company well to innovate, execute strategic plans and reach markets globally, as well as address the needs and challenges of the local markets.
In order to remain a leader in health care, the Company strives to maintain a purpose-driven organization and is committed to developing global business leaders who can achieve these growth objectives. Businesses are managed for the long-term in order to sustain market leadership positions and enable growth, which provides an enduring source of value to our shareholders.
Our Credo unifies all Johnson & Johnson employees in achieving these objectives, and provides a common set of values that serve as the foundation of the Company’s responsibilities to patients, consumers and health care professionals, employees, communities and shareholders. The Company believes that these foundational values, its strategic framework and long-term growth drivers, along with its overall mission of improving the quality of life for people around the world, will enable Johnson & Johnson to continue to be a leader in the health care industry.
|
14
|
||
Results of Operations
Analysis of Consolidated Sales
In 2016, worldwide sales increased 2.6% to $71.9 billion, compared to a decrease of 5.7% in 2015 and an increase of 4.2% in 2014. These sales changes consisted of the following:
|
Sales increase/(decrease) due to:
|
2016
|
2015
|
2014
|
||||||
|
Volume
|
3.2
|
%
|
1.2
|
%
|
6.3
|
|
|||
|
Price
|
0.7
|
|
0.6
|
|
(0.2
|
)
|
|||
|
Currency
|
(1.3
|
)
|
(7.5
|
)
|
(1.9
|
)
|
|||
|
Total
|
2.6
|
%
|
(5.7
|
)%
|
4.2
|
|
|||
In 2016, acquisitions and divestitures had a negative impact of 1.1% on the worldwide operational sales growth and competitive products to the Company's Hepatitis C products, OLYSIO
®
/SOVRIAD
®
(simeprevir) and INCIVO
®
(telaprevir), had a negative impact of 0.8% on the worldwide operational sales growth. Operations in Venezuela negatively impacted the worldwide operational sales growth 0.3%.
In 2015, the introduction of competitive products to the Company's Hepatitis C products, OLYSIO
®
/SOVRIAD
®
(simeprevir) and INCIVO
®
(telaprevir), had a negative impact of 2.7% on the worldwide operational sales growth. In 2015, the impact of acquisitions and divestitures on the worldwide operational sales growth was negative 2.0%.
In 2014, sales of the Company's Hepatitis C products, OLYSIO
®
/SOVRIAD
®
(simeprevir) and INCIVO
®
(telaprevir), had a positive impact of 2.8%, and the divestiture of the Ortho-Clinical Diagnostics business had a negative impact of 1.4% on the worldwide operational growth.
Sales by U.S. companies were $37.8 billion in 2016, $35.7 billion in 2015 and $34.8 billion in 2014. This represents increases of 6.0% in 2016, 2.6% in 2015 and 9.0% in 2014. Sales by international companies were $34.1 billion in 2016, $34.4 billion in 2015 and $39.5 billion in 2014. This represents decreases of 0.9% in 2016, and 13.1% in 2015 and an increase of 0.4% in 2014.
The five-year compound annual growth rates for worldwide, U.S. and international sales were 2.0%, 5.5% and (1.2)%, respectively. The ten-year compound annual growth rates for worldwide, U.S. and international sales were 3.0%, 2.4% and 3.8%, respectively.
Sales by companies in Europe experienced a decline of 1.4% as compared to the prior year, including operational growth of 1.4%, offset by a negative currency impact of 2.8%. Sales by companies in the Western Hemisphere (excluding the U.S.) experienced a decline of 5.1% as compared to the prior year, including operational growth of 4.0% offset by a negative currency impact of 9.1%. Sales by companies in the Asia-Pacific, Africa region achieved growth of 1.8% as compared to the prior year, including operational growth of 1.4% and a positive currency impact of 0.4%.
The 2016 sales growth percentage as compared to the prior year was negatively impacted by approximately 1.3% from additional shipping days in 2015. (See Note 1 to the Consolidated Financial Statements for Annual Closing Date details). While the additional week in 2015 added a few days to sales, it also added a full week's worth of operating costs; therefore, the net earnings impact was negligible.
In 2016, the Company had two wholesalers distributing products for all three segments that represented approximately 13.5% and 10.7% of the total consolidated revenues. In 2015 and 2014, the Company had one wholesaler distributing products for all three segments that represented approximately 12.5% and 11.0%, respectively, of the total consolidated revenues.
|
15
|
||
Analysis of Sales by Business Segments
Consumer Segment
Consumer segment sales in 2016 were $13.3 billion, a decrease of 1.5% from 2015, which included 1.5% operational growth offset by a negative currency impact of 3.0%. U.S. Consumer segment sales were $5.4 billion, an increase of 3.8%. International sales were $7.9 billion, a decrease of 4.8%, which included 0.1% operational growth offset by a negative currency impact of 4.9%. In 2016, the impact of acquisitions and divestitures on the Consumer segment operational sales growth was negative 0.5%. In 2016, the Consumer segment operational sales growth was negatively impacted 1.2% by operations in Venezuela and negatively impacted by 1.1% due to additional shipping days in 2015.
Major Consumer Franchise Sales:*
|
|
|
|
|
% Change
|
||||||||||||
|
(Dollars in Millions)
|
2016
|
2015
|
2014
|
’16 vs. ’15
|
’15 vs. ’14
|
|||||||||||
|
OTC
|
$
|
3,977
|
|
3,895
|
|
4,016
|
|
2.1
|
%
|
(3.0
|
)
|
|||||
|
Beauty**
|
3,897
|
|
3,633
|
|
3,873
|
|
7.3
|
|
(6.2
|
)
|
||||||
|
Baby Care
|
2,001
|
|
2,157
|
|
2,346
|
|
(7.2
|
)
|
(8.1
|
)
|
||||||
|
Oral Care
|
1,568
|
|
1,580
|
|
1,647
|
|
(0.8
|
)
|
(4.1
|
)
|
||||||
|
Women’s Health
|
1,067
|
|
1,200
|
|
1,302
|
|
(11.1
|
)
|
(7.8
|
)
|
||||||
|
Wound Care/Other
|
797
|
|
1,042
|
|
1,312
|
|
(23.5
|
)
|
(20.6
|
)
|
||||||
|
Total Consumer Sales
|
$
|
13,307
|
|
13,507
|
|
14,496
|
|
(1.5
|
)%
|
(6.8
|
)
|
|||||
* Prior year amounts have been reclassified to conform to current year product disclosure.
** Formerly Skin Care
The Over-the-Counter (OTC) franchise sales of $4.0 billion increased 2.1% as compared to the prior year, which included 4.8% operational growth and a negative currency impact of 2.7%. Operational growth was primarily driven by analgesics, anti-smoking aids and digestive health products.
The Beauty franchise sales of $3.9 billion increased 7.3% as compared to the prior year, which included 9.4% operational growth and a negative currency impact of 2.1%. Operational growth was primarily due to sales from the recent acquisitions of Vogue International LLC, which contributed approximately 4.6%, and NeoStrata Company, Inc., as well as sales growth of NEUTROGENA
®
, AVEENO
®
adult
products and DABAO
®
products.
The Baby Care franchise sales were $2.0 billion in 2016, a decrease of 7.2% compared to the prior year, primarily due to competitive pressure partially offset by sales growth of AVEENO
®
baby
products.
The Oral Care franchise sales were $1.6 billion in 2016, a decrease of 0.8% as compared to the prior year, which included 2.0% operational growth and a negative currency impact of 2.8%. Operational growth was driven by increased sales of LISTERINE
®
products,
attributable to new product launches and successful marketing campaigns.
The Women’s Health franchise sales were $1.1 billion in 2016, a decrease of 11.1% as compared to the prior year, primarily due to operations in Venezuela and the U.S. divestiture of TUCKS
®
.
The Wound Care/Other franchise sales were $0.8 billion in 2016, a decrease of 23.5% from 2015, primarily due to the SPLENDA
®
divestiture.
Consumer segment sales in 2015 were $13.5 billion, a decrease of 6.8% from 2014, which included 2.7% operational growth offset by a negative currency impact of 9.5%. U.S. Consumer segment sales were $5.2 billion, an increase of 2.5%. International sales were $8.3 billion, a decrease of 11.9%, which included 2.7% operational growth offset by a negative currency impact of 14.6%. In 2015, divestitures had a negative impact of 1.4% on the worldwide Consumer segment operational growth.
|
16
|
||
Pharmaceutical Segment
Pharmaceutical segment sales in 2016 were $33.5 billion, an increase of 6.5% from 2015, which included operational growth of 7.4% partially offset by a negative currency impact of 0.9%. U.S. sales were $20.1 billion, an increase of 9.8%. International sales were $13.3 billion, an increase of 1.8%, which included 4.0% operational growth partially offset by a negative currency impact of 2.2%. In 2016, acquisitions, divestitures and competitive products to the Company's Hepatitis C products, OLYSIO
®
/SOVRIAD
®
(simeprevir) and INCIVO
®
(telaprevir), had a negative impact of 2.5% on the operational growth of the Pharmaceutical segment. In 2016, the Pharmaceutical segment operational growth was negatively impacted by 1.5% due to additional shipping days in 2015. The Pharmaceutical segment operational growth for 2016, as compared to the prior year, was not impacted by adjustments to previous reserve estimates as both periods included approximately $0.5 billion of adjustments.
Major Pharmaceutical Therapeutic Area Sales:
*
|
% Change
|
||||||||||||||||
|
(Dollars in Millions)
|
2016
|
2015
|
2014
|
’16 vs. ’15
|
’15 vs. ’14
|
|||||||||||
|
Total Immunology
|
$
|
11,968
|
|
10,402
|
|
10,193
|
|
15.1
|
%
|
2.1
|
|
|||||
|
REMICADE
®
|
6,966
|
|
6,561
|
|
6,868
|
|
6.2
|
|
(4.5
|
)
|
||||||
|
SIMPONI
®
/SIMPONI ARIA
®
|
1,745
|
|
1,328
|
|
1,187
|
|
31.4
|
|
11.9
|
|
||||||
|
STELARA
®
|
3,232
|
|
2,474
|
|
2,072
|
|
30.6
|
|
19.4
|
|
||||||
|
Other Immunology
|
25
|
|
39
|
|
66
|
|
(35.9
|
)
|
(40.9
|
)
|
||||||
|
Total Infectious Diseases
|
3,208
|
|
3,656
|
|
5,599
|
|
(12.3
|
)
|
(34.7
|
)
|
||||||
|
EDURANT
®
/rilpivirine
|
573
|
|
410
|
|
365
|
|
39.8
|
|
12.3
|
|
||||||
|
OLYSIO
®
/SOVRIAD
®
|
106
|
|
621
|
|
2,302
|
|
(82.9
|
)
|
(73.0
|
)
|
||||||
|
PREZISTA
®
/ PREZCOBIX
®
/REZOLSTA
®
|
1,851
|
|
1,810
|
|
1,831
|
|
2.3
|
|
(1.1
|
)
|
||||||
|
Other Infectious Diseases
|
678
|
|
815
|
|
1,101
|
|
(16.8
|
)
|
(26.0
|
)
|
||||||
|
Total Neuroscience
|
6,085
|
|
6,259
|
|
6,487
|
|
(2.8
|
)
|
(3.5
|
)
|
||||||
|
CONCERTA
®
/methylphenidate
|
863
|
|
821
|
|
599
|
|
5.1
|
|
37.1
|
|
||||||
|
INVEGA
®
/paliperidone
|
311
|
|
573
|
|
640
|
|
(45.7
|
)
|
(10.5
|
)
|
||||||
|
INVEGA SUSTENNA
®
/XEPLION
®
/TRINZA
®
|
2,214
|
|
1,830
|
|
1,588
|
|
21.0
|
|
15.2
|
|
||||||
|
RISPERDAL
®
CONSTA
®
|
893
|
|
970
|
|
1,190
|
|
(7.9
|
)
|
(18.5
|
)
|
||||||
|
Other Neuroscience
|
1,804
|
|
2,065
|
|
2,470
|
|
(12.6
|
)
|
(16.4
|
)
|
||||||
|
Total Oncology
|
5,807
|
|
4,695
|
|
4,457
|
|
23.7
|
|
5.3
|
|
||||||
|
DARZALEX
®
|
572
|
|
20
|
|
—
|
|
**
|
|
—
|
|
||||||
|
IMBRUVICA
®
|
1,251
|
|
689
|
|
200
|
|
81.6
|
|
**
|
|
||||||
|
VELCADE
®
|
1,224
|
|
1,333
|
|
1,618
|
|
(8.2
|
)
|
(17.6
|
)
|
||||||
|
ZYTIGA
®
|
2,260
|
|
2,231
|
|
2,237
|
|
1.3
|
|
(0.3
|
)
|
||||||
|
Other Oncology
|
500
|
|
422
|
|
402
|
|
18.5
|
|
5.0
|
|
||||||
|
Cardiovascular / Metabolism / Other
|
6,396
|
|
6,418
|
|
5,577
|
|
(0.3
|
)
|
15.1
|
|
||||||
|
XARELTO
®
|
2,288
|
|
1,868
|
|
1,522
|
|
22.5
|
|
22.7
|
|
||||||
|
INVOKANA
®
/ INVOKAMET
®
|
1,407
|
|
1,308
|
|
586
|
|
7.6
|
|
**
|
|
||||||
|
PROCRIT
®
/EPREX
®
|
1,105
|
|
1,068
|
|
1,238
|
|
3.5
|
|
(13.7
|
)
|
||||||
|
Other
|
1,596
|
|
2,174
|
|
2,231
|
|
(26.6
|
)
|
(2.6
|
)
|
||||||
|
Total Pharmaceutical Sales
|
$
|
33,464
|
|
31,430
|
|
32,313
|
|
6.5
|
%
|
(2.7
|
)
|
|||||
* Prior year amounts have been reclassified to conform to current year presentation.
** Percentage greater than 100%
Immunology products achieved sales of $12.0 billion in 2016, representing an increase of 15.1% as compared to the prior year. Immunology products growth of 15.1% included operational growth of 15.9% and a negative currency impact of 0.8%. The strong growth of REMICADE
®
(infliximab), STELARA
®
(ustekinumab) and SIMPONI
®
/SIMPONI ARIA
®
(golimumab)was primarily driven by immunology market growth and increased penetration for both STELARA
®
(ustekinumab) and SIMPONI
®
/SIMPONI ARIA
®
(golimumab).
|
17
|
||
The patents for REMICADE
®
(infliximab)
in certain countries in Europe expired in February 2015. Biosimilar versions of REMICADE
®
have been introduced in certain markets outside the United States, resulting in a reduction in sales of REMICADE
®
in those markets. Additional biosimilar competition will likely result in a further reduction in REMICADE
®
sales in markets outside the United States. The introduction of a biosimilar version of REMICADE
®
in the United States is subject to enforcement of patent rights, approval by the U.S. Food and Drug Administration (FDA) and compliance with the 180-day notice provisions of the Biologics Price Competition and Innovation Act (the BPCIA). In April 2016, the FDA approved for sale in the United States an infliximab biosimilar to be marketed by a subsidiary of Pfizer Inc. In October 2016, the period for notice of launch under the BPCIA passed and Pfizer Inc., began shipment of an infliximab biosimilar to wholesalers in the United States in late November 2016. Sales of an infliximab biosimilar in the U.S. market will result in a reduction in U.S. sales of REMICADE
®
. The Company continues to assert REMICADE
®
related patent rights. See Note 21 to the Consolidated Financial Statements for a description of legal matters regarding the REMICADE
®
patents.
Infectious disease products sales were $3.2 billion, a decline of 12.3% from 2015, which included an operational decrease of 11.2% and a negative currency impact of 1.1%. Competitive products to the Company's Hepatitis C products, OLYSIO
®
/SOVRIAD
®
(simeprevir) and INCIVO
®
(telaprevir), had a significant negative impact on sales. The decline of Hepatitis C sales was partially offset by sales growth of EDURANT
®
(rilpivirine) and PREZCOBIX
®
(darunavir/cobicistat).
Neuroscience products sales were $6.1 billion, a decrease of 2.8% from 2015, which included an operational decrease of 2.3% and a negative currency impact of 0.5%. Strong sales of INVEGA SUSTENNA
®
/XEPLION
®
/ TRINZA
®
(paliperidone palmitate) were offset by lower sales of INVEGA
®
(paliperidone) due to generic competition, RISPERDAL CONSTA
®
(risperidone) and the impact of divestitures. Sales growth of CONCERTA
®
/methylphenidate was primarily due to a therapeutic equivalence reclassification of generic competitors.
Oncology products achieved sales of $5.8 billion in 2016, representing an increase of 23.7% as compared to the prior year. Oncology products growth of 23.7% included operational growth of 25.2% and a negative currency impact of 1.5%. Contributors to the growth of Oncology products were strong sales of IMBRUVICA
®
(ibrutinib) and DARZALEX
®
(daratumumab) due to patient uptake, additional country launches and additional indications for IMBRUVICA
®
. Generic competition negatively impacted the sales growth of VELCADE
®
(bortezomib). Sales growth of ZYTIGA
®
(abiraterone acetate) in the Asia Pacific region, primarily due to the launch in China earlier this year, was partially offset by lower sales in Europe due to competition.
Cardiovascular/Metabolism/Other products sales were $6.4 billion, a decline of 0.3% from 2015, which included an operational increase of 0.8% and a negative currency impact of 1.1%. Contributors to the growth were strong sales of XARELTO
®
(rivaroxaban) due to market share growth and INVOKANA
®
/INVOKAMET
®
(canagliflozin) due to market growth and continued uptake in the European Union and Canada. Sales of hormonal contraceptives were negatively impacted by generic competition and a higher adjustment to previous reserve estimates in 2015 as compared to 2016, which negatively impacted Cardiovascular/Metabolism/Other by approximately 2.3%.
|
18
|
||
During 2016, the Company advanced its pipeline with several regulatory submissions and approvals for new drugs and additional indications for existing drugs as follows:
|
Product Name (Chemical Name)
|
Indication
|
US Approv
|
EU Approv
|
US Filing
|
EU Filing
|
|
DARZALEX
®
(daratumumab)
|
In combination with lenalidomide and dexamethasone, or bortezomib and dexamethasone, for the treatment of patients with multiple myeloma who have received at least one prior therapy
|
ü
|
ü
|
||
|
For the treatment of double refractory multiple myeloma
|
ü
|
||||
|
darunavir STR
|
Single tablet regimen for HIV in treatment naive patients and treatment experienced patients
|
ü
|
|||
|
guselkumab
|
Treatment of adults living with moderate to severe plaque psoriasis
|
ü
|
ü
|
||
|
IMBRUVICA
®
(ibrutinib)
|
Additional indication for first-line treatment of chronic lymphocytic leukemia
|
ü
|
ü
|
||
|
Expanded label to include overall survival and combination data in chronic lymphocytic leukemia/small lymphocytic lymphoma (CLL/SLL)
|
ü
|
||||
|
Expanded label to include treatment for patients with relapsed or refractory chronic lymphocytic leukemia (CLL) or small lymphocytic lymphoma in combination with bendamustine and rituximab
|
ü
|
ü
|
|||
|
INVOKAMET
®
(canagliflozin)
|
Initial Therapy FDC with Metformin, Immediate Release
|
ü
|
|||
|
INVOKAMET
®
XR (canagliflozin)
|
A once-daily therapy combining fixed doses of canagliflozin and metformin hydrochloride extended release for the treatment of adults with type 2 diabetes
|
ü
|
|||
|
SIMPONI
®
(golimumab)
|
Treatment of polyarticular juvenile idiopathic arthritis
|
ü
|
|||
|
SIMPONI ARIA
®
(golimumab)
|
Treatment of adults living with active psoriatic arthritis and the treatment of adults living with active ankylosing spondylitis
|
ü
|
|||
|
sirukumab
|
Treatment of Rheumatoid Arthritis
|
ü
|
ü
|
||
|
STELARA
®
(ustekinumab)
|
Treatment of adults with moderately to severely active Crohn's disease
|
ü
|
ü
|
||
|
Treatment of adolescents (12 to 17 years of age) with moderate to severe plaque psoriasis
|
ü
|
||||
|
TREVICTA
®
(paliperidone palmitate a 3 monthly injection)
|
Maintenance treatment of schizophrenia in adult patients
|
ü
|
|||
Pharmaceutical segment sales in 2015 were $31.4 billion, a decrease of 2.7% from 2014, which included operational growth of 4.2% offset by a negative currency impact of 6.9%. U.S. sales were $18.3 billion, an increase of 5.2%. International sales were $13.1 billion, a decrease of 12.0%, which included 3.0% operational growth offset by a negative currency impact of 15.0%. The Pharmaceutical segment operational growth was negatively impacted by 6.5% due to the introduction of competitive products to the Company's Hepatitis C products, OLYSIO
®
/SOVRIAD
®
(simeprevir) and INCIVO
®
(telaprevir), and positively impacted by 1.4% due to an adjustment to previous reserve estimates, including Managed Medicaid rebates primarily in the Cardiovascular/Metabolism/Other therapeutic area. In 2015, divestitures had a negative impact of 0.3% on the worldwide Pharmaceutical segment operational growth.
|
19
|
||
Medical Devices Segment
The Medical Devices segment sales in 2016 were $25.1 billion, a decrease of 0.1% from 2015, which included an operational increase of 0.9% and a negative currency impact of 1.0%. U.S. sales were $12.3 billion, an increase of 1.1% as compared to the prior year. International sales were $12.9 billion, a decrease of 1.2% as compared to the prior year, with an operational increase of 0.7% and a negative currency impact of 1.9%. In 2016, acquisitions and divestitures had a negative impact of 1.8% on the worldwide operational growth of the Medical Devices segment as compared to 2015. In 2016, the Medical Devices segment operational growth was negatively impacted by 0.9% due to additional shipping days in 2015.
Major Medical Devices Franchise Sales:
|
|
|
|
|
% Change
|
||||||||||||
|
(Dollars in Millions)
|
2016
|
2015
|
2014
|
’16 vs. ’15
|
’15 vs. ’14
|
|||||||||||
|
Orthopaedics
|
$
|
9,334
|
|
9,262
|
|
9,675
|
|
0.8
|
%
|
(4.3
|
)
|
|||||
|
Hips
|
1,361
|
|
1,332
|
|
1,368
|
|
2.2
|
|
(2.6
|
)
|
||||||
|
Knees
|
1,524
|
|
1,496
|
|
1,533
|
|
1.9
|
|
(2.4
|
)
|
||||||
|
Trauma
|
2,569
|
|
2,528
|
|
2,640
|
|
1.6
|
|
(4.2
|
)
|
||||||
|
Spine & Other
|
3,880
|
|
3,906
|
|
4,134
|
|
(0.7
|
)
|
(5.5
|
)
|
||||||
|
Surgery
|
9,296
|
|
9,217
|
|
9,717
|
|
0.9
|
|
(5.1
|
)
|
||||||
|
Advanced
|
3,517
|
|
3,275
|
|
3,237
|
|
7.4
|
|
1.2
|
|
||||||
|
General
|
4,362
|
|
4,482
|
|
4,970
|
|
(2.7
|
)
|
(9.8
|
)
|
||||||
|
Specialty
|
1,417
|
|
1,460
|
|
1,510
|
|
(2.9
|
)
|
(3.3
|
)
|
||||||
|
Vision Care
|
2,785
|
|
2,608
|
|
2,818
|
|
6.8
|
|
(7.5
|
)
|
||||||
|
Cardiovascular
|
1,849
|
|
2,036
|
|
2,208
|
|
(9.2
|
)
|
(7.8
|
)
|
||||||
|
Diabetes Care
|
1,789
|
|
1,928
|
|
2,142
|
|
(7.2
|
)
|
(10.0
|
)
|
||||||
|
Diagnostics*
|
66
|
|
86
|
|
962
|
|
(23.3
|
)
|
(91.1
|
)
|
||||||
|
Total Medical Devices Sales
|
$
|
25,119
|
|
25,137
|
|
27,522
|
|
(0.1
|
)%
|
(8.7
|
)
|
|||||
* On June 30, 2014, the Company divested the Ortho-Clinical Diagnostics business (the Diagnostics Franchise)
The Orthopaedics franchise sales were $9.3 billion in 2016, an increase of 0.8% from 2015, which included operational growth of 1.8% and a negative currency impact of 1.0%. Sales growth was primarily driven by market growth, U.S. sales of the trauma TFNA nailing system, worldwide sales of the hip primary stem platform and the ATTUNE
®
Knee System. Growth was negatively impacted by continued pricing pressures.
The Surgery franchise sales were $9.3 billion in 2016, an increase of 0.9% from 2015, which included operational growth of 2.3% and a negative currency impact of 1.4%. Operational growth in Advanced Surgery was driven by endocutter, energy and biosurgery products, primarily attributable to market growth, increased penetration in certain markets and new product launches. The acquisition of NeuWave Medical, Inc. also contributed to growth. The operational decline in General Surgery was due to lower sales of women's health and urology products and pricing pressures partially offset by growth of sutures. The operational decline in Specialty Surgery was primarily due to lower sales of Acclarent products and Advanced Sterilization Products outside the U.S., divestitures and competitive pressures in Sterilmed partially offset by growth of Mentor products outside the U.S.
The Vision Care franchise achieved sales of $2.8 billion in 2016, an increase of 6.8% from 2015, which included operational growth of 6.4% and a positive currency impact of 0.4%. Growth in all the major regions was primarily driven by new product launches.
The Cardiovascular franchise sales were $1.8 billion, a decrease of 9.2% from 2015, which represented an operational decline of 9.2%. Strong operational growth in the electrophysiology business driven by market growth, share growth and new product launches was more than offset by the impact of divesting the Cordis business. The Company completed the divestiture of the Cordis business to Cardinal Health on October 4, 2015. For additional details see Note 20 to the Consolidated Financial Statements.
The Diabetes Care franchise sales were $1.8 billion, a decrease of 7.2% from 2015, which represented an operational decline of 5.9% and a negative currency impact of 1.3%. The operational decline was primarily due to price declines and competitive pressures. On January 26, 2017, subsequent to year-end, the Company announced it is engaging in a process to evaluate potential strategic options for the Diabetes Care franchise.
The Medical Devices segment sales in 2015 were $25.1 billion, a decrease of 8.7% from 2014, which included an operational decline of 1.4% and a negative currency impact of 7.3%. U.S. sales were $12.1 billion, a decrease of 1.0% as
|
20
|
||
compared to the prior year. International sales were $13.0 billion, a decrease of 14.8% as compared to the prior year, with an operational decrease of 1.7% and a negative currency impact of 13.1%. The divestitures of the Ortho-Clinical Diagnostics and the Cordis Businesses had a negative impact of 3.2% and 0.6%, respectively, on the worldwide operational growth of the Medical Devices segment as compared to 2014.
Analysis of Consolidated Earnings Before Provision for Taxes on Income
Consolidated earnings before provision for taxes on income increased to $19.8 billion in 2016, as compared to $19.2 billion in 2015, an increase of 3.2%. The increase was primarily attributable to higher sales volume, favorable mix in the business and lower selling, marketing and administrative costs. This was partially offset by higher net litigation expense of $0.7 billion and a higher restructuring charge of $0.1 billion as compared to 2015. Additionally, the fiscal year 2015 included higher gains on the sale of assets/businesses as compared to 2016. The fiscal year of 2016 included gains of $0.6 billion from the divestitures of the controlled substance raw material and API business, certain anesthetic products in Europe and certain non-strategic Consumer brands versus gains of $2.6 billion recorded in 2015 primarily from the divestiture of the Cordis business, the U.S. divestiture of NUCYNTA
®
and
the SPLENDA
®
brand. This was partially offset by a $0.3 billion intangible asset write-down related to Acclarent included in 2015.
Consolidated earnings before provision for taxes on income decreased to $19.2 billion in 2015, as compared to $20.6 billion in 2014, a decrease of 6.6%. The decrease was primarily attributable to significantly lower sales of OLYSIO
®
/SOVRIAD
®
(simeprevir), negative currency impacts, a restructuring charge of $0.6 billion and higher intangible asset write-downs of $0.1 billion in 2015 as compared to 2014. The decrease was partially offset by lower net litigation expense of $1.1 billion, lower Synthes integration costs of $0.6 billion, a positive adjustment of $0.4 billion to previous reserve estimates including Managed Medicaid rebates, and higher gains of $0.3 billion from divestitures as compared to the prior year. The fiscal year 2015 included higher gains of $0.3 billion primarily from the divestitures of the Cordis business, the SPLENDA
®
brand and the U.S. divestiture of NUCYNTA
®
versus the gains recorded in 2014 from the divestitures of the Ortho-Clinical Diagnostics business and the K-Y
®
brand. Additionally, 2014 included an additional year of the Branded Prescription Drug Fee of $0.2 billion.
As a percent to sales, consolidated earnings before provision for taxes on income in 2016 was 27.5% versus 27.4% in 2015.
Cost of Products Sold and Selling, Marketing and Administrative Expenses:
Cost of products sold and selling, marketing and administrative expenses as a percent to sales were as follows:
|
% of Sales
|
2016
|
2015
|
2014
|
||||||
|
Cost of products sold
|
30.2
|
%
|
30.7
|
|
30.6
|
|
|||
|
Percent point increase/(decrease) over the prior year
|
(0.5
|
)
|
0.1
|
|
(0.7
|
)
|
|||
|
Selling, marketing and administrative expenses
|
27.7
|
%
|
30.3
|
|
29.5
|
|
|||
|
Percent point increase/(decrease) over the prior year
|
(2.6
|
)
|
0.8
|
|
(1.1
|
)
|
|||
In 2016, cost of products sold as a percent to sales decreased to 30.2% from 30.7% as compared to the same period a year ago. Favorable mix in the business and cost improvement programs was partially offset by the unfavorable impact of transactional currency. Intangible asset amortization expense of $1.2 billion was included in cost of products sold for 2016 and 2015. There was a decrease in the percent to sales of selling, marketing and administrative expenses in 2016 compared to the prior year, primarily due to cost management in all the segments and favorable mix.
In 2015, cost of products sold as a percent to sales increased slightly as compared to the prior year. Favorable mix between the segments was offset by $81 million associated with the restructuring activity in the Medical Devices segment, negative transactional currency and lower sales of OLYSIO
®
/SOVRIAD
®
(simeprevir) in 2015. Intangible asset amortization expense included in cost of products sold for 2015 and 2014 was $1.2 billion and $1.4 billion, respectively. There was an increase in the percent to sales of selling, marketing and administrative expenses in 2015 compared to the prior year, primarily due to incremental investment spending in all the segments and the impact from lower sales of OLYSIO
®
/SOVRIAD
®
(simeprevir), partially offset by favorable mix and the inclusion of an additional year of the Branded Prescription Drug Fee of $0.2 billion in 2014.
|
21
|
||
Research and Development Expense:
Research and development expense by segment of business was as follows:
|
|
2016
|
2015
|
2014
|
||||||||||||||||
|
(Dollars in Millions)
|
Amount
|
% of Sales*
|
Amount
|
% of Sales*
|
Amount
|
% of Sales*
|
|||||||||||||
|
Consumer
|
$
|
580
|
|
4.4
|
%
|
625
|
|
4.6
|
|
629
|
|
4.3
|
|
||||||
|
Pharmaceutical
|
6,967
|
|
20.8
|
|
6,821
|
|
21.7
|
|
6,213
|
|
19.2
|
|
|||||||
|
Medical Devices
|
1,548
|
|
6.2
|
|
1,600
|
|
6.4
|
|
1,652
|
|
6.0
|
|
|||||||
|
Total research and development expense
|
$
|
9,095
|
|
12.7
|
%
|
9,046
|
|
12.9
|
|
8,494
|
|
11.4
|
|
||||||
|
Percent increase/(decrease) over the prior year
|
0.5
|
%
|
|
|
6.5
|
|
|
|
3.8
|
|
|
|
|||||||
|
*
|
As a percent to segment sales
|
Research and development activities represent a significant part of the Company's business. These expenditures relate to the processes of discovering, testing and developing new products, upfront payments and milestones, improving existing products, as well as ensuring product efficacy and regulatory compliance prior to launch. The Company remains committed to investing in research and development with the aim of delivering high quality and innovative products. In 2016, worldwide costs of research and development activities increased by 0.5% compared to 2015 but decreased as a percent of sales. The decrease as a percent of sales was attributable to higher overall sales in the Pharmaceutical segment. The increased dollar spend in the Pharmaceutical segment was for investment spending to advance the pipeline. In 2015, worldwide costs of research and development activities increased by 6.5% compared to 2014. The increase as a percent to sales was attributable to increased investment spending primarily in the Pharmaceutical segment, lower overall sales and business mix.
In-Process Research and Development (IPR&D):
In 2016, the Company recorded an IPR&D charge of $29 million for the discontinuation of a development program related to Crucell. In 2015, the Company recorded an IPR&D charge of $0.2 billion primarily for the discontinuation of certain development projects related to Covagen. In 2014, the Company recorded an IPR&D charge of $0.2 billion for the impairment of various IPR&D projects related to RespiVert, Crucell, Mentor and Synthes for the delay or discontinuation of certain development projects.
Other (Income) Expense, Net:
Other (income) expense, net is the account where the Company records gains and losses related to the sale and write-down of certain investments in equity securities held by Johnson & Johnson Innovation - JJDC, Inc. (JJDC), gains and losses on divestitures, transactional currency gains and losses, acquisition-related costs, litigation accruals and settlements, as well as royalty income. The change in other (income) expense, net for the fiscal year 2016 was an unfavorable change of $2.5 billion as compared to the prior year primarily due to higher gains on the sale of assets/businesses in the fiscal year 2015 as compared to 2016. The fiscal year of 2016 included gains of $0.6 billion from the divestitures of the controlled substance raw material and API business, certain anesthetic products in Europe and certain non-strategic Consumer brands versus gains of $2.6 billion recorded in 2015 primarily from the divestiture of the Cordis business, the U.S. divestiture of NUCYNTA
®
and
the SPLENDA
®
brand. Additionally, the fiscal year of 2016 included higher litigation expense of $0.7 billion as compared to 2015. This was partially offset by a $0.3 billion intangible asset write-down related to Acclarent included the fiscal year 2015.
The change in other (income) expense, net for the fiscal year 2015 was a favorable change of $2.0 billion as compared to the prior year primarily due to lower litigation expense of $1.1 billion, lower Synthes integration costs of $0.6 billion and higher JJDC portfolio gains of $0.2 billion as compared to the prior year. Additionally, the fiscal year 2015 included higher gains of $0.3 billion primarily from the divestitures of the Cordis business, the SPLENDA
®
brand and the U.S. divestiture of NUCYNTA
®
versus the gains recorded in 2014 from the divestitures of the Ortho-Clinical Diagnostics business and the K-Y
®
brand. This was partially offset by higher intangible asset write-downs of $0.1 billion in 2015.
Interest (Income) Expense:
Interest income in 2016 increased by $240 million as compared to 2015 due to a higher average balance of cash, cash equivalents and marketable securities and higher interest rates. Cash, cash equivalents and marketable securities totaled $41.9 billion at the end of 2016, and averaged $40.1 billion as compared to the $35.7 billion average cash balance in 2015.
Interest expense in 2016 was higher as compared to 2015. The average debt balance was $23.5 billion in 2016 versus $19.3 billion in 2015. The total debt balance at the end of 2016 was $27.1 billion as compared to $19.9 billion at the end of 2015. The higher debt balance of approximately $7.2 billion was primarily due to increased borrowings in February and May of 2016. The Company increased borrowings, capitalizing on favorable terms in the capital markets. The proceeds of the borrowings were used for general corporate purposes, primarily the stock repurchase program.
Interest income in 2015 increased by $61 million as compared to 2014 due to a higher average balance of cash, cash equivalents and marketable securities and higher interest rates. Cash, cash equivalents and marketable securities totaled
|
22
|
||
$38.4 billion at the end of 2015, and averaged $35.7 billion as compared to the $31.1 billion average cash balance in 2014. The increase in the year-end cash balance was primarily due to cash generated from operating activities.
Interest expense in 2015 increased slightly as compared to 2014. The average debt balance was $19.3 billion in 2015 versus $18.5 billion in 2014. The total debt balance at the end of 2015 was $19.9 billion as compared to $18.8 billion at the end of 2014. The higher debt balance of approximately $1.1 billion was an increase in commercial paper for general corporate purposes, primarily the stock repurchase program.
Income Before Tax by Segment
Income before tax by segment of business were as follows:
|
|
Income Before Tax
|
Segment Sales
|
Percent of Segment Sales
|
||||||||||||||||
|
(Dollars in Millions)
|
2016
|
2015
|
2016
|
2015
|
2016
|
2015
|
|||||||||||||
|
Consumer
|
$
|
2,441
|
|
1,787
|
|
$
|
13,307
|
|
13,507
|
|
18.3
|
%
|
13.2
|
||||||
|
Pharmaceutical
|
12,827
|
|
11,734
|
|
33,464
|
|
31,430
|
|
38.3
|
|
37.3
|
||||||||
|
Medical Devices
|
5,578
|
|
6,826
|
|
25,119
|
|
25,137
|
|
22.2
|
|
27.2
|
||||||||
|
Total
(1)
|
20,846
|
|
20,347
|
|
71,890
|
|
70,074
|
|
29.0
|
|
29.0
|
||||||||
|
Less: Expenses not allocated to segments
(2)
|
1,043
|
|
1,151
|
|
|
|
|
||||||||||||
|
Earnings before provision for taxes on income
|
$
|
19,803
|
|
19,196
|
|
$
|
71,890
|
|
70,074
|
|
27.5
|
%
|
27.4
|
||||||
|
(1)
|
See Note 18 to the Consolidated Financial Statements for more details.
|
|
(2)
|
Amounts not allocated to segments include interest (income) expense and general corporate (income) expense.
|
Consumer Segment:
In 2016, the Consumer segment income before tax as a percent to sales was 18.3%, versus 13.2% in 2015, primarily driven by favorable selling, marketing and administrative expenses due to cost management and higher gross profit margins from cost improvement projects and favorable mix. This was partially offset by higher gains in 2015 related to divestitures, primarily the divestiture of the SPLENDA
®
brand. Additionally, operations in Venezuela negatively impacted the Consumer segment income before tax in 2016 as compared to 2015.
In 2015, the Consumer segment income before tax as a percent to sales was 13.2%, versus 13.4% in 2014, primarily due to lower divestiture gains in 2015 versus 2014. In 2015, the Consumer segment tax included a gain of $0.3 billion from divestitures, primarily the divestiture of the SPLENDA
®
brand. In 2014, the Consumer segment included a gain $0.5 billion from divestitures, primarily the divestiture of the K-Y
®
brand.
Pharmaceutical Segment:
In 2016, the Pharmaceutical segment income before tax as a percent to sales was 38.3% versus 37.3% in 2015. The increase in income before tax was primarily due to
strong sales volume growth and favorable selling, marketing and administrative expenses due to cost management. Additionally, the fiscal year 2015, had higher gains of $0.7 billion related to divestitures partially offset by a higher IPR&D charge of $0.2 billion as compared to 2016. The fiscal year of 2016 included the gains from the divestitures of the controlled substance raw material and API business and certain anesthetic products in Europe versus the gains recorded in 2015 from the U.S. divestiture of NUCYNTA
®
.
In 2015, the Pharmaceutical segment income before tax as a percent to sales was 37.3% versus 36.2% in 2014. The favorable income before tax was primarily due to higher gains recognized in 2015 partially offset by a sales decline of OLYSIO
®
/SOVRIAD
®
(simeprevir), increased investment spending and negative currency impacts as compared to 2014. Included in 2015 was a gain of $1.0 billion on the U.S. divestiture of NUCYNTA
®
,
as well as receipt of a contingent payment and a positive adjustment to previous reserve estimates, including Managed Medicaid rebates. Additionally, the Pharmaceutical segment income before tax in 2014 was negatively impacted by $0.2 billion for an additional year of the Branded Prescription Drug Fee and higher intangible asset amortization expense of $0.3 billion primarily related to the write-down of INCIVO
®
(telaprevir).
Medical Devices Segment:
In 2016, the Medical Devices segment income before tax as a percent to sales was 22.2% versus 27.2% in 2015. The decrease in the income before tax as a percent to sales was primarily due to lower gains of $1.4 billion related to divestitures, higher litigation expense of $0.8 billion and a higher restructuring charge of $0.1 billion as compared to 2015. This was partially offset by an intangible asset write-down of $0.3 billion related to Acclarent in 2015 and favorable selling, marketing and administrative expenses in 2016.
In 2015, the Medical Devices segment income before tax as a percent to sales was 27.2% versus 28.9% in 2014 primarily due to a restructuring charge of $0.6 billion, an intangible asset write-down of $0.3 billion related to Acclarent, and lower gains of $0.5 billion on divestitures as compared to 2014. In 2015, the Medical Devices segment included gains of $1.4 billion, primarily for the divestiture of the Cordis business versus a gain of $1.9 billion recorded in 2014 for the divestiture of the Ortho-Clinical Diagnostics business. The 2015 income before tax was favorably impacted by lower net litigation expense of
|
23
|
||
$0.9 billion, which included a gain from the litigation settlement agreement of $0.6 billion with Guidant, and lower Synthes integration costs of $0.6 billion in 2015 as compared to 2014.
Restructuring:
The Company announced restructuring actions in its Medical Devices segment that are expected to result in annualized pre-tax cost savings of $800 million to $1.0 billion, the majority of which is expected to be realized by the end of 2018. Approximately $250 million in savings were realized in 2016. The savings will provide the Company with added flexibility and resources to fund investment in new growth opportunities and innovative solutions for customers and patients. The Company estimates that, in connection with its plans, it will record pre-tax restructuring related charges of approximately $2.0 billion to $2.4 billion, most of which are expected to be incurred by the end of 2017. In 2016, the Company recorded a pre-tax charge of $685 million, of which $45 million is included in cost of products sold and $149 million is included in other (income) expense. In 2015, the Company recorded a pre-tax charge of $590 million, of which $81 million was included in cost of products sold. Restructuring charges of $1.275 billion have been recorded since the restructuring was announced. See Note 22 to the Consolidated Financial Statements for additional details related to the restructuring.
Provision for Taxes on Income:
The worldwide effective income tax rate was 16.5% in
2016
, 19.7% in
2015
and 20.6% in
2014
. The 2016 effective tax rate decreased by 3.2% as compared to 2015. As described in Note 1 to the Consolidated Financial Statements, the Company adopted a new accounting standard for the reporting of additional tax benefits on share-based compensation that vested or were exercised during the fiscal year. The adoption of this new standard reduced the effective tax rate for the fiscal 2016 by 1.8% versus 2015. The remainder of the change in the effective tax rate was primarily related to the lower earnings before taxes in the United States and the settlement of several uncertain tax positions in 2016 versus 2015.
The decrease in the 2015 effective tax rate, as compared to 2014 was primarily attributable to the increases in taxable income in lower tax jurisdictions relative to higher tax jurisdictions and a tax benefit resulting from a restructuring of international affiliates. Additionally, the 2014 effective tax rate was affected by the items mentioned below.
The increase in the 2014 effective tax rate, as compared to 2013, was attributable to the following: the divestiture of the Ortho-Clinical Diagnostics business at an approximate 44% effective tax rate, litigation accruals at low tax rates, the mix of earnings into higher tax jurisdictions, primarily the U.S., the accrual of an additional year of the Branded Prescription Drug Fee, which is not tax deductible, and additional U.S. tax expense related to a planned increase in dividends from current year foreign earnings as compared to the prior year. These increases to the 2014 effective tax rate were partially offset by a tax benefit of $0.4 billion associated with the Conor Medsystems divestiture.
The 2014 effective tax rate was also reduced as the Company adjusted its unrecognized tax benefits as a result of (i) the federal appeals court’s decision in OMJ Pharmaceuticals, Inc.’s litigation regarding credits under former Section 936 of the Internal Revenue Code and (ii) a settlement of substantially all issues related to the Company’s U.S. Internal Revenue Service audit of tax years 2006 - 2009.
Liquidity and Capital Resources
Liquidity & Cash Flows
Cash and cash equivalents were $19.0 billion at the end of 2016 as compared to $13.7 billion at the end of 2015. The primary sources and uses of cash that contributed to the $5.3 billion increase were approximately $18.8 billion of cash generated from operating activities offset by $4.8 billion net cash used by investing activities, and $8.6 billion net cash used by financing activities, and $0.2 billion due to the effect on exchange rate changes on cash and cash equivalents. In addition, the Company had $22.9 billion in marketable securities at the end of 2016 and $24.6 billion at the end of 2015. See Note 1 to the Consolidated Financial Statements for additional details on cash, cash equivalents and marketable securities.
Cash flow from operations of $18.8 billion was the result of $16.5 billion of net earnings and $4.9 billion of non-cash expenses and other adjustments for depreciation and amortization, stock-based compensation and assets write-downs, reduced by $0.6 billion from net gains on sale of assets/businesses, $0.3 billion related to deferred taxes and $2.4 billion related to accounts receivable, inventories and other current and non-current liabilities. Additional sources of operating cash flow of $0.7 billion resulted from an increase in accounts payable and accrued liabilities and a decrease in other current and non-current assets.
Investing activities use of $4.8 billion was primarily for acquisitions, net of cash acquired of $4.5 billion and additions to property, plant and equipment of $3.2 billion. This was partially offset by proceeds from the net sale of investments primarily marketable securities of $1.8 billion and $1.3 billion of proceeds from the disposal of assets/businesses.
Financing activities use of $8.6 billion was primarily for dividends to shareholders of $8.6 billion and $9.0 billion for the repurchase of common stock. Financing activities also included a source of $7.9 billion from net proceeds of short and long-term debt and $1.2 billion of proceeds from stock options exercised/employee withholding tax on stock awards, net.
In 2016, the Company announced a definitive agreement to acquire Abbott Medical Optics Inc. for approximately $4.3 billion and on January 26, 2017, subsequent to year end the Company announced a definitive transaction agreement to acquire Actelion Ltd. for approximately $30.0 billion. Abbott Medical Optics closed on February 27, 2017. The Company will use cash held by the Company's foreign subsidiaries to pay for these acquisitions.
|
24
|
||
On October 13, 2015, the Company announced that its Board of Directors approved a share repurchase program, authorizing the Company to purchase up to $10.0 billion of the Company's shares of common stock. As of January 1, 2017, $7.3 billion has been repurchased under the program. The repurchase program has no time limit and may be delayed or suspended for periods or discontinued at any time. Any shares acquired will be available for general corporate purposes. The Company intends to finance the share repurchase program through available cash and access to the capital markets. The previous share repurchase program approved on July 21, 2014, authorizing the Company to purchase up to $5.0 billion of the Company's shares of common stock, was completed on April 28, 2015.
In 2016, the Company continued to have access to liquidity through the commercial paper market. The Company had a shelf registration with the U.S. Securities and Exchange Commission that expired on February 26, 2017. The Company plans to file a new shelf registration on February 27, 2017 which will enable it to issue debt securities on a timely basis. For additional details on borrowings, see Note 7 to the Consolidated Financial Statements.
The Company anticipates that operating cash flows, existing credit facilities and access to the capital markets will provide sufficient resources to fund operating needs in 2017.
Concentration of Credit Risk
Global concentration of credit risk with respect to trade accounts receivables continues to be limited due to the large number of customers globally and adherence to internal credit policies and credit limits. Economic challenges in Italy, Spain, Greece and Portugal (the Southern European Region) have impacted certain payment patterns, which have historically been longer than those experienced in the U.S. and other international markets. The total net trade accounts receivable balance in the Southern European Region was approximately $1.1 billion as of January 1, 2017 and $1.3 billion as of January 3, 2016. Approximately $0.7 billion as of January 1, 2017 and approximately $0.8 billion as of January 3, 2016 of the Southern European Region net trade accounts receivable balance related to the Company's Consumer, Vision Care and Diabetes Care businesses as well as certain Pharmaceutical and Medical Devices customers which are in line with historical collection patterns.
The remaining balance of net trade accounts receivable in the Southern European Region has been negatively impacted by the timing of payments from certain government owned or supported health care customers, as well as certain distributors of the Pharmaceutical and Medical Devices local affiliates. The total net trade accounts receivable balance for these customers were approximately $0.4 billion at January 1, 2017 and $0.5 billion at January 3, 2016. The Company continues to receive payments from these customers and, in some cases, late payments with interest. For customers where payment is expected over periods of time longer than one year, revenue and trade receivables have been discounted over the estimated period of time for collection. Allowances for doubtful accounts have been increased for these customers, but have been immaterial to date. The Company will continue to work closely with these customers on payment plans, monitor the economic situation and take appropriate actions as necessary.
Financing and Market Risk
The Company uses financial instruments to manage the impact of foreign exchange rate changes on cash flows. Accordingly, the Company enters into forward foreign exchange contracts to protect the value of certain foreign currency assets and liabilities and to hedge future foreign currency transactions primarily related to product costs. Gains or losses on these contracts are offset by the gains or losses on the underlying transactions. A 10% appreciation of the U.S. Dollar from the January 1, 2017 market rates would increase the unrealized value of the Company’s forward contracts by $23 million. Conversely, a 10% depreciation of the U.S. Dollar from the January 1, 2017 market rates would decrease the unrealized value of the Company’s forward contracts by $28 million. In either scenario, the gain or loss on the forward contract would be offset by the gain or loss on the underlying transaction, and therefore, would have no impact on future anticipated earnings and cash flows.
The Company hedges the exposure to fluctuations in currency exchange rates, and the effect on certain assets and liabilities in foreign currency, by entering into currency swap contracts. A 1% change in the spread between U.S. and foreign interest rates on the Company’s interest rate sensitive financial instruments would either increase or decrease the unrealized value of the Company’s swap contracts by approximately $82 million. In either scenario, at maturity, the gain or loss on the swap contract would be offset by the gain or loss on the underlying transaction, and therefore, would have no impact on future anticipated cash flows.
The Company does not enter into financial instruments for trading or speculative purposes. Further, the Company has a policy of only entering into contracts with parties that have at least an investment grade credit rating. The counter-parties to these contracts are major financial institutions and there is no significant concentration of exposure with any one counter-party. Management believes the risk of loss is remote.
The Company invests in both fixed rate and floating rate interest earning securities which carry a degree of interest rate risk. The fair market value of fixed rate securities may be adversely impacted due to a rise in interest rates, while floating rate securities may produce less income than predicted if interest rates fall. A 1% (100 basis points) change in spread on the Company’s interest rate sensitive investments would either increase or decrease the unrealized value of cash equivalents and current marketable securities by approximately $336 million.
|
25
|
||
The Company has access to substantial sources of funds at numerous banks worldwide. In September 2016, the Company secured a new 364-day Credit Facility. Total credit available to the Company approximates $10 billion, which expires on September 14, 2017. Interest charged on borrowings under the credit line agreement is based on either bids provided by banks, the prime rate or London Interbank Offered Rates (LIBOR), plus applicable margins. Commitment fees under the agreement are not material.
Total borrowings at the end of
2016
and
2015
were $27.1 billion and $19.9 billion, respectively. The increase in borrowings between 2016 and 2015 was a result of financing for the Company's share repurchase program and general corporate purposes. In 2016, net cash (cash and current marketable securities, net of debt) was $14.8 billion compared to net cash of $18.5 billion in 2015. Total debt represented 27.8% of total capital (shareholders’ equity and total debt) in 2016 and 21.8% of total capital in 2015. Shareholders’ equity per share at the end of
2016
was $26.02 compared to $25.82 at year-end
2015
, an increase of 0.8%.
A summary of borrowings can be found in Note 7 to the Consolidated Financial Statements.
Contractual Obligations and Commitments
The Company’s contractual obligations are primarily for leases, debt and unfunded retirement plans. There are no other significant obligations. To satisfy these obligations, the Company will use cash from operations. The following table summarizes the Company’s contractual obligations and their aggregate maturities as of January 1, 2017 (see Notes 7, 10 and 16 to the Consolidated Financial Statements for further details):
|
(Dollars in Millions)
|
Debt Obligations
|
Interest on
Debt Obligations |
Unfunded
Retirement Plans |
Operating Leases
|
Total
|
|||||||||||
|
2017
|
$
|
1,704
|
|
799
|
|
83
|
|
216
|
|
2,802
|
|
|||||
|
2018
|
1,561
|
|
735
|
|
84
|
|
179
|
|
2,559
|
|
||||||
|
2019
|
2,538
|
|
680
|
|
89
|
|
134
|
|
3,441
|
|
||||||
|
2020
|
629
|
|
608
|
|
94
|
|
105
|
|
1,436
|
|
||||||
|
2021
|
1,795
|
|
574
|
|
100
|
|
88
|
|
2,557
|
|
||||||
|
After 2021
|
15,919
|
|
6,956
|
|
610
|
|
100
|
|
23,585
|
|
||||||
|
Total
|
$
|
24,146
|
|
10,352
|
|
1,060
|
|
822
|
|
36,380
|
|
|||||
For tax matters, see Note 8 to the Consolidated Financial Statements. For other retirement plan and post-employment medical benefit information, see Note 10 to the Consolidated Financial Statements. The table does not include activity related to business combinations.
Dividends
The Company increased its dividend in 2016 for the 54th consecutive year. Cash dividends paid were $3.15 per share in
2016
compared with dividends of $2.95 per share in
2015
, and $2.76 per share in
2014
. The dividends were distributed as follows:
|
2016
|
2015
|
2014
|
|||||||
|
First quarter
|
$
|
0.75
|
|
0.70
|
|
0.66
|
|
||
|
Second quarter
|
0.80
|
|
0.75
|
|
0.70
|
|
|||
|
Third quarter
|
0.80
|
|
0.75
|
|
0.70
|
|
|||
|
Fourth quarter
|
0.80
|
|
0.75
|
|
0.70
|
|
|||
|
Total
|
$
|
3.15
|
|
2.95
|
|
2.76
|
|
||
On January 3, 2017, the Board of Directors declared a regular quarterly cash dividend of $0.80 per share, payable on March 14, 2017, to shareholders of record as of February 28, 2017. The Company expects to continue the practice of paying regular cash dividends.
Other Information
Critical Accounting Policies and Estimates
Management’s discussion and analysis of results of operations and financial condition are based on the Company’s consolidated financial statements that have been prepared in accordance with accounting principles generally accepted in the U.S. (GAAP). The preparation of these financial statements requires that management make estimates and assumptions that affect the amounts reported for revenues, expenses, assets, liabilities and other related disclosures. Actual results may or may
|
26
|
||
not differ from these estimates. The Company believes that the understanding of certain key accounting policies and estimates are essential in achieving more insight into the Company’s operating results and financial condition. These key accounting policies include revenue recognition, income taxes, legal and self-insurance contingencies, valuation of long-lived assets, assumptions used to determine the amounts recorded for pensions and other employee benefit plans and accounting for stock based awards.
Revenue Recognition:
The Company recognizes revenue from product sales when goods are shipped or delivered, and title and risk of loss pass to the customer. Provisions for certain rebates, sales incentives, trade promotions, coupons, product returns and discounts to customers are accounted for as reductions in sales in the same period the related sales are recorded.
Product discounts granted are based on the terms of arrangements with direct, indirect and other market participants, as well as market conditions, including prices charged by competitors. Rebates, which include the Medicaid rebate provision, are estimated based on contractual terms, historical experience, patient outcomes, trend analysis and projected market conditions in the various markets served. The Company evaluates market conditions for products or groups of products primarily through the analysis of wholesaler and other third-party sell-through and market research data, as well as internally generated information.
Sales returns are estimated and recorded based on historical sales and returns information. Products that exhibit unusual sales or return patterns due to dating, competition or other marketing matters are specifically investigated and analyzed as part of the accounting for sales return accruals.
Sales returns allowances represent a reserve for products that may be returned due to expiration, destruction in the field, or in specific areas, product recall. The returns reserve is based on historical return trends by product and by market as a percent to gross sales. In accordance with the Company’s accounting policies, the Company generally issues credit to customers for returned goods. The Company’s sales returns reserves are accounted for in accordance with the U.S. GAAP guidance for revenue recognition when right of return exists. Sales returns reserves are recorded at full sales value. Sales returns in the Consumer and Pharmaceutical segments are almost exclusively not resalable. Sales returns for certain franchises in the Medical Devices segment are typically resalable but are not material. The Company infrequently exchanges products from inventory for returned products. The sales returns reserve for the total Company has been approximately 1.0% of annual net trade sales during the fiscal reporting years
2016
,
2015
and
2014
.
Promotional programs, such as product listing allowances and cooperative advertising arrangements, are recorded in the year incurred. Continuing promotional programs include coupons and volume-based sales incentive programs. The redemption cost of consumer coupons is based on historical redemption experience by product and value. Volume-based incentive programs are based on estimated sales volumes for the incentive period and are recorded as products are sold. The Company also earns service revenue for co-promotion of certain products. For all years presented, service revenues were 1% or less of the total revenues and are included in sales to customers. These arrangements are evaluated to determine the appropriate amounts to be deferred or recorded as a reduction of revenue.
In addition, the Company enters into collaboration arrangements that contain multiple revenue generating activities. Amounts due from collaborative partners for these arrangements are recognized as each activity is performed or delivered, based on the relative selling price. Upfront fees received as part of these arrangements are deferred and recognized over the performance period. See Note 1 to the Consolidated Financial Statements for additional disclosures on collaborations.
Reasonably likely changes to assumptions used to calculate the accruals for rebates, returns and promotions are not anticipated to have a material effect on the financial statements. The Company currently discloses the impact of changes to assumptions in the quarterly or annual filing in which there is a material financial statement impact.
|
27
|
||
Below are tables that show the progression of accrued rebates, returns, promotions, reserve for doubtful accounts and reserve for cash discounts by segment of business for the fiscal years ended
January 1, 2017
and
January 3, 2016
.
Consumer Segment
|
(Dollars in Millions)
|
Balance at
Beginning of Period |
Accruals
|
Payments/Credits
|
Balance at
End of Period |
|||||||||
|
2016
|
|
|
|
|
|
|
|
|
|||||
|
Accrued rebates
(1)
|
$
|
139
|
|
615
|
|
(618
|
)
|
136
|
|
||||
|
Accrued returns
|
54
|
|
111
|
|
(100
|
)
|
65
|
|
|||||
|
Accrued promotions
|
412
|
|
1,908
|
|
(1,962
|
)
|
358
|
|
|||||
|
Subtotal
|
$
|
605
|
|
2,634
|
|
(2,680
|
)
|
559
|
|
||||
|
Reserve for doubtful accounts
|
18
|
|
12
|
|
(6
|
)
|
24
|
|
|||||
|
Reserve for cash discounts
|
17
|
|
209
|
|
(201
|
)
|
25
|
|
|||||
|
Total
|
$
|
640
|
|
2,855
|
|
(2,887
|
)
|
608
|
|
||||
|
2015
|
|
|
|
|
|
|
|
|
|||||
|
Accrued rebates
(1)
|
$
|
122
|
|
581
|
|
(564
|
)
|
139
|
|
||||
|
Accrued returns
|
77
|
|
84
|
|
(107
|
)
|
54
|
|
|||||
|
Accrued promotions
|
241
|
|
1,846
|
|
(1,675
|
)
|
412
|
|
|||||
|
Subtotal
|
$
|
440
|
|
2,511
|
|
(2,346
|
)
|
605
|
|
||||
|
Reserve for doubtful accounts
|
18
|
|
5
|
|
(5
|
)
|
18
|
|
|||||
|
Reserve for cash discounts
|
22
|
|
206
|
|
(211
|
)
|
17
|
|
|||||
|
Total
|
$
|
480
|
|
2,722
|
|
(2,562
|
)
|
640
|
|
||||
|
(1)
|
Includes reserve for customer rebates of $37 million at
January 1, 2017
and $31 million at
January 3, 2016
, recorded as a contra asset.
|
Pharmaceutical Segment
|
(Dollars in Millions)
|
Balance at
Beginning of Period |
Accruals
|
Payments/Credits
(2)
|
Balance at
End of Period |
|||||||||
|
2016
|
|
|
|
|
|
|
|
|
|||||
|
Accrued rebates
(1)
|
$
|
3,451
|
|
12,306
|
|
(12,337
|
)
|
3,420
|
|
||||
|
Accrued returns
|
404
|
|
140
|
|
(210
|
)
|
334
|
|
|||||
|
Accrued promotions
|
11
|
|
10
|
|
(21
|
)
|
—
|
|
|||||
|
Subtotal
|
$
|
3,866
|
|
12,456
|
|
(12,568
|
)
|
3,754
|
|
||||
|
Reserve for doubtful accounts
|
46
|
|
2
|
|
(10
|
)
|
38
|
|
|||||
|
Reserve for cash discounts
|
63
|
|
613
|
|
(618
|
)
|
58
|
|
|||||
|
Total
|
$
|
3,975
|
|
13,071
|
|
(13,196
|
)
|
3,850
|
|
||||
|
2015
|
|
|
|
|
|
|
|
|
|||||
|
Accrued rebates
(1)
|
$
|
2,717
|
|
10,449
|
|
(9,715
|
)
|
3,451
|
|
||||
|
Accrued returns
|
422
|
|
52
|
|
(70
|
)
|
404
|
|
|||||
|
Accrued promotions
|
34
|
|
127
|
|
(150
|
)
|
11
|
|
|||||
|
Subtotal
|
$
|
3,173
|
|
10,628
|
|
(9,935
|
)
|
3,866
|
|
||||
|
Reserve for doubtful accounts
|
41
|
|
30
|
|
(25
|
)
|
46
|
|
|||||
|
Reserve for cash discounts
|
51
|
|
625
|
|
(613
|
)
|
63
|
|
|||||
|
Total
|
$
|
3,265
|
|
11,283
|
|
(10,573
|
)
|
3,975
|
|
||||
|
(1)
|
Includes reserve for customer rebates of $102 million at
January 1, 2017
and $64 million at
January 3, 2016
, recorded as a contra asset.
|
|
(2)
|
Includes adjustments
|
|
28
|
||
Medical Devices Segment
|
(Dollars in Millions)
|
Balance at
Beginning of Period |
Accruals
|
Payments/Credits
|
Balance at
End of Period |
|||||||||
|
2016
|
|
|
|
|
|
|
|
|
|||||
|
Accrued rebates
(
1)
|
$
|
1,189
|
|
5,700
|
|
(5,389
|
)
|
1,500
|
|
||||
|
Accrued returns
|
239
|
|
518
|
|
(630
|
)
|
127
|
|
|||||
|
Accrued promotions
|
47
|
|
78
|
|
(93
|
)
|
32
|
|
|||||
|
Subtotal
|
$
|
1,475
|
|
6,296
|
|
(6,112
|
)
|
1,659
|
|
||||
|
Reserve for doubtful accounts
|
204
|
|
21
|
|
(35
|
)
|
190
|
|
|||||
|
Reserve for cash discounts
|
20
|
|
430
|
|
(434
|
)
|
16
|
|
|||||
|
Total
|
$
|
1,699
|
|
6,747
|
|
(6,581
|
)
|
1,865
|
|
||||
|
2015
|
|
|
|
|
|
|
|
|
|||||
|
Accrued rebates
(1)
|
$
|
844
|
|
5,216
|
|
(4,871
|
)
|
1,189
|
|
||||
|
Accrued returns
|
188
|
|
556
|
|
(505
|
)
|
239
|
|
|||||
|
Accrued promotions
|
53
|
|
95
|
|
(101
|
)
|
47
|
|
|||||
|
Subtotal
|
$
|
1,085
|
|
5,867
|
|
(5,477
|
)
|
1,475
|
|
||||
|
Reserve for doubtful accounts
|
216
|
|
13
|
|
(25
|
)
|
204
|
|
|||||
|
Reserve for cash discounts
|
16
|
|
877
|
|
(873
|
)
|
20
|
|
|||||
|
Total
|
$
|
1,317
|
|
6,757
|
|
(6,375
|
)
|
1,699
|
|
||||
|
(1)
|
Includes reserve for customer rebates of $430 million at
January 1, 2017
and $411 million at
January 3, 2016
, recorded as a contra asset.
|
Income Taxes:
Income taxes are recorded based on amounts refundable or payable for the current year and include the results of any difference between U.S. GAAP accounting and tax reporting, recorded as deferred tax assets or liabilities. The Company estimates deferred tax assets and liabilities based on enacted tax regulations and rates. Future changes in tax laws and rates may affect recorded deferred tax assets and liabilities.
The Company has unrecognized tax benefits for uncertain tax positions. The Company follows U.S. GAAP, which prescribes a recognition threshold and measurement attribute for the financial statement recognition and measurement of a tax position taken or expected to be taken in a tax return. Management believes that changes in these estimates would not have a material effect on the Company's results of operations, cash flows or financial position.
At
January 1, 2017
and
January 3, 2016
, the cumulative amounts of undistributed international earnings were approximately $66.2 billion and $58.0 billion, respectively. At
January 1, 2017
and
January 3, 2016
, the Company's foreign subsidiaries held balances of cash, cash equivalents and marketable securities in the amounts of $41.3 billion and $38.2 billion, respectively. The Company has not provided deferred taxes on the undistributed earnings from certain international subsidiaries where the earnings are considered to be indefinitely reinvested. The Company intends to continue to reinvest these earnings in international operations. If the Company decided at a later date to repatriate these earnings to the U.S., the Company would be required to provide for the net tax effects on these amounts. The Company does not determine the deferred tax liability associated with these undistributed earnings, as such determination is not practical.
See Note 8 to the Consolidated Financial Statements for further information regarding income taxes.
Legal and Self Insurance Contingencies:
The Company records accruals for various contingencies, including legal proceedings and product liability claims as these arise in the normal course of business. The accruals are based on management’s judgment as to the probability of losses and, where applicable, actuarially determined estimates. The Company has self insurance through a wholly-owned captive insurance company. In addition to accruals in the self insurance program, claims that exceed the insurance coverage are accrued when losses are probable and amounts can be reasonably estimated. Additionally, the Company records insurance receivable amounts from third-party insurers when recovery is probable. As appropriate, reserves against these receivables are recorded for estimated amounts that may not be collected from third-party insurers.
The Company follows the provisions of U.S. GAAP when recording litigation related contingencies. A liability is recorded when a loss is probable and can be reasonably estimated. The best estimate of a loss within a range is accrued; however, if no estimate in the range is better than any other, the minimum amount is accrued.
|
29
|
||
See Notes 1 and 21 to the Consolidated Financial Statements for further information regarding product liability and legal proceedings.
Long-Lived and Intangible Assets:
The Company assesses changes in economic conditions and makes assumptions regarding estimated future cash flows in evaluating the value of the Company’s property, plant and equipment, goodwill and intangible assets. As these assumptions and estimates may change over time, it may or may not be necessary for the Company to record impairment charges.
Employee Benefit Plans:
The Company sponsors various retirement and pension plans, including defined benefit, defined contribution and termination indemnity plans, which cover most employees worldwide. These plans are based on assumptions for the discount rate, expected return on plan assets, mortality rates, expected salary increases, health care cost trend rates and attrition rates. See Note 10 to the Consolidated Financial Statements for further details on these rates and the effect a rate change to the health care cost trend would have on the Company’s results of operations.
Stock Based Compensation:
The Company recognizes compensation expense associated with the issuance of equity instruments to employees for their services. Based on the type of equity instrument, the fair value is estimated on the date of grant using either the Black-Scholes option valuation model or a combination of both the Black-Scholes option valuation model and Monte Carlo valuation model, and is expensed in the financial statements over the service period. The input assumptions used in determining fair value are the expected life, expected volatility, risk-free rate and expected dividend yield. For performance share units the fair market value is calculated for each of the three component goals at the date of grant. The fair values for the sales and earnings per share goals of each performance share unit were estimated on the date of grant using the fair market value of the shares at the time of the award, discounted for dividends, which are not paid on the performance share units during the vesting period. The fair value for the relative total shareholder return goal of each performance share unit was estimated on the date of grant using the Monte Carlo valuation model. See Note 17 to the Consolidated Financial Statements for additional information.
New Accounting Pronouncements
Refer to Note 1 to the Consolidated Financial Statements for recently adopted accounting pronouncements and recently issued accounting pronouncements not yet adopted as of
January 1, 2017
.
Economic and Market Factors
The Company is aware that its products are used in an environment where, for more than a decade, policymakers, consumers and businesses have expressed concerns about the rising cost of health care. In response to these concerns, the Company has a long-standing policy of pricing products responsibly. For the period 2006 - 2016, in the United States, the weighted average compound annual growth rate of the Company’s net price increases for health care products (prescription and over-the-counter drugs, hospital and professional products) was below the U.S. Consumer Price Index (CPI).
The Company operates in certain countries where the economic conditions continue to present significant challenges. The Company continues to monitor these situations and take appropriate actions. Inflation rates continue to have an effect on worldwide economies and, consequently, on the way companies operate. The Company has accounted for operations in Venezuela as highly inflationary, as the prior three-year cumulative inflation rate surpassed 100%. In the face of increasing costs, the Company strives to maintain its profit margins through cost reduction programs, productivity improvements and periodic price increases.
The Venezuelan government has established alternative systems and offerings of various foreign currency exchanges. Through the fourth quarter of 2015, the number of the Company’s transactions conducted at the official rate declined from prior quarters. As a result, the Company determined that it was no longer likely that all outstanding net monetary assets would be settled at the official government rate of 6.3 Bolivares Fuertes to one U.S. Dollar. Therefore in 2015, the Company recorded a charge of $161 million to revalue its net monetary assets in Venezuela at one of the government’s alternative exchange rates (SIMADI) and impair its non-monetary assets. After the revaluation, as of January 3, 2016, the Company’s Venezuelan subsidiaries represented less than 0.1% of the Company's consolidated assets and liabilities.
While the Company continues to do business in Greece, the Company closely monitors the economic situation. As of January 1, 2017, the Company’s Greek subsidiaries represented 0.3% and 0.4% of the Company's consolidated assets and revenues, respectively.
On June 23, 2016, the United Kingdom (U.K.) held a referendum in which voters approved an exit from the European Union (E.U.), commonly referred to as “Brexit.” Given the lack of comparable precedent, it is unclear what financial, trade, regulatory and legal implications the withdrawal of the U.K. from the E.U. will have. Brexit creates global political and economic uncertainty, which may cause, among other consequences, volatility in exchange rates and interest rates, additional cost containment by third-party payors and changes in regulations. However, the Company currently does not believe that these and other related effects will have a material impact on the Company’s consolidated financial position or operating results. As of January 1, 2017, the business of the Company’s U.K. subsidiaries represented less than 3% of both the Company’s consolidated assets and fiscal twelve months revenues.
|
30
|
||
The Company is exposed to fluctuations in currency exchange rates. A 1% change in the value of the U.S. Dollar as compared to all foreign currencies in which the Company had sales, income or expense in 2016 would have increased or decreased the translation of foreign sales by approximately $330 million and income by $105 million.
Governments around the world, including in the United States, consider various proposals to make changes to tax laws, which may include increasing or decreasing existing statutory tax rates. A change in statutory tax rate in any country would result in the revaluation of the Company’s deferred tax assets and liabilities related to that particular jurisdiction in the period in which the new tax law is enacted. This change would result in an expense or benefit recorded to the Company’s Consolidated Statement of Earnings. The Company closely monitors these proposals as they arise in the countries where it operates. Changes to the statutory tax rate may occur at any time, and any related expense or benefit recorded may be material to the fiscal quarter and year in which the law change is enacted.
The Belgian government is currently considering a proposed change to its corporate tax code, including a proposal to lower its statutory tax rate. If enacted, the proposed change would result in revaluation of the Company's deferred tax assets, with a corresponding charge to tax expense that may have a material effect on the Company’s results of operations for the period. Based on the deferred tax asset balances as of January 1, 2017, the Company estimates for every 1% that the statutory tax is lowered there will be additional one-time tax expense of approximately $60-75 million. A significant portion of the deferred tax asset described as “International R&D capitalized for tax” in Note 8 to the Consolidated Financial Statements is related to the Company’s operations in Belgium.
The U.S. government is currently considering various proposals to changes in its corporate tax code. These proposals include but are not limited to lowering the statutory tax rate and the rules on how international income earned by the Company is taxed in the U.S. The impact of these proposals may have a material effect on the Company’s results of operations for the period and on future periods.
As the Belgian or U.S. governments are still considering these proposals, it is not certain when or if they will be enacted.
The Company faces various worldwide health care changes that may continue to result in pricing pressures that include health care cost containment and government legislation relating to sales, promotions and reimbursement of health care products.
Changes in the behavior and spending patterns of purchasers of health care products and services, including delaying medical procedures, rationing prescription medications, reducing the frequency of physician visits and foregoing health care insurance coverage, as a result of the current global economic downturn, may continue to impact the Company’s businesses.
The Company also operates in an environment increasingly hostile to intellectual property rights. Firms have filed Abbreviated New Drug Applications or Biosimilar Biological Product Applications with the FDA or otherwise challenged the coverage and/or validity of the Company's patents, seeking to market generic or biosimilar forms of many of the Company’s key pharmaceutical products prior to expiration of the applicable patents covering those products. In the event the Company is not successful in defending the patent claims challenged in the resulting lawsuits, generic or biosimilar versions of the products at issue will be introduced to the market, resulting in the potential for substantial market share and revenue losses for those products, and which may result in a non-cash impairment charge in any associated intangible asset. There is also a risk that one or more competitors could launch a generic or biosimilar version of the product at issue following regulatory approval even though one or more valid patents are in place. For further information, see the discussion on “REMICADE
®
Related Cases” and “Litigation Against Filers of Abbreviated New Drug Applications” in Note 21 to the Consolidated Financial Statements.
Legal Proceedings
Johnson & Johnson and certain of its subsidiaries are involved in various lawsuits and claims regarding product liability, intellectual property, commercial and other matters; governmental investigations; and other legal proceedings that arise from time to time in the ordinary course of business.
The Company records accruals for loss contingencies associated with these legal matters when it is probable that a liability will be incurred and the amount of the loss can be reasonably estimated. The Company has accrued for certain litigation matters and continues to monitor each related legal issue and adjust accruals for new information and further developments in accordance with Accounting Standards Codification (ASC) 450-20-25. For these and other litigation and regulatory matters currently disclosed for which a loss is probable or reasonably possible, the Company is unable to estimate the possible loss or range of loss beyond the amounts already accrued. Amounts accrued for legal contingencies often result from a complex series of judgments about future events and uncertainties that rely heavily on estimates and assumptions. The ability to make such estimates and judgments can be affected by various factors, including whether damages sought in the proceedings are unsubstantiated or indeterminate; scientific and legal discovery has not commenced or is not complete; proceedings are in early stages; matters present legal uncertainties; there are significant facts in dispute; or there are numerous parties involved.
In the Company's opinion, based on its examination of these matters, its experience to date and discussions with counsel, the ultimate outcome of legal proceedings, net of liabilities accrued in the Company's balance sheet, is not expected to have a material adverse effect on the Company's financial position. However, the resolution of, or increase in accruals for, one or more of these matters in any reporting period may have a material adverse effect on the Company's results of operations and cash flows for that period.
See Note 21 to the Consolidated Financial Statements for further information regarding legal proceedings.
|
31
|
||
Common Stock Market Prices
The Company’s Common Stock is listed on the New York Stock Exchange under the symbol JNJ. As of February 17, 2017, there were 156,073 record holders of Common Stock of the Company. The composite market price ranges for Johnson & Johnson Common Stock during
2016
and
2015
were:
|
|
|||||||||||||
|
|
2016
|
2015
|
|||||||||||
|
|
High
|
Low
|
High
|
Low
|
|||||||||
|
First quarter
|
$
|
109.56
|
|
94.28
|
|
$
|
106.50
|
|
97.15
|
|
|||
|
Second quarter
|
121.54
|
|
107.88
|
|
104.48
|
|
97.01
|
|
|||||
|
Third quarter
|
126.07
|
|
117.04
|
|
101.36
|
|
81.79
|
|
|||||
|
Fourth quarter
|
122.50
|
|
109.32
|
|
105.49
|
|
89.90
|
|
|||||
|
Year-end close
|
$115.21
|
$102.72
|
|||||||||||
|
32
|
||
|
Item 7A.
|
QUANTITATIVE AND QUALITATIVE DISCLOSURES ABOUT MARKET RISK
|
The information called for by this item is incorporated herein by reference to “Item 7. Management’s Discussion and Analysis of Results of Operations and Financial Condition - Liquidity and Capital Resources - Financing and Market Risk” of this Report; and Note 1 “Summary of Significant Accounting Policies - Financial Instruments” of the Notes to Consolidated Financial Statements included in Item 8 of this Report.
|
Index to Audited Consolidated Financial Statements
|
|
|
33
|
||
JOHNSON & JOHNSON AND SUBSIDIARIES
At
January 1, 2017
and
January 3, 2016
(Dollars in Millions Except Share and Per Share Amounts) (Note 1)
|
2016
|
2015
|
|||||
|
Assets
|
||||||
|
Current assets
|
|
|
|
|
||
|
Cash and cash equivalents (Notes 1 and 2)
|
$
|
18,972
|
|
13,732
|
|
|
|
Marketable securities (Notes 1 and 2)
|
22,935
|
|
24,644
|
|
||
|
Accounts receivable trade, less allowances for doubtful accounts $252 (2015, $268)
|
11,699
|
|
10,734
|
|
||
|
Inventories (Notes 1 and 3)
|
8,144
|
|
8,053
|
|
||
|
Prepaid expenses and other receivables
|
3,282
|
|
3,047
|
|
||
|
Total current assets
|
65,032
|
|
60,210
|
|
||
|
Property, plant and equipment, net (Notes 1 and 4)
|
15,912
|
|
15,905
|
|
||
|
Intangible assets, net (Notes 1 and 5)
|
26,876
|
|
25,764
|
|
||
|
Goodwill (Notes 1 and 5)
|
22,805
|
|
21,629
|
|
||
|
Deferred taxes on income (Note 8)
|
6,148
|
|
5,490
|
|
||
|
Other assets
|
4,435
|
|
4,413
|
|
||
|
Total assets
|
$
|
141,208
|
|
133,411
|
|
|
|
Liabilities and Shareholders’ Equity
|
|
|
|
|
||
|
Current liabilities
|
|
|
|
|
||
|
Loans and notes payable (Note 7)
|
$
|
4,684
|
|
7,004
|
|
|
|
Accounts payable
|
6,918
|
|
6,668
|
|
||
|
Accrued liabilities
|
5,635
|
|
5,411
|
|
||
|
Accrued rebates, returns and promotions
|
5,403
|
|
5,440
|
|
||
|
Accrued compensation and employee related obligations
|
2,676
|
|
2,474
|
|
||
|
Accrued taxes on income (Note 8)
|
971
|
|
750
|
|
||
|
Total current liabilities
|
26,287
|
|
27,747
|
|
||
|
Long-term debt (Note 7)
|
22,442
|
|
12,857
|
|
||
|
Deferred taxes on income (Note 8)
|
2,910
|
|
2,562
|
|
||
|
Employee related obligations (Notes 9 and 10)
|
9,615
|
|
8,854
|
|
||
|
Other liabilities
|
9,536
|
|
10,241
|
|
||
|
Total liabilities
|
70,790
|
|
62,261
|
|
||
|
Shareholders’ equity
|
|
|
|
|
||
|
Preferred stock — without par value (authorized and unissued 2,000,000 shares)
|
—
|
|
—
|
|
||
|
Common stock — par value $1.00 per share (Note 12) (authorized 4,320,000,000 shares; issued 3,119,843,000 shares)
|
3,120
|
|
3,120
|
|
||
|
Accumulated other comprehensive income (Note 13)
|
(14,901
|
)
|
(13,165
|
)
|
||
|
Retained earnings
|
110,551
|
|
103,879
|
|
||
|
|
98,770
|
|
93,834
|
|
||
|
Less: common stock held in treasury, at cost (Note 12) (413,332,000 shares and 364,681,000 shares)
|
28,352
|
|
22,684
|
|
||
|
Total shareholders’ equity
|
70,418
|
|
71,150
|
|
||
|
Total liabilities and shareholders’ equity
|
$
|
141,208
|
|
133,411
|
|
|
See Notes to Consolidated Financial Statements
|
34
|
||
JOHNSON & JOHNSON AND SUBSIDIARIES
(Dollars and Shares in Millions Except Per Share Amounts) (Note 1)
|
2016
|
2015
|
2014
|
|||||||
|
Sales to customers
|
$
|
71,890
|
|
70,074
|
|
74,331
|
|
||
|
Cost of products sold
|
21,685
|
|
21,536
|
|
22,746
|
|
|||
|
Gross profit
|
50,205
|
|
48,538
|
|
51,585
|
|
|||
|
Selling, marketing and administrative expenses
|
19,945
|
|
21,203
|
|
21,954
|
|
|||
|
Research and development expense
|
9,095
|
|
9,046
|
|
8,494
|
|
|||
|
In-process research and development
|
29
|
|
224
|
|
178
|
|
|||
|
Interest income
|
(368
|
)
|
(128
|
)
|
(67
|
)
|
|||
|
Interest expense, net of portion capitalized (Note 4)
|
726
|
|
552
|
|
533
|
|
|||
|
Other (income) expense, net
|
484
|
|
(2,064
|
)
|
(70
|
)
|
|||
|
Restructuring (Note 22)
|
491
|
|
509
|
|
—
|
|
|||
|
Earnings before provision for taxes on income
|
19,803
|
|
19,196
|
|
20,563
|
|
|||
|
Provision for taxes on income (Note 8)
|
3,263
|
|
3,787
|
|
4,240
|
|
|||
|
Net earnings
|
$
|
16,540
|
|
15,409
|
|
16,323
|
|
||
|
Net earnings per share (Notes 1 and 15)
|
|||||||||
|
Basic
|
$
|
6.04
|
|
5.56
|
|
5.80
|
|
||
|
Diluted
|
$
|
5.93
|
|
5.48
|
|
5.70
|
|
||
|
Cash dividends per share
|
$
|
3.15
|
|
2.95
|
|
2.76
|
|
||
|
Average shares outstanding (Notes 1 and 15)
|
|||||||||
|
Basic
|
2,737.3
|
|
2,771.8
|
|
2,815.2
|
|
|||
|
Diluted
|
2,788.9
|
|
2,812.9
|
|
2,863.9
|
|
|||
See Notes to Consolidated Financial Statements
|
35
|
||
JOHNSON & JOHNSON AND SUBSIDIARIES
CONSOLIDATED STATEMENTS OF COMPREHENSIVE INCOME
(Dollars in Millions) (Note 1)
|
2016
|
2015
|
2014
|
|||||||
|
Net earnings
|
$
|
16,540
|
|
15,409
|
|
16,323
|
|
||
|
Other comprehensive income (loss), net of tax
|
|||||||||
|
Foreign currency translation
|
(612
|
)
|
(3,632
|
)
|
(4,601
|
)
|
|||
|
Securities:
|
|||||||||
|
Unrealized holding gain (loss) arising during period
|
(52
|
)
|
471
|
|
156
|
|
|||
|
Reclassifications to earnings
|
(141
|
)
|
(124
|
)
|
(5
|
)
|
|||
|
Net change
|
(193
|
)
|
347
|
|
151
|
|
|||
|
Employee benefit plans:
|
|||||||||
|
Prior service credit (cost), net of amortization
|
21
|
|
(60
|
)
|
193
|
|
|||
|
Gain (loss), net of amortization
|
(862
|
)
|
931
|
|
(3,698
|
)
|
|||
|
Effect of exchange rates
|
159
|
|
148
|
|
197
|
|
|||
|
Net change
|
(682
|
)
|
1,019
|
|
(3,308
|
)
|
|||
|
Derivatives & hedges:
|
|||||||||
|
Unrealized gain (loss) arising during period
|
(359
|
)
|
(115
|
)
|
92
|
|
|||
|
Reclassifications to earnings
|
110
|
|
(62
|
)
|
(196
|
)
|
|||
|
Net change
|
(249
|
)
|
(177
|
)
|
(104
|
)
|
|||
|
Other comprehensive income (loss)
|
(1,736
|
)
|
(2,443
|
)
|
(7,862
|
)
|
|||
|
Comprehensive income
|
$
|
14,804
|
|
12,966
|
|
8,461
|
|
||
|
The tax effects in other comprehensive income for the fiscal years ended 2016, 2015 and 2014 respectively: Securities; $104 million, $187 million and $81 million, Employee Benefit Plans; $346 million, $519 million and $1,556 million, Derivatives & Hedges; $134 million, $95 million and $56 million.
|
See Notes to Consolidated Financial Statements
|
36
|
||
JOHNSON & JOHNSON AND SUBSIDIARIES
CONSOLIDATED STATEMENTS OF EQUITY
(Dollars in Millions) (Note 1)
|
Total
|
Retained
Earnings
|
Accumulated
Other
Comprehensive
Income
|
Common Stock
Issued Amount
|
Treasury
Stock
Amount
|
|||||||||||
|
Balance, December 29, 2013
|
$
|
74,053
|
|
89,493
|
|
(2,860
|
)
|
3,120
|
|
(15,700
|
)
|
||||
|
Net earnings
|
16,323
|
|
16,323
|
|
|
|
|
|
|
|
|||||
|
Cash dividends paid
|
(7,768
|
)
|
(7,768
|
)
|
|
|
|
|
|
|
|||||
|
Employee compensation and stock option plans
|
2,164
|
|
(769
|
)
|
|
|
|
|
2,933
|
|
|||||
|
Repurchase of common stock
|
(7,124
|
)
|
|
|
|
|
|
|
(7,124
|
)
|
|||||
|
Other
|
(34
|
)
|
(34
|
)
|
|||||||||||
|
Other comprehensive income (loss), net of tax
|
(7,862
|
)
|
(7,862
|
)
|
|
|
|
|
|||||||
|
Balance, December 28, 2014
|
69,752
|
|
97,245
|
|
(10,722
|
)
|
3,120
|
|
(19,891
|
)
|
|||||
|
Net earnings
|
15,409
|
|
15,409
|
|
|
|
|
|
|
|
|||||
|
Cash dividends paid
|
(8,173
|
)
|
(8,173
|
)
|
|
|
|
|
|
|
|||||
|
Employee compensation and stock option plans
|
1,920
|
|
(577
|
)
|
|
|
|
|
2,497
|
|
|||||
|
Repurchase of common stock
|
(5,290
|
)
|
|
|
|
|
|
|
(5,290
|
)
|
|||||
|
Other
|
(25
|
)
|
(25
|
)
|
|||||||||||
|
Other comprehensive income (loss), net of tax
|
(2,443
|
)
|
|
|
(2,443
|
)
|
|
|
|
|
|||||
|
Balance, January 3, 2016
|
71,150
|
|
103,879
|
|
(13,165
|
)
|
3,120
|
|
(22,684
|
)
|
|||||
|
Net earnings
|
16,540
|
|
16,540
|
|
|
|
|
|
|
|
|||||
|
Cash dividends paid
|
(8,621
|
)
|
(8,621
|
)
|
|
|
|
|
|
|
|||||
|
Employee compensation and stock option plans
|
2,130
|
|
(1,181
|
)
|
|
|
|
|
3,311
|
|
|||||
|
Repurchase of common stock
|
(8,979
|
)
|
|
|
|
|
|
|
(8,979
|
)
|
|||||
|
Other
|
(66
|
)
|
(66
|
)
|
|||||||||||
|
Other comprehensive income (loss), net of tax
|
(1,736
|
)
|
|
|
(1,736
|
)
|
|
|
|
|
|||||
|
Balance, January 1, 2017
|
$
|
70,418
|
|
110,551
|
|
(14,901
|
)
|
3,120
|
|
(28,352
|
)
|
||||
See Notes to Consolidated Financial Statements
|
37
|
||
CONSOLIDATED STATEMENTS OF CASH FLOWS
(Dollars in Millions) (Note 1)
|
2016
|
2015
|
2014
|
|||||||
|
Cash flows from operating activities
|
|
|
|
|
|||||
|
Net earnings
|
$
|
16,540
|
|
15,409
|
|
16,323
|
|
||
|
Adjustments to reconcile net earnings to cash flows from operating activities:
|
|
|
|
|
|||||
|
Depreciation and amortization of property and intangibles
|
3,754
|
|
3,746
|
|
3,895
|
|
|||
|
Stock based compensation
|
878
|
|
874
|
|
792
|
|
|||
|
Venezuela adjustments
|
—
|
|
122
|
|
87
|
|
|||
|
Asset write-downs
|
283
|
|
624
|
|
410
|
|
|||
|
Net gain on sale of assets/businesses
|
(563
|
)
|
(2,583
|
)
|
(2,383
|
)
|
|||
|
Deferred tax provision
|
(341
|
)
|
(270
|
)
|
441
|
|
|||
|
Accounts receivable allowances
|
(11
|
)
|
18
|
|
(28
|
)
|
|||
|
Changes in assets and liabilities, net of effects from acquisitions and divestitures:
|
|
|
|
|
|||||
|
Increase in accounts receivable
|
(1,065
|
)
|
(433
|
)
|
(247
|
)
|
|||
|
Increase in inventories
|
(249
|
)
|
(449
|
)
|
(1,120
|
)
|
|||
|
Increase in accounts payable and accrued liabilities
|
656
|
|
287
|
|
1,194
|
|
|||
|
Decrease in other current and non-current assets
|
18
|
|
65
|
|
442
|
|
|||
|
(Decrease)/Increase in other current and non-current liabilities
|
(1,133
|
)
|
2,159
|
|
(1,096
|
)
|
|||
|
Net cash flows from operating activities
|
18,767
|
|
19,569
|
|
18,710
|
|
|||
|
Cash flows from investing activities
|
|
|
|
|
|||||
|
Additions to property, plant and equipment
|
(3,226
|
)
|
(3,463
|
)
|
(3,714
|
)
|
|||
|
Proceeds from the disposal of assets/businesses, net
|
1,267
|
|
3,464
|
|
4,631
|
|
|||
|
Acquisitions, net of cash acquired (Note 20)
|
(4,509
|
)
|
(954
|
)
|
(2,129
|
)
|
|||
|
Purchases of investments
|
(33,950
|
)
|
(40,828
|
)
|
(34,913
|
)
|
|||
|
Sales of investments
|
35,780
|
|
34,149
|
|
24,119
|
|
|||
|
Other (primarily intangibles)
|
(123
|
)
|
(103
|
)
|
(299
|
)
|
|||
|
Net cash used by investing activities
|
(4,761
|
)
|
(7,735
|
)
|
(12,305
|
)
|
|||
|
Cash flows from financing activities
|
|
|
|||||||
|
Dividends to shareholders
|
(8,621
|
)
|
(8,173
|
)
|
(7,768
|
)
|
|||
|
Repurchase of common stock
|
(8,979
|
)
|
(5,290
|
)
|
(7,124
|
)
|
|||
|
Proceeds from short-term debt
|
111
|
|
2,416
|
|
1,863
|
|
|||
|
Retirement of short-term debt
|
(2,017
|
)
|
(1,044
|
)
|
(1,267
|
)
|
|||
|
Proceeds from long-term debt
|
12,004
|
|
75
|
|
2,098
|
|
|||
|
Retirement of long-term debt
|
(2,223
|
)
|
(68
|
)
|
(1,844
|
)
|
|||
|
Proceeds from the exercise of stock options/employee withholding tax on stock awards, net
|
1,189
|
|
1,005
|
|
1,543
|
|
|||
|
Other
|
(15
|
)
|
(57
|
)
|
—
|
|
|||
|
Net cash used by financing activities
|
(8,551
|
)
|
(11,136
|
)
|
(12,499
|
)
|
|||
|
Effect of exchange rate changes on cash and cash equivalents
|
(215
|
)
|
(1,489
|
)
|
(310
|
)
|
|||
|
Increase/(Decrease) in cash and cash equivalents
|
5,240
|
|
(791
|
)
|
(6,404
|
)
|
|||
|
Cash and cash equivalents, beginning of year (Note 1)
|
13,732
|
|
14,523
|
|
20,927
|
|
|||
|
Cash and cash equivalents, end of year (Note 1)
|
$
|
18,972
|
|
13,732
|
|
14,523
|
|
||
|
Supplemental cash flow data
|
|
|
|
|
|
|
|||
|
Cash paid during the year for:
|
|
|
|
|
|
|
|||
|
Interest
|
$
|
730
|
|
617
|
|
603
|
|
||
|
Interest, net of amount capitalized
|
628
|
|
515
|
|
488
|
|
|||
|
Income taxes
|
2,843
|
|
2,865
|
|
3,536
|
|
|||
|
38
|
||
|
Supplemental schedule of non-cash investing and financing activities
|
|
|
|
|
|
|
|||
|
Treasury stock issued for employee compensation and stock option plans, net of cash proceeds/ employee withholding tax on stock awards
|
2,043
|
|
1,486
|
|
1,409
|
|
|||
|
Conversion of debt
|
35
|
|
16
|
|
17
|
|
|||
|
Acquisitions
|
|
|
|
|
|
|
|||
|
Fair value of assets acquired
|
$
|
4,586
|
|
1,174
|
|
2,167
|
|
||
|
Fair value of liabilities assumed and noncontrolling interests
|
(77
|
)
|
(220
|
)
|
(38
|
)
|
|||
|
Net cash paid for acquisitions
|
$
|
4,509
|
|
954
|
|
2,129
|
|
||
See Notes to Consolidated Financial Statements
|
39
|
||
NOTES TO CONSOLIDATED FINANCIAL STATEMENTS
|
1.
|
Summary of Significant Accounting Policies
|
Principles of Consolidation
The consolidated financial statements include the accounts of Johnson & Johnson and its subsidiaries (the Company). Intercompany accounts and transactions are eliminated.
Description of the Company and Business Segments
The Company has approximately
126,400
employees worldwide engaged in the research and development, manufacture and sale of a broad range of products in the health care field. The Company conducts business in virtually all countries of the world and its primary focus is on products related to human health and well-being.
The Company is organized into
three
business segments: Consumer, Pharmaceutical and Medical Devices. The Consumer segment includes a broad range of products used in the baby care, oral care, beauty (previously referred to as skin care), over-the-counter pharmaceutical, women’s health and wound care markets. These products are marketed to the general public and sold both to retail outlets and distributors throughout the world. The Pharmaceutical segment is focused on five therapeutic areas, including immunology, infectious diseases, neuroscience, oncology, and cardiovascular and metabolic diseases. Products in this segment are distributed directly to retailers, wholesalers, hospitals and health care professionals for prescription use. The Medical Devices segment includes a broad range of products used in the orthopaedic, surgery, cardiovascular, diabetes care and vision care fields, which are distributed to wholesalers, hospitals and retailers, and used principally in the professional fields by physicians, nurses, hospitals, eye care professionals and clinics.
New Accounting Pronouncements
Recently Adopted Accounting Pronouncements
During the fiscal first quarter of 2016, the Financial Accounting Standards Board (FASB) issued Accounting Standards Update 2016-09 Compensation - Stock Compensation: Improvements to Employee Share Based Payment Accounting. The amendments in the update are effective for annual periods beginning after December 15, 2016 and interim periods within those annual periods. Early adoption is permitted for any entity in any interim or annual period. During the fiscal second quarter of 2016, the Company elected to early adopt this standard. The update requires the following changes to presentation of the financial statements:
|
•
|
All excess tax benefits and deficiencies to be recognized as a reduction or an increase to the provision for taxes on income. Previously, the Company recorded these benefits directly to Retained Earnings. The tax benefit for the Company was
$353 million
for the fiscal year 2016. The standard does not permit retroactive presentation of this benefit to prior fiscal years on the Consolidated Statement of Earnings.
|
|
•
|
The tax benefit or deficiency is required to be classified and presented as a cash flow to/from operating activities. It was previously required to be presented as a cash flow to/from financing activities on the Consolidated Statement of Cash Flows. As permitted in the standard, the Company has elected to adopt this reclassification on a prospective basis and therefore prior fiscal years for the Consolidated Statement of Cash Flows have not been recast for this provision.
|
|
•
|
Clarifies that all cash payments made to taxing authorities on employees’ share-based compensation should be classified as a cash outflow from financing activities. This reclassification is required to be recast retrospectively. As a result, for the fiscal year 2016,
$269 million
was classified as a cash outflow from financing activities and
$290 million
and
$239 million
, of cash outflow was reclassified from an operating activity to a financing activity (Proceeds from the exercise of stock options/employee withholding tax on stock awards, net) in the fiscal years 2015 and 2014, respectively.
|
|
•
|
In the diluted net earnings per share calculation, when applying the treasury stock method for shares that could be repurchased, the assumed proceeds no longer include the amount of excess tax benefit. This did not have a material impact on the Company's diluted net earnings per share calculation.
|
During the fiscal second quarter of 2015, the FASB issued Accounting Standards Update 2015-03: Simplifying the Presentation of Debt Issuance Costs. This update requires capitalized debt issuance costs to be presented as a reduction to the carrying value of debt instead of being classified as a deferred charge. This update is effective for the Company for all annual and interim periods beginning after December 15, 2015 and is required to be applied retroactively for all periods presented. This update did not have a material impact on the presentation of the Company’s financial position.
|
40
|
||
During the fiscal third quarter of 2015, the FASB issued Accounting Standards Update 2015-16 Business Combinations: Simplifying the Accounting for Measurement-Period Adjustments. The amendments in this update require that an acquirer recognize adjustments to provisional amounts that are identified during the measurement period in the reporting period in which the adjustment amounts are determined. This update is effective for the Company for all annual and interim periods beginning after December 15, 2015. The amendments in this update should be applied prospectively to adjustments to provisional amounts that occur after the effective date of this update with earlier application permitted for financial statements that have not been issued. This update did not have a material impact on the Company’s consolidated financial statements.
During the fiscal third quarter of 2014, the FASB issued Accounting Standards Update No. 2014-15: Disclosure of Uncertainties about an Entity’s Ability to Continue as a Going Concern. This standard requires management to evaluate, for each annual and interim reporting period, whether there are conditions and events, considered in the aggregate, that raise substantial doubt about an entity’s ability to continue as a going concern within one year after the date the financial statements are issued or are available to be issued. If substantial doubt is raised, additional disclosures around management’s plan to alleviate these doubts are required. This update becomes effective for all annual periods and interim reporting periods ending after December 15, 2016. The adoption of this standard did not have any impact on the Company’s current disclosures in the financial statements.
Recently Issued Accounting Pronouncements
Not Adopted as of January 1, 2017
During the fiscal first quarter of 2017, the FASB issued Accounting Standard Update 2017-01: Clarifying the Definition of a Business. This update narrows the definition of a business by providing a screen to determine when an integrated set of assets and activities is not a business. The screen specifies that an integrated set of assets and activities is not a business if substantially all of the fair value of the gross assets acquired or disposed of is concentrated in a single or a group of similar identifiable assets. This update will be effective for the Company for annual periods beginning after December 15, 2017, including interim periods within those annual periods. Early adoption is permitted. This update should be applied prospectively. The Company is currently assessing the impact of the future adoption of this standard on its financial statements.
During the fiscal first quarter of 2017, the FASB issued Accounting Standard Update 2017-04: Simplifying the Test for Goodwill Impairment. This update simplifies how an entity is required to test goodwill for impairment. A goodwill impairment will now be measured by the amount by which a reporting unit’s carrying value exceeds its fair value, not to exceed the carrying amount of goodwill. This update will be effective for the Company for its annual or any interim goodwill impairment tests in fiscal years beginning after December 15, 2019. Early adoption is permitted. This update should be applied prospectively. The Company is currently assessing the impact of the future adoption of this standard on its financial statements.
During the fiscal first quarter of 2017, the FASB issued Accounting Standard Update 2017-05: Other Income-Gains and Losses from the Derecognition of Nonfinancial Assets. This update clarifies the scope of asset derecognition guidance, adds guidance for partial sales of nonfinancial assets and clarifies recognizing gains and losses from the transfer of nonfinancial assets in contracts with noncustomers. This update will be effective for the Company for its annual and interim reporting periods beginning after December 15, 2017, the same time as the amendments in Update 2014-09 Revenue from Contracts with Customers. This update allows the Company to choose either a full retrospective method or modified retrospective method upon adoption. The Company is currently assessing the impact of the future adoption of this standard on its financial statements.
During the fiscal first quarter of 2016, the FASB issued Accounting Standards Update 2016-01 Financial Instruments: Recognition and Measurement of Financial Assets and Financial Liabilities. The amendments in this update supersede the guidance to classify equity securities with readily determinable fair values into different categories (that is, trading or available-for-sale) and require equity securities to be measured at fair value with changes in the fair value recognized through net income. The standard amends financial reporting by providing relevant information about an entity’s equity investments and reducing the number of items that are recognized in other comprehensive income. This update will be effective for the Company for annual periods beginning after December 15, 2017, and interim periods within those annual periods. The Company is unable to estimate the impact of the future adoption of this standard on its financial statements as it will depend on the equity investments as of the adoption date.
During the fiscal first quarter of 2016, the FASB issued Accounting Standards Update 2016-02 Leases (Topic 842). This update requires the recognition of lease assets and lease liabilities on the balance sheet for all lease obligations and disclosing key information about leasing arrangements. This update requires the recognition of lease assets and lease liabilities by lessees for those leases classified as operating leases under current generally accepted accounting principles. This update will be effective for the Company for all annual and interim periods beginning after December 15, 2018, including interim periods within those fiscal years. Early application is permitted. The update is required to be adopted using a modified retrospective approach. The Company anticipates that most of its operating leases will result in
the recognition of additional assets and the corresponding liabilities on its Consolidated Balance Sheets, however does not expect to have a material impact on the financial position.
The actual impact will depend on the Company's lease portfolio at the time of adoption. The Company continues to assess all implications of the standard and related financial disclosures.
|
41
|
||
During the fiscal first quarter of 2016, the FASB issued Accounting Standards Update 2016-07 Investments - Equity Method and Joint Ventures (Topic 323): Simplifying the Transition to the Equity Method of Accounting. The amendments in the update eliminate the requirement that when an investment qualifies for the use of the equity method as a result of an increase in the level of ownership interest or degree of influence, an investor must adjust the investment, results of operations, and retained earnings retroactively on a step by step basis as if the equity method had been in effect during all previous periods that the investment had been held. The amendments in this update are effective for all entities for fiscal years, and interim periods within those fiscal years, beginning after December 15, 2016. The amendments should be applied prospectively upon their effective date to increases in the level of ownership interest or degree of influence that result in the application of the equity method. Earlier adoption is permitted for any entity in any interim or annual period. The adoption of this standard is not expected to have a material impact on the presentation of the Company's consolidated financial statements.
During the fiscal third quarter of 2016, the FASB issued Accounting Standards Update 2016-15 Statement of Cash Flows (Topic 230): Classification of Certain Cash Receipts and Cash Payments. This update addresses whether to present certain specific cash flow items as operating, investing or financing activities. The amendments in this update are effective for public entities for fiscal years, and interim periods within those fiscal years, beginning after December 15, 2017. Early adoption is permitted, including adoption in an interim period. The Company is currently assessing the impact of the future adoption of this standard on its consolidated Statements of Cash Flows.
During the fiscal fourth quarter of 2016, the FASB issued Accounting Standards Update 2016-16 Income Taxes (Topic 740): Intra-Entity Transfers of Assets Other Than Inventory. This update removes the current exception in US GAAP prohibiting entities from recognizing current and deferred income tax expenses or benefits related to transfer of assets, other than inventory, within the consolidated entity. The current exception to defer the recognition of any tax impact on the transfer of inventory within the consolidated entity until it is sold to a third party remains unaffected. The amendments in this update are effective for public entities for annual reporting periods beginning after December 15, 2017. Early adoption is permitted and should be in the first interim period if an entity issues interim financial statements. The Company is currently assessing the impact of the future adoption of this standard on its consolidated financial statements.
During the fiscal second quarter of 2015, the FASB issued Accounting Standards Update 2015-11: Simplifying the Measurement of Inventory. This update requires inventory to be measured at the lower of cost or net realizable value. Net realizable value is the estimated selling prices in the ordinary course of business, less reasonably predictable costs of completion, disposal and transportation. This update will be effective for the Company for all annual and interim periods beginning after December 15, 2016. The amendments in this update should be applied prospectively with earlier application permitted as of the beginning of an interim or annual reporting period. This update will not have a material impact on the presentation of the Company’s financial position.
During the fiscal second quarter of 2014, the FASB issued Accounting Standards Update 2014-09: Revenue from Contracts with Customers, which, along with amendments issued in 2015 and 2016, will replace substantially all current U.S. GAAP guidance on this topic and eliminate industry-specific guidance. Early adoption of this standard is permitted but not before the original effective date for all annual periods and interim reporting periods beginning after December 15, 2017. The guidance permits two methods of adoption: full retrospective method (retrospective application to each prior reporting period presented) or modified retrospective method (retrospective application with the cumulative effect of initially applying the guidance recognized at the date of initial application and providing certain additional disclosures). While the Company continues to evaluate the effect of the standard, preliminarily, it does not anticipate a material impact on its financial statements. To complete the assessment of the impact of the standard to the financial statements, the Company continues to assess all implications of the standard, method of adoption and related financial disclosures. Additionally, the Company continues to monitor modifications, clarifications and interpretations issued by the FASB that may affect current conclusions.
Cash Equivalents
The Company classifies all highly liquid investments with stated maturities of three months or less from date of purchase as cash equivalents and all highly liquid investments with stated maturities of greater than three months from the date of purchase as current marketable securities. The Company has a policy of making investments only with commercial institutions that have at least an investment grade credit rating. The Company invests its cash primarily in government securities and obligations, corporate debt securities, money market funds and reverse repurchase agreements (RRAs).
RRAs are collateralized by deposits in the form of Government Securities and Obligations for an amount not less than
102%
of their value. The Company does not record an asset or liability as the Company is not permitted to sell or repledge the associated collateral. The Company has a policy that the collateral has at least an A (or equivalent) credit rating. The Company utilizes a third party custodian to manage the exchange of funds and ensure that collateral received is maintained at
102%
of the value of the RRAs on a daily basis. RRAs with stated maturities of greater than three months from the date of purchase are classified as marketable securities.
Investments
Investments classified as held to maturity investments are reported at amortized cost and realized gains or losses are reported in earnings. Investments classified as available-for-sale are carried at estimated fair value with unrealized gains and losses
|
42
|
||
recorded as a component of accumulated other comprehensive income. Available-for-sale securities available for current operations are classified as current assets otherwise, they are classified as long term. Management determines the appropriate classification of its investment in debt and equity securities at the time of purchase and re-evaluates such determination at each balance sheet date. The Company periodically reviews its investments in equity securities for impairment and adjusts these investments to their fair value when a decline in market value is deemed to be other than temporary. If losses on these securities are considered to be other than temporary, the loss is recognized in earnings.
Property, Plant and Equipment and Depreciation
Property, plant and equipment are stated at cost. The Company utilizes the straight-line method of depreciation over the estimated useful lives of the assets:
|
Building and building equipment
|
20 - 30 years
|
|
Land and leasehold improvements
|
10 - 20 years
|
|
Machinery and equipment
|
2 - 13 years
|
The Company capitalizes certain computer software and development costs, included in machinery and equipment, when incurred in connection with developing or obtaining computer software for internal use. Capitalized software costs are amortized over the estimated useful lives of the software, which generally range from
3
to
8
years.
The Company reviews long-lived assets to assess recoverability using undiscounted cash flows. When certain events or changes in operating or economic conditions occur, an impairment assessment may be performed on the recoverability of the carrying value of these assets. If the asset is determined to be impaired, the loss is measured based on the difference between the asset’s fair value and its carrying value. If quoted market prices are not available, the Company will estimate fair value using a discounted value of estimated future cash flows.
Revenue Recognition
The Company recognizes revenue from product sales when the goods are shipped or delivered and title and risk of loss pass to the customer. Provisions for certain rebates, sales incentives, trade promotions, coupons, product returns and discounts to customers are accounted for as reductions in sales in the same period the related sales are recorded.
Product discounts granted are based on the terms of arrangements with direct, indirect and other market participants, as well as market conditions, including prices charged by competitors. Rebates, which include Medicaid, are estimated based on contractual terms, historical experience, patient outcomes, trend analysis and projected market conditions in the various markets served. The Company evaluates market conditions for products or groups of products primarily through the analysis of wholesaler and other third-party sell-through and market research data, as well as internally generated information.
Sales returns are generally estimated and recorded based on historical sales and returns information. Products that exhibit unusual sales or return patterns due to dating, competition or other marketing matters are specifically investigated and analyzed as part of the accounting for sales returns accruals.
Sales returns allowances represent a reserve for products that may be returned due to expiration, destruction in the field, or in specific areas, product recall. The returns reserve is based on historical return trends by product and by market as a percent to gross sales. In accordance with the Company’s accounting policies, the Company generally issues credit to customers for returned goods. The Company’s sales returns reserves are accounted for in accordance with U.S. GAAP guidance for revenue recognition when right of return exists. Sales returns reserves are recorded at full sales value. Sales returns in the Consumer and Pharmaceutical segments are almost exclusively not resalable. Sales returns for certain franchises in the Medical Devices segment are typically resalable but are not material. The Company infrequently exchanges products from inventory for returned products. The sales returns reserve for the total Company has been approximately
1.0%
of annual sales to customers during the fiscal reporting years
2016
,
2015
and
2014
.
Promotional programs, such as product listing allowances and cooperative advertising arrangements, are recorded in the year incurred. Continuing promotional programs include coupons and volume-based sales incentive programs. The redemption cost of consumer coupons is based on historical redemption experience by product and value. Volume-based incentive programs are based on the estimated sales volumes for the incentive period and are recorded as products are sold. The Company also earns service revenue for co-promotion of certain products and includes it in sales to customers. These arrangements are evaluated to determine the appropriate amounts to be deferred or recorded as a reduction of revenue.
Shipping and Handling
Shipping and handling costs incurred were
$974 million
,
$996 million
and
$1,068 million
in
2016
,
2015
and
2014
, respectively, and are included in selling, marketing and administrative expense. The amount of revenue received for shipping and handling is less than
0.5%
of sales to customers for all periods presented.
Inventories
Inventories are stated at the lower of cost or market determined by the first-in, first-out method.
|
43
|
||
Intangible Assets and Goodwill
The authoritative literature on U.S. GAAP requires that goodwill and intangible assets with indefinite lives be assessed annually for impairment. The Company completed the annual impairment test for 2016 in the fiscal fourth quarter. Future impairment tests will be performed annually in the fiscal fourth quarter, or sooner if warranted. Purchased in-process research and development is accounted for as an indefinite lived intangible asset until the underlying project is completed, at which point the intangible asset will be accounted for as a definite lived intangible asset, or abandoned, at which point the intangible asset will be written off or partially impaired.
Intangible assets that have finite useful lives continue to be amortized over their useful lives, and are reviewed for impairment when warranted by economic conditions. See Note 5 for further details on Intangible Assets and Goodwill.
Financial Instruments
As required by U.S. GAAP, all derivative instruments are recorded on the balance sheet at fair value. Fair value is the exit price that would be received to sell an asset or paid to transfer a liability. Fair value is a market-based measurement determined using assumptions that market participants would use in pricing an asset or liability. The authoritative literature establishes a three-level hierarchy to prioritize the inputs used in measuring fair value, with Level 1 having the highest priority and Level 3 having the lowest. Changes in the fair value of derivatives are recorded each period in current earnings or other comprehensive income, depending on whether the derivative is designated as part of a hedge transaction, and if so, the type of hedge transaction.
The Company documents all relationships between hedged items and derivatives. The overall risk management strategy includes reasons for undertaking hedge transactions and entering into derivatives. The objectives of this strategy are: (1) minimize foreign currency exposure’s impact on the Company’s financial performance; (2) protect the Company’s cash flow from adverse movements in foreign exchange rates; (3) ensure the appropriateness of financial instruments; and (4) manage the enterprise risk associated with financial institutions. See Note 6 for additional information on Financial Instruments.
Product Liability
Accruals for product liability claims are recorded, on an undiscounted basis, when it is probable that a liability has been incurred and the amount of the liability can be reasonably estimated based on existing information and actuarially determined estimates where applicable. The accruals are adjusted periodically as additional information becomes available. The Company accrues an estimate of the legal defense costs needed to defend each matter when those costs are probable and can be reasonably estimated.
As a result of cost and availability factors, effective November 1, 2005, the Company ceased purchasing third-party product liability insurance. The Company has self insurance through a wholly-owned captive insurance company. In addition to accruals in the self insurance program, claims that exceed the insurance coverage are accrued when losses are probable and amounts can be reasonably estimated. Based on the availability of prior coverage, receivables for insurance recoveries related to product liability claims are recorded on an undiscounted basis, when it is probable that a recovery will be realized. As appropriate, reserves against these receivables are recorded for estimated amounts that may not be collected from third-party insurers.
Concentration of Credit Risk
Global concentration of credit risk with respect to trade accounts receivables continues to be limited due to the large number of customers globally and adherence to internal credit policies and credit limits. Economic challenges in Italy, Spain, Greece and Portugal (the Southern European Region) have impacted certain payment patterns, which have historically been longer than those experienced in the U.S. and other international markets. The total net trade accounts receivable balance in the Southern European Region was approximately
$1.1 billion
as of
January 1, 2017
and approximately
$1.3 billion
as of
January 3, 2016
. Approximately
$0.7 billion
as of
January 1, 2017
and approximately
$0.8 billion
as of
January 3, 2016
of the Southern European Region net trade accounts receivable balance related to the Company's Consumer, Vision Care and Diabetes Care businesses as well as certain Pharmaceutical and Medical Devices customers which are in line with historical collection patterns.
The remaining balance of net trade accounts receivable in the Southern European Region has been negatively impacted by the timing of payments from certain government owned or supported health care customers, as well as certain distributors of the Pharmaceutical and Medical Devices local affiliates. The total net trade accounts receivable balance for these customers were approximately
$0.4 billion
at
January 1, 2017
and
$0.5 billion
at
January 3, 2016
. The Company continues to receive payments from these customers and, in some cases, late payments with interest. For customers where payment is expected over periods of time longer than one year, revenue and trade receivables have been discounted over the estimated period of time for collection. Allowances for doubtful accounts have been increased for these customers, but have been immaterial to date. The Company will continue to work closely with these customers on payment plans, monitor the economic situation and take appropriate actions as necessary.
|
44
|
||
Research and Development
Research and development expenses are expensed as incurred. Upfront and milestone payments made to third parties in connection with research and development collaborations are expensed as incurred up to the point of regulatory approval. Payments made to third parties subsequent to regulatory approval are capitalized and amortized over the remaining useful life of the related product. Amounts capitalized for such payments are included in other intangibles, net of accumulated amortization.
The Company enters into collaborative arrangements, typically with other pharmaceutical or biotechnology companies, to develop and commercialize drug candidates or intellectual property. These arrangements typically involve two (or more) parties who are active participants in the collaboration and are exposed to significant risks and rewards dependent on the commercial success of the activities. These collaborations usually involve various activities by one or more parties, including research and development, marketing and selling and distribution. Often, these collaborations require upfront, milestone and royalty or profit share payments, contingent upon the occurrence of certain future events linked to the success of the asset in development. Amounts due from collaborative partners related to development activities are generally reflected as a reduction of research and development expense because the performance of contract development services is not central to the Company’s operations. In general, the income statement presentation for these collaborations is as follows:
|
Nature/Type of Collaboration
|
|
Statement of Earnings Presentation
|
|
Third-party sale of product
|
|
Sales to customers
|
|
Royalties/milestones paid to collaborative partner (post-regulatory approval)*
|
|
Cost of products sold
|
|
Royalties received from collaborative partner
|
|
Other income (expense), net
|
|
Upfront payments & milestones paid to collaborative partner (pre-regulatory approval)
|
|
Research and development expense
|
|
Research and development payments to collaborative partner
|
|
Research and development expense
|
|
Research and development payments received from collaborative partner
|
|
Reduction of Research and development expense
|
|
*
|
Milestones are capitalized as intangible assets and amortized to cost of goods sold over the useful life.
|
For all years presented, there was no individual project that represented greater than
5%
of the total annual consolidated research and development expense.
The Company has a number of products and compounds developed in collaboration with strategic partners including XARELTO
®
, co-developed with Bayer HealthCare AG and IMBRUVICA
®
, developed in collaboration and co-marketed with Pharmacyclics LLC, an AbbVie company.
Advertising
Costs associated with advertising are expensed in the year incurred and are included in selling, marketing and administrative expenses. Advertising expenses worldwide, which comprised television, radio, print media and Internet advertising, were
$2.4 billion
,
$2.5 billion
and
$2.6 billion
in
2016
,
2015
and
2014
, respectively.
Income Taxes
Income taxes are recorded based on amounts refundable or payable for the current year and include the results of any difference between U.S. GAAP accounting and tax reporting, recorded as deferred tax assets or liabilities. The Company estimates deferred tax assets and liabilities based on enacted tax regulations and rates. Future changes in tax laws and rates may affect recorded deferred tax assets and liabilities in the future.
The Company has unrecognized tax benefits for uncertain tax positions. The Company follows U.S. GAAP which prescribes a recognition threshold and measurement attribute for the financial statement recognition and measurement of a tax position taken or expected to be taken in a tax return. Management believes that changes in these estimates would not have a material effect on the Company's results of operations, cash flows or financial position.
At
January 1, 2017
and
January 3, 2016
, the cumulative amounts of undistributed international earnings were approximately
$66.2 billion
and
$58.0 billion
, respectively. At
January 1, 2017
and
January 3, 2016
, the Company's foreign subsidiaries held balances of cash, cash equivalents and marketable securities in the amounts of
$41.3 billion
and
$38.2 billion
, respectively. The Company has not provided deferred taxes on the undistributed earnings from certain international subsidiaries where the earnings are considered to be indefinitely reinvested. The Company intends to continue to reinvest these earnings in international operations. If the Company decided at a later date to repatriate these earnings to the U.S., the Company would be required to provide for the net tax effects on these amounts. The Company does not determine the deferred tax liability associated with these undistributed earnings, as such determination is not practical.
See Note 8 to the Consolidated Financial Statements for further information regarding income taxes.
|
45
|
||
Net Earnings Per Share
Basic earnings per share is computed by dividing net earnings available to common shareholders by the weighted average number of common shares outstanding for the period. Diluted earnings per share reflects the potential dilution that could occur if securities were exercised or converted into common stock using the treasury stock method.
Use of Estimates
The preparation of consolidated financial statements in conformity with accounting principles generally accepted in the U.S. requires management to make estimates and assumptions that affect the amounts reported. Estimates are used when accounting for sales discounts, rebates, allowances and incentives, product liabilities, income taxes, depreciation, amortization, employee benefits, contingencies and intangible asset and liability valuations. Actual results may or may not differ from those estimates.
The Company follows the provisions of U.S. GAAP when recording litigation related contingencies. A liability is recorded when a loss is probable and can be reasonably estimated. The best estimate of a loss within a range is accrued; however, if no estimate in the range is better than any other, the minimum amount is accrued.
Annual Closing Date
The Company follows the concept of a fiscal year, which ends on the Sunday nearest to the end of the month of December. Normally each fiscal year consists of
52 weeks, but every five or six years the fiscal year consists of 53 weeks
, and therefore includes additional shipping days, as was the case in 2015, and will be the case again in 2020.
Reclassification
Certain prior period amounts have been reclassified to conform to current year presentation.
|
46
|
||
|
2.
|
Cash, Cash Equivalents and Current Marketable Securities
|
At the end of
2016
and
2015
, cash, cash equivalents and current marketable securities were comprised of:
|
(Dollars in Millions)
|
2016
|
|||||||||||||||||||
|
Carrying Amount
|
Unrecognized Gain
|
Unrecognized Loss
|
Estimated Fair Value
|
Cash & Cash Equivalents
|
Current Marketable Securities
|
|||||||||||||||
|
Cash
|
$
|
1,979
|
|
—
|
|
—
|
|
1,979
|
|
$
|
1,979
|
|
—
|
|
||||||
|
U.S. Gov't Securities
(1)
|
10,832
|
|
—
|
|
(1
|
)
|
10,831
|
|
2,249
|
|
8,583
|
|
||||||||
|
Other Sovereign Securities
(1)
|
1,299
|
|
—
|
|
—
|
|
1,299
|
|
120
|
|
1,179
|
|
||||||||
|
U.S. Reverse repurchase agreements
|
6,103
|
|
—
|
|
—
|
|
6,103
|
|
6,103
|
|
—
|
|
||||||||
|
Other Reverse repurchase agreements
|
240
|
|
—
|
|
—
|
|
240
|
|
240
|
|
—
|
|
||||||||
|
Corporate debt securities
(1)
|
754
|
|
—
|
|
—
|
|
754
|
|
—
|
|
754
|
|
||||||||
|
Money market funds
|
7,187
|
|
—
|
|
—
|
|
7,187
|
|
7,187
|
|
—
|
|
||||||||
|
Time deposits
(1)
|
1,094
|
|
—
|
|
—
|
|
1,094
|
|
1,094
|
|
—
|
|
||||||||
|
Subtotal
|
$
|
29,488
|
|
—
|
|
(1
|
)
|
29,487
|
|
18,972
|
|
10,516
|
|
|||||||
|
Unrealized Gain
|
Unrealized Loss
|
|||||||||||||||||||
|
Gov't Securities
|
$
|
10,277
|
|
5
|
|
(51
|
)
|
10,231
|
|
—
|
|
10,231
|
|
|||||||
|
Other Sovereign Securities
|
90
|
|
—
|
|
—
|
|
90
|
|
90
|
|
||||||||||
|
Corporate debt securities
|
1,777
|
|
1
|
|
(12
|
)
|
1,766
|
|
—
|
|
1,766
|
|
||||||||
|
Equity investments
|
34
|
|
298
|
|
|
332
|
|
332
|
|
|||||||||||
|
Subtotal available for sale
(2)
|
$
|
12,178
|
|
304
|
|
(63
|
)
|
12,419
|
|
—
|
|
12,419
|
|
|||||||
|
Total cash, cash equivalents and current marketable securities
|
|
|
$
|
18,972
|
|
22,935
|
|
|||||||||||||
|
47
|
||
|
(Dollars in Millions)
|
2015
|
|||||||||||||||||||
|
Carrying Amount
|
Unrecognized Gain
|
Unrecognized Loss
|
Estimated Fair Value
|
Cash Equivalents
|
Current Marketable Securities
|
|||||||||||||||
|
Cash
|
$
|
1,832
|
|
—
|
|
—
|
|
1,832
|
|
1,832
|
|
—
|
|
|||||||
|
U.S. Gov't Securities
(1)
|
14,641
|
|
1
|
|
(2
|
)
|
14,640
|
|
650
|
|
13,991
|
|
||||||||
|
Other Sovereign Securities
(1)
|
2,122
|
|
—
|
|
—
|
|
2,122
|
|
933
|
|
1,189
|
|
||||||||
|
U.S. Reverse repurchase agreements
|
1,579
|
|
—
|
|
—
|
|
1,579
|
|
1,579
|
|
—
|
|
||||||||
|
Other Reverse repurchase agreements
|
2,200
|
|
—
|
|
—
|
|
2,200
|
|
2,200
|
|
—
|
|
||||||||
|
Corporate debt securities
(1)
|
2,941
|
|
—
|
|
—
|
|
2,941
|
|
1,793
|
|
1,148
|
|
||||||||
|
Money market funds
|
3,855
|
|
—
|
|
—
|
|
3,855
|
|
3,855
|
|
—
|
|
||||||||
|
Time deposits
(1)
|
890
|
|
—
|
|
—
|
|
890
|
|
890
|
|
—
|
|
||||||||
|
Subtotal
|
$
|
30,060
|
|
1
|
|
(2
|
)
|
30,059
|
|
13,732
|
|
16,328
|
|
|||||||
|
Unrealized Gain
|
Unrealized Loss
|
|||||||||||||||||||
|
Gov't Securities
|
$
|
7,307
|
|
1
|
|
(34
|
)
|
7,274
|
|
—
|
|
7,274
|
|
|||||||
|
Other Sovereign Securities
|
—
|
|
—
|
|
—
|
|
—
|
|
—
|
|
||||||||||
|
Corporate debt securities
|
1,046
|
|
1
|
|
(5
|
)
|
1,042
|
|
—
|
|
1,042
|
|
||||||||
|
Subtotal available for sale
(2)
|
$
|
8,353
|
|
2
|
|
(39
|
)
|
8,316
|
|
—
|
|
8,316
|
|
|||||||
|
Total cash, cash equivalents and current marketable securities
|
$
|
13,732
|
|
24,644
|
|
|||||||||||||||
(1)
Held to maturity investments are reported at amortized cost and realized gains or losses are reported in earnings.
(2)
Available for sale securities are reported at fair value with unrealized gains and losses reported net of taxes in other comprehensive income.
Fair value of government securities and obligations and corporate debt securities were estimated using quoted broker prices and significant other observable inputs.
The contractual maturities of the available for sale debt securities at
January 1, 2017
are as follows:
|
(Dollars in Millions)
|
Cost Basis
|
Fair Value
|
|||||
|
Due within one year
|
$
|
474
|
|
474
|
|
||
|
Due after one year through five years
|
11,430
|
|
11,381
|
|
|||
|
Due after five years through ten years
|
240
|
|
232
|
|
|||
|
Total debt securities
|
$
|
12,144
|
|
12,087
|
|
||
The Company invests its excess cash in both deposits with major banks throughout the world and other high-quality money market instruments. The Company has a policy of making investments only with commercial institutions that have at least an investment grade credit rating.
|
3.
|
Inventories
|
At the end of
2016
and
2015
, inventories were comprised of:
|
(Dollars in Millions)
|
2016
|
2015
|
|||||
|
Raw materials and supplies
|
$
|
952
|
|
936
|
|
||
|
Goods in process
|
2,185
|
|
2,241
|
|
|||
|
Finished goods
|
5,007
|
|
4,876
|
|
|||
|
Total inventories
|
$
|
8,144
|
|
8,053
|
|
||
|
48
|
||
|
4.
|
Property, Plant and Equipment
|
At the end of
2016
and
2015
, property, plant and equipment at cost and accumulated depreciation were:
|
(Dollars in Millions)
|
2016
|
2015
|
|||||
|
Land and land improvements
|
$
|
753
|
|
780
|
|
||
|
Buildings and building equipment
|
10,112
|
|
9,829
|
|
|||
|
Machinery and equipment
|
23,554
|
|
22,511
|
|
|||
|
Construction in progress
|
3,354
|
|
3,528
|
|
|||
|
Total property, plant and equipment, gross
|
$
|
37,773
|
|
36,648
|
|
||
|
Less accumulated depreciation
|
21,861
|
|
20,743
|
|
|||
|
Total property, plant and equipment, net
|
$
|
15,912
|
|
15,905
|
|
||
The Company capitalizes interest expense as part of the cost of construction of facilities and equipment. Interest expense capitalized in
2016
,
2015
and
2014
was
$102 million
,
$102 million
and
$115 million
, respectively.
Depreciation expense, including the amortization of capitalized interest was
$2.5 billion
in
2016
,
2015
and
2014
.
Upon retirement or other disposal of property, plant and equipment, the costs and related amounts of accumulated depreciation or amortization are eliminated from the asset and accumulated depreciation accounts, respectively. The difference, if any, between the net asset value and the proceeds are recorded in earnings.
|
5.
|
Intangible Assets and Goodwill
|
At the end of
2016
and
2015
, the gross and net amounts of intangible assets were:
|
(Dollars in Millions)
|
2016
|
2015
|
|||||
|
Intangible assets with definite lives:
|
|
|
|
|
|||
|
Patents and trademarks — gross
|
$
|
10,521
|
|
8,299
|
|
||
|
Less accumulated amortization
|
5,076
|
|
4,745
|
|
|||
|
Patents and trademarks — net
|
$
|
5,445
|
|
3,554
|
|
||
|
Customer relationships and other intangibles — gross
|
$
|
17,615
|
|
17,583
|
|
||
|
Less accumulated amortization
|
6,515
|
|
5,816
|
|
|||
|
Customer relationships and other intangibles — net
|
$
|
11,100
|
|
11,767
|
|
||
|
Intangible assets with indefinite lives:
|
|
|
|
|
|||
|
Trademarks
|
$
|
6,888
|
|
7,023
|
|
||
|
Purchased in-process research and development
|
3,443
|
|
3,420
|
|
|||
|
Total intangible assets with indefinite lives
|
$
|
10,331
|
|
10,443
|
|
||
|
Total intangible assets — net
|
$
|
26,876
|
|
25,764
|
|
||
Goodwill as of
January 1, 2017
and
January 3, 2016
, as allocated by segment of business, was as follows:
|
(Dollars in Millions)
|
Consumer
|
Pharmaceutical
|
Med Devices
|
Total
|
|||||||||
|
Goodwill at December 28, 2014
|
$
|
7,675
|
|
2,626
|
|
11,531
|
|
21,832
|
|
||||
|
Goodwill, related to acquisitions
|
110
|
|
366
|
|
34
|
|
510
|
|
|||||
|
Goodwill, related to divestitures
|
(119
|
)
|
(17
|
)
|
(57
|
)
|
(193
|
)
|
|||||
|
Currency translation/other
|
(426
|
)
|
(86
|
)
|
(8
|
)
|
(520
|
)
|
|||||
|
Goodwill at January 3, 2016
|
$
|
7,240
|
|
2,889
|
|
11,500
|
|
21,629
|
|
||||
|
Goodwill, related to acquisitions
|
1,362
|
|
—
|
|
210
|
|
1,572
|
|
|||||
|
Goodwill, related to divestitures
|
(63
|
)
|
(12
|
)
|
—
|
|
(75
|
)
|
|||||
|
Currency translation/other
|
(276
|
)
|
(37
|
)
|
(8
|
)
|
(321
|
)
|
|||||
|
Goodwill at January 1, 2017
|
$
|
8,263
|
|
2,840
|
|
11,702
|
|
22,805
|
|
||||
|
49
|
||
The weighted average amortization periods for patents and trademarks and customer relationships and other intangible assets are
19 years
and
24 years
, respectively. The amortization expense of amortizable assets included in cost of products sold was
$1.2 billion
,
$1.2 billion
and
$1.4 billion
before tax, for the fiscal years ended
January 1, 2017
,
January 3, 2016
and
December 28, 2014
, respectively. The estimated amortization expense, including Abbott Medical Optics (AMO), for the five succeeding years approximates
$1.5 billion
before tax, per year. Intangible asset write-downs are included in Other (income) expense, net.
See Note 20 to the Consolidated Financial Statements for additional details related to acquisitions and divestitures.
|
6.
|
Fair Value Measurements
|
The Company uses forward foreign exchange contracts to manage its exposure to the variability of cash flows, primarily related to the foreign exchange rate changes of future intercompany products and third-party purchases of materials denominated in a foreign currency. The Company uses cross currency interest rate swaps to manage currency risk primarily related to borrowings. The Company also uses equity collar contracts to manage exposure to market risk associated with certain equity investments. All three types of derivatives are designated as cash flow hedges.
Additionally, the Company uses interest rate swaps as an instrument to manage interest rate risk related to fixed rate borrowings. These derivatives are treated as fair value hedges. The Company uses forward foreign exchange contracts designated as net investment hedges. Additionally, the Company uses forward foreign exchange contracts to offset its exposure to certain foreign currency assets and liabilities. These forward foreign exchange contracts are not designated as hedges and therefore, changes in the fair values of these derivatives are recognized in earnings, thereby offsetting the current earnings effect of the related foreign currency assets and liabilities.
The Company does not enter into derivative financial instruments for trading or speculative purposes, or that contain credit risk related contingent features or requirements to post collateral (excluding equity collar contract) by either the Company or the counter-party. For equity collar contracts, the Company pledged the underlying hedged marketable equity securities to the counter-party as collateral. On an ongoing basis, the Company monitors counterparty credit ratings. The Company considers credit non-performance risk to be low, because the Company primarily enters into agreements with commercial institutions that have at least an investment grade credit rating. Refer to the table on significant financial assets and liabilities measured at fair value contained in this footnote for receivables and payables with these commercial institutions. As of
January 1, 2017
, the Company had notional amounts outstanding for forward foreign exchange contracts, cross currency interest rate swaps, interest rate swaps and equity collar contracts of
$36.0 billion
,
$2.3 billion
,
$1.8 billion
and
$0.3 billion
respectively.
All derivative instruments are recorded on the balance sheet at fair value. Changes in the fair value of derivatives are recorded each period in current earnings or other comprehensive income, depending on whether the derivative is designated as part of a hedge transaction, and if so, the type of hedge transaction.
The designation as a cash flow hedge is made at the entrance date of the derivative contract. At inception, all derivatives are expected to be highly effective. Changes in the fair value of a derivative that is designated as a cash flow hedge and is highly effective are recorded in accumulated other comprehensive income until the underlying transaction affects earnings, and are then reclassified to earnings in the same account as the hedged transaction. Gains and losses associated with interest rate swaps and changes in fair value of hedged debt attributable to changes in interest rates are recorded to interest expense in the period in which they occur. Gains and losses on net investment hedges are accounted for through the currency translation account. On an ongoing basis, the Company assesses whether each derivative continues to be highly effective in offsetting changes of hedged items. If and when a derivative is no longer expected to be highly effective, hedge accounting is discontinued. Hedge ineffectiveness, if any, is included in current period earnings in Other (income) expense, net for forward foreign exchange contracts, cross currency interest rate swaps, net investment hedges and equity collar contracts. For interest rate swaps designated as fair value hedges, hedge ineffectiveness, if any, is included in current period earnings within interest expense. For the current reporting period, hedge ineffectiveness associated with interest rate swaps was not material.
During the fiscal second quarter of 2016, the Company designated its Euro denominated notes issued in May 2016 with due dates ranging from 2022 to 2035 as a net investment hedge of the Company's investments in certain of its international subsidiaries that use the Euro as their functional currency in order to reduce the volatility caused by changes in exchange rates.
During 2016, the change in the carrying value due to remeasurement of these Euro notes resulted in a
$375 million
pretax gain reflected in foreign currency translation adjustment, within the Consolidated Statements of Comprehensive Income.
As of
January 1, 2017
, the balance of deferred net losses on derivatives included in accumulated other comprehensive income was
$285 million
after-tax. For additional information, see the Consolidated Statements of Comprehensive Income and Note 13. The Company expects that substantially all of the amounts related to forward foreign exchange contracts will be reclassified into earnings over the
next 12 months
as a result of transactions that are expected to occur over that period. The maximum length of time over which the Company is hedging transaction exposure is
18 months
, excluding interest rate contracts, net investment hedges and equity collar contracts. The amount ultimately realized in earnings may differ as foreign exchange rates change. Realized gains and losses are ultimately determined by actual exchange rates at maturity of the derivative.
|
50
|
||
The following table is a summary of the activity related to derivatives designated as cash flow hedges for the fiscal years ended
January 1, 2017
and
January 3, 2016
:
|
(Dollars in Millions)
|
Gain/(Loss)
Recognized In Accumulated OCI (1) |
Gain/(Loss) Reclassified From
Accumulated OCI Into Income (1) |
Gain/(Loss) Recognized In
Other Income/Expense (2) |
||||||||||||||||
|
Cash Flow Hedges by Income Statement Caption
|
2016
|
2015
|
2016
|
2015
|
2016
|
2015
|
|||||||||||||
|
Sales to customers
(3)
|
$
|
(65
|
)
|
(83
|
)
|
(47
|
)
|
(126
|
)
|
(1
|
)
|
(5
|
)
|
||||||
|
Cost of products sold
(3)
|
(212
|
)
|
(22
|
)
|
(3
|
)
|
122
|
|
(15
|
)
|
14
|
|
|||||||
|
Research and development expense
(3)
|
(76
|
)
|
(3
|
)
|
(90
|
)
|
6
|
|
—
|
|
1
|
|
|||||||
|
Interest (income)/Interest expense, net
(4)
|
66
|
|
(40
|
)
|
37
|
|
—
|
|
—
|
|
—
|
|
|||||||
|
Other (income) expense, net
(3) (5)
|
(72
|
)
|
33
|
|
(7
|
)
|
60
|
|
2
|
|
1
|
|
|||||||
|
Total
|
$
|
(359
|
)
|
(115
|
)
|
(110
|
)
|
62
|
|
(14
|
)
|
11
|
|
||||||
All amounts shown in the table above are net of tax.
|
(1)
|
Effective portion
|
|
(2)
|
Ineffective portion
|
|
(3)
|
Forward foreign exchange contracts
|
|
(4)
|
Cross currency interest rate swaps
|
|
(5)
|
Includes equity collar contracts
|
For the fiscal years ended
January 1, 2017
and
January 3, 2016
, a loss of
$56 million
and a loss of
$34 million
, respectively, was recognized in Other (income) expense, net, relating to forward foreign exchange contracts not designated as hedging instruments.
Fair value is the exit price that would be received to sell an asset or paid to transfer a liability. Fair value is a market-based measurement determined using assumptions that market participants would use in pricing an asset or liability. The authoritative literature establishes a three-level hierarchy to prioritize the inputs used in measuring fair value. The levels within the hierarchy are described below with Level 1 having the highest priority and Level 3 having the lowest.
The fair value of a derivative financial instrument (i.e. forward foreign exchange contracts, interest rate contracts) is the aggregation by currency of all future cash flows discounted to its present value at the prevailing market interest rates and subsequently converted to the U.S. Dollar at the current spot foreign exchange rate. The Company does not believe that fair values of these derivative instruments materially differ from the amounts that could be realized upon settlement or maturity, or that the changes in fair value will have a material effect on the Company’s results of operations, cash flows or financial position. The Company also holds equity investments which are classified as Level 1 and debt securities which are classified as Level 2. The Company did not have any other significant financial assets or liabilities which would require revised valuations under this standard that are recognized at fair value.
The following three levels of inputs are used to measure fair value:
Level 1 — Quoted prices in active markets for identical assets and liabilities.
Level 2 — Significant other observable inputs.
Level 3 — Significant unobservable inputs.
The Company’s significant financial assets and liabilities measured at fair value as of
January 1, 2017
and
January 3, 2016
were as follows:
|
51
|
||
|
2016
|
2015
|
|||||||||||||||
|
(Dollars in Millions)
|
Level 1
|
Level 2
|
Level 3
|
Total
|
Total
(1)
|
|||||||||||
|
Derivatives designated as hedging instruments:
|
|
|
|
|
|
|
|
|
|
|
||||||
|
Assets:
|
|
|
|
|
|
|
|
|
|
|
||||||
|
Forward foreign exchange contracts
(7)
|
$
|
—
|
|
747
|
|
—
|
|
747
|
|
452
|
|
|||||
|
Interest rate contracts
(2)(4)(7)
|
—
|
|
31
|
|
—
|
|
31
|
|
28
|
|
||||||
|
Total
|
—
|
|
778
|
|
—
|
|
778
|
|
480
|
|
||||||
|
Liabilities:
|
|
|
|
|
|
|
|
|
|
|
||||||
|
Forward foreign exchange contracts
(8)
|
—
|
|
723
|
|
—
|
|
723
|
|
358
|
|
||||||
|
Interest rate contracts
(3)(4)(8)
|
—
|
|
382
|
|
—
|
|
382
|
|
241
|
|
||||||
|
Equity collar contracts
(8)
|
—
|
|
57
|
|
—
|
|
57
|
|
—
|
|
||||||
|
Total
|
—
|
|
1,162
|
|
—
|
|
1,162
|
|
599
|
|
||||||
|
Derivatives not designated as hedging instruments:
|
|
|
|
|
|
|
|
|
|
|
||||||
|
Assets:
|
|
|
|
|
|
|
|
|
|
|
||||||
|
Forward foreign exchange contracts
(7)
|
—
|
|
34
|
|
—
|
|
34
|
|
33
|
|
||||||
|
Liabilities:
|
|
|
|
|
|
|
|
|
|
|
||||||
|
Forward foreign exchange contracts
(8)
|
—
|
|
57
|
|
—
|
|
57
|
|
41
|
|
||||||
|
Available For Sale Other Investments:
|
||||||||||||||||
|
Equity investments
(5)
|
1,209
|
|
—
|
|
—
|
|
1,209
|
|
1,494
|
|
||||||
|
Debt securities
(6)
|
$
|
—
|
|
12,087
|
|
—
|
|
12,087
|
|
8,316
|
|
|||||
|
(1)
|
2015 assets and liabilities are all classified as Level 2 with the exception of equity investments of
$1,494 million
, which are classified as Level 1.
|
|
(2)
|
Includes
$23 million
and
$20 million
of non-current assets for the fiscal years ending
January 1, 2017
and
January 3, 2016
, respectively.
|
|
(3)
|
Includes
$382 million
and
$239 million
of non-current liabilities for the fiscal years ending
January 1, 2017
and
January 3, 2016
, respectively.
|
|
(4)
|
Includes cross currency interest rate swaps and interest rate swaps.
|
|
(5)
|
Classified as non-current other assets with the exception of
$332 million
of current assets for January 1, 2017. The carrying amount of the equity investments were
$520 million
and
$528 million
as of
January 1, 2017
and
January 3, 2016
, respectively. The unrealized gains were
$757 million
and
$979 million
as of
January 1, 2017
and
January 3, 2016
, respectively. The unrealized losses were
$68 million
and
$13 million
as of
January 1, 2017
and
January 3, 2016
, respectively.
|
|
(6)
|
Classified as current marketable securities.
|
|
(7)
|
Classified as other current assets.
|
|
(8)
|
Classified as accounts payable.
|
See Notes 2 and 7 for financial assets and liabilities held at carrying amount on the Consolidated Balance Sheet.
|
52
|
||
|
7.
|
Borrowings
|
The components of long-term debt are as follows:
|
(Dollars in Millions)
|
2016
|
|
Effective Rate %
|
|
2015
|
|
Effective Rate %
|
||||||||
|
2.15% Notes due 2016
|
$
|
—
|
|
—
|
|
900
|
|
2.22
|
|
||||||
|
3 month LIBOR+0.07% FRN due 2016
|
—
|
|
—
|
|
800
|
|
0.48
|
|
|||||||
|
0.70% Notes due 2016
|
—
|
|
—
|
|
398
|
|
0.74
|
|
|||||||
|
5.55% Debentures due 2017
|
1,000
|
|
5.55
|
|
1,000
|
|
5.55
|
|
|||||||
|
1.125% Notes due 2017
|
699
|
|
1.15
|
|
700
|
|
1.15
|
|
|||||||
|
5.15% Debentures due 2018
|
899
|
|
|
5.18
|
|
|
899
|
|
|
5.15
|
|
||||
|
1.65% Notes due 2018
|
600
|
|
1.70
|
|
602
|
|
1.70
|
|
|||||||
|
4.75% Notes due 2019 (1B Euro 1.0449)
(2)
/
(1B Euro 1.0882)
(3)
|
1,041
|
|
(2)
|
5.83
|
|
|
1,085
|
|
(3)
|
5.83
|
|
||||
|
1.875% Notes due 2019
|
499
|
|
1.93
|
|
502
|
|
1.93
|
|
|||||||
|
0.89% Notes due 2019
|
299
|
|
1.20
|
|
—
|
|
—
|
|
|||||||
|
1.125% Notes due 2019
|
699
|
|
1.13
|
|
—
|
|
—
|
|
|||||||
|
3% Zero Coupon Convertible Subordinated Debentures due 2020
|
84
|
|
|
3.00
|
|
|
137
|
|
|
3.00
|
|
||||
|
2.95% Debentures due 2020
|
546
|
|
|
3.15
|
|
|
545
|
|
|
3.15
|
|
||||
|
3.55% Notes due 2021
|
447
|
|
3.67
|
|
448
|
|
3.67
|
|
|||||||
|
2.45% Notes due 2021
|
348
|
|
2.48
|
|
349
|
|
2.48
|
|
|||||||
|
1.65% Notes due 2021
|
997
|
|
1.65
|
|
—
|
|
—
|
|
|||||||
|
0.250% Notes due 2022 (1B Euro 1.0449)
(2)
|
1,041
|
|
(2)
|
0.26
|
|
—
|
|
—
|
|
||||||
|
6.73% Debentures due 2023
|
249
|
|
|
6.73
|
|
|
250
|
|
|
6.73
|
|
||||
|
3.375% Notes due 2023
|
807
|
|
3.17
|
|
811
|
|
3.17
|
|
|||||||
|
2.05% Notes due 2023
|
497
|
|
2.09
|
|
—
|
|
—
|
|
|||||||
|
0.650% Notes due 2024(750MM Euro 1.0449)
(2)
|
779
|
|
(2)
|
0.68
|
|
—
|
|
—
|
|
||||||
|
5.50% Notes due 2024 (500MM GBP 1.2237)
(2)
/(500MM GBP 1.4818)
(3)
|
605
|
|
(2)
|
6.75
|
|
|
737
|
|
(3)
|
6.75
|
|
||||
|
2.45% Notes due 2026
|
1,989
|
|
2.47
|
|
—
|
|
—
|
|
|||||||
|
1.150% Notes due 2028(750MM Euro 1.0449)
(2)
|
775
|
|
(2)
|
1.21
|
|
—
|
|
—
|
|
||||||
|
6.95% Notes due 2029
|
296
|
|
|
7.14
|
|
|
297
|
|
|
7.14
|
|
||||
|
4.95% Debentures due 2033
|
497
|
|
|
4.95
|
|
|
500
|
|
|
4.95
|
|
||||
|
4.375% Notes due 2033
|
857
|
|
4.24
|
|
864
|
|
4.24
|
|
|||||||
|
1.650% Notes due 2035 (1.5B Euro 1.0449)
(2)
|
1,549
|
|
(2)
|
1.68
|
|
—
|
|
—
|
|
||||||
|
3.55% Notes due 2036
|
987
|
|
3.59
|
|
—
|
|
—
|
|
|||||||
|
5.95% Notes due 2037
|
990
|
|
|
5.99
|
|
|
996
|
|
|
5.99
|
|
||||
|
5.85% Debentures due 2038
|
695
|
|
|
5.85
|
|
|
700
|
|
|
5.86
|
|
||||
|
4.50% Debentures due 2040
|
537
|
|
|
4.63
|
|
|
540
|
|
|
4.63
|
|
||||
|
4.85% Notes due 2041
|
296
|
|
4.89
|
|
298
|
|
4.89
|
|
|||||||
|
4.50% Notes due 2043
|
495
|
|
4.52
|
|
499
|
|
4.52
|
|
|||||||
|
3.70% Notes due 2046
|
1,970
|
|
3.74
|
|
—
|
|
—
|
|
|||||||
|
Other
|
77
|
|
|
—
|
|
|
104
|
|
|
—
|
|
||||
|
Subtotal
|
24,146
|
|
(4)
|
3.33
|
%
|
(1)
|
14,961
|
|
(4)
|
4.06
|
|
(1
|
)
|
||
|
Less current portion
|
1,704
|
|
|
|
|
|
2,104
|
|
|
|
|
||||
|
Total long-term debt
|
$
|
22,442
|
|
|
|
|
|
12,857
|
|
|
|
|
|||
|
(1)
|
Weighted average effective rate.
|
|
(2)
|
Translation rate at
January 1, 2017
.
|
|
53
|
||
|
(3)
|
Translation rate at
January 3, 2016
.
|
|
(4)
|
The excess of the fair value over the carrying value of debt was
$1.6 billion
in
2016
and
$1.7 billion
in
2015
.
|
Fair value of the long-term debt was estimated using market prices, which were corroborated by quoted broker prices and significant other observable inputs.
The Company has access to substantial sources of funds at numerous banks worldwide. In
September 2016
, the Company secured a new 364-day Credit Facility. Total credit available to the Company approximates
$10 billion
, which expires on
September 14, 2017
. Interest charged on borrowings under the credit line agreements is based on either bids provided by banks, the prime rate or London Interbank Offered Rates (LIBOR), plus applicable margins. Commitment fees under the agreements are not material.
Throughout
2016
, the Company continued to have access to liquidity through the commercial paper market. Short-term borrowings and the current portion of long-term debt amounted to approximately
$4.7 billion
at the end of
2016
, of which
$2.7 billion
was borrowed under the Commercial Paper Program. The remainder principally represents local borrowing by international subsidiaries.
Throughout 2015, the Company continued to have access to liquidity through the commercial paper market. Short-term borrowings and the current portion of long-term debt amounted to approximately
$7.0 billion
at the end of 2015, of which
$4.6 billion
was borrowed under the Commercial Paper Program. The remainder principally represents local borrowing by international subsidiaries.
Aggregate maturities of long-term obligations commencing in
2017
are:
|
(Dollars in Millions)
|
||||||||||
|
2017
|
2018
|
2019
|
2020
|
2021
|
After 2021
|
|||||
|
$1,704
|
1,561
|
2,538
|
629
|
1,795
|
15,919
|
|||||
|
8.
|
Income Taxes
|
The provision for taxes on income consists of:
|
(Dollars in Millions)
|
2016
|
2015
|
2014
|
|||||||
|
Currently payable:
|
||||||||||
|
U.S. taxes
|
$
|
1,896
|
|
2,748
|
|
2,625
|
|
|||
|
International taxes
|
1,708
|
|
1,309
|
|
1,174
|
|
||||
|
Total currently payable
|
3,604
|
|
4,057
|
|
3,799
|
|
||||
|
Deferred:
|
||||||||||
|
U.S. taxes
|
294
|
|
37
|
|
(258
|
)
|
||||
|
International taxes
|
(635
|
)
|
(307
|
)
|
699
|
|
||||
|
Total deferred
|
(341
|
)
|
(270
|
)
|
441
|
|
||||
|
Provision for taxes on income
|
$
|
3,263
|
|
3,787
|
|
4,240
|
|
|||
|
54
|
||
A comparison of income tax expense at the U.S. statutory rate of
35%
in
2016
,
2015
and
2014
, to the Company’s effective tax rate is as follows:
|
(Dollars in Millions)
|
2016
|
2015
|
2014
|
||||||||
|
U.S.
|
$
|
7,457
|
|
8,179
|
|
8,001
|
|
||||
|
International
|
12,346
|
|
11,017
|
|
12,562
|
|
|||||
|
Earnings before taxes on income:
|
$
|
19,803
|
|
19,196
|
|
20,563
|
|
||||
|
Tax rates:
|
|||||||||||
|
U.S. statutory rate
|
35.0
|
%
|
35.0
|
|
35.0
|
|
|||||
|
International operations excluding Ireland
|
(9.4
|
)
|
(6.7
|
)
|
(7.0
|
)
|
|||||
|
Ireland and Puerto Rico operations
(1)
|
(7.8
|
)
|
(8.7
|
)
|
(6.9
|
)
|
|||||
|
Research and orphan drug tax credits
|
(0.4
|
)
|
(0.2
|
)
|
(0.3
|
)
|
|||||
|
U.S. state and local
|
(0.1
|
)
|
0.4
|
|
1.0
|
|
|||||
|
U.S. manufacturing deduction
|
(0.6
|
)
|
(0.6
|
)
|
(0.6
|
)
|
|||||
|
U.S. tax on international income
|
1.3
|
|
0.2
|
|
1.4
|
|
|||||
|
Additional tax benefits on share based compensation
|
(1.8
|
)
|
—
|
|
—
|
|
|||||
|
U.S. tax benefit on asset/business disposals
|
—
|
|
—
|
|
(1.9
|
)
|
|||||
|
All other
|
0.3
|
|
0.3
|
|
(0.1
|
)
|
|||||
|
Effective tax rate
|
16.5
|
%
|
19.7
|
|
20.6
|
|
|||||
(1)
The Company has subsidiaries operating in Puerto Rico under various tax incentives.
The 2016 effective tax rate decreased by
3.2%
as compared to 2015. As described in Note 1, the Company adopted a new accounting standard for the reporting of additional tax benefits on share-based compensation that vested or were exercised during the fiscal year. The adoption of this new standard reduced the effective tax rate of fiscal 2016 by
1.8%
versus 2015.
The remainder of the change in the effective tax rate was primarily related to the lower earnings before taxes in the United States and the settlement of several uncertain tax positions in 2016 versus 2015.
The decrease in the 2015 effective tax rate, as compared to 2014, was primarily attributable to the increases in taxable income in lower tax jurisdictions relative to higher tax jurisdictions and a tax benefit resulting from a restructuring of international affiliates. Additionally, the 2014 effective tax rate was affected by the items mentioned below.
The increase in the 2014 effective tax rate, as compared to 2013, was attributable to the following: the divestiture of the Ortho-Clinical Diagnostics business at an approximate
44%
effective tax rate, litigation accruals at low tax rates, the mix of earnings into higher tax jurisdictions, primarily the U.S., the accrual of an additional year of the Branded Prescription Drug Fee, which is not tax deductible, and additional U.S. tax expense related to a planned increase in dividends from current year foreign earnings as compared to the prior year. These increases to the 2014 effective tax rate were partially offset by a tax benefit of
$0.4 billion
associated with the Conor Medsystems divestiture.
The 2014 effective tax rate was also reduced as the Company adjusted its unrecognized tax benefits as a result of (i) the federal appeals court’s decision in OMJ Pharmaceuticals, Inc.’s litigation regarding credits under former Section 936 of the Internal Revenue Code and (ii) a settlement of substantially all issues related to the Company’s U.S. Internal Revenue Service audit of tax years 2006 - 2009. The impact of the settlement is reflected in the U.S. tax on international income and the All other line items within the above reconciliation.
The items noted above reflect the key drivers of the rate reconciliation.
|
55
|
||
Temporary differences and carryforwards for
2016
and
2015
were as follows:
|
2016 Deferred Tax
|
2015 Deferred Tax
|
||||||||||||
|
(Dollars in Millions)
|
Asset
|
Liability
|
Asset
|
Liability
|
|||||||||
|
Employee related obligations
|
$
|
2,958
|
|
|
|
2,863
|
|
|
|
||||
|
Stock based compensation
|
749
|
|
|
|
790
|
|
|
|
|||||
|
Depreciation
|
|
|
(219
|
)
|
|
|
(247
|
)
|
|||||
|
Non-deductible intangibles
|
|
|
(6,672
|
)
|
|
|
(6,663
|
)
|
|||||
|
International R&D capitalized for tax
|
1,264
|
|
|
|
1,318
|
|
|
|
|||||
|
Reserves & liabilities
|
1,857
|
|
|
|
1,801
|
|
|
|
|||||
|
Income reported for tax purposes
|
1,309
|
|
|
|
960
|
|
|
|
|||||
|
Net operating loss carryforward international
|
717
|
|
|
|
997
|
|
|
|
|||||
|
Miscellaneous international
|
1,135
|
|
(15
|
)
|
922
|
|
(1)
|
(249
|
)
|
||||
|
Miscellaneous U.S.
|
155
|
|
|
|
436
|
|
|
|
|||||
|
Total deferred income taxes
|
$
|
10,144
|
|
(6,906
|
)
|
10,087
|
|
(7,159
|
)
|
||||
(1)
Net of a valuation allowance related to Belgium of
$196 million
. In 2016, this allowance was reversed and the related deferred tax asset was utilized to reduce current tax expense.
The Company has wholly-owned international subsidiaries that have cumulative net losses. The Company believes that it is more likely than not that these subsidiaries will realize future taxable income sufficient to utilize these deferred tax assets.
The following table summarizes the activity related to unrecognized tax benefits:
|
(Dollars in Millions)
|
2016
|
2015
|
2014
|
|||||||
|
Beginning of year
|
$
|
3,080
|
|
2,465
|
|
2,729
|
|
|||
|
Increases related to current year tax positions
|
348
|
|
570
|
|
281
|
|
||||
|
Increases related to prior period tax positions
|
11
|
|
182
|
|
295
|
|
||||
|
Decreases related to prior period tax positions
|
(338
|
)
|
(79
|
)
|
(288
|
)
|
||||
|
Settlements
|
(37
|
)
|
(4
|
)
|
(477
|
)
|
||||
|
Lapse of statute of limitations
|
(23
|
)
|
(54
|
)
|
(75
|
)
|
||||
|
End of year
|
$
|
3,041
|
|
3,080
|
|
2,465
|
|
|||
The unrecognized tax benefits of
$3.0 billion
at
January 1, 2017
, if recognized, would affect the Company’s annual effective tax rate. The Company conducts business and files tax returns in numerous countries and currently has tax audits in progress with a number of tax authorities. The IRS has completed its audit for the tax years through 2009 and is currently auditing the tax years 2010-2012. In other major jurisdictions where the Company conducts business, the years remain open generally back to the year 2004. The Company believes it is possible that audits may be completed by tax authorities in some jurisdictions over the next twelve months. However, the Company is not able to provide a reasonably reliable estimate of the timing of any other future tax payments relating to uncertain tax positions.
The Company classifies liabilities for unrecognized tax benefits and related interest and penalties as long-term liabilities. Interest expense and penalties related to unrecognized tax benefits are classified as income tax expense. The Company recognized after tax interest expense of
$7 million
,
$44 million
and
$12 million
in
2016
,
2015
and
2014
, respectively. The total amount of accrued interest was
$344 million
and
$366 million
in
2016
and
2015
, respectively.
|
56
|
||
|
9.
|
Employee Related Obligations
|
At the end of
2016
and
2015
, employee related obligations recorded on the Consolidated Balance Sheets were:
|
(Dollars in Millions)
|
2016
|
2015
|
|||||
|
Pension benefits
|
$
|
4,710
|
|
3,857
|
|
||
|
Postretirement benefits
|
2,733
|
|
2,738
|
|
|||
|
Postemployment benefits
|
2,050
|
|
2,092
|
|
|||
|
Deferred compensation
|
534
|
|
584
|
|
|||
|
Total employee obligations
|
10,027
|
|
9,271
|
|
|||
|
Less current benefits payable
|
412
|
|
417
|
|
|||
|
Employee related obligations — non-current
|
$
|
9,615
|
|
8,854
|
|
||
Prepaid employee related obligations of
$227 million
and
$256 million
for
2016
and
2015
, respectively, are included in Other assets on the Consolidated Balance Sheets.
|
10.
|
Pensions and Other Benefit Plans
|
The Company sponsors various retirement and pension plans, including defined benefit, defined contribution and termination indemnity plans, which cover most employees worldwide. The Company also provides post-retirement benefits, primarily health care, to all eligible U.S. retired employees and their dependents.
Many international employees are covered by government-sponsored programs and the cost to the Company is not significant.
Retirement plan benefits for employees hired before January 1, 2015 are primarily based on the employee’s compensation during the last
three
to
five
years before retirement and the number of years of service. In 2014, the Company announced that the U.S. Defined Benefit plan was amended to adopt a new benefit formula, effective for employees hired on or after January 1, 2015. The benefits are calculated using a new formula based on employee compensation over total years of service.
International subsidiaries have plans under which funds are deposited with trustees, annuities are purchased under group contracts, or reserves are provided.
The Company does not fund retiree health care benefits in advance and has the right to modify these plans in the future.
In 2016 and 2015 the Company used
December 31, 2016
and
December 31, 2015
, respectively, as the measurement date for all U.S. and international retirement and other benefit plans.
Net periodic benefit costs for the Company’s defined benefit retirement plans and other benefit plans for
2016
,
2015
and
2014
include the following components:
|
|
Retirement Plans
|
Other Benefit Plans
|
|||||||||||||||||
|
(Dollars in Millions)
|
2016
|
2015
|
2014
|
2016
|
2015
|
2014
|
|||||||||||||
|
Service cost
|
$
|
949
|
|
1,037
|
|
882
|
|
224
|
|
257
|
|
211
|
|
||||||
|
Interest cost
|
927
|
|
988
|
|
1,018
|
|
158
|
|
186
|
|
197
|
|
|||||||
|
Expected return on plan assets
|
(1,962
|
)
|
(1,809
|
)
|
(1,607
|
)
|
(6
|
)
|
(7
|
)
|
(7
|
)
|
|||||||
|
Amortization of prior service cost (credit)
|
1
|
|
2
|
|
6
|
|
(34
|
)
|
(33
|
)
|
(34
|
)
|
|||||||
|
Amortization of net transition obligation
|
—
|
|
—
|
|
1
|
|
—
|
|
—
|
|
—
|
|
|||||||
|
Recognized actuarial losses
|
496
|
|
745
|
|
460
|
|
135
|
|
201
|
|
136
|
|
|||||||
|
Curtailments and settlements
|
11
|
|
8
|
|
(17
|
)
|
—
|
|
—
|
|
—
|
|
|||||||
|
Net periodic benefit cost
|
$
|
422
|
|
971
|
|
743
|
|
477
|
|
604
|
|
503
|
|
||||||
Amounts expected to be recognized in net periodic benefit cost in the coming year for the Company’s defined benefit retirement plans and other post-retirement plans:
|
(Dollars in Millions)
|
|
||
|
Amortization of net transition obligation
|
$
|
—
|
|
|
Amortization of net actuarial losses
|
715
|
|
|
|
Amortization of prior service credit
|
28
|
|
|
Unrecognized gains and losses for the U.S. pension plans are amortized over the average remaining future service for each plan. For plans with no active employees, they are amortized over the average life expectancy. The amortization of gains and
|
57
|
||
losses for the other U.S. benefit plans is determined by using a
10%
corridor of the greater of the market value of assets or the accumulated postretirement benefit obligation. Total unamortized gains and losses in excess of the corridor are amortized over the average remaining future service.
Prior service costs/benefits for the U.S. pension plans are amortized over the average remaining future service of plan participants at the time of the plan amendment. Prior service cost/benefit for the other U.S. benefit plans is amortized over the average remaining service to full eligibility age of plan participants at the time of the plan amendment.
The following table represents the weighted-average actuarial assumptions:
|
|
Retirement Plans
|
Other Benefit Plans
|
|||||||||||
|
Worldwide Benefit Plans
|
2016
|
2015
|
2014
|
2016
|
2015
|
2014
|
|||||||
|
Net Periodic Benefit Cost
|
|||||||||||||
|
Service cost discount rate
|
3.98
|
%
|
3.78
|
4.78
|
4.77
|
4.31
|
5.25
|
||||||
|
Interest cost discount rate
|
4.24
|
%
|
3.78
|
4.78
|
4.10
|
4.31
|
5.25
|
||||||
|
Rate of increase in compensation levels
|
4.02
|
%
|
4.05
|
4.08
|
4.32
|
4.11
|
4.29
|
||||||
|
Expected long-term rate of return on plan assets
|
8.55
|
%
|
8.53
|
8.46
|
|||||||||
|
Benefit Obligation
|
|||||||||||||
|
Discount rate
|
3.78
|
%
|
4.11
|
3.78
|
4.42
|
4.63
|
4.31
|
||||||
|
Rate of increase in compensation levels
|
4.02
|
%
|
4.01
|
4.05
|
4.29
|
4.28
|
4.11
|
||||||
The Company’s discount rates are determined by considering current yield curves representing high quality, long-term fixed income instruments. The resulting discount rates are consistent with the duration of plan liabilities. For the fiscal year 2016, the Company changed its methodology in determining service and interest cost from the single weighted average discount rate approach to duration specific spot rates along that yield curve to the plans’ liability cash flows, which management has concluded is a more precise estimate. Prior to this change in methodology, the Company measured service and interest costs utilizing a single weighted-average discount rate derived from the yield curve used to measure the plan obligations. The Company has accounted for this change as a change in accounting estimate and, accordingly, has accounted for it on a prospective basis. This change does not impact the benefit obligation and did not have a material impact to the 2016 full year results.
The expected rates of return on plan asset assumptions represent the Company's assessment of long-term returns on diversified investment portfolios globally. The assessment is determined using projections from external financial sources, long-term historical averages, actual returns by asset class and the various asset class allocations by market.
The following table displays the assumed health care cost trend rates, for all individuals:
|
Health Care Plans
|
2016
|
2015
|
||||
|
Health care cost trend rate assumed for next year
|
6.32
|
%
|
6.60
|
%
|
||
|
Rate to which the cost trend rate is assumed to decline (ultimate trend)
|
4.50
|
%
|
4.50
|
%
|
||
|
Year the rate reaches the ultimate trend rate
|
2038
|
|
2038
|
|
||
A one-percentage-point change in assumed health care cost trend rates would have the following effect:
|
One-Percentage-
|
One-Percentage-
|
||||||
|
(Dollars in Millions)
|
Point Increase
|
Point Decrease
|
|||||
|
Health Care Plans
|
|
|
|
|
|||
|
Total interest and service cost
|
$
|
30
|
|
(23
|
)
|
||
|
Post-retirement benefit obligation
|
$
|
401
|
|
(325
|
)
|
||
|
58
|
||
The following table sets forth information related to the benefit obligation and the fair value of plan assets at year-end
2016
and
2015
for the Company’s defined benefit retirement plans and other post-retirement plans:
|
|
Retirement Plans
|
Other Benefit Plans
|
|||||||||||
|
(Dollars in Millions)
|
2016
|
2015
|
2016
|
2015
|
|||||||||
|
Change in Benefit Obligation
|
|||||||||||||
|
Projected benefit obligation — beginning of year
|
$
|
25,855
|
|
26,889
|
|
4,669
|
|
5,081
|
|
||||
|
Service cost
|
949
|
|
1,037
|
|
224
|
|
257
|
|
|||||
|
Interest cost
|
927
|
|
988
|
|
158
|
|
186
|
|
|||||
|
Plan participant contributions
|
54
|
|
48
|
|
—
|
|
—
|
|
|||||
|
Amendments
|
(48
|
)
|
60
|
|
—
|
|
—
|
|
|||||
|
Actuarial (gains) losses
|
2,302
|
|
(1,578
|
)
|
(73
|
)
|
(400
|
)
|
|||||
|
Divestitures & acquisitions
|
(24
|
)
|
(5
|
)
|
—
|
|
—
|
|
|||||
|
Curtailments, settlements & restructuring
|
(25
|
)
|
(20
|
)
|
—
|
|
(3
|
)
|
|||||
|
Benefits paid from plan*
|
(1,210
|
)
|
(773
|
)
|
(378
|
)
|
(420
|
)
|
|||||
|
Effect of exchange rates
|
(664
|
)
|
(791
|
)
|
5
|
|
(32
|
)
|
|||||
|
Projected benefit obligation — end of year
|
$
|
28,116
|
|
25,855
|
|
4,605
|
|
4,669
|
|
||||
|
Change in Plan Assets
|
|||||||||||||
|
Plan assets at fair value — beginning of year
|
$
|
22,254
|
|
22,575
|
|
74
|
|
79
|
|
||||
|
Actual return on plan assets
|
2,286
|
|
298
|
|
7
|
|
1
|
|
|||||
|
Company contributions
|
838
|
|
752
|
|
372
|
|
414
|
|
|||||
|
Plan participant contributions
|
54
|
|
48
|
|
—
|
|
—
|
|
|||||
|
Settlements
|
(25
|
)
|
(20
|
)
|
—
|
|
—
|
|
|||||
|
Divestitures & acquisitions
|
(24
|
)
|
(5
|
)
|
—
|
|
—
|
|
|||||
|
Benefits paid from plan assets*
|
(1,210
|
)
|
(773
|
)
|
(378
|
)
|
(420
|
)
|
|||||
|
Effect of exchange rates
|
(540
|
)
|
(621
|
)
|
—
|
|
—
|
|
|||||
|
Plan assets at fair value — end of year
|
$
|
23,633
|
|
22,254
|
|
75
|
|
74
|
|
||||
|
Funded status — end of year
|
$
|
(4,483
|
)
|
(3,601
|
)
|
(4,530
|
)
|
(4,595
|
)
|
||||
|
Amounts Recognized in the Company’s Balance Sheet consist of the following:
|
|||||||||||||
|
Non-current assets
|
$
|
227
|
|
256
|
|
—
|
|
—
|
|
||||
|
Current liabilities
|
(86
|
)
|
(77
|
)
|
(315
|
)
|
(324
|
)
|
|||||
|
Non-current liabilities
|
(4,624
|
)
|
(3,780
|
)
|
(4,215
|
)
|
(4,271
|
)
|
|||||
|
Total recognized in the consolidated balance sheet — end of year
|
$
|
(4,483
|
)
|
(3,601
|
)
|
(4,530
|
)
|
(4,595
|
)
|
||||
|
Amounts Recognized in Accumulated Other Comprehensive Income consist of the following:
|
|||||||||||||
|
Net actuarial loss
|
$
|
7,749
|
|
6,501
|
|
1,804
|
|
2,013
|
|
||||
|
Prior service cost (credit)
|
(12
|
)
|
34
|
|
(150
|
)
|
(185
|
)
|
|||||
|
Unrecognized net transition obligation
|
—
|
|
—
|
|
—
|
|
—
|
|
|||||
|
Total before tax effects
|
$
|
7,737
|
|
6,535
|
|
1,654
|
|
1,828
|
|
||||
|
Accumulated Benefit Obligations — end of year
|
$
|
25,319
|
|
23,262
|
|
||||||||
|
*In 2016, the Company offered a voluntary lump-sum payment option below a pre-determined threshold for certain eligible former employees who are vested participants of the U.S. Qualified Defined Benefit Pension Plan. The
distribution of the lump-sums was substantially completed by the end of fiscal 2016. The amount distributed in 2016 was approximately $420 million. These distributions from the plan did not have a material impact on the Company’s financial position.
|
|||||||||||||
|
59
|
||
|
|
Retirement Plans
|
Other Benefit Plans
|
|||||||||||
|
(Dollars in Millions)
|
2016
|
2015
|
2016
|
2015
|
|||||||||
|
Amounts Recognized in Net Periodic Benefit Cost and Other Comprehensive Income
|
|||||||||||||
|
Net periodic benefit cost
|
$
|
422
|
|
971
|
|
477
|
|
604
|
|
||||
|
Net actuarial (gain) loss
|
1,965
|
|
(75
|
)
|
(72
|
)
|
(389
|
)
|
|||||
|
Amortization of net actuarial loss
|
(496
|
)
|
(745
|
)
|
(135
|
)
|
(201
|
)
|
|||||
|
Prior service cost (credit)
|
(48
|
)
|
60
|
|
—
|
|
—
|
|
|||||
|
Amortization of prior service (cost) credit
|
(1
|
)
|
(2
|
)
|
34
|
|
33
|
|
|||||
|
Effect of exchange rates
|
(218
|
)
|
(218
|
)
|
(1
|
)
|
(1
|
)
|
|||||
|
Total recognized in other comprehensive income, before tax
|
$
|
1,202
|
|
(980
|
)
|
(174
|
)
|
(558
|
)
|
||||
|
Total recognized in net periodic benefit cost and other comprehensive income
|
$
|
1,624
|
|
(9
|
)
|
303
|
|
46
|
|
||||
The Company plans to continue to fund its U.S. Qualified Plans to comply with the Pension Protection Act of 2006. International Plans are funded in accordance with local regulations. Additional discretionary contributions are made when deemed appropriate to meet the long-term obligations of the plans. For certain plans, funding is not a common practice, as funding provides no economic benefit. Consequently, the Company has several pension plans that are not funded.
In
2016
, the Company contributed
$501 million
and
$337 million
to its U.S. and international pension plans, respectively.
The following table displays the funded status of the Company's U.S. Qualified & Non-Qualified pension plans and international funded and unfunded pension plans at December 31, 2016 and December 31, 2015, respectively:
|
U.S. Plans
|
International Plans
|
||||||||||||||||
|
Qualified Plans
|
Non-Qualified Plans
|
Funded Plans
|
Unfunded Plans
|
||||||||||||||
|
(Dollars in Millions)
|
2016
|
2015
|
2016
|
2015
|
2016
|
2015
|
2016
|
2015
|
|||||||||
|
Plan Assets
|
$
|
16,057
|
|
15,113
|
|
—
|
|
—
|
|
7,576
|
|
7,141
|
|
—
|
|
—
|
|
|
Projected Benefit Obligation
|
16,336
|
|
15,280
|
|
1,905
|
|
1,675
|
|
9,502
|
|
8,542
|
|
373
|
|
358
|
|
|
|
Accumulated Benefit Obligation
|
14,759
|
|
13,876
|
|
1,568
|
|
1,411
|
|
8,663
|
|
7,661
|
|
329
|
|
314
|
|
|
|
Over (Under) Funded Status
|
|||||||||||||||||
|
Projected Benefit Obligation
|
$
|
(279
|
)
|
(167
|
)
|
(1,905
|
)
|
(1,675
|
)
|
(1,926
|
)
|
(1,401
|
)
|
(373
|
)
|
(358
|
)
|
|
Accumulated Benefit Obligation
|
1,298
|
|
1,237
|
|
(1,568
|
)
|
(1,411
|
)
|
(1,087
|
)
|
(520
|
)
|
(329
|
)
|
(314
|
)
|
|
Plans with accumulated benefit obligations in excess of plan assets have an accumulated benefit obligation, projected benefit obligation and plan assets of
$8.8 billion
,
$9.9 billion
and
$5.6 billion
, respectively, at the end of
2016
, and
$4.5 billion
,
$5.3 billion
and
$1.9 billion
, respectively, at the end of
2015
.
The following table displays the projected future benefit payments from the Company’s retirement and other benefit plans:
|
(Dollars in Millions)
|
2017
|
2018
|
2019
|
2020
|
2021
|
2022-2026
|
|||||||||||||
|
Projected future benefit payments
|
|||||||||||||||||||
|
Retirement plans
|
$
|
897
|
|
908
|
|
958
|
|
1,010
|
|
1,081
|
|
6,416
|
|
||||||
|
Other benefit plans
|
$
|
325
|
|
315
|
|
311
|
|
307
|
|
304
|
|
1,465
|
|
||||||
The following table displays the projected future minimum contributions to the unfunded retirement plans. These amounts do not include any discretionary contributions that the Company may elect to make in the future.
|
(Dollars in Millions)
|
2017
|
2018
|
2019
|
2020
|
2021
|
2022-2026
|
|||||||||||||
|
Projected future contributions
|
$
|
83
|
|
84
|
|
89
|
|
94
|
|
100
|
|
610
|
|
||||||
|
60
|
||
Each pension plan is overseen by a local committee or board that is responsible for the overall administration and investment of the pension plans. In determining investment policies, strategies and goals, each committee or board considers factors including, local pension rules and regulations; local tax regulations; availability of investment vehicles (separate accounts, commingled accounts, insurance funds, etc.); funded status of the plans; ratio of actives to retirees; duration of liabilities; and other relevant factors including: diversification, liquidity of local markets and liquidity of base currency. A majority of the Company’s pension funds are open to new entrants and are expected to be on-going plans. Permitted investments are primarily liquid and/or listed, with little reliance on illiquid and non-traditional investments such as hedge funds.
The Company’s retirement plan asset allocation at the end of
2016
and
2015
and target allocations for
2017
are as follows:
|
Percent of
Plan Assets
|
Target
Allocation
|
||||||||
|
|
2016
|
2015
|
2017
|
||||||
|
Worldwide Retirement Plans
|
|||||||||
|
Equity securities
|
75
|
%
|
79
|
%
|
73
|
%
|
|||
|
Debt securities
|
25
|
|
21
|
|
27
|
|
|||
|
Total plan assets
|
100
|
%
|
100
|
%
|
100
|
%
|
|||
Determination of Fair Value of Plan Assets
The Plan has an established and well-documented process for determining fair values. Fair value is based upon quoted market prices, where available. If listed prices or quotes are not available, fair value is based upon models that primarily use, as inputs, market-based or independently sourced market parameters, including yield curves, interest rates, volatilities, equity or debt prices, foreign exchange rates and credit curves.
While the Plan believes its valuation methods are appropriate and consistent with other market participants, the use of different methodologies or assumptions to determine the fair value of certain financial instruments could result in a different estimate of fair value at the reporting date.
Valuation Hierarchy
The authoritative literature establishes a three-level hierarchy to prioritize the inputs used in measuring fair value. The levels within the hierarchy are described in the table below with Level 1 having the highest priority and Level 3 having the lowest.
A financial instrument’s categorization within the valuation hierarchy is based upon the lowest level of input that is significant to the fair value measurement.
Following is a description of the valuation methodologies used for the investments measured at fair value.
|
•
|
Short-term investments
— Cash and quoted short-term instruments are valued at the closing price or the amount held on deposit by the custodian bank. Other investments are through investment vehicles valued using the Net Asset Value (NAV) provided by the administrator of the fund. The NAV is based on the value of the underlying assets owned by the fund, minus its liabilities, and then divided by the number of shares outstanding. The NAV is a quoted price in a market that is not active and classified as Level 2.
|
|
•
|
Government and agency securities
— A limited number of these investments are valued at the closing price reported on the major market on which the individual securities are traded. Where quoted prices are available in an active market, the investments are classified within Level 1 of the valuation hierarchy. If quoted market prices are not available for the specific security, then fair values are estimated by using pricing models, quoted prices of securities with similar characteristics or discounted cash flows. When quoted market prices for a security are not available in an active market, they are classified as Level 2.
|
|
•
|
Debt instruments
— A limited number of these investments are valued at the closing price reported on the major market on which the individual securities are traded. Where quoted prices are available in an active market, the investments are classified as Level 1. If quoted market prices are not available for the specific security, then fair values are estimated by using pricing models, quoted prices of securities with similar characteristics or discounted cash flows and are classified as Level 2. Level 3 debt instruments are priced based on unobservable inputs.
|
|
•
|
Equity securities
— Common stocks are valued at the closing price reported on the major market on which the individual securities are traded. Substantially all common stock is classified within Level 1 of the valuation hierarchy.
|
|
•
|
Commingled funds
— These investment vehicles are valued using the NAV provided by the fund administrator. The NAV is based on the value of the underlying assets owned by the fund, minus its liabilities, and then divided by the number of shares outstanding. Assets in the Level 2 category have a quoted market price.
|
|
61
|
||
|
•
|
Insurance contracts
— The instruments are issued by insurance companies. The fair value is based on negotiated value and the underlying investments held in separate account portfolios as well as considering the credit worthiness of the issuer. The underlying investments are government, asset-backed and fixed income securities. In general, insurance contracts are classified as Level 3 as there are no quoted prices nor other observable inputs for pricing.
|
|
•
|
Other assets
— Other assets are represented primarily by limited partnerships and real estate investments, as well as commercial loans and commercial mortgages that are not classified as corporate debt. Other assets that are exchange listed and actively traded are classified as Level 1, while inactively traded assets are classified as Level 2.
|
The following table sets forth the Retirement Plans' investments measured at fair value as of December 31, 2016 and December 31, 2015:
|
Quoted Prices
in Active
Markets for
Identical Assets
|
Significant
Other
Observable
Inputs
|
Significant
Unobservable
Inputs
(a)
|
Investments Measured at Net Asset Value
(b)
|
|||||||||||||||||||||||||||
|
|
(Level 1)
|
(Level 2)
|
(Level 3)
|
Total Assets
|
||||||||||||||||||||||||||
|
(Dollars in Millions)
|
2016
|
2015
|
2016
|
2015
|
2016
|
2015
|
2016
|
2015
|
2016
|
2015
|
||||||||||||||||||||
|
Short-term investment funds
|
$
|
145
|
|
184
|
|
652
|
|
312
|
|
—
|
|
—
|
|
—
|
|
—
|
|
797
|
|
496
|
|
|||||||||
|
Government and agency securities
|
—
|
|
—
|
|
2,655
|
|
1,767
|
|
—
|
|
—
|
|
—
|
|
—
|
|
2,655
|
|
1,767
|
|
||||||||||
|
Debt instruments
|
—
|
|
—
|
|
1,237
|
|
1,050
|
|
—
|
|
1
|
|
—
|
|
—
|
|
1,237
|
|
1,051
|
|
||||||||||
|
Equity securities
|
11,433
|
|
11,317
|
|
12
|
|
11
|
|
—
|
|
—
|
|
—
|
|
—
|
|
11,445
|
|
11,328
|
|
||||||||||
|
Commingled funds
|
—
|
|
—
|
|
1,316
|
|
1,100
|
|
—
|
|
—
|
|
5,767
|
|
6,122
|
|
7,083
|
|
7,222
|
|
||||||||||
|
Insurance contracts
|
—
|
|
—
|
|
—
|
|
—
|
|
24
|
|
23
|
|
—
|
|
—
|
|
24
|
|
23
|
|
||||||||||
|
Other assets
|
—
|
|
—
|
|
—
|
|
107
|
|
—
|
|
—
|
|
392
|
|
260
|
|
392
|
|
367
|
|
||||||||||
|
Investments at fair value
|
$
|
11,578
|
|
11,501
|
|
5,872
|
|
4,347
|
|
24
|
|
24
|
|
6,159
|
|
6,382
|
|
23,633
|
|
22,254
|
|
|||||||||
(a)
The activity for the Level 3 assets is not significant for all years presented.
(b)
Per adoption of ASU 2015-07, certain investments that are measured at fair value using the net asset value per share (or its equivalent) practical expedient have not been classified in the fair value hierarchy. As per ASU 2015-7 prior year amounts have been reclassified to conform to the current year presentation. The fair value amounts presented in this table are intended to permit reconciliation of the fair value hierarchy to the total retirement plan assets.
The Company's Other Benefit Plans are unfunded except for U.S. commingled funds (Level 2) of
$75 million
and
$74 million
at December 31, 2016 and December 31, 2015, respectively.
The fair value of Johnson & Johnson Common Stock directly held in plan assets was
$847 million
(
3.6%
of total plan assets) at December 31, 2016 and
$751 million
(
3.4%
of total plan assets) at December 31, 2015.
|
11.
|
Savings Plan
|
The Company has voluntary 401(k) savings plans designed to enhance the existing retirement programs covering eligible employees. The Company matches a percentage of each employee’s contributions consistent with the provisions of the plan for which he/she is eligible. Total Company matching contributions to the plans were
$191 million
,
$187 million
and
$172 million
in
2016
,
2015
and
2014
, respectively.
|
62
|
||
|
12.
|
Capital and Treasury Stock
|
Changes in treasury stock were:
|
Treasury Stock
|
|||||||
|
(Amounts in Millions Except Treasury Stock Shares in Thousands)
|
Shares
|
Amount
|
|||||
|
Balance at December 29, 2013
|
299,215
|
|
$
|
15,700
|
|
||
|
Employee compensation and stock option plans
|
(32,302
|
)
|
(2,933
|
)
|
|||
|
Repurchase of common stock
|
69,707
|
|
7,124
|
|
|||
|
Balance at December 28, 2014
|
336,620
|
|
19,891
|
|
|||
|
Employee compensation and stock option plans
|
(24,413
|
)
|
(2,497
|
)
|
|||
|
Repurchase of common stock
|
52,474
|
|
5,290
|
|
|||
|
Balance at January 3, 2016
|
364,681
|
|
22,684
|
|
|||
|
Employee compensation and stock option plans
|
(30,839
|
)
|
(3,311
|
)
|
|||
|
Repurchase of common stock
|
79,490
|
|
8,979
|
|
|||
|
Balance at January 1, 2017
|
413,332
|
|
$
|
28,352
|
|
||
Aggregate shares of common stock issued were approximately
3,119,843,000
shares at the end of
2016
,
2015
and
2014
.
Cash dividends paid were
$3.15
per share in
2016
, compared with dividends of
$2.95
per share in
2015
, and
$2.76
per share in
2014
.
On October 13, 2015, the Company announced that its Board of Directors approved a share repurchase program, authorizing the Company to purchase up to
$10.0 billion
of the Company's shares of common stock. The repurchase program has no time limit and may be suspended for periods or discontinued at any time. Any shares acquired will be available for general corporate purposes. The Company intends to finance the share repurchase program through available cash and access to the capital markets. As of January 1, 2017,
$7.3 billion
has been repurchased under the program.
On July 21, 2014, the Company announced that its Board of Directors approved a share repurchase program, authorizing the Company to purchase up to
$5.0 billion
of the Company's shares of common stock. This share repurchase program was completed on April 28, 2015.
|
13.
|
Accumulated Other Comprehensive Income
|
Components of other comprehensive income (loss) consist of the following:
|
(Dollars in Millions)
|
Foreign
Currency Translation |
Gain/(Loss) On Securities
|
Employee Benefit Plans
|
Gain/
(Loss) On Derivatives & Hedges |
Total
Accumulated Other Comprehensive Income (Loss) |
|||||||||||
|
December 29, 2013
|
$
|
(202
|
)
|
106
|
|
(3,009
|
)
|
245
|
|
(2,860
|
)
|
|||||
|
Net 2014 changes
|
(4,601
|
)
|
151
|
|
(3,308
|
)
|
(104
|
)
|
(7,862
|
)
|
||||||
|
December 28, 2014
|
(4,803
|
)
|
257
|
|
(6,317
|
)
|
141
|
|
(10,722
|
)
|
||||||
|
Net 2015 changes
|
(3,632
|
)
|
347
|
|
1,019
|
|
(177
|
)
|
(2,443
|
)
|
||||||
|
January 3, 2016
|
(8,435
|
)
|
604
|
|
(5,298
|
)
|
(36
|
)
|
(13,165
|
)
|
||||||
|
Net 2016 changes
|
(612
|
)
|
(193
|
)
|
(682
|
)
|
(249
|
)
|
(1,736
|
)
|
||||||
|
January 1, 2017
|
$
|
(9,047
|
)
|
411
|
|
(5,980
|
)
|
(285
|
)
|
(14,901
|
)
|
|||||
Amounts in accumulated other comprehensive income are presented net of the related tax impact. Foreign currency translation is not adjusted for income taxes where it relates to permanent investments in international subsidiaries. For additional details on comprehensive income see the Consolidated Statements of Comprehensive Income.
Details on reclassifications out of Accumulated Other Comprehensive Income:
Gain/(Loss) On Securities - reclassifications released to Other (income) expense, net.
Employee Benefit Plans - reclassifications are included in net periodic benefit cost. See Note 10 for additional details.
Gain/(Loss) On Derivatives & Hedges - reclassifications to earnings are recorded in the same account as the hedged transaction. See Note 6 for additional details.
|
63
|
||
|
14.
|
International Currency Translation
|
For translation of its subsidiaries operating in non-U.S. Dollar currencies, the Company has determined that the local currencies of its international subsidiaries are the functional currencies except those in highly inflationary economies, which are defined as those which have had compound cumulative rates of inflation of
100% or more during the past three years
, or where a substantial portion of its cash flows are not in the local currency.
In consolidating international subsidiaries, balance sheet currency effects are recorded as a component of accumulated other comprehensive income. This equity account includes the results of translating certain balance sheet assets and liabilities at current exchange rates and some accounts at historical rates, except for those located in highly inflationary economies. The translation of balance sheet accounts for highly inflationary economies are reflected in the operating results.
A rollforward of the changes during
2016
,
2015
and
2014
for foreign currency translation adjustments is included in Note 13.
Net currency transaction gains and losses included in Other (income) expense were losses of
$289 million
,
$104 million
and
$156 million
in
2016
,
2015
and
2014
, respectively.
|
15.
|
Earnings Per Share
|
The following is a reconciliation of basic net earnings per share to diluted net earnings per share for the fiscal years ended
January 1, 2017
,
January 3, 2016
and
December 28, 2014
:
|
(In Millions Except Per Share Amounts)
|
2016
|
2015
|
2014
|
|||||||
|
Basic net earnings per share
|
$
|
6.04
|
|
5.56
|
|
5.80
|
|
|||
|
Average shares outstanding — basic
|
2,737.3
|
|
2,771.8
|
|
2,815.2
|
|
||||
|
Potential shares exercisable under stock option plans
|
142.4
|
|
141.5
|
|
142.6
|
|
||||
|
Less: shares repurchased under treasury stock method
|
(92.1
|
)
|
(102.6
|
)
|
(96.5
|
)
|
||||
|
Convertible debt shares
|
1.3
|
|
2.2
|
|
2.6
|
|
||||
|
Adjusted average shares outstanding — diluted
|
2,788.9
|
|
2,812.9
|
|
2,863.9
|
|
||||
|
Diluted net earnings per share
|
$
|
5.93
|
|
5.48
|
|
5.70
|
|
|||
The diluted net earnings per share calculation included the dilutive effect of convertible debt that is offset by the related reduction in interest expense of
$2 million
after-tax for year 2016, and
$3 million
for years 2015 and
2014
.
The diluted net earnings per share calculation for 2016, 2015 and 2014 included all shares related to stock options, as the exercise price of all options was less than the average market value of the Company's stock.
|
16.
|
Rental Expense and Lease Commitments
|
Rentals of space, vehicles, manufacturing equipment and office and data processing equipment under operating leases were approximately
$330 million
,
$316 million
and
$341 million
in
2016
,
2015
and
2014
, respectively.
The approximate minimum rental payments required under operating leases that have initial or remaining non-cancelable lease terms in excess of one year at
January 1, 2017
are:
(Dollars in Millions)
|
2017
|
2018
|
2019
|
2020
|
2021
|
After 2021
|
Total
|
||||||
|
$216
|
179
|
134
|
105
|
88
|
100
|
822
|
||||||
Commitments under capital leases are not significant.
|
17.
|
Common Stock, Stock Option Plans and Stock Compensation Agreements
|
At
January 1, 2017
, the Company had
2
stock-based compensation plans. The shares outstanding are for contracts under the Company's 2005 Long-Term Incentive Plan and the 2012 Long-Term Incentive Plan. The 2005 Long-Term Incentive Plan expired April 26, 2012. All options and restricted shares granted subsequent to that date were under the 2012 Long-Term Incentive Plan. Under the 2012 Long-Term Incentive Plan, the Company may issue up to
650 million
shares of common stock, plus any shares canceled, expired, forfeited, or not issued from the 2005 Long-Term Incentive Plan subsequent to April 26, 2012. Shares available for future grants under the 2012 Long-Term Incentive Plan were
439 million
at the end of
2016
.
The compensation cost that has been charged against income for these plans was
$878 million
,
$874 million
and
$792 million
for
2016
,
2015
and
2014
, respectively. The total income tax benefit recognized in the income statement for share-based compensation costs was
$256 million
,
$253 million
and
$259 million
for
2016
,
2015
and
2014
, respectively. An additional tax benefit of
$353 million
was recognized in 2016 due to the adoption of a new accounting standard for the reporting of additional
|
64
|
||
tax benefits on share-based compensation as described in Note 1. The total unrecognized compensation cost was
$749 million
,
$744 million
and
$722 million
for
2016
,
2015
and
2014
, respectively. The weighted average period for this cost to be recognized was
1.09
years,
0.98
years and
1.18
years for
2016
,
2015
, and
2014
, respectively. Share-based compensation costs capitalized as part of inventory were insignificant in all periods.
The Company settles employee benefit equity issuances with treasury shares. Treasury shares are replenished throughout the year for the number of shares used to settle employee benefit equity issuances.
Stock Options
Stock options expire
10
years from the date of grant and vest over service periods that range from
6 months
to
4 years
. All options are granted at the average of the high and low prices of the Company’s Common Stock on the New York Stock Exchange on the date of grant.
The fair value of each option award was estimated on the date of grant using the Black-Scholes option valuation model that uses the assumptions noted in the following table. For 2014 grants, expected volatility represents a blended rate of 4-year daily historical average volatility rate, and a 5-week average implied volatility rate based on at-the-money traded Johnson & Johnson options with a life of 2 years. For 2016 and 2015 grants, expected volatility represents a blended rate of 10-year weekly historical overall volatility rate, and a 5-week average implied volatility rate based on at-the-money traded Johnson & Johnson options with a life of 2 years. For all grants, historical data is used to determine the expected life of the option. The risk-free rate was based on the U.S. Treasury yield curve in effect at the time of grant.
The average fair value of options granted was
$10.01
,
$10.68
and
$8.42
, in
2016
,
2015
and
2014
, respectively. The fair value was estimated based on the weighted average assumptions of:
|
2016
|
2015
|
2014
|
||||||
|
Risk-free rate
|
1.51
|
%
|
1.77
|
%
|
1.87
|
%
|
||
|
Expected volatility
|
15.76
|
%
|
15.48
|
%
|
14.60
|
%
|
||
|
Expected life (in years)
|
7.0
|
|
7.0
|
|
6.0
|
|
||
|
Expected dividend yield
|
3.10
|
%
|
2.90
|
%
|
3.10
|
%
|
||
A summary of option activity under the Plan as of
January 1, 2017
,
January 3, 2016
and
December 28, 2014
, and changes during the years ending on those dates is presented below:
|
(Shares in Thousands)
|
Outstanding Shares
|
Weighted
Average Exercise Price
|
Aggregate
Intrinsic
Value
(Dollars in Millions)
|
||||||||
|
Shares at December 29, 2013
|
119,556
|
|
$
|
64.70
|
|
$
|
3,306
|
|
|||
|
Options granted
|
24,356
|
|
90.44
|
|
|||||||
|
Options exercised
|
(25,319
|
)
|
62.31
|
|
|||||||
|
Options canceled/forfeited
|
(2,881
|
)
|
75.48
|
|
|||||||
|
Shares at December 28, 2014
|
115,712
|
|
70.37
|
|
4,014
|
|
|||||
|
Options granted
|
20,484
|
|
100.06
|
|
|||||||
|
Options exercised
|
(16,683
|
)
|
62.53
|
|
|||||||
|
Options canceled/forfeited
|
(2,996
|
)
|
82.22
|
|
|||||||
|
Shares at January 3, 2016
|
116,517
|
|
76.41
|
|
3,065
|
|
|||||
|
Options granted
|
22,491
|
|
101.87
|
|
|||||||
|
Options exercised
|
(22,547
|
)
|
65.66
|
|
|||||||
|
Options canceled/forfeited
|
(3,006
|
)
|
92.83
|
|
|||||||
|
Shares at January 1, 2017
|
113,455
|
|
$
|
83.16
|
|
$
|
3,636
|
|
|||
The total intrinsic value of options exercised was
$980 million
,
$644 million
and
$954 million
in
2016
,
2015
and
2014
, respectively.
|
65
|
||
The following table summarizes stock options outstanding and exercisable at
January 1, 2017
:
|
(Shares in Thousands)
|
Outstanding
|
Exercisable
|
||||||||||
|
Exercise Price Range
|
Options
|
Average Life
(1)
|
Average Exercise Price
|
Options
|
Average Exercise Price
|
|||||||
|
$52.13-$58.33
|
7,361
|
|
2.1
|
$58.32
|
7,361
|
|
$58.32
|
|||||
|
$58.34-$62.20
|
11,297
|
|
2.4
|
$61.95
|
11,297
|
|
$61.95
|
|||||
|
$62.62-$65.62
|
14,380
|
|
3.1
|
$64.24
|
14,380
|
|
$64.24
|
|||||
|
$66.07-$72.54
|
18,127
|
|
6.0
|
$72.52
|
17,241
|
|
$72.52
|
|||||
|
$90.44-$101.87
|
62,290
|
|
8.1
|
$97.40
|
135
|
|
$93.73
|
|||||
|
|
113,455
|
|
6.2
|
$83.16
|
50,414
|
|
$65.77
|
|||||
(1)
Average contractual life remaining in years.
Stock options outstanding at
January 3, 2016
and
December 28, 2014
were
116,517
and an average life of
5.9
years and
115,712
and an average life of
5.7
years, respectively. Stock options exercisable at
January 3, 2016
and
December 28, 2014
were
48,345
at an average price of
$62.26
and
57,846
at an average price of
$61.94
, respectively.
Restricted Share Units and Performance Share Units
The Company grants restricted share units which vest over service periods that range from
6 months
to
3 years
. The Company also grants performance share units, which are paid in shares of Johnson & Johnson Common Stock after the end of a
three
-year performance period. Whether any performance share units vest, and the amount that does vest, is tied to the completion of service periods that range from
6 months
to
3 years
and the achievement, over a
three
-year period, of three equally-weighted goals that directly align with or help drive long-term total shareholder return: operational sales, adjusted operational earnings per share, and relative total shareholder return. The number of shares actually earned at the end of the
three
-year period will vary, based only on actual performance, from
0%
to
200%
of the target number of performance share units granted
.
A summary of the restricted share units and performance share units activity under the Plans as of
January 1, 2017
is presented below:
|
(Shares in Thousands)
|
Outstanding Restricted Share Units
|
Outstanding Performance Share Units
|
||||
|
Shares at December 29, 2013
|
30,617
|
|
1,535
|
|
||
|
Granted
|
8,487
|
|
1,113
|
|
||
|
Issued
|
(9,685
|
)
|
(19
|
)
|
||
|
Canceled/forfeited
|
(1,726
|
)
|
(98
|
)
|
||
|
Shares at December 28, 2014
|
27,693
|
|
2,531
|
|
||
|
Granted
|
7,637
|
|
931
|
|
||
|
Issued
|
(10,164
|
)
|
(285
|
)
|
||
|
Canceled/forfeited
|
(1,281
|
)
|
(99
|
)
|
||
|
Shares at January 3, 2016
|
23,885
|
|
3,078
|
|
||
|
Granted
|
7,173
|
|
958
|
|
||
|
Issued
|
(8,913
|
)
|
(1,437
|
)
|
||
|
Canceled/forfeited
|
(1,084
|
)
|
(184
|
)
|
||
|
Shares at January 1, 2017
|
21,061
|
|
2,415
|
|
||
The average fair value of the restricted share units granted was
$92.45
,
$91.65
and
$83.01
in
2016
,
2015
and
2014
, respectively, using the fair market value at the date of grant. The fair value of restricted share units was discounted for dividends, which are not paid on the restricted share units during the vesting period. The fair value of restricted share units issued was
$587.7 million
,
$597.6 million
and
$541.0 million
in
2016
,
2015
and
2014
, respectively.
The weighted average fair value of the performance share units granted was
$105.30
,
$93.54
and
$85.94
in
2016
,
2015
and
2014
, calculated using the weighted average fair market value for each of the three component goals at the date of grant.
|
66
|
||
The fair values for the sales and earnings per share goals of each performance share unit were estimated on the date of grant using the fair market value of the shares at the time of the award discounted for dividends, which are not paid on the performance share units during the vesting period. The fair value for the relative total shareholder return goal of each performance share unit was estimated on the date of grant using the Monte Carlo valuation model. The fair value of performance share units issued was
$127.7 million
,
$16.7 million
and
$1.4 million
in
2016
,
2015
and
2014
, respectively.
|
18.
|
Segments of Business and Geographic Areas
|
|
|
Sales to Customers
|
|||||||||
|
(Dollars in Millions)
|
2016
|
2015
|
2014
|
|||||||
|
Consumer —
|
||||||||||
|
United States
|
$
|
5,420
|
|
5,222
|
|
5,096
|
|
|||
|
International
|
7,887
|
|
8,285
|
|
9,400
|
|
||||
|
Total
|
13,307
|
|
13,507
|
|
14,496
|
|
||||
|
Pharmaceutical —
|
||||||||||
|
United States
|
20,125
|
|
18,333
|
|
17,432
|
|
||||
|
International
|
13,339
|
|
13,097
|
|
14,881
|
|
||||
|
Total
|
33,464
|
|
31,430
|
|
32,313
|
|
||||
|
Medical Devices —
|
||||||||||
|
United States
|
12,266
|
|
12,132
|
|
12,254
|
|
||||
|
International
|
12,853
|
|
13,005
|
|
15,268
|
|
||||
|
Total
|
25,119
|
|
25,137
|
|
27,522
|
|
||||
|
Worldwide total
|
$
|
71,890
|
|
70,074
|
|
74,331
|
|
|||
|
|
Income Before Tax
|
Identifiable Assets
|
|||||||||||||||
|
(Dollars in Millions)
|
2016
(3)
|
2015
(4)
|
2014
(5)
|
2016
|
2015
|
||||||||||||
|
Consumer
|
$
|
2,441
|
|
1,787
|
|
1,941
|
|
$
|
23,971
|
|
20,772
|
|
|||||
|
Pharmaceutical
|
12,827
|
|
11,734
|
|
11,696
|
|
27,477
|
|
26,144
|
|
|||||||
|
Medical Devices
|
5,578
|
|
6,826
|
|
7,953
|
|
39,773
|
|
40,979
|
|
|||||||
|
Total
|
20,846
|
|
20,347
|
|
21,590
|
|
91,221
|
|
87,895
|
|
|||||||
|
Less: Expense not allocated to segments
(1)
|
1,043
|
|
1,151
|
|
1,027
|
|
|||||||||||
|
General corporate
(2)
|
49,987
|
|
45,516
|
|
|||||||||||||
|
Worldwide total
|
$
|
19,803
|
|
19,196
|
|
20,563
|
|
$
|
141,208
|
|
133,411
|
|
|||||
|
Additions to Property,
Plant & Equipment
|
Depreciation and
Amortization
|
|||||||||||||||||||
|
(Dollars in Millions)
|
2016
|
2015
|
2014
|
2016
|
2015
|
2014
|
||||||||||||||
|
Consumer
|
$
|
486
|
|
544
|
|
581
|
|
$
|
608
|
|
559
|
|
577
|
|
||||||
|
Pharmaceutical
|
927
|
|
1,063
|
|
977
|
|
886
|
|
929
|
|
1,053
|
|
||||||||
|
Medical Devices
|
1,472
|
|
1,631
|
|
1,807
|
|
1,928
|
|
1,945
|
|
1,974
|
|
||||||||
|
Segments total
|
2,885
|
|
3,238
|
|
3,365
|
|
3,422
|
|
3,433
|
|
3,604
|
|
||||||||
|
General corporate
|
341
|
|
225
|
|
349
|
|
332
|
|
313
|
|
291
|
|
||||||||
|
Worldwide total
|
$
|
3,226
|
|
3,463
|
|
3,714
|
|
$
|
3,754
|
|
3,746
|
|
3,895
|
|
||||||
|
67
|
||
|
|
Sales to Customers
|
Long-Lived Assets
(6)
|
|||||||||||||||
|
(Dollars in Millions)
|
2016
|
2015
|
2014
|
2016
|
2015
|
||||||||||||
|
United States
|
$
|
37,811
|
|
35,687
|
|
34,782
|
|
$
|
36,934
|
|
36,609
|
|
|||||
|
Europe
|
15,770
|
|
15,995
|
|
18,947
|
|
21,996
|
|
20,167
|
|
|||||||
|
Western Hemisphere excluding U.S.
|
5,734
|
|
6,045
|
|
7,160
|
|
2,961
|
|
2,881
|
|
|||||||
|
Asia-Pacific, Africa
|
12,575
|
|
12,347
|
|
13,442
|
|
2,512
|
|
2,493
|
|
|||||||
|
Segments total
|
71,890
|
|
70,074
|
|
74,331
|
|
64,403
|
|
62,150
|
|
|||||||
|
General corporate
|
1,190
|
|
1,148
|
|
|||||||||||||
|
Other non long-lived assets
|
75,615
|
|
70,113
|
|
|||||||||||||
|
Worldwide total
|
$
|
71,890
|
|
70,074
|
|
74,331
|
|
$
|
141,208
|
|
133,411
|
|
|||||
See Note 1 for a description of the segments in which the Company operates.
Export sales are not significant. In 2016, the Company had two wholesalers distributing products for all three segments that represented approximately
13.5%
and
10.7%
of the total consolidated revenues. In 2015 and 2014, the Company had one wholesaler distributing products for all three segments that represented approximately
12.5%
and
11.0%
, respectively, of the total consolidated revenues.
|
(1)
|
Amounts not allocated to segments include interest (income) expense and general corporate (income) expense.
|
|
(2)
|
General corporate includes cash, cash equivalents and marketable securities.
|
|
(3)
|
Includes net litigation expense of
$806 million
and a restructuring related charge of
$685 million
in the Medical Devices segment. The Pharmaceutical segment includes a positive adjustment of
$0.5 billion
to previous reserve estimates, an in-process research and development expense of
$29 million
, and gains from the divestitures of the controlled substance raw material and active pharmaceutical ingredient (API) business and certain anesthetic products in Europe.
|
|
(4)
|
The Medical Devices segment includes a restructuring related charge of
$590 million
, an intangible asset write-down of
$346 million
related to Acclarent, Synthes integration costs of
$196 million
and
$148 million
expense for the cost associated with the DePuy ASR
TM
Hip program. Includes
$224 million
of in-process research and development expense, comprised of
$214 million
and
$10 million
in the Pharmaceutical and Medical Devices segments, respectively. Includes net litigation expense of
$141 million
comprised of
$136 million
in the Pharmaceutical segment and
$5 million
in the Medical Devices segment, which included the gain from the litigation settlement agreement with Guidant for
$600 million
. The Medical Devices Segment includes a gain of
$1.3 billion
from the divestiture of the Cordis business. The Pharmaceutical segment includes a gain of
$981 million
from the U.S. divestiture of NUCYNTA
®
and a positive adjustment of
$0.5 billion
to previous reserve estimates, including Managed Medicaid rebates. The Consumer segment includes a gain of
$229 million
from the divestiture of SPLENDA
®
brand.
|
|
(5)
|
Includes net litigation expense of
$1,253 million
comprised of
$907 million
,
$259 million
and
$87 million
in the Medical Devices, Pharmaceutical and Consumer segments, respectively. Includes
$178 million
of in-process research and development expense, comprised of
$147 million
and
$31 million
in the Pharmaceutical and Medical Devices segments, respectively. The Medical Devices segment includes a net gain of
$1,899 million
from the divestiture of the Ortho-Clinical Diagnostics business, Synthes integration costs of
$754 million
and
$126 million
expense for the cost associated with the DePuy ASR
TM
Hip program. The Pharmaceutical segment includes an additional year of the Branded Prescription Drug Fee of
$220 million
and a positive adjustment of
$0.1 billion
to previous reserve estimates.
|
|
(6)
|
Long-lived assets include property, plant and equipment, net for
2016
, and
2015
of
$15,912
and
$15,905
, respectively, and intangible assets and goodwill, net for
2016
and
2015
of
$49,681
and
$47,393
, respectively.
|
|
68
|
||
|
19.
|
Selected Quarterly Financial Data (unaudited)
|
Selected unaudited quarterly financial data for the years
2016
and
2015
are summarized below:
|
|
2016
|
2015
|
|||||||||||||||||||||||
|
(Dollars in Millions Except Per Share Data)
|
First Quarter
(1)
|
Second Quarter
(2)
|
Third Quarter
(3)
|
Fourth Quarter
(4)
|
First Quarter
(5)
|
Second Quarter
(6)
|
Third Quarter
(7)
|
Fourth Quarter
(8)
|
|||||||||||||||||
|
Segment sales to customers
|
|
|
|
|
|
|
|
|
|
|
|
|
|
|
|
|
|||||||||
|
Consumer
|
$
|
3,195
|
|
3,419
|
|
3,261
|
|
3,432
|
|
3,390
|
|
3,483
|
|
3,314
|
|
3,320
|
|
||||||||
|
Pharmaceutical
|
8,178
|
|
8,654
|
|
8,400
|
|
8,232
|
|
7,726
|
|
7,946
|
|
7,694
|
|
8,064
|
|
|||||||||
|
Medical Devices
|
6,109
|
|
6,409
|
|
6,159
|
|
6,442
|
|
6,258
|
|
6,358
|
|
6,094
|
|
6,427
|
|
|||||||||
|
Total sales
|
17,482
|
|
18,482
|
|
17,820
|
|
18,106
|
|
17,374
|
|
17,787
|
|
17,102
|
|
17,811
|
|
|||||||||
|
Gross profit
|
12,153
|
|
13,146
|
|
12,334
|
|
12,572
|
|
12,092
|
|
12,430
|
|
11,878
|
|
12,138
|
|
|||||||||
|
Earnings before provision for taxes on income
|
5,294
|
|
4,904
|
|
5,281
|
|
4,324
|
|
5,575
|
|
5,741
|
|
4,122
|
|
3,758
|
|
|||||||||
|
Net earnings
|
4,457
|
|
3,997
|
|
4,272
|
|
3,814
|
|
4,320
|
|
4,516
|
|
3,358
|
|
3,215
|
|
|||||||||
|
Basic net earnings per share
|
$
|
1.62
|
|
1.46
|
|
1.56
|
|
1.41
|
|
1.55
|
|
1.63
|
|
1.21
|
|
1.16
|
|
||||||||
|
Diluted net earnings per share
|
$
|
1.59
|
|
1.43
|
|
1.53
|
|
1.38
|
|
1.53
|
|
1.61
|
|
1.20
|
|
1.15
|
|
||||||||
|
(1)
|
The first quarter has been recast to reflect the adoption of ASU 2016-09. See Note 1 to the Consolidated Financial Statements for more details. The first quarter of 2016 includes a restructuring charge of
$120 million
after-tax (
$137 million
before-tax) and net litigation expense of
$56 million
after-tax (
$66 million
before-tax).
|
|
(2)
|
The second quarter of 2016 includes a restructuring charge of
$97 million
after-tax (
$141 million
before-tax) and net litigation expense of
$493 million
after-tax (
$600 million
before-tax).
|
|
(3)
|
The third quarter of 2016 includes a restructuring charge of
$76 million
after-tax (
$109 million
before-tax) and net litigation expense of
$46 million
after-tax (
$55 million
before-tax).
|
|
(4)
|
The fourth quarter of 2016 includes a restructuring charge of
$251 million
after-tax (
$298 million
before-tax) and net litigation expense of
$80 million
after-tax (
$96 million
before-tax).
|
|
(5)
|
The first quarter of 2015 includes a net litigation gain of
$253 million
after-tax (
$402 million
before-tax) and
$122 million
after-tax (
$139 million
before-tax) for costs associated with the DePuy ASR
TM
Hip program.
|
|
(6)
|
The second quarter of 2015 includes net litigation expense of
$23 million
after-tax (
$134 million
before-tax).
|
|
(7)
|
The third quarter of 2015 includes net litigation expense of
$348 million
after-tax (
$409 million
before-tax).
|
|
(8)
|
The fourth quarter of 2015 includes a restructuring charge of
$415 million
after-tax (
$590 million
before-tax),
$156 million
after-tax (
$214 million
before-tax) from impairment of in-process research and development and Synthes integration costs of
$59 million
after-tax (
$83 million
before-tax). Additionally, the fourth quarter of 2015 includes the gain on the Cordis divestiture.
|
|
69
|
||
|
20.
|
Business Combinations and Divestitures
|
Certain businesses were acquired for
$4,509 million
in cash and
$77 million
of liabilities assumed during 2016. These acquisitions were accounted for using the acquisition method and, accordingly, results of operations have been included in the financial statements from their respective dates of acquisition.
The 2016 acquisitions primarily included: Vogue International LLC, a privately-held company focused on the marketing, development and distribution of salon-influenced and nature inspired hair care and other personal products; NeuWave Medical, Inc., a privately-held medical device company that manufactures and markets minimally invasive soft tissue microwave ablation systems; NeoStrata Company, Inc., a global leader in dermocosmetics, and the global rights for the commercialization of RHINOCORT
®
allergy spray outside the United States.
The excess of purchase price over the estimated fair value of tangible assets acquired amounted to
$4,077 million
and has been assigned to identifiable intangible assets, with any residual recorded to goodwill.
The net purchase price for Vogue International LLC of
$3.3 billion
was primarily recorded as amortizable intangible assets for
$2.3 billion
and goodwill for
$1.1 billion
. The weighted average life for the
$2.3 billion
of total amortizable intangibles is approximately
22 years
. The trademark asset values were determined to have definite lives ranging from
10
to
22
years, with the majority being
22
years. The goodwill is primarily attributable to synergies expected to arise from the business acquisition and is expected to be deductible for tax purposes. The assets acquired were recorded in the Consumer segment.
During the fiscal third quarter of 2016, the Company announced a definitive agreement to acquire Abbott Medical Optics (AMO), a wholly-owned subsidiary of Abbott Laboratories, for
$4.325 billion
in cash. The acquisition will include ophthalmic products related to: cataract surgery, laser refractive surgery and consumer eye health. The transaction closed on February 27, 2017. The purchase price allocation is in progress and is expected to result in an allocation of significant value to the amortizable intangible assets with any residual recorded as goodwill.
On January 26, 2017, subsequent to year end, the Company announced a definitive transaction agreement under which the company will launch an all-cash tender offer in Switzerland to acquire all of the outstanding shares of Actelion Ltd. for
$280
per share, payable in U.S. dollars, for approximately
$30.0 billion
. As part of the transaction, immediately prior to the completion of the acquisition, Actelion will spin out its drug discovery operations and early-stage clinical development assets into a newly created Swiss biopharmaceutical company ("R&D NewCo"). The shares of R&D NewCo, which will be listed on the SIX Swiss Exchange (SIX), will be distributed to Actelion's shareholders as a stock dividend upon closing of the tender. The Company will initially hold
16%
of the shares of R&D NewCo and have rights to an additional
16%
of R&D NewCo equity through a convertible note. Actelion has established a leading franchise of differentiated, innovative products for pulmonary arterial hypertension (PAH) that is highly complementary to the existing portfolio of the Company. The addition of Actelion’s specialty in-market medicines and late-stage products is consistent with the Company's efforts to grow in attractive and complementary therapeutic areas and serve patients with serious illnesses and significant unmet medical need. The closing is subject to the demerger, antitrust clearance and other customary closing conditions.
On February 15, 2017, subsequent to year end, the Company received a binding offer from Integra LifeSciences Holdings Corporation to purchase the Codman Neurosurgery business for approximately
$1.0 billion
.
Subsequent to year end, the Company announced it is engaging in a process to evaluate potential strategic options for the Johnson & Johnson Diabetes Care Companies, specifically LifeScan, Inc., Animas Corporation, and Calibra Medical, Inc. Strategic options may include the formation of operating partnerships, joint ventures or strategic alliances, a sale of the businesses, or other alternatives either separately or together. All options will be evaluated to determine the best opportunity to drive future growth and maximize shareholder value. There can be no assurance that this process will result in any transaction or other strategic alternative of any kind therefore, there were no assets held for sale as of January 1, 2017 related to the announcement.
Certain businesses were acquired for
$954 million
in cash and
$220 million
of liabilities assumed during 2015. The assumed liabilities primarily represent the fair value of the contingent consideration of
$210 million
. These acquisitions were accounted for using the acquisition method and, accordingly, results of operations have been included in the financial statements from their respective dates of acquisition.
The 2015 acquisitions primarily included: XO1 Limited, a privately-held biopharmaceutical company developing an anti-thrombin antibody and Novira Therapeutics, Inc., a privately held clinical-stage biopharmaceutical company developing innovative therapies for curative treatment of chronic hepatitis B virus infection.
The excess of purchase price over the estimated fair value of tangible assets acquired amounted to
$1,173 million
and has been assigned to identifiable intangible assets, with any residual recorded to goodwill. Of this amount, approximately
$839 million
has been identified as the value of IPR&D primarily associated with the acquisitions of XO1 Limited and Novira Therapeutics, Inc. The value of the IPR&D was calculated using cash flow projections discounted for the inherent risk in the projects.
The IPR&D related to the acquisition of XO1 Limited of
$360 million
is associated with a recombinant human antibody developed to mimic the activity of a human antibody which appears to produce an anticoagulated state without predisposition to bleeding. A probability of success factor of
36.0%
was used to reflect inherent clinical and regulatory risk. The discount rate applied was
11.75%
.
|
70
|
||
The IPR&D related to the acquisition of Novira Therapeutics, Inc. of
$396 million
is associated with its lead candidate NVR 3-778 which is an investigational small molecule, direct-acting antiviral, for oral administration in patients with HBV that inhibits the HBV core or capsid protein. A probability of success factor of
51.0%
was used to reflect inherent clinical and regulatory risk. The discount rate applied was
16.0%
.
Certain businesses were acquired for
$2,129 million
in cash and
$38 million
of liabilities assumed during 2014. These acquisitions were accounted for using the acquisition method and, accordingly, results of operations have been included in the financial statements from their respective dates of acquisition.
The 2014 acquisitions included: Covagen AG, a privately-held, biopharmaceutical company specializing in the development of multispecific protein therapeutics through the FynomAb
®
technology platform; Alios BioPharma, Inc., a privately-held, clinical stage biopharmaceutical company focused on developing therapies for viral diseases; and the ORSL
TM
electrolyte ready-to-drink brand from Jagdale Industries Ltd. The excess of purchase price over the estimated fair value of tangible assets acquired amounted to
$2,069 million
and has been assigned to identifiable intangible assets, with any residual recorded to goodwill. Of this amount, approximately
$1,913 million
has been identified as the value of IPR&D associated with the acquisitions of Covagen AG and Alios BioPharma, Inc. The value of the IPR&D was calculated using cash flow projections discounted for the inherent risk in the projects.
The IPR&D related to the acquisition of Alios BioPharma, Inc. of
$1,688 million
is associated with Alios’ lead compound AL-8176, an orally administered antiviral therapy for treatment of infants with respiratory syncytial virus (RSV). A probability of success factor of
60.0%
was used to reflect inherent clinical and regulatory risk. The discount rate applied was
11.4%
. The IPR&D related to the acquisition of Covagen AG of
$225 million
is associated with Covagen’s lead compound COVA-322, currently in Phase 1b study for psoriasis and holding potential as a treatment for a broad range of inflammatory diseases including rheumatoid arthritis. A probability of success factor of
26.0%
was used to reflect inherent clinical and regulatory risk. The discount rate applied was
12.5%
. During 2015, the Company recorded a charge for the impairment of the IPR&D related to the acquisition of Covagen AG.
In 2012, the Company completed the acquisition of Synthes, Inc. for a purchase price of
$20.2 billion
in cash and stock. In connection with the acquisition of Synthes, Inc. the Company entered into two accelerated share repurchase (ASR) agreements. In 2013, the Company settled the remaining liabilities under the ASR agreements. While the Company believes that the transactions under each ASR agreement and a series of related internal transactions were consummated in a tax efficient manner in accordance with applicable law, it is possible that the Internal Revenue Service could assert one or more contrary positions to challenge the transactions from a tax perspective. If challenged, an amount up to the total purchase price for the Synthes shares could be treated as subject to applicable U.S. tax at approximately the statutory rate to the Company, plus interest.
Supplemental pro forma information for 2016, 2015 and 2014 in accordance with U.S. GAAP standards related to business combinations, and goodwill and other intangible assets, is not provided, as the impact of the aforementioned acquisitions did not have a material effect on the Company’s results of operations, cash flows or financial position.
During 2016, the Company divestitures included: the controlled substance raw material and active pharmaceutical ingredient (API) business; certain anesthetic products in Europe; and certain non-strategic Consumer brands. In 2016, the pre-tax gains on the divestitures were approximately
$0.6 billion
.
During 2015, the Company divestitures included: the Cordis business to Cardinal Health; the SPLENDA
®
brand to Heartland Food Products Group; and the U.S. license rights to NUCYNTA
®
(tapentadol), NUCYNTA
®
ER (tapentadol extended-release tablets), and NUCYNTA
®
(tapentadol) oral solution. In 2015, the pre-tax gains on the divestitures were approximately
$2.6 billion
.
During 2014, the Company divestitures included: the Ortho-Clinical Diagnostics business to The Carlyle Group; the K-Y
®
brand to Reckitt Benckiser Group PLC in the U.S. and certain other markets; and the BENECOL
®
brand to Raisio plc. In 2014, the pre-tax gains on the divestitures were approximately
$2.4 billion
. The Company completed the divestiture of its Ortho-Clinical Diagnostics business to The Carlyle Group for approximately
$4.0 billion
and the Company recorded a pre-tax gain of approximately
$1.9 billion
. Ortho-Clinical Diagnostics' results are included in the Company's Medical Devices segment.
|
21.
|
Legal Proceedings
|
Johnson & Johnson and certain of its subsidiaries are involved in various lawsuits and claims regarding product liability, intellectual property, commercial and other matters; governmental investigations; and other legal proceedings that arise from time to time in the ordinary course of their business.
The Company records accruals for loss contingencies associated with these legal matters when it is probable that a liability will be incurred and the amount of the loss can be reasonably estimated. As of January 1, 2017, the Company has determined that the liabilities associated with certain litigation matters are probable and can be reasonably estimated. The Company has accrued for these matters and will continue to monitor each related legal issue and adjust accruals as might be warranted based on new information and further developments in accordance with ASC 450-20-25. For these and other litigation and regulatory matters discussed below for which a loss is probable or reasonably possible, the Company is unable to estimate the possible loss or range of loss beyond the amounts already accrued. Amounts accrued for legal contingencies often result from a complex series
|
71
|
||
of judgments about future events and uncertainties that rely heavily on estimates and assumptions. The ability to make such estimates and judgments can be affected by various factors, including whether damages sought in the proceedings are unsubstantiated or indeterminate; scientific and legal discovery has not commenced or is not complete; proceedings are in early stages; matters present legal uncertainties; there are significant facts in dispute; or there are numerous parties involved.
In the Company's opinion, based on its examination of these matters, its experience to date and discussions with counsel, the ultimate outcome of legal proceedings, net of liabilities accrued in the Company's balance sheet, is not expected to have a material adverse effect on the Company's financial position. However, the resolution of, or increase in accruals for, one or more of these matters in any reporting period may have a material adverse effect on the Company's results of operations and cash flows for that period.
PRODUCT LIABILITY
Johnson & Johnson and certain of its subsidiaries are involved in numerous product liability claims and lawsuits involving multiple products. Claimants in these cases seek substantial compensatory and, where available, punitive damages. While the Company believes it has substantial defenses, it is not feasible to predict the ultimate outcome of litigation. The Company has established accruals for product liability claims and lawsuits in compliance with ASC 450-20 based on currently available information, which in some cases may be limited. The Company accrues an estimate of the legal defense costs needed to defend each matter when those costs are probable and can be reasonably estimated. For certain of these matters, the Company has accrued additional amounts such as estimated costs associated with settlements, damages and other losses. To the extent adverse verdicts have been rendered against the Company, the Company does not record an accrual until a loss is determined to be probable and can be reasonably estimated. Product liability accruals can represent projected product liability for thousands of claims around the world, each in different litigation environments and with different fact patterns. Changes to the accruals may be required in the future as additional information becomes available.
The most significant of these cases include the DePuy ASR™ XL Acetabular System and DePuy ASR™ Hip Resurfacing System, the PINNACLE
®
Acetabular Cup System, pelvic meshes, RISPERDAL
®
, XARELTO
®
and JOHNSON'S
®
Baby Powder. As of January 1, 2017, in the U.S. there were approximately
2,000
plaintiffs with direct claims in pending lawsuits regarding injuries allegedly due to the DePuy ASR™ XL Acetabular System and DePuy ASR™ Hip Resurfacing System,
9,400
with respect to the PINNACLE
®
Acetabular Cup System,
54,800
with respect to pelvic meshes,
18,500
with respect to RISPERDAL
®
,
16,900
with respect to XARELTO
®
and
3,100
with respect to JOHNSON'S
®
Baby Powder.
In August 2010, DePuy Orthopaedics, Inc. (DePuy) announced a worldwide voluntary recall of its ASR™ XL Acetabular System and DePuy ASR
™
Hip Resurfacing System used in hip replacement surgery. Claims for personal injury have been made against DePuy and Johnson & Johnson. The number of pending lawsuits is expected to fluctuate as certain lawsuits are settled or dismissed and additional lawsuits are filed. Cases filed in federal courts in the United States have been organized as a multi-district litigation in the United States District Court for the Northern District of Ohio. Litigation has also been filed in countries outside of the United States, primarily in the United Kingdom, Canada, Australia, Ireland, Germany and Italy. In November 2013, DePuy reached an agreement with a Court-appointed committee of lawyers representing ASR Hip System plaintiffs to establish a program to settle claims with eligible ASR Hip patients in the United States who had surgery to replace their ASR Hips, known as revision surgery, as of August 31, 2013. This settlement covered approximately
8,000
patients. In February 2015, DePuy reached an additional agreement, which effectively extends the existing settlement program to ASR Hip patients who had revision surgeries after August 31, 2013 and prior to February 1, 2015. This second agreement is estimated to cover approximately
1,800
additional patients. The estimated cost of these agreements is covered by existing accruals. This settlement program is expected to bring to a close significant ASR Hip litigation activity in the United States. However, many lawsuits in the United States will remain, and the settlement program does not address litigation outside of the United States. In Australia, a settlement was reached with representatives of a class action lawsuit pending in the Federal Court of New South Wales that resolves the claims of the majority of ASR Hip patients in that country. The Company continues to receive information with respect to potential costs associated with this recall on a worldwide basis. The Company has established accruals for the costs associated with the DePuy ASR™ Hip program and related product liability litigation. Changes to these accruals may be required in the future as additional information becomes available.
Claims for personal injury have also been made against DePuy and Johnson & Johnson relating to the PINNACLE
®
Acetabular Cup System used in hip replacement surgery. The number of pending product liability lawsuits continues to increase, and the Company continues to receive information with respect to potential costs and the anticipated number of cases. Cases filed in federal courts in the United States have been organized as a multi-district litigation in the United States District Court for the Northern District of Texas. Litigation has also been filed in countries outside of the United States, primarily in the United Kingdom. The Company has established an accrual for defense costs in connection with product liability litigation associated
|
72
|
||
with the PINNACLE
®
Acetabular Cup System. Changes to this accrual may be required in the future as additional information becomes available.
Claims for personal injury have been made against Ethicon, Inc. (Ethicon) and Johnson & Johnson arising out of Ethicon's pelvic mesh devices used to treat stress urinary incontinence and pelvic organ prolapse. The number of pending product liability lawsuits continues to increase, and the Company continues to receive information with respect to potential costs and the anticipated number of cases. Cases filed in federal courts in the United States have been organized as a multi-district litigation in the United States District Court for the Southern District of West Virginia. In addition, class actions and individual personal injury cases or claims have been commenced in various countries outside of the United States, including claims and cases in the United Kingdom, the Netherlands, Belgium, Italy and Venezuela, and class actions in Israel, Australia and Canada, seeking damages for alleged injury resulting from Ethicon's pelvic mesh devices. The Company has established an accrual with respect to product liability litigation associated with Ethicon's pelvic mesh products. Changes to this accrual may be required in the future as additional information becomes available.
Claims for personal injury have been made against Janssen Pharmaceuticals, Inc. and Johnson & Johnson arising out of the use of RISPERDAL
®
, indicated for the treatment of schizophrenia, acute manic or mixed episodes associated with bipolar I disorder and irritability associated with autism, and related compounds. Lawsuits have been primarily filed in state courts in Pennsylvania, California, and Missouri. Other actions are pending in various courts in the United States and Canada.
The number of pending product liability lawsuits continues to increase, and the Company continues to receive information with respect to potential costs and the anticipated number of cases. The Company has established an accrual with respect to product liability litigation associated with RISPERDAL
®
. Changes to this accrual may be required in the future as additional information becomes available.
Claims for personal injury have been made against Janssen Pharmaceuticals, Inc. and Johnson & Johnson arising out of the use of XARELTO
®
, an oral anticoagulant. The number of pending product liability lawsuits continues to increase, and the Company continues to receive information with respect to potential costs and the anticipated number of cases. Cases filed in federal courts in the United States have been organized as a multi-district litigation in the United States District Court for the Eastern District of Louisiana. In addition, cases have been filed in state courts across the United States. Many of these cases have been consolidated into a state mass tort litigation in Philadelphia, Pennsylvania; and there are coordinated proceedings in Delaware, California and Missouri. Class action lawsuits also have been filed in Canada. The Company has established an accrual for defense costs in connection with product liability litigation associated with XARELTO
®
. Changes to this accrual may be required in the future as additional information becomes available.
Claims for personal injury have been made against Johnson & Johnson Consumer Inc. and Johnson & Johnson arising out of the use of JOHNSON'S
®
Baby Powder. The number of pending product liability lawsuits continues to increase, and the Company continues to receive information with respect to potential costs and the anticipated number of cases. Lawsuits have been primarily filed in state courts in Missouri, New Jersey and California. In addition, a federal multi-district litigation proceeding has been created for this litigation in the District Court of New Jersey. The Company has established an accrual for defense costs in connection with product liability litigation associated with JOHNSON'S
®
Baby Powder. Changes to this accrual may be required in the future as additional information becomes available.
INTELLECTUAL PROPERTY
Certain subsidiaries of Johnson & Johnson are subject, from time to time, to legal proceedings and claims related to patent, trademark and other intellectual property matters arising out of their businesses. Many of these matters involve challenges to the coverage and/or validity of the patents on various products and allegations that certain of the Company’s products infringe the patents of third parties. Although these subsidiaries believe that they have substantial defenses to these challenges and allegations with respect to all significant patents, there can be no assurance as to the outcome of these matters. A loss in any of these cases could adversely affect the ability of these subsidiaries to sell their products, result in loss of sales due to loss of market exclusivity, require the payment of past damages and future royalties, and may result in a non-cash impairment charge for any associated intangible asset. The most significant of these matters are described below.
Medical Devices
In June 2009, Rembrandt Vision Technologies, L.P. (Rembrandt) filed a patent infringement lawsuit against Johnson & Johnson Vision Care, Inc. (JJVCI) in the United States District Court for the Eastern District of Texas alleging that JJVCI's manufacture and sale of its ACUVUE
®
ADVANCE and ACUVUE OASYS
®
Hydrogel Contact Lenses infringe their U.S. Patent No. 5,712,327 (the '327 patent). Rembrandt is seeking monetary relief. The case was transferred to the United States District Court for the Middle District of Florida. In May 2012, the jury returned a verdict holding that neither of the accused lenses infringes
|
73
|
||
the '327 patent. Rembrandt appealed, and in August 2013, the United States Court of Appeals for the Federal Circuit affirmed the District Court's judgment. Rembrandt asked the District Court to grant it a new trial based on alleged new evidence, and in July 2014, the District Court denied Rembrandt’s motion. Rembrandt appealed and the Court of Appeals overturned that ruling in April 2016 and remanded the case to the District Court for a new trial. JJVCI's motion to reconsider and petition for review with the United States Supreme Court were both denied. A new trial is scheduled for August 2017.
In December 2009, the State of Israel filed a lawsuit in the District Court in Tel Aviv Jaffa against Omrix Biopharmaceuticals, Inc. and various affiliates (Omrix). In the lawsuit, the State claimed that an employee of a government-owned hospital was the inventor on several patents related to fibrin glue technology that the employee developed while he was a government employee. The State claimed that he had no right to transfer any intellectual property to Omrix because it belongs to the State. The State sought damages plus royalties on QUIXIL™ and EVICEL
®
products, or alternatively, transfer of the patents to the State. The case was settled in December 2016.
LifeScan filed a patent infringement lawsuit against UniStrip Technologies, LLC (UniStrip) in the United States District Court for the District of North Carolina in May 2014, alleging that the making and marketing of UniStrip’s strips for use in LifeScan’s blood glucose monitors infringe U.S. Patent Nos. 6,241,862 (the '862 patent) and 7,250,105 (the '105 patent). In August 2014, the United States Patent and Trademark Office (USPTO) determined that the '105 patent is invalid. In January 2016, the invalidity decision was upheld on appeal. LifeScan filed a motion for rehearing, which was denied. In July 2014, UniStrip brought a lawsuit against LifeScan in the United States District Court for the Eastern District of Pennsylvania, alleging antitrust violations relating to marketing practices for LifeScan strips.
In March 2013, Medinol Ltd. (Medinol) filed a patent infringement lawsuit against Cordis Corporation (Cordis) and Johnson & Johnson in the United States District Court for the Southern District of New York alleging that all of Cordis's sales of the CYPHER
™
and CYPHER SELECT
™
Stents made in the United States since 2005 willfully infringed
four
of Medinol's patents directed to the geometry of articulated stents. Medinol is seeking damages and attorneys' fees. After trial in January 2014, the District Court dismissed the case, finding Medinol unreasonably delayed bringing its claims, and Medinol did not appeal the decision. In September 2014, the District Court denied a motion by Medinol to vacate the judgment and grant it a new trial. Medinol's appeal of this decision has been dismissed. Medinol has filed a petition for review with the United States Supreme Court. Cordis was divested in 2015 and the Company retained any liability that may result from this case.
In November 2016, MedIdea, L.L.C. (MedIdea) filed a patent infringement lawsuit against DePuy Orthopaedics, Inc. in the United States District Court for the Northern District of Illinois alleging infringement by the ATTUNE
®
Knee System of two patents relating to posterior stabilized knee systems. Specifically, MedIdea alleges that the SOFCAM
TM
Contact feature of the ATTUNE
®
posterior stabilized knee products infringes the patents-in-suit. MedIdea is seeking monetary damages and injunctive relief.
In December 2016, Ethicon Endo-Surgery, Inc. and Ethicon Endo-Surgery, LLC (now known as Ethicon LLC) sued Covidien, Inc. in the U.S. District Court for the District of Massachusetts seeking a declaration that Covidien’s U.S. Patent Nos. 6,585,735; 7,118,587; 7,473,253; 8,070,748; and 8,241,284 are either invalid or not infringed by Ethicon’s ENSEAL
®
X1 Large Jaw Tissue Sealer product (ENSEAL X1). The ENSEAL X1 product is scheduled to launch in the United States and Europe in the first quarter of 2017.
Pharmaceutical
In April 2016, MorphoSys AG, a German biotech company, filed a patent infringement lawsuit against Janssen Biotech, Inc. (JBI), Genmab U.S. Inc. and Genmab A/S (collectively, Genmab) in the United States District Court for the District of Delaware, alleging that JBI’s manufacture and sale of DARZALEX
®
(daratumumab) willfully infringes MorphoSys' U.S. Patent No. 8,263,746. MorphoSys is seeking money damages. JBI licenses patents and the commercial rights to DARZALEX
®
from Genmab. In June 2016, JBI filed a motion to dismiss the lawsuit. In November 2016, MorphoSys sought leave to add another patent to the case (U.S. Patent No. 9,200,061), and in February 2017, the Court granted the request. Trial in the case is currently scheduled to commence in August 2018.
In August 2016, Sandoz Ltd and Hexal AG (collectively, Sandoz) filed a lawsuit in the English High Court against G.D. Searle LLC (a Pfizer company) and Janssen Sciences Ireland UC (JSI) alleging that Searle’s supplementary protection certificate SPC/GB07/038 (SPC), which is exclusively licensed to JSI, is invalid and should be revoked. Janssen-Cilag Limited sells PREZISTA
®
(darunavir) in the UK pursuant to this license. In October 2016, Searle and JSI counterclaimed against Sandoz for threatened infringement of the SPC based on statements of its plans to launch generic darunavir in the UK. Trial of the case has been scheduled to begin in late April/early May 2017.
|
74
|
||
REMICADE
®
Related Cases
U.S. Proceedings
In September 2013, Janssen Biotech, Inc. (JBI) and NYU Langone Medical Center (NYU) received an Office Action from the United States Patent and Trademark Office (USPTO) rejecting the claims in U.S. Patent No. 6,284,471 relating to REMICADE
®
(infliximab) (the '471 patent) in a reexamination proceeding instituted by a third party. The '471 patent is co-owned by JBI and NYU, and NYU granted JBI an exclusive license to NYU’s rights under the patent. The '471 patent expires in September 2018. Following several office actions by the patent examiner, including two further rejections, and responses by JBI, the USPTO issued a further action maintaining its rejection of the '471 patent. JBI filed a notice of appeal to the USPTO's Patent Trial and Appeal Board. In November 2016, the Patent Trial and Appeal Board issued a decision upholding the examiner's rejection. JBI has filed an appeal to the U.S. Court of Appeals for the Federal Circuit.
In August 2014, Celltrion Healthcare Co. Ltd. and Celltrion Inc. (together, Celltrion) filed an application with the U.S. Food and Drug Administration (FDA) for approval to make and sell its own infliximab biosimilar. In March 2015, JBI filed a lawsuit in the United States District Court for the District of Massachusetts against Celltrion and Hospira Healthcare Corporation (Hospira), which has exclusive U.S. marketing rights for Celltrion's infliximab biosimilar, seeking, among other things, a declaratory judgment that their biosimilar product infringes or potentially infringes several JBI patents, including the '471 patent and U.S. Patent No. 7,598,083 (the '083 patent). In August 2016, the District Court granted both Celltrion's and Hospira's motions for summary judgment of invalidity of the '471 patent. JBI has appealed those decisions to the U.S. Court of Appeals for the Federal Circuit. This case and the appeal of the reexamination of the '471 patent have been designated companion cases and will be heard by the same panel of judges in the Federal Circuit.
In June 2016, JBI filed two additional patent infringement lawsuits asserting the '083 patent, one against Celltrion in the United States District Court for the District of Massachusetts and the other against HyClone Laboratories, Inc., the manufacturer of the cell culture media that Celltrion uses to make its biosimilar product, in the United States District Court for the District of Utah. Although the '083 patent is already asserted in the existing lawsuit against Celltrion, the additional lawsuit expands the claims to include any use of the cell culture media made in the United States to manufacture Celltrion's biosimilar. This additional lawsuit against Celltrion has been consolidated with the existing lawsuit discussed above. Hospira has moved to dismiss all counts of the lawsuit related to the '083 patent as to it. Celltrion has moved to dismiss all counts of the lawsuit related to the '083 patent without prejudice for failure to join all the co-owners of the ‘083 patent as plaintiffs. The trial has been postponed pending resolution of these motions.
The FDA approved Celltrion’s infliximab biosimilar for sale in the United States in April 2016, and the 180-day period for notice of launch of a biosimilar product under the Biologics Price Competition and Innovation Act has passed.
Hospira's parent company, Pfizer Inc., began shipment of Celltrion's infliximab biosimilar to wholesalers in the United States in late November 2016. Introduction to the U.S. market of the biosimilar will result in a reduction in U.S. sales of REMICADE
®
.
Canadian Proceedings
In March 2013, Hospira filed an impeachment proceeding against The Kennedy Institute of Rheumatology (Kennedy) challenging the validity of a Canadian patent related to REMICADE
®
(a Feldman patent), which is exclusively licensed to JBI. In October 2013, Kennedy, along with JBI, Janssen Inc. (Janssen) and Cilag GmbH International (both affiliates of JBI), filed a counterclaim for infringement against Celltrion and Hospira. The counterclaim alleges that the products described in Celltrion’s and Hospira’s marketing applications to Health Canada for their subsequent entry biologics (SEB) to REMICADE
®
would infringe the Feldman patents owned by Kennedy. A trial in this patent action concluded in October 2016, and closing arguments took place in January 2017. The parties are awaiting a decision.
In January 2014, Health Canada approved Celltrion’s SEB to REMICADE
®
, allowing Celltrion to market its infliximab biosimilar in Canada, regardless of the pending patent action. In June 2014, Health Canada approved Hospira’s SEB to REMICADE
®
. In July 2014, Janssen filed a lawsuit to compel the Canadian Minister of Health to withdraw the Notice of Compliance for Hospira’s SEB because Hospira did not serve a Notice of Allegation on Janssen to address the patent listed by Janssen on the Patent Register. In March 2015, the parties entered into a settlement agreement whereby Health Canada agreed to a Consent Judgment setting aside Hospira’s Notice of Compliance, subject to Health Canada's appeal, which was filed in June 2015. Nevertheless, Hospira began marketing an infliximab biosimilar as a distributor under Celltrion's Notice of Compliance. In October 2016, the appeals court reversed the Consent Judgment. Janssen has filed an application for leave to appeal with the Supreme Court of Canada. Hospira continues to market and sell Celltrion's infliximab biosimilar in Canada.
|
75
|
||
In Canada, if the REMICADE
®
patent discussed above is found to be invalid following all appeals, it could not be relied upon to prevent the further introduction of infliximab biosimilars prior to the August 1, 2017 expiry date of the patent.
Litigation Against Filers of Abbreviated New Drug Applications (ANDAs)
The following summarizes lawsuits pending against generic companies that have filed Abbreviated New Drug Applications (ANDAs) with the FDA, or undertaken similar regulatory processes outside of the United States, seeking to market generic forms of products sold by various subsidiaries of Johnson & Johnson prior to expiration of the applicable patents covering those products. These ANDAs typically include allegations of non-infringement, invalidity and unenforceability of the applicable patents. In the event the subsidiaries are not successful in these actions, or the statutory 30-month stays of the ANDAs expire before the United States District Court rulings are obtained, the third-party companies involved will have the ability, upon approval of the FDA, to introduce generic versions of the products at issue to the market, resulting in the potential for substantial market share and revenue losses for those products, and which may result in a non-cash impairment charge in any associated intangible asset. In addition, from time to time, subsidiaries may settle these actions and such settlements can involve the introduction of generic versions of the products at issue to the market prior to the expiration of the relevant patents. The inter partes review (IPR) process with the United States Patent and Trademark Office (USPTO), created under the 2011 America Invents Act, is also being used by generic companies in conjunction with these ANDAs and lawsuits to challenge patents held by the Company’s subsidiaries.
CONCERTA
®
In December 2014, Janssen Inc. and ALZA Corporation filed a Notice of Application against Actavis Pharma Company (Actavis) in response to Actavis’ Notice of Allegation seeking approval to market a generic version of CONCERTA
®
before the expiration of Canadian Patent No. 2,264,852 (the '852 patent). In December 2016, the Canadian Federal Court allowed the Application and issued an order preventing Actavis from obtaining marketing approval (a Notice of Compliance) for its generic version of CONCERTA
®
until the expiration of the '852 patent. Actavis did not commence an appeal prior to the deadline for doing so and thus, is prevented from obtaining a Notice of Compliance for a generic version of CONCERTA
®
until the expiration of the '852 patent.
In October 2016, ALZA Corporation and Janssen Pharmaceuticals, Inc. filed a patent infringement lawsuit in the U.S. District Court for the District of Delaware against Amneal Pharmaceuticals of New York, LLC and Amneal Pharmaceuticals LLC in response to Amneal’s ANDA seeking approval to market a generic version of CONCERTA
®
before the expiration of United States Patent Nos. 8,163,798 and 9,144,549. In November 2016, Amneal filed a motion for judgment on the pleadings, arguing that certain claims of the patents are invalid and others are not infringed. Janssen has opposed the motion.
ZYTIGA
®
In June and July 2015, Janssen Biotech, Inc. (JBI) received notices of paragraph IV certification from several companies advising of their respective ANDAs seeking approval for a generic version of ZYTIGA
®
before the expiration of one or more patents relating to ZYTIGA
®
. In July 2015, JBI, Janssen Oncology, Inc. (Janssen Oncology) and Janssen Research & Development, LLC (collectively, Janssen) and BTG International Ltd. (BTG) filed a patent infringement lawsuit in the United States District Court for the District of New Jersey against several generic ANDA applicants (and certain of their affiliates and/or suppliers) in response to their respective ANDAs seeking approval to market a generic version of ZYTIGA
®
before the expiration of United States Patent Nos. 5,604,213 (the '213 patent) and/or 8,822,438 (the '438 patent). The generic companies include Actavis Laboratories, FL, Inc. (Actavis); Amneal Pharmaceuticals, LLC and Amneal Pharmaceuticals of New York, LLC (collectively, Amneal); Apotex Inc. and Apotex Corp. (collectively, Apotex); Citron Pharma LLC (Citron); Dr. Reddy’s Laboratories, Ltd. and Dr. Reddy’s Laboratories, Inc. (collectively, Dr. Reddy's); Mylan Pharmaceuticals Inc. and Mylan Inc. (collectively, Mylan); Par Pharmaceuticals, Inc. and Par Pharmaceutical Companies, Inc. (collectively, Par); Sun Pharmaceutical Industries Ltd. and Sun Pharmaceuticals Industries, Inc. (collectively, Sun); Teva Pharmaceuticals USA, Inc. (Teva); Wockhardt Bio A.G.; Wockhardt USA LLC and Wockhardt Ltd. (collectively, Wockhardt); West-Ward Pharmaceutical Corp. (West-Ward); and Hikma Pharmaceuticals, LLC (Hikma). The Court entered a stay of the lawsuit against Par and Citron, as each agreed to be bound by the decision against the other defendants in the action. The '213 patent expired in December 2016 and thus the infringement actions concern only the '438 patent. In February 2016, the Court set a trial date of October 2017.
In August 2015, Janssen and BTG filed an additional jurisdictional protective lawsuit against the Mylan defendants in the United States District Court for the Northern District of West Virginia, which has been stayed.
|
76
|
||
In August 2015, Janssen received a notice of paragraph IV certification from Hetero USA Inc., the U.S. Regulatory Agent for Hetero Labs Limited Unit-V, a division of Hetero Labs Limited (collectively, Hetero) advising of Hetero’s ANDA seeking approval for a generic version of ZYTIGA
®
before expiration of the '438 patent. In September 2015, Janssen and BTG filed an amended complaint in the New Jersey lawsuit to add alleged infringement of the '438 patent by Hetero.
In March 2016, Janssen filed a motion in the New Jersey lawsuit to correct inventorship of the '438 patent to add an inventor and, if granted, for leave to amend the complaint accordingly. In January 2017, the Court granted Janssen's motion, and Janssen filed a second amended complaint adding BTG as a co-owner of the '438 patent and a co-plaintiff regarding the '438 patent infringement claims.
In March 2016, Janssen received a notice from Amerigen Pharmaceuticals Limited (Amerigen) advising of Amerigen’s ANDA seeking approval for a generic version of ZYTIGA
®
before expiration of the '438 patent. In response, Janssen and BTG filed a separate patent infringement lawsuit in the United States District Court for the District of New Jersey against Amerigen in May 2016.
In May 2016, Janssen received a notice of paragraph IV certification from Glenmark Pharmaceuticals Inc., on behalf of Glenmark Pharmaceuticals SA, a wholly owned subsidiary of Glenmark Pharmaceuticals Ltd. (collectively, Glenmark) advising of Glenmark’s ANDA seeking approval for a generic version of ZYTIGA
®
before expiration of the '438 patent. In response, in June 2016, Janssen and BTG filed a patent infringement lawsuit in the United States District Court for the District of New Jersey against Glenmark. The parties have stipulated to a dismissal of Glenmark Pharmaceuticals Ltd.
The filing of the above-referenced lawsuits triggered a stay until October 2018 during which time the FDA will not grant final approval of the generics' ANDAs unless there is an earlier District Court decision finding the patents-in-suit invalid or not infringed.
In each of the above lawsuits, Janssen is seeking an order enjoining the defendants from marketing their generic versions of ZYTIGA
®
before the expiration of the relevant patents.
In December 2015, Amerigen filed a petition for an inter partes review in the USPTO seeking to invalidate the '438 patent. In May 2016, the USPTO granted the inter partes review, and a decision as to the validity of the ‘438 patent is expected by May 2017. In June 2016, Argentum Pharmaceuticals LLC and Mylan Pharmaceuticals Inc. filed petitions for inter partes review in the USPTO seeking to invalidate the '438 patent and moved to join the inter partes review filed by Amerigen. The USPTO instituted Argentum's petition and granted Argentum's motion for joinder and, in January 2017, granted Mylan's petition for inter partes review but denied Mylan's motion for joinder. In August 2016, Wockhardt Bio AG filed a petition for inter partes review in the USPTO seeking to invalidate the '438 patent, which the USPTO granted in January 2017. In February 2017, Actavis, Amneal, Dr. Reddy's, Sun, Teva, West-Ward and Hikma filed a joint petition for inter partes review in the USPTO seeking to invalidate the '438 patent and moved to join the inter partes review filed by Mylan.
COMPLERA
®
In August and September 2015, Janssen Pharmaceutica NV and Janssen Sciences Ireland UC (collectively, Janssen) and Gilead Sciences, Inc. and Gilead Sciences Ireland UC (collectively, Gilead) filed patent infringement lawsuits in the United States District Courts for the District of Delaware and the District of West Virginia, respectively, against Mylan, Inc. and Mylan Pharmaceuticals, Inc. (collectively, Mylan) in response to Mylan’s ANDA seeking approval to market a generic version of COMPLERA
®
before the expiration of United States Patent Nos. 8,841,310 (the '310 patent), 7,125,879 (the '879 patent) and 8,101,629 (the '629 patent).
In the West Virginia action, in September 2015, Mylan filed an answer and counterclaims asserting invalidity and non-infringement of the '310 patent, '879 patent, and '629 patent, as well as United States Patent No. 8,080,551 (the ‘551 patent). In March 2016, the District of West Virginia Court stayed the lawsuit and scheduled a conditional trial date in February 2018, in accordance with the schedule in the first-filed Delaware lawsuit described below.
In the Delaware action, in January and March 2016, Janssen and Gilead amended their complaint to add claims for patent infringement with respect to the ‘551 patent and United States Patent Nos. 7,399,856 (the '856 patent), 7,563,922 (the '922 patent), 8,101,752 (the '752 patent) and 8,618,291 (the '291 patent). Mylan filed a motion to dismiss the suit for lack of personal jurisdiction and a motion to dismiss, strike or sever the infringement claims regarding the ‘752 and ‘291 patents. In September 2016, the Delaware District Court denied both of Mylan’s motions. A trial in the Delaware action has been scheduled for February 2018.
|
77
|
||
In each of these lawsuits, Janssen is seeking an order enjoining the defendants from marketing their generic versions of COMPLERA
®
before the expiration of the relevant patents.
XARELTO
®
A number of generic companies have filed ANDAs seeking approval to market generic versions of XARELTO
®
. In October 2015, Janssen Pharmaceuticals, Inc. (JPI) and Bayer Pharma AG and Bayer Intellectual Property GmbH (collectively, Bayer) filed patent infringement lawsuits in the United States District Court for the District of Delaware against Aurobindo Pharma Limited, Aurobindo Pharma USA, Inc., Breckenridge Pharmaceutical, Inc., Micro Labs USA Inc. and Micro Labs Ltd. (collectively, Micro), Mylan Pharmaceuticals Inc., Mylan Inc. (Mylan), Prinston Pharmaceutical, Inc., Sigmapharm Laboratories, LLC, Torrent Pharmaceuticals, Limited and Torrent Pharma Inc., in response to those parties’ respective ANDAs seeking approval to market generic versions of XARELTO
®
before the expiration of Bayer’s United States Patent Nos. 7,157,456 (the ‘456 patent), 7,585,860 (the ‘860 patent) and 7,592,339 (the ‘339 patent) relating to XARELTO
®
. JPI is the exclusive licensee of the asserted patents.
In November 2015, Mylan moved to dismiss the action. In December 2015, JPI, Bayer, and Mylan stipulated and agreed to dismiss the claims against Mylan, and suspend further briefing and argument on Mylan's motion to dismiss, pending appeals relating to personal jurisdiction over Mylan Pharmaceuticals Inc. in the District of Delaware. In February 2016, a similar patent infringement action by JPI and Bayer against Invagen Pharmaceuticals Inc. (Invagen), in response to Invagen’s notice of paragraph IV certification advising of its ANDA seeking FDA approval for a generic XARELTO
®
product before expiration of the relevant patents, was consolidated with the original case. The District Court has set a trial date of March 2018.
In April 2016, JPI and Bayer filed a separate patent infringement action in the District of Delaware against Micro, in response to their notice of paragraph IV certification advising of their ANDA seeking FDA approval for a generic XARELTO
®
product before expiration of the ‘860 and ‘339 patents. In May 2016, this action was consolidated with the original action.
In July 2016, JPI and Bayer filed a separate patent infringement action in the District of Delaware against Breckenridge Pharmaceutical, Inc., in response to its notice of paragraph IV certification advising of its ANDA seeking FDA approval for a generic XARELTO
®
product before expiration of the ‘456 and ‘339 patents. This action has been consolidated with the original action.
In each of these lawsuits, JPI is seeking an order enjoining the defendants from marketing their generic versions of XARELTO
®
before the expiration of the relevant patents.
In October 2016, Mylan filed petitions for inter partes review in the USPTO seeking to invalidate the ‘339, ‘456 and ‘860 patents.
GOVERNMENT PROCEEDINGS
Like other companies in the pharmaceutical and medical devices industries, Johnson & Johnson and certain of its subsidiaries are subject to extensive regulation by national, state and local government agencies in the United States and other countries in which they operate. As a result, interaction with government agencies is ongoing. The most significant litigation brought by, and investigations conducted by, government agencies are listed below. It is possible that criminal charges and substantial fines and/or civil penalties or damages could result from government investigations or litigation.
Average Wholesale Price (AWP) Litigation
Johnson & Johnson and several of its pharmaceutical subsidiaries (the J&J AWP Defendants), along with numerous other pharmaceutical companies, are defendants in a series of lawsuits in state and federal courts involving allegations that the pricing and marketing of certain pharmaceutical products amounted to fraudulent and otherwise actionable conduct because, among other things, the companies allegedly reported an inflated Average Wholesale Price (AWP) for the drugs at issue. Payors alleged that they used those AWPs in calculating provider reimbursement levels. Many of these cases, both federal actions and state actions removed to federal court, were consolidated for pre-trial purposes in a Multi-District Litigation (MDL) in the United States District Court for the District of Massachusetts. The plaintiffs in these cases included three classes of private persons or entities that paid for any portion of the purchase of the drugs at issue based on AWP, and state government entities that made Medicaid payments for the drugs at issue based on AWP. In June 2007, after a trial on the merits, the MDL Court dismissed the claims of two of the plaintiff classes against the J&J AWP Defendants. In March 2011, the Court dismissed the claims of the third class against the J&J AWP Defendants without prejudice.
|
78
|
||
AWP cases brought by various Attorneys General have proceeded to trial against other manufacturers. Several state cases against certain Johnson & Johnson subsidiaries have been settled, including the case in Wisconsin, which settled in February 2016. Cases are still pending in Illinois, New Jersey, and Utah. The cases in Illinois and New Jersey have not yet proceeded to trial. In Utah, the claims brought by the Attorney General were dismissed by the Court in 2013, but the State may appeal the dismissal after the conclusion of similar pending matters against other defendants. In the AWP case against the J&J AWP Defendants brought by the Commonwealth of Pennsylvania, following a trial in 2010, the Pennsylvania Commonwealth Court found in favor of the Commonwealth with regard to certain of its claims under the Pennsylvania Unfair Trade Practices and Consumer Protection Law, and in favor of the J&J AWP Defendants on the Commonwealth’s remaining claims. Following an appeal to the Pennsylvania Supreme Court that vacated that judgment, the Commonwealth Court entered a subsequent judgment in favor of the J&J AWP Defendants on all claims. That subsequent judgment has been upheld by the Pennsylvania Supreme Court in a successive appeal.
McNeil Consumer Healthcare
Starting in June 2010, McNeil Consumer Healthcare Division of McNEIL-PPC, Inc. (now Johnson & Johnson Consumer Inc., McNeil Consumer Healthcare Division) (McNeil Consumer Healthcare) and certain affiliates, including Johnson & Johnson (the Companies), received grand jury subpoenas from the United States Attorney's Office for the Eastern District of Pennsylvania requesting documents broadly relating to recalls of various products of McNeil Consumer Healthcare, and the FDA inspections of the Fort Washington, Pennsylvania and Lancaster, Pennsylvania manufacturing facilities, as well as certain documents relating to recalls of a small number of products of other subsidiaries. In addition, in February 2011, the government served McNEIL-PPC, Inc. (now Johnson & Johnson Consumer Inc.) (JJCI) with a Civil Investigative Demand seeking records relevant to its investigation to determine if there was a violation of the Federal False Claims Act. In March 2015, McNEIL-PPC, Inc. (now JJCI) entered a guilty plea in the United States District Court for the Eastern District of Pennsylvania to a misdemeanor violation of the U.S. Food, Drug and Cosmetic Act. McNEIL-PPC, Inc. (now JJCI) agreed to pay a
$20 million
fine and a
$5 million
forfeiture to resolve the matter.
The Companies have also received Civil Investigative Demands from multiple State Attorneys General Offices broadly relating to the McNeil recall issues. The Companies continue to cooperate with these inquiries, which are being coordinated through a multi-state coalition. If a resolution cannot be reached with this multi-state coalition, it is possible that individual State Attorneys General Offices may file civil monetary claims against the Companies.
In January 2011, the Oregon Attorney General filed a civil complaint against Johnson & Johnson, McNEIL-PPC, Inc. (now JJCI) and McNeil Healthcare LLC in state court alleging civil violations of the Oregon Unlawful Trade Practices Act relating to an earlier recall of a McNeil OTC product. In November 2012, the state court granted a motion by the Companies to dismiss Oregon's complaint in its entirety, with prejudice. In November 2015, the State Court of Appeals reversed the trial court and reinstated Oregon's consumer protection claims. In February 2016, the Oregon Supreme Court denied the Companies' petition for review, and the case was sent back to the trial court.
Opioids Litigation
As described below, Johnson & Johnson (J&J) and Janssen Pharmaceuticals, Inc. (JPI), along with other pharmaceutical companies, have been named in four lawsuits alleging claims related to marketing of opioids, including DURAGESIC
®
, NUCYNTA
®
and NUCYNTA
®
ER, and have been subpoenaed by two other states for information related to opioid marketing practices.
In May 2014, Santa Clara and Orange Counties in California filed a complaint in state court in Orange County, California against numerous pharmaceutical manufacturers, including J&J and JPI, alleging claims related to opioid marketing practices, including false advertising, unfair competition, and public nuisance. The counties seek injunctive and monetary relief. In February 2015, the defendants filed motions challenging the sufficiency of the complaint. In August 2015, the Court stayed the case until the FDA concludes its ongoing inquiry into the safety and effectiveness of long-term opioid treatment. Following a motion by the counties to lift the stay, in October 2016, the Court kept the stay in place in part, requested the parties to confer, and adjourned the matter until a later date.
In June 2014, the City of Chicago filed a complaint in Cook County Circuit Court against the same group of pharmaceutical manufacturers, including J&J and JPI, alleging a number of claims related to opioid marketing practices, including consumer fraud violations and false claims, and seeking injunctive and monetary relief. The case was later removed to the United States District Court for the Northern District of Illinois. In December 2014, J&J and JPI filed a motion to dismiss the City of Chicago's first amended complaint, which was granted with leave to file an amended complaint. The City filed a second
|
79
|
||
amended complaint, and in November 2015, J&J and JPI filed a motion to dismiss the second amended complaint. In September 2016, the Court dismissed eight of the City’s ten causes of action and granted the City one final opportunity to replead the dismissed claims. The City filed a third amended complaint in October 2016, and, in December 2016, J&J and JPI filed an answer as to two causes of action and a motion to dismiss the remaining causes of action.
In September 2014, the Tennessee Attorney General Division of Consumer Affairs issued a Request for Information to JPI and other pharmaceutical companies related to opioids marketing practices.
In August 2015, the New Hampshire Attorney General, Consumer Protection and Antitrust Bureau issued a subpoena to JPI and other pharmaceutical companies related to opioids marketing practices. In October 2015, the State filed a motion in the State of New Hampshire Superior Court to enforce the subpoena. JPI and the other pharmaceutical companies subsequently filed a joint motion for injunctive relief and a protective order to preclude the State from engaging private contingent fee counsel to participate in the State’s investigation or any subsequent enforcement action. In March 2016, the Court granted the protective order on the grounds that the State had not obtained requisite executive and legislative approvals to retain private counsel, but rejected the contention that the contingency fee agreement was otherwise unlawful. All parties have appealed the March 2016 ruling to the New Hampshire Supreme Court. In August 2016, the Court denied the pharmaceutical companies’ joint motion to enforce the protective order on the ground that the underlying deficiency (legislative approval) had been cured. In September 2016, the State stipulated to stay enforcement of any subpoenas pending the New Hampshire Supreme Court’s consideration of the companies’ appeal of the March 2016 ruling.
In December 2015, the State of Mississippi filed a complaint in the Chancery Court of the First Judicial District of Hinds County against substantially the same group of pharmaceutical manufacturers as in the suits brought by the California counties and City of Chicago, including J&J and JPI, alleging a number of claims related to opioid marketing practices and seeking penalties and injunctive and monetary relief. In March 2016, defendants filed a motion to transfer venue and motions to dismiss the complaint.
In August 2016, the County of Suffolk in New York filed a complaint against several pharmaceutical manufacturers in New York Supreme Court, including J&J and JPI, alleging claims related to opioid marketing, including claims based on deceptive acts and practices, false advertising, fraud and unjust enrichment. The complaint seeks penalties and injunctive and monetary relief.
In February 2017, the County of Erie and the County of Broome in New York each filed a complaint in New York Supreme Court against several pharmaceutical manufacturers, including JPI. Both complaints allege claims related to opioid marketing practices, including statutory claims for deceptive acts and practices, false advertising, and violation of New York’s Social Services Law, and common law causes of action for public nuisance, fraud, and unjust enrichment. Each county is seeking compensatory and punitive damages and costs.
Other
In September 2011, Synthes, Inc. (Synthes) received a Civil Investigative Demand issued pursuant to the False Claims Act from the United States Attorney's Office for the Eastern District of Pennsylvania. The demand sought information regarding allegations that fellowships had been offered to hospitals in exchange for agreements to purchase products. Synthes has produced documents and information in response to the demand and is cooperating with the inquiry.
In May 2012, Acclarent, Inc. (Acclarent) received a subpoena from the United States Attorney's Office for the District of Massachusetts requesting documents broadly relating to the sales, marketing and alleged off-label promotion by Acclarent of the RELIEVA STRATUS
®
MicroFlow Spacer product (the RELIEVA STRATUS
®
Spacer). In March 2016, Acclarent executed a civil settlement with the United States Justice Department and other agencies to resolve this investigation. Johnson & Johnson was not a party to this settlement and there was no admission of liability. In a separate matter, in July 2016, the former President/CEO and Vice President of Sales of Acclarent (the former Acclarent officers), were convicted of misdemeanor violations in connection with the sale and marketing of the RELIEVA STRATUS
®
Spacer. There are no charges against Acclarent, Ethicon, Inc. or Johnson & Johnson in this matter.
In August 2012, DePuy Orthopaedics, Inc., DePuy, Inc. (now DePuy Synthes, Inc.), and Johnson & Johnson Services, Inc. received an informal request from the United States Attorney's Office for the District of Massachusetts and the Civil Division of the United States Department of Justice (the United States) for the production of materials relating to the DePuy ASR™ XL Hip device. In July 2014, the United States notified the United States District Court for the District of Massachusetts that it had declined to intervene in a qui tam case filed pursuant to the False Claims Act against the companies. In February 2016, the District Court granted the companies’ motion to dismiss with prejudice, unsealed the qui tam complaint, and denied the qui tam
|
80
|
||
relators’ request for leave to file a further amended complaint. The qui tam relators appealed the case to the United States Court of Appeals for the First Circuit. The First Circuit's decision in the case is pending. Since October 2013, a group of State Attorneys General have issued Civil Investigative Demands relating to the development, sales and marketing of several of DePuy Orthopaedics, Inc.'s hip products. The states are seeking monetary and injunctive relief. In July 2014, the Oregon Department of Justice, which was investigating these matters independently of the other states, announced a settlement of its ASR XL Hip device investigation for a total payment of
$4 million
to the State of Oregon.
In October 2012, Johnson & Johnson was contacted by the California Attorney General's office regarding a multi-state Attorney General investigation of the marketing of surgical mesh products for hernia and urogynecological purposes by Johnson & Johnson's subsidiary, Ethicon, Inc. (Ethicon). Johnson & Johnson and Ethicon have since entered into a series of tolling agreements with the 47 states and the District of Columbia participating in the multi-state investigation and have responded to Civil Investigative Demands served by certain of the participating states. The states are seeking monetary and injunctive relief. In May 2016, California and Washington filed civil complaints against Johnson & Johnson and Ethicon alleging violations of their consumer protection statutes. In August 2016, Kentucky filed a similar complaint against the companies. Johnson & Johnson and Ethicon have entered into a new tolling agreement with the remaining 44 states and the District of Columbia.
In December 2012, Therakos, Inc. (Therakos), formerly a subsidiary of Johnson & Johnson and part of the Ortho-Clinical Diagnostics, Inc. (OCD) franchise, received a letter from the civil division of the United States Attorney's Office for the Eastern District of Pennsylvania informing Therakos that the United States Attorney's Office was investigating the sales and marketing of Uvadex
®
(methoxsalen) and the Uvar Xts
®
System during the period 2000 to the present. The United States Attorney's Office requested that OCD and Johnson & Johnson preserve documents that could relate to the investigation. Therakos was subsequently acquired by an affiliate of Gores Capital Partners III, L.P. in January 2013, and OCD was divested in June 2014. Following the divestiture of OCD, Johnson & Johnson retains OCD’s portion of any liability that may result from the investigation for activity that occurred prior to the sale of Therakos. In March 2014 and March 2016, the United States Attorney’s Office requested that Johnson & Johnson produce certain documents, and Johnson & Johnson is cooperating with the requests.
In June 2014, the Mississippi Attorney General filed a complaint in Chancery Court of The First Judicial District of Hinds County, Mississippi against Johnson & Johnson and Johnson & Johnson Consumer Companies, Inc. (now Johnson & Johnson Consumer Inc.) (JJCI). The complaint alleges that defendants failed to disclose alleged health risks associated with female consumers' use of talc contained in JOHNSON'S
®
Baby Powder and JOHNSON'S
®
Shower to Shower (a product no longer sold by JJCI) and seeks injunctive and monetary relief. This matter is currently scheduled for trial in September 2017.
In March 2016, Janssen Pharmaceuticals, Inc. (JPI) received a Civil Investigative Demand from the United States Attorney’s Office for the Southern District of New York related to JPI’s contractual relationships with pharmacy benefit managers over the period from January 1, 2006 to the present with regard to certain of JPI's pharmaceutical products. The demand was issued in connection with an investigation under the False Claims Act.
In January 2017, Janssen Pharmaceuticals, Inc. (JPI) received a Civil Investigative Demand (CID) from the United States Department of Justice (DOJ) relating to allegations concerning the sales and marketing practices of OLYSIO
TM
. JPI is cooperating with DOJ in appropriately responding to the CID.
In February 2017, Johnson & Johnson received a subpoena from the United States Attorney's Office for the District of Massachusetts seeking the production of records pertaining to payments to any 501(c)(3) charitable organization that provides financial assistance to Medicare patients. Multiple pharmaceutical companies have publicly reported receipt of similar subpoenas and ongoing inquiries.
In recent years, Johnson & Johnson has received numerous requests from a variety of United States Congressional Committees to produce information relevant to ongoing congressional inquiries. It is the policy of Johnson & Johnson to cooperate with these inquiries by producing the requested information.
GENERAL LITIGATION
In June 2009, following the public announcement that Ortho-Clinical Diagnostics, Inc. (OCD) had received a grand jury subpoena from the United States Department of Justice, Antitrust Division, in connection with an investigation that has since been closed, multiple class action complaints were filed against OCD by direct purchasers seeking damages for alleged price fixing. These cases were consolidated for pre-trial purposes in the United States District Court for the Eastern District of Pennsylvania as In re Blood Reagent Antitrust Litigation. In August 2012, the District Court granted a motion filed by the plaintiffs for class certification. In April 2015, the United States Court of Appeals for the Third Circuit reversed the class
|
81
|
||
certification ruling and remanded the case to the District Court for further proceedings. In October 2015, the District Court again granted the motion by the plaintiffs for class certification. In July 2016, OCD filed a motion for summary judgment. OCD was divested in 2014 and Johnson & Johnson retained any liability that may result from these cases.
In September 2011, Johnson & Johnson, Johnson & Johnson Inc. and McNeil Consumer Healthcare Division of Johnson & Johnson Inc. received a Notice of Civil Claim filed by Nick Field in the Supreme Court of British Columbia, Canada (the BC Civil Claim). The BC Civil Claim is a putative class action brought on behalf of persons who reside in British Columbia and who purchased during the period between September 20, 2001 and in or about December 2010 one or more various McNeil infants' or children's over-the-counter medicines that were manufactured at the Fort Washington, Pennsylvania facility. The BC Civil Claim alleges that the defendants violated the BC Business Practices and Consumer Protection Act, and other Canadian statutes and common laws, by selling medicines that were allegedly not safe and/or effective or did not comply with Canadian Good Manufacturing Practices. The class certification hearing scheduled for October 2015 was adjourned, and there is currently no date set for that hearing.
In May 2014,
two
purported class actions were filed in federal court, one in the United States District Court for the Central District of California and one in the United States District Court for the Southern District of Illinois, against Johnson & Johnson (J&J) and Johnson & Johnson Consumer Companies, Inc. (now Johnson & Johnson Consumer Inc.) (JJCI), alleging violations of state consumer fraud statutes based on nondisclosure of alleged health risks associated with talc contained in JOHNSON'S
®
Baby Powder and JOHNSON'S
®
Shower to Shower (a product no longer sold by JJCI). Both cases seek injunctive relief and monetary damages; neither includes a claim for personal injuries. In October 2016, both cases were transferred to the United States District Court for the District Court of New Jersey as part of a newly created federal multi-district litigation. In December 2016, J&J and JJCI filed a motion to dismiss one of the cases.
In August 2014, United States Customs and Border Protection (US CBP) issued a Penalty Notice against Janssen Ortho LLC (Janssen Ortho), assessing penalties for the alleged improper classification of darunavir ethanolate (the active pharmaceutical ingredient in PREZISTA
®
) in connection with its importation into the United States. In October 2014, Janssen Ortho submitted a Petition for Relief in response to the Penalty Notice. In May 2015, US CBP issued an Amended Penalty Notice assessing substantial penalties and Janssen Ortho filed its Petition for Relief in July 2015.
In March and April 2015, over 30 putative class action complaints were filed by contact lens patients in a number of courts around the United States against Johnson & Johnson Vision Care, Inc. (JJVCI), other contact lens manufacturers, distributors, and retailers, alleging vertical and horizontal conspiracies to fix the retail prices of contact lenses. The complaints allege that the manufacturers reached agreements with each other and certain distributors and retailers concerning the prices at which some contact lenses could be sold to consumers. The plaintiffs are seeking damages and injunctive relief. All of the class action cases were transferred to the United States District Court for the Middle District of Florida in June 2015. The plaintiffs filed a Consolidated Class Action complaint in November 2015, and in December 2015, JJVCI and other defendants filed motions to dismiss. In June 2016, the Court denied the motions to dismiss. Discovery is ongoing.
In April 2015, Johnson & Johnson Vision Care, Inc. (JJVCI) filed a complaint in the United States District Court for the District of Utah against the State of Utah seeking a declaratory judgment that a law passed by the State to ban unilateral pricing policies solely in the contact lens market violates the Commerce Clause of the United States Constitution. The Court denied JJVCI's motion for a preliminary injunction. JJVCI appealed. Argument on the appeal was held in August 2015. In December 2016, the appellate court denied JJVCI's appeal.
In April 2015, Adimmune Corporation Ltd (Adimmune) commenced an arbitration in the International Court of Arbitration - International Chamber of Commerce against Crucell Switzerland AG (now Janssen Vaccines AG) and Crucell Holland B.V. (now Janssen Vaccines & Prevention B.V.) (collectively, Crucell). Adimmune claims that Crucell breached certain agreements relating to the supply of flu antigen when Crucell ceased purchasing flu antigen from Adimmune. In December 2015, Adimmune filed its Statement of Claim seeking monetary damages. The arbitration hearing took place in November 2016 and the parties are awaiting a ruling.
In August 2015, two third-party payors filed a purported class action in the United States District Court for the Eastern District of Louisiana against Janssen Research & Development, LLC, Janssen Ortho LLC, Janssen Pharmaceuticals, Inc., Ortho-McNeil-Janssen Pharmaceuticals, Inc. and Johnson & Johnson (as well as certain Bayer entities), alleging that the defendants improperly marketed and promoted XARELTO
®
as safer and more effective than less expensive alternative medications while failing to fully disclose its risks. The complaint seeks damages in an unspecified amount.
Johnson & Johnson or its subsidiaries are also parties to a number of proceedings brought under the Comprehensive Environmental Response, Compensation, and Liability Act, commonly known as Superfund, and comparable state, local or foreign laws in which the primary relief sought is the cost of past and/or future remediation.
|
82
|
||
22. Restructuring
The Company announced restructuring actions in its Medical Devices segment to better serve the needs of patients and customers in today’s evolving healthcare marketplace. The Company is undertaking actions to strengthen its go-to-market model, accelerate the pace of innovation, further prioritize key platforms and geographies, and streamline operations while maintaining high quality standards.
The Company estimates that, in connection with its plans, it will record pre-tax restructuring related charges of approximately
$2.0 billion
to
$2.4 billion
. In 2016, the Company recorded a pre-tax charge of
$685 million
, of which
$45 million
was included in cost of products sold and
$149 million
was included in other (income) expense. See table below for additional details. Total project costs of
$1.275 billion
have been recorded since the restructuring has been announced.
Additionally, as part of the plan, the Company expects that the restructuring actions will result in position eliminations of approximately
4
to
6
percent of the Medical Devices segment’s global workforce over the next
two
years, subject to any consultation procedures in countries, where required. Approximately
1,500
positions have been eliminated since the restructuring was announced.
The Company estimates that approximately one-half of the cumulative pre-tax costs will result in cash outlays, including approximately
$500 million
of employee severance. Approximately one half of the cumulative pre-tax costs are non-cash, relating primarily to facility rationalization, inventory write-offs and intangible asset write-offs.
The following table summarizes the severance charges and the associated spending under this initiative through the fiscal year ended 2016:
|
(Dollars in Millions)
|
Severance
|
Asset Write-offs
|
Other**
|
Total
|
|||||
|
2015 restructuring charge
|
$
|
484
|
|
86
|
|
20
|
|
590
|
|
|
2015 activity
|
(86
|
)
|
(3
|
)
|
(89
|
)
|
|||
|
Reserve balance, January 3, 2016
|
484
|
|
—
|
|
17
|
|
501
|
|
|
|
Current year activity:
|
|
|
|
|
|||||
|
Charges
|
—
|
|
249
|
|
436
|
|
685
|
|
|
|
Cash payments
|
(104
|
)
|
—
|
|
(452
|
)
|
(556
|
)
|
|
|
Settled non cash
|
—
|
|
(249
|
)
|
—
|
|
(249
|
)
|
|
|
Reserve balance, January 1, 2017*
|
$
|
380
|
|
—
|
|
1
|
|
381
|
|
*Cash outlays for severance are expected to be substantially paid out over the next 18 months in accordance with the Company's plans and local laws.
**Other includes project expense such as salaries for employees supporting the initiative and consulting expenses.
|
83
|
||
Report of Independent Registered Public Accounting Firm
To the Shareholders and Board of Directors of Johnson & Johnson
In our opinion, the accompanying consolidated balance sheets and the related consolidated statements of earnings, of comprehensive income, of equity, and of cash flows present fairly, in all material respects, the financial position of Johnson & Johnson and its subsidiaries at January 1, 2017 and January 3, 2016, and the results of their operations and their cash flows for each of the three years in the period ended January 1, 2017
in conformity with accounting principles generally accepted in the United States of America. Also in our opinion, the Company maintained, in all material respects, effective internal control over financial reporting as of January 1, 2017, based on criteria established in
Internal Control - Integrated Framework
(2013) issued by the Committee of Sponsoring Organizations of the Treadway Commission (COSO). The Company's management is responsible for these financial statements, for maintaining effective internal control over financial reporting and for its assessment of the effectiveness of internal control over financial reporting, included in the accompanying
Management's Report on Internal Control over Financial Reporting. Our responsibility is to express opinions on these financial statements and on the Company's internal control over financial reporting based on our integrated audits. We conducted our audits in accordance with the standards of the Public Company Accounting Oversight Board (United States). Those standards require that we plan and perform the audits to obtain reasonable assurance about whether the financial statements are free of material misstatement and whether effective internal control over financial reporting was maintained in all material respects. Our audits of the financial statements included examining, on a test basis, evidence supporting the amounts and disclosures in the financial statements, assessing the accounting principles used and significant estimates made by management, and evaluating the overall financial statement presentation. Our audit of internal control over financial reporting included obtaining an understanding of internal control over financial reporting, assessing the risk that a material weakness exists, and testing and evaluating the design and operating effectiveness of internal control based on the assessed risk. Our audits also included performing such other procedures as we considered necessary in the circumstances. We believe that our audits provide a reasonable basis for our opinions.
As discussed in Note 1 to the consolidated financial statements, the Company changed the manner in which it accounts for and presents certain elements of share based payments in 2016.
A company’s internal control over financial reporting is a process designed to provide reasonable assurance regarding the reliability of financial reporting and the preparation of financial statements for external purposes in accordance with generally accepted accounting principles. A company’s internal control over financial reporting includes those policies and procedures that (i) pertain to the maintenance of records that, in reasonable detail, accurately and fairly reflect the transactions and dispositions of the assets of the company; (ii) provide reasonable assurance that transactions are recorded as necessary to permit preparation of financial statements in accordance with generally accepted accounting principles, and that receipts and expenditures of the company are being made only in accordance with authorizations of management and directors of the company; and (iii) provide reasonable assurance regarding prevention or timely detection of unauthorized acquisition, use, or disposition of the company’s assets that could have a material effect on the financial statements.
Because of its inherent limitations, internal control over financial reporting may not prevent or detect misstatements. Also, projections of any evaluation of effectiveness to future periods are subject to the risk that controls may become inadequate because of changes in conditions, or that the degree of compliance with the policies or procedures may deteriorate.
/s/ PricewaterhouseCoopers LLP
Florham Park, New Jersey
February 27, 2017
|
84
|
||
Management’s Report on Internal Control Over Financial Reporting
Under Section 404 of the Sarbanes-Oxley Act of 2002, management is required to assess the effectiveness of the Company’s internal control over financial reporting as of the end of each fiscal year and report, based on that assessment, whether the Company’s internal control over financial reporting is effective.
Management of the Company is responsible for establishing and maintaining adequate internal control over financial reporting. The Company’s internal control over financial reporting is designed to provide reasonable assurance as to the reliability of the Company’s financial reporting and the preparation of external financial statements in accordance with generally accepted accounting principles.
Internal controls over financial reporting, no matter how well designed, have inherent limitations. Therefore, internal control over financial reporting determined to be effective can provide only reasonable assurance with respect to financial statement preparation and may not prevent or detect all misstatements. Moreover, projections of any evaluation of effectiveness to future periods are subject to the risk that controls may become inadequate because of changes in conditions, or that the degree of compliance with the policies or procedures may deteriorate.
The Company’s management has assessed the effectiveness of the Company’s internal control over financial reporting as of January 1, 2017. In making this assessment, the Company used the criteria established by the Committee of Sponsoring Organizations of the Treadway Commission (COSO) in “Internal Control-Integrated Framework (2013).” These criteria are in the areas of control environment, risk assessment, control activities, information and communication, and monitoring. The Company’s assessment included extensive documenting, evaluating and testing the design and operating effectiveness of its internal controls over financial reporting.
Based on the Company’s processes and assessment, as described above, management has concluded that, as of January 1, 2017, the Company’s internal control over financial reporting was effective.
The effectiveness of the Company’s internal control over financial reporting as of January 1, 2017 has been audited by PricewaterhouseCoopers LLP, an independent registered public accounting firm, as stated in their report, which appears herein.
|
/s/ Alex Gorsky
|
/s/ Dominic J. Caruso
|
|
|
Alex Gorsky
|
|
Dominic J. Caruso
|
|
Chairman, Board of Directors
|
|
Executive Vice President, Chief Financial Officer
|
|
Chief Executive Officer
|
|
|
|
85
|
||
Shareholder Return Performance Graphs
Set forth below are line graphs comparing the cumulative total shareholder return on the Company’s Common Stock for periods of five years and ten years ending December 31, 2016, against the cumulative total return of the Standard & Poor’s 500 Stock Index, the Standard & Poor’s Pharmaceutical Index and the Standard & Poor’s Health Care Equipment Index. The graphs and tables assume that $100 was invested on December 31, 2011 and December 31, 2006 in each of the Company’s Common Stock, the Standard & Poor’s 500 Stock Index, the Standard & Poor’s Pharmaceutical Index and the Standard & Poor’s Health Care Equipment Index and that all dividends were reinvested.
5 Year Shareholder Return Performance J&J vs. Indices

|
2011
|
2012
|
2013
|
2014
|
2015
|
2016
|
|
|
Johnson & Johnson
|
$100.00
|
$110.83
|
$149.19
|
$175.05
|
$177.08
|
$204.21
|
|
S&P 500 Index
|
$100.00
|
$115.99
|
$153.55
|
$174.55
|
$176.95
|
$198.10
|
|
S&P Pharmaceutical Index
|
$100.00
|
$114.43
|
$154.73
|
$189.12
|
$200.06
|
$196.93
|
|
S&P Healthcare Equipment Index
|
$100.00
|
$117.27
|
$149.74
|
$189.09
|
$200.39
|
$213.38
|
10 Year Shareholder Return Performance J&J vs. Indices
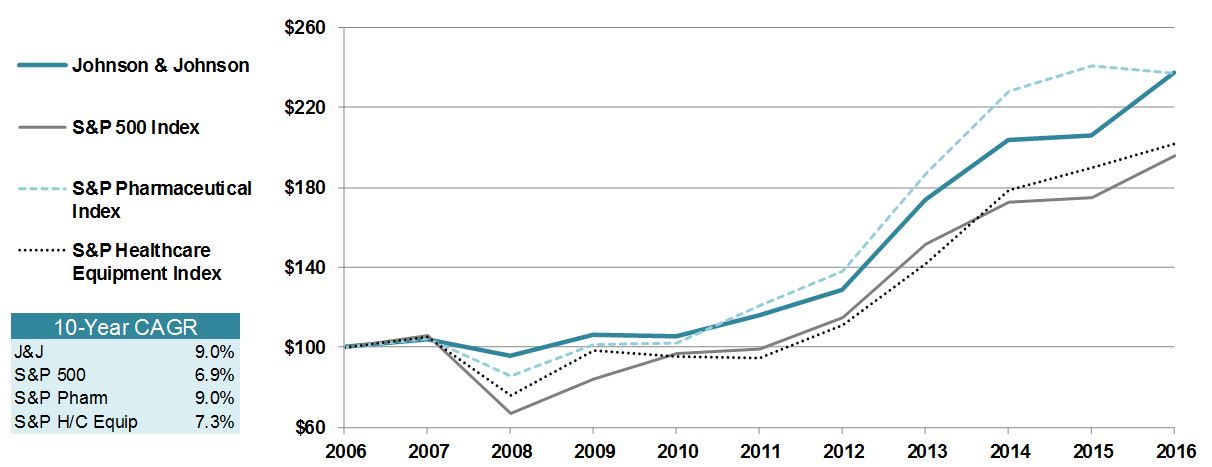
|
2006
|
2007
|
2008
|
2009
|
2010
|
2011
|
2012
|
2013
|
2014
|
2015
|
2016
|
|
|
Johnson & Johnson
|
$100.00
|
$103.61
|
$95.56
|
$106.34
|
$105.72
|
$116.17
|
$128.75
|
$173.32
|
$203.36
|
$205.72
|
$237.24
|
|
S&P 500 Index
|
$100.00
|
$105.57
|
$66.51
|
$84.10
|
$96.76
|
$98.80
|
$114.60
|
$151.71
|
$172.46
|
$174.83
|
$195.72
|
|
S&P Pharmaceutical Index
|
$100.00
|
$104.66
|
$85.61
|
$101.55
|
$102.34
|
$120.51
|
$137.90
|
$186.48
|
$227.91
|
$241.09
|
$237.32
|
|
S&P Healthcare Equipment Index
|
$100.00
|
$105.13
|
$76.07
|
$97.97
|
$95.32
|
$94.55
|
$110.88
|
$141.58
|
$178.79
|
$189.47
|
$201.76
|
|
86
|
||
|
Item 9.
|
CHANGES IN AND DISAGREEMENTS WITH ACCOUNTANTS ON ACCOUNTING AND FINANCIAL DISCLOSURE
|
Not applicable.
|
Item 9A.
|
CONTROLS AND PROCEDURES
|
Disclosure Controls and Procedures.
At the end of the period covered by this Report, the Company evaluated the effectiveness of the design and operation of its disclosure controls and procedures. The Company’s disclosure controls and procedures are designed to ensure that information required to be disclosed by the Company in the reports that it files or submits under the Exchange Act is recorded, processed, summarized and reported within the time periods specified in the SEC’s rules and forms. Disclosure controls and procedures include, without limitation, controls and procedures designed to ensure that information required to be disclosed by the Company in the reports that it files or submits under the Exchange Act is accumulated and communicated to the Company’s management, including its principal executive and principal financial officers, or persons performing similar functions, as appropriate to allow timely decisions regarding required disclosure. Alex Gorsky, Chairman and Chief Executive Officer, and Dominic J. Caruso, Executive Vice President, Chief Financial Officer, reviewed and participated in this evaluation. Based on this evaluation, Messrs. Gorsky and Caruso concluded that, as of the end of the period covered by this Report, the Company’s disclosure controls and procedures were effective
Reports on Internal Control Over Financial Reporting.
The information called for by this item is incorporated herein by reference to "Management’s Report on Internal Control Over Financial Reporting", and the attestation regarding internal controls over financial reporting included in the "Report of Independent Registered Public Accounting Firm" included in Item 8 of this Report.
Changes in Internal Control Over Financial Reporting.
During the fiscal quarter ended January 1, 2017, there were no changes in the Company’s internal control over financial reporting identified in connection with the evaluation required under Rules 13a-15 and 15d-15 under the Exchange Act that have materially affected, or are reasonably likely to materially affect, the Company’s internal control over financial reporting.
The Company is implementing a multi-year, enterprise-wide initiative to integrate, simplify and standardize processes and systems for the human resources, information technology, procurement, supply chain and finance functions. These are enhancements to support the growth of the Company’s financial shared service capabilities and standardize financial systems. This initiative is not in response to any identified deficiency or weakness in the Company’s internal control over financial reporting. In response to this initiative, the Company has and will continue to align and streamline the design and operation of its financial control environment.
|
Item 9B.
|
OTHER INFORMATION
|
Not applicable.
|
Item 10.
|
DIRECTORS, EXECUTIVE OFFICERS AND CORPORATE GOVERNANCE
|
The information called for by this item is incorporated herein by reference to the discussion of the Audit Committee under the caption “Item 1. Election of Directors - Board Committees”; and the material under the captions “Item 1. Election of Directors” and “Stock Ownership and Section 16 Compliance – Section 16(a) Beneficial Ownership Reporting Compliance” in the Proxy Statement; and the material under the caption “Executive Officers of the Registrant” in Part I of this Report.
The Company’s Code of Business Conduct, which covers all employees (including the Chief Executive Officer, Chief Financial Officer and Controller), meets the requirements of the SEC rules promulgated under Section 406 of the Sarbanes-Oxley Act of 2002. The Code of Business Conduct is available on the Company’s website at
www.jnj.com/code-of-business-conduct
, and copies are available to shareholders without charge upon written request to the Secretary at the Company’s principal executive offices. Any substantive amendment to the Code of Business Conduct or any waiver of the Code granted to the Chief Executive Officer, the Chief Financial Officer or the Controller will be posted on the Company’s website at
www.investor.jnj.com/gov.cfm
within five business days (and retained on the website for at least one year).
In addition, the Company has adopted a Code of Business Conduct & Ethics for Members of the Board of Directors and Executive Officers. The Code of Business Conduct & Ethics for Members of the Board of Directors and Executive Officers is available on the Company’s website at
www.investor.jnj.com/gov/boardconduct.cfm
, and copies are available to shareholders without charge upon written request to the Secretary at the Company’s principal executive offices. Any substantive amendment to the Code or any waiver of the Code granted to any member of the Board of Directors or any executive officer will be posted
|
87
|
||
on the Company’s website at
www.investor.jnj.com/gov.cfm
within five business days (and retained on the website for at least one year).
|
Item 11.
|
EXECUTIVE COMPENSATION
|
The information called for by this item is incorporated herein by reference to the material under the captions “Item 1. Election of Directors – Director Compensation,” “Compensation Committee Report,” “Compensation Discussion and Analysis” and “Executive Compensation Tables” in the Proxy Statement.
The material incorporated herein by reference to the material under the caption “Compensation Committee Report” in the Proxy Statement shall be deemed furnished, and not filed, in this Report and shall not be deemed incorporated by reference into any filing under the Securities Act of 1933, as amended, or the Securities Exchange Act of 1934, as amended, as a result of this furnishing, except to the extent that the Company specifically incorporates it by reference.
|
Item 12.
|
SECURITY OWNERSHIP OF CERTAIN BENEFICIAL OWNERS AND MANAGEMENT AND RELATED STOCKHOLDER MATTERS
|
The information called for by this item is incorporated herein by reference to the material under the caption “Item 1. Stock Ownership and Section 16 Compliance” in the Proxy Statement; and Note 17 “Common Stock, Stock Option Plans and Stock Compensation Agreements” of the Notes to Consolidated Financial Statements in Item 8 of this Report.
Equity Compensation Plan Information
The following table provides certain information as of January 1, 2017 concerning the shares of the Company’s Common Stock that may be issued under existing equity compensation plans.
|
Plan Category
|
Number of Securities to
be Issued Upon Exercise of
Outstanding Options and Rights
|
Weighted Average
Exercise Price of
Outstanding Options and Rights
|
Number of Securities
Remaining Available for
Future Issuance Under Equity Compensation Plans
(2)(3)
|
||||||
|
Equity Compensation Plans Approved by Security Holders
(1)
|
137,289,904
|
|
|
$68.72
|
|
439,398,804
|
|
||
|
Equity Compensation Plans Not Approved by Security Holders
|
-
|
|
-
|
|
-
|
|
|||
|
Total
|
137,289,904
|
|
|
$68.72
|
|
439,398,804
|
|
||
|
(1)
|
Included in this category are the following equity compensation plans which have been approved by the Company’s shareholders: 2005 Long-Term Incentive Plan and 2012 Long-Term Incentive Plan.
|
|
(2)
|
This column excludes shares reflected under the column “Number of Securities to be Issued Upon Exercise of Outstanding Options and Rights.”
|
|
(3)
|
The 2005 Long-Term Incentive Plan expired April 26, 2012. All options and restricted shares granted subsequent to that date were under the 2012 Long-Term Incentive Plan.
|
|
Item 13.
|
CERTAIN RELATIONSHIPS AND RELATED TRANSACTIONS, AND DIRECTOR INDEPENDENCE
|
The information called for by this item is incorporated herein by reference to the material under the captions “Item 1. Election of Directors - Director Independence” and “Related Party Transactions” in the Proxy Statement.
|
Item 14.
|
PRINCIPAL ACCOUNTANT FEES AND SERVICES
|
The information called for by this item is incorporated herein by reference to the material under the caption “Item 5. Ratification of Appointment of Independent Registered Public Accounting Firm” in the Proxy Statement.
|
88
|
||
|
Item 15.
|
EXHIBITS AND FINANCIAL STATEMENT SCHEDULES
|
The following documents are filed as part of this report:
1.
Financial Statements
Consolidated Balance Sheets at end of Fiscal Years 2016 and 2015
Consolidated Statements of Earnings for Fiscal Years 2016, 2015 and 2014
Consolidated Statements of Comprehensive Income for Fiscal Years 2016, 2015 and 2014
Consolidated Statements of Equity for Fiscal Years 2016, 2015 and 2014
Consolidated Statements of Cash Flows for Fiscal Years 2016, 2015 and 2014
Notes to Consolidated Financial Statements
Report of Independent Registered Public Accounting Firm
All schedules are omitted because they are not applicable or the required information is included in the financial statements or notes.
2.
Exhibits
Required
to be Filed by Item 60l of Regulation S-K
The information called for by this item is incorporated herein by reference to the Exhibit Index in this Report.
Registrants may voluntarily include a summary of information required by Form 10-K under this Item 16. The Company has elected not to include such summary information.
|
89
|
||
SIGNATURES
Pursuant to the requirements of Section 13 of the Securities Exchange Act of 1934, the registrant has duly caused this Report to be signed on its behalf by the undersigned, thereunto duly authorized.
Date: February 27, 2017
|
JOHNSON & JOHNSON
|
|
(Registrant)
|
|
By
|
/s/ A. Gorsky
|
|
A. Gorsky, Chairman, Board of Directors,
and Chief Executive Officer |
|
Pursuant to the requirements of the Securities Exchange Act of 1934, this report has been signed below by the following persons on behalf of the registrant and in the capacities and on the dates indicated.
|
Signature
|
|
Title
|
|
Date
|
|
|
|
|
|
|
|
/s/ A. Gorsky
|
|
Chairman, Board of Directors
|
|
February 27, 2017
|
|
A. Gorsky
|
Chief Executive Officer
(Principal Executive Officer)
|
|||
|
|
|
|
|
|
|
/s/ D. J. Caruso
|
|
Chief Financial Officer
|
|
February 27, 2017
|
|
D. J. Caruso
|
(Principal Financial Officer)
|
|||
|
|
|
|
|
|
|
/s/ R. A. Kapusta
|
|
Controller and Chief Accounting Officer
|
|
February 27, 2017
|
|
R. A. Kapusta
|
(Principal Accounting Officer)
|
|||
|
|
|
|
|
|
|
/s/ M. C. Beckerle
|
Director
|
February 27, 2017
|
||
|
M. C. Beckerle
|
||||
|
/s/ D. S. Davis
|
|
Director
|
|
February 27, 2017
|
|
D. S. Davis
|
||||
|
|
|
|
|
|
|
/s/ I. E. L. Davis
|
|
Director
|
|
February 27, 2017
|
|
I. E. L. Davis
|
|
|
|
|
|
90
|
||
|
Signature
|
|
Title
|
|
Date
|
|
/s/ M. B. McClellan
|
Director
|
February 27, 2017
|
||
|
M. B. McClellan
|
||||
|
|
|
|
|
|
|
/s/ A. M. Mulcahy
|
|
Director
|
|
February 27, 2017
|
|
A. M. Mulcahy
|
||||
|
|
|
|
|
|
|
/s/ W. D. Perez
|
|
Director
|
|
February 27, 2017
|
|
W. D. Perez
|
||||
|
|
|
|
|
|
|
/s/ C. Prince
|
|
Director
|
|
February 27, 2017
|
|
C. Prince
|
||||
|
|
|
|
|
|
|
/s/ A. E. Washington
|
|
Director
|
|
February 27, 2017
|
|
A. E. Washington
|
||||
|
/s/ R. A. Williams
|
|
Director
|
|
February 27, 2017
|
|
R. A. Williams
|
||||
|
91
|
||
EXHIBIT INDEX
|
Reg. S-K
|
|
|
|
Exhibit Table
|
Description
|
|
|
Item No.
|
of Exhibit
|
|
|
3(i)
|
Restated Certificate of Incorporation effective February 19, 2016 — Incorporated herein by reference to Exhibit 3(i) of the Registrant’s Form 10-K Annual Report for the fiscal year ended January 3, 2016.
|
|
|
3(ii)
|
By-Laws of the Company, as amended effective January 26, 2016 — Incorporated herein by reference to Exhibit 3.1 the Registrant’s Form 8-K Current Report filed January 26, 2016.
|
|
|
4(a)
|
Upon the request of the Securities and Exchange Commission, the Registrant will furnish a copy of all instruments defining the rights of holders of long-term debt of the Registrant.
|
|
|
10(a)
|
2005 Long-Term Incentive Plan — Incorporated herein by reference to Exhibit 4 of the Registrant’s S-8 Registration Statement filed with the Commission on May 10, 2005 (file no. 333-124785).*
|
|
|
10(b)
|
Form of Stock Option Certificate, Restricted Share Unit Certificate and Performance Share Unit Certificate under the 2005 Long-Term Incentive Plan — Incorporated herein by reference to Exhibits 10.1, 10.2 and 10.3 of the Registrant’s Form 8-K Current Report filed January 13, 2012.*
|
|
|
10(c)
|
2012 Long-Term Incentive Plan — Incorporated herein by reference to Appendix A of the Registrant’s Proxy Statement filed with the Commission on March 14, 2012 .*
|
|
|
10(d)
|
Form of Stock Option Certificate, Restricted Share Unit Certificate and Performance Share Unit Certificate under the 2012 Long-Term Incentive Plan — Incorporated herein by reference to Exhibits 10.2, 10.3 and 10.4 of the Registrant’s Form 10-Q Quarterly Report filed May 7, 2012.*
|
|
|
10(e)
|
Executive Incentive Plan (as amended) — Incorporated herein by reference to Exhibit 10(f) of the Registrant’s Form 10-K Annual Report for the fiscal year ended December 31, 2000.*
|
|
|
10(f)
|
Domestic Deferred Compensation (Certificate of Extra Compensation) Plan — Incorporated herein by reference to Exhibit 10(g) of the Registrant’s Form 10-K Annual Report for the year ended December 28, 2003.*
|
|
|
10(g)
|
Amendments to the Certificate of Extra Compensation Plan effective as of January 1, 2009 — Incorporated herein by reference to Exhibit 10(j) of the Registrant’s Form 10-K Annual Report for the year ended December 28, 2008.*
|
|
|
10(h)
|
2009 Certificates of Long-Term Performance Plan — Incorporated herein by reference to Exhibit 10.1 of the Registrant’s Form 10-Q Quarterly Report for the quarter ended September 27, 2009.*
|
|
|
10(i)
|
Amended and Restated Deferred Fee Plan for Directors — Incorporated herein by reference to Exhibit 10(k) of the Registrant's Form 10-K Annual Report for the fiscal year ended January 1, 2012.*
|
|
|
10(j)
|
Executive Income Deferral Plan (Amended and Restated) — Incorporated herein by reference to Exhibit 10.1 of the Registrant’s Form 10-Q Quarterly Report for the quarter ended September 30, 2012.*
|
|
|
10(k)
|
Excess Savings Plan — Incorporated herein by reference to Exhibit 10(j) of the Registrant’s Form 10-K Annual Report for the fiscal year ended December 29, 1996.*
|
|
|
10(l)
|
Amendments to the Johnson & Johnson Excess Savings Plan effective as of January 1, 2009 — Incorporated herein by reference to Exhibit 10(p) of the Registrant’s Form 10-K Annual Report for the fiscal year ended December 28, 2008.*
|
|
|
10(m)
|
Excess Benefit Plan (Supplemental Retirement Plan) — Incorporated herein by reference to Exhibit 10(h) of the Registrant’s Form 10-K Annual Report for the fiscal year ended January 3, 1993.*
|
|
|
10(n)
|
Amendments to the Excess Benefit Plan of Johnson & Johnson and Affiliated Companies effective as of January 1, 2009 — Incorporated herein by reference to Exhibit 10(r) of the Registrant’s Form 10-K Annual Report for the fiscal year ended December 28, 2008.*
|
|
|
10(o)
|
Amendment to the Excess Benefit Plan of Johnson & Johnson and Affiliated Companies, effective as of January 1, 2015 — Incorporated herein by reference to Exhibit 10(q) of the Registrant’s Form 10-K Annual Report for the fiscal year ended December 28, 2014.*
|
|
|
10(p)
|
Executive Life Plan Agreement — Incorporated herein by reference to Exhibit 10(i) of the Registrant’s Form 10-K Annual Report for the fiscal year ended January 3, 1993.*
|
|
|
10(q)
|
Executive Life Plan Agreement Closure Letter — Incorporated herein by reference to Exhibit 10.1 of the Registrant’s Form 10-Q Quarterly Report for the quarter ended March 29, 2015.*
|
|
|
10(r)
|
Johnson & Johnson Retirement Savings Plan, Johnson & Johnson Savings Plan for Union Represented Employees, and Johnson & Johnson Savings Plan - Incorporated herein by reference to Exhibits 99.1, 99.2 and 99.3 of the Registrant's Form S-8 filed with the Commission on May 6, 2013.*
|
|
|
10(s)
|
Employment Agreement for Dr. Paulus Stoffels - Incorporated herein by reference to Exhibit 10.2 of the Registrant’s Form 10-Q Quarterly Report for the quarter ended September 30, 2012.*
|
|
|
10(t)
|
Summary of Employment Arrangements for Sandra E. Peterson — Incorporated herein by reference to Exhibit 10(t) of the Registrant's Form 10-K Annual Report for the year ended December 30, 2012.*
|
|
|
92
|
||
|
Reg. S-K
|
|
|
|
Exhibit Table
|
Description
|
|
|
Item No.
|
of Exhibit
|
|
|
10(u)
|
Severance Pay Plan of Johnson & Johnson and U.S. Affiliated Companies, Amended and Restated as of October 1, 2014 — Incorporated herein by reference to Exhibit 10.1 of the Registrant's Form 10-Q Quarterly Report for the quarter ended September 28, 2014.*
|
|
|
10(v)
|
First Amendment to the Severance Pay Plan of Johnson & Johnson and U.S. Affiliated Companies (as amended and restated effective October 1, 2014) — Incorporated herein by reference to Exhibit 10.1 of the Registrant's Form 10-Q Quarterly Report for the quarter ended June 28, 2015.*
|
|
|
10(w)
|
Second Amendment to the Severance Pay Plan of Johnson & Johnson and U.S. Affiliated Companies (as amended and restated effective October 1, 2014) — Incorporated herein by reference to Exhibit 10(x) of the Registrant's Form 10-K Annual Report for the fiscal year ended January 3, 2016.*
|
|
|
12
|
Statement of Computation of Ratio of Earnings to Fixed Charges — Filed with this document.
|
|
|
21
|
Subsidiaries - Filed with this document.
|
|
|
23
|
Consent of Independent Registered Public Accounting Firm — Filed with this document.
|
|
|
31(a)
|
Certification of Chief Executive Officer Pursuant to Section 302 of the Sarbanes-Oxley Act — Filed with this document.
|
|
|
31(b)
|
Certification of Chief Financial Officer Pursuant to Section 302 of the Sarbanes-Oxley Act — Filed with this document.
|
|
|
32(a)
|
Certification of Chief Executive Officer Pursuant to Section 906 of the Sarbanes-Oxley Act — Furnished with this document.
|
|
|
32(b)
|
Certification of Chief Financial Officer Pursuant to Section 906 of the Sarbanes-Oxley Act — Furnished with this document.
|
|
|
101
|
XBRL (Extensible Business Reporting Language) The following materials from this Report for the fiscal year ended January 1, 2017, formatted in Extensive Business Reporting Language (XBRL): (i) Consolidated Balance Sheets, (ii) Consolidated Statements of Earnings, (iii) Consolidated Statements of Comprehensive Income, (iv) Consolidated Statements of Equity, (v) Consolidated Statements of Cash Flows, and (vi) Notes to the Consolidated Financial Statements.
|
|
|
*
|
Management contract or compensatory plan.
|
A copy of any of the Exhibits listed above will be provided without charge to any shareholder submitting a written request specifying the desired exhibit(s) to the Secretary at the principal executive offices of the Company.
|
93
|
||
TABLE OF CONTENTS
Part IItem 1. BusinessItem 1A. Risk FactorsItem 1B. Unresolved Staff CommentsItem 2. PropertiesItem 3. Legal ProceedingsItem 4. Mine Safety DisclosuresPart IIItem 5. Market For Registrant S Common Equity, Related Stockholder Matters and Issuer Purchases Of Equity SecuritiesItem 6. Selected Financial DataItem 7. Management S Discussion and Analysis Of Results Of Operations and Financial ConditionItem 7A. Quantitative and Qualitative Disclosures About Market RiskItem 8. Financial Statements and Supplementary DataItem 9. Changes in and Disagreements with Accountants on Accounting and Financial DisclosureItem 9A. Controls and ProceduresItem 9B. Other InformationPart IIIItem 10. Directors, Executive Officers and Corporate GovernanceItem 11. Executive CompensationItem 12. Security Ownership Of Certain Beneficial Owners and Management and Related Stockholder MattersItem 13. Certain Relationships and Related Transactions, and Director IndependenceItem 14. Principal Accountant Fees and ServicesPart IVItem 15. Exhibits and Financial Statement SchedulesItem 16. Form 10-k SummaryItem No. Of Exhibit