JOHNSON & JOHNSON
10-Ks and 10-Qs
|
|
|
|
|
|
|
|
|
|
|
|
|
|
|
|
|
|
|
|
|
|
|
|
|
|
|
|
|
|
|
|
|
|
|
|
|
|
|
|
|
|
|
|
|
|
|
|
|
|
UNITED STATES
SECURITIES AND EXCHANGE COMMISSION
Washington, D.C. 20549
FORM 10-Q
|
|
|
|
|
þ
|
|
Quarterly Report Pursuant to Section 13 or 15(d) of the Securities Exchange Act of 1934
for the quarterly period ended September 30, 2018
|
or
|
|
|
|
|
o
|
|
Transition Report Pursuant to Section 13 or 15(d) of the Securities Exchange Act of 1934
for the transition period from to
|
Commission file number 1-3215

(Exact name of registrant as specified in its charter)
|
NEW JERSEY
(State or other jurisdiction of
incorporation or organization)
|
|
22-1024240
(I.R.S. Employer
Identification No.)
|
One Johnson & Johnson Plaza
New Brunswick, New Jersey 08933
(Address of principal executive offices)
Registrant’s telephone number, including area code (732) 524-0400
Indicate by check mark whether the registrant (1) has filed all reports required to be filed by Section 13 or 15(d) of the Securities Exchange Act of 1934 during the preceding 12 months (or for such shorter period that the registrant was required to file such reports), and (2) has been subject to such filing requirements for the past 90 days.
þ
Yes
o
No
Indicate by check mark whether the registrant has submitted electronically every Interactive Data File required to be submitted pursuant to Rule 405 of Regulation S-T during the preceding 12 months (or for such shorter period that the registrant was required to submit such files).
þ
Yes
o
No
Indicate by check mark whether the registrant is a large accelerated filer, an accelerated filer, a non-accelerated filer, a smaller reporting company, or an emerging growth company. See the definitions of “large accelerated filer,” “accelerated filer,” “smaller reporting company,” and "emerging growth company" in Rule 12b-2 of the Exchange Act.
|
Large accelerated filer
þ
|
|
Accelerated filer
o
|
|
|
|
Non-accelerated filer
o
|
|
Smaller reporting company
o
|
|
|
|
Emerging growth company
o
|
||||
If an emerging growth company, indicated by check mark if the registrant has elected not to use the extended transition period for complying with any new or revised financial accounting standards provided pursuant to Section 13(a) of the Exchange Act.
o
Indicate by check mark whether the registrant is a shell company (as defined in Rule 12b-2 of the Exchange Act).
o
Yes
þ
No
Indicate the number of shares outstanding of each of the issuer’s classes of common stock, as of the latest practicable date.
On October 26, 2018, 2,681,977,969 shares of Common Stock, $1.00 par value, were outstanding.
JOHNSON & JOHNSON AND SUBSIDIARIES
TABLE OF CONTENTS
|
|
Page
|
|
|
|
No.
|
|
|
|
|
|
|
|
|
|
|
|
|
|
|
|
|
|
|
|
|
|
|
|
|
|
|
|
|
|
|
|
|
|
|
|
|
|
|
|
|
|
|
|
|
|
|
|
|
|
|
|
|
|
|
EX-31.1
|
||
|
EX-32.1
|
||
|
EX-101 INSTANCE DOCUMENT
|
||
|
EX-101 SCHEMA DOCUMENT
|
||
|
EX-101 CALCULATION LINKBASE DOCUMENT
|
||
|
EX-101 LABELS LINKBASE DOCUMENT
|
||
|
EX-101 PRESENTATION LINKBASE DOCUMENT
|
||
|
EX-101 DEFINITION LINKBASE DOCUMENT
|
||
CAUTIONARY NOTE REGARDING FORWARD-LOOKING STATEMENTS
This Quarterly Report on Form 10-Q
and Johnson & Johnson's other publicly available documents contain
“
forward-looking statements
”
within the meaning of the safe harbor provisions of the United States Private Securities Litigation Reform Act of 1995. Management and representatives of Johnson & Johnson and its subsidiaries (the Company) also may from time to time make forward-looking statements.
Forward-looking statements do not relate strictly to historical or current facts and reflect management’s assumptions, views, plans, objectives and projections about the future. Forward-looking statements may be identified by the use of words such as “plans,” “expects,” “will,” “anticipates,” “estimates,” and other words of similar meaning in conjunction with, among other things: discussions of future operations, expected operating results, financial performance; impact of planned acquisitions and dispositions; impact and timing of restructuring initiatives including associated cost savings and other benefits; the Company's strategy for growth; product development activities; regulatory approvals; market position and expenditures.
Because forward-looking statements are based on current beliefs, expectations and assumptions regarding future events, they are subject to uncertainties, risks and changes that are difficult to predict and many of which are outside of the Company's control. Investors should realize that if underlying assumptions prove inaccurate, or known or unknown risks or uncertainties materialize, the Company’s actual results and financial condition could vary materially from expectations and projections expressed or implied in its forward-looking statements. Investors are therefore cautioned not to rely on these forward-looking statements. Risks and uncertainties include, but are not limited to:
Risks Related to Product Development, Market Success and Competition
|
•
|
Challenges and uncertainties inherent in innovation and development of new and improved products and technologies on which the Company’s continued growth and success depend, including uncertainty of clinical outcomes, additional analysis of existing clinical data, obtaining regulatory approvals, health plan coverage and customer access, and initial and continued commercial success;
|
|
•
|
Challenges to the Company’s ability to obtain and protect adequate patent and other intellectual property rights for new and existing products and technologies in the United States and other important markets;
|
|
•
|
The impact of patent expirations, typically followed by the introduction of competing biosimilars and generics and resulting revenue and market share losses;
|
|
•
|
Increasingly aggressive and frequent challenges to the Company’s patents by competitors and others seeking to launch competing generic, biosimilar or other products and increased receptivity of courts, the United States Patent and Trademark Office and other decision makers to such challenges, potentially resulting in loss of market exclusivity and rapid decline in sales for the relevant product sooner than expected;
|
|
•
|
Competition in research and development of new and improved products, processes and technologies, which can result in product and process obsolescence;
|
|
•
|
Competition to reach agreement with third parties for collaboration, licensing, development and marketing agreements for products and technologies;
|
|
•
|
Competition based on cost-effectiveness, product performance, technological advances and patents attained by competitors; and
|
|
•
|
Allegations that the Company’s products infringe the patents and other intellectual property rights of third parties, which could adversely affect the Company’s ability to sell the products in question and require the payment of money damages and future royalties.
|
Risks Related to Product Liability, Litigation and Regulatory Activity
|
•
|
Product efficacy or safety concerns, whether or not based on scientific evidence, potentially resulting in product withdrawals, recalls, regulatory action on the part of the United States Food and Drug Administration (or international counterparts), declining sales and reputational damage;
|
|
•
|
Impact, including declining sales and reputational damage, of significant litigation or government action adverse to the Company, including product liability claims and allegations related to pharmaceutical marketing practices and contracting strategies;
|
|
•
|
Increased scrutiny of the health care industry by government agencies and state attorneys general resulting in investigations and prosecutions, which carry the risk of significant civil and criminal penalties, including, but not limited to, debarment from government business;
|
|
•
|
Failure to meet compliance obligations in the McNEIL-PPC, Inc. Consent Decree or the Corporate Integrity Agreements of the Johnson & Johnson Pharmaceutical Affiliates, or any other compliance agreements with governments or government agencies, which could result in significant sanctions;
|
|
•
|
Potential changes to applicable laws and regulations affecting United States and international operations, including relating to: approval of new products; licensing and patent rights; sales and promotion of health care products; access to, and reimbursement and pricing for, health care products and services; environmental protection and sourcing of raw materials;
|
|
•
|
Changes in domestic and international tax laws and regulations, including changes related to The Tax Cuts and Jobs Act in the United States, increasing audit scrutiny by tax authorities around the world and exposures to additional tax liabilities potentially in excess of existing reserves; and
|
|
•
|
Issuance of new or revised accounting standards by the Financial Accounting Standards Board and regulations by the Securities and Exchange Commission.
|
Risks Related to the Company’s Strategic Initiatives and Health Care Market Trends
|
•
|
Pricing pressures resulting from trends toward health care cost containment, including the continued consolidation among health care providers and other market participants, trends toward managed care, the shift toward governments increasingly becoming the primary payers of health care expenses and significant new entrants to the health care markets seeking to reduce costs;
|
|
•
|
Restricted spending patterns of individual, institutional and governmental purchasers of health care products and services due to economic hardship and budgetary constraints;
|
|
•
|
Challenges to the Company’s ability to realize its strategy for growth including through externally sourced innovations, such as development collaborations, strategic acquisitions, licensing and marketing agreements, and the potential heightened costs of any such external arrangements due to competitive pressures;
|
|
•
|
The potential that the expected strategic benefits and opportunities from any planned or completed acquisition or divestiture by the Company may not be realized or may take longer to realize than expected; and
|
|
•
|
The potential that the expected benefits and opportunities related to past and future restructuring actions may not be realized or may take longer to realize than expected.
|
Risks Related to Economic Conditions, Financial Markets and Operating Internationally
|
•
|
Impact of inflation and fluctuations in interest rates and currency exchange rates and the potential effect of such fluctuations on revenues, expenses and resulting margins;
|
|
•
|
Potential changes in export/import and trade laws, regulations and policies of the United States and other countries, including any increased trade restrictions or tariffs and potential drug reimportation legislation;
|
|
•
|
The impact on international operations from financial instability in international economies, sovereign risk, possible imposition of governmental controls and restrictive economic policies, and unstable international governments and legal systems;
|
|
•
|
Changes to global climate, extreme weather and natural disasters that could affect demand for the Company's products and services, cause disruptions in manufacturing and distribution networks, alter the availability of goods and services within the supply chain, and affect the overall design and integrity of the Company's products and operations; and
|
|
•
|
The impact of armed conflicts and terrorist attacks in the United States and other parts of the world including social and economic disruptions and instability of financial and other markets.
|
Risks Related to Supply Chain and Operations
|
•
|
Difficulties and delays in manufacturing, internally through third party providers or otherwise within the supply chain, that may lead to voluntary or involuntary business interruptions or shutdowns, product shortages, withdrawals or suspensions of products from the market, and potential regulatory action;
|
|
•
|
Interruptions and breaches of the Company's information technology systems or those of the Company's vendors which, could result in reputational, competitive, operational or other business harm as well as financial costs and regulatory action;
|
|
•
|
Reliance on global supply chains and production and distribution processes that are complex and subject to increasing regulatory requirements that may adversely affect supply, sourcing and pricing of materials used in the Company’s products; and
|
|
•
|
The potential that the expected benefits and opportunities related to restructuring actions contemplated for the global supply chain may not be realized or may take longer to realize than expected, including due to any required approvals from
|
applicable regulatory authorities. Disruptions associated with the recently announced global supply chain actions may adversely affect supply and sourcing of materials used in the Company's products.
Investors also should carefully read the Risk Factors described in Item 1A of the Company's Annual Report on Form 10-K for the fiscal year ended December 31, 2017, for a description of certain risks that could, among other things, cause the Company’s actual results to differ materially from those expressed in its forward-looking statements. Investors should understand that it is not possible to predict or identify all such factors and should not consider the risks described above to be a complete statement of all potential risks and uncertainties. The Company does not undertake to publicly update any forward-looking statement that may be made from time to time, whether as a result of new information or future events or developments.
JOHNSON & JOHNSON AND SUBSIDIARIES
CONSOLIDATED BALANCE SHEETS
(Unaudited; Dollars in Millions Except Share and Per Share Data)
|
September 30, 2018
|
December 31, 2017
|
||||||
|
ASSETS
|
|||||||
|
Current assets:
|
|
|
|||||
|
Cash and cash equivalents
|
$
|
16,056
|
|
17,824
|
|
||
|
Marketable securities
|
3,308
|
|
472
|
|
|||
|
Accounts receivable, trade, less allowances for doubtful accounts $281 (2017, $291)
|
14,048
|
|
13,490
|
|
|||
|
Inventories (Note 2)
|
8,678
|
|
8,765
|
|
|||
|
Prepaid expenses and other
|
2,896
|
|
2,537
|
|
|||
|
Assets held for sale (Note 10)
|
2,208
|
|
—
|
|
|||
|
Total current assets
|
47,194
|
|
43,088
|
|
|||
|
Property, plant and equipment at cost
|
41,520
|
|
41,466
|
|
|||
|
Less: accumulated depreciation
|
(24,891
|
)
|
(24,461
|
)
|
|||
|
Property, plant and equipment, net
|
16,629
|
|
17,005
|
|
|||
|
Intangible assets, net (Note 3)
|
48,637
|
|
53,228
|
|
|||
|
Goodwill (Note 3)
|
30,702
|
|
31,906
|
|
|||
|
Deferred taxes on income
|
8,076
|
|
7,105
|
|
|||
|
Other assets
|
4,465
|
|
4,971
|
|
|||
|
Total assets
|
$
|
155,703
|
|
157,303
|
|
||
|
LIABILITIES AND SHAREHOLDERS’ EQUITY
|
|||||||
|
Current liabilities:
|
|
|
|||||
|
Loans and notes payable
|
$
|
1,773
|
|
3,906
|
|
||
|
Accounts payable
|
7,000
|
|
7,310
|
|
|||
|
Accrued liabilities
|
6,044
|
|
7,304
|
|
|||
|
Accrued rebates, returns and promotions
|
8,684
|
|
7,210
|
|
|||
|
Accrued compensation and employee related obligations
|
2,840
|
|
2,953
|
|
|||
|
Accrued taxes on income
|
1,096
|
|
1,854
|
|
|||
|
Total current liabilities
|
27,437
|
|
30,537
|
|
|||
|
Long-term debt (Note 4)
|
29,480
|
|
30,675
|
|
|||
|
Deferred taxes on income
|
7,711
|
|
8,368
|
|
|||
|
Employee related obligations
|
9,374
|
|
10,074
|
|
|||
|
Long-term taxes payable
|
8,537
|
|
8,472
|
|
|||
|
Other liabilities
|
8,538
|
|
9,017
|
|
|||
|
Total liabilities
|
91,077
|
|
97,143
|
|
|||
|
Shareholders’ equity:
|
|
|
|||||
|
Common stock — par value $1.00 per share (authorized 4,320,000,000 shares; issued 3,119,843,000 shares)
|
$
|
3,120
|
|
3,120
|
|
||
|
Accumulated other comprehensive income (loss) (Note 7)
|
(14,647
|
)
|
(13,199
|
)
|
|||
|
Retained earnings
|
107,617
|
|
101,793
|
|
|||
|
Less: common stock held in treasury, at cost (436,688,000 and 437,318,000 shares)
|
31,464
|
|
31,554
|
|
|||
|
Total shareholders’ equity
|
64,626
|
|
60,160
|
|
|||
|
Total liabilities and shareholders' equity
|
$
|
155,703
|
|
157,303
|
|
||
See Notes to Consolidated Financial Statements
1
JOHNSON & JOHNSON AND SUBSIDIARIES
CONSOLIDATED STATEMENTS OF EARNINGS
(Unaudited; Dollars & Shares in Millions Except Per Share Amounts)
|
|
Fiscal Third Quarters Ended
|
|||||||||||||
|
September 30,
2018 |
Percent
to Sales
|
October 1,
2017 |
Percent
to Sales
|
|||||||||||
|
Sales to customers (Note 9)
|
$
|
20,348
|
|
100.0
|
%
|
$
|
19,650
|
|
100.0
|
%
|
||||
|
Cost of products sold
|
6,589
|
|
32.4
|
|
6,925
|
|
35.2
|
|
||||||
|
Gross profit
|
13,759
|
|
67.6
|
|
12,725
|
|
64.8
|
|
||||||
|
Selling, marketing and administrative expenses
|
5,543
|
|
27.3
|
|
5,423
|
|
27.6
|
|
||||||
|
Research and development expense
|
2,508
|
|
12.3
|
|
2,585
|
|
13.2
|
|
||||||
|
In-process research and development
|
1,126
|
|
5.6
|
|
—
|
|
—
|
|
||||||
|
Interest income
|
(175
|
)
|
(0.9
|
)
|
(74
|
)
|
(0.4
|
)
|
||||||
|
Interest expense, net of portion capitalized
|
243
|
|
1.2
|
|
229
|
|
1.2
|
|
||||||
|
Other (income) expense, net
|
3
|
|
0.0
|
|
(297
|
)
|
(1.5
|
)
|
||||||
|
Restructuring (Note 12)
|
88
|
|
0.4
|
|
69
|
|
0.3
|
|
||||||
|
Earnings before provision for taxes on income
|
4,423
|
|
21.7
|
|
4,790
|
|
24.4
|
|
||||||
|
Provision for taxes on income (Note 5)
|
489
|
|
2.4
|
|
1,026
|
|
5.2
|
|
||||||
|
NET EARNINGS
|
$
|
3,934
|
|
19.3
|
%
|
$
|
3,764
|
|
19.2
|
%
|
||||
|
NET EARNINGS PER SHARE (Note 8)
|
|
|
|
|
||||||||||
|
Basic
|
$
|
1.47
|
|
|
$
|
1.40
|
|
|
||||||
|
Diluted
|
$
|
1.44
|
|
|
$
|
1.37
|
|
|
||||||
|
CASH DIVIDENDS PER SHARE
|
$
|
0.90
|
|
|
$
|
0.84
|
|
|
||||||
|
AVG. SHARES OUTSTANDING
|
|
|
|
|
||||||||||
|
Basic
|
2,683.2
|
|
|
2,684.6
|
|
|
||||||||
|
Diluted
|
2,727.6
|
|
|
2,737.7
|
|
|
||||||||
Prior year amounts have been reclassified to conform to current year presentation
See Notes to Consolidated Financial Statements
2
JOHNSON & JOHNSON AND SUBSIDIARIES
CONSOLIDATED STATEMENTS OF EARNINGS
(Unaudited; Dollars & Shares in Millions Except Per Share Amounts)
|
Fiscal Nine Months Ended
|
||||||||||||||
|
September 30,
2018 |
Percent
to Sales
|
October 1,
2017 |
Percent
to Sales
|
|||||||||||
|
Sales to customers (Note 9)
|
$
|
61,187
|
|
100.0
|
%
|
$
|
56,255
|
|
100.0
|
%
|
||||
|
Cost of products sold
|
20,130
|
|
32.9
|
|
18,180
|
|
32.3
|
|
||||||
|
Gross profit
|
41,057
|
|
67.1
|
|
38,075
|
|
67.7
|
|
||||||
|
Selling, marketing and administrative expenses
|
16,549
|
|
27.1
|
|
15,475
|
|
27.5
|
|
||||||
|
Research and development expense
|
7,551
|
|
12.3
|
|
6,951
|
|
12.4
|
|
||||||
|
In-process research and development
|
1,126
|
|
1.8
|
|
—
|
|
0.0
|
|
||||||
|
Interest income
|
(415
|
)
|
(0.6
|
)
|
(300
|
)
|
(0.5
|
)
|
||||||
|
Interest expense, net of portion capitalized
|
755
|
|
1.2
|
|
660
|
|
1.1
|
|
||||||
|
Other (income) expense, net
|
427
|
|
0.7
|
|
11
|
|
0.0
|
|
||||||
|
Restructuring expense (Note 12)
|
187
|
|
0.3
|
|
165
|
|
0.3
|
|
||||||
|
Earnings before provision for taxes on income
|
14,877
|
|
24.3
|
|
15,113
|
|
26.9
|
|
||||||
|
Provision for taxes on income (Note 5)
|
2,622
|
|
4.3
|
|
3,100
|
|
5.5
|
|
||||||
|
NET EARNINGS
|
$
|
12,255
|
|
20.0
|
%
|
$
|
12,013
|
|
21.4
|
%
|
||||
|
NET EARNINGS PER SHARE (Note 8)
|
|
|
|
|
||||||||||
|
Basic
|
$
|
4.57
|
|
|
$
|
4.46
|
|
|
||||||
|
Diluted
|
$
|
4.49
|
|
|
$
|
4.37
|
|
|
||||||
|
CASH DIVIDENDS PER SHARE
|
$
|
2.64
|
|
|
$
|
2.48
|
|
|
||||||
|
AVG. SHARES OUTSTANDING
|
|
|
|
|
||||||||||
|
Basic
|
2,682.6
|
|
|
2,694.4
|
|
|
||||||||
|
Diluted
|
2,729.6
|
|
|
2,746.4
|
|
|
||||||||
|
Prior year amounts have been reclassified to conform to current year presentation
|
||||||||||||||
|
See Notes to Consolidated Financial Statements
|
||||||||||||||
3
JOHNSON & JOHNSON AND SUBSIDIARIES
CONSOLIDATED STATEMENTS OF COMPREHENSIVE INCOME
(Unaudited; Dollars in Millions)
|
Fiscal Third Quarters Ended
|
Fiscal Nine Months Ended
|
||||||||||||
|
September 30, 2018
|
October 1, 2017
|
September 30, 2018
|
October 1, 2017
|
||||||||||
|
Net earnings
|
$
|
3,934
|
|
3,764
|
|
$
|
12,255
|
|
12,013
|
|
|||
|
Other comprehensive income (loss), net of tax
|
|||||||||||||
|
Foreign currency translation
|
(151
|
)
|
359
|
|
(1,718
|
)
|
1,597
|
|
|||||
|
Securities:
(1)
|
|||||||||||||
|
Unrealized holding gain (loss) arising during period
|
—
|
|
14
|
|
—
|
|
150
|
|
|||||
|
Reclassifications to earnings
|
(1
|
)
|
(99
|
)
|
(1
|
)
|
(292
|
)
|
|||||
|
Net change
|
(1
|
)
|
(85
|
)
|
(1
|
)
|
(142
|
)
|
|||||
|
Employee benefit plans:
|
|||||||||||||
|
Prior service cost amortization during period
|
(6
|
)
|
(4
|
)
|
(17
|
)
|
(13
|
)
|
|||||
|
Gain (loss) amortization during period
|
192
|
|
124
|
|
574
|
|
370
|
|
|||||
|
Net change
|
186
|
|
120
|
|
557
|
|
357
|
|
|||||
|
Derivatives & hedges:
|
|||||||||||||
|
Unrealized gain (loss) arising during period
|
262
|
|
62
|
|
37
|
|
(8
|
)
|
|||||
|
Reclassifications to earnings
|
(166
|
)
|
31
|
|
(91
|
)
|
350
|
|
|||||
|
Net change
|
96
|
|
93
|
|
(54
|
)
|
342
|
|
|||||
|
Other comprehensive income (loss)
|
130
|
|
487
|
|
(1,216
|
)
|
2,154
|
|
|||||
|
Comprehensive income
|
$
|
4,064
|
|
4,251
|
|
$
|
11,039
|
|
14,167
|
|
|||
|
(1)
2018 includes the impact from the adoption of ASU 2016-01. For further details see Note 1 to the Consolidated Financial Statements
|
|||||||||||||
See Notes to Consolidated Financial Statements
|
The tax effects in other comprehensive income for the fiscal third quarters were as follows for 2018 and 2017, respectively: Foreign Currency Translation: $104 million in 2018 due to the enactment of the U.S. Tax Cuts and Jobs Act; Securities: $0 million and $45 million; Employee Benefit Plans: $52 million and $61 million; Derivatives & Hedges: $26 million and $50 million.
|
|
The tax effects in other comprehensive income for the fiscal nine months were as follows for 2018 and 2017, respectively: Foreign Currency Translation: $79 million in 2018 due to the enactment of the U.S. Tax Cuts and Jobs Act; Securities: $0 million and $76 million; Employee Benefit Plans: $155 million and $181 million; Derivatives & Hedges:$14 million and $184 million.
|
4
|
JOHNSON & JOHNSON AND SUBSIDIARIES
CONSOLIDATED STATEMENTS OF CASH FLOWS
(Unaudited; Dollars in Millions)
|
|||||||
|
|
Fiscal Nine Months Ended
|
||||||
|
September 30,
2018 |
October 1,
2017 |
||||||
|
CASH FLOWS FROM OPERATING ACTIVITIES
|
|
|
|||||
|
Net earnings
|
$
|
12,255
|
|
12,013
|
|
||
|
Adjustments to reconcile net earnings to cash flows from operating activities:
|
|
|
|||||
|
Depreciation and amortization of property and intangibles
|
5,194
|
|
3,773
|
|
|||
|
Stock based compensation
|
822
|
|
758
|
|
|||
|
Asset write-downs
|
1,226
|
|
309
|
|
|||
|
Net gain on sale of assets/businesses
|
(443
|
)
|
(527
|
)
|
|||
|
Deferred tax provision
|
53
|
|
(407
|
)
|
|||
|
Accounts receivable allowances
|
(3
|
)
|
59
|
|
|||
|
Changes in assets and liabilities, net of effects from acquisitions and divestitures:
|
|
|
|||||
|
Increase in accounts receivable
|
(1,040
|
)
|
(300
|
)
|
|||
|
Increase in inventories
|
(777
|
)
|
(193
|
)
|
|||
|
Increase in accounts payable and accrued liabilities
|
731
|
|
339
|
|
|||
|
Increase in other current and non-current assets
|
(904
|
)
|
(555
|
)
|
|||
|
Decrease in other current and non-current liabilities
|
(1,157
|
)
|
(318
|
)
|
|||
|
NET CASH FLOWS FROM OPERATING ACTIVITIES
|
15,957
|
|
14,951
|
|
|||
|
CASH FLOWS FROM INVESTING ACTIVITIES
|
|
|
|||||
|
Additions to property, plant and equipment
|
(2,352
|
)
|
(2,039
|
)
|
|||
|
Proceeds from the disposal of assets/businesses, net
|
895
|
|
726
|
|
|||
|
Acquisitions, net of cash acquired
|
(897
|
)
|
(34,646
|
)
|
|||
|
Purchases of investments
|
(4,155
|
)
|
(5,798
|
)
|
|||
|
Sales of investments
|
1,162
|
|
27,511
|
|
|||
|
Other
|
(48
|
)
|
(117
|
)
|
|||
|
NET CASH USED BY INVESTING ACTIVITIES
|
(5,395
|
)
|
(14,363
|
)
|
|||
|
CASH FLOWS FROM FINANCING ACTIVITIES
|
|
|
|||||
|
Dividends to shareholders
|
(7,083
|
)
|
(6,687
|
)
|
|||
|
Repurchase of common stock
|
(2,060
|
)
|
(5,543
|
)
|
|||
|
Proceeds from short-term debt
|
40
|
|
4,760
|
|
|||
|
Retirement of short-term debt
|
(2,365
|
)
|
(936
|
)
|
|||
|
Proceeds from long-term debt, net of issuance costs
|
6
|
|
4,465
|
|
|||
|
Retirement of long-term debt
|
(910
|
)
|
(1,024
|
)
|
|||
|
Proceeds from the exercise of stock options/employee withholding tax on stock awards, net
|
480
|
|
854
|
|
|||
|
Other
|
(229
|
)
|
(25
|
)
|
|||
|
NET CASH USED BY FINANCING ACTIVITIES
|
(12,121
|
)
|
(4,136
|
)
|
|||
|
Effect of exchange rate changes on cash and cash equivalents
|
(209
|
)
|
297
|
|
|||
|
Decrease in cash and cash equivalents
|
(1,768
|
)
|
(3,251
|
)
|
|||
|
Cash and Cash equivalents, beginning of period
|
17,824
|
|
18,972
|
|
|||
|
CASH AND CASH EQUIVALENTS, END OF PERIOD
|
$
|
16,056
|
|
15,721
|
|
||
|
Acquisitions
|
|
|
|||||
|
Fair value of assets acquired
|
$
|
1,046
|
|
36,494
|
|
||
|
Fair value of liabilities assumed and noncontrolling interests
|
(149
|
)
|
(1,848
|
)
|
|||
|
Net cash paid for acquisitions
|
$
|
897
|
|
34,646
|
|
||
See Notes to Consolidated Financial Statements
5
NOTES TO CONSOLIDATED FINANCIAL STATEMENTS
NOTE 1 — The accompanying unaudited interim consolidated financial statements and related notes should be read in conjunction with the audited Consolidated Financial Statements of Johnson & Johnson and its subsidiaries (the Company) and related notes as contained in the Company’s Annual Report on Form 10-K for the fiscal year ended
December 31, 2017
. The unaudited interim financial statements include all adjustments (consisting only of normal recurring adjustments) and accruals necessary in the judgment of management for a fair statement of the results for the periods presented.
New Accounting Standards
Recently Adopted Accounting Standards
ASU 2017-12
: Targeted Improvements to Accounting for Hedging Activities
The Company elected to early adopt this standard as of the beginning of the fiscal second quarter of 2018. This update makes more financial and nonfinancial hedging strategies eligible for hedge accounting. It also amends the presentation and disclosure requirements and changes how companies assess effectiveness. The adoption of this standard did not have a material impact on the Company's consolidated financial statements. For additional required disclosures see Note 4 to the Consolidated Financial Statements.
ASU 2014-09
: Revenue from Contracts with Customers
On January 1, 2018, the Company adopted the new accounting standard, ASC 606, Revenue from Contracts with Customers and all the related amendments (new revenue standard) to all contracts using the modified retrospective method. The cumulative effect of initially applying the new standard was recognized as an adjustment to the opening balance of retained earnings. The comparative information has not been restated and continues to be reported under the accounting standards in effect for those periods. The adoption of the new revenue standard has not had a material impact to either reported Sales to customers or Net earnings. Additionally, the Company will continue to recognize revenue from product sales as goods are shipped or delivered to the customer, as control of goods transfers at the same time.
In accordance with the new standard requirements, the disclosure of the impact of adoption on the Company's Consolidated Statement of Earnings and Balance Sheet was as follows:
|
Statement of Earnings - For the fiscal nine months ended September 30, 2018
|
|||||||||
|
(Dollars in millions)
|
As Reported
|
Effect of change
|
Balance without adoption of ASC 606
|
||||||
|
Sales to customers
|
$
|
61,187
|
|
(18
|
)
|
61,169
|
|
||
|
Net earnings
|
12,255
|
|
(14
|
)
|
12,241
|
|
|||
|
Statement of Earnings - For the fiscal third quarter ended September 30, 2018
|
|||||||||
|
(Dollars in millions)
|
As Reported
|
Effect of change
|
Balance without adoption of ASC 606
|
||||||
|
Sales to customers
|
$
|
20,348
|
|
22
|
|
20,370
|
|
||
|
Net earnings
|
3,934
|
|
19
|
|
3,953
|
|
|||
|
|
|||||||||
|
As Reported
|
Effect of change
|
Balance without adoption of ASC 606
|
|||||||
|
Assets
|
155,703
|
|
24
|
|
155,727
|
|
|||
|
Liabilities
|
91,077
|
|
(7
|
)
|
91,070
|
|
|||
|
Equity
|
$
|
64,626
|
|
31
|
|
64,657
|
|
||
The Company made a cumulative effect adjustment to the 2018 opening balance of retained earnings upon adoption of ASU 2014-09, which decreased beginning retained earnings by
$47 million
.
As part of the adoption of ASC 606 see Note 9 to the Consolidated Financial Statements for further disaggregation of revenue.
6
The Company recognizes revenue from product sales when obligations under the terms of a contract with the customer are satisfied; generally, this occurs with the transfer of control of the goods to customers. The Company's global payment terms are typically between 30 to 90 days. Provisions for certain rebates, sales incentives, trade promotions, coupons, product returns and discounts to customers are accounted as variable consideration and recorded as a reduction in sales.
Product discounts granted are based on the terms of arrangements with direct, indirect and other market participants, as well as market conditions, including prices charged by competitors. Rebates are estimated based on contractual terms, historical experience, patient outcomes, trend analysis and projected market conditions in the various markets served. The Company evaluates market conditions for products or groups of products primarily through the analysis of wholesaler and other third-party sell-through and market research data, as well as internally generated information.
Sales returns are estimated and recorded based on historical sales and returns information. Products that exhibit unusual sales or return patterns due to dating, competition or other marketing matters are specifically investigated and analyzed as part of the accounting for sales return accruals.
Sales returns allowances represent a reserve for products that may be returned due to expiration, destruction in the field, or in specific areas, product recall. The sales returns reserve is based on historical return trends by product and by market as a percent to gross sales. In accordance with the Company’s accounting policies, the Company generally issues credit to customers for returned goods. The Company’s sales returns reserves are accounted for in accordance with the U.S. GAAP guidance for revenue recognition when right of return exists. Sales returns reserves are recorded at full sales value. Sales returns in the Consumer and Pharmaceutical segments are almost exclusively not resalable. Sales returns for certain franchises in the Medical Devices segment are typically resalable but are not material. The Company infrequently exchanges products from inventory for returned products. The sales returns reserve for the total Company has been approximately
1.0%
of annual net trade sales during the fiscal reporting years 2017, 2016 and 2015.
Promotional programs, such as product listing allowances and cooperative advertising arrangements, are recorded in the same period as related sales. Continuing promotional programs include coupons and volume-based sales incentive programs. The redemption cost of consumer coupons is based on historical redemption experience by product and value. Volume-based incentive programs are based on the estimated sales volumes for the incentive period and are recorded as products are sold. These arrangements are evaluated to determine the appropriate amounts to be deferred or recorded as a reduction of revenue. The Company also earns service revenue for co-promotion of certain products, which is included in sales to customers.
ASU 2016-01
: Financial Instruments: Recognition and Measurement of Financial Assets and Financial Liabilities
The Company adopted this standard as of the beginning of the fiscal year 2018 on a modified retrospective basis. The amendments in this update supersede the guidance to classify equity securities with readily determinable fair values into different categories (that is, trading or available-for-sale) and require equity securities to be measured at fair value with changes in the fair value recognized through net earnings. The standard amends financial reporting by providing relevant information about an entity’s equity investments and reducing the number of items that are recognized in other comprehensive income.
The Company made a cumulative effect adjustment to the opening balance of retained earnings upon adoption of ASU 2016-01 that increased retained earnings by
$232 million
net of tax and decreased accumulated other comprehensive income for previously unrealized gains from equity investments. For additional details see Note 4 to the Consolidated Financial Statements.
ASU 2016-16
: Income Taxes: Intra-Entity Transfers of Assets Other Than Inventory
The Company adopted this standard as of the beginning of the fiscal year 2018. This update removes the current exception in U.S. GAAP prohibiting entities from recognizing current and deferred income tax expenses or benefits related to transfer of assets, other than inventory, within the consolidated entity. The current exception to defer the recognition of any tax impact on the transfer of inventory within the consolidated entity until it is sold to a third party remains unaffected. The Company recorded net adjustments to deferred taxes of approximately
$2.0 billion
, a decrease to Other Assets of approximately
$0.7 billion
and an increase to retained earnings of approximately
$1.3 billion
. The adoption of this standard did not have a material impact on the Company's consolidated financial statements.
ASU 2017-01
: Clarifying the Definition of a Business
The Company adopted this standard as of the beginning of the fiscal year 2018. This update narrows the definition of a business by providing a screen to determine when an integrated set of assets and activities is not a business. The screen specifies that an integrated set of assets and activities is not a business if substantially all of the fair value of the gross assets acquired or disposed of is concentrated in a single or a group of similar identifiable assets. This update was applied prospectively. The adoption of this standard did not have a material impact on the Company's consolidated financial statements.
7
ASU 2017-07
: Improving the Presentation of Net Periodic Pension Cost and Net Periodic Postretirement Benefit Cost
The Company adopted this standard as of the beginning of the fiscal year 2018. This update requires that an employer disaggregate the service cost component from the other components of net periodic benefit cost (NPBC). In addition, only the service cost component will be eligible for capitalization. The amendments in this update are required to be applied retrospectively for the presentation of the service cost component and the other components of NPBC in the Consolidated Statement of Earnings and prospectively, on and after the adoption date, for the capitalization of the service cost component of NPBC in assets. As required by the transition provisions of this update, the Company made the following reclassifications to the 2017 fiscal third quarter and fiscal nine months Consolidated Statement of Earnings to retroactively apply classification of the service cost component and the other components of NPBC:
|
(Dollars In millions)
|
Increase (Decrease) to Net Expense
|
||||||
|
Fiscal Third Quarter Ended
|
Fiscal Nine Months Ended
|
||||||
|
Cost of products sold
|
$
|
23
|
|
69
|
|
||
|
Selling, marketing and administrative expenses
|
27
|
|
80
|
|
|||
|
Research and development expense
|
11
|
|
32
|
|
|||
|
Other (income) expense, net
|
(61
|
)
|
(181
|
)
|
|||
|
Earnings before provision for taxes on income
|
$
|
—
|
|
—
|
|
||
The following table summarizes the cumulative effect adjustments made to the 2018 opening balance of retained earnings upon adoption of the new accounting standards mentioned above:
|
(Dollars in Millions)
|
Cumulative Effect Adjustment Increase (Decrease) to Retained Earnings
|
|||
|
ASU 2014-09 - Revenue from Contracts with Customers
|
$
|
(47
|
)
|
|
|
ASU 2016-01 - Financial Instruments
|
232
|
|
||
|
ASU 2016-16 - Income Taxes: Intra-Entity Transfers
|
1,311
|
|
||
|
Total
|
$
|
1,496
|
|
|
Recently Issued Accounting Standards
Not Adopted as of September 30, 2018
ASU 2018-02
: Reclassification of Certain Tax Effects from Accumulated Other Comprehensive Income
This update allows a reclassification from accumulated other comprehensive income to retained earnings for stranded tax effects resulting from the Tax Cuts and Job Act enacted in December 2017. This update will be effective for the Company for fiscal years beginning after December 15, 2018 and interim periods within those fiscal years. Early adoption is permitted. The Company does not expect this standard to have a material impact on the Company's consolidated financial statements.
ASU 2016-02
: Leases
This update requires the recognition of lease assets and lease liabilities on the balance sheet for all lease obligations and disclosing key information about leasing arrangements. This update requires the recognition of lease assets and lease liabilities by lessees for those leases classified as operating leases under current generally accepted accounting principles. This update will be effective for the Company for all annual periods beginning after December 15, 2018, including interim periods within those fiscal years. Early application is permitted. The Company will apply the new standard at its adoption date rather than at the earliest comparative period presented in the financial statements. The Company anticipates that most of its operating leases will result in the recognition of additional assets and the corresponding liabilities on its Consolidated Balance Sheets, however it does not expect the standard to have a material impact on the financial position. The actual impact will depend on the Company's lease portfolio at the time of adoption. The Company continues to assess all implications of the standard and related financial disclosures.
8
|
(Dollars in Millions)
|
September 30, 2018
|
December 31, 2017
|
|||||
|
Raw materials and supplies
|
$
|
1,202
|
|
1,140
|
|
||
|
Goods in process
|
1,986
|
|
2,317
|
|
|||
|
Finished goods
|
5,490
|
|
5,308
|
|
|||
|
Total inventories
(1)
|
$
|
8,678
|
|
8,765
|
|
||
(1)
Net of assets held for sale on the Consolidated Balance Sheet for approximately
$0.1 billion
related to the divestiture of the LifeScan business,
$0.2 billion
related to the divestiture of the Advanced Sterilization Products business and
$0.3 billion
related to the strategic collaboration with Jabil Inc., all of which were pending as of September 30, 2018.
Intangible assets that have finite useful lives are amortized over their estimated useful lives. The latest annual impairment assessment of goodwill and indefinite lived intangible assets was completed in the fiscal fourth quarter of
2017
. Future impairment tests for goodwill and indefinite lived intangible assets will be performed annually in the fiscal fourth quarter, or sooner, if warranted.
|
(Dollars in Millions)
|
September 30, 2018
|
December 31, 2017
|
|||||
|
Intangible assets with definite lives:
|
|
|
|||||
|
Patents and trademarks — gross
|
$
|
35,478
|
|
36,427
|
|
||
|
Less accumulated amortization
|
9,077
|
|
7,223
|
|
|||
|
Patents and trademarks — net
(1)
|
26,401
|
|
29,204
|
|
|||
|
Customer relationships and other intangibles — gross
|
21,176
|
|
20,204
|
|
|||
|
Less accumulated amortization
|
8,168
|
|
7,463
|
|
|||
|
Customer relationships and other intangibles — net
|
13,008
|
|
12,741
|
|
|||
|
Intangible assets with indefinite lives:
|
|
|
|||||
|
Trademarks
|
7,002
|
|
7,082
|
|
|||
|
Purchased in-process research and development
(2)
|
2,226
|
|
4,201
|
|
|||
|
Total intangible assets with indefinite lives
|
9,228
|
|
11,283
|
|
|||
|
Total intangible assets — net
|
$
|
48,637
|
|
53,228
|
|
||
(1)
Net of approximately
$0.1 billion
classified as assets held for sale on the Consolidated Balance Sheet related to the divestiture of the LifeScan business, which was pending as of September 30, 2018. See Note 10 to the Consolidated Financial Statements for additional details
(2)
The decrease was primarily attributable to the write-down of
$1.1 billion
related to the assets acquired in the acquisitions of Alios Biopharma Inc. (Alios) and XO1 Limited (XO1). Of the
$1.1 billion
, the Company recorded a partial impairment charge of
$0.8 billion
related to the development program of AL-8176, an investigational drug for the treatment of Respiratory Syncytial Virus (RSV) and human metapneumovirus (hMPV) acquired with the 2014 acquisition of Alios. The impairment charge was calculated based on updated cash flow projections discounted for the inherent risk in the asset development and reflects the impact of recent phase 2b clinical trial suspension, a decrease in the probability of success factors and the ongoing analysis of asset development activities. In addition, an impairment charge of
$0.3 billion
was recorded for the discontinuation of the development project for an anti-thrombin antibody associated with the 2015 acquisition of XO1.
Goodwill as of
September 30, 2018
was allocated by segment of business as follows:
|
(Dollars in Millions)
|
Consumer
|
Pharm
|
Med Devices
|
Total
|
|||||||||
|
Goodwill, net at December 31, 2017
|
$
|
8,875
|
|
9,109
|
|
13,922
|
|
31,906
|
|
||||
|
Goodwill, related to acquisitions
|
169
|
|
51
|
|
208
|
|
428
|
|
|||||
|
Goodwill, related to divestitures
|
—
|
|
—
|
|
(1,246
|
)
|
(1)
|
(1,246
|
)
|
||||
|
Currency translation/Other
|
(304
|
)
|
(48
|
)
|
(34
|
)
|
(386
|
)
|
|||||
|
Goodwill, net at September 30, 2018
|
$
|
8,740
|
|
9,112
|
|
12,850
|
|
30,702
|
|
||||
9
(1)
Goodwill of
$1.0 billion
is related to the divestiture of the LifeScan business and
$0.2 billion
is related to the divestiture of the Advanced Sterilization Products business, both of which were pending and classified as assets held for sale on the Consolidated Balance Sheet as of September 30, 2018.
The weighted average amortization periods for patents and trademarks and customer relationships and other intangible assets are
11
years and
22
years, respectively. The amortization expense of amortizable intangible assets included in cost of products sold was
$3.3 billion
and
$1.9 billion
for the
fiscal nine months
ended
September 30, 2018
and
October 1, 2017
, respectively. The estimated amortization expense for the five succeeding years approximates
$4.4 billion
, before tax, per year. Intangible asset write-downs, other than in-process research and development are included in Other (income) expense, net.
See Note 10 to the Consolidated Financial Statements for additional details related to acquisitions and divestitures.
The Company uses forward foreign exchange contracts to manage its exposure to the variability of cash flows, primarily related to the foreign exchange rate changes of future intercompany product and third-party purchases of materials denominated in a foreign currency. The Company uses cross currency interest rate swaps to manage currency risk primarily related to borrowings.
The Company also uses equity collar contracts to manage exposure to market risk associated with certain equity investments.
All three types of derivatives are designated as cash flow hedges.
The Company uses interest rate swaps as an instrument to manage interest rate risk related to fixed rate borrowings. These derivatives are designated as fair value hedges. The Company uses cross currency interest rate swaps and forward foreign exchange contracts designated as net investment hedges. Additionally, the Company uses forward foreign exchange contracts to offset its exposure to certain foreign currency assets and liabilities. These forward foreign exchange contracts are not designated as hedges, and therefore, changes in the fair values of these derivatives are recognized in earnings, thereby offsetting the current earnings effect of the related foreign currency assets and liabilities.
The Company early adopted ASU 2017-12: Targeted Improvements to Accounting for Hedge Activities effective as of the beginning of fiscal second quarter of 2018.
The Company does not enter into derivative financial instruments for trading or speculative purposes, or that contain credit risk related contingent features. During the fiscal second quarter of 2017, the Company entered into credit support agreements (CSA) with certain derivative counterparties establishing collateral thresholds based on respective credit ratings and netting agreements. As of
September 30, 2018
, the total amount of collateral paid under the credit support agreements amounted to
$153 million
, net. For equity collar contracts, the Company pledged the underlying hedged marketable equity securities to the counter-party as collateral. On an ongoing basis, the Company monitors counter-party credit ratings. The Company considers credit non-performance risk to be low, because the Company primarily enters into agreements with commercial institutions that have at least an investment grade credit rating. Refer to the table on significant financial assets and liabilities measured at fair value contained in this footnote for receivables and payables with these commercial institutions. As of
September 30, 2018
, the Company had notional amounts outstanding for forward foreign exchange contracts, cross currency interest rate swaps and interest rate swaps of
$38.8 billion
,
$7.3 billion
and
$1.1 billion
, respectively. As of December 31, 2017, the Company had notional amounts outstanding for forward foreign exchange contracts, cross currency interest rate swaps and interest rate swaps of
$34.5 billion
,
$2.3 billion
and
$1.1 billion
, respectively.
All derivative instruments are recorded on the balance sheet at fair value. Changes in the fair value of derivatives are recorded each period in current earnings or other comprehensive income, depending on whether the derivative is designated as part of a hedge transaction, and if so, the type of hedge transaction.
The designation as a cash flow hedge is made at the entrance date of the derivative contract. At inception, all derivatives are expected to be highly effective. Changes in the fair value of a derivative that is designated as a cash flow hedge and is highly effective are recorded in accumulated other comprehensive income until the underlying transaction affects earnings and are then reclassified to earnings in the same account as the hedged transaction. Gains and losses associated with interest rate swaps and changes in fair value of hedged debt attributable to changes in interest rates are recorded to interest expense in the period in which they occur. Gains and losses on net investment hedges are accounted for through the currency translation account. On an ongoing basis, the Company assesses whether each derivative continues to be highly effective in offsetting changes of hedged items. If a derivative is no longer expected to be highly effective, hedge accounting is discontinued.
10
During the fiscal second quarter of 2016, the Company designated its Euro denominated notes issued in May 2016 with due dates ranging from 2022 to 2035 as a net investment hedge of the Company's investments in certain of its international subsidiaries that use the Euro as their functional currency in order to reduce the volatility caused by changes in exchange rates.
As of
September 30, 2018
, the balance of deferred net gain on derivatives included in accumulated other comprehensive income was
$16 million
after-tax. For additional information, see the Consolidated Statements of Comprehensive Income and Note 7. The Company expects that substantially all of the amounts related to forward foreign exchange contracts will be reclassified into earnings over the
next 12 months
as a result of transactions that are expected to occur over that period. The maximum length of time over which the Company is hedging transaction exposure is
18 months
, excluding interest rate contracts,
net investment hedges
and equity collar contracts. The amount ultimately realized in earnings may differ as foreign exchange rates change. Realized gains and losses are ultimately determined by actual exchange rates at maturity of the derivative.
The following table is a summary of the activity related to derivatives and hedges for the fiscal
third
quarters in
2018
and
2017
:
|
September 30, 2018
|
October 1, 2017
|
||||||||||||||||||||
|
(Dollars in Millions)
|
Sales
|
Cost of Products Sold
|
R&D Expense
|
Interest (Income) Expense
|
Other (Income) Expense
|
Sales
|
Cost of Products Sold
|
R&D Expense
|
Interest (Income) Expense
|
Other (Income) Expense
|
|||||||||||
|
The effects of fair value, net investment and cash flow hedging:
|
|||||||||||||||||||||
|
Gain (Loss) on fair value hedging relationship:
|
|||||||||||||||||||||
|
Interest rate swaps contracts:
|
|||||||||||||||||||||
|
Hedged items
|
$
|
—
|
|
—
|
|
—
|
|
(7
|
)
|
—
|
|
—
|
|
—
|
|
—
|
|
(4
|
)
|
—
|
|
|
Derivatives designated as hedging instruments
|
—
|
|
—
|
|
—
|
|
7
|
|
—
|
|
—
|
|
—
|
|
—
|
|
4
|
|
—
|
|
|
|
Gain (Loss) on net investment hedging relationship:
|
|||||||||||||||||||||
|
Cross currency interest rate swaps contracts:
|
|||||||||||||||||||||
|
Amount of gain or (loss) recognized in income on derivative amount excluded from effectiveness testing
|
—
|
|
—
|
|
—
|
|
25
|
|
—
|
|
—
|
|
—
|
|
—
|
|
—
|
|
—
|
|
|
|
Amount of gain or (loss) recognized in AOCI
|
—
|
|
—
|
|
—
|
|
25
|
|
—
|
|
—
|
|
—
|
|
—
|
|
—
|
|
—
|
|
|
|
Gain (Loss) on cash flow hedging relationship:
|
|||||||||||||||||||||
|
Forward foreign exchange contracts:
|
|||||||||||||||||||||
|
Amount of gain or (loss) reclassified from AOCI into income
(1)
|
4
|
|
97
|
|
10
|
|
—
|
|
(3
|
)
|
5
|
|
(63
|
)
|
(30
|
)
|
—
|
|
(49
|
)
|
|
|
Amount of gain or (loss) recognized in AOCI
(1)
|
15
|
|
192
|
|
(4
|
)
|
—
|
|
(1
|
)
|
18
|
|
(16
|
)
|
(39
|
)
|
—
|
|
(15
|
)
|
|
|
Cross currency interest rate swaps contracts:
|
|||||||||||||||||||||
|
Amount of gain or (loss) reclassified from AOCI into income
|
—
|
|
—
|
|
—
|
|
34
|
|
—
|
|
—
|
|
|
—
|
|
106
|
|
—
|
|
||
|
Amount of gain or (loss) recognized in AOCI
|
$
|
—
|
|
—
|
|
—
|
|
35
|
|
—
|
|
—
|
|
—
|
|
—
|
|
114
|
|
—
|
|
11
The following table is a summary of the activity related to derivatives and hedges for the
fiscal nine months
in
2018
and
2017
:
|
September 30, 2018
|
October 1, 2017
|
||||||||||||||||||||
|
(Dollars in Millions)
|
Sales
|
Cost of Products Sold
|
R&D Expense
|
Interest (Income) Expense
|
Other (Income) Expense
|
Sales
|
Cost of Products Sold
|
R&D Expense
|
Interest (Income) Expense
|
Other (Income) Expense
|
|||||||||||
|
The effects of fair value, net investment and cash flow hedging:
|
|||||||||||||||||||||
|
Gain (Loss) on fair value hedging relationship:
|
|||||||||||||||||||||
|
Interest rate swaps contracts:
|
|||||||||||||||||||||
|
Hedged items
|
$
|
—
|
|
—
|
|
—
|
|
3
|
|
—
|
|
—
|
|
—
|
|
—
|
|
(6
|
)
|
—
|
|
|
Derivatives designated as hedging instruments
|
—
|
|
—
|
|
—
|
|
(3
|
)
|
—
|
|
—
|
|
—
|
|
—
|
|
6
|
|
—
|
|
|
|
Gain (Loss) on net investment hedging relationship:
|
|||||||||||||||||||||
|
Cross currency interest rate swaps contracts:
|
|||||||||||||||||||||
|
Amount of gain or (loss) recognized in income on derivative amount excluded from effectiveness testing
|
—
|
|
—
|
|
—
|
|
27
|
|
—
|
|
—
|
|
—
|
|
—
|
|
—
|
|
—
|
|
|
|
Amount of gain or (loss) recognized in AOCI
|
—
|
|
—
|
|
—
|
|
27
|
|
—
|
|
—
|
|
—
|
|
—
|
|
—
|
|
—
|
|
|
|
Gain (Loss) on cash flow hedging relationship:
|
|||||||||||||||||||||
|
Forward foreign exchange contracts:
|
|||||||||||||||||||||
|
Amount of gain or (loss) reclassified from AOCI into income
(1)
|
50
|
|
175
|
|
(242
|
)
|
—
|
|
(24
|
)
|
(34
|
)
|
(162
|
)
|
(131
|
)
|
—
|
|
(86
|
)
|
|
|
Amount of gain or (loss) recognized in AOCI
(1)
|
(3
|
)
|
138
|
|
(220
|
)
|
—
|
|
(16
|
)
|
40
|
|
105
|
|
(167
|
)
|
—
|
|
(59
|
)
|
|
|
Cross currency interest rate swaps contracts:
|
|||||||||||||||||||||
|
Amount of gain or (loss) reclassified from AOCI into income
|
—
|
|
—
|
|
—
|
|
106
|
|
—
|
|
—
|
|
—
|
|
—
|
|
63
|
|
—
|
|
|
|
Amount of gain or (loss) recognized in AOCI
|
$
|
—
|
|
—
|
|
—
|
|
111
|
|
—
|
|
—
|
|
—
|
|
—
|
|
73
|
|
—
|
|
(1)
Includes equity collar contracts. The equity collar contracts expired in December of 2017.
12
As of
September 30, 2018
and December 31, 2017, the following amounts were recorded on the Consolidated Balance Sheet related to cumulative basis adjustment for fair value hedges:
|
Line item in the Consolidated Balance Sheet in which the hedged item is included
|
Carrying Amount of the Hedged Liability
|
Cumulative Amount of Fair Value Hedging Adjustment Included in the Carrying Amount of the Hedged Liability
|
|||||||||||
|
(Dollars in Millions)
|
September 30, 2018
|
December 31, 2017
|
September 30, 2018
|
December 31, 2017
|
|||||||||
|
Current Portion of Long-term Debt
|
$
|
601
|
|
597
|
|
1
|
|
2
|
|
||||
|
Long-term Debt
|
495
|
|
496
|
|
(4
|
)
|
3
|
|
|||||
|
The following table is the effect of derivatives not designated as hedging instrument for the fiscal third quarters and fiscal nine months in 2018 and 2017:
|
||||||||||||||
|
Gain/(Loss)
Recognized In
Income on Derivative
|
Gain/(Loss)
Recognized In
Income on Derivative
|
|||||||||||||
|
(Dollars in Millions)
|
Location of Gain /(Loss) Recognized in Income on Derivative
|
Fiscal Third Quarters Ended
|
Fiscal Nine Months Ended
|
|||||||||||
|
Derivatives Not Designated as Hedging Instruments
|
September 30, 2018
|
October 1, 2017
|
September 30, 2018
|
October 1, 2017
|
||||||||||
|
Foreign Exchange Contracts
|
Other (income) expense
|
$
|
49
|
|
(12
|
)
|
(23
|
)
|
22
|
|
||||
|
The following table is the effect of net investment hedges for the fiscal third quarters in 2018 and 2017:
|
|||||||||||||||
|
Gain/(Loss)
Recognized In
Accumulated
OCI
|
Location of Gain or (Loss) Reclassified from Accumulated Other Comprehensive Income Into Income
|
Gain/(Loss) Reclassified From
Accumulated OCI
Into Income
|
|||||||||||||
|
(Dollars in Millions)
|
Fiscal Third Quarters Ended
|
||||||||||||||
|
September 30, 2018
|
October 1, 2017
|
September 30, 2018
|
October 1, 2017
|
||||||||||||
|
Debt
|
$
|
(50
|
)
|
(151
|
)
|
Other (income) expense
|
—
|
|
—
|
|
|||||
|
Cross Currency interest rate swaps
|
$
|
(75
|
)
|
—
|
|
Other (income) expense
|
—
|
|
—
|
|
|||||
|
The following table is the effect of net investment hedges for the fiscal nine months in 2018 and 2017:
|
|||||||||||||||
|
Gain/(Loss)
Recognized In
Accumulated OCI
|
Location of Gain or (Loss) Reclassified from Accumulated Other Comprehensive Income Into Income
|
Gain/(Loss) Reclassified From
Accumulated OCI
Into Income
|
|||||||||||||
|
(Dollars in Millions)
|
Fiscal Nine Months Ended
|
||||||||||||||
|
September 30, 2018
|
October 1, 2017
|
September 30, 2018
|
October 1, 2017
|
||||||||||||
|
Debt
|
$
|
106
|
|
(529
|
)
|
Other (income) expense
|
—
|
|
—
|
|
|||||
|
Cross Currency interest rate swaps
|
$
|
(37
|
)
|
—
|
|
Other (income) expense
|
—
|
|
—
|
|
|||||
13
The Company adopted ASU 2016-01: Financial Instruments: Recognition and Measurement of Financial Assets and Financial Liabilities as of the beginning of the fiscal year 2018. This ASU amends prior guidance to classify equity investments with readily determinable market values into different categories (that is, trading or available-for-sale) and require equity investments to be measured at fair value with changes in fair value recognized through net earnings. The Company made a cumulative effect adjustment to the opening balance of retained earnings upon adoption of ASU 2016-01 which increased retained earnings by
$232 million
, net of tax, and decreased accumulated other comprehensive income for previously net unrealized gains from equity investments.
The Company holds equity investments with readily determinable fair values and equity investments without readily determinable fair values. The Company has elected to measure equity investments that do not have readily determinable fair values at cost minus impairment, if any, plus or minus changes resulting from observable price changes in orderly transactions for the identical or a similar investment of the same issuer.
The following table is a summary of the activity related to equity investments as of
September 30, 2018
:
|
(Dollars in Millions)
|
December 31, 2017
|
September 30, 2018
|
||||||||||||||
|
Carrying Value
|
Changes in Fair Value Reflected in Net Income
(1)
|
Sales/ Purchases/Other
(2)
|
Carrying Value
|
Non Current Other Assets
|
||||||||||||
|
Equity Investments with readily determinable value
|
$
|
751
|
|
(35
|
)
|
(19
|
)
|
697
|
|
697
|
|
|||||
|
Equity Investments without readily determinable value
|
$
|
510
|
|
7
|
|
122
|
|
639
|
|
639
|
|
|||||
(1)
Recorded in Other Income/Expense
(2)
Other includes impact of currency
For equity investments without readily determinable market values,
$31 million
of the changes in fair value reflected in net income were the result of impairments. There were
$38 million
of changes in fair value reflected in net income due to changes in observable prices.
For the
fiscal nine months
ended
October 1, 2017
, changes in fair value reflected within other comprehensive income due to previously unrealized gains on equity investments with readily determinable fair values net of tax was a net gain of
$269 million
.
Fair value is the exit price that would be received to sell an asset or paid to transfer a liability. Fair value is a market-based measurement determined using assumptions that market participants would use in pricing an asset or liability. The authoritative literature establishes a three-level hierarchy to prioritize the inputs used in measuring fair value. The levels within the hierarchy are described below with Level 1 inputs having the highest priority and Level 3 inputs having the lowest.
The fair value of a derivative financial instrument (i.e., forward foreign exchange contracts, interest rate contracts) is the aggregation by currency of all future cash flows discounted to its present value at the prevailing market interest rates and subsequently converted to the U.S. Dollar at the current spot foreign exchange rate. The Company does not believe that fair values of these derivative instruments materially differ from the amounts that could be realized upon settlement or maturity, or that the changes in fair value will have a material effect on the Company’s results of operations, cash flows or financial position. The Company also holds equity investments which are classified as Level 1 and debt securities which are classified as Level 2. The Company did not have any other significant financial assets or liabilities which would require revised valuations under this standard that are recognized at fair value.
The following three levels of inputs are used to measure fair value:
Level 1 — Quoted prices in active markets for identical assets and liabilities.
Level 2 — Significant other observable inputs.
Level 3 — Significant unobservable inputs.
14
The Company’s significant financial assets and liabilities measured at fair value as of
September 30, 2018
and
December 31, 2017
were as follows:
|
|
September 30, 2018
|
|
December 31, 2017
|
|||||||||||||
|
(Dollars in Millions)
|
Level 1
|
Level 2
|
Level 3
|
Total
|
Total
(1)
|
|||||||||||
|
Derivatives designated as hedging instruments:
|
|
|
|
|
|
|||||||||||
|
Assets:
|
|
|
|
|
|
|||||||||||
|
Forward foreign exchange contracts
|
$
|
—
|
|
551
|
|
—
|
|
551
|
|
418
|
|
|||||
|
Interest rate contracts
(2)(4)
|
—
|
|
19
|
|
—
|
|
19
|
|
7
|
|
||||||
|
Total
|
—
|
|
570
|
|
—
|
|
570
|
|
425
|
|
||||||
|
Liabilities:
|
|
|
|
|
|
|||||||||||
|
Forward foreign exchange contracts
|
—
|
|
401
|
|
—
|
|
401
|
|
402
|
|
||||||
|
Interest rate contracts
(3)(4)
|
—
|
|
269
|
|
—
|
|
269
|
|
165
|
|
||||||
|
Total
|
—
|
|
670
|
|
—
|
|
670
|
|
567
|
|
||||||
|
Derivatives not designated as hedging instruments:
|
|
|
|
|
|
|||||||||||
|
Assets:
|
|
|
|
|
|
|||||||||||
|
Forward foreign exchange contracts
|
—
|
|
28
|
|
—
|
|
28
|
|
38
|
|
||||||
|
Liabilities:
|
|
|
|
|
|
|||||||||||
|
Forward foreign exchange contracts
|
—
|
|
45
|
|
—
|
|
45
|
|
38
|
|
||||||
|
Other Investments:
|
||||||||||||||||
|
Equity investments
(5)
|
697
|
|
—
|
|
—
|
|
697
|
|
751
|
|
||||||
|
Debt securities
(6)
|
$
|
—
|
|
11,155
|
|
—
|
|
11,155
|
|
5,310
|
|
|||||
|
Gross to Net Derivative Reconciliation
|
September 30, 2018
|
December 31, 2017
|
|||||
|
(Dollars in Millions)
|
|||||||
|
Total Gross Assets
|
$
|
598
|
|
463
|
|
||
|
Credit Support Agreement (CSA)
|
(290
|
)
|
(76
|
)
|
|||
|
Total Net Asset
|
308
|
|
387
|
|
|||
|
Total Gross Liabilities
|
715
|
|
605
|
|
|||
|
Credit Support Agreement (CSA)
|
(443
|
)
|
(238
|
)
|
|||
|
Total Net Liabilities
|
$
|
272
|
|
367
|
|
||
|
(1)
|
2017 assets and liabilities are all classified as Level 2 with the exception of equity investments of
$751 million
, which are classified as Level 1.
|
|
(2)
|
Includes
$4 million
and
$7 million
of non-current other assets for
September 30, 2018
and
December 31, 2017
, respectively.
|
|
(3)
|
Includes
$6 million
and
$9 million
of non-current other liabilities for
September 30, 2018
and
December 31, 2017
, respectively.
|
|
(4)
|
Includes cross currency interest rate swaps and interest rate swaps.
|
|
(5)
|
Classified as non-current other assets. The carrying amount of the equity investments were
$697 million
and
$751 million
as of
September 30, 2018
and
December 31, 2017
, respectively.
|
|
(6)
|
Classified as cash equivalents and current marketable securities.
|
15
The Company's cash, cash equivalents and current marketable securities as of
September 30, 2018
comprised:
|
September 30, 2018
|
||||||||||||||||||
|
(Dollars in Millions)
|
Carrying Amount
|
Unrecognized Gain
|
Unrecognized Loss
|
Estimated Fair Value
|
Cash & Cash Equivalents
|
Current Marketable Securities
|
||||||||||||
|
Cash
|
$
|
2,575
|
|
—
|
|
—
|
|
2,575
|
|
2,575
|
|
|||||||
|
Other sovereign securities
(1)
|
—
|
|
—
|
|
—
|
|
—
|
|
—
|
|
|
|
||||||
|
U.S. reverse repurchase agreements
|
2,260
|
|
—
|
|
—
|
|
2,260
|
|
2,260
|
|
|
|||||||
|
Other reverse repurchase agreements
|
479
|
|
—
|
|
—
|
|
479
|
|
479
|
|
||||||||
|
Corporate debt securities
(1)
|
200
|
|
—
|
|
—
|
|
200
|
|
200
|
|
—
|
|
||||||
|
Money market funds
|
1,763
|
|
—
|
|
—
|
|
1,763
|
|
1,763
|
|
||||||||
|
Time deposits
(1)
|
932
|
|
—
|
|
—
|
|
932
|
|
932
|
|
||||||||
|
Subtotal
|
8,209
|
|
—
|
|
—
|
|
8,209
|
|
8,209
|
|
—
|
|
||||||
|
Unrealized Gain
|
Unrealized Loss
|
|||||||||||||||||
|
Government securities
|
10,885
|
|
—
|
|
(1
|
)
|
10,884
|
|
7,835
|
|
3,049
|
|
||||||
|
Other sovereign securities
|
—
|
|
—
|
|
—
|
|
—
|
|
—
|
|
—
|
|
||||||
|
Corporate debt securities
|
271
|
|
—
|
|
—
|
|
271
|
|
12
|
|
259
|
|
||||||
|
Subtotal available for sale debt
(2)
|
$
|
11,156
|
|
—
|
|
(1
|
)
|
11,155
|
|
7,847
|
|
3,308
|
|
|||||
|
Total cash, cash equivalents and current marketable securities
|
|
|
|
|
|
|
|
|
16,056
|
|
3,308
|
|
||||||
(1)
Held to maturity investments are reported at amortized cost and gains or losses are reported in earnings.
(2)
Available for sale debt securities are reported at fair value with unrealized gains and losses reported net of taxes in other comprehensive income.
Fair value of government securities and obligations and corporate debt securities was estimated using quoted broker prices and significant other observable inputs.
The Company classifies all highly liquid investments with stated maturities of three months or less from date of purchase as cash equivalents and all highly liquid investments with stated maturities of greater than three months from the date of purchase as current marketable securities. Available for sale securities with stated maturities of greater than one year from the date of purchase are available for current operations and are classified as cash equivalents and current marketable securities.
The contractual maturities of the available for sale securities at
September 30, 2018
are as follows:
|
(Dollars in Millions)
|
Cost Basis
|
Fair Value
|
|||||
|
Due within one year
|
$
|
11,079
|
|
11,078
|
|
||
|
Due after one year through five years
|
77
|
|
77
|
|
|||
|
Due after five years through ten years
|
—
|
|
—
|
|
|||
|
Total debt securities
|
$
|
11,156
|
|
11,155
|
|
||
16
Financial Instruments not measured at Fair Value:
The following financial liabilities are held at carrying amount on the consolidated balance sheet as of
September 30, 2018
:
|
(Dollars in Millions)
|
Carrying Amount
|
Estimated Fair Value
|
|||||
|
Financial Liabilities
|
|
|
|||||
|
Current Debt
|
$
|
1,773
|
|
1,773
|
|
||
|
Non-Current Debt
|
|
|
|||||
|
4.75% Notes due 2019 (1B Euro 1.1681)
|
1,166
|
|
1,231
|
|
|||
|
1.875% Notes due 2019
|
495
|
|
490
|
|
|||
|
3% Zero Coupon Convertible Subordinated Debentures due in 2020
|
52
|
|
100
|
|
|||
|
1.950% Notes due 2020
|
499
|
|
490
|
|
|||
|
2.95% Debentures due 2020
|
548
|
|
551
|
|
|||
|
3.55% Notes due 2021
|
448
|
|
454
|
|
|||
|
2.45% Notes due 2021
|
349
|
|
345
|
|
|||
|
1.65% Notes due 2021
|
998
|
|
967
|
|
|||
|
0.250% Notes due 2022 (1B Euro 1.1681)
|
1,165
|
|
1,172
|
|
|||
|
2.25% Notes due 2022
|
996
|
|
973
|
|
|||
|
6.73% Debentures due 2023
|
250
|
|
291
|
|
|||
|
3.375% Notes due 2023
|
805
|
|
829
|
|
|||
|
2.05% Notes due 2023
|
498
|
|
477
|
|
|||
|
0.650% Notes due 2024 (750MM Euro 1.1681)
|
872
|
|
881
|
|
|||
|
5.50% Notes due 2024 (500 MM GBP 1.3123)
|
651
|
|
793
|
|
|||
|
2.625% Notes due 2025
|
748
|
|
719
|
|
|||
|
2.45% Notes due 2026
|
1,991
|
|
1,884
|
|
|||
|
2.95% Notes due 2027
|
996
|
|
956
|
|
|||
|
2.90% Notes due 2028
|
1,493
|
|
1,420
|
|
|||
|
1.150% Notes due 2028 (750MM Euro 1.1681)
|
868
|
|
874
|
|
|||
|
6.95% Notes due 2029
|
296
|
|
385
|
|
|||
|
4.95% Debentures due 2033
|
498
|
|
559
|
|
|||
|
4.375% Notes due 2033
|
856
|
|
912
|
|
|||
|
1.650% Notes due 2035 (1.5B Euro 1.1681)
|
1,735
|
|
1,774
|
|
|||
|
3.55% Notes due 2036
|
988
|
|
945
|
|
|||
|
5.95% Notes due 2037
|
991
|
|
1,252
|
|
|||
|
3.625% Notes due 2037
|
1,486
|
|
1,433
|
|
|||
|
3.40% Notes due 2038
|
990
|
|
926
|
|
|||
|
5.85% Debentures due 2038
|
696
|
|
874
|
|
|||
|
4.50% Debentures due 2040
|
538
|
|
573
|
|
|||
|
4.85% Notes due 2041
|
297
|
|
330
|
|
|||
|
4.50% Notes due 2043
|
495
|
|
532
|
|
|||
|
3.70% Notes due 2046
|
1,971
|
|
1,884
|
|
|||
|
3.75% Notes due 2047
|
991
|
|
951
|
|
|||
|
3.50% Notes due 2048
|
742
|
|
689
|
|
|||
|
Other
|
22
|
|
22
|
|
|||
|
Total Non-Current Debt
|
$
|
29,480
|
|
29,938
|
|
||
17
The weighted average effective interest rate on non-current debt is
3.20%
.
The excess of the estimated fair value over the carrying value of debt was
$2.0 billion
at December 31, 2017.
Fair value of the non-current debt was estimated using market prices, which were corroborated by quoted broker prices and significant other observable inputs.
The worldwide effective income tax rates for the
fiscal nine months
of
2018
and
2017
were
17.6%
and
20.5%
, respectively. The U.S. Tax Cuts and Jobs Act (TCJA) was enacted into law effective January 1, 2018. This law reduces the U.S. statutory corporate tax rate from 35% to 21%, eliminates or reduces certain corporate income tax deductions and introduces a tax on global intangible low-taxed income (GILTI). In December 2017, the Company recorded a provisional tax cost of
$13.0 billion
related to the enactment of the TCJA. Under the guidance in SEC Staff Accounting Bulletin 118 (SAB 118), the provisional amount was a reasonable estimate based on the most recent information and guidance available related to the calculation of the tax liability and the impact to its deferred tax assets and liabilities, including those recorded for foreign local and withholding taxes as of the 2017 assessment date of January 18, 2018. As noted below, the Company has made adjustments through the third quarter of 2018. All amounts recorded remain provisional and may require further adjustments and changes to the Company’s estimates as new guidance is made available. The estimate is subject to the finalization of management’s analysis related to certain matters, such as developing interpretations of the provisions of the TCJA, changes to certain estimates and amounts related to the earnings and profits of certain subsidiaries and the filing of tax returns. Revisions to the provisional charge may be material to the Company's future financial results. See Note 8 to the Consolidated Financial Statements in the Annual Report on Form 10-K for the fiscal year ended December 31, 2017 for further details on the TCJA and SAB 118.
The Company completed its acquisition of AMO in the first fiscal quarter of 2017, and incurred incremental tax costs that were discretely recorded in the first quarter of 2017, which had increased the effective tax rate by
1.4%
for the first nine months of 2017 compared to the same period in 2018. Additionally, in 2018 the Company had more income in higher tax jurisdictions relative to lower tax jurisdictions as compared to 2017. Tax benefits received from stock-based compensation during the fiscal nine months of 2018 and 2017, reduced the effective tax rate by
1.2%
and
2.1%
, respectively. The reduction of the U.S. statutory corporate tax rate including the effects of tax elections which resulted in the acceleration of certain deductions into the 2017 tax return
(1)
, offset by the elimination of the corporate income tax deductions, measurement period adjustments
(2)
and the GILTI tax
(3)
, decreased the Company’s worldwide effective rate as compared to the same period of the prior year. As previously disclosed, the Company has elected to provisionally treat the GILTI tax as a period expense, pending further analysis by management of this new tax provision which will be completed in the fourth quarter of 2018.
(1)
The impact of the accelerations of these deductions on the effective tax rate through the fiscal nine months of 2018 was a decrease of approximately
2.0%
.
(2)
The following adjustments were made to the provisional tax amounts through the fiscal third quarter of 2018 due to issued Treasury guidance and revisions to the Company’s estimates since the assessment date:
|
•
|
$0.1 billion
increase to the transition tax on previously undistributed foreign earnings as of December 31, 2017 due to U.S. Treasury Department’s issuance of Notice 2018-13 on January 19, 2018, Notice 2018-26 on April 2, 2018, Notice 2018-78 on October 1, 2018 and updates to prior estimates
|
|
•
|
$0.3 billion
decrease to the deferred tax liability for foreign withholding and local taxes, partially offset by a decrease of
$0.2 billion
in deferred tax assets for U.S. foreign tax credits due to updated estimates from the amounts recorded in 2017.
|
These measurement period adjustments decreased the Company’s effective tax rate by approximately
0.4%
through the first fiscal nine months of 2018 as compared to the same period of the prior year.
(3)
The impact of GILTI on the effective tax rate through the first fiscal nine months of 2018 was an increase of
2.5%
.
In 2017, the Company provisionally recorded the TCJA transition tax and foreign local and withholding taxes on substantially all of the Company’s foreign earnings. The Company has currently designated a portion of its 2018 foreign earnings as indefinitely reinvested in certain foreign jurisdictions and, as such, has not accrued for the impact of foreign local and withholding taxes in its financial results related to these earnings. The estimated impact of these taxes would have been an increase of approximately
2.5%
to the year-to-date effective tax rate. As of September 30, 2018, the Company has no plans or intention to repatriate these designated earnings to the United States. However, the Company is continuing to evaluate its reinvestment plans based on the enacted provisions of the TCJA and related guidance issued to-date in 2018 by the U.S. Department of Treasury, specifically related to the eligibility of these earnings to utilize foreign tax credits. As further Treasury guidance is provided, the Company may re-evaluate its reinvestment plans and strategies for all of its foreign earnings.
18
As of
September 30, 2018
, the Company had approximately
$3.2 billion
of liabilities from unrecognized tax benefits. The Company believes it is possible that audits may be completed by tax authorities in some jurisdictions over the next twelve months. The Company is not able to provide a reasonably reliable estimate of the timing of any future tax payments relating to uncertain tax positions. The IRS has completed its audit for the tax years through 2009 and is currently auditing the tax years 2010 through 2012. The Company currently expects completion of this audit during 2019. Final conclusion of the tax audit may result in an outcome that is different than the Company’s estimates and may result in a material impact on the Company’s current and future operating results or cash flows in the period that the audit is concluded.
Components of Net Periodic Benefit Cost
Net periodic benefit cost for the Company’s defined benefit retirement plans and other benefit plans for the fiscal
third
quarters and
fiscal nine months
of
2018
and
2017
include the following components:
|
Fiscal Third Quarters Ended
|
Fiscal Nine Months Ended
|
||||||||||||||||||||||||
|
|
Retirement Plans
|
Other Benefit Plans
|
Retirement Plans
|
Other Benefit Plans
|
|||||||||||||||||||||
|
(Dollars in Millions)
|
September 30, 2018
|
October 1, 2017
|
September 30, 2018
|
October 1, 2017
|
September 30, 2018
|
October 1, 2017
|
September 30, 2018
|
October 1, 2017
|
|||||||||||||||||
|
Service cost
|
$
|
307
|
|
266
|
|
67
|
|
62
|
|
925
|
|
772
|
|
202
|
|
185
|
|
||||||||
|
Interest cost
|
247
|
|
232
|
|
37
|
|
40
|
|
748
|
|
693
|
|
112
|
|
119
|
|
|||||||||
|
Expected return on plan assets
|
(550
|
)
|
(514
|
)
|
(1
|
)
|
(2
|
)
|
(1,664
|
)
|
(1,528
|
)
|
(5
|
)
|
(5
|
)
|
|||||||||
|
Amortization of prior service cost/(credit)
|
1
|
|
1
|
|
(7
|
)
|
(8
|
)
|
2
|
|
2
|
|
(23
|
)
|
(23
|
)
|
|||||||||
|
Recognized actuarial losses
|
213
|
|
154
|
|
31
|
|
34
|
|
641
|
|
456
|
|
92
|
|
103
|
|
|||||||||
|
Curtailments and settlements
|
—
|
|
2
|
|
—
|
|
—
|
|
(2
|
)
|
1
|
|
—
|
|
—
|
|
|||||||||
|
Net periodic benefit cost
|
$
|
218
|
|
141
|
|
127
|
|
126
|
|
650
|
|
396
|
|
378
|
|
379
|
|
||||||||
As per the adoption of ASU 2017-07, the service cost component of net periodic benefit cost was presented in the same line items on the Consolidated Statement of Earnings where other employee compensation costs are reported. All other components of net periodic benefit cost are presented as part of Other (income) expense, net on the Consolidated Statement of Earnings.
Company Contributions
For the
fiscal nine months
ended
September 30, 2018
, the Company contributed
$656 million
and
$28 million
to its U.S. and international retirement plans, respectively. The Company plans to continue to fund its U.S. defined benefit plans to comply with the Pension Protection Act of 2006. International plans are funded in accordance with local regulations.
19
Components of other comprehensive income (loss) consist of the following:
|
|
Foreign
|
Gain/(Loss)
|
Employee
|
Gain/(Loss)
|
Total Accumulated
|
|||||||||||
|
Currency
|
On
|
Benefit
|
On Derivatives
|
Other Comprehensive
|
||||||||||||
|
(Dollars in Millions)
|
Translation
|
Securities
|
Plans
|
& Hedges
|
Income (Loss)
|
|||||||||||
|
December 31, 2017
|
$
|
(7,351
|
)
|
232
|
|
(6,150
|
)
|
70
|
|
(13,199
|
)
|
|||||
|
Net change
|
(1,718
|
)
|
(1
|
)
|
557
|
|
(54
|
)
|
(1,216
|
)
|
||||||
|
Cumulative adjustment to retained earnings
|
(232
|
)
|
(1)
|
(232
|
)
|
|||||||||||
|
September 30, 2018
|
$
|
(9,069
|
)
|
(1
|
)
|
(5,593
|
)
|
16
|
|
(14,647
|
)
|
|||||
(1)
See Note 1 to the Consolidated Financial Statements for additional details on the adoption of ASU 2016-01
Amounts in accumulated other comprehensive income are presented net of the related tax impact. Foreign currency translation is not adjusted for income taxes where it relates to permanent investments in international subsidiaries. For additional details on comprehensive income see the Consolidated Statements of Comprehensive Income.
Details on reclassifications out of Accumulated Other Comprehensive Income:
Gain/(Loss) On Securities - reclassifications released to Other (income) expense, net.
Employee Benefit Plans - reclassifications are included in net periodic benefit cost. See Note 6 for additional details.
Gain/(Loss) On Derivatives & Hedges - reclassifications to earnings are recorded in the same account as the underlying transaction. See Note 4 for additional details.
The following is a reconciliation of basic net earnings per share to diluted net earnings per share for the fiscal
third
quarters and
fiscal nine months
ended
September 30, 2018
and
October 1, 2017
:
|
|
Fiscal Third Quarters Ended
|
Fiscal Nine Months Ended
|
|||||||||||
|
(Shares in Millions)
|
September 30, 2018
|
October 1, 2017
|
September 30, 2018
|
October 1, 2017
|
|||||||||
|
Basic net earnings per share
|
$
|
1.47
|
|
1.40
|
|
4.57
|
|
4.46
|
|
||||
|
Average shares outstanding — basic
|
2,683.2
|
|
2,684.6
|
|
2,682.6
|
|
2,694.4
|
|
|||||
|
Potential shares exercisable under stock option plans
|
140.3
|
|
139.3
|
|
140.9
|
|
141.2
|
|
|||||
|
Less: shares which could be repurchased under treasury stock method
|
(96.7
|
)
|
(87.2
|
)
|
(94.7
|
)
|
(90.2
|
)
|
|||||
|
Convertible debt shares
|
0.8
|
|
1.0
|
|
0.8
|
|
1.0
|
|
|||||
|
Average shares outstanding — diluted
|
2,727.6
|
|
2,737.7
|
|
2,729.6
|
|
2,746.4
|
|
|||||
|
Diluted net earnings per share
|
$
|
1.44
|
|
1.37
|
|
4.49
|
|
4.37
|
|
||||
The diluted net earnings per share calculation for both the fiscal
third
quarters ended
September 30, 2018
and
October 1, 2017
included the dilutive effect of convertible debt that was offset by the related reduction in interest expense. The diluted net earnings per share calculation for the both the fiscal
third
quarters ended
September 30, 2018
and
October 1, 2017
included all shares related to stock options, as there were
no
options or other instruments which were anti-dilutive.
The diluted net earnings per share calculation for both the
fiscal nine months
ended
September 30, 2018
and
October 1, 2017
included the dilutive effect of convertible debt that was offset by the related reduction in interest expense. The diluted net earnings per share calculation for both the
fiscal nine months
ended
September 30, 2018
and
October 1, 2017
included all shares related to stock options, as there were
no
options or other instruments which were anti-dilutive.
20
SALES BY SEGMENT OF BUSINESS
|
|
Fiscal Third Quarters Ended
|
Fiscal Nine Months Ended
|
||||||||||||||||||
|
(Dollars in Millions)
|
September 30,
2018 |
October 1,
2017 |
Percent
Change
|
September 30,
2018 |
October 1,
2017 |
Percent Change
|
||||||||||||||
|
CONSUMER
|
|
|
|
|||||||||||||||||
|
Baby Care
|
||||||||||||||||||||
|
U.S.
|
$
|
120
|
|
100
|
|
20.0
|
%
|
$
|
306
|
|
326
|
|
(6.1
|
)%
|
||||||
|
International
|
352
|
|
377
|
|
(6.6
|
)
|
1,079
|
|
1,100
|
|
(1.9
|
)
|
||||||||
|
Worldwide
|
472
|
|
477
|
|
(1.0
|
)
|
1,385
|
|
1,426
|
|
(2.9
|
)
|
||||||||
|
Beauty
|
||||||||||||||||||||
|
U.S.
|
543
|
|
523
|
|
3.8
|
|
1,791
|
|
1,739
|
|
3.0
|
|
||||||||
|
International
|
535
|
|
510
|
|
4.9
|
|
1,480
|
|
1,351
|
|
9.5
|
|
||||||||
|
Worldwide
|
1,078
|
|
1,033
|
|
4.4
|
|
3,271
|
|
3,090
|
|
5.9
|
|
||||||||
|
Oral Care
|
||||||||||||||||||||
|
U.S.
|
158
|
|
154
|
|
2.6
|
|
472
|
|
460
|
|
2.6
|
|
||||||||
|
International
|
226
|
|
228
|
|
(0.9
|
)
|
684
|
|
678
|
|
0.9
|
|
||||||||
|
Worldwide
|
384
|
|
382
|
|
0.5
|
|
1,156
|
|
1,138
|
|
1.6
|
|
||||||||
|
OTC
|
||||||||||||||||||||
|
U.S.
|
440
|
|
401
|
|
9.7
|
|
1,359
|
|
1,310
|
|
3.7
|
|
||||||||
|
International
|
608
|
|
601
|
|
1.2
|
|
1,827
|
|
1,711
|
|
6.8
|
|
||||||||
|
Worldwide
|
1,048
|
|
1,002
|
|
4.6
|
|
3,186
|
|
3,021
|
|
5.5
|
|
||||||||
|
Women's Health
|
||||||||||||||||||||
|
U.S.
|
3
|
|
3
|
|
0.0
|
|
10
|
|
9
|
|
11.1
|
|
||||||||
|
International
|
266
|
|
267
|
|
(0.4
|
)
|
782
|
|
779
|
|
0.4
|
|
||||||||
|
Worldwide
|
269
|
|
270
|
|
(0.4
|
)
|
792
|
|
788
|
|
0.5
|
|
||||||||
|
Wound Care/Other
|
||||||||||||||||||||
|
U.S.
|
106
|
|
104
|
|
1.9
|
|
344
|
|
342
|
|
0.6
|
|
||||||||
|
International
|
58
|
|
88
|
|
(34.1
|
)
|
183
|
|
257
|
|
(28.8
|
)
|
||||||||
|
Worldwide
|
164
|
|
192
|
|
(14.6
|
)
|
527
|
|
599
|
|
(12.0
|
)
|
||||||||
|
TOTAL CONSUMER
|
||||||||||||||||||||
|
U.S.
|
1,370
|
|
1,285
|
|
6.6
|
|
4,282
|
|
4,186
|
|
2.3
|
|
||||||||
|
International
|
2,045
|
|
2,071
|
|
(1.3
|
)
|
6,035
|
|
5,876
|
|
2.7
|
|
||||||||
|
Worldwide
|
3,415
|
|
3,356
|
|
1.8
|
|
10,317
|
|
10,062
|
|
2.5
|
|
||||||||
|
PHARMACEUTICAL
|
||||||||||||||||||||
|
Immunology
|
||||||||||||||||||||
|
U.S.
|
2,400
|
|
2,420
|
|
(0.8
|
)
|
6,717
|
|
6,644
|
|
1.1
|
|
||||||||
|
International
|
998
|
|
849
|
|
17.6
|
|
3,061
|
|
2,514
|
|
21.8
|
|
||||||||
|
Worldwide
|
3,398
|
|
3,269
|
|
3.9
|
|
9,778
|
|
9,158
|
|
6.8
|
|
||||||||
|
REMICADE
®
|
||||||||||||||||||||
|
U.S.
|
987
|
|
1,206
|
|
(18.2
|
)
|
2,821
|
|
3,452
|
|
(18.3
|
)
|
||||||||
|
U.S. Exports
|
100
|
|
156
|
|
(35.9
|
)
|
346
|
|
448
|
|
(22.8
|
)
|
||||||||
|
International
|
292
|
|
285
|
|
2.5
|
|
921
|
|
949
|
|
(3.0
|
)
|
||||||||
|
Worldwide
|
1,379
|
|
1,647
|
|
(16.3
|
)
|
4,088
|
|
4,849
|
|
(15.7
|
)
|
||||||||
21
|
SIMPONI / SIMPONI ARIA
®
|
||||||||||||||||||||
|
U.S.
|
281
|
|
242
|
|
16.1
|
|
779
|
|
701
|
|
11.1
|
|
||||||||
|
International
|
255
|
|
234
|
|
9.0
|
|
823
|
|
642
|
|
28.2
|
|
||||||||
|
Worldwide
|
536
|
|
476
|
|
12.6
|
|
1,602
|
|
1,343
|
|
19.3
|
|
||||||||
|
STELARA
®
|
||||||||||||||||||||
|
U.S.
|
889
|
|
800
|
|
11.1
|
|
2,460
|
|
2,027
|
|
21.4
|
|
||||||||
|
International
|
421
|
|
324
|
|
29.9
|
|
1,252
|
|
903
|
|
38.6
|
|
||||||||
|
Worldwide
|
1,310
|
|
1,124
|
|
16.5
|
|
3,712
|
|
2,930
|
|
26.7
|
|
||||||||
|
OTHER IMMUNOLOGY
|
||||||||||||||||||||
|
U.S.
|
143
|
|
16
|
|
*
|
311
|
|
16
|
|
*
|
||||||||||
|
International
|
30
|
|
6
|
|
*
|
65
|
|
20
|
|
*
|
||||||||||
|
Worldwide
|
173
|
|
22
|
|
*
|
376
|
|
36
|
|
*
|
||||||||||
|
Infectious Diseases
|
||||||||||||||||||||
|
U.S.
|
345
|
|
353
|
|
(2.3
|
)
|
1,006
|
|
1,020
|
|
(1.4
|
)
|
||||||||
|
International
|
478
|
|
460
|
|
3.9
|
|
1,496
|
|
1,334
|
|
12.1
|
|
||||||||
|
Worldwide
|
823
|
|
813
|
|
1.2
|
|
2,502
|
|
2,354
|
|
6.3
|
|
||||||||
|
EDURANT
®
/ rilpivirine
|
||||||||||||||||||||
|
U.S.
|
13
|
|
15
|
|
(13.3
|
)
|
42
|
|
44
|
|
(4.5
|
)
|
||||||||
|
International
|
189
|
|
179
|
|
5.6
|
|
581
|
|
478
|
|
21.5
|
|
||||||||
|
Worldwide
|
202
|
|
194
|
|
4.1
|
|
623
|
|
522
|
|
19.3
|
|
||||||||
|
PREZISTA
®
/ PREZCOBIX
®
/ REZOLSTA
®
/ SYMTUZA
®
|
||||||||||||||||||||
|
U.S.
|
297
|
|
287
|
|
3.5
|
|
847
|
|
824
|
|
2.8
|
|
||||||||
|
International
|
193
|
|
180
|
|
7.2
|
|
613
|
|
527
|
|
16.3
|
|
||||||||
|
Worldwide
|
490
|
|
467
|
|
4.9
|
|
1,460
|
|
1,351
|
|
8.1
|
|
||||||||
|
OTHER INFECTIOUS DISEASES
|
||||||||||||||||||||
|
U.S.
|
35
|
|
51
|
|
(31.4
|
)
|
117
|
|
152
|
|
(23.0
|
)
|
||||||||
|
International
|
96
|
|
101
|
|
(5.0
|
)
|
302
|
|
329
|
|
(8.2
|
)
|
||||||||
|
Worldwide
|
131
|
|
152
|
|
(13.8
|
)
|
419
|
|
481
|
|
(12.9
|
)
|
||||||||
|
Neuroscience
|
||||||||||||||||||||
|
U.S.
|
651
|
|
647
|
|
0.6
|
|
1,914
|
|
1,931
|
|
(0.9
|
)
|
||||||||
|
International
|
839
|
|
851
|
|
(1.4
|
)
|
2,663
|
|
2,531
|
|
5.2
|
|
||||||||
|
Worldwide
|
1,490
|
|
1,498
|
|
(0.5
|
)
|
4,577
|
|
4,462
|
|
2.6
|
|
||||||||
|
CONCERTA
®
/ Methylphenidate
|
||||||||||||||||||||
|
U.S.
|
57
|
|
100
|
|
(43.0
|
)
|
191
|
|
284
|
|
(32.7
|
)
|
||||||||
|
International
|
100
|
|
98
|
|
2.0
|
|
322
|
|
304
|
|
5.9
|
|
||||||||
|
Worldwide
|
157
|
|
198
|
|
(20.7
|
)
|
513
|
|
588
|
|
(12.8
|
)
|
||||||||
|
INVEGA SUSTENNA
®
/ XEPLION
®
/ TRINZA
®
/ TREVICTA
®
|
||||||||||||||||||||
|
U.S.
|
468
|
|
395
|
|
18.5
|
|
1,306
|
|
1,154
|
|
13.2
|
|
||||||||
|
International
|
281
|
|
248
|
|
13.3
|
|
859
|
|
722
|
|
19.0
|
|
||||||||
|
Worldwide
|
749
|
|
643
|
|
16.5
|
|
2,165
|
|
1,876
|
|
15.4
|
|
||||||||
|
RISPERDAL CONSTA
®
|
||||||||||||||||||||
|
U.S.
|
76
|
|
87
|
|
(12.6
|
)
|
238
|
|
273
|
|
(12.8
|
)
|
||||||||
|
International
|
99
|
|
107
|
|
(7.5
|
)
|
321
|
|
335
|
|
(4.2
|
)
|
||||||||
|
Worldwide
|
175
|
|
194
|
|
(9.8
|
)
|
559
|
|
608
|
|
(8.1
|
)
|
||||||||
22
|
OTHER NEUROSCIENCE
|
||||||||||||||||||||
|
U.S.
|
50
|
|
65
|
|
(23.1
|
)
|
179
|
|
220
|
|
(18.6
|
)
|
||||||||
|
International
|
359
|
|
398
|
|
(9.8
|
)
|
1,161
|
|
1,170
|
|
(0.8
|
)
|
||||||||
|
Worldwide
|
409
|
|
463
|
|
(11.7
|
)
|
1,340
|
|
1,390
|
|
(3.6
|
)
|
||||||||
|
Oncology
|
||||||||||||||||||||
|
U.S.
|
1,250
|
|
846
|
|
47.8
|
|
3,268
|
|
2,207
|
|
48.1
|
|
||||||||
|
International
|
1,338
|
|
1,052
|
|
27.2
|
|
4,087
|
|
3,012
|
|
35.7
|
|
||||||||
|
Worldwide
|
2,588
|
|
1,898
|
|
36.4
|
|
7,355
|
|
5,219
|
|
40.9
|
|
||||||||
|
DARZALEX
®
|
||||||||||||||||||||
|
U.S.
|
318
|
|
230
|
|
38.3
|
|
880
|
|
643
|
|
36.9
|
|
||||||||
|
International
|
180
|
|
87
|
|
*
|
561
|
|
228
|
|
*
|
||||||||||
|
Worldwide
|
498
|
|
317
|
|
57.1
|
|
1,441
|
|
871
|
|
65.4
|
|
||||||||
|
IMBRUVICA
®
|
||||||||||||||||||||
|
U.S.
|
334
|
|
230
|
|
45.2
|
|
811
|
|
622
|
|
30.4
|
|
||||||||
|
International
|
371
|
|
282
|
|
31.6
|
|
1,101
|
|
749
|
|
47.0
|
|
||||||||
|
Worldwide
|
705
|
|
512
|
|
37.7
|
|
1,912
|
|
1,371
|
|
39.5
|
|
||||||||
|
VELCADE
®
|
||||||||||||||||||||
|
U.S.
|
—
|
|
—
|
|
—
|
|
—
|
|
—
|
|
—
|
|
||||||||
|
International
|
271
|
|
273
|
|
(0.7
|
)
|
864
|
|
843
|
|
2.5
|
|
||||||||
|
Worldwide
|
271
|
|
273
|
|
(0.7
|
)
|
864
|
|
843
|
|
2.5
|
|
||||||||
|
ZYTIGA
®
|
||||||||||||||||||||
|
U.S.
|
527
|
|
352
|
|
49.7
|
|
1,420
|
|
826
|
|
71.9
|
|
||||||||
|
International
|
431
|
|
317
|
|
36.0
|
|
1,292
|
|
924
|
|
39.8
|
|
||||||||
|
Worldwide
|
958
|
|
669
|
|
43.2
|
|
2,712
|
|
1,750
|
|
55.0
|
|
||||||||
|
OTHER ONCOLOGY
|
||||||||||||||||||||
|
U.S.
|
71
|
|
34
|
|
*
|
157
|
|
116
|
|
35.3
|
|
|||||||||
|
International
|
85
|
|
93
|
|
(8.6
|
)
|
269
|
|
268
|
|
0.4
|
|
||||||||
|
Worldwide
|
156
|
|
127
|
|
22.8
|
|
426
|
|
384
|
|
10.9
|
|
||||||||
|
Pulmonary Hypertension
|
||||||||||||||||||||
|
U.S.
|
425
|
|
371
|
|
14.6
|
1,215
|
|
408
|
|
*
|
||||||||||
|
International
|
231
|
|
261
|
|
(11.5)
|
691
|
|
309
|
|
*
|
||||||||||
|
Worldwide
|
656
|
|
632
|
|
3.8
|
1,906
|
|
717
|
|
*
|
||||||||||
|
OPSUMIT
®
|
||||||||||||||||||||
|
U.S.
|
182
|
|
150
|
|
21.3
|
511
|
|
174
|
|
*
|
||||||||||
|
International
|
128
|
|
109
|
|
17.4
|
381
|
|
130
|
|
*
|
||||||||||
|
Worldwide
|
310
|
|
259
|
|
19.7
|
892
|
|
304
|
|
*
|
||||||||||
|
TRACLEER
®
|
||||||||||||||||||||
|
U.S.
|
69
|
|
83
|
|
(16.9)
|
208
|
|
85
|
|
*
|
||||||||||
|
International
|
70
|
|
127
|
|
(44.9)
|
214
|
|
151
|
|
*
|
||||||||||
|
Worldwide
|
139
|
|
210
|
|
(33.8)
|
422
|
|
236
|
|
*
|
||||||||||
|
UPTRAVI
®
|
||||||||||||||||||||
|
U.S.
|
154
|
|
113
|
|
36.3
|
433
|
|
121
|
|
*
|
||||||||||
|
International
|
17
|
|
11
|
|
54.5
|
49
|
|
12
|
|
*
|
||||||||||
|
Worldwide
|
171
|
|
124
|
|
37.9
|
482
|
|
133
|
|
*
|
||||||||||
23
|
OTHER
|
||||||||||||||||||||
|
U.S.
|
20
|
|
25
|
|
(20.0)
|
63
|
|
28
|
|
*
|
||||||||||
|
International
|
16
|
|
14
|
|
14.3
|
47
|
|
16
|
|
*
|
||||||||||
|
Worldwide
|
36
|
|
39
|
|
(7.7)
|
110
|
|
44
|
|
*
|
||||||||||
|
Cardiovascular / Metabolism / Other
|
||||||||||||||||||||
|
U.S.
|
1,026
|
|
1,179
|
|
(13.0
|
)
|
3,230
|
|
3,488
|
|
(7.4
|
)
|
||||||||
|
International
|
365
|
|
406
|
|
(10.1
|
)
|
1,196
|
|
1,177
|
|
1.6
|
|
||||||||
|
Worldwide
|
1,391
|
|
1,585
|
|
(12.2
|
)
|
4,426
|
|
4,665
|
|
(5.1
|
)
|
||||||||
|
XARELTO
®
|
||||||||||||||||||||
|
U.S.
|
612
|
|
635
|
|
(3.6
|
)
|
1,869
|
|
1,790
|
|
4.4
|
|
||||||||
|
International
|
—
|
|
—
|
|
—
|
|
—
|
|
—
|
|
—
|
|
||||||||
|
Worldwide
|
612
|
|
635
|
|
(3.6
|
)
|
1,869
|
|
1,790
|
|
4.4
|
|
||||||||
|
INVOKANA
®
/ INVOKAMET
®
|
||||||||||||||||||||
|
U.S.
|
150
|
|
220
|
|
(31.8
|
)
|
523
|
|
723
|
|
(27.7
|
)
|
||||||||
|
International
|
40
|
|
45
|
|
(11.1
|
)
|
130
|
|
121
|
|
7.4
|
|
||||||||
|
Worldwide
|
190
|
|
265
|
|
(28.3
|
)
|
653
|
|
844
|
|
(22.6
|
)
|
||||||||
|
PROCRIT
®
/ EPREX
®
|
||||||||||||||||||||
|
U.S.
|
178
|
|
168
|
|
6.0
|
|
523
|
|
511
|
|
2.3
|
|
||||||||
|
International
|
77
|
|
70
|
|
10.0
|
|
244
|
|
229
|
|
6.6
|
|
||||||||
|
Worldwide
|
255
|
|
238
|
|
7.1
|
|
767
|
|
740
|
|
3.6
|
|
||||||||
|
OTHER
|
||||||||||||||||||||
|
U.S.
|
86
|
|
156
|
|
(44.9
|
)
|
315
|
|
464
|
|
(32.1
|
)
|
||||||||
|
International
|
248
|
|
291
|
|
(14.8
|
)
|
822
|
|
827
|
|
(0.6
|
)
|
||||||||
|
Worldwide
|
334
|
|
447
|
|
(25.3
|
)
|
1,137
|
|
1,291
|
|
(11.9
|
)
|
||||||||
|
TOTAL PHARMACEUTICAL
|
|
|
||||||||||||||||||
|
U.S.
|
6,097
|
|
5,816
|
|
4.8
|
|
17,350
|
|
15,698
|
|
10.5
|
|
||||||||
|
International
|
4,249
|
|
3,879
|
|
9.5
|
|
13,194
|
|
10,877
|
|
21.3
|
|
||||||||
|
Worldwide
|
10,346
|
|
9,695
|
|
6.7
|
|
30,544
|
|
26,575
|
|
14.9
|
|
||||||||
|
MEDICAL DEVICES
|
||||||||||||||||||||
|
Diabetes Care
|
||||||||||||||||||||
|
U.S.
|
125
|
|
168
|
|
(25.6
|
)
|
371
|
|
482
|
|
(23.0
|
)
|
||||||||
|
International
|
190
|
|
237
|
|
(19.8
|
)
|
638
|
|
743
|
|
(14.1
|
)
|
||||||||
|
Worldwide
|
315
|
|
405
|
|
(22.2
|
)
|
1,009
|
|
1,225
|
|
(17.6
|
)
|
||||||||
|
Diagnostics
|
||||||||||||||||||||
|
U.S.
|
—
|
|
—
|
|
—
|
|
—
|
|
—
|
|
—
|
|
||||||||
|
International
|
—
|
|
—
|
|
—
|
|
—
|
|
1
|
|
*
|
|||||||||
|
Worldwide
|
—
|
|
—
|
|
—
|
|
—
|
|
1
|
|
*
|
|||||||||
|
Interventional Solutions
|
||||||||||||||||||||
|
U.S.
|
320
|
|
279
|
|
14.7
|
|
947
|
|
843
|
|
12.3
|
|
||||||||
|
International
|
333
|
|
274
|
|
21.5
|
|
1,013
|
|
832
|
|
21.8
|
|
||||||||
|
Worldwide
|
653
|
|
553
|
|
18.1
|
|
1,960
|
|
1,675
|
|
17.0
|
|
||||||||
|
Orthopaedics
|
||||||||||||||||||||
|
U.S.
|
1,284
|
|
1,308
|
|
(1.8
|
)
|
3,923
|
|
4,034
|
|
(2.8
|
)
|
||||||||
|
International
|
827
|
|
896
|
|
(7.7
|
)
|
2,700
|
|
2,738
|
|
(1.4
|
)
|
||||||||
|
Worldwide
|
2,111
|
|
2,204
|
|
(4.2
|
)
|
6,623
|
|
6,772
|
|
(2.2
|
)
|
||||||||
24
|
HIPS
|
||||||||||||||||||||
|
U.S.
|
201
|
|
195
|
|
3.1
|
|
621
|
|
612
|
|
1.5
|
|
||||||||
|
International
|
129
|
|
133
|
|
(3.0
|
)
|
432
|
|
418
|
|
3.3
|
|
||||||||
|
Worldwide
|
330
|
|
328
|
|
0.6
|
|
1,053
|
|
1,030
|
|
2.2
|
|
||||||||
|
KNEES
|
||||||||||||||||||||
|
U.S.
|
215
|
|
220
|
|
(2.3
|
)
|
672
|
|
702
|
|
(4.3
|
)
|
||||||||
|
International
|
126
|
|
123
|
|
2.4
|
|
438
|
|
424
|
|
3.3
|
|
||||||||
|
Worldwide
|
341
|
|
343
|
|
(0.6
|
)
|
1,110
|
|
1,126
|
|
(1.4
|
)
|
||||||||
|
TRAUMA
|
||||||||||||||||||||
|
U.S.
|
395
|
|
398
|
|
(0.8
|
)
|
1,196
|
|
1,179
|
|
1.4
|
|
||||||||
|
International
|
259
|
|
264
|
|
(1.9
|
)
|
829
|
|
768
|
|
7.9
|
|
||||||||
|
Worldwide
|
654
|
|
662
|
|
(1.2
|
)
|
2,025
|
|
1,947
|
|
4.0
|
|
||||||||
|
SPINE & OTHER
|
||||||||||||||||||||
|
U.S.
|
473
|
|
495
|
|
(4.4
|
)
|
1,434
|
|
1,541
|
|
(6.9
|
)
|
||||||||
|
International
|
313
|
|
376
|
|
(16.8
|
)
|
1,001
|
|
1,128
|
|
(11.3
|
)
|
||||||||
|
Worldwide
|
786
|
|
871
|
|
(9.8
|
)
|
2,435
|
|
2,669
|
|
(8.8
|
)
|
||||||||
|
Surgery
|
||||||||||||||||||||
|
U.S.
|
1,016
|
|
1,002
|
|
1.4
|
|
3,031
|
|
3,009
|
|
0.7
|
|
||||||||
|
International
|
1,360
|
|
1,344
|
|
1.2
|
|
4,283
|
|
3,992
|
|
7.3
|
|
||||||||
|
Worldwide
|
2,376
|
|
2,346
|
|
1.3
|
|
7,314
|
|
7,001
|
|
4.5
|
|
||||||||
|
ADVANCED
|
||||||||||||||||||||
|
U.S.
|
421
|
|
398
|
|
5.8
|
|
1,216
|
|
1,190
|
|
2.2
|
|
||||||||
|
International
|
555
|
|
525
|
|
5.7
|
|
1,731
|
|
1,543
|
|
12.2
|
|
||||||||
|
Worldwide
|
976
|
|
923
|
|
5.7
|
|
2,947
|
|
2,733
|
|
7.8
|
|
||||||||
|
GENERAL
|
||||||||||||||||||||
|
U.S.
|
423
|
|
430
|
|
(1.6
|
)
|
1,282
|
|
1,276
|
|
0.5
|
|
||||||||
|
International
|
657
|
|
675
|
|
(2.7
|
)
|
2,094
|
|
2,017
|
|
3.8
|
|
||||||||
|
Worldwide
|
1,080
|
|
1,105
|
|
(2.3
|
)
|
3,376
|
|
3,293
|
|
2.5
|
|
||||||||
|
SPECIALTY
|
||||||||||||||||||||
|
U.S.
|
172
|
|
174
|
|
(1.1
|
)
|
533
|
|
543
|
|
(1.8
|
)
|
||||||||
|
International
|
148
|
|
144
|
|
2.8
|
|
458
|
|
432
|
|
6.0
|
|
||||||||
|
Worldwide
|
320
|
|
318
|
|
0.6
|
|
991
|
|
975
|
|
1.6
|
|
||||||||
|
Vision
|
||||||||||||||||||||
|
U.S.
|
452
|
|
432
|
|
4.6
|
|
1,351
|
|
1,142
|
|
18.3
|
|
||||||||
|
International
|
680
|
|
659
|
|
3.2
|
|
2,069
|
|
1,802
|
|
14.8
|
|
||||||||
|
Worldwide
|
1,132
|
|
1,091
|
|
3.8
|
|
3,420
|
|
2,944
|
|
16.2
|
|
||||||||
|
CONTACT LENSES / OTHER
|
||||||||||||||||||||
|
U.S.
|
319
|
|
302
|
|
5.6
|
|
948
|
|
832
|
|
13.9
|
|
||||||||
|
International
|
516
|
|
498
|
|
3.6
|
|
1,538
|
|
1,404
|
|
9.5
|
|
||||||||
|
Worldwide
|
835
|
|
800
|
|
4.4
|
|
2,486
|
|
2,236
|
|
11.2
|
|
||||||||
|
SURGICAL
|
||||||||||||||||||||
|
U.S.
|
133
|
|
130
|
|
2.3
|
|
403
|
|
310
|
|
30.0
|
|
||||||||
|
International
|
164
|
|
161
|
|
1.9
|
|
531
|
|
398
|
|
33.4
|
|
||||||||
|
Worldwide
|
297
|
|
291
|
|
2.1
|
|
934
|
|
708
|
|
31.9
|
|
||||||||
25
|
TOTAL MEDICAL DEVICES
|
|
|
|
|
||||||||||||||||
|
U.S.
|
3,197
|
|
3,189
|
|
0.3
|
|
9,623
|
|
9,510
|
|
1.2
|
|
||||||||
|
International
|
3,390
|
|
3,410
|
|
(0.6
|
)
|
10,703
|
|
10,108
|
|
5.9
|
|
||||||||
|
Worldwide
|
6,587
|
|
6,599
|
|
(0.2
|
)
|
20,326
|
|
19,618
|
|
3.6
|
|
||||||||
|
WORLDWIDE
|
|
|
|
|
|
|
||||||||||||||
|
U.S.
|
10,664
|
|
10,290
|
|
3.6
|
|
31,255
|
|
29,394
|
|
6.3
|
|
||||||||
|
International
|
9,684
|
|
9,360
|
|
3.5
|
|
29,932
|
|
26,861
|
|
11.4
|
|
||||||||
|
Worldwide
|
$
|
20,348
|
|
19,650
|
|
3.6
|
%
|
$
|
61,187
|
|
56,255
|
|
8.8
|
%
|
||||||
*Percentage greater than 100% or not meaningful
EARNINGS BEFORE PROVISION FOR TAXES BY SEGMENT
|
|
Fiscal Third Quarters Ended
|
Fiscal Nine Months Ended
|
||||||||||||||||||
|
(Dollars in Millions)
|
September 30,
2018 |
October 1,
2017 |
Percent
Change
|
September 30,
2018 |
October 1,
2017 |
Percent Change
|
||||||||||||||
|
Consumer
(1)
|
$
|
510
|
|
878
|
|
(41.9
|
)%
|
$
|
1,887
|
|
2,132
|
|
(11.5
|
)%
|
||||||
|
Pharmaceutical
(2)
|
2,876
|
|
2,857
|
|
0.7
|
|
10,193
|
|
9,934
|
|
2.6
|
|
||||||||
|
Medical Devices
(3)
|
1,267
|
|
1,383
|
|
(8.4
|
)
|
3,642
|
|
3,938
|
|
(7.5
|
)
|
||||||||
|
Segment earnings before provision for taxes
|
4,653
|
|
5,118
|
|
(9.1
|
)
|
15,722
|
|
16,004
|
|
(1.8
|
)
|
||||||||
|
Less: Expense not allocated to segments
(4)
|
230
|
|
328
|
|
|
845
|
|
891
|
|
|
|
|||||||||
|
Worldwide income before tax
|
$
|
4,423
|
|
4,790
|
|
(7.7
|
)%
|
$
|
14,877
|
|
15,113
|
|
(1.6
|
)%
|
||||||
(1)
Includes a gain of
$0.3 billion
from the divestiture of NIZORAL
®
in the fiscal nine months of 2018. Includes a gain of
$0.4 billion
from the divestiture of COMPEED
®
in the fiscal third quarter and fiscal nine months of 2017. Includes amortization expense of
$0.1 billion
in the fiscal third quarters and
$0.2 billion
in fiscal nine months of 2018 and 2017.
(2)
Includes an in-process research and development charge of
$1.1 billion
related to the Alios and XO1 assets and the corresponding XO1 contingent liability reversal of
$0.2 billion
in the fiscal third quarter and fiscal nine months of 2018. Includes Actelion acquisition related costs of
$0.4 billion
in the fiscal third quarter of 2017. Includes Actelion acquisition related costs of
$0.2 billion
and
$0.6 billion
in the fiscal nine months of 2018 and 2017, respectively. Includes a gain of
$0.1 billion
from the divestiture of PANCREASE
®
in the fiscal nine months of 2018. Includes a gain of
$0.2 billion
related to monetization of future royalty receivables in the fiscal nine months of 2017. Includes a gain of
$0.3 billion
in the fiscal nine months of 2017 related to the sale of certain investments in equity securities held by Johnson & Johnson Innovation - JJDC, Inc. Includes litigation expense of
$0.1 billion
in the fiscal nine months of 2017. Includes amortization expense of
$0.7 billion
in the fiscal third quarters of 2018 and 2017. Includes amortization expense of
$2.3 billion
and
$0.9 billion
in the fiscal nine months of 2018 and 2017, respectively.
(3)
Includes a restructuring related charge of
$0.2 billion
and
$0.2 billion
in the fiscal third quarters of 2018 and 2017, respectively. Includes a restructuring related charge of
$0.4 billion
and
$0.5 billion
in the fiscal nine months of 2018 and 2017, respectively. Includes litigation expense of
$0.1 billion
in the fiscal third quarter of 2017. Includes litigation expense of
$0.7 billion
and
$0.5 billion
in the fiscal nine months of 2018 and 2017, respectively. Includes an asset impairment of
$0.2 billion
primarily related to the insulin pump business in the fiscal nine months of 2017. Includes amortization expense of
$0.3 billion
and
$0.3 billion
in the fiscal third quarters of 2018 and 2017, respectively. Includes amortization expense of
$0.8 billion
and
$0.8 billion
in the fiscal nine months of 2018 and 2017, respectively.
(4)
Amounts not allocated to segments include interest income/expense and general corporate income/expense.
26
SALES BY GEOGRAPHIC AREA
|
|
Fiscal Third Quarters Ended
|
Fiscal Nine Months Ended
|
||||||||||||||||||
|
(Dollars in Millions)
|
September 30, 2018
|
October 1, 2017
|
Percent
Change
|
September 30, 2018
|
October 1, 2017
|
Percent Change
|
||||||||||||||
|
United States
|
$
|
10,664
|
|
10,290
|
|
3.6
|
%
|
$
|
31,255
|
|
29,394
|
|
6.3
|
%
|
||||||
|
Europe
|
4,416
|
|
4,308
|
|
2.5
|
|
14,023
|
|
12,398
|
|
13.1
|
|
||||||||
|
Western Hemisphere, excluding U.S.
|
1,550
|
|
1,569
|
|
(1.2
|
)
|
4,657
|
|
4,522
|
|
3.0
|
|
||||||||
|
Asia-Pacific, Africa
|
3,718
|
|
3,483
|
|
6.7
|
|
11,252
|
|
9,941
|
|
13.2
|
|
||||||||
|
Total
|
$
|
20,348
|
|
19,650
|
|
3.6
|
%
|
$
|
61,187
|
|
56,255
|
|
8.8
|
%
|
||||||
Subsequent to the third quarter of 2018, the Company announced an agreement with Ci:z Holdings Co., Ltd., a Japanese company focused on the marketing, development and distribution of a broad range of dermocosmetic, cosmetic and skincare products, to launch an all-cash offer (the “tender offer”) to acquire all of the outstanding shares of Ci:z Holdings Co., Ltd. not already held by the Company and its affiliates for
¥5,900
per share, which equates to approximately
¥230 billion
(approximately
$2 billion
, using the exchange rate of
112.82
Japanese Yen to each U.S. Dollar as of 5 p.m., New York City time, on October 22, 2018). The tender offer is expected to close in the first quarter of 2019. Upon completion of the tender offer, the Company intends to conduct a squeeze-out procedure to purchase the remaining shares that were not tendered in the tender offer, which the Company expects to complete in the first half of 2019. The acquisition will include the range of brands comprising DR.CI:LABO, LABO LABO and GENOMER line of skincare products.
Subsequent to the third quarter of 2018, the Company completed the divestiture of its LifeScan business for approximately
$2.1 billion
. As of September 30, 2018, the assets held for sale on the Consolidated Balance Sheet were
$0.1 billion
of inventory,
$0.1 billion
of property, plant and equipment,
$0.1 billion
of intangible assets, net and
$1.0 billion
of goodwill. The Company will retain certain net liabilities of approximately
$0.4 billion
associated with the LifeScan business.
During the fiscal third quarter of 2018, the Company accepted the binding offer from Fortive Corporation to acquire its Advanced Sterilization Products (ASP) business for approximately
$2.7 billion
, subject to customary adjustments. The transaction is expected to close in 2019. As of September 30, 2018, the assets held for sale on the Consolidated Balance Sheet were
$0.2 billion
of inventory,
$0.1 billion
of property, plant and equipment and
$0.2 billion
of goodwill. The Company will retain certain net receivables of approximately
$0.1 billion
associated with the ASP business.
During the fiscal third quarter, the Company accepted a binding offer to form a strategic collaboration with Jabil Inc., one of the world’s leading manufacturing services providers for health care products and technology products. The Company is expanding a 12-year relationship with Jabil to produce a range of products within the Ethicon Endo-Surgery and DePuy Synthes businesses. This strategic collaboration has been accepted with respect to the North American sites and is pending applicable consultative processes in other jurisdictions. As of September 30, 2018, the assets held for sale on the Consolidated Balance Sheet were
$0.3 billion
of inventory and
$0.1 billion
of property, plant and equipment, net. For additional details on the global supply chain restructuring see Note 12 to the Consolidated Financial Statements.
During the fiscal third quarter of 2018, the Company completed the acquisitions of Zarbee’s, Inc., a privately held company that is a leader in naturally-based consumer healthcare products and Medical Enterprises Distribution, a healthcare technology firm focused on surgical procedure innovation.
During the fiscal second quarter of 2018, the Company completed the acquisition of BeneVir Biopharm, Inc. (BeneVir), a privately-held, biopharmaceutical company specializing in the development of oncolytic immunotherapies. Additionally, during the fiscal second quarter of 2018, the Company completed the divestitures of NIZORAL
®
, PANCREASE
®
and VALCHLOR
®
products.
During the fiscal first quarter of 2018, the Company completed the acquisition of Orthotaxy, a privately-held developer of software-enabled surgery technologies, including a differentiated robotic-assisted surgery solution.
During the fiscal third quarter of 2017, the Company completed the acquisitions of TearScience Inc., a manufacturer of products dedicated to treating meibomian gland dysfunction and Sightbox, Inc., a privately-held company that developed a subscription vision care service that connects consumers with eye care professionals and a supply of contact lenses. Additionally, during the fiscal third quarter of 2017, the Company completed the divestiture of COMPEED
®
to HRA Pharma.
27
On June 16, 2017, the Company completed the acquisition of Actelion Ltd through an all cash tender offer in Switzerland for
$280
per share, amounting to
$29.6 billion
, net of cash acquired. As part of the transaction, immediately prior to the completion of the acquisition, Actelion spun out its drug discovery operations and early-stage clinical development assets into a newly created Swiss biopharmaceutical company, Idorsia Ltd. The shares of Idorsia are listed on the SIX Swiss Exchange (SIX). The Company currently holds
9.9%
of the shares of Idorsia and has rights to an additional
22.1%
of Idorsia equity through a convertible loan with a principal amount of approximately
$0.5 billion
. The convertible loan may be converted into Idorsia shares as follows: (i) up to an aggregate shareholding of
16%
of Idorsia shares as a result of certain shareholders holding more than
20%
of the issued Idorsia shares, and (ii) up to the balance of the remaining amount within 20 business days of the maturity date of the convertible loan, which has a
ten
-year term, or if Idorsia undergoes a change of control transaction. The investment in Idorsia was recorded as a cost method investment in Other assets in the Company's consolidated Balance Sheet. The Company also exercised the option acquired on ACT-132577, a product within Idorsia being developed for resistant hypertension currently in phase 2 of clinical development. The Company has also entered into an agreement to provide Idorsia with a Swiss franc denominated credit facility of approximately
$250 million
. As of September 30, 2018, Idorsia has not made any draw-downs under the credit facility. Actelion has entered into a transitional services agreement with Idorsia. Actelion has established a leading franchise of differentiated, innovative products for pulmonary arterial hypertension (PAH) that are highly complementary to the existing portfolio of the Company. The addition of Actelion’s specialty in-market medicines and late-stage products is consistent with the Company's efforts to grow in attractive and complementary therapeutic areas and serve patients with serious illnesses and significant unmet medical need.
During the fiscal second quarter of 2018, the Company finalized the purchase price allocation to the individual assets acquired and liabilities assumed using the acquisition method. The following table presents the amounts recognized for assets acquired and liabilities assumed as of the acquisition date with adjustments made through the second quarter of 2018:
|
(Dollars in Millions)
|
||
|
Cash & Cash equivalents
|
469
|
|
|
Inventory
(1)
|
759
|
|
|
Accounts Receivable
|
485
|
|
|
Other current assets
|
93
|
|
|
Property, plant and equipment
|
104
|
|
|
Goodwill
|
6,161
|
|
|
Intangible assets
|
25,010
|
|
|
Deferred Taxes
|
99
|
|
|
Other non-current assets
|
19
|
|
|
Total Assets Acquired
|
33,199
|
|
|
Current liabilities
|
956
|
|
|
Deferred Taxes
|
1,776
|
|
|
Other non-current liabilities
|
413
|
|
|
Total Liabilities Assumed
|
3,145
|
|
|
Net Assets Acquired
|
30,054
|
|
(1)
Includes adjustment of
$642 million
to write-up the acquired inventory to its estimated fair value.
The adjustments made since the date of acquisition were
$0.2 billion
to the deferred taxes and
$0.4 billion
to the current liabilities with the offset to goodwill. The assets acquired are recorded in the Pharmaceutical segment. The acquisition of Actelion resulted in approximately
$6.2 billion
of goodwill. The goodwill is primarily attributable to synergies expected to arise from the acquisition. The goodwill is not expected to be deductible for tax purposes.
28
The purchase price allocation to the identifiable intangible assets is as follows:
|
(Dollars in Millions)
|
||||
|
Intangible assets with definite lives:
|
||||
|
Patents and trademarks*
|
$
|
24,230
|
|
|
|
Total amortizable intangibles
|
24,230
|
|
||
|
In-process research and development
|
780
|
|
||
|
Total intangible assets
|
$
|
25,010
|
|
|
*Includes
$0.4 billion
related to
VALCHLOR
®
, one of the acquired products, which was divested in the fiscal second quarter of 2018.
The patents and trademarks acquired are comprised of developed technology with a weighted average life of
9 years
and was primarily based on the patent life of the marketed products. The intangible assets with definite lives were assigned asset lives ranging from
4
to
10 years
. The in-process research and development intangible assets were valued for technology programs for unapproved products.
The value of the IPR&D was calculated using probability adjusted cash flow projections discounted for the risk inherent in such projects. The discount rate applied was
9%
.
The acquisition was accounted for using the acquisition method and, accordingly, the results of operations of Actelion were reported in the Company's financial statements beginning on June 16, 2017, the date of acquisition.
The following table provides pro forma results of operations for the fiscal nine months ended October 1, 2017 as if Actelion had been acquired as of January 4, 2016. The pro forma results include the effect of certain purchase accounting adjustments such as the estimated changes in depreciation and amortization expense on the acquired tangible and intangible assets. However, pro forma results do not include any anticipated cost savings or other effects of the planned integration of Actelion. Accordingly, such amounts are not necessarily indicative of the results if the acquisition had occurred on the dates indicated or which may occur in the future.
|
Unaudited Pro forma Consolidated Results
|
||||
|
(Dollars in Millions Except Per Share Data)
|
Fiscal Nine Months Ended
|
|||
|
October 1, 2017
|
||||
|
Net Sales
|
$
|
57,486
|
|
|
|
Net Earnings
|
11,909
|
|
||
|
Diluted Net Earnings per Common Share
|
$
|
4.34
|
|
|
In the fiscal nine months of 2018, the Company recorded acquisition related costs, of approximately
$0.2 billion
before tax, which was recorded in Other (income)/expense and Cost of products sold.
Additionally, during the fiscal second quarter of 2017, the Company completed the acquisition of Neuravi Limited, a privately-held medical device company that develops and markets medical devices for neurointerventional therapy.
During the fiscal first quarter of 2017, the Company acquired Abbott Medical Optics (AMO), a wholly-owned subsidiary of Abbott Laboratories, for
$4.3 billion
, net of cash acquired. The acquisition included ophthalmic products related to: cataract surgery, laser refractive surgery and consumer eye health. The net purchase price was primarily recorded as amortizable intangible assets for
$2.3 billion
and goodwill for
$1.7 billion
. The weighted average life of total amortizable intangibles, the majority being customer relationships, is approximately
14.4 years
. The goodwill is primarily attributable to synergies expected to arise from the business acquisition and is not deductible for tax purposes. The intangible assets and goodwill amounts are based on the final purchase price allocation. The assets acquired were recorded in the Medical Devices segment.
Additionally, during the fiscal first quarter of 2017, the Company completed the acquisitions of Torax Medical, Inc., a privately-held medical device company that manufactures and markets the LINX™ Reflux Management System for the surgical treatment of gastroesophageal reflux disease and Megadyne Medical Products, Inc., a privately-held medical device company that develops, manufactures and markets electrosurgical tools.
29
Johnson & Johnson and certain of its subsidiaries are involved in various lawsuits and claims regarding product liability; intellectual property; commercial and other matters; governmental investigations; and other legal proceedings that arise from time to time in the ordinary course of their business.
The Company records accruals for loss contingencies associated with these legal matters when it is probable that a liability will be incurred, and the amount of the loss can be reasonably estimated. As of
September 30, 2018
, the Company has determined that the liabilities associated with certain litigation matters are probable and can be reasonably estimated. The Company has accrued for these matters and will continue to monitor each related legal issue and adjust accruals as might be warranted based on new information and further developments in accordance with ASC 450-20-25. For these and other litigation and regulatory matters discussed below for which a loss is probable or reasonably possible, the Company is unable to estimate the possible loss or range of loss beyond the amounts already accrued. Amounts accrued for legal contingencies often result from a complex series of judgments about future events and uncertainties that rely heavily on estimates and assumptions. The ability to make such estimates and judgments can be affected by various factors, including whether damages sought in the proceedings are unsubstantiated or indeterminate; scientific and legal discovery has not commenced or is not complete; proceedings are in early stages; matters present legal uncertainties; there are significant facts in dispute; or there are numerous parties involved.
In the Company's opinion, based on its examination of these matters, its experience to date and discussions with counsel, the ultimate outcome of legal proceedings, net of liabilities accrued in the Company's balance sheet, is not expected to have a material adverse effect on the Company's financial position. However, the resolution of, or increase in accruals for, one or more of these matters in any reporting period may have a material adverse effect on the Company's results of operations and cash flows for that period.
PRODUCT LIABILITY
Johnson & Johnson and certain of its subsidiaries are involved in numerous product liability claims and lawsuits involving multiple products. Claimants in these cases seek substantial compensatory and, where available, punitive damages. While the Company believes it has substantial defenses, it is not feasible to predict the ultimate outcome of litigation. The Company has established accruals for product liability claims and lawsuits in compliance with ASC 450-20 based on currently available information, which in some cases may be limited. The Company accrues an estimate of the legal defense costs needed to defend each matter when those costs are probable and can be reasonably estimated. For certain of these matters, the Company has accrued additional amounts such as estimated costs associated with settlements, damages and other losses. To the extent adverse verdicts have been rendered against the Company, the Company does not record an accrual until a loss is determined to be probable and can be reasonably estimated. Product liability accruals can represent projected product liability for thousands of claims around the world, each in different litigation environments and with different fact patterns. Changes to the accruals may be required in the future as additional information becomes available.
The most significant of these cases include: the DePuy ASR™ XL Acetabular System and DePuy ASR™ Hip Resurfacing System; the PINNACLE
®
Acetabular Cup System; pelvic meshes; RISPERDAL
®
; XARELTO
®
; body powders containing talc, primarily JOHNSONS
®
Baby Powder; INVOKANA
®
; and ETHICON PHYSIOMESH
®
Flexible Composite Mesh. As of
September 30, 2018
, in the United States there were approximately
2,000
plaintiffs with direct claims in pending lawsuits regarding injuries allegedly due to the DePuy ASR™ XL Acetabular System and DePuy ASR™ Hip Resurfacing System;
10,400
with respect to the PINNACLE
®
Acetabular Cup System;
37,400
with respect to pelvic meshes;
13,000
with respect to RISPERDAL
®
;
25,500
with respect to XARELTO
®
;
11,700
with respect to body powders containing talc;
1,100
with respect to INVOKANA
®
;
and
1,500
with respect to ETHICON PHYSIOMESH
®
Flexible Composite Mesh.
In August 2010, DePuy Orthopaedics, Inc. (DePuy) announced a worldwide voluntary recall of its ASR
™
XL Acetabular System and DePuy ASR
™
Hip Resurfacing System used in hip replacement surgery. Claims for personal injury have been made against DePuy and Johnson & Johnson. The number of pending lawsuits is expected to fluctuate as certain lawsuits are settled or dismissed and additional lawsuits are filed. Cases filed in federal courts in the United States have been organized as a multi-district litigation in the United States District Court for the Northern District of Ohio. Litigation has also been filed in countries outside of the United States, primarily in the United Kingdom, Canada, Australia, Ireland, Germany and Italy. In November 2013, DePuy reached an agreement with a Court-appointed committee of lawyers representing ASR Hip System plaintiffs to establish a program to settle claims with eligible ASR Hip patients in the United States who had surgery to replace their ASR Hips, known as revision surgery, as of August 31, 2013. DePuy reached additional agreements in February 2015 and March
30
2017, which further extended the settlement program to include ASR Hip patients who had revision surgeries after August 31, 2013 and prior to February 15, 2017. This settlement program has resolved more than
10,000
claims, therefore bringing to resolution significant ASR Hip litigation activity in the United States. However, lawsuits in the United States remain, and the settlement program does not address litigation outside of the United States. In Australia, a class action settlement was reached that resolved the claims of the majority of ASR Hip patients in that country. In Canada, the Company has reached agreements to settle two pending class actions which have been approved by the Québec Superior Court and the Supreme Court of British Columbia. The British Columbia order is currently the subject of an appeal. The Company continues to receive information with respect to potential additional costs associated with this recall on a worldwide basis. The Company has established accruals for the costs associated with the United States settlement program and DePuy ASR
™
Hip-related product liability litigation.
Claims for personal injury have also been made against DePuy Orthopaedics, Inc. and Johnson & Johnson (collectively, DePuy) relating to the PINNACLE
®
Acetabular Cup System used in hip replacement surgery. The number of pending product liability lawsuits continues to increase, and the Company continues to receive information with respect to potential costs and the anticipated number of cases. Cases filed in federal courts in the United States have been organized as a multi-district litigation in the United States District Court for the Northern District of Texas. Litigation has also been filed in some state courts and in countries outside of the United States. Several adverse verdicts have been rendered against DePuy, which are currently being appealed. The Company has established an accrual for defense costs only in connection with product liability litigation associated with the PINNACLE
®
Acetabular Cup System.
Claims for personal injury have been made against Ethicon, Inc. (Ethicon) and Johnson & Johnson arising out of Ethicon's pelvic mesh devices used to treat stress urinary incontinence and pelvic organ prolapse. The Company continues to receive information with respect to potential costs and additional cases. Cases filed in federal courts in the United States have been organized as a multi-district litigation in the United States District Court for the Southern District of West Virginia. The Company has settled or otherwise resolved a majority of the United States cases and the costs associated with these settlements are reflected in the Company's accruals. In addition, class actions and individual personal injury cases or claims have been commenced in various countries outside of the United States, including claims and cases in the United Kingdom, the Netherlands and Belgium, and class actions in Israel, Australia and Canada, seeking damages for alleged injury resulting from Ethicon's pelvic mesh devices. In Australia, a trial of class action issues has been completed and a decision is expected in 2018. The Company has established accruals with respect to product liability litigation associated with Ethicon's pelvic mesh products.
Following a June 2016 worldwide market withdrawal of ETHICON PHYSIOMESH
®
Flexible Composite Mesh, claims for personal injury have been made against Ethicon, Inc. and Johnson & Johnson alleging personal injury arising out of the use of this hernia mesh device. Cases filed in federal courts in the United States have been organized as a multi-district litigation (MDL) in the United States District Court for the Northern District of Georgia. A multi county litigation (MCL) has also been formed in New Jersey state court and assigned to Atlantic County for cases pending in New Jersey. Product liability lawsuits continue to be filed, and the Company continues to receive information with respect to potential costs and the anticipated number of cases. The Company has established accruals with respect to product liability litigation associated with ETHICON PHYSIOMESH
®
Flexible Composite Mesh.
Claims for personal injury have been made against Janssen Pharmaceuticals, Inc. and Johnson & Johnson arising out of the use of RISPERDAL
®
, indicated for the treatment of schizophrenia, acute manic or mixed episodes associated with bipolar I disorder and irritability associated with autism, and related compounds. Lawsuits have been primarily filed in state courts in Pennsylvania, California, and Missouri. Other actions are pending in various courts in the United States and Canada. Product liability lawsuits continue to be filed, and the Company continues to receive information with respect to potential costs and the anticipated number of cases. The Company has settled or otherwise resolved many of the United States cases and the costs associated with these settlements are reflected in the Company's accruals.
Claims for personal injury arising out of the use of XARELTO
®
, an oral anticoagulant, have been made against Janssen Pharmaceuticals, Inc. (JPI); Johnson & Johnson; and JPI's collaboration partner for XARELTO
®
Bayer AG and certain of its affiliates. The number of pending product liability lawsuits continues to increase, and the Company continues to receive information with respect to potential costs and the anticipated number of cases. Cases filed in federal courts in the United States have been organized as a multi-district litigation in the United States District Court for the Eastern District of Louisiana. In addition, cases have been filed in state courts across the United States. Many of these cases have been consolidated into a state mass tort litigation in Philadelphia, Pennsylvania; and there are coordinated proceedings in Delaware, California and Missouri. Class action lawsuits also have been filed in Canada. The Company has established an accrual for defense costs only in connection with product liability litigation associated with XARELTO
®
.
31
Personal injury claims alleging that talc causes cancer have been made against Johnson & Johnson Consumer Inc. and Johnson & Johnson arising out of the use of body powders containing talc, primarily JOHNSONS
®
Baby Powder. The number of pending product liability lawsuits continues to increase, and the Company continues to receive information with respect to potential costs and the anticipated number of cases. Lawsuits have been primarily filed in state courts in Missouri, New Jersey and California. Cases filed in federal courts in the United States have been organized as a multi-district litigation in the United States District Court for the District of New Jersey. The Company has successfully defended a number of these cases but there have been verdicts against the Company, including a recent jury verdict of
$4.7 billion
. The Company believes that it has strong grounds on appeal to overturn these verdicts. The Company has established an accrual for defense costs only in connection with product liability litigation associated with body powders containing talc.
Claims for personal injury have been made against a number of Johnson & Johnson companies, including Janssen Pharmaceuticals, Inc. and Johnson & Johnson, arising out of the use of INVOKANA
®
, a prescription medication indicated to improve glycemic control in adults with Type 2 diabetes. Lawsuits filed in federal courts in the United States have been organized as a multi-district litigation in the United States District Court for the District of New Jersey. Cases have also been filed in state courts in Pennsylvania, California and New Jersey. Class action lawsuits have been filed in Canada. Product liability lawsuits continue to be filed, and the Company continues to receive information with respect to potential costs and the anticipated number of cases. The Company has settled or otherwise resolved many of the cases and claims in the United States and the costs associated with these settlements are reflected in the Company's accruals.
INTELLECTUAL PROPERTY
Certain subsidiaries of Johnson & Johnson are subject, from time to time, to legal proceedings and claims related to patent, trademark and other intellectual property matters arising out of their businesses. Many of these matters involve challenges to the coverage and/or validity of the patents on various products and allegations that certain of the Company’s products infringe the patents of third parties. Although these subsidiaries believe that they have substantial defenses to these challenges and allegations with respect to all significant patents, there can be no assurance as to the outcome of these matters. A loss in any of these cases could adversely affect the ability of these subsidiaries to sell their products, result in loss of sales due to loss of market exclusivity, require the payment of past damages and future royalties, and may result in a non-cash impairment charge for any associated intangible asset. The most significant of these matters are described below.
Medical Devices
In June 2009, Rembrandt Vision Technologies, L.P. (Rembrandt) filed a patent infringement lawsuit against Johnson & Johnson Vision Care, Inc. (JJVCI) in the United States District Court for the Eastern District of Texas alleging that JJVCI's manufacture and sale of its ACUVUE
®
ADVANCE and ACUVUE OASYS
®
Hydrogel Contact Lenses infringed Rembrandt’s United States Patent No. 5,712,327 and seeking monetary relief. The case was transferred to the United States District Court for the Middle District of Florida, where a trial in May 2012 resulted in a verdict of non-infringement that was subsequently upheld on appeal. In July 2014, Rembrandt sought a new trial based on alleged new evidence, which the District Court denied. In April 2016, the Court of Appeals overturned that ruling and remanded the case to the District Court for a new trial. A new trial was held in August 2017, and the jury returned a verdict of non-infringement in favor of JJVCI. Rembrandt has appealed the verdict to the United States Court of Appeals for the Federal Circuit.
In March 2013, Medinol Ltd. (Medinol) filed a patent infringement lawsuit against Cordis Corporation (Cordis) and Johnson & Johnson in the United States District Court for the Southern District of New York alleging that Cordis’s sales of the CYPHER
™
and CYPHER SELECT
™
stents made in the United States since 2005 willfully infringed four of Medinol's patents directed to the geometry of articulated stents. Medinol is seeking damages and attorneys’ fees. Although Johnson & Johnson has since sold Cordis, it has retained liability for this case. After trial in January 2014, the District Court dismissed the case, finding Medinol unreasonably delayed bringing its claims (the laches defense). In September 2014, the District Court denied a motion by Medinol to vacate the judgment and grant it a new trial. Medinol appealed the decision to the United States Court of Appeals for the Federal Circuit. In March 2017, the United States Supreme Court held that the laches defense is not available in patent cases. In April 2018, the United States Court of Appeals for the Federal Circuit remanded the case back to the District Court to reconsider Medinol's motion for a new trial, and briefing in the District Court was completed in June 2018.
In November 2016, MedIdea, L.L.C. (MedIdea) filed a patent infringement lawsuit against DePuy Orthopaedics, Inc. in the United States District Court for the Northern District of Illinois alleging infringement by the ATTUNE
®
Knee System. In April 2017, MedIdea filed an amended complaint adding DePuy Synthes Products, Inc. and DePuy Synthes Sales, Inc. as named defendants. MedIdea alleges infringement of United States Patent Nos. 6,558,426 (’426); 8,273,132; 8,721,730 and 9,492,280 relating to posterior stabilized knee systems. Specifically, MedIdea alleges that the SOFCAM
TM
Contact feature of the
32
ATTUNE
®
posterior stabilized knee products infringes the patents-in-suit. MedIdea is seeking monetary damages and injunctive relief. In June 2017, the case was transferred to the United States District Court for the District of Massachusetts. A claim construction hearing was held in October 2018. In December 2017, DePuy Synthes Products, Inc. filed a Petition for Inter Partes Review with the United States Patent and Trademark Office (USPTO), seeking to invalidate the ’426 patent, and in June 2018, the USPTO instituted review of the patent.
In December 2016, Ethicon Endo-Surgery, Inc. and Ethicon Endo-Surgery, LLC (now known as Ethicon LLC) sued Covidien, Inc. in the United States District Court for the District of Massachusetts seeking a declaration that United States Patent Nos. 6,585,735 (the ’735 patent); 7,118,587; 7,473,253; 8,070,748 and 8,241,284 (the ’284 patent), are either invalid or not infringed by Ethicon’s ENSEAL
®
X1 Large Jaw Tissue Sealer product. In April 2017, Covidien LP, Covidien Sales LLC, and Covidien AG (collectively, Covidien) answered and counterclaimed, denying the allegations, asserting willful infringement of the ’735 patent, the ’284 patent and United States Patent Nos. 8,323,310 (the ’310 patent); 9,084,608; 9,241,759 (the ’759 patent) and 9,113,882, and seeking damages and an injunction. Covidien filed a motion for preliminary injunction, which was denied in October 2017. The parties have entered joint stipulations such that only the ’284 patent, the ’735 patent, the ’310 patent and the ’759 patent remain in dispute. Trial is scheduled to begin in September 2019.
In November 2017, Board of Regents, The University of Texas System and Tissuegen, Inc. (collectively, UT) filed a lawsuit in the United States District Court for the Western District of Texas against Ethicon, Inc. and Ethicon US, LLC alleging the manufacture and sale of VICRYL
®
Plus Antibacterial Sutures, MONOCRYL
®
Plus Antibacterial Sutures, PDS
®
Plus Antibacterial Sutures, STRATAFIX
®
POS
®
Antibacterial Sutures and STRATAFIX
®
MONOCRYL
®
Plus Antibacterial Sutures infringe plaintiffs’ United States Patent Nos. 6,596,296 and 7,033,603 directed to implantable polymer drug releasing biodegradable fibers containing a therapeutic agent. UT is seeking damages and an injunction. A claim construction hearing was held in October 2018, and the parties await a decision.
Pharmaceutical
In April 2016, MorphoSys AG, a German biotech company, filed a patent infringement lawsuit against Janssen Biotech, Inc. (JBI), Genmab U.S. Inc. and Genmab A/S (collectively, Genmab) in the United States District Court for the District of Delaware. MorphoSys alleges that JBI’s manufacture and sale of DARZALEX
®
(daratumumab) willfully infringes MorphoSys’ United States Patent Nos. 8,263,746, 9,200,061 and 9,785,590. MorphoSys is seeking money damages. JBI licenses patents and the commercial rights to DARZALEX
®
from Genmab. Trial on liability and damages is scheduled to commence in February 2019.
In August 2016, Sandoz Ltd and Hexal AG (collectively, Sandoz) filed a lawsuit in the English High Court against G.D. Searle LLC, a Pfizer company (Searle) and Janssen Sciences Ireland UC (JSI) alleging that Searle’s supplementary protection certificate SPC/GB07/038 (SPC), which is exclusively licensed to JSI, is invalid and should be revoked. Janssen-Cilag Limited sells PREZISTA
®
(darunavir) in the United Kingdom pursuant to this license. In October 2016, Searle and JSI counterclaimed against Sandoz for threatened infringement of the SPC based on statements of its plans to launch generic darunavir in the United Kingdom. Sandoz admitted that its generic darunavir product would infringe the SPC if it is found valid. Searle and JSI are seeking an order enjoining Sandoz from marketing its generic darunavir before the expiration of the SPC. Following a trial in April 2017, the Court entered a decision holding that the SPC is valid and granting a final injunction. Sandoz has appealed the Court’s decision and the injunction will be stayed pending the appeal. In January 2018, the Court referred the issue on appeal to the Court of Justice for the European Union (CJEU) and stayed the proceedings pending the CJEU’s ruling on the issue.
REMICADE
®
Related Cases
In August 2014, Celltrion Healthcare Co. Ltd. and Celltrion Inc. (collectively, Celltrion) filed an application with the United States Food and Drug Administration (FDA) for approval to make and sell its own infliximab biosimilar. In March 2015, Janssen Biotech, Inc. (JBI) filed a lawsuit in the United States District Court for the District of Massachusetts against Celltrion and Hospira Healthcare Corporation (Hospira), which has exclusive marketing rights for Celltrion's infliximab biosimilar in the United States, seeking, among other things, a declaratory judgment that their biosimilar product infringes or potentially infringes several JBI patents, including United States Patent No. 6,284,471 relating to REMICADE
®
(infliximab) (the ’471 patent) and United States Patent No. 7,598,083 (the ’083 patent) directed to the cell culture media used to make Celltrion’s biosimilar. In August 2016, the District Court granted both Celltrion's and Hospira's motions for summary judgment of invalidity of the ’471 patent. JBI appealed those decisions to the United States Court of Appeals for the Federal Circuit. In January 2018, the Federal Circuit dismissed the appeal as moot based on its affirmance of a decision by the USPTO’s Patent Trial and Appeal Board affirming invalidity of the ’471 patent.
33
In June 2016, JBI filed two additional patent infringement lawsuits asserting the ’083 patent, one against Celltrion and Hospira in the United States District Court for the District of Massachusetts and the other against HyClone Laboratories, Inc., the manufacturer of the cell culture media that Celltrion uses to make its biosimilar product, in the United States District Court for the District of Utah. On July 30, 2018 the District Court granted Celltrion’s motion for summary judgment of non-infringement and entered an order dismissing the ’083 lawsuit against Celltrion and Hospira. JBI appealed to the United States District Court of Appeals for the Federal Circuit. The litigation against HyClone in Utah is stayed pending the outcome of the Massachusetts actions.
The FDA approved the first infliximab biosimilar for sale in the United States in 2016, and a number of such products have been launched.
Litigation Against Filers of Abbreviated New Drug Applications (ANDAs)
The following summarizes lawsuits pending against generic companies that have filed Abbreviated New Drug Applications (ANDAs) with the FDA or undertaken similar regulatory processes outside of the United States, seeking to market generic forms of products sold by various subsidiaries of Johnson & Johnson prior to expiration of the applicable patents covering those products. These ANDAs typically include allegations of non-infringement, invalidity and unenforceability of the applicable patents. In the event the subsidiaries are not successful in these actions, or the statutory 30-month stays of the ANDAs expire before the United States District Court rulings are obtained, the third-party companies involved will have the ability, upon approval of the FDA, to introduce generic versions of the products at issue to the market, resulting in the potential for substantial market share and revenue losses for those products, and which may result in a non-cash impairment charge in any associated intangible asset. In addition, from time to time, subsidiaries may settle these actions and such settlements can involve the introduction of generic versions of the products at issue to the market prior to the expiration of the relevant patents. The Inter Partes Review (IPR) process with the United States Patent and Trademark Office (USPTO), created under the 2011 America Invents Act, is also being used by generic companies in conjunction with these ANDAs and lawsuits to challenge patents held by the Company’s subsidiaries.
ZYTIGA
®
In July 2015, Janssen Biotech, Inc., Janssen Oncology, Inc. and Janssen Research & Development, LLC (collectively, Janssen) and BTG International Ltd. (BTG) initiated a patent infringement lawsuit in the United States District Court for the District of New Jersey against a number of generic companies (and certain of their affiliates and/or suppliers) who filed ANDAs seeking approval to market a generic version of ZYTIGA
®
250mg before the expiration of United States Patent No. 8,822,438 (the ’438 patent). The generic companies currently include Amneal Pharmaceuticals, LLC and Amneal Pharmaceuticals of New York, LLC (collectively, Amneal); Apotex Inc. and Apotex Corp. (collectively, Apotex); Citron Pharma LLC (Citron); Dr. Reddy’s Laboratories, Ltd. and Dr. Reddy’s Laboratories, Inc. (collectively, Dr. Reddy’s); Mylan Pharmaceuticals Inc. and Mylan Inc. (collectively, Mylan); Par Pharmaceuticals, Inc. and Par Pharmaceutical Companies, Inc. (collectively, Par); Sun Pharmaceutical Industries Ltd. and Sun Pharmaceuticals Industries, Inc. (collectively, Sun); Teva Pharmaceuticals USA, Inc. (Teva); Wockhardt Bio A.G.; Wockhardt USA LLC and Wockhardt Ltd. (collectively, Wockhardt); West-Ward Pharmaceutical Corp. (West-Ward) and Hikma Pharmaceuticals, LLC (Hikma).
Janssen and BTG also initiated patent infringement lawsuits in the United States District Court for the District of New Jersey against Amerigen Pharmaceuticals Limited (Amerigen) in May 2016, and Glenmark Pharmaceuticals, Inc. (Glenmark) in June 2016, each of whom filed an ANDA seeking approval to market its generic version of ZYTIGA
®
before the expiration of the ’438 patent. These lawsuits have been consolidated with the lawsuit filed in July 2015.
In August 2015, Janssen and BTG filed an additional jurisdictional protective lawsuit against the Mylan defendants in the United States District Court for the Northern District of West Virginia, which has been stayed.
In August 2017, Janssen and BTG initiated a patent infringement lawsuit in the United States District Court for the District of New Jersey against Teva, who filed an ANDA seeking approval to market a generic version of ZYTIGA
®
500mg before the expiration of the ’438 patent. This lawsuit has been consolidated with the lawsuit filed in July 2015.
In February 2018, Janssen and BTG filed a patent infringement lawsuit against MSN Pharmaceuticals, Inc. and MSN Laboratories Private Limited (collectively, MSN) based on its ANDA seeking approval for a generic version of ZYTIGA
®
prior to the expiration of the ‘438 patent.
34
In February 2018, the court heard oral arguments on a motion for summary judgment of non-infringement filed by certain defendants and, in May 2018, administratively terminated the motion without prejudice to reassertion following trial.
In October 2018, the Court issued a ruling invalidating all asserted claims of the ‘438 patent. The Court held that the patent claims would be infringed if the patent were valid. Janssen plans to appeal the Court’s decision. The Court extended an injunction prohibiting generics from launching until the earlier of November 9, 2018, or until the Federal Circuit renders a decision on a stay pending appeal. If the Federal Circuit Court of Appeals declines to extend the injunction, the Company expects that a generic version of ZYTIGA
®
will enter the market and will result in a significant decline in sales of ZYTIGA
®
.
In December 2017, Janssen and BTG entered into a settlement agreement with Glenmark. In January 2018, Janssen dismissed its lawsuit against Sun after it withdrew its ANDA. In April 2018, Janssen and BTG entered into a settlement agreement with Apotex.
In each of the above lawsuits, Janssen is seeking an order enjoining the defendants from marketing their generic versions of ZYTIGA
®
before the expiration of the ’438 patent.
Several generic companies including Amerigen, Argentum Pharmaceuticals LLC (Argentum), Mylan, Wockhardt, Actavis, Amneal, Dr. Reddy’s, Sun, Teva, West-Ward and Hikma filed Petitions for Inter Partes Review (IPR) with the USPTO, seeking to invalidate the ’438 patent. In January 2018, the USPTO issued decisions finding the '438 patent claims unpatentable, and Janssen has requested rehearing. The IPR decisions are not binding on the district court in the pending litigation.
In October 2017, Janssen Inc. and Janssen Oncology, Inc. (collectively, Janssen) initiated two Notices of Application under Section 6 of the Patented Medicines (Notice of Compliance) Regulations against Teva Canada Limited (Teva) and the Minister of Health in Canada in response to Teva's filing Abbreviated New Drug Submissions (ANDS) and seeking approval to market generic versions of ZYTIGA
®
250mg and ZYTIGA
®
500mg
before the expiration of Canadian Patent No. 2,661,422. In June 2018, the parties entered into a settlement agreement.
In November 2017, Janssen initiated a Notice of Application under Section 6 of the Patented Medicines (Notice of Compliance) Regulations against Apotex Inc. (Apotex) and the Minister of Health in Canada in response to Apotex’s filing of an Abbreviated New Drug Submission (ANDS) seeking approval to market a generic version of ZYTIGA
®
before the expiration of Canadian Patent No. 2,661,422. The federal court of Canada scheduled the Final Hearing for April 2019. Janssen is seeking an order prohibiting the Minister of Health from issuing a Notice of Compliance with respect to Apotex's ANDS before the expiration of Janssen's patent.
XARELTO
®
B
eginning in October 2015, Janssen Pharmaceuticals, Inc. (JPI) and Bayer Pharma AG and Bayer Intellectual Property GmbH (collectively, Bayer) filed patent infringement lawsuits in the United States District Court for the District of Delaware against a number of generic companies who filed ANDAs seeking approval to market generic versions of XARELTO
®
before expiration of Bayer’s United States Patent Nos. 7,157,456, 7,585,860 and 7,592,339 relating to XARELTO
®
. JPI is the exclusive sublicensee of the asserted patents. The following generic companies are named defendants: Aurobindo Pharma Limited and Aurobindo Pharma USA, Inc. (collectively, Aurobindo); Breckenridge Pharmaceutical, Inc. (Breckenridge); InvaGen Pharmaceuticals Inc. (InvaGen); Micro Labs USA Inc. and Micro Labs Ltd (collectively, Micro); Mylan Pharmaceuticals Inc. (Mylan); Prinston Pharmaceuticals, Inc.; Sigmapharm Laboratories, LLC (Sigmapharm); Torrent Pharmaceuticals, Limited and Torrent Pharma Inc. (collectively, Torrent). Trial concluded in April 2018. In July 2018 the court entered judgment against Mylan and Sigmapharm, holding that the asserted compound patent is valid and infringed. In September 2018, the court entered judgment against the remaining defendants.
Beginning in April 2017, JPI and Bayer Intellectual Property GmbH and Bayer AG (collectively, Bayer AG) filed patent infringement lawsuits in the United States District Court for the District of Delaware against a number of generic companies who filed ANDAs seeking approval to market generic versions of XARELTO
®
before expiration of Bayer AG’s United States Patent No. 9,539,218 (’218) relating to XARELTO
®
. The following generic companies are named defendants: Alembic Pharmaceuticals Limited, Alembic Global Holding SA and Alembic Pharmaceuticals, Inc. (Alembic); Aurobindo; Breckenridge; InvaGen; Lupin Limited and Lupin Pharmaceuticals, Inc. (collectively, Lupin); Micro; Mylan; Sigmapharm; Taro Pharmaceutical Industries Ltd. and Taro Pharmaceuticals U.S.A., Inc. (collectively, Taro) and Torrent. Lupin counterclaimed for declaratory judgment of noninfringement and invalidity of United States Patent No. 9,415,053, but Lupin dismissed its counterclaims after it was provided a covenant not to sue on that patent. Aurobindo, Taro, Torrent, Micro, Breckenridge, Invagen, Sigmapharm, Lupin and Alembic have agreed to have their cases stayed and to be bound by the
35
outcome of any final judgment rendered against any of the other defendants. The ’218 cases have been consolidated for discovery and trial, and are currently set for trial in April 2019.
In each of these lawsuits, JPI is seeking an order enjoining the defendants from marketing their generic versions of XARELTO
®
before the expiration of the relevant patents.
In May 2018, Mylan filed a Petition for Inter Partes Review with the USPTO, seeking to invalidate the ’218 patent. The USPTO has not yet decided whether to initiate review.
PREZISTA
®
In November 2017, Janssen Inc. initiated Notices of Application under Section 6 of the Patented Medicines (Notice of Compliance) Regulations against Apotex Inc. (Apotex) and the Minister of Health in Canada in response to Apotex’s filing of an Abbreviated New Drug Submission (ANDS) seeking approval to market a generic version of PREZISTA
®
before the expiration of Canadian Patent Nos. 2,485,834 and 2,336,160, which are owned by the United States and the Board of Trustees of the University of Illinois. Janssen Inc. is seeking an order prohibiting the Minister of Health from issuing a Notice of Compliance with respect to Apotex's ANDS before the expiration of the relevant patents. The Final Hearing is scheduled to begin in June 2019. Janssen Inc. is also seeking an order enjoining Apotex from marketing its generic versions of PREZISTA
®
before the expiration of the patents-in-suit. In September 2018, the parties entered into a settlement agreement.
In May 2018, Janssen Products, L.P. and Janssen Sciences Ireland UC (collectively, Janssen) initiated a patent infringement lawsuit in the United States District Court for the District of New Jersey against Dr. Reddys Laboratories, Inc., Dr. Reddys Laboratories, Ltd., Laurus Labs, Ltd. and Pharmaq, Inc. (collectively, DRL) who filed an ANDA seeking approval to market generic versions of PREZISTA
®
before the expiration of United States Patent Nos. 8,518,987; 7,126,015; and 7,595,408 (the patents-in-suit). Janssen is seeking an order enjoining DRL from marketing its generic versions of PREZISTA
®
before the expiration of the patents-in-suit. Trial is scheduled to begin in May 2020.
INVOKANA
®
/INVOKAMET
®
Beginning in July 2017, Janssen Pharmaceuticals, Inc., Janssen Research & Development, LLC, Cilag GmbH International and Janssen Pharmaceutica NV (collectively, Janssen) and Mitsubishi Tanabe Pharma Corporation (MTPC) filed patent infringement lawsuits in the United States District Court for the District of New Jersey, the United States District Court for the District of Colorado and the United States District Court for the District of Delaware against a number of generic companies who filed ANDAs seeking approval to market generic versions of INVOKANA
®
and/or INVOKAMET
®
before expiration of MTPC’s United States Patent Nos. 7,943,582 and/or 8,513,202 relating to INVOKANA
®
and INVOKAMET
®
. Janssen is the exclusive licensee of the asserted patents. The following generic companies are named defendants: Apotex Inc. and Apotex Corp. (Apotex); Aurobindo Pharma USA Inc. (Aurobindo); Macleods Pharmaceuticals Ltd. and Macleods Pharma USA, Inc.; InvaGen Pharmaceuticals, Inc. (InvaGen); Prinston Pharmaceuticals Inc.; Dr. Reddy’s Laboratories, Inc. and Dr. Reddy’s Laboratories Ltd; Hetero USA, Inc., Hetero Labs Limited Unit-V and Hetero Labs Limited; MSN Laboratories Private Ltd. and MSN Pharmaceuticals, Inc.; Laurus Labs Ltd.; Indoco Remedies Ltd.; Zydus Pharmaceuticals (USA) Inc. (Zydus); Sandoz, Inc. (Sandoz); Teva Pharmaceuticals USA, Inc.; and Lupin Ltd. and Lupin Pharmaceuticals, Inc.
Beginning in July 2017, Janssen and MTPC filed patent infringement lawsuits in the United States District Court for the District of New Jersey and the United States District Court for the District of Colorado against Sandoz and InvaGen, who filed ANDAs seeking approval to market generic versions of INVOKANA
®
and/or INVOKAMET
®
before expiration of MTPC’s United States Patent No. 7,943,788 (the '788 patent) relating to INVOKANA
®
and INVOKAMET
®
and against Zydus, who filed ANDAs seeking approval to market generic versions of INVOKANA
®
and INVOKAMET
®
before expiration of the '788 patent, MTPC's United States Patent No. 8,222,219 relating to INVOKANA
®
and INVOKAMET
®
and MTPC’s United States Patent No. 8,785,403 relating to INVOKAMET
®
, and against Aurobindo, who filed an ANDA seeking approval to market a generic version of INVOKANA
®
before expiration of the ’788 patent and the ’219 patent relating to INVOKANA
®
. Janssen is the exclusive licensee of the asserted patents. In October 2017, the Colorado lawsuits against Sandoz were dismissed. In December 2017, the Delaware lawsuits against Apotex and Teva were dismissed.
In April 2018, Janssen and MTPC filed a patent infringement lawsuit in the United States District Court for the District of New Jersey against Prinston, who filed an ANDA seeking approval to market a generic version of INVOKANA
®
before expiration of the ’788 patent relating to INVOKANA
®
.
In each of these lawsuits, Janssen and MTPC are seeking an order enjoining the defendants from marketing their generic versions of INVOKANA
®
and/or INVOKAMET
®
before the expiration of the relevant patents.
36
VELETRI
®
In July 2017, Actelion Pharmaceuticals Ltd. (Actelion) initiated a patent infringement lawsuit in the United States District Court for the District of New Jersey against Sun Pharmaceutical Industries, Inc. and Sun Pharmaceutical Industries Limited (collectively, Sun Pharmaceutical), who filed an ANDA seeking approval to market a generic version of VELETRI
®
before the expiration of United States Patent No. 8,598,227. Actelion is seeking an order enjoining Sun Pharmaceutical from marketing its generic version of VELETRI
®
before the expiration of the patent. Trial is scheduled to commence in June 2019.
OPSUMIT
®
In January 2018, Actelion Pharmaceuticals Ltd (Actelion) initiated a patent infringement lawsuit in the United States District Court for the District of New Jersey against Zydus Pharmaceuticals (USA) Inc. (Zydus) and Amneal Pharmaceuticals LLC (Amneal), each of whom filed an ANDA seeking approval to market a generic version of OPSUMIT
®
before the expiration of United States Patent No. 7,094,781. In the lawsuit, Actelion is seeking an order enjoining Zydus and Amneal from marketing generic versions of OPSUMIT
®
before the expiration of the patent. Trial is scheduled to commence in October 2020.
INVEGA SUSTENNA
®
In January 2018, Janssen Pharmaceutica NV and Janssen Pharmaceuticals, Inc. (collectively, Janssen) initiated a patent infringement lawsuit in the United States District Court for the District of New Jersey against Teva Pharmaceuticals USA, Inc. (Teva), who filed an ANDA seeking approval to market a generic version of INVEGA SUSTENNA
®
before the expiration of United States Patent No. 9,439,906. In the lawsuit, Janssen is seeking an order enjoining Teva from marketing a generic version of INVEGA SUSTENNA
®
before the expiration of the patent.
In February 2018, Janssen Inc. and Janssen Pharmaceutica NV (collectively, Janssen) initiated a Notices of Application under Section 6 of the Patented Medicines (Notice of Compliance) Regulations against Teva Canada Limited (Teva) and the Minister of Health in response to Teva's filing of an Abbreviated New Drug Submission (ANDS) seeking approval to market a generic version of INVEGA SUSTENNA
®
before the expiration of Canadian Patent Nos. 2,309,629 and 2,655,335. Janssen is seeking an order prohibiting the Minister of Health from issuing a Notice of Compliance with respect to Teva's ANDS before the expiration of these patents. The Final Hearing is scheduled to begin in September 2019.
IMBRUVICA
®
Beginning in January 2018, Pharmacyclics LLC (Pharmacyclics) and Janssen Biotech, Inc. (JBI) filed patent infringement lawsuits in the United States District Court for the District of Delaware against a number of generic companies who filed ANDAs seeking approval to market generic versions of IMBRUVICA
®
before expiration of Pharmacyclics’ United States Patent Nos. 8,008,309, 7,514,444, 8,697,711, 8,735,403, 8,957,079, 9,181,257, 8,754,091, 8,497,277, 8,925,015, 8,476,284, 8,754,090, 8,999,999, 9,125,889, 9,801,881, 9,801,883, 9,814,721, 9,795,604, 9,296,753, 9,540,382, 9,713,617 and/or 9,725,455 relating to IMBRUVICA
®
. JBI is the exclusive licensee of the asserted patents. The following generic companies are named defendants: Cipla Limited and Cipla USA Inc. (Cipla); Fresenius Kabi USA, LLC, Fresenius Kabi USA, Inc., and Fresenius Kabi Oncology Limited (Fresenius Kabi); Sandoz Inc. and Lek Pharmaceuticals d.d. (Sandoz); Shilpa Medicare Limited (Shilpa); Sun Pharma Global FZE and Sun Pharmaceutical Industries Limited (Sun); Teva Pharmaceuticals USA, Inc. (Teva); and Zydus Worldwide DMCC and Cadila Healthcare Limited (Zydus). Trial is scheduled to begin in September 2020.
In October 2018, Pharmacyclics and JBI filed a patent infringement lawsuit in the United States District Court for the District of Delaware against Sun asserting newly issued United States Patent No. 10,004,746.
In each of the lawsuits, Pharmacyclics and JBI are seeking an order enjoining the defendants from marketing generic versions of IMBRUVICA
®
before the expiration of the relevant patents.
GOVERNMENT PROCEEDINGS
Like other companies in the pharmaceutical and medical devices industries, Johnson & Johnson and certain of its subsidiaries are subject to extensive regulation by national, state and local government agencies in the United States and other countries in which they operate. As a result, interaction with government agencies is ongoing. The most significant litigation brought by,
37
and investigations conducted by, government agencies are listed below. It is possible that criminal charges and substantial fines and/or civil penalties or damages could result from government investigations or litigation.
Average Wholesale Price (AWP) Litigation
Johnson & Johnson and several of its pharmaceutical subsidiaries (the J&J AWP Defendants), along with numerous other pharmaceutical companies, were named as defendants in a series of lawsuits in state and federal courts involving allegations that the pricing and marketing of certain pharmaceutical products amounted to fraudulent and otherwise actionable conduct because, among other things, the companies allegedly reported an inflated Average Wholesale Price (AWP) for the drugs at issue. Payors alleged that they used those AWPs in calculating provider reimbursement levels. The plaintiffs in these cases included three classes of private persons or entities that paid for any portion of the purchase of the drugs at issue based on AWP, and state government entities that made Medicaid payments for the drugs at issue based on AWP. Many of these cases, both federal actions and state actions removed to federal court, were consolidated for pre-trial purposes in a multi-district litigation in the United States District Court for the District of Massachusetts, where all claims against the J&J AWP Defendants were ultimately dismissed. The J&J AWP Defendants also prevailed in a case brought by the Commonwealth of Pennsylvania. Other AWP cases have been resolved through court order or settlement. Two cases remain pending. In a case brought by Illinois, trial has been scheduled for March 2019. In New Jersey, a putative class action based upon AWP allegations is pending against Centocor, Inc. and Ortho Biotech Inc. (both now Janssen Biotech, Inc.), Johnson & Johnson and ALZA Corporation.
Opioids Litigation
Beginning in 2014 and continuing to the present, Johnson & Johnson and Janssen Pharmaceuticals, Inc. (JPI), along with other pharmaceutical companies, have been named in numerous lawsuits brought by certain state and local governments related to the marketing of opioids, including DURAGESIC
®
, NUCYNTA
®
and NUCYNTA
®
ER. To date, complaints against pharmaceutical companies, including Johnson & Johnson and JPI, have been filed in state court by the state Attorneys General in Arkansas, Florida, Kentucky, Louisiana, Mississippi, Missouri, New Mexico, Ohio, Oklahoma and South Dakota. Complaints against the manufacturers also have been filed in state or federal court by city, county and local government agencies in the following states: Alabama; Arkansas; California; Connecticut; Florida; Georgia; Illinois; Kentucky; Louisiana; Maine; Maryland; Massachusetts; Mississippi; Missouri; Nevada; New Hampshire; New Jersey; New Mexico; New York; North Carolina; Ohio; Oklahoma; Oregon; Pennsylvania; Rhode Island; South Carolina; South Dakota; Tennessee; Texas; Utah; Virginia; Washington; West Virginia and Wisconsin. The Government of Puerto Rico filed suit in Superior Court of San Juan. In addition, the Province of British Columbia filed suit in Canada. These actions allege a variety of claims related to opioids marketing practices, including false advertising, unfair competition, public nuisance, consumer fraud violations, deceptive acts and practices, false claims and unjust enrichment. The suits generally seek penalties and/or injunctive and monetary relief. These cases are in early stages of litigation. In October 2017, Johnson & Johnson and JPI were both served with a motion to consolidate 66 pending matters into a federal Multi District Litigation in the Southern District of Ohio. In December 2017, the MDL was approved in the Northern District of Ohio and there are over 500 cases that have been transferred to the MDL.
Johnson & Johnson, JPI and other pharmaceutical companies have also received subpoenas or requests for information related to opioids marketing practices from the following state Attorneys General: Alaska, Indiana, Montana, New Hampshire, New Jersey, South Carolina, Tennessee, Texas and Washington. An additional request was received from Puerto Rico. In September 2017, Johnson & Johnson and JPI were contacted by the Texas and Colorado Attorney General’s Offices on behalf of approximately 38 states regarding a multi-state Attorney General investigation. The multi-state coalition served Johnson & Johnson and JPI with subpoenas as part of the investigation. Johnson & Johnson and JPI have also received requests for information from the ranking minority member of the United States Senate Committee on Homeland Security and Governmental Affairs regarding the sales, marketing, and educational strategies related to the promotion of opioids use.
Other
In August 2012, DePuy Orthopaedics, Inc., DePuy, Inc. (now known as DePuy Synthes, Inc.), and Johnson & Johnson Services, Inc. (collectively DePuy) received an informal request from the United States Attorney's Office for the District of Massachusetts and the Civil Division of the United States Department of Justice (the United States) for the production of materials relating to the DePuy ASR™ XL Hip device. In July 2014, the United States notified the United States District Court for the District of Massachusetts that it had declined to intervene in a qui tam case filed pursuant to the False Claims Act against the companies. In February 2016, the District Court granted the companies’ motion to dismiss with prejudice, unsealed the qui tam complaint, and denied the qui tam relators’ request for leave to file a further amended complaint. The qui tam relators appealed the case to the United States Court of Appeals for the First Circuit. In July 2017, the First Circuit affirmed the District Court’s dismissal in part, reversed in part, and affirmed the decision to deny the relators’ request to file a third amended
38
complaint. The relators’ remaining claims are now pending before the District Court. DePuy filed a petition for certiorari with the United States Supreme Court, seeking review of the First Circuit’s decision. The Supreme Court denied the petition in April 2018.
Since October 2013, a group of State Attorneys General have issued Civil Investigative Demands relating to the development, sales and marketing of several of DePuy Orthopaedics, Inc.'s hip products. The states are seeking monetary and injunctive relief, and DePuy Orthopaedics, Inc. has entered into a tolling agreement with the states. In July 2014, the Oregon Department of Justice, which was investigating these matters independently of the other states, announced a settlement of its ASR™ XL Hip device investigation
with the State of Oregon.
In October 2012, Johnson & Johnson was contacted by the California Attorney General's office regarding a multi-state Attorney General investigation of the marketing of surgical mesh products for hernia and urogynecological purposes by Johnson & Johnson's subsidiary, Ethicon, Inc. (Ethicon). Johnson & Johnson and Ethicon have since entered into a series of tolling agreements with the 47 states and the District of Columbia participating in the multi-state investigation and have responded to Civil Investigative Demands served by certain of the participating states. The states are seeking monetary and injunctive relief. In May 2016, California and Washington filed civil complaints against Johnson & Johnson, Ethicon and Ethicon US, LLC alleging violations of their consumer protection statutes. Similar complaints were filed against the companies by Kentucky in August 2016 and by Mississippi in October 2017. Johnson & Johnson and Ethicon have entered into a new tolling agreement with the remaining 43 states and the District of Columbia.
In December 2012, Therakos, Inc. (Therakos), formerly a subsidiary of Johnson & Johnson and part of the Ortho-Clinical Diagnostics, Inc. (OCD) franchise, received a letter from the civil division of the United States Attorney's Office for the Eastern District of Pennsylvania informing Therakos that the United States Attorney's Office was investigating the sales and marketing of Uvadex
®
(methoxsalen) and the Uvar Xts
®
and Cellex
®
Systems during the period 2000 to the present. The United States Attorney's Office requested that OCD and Johnson & Johnson preserve documents that could relate to the investigation. Therakos was subsequently acquired by an affiliate of Gores Capital Partners III, L.P. in January 2013, and OCD was divested in June 2014. Following the divestiture of OCD, Johnson & Johnson retains OCD’s portion of any liability that may result from the investigation for activity that occurred prior to the sale of Therakos. In March 2014 and March 2016, the United States Attorney’s Office requested that Johnson & Johnson produce certain documents, and Johnson & Johnson is cooperating with those requests.
In June 2014, the Mississippi Attorney General filed a complaint in Chancery Court of The First Judicial District of Hinds County, Mississippi against Johnson & Johnson and Johnson & Johnson Consumer Companies, Inc. (now known as Johnson & Johnson Consumer Inc.) (JJCI). The complaint alleges that defendants failed to disclose alleged health risks associated with female consumers' use of talc contained in JOHNSON'S
®
Baby Powder and JOHNSON'S
®
Shower to Shower (a product no longer sold by JJCI) and seeks injunctive and monetary relief. Trial is currently scheduled to begin in the fall of 2019.
In March 2016, Janssen Pharmaceuticals, Inc. (JPI) received a Civil Investigative Demand from the United States Attorney’s Office for the Southern District of New York related to JPI’s contractual relationships with pharmacy benefit managers over the period from January 1, 2006 to the present with regard to certain of JPI's pharmaceutical products. The demand was issued in connection with an investigation under the False Claims Act.
In January 2017, Janssen Pharmaceuticals, Inc. (JPI) received a Civil Investigative Demand from the United States Department of Justice relating to allegations concerning the sales and marketing practices of OLYSIO
®
. In December 2017, Johnson & Johnson and JPI were served with a whistleblower lawsuit filed in the United States District Court for the Central District of California alleging the off-label promotion of OLYSIO
®
and additional products, including NUCYNTA
®
, XARELTO
®
, LEVAQUIN
®
and REMICADE
®
. At this time, the federal and state governments have declined to intervene and the lawsuit, which is related to the Civil Investigative Demand, is being prosecuted by a former company employee. The United States District Court for the Central District of California dismissed the claim in April 2018. In May 2018, the relator filed a notice of appeal to the United States Court of Appeals for the Ninth Circuit.
In February 2017, Johnson & Johnson received a subpoena from the United States Attorney's Office for the District of Massachusetts seeking the production of records pertaining to payments to any 501(c)(3) charitable organization that provides financial assistance to Medicare patients. Multiple pharmaceutical companies have publicly reported receipt of subpoenas and ongoing inquiries similar to this one and the one described below.
Actelion Pharmaceuticals US, Inc. (Actelion US), received a subpoena in May 2016, with follow-up requests for documents from the United States Attorney's Office for the District of Massachusetts. The subpoena seeks the production of records pertaining to Actelion US’ payments to 501(c)(3) charitable organizations that provide financial assistance to Medicare patients.
39
In March 2017, Janssen Biotech, Inc. received a Civil Investigative Demand from the United States Department of Justice regarding a False Claims Act investigation concerning management and advisory services provided to rheumatology and gastroenterology practices that purchased REMICADE
®
or SIMPONI ARIA
®
.
In April and September 2017, Johnson & Johnson received subpoenas from the United States Attorney for the District of Massachusetts seeking documents broadly relating to pharmaceutical copayment support programs for DARZALEX
®
, OLYSIO
®
, REMICADE
®
, SIMPONI
®
, STELARA
®
and ZYTIGA
®
. The subpoenas also seek documents relating to Average Manufacturer Price and Best Price reporting to the Center for Medicare and Medicaid Services related to those products, as well as rebate payments to state Medicaid agencies.
In June 2017, Johnson & Johnson received a subpoena from the United States Attorney's Office for the District of Massachusetts seeking information regarding practices pertaining to the sterilization of DePuy Synthes, Inc. spinal implants at three hospitals in Boston as well as interactions of employees of Company subsidiaries with physicians at these hospitals.
In July 2018, Advanced Sterilization Products (ASP) received a Civil Investigative Demand from the United States Department of Justice regarding a False Claims Act investigation concerning the pricing, quality, marketing and promotion of EvoTech ECR, Tyvek Peel Pouches, or Sterrad Cyclesure 24 biological indicators.
In July 2018 the Public Prosecution Service in Rio de Janeiro and representatives from the Brazilian antitrust authority CADE inspected the offices of more than 30 companies including Johnson & Johnson do Brasil Indústria e Comércio de Produtos para Saúde Ltda. The authorities appear to be investigating allegations of possible anti-competitive behavior and possible improper payments in the medical device industry. The United State Department of Justice and the United States Securities and Exchange Commission have made additional preliminary inquiries about the inspection in Brazil, and Johnson & Johnson do Brasil Indústria e Comércio de Produtos para Saúde Ltda.
is cooperating with those requests.
From time to time, the Company has received requests from a variety of United States Congressional Committees to produce information relevant to ongoing congressional inquiries. It is the policy of Johnson & Johnson to cooperate with these inquiries by producing the requested information.
GENERAL LITIGATION
In June 2009, following the public announcement that Ortho-Clinical Diagnostics, Inc. (OCD) had received a grand jury subpoena from the United States Department of Justice, Antitrust Division, in connection with an investigation that has since been closed, multiple class action complaints were filed against OCD by direct purchasers seeking damages for alleged price fixing. These cases were consolidated for pre-trial purposes in the United States District Court for the Eastern District of Pennsylvania as In re Blood Reagent Antitrust Litigation. OCD was divested in 2014 and Johnson & Johnson retained any liability that may result from these cases. Following the appeal and reversal of its initial grant of a motion for class certification, on remand, the District Court in October 2015 again granted a motion by the plaintiffs for class certification. In July 2017, the Court issued an opinion granting in part and denying in part OCD's motion for summary judgment. The Court granted summary judgment concerning allegations of price fixing in 2005 and 2008, and denied summary judgment concerning allegations of price fixing in 2001. In May 2018, OCD and the plaintiffs reached a settlement on all claims. The court granted preliminary approval of the settlement in July 2018.
In June 2011, DePuy Orthopaedics, Inc. (DePuy) filed suit against Orthopaedic Hospital (OH) in the United States District Court for the Northern District of Indiana seeking a declaratory judgment that DePuy did not owe OH royalties under a 1999 development agreement. In January 2012, OH filed a breach of contract case in California federal court, which was later consolidated with the Indiana case. In February 2014, OH brought suit for patent infringement relating to the same technology, and that action was also consolidated with the Indiana case. In October 2018, the parties entered into a settlement agreement.
In April 2016, a putative class action was filed against Johnson & Johnson, Johnson & Johnson Sales and Logistics Company, LLC and McNeil PPC, Inc. (now known as Johnson & Johnson Consumer, Inc.) in New Jersey Superior Court, Camden County on behalf of persons who reside in the state of New Jersey who purchased various McNeil over-the-counter products from December 2008 through the present. The complaint alleges violations of the New Jersey Consumer Fraud Act. Following the grant of a motion to dismiss and the filing of an amended complaint, in May 2017, the Court denied a motion to dismiss the amended complaint. Discovery is underway.
In May 2014, two purported class actions were filed in federal court, one in the United States District Court for the Central District of California and one in the United States District Court for the Southern District of Illinois, against Johnson &
40
Johnson and Johnson & Johnson Consumer Companies, Inc. (now known as Johnson & Johnson Consumer Inc.) (JJCI) alleging violations of state consumer fraud statutes based on nondisclosure of alleged health risks associated with talc contained in JOHNSON'S
®
Baby Powder and JOHNSON'S
®
Shower to Shower (a product no longer sold by JJCI). Both cases seek injunctive relief and monetary damages; neither includes a claim for personal injuries. In October 2016, both cases were transferred to the United States District Court for the District Court of New Jersey as part of a newly created federal multi-district litigation. In July 2017, the Court granted Johnson & Johnson's and JJCI’s motion to dismiss one of the cases. In September 2018, the United States Court of Appeals for the Third Circuit affirmed this dismissal. In September 2017, the plaintiff in the second case voluntarily dismissed their complaint. In March 2018, the plaintiff in the second case refiled in Illinois State Court.
In August 2014, United States Customs and Border Protection (US CBP) issued a Penalty Notice against Janssen Ortho LLC (Janssen Ortho), assessing penalties for the alleged improper classification of darunavir ethanolate (the active pharmaceutical ingredient in PREZISTA
®
) in connection with its importation into the United States. In October 2014, Janssen Ortho submitted a Petition for Relief in response to the Penalty Notice. In May 2015, US CBP issued an Amended Penalty Notice assessing substantial penalties and Janssen Ortho filed a Petition for Relief in July 2015.
In March and April 2015, over 30 putative class action complaints were filed by contact lens patients in a number of courts around the United States against Johnson & Johnson Vision Care, Inc. (JJVCI) and other contact lens manufacturers, distributors, and retailers, alleging vertical and horizontal conspiracies to fix the retail prices of contact lenses. The complaints allege that the manufacturers reached agreements with each other and certain distributors and retailers concerning the prices at which some contact lenses could be sold to consumers. The plaintiffs are seeking damages and injunctive relief. All of the class action cases were transferred to the United States District Court for the Middle District of Florida in June 2015. The plaintiffs filed a consolidated class action complaint in November 2015. In June 2016, the Court denied motions to dismiss filed by JJVCI and other defendants. Discovery is ongoing. In March 2017, the plaintiffs filed a motion for class certification. The court held a hearing on the motion for class certification in August 2018.
In August 2015, two third-party payors filed a purported class action in the United States District Court for the Eastern District of Louisiana against Janssen Research & Development, LLC, Janssen Ortho LLC, Janssen Pharmaceuticals, Inc., Ortho-McNeil-Janssen Pharmaceuticals, Inc. and Johnson & Johnson (as well as certain Bayer entities), alleging that the defendants improperly marketed and promoted XARELTO
®
as safer and more effective than less expensive alternative medications while failing to fully disclose its risks. The complaint seeks damages.
In May 2017, Lonza Sales AG (Lonza) filed a Request for Arbitration with the London Court of International Arbitration against Janssen Research & Development, LLC (Janssen R&D). Lonza alleges that Janssen R&D breached a 2005 agreement between the parties by sublicensing certain Lonza technology used in the manufacture of daratumumab without Lonza’s consent. Lonza seeks monetary damages. The arbitration hearing was held in September 2018. Post hearing briefing is complete, and the parties are awaiting a decision.
In May 2017, a purported class action was filed in the United States District Court for the Western District of Washington against LifeScan Inc., Johnson & Johnson, other diabetes test strip manufacturers and certain Pharmacy Benefit Managers (PBMs). The complaint alleges that consumers paid inflated prices for glucose monitor test strips as a consequence of undisclosed rebates and other incentives paid by manufacturers to PBMs. The complaint includes RICO, ERISA, and state consumer protection claims. The complaint seeks equitable relief and damages. In November 2017, the case was ordered transferred to United States District Court for the District of New Jersey. The LifeScan business was divested in October 2018 and Johnson & Johnson retained liability that may result from these claims prior to the closing of the divestiture.
In September 2017, Strategic Products Group, Inc. (SPG) filed an antitrust complaint against LifeScan, Inc. and LifeScan Scotland, Ltd. (collectively, LifeScan) in the United States District Court for the Northern District of Florida (Pensacola Division). SPG, the exclusive distributor of Unistrip blood glucose meter test strips, alleges that LifeScan has monopolized or is attempting to monopolize the market for blood glucose meter test strips compatible with certain LifeScan meters. The complaint seeks damages. The LifeScan business was divested in October 2018 and the buyer assumed any liability that may result from these claims.
In September 2017, Pfizer, Inc. (Pfizer) filed an antitrust complaint against Johnson & Johnson and Janssen Biotech, Inc. (collectively Janssen) in United States District Court for the Eastern District of Pennsylvania. Pfizer alleges that Janssen has violated federal antitrust laws through its contracting strategies for REMICADE
®
. The complaint seeks damages and injunctive relief.
41
Beginning in September 2017, multiple purported class actions were filed against Johnson & Johnson and Janssen Biotech, Inc. (collectively Janssen) alleging that Janssen’s REMICADE
®
contracting strategies violated federal and state antitrust and consumer laws and seeking damages and injunctive relief. In November 2017, the cases were consolidated for pre-trial purposes in United States District Court for the Eastern District of Pennsylvania as In re Remicade Antitrust Litigation.
In June 2018, Walgreen Co. and Kroger Co, filed an antitrust complaint against Johnson & Johnson and Janssen Biotech, Inc. (collectively, Janssen) in the United States District Court for the Eastern District of Pennsylvania. The complaint alleges that Janssen has violated federal antitrust laws through its contracting strategies for Remicade. The complaint seeks damages and injunctive relief.
In October 2017, certain United States service members and their families brought a complaint against a number of pharmaceutical and medical devices companies, including Johnson & Johnson and certain of its subsidiaries, alleging that the defendants violated the United States Anti-Terrorism Act. The complaint alleges that the defendants provided funding for terrorist organizations through their sales practices pursuant to pharmaceutical and medical device contracts with the Iraqi Ministry of Health.
Andover Healthcare, Inc. (Andover) filed a Lanham act case against Johnson & Johnson Consumer Inc. in April 2017 in the United States District Court for the District of Massachusetts. Andover asserts that the claim “not made with natural rubber latex” on COACH
®
Sports Wrap, BAND-AID
®
Brand SECURE-FLEX
®
Wrap and BAND-AID
®
Brand HURT-FREE
®
Wrap is false. Andover seeks actual damages and pre-judgment interest thereon, disgorgement of profits, treble damages, attorney’s fees and injunctive relief.
In February 2018, a securities class action lawsuit was filed against Johnson & Johnson and certain named officers in the United States District Court for the District of New Jersey, alleging that Johnson & Johnson violated the federal securities laws by failing to adequately disclose the alleged asbestos contamination in body powders containing talc, primarily JOHNSON'S
®
Baby Powder. In October 2018, a shareholder derivative lawsuit was filed against Johnson & Johnson as the nominal defendant and its current directors as defendants in the United States District Court for the District of New Jersey, alleging a breach of fiduciary duties related to the alleged asbestos contamination in body powders containing talc, primarily JOHNSON’S
®
Baby Powder, and that Johnson & Johnson has suffered damages as a result of those alleged breaches. Plaintiffs are seeking damages and an order for the Company to reform its internal policies and procedures.
Johnson & Johnson or its subsidiaries are also parties to a number of proceedings brought under the Comprehensive Environmental Response, Compensation, and Liability Act, commonly known as Superfund, and comparable state, local or foreign laws in which the primary relief sought is the cost of past and/or future remediation.
In the first quarter of 2016, the Company announced restructuring actions in its Medical Devices segment to better serve the needs of patients and customers in today’s evolving healthcare marketplace. The Company is undertaking actions to strengthen its go-to-market model, accelerate the pace of innovation, further prioritize key platforms and geographies, and streamline operations while maintaining high quality standards.
The Company estimates that, in connection with its plans, it will record pre-tax restructuring related charges of approximately
$2.4 billion
. In the fiscal third quarter of 2018, the Company recorded a pre-tax charge of
$101 million
, of which
$9 million
was included in cost of products sold and
$45 million
was included in other (income) expense. See the following table for additional details on the restructuring programs. Total project costs of approximately
$2.4 billion
have been recorded since the restructuring was announced.
Additionally, as part of the plan, the Company expects that the restructuring actions will result in position eliminations of approximately
5
percent of the Medical Devices segment’s global workforce. Approximately
2,650
positions have been eliminated of which
1,950
received separation payments since the restructuring announcement.
On April 17, 2018, the Company announced plans to implement a series of actions across its Global Supply Chain that are intended to focus resources and increase investments in the critical capabilities, technologies and solutions necessary to manufacture and supply its product portfolio, enhance agility and drive growth. The Global Supply Chain actions will include expanding the use of strategic collaborations and bolstering initiatives to reduce complexity, improve cost-competitiveness, enhance capabilities and optimize the Supply Chain network. For additional details on the global supply chain restructuring strategic collaborations see Note 10 to the Consolidated Financial Statements. In the fiscal third quarter of 2018, the Company
42
recorded a pre-tax charge of
$89 million
, of which
$14 million
was included in cost of products sold and
$34 million
was included in other (income) expense. Total project costs of
$0.1 billion
have been recorded since the restructuring was announced. See the following table for additional details on the restructuring programs.
In total, the Company expects these actions to generate approximately
$0.6 billion
to
$0.8 billion
in annual pre-tax cost savings that will be substantially delivered by 2022. The Company expects to record pre-tax restructuring charges of approximately
$1.9 billion
to
$2.3 billion
, over the
4
to
5
year period of this activity. The Company estimates that approximately
70%
of the cumulative pre-tax costs will result in cash outlays. These costs are associated with network optimizations, exit costs and accelerated depreciation and amortization.
The following table summarizes the severance related reserves and the associated spending under these restructuring programs through the
fiscal nine months
of 2018:
|
(Dollars in Millions)
|
Severance
|
Asset Write-offs
|
Other**
|
Total
|
|||||
|
Reserve balance, December 31, 2017
|
$
|
229
|
|
—
|
|
38
|
|
267
|
|
|
Current year activity:
|
|
|
|
|
|||||
|
Charges
|
—
|
|
100
|
|
373
|
|
473
|
|
|
|
Cash payments
|
(29
|
)
|
—
|
|
(388
|
)
|
(417
|
)
|
|
|
Settled non cash
|
—
|
|
(100
|
)
|
—
|
|
(100
|
)
|
|
|
Reserve balance, September 30, 2018*
|
$
|
200
|
|
—
|
|
23
|
|
223
|
|
*Cash outlays for severance are expected to be substantially paid out over the next 2 years in accordance with the Company's plans and local laws.
**Other includes project expense such as salaries for employees supporting the initiative and consulting expenses.
The Company expects that the Medical Devices restructuring program will be completed by the end of fiscal year 2018 with certain projects and severance charges continuing beyond that date. The Company continuously reevaluates its severance reserves related to restructuring and the timing of payments has extended due to the planned release of associates regarding several longer-term projects. The Company believes that the existing severance reserves are sufficient to cover the Global Supply Chain plans given the period over which the actions will take place. The Company will continue to assess and make adjustments as necessary if additional amounts become probable and estimable.
43
RESULTS OF OPERATIONS
Sales to Customers
Analysis of Consolidated Sales
For the fiscal nine months of 2018, worldwide sales were $61.2 billion, a total increase of 8.8%, including operational growth of 7.5% as compared to 2017 fiscal nine months sales of $56.3 billion. Currency fluctuations had a positive impact of 1.3% for the fiscal nine months of 2018. In the fiscal nine months of 2018, the net impact of acquisitions and divestitures on worldwide operational sales growth was a positive 1.9%.
Sales by U.S. companies were $31.3 billion in the fiscal nine months of 2018, which represented an increase of 6.3% as compared to the prior year. In the fiscal nine months of 2018, the net impact of acquisitions and divestitures on the U.S. operational sales growth was a positive 2.6%. Sales by international companies were $29.9 billion, an increase of 11.4%, including operational growth of 8.6%, and a positive currency impact of 2.8% as compared to the fiscal nine months sales of 2017. In the fiscal nine months of 2018, the net impact of acquisitions and divestitures on the international operational sales growth was a positive 1.0%.
In the fiscal nine months of 2018, sales by companies in Europe achieved growth of 13.1%, which included operational growth of 7.1% and a positive currency impact of 6.0%. Sales by companies in the Western Hemisphere, excluding the U.S., achieved growth of 3.0%, which included operational growth of 8.4%, partially offset by a negative currency impact of 5.4%. Sales by companies in the Asia-Pacific, Africa region achieved growth of 13.2%, including operational growth of 10.8% and a positive currency impact of 2.4%.
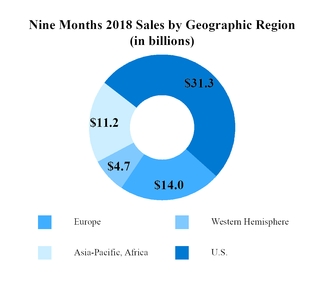

Note: values may have been rounded
44
For the fiscal
third
quarter of
2018
, worldwide sales were $20.3 billion, a total increase of 3.6%, including operational growth of 5.5% as compared to
2017
fiscal
third
quarter sales of $19.7 billion. Currency fluctuations had a negative impact of 1.9% for the fiscal
third
quarter of
2018
. In the fiscal
third
quarter of 2018, the net impact of acquisitions and divestitures on worldwide operational sales growth was a negative 0.6%.
Sales by U.S. companies were $10.7 billion in the fiscal
third
quarter of
2018
, which represented an increase of 3.6% as compared to the prior year. In the fiscal
third
quarter of 2018, the net impact of acquisitions and divestitures on the U.S. operational sales growth was a negative 0.3%. Sales by international companies were $9.7 billion, an increase of 3.5%, including operational growth of 7.5%, partially offset by a negative currency impact of 4.0% as compared to the fiscal
third
quarter sales of
2017
. In the fiscal
third
quarter of 2018, the net impact of acquisitions and divestitures on the international operational sales growth was a negative 1.0%.
In the fiscal
third
quarter of 2018, sales by companies in Europe achieved growth of 2.5%, which included operational growth of 5.1% and a negative currency impact of 2.6%. Sales by companies in the Western Hemisphere, excluding the U.S., experienced a sales decline of 1.2%, which included operational growth of 11.2%, offset by a negative currency impact of 12.4%. Sales by companies in the Asia-Pacific, Africa region achieved growth of 6.7%, including operational growth of 8.6% and a negative currency impact of 1.9%.
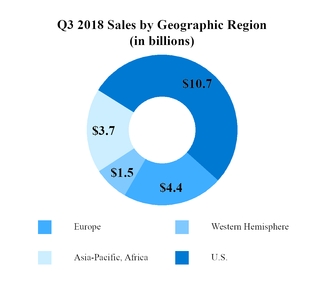
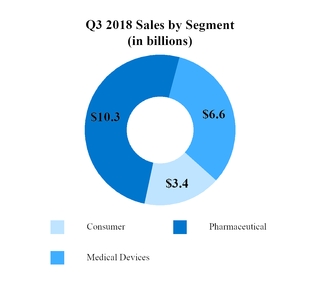
Note: values may have been rounded
45
Analysis of Sales by Business Segments
Consumer
Consumer segment sales in the fiscal nine months of 2018 were $10.3 billion, an increase of 2.5% as compared to the same period a year ago, including operational growth of 1.9% and a positive currency impact of 0.6%. U.S. Consumer segment sales increased by 2.3%. International Consumer segment sales increased by 2.7%, including an operational increase of 1.6% and a positive currency impact of 1.1%. In the fiscal nine months of 2018, the impact of acquisitions and divestitures on the Consumer segment operational sales growth was a negative 1.1%.
Major Consumer Franchise Sales — Fiscal Nine Months Ended
|
(Dollars in Millions)
|
September 30, 2018
|
October 1, 2017
|
Total
Change |
Operations
Change |
Currency
Change |
||||||||||||
|
Beauty
|
$
|
3,271
|
|
$
|
3,090
|
|
5.9
|
%
|
5.1
|
%
|
0.8
|
%
|
|||||
|
OTC
|
3,186
|
|
3,021
|
|
5.5
|
|
3.8
|
|
1.7
|
|
|||||||
|
Baby Care
|
1,385
|
|
1,426
|
|
(2.9
|
)
|
(1.8
|
)
|
(1.1
|
)
|
|||||||
|
Oral Care
|
1,156
|
|
1,138
|
|
1.6
|
|
0.7
|
|
0.9
|
|
|||||||
|
Women’s Health
|
792
|
|
788
|
|
0.5
|
|
2.1
|
|
(1.6
|
)
|
|||||||
|
Wound Care/Other
|
527
|
|
599
|
|
(12.0
|
)
|
(12.5
|
)
|
0.5
|
|
|||||||
|
Total Consumer Sales
|
$
|
10,317
|
|
$
|
10,062
|
|
2.5
|
%
|
1.9
|
%
|
0.6
|
%
|
|||||
Consumer segment sales in the fiscal
third
quarter of
2018
were $3.4 billion, an increase of 1.8% as compared to the same period a year ago, including an operational growth of 4.9% and a negative currency impact of 3.1%. U.S. Consumer segment sales increased by 6.6%. International Consumer segment sales decreased by 1.3%, including an operational growth of 3.7% and a negative currency impact of 5.0%. In the fiscal
third
quarter of 2018, the net impact of acquisitions and divestitures on the Consumer segment operational sales growth was a negative 1.2%.
Major Consumer Franchise Sales —
Fiscal Third Quarters Ended
|
(Dollars in Millions)
|
September 30, 2018
|
October 1, 2017
|
Total
Change |
Operations
Change |
Currency
Change |
||||||||||||
|
Beauty
|
$
|
1,078
|
|
$
|
1,033
|
|
4.4
|
%
|
6.5
|
%
|
(2.1
|
)%
|
|||||
|
OTC
|
1,048
|
|
1,002
|
|
4.6
|
|
6.8
|
|
(2.2
|
)
|
|||||||
|
Baby Care
|
472
|
|
477
|
|
(1.0
|
)
|
4.3
|
|
(5.3
|
)
|
|||||||
|
Oral Care
|
384
|
|
382
|
|
0.5
|
|
3.2
|
|
(2.7
|
)
|
|||||||
|
Women’s Health
|
269
|
|
270
|
|
(0.4
|
)
|
7.9
|
|
(8.3
|
)
|
|||||||
|
Wound Care/Other
|
164
|
|
192
|
|
(14.6
|
)
|
(13.3
|
)
|
(1.3
|
)
|
|||||||
|
Total Consumer Sales
|
$
|
3,415
|
|
$
|
3,356
|
|
1.8
|
%
|
4.9
|
%
|
(3.1
|
)%
|
|||||
The Beauty franchise achieved operational growth of 6.5% as compared to the prior year fiscal
third
quarter. Growth was primarily driven by NEUTROGENA
®
, Vogue and NEOSTRATA
®
products as well as strength of DR. CI: LABO and DABAO
®
products
outside the U.S.
The OTC franchise achieved operational growth of 6.8% as compared to the prior year fiscal
third
quarter. Growth was primarily driven by share and consumption growth across multiple brands including ZYRTEC
®
, TYLENOL
®
and Children's MOTRIN
®
, as well as digestive health products and anti-smoking aids. Additionally, sales from the recent acquisition of ZARBEES
®
contributed to growth.
The Baby Care franchise achieved operational growth of 4.3% as compared to the prior year fiscal
third
quarter due to the U.S. relaunch pipeline replenishment.
The Oral Care franchise achieved operational growth of 3.2% as compared to the prior year fiscal
third
quarter primarily due to new product launches.
46
The Women’s Health franchise achieved operational growth of 7.9% as compared to the prior year fiscal
third
quarter primarily driven by sales in Latin America.
The Wound Care/Other franchise experienced an operational decline of 13.3% as compared to the prior year fiscal
third
quarter due to the divestiture of COMPEED
®
in the fiscal third quarter of 2017.
Pharmaceutical
Pharmaceutical segment sales in the fiscal nine months of
2018
were $30.5 billion, an increase of 14.9% as compared to the same period a year ago, with an operational increase of 13.4% and a positive currency impact of 1.5%. U.S. Pharmaceutical sales increased 10.5% as compared to the same period a year ago. International Pharmaceutical sales increased by 21.3%, including operational growth of 17.5% and a positive currency impact of 3.8%. In the fiscal nine months of 2018, the net impact of acquisitions and divestitures on the Pharmaceutical segment operational sales growth was a positive 4.5%.
Major Pharmaceutical Therapeutic Area Sales* — Fiscal Nine Months Ended
|
(Dollars in Millions)
|
September 30, 2018
|
October 1, 2017
|
Total
Change
|
Operations
Change
|
Currency
Change
|
||||||||||||
|
Total Immunology
|
$
|
9,778
|
|
$
|
9,158
|
|
6.8
|
%
|
5.9
|
%
|
0.9
|
%
|
|||||
|
REMICADE
®
|
4,088
|
|
4,849
|
|
(15.7
|
)
|
(15.9
|
)
|
0.2
|
|
|||||||
|
SIMPONI
®
/ SIMPONI ARIA
®
|
1,602
|
|
1,343
|
|
19.3
|
|
17.9
|
|
1.4
|
|
|||||||
|
STELARA
®
|
3,712
|
|
2,930
|
|
26.7
|
|
24.9
|
|
1.8
|
|
|||||||
|
Other Immunology
|
376
|
|
36
|
|
**
|
**
|
**
|
||||||||||
|
Total Infectious Diseases
|
2,502
|
|
2,354
|
|
6.3
|
|
4.0
|
|
2.3
|
|
|||||||
|
EDURANT
®
/rilpivirine
|
623
|
|
522
|
|
19.3
|
|
12.6
|
|
6.7
|
|
|||||||
|
PREZISTA
®
/ PREZCOBIX
®
/ REZOLSTA
®/
SYMTUZA
®
|
1,460
|
|
1,351
|
|
8.1
|
|
7.0
|
|
1.1
|
|
|||||||
|
Other Infectious Diseases
|
419
|
|
481
|
|
(12.9
|
)
|
(13.7
|
)
|
0.8
|
|
|||||||
|
Total Neuroscience
|
4,577
|
|
4,462
|
|
2.6
|
|
0.9
|
|
1.7
|
|
|||||||
|
CONCERTA
®
/methylphenidate
|
513
|
|
588
|
|
(12.8
|
)
|
(13.6
|
)
|
0.8
|
|
|||||||
|
INVEGA SUSTENNA
®
/ XEPLION
®
/ TRINZA
®/
TREVICTA
®
|
2,165
|
|
1,876
|
|
15.4
|
|
13.5
|
|
1.9
|
|
|||||||
|
RISPERDAL CONSTA
®
|
559
|
|
608
|
|
(8.1
|
)
|
(9.8
|
)
|
1.7
|
|
|||||||
|
Other Neuroscience
|
1,340
|
|
1,390
|
|
(3.6
|
)
|
(5.4
|
)
|
1.8
|
|
|||||||
|
Total Oncology
|
7,355
|
|
5,219
|
|
40.9
|
|
38.1
|
|
2.8
|
|
|||||||
|
DARZALEX
®
|
1,441
|
|
871
|
|
65.4
|
|
63.6
|
1.8
|
|
||||||||
|
IMBRUVICA
®
|
1,912
|
|
1,371
|
|
39.5
|
|
36.9
|
|
2.6
|
|
|||||||
|
VELCADE
®
|
864
|
|
843
|
|
2.5
|
|
(1.7
|
)
|
4.2
|
|
|||||||
|
ZYTIGA
®
|
2,712
|
|
1,750
|
|
55.0
|
|
52.0
|
|
3.0
|
|
|||||||
|
Other Oncology
|
426
|
|
384
|
|
10.9
|
|
8.9
|
|
2.0
|
|
|||||||
|
Pulmonary Hypertension***
|
1,906
|
|
717
|
|
**
|
**
|
**
|
||||||||||
|
OPSUMIT
®
|
892
|
|
304
|
|
**
|
**
|
**
|
||||||||||
|
TRACLEER
®
|
422
|
|
236
|
|
**
|
**
|
**
|
||||||||||
|
UPTRAVI
®
|
482
|
|
133
|
|
**
|
**
|
**
|
||||||||||
|
Other
|
110
|
|
44
|
|
**
|
**
|
**
|
||||||||||
|
Cardiovascular / Metabolism / Other
|
4,426
|
|
4,665
|
|
(5.1
|
)
|
(5.8
|
)
|
0.7
|
|
|||||||
|
XARELTO
®
|
1,869
|
|
1,790
|
|
4.4
|
|
4.4
|
|
—
|
|
|||||||
|
INVOKANA
®
/ INVOKAMET
®
|
653
|
|
844
|
|
(22.6
|
)
|
(23.0
|
)
|
0.4
|
|
|||||||
|
PROCRIT
®
/EPREX
®
|
767
|
|
740
|
|
3.6
|
|
2.4
|
|
1.2
|
|
|||||||
|
Other
|
1,137
|
|
1,291
|
|
(11.9
|
)
|
(13.5
|
)
|
1.6
|
|
|||||||
|
Total Pharmaceutical Sales
|
$
|
30,544
|
|
$
|
26,575
|
|
14.9
|
%
|
13.4
|
%
|
1.5
|
%
|
|||||
*Prior year amounts have been reclassified to conform to current year presentation
**Percentage greater than 100% or not meaningful
***Products acquired from Actelion acquisition on June 16, 2017
47
Pharmaceutical segment sales in the fiscal
third
quarter of
2018
were $10.3 billion, an increase of 6.7% as compared to the same period a year ago, with an operational increase of 8.2% and a negative currency impact of 1.5%. U.S. Pharmaceutical sales increased 4.8% as compared to the same period a year ago. International Pharmaceutical sales increased by 9.5%, including operational growth of 13.2% and a negative currency impact of 3.7%. In the fiscal
third
quarter of 2018, the net impact of acquisitions and divestitures on the Pharmaceutical segment operational sales growth was negligible.
Major Pharmaceutical Therapeutic Area Sales* —
Fiscal Third Quarters Ended
|
(Dollars in Millions)
|
September 30, 2018
|
October 1, 2017
|
Total
Change
|
Operations
Change
|
Currency
Change
|
||||||||||||
|
Total Immunology
|
$
|
3,398
|
|
$
|
3,269
|
|
3.9
|
%
|
5.0
|
%
|
(1.1
|
)%
|
|||||
|
REMICADE
®
|
1,379
|
|
1,647
|
|
(16.3
|
)
|
(15.3
|
)
|
(1.0
|
)
|
|||||||
|
SIMPONI
®
/ SIMPONI ARIA
®
|
536
|
|
476
|
|
12.6
|
|
14.8
|
|
(2.2
|
)
|
|||||||
|
STELARA
®
|
1,310
|
|
1,124
|
|
16.5
|
|
17.4
|
|
(0.9
|
)
|
|||||||
|
Other Immunology
|
173
|
|
22
|
|
**
|
**
|
**
|
||||||||||
|
Total Infectious Diseases
|
823
|
|
813
|
|
1.2
|
|
3.2
|
|
(2.0
|
)
|
|||||||
|
EDURANT
®
/rilpivirine
|
202
|
|
194
|
|
4.1
|
|
5.2
|
|
(1.1
|
)
|
|||||||
|
PREZISTA
®
/ PREZCOBIX
®
/ REZOLSTA
®/
SYMTUZA
®
|
490
|
|
467
|
|
4.9
|
|
6.9
|
|
(2.0
|
)
|
|||||||
|
Other Infectious Diseases
|
131
|
|
152
|
|
(13.8
|
)
|
(10.7
|
)
|
(3.1
|
)
|
|||||||
|
Total Neuroscience
|
1,490
|
|
1,498
|
|
(0.5
|
)
|
1.5
|
|
(2.0
|
)
|
|||||||
|
CONCERTA
®
/ methylphenidate
|
157
|
|
198
|
|
(20.7
|
)
|
(18.1
|
)
|
(2.6
|
)
|
|||||||
|
INVEGA SUSTENNA
®
/ XEPLION
®
/ TRINZA
®/
TREVICTA
®
|
749
|
|
643
|
|
16.5
|
|
17.8
|
|
(1.3
|
)
|
|||||||
|
RISPERDAL CONSTA
®
|
175
|
|
194
|
|
(9.8
|
)
|
(7.9
|
)
|
(1.9
|
)
|
|||||||
|
Other Neuroscience
|
409
|
|
463
|
|
(11.7
|
)
|
(9.0
|
)
|
(2.7
|
)
|
|||||||
|
Total Oncology
|
2,588
|
|
1,898
|
|
36.4
|
|
38.6
|
|
(2.2
|
)
|
|||||||
|
DARZALEX
®
|
498
|
|
317
|
|
57.1
|
|
60.0
|
|
(2.9
|
)
|
|||||||
|
IMBRUVICA
®
|
705
|
|
512
|
|
37.7
|
|
40.4
|
|
(2.7
|
)
|
|||||||
|
VELCADE
®
|
271
|
|
273
|
|
(0.7
|
)
|
1.8
|
|
(2.5
|
)
|
|||||||
|
ZYTIGA
®
|
958
|
|
669
|
|
43.2
|
|
44.5
|
|
(1.3
|
)
|
|||||||
|
Other Oncology
|
156
|
|
127
|
|
22.8
|
|
25.6
|
|
(2.8
|
)
|
|||||||
|
Pulmonary Hypertension
|
656
|
|
632
|
|
3.8
|
|
4.9
|
|
(1.1
|
)
|
|||||||
|
OPSUMIT
®
|
310
|
|
259
|
|
19.7
|
|
21.2
|
|
(1.5
|
)
|
|||||||
|
TRACLEER
®
|
139
|
|
210
|
|
(33.8
|
)
|
(33.0
|
)
|
(0.8
|
)
|
|||||||
|
UPTRAVI
®
|
171
|
|
124
|
|
37.9
|
|
38.1
|
|
(0.2
|
)
|
|||||||
|
Other
|
36
|
|
39
|
|
(7.7
|
)
|
(5.2
|
)
|
(2.5
|
)
|
|||||||
|
Cardiovascular / Metabolism / Other
|
1,391
|
|
1,585
|
|
(12.2
|
)
|
(11.3
|
)
|
(0.9
|
)
|
|||||||
|
XARELTO
®
|
612
|
|
635
|
|
(3.6
|
)
|
(3.6
|
)
|
—
|
|
|||||||
|
INVOKANA
®
/ INVOKAMET
®
|
190
|
|
265
|
|
(28.3
|
)
|
(27.6
|
)
|
(0.7
|
)
|
|||||||
|
PROCRIT
®
/ EPREX
®
|
255
|
|
238
|
|
7.1
|
|
7.9
|
|
(0.8
|
)
|
|||||||
|
Other
|
334
|
|
447
|
|
(25.3
|
)
|
(22.9
|
)
|
(2.4
|
)
|
|||||||
|
Total Pharmaceutical Sales
|
$
|
10,346
|
|
$
|
9,695
|
|
6.7
|
%
|
8.2
|
%
|
(1.5
|
)%
|
|||||
*Prior year amounts have been reclassified to conform to current year presentation
**Percentage greater than 100% or not meaningful
Immunology products achieved operational growth of 5.0% as compared to the same period a year ago driven by strong uptake of STELARA
®
(ustekinumab) in Crohn's disease, expanded indications of SIMPONI
®
/SIMPONI ARIA
®
(golimumab), the launch of TREMFYA
®
(guselkumab) and U.S. immunology market growth. Immunology was negatively impacted by lower sales of REMICADE
®
(infliximab) due to increased discounts/rebates and biosimilar competition.
48
The patents for REMICADE
®
(infliximab)
in certain countries in Europe expired in February 2015. Biosimilar versions of REMICADE
®
have been introduced in certain markets outside the United States, resulting in a reduction in sales of REMICADE
®
in those markets. Additional biosimilar competition will likely result in a further reduction in REMICADE
®
sales in markets outside the United States. In the United States, a biosimilar version of REMICADE
®
was introduced in 2016, and additional competitors continue to enter the market. Continued infliximab biosimilar competition in the U.S. market will result in a further reduction in U.S. sales of REMICADE
®
. See Note 11 to the Consolidated Financial Statements for a description of legal matters regarding the REMICADE
®
patents.
Infectious disease products achieved operational growth of 3.2% as compared to the same period a year ago. Sales growth of PREZCOBIX
®
/REZOLSTA
®
, EDURANT
®
/rilpivirine, and the launch of SYMTUZA
®
was partially offset by lower sales of PREZISTA
®
.
Neuroscience products achieved operational sales growth of 1.5% as compared to the same period a year ago. Strong sales of INVEGA SUSTENNA
®
/XEPLION
®
/ TRINZA
®
/TREVICTA
®
(paliperidone palmitate) were partially offset by cannibalization of RISPERDAL CONSTA
®
(risperidone) and generic competition for CONCERTA
®
/methylphenidate.
Oncology products achieved strong operational sales growth of 38.6% as compared to the same period a year ago. Contributors to the growth were strong sales of DARZALEX
®
(daratumumab) and IMBRUVICA
®
(ibrutinib) due to increased patient uptake globally and sales of ZYTIGA
®
(abiraterone acetate) driven by LATITUDE data and market growth. Additionally, sales from the launch of ERLEADA™ (apalutamide) contributed to the growth. The growth of DARZALEX
®
(daratumumab) was partially offset by a one-time adjustment outside the U.S. related to accruals for retroactive reimbursement matters. A number of companies marketing generic pharmaceuticals have filed Abbreviated New Drug Applications (ANDAs) with the FDA, or undertaken similar regulatory processes outside of the United States, seeking to market generic forms of ZYTIGA
®
prior to expiration of its applicable patents. These ANDAs include allegations of non-infringement, invalidity and unenforceability of the applicable patents. In October 2018, the Court issued a ruling invalidating all asserted claims of the applicable patent. Janssen plans to appeal the Court’s decision. The Court extended an injunction prohibiting generics from launching until the earlier of November 9, 2018, or until the Federal Circuit renders a decision on a stay pending appeal. If the Federal Circuit Court of Appeals declines to extend the injunction, the Company expects that a generic version of ZYTIGA
®
will enter the market and will result in a significant decline in sales of ZYTIGA
®
. See Note 11 to the Consolidated Financial Statements for a description of the legal matters regarding the ZYTIGA
®
patents.
Pulmonary Hypertension achieved operational sales growth of 4.9% as compared to the same period a year ago primarily due to strong sales of OPSUMIT
®
(macitentan) and UPTRAVI
®
(selexipag) due to continued market growth and share gains partially offset by lower sales of TRACLEER
®
(bosetan) due to generics and market share loss to OPSUMIT
®
.
Cardiovascular / Metabolism / Other products experienced an operational decline of 11.3% as compared to the same period a year ago. Lower sales of XARELTO
®
(rivaroxaban) were driven by an increase in price discounts and rebates and lower sales of INVOKANA
®
/INVOKAMET
®
(canagliflozin) were due to increased discounts and rebates and competitive pressure.
49
Medical Devices
The Medical Devices segment sales in the fiscal nine months of
2018
were $20.3 billion, an increase of 3.6% as compared to the same period a year ago, with operational growth of 2.2% and a positive currency impact of 1.4%. U.S. Medical Devices sales increased 1.2%. International Medical Devices sales increased by 5.9%, including an operational increase of 3.2% and a positive currency impact of 2.7%. In the fiscal nine months of 2018, the net impact of acquisitions and divestitures on the Medical Devices segment operational sales growth was a negative 0.1%.
Major Medical Devices Franchise Sales* — Fiscal Nine Months Ended
|
(Dollars in Millions)
|
September 30, 2018
|
October 1, 2017
|
Total
Change
|
Operations
Change
|
Currency
Change
|
||||||||||||
|
Surgery
|
$
|
7,314
|
|
$
|
7,001
|
|
4.5
|
%
|
3.2
|
%
|
1.3
|
%
|
|||||
|
Advanced
|
2,947
|
|
2,733
|
|
7.8
|
|
6.3
|
|
1.5
|
|
|||||||
|
General
|
3,376
|
|
3,293
|
|
2.5
|
|
1.1
|
|
1.4
|
|
|||||||
|
Specialty
|
991
|
|
975
|
|
1.6
|
|
1.1
|
|
0.5
|
|
|||||||
|
Orthopaedics
|
6,623
|
|
6,772
|
|
(2.2
|
)
|
(3.5
|
)
|
1.3
|
|
|||||||
|
Hips
|
1,053
|
|
1,030
|
|
2.2
|
|
0.9
|
|
1.3
|
|
|||||||
|
Knees
|
1,110
|
|
1,126
|
|
(1.4
|
)
|
(2.6
|
)
|
1.2
|
|
|||||||
|
Trauma
|
2,025
|
|
1,947
|
|
4.0
|
|
2.6
|
|
1.4
|
|
|||||||
|
Spine & Other
|
2,435
|
|
2,669
|
|
(8.8
|
)
|
(10.1
|
)
|
1.3
|
|
|||||||
|
Vision
|
3,420
|
|
2,944
|
|
16.2
|
|
14.9
|
|
1.3
|
|
|||||||
|
Contact Lenses/Other
|
2,486
|
|
2,236
|
|
11.2
|
|
9.9
|
|
1.3
|
|
|||||||
|
Surgical
|
934
|
|
708
|
|
31.9
|
|
30.5
|
|
1.4
|
|
|||||||
|
Interventional Solutions
(1)
|
1,960
|
|
1,675
|
|
17.0
|
|
14.9
|
|
2.1
|
|
|||||||
|
Diabetes Care
|
1,009
|
|
1,225
|
|
(17.6
|
)
|
(19.0
|
)
|
1.4
|
|
|||||||
|
Diagnostics
(2)
|
—
|
|
1
|
|
**
|
**
|
**
|
||||||||||
|
Total Medical Devices Sales
|
$
|
20,326
|
|
$
|
19,618
|
|
3.6
|
%
|
2.2
|
%
|
1.4
|
%
|
|||||
*Prior year amounts have been reclassified to conform to current year presentation
**Percentage greater than 100% or not meaningful
(1)
Previously referred to as Cardiovascular
(2)
On June 30, 2014, the Company divested the Ortho-Clinical Diagnostics business (the Diagnostics Franchise)
The Medical Devices segment sales in the fiscal
third
quarter of
2018
were $6.6 billion, a decrease of 0.2% as compared to the same period a year ago, with operational growth of 1.7% offset by a negative currency impact of 1.9%. U.S. Medical Devices sales increased 0.3%. International Medical Devices sales decreased by 0.6%, including an operational increase of 3.0% offset by a negative currency impact of 3.6%. In the fiscal
third
quarter of 2018, the net impact of acquisitions and divestitures on the Medical Devices segment operational sales growth was a negative 1.2%.
50
Major Medical Devices Franchise Sales* —
Fiscal Third Quarters Ended
|
(Dollars in Millions)
|
September 30, 2018
|
October 1, 2017
|
Total
Change
|
Operations
Change
|
Currency
Change
|
||||||||||||
|
Surgery
|
$
|
2,376
|
|
$
|
2,346
|
|
1.3
|
%
|
3.8
|
%
|
(2.5
|
)%
|
|||||
|
Advanced
|
976
|
|
923
|
|
5.7
|
|
8.1
|
|
(2.4
|
)
|
|||||||
|
General
|
1,080
|
|
1,105
|
|
(2.3
|
)
|
0.3
|
(2.6
|
)
|
||||||||
|
Specialty
|
320
|
|
318
|
|
0.6
|
|
2.9
|
|
(2.3
|
)
|
|||||||
|
Orthopaedics
|
2,111
|
|
2,204
|
|
(4.2
|
)
|
(2.9
|
)
|
(1.3
|
)
|
|||||||
|
Hips
|
330
|
|
328
|
|
0.6
|
|
2.2
|
|
(1.6
|
)
|
|||||||
|
Knees
|
341
|
|
343
|
|
(0.6)
|
1.0
|
|
(1.6
|
)
|
||||||||
|
Trauma
|
654
|
|
662
|
|
(1.2
|
)
|
0.0
|
|
(1.2
|
)
|
|||||||
|
Spine & Other
|
786
|
|
871
|
|
(9.8
|
)
|
(8.6
|
)
|
(1.2
|
)
|
|||||||
|
Vision
|
1,132
|
|
1,091
|
|
3.8
|
|
5.6
|
|
(1.8
|
)
|
|||||||
|
Contact Lenses/Other
|
835
|
|
800
|
|
4.4
|
|
6.2
|
|
(1.8
|
)
|
|||||||
|
Surgical
|
297
|
|
291
|
|
2.1
|
|
4.1
|
|
(2.0
|
)
|
|||||||
|
Interventional Solutions
(1)
|
653
|
|
553
|
|
18.1
|
|
19.4
|
|
(1.3
|
)
|
|||||||
|
Diabetes Care
|
315
|
|
405
|
|
(22.2
|
)
|
(20.0
|
)
|
(2.2
|
)
|
|||||||
|
Total Medical Devices Sales
|
$
|
6,587
|
|
$
|
6,599
|
|
(0.2
|
)%
|
1.7
|
%
|
(1.9
|
)%
|
|||||
*Prior year amounts have been reclassified to conform to current year presentation
(1)
Previously referred to as Cardiovascular
The Surgery franchise achieved operational sales growth of 3.8% as compared to the prior year fiscal
third
quarter. Operational growth in Advanced Surgery was primarily driven by endocutters, biosurgery products and growth outside the U.S. in energy products. Operational growth in General Surgery was driven by wound closure products. Operational growth in Specialty Surgery was primarily driven by Advanced Sterilization Products.
The Orthopaedics franchise experienced an operational sales decline of 2.9% as compared to the prior year fiscal
third
quarter. The decline in Spine & Other sales was primarily due to the Codman Neurosurgery divestiture and share loss in Spine partially offset by new product launches. Trauma is flat as compared to the prior year due to lower market growth and continued pricing pressure, primarily in the U.S. Operational growth in hips and knees was primarily due to the continued uptake of new products.
The Vision franchise achieved operational sales growth of 5.6% as compared to the prior year fiscal
third
quarter. Operational growth was primarily driven by strength of the astigmatism and daily disposable lenses in the OASYS
®
contact lenses category. Surgical growth was driven by cataract performance primarily outside the U.S.
The Interventional Solutions franchise (includes the Cerenovus business previously included in Spine and Other in Orthopaedics) achieved strong operational sales growth of 19.4% as compared to the prior year fiscal
third
quarter. Strong operational growth in the electrophysiology business was driven by Atrial Fibrillation procedure growth and continued uptake of the THERMOCOOL SMARTTOUCH
®
Contact Force
Sensing Catheter.
The Diabetes Care franchise experienced an operational sales decline of 20.0% as compared to the prior year fiscal
third
quarter. Lower sales were primarily due to the Company's decision to exit the Animas insulin pump business, price declines in the U.S. and competitive pressure. Subsequent to the quarter the Company completed the divestiture of its LifeScan business.
51
ANALYSIS OF CONSOLIDATED EARNINGS BEFORE PROVISION FOR TAXES ON INCOME
Consolidated earnings before provision for taxes on income for the fiscal nine months of 2018 was $14.9 billion representing 24.3% of sales as compared to $15.1 billion in the fiscal nine months of 2017, representing 26.9% of sales.
Consolidated earnings before provision for taxes on income for the fiscal third quarter of 2018 was $4.4 billion representing 21.7% of sales as compared to $4.8 billion in the fiscal third quarter of 2017, representing 24.4% of sales.
Cost of Products Sold
Consolidated costs of products sold for the fiscal nine months of
2018
increased to 32.9% from 32.3% of sales as compared to the same period a year ago. Consolidated costs of products sold for the fiscal
third
quarter of
2018
decreased to 32.4% from 35.2% of sales as compared to the same period a year ago. The unfavorable increase in the fiscal nine months was primarily driven by higher amortization expense primarily related to the Actelion acquisition. This was partially offset by lower acquisition related costs and favorable product and segment mix. The favorable decrease in the fiscal third quarter was primarily driven by lower acquisition related costs and favorable product and segment mix. The intangible asset amortization expense for the
fiscal nine months
of 2018 and 2017 was $3.3 billion and $1.9 billion, respectively.
Selling, Marketing and Administrative Expenses
Consolidated selling, marketing and administrative expenses for the fiscal nine months of
2018
decreased to 27.1% from 27.5% of sales as compared to the same period a year ago. Consolidated selling, marketing and administrative expenses for the fiscal
third
quarter of
2018
decreased to 27.3% from 27.6% of sales as compared to the same period a year ago. The decrease in both periods as compared to the same period a year ago was primarily due to lower costs relative to sales growth in the Pharmaceutical business. The decrease in the nine months was partially offset by investment spend to support new product launches in the Medical Devices and Consumer segments.
Research and Development Expense
Worldwide costs of research and development activities for the fiscal nine months of
2018
decreased to 12.3% from 12.4% of sales as compared to the same period a year ago. Worldwide costs of research and development activities for the fiscal
third
quarter of
2018
decreased to 12.3% from 13.2% of sales as compared to the same period a year ago. In the fiscal nine months of 2018 worldwide costs of research and development activities were $7.6 billion, an increase of 8.6% as compared to the same period a year ago but decreased slightly as a percent to sales due to higher overall sales in the Pharmaceutical segment. The decrease in the fiscal third quarter was primarily due to timing, specifically lower milestone payments in the pharmaceutical business.
In-Process Research and Development (IPR&D)
In the fiscal third quarter and fiscal nine months of 2018, the Company recorded an IPR&D charge of $1.1 billion. Of the $1.1 billion, a partial impairment charge of $0.8 billion related to the development program of AL-8176, an investigational drug for the treatment of Respiratory Syncytial Virus (RSV) and human metapneumovirus (hMPV) acquired with the 2014 acquisition of Alios Biopharma Inc. Late in the fiscal second quarter of 2018, information became available which led the Company to suspend on-going Phase 2B trials on AL-8176 until an analysis of this information was completed. In the fiscal third quarter of 2018, further information became available to the Company enabling the Company to reassess the carrying value of the AL-8176 IPR&D asset. The impairment charge was calculated based on updated cash flow projections discounted for the inherent risk in the asset development and reflects the impact of recent phase 2b clinical trial suspension, a decrease in the probability of success factors and the ongoing analysis of asset development activities. The Company continues to evaluate information with respect to the development program and will monitor the remaining $0.9 billion intangible asset for further impairment. In addition, an impairment charge of $0.3 billion was recorded for the discontinuation of the development project for an anti-thrombin antibody associated with the 2015 acquisition of XO1 Limited.
Interest (Income) Expense
Interest income in the fiscal nine months and fiscal
third
quarter of 2018 was higher than the same periods a year ago. Interest income was higher in the fiscal nine months of 2018 as compared to 2017 due to a higher average interest rate partially offset by a lower average cash, cash equivalents and marketable securities balance during the period. Interest income was higher in the fiscal third quarter 2018 as compared to 2017 due to a higher average interest rate and a higher average cash, cash
52
equivalents and marketable securities balance during the period. The balance of cash, cash equivalents and current marketable securities was $19.4 billion at the end of the fiscal
third
quarter of
2018
as compared to $16.2 billion at the end of the fiscal third quarter of 2017. The average balance of cash, cash equivalents and marketable securities for the fiscal nine months of 2018 was $18.8 billion as compared to $29.1 billion for the same period a year ago. The decrease in the average balance of cash, cash equivalents and marketable securities was due to the use of cash for general corporate purposes including acquisitions, primarily the Actelion acquisition for $29.6 billion, net of cash acquired late in the fiscal second quarter of 2017.
Interest expense in the fiscal nine months and fiscal
third
quarter of
2018
was higher as compared to the same periods a year ago. Interest expense was higher in the fiscal nine months of 2018 as compared to 2017 due to a higher average interest rate and a higher average debt balance. Interest expense was slightly higher in the fiscal third quarter of 2018 as compared to 2017 due to a higher average interest rate partially offset by a lower average debt balance. The Company’s debt position was $31.3 billion as of September 30, 2018 as compared to $35.2 billion the same period a year ago.
Other (Income) Expense, Net
Other (income) expense, net for the fiscal nine months of 2018 was unfavorable by $0.4 billion as compared to the same period a year ago. The fiscal nine months of 2018 included a reversal of a contingent liability of $0.2 billion and lower costs of $0.1 billion related to the Actelion acquisition offset by higher litigation expense of $0.1 billion and $0.3 billion of other miscellaneous items as compared to the same period a year ago. The fiscal nine months of 2017 included higher gains of $0.5 billion from the monetization of future royalty receivables and the sale of certain investments in equity securities partially offset by an asset impairment charge of $0.2 billion primarily related to the insulin pump business.
Other (income) expense, net for the fiscal
third
quarter of 2018 was unfavorable by $0.3 billion as compared to the same period a year ago. This was primarily attributable to a reversal of a contingent liability of $0.2 billion and lower litigation expense of $0.1 billion in the fiscal third quarter of 2018 offset by higher gains of $0.5 billion on divestitures, primarily COMPEED
®
, in the fiscal third quarter of 2017.
EARNINGS BEFORE PROVISION FOR TAXES BY SEGMENT
Income before tax by segment of business for the fiscal nine months were as follows:
|
|
Income Before Tax
|
Segment Sales
|
Percent of Segment Sales
|
|||||||||||||||||||
|
(Dollars in Millions)
|
September 30, 2018
|
October 1, 2017
|
September 30, 2018
|
October 1, 2017
|
September 30, 2018
|
October 1, 2017
|
||||||||||||||||
|
Consumer
|
$
|
1,887
|
|
$
|
2,132
|
|
$
|
10,317
|
|
$
|
10,062
|
|
18.3
|
%
|
21.2
|
%
|
||||||
|
Pharmaceutical
|
10,193
|
|
9,934
|
|
30,544
|
|
26,575
|
|
33.4
|
|
37.4
|
|
||||||||||
|
Medical Devices
|
3,642
|
|
3,938
|
|
20,326
|
|
19,618
|
|
17.9
|
|
20.1
|
|
||||||||||
|
Segment total
|
15,722
|
|
16,004
|
|
61,187
|
|
56,255
|
|
25.7
|
|
28.4
|
|
||||||||||
|
Less: Expenses not allocated to segments
(1)
|
845
|
|
891
|
|
|
|
|
|
||||||||||||||
|
Worldwide total
|
$
|
14,877
|
|
$
|
15,113
|
|
$
|
61,187
|
|
$
|
56,255
|
|
24.3
|
%
|
26.9
|
%
|
||||||
(1)
Amounts not allocated to segments include interest (income) expense and general corporate (income) expense.
Income before tax by segment of business for the fiscal
third
quarters were as follows:
|
|
Income Before Tax
|
Segment Sales
|
Percent of Segment Sales
|
|||||||||||||||||||
|
(Dollars in Millions)
|
September 30, 2018
|
October 1, 2017
|
September 30, 2018
|
October 1, 2017
|
September 30, 2018
|
October 1, 2017
|
||||||||||||||||
|
Consumer
|
$
|
510
|
|
$
|
878
|
|
$
|
3,415
|
|
$
|
3,356
|
|
14.9
|
%
|
26.2
|
%
|
||||||
|
Pharmaceutical
|
2,876
|
|
2,857
|
|
10,346
|
|
9,695
|
|
27.8
|
|
29.5
|
|
||||||||||
|
Medical Devices
|
1,267
|
|
1,383
|
|
6,587
|
|
6,599
|
|
19.2
|
|
21.0
|
|
||||||||||
|
Segment earnings before provision for taxes
|
4,653
|
|
5,118
|
|
20,348
|
|
19,650
|
|
22.9
|
|
26.0
|
|
||||||||||
|
Less: Expenses not allocated to segments
(1)
|
230
|
|
328
|
|
|
|
|
|
||||||||||||||
|
Worldwide income before tax
|
$
|
4,423
|
|
$
|
4,790
|
|
$
|
20,348
|
|
$
|
19,650
|
|
21.7
|
%
|
24.4
|
%
|
||||||
(1)
Amounts not allocated to segments include interest (income) expense and general corporate (income) expense.
53
Consumer Segment
The Consumer segment income before tax as a percent of sales in the fiscal nine months of
2018
was 18.3% versus 21.2% for the same period a year ago. The Consumer segment income before tax as a percent of sales in the fiscal
third
quarter of
2018
was 14.9% versus 26.2% for the same period a year ago. The decrease in the income before tax as a percent of sales in both the fiscal nine months and fiscal third quarter of 2018 as compared to 2017 was primarily attributable to higher gains on divestitures in 2017 as compared to 2018. The fiscal nine months of 2018 included a
gain of $0.3 billion from the divestiture of NIZORAL
®
which was completed in the fiscal second quarter of 2018. The fiscal nine months of 2017 included the COMPEED
®
gain of $0.4 billion which was divested in the fiscal third quarter of 2017. Additionally, the fiscal nine months of 2018 included higher investment spend as compared to the prior year to support the launch of new products.
Pharmaceutical Segment
The Pharmaceutical segment income before tax as a percent of sales in the fiscal nine months of
2018
was 33.4% versus 37.4% for the same period a year ago. The Pharmaceutical segment income before tax as a percent of sales in the fiscal
third
quarter of
2018
was 27.8% versus 29.5% for the same period a year ago. The decrease in the income before tax as a percent of sales for the fiscal nine months of 2018 was primarily due to higher amortization expense of $1.3 billion related to the Actelion acquisition and an in-process research and development charge of $1.1 billion. This was partially offset by lower acquisition related costs of $0.4 billion, a contingent liability reversal of $0.2 billion, a gain of $0.1 billion on the divestiture of PANCREASE
®
, favorable product mix and slower increases in expenses relative to the increase in sales. Additionally, the fiscal nine months of 2017 included a gain of $0.2 billion related to the monetization of future royalty receivables and higher gains of $0.3 billion on the sale of certain investments in equity securities held by Johnson & Johnson Innovation - JJDC, Inc. as compared to the fiscal nine months of 2018. The decrease in the income before tax as a percent of sales for the fiscal third quarter of 2018 as compared to the prior year was primarily due to an in-process research and development charge of $1.1 billion. This was partially offset by lower acquisition related costs of $0.3 billion, a contingent liability reversal of $0.2 billion and favorable product mix and slower increases in expenses relative to the increase in sales.
Medical Devices Segment
The Medical Devices segment income before tax as a percent of sales in the fiscal nine months of 2018 was 17.9% versus 20.1% for the same period a year ago. The Medical Devices segment income before tax as a percent of sales in the fiscal third quarter of 2018 was 19.2% versus 21.0% for the same period a year ago. The decrease in the income before tax as a percent of sales for the fiscal nine months of 2018 as compared to 2017 was primarily due to litigation expense of $0.7 billion in 2018 as compared to $0.5 billion in 2017, and investments in the business. This was partially offset by an asset impairment charge of $0.2 billion primarily related to the insulin pump business in the fiscal nine months of 2017. The decrease in the income before tax as a percent of sales for the fiscal third quarter of 2018 as compared to 2017 was primarily due to increased investments in the business. This was partially offset by $0.1 billion of higher litigation expense in 2017.
Restructuring
In the first quarter of 2016, the Company announced restructuring actions in its Medical Devices segment. The restructuring actions are expected to result in annualized pre-tax cost savings of $800 million to $1.0 billion, the majority of which is expected to be realized by the end of 2018. Approximately $500 million in savings were realized in 2017. The savings will provide the Company with added flexibility and resources to fund investment in new growth opportunities and innovative solutions for customers and patients. The Company estimates that, in connection with its plans, it will record pre-tax restructuring related charges of approximately $2.4 billion. In the fiscal
third
quarter of 2018, the Company recorded a pre-tax charge of $101 million, of which $9 million is included in cost of products sold and $45 million is included in other (income) expense. Restructuring charges of $2.4 billion have been recorded since the restructuring was announced.
In the second quarter of 2018, the Company announced plans to implement actions across its global supply chain that are intended to enable the Company to focus resources and increase investments in critical capabilities, technologies and solutions necessary to manufacture and supply its product portfolio of the future, enhance agility and drive growth. The Company expects these supply chain actions will include expanding its use of strategic collaborations, and bolstering its initiatives to reduce complexity, improving cost-competitiveness, enhancing capabilities and optimizing its network. Discussions regarding specific future actions are ongoing and are subject to all relevant consultation requirements before they are finalized. In total, the Company expects these actions to generate approximately $0.6 to $0.8 billion in annual pre-tax cost savings that will be
54
substantially delivered by 2022. The Company expects to record pre-tax restructuring charges of approximately $1.9 to $2.3 billion. In the fiscal
third
quarter of 2018, the Company recorded a pre-tax charge of $89 million, of which $14 million is included in cost of products sold and $34 million is included in other (income) expense. Restructuring charges of $148 million have been recorded since the restructuring was announced.
See Note 12 to the Consolidated Financial Statements for additional details related to the restructuring.
Provision for Taxes on Income
The worldwide effective income tax rates for the fiscal nine months of
2018
and
2017
were 17.6% and 20.5%, respectively. The Company estimates that the net impact of the U.S. Tax Cuts and Jobs Act (TCJA) including the reduction of the U.S. statutory corporate tax rate, offset by the elimination of the corporate income tax deductions, measurement period adjustments and the global intangible low-taxed income (GILTI) tax, but excluding certain one-time tax benefits, decreased the Company’s worldwide effective rate by approximately 1.0% to 2.0% compared to the same period of the prior year.
Provisional amounts recorded as part of the adoption of the TCJA and estimates used to develop the current quarter's effective tax rate may require further adjustments and changes to the Company’s estimates as new guidance is made available. These estimates are subject to the finalization of management’s analysis related to certain matters, such as developing interpretations of the provision of the TCJA, changes to certain estimates and amounts related to the earnings and profits of certain subsidiaries and the filing of tax returns. Revisions to the provisional charge may be material to the Company's future financial results.
On August 1, 2018, the U.S. Treasury Department issued Proposed Regulations (REG-104226-18) related to the TCJA transition tax. On September 13, 2018 the U.S. Treasury Department issued Proposed Regulations (REG-104390-18) related to the GILTI tax. The Company has assessed the impact of these Proposed Regulations and at this time does not expect either proposal to have a material impact on the Company’s future results.
See Note 5 to the Consolidated Financial Statements for additional details regarding the impact of the TCJA and adjustments to provisional amounts recorded in fiscal 2017.
The Company completed its acquisition of AMO in the first fiscal quarter of 2017 and incurred incremental tax costs that were discretely recorded in the first quarter of 2017, which had increased the effective tax rate by 1.4% for the first nine months of 2017 compared to the same period in 2018. Additionally, in 2018 the Company had more income in higher tax jurisdictions relative to lower tax jurisdictions as compared to 2017. These increases to the effective tax rate were partially offset by additional tax benefits received from stock-based compensation that either vested or were exercised during the fiscal nine months of 2018 and 2017, which reduced the effective tax rate by 1.2% and 2.1%, respectively.
As of September 30, 2018, the Company had approximately $3.2 billion of liabilities from unrecognized tax benefits. The Company believes it is possible that audits may be completed by tax authorities in some jurisdictions over the next twelve months. The Company is not able to provide a reasonably reliable estimate of the timing of any future tax payments relating to uncertain tax positions. The IRS has completed its audit for the tax years through 2009 and is currently auditing the tax years 2010 through 2012. The Company currently expects completion of this audit during 2019. Final conclusion of the tax audit may result in an outcome that is different than the Company’s estimates and may result in a material impact on the Company’s current and future operating results or cash flows in the period that the audit is concluded.
See Note 8 to the Consolidated Financial Statements in the Annual Report on Form 10-K for the fiscal year ended
December 31, 2017
for more detailed information regarding unrecognized tax benefits.
LIQUIDITY AND CAPITAL RESOURCES
Cash Flows
Cash and cash equivalents were $16.1 billion at the end of the fiscal
third
quarter of
2018
as compared with $17.8 billion at the end of fiscal year
2017
. The primary sources and uses of cash that contributed to the $1.7 billion decrease were approximately $16.0 billion of cash generated from operating activities offset by $5.4 billion net cash used by investing activities, $12.1 billion net cash used by financing activities and $0.2 billion due to the effect on exchange rate changes on cash and cash
55
equivalents. In addition, the Company had $3.3 billion in marketable securities at the end of the fiscal third quarter of 2018 and $0.5 billion at the end of 2017.
Cash flow from operations of $16.0 billion was the result of $12.3 billion of net earnings and $7.3 billion of non-cash expenses and other adjustments primarily for depreciation and amortization, stock-based compensation, asset write-downs primarily related to the Alios and XO1 assets and the deferred tax provision. Additionally, an increase of $0.7 billion in accounts payable and accrued liabilities contributed to cash flows from operating activities. This was reduced by $3.9 billion related to an increase in accounts receivable, inventories, other current and non-current assets, a decrease in other liabilities and $0.4 billion related to the sales of assets/businesses. In the fiscal third quarter of 2018, the Company contributed $0.6 billion to its U.S. pension plan.
Investing activities use of $5.4 billion of cash was primarily used for additions to property, plant and equipment of $2.4 billion, $3.0 billion from the net purchases of investments in marketable securities and acquisitions of $0.9 billion. Investing activities also included a source of $0.9 billion of proceeds from the disposal of assets/businesses, net.
Financing activities use of $12.1 billion of cash was primarily used for dividends to shareholders of $7.1 billion, the net retirement of short and long term debt of $3.2 billion and the repurchase of common stock of $2.1 billion. Financing activities also included a source of $0.5 billion from proceeds from stock options exercised/employee withholding tax on stock awards, net.
The Company has access to substantial sources of funds at numerous banks worldwide. In September 2018, the Company secured a new 364-day Credit Facility. Total credit available to the Company under the facility, which expires September 12, 2019, approximates $10.0 billion. Interest charged on borrowings under the credit line agreement is based on either bids provided by banks, the prime rate or London Interbank Offered Rates (LIBOR), plus applicable margins. Commitment fees under the agreement are not material.
In the fiscal
third
quarter of
2018
, the Company's notes payable and long-term debt was in excess of cash, cash equivalents and marketable securities. The Company anticipates that operating cash flows, the ability to raise funds from external sources, borrowing capacity from existing committed credit facilities and access to the commercial paper markets will continue to provide sufficient resources to fund operating needs. Additionally, as a result of the TCJA, the Company has access to its cash outside the U.S. at a significantly reduced cost. The Company monitors the global capital markets on an ongoing basis and from time to time may raise capital when market conditions are favorable. The Company filed a shelf registration on February 27, 2017, which will enable it to issue debt securities on a timely basis.
Dividends
On July 16, 2018, the Board of Directors declared a regular cash dividend of $0.90 per share, payable on September 11, 2018 to shareholders of record as of August 28, 2018.
On October 18, 2018, the Board of Directors declared a regular cash dividend of $0.90 per share, payable on December 11, 2018 to shareholders of record as of November 27, 2018. The Company expects to continue the practice of paying regular quarterly cash dividends.
OTHER INFORMATION
New Accounting Pronouncements
Refer to Note 1 to the Consolidated Financial Statements for new accounting pronouncements.
Economic and Market Factors
The Company operates in certain countries where the economic conditions continue to present significant challenges. The Company continues to monitor these situations and take appropriate actions. Inflation rates and currency exchange rates continue to have an effect on worldwide economies and, consequently, on the way the Company operates. The Company has accounted for operations in Venezuela as highly inflationary, as the prior three-year cumulative inflation rate surpassed 100%. Beginning in the fiscal third quarter of 2018, the Company accounted for operations in Argentina as highly inflationary. This did not have a material impact to the Company's results in the period. In the face of increasing costs, the Company strives to maintain its profit margins through cost reduction programs, productivity improvements and periodic price increases.
56
In June 2016, the United Kingdom (U.K.) held a referendum in which voters approved an exit from the European Union (E.U.), commonly referred to as “Brexit”, and in March 2017 the U.K. formally started the process to leave the E.U. Given the lack of comparable precedent, it is unclear what financial, trade, regulatory and legal implications the withdrawal of the U.K. from the E.U. will have. Brexit creates global political and economic uncertainty, which may cause, among other consequences, volatility in exchange rates and interest rates, additional cost containment by third-party payors and changes in regulations. However, the Company currently does not believe that these and other related effects will have a material impact on the Company’s consolidated financial position or operating results. As of September 30, 2018, the business of the Company’s U.K. subsidiaries represented less than 3% of both the Company’s consolidated assets and fiscal nine months revenues, respectively.
Governments around the world consider various proposals to make changes to tax laws, which may include increasing or decreasing existing statutory tax rates. A change in statutory tax rate in any country would result in the revaluation of the Company’s deferred tax assets and liabilities related to that particular jurisdiction in the period in which the new tax law is enacted. This change would result in an expense or benefit recorded to the Company’s Consolidated Statement of Earnings. The Company closely monitors these proposals as they arise in the countries where it operates. Changes to the statutory tax rate may occur at any time, and any related expense or benefit recorded may be material to the fiscal quarter and year in which the law change is enacted. On September 28, 2018 the Swiss Parliament approved the Federal Act on Tax Reform and AHV Financing (“Swiss Tax Reform”). The proposed Swiss Tax Reform is subject to approval by a possible public referendum. If no referendum is called, the Swiss Tax Reform could come into force in January 2020. If a referendum is held, the public vote is likely to take place in May 2019 and if adopted, the measures could come into force in either January 2020 or January 2021. As result, the proposed Swiss Tax Reform is not considered enacted and therefore the Company has not reflected any of the potential impacts in its fiscal third quarter results. The Company is currently assessing the impact of the proposed Swiss Tax Reform, but when enacted, the law may have a material impact on the Company’s operating results.
The Company faces various worldwide health care changes that may continue to result in pricing pressures that include health care cost containment and government legislation relating to sales, promotions and reimbursement of health care products.
Changes in the behavior and spending patterns of purchasers of health care products and services, including delaying medical procedures, rationing prescription medications, reducing the frequency of physician visits and foregoing health care insurance coverage, may continue to impact the Company’s businesses.
The Company also operates in an environment increasingly hostile to intellectual property rights. Firms have filed Abbreviated New Drug Applications or Biosimilar Biological Product Applications with the FDA, initiated Inter Partes Review proceedings in the United States Patent and Trademark Office, or otherwise challenged the coverage and/or validity of the Company's patents, seeking to market generic or biosimilar forms of many of the Company’s key pharmaceutical products prior to expiration of the applicable patents covering those products. In the event the Company is not successful in defending the patent claims challenged in these actions, generic or biosimilar versions of the products at issue may be introduced to the market, resulting in the potential for substantial market share and revenue losses for those products, and which may result in a non-cash impairment charge in any associated intangible asset. There is also a risk that one or more competitors could launch a generic or biosimilar version of the product at issue following regulatory approval even though one or more valid patents are in place. For further information, see the discussion on “REMICADE
®
Related Cases” and “Litigation Against Filers of Abbreviated New Drug Applications” in Note 11 to the Consolidated Financial Statements.
There has been no material change in the Company’s assessment of its sensitivity to market risk since its presentation set forth in Item 7A, “Quantitative and Qualitative Disclosures About Market Risk,” in its Annual Report on Form 10-K for the fiscal year ended
December 31, 2017
.
Disclosure controls and procedures. At the end of the period covered by this report, the Company evaluated the effectiveness of the design and operation of its disclosure controls and procedures. The Company’s disclosure controls and procedures are designed to ensure that information required to be disclosed by the Company in the reports that it files or submits under the Securities Exchange Act is recorded, processed, summarized and reported, within the time periods specified in the SEC’s rules and forms. Disclosure controls and procedures include, without limitation, controls and procedures designed to ensure that information required to be disclosed by the Company in the reports that it files or submits under the Securities Exchange Act is
57
accumulated and communicated to the Company’s management, including its principal executive and principal financial officers, or persons performing similar functions, as appropriate, to allow timely decisions regarding required disclosure. Alex Gorsky, Chairman and Chief Executive Officer, and Joseph J. Wolk, Executive Vice President, Chief Financial Officer, reviewed and participated in this evaluation. Based on this evaluation, Messrs. Gorsky and Wolk concluded that, as of the end of the period covered by this report, the Company’s disclosure controls and procedures were effective.
Internal control. During the period covered by this report, there were no changes in the Company’s internal control over financial reporting that have materially affected, or are reasonably likely to materially affect, the Company’s internal control over financial reporting.
The Company is implementing a multi-year, enterprise-wide initiative to integrate, simplify and standardize processes and systems for the human resources, information technology, procurement, supply chain and finance functions. These are enhancements to support the growth of the Company’s financial shared service capabilities and standardize financial systems. This initiative is not in response to any identified deficiency or weakness in the Company’s internal control over financial reporting. In response to this initiative, the Company has and will continue to align and streamline the design and operation of its financial control environment.
58
The information called for by this item is incorporated herein by reference to Note 11 included in Part I, Item 1, Financial Statements (unaudited) — Notes to Consolidated Financial Statements.
(c) Purchases of Equity Securities by the Issuer and Affiliated Purchasers.
The following table provides information with respect to Common Stock purchases by the Company during the fiscal third quarter of 2018. The repurchases below also include the stock-for-stock option exercises that settled in the fiscal third quarter.
|
Period
|
Total Number
of Shares Purchased
(1)
|
Avg. Price
Per Share
|
Total Number of Shares Purchased as Part of Publicly Announced Plans or Programs
|
Maximum Number of Shares that May Yet Be Purchased Under the Plans or Programs
|
|||||||
|
July 2, 2018 through July 29, 2018
|
200,000
|
|
128.19
|
|
—
|
|
—
|
||||
|
July 30, 2018 through August 26, 2018
|
265,958
|
|
135.10
|
|
—
|
|
—
|
||||
|
August 27, 2018 through September 30, 2018
|
2,958,890
|
|
138.58
|
|
—
|
|
—
|
||||
|
Total
|
3,424,848
|
|
—
|
|
|
||||||
(1) During the fiscal third quarter of 2018, the Company repurchased an aggregate of 3,424,848 shares of Johnson & Johnson Common Stock in open-market transactions as part of a systematic plan to meet the needs of the Company’s compensation programs.
Exhibit 31.1
Certification of Chief Executive Officer under Rule 13a-14(a) of the Securities Exchange Act pursuant to Section 302 of the Sarbanes-Oxley Act of 2002 — Filed with this document.
Exhibit 31.2
Certification of Chief Financial Officer under Rule 13a-14(a) of the Securities Exchange Act pursuant to Section 302 of the Sarbanes-Oxley Act of 2002 — Filed with this document.
Exhibit 32.1
Certification of Chief Executive Officer pursuant to Section 906 of the Sarbanes-Oxley Act of 2002 — Furnished with this document.
Exhibit 32.2
Certification of Chief Financial Officer pursuant to Section 906 of the Sarbanes-Oxley Act of 2002 — Furnished with this document.
Exhibit 101 XBRL (Extensible Business Reporting Language) The following materials from Johnson & Johnson’s Quarterly Report on Form 10-Q for the quarter ended
September 30, 2018
, formatted in Extensive Business Reporting Language (XBRL), (i) consolidated balance sheets, (ii) consolidated statements of earnings, (iii) consolidated statements of comprehensive income (iv) consolidated statements of cash flows, and (v) the notes to the consolidated financial statements.
59
SIGNATURES
Pursuant to the requirements of the Securities Exchange Act of 1934, the registrant has duly caused this report to be signed on its behalf by the undersigned thereunto duly authorized.
|
|
JOHNSON & JOHNSON
(Registrant)
|
|
Date: October 31, 2018
|
By /s/ J. J. WOLK
|
|
J. J. WOLK
|
|
|
|
Executive Vice President, Chief Financial Officer (Principal Financial Officer)
|
|
|
|
|
Date: October 31, 2018
|
By /s/ R. A. KAPUSTA
|
|
|
R. A. KAPUSTA
|
|
|
Controller (Principal Accounting Officer)
|
60
TABLE OF CONTENTS
Part I Financial InformationItem 1 Financial StatementsNote 2 InventoriesNote 3 Intangible Assets and GoodwillNote 4 Fair Value MeasurementsNote 5 Income TaxesNote 6 Pensions and Other Benefit PlansNote 7 Accumulated Other Comprehensive IncomeNote 8 Earnings Per ShareNote 9 Segments Of Business and Geographic AreasNote 10 Business Combinations and DivestituresNote 11 Legal ProceedingsNote 12 RestructuringItem 2 Management S Discussion and Analysis Of Financial Condition and Results Of OperationsItem 3 Quantitative and Qualitative Disclosures About Market RiskItem 4 Controls and ProceduresPart II Other InformationItem 1 Legal ProceedingsItem 2 Unregistered Sales Of Equity Securities and Use Of ProceedsItem 6 Exhibits