ST JOE CO
10-Ks and 10-Qs
|
|
|
|
|
|
|
|
|
|
|
|
|
|
|
|
|
|
|
|
|
|
|
|
|
|
|
|
|
|
|
|
|
|
|
|
|
|
|
|
|
|
|
|
|
|
|
|
|
|
|
|
|
|
|
|
|
|
|
UNITED STATES
SECURITIES AND EXCHANGE COMMISSION
Washington, D.C. 20549
Form 10-K
(Mark One)
|
x
|
ANNUAL REPORT PURSUANT TO SECTION 13 OR 15(d) OF THE SECURITIES EXCHANGE ACT OF 1934
|
For the fiscal year ended
December 31, 2015
|
¨
|
TRANSITION REPORT PURSUANT TO SECTION 13 OR 15(d) OF THE SECURITIES EXCHANGE ACT OF 1934
|
For the transition period from to .
Commission file number: 1-10466
The St. Joe Company
(Exact name of registrant as specified in its charter)
|
Florida
|
|
59-0432511
|
|
(State or other jurisdiction of
incorporation or organization)
|
|
(I.R.S. Employer
Identification No.)
|
|
133 South WaterSound Parkway
WaterSound, Florida
|
|
32413
|
|
(Address of principal executive offices)
|
|
(Zip Code)
|
(850) 231-6400
(Registrant’s telephone number, including area code)
Securities Registered Pursuant to Section 12(b) of the Act:
|
Title of Each Class
|
Name of Exchange on Which Registered
|
|
|
Common Stock, no par value
|
New York Stock Exchange
|
|
Indicate by check mark whether the registrant is a well-known seasoned issuer, as defined in Rule 405 of the Securities Act. YES
¨
NO
þ
Indicate by check mark if the registrant is not required to file reports pursuant to Section 13 or Section 15(d) of the Act. YES
¨
NO
þ
Indicate by check mark whether the registrant (1) has filed all reports required to be filed by Section 13 or 15(d) of the Securities Exchange Act of 1934 during the preceding 12 months (or for such shorter period that the registrant was required to file such reports), and (2) has been subject to such filing requirements for the past 90 days. YES
þ
NO
¨
Indicate by check mark whether the registrant has submitted electronically and posted on its corporate Web site, if any, every Interactive Data File required to be submitted and posted pursuant to Rule 405 of Regulation S-T (§ 232.405 of this chapter) during the preceding 12 months (or for such shorter period that the registrant was required to submit and post such files). YES
þ
NO
¨
Indicate by check mark if disclosure of delinquent filers pursuant to item 405 of Regulation S-K is not contained herein, and will not be contained, to the best of the Registrant’s knowledge, in definitive proxy or information statements incorporated by reference in Part III of this Form 10-K or any amendment to this Form 10-K.
þ
Indicate by check mark whether the registrant is a large accelerated filer, an accelerated filer, a non-accelerated filer, or a smaller reporting company. See the definitions of “large accelerated filer,” “accelerated filer” and “smaller reporting company” in Rule 12b-2 of the Exchange Act. (Check one):
|
Large accelerated filer
|
¨
|
Accelerated filer
|
þ
|
|
Non-accelerated filer
|
¨
(Do not check if a smaller reporting company)
|
Smaller reporting company
|
¨
|
Indicate by check mark whether the registrant is a shell company (as defined in Rule 12b-2 of the Exchange Act). YES
¨
NO
þ
The aggregate market value of the registrant’s Common Stock held by non-affiliates based on the closing price on June 30,
2015
, was approximately $574.8 million.
As of
February 26, 2016
, there were 92,332,565 shares of common stock, no par value, issued of which 74,349,612 were outstanding, and 17,982,953 are shares of treasury stock.
THE ST. JOE COMPANY
INDEX
|
|
Page No.
|
2
Item 1.
Business
As used throughout this Annual Report on Form 10-K, the terms “St. Joe,” the “Company,” “we,” “our,” or “us” include The St. Joe Company and its consolidated subsidiaries unless the context indicates otherwise.
General
St. Joe was incorporated in 1936. We are a real estate development, asset management and operating company with real estate assets and operations currently concentrated primarily between Tallahassee and Destin, Florida, which we predominantly use, or intend to use, for or in connection with, our various residential or commercial real estate developments, resorts and leisure operations, leasing operations or our forestry operations on a limited basis.
We have significant residential and commercial land-use entitlements in hand or in process. We seek higher and better uses for our real estate assets through a range of activities from strategic land planning and development, infrastructure improvements and promoting economic development in the regions where we operate. We may explore the sale of such assets opportunistically or when we believe they have reached their highest and best use.
Business Strategy
We intend to use our land holdings and our cash and cash equivalents and investments to create long-term value for our shareholders. We believe that our present liquidity position can provide us with numerous opportunities to create long-term value for our shareholders by allowing us to focus on our core business activity of real estate development and asset management, including opportunities surrounding the Northwest Florida Beaches International Airport and our other land holdings in Northwest Florida.
Specifically, in 2016, we intend to focus on the following initiatives:
|
•
|
Bay-Walton Sector Plan.
In May of 2015, the Bay-Walton Sector Plan was officially adopted by Bay County and Walton County, found in compliance with state law, and no third party appeals were filed, therefore it became in effect in June 2015. The Bay-Walton Sector Plan is a long term master plan that includes entitlements, or legal rights, to develop over 170,000 residential units and over 22 million square feet of retail, commercial, and industrial uses on approximately 110,500 acres of the Company’s land holdings. While these entitlements are broadly defined, what will actually be developed will be a function of more detailed planning, analysis, and market conditions, which will occur over time. We intend to explore opportunities to capitalize on these entitlements, including continuing to explore opportunities in the growing retirement demographic and other strategic initiatives.
|
|
•
|
Commercial and industrial uses of our land portfolio.
We intend to continue exploring new commercial and industrial uses of our land portfolio. The majority of our current land holdings are located within fifteen miles of the coast of the Gulf of Mexico and adjacent to major roads or the Northwest Florida Beaches International Airport.
|
|
◦
|
Pier Park North.
We are developing a 330,000 square foot retail center in Panama City Beach, with Casto, our joint venture partner and one of the country’s leading developers of neighborhood and community retail centers. As of February 1, 2016, approximately 287,000 square feet of retail space was leased, which included key tenants such as Dick’s Sporting Goods, Fresh Market, World Market, Bed Bath & Beyond, Michaels, Pet Smart, Bealls Outlet Store and Ross Dress for Less.
|
|
◦
|
Port of Port St. Joe.
We believe the Port of Port St. Joe can benefit from the expected long-term economic growth in the Southeastern United States and the Panama Canal. The Port of Port St. Joe is well positioned for bulk cargo shipments, offering access to rail, the U.S. Gulf Intracoastal Waterway and state and U.S. highways. However, the Port of Port St. Joe’s shipping channel must first be dredged up to the federally authorized depth. We previously announced that in December 2014, the Florida Department of Environmental Protection issued the state permits to dredge the shipping channel to the maximum authorized depth. In February of 2015, the U.S. Army Corps of Engineers issued the federal permits to dredge the shipping channel to the maximum authorized depth. Additional regulatory approvals, funding, and other infrastructure improvements are required before dredging can begin, which could span multiple years.
|
3
|
◦
|
VentureCrossings.
VentureCrossings allows for 5.9 million square feet of industrial and commercial development adjacent to Northwest Florida Beaches International Airport.
|
|
•
|
Joint ventures with best of class operators.
We believe that by entering into partnerships, joint ventures or other collaborations and alliances with best of class operators, we can efficiently utilize our land assets while reducing capital requirements.
|
|
•
|
Efficient operations.
We expect to continue a cost and investment discipline to ensure low fixed expenses and bottom line performance in all environments.
|
|
•
|
|
Our Business
We currently view the company as a manager of our real estate assets. We operate our business in five reportable operating segments: (1) residential real estate, (2) commercial real estate, (3) resorts and leisure, (4) leasing operations and (5) forestry. For financial information about our operating segments, please see
Note 20,
Segment Information
included in the Notes to the Consolidated Financial Statements included in Item 15 of this Form 10-K.
Residential Real Estate
Our residential real estate segment plans and develops mixed-use resort, primary and seasonal residential communities of various sizes on existing land. We own land in Northwest Florida near the Gulf of Mexico and other waterfront properties concentrated between Tallahassee and Destin, Florida.
Our real estate investment strategy focuses on projects that meet our investment return criteria. The time frame for these expenditures and investments will vary based on the type of project. However, we will only incur such expenditures if our analysis indicates that the project will generate a return equal to or greater than the threshold return over its life. An analysis is conducted for capital expenditures in each of our five segments.
Within our residential real estate business, we currently have two types of communities. The first, our residential resort communities, are positioned to attract primarily second-home buyers. Our successful projects in this category include the WaterColor and WaterSound Beach communities, which were built in a region of Florida that has historically attracted second-home buyers. We continue to see demand for lots and homes in these established resort communities, while some of our other communities continue to have low sales volume.
Our second type of residential communities serve the primary home market. These communities are for buyers who intend to use the community primarily for their main residence. Our Watersound Origins, Breakfast Point and SouthWood communities are our largest projects in this category. We have seen continued demand from builders for our developed lots and parcels of entitled, undeveloped land in our primary home communities.
Commercial Real Estate
In our commercial real estate segment we plan, develop, manage and sell real estate, including commercial operating properties. We provide development opportunities for national, regional and local retailers and other strategic partners in Northwest Florida. We offer land for commercial and light industrial uses. We also develop commercial parcels within or near existing residential developments. Our commercial real estate also includes industrial parks and several commerce parks. We have large land holdings surrounding the Northwest Florida Beaches International Airport, the Port of Port St. Joe, along roadways and near or within business districts in the region. Adjacent to the Northwest Florida Beaches International Airport is one of our industrial parks, VentureCrossings, a commercial and industrial development. We are soliciting global office, retail and industrial users for this prime development location.
4
Resorts and Leisure
WaterColor Inn and Vacation Rentals.
Our WaterColor Inn and Resort is an award winning boutique hotel, which provides guests with access to a beach club, spa, tennis center, an award-winning restaurant, and retail and commercial space. In addition, our vacation rental business rents private homes in the WaterColor, WaterSound Beach and surrounding communities, to individuals who are vacationing in the area. Our resorts and leisure businesses are managed for us by a third party management company.
Clubs and Resorts.
We own four golf courses in Northwest Florida. Three of them are in the Panama City Beach area and the fourth is located in Tallahassee. The golf courses are situated in or near our residential communities. We also own and operate two marinas. Our golf courses and marinas are managed for us by a third party management company.
St. Joe Club & Resorts.
St. Joe Club & Resorts is our private membership club that provides exceptional amenities to our members and resort guests. The focus is on creating a world class membership experience combined with the all-inclusive aspects of a four star/four diamond resort. This allows the company to provide membership and create a competitive advantage in the lodging business. In addition, St. Joe Club & Resorts manages The Pearl Hotel, a boutique resort hotel in Northwest, Florida.
From time to time, we may explore the sale of certain resort and leisure properties.
Leasing Operations
Our leasing operations business includes our retail and commercial leasing. We own and manage several small retail shopping centers located in or very near to some of our residential projects, such as the WaterColor, WaterSound Beach, SouthWood and WindMark Beach communities. The success of these small retail centers is closely tied to the success of the residential developments from which they draw their customers.
Pier Park North.
Our commercial leasing operations include our Pier Park North joint venture. Our Pier Park North joint venture includes a 330,000 square foot retail center in Panama City Beach, which we are developing with Casto, our joint venture partner and one of the country’s leading developers of neighborhood and community retail centers. We began to develop and construct the Pier Park North retail center in early 2013 and expect to complete construction in 2016. As of February 1, 2016, approximately 287,000 square feet of retail space was leased, which included key tenants such as Dick’s Sporting Goods, Fresh Market, World Market, Bed Bath & Beyond, Michaels, Pet Smart, Bealls Outlet Store and Ross Dress for Less.
VentureCrossings.
We built and own a 105,000 square foot building with manufacturing and office space in VentureCrossings and lease the facility to the Harris Corporation under a long-term lease that commenced in 2012.
From time to time, we may sell certain operating properties. Typically the sales of these assets are reported in our commercial real estate segment.
Forestry
Our forestry segment focuses on the management of our timber holdings in Northwest Florida. We grow and sell sawtimber, wood fiber and forest products and provide land management services for conservation properties. We generate revenue from our forestry segment primarily from open market sales of timber. We sell product on site without the associated delivery costs. As of December 31, 2015, we had approximately 116,000 acres in our forestry operations and expect to have the ability to consistently operate approximately 60,000 of those acres. As of December 31, 2015, we had an estimated 3.2 million tons of marketable pulpwood and 2.1 million tons of marketable sawlogs on such acreage. Our ability to operate the remaining acreage is limited by geographical restrictions, (e.g. lakes and wetlands that do not yield enough timber to make it cost effective to operate in those areas, land set aside for mitigation banks and certain regulatory restrictions). Based on our annual harvest plan, we anticipated harvesting approximately 350,000 tons of pulpwood and sawlogs during 2016.
Our forestry segment may also sell our timber holdings, undeveloped land or land with limited development and easements. Some parcels include the benefits of limited development activity including improved roads, ponds and fencing. We have traditionally sold parcels of varying sizes ranging from less than one acre to thousands of acres. The pricing of these parcels varies significantly based on size, location, terrain, timber quality and other local factors.
5
Seasonality
Our businesses may be affected by seasonal fluctuations. For example, revenues from our resorts and leisure operations are typically higher in the second and third quarters; however, they can vary depending on the timing of holidays and school breaks, including spring break.
In addition to the seasonality effect described above, variability in our results of operations is further heightened by the change in our customer mix in our residential real estate business from some retail sales, which have a more consistent flow of revenues, to predominantly sales to homebuilders, who tend to buy multiple lots in sporadic transactions. Our commercial real estate projects are likewise subject to one-off sales and the development of specific projects depending on demand.
These variables have caused, and may continue to cause, our operating results to vary significantly from period to period. See “Item 1A—Risk Factors—Risks Related to Our Current Business—Our results of operations may vary significantly from period to period which could adversely impact our stock price, results of operations, cash flows and financial condition.”
Competition
The real estate development and leasing businesses are highly competitive and fragmented. We compete with other local, regional and national real estate companies, some of which may have greater financial, marketing, sales and other resources than we do.
A number of highly competitive companies participate in the vacation rental industry. Our ability to remain competitive and to attract and retain vacation rental owners and memberships depends on our success in distinguishing the quality and value of our products and services from those offered by others. We compete based on location, price and amenities.
In our forestry business, we compete with numerous public and privately held timber companies in our region. The principal method of competition is price and delivery.
6
Governmental Regulation
Our operations are subject to federal, state and local environmental laws and regulations, including laws relating to water, air, solid waste and hazardous substances and the requirements of the Federal Occupational Safety and Health Act and comparable state statutes relating to the health and safety of our employees. Although we believe that we are in material compliance with these requirements, there can be no assurance that we will not incur significant costs, civil and criminal penalties, and liabilities, including those relating to claims for damages to property or natural resources, resulting from our operations. We maintain environmental and safety compliance programs and conduct audits of our facilities and timberlands to monitor compliance with these laws and regulations. Enactment of new environmental laws or regulations, or changes in existing laws or regulations or the interpretation of these laws or regulations, might require significant expenditures.
Employees
As of February 26, 2016, we had 55 full-time employees. Most persons employed in the day-to-day operations of our resorts and leisure operations are employed by a third party management company engaged pursuant to a consulting and employment services agreement. In addition, we utilize part-time employees and independent contractors during the year based on seasonal needs.
Available Information
Our most recent Annual Report on Form 10-K, Quarterly Reports on Form 10-Q, Current Reports on Form 8-K, and amendments to those reports may be viewed or downloaded electronically, free of charge, from our website:
http://www.joe.com as soon as reasonably practicable after we electronically file such material with, or furnish it to, the Securities and Exchange Commission (“SEC”). In addition, you may read and copy any materials we file with the SEC at the SEC’s Public Reference Room at 100 F Street, NE, Washington, DC 20549. To obtain information on the operation of the Public Reference room, you may call the SEC at 1-800-SEC-0330. Our recent press releases are also available to be viewed or downloaded electronically at http://www.joe.com.
We will also provide electronic copies of our SEC filings free of charge upon request. Any information posted on or linked from our website is not incorporated by reference into this Annual Report on Form 10-K. The SEC also maintains a website at http://www.sec.gov, which contains reports, proxy and information statements and other information regarding issuers that file electronically with the SEC.
7
Item 1A.
Risk Factors
You should carefully consider the risks described below, together with all of the other information in this Annual Report on Form 10-K. The risks described below are not the only risks facing us. Additional risks and uncertainties not currently known to us, or that we currently deem to be immaterial, may also materially and adversely affect our business. If any of these risks actually occur, our business, financial condition, results of operations, cash flows, strategies and prospects could be materially adversely affected.
Risks Related to Our Current Business Strategy
We may not be able to successfully implement our business strategy, which would adversely affect our financial condition, results of operations, cash flows and financial performance.
Following the AgReserves Sale and RiverTown Sale that were completed in 2014, our cash and available-for-sale securities comprise over forty percent of the carrying value of our assets, while our assets related to our existing investments in real estate only comprise about thirty percent of the carrying value of our assets. Our future financial performance and success are therefore heavily dependent on our ability to implement our business strategy successfully.
Our current business strategy envisions several initiatives, including investing in new real estate and real estate related opportunities, such as the development of our mixed-use and active adult communities, developing new commercial and industrial uses for our land portfolio, entering into strategic alliances, investing in businesses related to our real estate development, management, and operating activities, investing in available-for-sale securities or longer term investments in real estate investment trusts and other investments in illiquid securities and continuing to efficiently contribute to our bottom line performance. We may not be able to successfully implement our business strategy or achieve the benefits of our business plan. If we are not successful in achieving our objectives, our business, results of operations, cash flows and financial condition could be negatively affected.
Management has discretion as to the investments we make and may not use these funds effectively.
We plan to continue to invest in available-for-sale securities or longer term investments in real estate investment trusts and other investments in illiquid securities until we can find what we believe to be other advantageous opportunities for these funds. Our management has discretion in the selection of these investments and could make investments that do not improve our results of operations, cash flows and financial condition or enhance the value of our common stock or which results in financial losses that could have a material adverse effect on our business, results of operations, cash flows and financial condition and stock price. Additionally, longer term investments, such as real estate investment trusts and other investments in illiquid securities are inherently riskier investments and could result in us losing some or all of our investment as well as not being able to liquidate our position when we would otherwise wish to do so.
Our investment in new business opportunities is inherently risky, and could disrupt our ongoing businesses and adversely affect our operations.
We have invested and expect to continue to invest in new business opportunities, such as the development of our mixed-use and active adult communities and the expansion of port related opportunities at the Port of Port St. Joe. Such endeavors may involve significant risks and uncertainties, including distraction of management from current operations, insufficient revenues to offset liabilities assumed and expenses associated with these new investments including development costs, inadequate return of capital on our investments, and unidentified issues not discovered in our due diligence of such opportunities. Because these ventures are inherently risky, no assurance can be given that such strategies and offerings will be successful and will not adversely affect our reputation, financial condition, and operating results.
8
We intend to invest our assets in ways such that we will not have to register as an investment company under the Investment Company Act of 1940. As a result, we may be unable to make some potentially profitable investments.
We are not registered as an “investment company” under the Investment Company Act of 1940 (the “Investment Company Act”) and we intend to invest our assets in such a manner so that we are not required to register as an investment company. This will require monitoring our portfolio so that (a) we will not have more than 40% percent of total assets (excluding U.S. government securities and cash items) in investment securities or (b) we will meet and maintain another exemption from registration. As a result, we may be (1) unable to make some potentially profitable investments, (2) unable to sell assets we would otherwise want to sell or (3) forced to sell investments in investment securities before we would otherwise want to do so.
If The Fairholme Funds or Fairholme Capital Management, L.L.C. controls us within the meaning of the Investment Company Act of 1940, we may be unable to engage in transactions with potential strategic partners, which could adversely affect our business.
The Fairholme Fund (“Fairholme”) (a series of Fairholme Funds, Inc., an investment company registered under the Investment Company Act) has the right to vote as of December 31, 2015 approximately 30.7% of our outstanding common stock. Fairholme Capital Management, L.L.C. (“Fairholme Capital”), which controls Fairholme, is the investment adviser of accounts that in the aggregate own, as of December 31, 2015, an additional 1.8% of our common stock. Bruce R. Berkowitz, the Managing Member of Fairholme Capital, and the President of Fairholme Funds, Inc., is the Chairman of our Board of Directors. Under the Investment Company Act, “control” means the power to exercise a controlling influence over the management or policies of a company, unless such power is solely the result of an official position with such company. Any person who owns beneficially, either directly or through one or more controlled companies, more than 25% of the outstanding voting securities of a company is presumed to control such company. The SEC has considered factors other than ownership of voting securities in determining control, including an official position with the company when such was obtained as a result of the influence over the company. Accordingly, even if Fairholme’s beneficial ownership in us is below 25% of our outstanding voting securities, Fairholme may nevertheless be deemed to control us. The Investment Company Act generally prohibits a company controlled by an investment company from engaging in certain transactions with any affiliate of the investment company or affiliates of the affiliate, subject to limited exceptions. An affiliate of an investment company is defined in the Investment Company Act as, among other things, any company 5% or more of whose outstanding voting securities are directly or indirectly owned, controlled, or held with power to vote, by the investment company, a company directly or indirectly controlling, controlled by, or under common control with, the investment company or a company directly or indirectly owning, controlling, or holding with power to vote, 5% or more of the outstanding voting securities of the investment company.
We believe that Fairholme is currently affiliated with a number of entities, including MRC Global, Inc., Imperial Metals Corp., NOW, Inc., Sears Holdings Corp., Seritage Growth Properties, Sears Canada, Inc., and Lands’ End, Inc. Due to these affiliations, should Fairholme be deemed to control us, we may be prohibited from engaging in certain transactions with these entities and certain of their affiliates and any future affiliates of Fairholme, unless one of the limited exceptions applies. This could adversely affect our ability to enter into transactions freely and compete in the marketplace. In addition, significant penalties and other consequences may arise as a result of a violation for companies found to be in violation of the Investment Company Act.
9
Returns on our investments may be limited by our investment guidelines and restrictions.
In 2013, we established investment guidelines and restrictions approved by the Investment Committee of our Board of Directors pursuant to the terms of the Investment Agreement with Fairholme Capital, as amended. The investment guidelines require that, as of the date of any investment: (i) at least 50% of the investment account be held in cash or cash equivalents, (ii) no more than 15% of the investment account may be invested in securities of any one issuer (excluding the U.S. Government), (iii) any investment in any one issuer (excluding the U.S. Government) that exceeds 10%, but not 15%, requires the consent of at least two members of the Investment Committee, and (iv) the investment account may not be invested in common stock securities. These limitations may restrict our ability to make certain investments and may negatively impact the return that we could otherwise receive from our investment account. This could adversely affect our cash flows and results of operations.
Our future growth is dependent on transactions with strategic partners. We may not be able to successfully (1) attract desirable strategic partners; (2) complete agreements with strategic partners; and/or (3) manage relationships with strategic partners going forward, any of which could adversely affect our business.
We may seek strategic partnerships to develop mixed-use and active adult communities, capitalize on the potential of our commercial and industrial opportunities and maximize the value of our assets. These strategic partnerships may bring development experience, industry expertise, financial resources, financing capabilities, brand recognition and credibility or other competitive assets. We cannot assure, however, that we will have sufficient resources, experience and/or skills to locate desirable partners. We also may not be able to attract partners who want to conduct business in desirable geographic locations and who have the assets, reputation or other characteristics that would optimize our development and asset management opportunities.
Once a strategic partner has been identified, actually reaching an agreement on a transaction may be difficult to complete and may take a considerable amount of time considering that negotiations require careful balancing of the parties’ various objectives, assets, skills and interests. A formal partnership may also involve special risks such as:
|
•
|
our partner may take actions contrary to our instructions or requests, or contrary to our policies or objectives with respect to the real estate investments;
|
|
•
|
our partner could experience financial difficulties, become bankrupt or fail to fund their share of capital contributions, which may delay construction or development of property or increase our financial commitment to the strategic partnership;
|
|
•
|
we may disagree with our partner about decisions affecting the real estate investments or partnership, which could result in litigation or arbitration that increases our expenses, distracts our officers and directors and disrupts the day-to-day operations of the property, which may delay important decisions until the dispute is resolved; and
|
|
•
|
actions by our partner may subject property owned by the partnership to liabilities or have other adverse consequences.
|
A key complicating factor is that strategic partners may have economic or business interests or goals that are inconsistent with ours or that are influenced by factors unrelated to our business. These competing interests lead to the difficult challenges of successfully managing the relationship and communication between strategic partners and monitoring the execution of the partnership plan. We cannot assure that we will have sufficient resources, experience and/or skills to effectively manage our ongoing relationships with our strategic partners. We may also be subject to adverse business consequences if the market reputation of a strategic partner deteriorates. If we cannot successfully execute transactions with strategic partners, our business, results of operations, cash flows and financial condition could be adversely affected.
10
Losses in the fair value of our available-for-sale and held-to-maturity investments, and the concentration of our investment portfolio in any particular issuer, industry, group of related industries or geographic sector, could have an adverse impact on our results of operations, cash flows and financial condition.
As of December 31, 2015, we have investment accounts of $384.4 million which are managed by Fairholme Capital. Of this amount, $193.2 million is held in cash equivalents, $184.7 million is held in U.S. Treasury securities, $6.3 million is held in corporate debt securities and $0.2 million is held in preferred stock investments. The market value of these investments is subject to change from period to period. Our available-for-sale securities include corporate debt securities, and our preferred stock that are issued by one issuer who is a national retail chain that is non-investment grade. Furthermore, pursuant to our Investment Agreement with Fairholme Capital, our investment advisor, we could invest up to a total of fifteen percent of the investment account in any one issuer as of the date of purchase.
We have exposure to credit risk associated with our available-for-sale and held-to-maturity investments, which include U.S. Treasury securities, corporate debt securities, preferred stock investments and retained interest investments. These instruments are also subject to price fluctuations as a result of changes in the financial market’s assessment of issuer credit quality, increases in delinquency and default rates, changes in prevailing interest rates and other economic factors. A downgrade of the U.S. government’s credit rating could also decrease the value of our available-for-sale and held-to-maturity investments.
Losses in the fair value of our available-for-sale and held-to-maturity investments can negatively affect earnings if management determines that such securities are other-than-temporary impaired. The evaluation of other-than-temporary impairment is based on various factors, including the financial condition, business prospects, industry and creditworthiness of the issuer, severity and length of time the securities were in a loss position, our ability and intent to hold investments until unrealized losses are recovered or until maturity. If a decline in fair value is considered other-than-temporary, the carrying amount of the security is written down and the amount of the credit-related component is recognized in earnings. Based on these factors, the unrealized losses related to the Company's debt securities of
$1.1 million
were determined to be temporary at
December 31, 2015
.
Any losses in the fair value of our available-for-sale and held-to-maturity investments that are deemed to be other-than-temporary due to credit deterioration will result in us being required to record credit-related losses in our Consolidated Statements of Operations. Furthermore, as a result of the concentration of our corporate debt securities and preferred stock investments, the performance of our investments may be disproportionately affected by any adverse change in the financial condition of these issuers or the market value of any of the securities in our portfolio, which could have a material adverse effect on our results of operations, cash flows and financial condition.
We face risks associated with short-term liquid investments.
We continue to have significant cash balances that are invested in a variety of short-term investments that are intended to preserve principal value and maintain a high degree of liquidity while providing current income. From time to time, these investments may include (either directly or indirectly):
|
•
|
direct obligations issued by the U.S. Treasury;
|
|
•
|
obligations issued or guaranteed by the U.S. government or its agencies;
|
|
•
|
taxable municipal securities;
|
|
•
|
obligations (including certificates of deposit) of banks and thrifts;
|
|
•
|
commercial paper and other instruments consisting of short-term U.S. dollar denominated obligations issued by corporations and banks;
|
|
•
|
repurchase agreements collateralized by corporate and asset-backed obligations;
|
|
•
|
both registered and unregistered money market funds; and
|
|
•
|
other highly rated short-term securities.
|
Investments in these securities and funds are not insured against loss of principal. Under certain circumstances we may be required to redeem all or part of our investment, and our right to redeem some or all of our investment may be delayed or suspended. In addition, there is no guarantee that our investments in these securities or funds will be redeemable at par value. A decline in the value of our investment or a delay or suspension of our right to redeem may have a material adverse effect on our results of operations or financial condition.
11
Risks Related to our Current Business
Our results of operations may vary significantly from period to period which could adversely impact our stock price, results of operations, cash flows and financial condition.
Historically, we derived a substantial portion of our income from our forestry operations which had more of a consistent flow of revenues. However, following the 2014 AgReserves Sale, variability in our period to period results of operations and cash flows has become more apparent as income from our forestry operations has been reduced. In addition, our customer mix in our residential real estate business has changed from some retail sales, which have a more consistent flow of revenues, to the majority of sales to homebuilders who tend to buy multiple lots in sporadic transactions. Commercial real estate projects are likewise subject to one-off sales and the development of specific projects depending on demand.
Moreover, as it relates to all of our residential and commercial land-use entitlements in hand or in process, we seek higher and better uses for our assets through a range of activities from strategic land planning and development, infrastructure improvements and promoting economic development in the regions where we operate; and therefore may explore the sale of assets opportunistically or when we believe they have reached their highest and best use. As a consequence, there may be reporting periods in which we have no, or significantly less, revenues from residential or commercial real estate sales.
Furthermore, our resorts and leisure operations are affected by seasonal fluctuations. Revenues from our resorts and leisure operations are typically higher in the second and third quarters; however, they can vary depending on the timing of holidays and school breaks, including spring break.
These variables have caused, and may continue to cause, our operating results to vary significantly from period to period which could have an adverse impact on our stock price, cash flows, results of operations and financial condition.
Our business is subject to extensive regulation and growth management initiatives that may restrict, make more costly or otherwise adversely impact our ability to develop our real estate investments or otherwise conduct our operations.
A large part of our business strategy is dependent on our ability to develop and manage real estate in Northwest Florida, including opportunities in the mixed-use and active adult communities and expanding the Port of Port St. Joe operations. Approval to develop real property in Florida entails an extensive entitlements process involving multiple and overlapping regulatory jurisdictions and often requiring discretionary action by local government. This process is often political, uncertain and may require significant exactions in order to secure approvals. Real estate projects in Florida must generally comply with the provisions of the Local Government Comprehensive Planning and Land Development Regulation Act (the “Growth Management Act”) and local land development regulations. In addition, development projects that exceed certain specified regulatory thresholds require approval of a comprehensive Development of Regional Impact, or DRI, application. Compliance with the Growth Management Act, local land development regulations and the DRI process is usually lengthy and costly and can be expected to materially affect our real estate development activities.
The Growth Management Act requires local governments to adopt comprehensive plans guiding and controlling future real property development in their respective jurisdictions and to evaluate, assess and keep those plans current. Included in all comprehensive plans is a future land use map which sets forth allowable land use development rights. Some of our land has an “agricultural” or “silviculture” future land use designation, and we are required to seek an amendment to the future land use map to develop residential, commercial and mixed-use projects. Approval of these comprehensive plan map amendments is highly discretionary.
All development orders and permits must be consistent with the comprehensive plan. Each plan must address such topics as future land use and capital improvements and make adequate provision for a multitude of public services including transportation, schools, solid waste disposal, sanitation, sewerage, potable water supply, drainage, affordable housing, open space, parks and others. The local governments’ comprehensive plans must also establish “levels of service” with respect to certain specified public facilities, including roads and schools, and services to residents. In many areas, infrastructure funding has not kept pace with growth, causing facilities to operate below established levels of service. Local governments are prohibited from issuing development orders or permits if the development will reduce the level of service for public facilities below the level of service established in the local government’s comprehensive plan, unless the developer either sufficiently improves the services up front to meet the required level of service or provides financial assurances that the additional services will be provided as the project progresses. In addition, local governments that fail to keep their plans current may be prohibited by law from amending their plans to allow for new development.
12
If any one or more of these factors were to occur, we may be unable to develop our primary or resort communities or the mixed-use and active adult communities successfully or within the expected timeframes. Changes in the Growth Management Act or the DRI review process or the interpretation thereof, new enforcement of these laws or the enactment of new laws regarding the development of real property could lead to a decline in our ability to develop and market our communities successfully and to generate positive cash flow from these operations in a timely manner which could have a materially adverse affect our ability to service our demand and negatively impact our business, results of operations, cash flows or financial condition.
Our existing real estate investments are concentrated in Northwest Florida; therefore our long-term financial results are largely dependent on the economic growth of Northwest Florida.
The economic growth of Northwest Florida, where most of our land is located, is an important factor in creating demand for our products and services. Our principal sources of revenue are (1) sales of lots or entitled land to homebuilders and others in connection with residential housing developments, (2) sales and leasing of commercial real estate, (3) revenues generated through our hotel and other leasing activities that are principally tourism related and (4) future revenue from the Port of Port St. Joe operations and our planned mixed-use and active adult communities. Consequently, demand for our products largely depends on the growth of the local economy.
We believe that the future economic growth of Northwest Florida will largely depend on the ability and willingness of state and local governments, in combination with the private sector, (1) to plan and complete significant infrastructure improvements in the region, such as new transportation hubs, roads, rail, pipeline, medical facilities and schools and (2) to attract companies offering high-quality, high salary jobs to large numbers of new employees. If new businesses and new employees in Northwest Florida do not grow as anticipated, demand for residential and commercial real estate and demand to expand the Port of Port St. Joe will not meet our expectations and our future growth will be adversely affected.
Changes in the demographics affecting projected population growth in Florida, particularly Northwest Florida, including a decrease in the migration of Baby Boomers, could adversely affect our business.
Florida has experienced strong population growth in the past few decades, particularly during the real estate boom in the first half of the last decade. However, a decline in the rate of migration into Florida could occur due to a number of factors affecting Florida, including weak economic conditions, restrictive credit, the occurrence of hurricanes and increased costs of living.
The success of our primary communities and planned mixed-use and active adult communities will be dependent on strong migration and population expansion in our regions of development, primarily Northwest Florida. We also believe that Baby Boomers seeking retirement or vacation homes in Florida will remain important target customers for our real estate products in the future. Florida’s population growth could be negatively affected in the future by factors such as adverse economic conditions, the occurrence of natural or manmade disasters and the high cost of real estate, insurance and property taxes. Furthermore, those persons considering moving to Florida may not view Northwest Florida as an attractive place to live or own a second home and may choose to live in another region of the state. In addition, as an alternative to Florida, other states such as Georgia, North and South Carolina and Tennessee are increasingly becoming retirement destinations and are attracting retiring Baby Boomers and the workforce population who may have otherwise considered moving to Florida. If Florida, especially Northwest Florida, experiences an extended period of slow growth, or even net out-migration, our business, results of operations, cash flows and financial condition would suffer.
13
We have significant operations and properties in Florida that could be materially and adversely affected by natural disasters, manmade disasters, severe weather conditions or other significant disruptions.
Our corporate headquarters and our properties are located in Florida, where major hurricanes have occurred. Because of its location between the Gulf of Mexico and the Atlantic Ocean, Florida is particularly susceptible to the occurrence of hurricanes. Depending on where any particular hurricane makes landfall, our developments in Florida, especially our coastal properties in Northwest Florida, could experience significant, if not catastrophic, damage. Such damage could materially delay sales or lessen demand for our residential or commercial real estate in affected communities and lessen demand for our resorts and leisure operations and leasing operations, such as by disrupting our resort and vacation rental business if there are extensive repairs to the facilities or by lessening demand as a vacation destination. If our corporate headquarters facility is damaged or destroyed, we may have difficulty performing certain corporate and operational functions.
In addition to hurricanes, the occurrence of other natural disasters and climate conditions in Florida, such as tornadoes, floods, fires, unusually heavy or prolonged rain, droughts and heat waves, could have a material adverse effect on our ability to develop and sell properties or realize income from our projects. The occurrence of these natural disasters could also have a material adverse effect on our forestry business, if timber inventory is destroyed. Furthermore, an increase in sea levels due to long-term global warming could have a material adverse effect on our coastal properties and forestry business. The occurrence of natural disasters and the threat of adverse climate changes could also have a long-term negative effect on the attractiveness of Florida as a location for resort, seasonal and/or primary residences and as a location for new employers that can create high-quality jobs needed to spur growth in Northwest Florida.
Additionally, we are susceptible to manmade disasters or disruptions, such as oil spills like the Deepwater Horizon oil spill, acts of terrorism, power outages and communications failures. If a hurricane, natural disaster, manmade disaster or other significant disruption occurs, we may experience disruptions to our operations and properties, which could have a material adverse effect on our business, results of operations, cash flows and financial condition.
Our insurance coverage on our properties may be inadequate to cover any losses we may incur.
We maintain insurance on our property, including property, liability, fire, flood and extended coverage. However, we do not insure our timber assets and we self-insure home warranty claims. Additionally, our insurance for hurricanes is capped at $50 million per named storm and is subject to deductibles. We use our discretion when determining amounts, coverage limits and deductibles for insurance. These terms are determined based on retaining an acceptable level of risk at a reasonable cost. This may result in insurance coverage that in the event of a substantial loss would not be sufficient to pay the full current market value or current replacement cost of our lost investment. Inflation, changes in building codes and ordinances, environmental considerations and other factors also may make it unfeasible to use insurance proceeds to replace a facility after it has been damaged or destroyed. Under such circumstances, we may not receive insurance proceeds or the insurance proceeds we receive may not fully cover business interruptions or losses and our earnings, liquidity, or capital resources could be adversely affected.
Increases in property insurance premiums and decreases in availability of homeowner property insurance in Florida could reduce customer demand for homes and homesites in our developments.
Homeowner property insurance companies doing business in Florida have reacted to previous hurricanes by increasing premiums, requiring higher deductibles, reducing limits, restricting coverage, imposing exclusions, refusing to insure certain property owners, and in some instances, ceasing insurance operations in the state. It is uncertain what effect these actions may have on property insurance availability and rates in the state.
14
Furthermore, Florida’s state-owned property insurance company, Citizens Property Insurance Corp., underwrites homeowner property insurance. If there were to be a catastrophic hurricane or series of hurricanes to hit Florida, the exposure of the state government to property insurance claims could place extreme stress on state finances.
The high costs of property insurance premiums in Florida could deter potential customers from purchasing a homesite in one of our developments or make Northwest Florida less attractive to new employers that can create high quality jobs needed to spur growth in the region, either of which could have a material adverse effect on our business, results of operations, cash flows and financial condition.
A decline in consumers’ discretionary spending or a change in consumer preferences could reduce our sales and harm our business.
Our real estate and resorts and leisure businesses’ sales ultimately depend on consumer discretionary spending, which is influenced by factors beyond our control, including general economic conditions, the availability of discretionary income and credit, weather, consumer confidence and unemployment levels. Any material decline in the amount of consumer discretionary spending could reduce our sales and harm our business. These economic and market conditions, combined with continuing difficulties in the credit markets and the resulting pressures on liquidity, may also place a number of our key customers under financial stress, which could adversely affect our occupancy rates and our profitability, which could have a material adverse effect on our business, results of operations, cash flows and financial condition.
Downturns of the real estate market in Northwest Florida could adversely affect our operations.
Demand for real estate is sensitive to changes in economic conditions such as the level of employment, consumer confidence, consumer income, the availability of financing and interest rate levels, over which we have no control. In addition, the real estate market is subject to downturns, and our business is especially sensitive to economic conditions in Northwest Florida, where many of our developments are located, and the Southeast region of the United States, which in the past has produced a high percentage of customers for the resort and seasonal products in our Northwest Florida communities. Unemployment, lack of consumer confidence and other adverse consequences of the previous economic recession continue to affect the economies of these regions. If market conditions do not continue to improve as anticipated or were to worsen, the demand for our real estate products could decline, negatively impacting our business, results of operations, cash flows and financial condition.
Mortgage financing issues, including lack of supply of mortgage loans, tightened lending requirements and possible future increases in interest rates, could reduce demand for our products.
Many purchasers of our real estate products obtain mortgage loans to finance a substantial portion of the purchase price, or they may need to obtain mortgage loans to finance the construction costs of homes to be built on homesites purchased from us. Also, our homebuilder customers depend on retail purchasers who rely on mortgage financing. Many mortgage lenders and investors in mortgage loans experienced severe financial difficulties arising from losses incurred on sub-prime and other loans originated before the downturn in the real estate market. As a result, the mortgage industry remains under scrutiny and continues to face the challenges of increased regulation at federal, state, and local levels. Because of these challenges, the supply of mortgage products has been constrained, and the eligibility requirements for borrowers have been tightened. Constraints on the mortgage lending industry could adversely affect potential purchasers of our products, including our homebuilder customers, thus having a negative effect on demand in our communities.
While interest rates for home mortgage loans have generally remained low, mortgage interest rates could increase in the future which could adversely affect the demand for residential real estate. In addition to residential real estate, increased interest rates and restrictions in the availability of credit could also negatively impact sales of our commercial properties or other land we offer for sale. If interest rates increase and the ability or willingness of prospective buyers to finance real estate purchases is adversely affected, our sales, results of operations, cash flows and financial condition may be negatively affected.
15
Tax law changes could make home ownership more expensive or less attractive.
Historically, significant expenses of owning a home, including mortgage interest expense and real estate taxes, generally have been deductible expenses for the purpose of calculating an individual’s federal, and in some cases state, taxable income as itemized deductions. The Federal government has been considering eliminating some deductions, or limiting the tax benefit of deductions, with regard to people with incomes above specified levels. Changes in tax laws could increase the after-tax cost of owning a home, which is likely to adversely impact the demand for homes and could reduce the prices for which we can sell homesites, particularly in higher priced communities.
Significant competition could have an adverse effect on our business.
The real estate development business is highly competitive and fragmented. We compete with other local, regional and national real estate companies, some of which may have greater financial, marketing, sales and other resources than we do. Competition from other real estate developers may adversely affect our ability to attract purchasers and sell residential and commercial real estate and attract and retain experienced real estate development personnel.
A number of highly competitive companies participate in the vacation rental industry. In 2014, we launched St. Joe Club & Resorts, a private membership club that provides access to a diverse offering of benefits and privileges at certain of our owned and operated resort facilities. In addition, certain facilities are
private clubs and only members and registered guests of St. Joe Club & Resorts are eligible to access.
Our ability to remain competitive and to attract and retain vacation rental owners and memberships depends on our success in distinguishing the quality and value of our products and services from those offered by others.
In addition, the forestry business is highly competitive in terms of price and quality. Wood products are subject to increasing competition from a variety of substitute products, including non-wood and engineered wood products. There can be no assurance we will be able to compete successfully against current or future competitors or that competitive pressures we face in the markets in which we operate will not have a material adverse affect on our business, results of operations, cash flows and financial condition.
We are dependent upon homebuilders as customers, but our ability to attract homebuilder customers and their ability or willingness to satisfy their purchase commitments may be uncertain.
We are highly dependent upon our relationships with homebuilders to be the primary customers for our homesites and to provide construction services in our residential developments. The homebuilder customers that have already committed to purchase homesites from us could decide to reduce, delay or cancel their existing commitments to purchase homesites in our developments. From time to time we finance real estate sales with mortgage note receivables. If these homebuilders fail to pay their debts to us or delay paying us, it would reduce our anticipated cash flows. Homebuilders also may not view our developments as desirable locations for homebuilding operations, or they may choose to purchase land from other sellers. Any of these events could have an adverse effect on our business, results of operations, cash flows and financial condition.
16
We are exposed to risks associated with real estate development that could adversely impact our results of operations, cash flows and financial condition.
Our real estate development activities entail risks that could adversely impact our results of operations, cash flows and financial condition, including:
|
•
|
construction delays or cost overruns, which may increase project development costs;
|
|
•
|
claims for construction defects after property has been developed, including claims by purchasers and property owners’ associations;
|
|
•
|
an inability to obtain required governmental permits and authorizations;
|
|
•
|
an inability to secure tenants necessary to support commercial projects; and
|
|
•
|
compliance with building codes and other local regulations.
|
Our commercial leasing projects may not yield anticipated returns, which could harm our operating results, reduce cash flow, or the ability to sell commercial assets.
A component of our business strategy is the development and management of commercial properties and assets for sale. These developments may not be as successful as expected due to the commercial leasing related risks, including the risk that we may not be able to lease new properties to an appropriate mix of tenants or lease rates that are consistent with our projections, as well as the risks generally associated with real estate development. Additionally, development of commercial projects involves the risk associated with the significant time lag between commencement and completion of the project. This time lag subjects us to greater risks relating to fluctuations in the general economy, our ability to obtain construction or permanent financing on favorable terms, if at all, our ability to achieve projected rental rates, the pace that we will be able to lease to new tenants, higher than estimated construction costs (including labor and material costs), and delays in the completion of projects because of, among other factors, inclement weather, labor disruptions, construction delays or delays in receiving zoning or other regulatory approvals, or man-made or natural disasters. If any one of these factors negatively impacts our commercial leasing projects we may not yield anticipated returns, which could have a material adverse effect on our operating results, cash flows and ability to sell commercial assets.
We face potential adverse effects from commercial tenant bankruptcies.
A component of our business strategy is the development and leasing of commercial properties. The bankruptcy of a major tenant may adversely affect the income produced by our commercial properties. If one or more of our tenants, particularly an anchor tenant, declares bankruptcy or voluntarily vacates from the leased premises, we may be unable to re-lease such space or to re-lease it on comparable or more favorable terms. Additionally, the bankruptcy of an anchor tenant may make it more difficult to lease the remainder of the affected properties, which could have a material adverse effect on our results of operations, cash flows and financial condition. This could adversely affect our properties and growth.
We guarantee debt for our Pier Park North joint venture, and may in the future enter into similar agreements, which may have a material adverse effect on our results of operations, cash flows and financial condition.
We have agreed to provide a limited guarantee in connection with our Pier Park North joint venture, and may in the future agree to similar agreements. In October 2015, the Pier Park North joint venture refinanced its construction loan and entered into a $48.2 million loan (the “Refinanced Loan”) that matures in November 2025. Pursuant to the Refinanced Loan, we have provided a limited guarantee in favor of the lender that covers losses arising as a result of: (i) tenant security deposits; (ii) tenant rents; (iii) costs and expenses related to any environmental clean-up; (iv) liability for fraud or material breach of warranty with respect to the financing; (v) unpaid real estate taxes assessed against the property; (vi) failure to maintain required insurance; (vii) foreclosure of the security instrument; or (viii) failure of the joint venture to comply with certain covenants in the agreement. In addition, the guarantee can become full recourse in the case of any fraud or intentional misrepresentation by the joint venture; any voluntary transfer or encumbrance of the property in violation of the due-on-sale clause in the security instrument; upon commencement of voluntary or insolvency proceedings; and upon breach of covenants in the security instrument. If we were to become obligated to perform on the guarantee, it could have a material adverse effect on our results of operations, cash flows and financial condition.
17
Environmental and other regulations may have an adverse effect on our business.
Our properties are subject to federal, state and local environmental regulations and restrictions that may impose significant limitations on our development ability. In most cases, approval to develop requires multiple permits which involve a long, uncertain and costly regulatory process. Our land holdings contain jurisdictional wetlands, some of which may be unsuitable for development or prohibited from development by law. Development approval most often requires mitigation for impacts to wetlands that require land to be conserved at a disproportionate ratio versus the actual wetlands impacted and approved for development. Some of our property is undeveloped land located in areas where development may have to avoid, minimize or mitigate for impacts to the natural habitats of various protected wildlife or plant species. Additionally, much of our property is in coastal areas that usually have a more restrictive permitting burden or must address issues such as coastal high hazard, hurricane evacuation, floodplains and dune protection.
In addition, our current or past ownership, operation and leasing of real property, and our current or past transportation and other operations, are subject to extensive and evolving federal, state and local environmental laws and other regulations. The provisions and enforcement of these environmental laws and regulations may become more stringent in the future. Violations of these laws and regulations can result in:
|
•
|
civil penalties;
|
|
•
|
remediation expenses;
|
|
•
|
natural resource damages;
|
|
•
|
personal injury damages;
|
|
•
|
potential injunctions;
|
|
•
|
cease and desist orders; and
|
|
•
|
criminal penalties.
|
In addition, some of these environmental laws impose strict liability, which means that we may be held liable for any environmental damage on our property regardless of fault.
Some of our past and present real property, particularly properties used in connection with our previous transportation and papermill operations, were involved in the storage, use or disposal of hazardous substances that have contaminated and may in the future contaminate the environment. We may bear liability for this contamination and for the costs of cleaning up a site at which we have disposed of, or to which we have transported, hazardous substances. The presence of hazardous substances on a property may also adversely affect our ability to sell or develop the property or to borrow funds using the property as collateral.
Changes in laws or the interpretation thereof, new enforcement of laws, the identification of new facts or the failure of other parties to perform remediation at our current or former facilities could lead to new or greater liabilities that could materially adversely affect our business, results of operations, cash flows or financial condition.
From time to time, we may be subject to periodic litigation and other regulatory proceedings which could impair our financial results of operations.
From time to time, we may be involved in lawsuits and regulatory actions relating to our business, our operations and our position as an owner and operator of real estate. An adverse outcome in any of these transactions could adversely affect our financial condition, our results of operations or impose additional restrictions or limitations on us. In addition, regardless of the outcome of any litigation or regulatory proceedings, these proceedings could result in substantial costs and may require that we devote substantial resources to defend our Company. For example, on October 27, 2015, we fully resolved an SEC investigation regarding our policies and practices concerning impairment of investment in real estate assets principally as reflected in our financial results for 2010, 2009 and prior periods. The settlement and all allegations relate to actions taken prior to the 2011 replacement of the Board of Directors, the Chief Executive Officer and the Chief Financial Officer. None of the SEC's allegations, findings, sanctions, remedies or orders relate to any of our current directors or controlling shareholders. Without admitting or denying any factual allegations, we consented to the SEC’s issuance of an administrative order, and as a result, we became an “ineligible issuer” under Rule 405 of the Securities Act. Pursuant to the order, we agreed to pay penalties, disgorgements and interest of approximately $3.5 million. In connection with the SEC investigation we also incurred significant legal expenses and devoted substantial management resources to its resolution. If we were to become subject to other litigation or regulatory proceedings in the future, it could impair our financial results of operations.
18
Limitations on the access to the airport runway at the new Northwest Florida Beaches International Airport may have an adverse effect on the demand for our Bay-Walton Sector Plan lands adjacent to the airport.
Our land donation agreement with the airport authority and the deed for the airport land provide access rights to the airport runway from our adjacent lands. We subsequently entered into an access agreement with the airport authority that provides access to the airport runway. Under the terms of the access agreement, we are subject to certain requirements of the airport authority, including but not limited to the laws administered by the Federal Aviation Administration (the “FAA”), the Florida Department of Environmental Protection, the U.S. Army Corps of Engineers, and Bay County. Should security measures at airports become more restrictive in the future due to circumstances beyond our control, FAA regulations governing these access rights may impose additional limitations that could significantly impair or restrict access rights.
In addition, we are required to obtain environmental permits from the U.S. Army Corps of Engineers and Florida’s Department of Environmental Protection in order to develop the land necessary for access from our planned areas of commercial development to the airport runway. Such permits are often subject to a lengthy approval process, and there can be no assurance that such permits will be issued, or that they will be issued in a timely manner.
We believe that runway access is a valuable attribute of some of our Bay-Walton Sector Plan lands adjacent to the airport, and the failure to maintain such access, or the imposition of significant restrictions on such access, could adversely affect the demand for such lands and our business, results of operations, cash flows and financial condition.
Weather and other natural conditions and regulatory requirements may limit our ability to sell timber, which could adversely affect our operations.
Weather conditions, timber growth cycles, access limitations (for example, restrictions on access to timberlands due to prolonged wet conditions) and regulatory requirements associated with the protection of wildlife and water resources may restrict our ability to sell timber. In addition, our timber is subject to damage by fire, insect infestation, disease, prolonged drought, flooding and other natural disasters. Changes in global climate conditions could intensify one or more of these factors. Although damage from such natural causes usually is localized and affects only a limited percentage of the timber, there can be no assurance that any damage affecting our timberlands will in fact be so limited. As is common in the forestry industry, we do not maintain insurance coverage with respect to damage to our timberlands. Our results of operations and cash flows may therefore be materially adversely affected if we are unable to sell our timber at adequate levels or if demand decreases due to an increase in our prices as a result of any of these factors.
We face risks associated with third-party service providers, which could negatively impact our profitability.
We enter into arrangements from time to time by which third-party service providers conduct day-to-day operations of our resorts and leisure operations. Failure of such service providers to adequately perform their contracted services could negatively impact our ability to retain customers. As a result, any such failure could negatively impact our results of operations, cash flows and financial condition.
Risks Related to Our Company or Common Stock
The market price of our common stock has been, and may continue to be, highly volatile.
The market price of our common stock on the New York Stock Exchange has been volatile in recent years. We may continue to experience significant volatility in the market price of our common stock. Numerous factors could have a significant effect on the price of our common stock, including:
•
announcements of fluctuations in our operating results;
•
other announcements concerning our Company or business, including acquisitions or litigation announcements;
•
changes in market conditions in Northwest Florida or the real estate or real estate development industry in general;
•
changes in recommendations or earnings estimates by securities analysts; and
•
less volume due to reduced shares outstanding.
In addition, the stock market has experienced significant price and volume fluctuations in recent years, which have sometimes been unrelated or disproportionate to operating performance. Volatility in the market price of our common stock could cause shareholders to lose some or all of their investment in our common stock.
19
The Fairholme Funds or Fairholme Capital has the ability to influence major corporate decisions.
Bruce R. Berkowitz, the Chairman of our Board of Directors, is the Managing Member of Fairholme Capital, and the President of Fairholme Funds, Inc. Fairholme Funds has the right to vote, as of December 31, 2015, approximately 30.7% of our outstanding common stock. Fairholme Capital is the investment adviser of accounts that in the aggregate owns, as of December 31, 2015, an additional 1.8% of our common stock. Accordingly, Fairholme Funds and Fairholme Capital are in a position to influence:
|
•
|
the vote of most matters submitted to our shareholders, including any merger, consolidation or sale of all or substantially all of our assets;
|
|
•
|
the nomination of individuals to our Board of Directors; and
|
|
•
|
a change in our control.
|
These factors may discourage, delay or prevent a takeover attempt that shareholders might consider in their best interests or that might result in shareholders receiving a premium for their common stock. Our articles of incorporation and certain provisions of Florida law contain anti-takeover provisions that may make it more difficult to effect a change in our control.
The loss of the services of our key management, personnel or our ability to recruit staff could adversely affect our business.
Our ability to successfully implement our business strategy will depend on our ability to attract and retain experienced and knowledgeable management and other professional staff. We cannot assure you that we will be successful in attracting and retaining key management personnel.
Changes in our income tax estimates could materially impact our results of operations, cash flows and financial condition.
In preparing our Consolidated Financial Statements, significant management judgment is required to estimate our income taxes. Our estimates are based on our interpretation of federal and state tax laws. We estimate our actual current tax due and assess temporary differences resulting from differing treatment of items for tax and accounting purposes. The temporary differences result in deferred tax assets and liabilities, which are included in our Consolidated Balance Sheets. Adjustments may be required by a change in assessment of our deferred tax assets and liabilities, changes due to audit adjustments by federal and state tax authorities, and changes in tax laws and rates. To the extent adjustments are required in any given period, we include the adjustments in the deferred tax assets and liabilities in our Consolidated Financial Statements. These adjustments could materially impact our results of operations, cash flows and financial condition.
We may not be able to utilize our net state operating loss carryforwards.
In prior years, we have suffered losses, for tax and financial statement purposes, which generated significant state net operating loss carryforwards. While we utilized a portion of our state net operating loss carryforwards as a result of the AgReserves Sale in 2014, we still have a significant amount of state net operating loss carryforwards. These may be used against future taxable income in future periods; however, we will not receive any tax benefits with regard to tax losses incurred except to the extent we have taxable income in the remaining net operating loss carryforward period. Based on the timing of reversals of our existing taxable temporary differences and our history of losses, management does not believe that the requirements to realize the benefits of certain of our deferred tax assets have been met; therefore, we have maintained a valuation allowance against a portion of our deferred tax assets in our Consolidated Financial Statements as of December 31, 2015. Unless we generate more income in the future than presently estimated, we will not be able to utilize all of our net state operating loss carryforwards.
We have had to take significant impairments of the carrying value of our investments in real estate and a decline in real estate values or continuing operating losses in our operating properties could result in additional impairments, which would have an adverse effect on our results of operations and financial condition.
Over the past five years, we have recorded impairment charges of $384.4 million related to real estate investments. We have approximately $313.6 million of real estate investments recorded on our books that may be subject to impairment. If market conditions were to deteriorate, our estimate of undiscounted future cash flows could fall below their carrying value and we could be required to take further impairments, which would have an adverse effect on our results of operations and financial condition.
20
Changes in accounting pronouncements could adversely affect our reported operating results, in addition to the reported financial performance of our tenants.
Accounting policies and methods are fundamental to how we record and report our financial condition and results of operations. Uncertainties posed by various initiatives of accounting standard-setting by the Financial Accounting Standards Board and the Securities and Exchange Commission, which create and interpret applicable accounting standards for U.S. companies, may change the financial accounting and reporting standards or their interpretation and application of these standards that govern the preparation of our financial statements. Proposed changes include, but are not limited to, changes in lease accounting and the adoption of accounting standards that establish the principles used to recognize revenue for all entities. These changes and others could have a material impact on our reported financial condition and results of operations. In some cases, we could be required to apply a new or revised standard retroactively, resulting in potentially material restatements of prior period financial statements.
Failure to maintain the integrity of internal or customer data could result in faulty business decisions, damage of reputation and/or subject us to costs, fines or lawsuits.
We face risks associated with security breaches or disruptions, whether through cyber-attacks or cyber intrusions over the Internet, malware, computer viruses, attachments to emails, persons inside our organization or persons with access to systems, and other significant disruptions of our networks and related systems. For a number of years, we have been increasing our reliance on computers and digital technology. While all of our businesses and our internal employment records require the collection of digital information, our resorts and leisure businesses, in particular, require the collection and retention of large volumes of internal and customer data, including credit card numbers and other personally identifiable information of our customers as such information is entered into, processed, summarized, and reported by the various information systems we use. All of these activities give rise to material cyber risks and potential costs and consequences that cannot be estimated or predicted with any certainty. The integrity and protection of our customer, employee and other company data, is critical to us. Although we make efforts to maintain the security and integrity of these networks and related systems, and we have implemented various measures to manage the risk of a security breach or disruption, there can be no assurance that our security efforts and measures will be effective or that attempted security breaches or disruptions would not be successful or damaging. Even the most well protected information, networks, systems and facilities remain potentially vulnerable because the techniques used in such attempted security breaches evolve and generally are not recognized until launched against a target, and in some cases are designed not be detected and, in fact, may not be detected. Accordingly, we and our service providers may be unable to anticipate these techniques or to implement adequate security barriers or other preventative measures, and thus it is impossible for us and our service providers to entirely mitigate this risk. Our failure to maintain the security of the data which we are required to protect, including via the penetration of our network security and the misappropriation of confidential and personal information, could result in business disruption, damage to our reputation, fines, penalties, regulatory proceedings, and other severe financial and business implications.
21
Item 1B.
Unresolved Staff Comments
None.
Item 2.
Properties
We own our principal executive offices located in WaterSound, Florida. As of
December 31, 2015
, we owned approximately 178,000 acres, the majority of which were located in Northwest Florida. Our raw land assets are managed by us as timberlands until designated for development. In addition, our resorts and leisure, and leasing segments include the following properties:
WaterColor Inn and Vacation Rentals.
We own the WaterColor Inn and Resort, which includes a boutique hotel, spa, restaurant, and retail and commercial space. We completed construction for the WaterColor Inn in 2002. In addition, we own multi-family units that are used primarily in our vacation rental business in our WaterSound Beach and WindMark Beach communities. We completed construction on these multi-family units during 2008 and 2009. We generally do not own the homes included in our vacation rental program and instead enter into a rental agreement with the homeowner.
Clubs and Resorts.
We own four golf courses in Northwest Florida. Three of them are in the Panama City Beach, Florida, area and the fourth is located in Tallahassee. The golf courses are situated in or near our residential communities. Our golf course property primarily includes the golf course land, clubhouses, other buildings and equipment. We also own and operate two marinas. Our marina property primarily includes land and improvements, marina slips and equipment.
Leasing.
We own the property included in our leasing operations business, which includes our retail and commercial leasing. Our retail leasing business principally arose in connection with the growth in our residential developments. We have several small retail shopping centers located in or very near to some of our residential projects, such as the WaterColor, WaterSound Beach, SouthWood and WindMark Beach communities. The success of these small retail centers is closely tied to the success of the residential developments from which they draw their customers.
Pier Park North.
In addition, our commercial leasing operations include our Pier Park North joint venture. Our Pier Park North joint venture includes a 330,000 square foot retail center in Panama City Beach, which we are developing with Casto, our joint venture partner and one of the country’s leading developers of neighborhood and community retail centers. We began to develop and construct the Pier Park North retail center in early 2013 and expect to complete construction in 2016. As of February 1, 2016, approximately 287,000 square feet of retail space was leased, which included key tenants such as Dick’s Sporting Goods, Fresh Market, World Market, Bed Bath & Beyond, Michaels, Pet Smart, Bealls Outlet Store and Ross Dress for Less.
VentureCrossings.
We built and own a 105,000 square foot building with manufacturing and office space in VentureCrossings and lease the facility to the Harris Corporation under a long-term lease that commenced in 2012.
For more information on our real estate assets, see “Item 1. Business” and “Schedule III (Consolidated) - Real Estate and Accumulated Depreciation” included in the Schedules to the Consolidated Financial Statements included in Item 15 of this Form 10-K for further information.
22
Item 3.
Legal Proceedings
We are subject to a variety of litigation, claims, other disputes and governmental proceedings that arise from time to time in the ordinary course of our business, none of which we believe will have a material adverse effect on our consolidated financial position, results of operations or liquidity.
In addition, we are subject to environmental laws and regulations, which include obligations to remove or limit the effects on the environment of the disposal or release of certain wastes or substances at various sites, including sites which have been previously sold. Refer to Note 21,
Commitments and Contingencies
, for further discussion.
Securities and Exchange Commission Investigation
On January 4, 2011 we received notice from the Staff of the SEC of the initiation of an inquiry into our policies and practices concerning impairment of investment in real estate assets and on June 24, 2011 the SEC issued to us a related order of private investigation. On January 20, 2015, we received a Wells Notice from the Staff related to historical accounting and disclosure practices and real estate asset valuations principally as reflected in our financial results for 2010, 2009 and prior periods. On February 20, 2015, we submitted to the Staff a Wells submission and subsequently engaged in discussions with the Staff concerning a settlement of its investigation, with which we cooperated.
On October 27, 2015, we fully resolved the SEC investigation and entered into a settlement with the SEC. Without admitting or denying any factual allegations, we consented to the SEC’s issuance of an administrative order pursuant to which we agreed to pay penalties, disgorgements and interest of approximately $3.5 million, including a civil penalty assessed on us of $2.75 million and other disgorgements and interest subject to indemnification by us. The settlement and all allegations relate to actions taken prior to the 2011 replacement of the Board of Directors, the Chief Executive Officer and the Chief Financial Officer. None of the SEC's allegations, findings, sanctions, remedies or orders relate to any of our current directors or controlling shareholders.
Item 4.
Mine Safety Disclosures
Not applicable.
|
Item 5.
|
Market for the Registrant’s Common Equity, Related Stockholder Matters and Issuer Purchases of Equity Securities
|
On
February 26, 2016
we had approximately 1,104 registered holders of record of our common stock. Our common stock is listed on the New York Stock Exchange (“NYSE”) under the symbol “JOE.”
The ranges of high and low prices for our common stock as reported on the NYSE are set forth below:
|
Common Stock Price
|
|||||||
|
|
High
|
Low
|
|||||
|
2015
|
|||||||
|
Fourth Quarter
|
$
|
21.45
|
|
$
|
17.95
|
|
|
|
Third Quarter
|
$
|
19.13
|
|
$
|
15.70
|
|
|
|
Second Quarter
|
$
|
19.03
|
|
$
|
15.07
|
|
|
|
First Quarter
|
$
|
18.56
|
|
$
|
16.16
|
|
|
|
2014
|
|||||||
|
Fourth Quarter
|
$
|
20.10
|
|
$
|
17.55
|
|
|
|
Third Quarter
|
$
|
26.21
|
|
$
|
19.93
|
|
|
|
Second Quarter
|
$
|
26.20
|
|
$
|
17.85
|
|
|
|
First Quarter
|
$
|
19.61
|
|
$
|
17.78
|
|
|
23
On
February 26, 2016
, the closing price of our common stock on the NYSE was $15.49. We did not pay cash dividends in
2015
or
2014
and retained future earnings to fund the development and growth of our business or other uses.
The following performance graph compares our cumulative shareholder returns for the period December 31, 2010, through
December 31, 2015
, assuming $100 was invested on December 31, 2010, in our common stock, in the Russell 3000 Index, and the below custom peer group of real estate related companies, which is composed of the following companies:
Alexander & Baldwin Inc (ALEX)
Consolidated Tomoka-Land Co. (CTO)
First Hartford Corp (FHRT)
Tejon Ranch Co. (TRC)
AV Homes Inc (AVHI)
Homefed Corp (HOFD)
The Howard Hughes Corp (HHC)
Maui Land & Pineapple Co Inc. (MLP)
Stratus Properties Inc (STRS)
The total returns shown assume that dividends are reinvested. The stock price performance shown below is not necessarily indicative of future price performance.
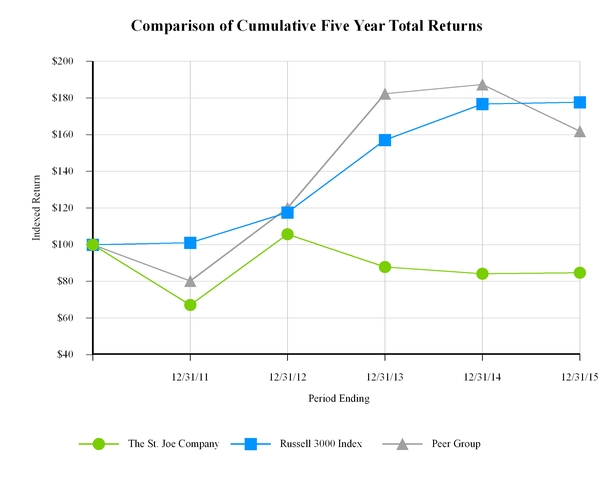
24
|
|
12/31/2010
|
12/31/2011
|
12/31/2012
|
12/31/2013
|
12/31/2014
|
12/31/2015
|
|||||||||||||||||
|
The St. Joe Company
|
$
|
100
|
|
$
|
67.09
|
|
$
|
105.63
|
|
$
|
87.83
|
|
$
|
84.16
|
|
$
|
84.71
|
|
|||||
|
Russell 3000 Index
|
$
|
100
|
|
$
|
101.03
|
|
$
|
117.61
|
|
$
|
157.07
|
|
$
|
176.79
|
|
$
|
177.64
|
|
|||||
|
Custom Real Estate Peer Group*
|
$
|
100
|
|
$
|
80.24
|
|
$
|
120.05
|
|
$
|
182.35
|
|
$
|
187.43
|
|
$
|
161.90
|
|
|||||
|
*
|
The total return for the Custom Real Estate Peer Group was calculated using an equal weighting for each of the stocks within the peer group.
|
Item 6.
Selected Financial Data
The following table sets forth our Selected Consolidated Financial Data on a historical basis for the five years ended
December 31, 2015
. This information should be read in conjunction with our consolidated financial statements (including the related notes thereto) and Management’s Discussion and Analysis of Financial Condition and Results of Operations, each included elsewhere in this Form 10-K. This historical Selected Consolidated Financial Data has been derived from our audited consolidated financial statements.
|
|
Year Ended December 31,
|
||||||||||||||||||
|
|
2015
|
2014
|
2013
|
2012
|
2011
|
||||||||||||||
|
|
In thousands, except per share amounts
|
||||||||||||||||||
|
Statement of Operations Data:
|
|||||||||||||||||||
|
Total revenues
(1)(2)
|
$
|
103,871
|
|
$
|
701,873
|
|
$
|
131,256
|
|
$
|
139,396
|
|
$
|
145,285
|
|
||||
|
Total cost of revenues
(3)(4)
|
67,094
|
|
136,798
|
|
86,913
|
|
91,276
|
|
71,472
|
|
|||||||||
|
Other operating and corporate expenses
|
33,426
|
|
26,128
|
|
27,855
|
|
30,326
|
|
50,037
|
|
|||||||||
|
Pension charges
|
—
|
|
13,529
|
|
1,500
|
|
2,999
|
|
5,871
|
|
|||||||||
|
Costs associated with special purpose entities
(5)
|
—
|
|
3,746
|
|
—
|
|
—
|
|
—
|
|
|||||||||
|
Depreciation, depletion and amortization
|
9,486
|
|
8,422
|
|
9,131
|
|
10,110
|
|
15,840
|
|
|||||||||
|
Impairment losses
|
—
|
|
—
|
|
5,080
|
|
2,551
|
|
377,325
|
|
|||||||||
|
Restructuring
|
—
|
|
—
|
|
—
|
|
—
|
|
11,547
|
|
|||||||||
|
Total expenses
|
110,006
|
|
188,623
|
|
130,479
|
|
137,262
|
|
532,092
|
|
|||||||||
|
Operating (loss) income
|
(6,135
|
)
|
513,250
|
|
777
|
|
2,134
|
|
(386,807
|
)
|
|||||||||
|
Other income
|
4,972
|
|
8,571
|
|
3,668
|
|
4,289
|
|
934
|
|
|||||||||
|
(Loss) income before equity in (loss) income from unconsolidated affiliates and income taxes
|
(1,163
|
)
|
521,821
|
|
4,445
|
|
6,423
|
|
(385,873
|
)
|
|||||||||
|
Equity in (loss) income from unconsolidated affiliates
|
—
|
|
(32
|
)
|
112
|
|
(46
|
)
|
(93
|
)
|
|||||||||
|
Income tax (expense) benefit
|
(808
|
)
|
(115,507
|
)
|
409
|
|
(387
|
)
|
55,658
|
|
|||||||||
|
Net (loss) income
|
(1,971
|
)
|
406,282
|
|
4,966
|
|
5,990
|
|
(330,308
|
)
|
|||||||||
|
Net loss attributable to non-controlling interest
|
240
|
|
171
|
|
24
|
|
22
|
|
29
|
|
|||||||||
|
Net (loss) income attributable to the Company
|
$
|
(1,731
|
)
|
$
|
406,453
|
|
$
|
4,990
|
|
$
|
6,012
|
|
$
|
(330,279
|
)
|
||||
|
|
|
|
|
||||||||||||||||
|
Per Share Data:
|
|||||||||||||||||||
|
Basic and Diluted
|
|||||||||||||||||||
|
Net (loss) income attributable to the Company
|
$
|
(0.02
|
)
|
$
|
4.40
|
|
$
|
0.05
|
|
$
|
0.07
|
|
$
|
(3.58
|
)
|
||||
|
(1)
|
Total revenues include revenues from real estate sales, timber sales, resorts and leisure revenues, and leasing revenues.
|
|
(2)
|
Total revenues in 2014 include $570.9 million from the AgReserves Sale and $43.6 million from the RiverTown Sale. Refer to Note 5,
Real Estate Sales
included in the Notes to the Consolidated Financial Statements included in Item 15 of this Form 10-K for further discussion.
|
|
(3)
|
Total cost of revenues includes cost of revenues from real estate sales, timber sales, resorts and leisure revenues, and leasing revenues.
|
|
(4)
|
Total cost of revenues in 2014 includes $58.4 million from the AgReserves Sale and $17.6 million from the RiverTown Sale. Refer to Note 5,
Real Estate Sales
included in the Notes to the Consolidated Financial Statements included in Item 15 of this Form 10-K for further discussion.
|
|
(5)
|
Refer to Note 5,
Real Estate Sales
included in the Notes to the Consolidated Financial Statements included in Item 15 of this Form 10-K for further discussion on our special purpose entities.
|
25
|
|
As of December 31,
|
||||||||||||||||||
|
|
2015
|
2014
|
2013
|
2012
|
2011
|
||||||||||||||
|
|
In thousands
|
||||||||||||||||||
|
Balance Sheet Data:
|
|||||||||||||||||||
|
Investment in real estate, net
|
$
|
313,599
|
|
$
|
321,812
|
|
$
|
385,009
|
|
$
|
370,647
|
|
$
|
387,202
|
|
||||
|
Cash and cash equivalents
|
$
|
212,773
|
|
$
|
34,515
|
|
$
|
21,894
|
|
$
|
165,980
|
|
$
|
162,391
|
|
||||
|
Investments
|
$
|
191,240
|
|
$
|
636,878
|
|
$
|
146,972
|
|
$
|
—
|
|
$
|
—
|
|
||||
|
Property and equipment, net
|
$
|
10,145
|
|
$
|
10,203
|
|
$
|
11,410
|
|
$
|
12,149
|
|
$
|
14,946
|
|
||||
|
Total assets
|
$
|
984,813
|
|
$
|
1,303,135
|
|
$
|
669,472
|
|
$
|
645,521
|
|
$
|
661,291
|
|
||||
|
Long-term debt
(1)
|
$
|
48,132
|
|
$
|
31,618
|
|
$
|
6,445
|
|
$
|
—
|
|
$
|
—
|
|
||||
|
Senior Notes held by special purpose entity
(2)
|
$
|
177,445
|
|
$
|
177,341
|
|
$
|
—
|
|
$
|
—
|
|
$
|
—
|
|
||||
|
Total debt
|
$
|
232,639
|
|
$
|
241,145
|
|
$
|
44,217
|
|
$
|
36,062
|
|
$
|
53,458
|
|
||||
|
Total equity
|
$
|
673,447
|
|
$
|
979,701
|
|
$
|
563,525
|
|
$
|
552,334
|
|
$
|
543,892
|
|
||||
|
(1)
|
Long-term debt includes the Pier Park North Refinanced Loan held by our Pier Park North joint venture.
|
|
(2)
|
Refer to Note 5,
Real Estate Sales
included in the Notes to the Consolidated Financial Statements included in Item 15 of this Form 10-K for further discussion on our special purpose entities.
|
26
Item 7.
Management’s Discussion and Analysis of Financial Condition and Results of Operations
Business Overview
We are a real estate development, asset management and operating company with real estate assets and operations currently concentrated primarily between Tallahassee and Destin, Florida, which we predominantly use, or intend to use, for or in connection with, our various residential or commercial real estate developments, resorts and leisure operations, and leasing operations or our forestry operations on a limited basis.
We have significant residential and commercial land-use entitlements in hand or in process. We seek higher and better uses for our real estate assets through a range of activities from strategic land planning and development, infrastructure improvements and promoting economic development in the regions where we operate. We may explore the sale of such assets opportunistically or when we believe that we can better deploy those resources.
We received significant liquid assets as a result of the AgReserves Sale and RiverTown Sale in 2014. During the year ended December 31, 2015, we repurchased a total of approximately
17.0
million shares of our common stock outstanding for a total price of $305.0 million, including costs, pursuant to a tender offer and open market purchases. In October 2015, the Board of Directors authorized an additional $200.0 million for share repurchases, for a total of
$205.7 million
available as of December 31, 2015. We may repurchase our outstanding common stock in open market purchases from time to time pursuant to Rule 10b-18, in privately negotiated transactions or otherwise. We will continue to seek additional opportunities to invest the remaining funds that could increase our returns. These investments may include longer term commercial or residential real estate or real estate related investments (in which we may play an active or passive role), investments in real estate investments trusts, and other investments in illiquid securities where we believe we can increase our returns.
Segments
As of
December 31, 2015
, we have the following five operating segments: 1) residential real estate, 2) commercial real estate, 3) resorts and leisure 4) leasing operations and 5) forestry. Commencing in the first quarter of 2015, our leasing operations segment met the quantitative and qualitative factors as a reportable operating segment; therefore, we changed our segment presentation to include leasing operations as an operating segment. Prior to the first quarter of 2015, leasing operations were historically included with our resorts, leisure and leasing operating segment. All prior year segment information has been reclassified to conform to the 2015 presentation. The change in reporting segments had no effect on the Consolidated Balance Sheets, Statements of Operations, Statements of Comprehensive (Loss) Income or Statements of Cash Flows for the periods presented.
The table below sets forth the relative contribution of these operating segments to our consolidated operating revenues, excluding revenues of $570.9 million related to the AgReserves Sale and revenues of $43.6 million related to the RiverTown Sale during 2014:
|
|
2015
|
2014
|
2013
|
|||||
|
Segment Operating Revenues
|
||||||||
|
Residential real estate
|
20.4
|
%
|
20.4
|
%
|
25.7
|
%
|
||
|
Commercial real estate
|
6.9
|
%
|
3.7
|
%
|
8.3
|
%
|
||
|
Resorts and leisure
|
52.5
|
%
|
55.4
|
%
|
35.4
|
%
|
||
|
Leasing operations
|
8.6
|
%
|
8.0
|
%
|
3.3
|
%
|
||
|
Forestry
|
11.6
|
%
|
12.1
|
%
|
27.0
|
%
|
||
|
Other
|
—
|
%
|
0.4
|
%
|
0.3
|
%
|
||
|
Consolidated operating revenues
|
100.0
|
%
|
100.0
|
%
|
100.0
|
%
|
||
27
Residential Real Estate
Our residential real estate segment typically plans and develops mixed-use resort, primary residential and seasonal residential communities of various sizes, primarily on our existing land. The following is a description of some of our major residential development communities in Florida that we are currently in the process of planning or developing:
The Watersound Origins community
is a residential community in South Walton County, Florida with direct access to Lake Powell. The project has received government approval for approximately 1,074 single family units with an additional multi-family component, however, the actual amount of units that we ultimately approve for development will depend on our development strategy, the extent to which the anticipated returns of the project meets our investment return criteria, and the availability of capital resources to fund such development. The Watersound Origins community includes a six-hole golf course that is operated by our Resorts and Leisure segment.
The Breakfast Point community
is a residential community in Panama City Beach, Florida near the Pier Park retail center. The project has received government approval for 368 single family units, however, the actual amount of units that we ultimately approve for development will depend on our development strategy, the extent to which the anticipated returns of the project meets our investment return criteria, and the availability of capital resources to fund such development.
The SouthWood community
is a large scale, mixed use development community located in the southeastern section of Tallahassee. The project has received government approval for 4,770 residential units, including 2,074 single family residences and 2,696 multi-family units, however, the actual amount of units that we ultimately approve for development will depend on our development strategy, the extent to which the anticipated returns of the project meets our investment return criteria, and the availability of capital resources to fund such development. SouthWood also includes an 18-hole golf course and club and a town center with restaurants, retail shops and offices. The SouthWood Golf Club is operated by our Resorts and Leisure segment and a portion of the towncenter is leased and operated by our Leasing segment.
We have other residential communities, such as the WaterColor, WaterSound Beach, WaterSound West Beach and other communities that are substantially developed. The remaining developed and available homesites in those other communities are available for sale.
In addition, the Bay-Walton Sector Plan was officially adopted by Bay County and Walton County in May 2015 and was found in compliance with state law and is therefore in effect as of June 2015. The Bay-Walton Sector Plan is a long term master plan that includes entitlements, or legal rights, to develop over 170,000 residential units and over 22 million square feet of retail, commercial, and industrial uses on approximately 110,500 acres of our land holdings. We anticipate a wide range of residential and commercial uses on these land holdings, including some portion of these entitlements serving the active adult retirement market. We believe that there is a growing retirement demographic in Northwest Florida and that our development experience and the location, size and contiguous nature of our Florida land holdings provide us with strategic opportunities in this demographic. As is true with all of our projects, what will actually be developed will be a function of more detailed planning, analysis, and market conditions, which will occur over time.
Our residential real estate segment generates revenues primarily from the sale of developed homesites; the sale of parcels of entitled, undeveloped land; a lot residual on homebuilder sales that provides us a percentage of the sale price of the completed home if the home price exceeds a negotiated threshold; the sale of impact fee credits; marketing fees and other fees on certain transactions.
Our residential real estate segment incurs cost of revenues primarily from costs directly associated with the land, development and construction of real estate sold and indirect costs such as development overhead, capitalized interest, marketing, project administration, and selling costs.
Commercial Real Estate
In our commercial real estate segment we plan, develop and entitle our land holdings for a variety of uses including a broad range of retail, office, hotel and industrial uses. We sell land for commercial and light industrial uses. From time to time, our commercial real estate segment also evaluates opportunities to maximize value by selling some of our resorts, leisure or operating properties.
28
Our commercial real estate segment generates revenues from the sale of developed and undeveloped land for retail, office, hotel and industrial uses, from the sale of undeveloped land or land with limited development and easements and the sale of commercial operating properties. Our commercial real estate segment incurs costs of revenues from costs directly associated with the land, development, construction and selling costs.
Resorts and Leisure
Our resorts and leisure segment generates revenues primarily from the WaterColor Inn and vacation rental programs, four golf courses, marina operations and other related resort activities.
WaterColor Inn, Vacation Rentals and Other Management Services -
Our WaterColor Inn and vacation rentals generate revenue from (1) the WaterColor Inn and Resort, (2) our management of The Pearl Hotel, (3) our vacation rental businesses and (4) our restaurants. The WaterColor Inn incurs expenses from the cost of services and goods provided, personnel costs and third party management fees. Revenues generated for our management services of The Pearl Hotel include a management fee, fifty percent of certain resort fees and a percentage of The Pearl Hotel’s gross operating profit. Expenses include primarily internal administrative costs. Our vacation rental business generates revenues from the rental of private homes and other services, which includes the entire rental fee collected from the customer, including the homeowner’s portion. A percentage of the fee is remitted to the homeowner and presented in the cost of resorts and leisure revenues. The vacation rental business also incurs expenses from standard lodging personnel, such as front desk, reservations and marketing.
Clubs and Resorts -
Our clubs and resorts operations include our golf courses and resort facilities that generate revenues from memberships, daily play at those golf courses that are not part of our St. Joe Club & Resorts, merchandise sales and food and beverage sales and incur expenses from the services provided, maintenance of the golf course facilities, personnel costs and third party management fees.
St. Joe Club & Resorts is our private membership club that provides members, participating homeowners and their rental guests access to our clubs. The focus is on creating a world class membership experience combined with the all-inclusive aspects of a four star/four diamond resort. This allows the company to provide membership and create a competitive advantage in the lodging business.
Marinas -
Our marinas generate revenues from boat slip rentals and fuel sales, and incur expenses from cost of services provided, maintenance of the marina facilities, personnel costs and third party management fees.
Leasing Operations
Our leasing operations generate revenues from leasing retail and commercial property, including properties located in our consolidated joint venture at Pier Park North and our industrial park, VentureCrossings, and incur expenses primarily from maintenance and management of these properties and personnel costs. Our Pier Park North joint venture also incurred interest and financing expenses related to its loan. In October 2015, our Pier Park North joint venture refinanced its construction loan and entered into a
$48.2 million
loan and will incur interest and financing expenses related to the loan as described in
Note 9,
Real Estate Joint Ventures
.
Forestry
Our forestry segment focuses on the management of our timber holdings in Northwest Florida. We grow and sell sawtimber, wood fiber and forest products and provide land management services for conservation properties. We generate revenue from our forestry segment primarily from open market sales of timber. We sell product on site without the associated delivery costs. Our forestry segment generates revenues from the sale of wood fiber, sawtimber, standing timber and forest products and conservation land management services. Our forestry segment incurs costs of revenues from internal costs of forestry management and property taxes.
Our forestry segment may also generate revenues from the sale of our timber holdings, undeveloped land or land with limited development and easements. Costs incurred as part of a sale of these lands may include the cost of timber, land, minimal development costs and selling costs.
29
Factors Affecting Comparability
AgReserves Sale
On March 5, 2014, we completed the sale to AgReserves, Inc. of approximately 380,000 acres of land located in Northwest Florida along with certain other assets, inventory and rights under certain continuing leases and contracts (the “AgReserves Sale”) for $562 million and recorded pre-tax income of $511.1 million for the AgReserves Sale, which includes $1.2 million of severance costs recorded in Other operating and corporate expenses during 2014. As a result of certain adjustments to the purchase price, consideration received for the AgReserves Sale was (1) $358.5 million in cash, (2) a $200 million fifteen year installment note (the “Timber Note”) issued by a buyer-sponsored special purpose entity (the “Buyer SPE”) and (3) an Irrevocable Standby Letter of Credit (the “Letter of Credit”) at the request of the Buyer SPE, in favor of us.
In April 2014, we contributed the Timber Note and assigned our rights as a beneficiary under the Letter of Credit to Northwest Florida Timber Finance, LLC, a bankruptcy-remote, qualified special purpose entity wholly owned by us (“NFTF”). NFTF monetized the Timber Note by issuing $180 million aggregate principal amount of its 4.750% Senior Secured Notes due 2029 (the “Senior Notes”) at an issue price of 98.483% of the face value to third party investors. The Senior Notes are payable only from the property of NFTF, which consists solely of (i) the Timber Note, (ii) the Letter of Credit, (iii) any cash, securities and other property in certain NFTF accounts, (iv) the rights of NFTF under the contribution agreement with us (which was solely to contribute the Timber Note and the Letter of Credit) and (v) any proceeds relating to the property listed in (i) through (iv) above. The investors holding the Senior Notes of NFTF have no recourse against us for payment of the Senior Notes or the related interest expense.
We received $165.0 million in cash, net of $15.0 million in costs, from the monetization and expect to receive the remaining $20.0 million upon maturity of the Timber Note in 2029 and after payment of the Senior Notes and any other liabilities of NFTF. The $15.0 million of costs from the monetization include (1) a total of $4.3 million for the discount and issuance costs for the Senior Notes, which will be amortized over the term of the Senior Notes, (2) $7.0 million for U.S. Treasury securities and cash that we contributed to NFTF to be used for interest and operating expenses over the fifteen year period and which are recorded in Investments held by special purpose entities on our Consolidated Balance Sheets and (3) $3.7 million of costs related to the monetization that were expensed during 2014 and are recorded in Administrative costs associated with special purpose entities on our Consolidated Statements of Operations.
RiverTown Sale
On April 2, 2014, we completed a sale to an affiliate of Mattamy (Jacksonville) Partnership d/b/a Mattamy Homes (
“
Mattamy
”
) of approximately 4,057 acres of real property, which constitutes the RiverTown community in St. Johns County, Florida, along with all of the Company’s related development or developer rights, founder’s rights and certain tangible and intangible personal property in exchange for $43.6 million, the assumption of $11.0 million of associated community development district assessments and the obligation to purchase certain RiverTown community related impact fee credits from us as the RiverTown community is developed. Based on Mattamy’s current development plans and St. Johns County’s current costs for impact fees, we may receive approximately $20 million to $26 million for the impact fees over the five-year period following the closing of the 2014 sale to Mattamy (most of which, we expect to receive at the end of that five-year period). However, the actual additional consideration received for the impact fees, will be based on Mattamy’s actual development of the RiverTown community, the timing of Mattamy’s development of the RiverTown community and the impact fee rates at the time of such development (as determined by St. Johns County’s then current impact fee rate schedule), which are all factors beyond our control. We cannot provide any assurance as to the amount or timing of any payments it may receive for the impact fees. We received
$0.1 million
for these impact fees during
2015
and
2014
.
We recorded net earnings of $26.0 million before income taxes for the RiverTown Sale during the second quarter of 2014.
30
Results of Operations
Consolidated Results
Revenues and expenses.
The following table sets forth a comparison of the results of our operations for the three years ended
December 31, 2015
:
|
|
2015
|
2014
|
2013
|
||||||||
|
|
In millions
|
||||||||||
|
Revenues:
|
|||||||||||
|
Real estate sales
|
$
|
33.7
|
|
$
|
635.0
|
|
$
|
45.1
|
|
||
|
Resorts and leisure revenues
|
54.5
|
|
|
48.4
|
|
|
46.4
|
|
|||
|
Leasing revenues
|
9.0
|
|
|
7.0
|
|
|
4.3
|
|
|||
|
Timber sales
|
6.7
|
|
11.5
|
|
|
35.5
|
|
||||
|
Total
|
103.9
|
|
701.9
|
|
131.3
|
|
|||||
|
Expenses:
|
|||||||||||
|
Cost of real estate sales
|
16.4
|
|
|
87.1
|
|
|
24.7
|
|
|||
|
Cost of resorts and leisure revenues
|
47.1
|
|
|
42.9
|
|
|
39.0
|
|
|||
|
Cost of leasing revenues
|
2.8
|
|
|
2.3
|
|
|
1.7
|
|
|||
|
Cost of timber sales
|
0.8
|
|
4.5
|
|
21.5
|
|
|||||
|
Other operating and corporate expenses
|
33.4
|
|
26.2
|
|
27.8
|
|
|||||
|
Pension charges
|
—
|
|
13.5
|
|
1.5
|
|
|||||
|
Administrative costs associated with special purpose entities
|
—
|
|
3.7
|
|
—
|
|
|||||
|
Depreciation, depletion and amortization
|
9.5
|
|
8.4
|
|
9.1
|
|
|||||
|
Impairment losses
|
—
|
|
—
|
|
5.1
|
|
|||||
|
Total
|
110.0
|
|
188.6
|
|
130.4
|
|
|||||
|
Operating (loss) income
|
(6.1
|
)
|
513.3
|
|
0.9
|
|
|||||
|
Other income (expense):
|
|||||||||||
|
Investment income, net
|
22.7
|
|
12.7
|
|
1.5
|
|
|||||
|
Interest expense
|
(11.4
|
)
|
(8.6
|
)
|
(2.0
|
)
|
|||||
|
Other, net
|
(6.3
|
)
|
4.4
|
|
4.2
|
|
|||||
|
Total other income
|
5.0
|
|
8.5
|
|
3.7
|
|
|||||
|
(Loss) income before equity in income from unconsolidated affiliates and income taxes
|
(1.1
|
)
|
521.8
|
|
4.6
|
|
|||||
|
Equity in income from unconsolidated affiliates
|
—
|
|
—
|
|
0.1
|
|
|||||
|
Income tax (expense) benefit
|
(0.8
|
)
|
(115.5
|
)
|
0.4
|
|
|||||
|
Net (loss) income
|
$
|
(1.9
|
)
|
$
|
406.3
|
|
$
|
5.1
|
|
||
31
Real Estate Sales and Gross Margin
.
|
|
2015
|
%
(1)
|
2014
|
%
(1)
|
2013
|
%
(1)
|
||||||||||||||
|
|
Dollars in millions
|
|||||||||||||||||||
|
Revenues:
|
||||||||||||||||||||
|
Residential real estate sales
|
$
|
21.2
|
|
62.9
|
%
|
$
|
17.9
|
|
2.8
|
%
|
$
|
33.8
|
|
74.9
|
%
|
|||||
|
RiverTown Sale
|
—
|
|
—
|
%
|
43.6
|
|
6.9
|
%
|
—
|
|
—
|
%
|
||||||||
|
Commercial real estate sales
|
7.2
|
|
21.4
|
%
|
3.3
|
|
0.5
|
%
|
10.9
|
|
24.2
|
%
|
||||||||
|
AgReserves and other rural land sales
|
5.3
|
|
15.7
|
%
|
570.2
|
|
89.8
|
%
|
0.4
|
|
0.9
|
%
|
||||||||
|
Real estate sales
|
$
|
33.7
|
|
100.0
|
%
|
$
|
635.0
|
|
100.0
|
%
|
$
|
45.1
|
|
100.0
|
%
|
|||||
|
Gross profit:
|
||||||||||||||||||||
|
Residential real estate sales
|
$
|
10.3
|
|
48.6
|
%
|
$
|
8.0
|
|
44.7
|
%
|
$
|
14.4
|
|
42.6
|
%
|
|||||
|
RiverTown Sale
|
—
|
|
—
|
%
|
26.0
|
|
59.6
|
%
|
—
|
|
—
|
%
|
||||||||
|
Commercial real estate sales
|
2.2
|
|
30.6
|
%
|
2.3
|
|
69.7
|
%
|
5.6
|
|
51.4
|
%
|
||||||||
|
AgReserves and other rural land sales
|
4.8
|
|
90.6
|
%
|
511.6
|
|
89.7
|
%
|
0.4
|
|
100.0
|
%
|
||||||||
|
Gross profit
|
$
|
17.3
|
|
51.3
|
%
|
$
|
547.9
|
|
86.3
|
%
|
$
|
20.4
|
|
45.2
|
%
|
|||||
|
(1
|
)
|
Calculated percentage of total real estate sales and the respective gross profit percentage.
|
Real Estate Sales.
Residential real estate sales revenue increased $3.3 million, or 18%, to
$21.2 million
during
2015
, as compared to
$17.9 million
during
2014
. This increase is primarily due to increased volume in our primary home communities and a sale of one resort home offset by a reduction in sales in our resort home communities due to lower homesite availability. Commercial real estate sales increased
$3.9 million
, or
118%
, to
$7.2 million
during
2015
, as compared to
$3.3 million
during
2014
, primarily due to three commercial real estate transactions in
2015
totaling 13.6 acres.
Our customer base for residential real estate sales is shifting from being primarily retail based to being more weighted towards homebuilders. Homebuilders generally buy more homesites in a single transaction but tend to buy on a more sporadic basis, and we believe we will continue to experience greater volatility in the consistency and pace of our residential real estate sales. In addition, as the mix of homesites that we sell has shifted to homesites in our primary communities, which typically have a lower price and gross profit margin than homesites in our resort communities, we may experience a decrease in our gross profit margin from residential real estate sales.
During
2015
, we sold approximately 3,330 acres of rural and timber land for $5.3 million. Revenues from rural land and commercial real estate can vary drastically from period to period. As a result of the AgReserves Sale, we do not expect to have substantial revenues from sales of our timber or rural lands in the future, which typically yield higher gross profit margins than residential and commercial real estate sales. Thus our gross profit margins may decrease in the future.
Included in revenues from real estate sales for 2014 is revenue of $569.7 million for the AgReserves Sale and revenue of $43.6 million for the RiverTown Sale. The AgReserves Sale included the recognition of $11.0 million of revenue which had been previously recorded as deferred revenue in connection with a 2006 agreement with the Florida Department of Transportation (the “FDOT”) pursuant to which we agreed to sell approximately 3,900 acres of rural land to the FDOT. As part of the AgReserves Sale, we transferred approximately 800 acres that are subject to the 2006 agreement to AgReserves who has agreed to transfer title to the FDOT.
32
Residential real estate sales decreased $15.9 million, or 47%, to
$17.9 million
in
2014
, as compared to
$33.8 million
during
2013
. This decrease is primarily due to a decrease in available homesites for sale in our resort communities during 2014, as compared to 2013. Commercial real estate sales decreased $7.6 million, or 70%, to
$3.3 million
during
2014
, as compared to
$10.9 million
during
2013
, primarily due to the sale of two commercial real estate sales in 2013 totaling $6.0 million for built-to-suit commercial operating properties that we constructed and were leasing under long-term leases.
Real Estate Sales Gross Profit
. During
2015
, we recorded gross profit of
$17.3 million
, or
51.3%
, as compared to
$547.9 million
, or
86.3%
, during
2014
. During 2014, we recorded gross profit of $511.2 million, or 89.7%, for the AgReserves Sale and $26.0 million, or 59.6%, for the RiverTown Sale. Excluding the AgReserves Sale and the RiverTown Sale, gross profit was $10.7 million, or 50.5%, during 2014, as compared to
$20.4 million
, or
45.2%
, during
2013
. Residential real estate gross margins increased due to price increases and the mix of sales from different communities.
Resorts and Leisure Revenues and Gross Profit
.
|
|
2015
|
2014
|
2013
|
||||||||
|
|
Dollars in millions
|
||||||||||
|
Resorts and leisure revenues
|
$
|
54.5
|
|
$
|
48.4
|
|
$
|
46.4
|
|
||
|
Gross profit
|
$
|
7.4
|
|
$
|
5.5
|
|
$
|
7.4
|
|
||
|
Gross profit margin
|
13.6
|
%
|
11.4
|
%
|
15.9
|
%
|
|||||
Resorts and leisure revenues increased
$6.1 million
, or
13%
, during
2015
, as compared to
2014
. The increase in our resorts and leisure revenues and gross profit margin was primarily due to: (i) an increase of $2.0 million within the club operations due to membership growth and increase golf rounds, (ii) a $1.8 million increase in our vacation rental department due to shift in higher revenue producing homes, (iii) $0.4 increase in The Pearl Hotel management fees due to a full year of the management agreement and (iv) increases in ancillary spend including food and beverage, recreation, spa, marina and resort service fees.
Resorts and leisure revenues increased
$2.0 million
, or
4%
, during
2014
, as compared to
2013
. The increase in our resorts and leisure revenues was primarily due to: (i) an increase of $0.8 million in food and beverage sales primarily from the LakeHouse, which opened in late 2013, (ii) a $0.9 million increase in our vacation rental business primarily due to more homes being included our program and (iii) $0.4 million of resort fees from The Pearl Hotel pursuant to a management agreement, which began in May 2014. Our gross profit margins decreased in our resorts and leisure businesses in
2014
as compared to
2013
primarily due to the adjustments in the costs associated with our business model and the costs associated with the launch of St. Joe Club & Resorts.
Leasing Revenues and Gross Profit
.
|
|
2015
|
2014
|
2013
|
||||||||
|
|
Dollars in millions
|
||||||||||
|
Leasing revenues
|
$
|
9.0
|
|
$
|
7.0
|
|
$
|
4.3
|
|
||
|
Gross profit
|
$
|
6.2
|
|
$
|
4.7
|
|
$
|
2.6
|
|
||
|
Gross profit margin
|
68.9
|
%
|
67.1
|
%
|
60.5
|
%
|
|||||
Leasing revenues increased
$2.0 million
, or approximately
29%
, during
2015
, as compared to
2014
, and gross profit margin increased in
2015
as compared to
2014
primarily due to the commencement of revenues from new store openings in our Pier Park North joint venture combined with increased percentage rent from retail operating properties in or near our WaterColor and WaterSound Beach resort operations. In 2015, we continued to open new stores and increase leasing revenue from our Pier Park North joint venture as retail space became occupied by tenants. As a result, we recognized $4.6 million of leasing revenues from Pier Park North during
2015
.
33
Leasing revenues increased
$2.7 million
, or
63%
, during
2014
, as compared to
2013
, and gross profit margin increased in
2014
to
67.1%
, from
60.5%
in
2013
. The increase in revenues and gross profit is primarily due to a full year of rent from our property in our VentureCrossings industrial park and the commencement of revenues from our Pier Park North joint venture combined with increased percentage rent from retail operating properties in or near our WaterColor and WaterSound Beach resort operations. Beginning in early 2014, we commenced recognizing leasing revenue from our Pier Park North joint venture as retail space became occupied by tenants. As a result, we recognized $2.4 million of leasing revenues from Pier Park North during
2014
.
Timber Sales and Gross Profit
.
|
|
2015
|
2014
|
2013
|
||||||||
|
|
Dollars in millions
|
||||||||||
|
Timber sales
|
$
|
6.7
|
|
$
|
11.5
|
|
$
|
35.5
|
|
||
|
Gross profit
|
$
|
5.9
|
|
$
|
7.0
|
|
$
|
14.0
|
|
||
|
Gross profit margin
|
88.1
|
%
|
60.9
|
%
|
39.4
|
%
|
|||||
Timber sales decreased
$4.8 million
, or
42%
, during
2015
, as compared to
2014
, primarily due to the AgReserves Sale, which closed on March 5, 2014. In addition, timber sales for 2014 included $1.1 million of deferred revenue related to an imputed land lease that was to be recognized over the life of the timber deeds sold in March 2011. We sold substantially all the land included in the imputed lease as part of the AgReserves Sale and recognized the remaining deferred revenue during 2014. In addition, subsequent to the AgReserves Sale, we have primarily sold product on site without the associated delivery costs, which has increased our timber sales gross profit margin.
Timber sales decreased
$24.0 million
, or
68%
, during
2014
, as compared to
2013
, primarily due to the AgReserves Sale, which closed on March 5, 2014. As expected our timber sales and related costs substantially decreased following the AgReserves Sale. In addition, subsequent to the AgReserves Sale, we have primarily sold product on site without the associated delivery costs, which has increased our timber sales gross profit margin.
Other operating and corporate expenses.
Other operating and corporate expenses increased by
$7.2 million
or
27%
, during
2015
, as compared to
2014
, primarily due to increased planning costs related to our mixed-use and active adult community, including non-recurring expenses related to the approval of the Bay-Walton Sector Plan and costs related to personnel changes.
Other operating and corporate expenses decreased by
$1.6 million
, or
6%
, during
2014
, as compared to
2013
, primarily due to a decrease in employee costs of $1.1 million and a $0.5 million termination fee paid in 2013 to our third party manager for certain of our resorts and leisure businesses.
Pension charges.
In 2014 the pension plan was terminated. In November 2012, the Board of Directors approved the termination of our Pension Plan, which was frozen in March 2013 pending regulatory approvals which were received in August 2014. As of December 31, 2014, the Pension Plan assets were distributed to Pension Plan participants and $7.9 million was distributed to our 401(k) Plan to pay additional future benefits. Subsequent to these distributions, the remaining Pension Plan assets of $23.8 million were reverted to us in December 2014. During 2015, we recorded an expense of $1.0 million for the fair value of the assets that were allocated to participants. Any gains and losses on these assets are reflected in the Company’s Consolidated Statements of Operations and were a $0.1 million gain for 2015. Refer to Note 8,
Financial Instruments and Fair Value Measurements.
In addition, we expect to record additional expenses of approximately $7.1 million as the assets in our 401(k) Plan are allocated to participants over the next six years. See Note 18,
Employee Benefit Plans
in the Notes to the Consolidated Financial Statements included in Item 15 to this annual report on Form 10-K for further information.
Administrative costs associated with special purpose entities.
Administrative costs associated with special purpose entities of $3.7 million during 2014, include one-time administrative costs associated with the monetization of the Timber Note received in the AgReserves Sale. See Note 5,
Real Estate Sales
in the Notes to the Consolidated Financial Statements included in Item 15 to this annual report on Form 10-K for further information.
Depreciation, depletion and amortization.
The increase of
$1.1 million
in depreciation, depletion and amortization expenses in
2015
, as compared to
2014
, was primarily due to an increase in building and land improvements completed during 2015 related to Pier Park North and other operating properties.
The decrease of
$0.7 million
in depreciation, depletion and amortization expenses in
2014
, as compared to
2013
, was primarily due to a decrease in depletion expense related to the AgReserves Sale.
34
Impairment losses.
In 2013, we recorded impairment charges of $5.1 million primarily for a golf course that we operate, which incurred negative operating cash flows and the future estimated undiscounted cash flows were less than its carrying value. For further discussion of these impairments, see
Note 4,
Impairments of Long-lived Assets
, in the Notes to the Consolidated Financial Statements included in Item 15 to this annual report on Form 10-K.
Investment income, net.
Investment income, net primarily includes (i) interest and dividends earned, accretion of the net discount, and realized gains and losses from our available-for-sale investments, (ii) interest income earned on the time deposit held by the Buyer SPE and (iii) interest earned on mortgage notes receivable.
|
2015
|
2014
|
2013
|
||||||||||
|
In millions
|
||||||||||||
|
Net investment income from available-for-sale securities
|
||||||||||||
|
Interest and dividend income
|
$
|
5.9
|
|
$
|
6.3
|
|
$
|
1.2
|
|
|||
|
Accretion income
|
2.6
|
|
1.4
|
|
—
|
|
||||||
|
Realized gains (losses) on the sale of investments
|
5.3
|
|
(0.8
|
)
|
0.1
|
|
||||||
|
Other-than-temporary impairment losses
|
—
|
|
(1.3
|
)
|
—
|
|
||||||
|
Total net investment income from available-for-sale securities
|
13.8
|
|
5.6
|
|
1.3
|
|
||||||
|
Interest income from investments in special purpose entities
|
8.2
|
|
6.1
|
|
—
|
|
||||||
|
Interest accrued on notes receivable and other
|
0.7
|
|
1.0
|
|
0.2
|
|
||||||
|
Total investment income, net
|
$
|
22.7
|
|
$
|
12.7
|
|
$
|
1.5
|
|
|||
Investment income increased
$10.0 million
during
2015
, as compared to
2014
, due to (i) an increase of $8.2 million from our available-for-sale securities, primarily due to an increase in accretion income and the sale of certain corporate debt securities at a realized gain of $5.3 million, compared to $0.8 million in losses from such sales in 2014, (ii) no other-than-temporary impairment losses in 2015 compared to $1.3 million in 2014 and (iii) $2.1 million increase from a full year of interest earned on the time deposit held by the Buyer SPE.
Investment income increased
$11.2 million
during
2014
, as compared to
2013
, due to (i) an increase of $4.3 million from our available-for-sale securities, which includes an increase of $6.5 million for interest, dividends and accretion, partially offset by other-than-temporary impairment losses related to the credit-related component recognized in earnings of $1.3 million and realized losses on the sale of investments, (ii) $0.8 million from interest earned on mortgage notes receivables (primarily related to the RiverTown Note) and (iii) $6.1 million from interest earned on the time deposit held by the Buyer SPE.
Interest expense.
Interest expense primarily includes interest expense on our CDD assessments, the Senior Notes issued by NFTF in April 2014 in connection with the AgReserves Sale and the construction loan and Refinanced Loan in our consolidated Pier Park North joint venture.
|
2015
|
2014
|
2013
|
||||||||||
|
In millions
|
||||||||||||
|
Interest expense and amortization of discount and issuance costs for Senior Notes issued by special purpose entity
|
$
|
8.8
|
|
$
|
6.6
|
|
$
|
—
|
|
|||
|
Interest expense
|
2.6
|
|
2.0
|
|
2.0
|
|
||||||
|
Total interest expense
|
$
|
11.4
|
|
$
|
8.6
|
|
$
|
2.0
|
|
|||
Interest expense increased
$2.8 million
during
2015
, as compared to
2014
, primarily due an increase of $2.2 million for a full year of interest expense for the Senior Notes issued by NFTF and interest expense of $1.5 million on the Pier Park North joint venture construction loan and Refinanced Loan, partially offset by a decrease in interest expense on our CDD assessments due to the RiverTown Sale.
Interest expense increased by
$6.6 million
during,
2014
as compared to
2013
, primarily due to interest expense of
$6.6 million
for the Senior Notes issued by NFTF and construction loan interest expense of $0.6 million on the Pier Park North joint venture construction loan, partially offset by a decrease in interest expense on our CDD assessments due to the RiverTown Sale.
35
Other, net.
Other (expense) income primarily includes legal and regulatory costs related to the recently resolved SEC investigation, income from our retained interest investments, hunting lease income and other income and expense items.
|
2015
|
2014
|
2013
|
||||||||||
|
In millions
|
||||||||||||
|
Fees and expenses for the SEC investigation
|
$
|
(8.2
|
)
|
$
|
—
|
|
$
|
—
|
|
|||
|
Accretion income from retained interest investments
|
0.9
|
|
0.9
|
|
0.8
|
|
||||||
|
Hunting lease income
|
0.7
|
|
0.9
|
|
1.8
|
|
||||||
|
Litigation and insurance proceeds received
|
—
|
|
1.8
|
|
0.6
|
|
||||||
|
Other income, net
|
0.3
|
|
0.8
|
|
1.0
|
|
||||||
|
Other, net
|
$
|
(6.3
|
)
|
$
|
4.4
|
|
$
|
4.2
|
|
|||
Other, net was
$6.3 million
of expense during
2015
, as compared to income of
$4.4 million
during
2014
, primarily due to a total of
$8.2 million
of expenses recorded related to the recently resolved SEC investigation. The
$8.2 million
of fees and expenses for the SEC investigation consisted of (i) penalties, disgorgements and interest of approximately
$3.5 million
, including a civil penalty assessed on us of $2.75 million and other disgorgements and interest subject to indemnification by us and (ii) legal expenses associated with the SEC investigation. On October 27, 2015, we fully resolved the SEC investigation and entered into a settlement with the SEC. During 2015, we received correspondence from an insurance carrier related to non-coverage of certain fees and expenses incurred in the SEC investigation and, as a result of this correspondence, we recorded $4.7 million, in legal costs during 2015. As of December 31, 2015, we did not possess necessary data to determine any insurance receivables.
Other, net increased by
$0.2 million
during
2014
, as compared to
2013
, primarily due to the sale of hunting leases that were included in the AgReserves Sale, partially offset by the cash receipt of $1.8 million for a real estate litigation settlement and a $0.6 million gain related to the sale of our fifty percent ownership in our East San Marco joint venture during 2014, as compared to 2013, which included a cash receipt of $0.6 million for insurance proceeds in 2013.
Income tax expense/benefit.
Our income tax expense in
2015
was
$0.8 million
as compared to an income tax expense of $115.5 million in
2014
and income tax benefit of $0.4 million in
2013
. Our effective tax rate was
87.5%
, 22.1% and 9.0% in
2015
,
2014
, and
2013
, respectively. During
2015
, we reversed
$0.2 million
of the valuation allowances established on our net deferred tax liability of $34.8 million as of December 31,
2014
. Our effective rate
f
or
2015
, reflected our expectation that approximately $2.8 million of the settlements costs related to the SEC investigation may not be deductible for income tax purposes, which increased our effective rate in
2015
. During 2014, we reversed $86.9 million of the valuation allowances established on our net deferred tax assets as of December 31, 2013, which reduced our effective rate in 2014. In the future, we expect that our effective rate will be closer to the statutory rate.
36
Segment Results
Residential Real Estate
Our residential real estate segment typically plans and develops mixed-use resort, primary residential and seasonal residential communities of various sizes, primarily on our existing land. We own land in Northwest Florida, including Gulf of Mexico beach frontage and waterfront properties, concentrated primarily between Tallahassee and Destin, Florida.
The table below sets forth the results of operations of our residential real estate segment for the three years ended
December 31, 2015
:
|
|
2015
|
2014
|
2013
|
||||||||
|
|
In millions
|
||||||||||
|
Revenues:
|
|||||||||||
|
Real estate sales
|
$
|
19.4
|
|
$
|
17.0
|
|
$
|
33.0
|
|
||
|
RiverTown Sale
|
—
|
|
43.6
|
|
—
|
|
|||||
|
Other
|
1.8
|
|
0.9
|
|
0.8
|
|
|||||
|
Total revenues
|
21.2
|
|
61.5
|
|
33.8
|
|
|||||
|
Expenses:
|
|||||||||||
|
Cost of real estate sales and other revenues
|
10.9
|
|
10.0
|
|
19.4
|
|
|||||
|
Cost of real estate sales - RiverTown Sale
|
—
|
|
17.6
|
|
—
|
|
|||||
|
Other operating expenses
|
10.2
|
|
8.3
|
|
7.6
|
|
|||||
|
Depreciation and amortization
|
0.5
|
|
0.6
|
|
0.8
|
|
|||||
|
Impairment losses
|
—
|
|
—
|
|
0.2
|
|
|||||
|
Total expenses
|
21.6
|
|
36.5
|
|
28.0
|
|
|||||
|
Operating (loss) income
|
(0.4
|
)
|
25.0
|
|
5.8
|
|
|||||
|
Other expense, net
|
(0.4
|
)
|
(0.1
|
)
|
(1.6
|
)
|
|||||
|
(Loss) income
|
$
|
(0.8
|
)
|
$
|
24.9
|
|
$
|
4.2
|
|
||
Real estate sales include sales of homesites, other residential land and certain lot residuals from homebuilder sales that provide us a percentage of the sale price of the completed home if the home price exceeds a negotiated threshold. Cost of real estate sales includes direct costs (e.g., development and construction costs), selling costs and other indirect costs (e.g., development overhead, capitalized interest and project administration costs). Other operating expenses include non-recurring expenses related to planning of the Bay-Walton Sector Plan. Other revenues include brokerage fees, marketing fees, and impact fee credits sold.
In April 2014, we completed the RiverTown Sale and as a result recognized revenue of $43.6 million during 2014.
37
Year Ended
December 31, 2015
Compared to the Year Ended
December 31, 2014
The following table sets forth our residential real estate sales and cost of sales activity by geographic region and property type:
|
|
Year Ended December 31, 2015
|
Year Ended December 31, 2014
|
|||||||||||||||||||||||||||||||||
|
|
Units Sold
|
Revenues
|
Cost of
Sales
|
Gross
Profit
|
Gross
Profit Margin
|
Units Sold
|
Revenues
|
Cost of
Sales
|
Gross
Profit
|
Gross
Profit Margin
|
|||||||||||||||||||||||||
|
|
(Dollars in millions)
|
||||||||||||||||||||||||||||||||||
|
Northwest Florida:
|
|||||||||||||||||||||||||||||||||||
|
Resort homesites
|
23
|
|
$
|
8.8
|
|
$
|
3.3
|
|
$
|
5.5
|
|
62.5
|
%
|
31
|
|
$
|
10.3
|
|
$
|
5.3
|
|
$
|
5.0
|
|
48.5
|
%
|
|||||||||
|
Resort home
|
1
|
|
0.8
|
|
0.8
|
|
—
|
|
—
|
%
|
—
|
|
—
|
|
—
|
|
—
|
|
—
|
%
|
|||||||||||||||
|
Primary homesites
|
138
|
|
9.8
|
|
5.5
|
|
4.3
|
|
43.9
|
%
|
69
|
|
6.3
|
|
3.9
|
|
2.4
|
|
38.1
|
%
|
|||||||||||||||
|
RiverTown Community
|
—
|
|
—
|
|
—
|
|
—
|
|
—
|
%
|
7
|
|
0.4
|
|
0.2
|
|
0.2
|
|
50.0
|
%
|
|||||||||||||||
|
Total
|
162
|
|
$
|
19.4
|
|
$
|
9.6
|
|
$
|
9.8
|
|
50.5
|
%
|
107
|
|
$
|
17.0
|
|
$
|
9.4
|
|
$
|
7.6
|
|
44.7
|
%
|
|||||||||
Northwest Florida resort homesites and resort home.
Revenues from resort homesite sales decreased
$1.5 million
, or
15%
, during
2015
, as compared to
2014
, due to a decrease of available homesites. Gross profit margins increased to
62.5%
during
2015
, as compared to
48.5%
during
2014
, primarily due to price increases and the mix of homesites sold during each respective period and the receipt of lot residuals that have no related costs at the time of recognition. Revenues from the resort home are related to a completed home that was sold within the WaterSound Beach community.
Northwest Florida primary homesites.
Revenues from real estate sales increased
$3.5 million
, or
56%
, during
2015
, as compared to
2014
, due to the timing of sales in our Watersound Origins, Breakfast Point, and Southwood communities. Gross profit margin increased to
43.9%
during
2015
, as compared to
38.1%
during
2014
, primarily due to price increases and the mix of homesites sold during each respective period and the receipt of lot residuals that have no related costs at the time of recognition.
RiverTown Community primary homesites.
In April 2014, we completed the sale of our RiverTown community.
Other operating expenses include salaries and benefits, property taxes, marketing, project administration, support personnel and other administrative expenses. Other operating expenses increased
$1.9 million
during
2015
, as compared to
2014
, primarily due to increased spending related to our mixed-use and active adult communities, including non-recurring expenses related to the approval of the Bay-Walton Sector Plan. During
2015
and
2014
, we capitalized less than $0.1 million of indirect development costs related to our residential development projects.
Other expense primarily includes interest earned on our mortgage notes receivables and interest expense on our CDD assessments. Other expense, net increased
$0.3 million
during
2015
, as compared to
2014
, primarily due to a decrease in interest earned on the RiverTown Note that was paid in June 2015.
38
Year Ended
December 31, 2014
Compared to the Year Ended
December 31, 2013
The following table sets forth our residential real estate sales and cost of sales activity by geographic region and property type:
|
|
Year Ended December 31, 2014
|
Year Ended December 31, 2013
|
|||||||||||||||||||||||||||||||||
|
|
Units Sold
|
Revenues
|
Cost of
Sales
|
Gross
Profit
|
Gross
Profit Margin
|
Units Sold
|
Revenues
|
Cost of
Sales
|
Gross
Profit
|
Gross
Profit Margin
|
|||||||||||||||||||||||||
|
|
(Dollars in millions)
|
||||||||||||||||||||||||||||||||||
|
Northwest Florida:
|
|||||||||||||||||||||||||||||||||||
|
Resort homesites
|
31
|
|
$
|
10.3
|
|
$
|
5.3
|
|
$
|
5.0
|
|
48.5
|
%
|
92
|
|
$
|
17.5
|
|
$
|
9.4
|
|
$
|
8.1
|
|
46.3
|
%
|
|||||||||
|
Primary homesites
|
69
|
|
6.3
|
|
3.9
|
|
2.4
|
|
38.1
|
%
|
166
|
|
11.0
|
|
7.0
|
|
4.0
|
|
36.4
|
%
|
|||||||||||||||
|
Single-family homes
|
—
|
|
—
|
|
—
|
|
—
|
|
—
|
%
|
3
|
|
0.8
|
|
0.7
|
|
0.1
|
|
12.5
|
%
|
|||||||||||||||
|
Land sale
|
—
|
|
—
|
|
—
|
|
—
|
|
—
|
%
|
—
|
|
1.8
|
|
0.6
|
|
1.2
|
|
66.7
|
%
|
|||||||||||||||
|
RiverTown Community:
|
|
|
|||||||||||||||||||||||||||||||||
|
Primary homesites
|
7
|
|
0.4
|
|
0.2
|
|
0.2
|
|
50.0
|
%
|
54
|
|
1.9
|
|
1.3
|
|
0.6
|
|
31.6
|
%
|
|||||||||||||||
|
Total
|
107
|
|
$
|
17.0
|
|
$
|
9.4
|
|
$
|
7.6
|
|
44.7
|
%
|
315
|
|
$
|
33.0
|
|
$
|
19.0
|
|
$
|
14.0
|
|
42.4
|
%
|
|||||||||
Northwest Florida resort homesites.
Revenues from real estate sales decreased
$7.2 million
, or
41%
, during
2014
, as compared to
2013
, due to a decrease in homesite sales in our WaterColor and WaterSound West Beach communities, slightly offset by an increase in homesite sales in our WaterSound Beach and SummerCamp Beach communities. Gross profit margins increased to
48.5%
during
2014
, as compared to
46.3%
during
2013
, primarily due to an increase in pricing in our WaterColor, WaterSound Beach and WaterSound West Beach communities, an increase in the lot residual received and the recognition of deferred profit in our WaterSound West Beach and WaterSound Beach communities, given that both the lot residual and the recognition of deferred profit have no related costs.
Northwest Florida primary homesites.
Revenues from real estate sales decreased
$4.7 million
, or
43%
, during
2014
, as compared to
2013
, primarily due to a sale of sixty-two homesites to a homebuilder in Watersound Origins in 2013. Gross profit margin increased to
38.1%
during
2014
, as compared to
36.4%
during
2013
, primarily due to increased prices.
Northwest Florida land sales.
In 2013, we had a sale of residential land that included 28 units of developed and 37 acres of undeveloped residential land.
RiverTown Community primary homesites.
In April 2014, we completed the sale of our RiverTown community.
Other operating expenses include salaries and benefits, property taxes, marketing, project administration, support personnel and other administrative expenses. Other operating expenses increased
$0.7 million
during
2014
, as compared to
2013
, primarily due to increases in professional fees and marketing. During
2014
and
2013
, we capitalized less than $0.1 million of indirect development costs related to our residential development projects.
Other expense primarily includes interest earned on our mortgage notes receivables and interest expense on our CDD assessments. Other expense, net decreased
$1.5 million
during
2014
, as compared to
2013
, primarily due to interest earned on the RiverTown Note and lower interest expense related to the Rivers Edge CDD assessments.
39
Commercial Real Estate
Our commercial real estate segment plans, develops, entitles and sells our land holdings, often in conjunction with strategic partners, for a broad range of retail, office, hotel and industrial uses. From time to time, our commercial real estate segment may sell our resort, leisure and operating properties. The timing of commercial real estate revenues can vary depending on the demand, size and location of the property.
The table below sets forth the results of operations of our commercial real estate segment for the three years ended
December 31, 2015
:
|
|
2015
|
2014
|
2013
|
||||||||
|
|
In millions
|
||||||||||
|
Revenues:
|
|||||||||||
|
Real estate sales
|
$
|
7.2
|
|
$
|
3.3
|
|
$
|
10.9
|
|
||
|
Expenses:
|
|||||||||||
|
Cost of real estate sales
|
5.0
|
|
1.0
|
|
5.3
|
|
|||||
|
Other operating expenses
|
2.1
|
|
2.3
|
|
2.5
|
|
|||||
|
Total expenses
|
7.1
|
|
3.3
|
|
7.8
|
|
|||||
|
Operating income
|
0.1
|
|
—
|
|
3.1
|
|
|||||
|
Other (expense) income
|
—
|
|
(0.1
|
)
|
0.2
|
|
|||||
|
Income (loss)
|
$
|
0.1
|
|
$
|
(0.1
|
)
|
$
|
3.3
|
|
||
Real Estate Sales.
Commercial real estate sales for the three years ended
December 31, 2015
include the following:
|
Period
|
Number of
Sales
|
Acres Sold
|
Average Price Per Acre
|
Revenue
|
Gross Profit on Sales
|
|||||||||||||
|
In millions
|
||||||||||||||||||
|
2015
|
3
|
|
14
|
|
$
|
514,285
|
|
$
|
7.2
|
|
$
|
2.2
|
|
|||||
|
2014
|
4
|
|
5
|
|
$
|
609,938
|
|
$
|
3.3
|
|
$
|
2.3
|
|
|||||
|
2013
|
8
|
|
18
|
|
$
|
605,556
|
|
$
|
10.9
|
|
$
|
5.6
|
|
|||||
Year Ended
December 31,
2015
Compared to Year Ended
December 31,
2014
Commercial real estate sales were
$7.2 million
during
2015
, as compared to
$3.3 million
during
2014
. Commercial real estate sales can vary depending on the mix of commercial real estate sold in each period, with varying compositions of retail, office, light industrial and other commercial uses.
Other operating expenses include salaries and benefits, property taxes, professional fees and other administrative expenses. Other operating expenses decreased
$0.2 million
during
2015
, as compared to
2014
, primarily due to reduced employee costs and property taxes.
40
Year Ended
December 31,
2014
Compared to Year Ended
December 31,
2013
Commercial real estate sales were
$3.3 million
during
2014
, as compared to
$10.9 million
during
2013
. Commercial real estate sales can vary depending on the mix of commercial real estate sold in each period, with varying compositions of retail, office, light industrial and other commercial uses.
Other operating expenses include salaries and benefits, property taxes, professional fees and other administrative expenses. Other operating expenses decreased
$0.2 million
during
2014
, as compared to
2013
, primarily due to reduced employee costs and property taxes.
Resorts and Leisure
Our resorts and leisure segment includes recurring revenues from our resorts and leisure activities. Resorts and leisure revenues and cost of resorts and leisure revenues include results of operations from the WaterColor Inn and vacation rental programs, four golf courses, marina operations, management of The Pearl Hotel and other related resort activities.
The table below sets forth the results of operations of our resorts and leisure segment for the three years ended
December 31, 2015
:
|
2015
|
2014
|
2013
|
|||||||||
|
In millions
|
|||||||||||
|
Revenues:
|
|||||||||||
|
Resorts and leisure revenues
|
$
|
54.5
|
|
$
|
48.4
|
|
$
|
46.4
|
|
||
|
Expenses:
|
|||||||||||
|
Cost of resorts and leisure revenues
|
47.1
|
|
42.9
|
|
39.0
|
|
|||||
|
Operating expenses
|
0.4
|
|
0.5
|
|
0.8
|
|
|||||
|
Depreciation
|
5.1
|
|
4.1
|
|
4.2
|
|
|||||
|
Impairment losses
|
—
|
|
—
|
|
4.9
|
|
|||||
|
Total expenses
|
52.6
|
|
47.5
|
|
48.9
|
|
|||||
|
Operating income (loss)
|
1.9
|
|
|
0.9
|
|
|
(2.5
|
)
|
|||
|
Other (expense) income
|
(0.1
|
)
|
0.6
|
|
0.9
|
|
|||||
|
Net income (loss)
|
$
|
1.8
|
|
$
|
1.5
|
|
$
|
(1.6
|
)
|
||
41
The following table sets forth the detail of our resorts and leisure revenues and cost of revenues:
|
|
Year Ended December 31, 2015
|
Year Ended December 31, 2014
|
|||||||||||||||||||
|
|
Revenues
|
Gross
Profit
|
Gross
Profit Margin
|
Revenues
|
Gross
Profit
|
Gross
Profit Margin
|
|||||||||||||||
|
|
Dollars in millions
|
||||||||||||||||||||
|
Resorts, vacation rentals and other management services
|
$
|
39.1
|
|
$
|
5.6
|
|
14.3
|
%
|
$
|
35.1
|
|
$
|
4.6
|
|
13.1
|
%
|
|||||
|
Clubs
|
12.4
|
|
1.0
|
|
8.1
|
%
|
10.4
|
|
0.2
|
|
1.9
|
%
|
|||||||||
|
Marinas
|
3.0
|
|
0.8
|
|
26.7
|
%
|
2.9
|
|
0.7
|
|
24.1
|
%
|
|||||||||
|
Total
|
$
|
54.5
|
|
|
$
|
7.4
|
|
13.6
|
%
|
$
|
48.4
|
|
|
$
|
5.5
|
|
11.4
|
%
|
|||
Year Ended
December 31,
2015
Compared to Year Ended
December 31,
2014
Revenues from our Resorts, vacation rentals and other management services increased
$4.0 million
, or
11%
, during
2015
, as compared to
2014
, primarily due to: (i) an increase of $1.7 million in resort ancillary spend including food and beverage, recreation, spa and resort service fees, (ii) a $1.8 million increase in our vacation rental department due to shift in higher revenue producing homes and (iii) $0.4 increase in The Pearl Hotel management fees due to a full year of the management agreement.
Revenues from our clubs increased
$2.0 million
, or
19%
, and gross profit margin increased 6.2% due to a continued increase in total members, the growth in resort rounds at the golf courses and continued focus with weddings and special events.
Year Ended
December 31,
2014
Compared to Year Ended
December 31,
2013
|
|
Year Ended December 31, 2014
|
Year Ended December 31, 2013
|
|||||||||||||||||||
|
|
Revenues
|
Gross
Profit
|
Gross
Profit Margin
|
Revenues
|
Gross
Profit
|
Gross
Profit Margin
|
|||||||||||||||
|
|
(Dollars in millions)
|
||||||||||||||||||||
|
Resorts, vacation rentals and other management services
|
$
|
35.1
|
|
$
|
4.6
|
|
13.1
|
%
|
$
|
32.3
|
|
$
|
5.0
|
|
15.5
|
%
|
|||||
|
Clubs
|
10.4
|
|
0.2
|
|
1.9
|
%
|
11.3
|
|
1.6
|
|
14.2
|
%
|
|||||||||
|
Marinas
|
2.9
|
|
0.7
|
|
24.1
|
%
|
2.8
|
|
0.8
|
|
28.6
|
%
|
|||||||||
|
Total
|
$
|
48.4
|
|
|
$
|
5.5
|
|
11.4
|
%
|
$
|
46.4
|
|
$
|
7.4
|
|
15.9
|
%
|
||||
Revenues from our Resorts, vacation rentals and other management services increased $2.8 million, or 9%, during 2014, as compared to 2013, primarily due to: (i) an increase of $0.8 million in food and beverage sales primarily from the LakeHouse, which opened in late 2013, (ii) a $0.9 million increase in our vacation rental business primarily due to more homes being included our program and (iii) $0.4 million of resort fees from The Pearl Hotel pursuant to a management agreement, which began in May 2014.
Revenues from our clubs decreased $0.9 million, or 8%, and gross profit margin decreased 12.3% due to the launch of St Joe Club & Resorts on January 1, 2014. In connection with the launch of St. Joe Club & Resorts in January 2014, we limited the public use of our golf courses and resort facilities; therefore, the loss of revenues from the public access to the golf courses and resort facilities have contributed to the decrease in revenues and gross profit margin during 2014, as compared to 2013.
In 2013, we recorded an impairment charge of
$4.9 million
for a golf course that we operate, which incurred negative operating cash flows and the future estimated undiscounted cash flows were less than the carrying value of its assets.
42
Leasing Operations
Our leasing operations segment includes recurring revenues from our retail and commercial leasing operations, including our consolidated joint venture at Pier Park North.
The table below sets forth the results of operations of our leasing operations segment for the three years ended
December 31, 2015
:
|
2015
|
2014
|
2013
|
|||||||||
|
In millions
|
|||||||||||
|
Revenues:
|
|||||||||||
|
Leasing operations
|
$
|
9.0
|
|
$
|
7.0
|
|
$
|
4.3
|
|
||
|
Expenses:
|
|||||||||||
|
Cost of leasing operations
|
2.8
|
|
2.3
|
|
1.7
|
|
|||||
|
Operating expenses
|
0.9
|
|
0.6
|
|
0.4
|
|
|||||
|
Depreciation
|
3.1
|
|
2.7
|
|
2.1
|
|
|||||
|
Total expenses
|
6.8
|
|
5.6
|
|
4.2
|
|
|||||
|
Operating income
|
2.2
|
|
|
1.4
|
|
|
0.1
|
|
|||
|
Other (expense) income
|
(1.5
|
)
|
(0.3
|
)
|
0.2
|
|
|||||
|
Net income
|
$
|
0.7
|
|
$
|
1.1
|
|
$
|
0.3
|
|
||
Year Ended
December 31,
2015
Compared to Year Ended
December 31,
2014
Revenues from our leasing operations increased
$2.0 million
and gross profit increased
$1.5 million
primarily attributable to an increase in revenues from leases in our Pier Park North joint venture that began to open in 2014. In connection with our Pier Park North joint venture, we recognized $4.6 million of leasing revenues during
2015
.
Other (expense) income increased
$1.2 million
during 2015, as compared to 2014, primarily due to interest expense from the Pier Park North joint venture Refinanced Loan.
During
2015
and
2014
, we capitalized $0.2 million and $0.6 million, respectively, of indirect development costs related to Pier Park North, for which construction began in early 2013.
Year Ended
December 31,
2014
Compared to Year Ended
December 31,
2013
Revenues and gross profit from our leasing operations increased in
2014
as compared to
2013
primarily due to the commencement of recognition of leasing revenue in our Pier Park North joint venture as retail stores became occupied by tenants commencing in early 2014. In connection with our Pier Park North joint venture, we recognized $2.4 million of leasing revenues during
2014
.
During
2014
and
2013
, we capitalized $0.6 million and $0.7 million, respectively, of indirect development costs related to Pier Park North, for which construction began in early 2013.
43
Forestry
Our forestry segment focuses on the management of our timber holdings. We grow and sell timber and wood fiber and provide land management services for conservation properties. Our forestry segment may also sell our timber holdings, undeveloped land or land with limited development and easements.
The table below sets forth the results of operations of our forestry segment, including revenues and expenses associated with the AgReserves Sale and rural land sales that were previously reported in our former rural land segment for the three years ended
December 31, 2015
:
|
|
2015
|
2014
|
2013
|
||||||||
|
|
In millions
|
||||||||||
|
Revenues:
|
|||||||||||
|
Timber sales
|
$
|
6.7
|
|
$
|
11.5
|
|
$
|
35.5
|
|
||
|
Real estate sales - AgReserves and other rural land sales
|
5.3
|
|
569.9
|
|
—
|
|
|||||
|
Total revenues
|
12.0
|
|
581.4
|
|
35.5
|
|
|||||
|
Expenses:
|
|||||||||||
|
Cost of timber sales
|
0.8
|
|
4.5
|
|
21.5
|
|
|||||
|
Cost of real estate sales - AgReserves and other rural land sales
|
0.5
|
|
58.4
|
|
—
|
|
|||||
|
Other operating expenses
|
0.9
|
|
1.9
|
|
1.0
|
|
|||||
|
Depreciation and depletion
|
0.6
|
|
0.7
|
|
1.8
|
|
|||||
|
Total expenses
|
2.8
|
|
65.5
|
|
24.3
|
|
|||||
|
Operating income
|
9.2
|
|
515.9
|
|
11.2
|
|
|||||
|
Other income
|
1.1
|
|
1.2
|
|
2.2
|
|
|||||
|
Net income
|
$
|
10.3
|
|
$
|
517.1
|
|
$
|
13.4
|
|
||
The total tons sold and relative percentage of total tons sold by major item for the three years ended
December 31, 2015
is as follows:
|
|
2015
|
2014
|
2013
|
||||||||||||||
|
Pine pulpwood
|
66
|
%
|
249,000
|
|
70
|
%
|
303,000
|
|
71
|
%
|
854,000
|
|
|||||
|
Pine sawtimber
|
27
|
%
|
100,000
|
|
20
|
%
|
87,000
|
|
23
|
%
|
283,000
|
|
|||||
|
Pine grade logs
|
6
|
%
|
24,000
|
|
6
|
%
|
25,000
|
|
5
|
%
|
64,000
|
|
|||||
|
Other
|
1
|
%
|
2,000
|
|
4
|
%
|
18,000
|
|
1
|
%
|
8,000
|
|
|||||
|
Total
|
100
|
%
|
375,000
|
|
100
|
%
|
433,000
|
|
100
|
%
|
1,209,000
|
|
|||||
Year Ended
December 31, 2015
Compared to the Year Ended
December 31,
2014
Changes in our timber revenue from 2014 to 2015 are primarily driven by the results of the AgReserves Sale discussed above. In connection with the AgReserves Sale that we completed on March 5, 2014, we recorded $569.9 million in revenues from real estate sales, including the accelerated recognition of $11.0 million of deferred revenue arising from our 2006 agreement with the FDOT. We recorded cost of sales of $58.4 million related to the AgReserves Sale, including $48.7 million related to our carrying value for land, timber and property and closing costs of $9.8 million.
During
2015
, we sold approximately 3,330 acres of rural and timber land for $5.3 million.
44
The following table sets forth our timber sales activity by volume sold and average price:
|
|
Year Ended December 31, 2015
|
Year Ended December 31, 2014
|
|||||||||||||||||||
|
|
Revenues
|
Tons
|
Average price
|
Revenues
|
Tons
|
Average price
|
|||||||||||||||
|
|
(In millions)
|
(In millions)
|
|||||||||||||||||||
|
RockTenn supply agreement
|
$
|
—
|
|
—
|
|
$
|
—
|
|
$
|
3.2
|
|
111,000
|
|
$
|
28.83
|
|
|||||
|
Open market sales
|
6.6
|
|
375,000
|
|
17.60
|
|
7.0
|
|
322,000
|
|
21.74
|
|
|||||||||
|
Total
|
$
|
6.6
|
|
375,000
|
|
$
|
17.60
|
|
$
|
10.2
|
|
433,000
|
|
$
|
23.56
|
|
|||||
As a result of the AgReserves Sale we transferred the RockTenn supply agreement to AgReserves and are no longer selling under that agreement. In addition, tons of timber sold, the average price per ton and total revenue from timber sales in the open market sales decreased in
2015
as compared to
2014
as a result of our significantly lower holdings of timber land. Specifically, (1) we sold
375,000
tons during 2015 as compared to
433,000
tons during 2014, (2) the average price per ton sold decreased to $17.60 in 2015 from $21.74 in 2014 and (3) total revenues from timber sales decreased by approximately
$4.8 million
during
2015
as compared to
2014
. Prior to the AgReserves Sale, we primarily cut and delivered the timber sold, however after the AgReserves Sale we primarily sold the timber on site and required the purchaser to cut and pay for removal of the timber. This resulted in a lower average sales price but increased our gross profit margin per ton.
The gross margin, excluding the recognition of the deferred revenue from the imputed lease, increased during
2015
, to
88.1%
, as compared to 56.7% during
2014
.
Other operating expenses decreased
$1.0 million
during
2015
, as compared to
2014
, due to severance costs that were paid in the first quarter of 2014, related to the workforce reduction in our forestry operations due to the AgReserves Sale.
Other income consists primarily of income from hunting leases, which decreased
$0.1 million
during
2015
, as compared to
2014
, primarily due to hunting leases that were sold and use practices.
45
Year Ended
December 31,
2014
Compared to Year Ended
December 31,
2013
As previously discussed, changes in our timber revenue from 2014 to 2013 are primarily driven by the results of the AgReserves Sale in March 2014. In connection with the AgReserves sale, we recorded $569.9 million in revenues from real estate sales, including the accelerated recognition of $11.0 million of deferred revenue arising from our 2006 agreement with the FDOT. We recorded cost of sales of $58.4 million related to the AgReserves Sale, including $48.7 million related to our carrying value for land, timber and property and closing costs of $9.8 million. The following table set forth our timber sales activity by volume sold and average price:
|
Year Ended December 31, 2014
|
Year Ended December 31, 2013
|
||||||||||||||||||||
|
Revenues
|
Tons
|
Average price
|
Revenues
|
Tons
|
Average price
|
||||||||||||||||
|
(In millions)
|
(In millions)
|
||||||||||||||||||||
|
RockTenn supply agreement
|
$
|
3.2
|
|
111,000
|
|
$
|
28.83
|
|
$
|
15.4
|
|
553,000
|
|
$
|
27.85
|
|
|||||
|
Open market sales
|
7.0
|
|
322,000
|
|
21.74
|
|
19.6
|
|
656,000
|
|
29.88
|
|
|||||||||
|
Total
|
$
|
10.2
|
|
433,000
|
|
$
|
23.56
|
|
$
|
35.0
|
|
1,209,000
|
|
$
|
28.95
|
|
|||||
As previously discussed, we completed the AgReserves Sale on March 5, 2014.
As a result of the AgReserves Sale we transferred the RockTenn supply agreement to AgReserves, therefore our results for 2014 include only three months of sales under that agreement. In addition, tons of timber sold, the average price per ton and total revenue from timber sales in the open market sales decreased in 2014 as compared to 2013 as a result of our significantly lower holdings of timber land. Specifically, (1) we sold 433,000 tons during 2014 as compared to 1,209,000 tons during 2013, (2) the average price per ton sold decreased to $21.74 in 2014 from $29.88 in 2013 and (3) total revenues from timber sales decreased by approximately $24.0 million during 2014 as compared to 2013. Prior to the AgReserves Sale, we primarily cut and delivered the timber sold, however after the AgReserves Sale we primarily sold the timber on site and required the purchaser to cut and pay for removal of the timber. This resulted in a lower average sales price but increased our gross profit margin per ton.
In addition, timber sales in 2014 included $1.1 million of deferred revenue related to an imputed land lease that was to be recognized over the life of the timber deeds sold in March 2011. We sold substantially all the land included in the imputed lease as part of the AgReserves Sale and recognized the remaining deferred revenue during 2014.
The gross margin, excluding the recognition of the deferred revenue from the imputed lease, increased during 2014, to 56.7%, as compared to 39.4% during 2013. Subsequent to the AgReserves Sale, we have primarily sold product on site without the associated delivery costs, which has decreased prices and increased our gross profit margin.
Other income consists primarily of income from hunting leases, which decreased $1.0 million during 2014, as compared to 2013, primarily due to hunting leases that were sold as part of the AgReserves Sale.
46
Liquidity and Capital Resources
As of
December 31, 2015
, we had cash and cash equivalents of
$212.8 million
, compared to
$34.5 million
as of
December 31, 2014
. In addition to cash and cash equivalents, we consider investments classified as available-for-sale securities, especially our investments in U.S. Treasury securities, as being generally available to meet our liquidity needs. Securities classified as available-for-sale securities are not as liquid as cash and cash equivalents, but they are generally convertible into cash within a relatively short period of time. As of
December 31, 2015
, we had investments in U.S. Treasuries of
$184.7 million
and investments in corporate debt securities and preferred stock investments of
$6.5 million
as compared to investments in U.S. Treasuries of
$509.8 million
and investments in corporate debt securities and preferred stock investments of
$127.1 million
as of
December 31, 2014
. The decrease in investments is related to $305.0 million of common stock repurchases in 2015.
Fairholme Capital Management, L.L.C., or one of its affiliates (“Fairholme Capital”) has served as our investment advisor since April 2013. Fairholme Capital receives no compensation for services to us. As of
December 31, 2015
, the funds managed by Fairholme Capital beneficially owned approximately 32.5% of our common stock. Mr. Bruce Berkowitz is the Managing Member of Fairholme Capital and the Chairman of our Board of Directors.
Pursuant to the terms of the Investment Management Agreement as amended (the “Agreement”), with Fairholme Capital, Fairholme Capital agreed to supervise and direct the investments of our accounts in accordance with the investment guidelines and restrictions approved by the Investment Committee of our Board of Directors. The investment guidelines are set forth in the Agreement and require that, as of the date of any investment: (i) at least 50% of the investment account be held in cash or cash equivalents, as defined in the Agreement, (ii) no more than 15% of the investment account may be invested in securities of any one issuer (excluding the U.S. Government) and (iii) any investment in any one issuer (excluding the U.S. Government) that exceeds 10%, but not 15%, requires the consent of at least two members of the Investment Committee. The investment accounts may not be invested in common stock securities.
As of
December 31, 2015
, the investment accounts included
$18.2 million
of money market funds and
$175.0 million
of commercial paper (all of which are classified within cash and cash equivalents on our Consolidated Balance Sheet),
$184.7 million
of U.S. Treasury securities (all of which are classified within investments on our Consolidated Balance Sheet),
$6.3 million
of corporate debt securities and
$0.2 million
of preferred stock investments. The issuer of the corporate debt securities and preferred stock is Sears Holdings Corp or affiliates.
We believe that our current cash position and our anticipated cash flows will provide us with sufficient liquidity to satisfy our anticipated working capital needs, expected capital expenditures, principal and interest payments on our long term debt, and authorized stock repurchases for the next twelve months.
In October 2015, the Pier Park North joint venture refinanced its construction loan and entered into a $48.2 million loan (the “Refinanced Loan”). As of
December 31, 2015
,
$48.2 million
was outstanding on the Refinanced Loan. The Refinanced Loan accrues interest at a rate of 4.1% per annum and matures in November 2025. The Refinanced Loan provides for interest only payments during the first twelve months and principal and interest payments on the Refinanced Loan thereafter with a final balloon payment at maturity. The Refinanced Loan is secured by a first lien on, and security interest in, a majority of the Pier Park North joint venture’s property and a short term $6.62 million letter of credit. In connection with the Refinanced Loan, we entered into a limited guarantee in favor of the lender, based on our percentage ownership of the joint venture. The limited guarantee covers losses arising out of certain events, including (i) tenant security deposits; (ii) tenant rents; (iii) costs and expenses related to any environmental clean-up; (iv) liability for fraud or material breach of warranty with respect to the financing; (v) unpaid real estate taxes assessed against the Property; (vi) failure to maintain required insurance; (vii) foreclosure of the security instrument; or (viii) failure of the joint venture to comply with certain covenants in the security instrument. In addition, the guarantee can become full recourse in the case of any fraud or intentional misrepresentation by the Pier Park North joint venture; any voluntary transfer or encumbrance of the property in violation of the due-on-sale clause in the security instrument; upon commencement of voluntary or insolvency proceedings; and upon breach of covenants in the security instrument. Pursuant to the guarantee, the Pier Park North joint venture partners are required to maintain a minimum of $36 million in combined net worth, not including the value of each partner’s respective equity in the Pier Park North property. See
Note 9,
Real Estate Joint Ventures
.
47
Our real estate investment strategy focuses on projects that meet our investment return criteria. During
2015
, we incurred a total of $17.4 million for capital expenditures, which includes
$5.8 million
related to the Pier Park North joint venture, $7.1 million related to the development of our residential and commercial real estate projects, $2.5 million related primarily to our resorts and leisure operations, and $2.0 million related primarily to our forestry and other segments. Our 2016 budgeted capital expenditures are estimated to total $23.1 million, which includes $17.5 million primarily for the development and acquisition of land for our residential and commercial real estate projects, $3.3 million for our resorts and leisure segment, $0.6 million for our commercial leasing segment, and $1.7 million for our forestry and other segments. A portion of this spending is discretionary and will only be spent if we believe the risk adjusted return warrants the expenditures. We anticipate that these future capital commitments will be funded through our cash and cash equivalents, short term investments and cash generated from operations.
CDD bonds financed the construction of infrastructure improvements in some of our projects. The principal and interest payments on the bonds are paid by assessments on the properties benefited by the improvements financed by the bonds. We have recorded a liability for CDD assessments that are associated with platted property, which is the point at which the assessments become fixed or determinable. Additionally, we have recorded a liability for the balance of the CDD assessment that is associated with unplatted property if it is probable and reasonably estimable that we will ultimately be responsible for repaying. We have recorded debt of
$7.0 million
related to CDD debt as of
December 31, 2015
. Our total outstanding CDD assessments were
$22.5 million
at
December 31, 2015
, which is comprised of
$18.6 million
at SouthWood,
$3.1 million
at the existing Pier Park retail center,
$0.7 million
at Wild Heron and less than $0.1 million at NatureWalk.
As of January 1, 2015, we had $103.8 million remaining under our stock repurchase program (the “Stock Repurchase Program”). From January 1 through August 15, 2015, we repurchased 634,596 shares of our common stock in open market transactions at an average weighted price of $16.03 for a total of $10.2 million. On August 15, 2015 our Board of Directors increased our Stock Repurchase Program authorization to permit the repurchase of up to $300.0 million (including $93.6 million that remained unused from the previous authorization).
On August 21, 2015, we commenced a tender offer to purchase up to 16,666,666 shares of our common stock at a price of $18.00 per share. Upon consummation of this tender offer, we purchased 16,348,143 shares of our common stock at a purchase price of $18.00 per share, for a total purchase price of $294.3 million and $0.5 million in related costs. In October 2015, our Board of Directors again increased our Stock Repurchase Program authorization to permit the repurchase of an additional $200.0 million. As of December 31, 2015, we had a total of $205.7 million available for purchase of shares under our Stock Repurchase Program. We may repurchase our stock in open market purchases from time to time pursuant to Rule 10b-18, in privately negotiated transactions or otherwise. The timing and amount of any additional shares to be repurchased will depend upon a variety of factors, including market and business conditions, applicable legal requirements and other factors. Repurchases may be commenced or suspended at any time or from time to time without prior notice. The Stock Repurchase Program will continue until otherwise modified or terminated by our Board of Directors at any time in our sole discretion. Subsequent to December 31, 2015 but prior to the filing of this annual report, we purchased an additional 995,650 shares for an aggregate purchase price of $14.8 million.
Summary of Cash Flows
A summary of our cash flows from operating, investing and financing activities for the three years ended
December 31, 2015
are as follows:
|
2015
|
2014
|
2013
|
|||||||||
|
(Dollars in millions)
|
|||||||||||
|
Net cash provided by operating activities
|
$
|
22.4
|
|
$
|
331.0
|
|
$
|
16.3
|
|
||
|
Net cash provided by (used in) investing activities
|
445.4
|
|
(518.7
|
)
|
(171.4
|
)
|
|||||
|
Net cash (used in) provided by financing activities
|
(289.5
|
)
|
200.3
|
|
11.0
|
|
|||||
|
Net increase (decrease) in cash and cash equivalents
|
178.3
|
|
12.6
|
|
(144.1
|
)
|
|||||
|
Cash and cash equivalents at beginning of the year
|
34.5
|
|
21.9
|
|
166.0
|
|
|||||
|
Cash and cash equivalents at end of the year
|
$
|
212.8
|
|
$
|
34.5
|
|
$
|
21.9
|
|
||
48
Cash Flows from Operating Activities
Cash flows from operating activities include costs related to assets ultimately planned to be sold, including residential real estate development and related amenities, sales of undeveloped and developed land, our forestry operations and land developed by the commercial real estate segment. Net cash provided by operations was
$22.4 million
in
2015
, as compared to
$331.0 million
in
2014
. This large decrease in net cash provided by operations in
2015
as compared to
2014
is primarily as a result of the AgReserves Sale. In addition, we received $19.6 million RiverTown Note payment during
2015
. Net cash provided by operations was $331.0 million in 2014, as compared to $16.3 million in 2013. This large increase in net cash provided by operations in 2014 as compared to 2013 is primarily attributable to the proceeds we received from the AgReserves Sale and the RiverTown Sale.
During
2015
, capital expenditures related to assets ultimately planned to be sold were
$8.4 million
and consisted of $4.9 million relating to our residential real estate segment, $2.2 million for our commercial real estate segment, and $1.3 million for our forestry segment. The expenditures relating to our residential real estate and commercial real estate segments were primarily for site infrastructure development, general amenity construction, and the acquisition of commercial land.
Cash Flows from Investing Activities
Cash flows provided by investing activities primarily includes purchases and sales of investments, investments in assets held by special purpose entities, capital expenditures incurred by our Pier Park North joint venture for property to be held and used in the joint venture’s operations and capital expenditures for property and equipment used in our operations. During
2015
, cash flows provided by investing activities were
$445.4 million
, which includes our total net purchases, sales and maturities of our available-for-sale investments of $453.7 million and $0.8 million for investments and maturities in assets held by special purpose entities. During
2014
, cash flows used in investing activities were
$518.7 million
, which includes our total net purchases, sales and maturities of our available-for-sale investments of $489.9 million and $6.9 million for investments in assets held by special purpose entities. See Note 5,
Real Estate Sales
, included in the Notes to the Consolidated Financial Statements included in Item 15 of this Form 10-K for further discussion on our special purpose entities. During
2013
, cash flows used in investing activities were
$171.4 million
, which includes our total purchases, sales and maturities of U.S. treasury securities and corporate debt securities of $149.0 million.
During
2015
, capital expenditures incurred by our Pier Park North joint venture were
$5.8 million
which were reported in our leasing operations segment and capital expenditures for other property and equipment were
$3.3 million
, which were primarily for our resorts and leisure segment. Capital expenditures incurred by our Pier Park North joint venture were $22.6 million during 2014 and $19.3 million during 2013. Capital expenditures for other property and equipment were $2.5 million during 2014 and $3.6 million during 2013, which were primarily for our resorts, leisure and leasing operations segment. In addition, we received $3.0 million in proceeds from the sale of our fifty percent ownership interest in our East San Marco real estate joint venture during 2014.
Cash Flows from Financing Activities
Net cash used in financing activities was
$289.6 million
for
2015
compared to net cash provided by financing activities of $200.3 million for 2014, primarily a result of the repurchase of common stock in 2015, compared to NFTF’s issuance of Senior Notes in 2014. In 2015,
$305.0 million
was used for the repurchase of our common stock. Financing activities include
$48.2 million
of borrowings on the Pier Park North joint venture Refinanced Loan, partially offset by payments of approximately
$31.9 million
related to our Pier Park North construction loan and other CDD payments. Financing activities also include $
0.7 million
of debt issuance costs and capital distribution to non-controlling interest of
$0.1 million
. Net cash provided by financing activities was $200.3 million in 2014 compared to $11.0 million for 2013. This large increase in net cash provided by financing activities in 2014 as compared to 2013 is primarily a result of NFTF’s issuance of Senior Notes in 2014.
49
Off-Balance Sheet Arrangements
In October 2015, the Pier Park North joint venture refinanced its construction loan and entered into a $48.2 million loan. The Refinanced Loan will accrue interest at a rate of 4.1% per annum and matures in November 2025. The Refinanced Loan provides for interest only payments during the first twelve months and principal and interest payments thereafter with a final balloon principal payment at maturity of the Refinanced Loan. The Refinanced Loan is secured by a first lien on, and security interest in, a majority of Pier Park North joint venture’s property and a short term
$6.62 million
letter of credit. In connection with the Refinanced Loan, we entered into a limited guarantee and are required to comply with a financial covenant as described in
Note 9,
Real Estate Joint Ventures
.
During 2008 and 2007, we sold 132,055 acres of timberland in exchange for fifteen year installment notes receivable in the aggregate amount of $183.3 million. The installment notes are fully backed by irrevocable letters of credit issued by Wachovia Bank, N.A. (now a subsidiary of Wells Fargo & Company). We contributed the installment notes to bankruptcy remote qualified special purpose entities. The entities’ financial condition and financial results are not consolidated in our financial statements.
During 2008 and 2007, the entities monetized $183.3 million of installment notes by issuing debt securities to third party investors equal to approximately 90% of the value of the installment notes. Approximately $163.0 million in net proceeds were distributed to us during 2008 and 2007. The debt securities are payable solely out of the assets of the entities and proceeds from the letters of credit. The investors in the entities have no recourse against us for payment of the debt securities or related interest expense. We have recorded a retained interest with respect to all entities of
$10.2 million
for all installment notes monetized through
December 31, 2015
. This balance represents the present value of future cash flows to be received over the life of the installment notes, using management’s best estimates of underlying assumptions, including credit risk and interest rates as of the date of the monetization, plus the accretion of investment income based on an effective yield, which is recognized over the term of the notes, less actual cash receipts. We continue to update the expectation of cash flows to be collected over the term of the notes. Changes to the previously projected cash flows are accounted for prospectively, unless based on management’s assessment of current information and events, it is determined that there is an other-than-temporary impairment. We have not recorded an other-than-temporary impairment during the three years ended
December 31, 2015
.
At
December 31, 2015
, the Company was required to provide surety bonds that guarantee completion of certain infrastructure in certain development projects and mitigation banks of
$7.1 million
and standby letters of credit in the amount of
$0.5 million
, which may potentially result in liability to the Company if certain obligations of the Company are not met.
50
Contractual Obligations at
December 31, 2015
|
|
Payments due by Calendar Period
|
||||||||||||||||||
|
Total
|
Less Than
1 Year
|
1-3 Years
|
3-5 Years
|
More Than
5 Years
|
|||||||||||||||
|
|
In millions
|
||||||||||||||||||
|
Debt
(1)
|
$
|
55.2
|
|
$
|
0.2
|
|
$
|
2.0
|
|
$
|
2.2
|
|
$
|
50.8
|
|
||||
|
Interest related to debt, including community development district debt
(1)
|
20.6
|
|
2.2
|
|
4.3
|
|
4.2
|
|
9.9
|
|
|||||||||
|
Contractual obligations
(2)
|
1.4
|
|
0.7
|
|
0.2
|
|
0.5
|
|
—
|
|
|||||||||
|
Other long term liabilities
(3)
|
131.1
|
|
—
|
|
—
|
|
—
|
|
131.1
|
|
|||||||||
|
Senior Notes held by special purpose entity
(4)
|
180.0
|
|
—
|
|
—
|
|
—
|
|
180.0
|
|
|||||||||
|
Interest related to Senior Notes held by special purpose entity
(4)
|
115.3
|
|
8.6
|
|
17.1
|
|
17.1
|
|
72.5
|
|
|||||||||
|
Total contractual obligations
|
$
|
503.6
|
|
$
|
11.7
|
|
$
|
23.6
|
|
$
|
24.0
|
|
$
|
444.3
|
|
||||
|
(1)
|
These amounts do not include additional CDD obligations associated with unplatted properties that are not yet fixed or determinable or that are not yet probable or reasonably estimable.
|
|
(2)
|
These aggregate amounts include individual contracts in excess of $0.1 million.
|
|
(3)
|
Other long term liabilities include certain of our deferred tax liabilities related to our installment note monetization transactions.
|
|
(4)
|
Senior Notes held by a consolidated special purpose entity. There is no recourse against the Company on the Senior Notes as recourse is limited to proceeds from the Timber Note and the underlying Letter of Credit held by the special purpose entity. See Note 5,
Real Estate Sales
, of our Consolidated Financial Statements included in this Form 10-K for further discussion.
|
51
Critical Accounting Estimates
The discussion and analysis of our financial condition and results of operations are based upon our consolidated financial statements, which have been prepared in accordance with U.S. generally accepted accounting principles. The preparation of these financial statements requires us to make estimates and judgments that affect the reported amounts of assets, liabilities, revenues and expenses, and related disclosures of contingent assets and liabilities. We base these estimates on historical experience, available current market information and on various other assumptions that management believes are reasonable under the circumstances. Additionally, we evaluate the results of these estimates on an on-going basis. Management’s estimates form the basis for making judgments about the carrying values of assets and liabilities that are not readily apparent from other sources. Actual results may differ from these estimates under different assumptions or conditions, and our accounting estimates are subject to change.
Investment in Real Estate and Cost of Real Estate Sales.
Costs associated with a specific real estate project are capitalized during the development period. We capitalize costs directly associated with development and construction of identified real estate projects. Indirect costs that clearly relate to a specific project under development, such as project administration, may also be capitalized. We capitalize interest (up to total interest expense) based on the amount of underlying expenditures and real estate taxes on real estate projects under development.
Real estate development costs also include land and common development costs (such as roads, sewers and amenities), capitalized property taxes, capitalized interest and certain indirect costs. A portion of real estate development costs and estimates for costs to complete are allocated to each unit based on the relative sales value of each unit as compared to the estimated sales value of the total project. These estimates are reevaluated at least annually and more frequently if warranted by market conditions, changes in the project’s scope or other factors, with any adjustments being allocated prospectively to the remaining property or units available-for-sale.
The capitalization period relating to direct and indirect project costs is the period in which activities necessary to ready a property for its intended use are in progress. The period begins when such activities commence, typically when we begin the entitlement processes for land already owned, and ends when the asset is substantially complete and ready for its intended use. Determination of when construction of a project is substantially complete and ready for its intended use requires judgment. We determine when the capitalization period begins and ends through communication with project and other managers responsible for the tracking and oversight of individual projects. In the event that the activities to ready the asset for its intended use are suspended, the capitalization period will cease until such activities are resumed. If we determine not to complete a project, any previously capitalized costs are expensed in the period in which the determination is made and recovery is not deemed reasonable.
Our investments in real estate are carried at cost, net of depreciation and timber depletion, unless circumstances indicate that the carrying value of the assets may not be recoverable. If we determine that an impairment exists due to the inability to recover an asset’s carrying value, an impairment charge is recorded to the extent that the carrying value exceeds estimated fair value. If such assets were held for sale, the provision for loss would be recorded to the extent that the carrying value exceeds estimated fair value less costs to sell.
Long-Lived Assets.
We review our long-lived assets for impairment whenever events or changes in circumstances indicate that the carrying amount of an asset may not be recoverable. Long-lived assets include our investments in operating and development property and property and equipment, net. Some of the events or changes in circumstances that we consider as indicators of potential impairment include:
|
•
|
a prolonged decrease in the fair value or demand for the properties;
|
|
•
|
a change in the expected use or development plans for the properties;
|
|
•
|
continuing operating or cash flow losses for an operating property; and
|
|
•
|
an accumulation of costs in a development property to be held long-term above the amount originally expected.
|
We use varying methods to determine if impairment exists, such as (i) considering indicators of potential impairment, (ii) analyzing expected future cash flows and comparing the expected future undiscounted cash flows of the property to the carrying value, or (iii) determining market resale values.
52
The accounting estimate related to real estate impairment evaluation is susceptible to change due to the use of assumptions about future sales proceeds and future expenditures. For projects under development, an estimate of future cash flows on an undiscounted basis is performed using estimated future expenditures necessary to maintain the existing project and using management’s best estimates about future sales prices and planned holding periods. Based on our investment return criteria for evaluating our projects under development or undeveloped, management’s assumptions used in the projection of undiscounted cash flows include:
|
•
|
the projected pace of sales of homesites based on estimated market conditions and our development plans;
|
|
•
|
estimated pricing and projected price appreciation over time;
|
•
the amount and trajectory of price appreciation over the estimate selling period;
|
•
|
the length of the estimated development and selling periods, which can differ depending on the size of the development and the number of phases to be developed;
|
|
•
|
the amount of remaining development costs, including the extent of infrastructure or amenities included in such development costs;
|
|
•
|
holding costs to be incurred over the selling period;
|
|
•
|
for bulk land sales of undeveloped and developed parcels future pricing is based upon estimated developed lot pricing less estimated development costs and estimated developer profit;
|
|
•
|
for commercial development property, future pricing is based on sales of comparable property in similar markets; and
|
|
•
|
whether liquidity is available to fund continued development.
|
For operating properties, an estimate of undiscounted cash flows requires management to make similar assumptions about the use and eventual disposition of such properties. Some of the significant assumptions that are used to develop the undiscounted cash flows include:
|
•
|
for investments in inns and rental condominium units, average occupancy and room rates, revenues from food and beverage and other amenity operations, operating expenses and capital expenditures, and eventual disposition of such properties as private residence vacation units or condominiums, based on current prices for similar units appreciated to the expected sale date;
|
|
•
|
for investments in commercial or retail property, future occupancy and rental rates and the amount of proceeds to be realized upon eventual disposition of such property at a terminal capitalization rate; and
|
|
•
|
for investments in golf courses, future memberships, rounds and greens fees, operating expenses and capital expenditures, and the amount of proceeds to be realized upon eventual disposition of such properties at a multiple of terminal year cash flows.
|
Other properties that management does not intend to sell in the near term under current market conditions and has the ability to hold are evaluated for impairment based on management’s best estimate of the long-term use and eventual disposition of the property. Typically, assets are carried based on historical cost basis which in some cases exceeds fair value if sold in the near term. The results of impairment analysis for development and operating properties are particularly dependent on the estimated holding and selling period for each asset group.
If a property is considered impaired, the impairment charge is determined by the amount the property’s carrying value exceeds its fair value. We use varying methods to determine fair value, such as (i) analyzing expected future cash flows, (ii) determining resale values by market, (iii) applying a capitalization rate to net operating income using prevailing rates in a given market or (iv) applying a multiple to revenues using prevailing rates in a given market. The fair value of a property may be derived either from discounting projected cash flows at an appropriate discount rate, through appraisals of the underlying property, or a combination thereof.
We classify the assets and liabilities of a long-lived asset as held-for-sale when management approves and commits to a formal plan of sale and it is probable that a sale will be completed. The carrying value of the assets held-for-sale is then recorded at the lower of their carrying value or fair value less costs to sell.
53
Investments.
We evaluate investments classified as available-for-sale with unrealized losses to determine if they are other-than-temporary impaired. This evaluation is based on various factors, including the financial condition, business prospects, industry and creditworthiness of the issuer, severity and length of time the securities were in a loss position, our ability and intent to hold investments until unrealized losses are recovered or until maturity and amount of the unrealized loss. If a decline in fair value is considered other-than-temporary, the decline is then bifurcated into its credit and non-credit related components. The amount of the credit-related component is recognized in earnings, and the amount of the non-credit related component is recognized in other comprehensive loss, unless we intend to sell the security or it is more likely than not that we will be required to sell the security prior to its anticipated recovery. Based on these factors, the unrealized losses related to the Company's debt securities of
$1.1 million
were determined to be temporary at
December 31, 2015
.
Retained interest investments
. We have recorded retained interest investments with respect to the monetization of certain installment notes through the use of qualified special purpose entities, which are recorded in Other assets in our Consolidated Balance Sheets. At the time of monetization the initial retained interest recorded was an estimate based on the present value of future excess cash flows expected to be received over the life of the notes, using management’s best estimate of underlying assumptions, including credit risk and discount rates. We recognize investment income over the life of the retained interest using the effective yield method with rates ranging from
3.7%
-
11.7%
based on expected future cash flows. We continue to update the expectation of cash flows to be collected over the life of the retained interest. Changes to the previously projected cash flows are accounted for prospectively, unless based on management’s assessment of current information and events, it is determined that there is an other-than-temporary impairment. We have not recorded an other-than-temporary impairment related to our retained interest investments during the three years ended December 31,
2015
.
Pension plan.
In 2014 the pension plan was terminated. In November 2012, the Board of Directors approved the termination of our Pension Plan, which was frozen in March 2013 pending regulatory approvals which were received in August 2014. As of December 31, 2014, the Pension Plan assets were distributed to Pension Plan participants and $7.9 million was distributed to our 401(k) Plan to pay additional future benefits. Subsequent to these distributions, the remaining Pension Plan assets of $23.8 million were reverted to us in December 2014. During 2015, we recorded an expense of $1.0 million for the fair value of the assets that were allocated to participants. Any gains and losses on these assets are reflected in the Company’s Consolidated Statements of Operations and were a $0.1 million gain for 2015. Refer to Note 8,
Financial Instruments and Fair Value Measurements.
In addition, we expect to record additional expenses of approximately $7.1 million as the assets in our 401(k) Plan are allocated to participants over the next six years.
Income Taxes.
In preparing our Consolidated Financial Statements, significant management judgment is required to estimate our income taxes. Our estimates are based on our interpretation of federal and state tax laws. We estimate our actual current tax due and assess temporary differences resulting from differing treatment of items for tax and accounting purposes. The temporary differences result in deferred tax assets and liabilities, which are included in our Consolidated Balance Sheets. Adjustments may be required by a change in assessment of our deferred tax assets and liabilities, changes due to audit adjustments by federal and state tax authorities, and changes in tax laws. To the extent adjustments are required in any given period we will include the adjustments in the deferred tax assets and liabilities in our Consolidated Financial Statements. We recorded a valuation allowance against our deferred tax assets based upon our analysis of the timing and reversal of future taxable amounts and our history and future expectations of taxable income.
A valuation allowance is recorded if based on the weight of available evidence it is more likely than not that some portion or all of the deferred tax asset will not be realized. Realization of our deferred tax assets is dependent upon us generating sufficient taxable income in future years in the appropriate tax jurisdictions to obtain a benefit from the reversal of deductible temporary differences and from net operating loss carryforwards.
54
We had no federal net operating loss carryforwards at
December 31, 2015
and
2014
. We had a state net operating loss carryforward of
$325.7 million
and
$323.9 million
, respectively, at December 31,
2015
, and
2014
. The majority of state net operating losses are available to offset future taxable income through 2031. As of December 31,
2015
, based on the timing of reversal of future taxable amounts and our history of losses, we do not believe that we have met the requirements to realize the benefits of certain of our deferred tax assets for our state net operating loss carryforwards; therefore, we have maintained a valuation allowance of
$6.0 million
for these deferred tax assets at December 31,
2015
.
Variable Interest Entities.
In 2014, in connection with the AgReserves Sale, two special purpose entities were created, NFTF and Buyer SPE. We own the equity interest in NFTF, but no equity interest in the Buyer SPE. Both the Buyer SPE and NFTF are distinct legal entities and the assets of the Buyer SPE and NFTF are not available to satisfy our liabilities or obligations and the liabilities of the Buyer SPE and NFTF are not our liabilities or obligations. In the event that proceeds from the financial instruments are insufficient to settle all of the liabilities of the Buyer SPE or NFTF, we are not obligated to contribute any funds to either the Buyer SPE or NFTF.
We have determined that we are the primary beneficiary of the Buyer SPE and NFTF, and therefore, the Buyer SPE’s and NFTF’s assets and liabilities are consolidated in our financial statements as of December 31, 2015. The carrying amounts of the Buyer SPE’s and NFTF’s assets and non-recourse liabilities were $213.5 million and $180.3 million, respectively, as of December 31, 2015. The consolidated assets of the Buyer SPE and NFTF consist of a $200 million time deposit that subsequent to April 2, 2014 pays interest at 4.006% and matures in March 2029, accrued interest of $3.3 million on the time deposit, U.S. Treasuries of $8.5 million, and cash of $0.3 million and deferred issuance costs of $1.4 million for the Senior Notes. The consolidated liabilities include the Senior Notes issued by NFTF of $177.4 million net of the $2.5 million discount and $2.9 million accrued interest expense on the Senior Notes.
Our consolidated Statements of Operations for the year ended December 31, 2015 includes $8.2 million of interest income on the time deposit and amortization of the discounts on the U.S. Treasuries and $8.8 million of interest expense for the Senior Notes, amortization of the discount and issuance costs related to the Buyer SPE and NFTF.
Recently Issued Accounting Pronouncements
Revenue recognition
In May 2014, the FASB issued an ASU that establishes the principles used to recognize revenue for all entities. The new guidance will be effective for annual and interim periods beginning after December 15, 2017. Early application will be permitted, but not before annual reporting periods beginning after December 15, 2016. The Company is currently evaluating the impact that the adoption of this guidance will have on its Consolidated Balance Sheets, Statements of Operations, Statements of Comprehensive (Loss) Income or Statements of Cash Flows.
Consolidation
In February 2015, the FASB issued an ASU that amends the existing consolidation guidance related to (i) limited partnerships and similar legal entities, (ii) the evaluation of variable interests for fees paid to decision makers or service providers, (iii) the effect of fee arrangements and related parties on the primary beneficiary determination, and (iv) certain investment funds. These changes are expected to limit the number of consolidation models and place more emphasis on risk of loss when determining a controlling financial interest. The new guidance will be effective for the Company as of January 1, 2016. Early adoption is permitted, including early adoption in an interim period. The Company has evaluated the impact of the adoption of this guidance and determined there will be no impact on the Consolidated Balance Sheets, Statements of Operations, Statements of Comprehensive (Loss) Income or Statements of Cash Flows. The Company had not adopted this ASU as of
December 31, 2015
.
Debt issuance costs
In April 2015, the FASB issued an ASU that requires debt issuance costs related to a recognized debt liability to be presented in the balance sheet as a direct deduction from the carrying amount of that debt liability, consistent with debt discounts. The amendment does not affect the recognition and measurement guidance for debt issuance costs. The new guidance should be applied on a retrospective basis and is effective for the Company as of January 1, 2016. Early adoption is permitted for financial statements that have not been previously issued. The Company has evaluated the impact of the adoption of this guidance and determined that the adoption will not have a material impact on its financial condition. The Company had not adopted this ASU as of December 31, 2015.
55
Financial Instruments
In January 2016, the FASB issued an ASU that amends existing guidance to address certain aspects of recognition, measurement, presentation, and disclosure of financial instruments. The new guidance will require equity investments (except those accounted for under the equity method of accounting, or those that result in consolidation of the investee) to be measured at fair value with changes in fair value recognized in net income. Additionally, certain disclosure requirements and other aspects of accounting for financial instruments will change as a result of the new guidance, which is effective for interim and annual reporting periods beginning after December 15, 2017. The Company is currently evaluating the impact that the adoption of the new guidance will have on its financial condition and results of operations.
56
Forward-Looking Statements
This annual report contains “forward-looking statements” within the meaning of Section 27A of the Securities Act and Section 21E of the Exchange Act. These statements concern expectations, beliefs, projections, plans and strategies, anticipated events or trends and similar expressions concerning matters that are not historical facts. Specifically, this annual report contains forward-looking statements regarding:
|
•
|
our expectations concerning our future business strategy and the impact of this strategy on our cash flows, financial condition and results of operations;
|
|
•
|
our expectations concerning our intent to seek additional opportunities to invest our liquid assets, including our intent to seek opportunities that could increase our returns;
|
|
•
|
our expectation to repurchase our shares through our Stock Repurchase Program;
|
|
•
|
our expectations concerning the benefits of our recent repurchase of shares, including our recent tender offer;
|
|
•
|
our expectations concerning demand for residential real estate, including mixed-use and active adult communities in Northwest Florida and our ability to develop projects that meet that demand;
|
|
•
|
our expectations regarding the wide range of residential and commercial uses of our Bay-Walton Sector Plan land holdings, including to serve the active adult retirement market;
|
|
•
|
our beliefs concerning the volatility in the consistency and pace of our residential real estate sales, the type of buyers interested in our residential real estate, and the mix of homesites that will be available for sale and the related effect on our gross profit margins;
|
|
•
|
our beliefs concerning the seasonality of our revenues;
|
|
•
|
our expectations regarding the amount and timing of the impact fees which we will receive in connection with the RiverTown Sale;
|
|
•
|
our expectations regarding the costs and benefits of the Timber Note monetization structure, including the timing and amount of the expenses that NFTF will incur during the life of the Timber Note and the amount of the remaining principal balance;
|
|
•
|
our expectation regarding the lack of substantial revenues from sales of our timber or rural lands in the future;
|
|
•
|
our expectation regarding our liquidity or ability to satisfy our working capital needs, expected capital expenditures, principal and interest payments on our debt and deferred tax liabilities;
|
|
•
|
our expectation regarding cash flows to be received over the term and at the maturity of the 2007 and 2008 installment notes and our intent to hold such notes until maturity;
|
|
•
|
our expectation regarding the impact of pending litigation, claims, other disputes or governmental proceedings, on our cash flows, financial condition or results of operations, and our belief regarding the defenses to pending litigation claims against us;
|
|
•
|
our expectations with respect to the accounting treatment for the AgReserves Sale and related monetization and RiverTown Sale;
|
|
•
|
our estimates regarding certain tax matters and accounting valuations, including our ability to use our tax assets to mitigate any tax liabilities that arise from the AgReserves Sale and the timing and amount we expect to pay in future income taxes;
|
|
•
|
our expectations regarding the sufficiency of the Pension Plan’s surplus assets to fund future benefits to 401(k) Plan participants; and
|
|
•
|
our expectations regarding the impact of new accounting pronouncements.
|
57
These forward-looking statements reflect our current views about future events and are subject to risks, uncertainties and assumptions. We wish to caution readers that certain important factors may have affected and could in the future affect our actual results and could cause actual results to differ significantly from those expressed in any forward-looking statement. The most important factors that could prevent us from achieving our goals, and cause the assumptions underlying forward-looking statements and the actual results to differ materially from those expressed in or implied by those forward-looking statements include, but are not limited to, those risk factors and disclosures set forth in this Form 10-K and subsequent Form 10-Qs and other current reports, and the following:
|
•
|
any changes in our strategic objectives and our ability to implement such strategic objectives;
|
|
•
|
any potential negative impact of our longer-term property development strategy, including losses and negative cash flows for an extended period of time if we continue with the self-development of recently granted entitlements;
|
|
•
|
significant decreases in the market value of our investments in securities or any other investments;
|
|
•
|
our use of our share repurchase authorization and our ability to carry on the Stock Repurchase Program in accordance with applicable securities laws;
|
|
•
|
our ability to capitalize on opportunities relating to a mixed-use and active adult community or communities in Northwest Florida;
|
|
•
|
changes in our customer base and the mix of homesites available for sale in our residential real estate;
|
|
•
|
any downturns in real estate markets in Florida or across the nation;
|
|
•
|
a slowing of the population growth in Florida, including a decrease of the migration of Baby Boomers to Florida;
|
|
•
|
our dependence on the real estate industry and the cyclical nature of our real estate operations;
|
|
•
|
our ability to successfully and timely obtain land use entitlements and construction financing, maintain compliance with state law requirements and address issues that arise in connection with the use and development of our land, including the permits required for mixed-use and active adult communities;
|
|
•
|
changes in laws, regulations or the regulatory environment affecting the development of real estate;
|
|
•
|
our ability to effectively deploy and invest our assets, including our available-for-sale securities;
|
|
•
|
our ability to effectively manage our real estate assets, as well as the ability of our joint venture partner to effectively manage the day-to-day activities of the Pier Park North joint venture;
|
|
•
|
our ability to successfully estimate the amount and timing of the impact fees we will receive in connection with the RiverTown Sale;
|
|
•
|
our ability to successfully estimate the costs and benefits of the Timber Note monetization structure;
|
|
•
|
increases in operating costs, including costs related to real estate taxes, owner association fees, construction materials, labor and insurance, and our ability to manage our cost structure;
|
|
•
|
our ability to anticipate the impact of pending environmental litigation matters or governmental proceedings on our financial condition or results of operations;
|
|
•
|
the expense, management distraction and possible liability associated with litigation, claims, other disputes or governmental proceedings;
|
|
•
|
potential liability under environmental or construction laws, or other laws or regulations;
|
|
•
|
our ability to successfully estimate the impact of certain accounting and tax matters that arise from the AgReserves Sale and RiverTown Sale;
|
|
•
|
significant tax payments arising from any acceleration of deferred taxes that arise from the AgReserves Sale and other transactions; and
|
|
•
|
the performance of the surplus assets in the Pension Plan may not be what we expected.
|
58
Item 7A.
Quantitative and Qualitative Disclosures about Market Risk
We are exposed to market risks primarily from interest rate risk fluctuations. We have investments in corporate debt securities that have fixed interest rates for which changes in interest rates generally affect the fair value of the investment, but not the earnings or cash flows. In addition, our investments in corporate debt securities are non-investment grade, which could affect their fair value and could materially impact our results of operations if a decline in their value is determined to be other-than-temporary. A hypothetical 100 basis point increase in interest rates would result in a decrease of approximately $0.6 million in the market value of our available-for-sale securities as of
December 31, 2015
. Any realized gains or losses resulting from such interest rate changes would only occur if we sold the investments prior to maturity.
Our cash and cash equivalents are invested in demand deposit and money market instruments. Changes in interest rates related to these investments would not significantly impact our results of operations. The amount of interest earned on one of our retained interest investments is based on LIBOR. A 100 basis point change in the interest rate may result in an insignificant change in interest earned on the investment.
Item 8.
Financial Statements and Supplementary Data
The Financial Statements and related notes on pages F 3 to F 46 and the Report of Independent Registered Public Accounting Firm on page F 2 are filed as part of this Report and incorporated by reference.
Item 9.
Changes in and Disagreements with Accountants on Accounting and Financial Disclosure
None.
59
Item 9A.
Controls and Procedures
(a) Evaluation of Disclosure Controls and Procedures.
Our Chief Executive Officer and Chief Financial Officer have evaluated the effectiveness of our disclosure controls and procedures (as such term is defined in Rules 13a-15(e) and 15d-15(e) under the Exchange Act) as of the end of the period covered by this report. Based on this evaluation, our Chief Executive Officer and Chief Financial Officer have concluded that, as of the end of the period covered by this report, our disclosure controls and procedures were effective.
(b)
Changes in Internal Control Over External Financial Reporting.
During the quarter ended
December 31, 2015
there were no changes in our internal controls over external financial reporting that have materially affected, or are reasonably likely to materially affect, our internal controls over external financial reporting.
(c)
Management’s Annual Report on Internal Control Over External Financial Reporting.
Management of the Company is responsible for establishing and maintaining adequate internal control over external financial reporting as defined in Rules 13a-15(f) and 15d-15(f) under the Exchange Act. The Company’s internal control over external financial reporting is designed to provide reasonable assurance regarding the reliability of external financial reporting and the preparation of financial statements for external purposes in accordance with generally accepted accounting principles. The Company’s internal control over financial reporting includes those policies and procedures that:
(i) pertain to the maintenance of records that, in reasonable detail, accurately and fairly reflect the transactions and dispositions of the assets of the Company;
(ii) provide reasonable assurance that transactions are recorded as necessary to permit preparation of financial statements in accordance with generally accepted accounting principles, and that receipts and expenditures of the Company are being made only in accordance with authorizations of management and directors of the Company; and
(iii) provide reasonable assurance regarding prevention or timely detection of unauthorized acquisition, use or disposition of the Company’s assets that could have a material effect on the financial statements.
Management assessed the effectiveness of the Company’s internal control over external financial reporting as of
December 31, 2015
. In making this assessment, management used the criteria described in
Internal Control - Integrated Framework (2013) i
ssued by the Committee of Sponsoring Organizations of the Treadway Commission.
Based on our assessment and those criteria, management concluded that our internal control over external financial reporting was effective as of
December 31, 2015
. Management reviewed the results of their assessment with our Audit Committee. The effectiveness of our internal control over external financial reporting as of
December 31, 2015
has been audited by KPMG LLP, an independent registered public accounting firm, as stated in their attestation report as follows.
60
(d)
Report of Independent Registered Public Accounting Firm.
The Board of Directors and Stockholders
The St. Joe Company:
We have audited The St. Joe Company’s (the Company’s) internal control over financial reporting as of December 31, 2015, based on criteria established in
Internal Control - Integrated Framework (2013)
issued by the Committee of Sponsoring Organizations of the Treadway Commission (COSO). The Company’s management is responsible for maintaining effective internal control over financial reporting and for its assessment of the effectiveness of internal control over financial reporting, included in the accompanying Management’s Annual Report on Internal Control Over Financial Reporting. Our responsibility is to express an opinion on the Company’s internal control over financial reporting based on our audit.
We conducted our audit in accordance with the standards of the Public Company Accounting Oversight Board (United States). Those standards require that we plan and perform the audit to obtain reasonable assurance about whether effective internal control over financial reporting was maintained in all material respects. Our audit included obtaining an understanding of internal control over financial reporting, assessing the risk that a material weakness exists, and testing and evaluating the design and operating effectiveness of internal control based on the assessed risk. Our audit also included performing such other procedures as we considered necessary in the circumstances. We believe that our audit provides a reasonable basis for our opinion.
A company’s internal control over financial reporting is a process designed to provide reasonable assurance regarding the reliability of financial reporting and the preparation of financial statements for external purposes in accordance with generally accepted accounting principles. A company’s internal control over financial reporting includes those policies and procedures that (1) pertain to the maintenance of records that, in reasonable detail, accurately and fairly reflect the transactions and dispositions of the assets of the company; (2) provide reasonable assurance that transactions are recorded as necessary to permit preparation of financial statements in accordance with generally accepted accounting principles, and that receipts and expenditures of the company are being made only in accordance with authorizations of management and directors of the company; and (3) provide reasonable assurance regarding prevention or timely detection of unauthorized acquisition, use, or disposition of the company’s assets that could have a material effect on the financial statements.
Because of its inherent limitations, internal control over financial reporting may not prevent or detect misstatements. Also, projections of any evaluation of effectiveness to future periods are subject to the risk that controls may become inadequate because of changes in conditions, or that the degree of compliance with the policies or procedures may deteriorate.
In our opinion, The St. Joe Company maintained, in all material respects, effective internal control over financial reporting as of December 31, 2015, based on criteria established in
Internal Control - Integrated Framework
(2013)
issued by COSO.
We also have audited, in accordance with the standards of the Public Company Accounting Oversight Board (United States), the consolidated balance sheets of The St. Joe Company and subsidiaries as of December 31, 2015 and 2014, and the related consolidated statements of operations, comprehensive (loss) income, changes in stockholders’ equity, and cash flows for each of the years in the three-year period ended December 31, 2015, and our report dated March 2, 2016 expressed an unqualified opinion on those consolidated financial statements.
/s/ KPMG
Jacksonville, Florida
March 2, 2016
Certified Public Accountants
61
Item 9B.
Other Information
Item 5.02
Departure of Directors or Certain Officers; Election of Directors; Appointment of Certain Officers; Compensatory Arrangements of Certain Officers.
(e) On November 24, 2015, our Compensation Committee approved an increase in the salary of Mr. Gonzalez from $250,000 to $350,000, effective January 1, 2016.
Item 10.
Directors, Executive Officers and Corporate Governance
Directors
Our Board of Directors (the “Board”) is currently comprised of seven (7) directors. Under our Bylaws, directors are elected for a one-year term expiring at the next annual meeting of shareholders or until his or her successor is elected and qualified. The principal occupation and other pertinent information about the particular experiences, qualifications, attributes and skills for our current directors is set forth below.
|
Cesar L. Alvarez
Age 68
Director since 2012
|
Mr. Alvarez has served as Senior Chairman of the international law firm of Greenberg Traurig, LLP, commencing in 2016. Prior to his appointment as Senior Chairman, Mr. Alvarez served as the firm’s Co-Chairman from 2012 to 2016. He previously served as the firm’s Chief Executive Officer from 1997 until his election as Executive Chairman in January 2010 and as its Executive Chairman from January 2010 until his election as Co-Chairman. Mr. Alvarez has served on the board of directors of each of Watsco, Inc. and Mednax, Inc. since 1997 and on the board of directors of Intrexon Corporation since 2008. Mr. Alvarez has also served on the board of directors of Fairholme Funds, Inc., which we refer to as the Fairholme Fund, since 2008 and on the board of directors of Sears Holding Corporation since 2013.
|
|
|
Qualifications
. The Board nominated Mr. Alvarez to serve as a director due to his management experience as the Senior Chairman and as former Chief Executive Officer of one of the nation’s largest law firms with professionals providing services in multiple locations across the country, as well as his many years of corporate governance experience, both counseling and serving on the boards of directors of other publicly traded companies.
|
|
Bruce R. Berkowitz
Age 57
Director since 2011
Chairman since 2011
|
Mr. Berkowitz is the Chief Investment Officer of Fairholme Capital Management, LLC, which we refer to as Fairholme, President of the Fairholme Fund and Manager of Fairholme Holdings LLC. The Fairholme Fund owned approximately 31.1% of our common stock as of February 26, 2016.
Mr. Berkowitz has served as a director of the Fairholme Fund since 1999 and as a director of Sears Holding Corporation since February 2016. He has also served as a director of Olympus Re Holdings, Ltd. and Olympus Reinsurance Company, Ltd. (Bermuda) since 2001. Previously, Mr. Berkowitz served as a director of each of White Mountains Insurance Group, Ltd., a financial services holding company, from 2004 to 2010, AmeriCredit Corporation, a retail financial services company, from 2008 to 2009 and TAL International Group Inc., a lessor of intermodal freight containers and chassis, from 2004 to 2009. In addition, Mr. Berkowitz was Managing Member of Fairholme from 1997 to 2014.
|
|
|
|
|
|
Qualifications
. The Board nominated Mr. Berkowitz to serve as a director because of his extensive financial and investment experience and his valuable network of business and professional relationships.
|
|
|
|
62
|
Howard S. Frank
Age 74
Director since 2011
|
Mr. Frank is currently a Consultant to the CEO and to the Chairman of Carnival Corporation & plc (“Carnival”). He has also served as Chairman of the board of directors of Costa Crociere, S.p.A., Carnival’s largest cruise group in Europe since 2014. From 1989 until 2013, Mr. Frank served as the Vice Chairman, Chief Operating Officer and director of Carnival, one of the largest cruise vacation groups in the world. Mr. Frank is a past Chairman and current Vice Chairman of the Board of Trustees for the New World Symphony and currently serves as an independent director on the board of directors of the Fairholme Fund.
|
|
|
|
|
|
Qualifications
. The Board nominated Mr. Frank to serve as a director because of his extensive strategic accounting, operational experience and sound business judgment demonstrated throughout his career with Carnival, as well as his experience as an Audit Committee Chair with the Fairholme Fund.
|
|
|
|
|
Jorge L. Gonzalez
Age 51
Director since 2015
|
Mr. Gonzalez joined us in 2002 and has served as our President and Chief Executive Officer since November 2015. During his time with the Company, Mr. Gonzalez has served in roles of increasing responsibility and most recently as the Company’s Senior Vice President of Development from March 2015 to November 2015.
In that role, Mr. Gonzalez supervised the long and complex sector planning entitlement process that was successfully concluded in 2015. Mr. Gonzalez has over 26 years of continuous experience in various planning and real estate related roles. Mr. Gonzalez is a member of the Urban Land Institute and serves on various community boards and organizations including the Florida State University Panama City Campus Development Board, the Bay County Economic Development Alliance, the Northwest Florida Manufacturer’s Council, Gulf Coast Regional Medical Center, and Enterprise Florida.
Qualifications
. The Board nominated Mr. Gonzalez to serve as a director because of his extensive experience in the real estate development industry, including as an executive officer of the Company.
|
|
Stanley Martin
Age 68
Director since 2012
|
Mr. Martin is currently a private investor with significant finance executive experience. From 2004 to 2006, Mr. Martin served as the Chief Audit Executive for the Federal Home Loan Mortgage Corporation. Previously, he served as the Chief Financial Officer of Republic New York Corporation and Republic National Bank from 1998 until its acquisition by HSBC Bank in 2000 and then as an Executive Vice President and consultant with HSBC Bank through April 2003. Mr. Martin formerly served as a member of the Board of Trustees and Chairman of Audit Committee of John Hancock Funds, which is composed of over 50 mutual funds including 10 New York Stock Exchange closed end funds. Mr. Martin was previously a partner of and spent 27 years with KPMG LLP, and holds an active license in the State of Florida as a Certified Public Accountant.
|
|
|
|
|
|
Qualifications
. The Board nominated Mr. Martin to serve as a director because of his significant finance and accounting experience and his experience as an Audit Committee Chair with John Hancock Funds.
|
|
|
|
|
Thomas P. Murphy, Jr.
Age 67
Director since 2011
|
Mr. Murphy is Chairman and Chief Executive Officer of Coastal Construction Group, a construction company that he founded in 1989. Mr. Murphy has 47 years of construction and development experience, which encompasses hospitality, resort, single and multi-family residential, commercial, educational and industrial projects. Mr. Murphy is an honorary Board member of Baptist Health Systems of South Florida and is a member of the Construction Industry Round Table, the National Association of Home Builders and the Florida Home Builders Association. Mr. Murphy also co-founded Seaboard Construction, which he grew to become one of the largest general contractors in Florida, selling the company in 1988 to Turner Construction, the largest general contractor in the United States at the time. Mr. Murphy has served as a director of Interval Leisure Group, Inc. since August 2008.
|
|
|
|
|
|
Qualifications
. The Board nominated Mr. Murphy to serve as a director because of his valuable entrepreneurial skills and extensive knowledge of construction and real estate in Florida as well as his experience serving on the board of directors of a public company.
|
63
|
|
|
|
Vito S. Portera
Age 73
Director since 2014
|
Mr. Portera is currently a private investor who previously served as Vice Chairman and director of Republic New York Corporation, Vice Chairman and director of Republic National Bank of New York and officer of various subsidiaries from 1969 until its acquisition by HSBC Bank in 2000 and then as an Executive Vice President until April 2000.
|
|
|
|
|
|
Qualifications.
The Board nominated Mr. Portera to serve as a director because of his significant finance and investment experience as well as his prior senior executive experience.
|
Executive Officers
Set forth below is certain information relating to our current executive officers and key employees other than Mr. Gonzalez. Biographical information with respect to Mr. Gonzalez is set forth above under “Directors”.
Marek Bakun
, 44, has served as our Chief Financial Officer since October 2013 and as our Executive Vice President since May 2014. Prior to joining us in 2013, Mr. Bakun served as Chief Financial Officer and Treasurer of Orleans Homebuilders, Inc., in Bensalem, Pennsylvania from February 2011 until October 2013. From October 2010 to February 2011, Mr. Bakun served in a senior finance position for MDC Holdings, Inc., a homebuilder which builds under the name Richmond American Homes, where he provided financial analysis in connection with systems implementation in two of the company’s U.S. markets and provided financial analysis on other initiatives. From April 2008 to October 2010, Mr. Bakun served as Chief Financial Officer and Treasurer for Mattamy Homes Corporation with responsibility for financial controls in its five U.S. markets. From 1999 to April 2008, Mr. Bakun served in positions of increasing responsibility for Morrison Homes, which merged into Taylor Morrison Home Corporation during his tenure, and was appointed Vice President and Chief Financial Officer in August 2006.
Kenneth M. Borick
, 55, has served as our Senior Vice President, General Counsel and Corporate Secretary since February 2012. From September 2000 until February 2012, Mr. Borick held various positions of increasing responsibility within St. Joe, primarily in the legal department. Mr. Borick has over twenty years of legal experience, which began with the private practice of law in South Carolina. Mr. Borick then spent seven years with The Walt Disney Company prior to joining us in 2000.
David S. Harrelson
, 60, joined us in 1976 and has served as our Senior Vice President, Timberland since February 2012. Previously, Mr. Harrelson served as our Vice President, Timberland from 2006 until February 2012. Mr. Harrelson is responsible for the timber resources and land management on non-entitled property. Since joining St. Joe as an entry-level forester, Mr. Harrelson has held various positions of increasing responsibility within the forestry division.
Patrick W. Murphy
, 45, has served as our Senior Vice President, Operations since October 2012. From March 2006 until October 2012, Mr. Murphy served as the General Manager of the WaterColor Inn & Resort, our wholly owned resort. Prior to joining us, Mr. Murphy held various management positions with Five Diamond and Five Star Resorts, including Nemacolin Woodlands Resort from 2004 to 2006 and Sea Island Company from 2001 to 2004.
Corporate Governance
Section 16(a) Beneficial Ownership Reporting Compliance
Section 16(a) of the Securities Exchange Act of 1934 (“Exchange Act”) requires our directors and executive officers, and persons who beneficially own more than 10% of a registered class of our equity securities, to file reports with the SEC relating to their common stock ownership and changes in such ownership. To our knowledge, based solely on our records and certain written representations received from our executive officers and directors, during the year ended December 31, 2015, directors, executive officers and greater than 10% shareholders complied with their Section 16(a) filing requirements applicable to them on a timely basis.
64
Code of Ethics
Our Board has adopted a Code of Business Conduct and Ethics, which we refer to as the Code, applicable to all our directors, officers and employees. Its purpose is to promote our commitment to standards for ethical business practices. The Code provides that it is our policy that our business be conducted in accordance with the highest legal and ethical standards. Our reputation for integrity is one of our most valuable assets, and each director, officer and employee is expected to contribute to the care and preservation of that asset. The Code addresses a number of issues, including conflicts of interest, corporate opportunities, use and protection of company assets, fair dealing, confidential information, insider trading and stock transactions, media and public inquiries, accounting matters, books and record keeping, working with governments and compliance with applicable laws, including antitrust and competition laws.
Our Code, which was most recently revised in November 2013, is available to view under the Investor Relations - Corporate Governance section of our website, located at
www.joe.com
. We intend to post on our website information regarding any amendment to the Code or any waiver granted under the Code covered by Item 5.05 of Form 8-K within four business days following the date of the amendment or waiver.
Audit Committee and Audit Committee Financial Expert
We currently have a standing Audit Committee. Our Audit Committee currently consists of three members: Stanley Martin (Chairman), Howard S. Frank and Vito S. Portera. The Audit Committee’s responsibilities include, among other things:
|
•
|
appointing our independent auditors and monitoring their performance, qualifications and independence;
|
|
•
|
assisting the Board’s oversight of the quality and integrity of our financial statements;
|
|
•
|
reviewing with management, the internal auditor and independent auditors, the quality, adequacy and effectiveness of our internal control over financial reporting;
|
|
•
|
reviewing our policies and processes with respect to risk assessment and risk management;
|
|
•
|
exercising an oversight role with respect to our internal audit function; and
|
|
•
|
reviewing with management our policies with respect to compliance with laws and regulations, including our Code of Business Conduct and Ethics.
|
In addition, the Audit Committee has sole authority to pre-approve all auditing services, internal control-related audit services and permitted non-audit services to be provided by the independent auditors. The Audit Committee may delegate any of its responsibilities, as it deems appropriate, to a subcommittee composed of one or more members.
Independence and Financial Expertise
The Board reviewed the background, experience and independence of the Audit Committee members based in large part on the directors’ responses to questions relating to their relationships, background and experience. Based on this review, the Board determined that each member of the Audit Committee:
|
•
|
meets the independence requirements of the NYSE’s corporate governance listing standards;
|
|
•
|
meets the enhanced independence standards for audit committee members required by the Securities and Exchange Commission;
|
|
•
|
is financially literate, knowledgeable and qualified to review financial statements; and
|
|
•
|
is free of any relationship that, in the opinion of the Board, may interfere with his or her exercise of independent judgment as an Audit Committee member.
|
In addition, the Board has determined that each of Howard S. Frank, Stanley Martin and Vito S. Portera qualifies as an “audit committee financial expert” under SEC rules.
Procedures for Shareholder Nominations
There have been no material changes to the procedures by which security holders may recommend nominees to our Board since such disclosures were last provided in our proxy statement in connection with our 2015 annual meeting of shareholders.
65
Item 11.
Executive Compensation
Compensation Discussion and Analysis
This Compensation Discussion and Analysis is designed to provide our shareholders with a clear understanding of our compensation philosophy and objectives, the compensation-setting process, and the 2015 compensation of our named executive officers (identified below), who we sometimes refer to as our NEOs.
Named Executive Officers
For 2015, our “named executive officers” were:
|
•
|
Jorge L. Gonzalez, our President and Chief Executive Officer and
former
SVP, Development;
|
|
•
|
Marek Bakun, our EVP and Chief Financial Officer;
|
|
•
|
Kenneth Borick, our SVP, General Counsel and Corporate Secretary;
|
|
•
|
David Harrelson, our SVP, Timberland;
|
|
•
|
Patrick Murphy, our SVP, Operations;
|
|
•
|
Jeffrey Keil, our
former
President and Interim Chief Executive Officer; and
|
|
•
|
Patrick Bienvenue, our
former
EVP and Senior Advisor to the Chairman.
|
In November 2015, the Board appointed Jorge Gonzalez as our President and Chief Executive Officer. Mr. Gonzalez has been with the Company since 2002, most recently as our Senior Vice President of Development. In connection with Mr. Gonzalez’s appointment, Jeffrey Keil, our Interim Chief Executive Officer, stepped down from that position.
Compensation Setting Process
Role of Compensation Committee
Pursuant to its Charter, the Compensation Committee is responsible for, among other things, establishing our general compensation philosophy and overseeing the development and implementation of our compensation and benefits program. The Compensation Committee is also responsible for reviewing the performance of our CEO and other executive officers and, together with the other independent members of the Board, setting the compensation of the CEO and such other executive officers.
Role of Management
Our management develops background and supporting materials for review at Compensation Committee meetings, attends Compensation Committee meetings at the committee’s request, and provides information regarding, and makes recommendations about, designs for and, if warranted, changes to our executive compensation programs. Our CEO generally attends Compensation Committee meetings, but will not participate in any decisions relating to his own compensation. CEO performance and compensation are discussed by the Compensation Committee in executive session. Our CEO, without the presence of any other members of senior management, actively participates in the performance and compensation discussions for our senior executives, including making recommendations to the Compensation Committee as to the amount and form of compensation.
Elements of Compensation
Our 2015 executive compensation program consisted of base salary and discretionary bonuses payable based on the Compensation Committee’s discretionary evaluation of our overall financial performance and the contribution of the individual named executive officer to such performance. In addition, our named executive officers receive the same benefits and perquisites that are available to all employees generally. The Compensation Committee does not have a formal policy relating to the allocation of total compensation among the various components. The Compensation Committee currently does not have an annual performance-based bonus plan or a formal long-term equity incentive plan. We anticipate that more formalized programs may be adopted in the future.
66
Base Salary
Objective
: The Compensation Committee believes that base salary should provide executives certainty that they will receive competitive compensation.
Performance Considerations
: Base salary is designed to adequately compensate and reward the executive on a day-to-day basis for the time spent and the services the executive performs. When setting and adjusting individual executive salary levels, the Compensation Committee considers the executive officer’s responsibilities, experience, potential, individual performance and the Compensation Committee’s evaluation of its competitive market position. The Compensation Committee also considers other factors such as demand in the labor market and comparable salaries for the particular executive and succession planning. These factors are not weighted. The Compensation Committee bases salary adjustments on the overall assessment of all of these factors. The Compensation Committee does not target base pay at any particular level versus a peer group, but uses its judgment based on all available information (including, from time to time, market and survey data compiled by compensation consultants) to set a base salary that, when combined with all other compensation elements, results in a competitive pay package.
Committee Actions Taken in 2015
: Mr. Gonzalez did not receive a salary increase in connection with his appointment as President and Chief Executive Officer in November 2015, but continued to receive his base salary of $250,000 from his previous position with the Company. In 2015, the Compensation Committee reviewed base salaries for each NEO and determined that the base salary for Mr. Borick was below competitive market salary levels. Consequently, the Compensation Committee approved an increase in Mr. Borick’s base salary to $300,000. No other NEO received a base salary increase for 2015. However, the Compensation Committee approved an increase in Mr. Gonzalez’s base salary from $250,000 to $350,000, effective January 1, 2016.
Discretionary Bonuses
Objective
: The Compensation Committee awards discretionary bonuses to our named executive officers to reward such officers for their individual contributions to our overall performance in a given year and to assist in providing a competitive compensation package. The Committee believes that discretionary bonuses, if any, should be subject to the achievement of the Company of the financial and operational objectives set by the Board from time to time, the financial results of the Company during the year, the Company’s liquidity position at the end of the year and the Board’s expectations regarding the required uses of liquidity in the upcoming year. We believe that making such compensation “at risk” provides significant motivation for increasing company and individual performance.
Performance Considerations
: Discretionary bonuses (if any) will be paid based on the Compensation Committee’s discretionary evaluation of our overall financial performance, the contribution of the particular named executive officer to such performance and the other factors discussed above. The Compensation Committee also takes into consideration the target bonus amounts set in such named executive officer’s employment agreement, if applicable. The amount of any discretionary bonus awarded is determined by the Compensation Committee, in its sole discretion, and in consultation with the independent directors of the Board. Bonuses are typically paid in cash during the first quarter, however, the Compensation Committee has, and may in the future, decide to award bonuses during the year for exemplary performance.
Committee Actions Taken with Respect to 2015 Performance
: The Compensation Committee, in consultation with the independent directors of the Board, approved the following discretionary cash bonus awards for 2015 performance: $250,000 for Mr. Bakun, $200,000 for Mr. Borick, $50,000 for Mr. Harrelson and $60,000 for Mr. Murphy. In addition, Mr. Gonzalez was paid a discretionary bonus of $1,000,000 for his exemplary service and leadership in connection with his responsibilities arising from his position as Senior Vice President of Development prior to being named Chief Executive Officer. Mr. Gonzalez did not receive an additional bonus for his services as Chief Executive Officer.
Mr. Keil stepped in as our Interim Chief Executive Officer and provided invaluable leadership during a critical period of transition for the Company. Among many things, Mr. Keil was instrumental in assessing talent at St. Joe and formulating a succession plan for our executive leadership. In recognition of his contributions and in lieu of a bonus, the Compensation Committee, in consultation with independent directors of the Board, awarded Mr. Keil a severance payment in the amount of $500,000 upon his departure from the Company.
67
Employment Agreements
Employment Agreement with Mr. Bakun
In connection with his appointment as CFO, we entered into an employment agreement with Mr. Bakun to serve as CFO for a period of one year, commencing on October 7, 2013. On April 1
st
of each successive one year anniversary from that date, the employment agreement will automatically renew for an additional year, unless it is terminated at least 30 days prior to the applicable renewal date.
Pursuant to the employment agreement, Mr. Bakun will receive an annual base salary of $350,000, which may be increased by the Compensation Committee. In addition, Mr. Bakun is eligible for an annual cash bonus with a target award equal to 100% of his base salary rate.
The employment agreement provides that, upon termination of Mr. Bakun’s employment following his resignation for good cause, for a reason other than for cause or due to his death or disability, Mr. Bakun is entitled to receive (i) an amount equal to his annual base salary as of the termination date, paid ratably over a 12 month period following such date and (ii) a monthly amount equal to the employer portion of the applicable COBRA premium for the level of coverage that Mr. Bakun has as of the termination date, which will be paid for a period of 18 months. The employment agreement provides for certain noncompetition, confidentiality, non-solicitation and non-disparagement covenants. Mr. Bakun’s severance payment is conditioned upon his execution of a separation and release agreement.
Employment Agreement with Mr. Bienvenue
Prior to his separation from the Company in November 2015, Mr. Bienvenue had an employment agreement with the Company. The employment agreement provided for an annual base salary of $400,000 for Mr. Bienvenue, which may have been increased, but not decreased, by the Compensation Committee. For 2015, Mr. Bienvenue’s base salary was $500,000. In addition, Mr. Bienvenue is eligible for an annual cash bonus with a target award equal to 100% of his base salary rate.
Mr. Bienvenue’s employment agreement provided that, upon our termination of his employment without cause or his resignation for good reason, Mr. Bienvenue, would have been entitled to receive (i) ratably over a 12 month period after the termination date, an amount equal to his base salary as in effect on the termination date, and (ii) a monthly amount equal to the employer portion of the applicable COBRA premium for a period of 18 months.
In connection with his separation, we and Mr. Bienvenue entered into a separation agreement pursuant to which Mr. Bienvenue was entitled to (i) $500,000 and (ii) reimbursement for health insurance for 18 months, each as provided in his employment agreement. In addition, we agreed to pay Mr. Bienvenue a one-time lump sum in the amount of $100,000. Mr. Bienvenue agreed to a general release and to comply with certain non-competition, confidentiality and non-disparagement obligations. The amount of $600,000 has been paid.
Retirement Plans
We previously provided retirement benefits to our named executive officers through a Pension Plan and 401(k) retirement plan. However, effective March 2013, we froze the Pension Plan and, in August 2014, we received the requisite regulatory approvals to terminate the Pension Plan. Currently, we provide retirement benefits to our named executive officers solely through our 401(k) retirement plan pursuant to which we contribute the same percentage of salary as we do for our other employees, subject to a cap.
Health and Welfare Benefits and Perquisites
We have traditionally provided our named executive officers with a variety of health and welfare benefits. In addition we provide the perquisites reflected in the All Other Compensation column in the “Summary Compensation Table” and more fully described in the footnote to that column. The only perquisites that our named executive officers are currently entitled to receive, other than those that are available to all employees, are reimbursement for annual physical exams and membership in our St. Joe Club & Resorts (the latter of which has no incremental cost to us).
68
Tax Deductibility
Section 162(m) of the Internal Revenue Code of 1986, as amended, precludes public companies from taking a federal income tax deduction for compensation in excess of $1 million paid to individual named executive officers unless certain specific and detailed criteria are met, including the requirement that compensation be “performance based” and under a plan approved by our shareholders. Because St. Joe had previously operated with net operating losses, the tax deductibility of compensation has not been a major consideration in the Compensation Committee’s compensation decisions; however this may become a consideration in the future.
Consideration of Shareholder Advisory Vote
As part of its compensation setting process, the Compensation Committee also considers the results of the prior-year’s shareholder advisory vote on our executive compensation to provide useful feedback regarding whether shareholders believe that the Compensation Committee is achieving its goal of designing an executive compensation program that promotes the best interests of St. Joe and its shareholders by providing its executives with the appropriate compensation and meaningful incentives. In 2015, the Compensation Committee took into consideration that approximately 88% of the votes cast on the shareholder advisory vote were voted in favor of our executive compensation in its decision to maintain the current compensation program and philosophy. The Compensation Committee intends to annually review the results of the advisory vote and will be cognizant of this feedback as it completes its annual review of each pay element and the total compensation packages for our NEOs.
Compensation Committee Report
The Compensation Committee has reviewed and discussed with management the Compensation Discussion and Analysis included in this Annual Report on Form 10-K for the fiscal year ended December 31, 2015. Based on those reviews and discussions, the Compensation Committee has recommended to the Board that the Compensation Discussion and Analysis be included in this Annual Report on Form 10-K for the fiscal year ended December 31, 2015 for filing with the Securities and Exchange Commission.
|
Compensation Committee
Howard S. Frank, Chair
Thomas P. Murphy, Jr.
Vito S. Portera
March 2, 2016
|
|
Compensation Committee Interlocks and Insider Participation
The Compensation Committee currently consists of Howard S. Frank (Chairman), Thomas P. Murphy, Jr. and Vito S. Portera. None of the members of the Compensation Committee was at any time during 2015 or at any other time an officer or employee of St. Joe. No executive officer of St. Joe serves as a member of (i) a board of directors or (ii) a compensation committee of any other entity that has one or more executive officers serving as a member of our Board of Directors or Compensation Committee.
69
2015 Summary Compensation Table
The following table sets forth the compensation earned by each of our named executive officers, or NEOs, for 2015, 2014 and 2013. In accordance with applicable SEC rules, we are providing compensation information for named executive officers only for years in which they qualified as named executive officers.
|
Name and Principal Position
|
Year
|
Salary
($)
|
Bonus
($)
|
Stock Award
($)
|
Change in Pension Value and Nonqualified
Deferred Compensation Earnings ($)
(1)
|
All Other Compensation
($)
(2)
|
Total
($)
|
|||||||||||
|
Jorge Gonzalez
President and Chief Executive Officer
|
2015
|
250,000
|
1,000,000
|
|
—
|
|
—
|
|
53,000
(3)
|
|
1,303,000
|
|||||||
|
Marek Bakun
EVP and Chief Financial Officer
|
2015
|
350,000
|
250,000
|
|
—
|
|
—
|
|
53,000
(3)
|
|
653,000
|
|||||||
|
2014
|
350,000
|
250,000
|
|
—
|
|
—
|
|
58,600
|
|
658,600
|
||||||||
|
2013
|
71,346
|
132,466
|
|
—
|
|
—
|
|
100,114
|
|
303,926
|
||||||||
|
Kenneth Borick
SVP, General Counsel and Corporate Secretary
|
2015
|
293,231
(4)
|
200,000
|
|
—
|
|
—
|
|
53,000
(3)
|
|
546,231
|
|||||||
|
2014
|
253,308
|
128,000
|
|
—
|
|
39,746
|
|
34,500
|
|
455,554
|
||||||||
|
2013
|
241,539
|
196,000
|
|
—
|
|
(39,972)
|
|
392
|
|
397,959
|
||||||||
|
David Harrelson
SVP, Timberland
|
2015
|
190,000
|
50,000
|
|
—
|
|
—
|
|
53,000
(3)
|
|
293,000
|
|||||||
|
2014
|
190,000
|
50,000
|
|
—
|
|
55,937
|
|
34,500
|
|
330,437
|
||||||||
|
2013
|
180,769
|
250,000
|
|
—
|
|
(30,359)
|
|
2,572
|
|
402,983
|
||||||||
|
Patrick Murphy
SVP, Operations
|
2015
|
190,000
|
60,000
|
|
—
|
|
—
|
|
52,635
(3)
|
|
302,635
|
|||||||
|
Patrick Bienvenue
Former
EVP
|
2015
|
480,770
|
—
|
|
—
|
|
—
|
|
600,000
(5)
|
|
1,080,770
|
|||||||
|
2014
|
500,000
|
350,000
|
|
—
|
|
3,865
|
|
34,500
|
|
888,365
|
||||||||
|
2013
|
500,000
|
500,000
|
|
—
|
|
7,452
|
|
1,127
|
|
1,008,580
|
||||||||
|
Jeffrey Keil
Former
President and Interim Chief Executive Officer
|
2015
|
230,769
|
—
|
|
—
|
|
—
|
|
517,740
(3)(6)
|
|
748,509
|
|||||||
|
2014
|
142,789
|
—
|
|
50,009
|
|
—
|
|
—
|
|
192,798
|
||||||||
__________
|
(1)
|
The amounts shown represent the change in present values of the Pension Plan benefits in 2013 and 2014. St. Joe discontinued its nonqualified deferred capital accumulation plan effective December 30, 2011 and froze the Pension Plan, effective March 27, 2013. As of December 31, 2015, the pension plan assets were distributed. The changes in pension values shown reflect the changes in the present value of pension benefits from one year end to the next. Factors affecting the changes in present values include the impact of the value of benefits earned in the current year, the growth in the value of benefits earned in prior years due to the passage of time and the impact of changes in assumptions. This present value calculation was based on actuarial assumptions and discounting and was not a direct reflection of the change in each participant’s actual account balance in the Pension Plan during the year.
|
|
(2)
|
Our NEOs are provided with membership to our St. Joe Club & Resorts which has no incremental cost to us.
|
|
(3)
|
The amount shown represents Company 401(k) Plan contributions in 2015. The Company contributes the same percentage of salary for all employees, subject to a cap.
|
70
|
(4)
|
The amount shown includes a pro-rata adjustment due to an increase in Mr. Borick’s base salary from $256,000 to $300,000 in 2015.
|
|
(5)
|
The amount shown includes (i) a $100,000 one-time cash lump sum payment and (ii) one times (1x) his base salary that were paid to Mr. Bienvenue in connection with his departure from the Company in November 2015. See above “
Compensation Discussion & Analysis - Employment Agreements - Employment Agreement with Mr. Bienvenue
.”
|
|
(6)
|
In lieu of an annual bonus, the Company paid to Mr. Keil a severance payment of $500,000 in connection with his services as our Interim Chief Executive Officer.
|
Outstanding Equity Awards at December 31, 2015
The following table provides information on the outstanding equity awards held by the named executive officers at December 31, 2015.
|
Name
|
Option Awards
|
|||||||||||
|
Number of Securities Underlying Unexercised Options Exercisable (#)
|
Number of Securities Underlying Unexercised Options Unexercisable (#)
|
Option Exercise Price ($)
|
Option Expiration Date
|
|||||||||
|
Jorge Gonzalez
|
—
|
|
—
|
|
—
|
|
—
|
|
||||
|
Marek Bakun
|
—
|
|
—
|
|
—
|
|
—
|
|
||||
|
Kenneth Borick
|
2,595
|
|
—
|
|
54.05
|
|
2/12/17
|
|
||||
|
David Harrelson
|
1,446
|
|
—
|
|
54.05
|
|
2/12/17
|
|
||||
|
Patrick Murphy
|
—
|
|
—
|
|
—
|
|
—
|
|
||||
|
Patrick Bienvenue
|
—
|
|
—
|
|
—
|
|
—
|
|
||||
|
Jeffrey Keil
|
—
|
|
—
|
|
—
|
|
—
|
|
||||
Pension Benefits
The Company’s Pension Plan was frozen in March 2013 and terminated in August 2014.
Potential Payments Upon Termination or Change in Control
Mr. Bakun
As discussed in the Compensation Discussion and Analysis under “
Employment Agreements
”, we have entered into an employment agreement with Mr. Bakun that provides for certain payments and other benefits if employment with us is terminated without “cause” or by Mr. Bakun for “Good Reason”. Upon a termination by us without “cause” or by Mr. Bakun for “Good Reason”, Mr. Bakun is entitled to receive:
|
•
|
salary continuation for a period of 12 months from the termination date and
|
|
•
|
payments equal to our portion of the cost of continued health and welfare benefits for an 18-month period from the termination date.
|
Mr. Bakun’s employment agreement does not provide for any additional benefits if such termination occurs in connection with a change in control. In addition, the employment agreement does not provide any gross-up for excise taxes. Instead, the employment agreement provides that any amounts that would have been payable as a severance payment will be carved-back, as necessary, to avoid the payment of any excise taxes. Additionally, the employment agreement does not provide for any additional benefits in the event of death or termination due to disability.
The following table shows the termination payments that Mr. Bakun would receive pursuant to his employment agreement in connection with his termination without cause or by Mr. Bakun for good reason. These amounts have been quantified as if such termination events occurred on December 31, 2015.
71
|
Name and Type of Payment/Benefit
|
Payments Upon Termination Without Cause
(1)
or for Good Reason
(2)
($)
|
|
|
Marek Bakun
|
||
|
Salary
|
$350,000
|
|
|
Continuation of Benefits
(3)
|
$26,685
|
|
|
Total Termination Payments/Benefits
|
$376,685
|
|
__________
|
(1)
|
Pursuant to the terms of Mr. Bakun’s employment agreement, “cause” means termination due to (a) the executive’s continued failure to substantially perform the executive’s employment duties (other than any such failure resulting from the executive’s incapacity due to physical or mental illness) which are demonstrably willful and deliberate on the executive’s part and which are not remedied in a reasonable period of time after receipt of notice from St. Joe, (b) the willful engaging by the executive in illegal conduct or gross misconduct which causes financial or reputational harm to St. Joe, (c) the conviction of a felony or a guilty or nolo contendere plea by the executive with respect thereto, (d) the material breach by the executive of his employment agreement or any of St. Joe’s written policies, (e) the habitual abuse of narcotics or alcohol by the executive, (f) engaging in fraud in connection with the business of St. Joe or misappropriation of St. Joe’s funds or property, or (g) the executive’s disqualification or bar by any governmental or self-regulatory authority from serving in the capacity contemplated by the employment agreement or the executive’s loss of any governmental or self-regulatory license that is reasonably necessary for the executive to perform his responsibilities.
|
|
(2)
|
Pursuant to the terms of Mr. Bakun’s employment agreement, “good reason” means the executive’s termination of the executive’s employment for any one or more of the following reasons without the executive’s express written consent: (a) a significant diminution in the executive’s position, authority, comparable duties or responsibilities, excluding for these purposes: (i) an isolated, insubstantial or inadvertent action not taken in bad faith that is remedied by St. Joe within thirty (30) days after receipt of written notice thereof given by the executive as provided in Section 5.4 of the employment agreement, (ii) a change in the person to whom (but not the position to which) the executive reports, or (iii) the executive ceasing to be an executive officer subject to Section 16(b) of the Exchange Act; (b) a material failure by St. Joe to comply with any of the provisions of Section 4 of the employment agreement other than an isolated, insubstantial or inadvertent failure not occurring in bad faith that is remedied by St. Joe within thirty (30) days after receipt of notice thereof given by the executive pursuant to Section 5.4 of the employment agreement; (c) any purported termination by St. Joe of the executive’s employment otherwise than as expressly permitted by the employment agreement; or (d) any failure by St. Joe to comply with and satisfy Section 9.3 of the employment agreement.
|
|
(3)
|
Pursuant to terms of his employment agreement, Mr. Bakun, whether terminated without cause or for good reason, receives a continuation of health and welfare benefits for a period of 18 months following the date of termination.
|
Director Compensation
Annual Retainer
. For 2015, our Board approved the annual retainer fees set forth below, payable in cash. We do not pay meeting fees. Annual retainer fees are payable quarterly in advance.
|
•
|
$75,000 for each non-employee director;
|
|
•
|
an additional $25,000 for the Chairman of the Board;
|
|
•
|
an additional $10,000 for the Chair of the Governance and Nominating Committee;
|
|
•
|
an additional $12,500 for the Chair of the Compensation Committee; and
|
|
•
|
an additional $25,000 for the Chair of the Audit Committee.
|
Messrs. Berkowitz and Frank waived their rights to receive the annual retainer or committee chair fees for their service on the Board in 2015.
Annual Equity Grant
. Following each annual meeting of our shareholders, the Compensation Committee grants an equity compensation award to each non-employee director. In 2015, the Compensation Committee granted to each non-employee director an equity grant with an aggregate fair market value of $50,007, based on the closing price of our common stock on the grant date.
Messrs. Berkowitz and Frank waived their rights to receive annual equity grants for their service on the Board in 2015. In lieu of the annual equity grant, the Compensation Committee approved paying Mr. Alvarez the equivalent value of the equity award in cash for 2015 and intends to do so in 2016.
72
Expense Reimbursement
. We reimburse directors for travel expenses related to attending Board and committee meetings and for other company related business. In certain circumstances, we will pay the costs for directors to fly on a private airplane to attend Board and committee meetings or for other company business. We may also invite director spouses to accompany directors to some of our Board meetings, for which we pay or reimburse travel expenses. In addition, we reimburse directors for seminar fees and travel expenses associated with attending one approved educational seminar each year.
Charitable Matching Program
. We have chosen to support the charitable and civic activities of our directors. We will match each director’s cash contributions to charities in which he serves as an officer or trustee up to an aggregate annual amount of $5,000 per director. We will also contribute to events at which directors are recognized for their services to charitable or civic causes. Only Mr. Alvarez participated in this program during 2015.
2015 Director Compensation
The following table sets forth the compensation paid in 2015 to each director, other than Mr. Gonzalez whose 2015 compensation for his services as President and CEO for the remainder of 2015 is discussed under “
Executive Compensation
”.
|
Name
|
Fees Earned or Paid in Cash
(1)
($)
|
Stock Awards
(2)
($)
|
All Other Compensation ($)
|
Total
($)
|
||||||||
|
Cesar L. Alvarez
|
135,000
|
|
—
|
|
5,000
(3)
|
|
140,000
|
|
||||
|
Bruce R. Berkowitz
(4)
|
—
|
|
—
|
|
—
|
|
—
|
|
||||
|
Howard S. Frank
(4)
|
—
|
|
—
|
|
—
|
|
—
|
|
||||
|
Stanley Martin
|
100,000
|
|
50,007
|
|
—
|
|
150,007
|
|
||||
|
Thomas P. Murphy, Jr.
|
75,000
|
|
50,007
|
|
—
|
|
125,007
|
|
||||
|
Vito S. Portera
|
75,000
|
|
50,007
|
|
—
|
|
125,007
|
|
||||
__________
|
(1)
|
The amounts shown include the annual retainer fees for all directors. For Mr. Alvarez, the amount also includes (i) $50,000 in cash granted in lieu of Mr. Alvarez’s annual equity grant for 2015, and (ii) fees in the amount of $10,000 for his service as Chair of the Governance and Nominating Committee. For Mr. Martin, the amount also includes fees in the amount of $25,000 for his service as Chair of the Audit Committee.
|
|
(2)
|
Represents the grant date fair value of the Annual Equity Grant of 3,220 shares of common stock awarded to Messrs. Martin, Murphy and Portera on June 30, 2015, based on a closing market price of our common stock of $15.53 on June 30, 2015. The amounts shown represent the grant date fair value under FASB ASC Topic 718. Please refer to Note 17 of our Consolidated Financial Statements included in our Annual Report on Form 10-K for the fiscal year ended December 31, 2015, filed with the SEC on February 29, 2016 for the assumptions utilized in calculating fair value. As of December 31, 2015, none of our Directors held unvested restricted stock units or unexercised options.
|
|
(3)
|
The amount shown represents a matching contribution in the amount of $5,000 paid by the Company to United Way of Miami-Dade in accordance with the Company’s Charitable Matching Program. The Charitable Matching Program matches each director’s cash contributions to charities in which he serves as an officer or trustee up to an aggregate annual amount of $5,000 per director and also provides for contributions to events at which directors are recognized for their services to charitable or civic causes.
|
|
(4)
|
Messrs. Berkowitz and Frank waived their rights to receive any compensation for their service on the Board in 2015.
|
73
Item 12.
Security Ownership of Certain Beneficial Owners and Management and Related Stockholder Matters
Equity Compensation Plan
|
|
|
|
|
|
|
|
|
|
|
|||
|
|
|
Equity Compensation Plan Information
|
||||||||||
|
|
|
Number of Securities to be Issued Upon Exercise of Outstanding Options, Warrants and Rights
|
|
|
Weighted- Average Exercise Price of Outstanding Options, Warrants and Rights
|
|
|
Number of Securities Remaining
Available for
Future Issuance Under Equity Compensation Plans (Excluding Securities Reflected in Column (a))
|
||||
|
|
|
(a)
|
|
|
|
(b)
|
|
|
(c)
|
|||
|
Equity compensation plans approved by security holders
|
|
|
|
|
|
|
|
|
|
|||
|
2009 Equity Incentive Plan
(1)
|
99,755
|
|
54.15
|
|
—
|
|
||||||
|
2015 Performance and Equity Incentive Plan
|
|
—
|
|
—
|
|
1,500,000
|
|
|||||
|
Equity compensation plans not approved by security holders
|
|
—
|
|
|
|
|
—
|
|
|
|
—
|
|
|
Total
|
|
99,755
|
|
54.15
|
|
1,500,000
|
|
|||||
______________________
|
(1)
|
Upon adoption of the 2015 Performance and Equity Incentive Plan (the “2015 Plan”), the remaining shares available for awards under the 2009 Equity Incentive Plan (the “2009 Plan”) were included in the 1,500,000 shares approved under the 2015 Plan. Stock options previously granted under the 2009 Plan are still outstanding and to the extent that such options are exercised prior to their expiration, shares will be issued under the 2009 Plan.
|
Principal Holders of Stock
The following table shows the number of shares of common stock held by all persons who are known by us to beneficially own or exercise voting or dispositive control over more than five percent of our outstanding common stock as of February 26, 2016:
|
Name and Address
|
Number of Shares Beneficially Owned
|
Percent of Class
(1)
|
||
|
Fairholme Capital Management, LLC, Bruce R.
Berkowitz and Fairholme Funds, Inc.
4400 Biscayne Boulevard, 9th Floor
Miami, FL 33137
|
24,355,819
(2)
|
32.8%
|
||
|
Blackrock, Inc.
55 East 52nd Street
New York, NY 10055
|
14,949,505
(3)
|
20.1%
|
||
|
Janus Capital Management, LLC and Janus
Contrarian Fund
151 Detroit Street
Denver, CO 80206
|
12,159,022
(4)
|
16.4%
|
||
|
The Vanguard Group
100 Vanguard Boulevard
Malvern, PA 19355
|
4,123,719
(5)
|
5.5%
|
||
_______
|
(1)
|
The percentages reported are based on 74,349,612 shares of common stock outstanding as of February 26, 2016.
|
74
|
(2)
|
These amounts are held by Fairholme Capital Management, LLC (“Fairholme Capital”) and Fairholme Funds, Inc. Fairholme Capital and Bruce R. Berkowitz shared the power to vote or direct the vote of 23,603,302 shares and shared the power to dispose or direct the disposition of 24,355,819 shares. Fairholme Funds, Inc. shared the power to vote or direct the vote of 23,136,502 shares and shared the power to dispose or direct the disposition of 23,136,502 shares. Because Mr. Berkowitz, in his capacity as the Managing Member of Fairholme Capital or as President of Fairholme Funds, Inc., has voting or dispositive power over all shares beneficially owned by Fairholme Capital, he is deemed to have beneficial ownership of all of the shares.
|
|
(3)
|
Based on a Schedule 13G/A filed by Blackrock, Inc. on January 8, 2016. Blackrock, Inc. has sole power to vote or direct the vote of 14,841,988 of the shares it beneficially owns and has sole power to dispose or direct the disposition of all the shares it beneficially owns.
|
|
(4)
|
Based on a Schedule 13G/A filed by Janus Capital Management, LLC (“Janus Capital”) on February 16, 2016. Janus Capital has sole voting and dispositive power with respect to 12,159,022 shares at December 31, 2015. Janus Contrarian Fund (“Janus Contrarian”) has sole voting and dispositive power with respect to 10,451,593 shares. Janus Capital owns 96.81% of INTECH Investment Management (“INTECH”) and 100% of Perkins Investment Management LLC (“Perkins”), both of which are registered investment advisers which furnish advice to various investment companies and to individual and institutional clients (“Managed Portfolios”). Holdings for Janus Capital, Perkins and INTECH are aggregated for purposes of this Schedule 13G/A filing. Janus Capital and INTECH disclaim pecuniary interests in such shares. Janus Contrarian is an investment company and one of the Managed Portfolios to which Janus Capital provides investment advice.
|
|
(5)
|
Based on a Schedule 13G filed by The Vanguard Group on February 10, 2016. The Vanguard Group has sole voting power with respect to 79,588 shares and it beneficially owns and has sole dispositive power with respect to 4,040,431 shares it beneficially owns. The Vanguard Group has shared voting power with respect to 6,300 shares and shared dispositive power with respect to 83,288 shares.
|
Common Stock Ownership by Directors and Executive Officers
The following table sets forth the number of shares of our common stock beneficially owned by the current directors, the named executive officers and the directors and all executive officers as a group, as of February 26, 2016.
|
Name
|
Amount and Nature of Beneficial Ownership
(1)
|
Percent of Class
(2)
|
||||
|
Cesar L. Alvarez
|
—
|
|
—
|
|
||
|
Marek Bakun
|
—
|
|
—
|
|
||
|
Bruce R. Berkowitz
|
24,355,819
(3)
|
|
32.8%
|
|
||
|
Kenneth Borick
|
14,712
(4)
|
|
*
|
|
||
|
Howard S. Frank
|
—
|
|
—
|
|
||
|
Jorge L. Gonzalez
|
4
|
|
*
|
|
||
|
David Harrelson
|
2,761
(5)
|
|
*
|
|
||
|
Stanley Martin
|
14,100
|
|
*
|
|
||
|
Patrick W. Murphy
|
—
|
|
—
|
|
||
|
Thomas P. Murphy, Jr.
|
22,844
|
|
*
|
|
||
|
Vito S. Portera
|
5,527
|
|
*
|
|
||
|
Directors and Executive Officers as a Group (eleven (11) persons)
|
24,415,767
|
|
32.8%
|
|
||
__________
The address of each director and executive officer in this table is c/o The St. Joe Company, 133 South WaterSound Parkway, Watersound, Florida 32413.
|
(1)
|
Each director and executive officer listed has sole or shared voting and dispositive power over the shares listed.
|
|
(2)
|
The percentages reported are based on 74,349,612 shares of common stock outstanding as of February 26, 2016. An “*” indicates less than 1% ownership.
|
75
|
(3)
|
These amounts are held by Fairholme Capital and Fairholme Funds, Inc. Fairholme Capital and Bruce R. Berkowitz shared the power to vote or direct the vote of 23,603,302 shares and shared the power to dispose or direct the disposition of 24,355,819 shares. Fairholme Funds, Inc. shared the power to vote or direct the vote of 23,136,502 shares and shared the power to dispose or direct the disposition of 23,136,502 shares. Because Mr. Berkowitz, in his capacity as the Managing Member of Fairholme Capital or as President of Fairholme Funds, Inc., has voting or dispositive power over all shares beneficially owned by Fairholme Capital, he is deemed to have beneficial ownership of all of the shares.
|
|
(4)
|
Includes 2,595 shares issuable upon the exercise of stock options that are currently exercisable.
|
|
(5)
|
Includes 1,446 shares issuable upon the exercise of stock options that are currently exercisable.
|
Item 13.
Certain Relationships and Related Transactions and Director Independence
Related Person Transaction Policy
The Charter of our Governance and Nominating Committee (the “Governance Committee”) provides that our Governance Committee must approve all related person transactions involving any Board member or any executive officer. Current SEC rules define transactions with related persons to include any transaction, arrangement or relationship (i) in which St. Joe is a participant, (ii) in which the amount involved exceeds $120,000, and (iii) in which any executive officer, director, director nominee, beneficial owner of more than 5% of St. Joe’s common stock, or any immediate family member of such persons has or will have a direct or indirect material interest. All directors must recuse themselves from any discussion or decision affecting their personal, business or professional interests. All related person transactions will be disclosed in our applicable SEC filings as required under SEC rules.
Certain Relationships and Related Transactions
In November 2015, we appointed Mr. Jorge Gonzalez as President and CEO. Mr. Gonzalez’s wife owns a spa business that leases space in one of our commercial properties. The lease was entered into prior to Mr. Gonzalez becoming an executive officer and lease payments are at market rates. The lease obligations for the 2015 fiscal year through January 2019 (the end of the current term of the lease) are approximately $210,000 (including CAM reimbursements of approximately $67,000).
Fairholme Capital Management, L.L.C., or one of its affiliates (“Fairholme Capital”), has served as an investment adviser to the Company since April 2013. Mr. Berkowitz, the Founder, Managing Member and Chief Investment Officer of Fairholme Capital, and the President and a director of the Fairholme Fund, is the Chairman of our Board of Directors. The Fairholme Fund owned approximately 31.1% of our common stock as of February 26, 2016. Pursuant to the terms of an Investment Management Agreement, as amended, Fairholme Capital has agreed to supervise and direct the investments of investment accounts established by us in accordance with the investment guidelines and restrictions set forth in such agreement. During 2015, the investment guidelines required that, as of the date of any investment (i) at least 50% of the investment accounts be held in cash or cash equivalents, (ii) no more than 15% of the investment accounts may be invested in securities of any one issuer (excluding the U.S. Government), (iii) any investment in any one issuer (excluding the U.S. Government) that exceeds 10%, but not 15%, requires the consent of at least two members of the Investment Committee and (iv) the investment accounts may not be invested in common stock securities. Fairholme Capital receives no compensation for its services as our investment advisor.
Director Independence
It is the policy of the Board that a majority of the members of the Board qualify as independent directors. To assist it in making independence determinations, the Board adopted categorical standards of director independence, which are attached as
Annex A
to our Corporate Governance Guidelines which are available to view under the Investor Relations - Corporate Governance section of our website, located at www.joe.com. The categorical standards of director independence are consistent with the independence standards set forth in Section 303A.02 of the NYSE listing standards.
Pursuant to our Corporate Governance Guidelines, the Board undertakes an annual review of director independence, which includes a review of each director’s responses to questionnaires asking about any relationships with us. This review is designed to identify and evaluate any transactions or relationships between a director or any member of his or her immediate family and us or members of our senior management.
76
In determining that Mr. Alvarez was independent, the Board considered the legal services provided to us by Greenberg Traurig, a law firm for which Mr. Alvarez serves as Co-Chairman. Following such consideration, the Board determined that the services provided by Greenberg Traurig did not affect Mr. Alvarez’s independence.
Based on its independence review and after considering the transactions described above, the Board determined that each of the following current directors (which together constitute all of the members of the Board other than Mr. Gonzalez) is independent: Messrs. Alvarez, Berkowitz, Frank, Martin, Murphy and Portera. Mr. Gonzalez is not independent as he currently serves as our President and Chief Executive Officer.
Item 14.
Principal Accounting Fees and Services
Our Audit Committee appointed KPMG to continue to serve as our independent registered public accounting firm, to audit the consolidated financial statements for our Company for the fiscal year ended December 31, 2015. KPMG has served as our independent registered public accounting firm since 1990.
Fees Paid to KPMG
We were billed for professional services provided with respect to fiscal years 2014 and 2015 by KPMG in the amounts set forth in the following table.
|
Services Provided
|
2014
|
2015
|
||||||
|
Audit Fees
(1)
|
$
|
934,000
|
|
$
|
661,000
|
|
||
|
Audit-Related Fees
|
—
|
|
—
|
|
||||
|
Tax Fees
|
—
|
|
—
|
|
||||
|
All Other Fees
|
—
|
|
—
|
|
||||
|
Total
|
$
|
934,000
|
|
$
|
661,000
|
|
||
__________
|
(1)
|
These professional services included fees associated with (i) the audit of our annual financial statements (Form 10-K); (ii) reviews of our quarterly financial statements (Forms 10-Q); and (iii) the audit of St. Joe’s internal control over financial reporting and attestation services in connection with St. Joe’s compliance with Section 404 of the Sarbanes-Oxley Act of 2002. These amounts do not include reimbursement of expenses equaling $51,700 for 2014 and $28,437 for 2015.
|
Pre-Approval Policies and Procedures for Audit and Permitted Non-Audit Services
The Pre-Approval Policy of the Company provides that the Audit Committee of The St. Joe Company is required to pre-approve all audit and non-audit services performed by the Company’s independent auditor in order to assure that the provision of such services does not impair the auditor’s independence. Any proposed services exceeding pre-approved cost levels require specific pre-approval by the Audit Committee. The term of any pre-approval is indefinite, unless the Audit Committee specifically provides for a different period or amends such approval.
Pursuant to the Pre-Approval Policy, the Audit Committee delegates pre-approval authority to the Chairman of the Audit Committee for pre-approval of decisions relating to a service if the fee for such service does not exceed $50,000. The Chairman must report any pre-approval decisions to the Audit Committee at its next scheduled meeting. The Audit Committee may not delegate its responsibilities to pre-approve services performed by the independent auditor to management.
Consistent with these policies and procedures, the Audit Committee approved all of the services rendered by KPMG during fiscal year 2015, as described above.
77
Item 15.
Exhibits, Financial Statement Schedules
(a)(1)
Financial Statements
The financial statements listed in the accompanying Index to Financial Statements and Financial Statement Schedules and Report of Independent Registered Public Accounting Firm are filed as part of this Report.
(2)
Financial Statement Schedule
The financial statement schedules listed in the accompanying Index to Financial Statements and Financial Statement Schedules are filed as part of this Report.
(3)
Exhibits
The exhibits listed on the accompanying Index to Exhibits are filed or incorporated by reference as part of this Report.
Exhibit Index
|
Exhibit
Number
|
Description
|
|
|
2.1
|
Purchase and Sale Agreement, dated November 6, 2013, by and between The St. Joe Company and AgReserves, Inc. (incorporated by reference to Exhibit 10.53 to the registrant’s Current Report on Form 8-K filed on November 7, 2013).
|
|
|
2.2
|
Purchase and Sale Agreement, dated December 31, 2013, by and between The St. Joe Company and Mattamy (Jacksonville) Partnership d/b/a Mattamy Homes, (incorporated by reference to Exhibit 10.55 to the registrant’s Current Report on Form 8-K filed on January 6, 2014).
|
|
|
2.2a
|
Amendment to Agreement for Sale and Purchase executed on March 19, 2014, by and between The St. Joe Company and Mattamy (Jacksonville) Partnership d/b/a Mattamy Homes (incorporated by reference to Exhibit 10.57 to the registrant’s Current Report on Form 8-K filed on March 25, 2014).
|
|
|
3.1
|
Restated and Amended Articles of Incorporation of the registrant, as amended (incorporated by reference to Exhibit 3.1 to the registrant’s Quarterly Report on Form 10-Q for the quarter ended June 30, 2010).
|
|
|
3.2
|
Amended and Restated Bylaws of the registrant (incorporated by reference to Exhibit 3.1 to the registrant’s Current Report on Form 8-K filed on March 4, 2011).
|
|
|
4.1
|
Indenture, dated April 10, 2014, between Northwest Florida Timber Finance, LLC and Wilmington
Trust, National Association (incorporated by reference to Exhibit 4.1 to the registrant’s Quarterly Report on Form 10-Q for the quarter ended June 30, 2014).
|
|
|
4.2
|
Form of 4.750% Senior Secured Note due 2029 (incorporated by reference to Exhibit 4.1 to the registrant’s Quarterly Report on Form 10-Q for the quarter ended June 30, 2014).
|
|
|
10.1
|
Form of Indemnification Agreement for Directors and Officers (incorporated by reference to Exhibit 10.1 to the registrant’s Current Report on Form 8-K filed on February 13, 2009).
|
|
|
10.3
|
Master Airport Access Agreement dated November 22, 2010 by and between the registrant and the Panama City-Bay County Airport and Industrial District (the “Airport District”) (including as attachments the Land Donation Agreement dated August 22, 2006, by and between the registrant and the Airport District, and the Special Warranty Deed dated November 29, 2007, granted by St. Joe Timberland Company of Delaware, LLC to the Airport District) (incorporated by reference to Exhibit 10.1 to the registrant’s Current Report on Form 8-K filed on November 30, 2010).
|
|
|
10.7a
|
Stockholder Agreement dated September 14, 2011 by and between the registrant, Fairholme Capital Management, LLC and Fairholme Funds, Inc. (incorporated by reference to Exhibit 10.7a to the registrant’s Annual Report on Form 10-K for the year ended December 31, 2011).
|
|
|
10.22
†
|
2009 Equity Incentive Plan (incorporated by reference to Appendix A to the registrant’s Proxy Statement on Schedule 14A filed on March 31, 2009).
|
|
|
10.22a
†**
|
2015 Performance and Equity Incentive Plan.
|
|
78
|
10.49
|
Investment Management Agreement, dated April 8, 2013, between Fairholme Capital Management, L.L.C. and The St. Joe Company, (incorporated by reference to Exhibit 10.49 to the registrant’s Quarterly Report on Form 10-Q for the quarter ended March 31, 2013).
|
|
|
10.49a
|
Amendment to Investment Management Agreement, dated February 21, 2014, between Fairholme Capital Management, L.L.C. and The St. Joe Company (incorporated by reference to Exhibit 10.49a to the registrant’s Annual Report on Form 10-K for the year ended December 31, 2013).
|
|
|
10.49b
|
Amendment to Investment Management Agreement, dated April 21, 2014, between Fairholme Capital Management, L.L.C. and The St. Joe Company (incorporated by reference to Exhibit 10.49b to the registrant’s Quarterly Report on Form 10-Q for the quarter ended March 31, 2014).
|
|
|
10.52
†
|
Employment Agreement, dated October 1, 2013, between Marek Bakun and The St. Joe Company (incorporated by reference to Exhibit 10.52 to the registrant’s Current Report on Form 8-K filed on October 3, 2013).
|
|
|
10.56
†
|
Form of Employment Agreement between Executive and The St. Joe Company (incorporated by reference to Exhibit 10.56 to the registrant’s Annual Report on Form 10-K for the year ended December 31, 2013).
|
|
|
10.58
|
Form of Note Purchase Agreement (incorporated by reference to Exhibit 10.58 to the registrant’s Current Report on Form 8-K filed on April 9, 2014).
|
|
|
10.59
†
|
Letter Agreement, dated August 13, 2014, between The St. Joe Company and Park Brady (incorporated by reference to Exhibit 10.59 to the registrant’s Current Report on Form 8-K filed on August 18, 2014).
|
|
|
10.60
|
Separate Guaranty of Retained Liability Matters, dated October 19, 2015, among the St. Joe Company, Don M. Casto, III and Kensington Gardens Builders Corporation, in favor of Keybank National Association (incorporated by reference to Exhibit 10.60 to the registrant’s Quarterly Report on Form 10-Q for the quarter ended September 30, 2015).
|
|
|
10.61
†
**
|
Separation Agreement, dated November 18, 2015, between Patrick Bienvenue and The St. Joe Company.
|
|
|
21.1**
|
Subsidiaries of The St. Joe Company.
|
|
|
23.1**
|
Consent of KPMG LLP, independent registered public accounting firm for the registrant.
|
|
|
31.1**
|
Certification by Chief Executive Officer.
|
|
|
31.2**
|
Certification by Chief Financial Officer.
|
|
|
32.1**
|
Certification by Chief Executive Officer.
|
|
|
32.2**
|
Certification by Chief Financial Officer.
|
|
|
101*
|
The following information from the registrant’s Annual Report on Form 10-K for the year ended December 31, 2015, formatted in XBRL (eXtensible Business Reporting Language): (i) the Consolidated Balance Sheets, (ii) the Consolidated Statements of Operations, (iii) the Consolidated Statements of Comprehensive (Loss) Income, (iv) the Consolidated Statement of Changes in Stockholders’ Equity, (v) the Consolidated Statements of Cash Flows and (vi) Notes to the Consolidated Financial Statements.
|
|
|
*
|
|
In accordance with Regulation S-T, the XBRL-related information in Exhibit 101 to this Annual Report on Form 10-K shall be deemed to be “furnished” and not “filed”.
|
|
**
|
Filed herewith.
|
|
|
†
|
Management contract or compensatory plan or arrangement.
|
|
79
SIGNATURES
Pursuant to the requirements of the Securities Exchange Act of 1934, the registrant has duly caused this report to be signed on its behalf by the undersigned thereunto duly authorized.
|
THE ST. JOE COMPANY
|
||
|
Date:
|
March 2, 2016
|
/s/ Jorge Gonzalez
|
|
Jorge Gonzalez
|
||
|
President, Chief Executive Officer and Director
|
||
|
(Duly Authorized Officer)
|
||
Pursuant to the requirements of the Securities Exchange Act of 1934, this report has been signed below by the following persons on behalf of the registrant and in the capacities and on the dates indicated.
|
Title
|
Date
|
|||
|
/s/ Jorge Gonzalez
|
President, Chief Executive Officer and Director
|
March 2, 2016
|
||
|
Jorge Gonzalez
|
||||
|
(Principal Executive Officer)
|
||||
|
/s/ Marek Bakun
|
Executive Vice President and Chief Financial Officer
|
March 2, 2016
|
||
|
Marek Bakun
|
||||
|
(Principal Financial Officer and Principal Accounting Officer)
|
||||
|
/s/ Bruce R. Berkowitz
|
Chairman
|
March 2, 2016
|
||
|
Bruce R. Berkowitz
|
||||
|
/s/ Cesar L. Alvarez
|
Director
|
March 2, 2016
|
||
|
Cesar L. Alvarez
|
||||
|
/s/ Howard S. Frank
|
Director
|
March 2, 2016
|
||
|
Howard S. Frank
|
||||
|
/s/ Stanley Martin
|
Director
|
March 2, 2016
|
||
|
Stanley Martin
|
||||
|
/s/ Thomas P. Murphy, Jr.
|
Director
|
March 2, 2016
|
||
|
Thomas P. Murphy, Jr.
|
||||
|
/s/ Vito S. Portera
|
Director
|
March 2, 2016
|
||
|
Vito S. Portera
|
||||
80
INDEX TO FINANCIAL STATEMENTS AND FINANCIAL STATEMENT SCHEDULES
|
|
Page No.
|
REPORT OF INDEPENDENT REGISTERED PUBLIC ACCOUNTING FIRM
The Board of Directors and Stockholders
The St. Joe Company:
We have audited the accompanying consolidated balance sheets of The St. Joe Company and subsidiaries (the Company) as of December 31, 2015 and 2014, and the related consolidated statements of operations, comprehensive (loss) income, changes in stockholders’ equity, and cash flows for each of the years in the three‑year period ended December 31, 2015. In connection with our audits of the consolidated financial statements, we also have audited financial statement Schedule III - Consolidated Real Estate and Accumulated Depreciation and financial statement Schedule IV - Consolidated Mortgage Loans on Real Estate. These consolidated financial statements and financial statement schedules are the responsibility of the Company’s management. Our responsibility is to express an opinion on these consolidated financial statements and financial statement schedules based on our audits.
We conducted our audits in accordance with the standards of the Public Company Accounting Oversight Board (United States). Those standards require that we plan and perform the audit to obtain reasonable assurance about whether the financial statements are free of material misstatement. An audit includes examining, on a test basis, evidence supporting the amounts and disclosures in the financial statements. An audit also includes assessing the accounting principles used and significant estimates made by management, as well as evaluating the overall financial statement presentation. We believe that our audits provide a reasonable basis for our opinion.
In our opinion, the consolidated financial statements referred to above present fairly, in all material respects, the financial position of The St. Joe Company and subsidiaries as of December 31, 2015 and 2014, and the results of their operations and their cash flows for each of the years in the three‑year period ended December 31, 2015, in conformity with U.S. generally accepted accounting principles. Also in our opinion, the related financial statement schedules, when considered in relation to the basic consolidated financial statements taken as a whole, present fairly, in all material respects, the information set forth therein.
We also have audited, in accordance with the standards of the Public Company Accounting Oversight Board (United States), The St. Joe Company’s internal control over financial reporting as of December 31, 2015, based on criteria established in Internal Control - Integrated Framework (2013) issued by the Committee of Sponsoring Organizations of the Treadway Commission (COSO), and our report dated March 2, 2016, expressed an unqualified opinion on the effectiveness of the Company’s internal control over financial reporting.
/s/ KPMG
Jacksonville, Florida
March 2, 2016
Certified Public Accountants
THE ST. JOE COMPANY
CONSOLIDATED BALANCE SHEETS
(Dollars in thousands)
|
December 31, 2015
|
December 31, 2014
|
||||||
|
ASSETS
|
|||||||
|
Investment in real estate, net
|
$
|
313,599
|
|
$
|
321,812
|
|
|
|
Cash and cash equivalents
|
212,773
|
|
34,515
|
|
|||
|
Investments
|
191,240
|
|
636,878
|
|
|||
|
Restricted investments (Note 18)
|
7,072
|
|
7,940
|
|
|||
|
Notes receivable, net
|
2,555
|
|
24,270
|
|
|||
|
Pledged treasury securities
|
—
|
|
25,670
|
|
|||
|
Property and equipment, net of accumulated depreciation of $57.1 million and $60.3 million at December 31, 2015 and 2014, respectively
|
10,145
|
|
10,203
|
|
|||
|
Other assets
|
38,644
|
|
31,990
|
|
|||
|
Investments held by special purpose entities (Note 5)
|
208,785
|
|
209,857
|
|
|||
|
Total assets
|
$
|
984,813
|
|
$
|
1,303,135
|
|
|
|
LIABILITIES AND EQUITY
|
|||||||
|
LIABILITIES:
|
|||||||
|
Debt
|
$
|
55,194
|
|
$
|
63,804
|
|
|
|
Accounts payable
|
6,159
|
|
12,554
|
|
|||
|
Accrued liabilities and deferred credits
|
35,721
|
|
34,911
|
|
|||
|
Deferred tax liabilities
|
36,847
|
|
34,824
|
|
|||
|
Senior Notes held by special purpose entity (Note 5)
|
177,445
|
|
177,341
|
|
|||
|
Total liabilities
|
311,366
|
|
323,434
|
|
|||
|
EQUITY:
|
|||||||
|
Common stock, no par value; 180,000,000 shares authorized; 92,332,565 and 92,322,905 issued at December 31, 2015 and 2014, respectively; 75,329,557 and 92,302,636 outstanding at December 31, 2015 and 2014, respectively
|
892,387
|
|
892,237
|
|
|||
|
Retained earnings
|
78,851
|
|
80,582
|
|
|||
|
Accumulated other comprehensive loss
|
(686
|
)
|
(1,325
|
)
|
|||
|
Treasury stock at cost, 17,003,008 and 20,269 shares held at December 31, 2015 and 2014, respectively
|
(305,289
|
)
|
(285
|
)
|
|||
|
Total stockholders’ equity
|
665,263
|
|
971,209
|
|
|||
|
Non-controlling interest
|
8,184
|
|
8,492
|
|
|||
|
Total equity
|
673,447
|
|
979,701
|
|
|||
|
Total liabilities and equity
|
$
|
984,813
|
|
$
|
1,303,135
|
|
|
See notes to the consolidated financial statements.
F 3
THE ST. JOE COMPANY
CONSOLIDATED BALANCE SHEETS
(Dollars in thousands)
The following presents the portion of the consolidated balances presented above attributable to the Company’s consolidated variable interest entities. The Company’s consolidated variable interest entities include the Pier Park North joint venture, Artisan Park, L.L.C., Panama City Timber Finance Company, L.L.C. and Northwest Florida Timber Finance Company L.L.C. The following assets may only be used to settle obligations of the consolidated variable interest entities and the following liabilities are only obligations of the variable interest entities and do not have recourse to the general credit of the Company, except for the guarantees and covenants discussed in Note 9,
Real Estate Joint Ventures
. See Note 5,
Real Estate Sales
and Note 9,
Real Estate Joint Ventures.
|
December 31,
2015 |
December 31,
2014 |
||||||
|
ASSETS
|
|||||||
|
Investment in real estate
|
$
|
46,156
|
|
$
|
43,709
|
|
|
|
Cash and cash equivalents
|
4,067
|
|
3,455
|
|
|||
|
Other assets
|
14,924
|
|
8,781
|
|
|||
|
Investments held by special purpose entity (Note 5)
|
208,785
|
|
209,857
|
|
|||
|
$
|
273,932
|
|
$
|
265,802
|
|
||
|
LIABILITIES
|
|||||||
|
Debt
|
$
|
48,200
|
|
$
|
31,618
|
|
|
|
Accounts payable
|
177
|
|
1,511
|
|
|||
|
Accrued liabilities and deferred credits
|
4,239
|
|
4,142
|
|
|||
|
Senior Notes held by special purpose entity (Note 5)
|
177,445
|
|
177,341
|
|
|||
|
Total liabilities
|
$
|
230,061
|
|
$
|
214,612
|
|
|
See notes to the consolidated financial statements.
F 4
THE ST. JOE COMPANY
(Dollars in thousands except per share amounts)
|
|
Years Ended December 31,
|
||||||||||
|
|
2015
|
|
2014
|
2013
|
|||||||
|
Revenues:
|
|||||||||||
|
Real estate sales
|
$
|
33,704
|
|
$
|
634,976
|
|
$
|
45,076
|
|
||
|
Resorts and leisure revenues
|
54,488
|
|
48,414
|
|
46,424
|
|
|||||
|
Leasing revenues
|
8,978
|
|
6,977
|
|
4,306
|
|
|||||
|
Timber sales
|
6,701
|
|
11,506
|
|
35,450
|
|
|||||
|
Total revenues
|
103,871
|
|
701,873
|
|
131,256
|
|
|||||
|
Expenses:
|
|||||||||||
|
Cost of real estate sales
|
16,399
|
|
87,132
|
|
24,701
|
|
|||||
|
Cost of resorts and leisure revenues
|
47,069
|
|
42,900
|
|
39,014
|
|
|||||
|
Cost of leasing revenues
|
2,792
|
|
2,253
|
|
1,671
|
|
|||||
|
Cost of timber sales
|
834
|
|
4,513
|
|
21,527
|
|
|||||
|
Other operating and corporate expenses
|
33,426
|
|
26,128
|
|
27,855
|
|
|||||
|
Pension charges
|
—
|
|
13,529
|
|
1,500
|
|
|||||
|
Administrative costs associated with special purpose entities (Note 5)
|
—
|
|
3,746
|
|
—
|
|
|||||
|
Depreciation, depletion and amortization
|
9,486
|
|
8,422
|
|
9,131
|
|
|||||
|
Impairment losses
|
—
|
|
—
|
|
5,080
|
|
|||||
|
Total expenses
|
110,006
|
|
188,623
|
|
130,479
|
|
|||||
|
Operating (loss) income
|
(6,135
|
)
|
513,250
|
|
777
|
|
|||||
|
Other income (expense):
|
|||||||||||
|
Investment income, net
|
22,688
|
|
12,691
|
|
1,498
|
|
|||||
|
Interest expense
|
(11,429
|
)
|
(8,608
|
)
|
(2,040
|
)
|
|||||
|
Other, net
|
(6,287
|
)
|
4,488
|
|
4,210
|
|
|||||
|
Total other income
|
4,972
|
|
8,571
|
|
3,668
|
|
|||||
|
(Loss) income before equity in (loss) income from unconsolidated affiliates and income taxes
|
(1,163
|
)
|
521,821
|
|
4,445
|
|
|||||
|
Equity in (loss) income from unconsolidated affiliates
|
—
|
|
(32
|
)
|
112
|
|
|||||
|
Income tax (expense) benefit
|
(808
|
)
|
(115,507
|
)
|
409
|
|
|||||
|
Net (loss) income
|
(1,971
|
)
|
|
406,282
|
|
4,966
|
|
||||
|
Net loss attributable to non-controlling interest
|
240
|
|
171
|
|
24
|
|
|||||
|
Net (loss) income attributable to the Company
|
$
|
(1,731
|
)
|
$
|
406,453
|
|
$
|
4,990
|
|
||
|
NET INCOME PER SHARE
|
|||||||||||
|
Basic and Diluted
|
|||||||||||
|
Weighted average shares outstanding
|
87,827,869
|
|
92,297,467
|
|
92,285,888
|
|
|||||
|
Net (loss) income per share attributable to the Company
|
$
|
(0.02
|
)
|
$
|
4.40
|
|
$
|
0.05
|
|
||
See notes to the consolidated financial statements.
F 5
THE ST. JOE COMPANY
CONSOLIDATED STATEMENTS OF COMPREHENSIVE (LOSS) INCOME
(Dollars in thousands)
|
|
Years Ended December 31,
|
||||||||||
|
|
2015
|
|
2014
|
2013
|
|||||||
|
Net (loss) income:
|
$
|
(1,971
|
)
|
$
|
406,282
|
|
$
|
4,966
|
|
||
|
Other comprehensive income, net of tax:
|
|
||||||||||
|
Available-for-sale investment items:
|
|||||||||||
|
Net unrealized gains (losses) on available-for-sale investments
|
5,650
|
|
(1,455
|
)
|
(2,032
|
)
|
|||||
|
Reclassification of other-than-temporary impairment losses included in earnings
|
—
|
|
1,295
|
|
—
|
|
|||||
|
Reclassification of realized (gains) losses included in earnings
|
(5,311
|
)
|
833
|
|
(93
|
)
|
|||||
|
Total before income taxes
|
339
|
|
673
|
|
(2,125
|
)
|
|||||
|
Income tax
|
300
|
|
127
|
|
—
|
|
|||||
|
Total
|
639
|
|
800
|
|
(2,125
|
)
|
|||||
|
Defined benefit pension items:
|
|||||||||||
|
Net (loss) gain arising during the period
|
—
|
|
(2,180
|
)
|
2,191
|
|
|||||
|
Amortization and settlement included in net periodic cost
|
—
|
|
7,107
|
|
743
|
|
|||||
|
Amortization of loss included in net periodic cost
|
—
|
|
465
|
|
326
|
|
|||||
|
Total before income taxes
|
—
|
|
5,392
|
|
3,260
|
|
|||||
|
Income tax
|
—
|
|
—
|
|
—
|
|
|||||
|
Total
|
—
|
|
5,392
|
|
3,260
|
|
|||||
|
Total other comprehensive income, net of tax
|
639
|
|
6,192
|
|
1,135
|
|
|||||
|
Total comprehensive (loss) income
|
$
|
(1,332
|
)
|
$
|
412,474
|
|
$
|
6,101
|
|
||
See notes to the consolidated financial statements.
F 6
THE ST. JOE COMPANY
CONSOLIDATED STATEMENT OF CHANGES IN STOCKHOLDERS’ EQUITY
(Dollars in thousands)
|
|
Common Stock
|
Retained (Deficit) Earnings
|
Accumulated
Other
Comprehensive
Loss
|
|
|
|
||||||||||||||||||||
|
|
Outstanding
Shares
|
Amount
|
Treasury
Stock
|
Non-controlling
Interest
|
Total
|
|||||||||||||||||||||
|
Balance at December 31, 2012
|
92,285,408
|
|
$
|
891,798
|
|
$
|
(330,861
|
)
|
$
|
(8,652
|
)
|
$
|
(260
|
)
|
$
|
309
|
|
$
|
552,334
|
|
||||||
|
Net income (loss)
|
—
|
|
—
|
|
4,990
|
|
—
|
|
—
|
|
(24
|
)
|
4,966
|
|
||||||||||||
|
Other comprehensive income
|
—
|
|
—
|
|
—
|
|
1,135
|
|
—
|
|
—
|
|
1,135
|
|
||||||||||||
|
Capital contributions from non-controlling interest
|
—
|
|
—
|
|
—
|
|
—
|
|
—
|
|
4,886
|
|
4,886
|
|
||||||||||||
|
Issuance of common stock for director fees
|
11,898
|
|
244
|
|
—
|
|
—
|
|
—
|
|
—
|
|
244
|
|
||||||||||||
|
Amortization of stock based compensation
|
—
|
|
3
|
|
—
|
|
—
|
|
—
|
|
—
|
|
3
|
|
||||||||||||
|
Reduction in excise tax benefits on stock options
|
—
|
|
(18
|
)
|
—
|
|
—
|
|
—
|
|
—
|
|
(18
|
)
|
||||||||||||
|
Treasury shares received in lieu of taxes to be remitted on vesting of restricted stock awards
|
(4,393
|
)
|
—
|
|
—
|
|
—
|
|
(25
|
)
|
—
|
|
(25
|
)
|
||||||||||||
|
Balance at December 31, 2013
|
92,292,913
|
|
$
|
892,027
|
|
$
|
(325,871
|
)
|
$
|
(7,517
|
)
|
$
|
(285
|
)
|
$
|
5,171
|
|
$
|
563,525
|
|
||||||
|
Net income (loss)
|
—
|
|
—
|
|
406,453
|
|
—
|
|
—
|
|
(171
|
)
|
406,282
|
|
||||||||||||
|
Other comprehensive income
|
—
|
|
—
|
|
—
|
|
6,192
|
|
—
|
|
—
|
|
6,192
|
|
||||||||||||
|
Capital contributions to special purpose entity from non-controlling interest
|
—
|
|
—
|
|
—
|
|
—
|
|
—
|
|
3,492
|
|
3,492
|
|
||||||||||||
|
Issuance of common stock for director’s fees
|
9,723
|
|
210
|
|
—
|
|
—
|
|
—
|
|
—
|
|
210
|
|
||||||||||||
|
Balance at December 31, 2014
|
92,302,636
|
|
$
|
892,237
|
|
$
|
80,582
|
|
$
|
(1,325
|
)
|
$
|
(285
|
)
|
$
|
8,492
|
|
$
|
979,701
|
|
||||||
|
Net loss
|
—
|
|
—
|
|
(1,731
|
)
|
—
|
|
—
|
|
(240
|
)
|
(1,971
|
)
|
||||||||||||
|
Other comprehensive income
|
—
|
|
—
|
|
—
|
|
639
|
|
—
|
|
—
|
|
639
|
|
||||||||||||
|
Capital distribution to non-controlling interest
|
—
|
|
—
|
|
—
|
|
—
|
|
—
|
|
(68
|
)
|
(68
|
)
|
||||||||||||
|
Repurchase of common shares
|
(16,982,739
|
)
|
—
|
|
—
|
|
—
|
|
(305,004
|
)
|
—
|
|
(305,004
|
)
|
||||||||||||
|
Issuance of common stock for director’s fees
|
9,660
|
|
150
|
|
—
|
|
—
|
|
—
|
|
—
|
|
150
|
|
||||||||||||
|
Balance at December 31, 2015
|
75,329,557
|
|
$
|
892,387
|
|
$
|
78,851
|
|
$
|
(686
|
)
|
$
|
(305,289
|
)
|
$
|
8,184
|
|
$
|
673,447
|
|
||||||
See notes to consolidated financial statements.
F 7
THE ST. JOE COMPANY
(Dollars in thousands)
|
|
Years Ended December 31,
|
||||||||||
|
|
2015
|
2014
|
2013
|
||||||||
|
Cash flows from operating activities:
|
|||||||||||
|
Net (loss) income
|
$
|
(1,971
|
)
|
$
|
406,282
|
|
$
|
4,966
|
|
||
|
Adjustments to reconcile net income to net cash from operating activities:
|
|||||||||||
|
Depreciation, depletion and amortization
|
9,486
|
|
8,422
|
|
9,131
|
|
|||||
|
Stock based compensation
|
150
|
|
210
|
|
247
|
|
|||||
|
Pension charges
|
—
|
|
8,749
|
|
1,500
|
|
|||||
|
(Gain) loss on sale of investments
|
(5,311
|
)
|
833
|
|
(93
|
)
|
|||||
|
Other-than-temporary impairment loss
|
—
|
|
1,295
|
|
—
|
|
|||||
|
Equity in loss (income) from unconsolidated joint ventures
|
—
|
|
32
|
|
(112
|
)
|
|||||
|
Deferred income tax expense (benefit)
|
2,323
|
|
46,127
|
|
(909
|
)
|
|||||
|
Impairment losses
|
—
|
|
—
|
|
5,080
|
|
|||||
|
Gain (loss) on disposal of real estate and property and equipment
|
77
|
|
(202
|
)
|
(528
|
)
|
|||||
|
Cost of real estate sold
|
14,584
|
|
76,060
|
|
22,022
|
|
|||||
|
Expenditures for and acquisition of real estate to be sold
|
(8,378
|
)
|
(7,368
|
)
|
(19,165
|
)
|
|||||
|
Notes financed by the Company for operating properties sold
|
—
|
|
(19,600
|
)
|
(5,248
|
)
|
|||||
|
Timber Note
|
—
|
|
(200,000
|
)
|
—
|
|
|||||
|
Deferred revenue
|
(65
|
)
|
(13,562
|
)
|
—
|
|
|||||
|
Accretion income and other
|
(1,780
|
)
|
(2,129
|
)
|
(966
|
)
|
|||||
|
Changes in operating assets and liabilities:
|
|||||||||||
|
Pension Plan assets reverted to the Company
|
—
|
|
23,820
|
|
—
|
|
|||||
|
Payments received on notes receivable
|
21,780
|
|
3,242
|
|
1,562
|
|
|||||
|
Other assets
|
(3,650
|
)
|
(5,010
|
)
|
(1,596
|
)
|
|||||
|
Accounts payable and accrued liabilities
|
(3,330
|
)
|
4,946
|
|
(96
|
)
|
|||||
|
Income taxes
|
(1,497
|
)
|
(1,112
|
)
|
538
|
|
|||||
|
Net cash provided by operating activities
|
22,418
|
|
331,035
|
|
16,333
|
|
|||||
|
Cash flows from investing activities:
|
|||||||||||
|
Expenditures for Pier Park North joint venture
|
(5,783
|
)
|
(22,592
|
)
|
(19,301
|
)
|
|||||
|
Purchases of property and equipment
|
(3,304
|
)
|
(2,483
|
)
|
(3,594
|
)
|
|||||
|
Purchases of investments
|
(341,994
|
)
|
(723,099
|
)
|
(256,730
|
)
|
|||||
|
Maturities of investments
|
410,000
|
|
150,319
|
|
100,000
|
|
|||||
|
Sales of investments
|
385,695
|
|
83,239
|
|
7,725
|
|
|||||
|
Sales of unconsolidated affiliates
|
—
|
|
3,000
|
|
—
|
|
|||||
|
Investment and maturities of assets held by special purpose entities
|
787
|
|
(6,921
|
)
|
—
|
|
|||||
|
Other
|
—
|
|
(148
|
)
|
514
|
|
|||||
|
Net cash provided by (used in) investing activities
|
445,401
|
|
(518,685
|
)
|
(171,386
|
)
|
|||||
|
Cash flows from financing activities:
|
|||||||||||
|
Borrowings on construction/refinanced loan in Pier Park North joint venture
|
48,200
|
|
25,173
|
|
6,445
|
|
|||||
|
(Distribution) contribution to Pier Park North joint venture from non-controlling interest
|
(68
|
)
|
—
|
|
4,886
|
|
|||||
|
Repurchase of common shares
|
(305,004
|
)
|
—
|
|
—
|
|
|||||
|
Principal payments for debt
|
(31,942
|
)
|
(627
|
)
|
(321
|
)
|
|||||
|
Proceeds from issuance of Senior Notes by special purpose entity
|
—
|
|
177,269
|
|
—
|
|
|||||
|
Debt issuance costs
|
(747
|
)
|
(1,544
|
)
|
—
|
|
|||||
|
Other
|
—
|
|
—
|
|
(43
|
)
|
|||||
|
Net cash (used in) provided by financing activities
|
(289,561
|
)
|
200,271
|
|
10,967
|
|
|||||
|
Net increase (decrease) in cash and cash equivalents
|
178,258
|
|
12,621
|
|
(144,086
|
)
|
|||||
|
Cash and cash equivalents at beginning of the year
|
34,515
|
|
21,894
|
|
165,980
|
|
|||||
|
Cash and cash equivalents at end of the year
|
$
|
212,773
|
|
$
|
34,515
|
|
$
|
21,894
|
|
||
See notes to consolidated financial statements.
F 8
THE ST. JOE COMPANY
SUPPLEMENTAL DISCLOSURES OF CASH FLOW INFORMATION
(Dollars in thousands)
|
Years Ended December 31,
|
||||||||||||
|
2015
|
2014
|
2013
|
||||||||||
|
Cash paid during the period for:
|
||||||||||||
|
Interest
|
$
|
10,569
|
|
$
|
1,733
|
|
$
|
2,413
|
|
|||
|
Income taxes
|
$
|
—
|
|
$
|
70,491
|
|
$
|
(22
|
)
|
|||
|
|
|
|
||||||||||
|
Non-cash financing and investment activities:
|
||||||||||||
|
(Decrease) increase in Community Development District Debt
|
$
|
(768
|
)
|
$
|
(4,369
|
)
|
$
|
2,589
|
|
|||
|
Decrease in pledged treasury securities related to defeased debt
|
$
|
(25,670
|
)
|
$
|
(590
|
)
|
$
|
(558
|
)
|
|||
|
Expenditures for operating properties and property and equipment financed through accounts payable
|
$
|
1,138
|
|
$
|
4,866
|
|
$
|
4,497
|
|
|||
|
Exchange of Timber Note for investments held by special purpose entity
|
$
|
—
|
|
$
|
200,000
|
|
$
|
—
|
|
|||
|
Capital contributions to special purpose entity from non-controlling interest
|
$
|
—
|
|
$
|
3,492
|
|
$
|
—
|
|
|||
|
Pension Plan assets transferred to the Company’s 401(k) Plan and invested in restricted investments
|
$
|
—
|
|
$
|
7,940
|
|
$
|
—
|
|
|||
|
Settlement of note receivable
|
$
|
—
|
|
$
|
—
|
|
$
|
312
|
|
|||
|
Non-monetary receipt of real estate from an unconsolidated affiliate
|
$
|
—
|
|
$
|
—
|
|
$
|
398
|
|
|||
See notes to consolidated financial statements.
F 9
THE ST. JOE COMPANY
NOTES TO CONSOLIDATED FINANCIAL STATEMENTS
(Dollars in thousands, unless otherwise stated)
1. Nature of Operations
The St. Joe Company together with its consolidated subsidiaries (the “Company”) is a Florida real estate development, asset management, and operating company with real estate assets and operations concentrated primarily between Tallahassee and Destin, Florida.
The Company conducts primarily all of its business in the following
five
reportable operating segments: 1) residential real estate, 2) commercial real estate, 3) resorts and leisure, 4) leasing operations and 5) forestry. In prior periods, the Company’s reportable operating segments were 1) residential real estate, 2) commercial real estate, 3) resorts, leisure and leasing operations and 4) forestry. The Company’s leasing operations segment currently meets the quantitative and qualitative factors as a reportable operating segment; therefore, the Company has changed its segment presentation to include leasing operations as a reportable operating segment. Leasing operations were historically included with the Company’s resorts, leisure and leasing operating segment. All prior year’s segment information has been reclassified to conform to the 2015 presentation. The change in reporting segments had no effect on the Consolidated Balance Sheets, Statements of Operations, Statements of Comprehensive (Loss) Income or Statements of Cash Flows for the periods presented. See Note 20,
Segment Information
.
2. Significant Accounting Policies
Basis of Presentation and Principles of Consolidation
The consolidated financial statements include the accounts of the Company and all of its majority-owned and controlled subsidiaries and variable interest entities where the Company is the primary beneficiary. Investments in joint ventures and limited partnerships in which the Company has significant influence, but not a controlling interest are accounted for by the equity method. All significant intercompany transactions and balances have been eliminated in consolidation. Certain prior period amounts have been reclassified to conform to the current period’s presentation.
Use of Estimates
The preparation of financial statements in conformity with accounting principles generally accepted in the United States requires management to make estimates and assumptions that affect the reported amounts of assets, liabilities and disclosure of contingent assets and liabilities at the date of the financial statements and the reported amounts of revenues and expenses during the reporting period. On an ongoing basis, the Company evaluates its estimates and assumptions including investment in real estate, impairment assessments, investments, other-than-temporarily impairment assessments, retained interest investments, accruals and deferred income taxes. Actual results could differ from those estimates.
Revenue Recognition
Revenues consist primarily of real estate sales, resorts and leisure operations, leasing operations, and timber sales. Taxes collected from customers and remitted to governmental authorities (e.g. sales tax) are excluded from revenues and costs and expenses.
Real estate sales
Revenues from real estate sales, including sales of homesites, commercial properties and rural or timberland, are recognized when a sale is closed and title transfers to the buyer, the buyer’s initial investment is adequate, any receivables are probable of collection, the usual risks and rewards of ownership have been transferred to the buyer, and the Company does not have significant continuing involvement with the real estate sold.
F 10
The buyer’s minimum initial investment requirement is typically the receipt of cash for approximately twenty to twenty-five percent of the sales value depending on the type and use of the property purchased. If the minimum initial investment requirement is not met, revenues may be deferred depending on the circumstances. In addition, revenue is not recognized until title transfers and any consideration received is deferred until title is transferred.
Percentage-of-completion accounting, where revenue is recognized in proportion to the percentage of total costs incurred in relation to estimated total costs, is used for our homesite sales when required development is not complete at the time of sale and for commercial and other land sales if there are uncompleted development costs yet to be incurred for the property sold.
As part of the purchase price consideration for a homesite from sales to homebuilders, the Company may receive a percentage of the sale price of the completed home if the home price or gross profit of the home exceeds a negotiated threshold. These lot residuals are recognized in revenue when consideration is received by the Company in periods subsequent to the initial recognition of revenue for the sale of the homesite.
Resorts and leisure revenues
Resorts and leisure revenues include service and rental fees associated with the WaterColor Inn and the Company’s vacation rental programs in WaterColor Inn, WaterColor, WaterSound Beach and surrounding communities and other resort, golf club, marina, and management services of The Pearl Hotel. These revenues are generally recognized as services are provided. Vacation rental revenues include the entire rental fee collected from the customer, including the homeowner’s portion. A percentage of the fee is remitted to the homeowner and presented in cost of resorts and leisure revenues. The Company is the principal in its vacation rental business and has determined that it is the primary obligor to the guest, as it has sole discretion in establishing prices and provides the majority of the services to the guest. Club membership revenues are recognized when billed to the member and the non-refundable initiation fee is deferred and recognized ratably over the estimated membership period. Revenues generated from our management services of The Pearl Hotel include a management fee,
fifty percent
of certain resort fees and a percentage of The Pearl Hotel’s gross operating profit.
Leasing revenues
Leasing revenues consist of long term rental revenues from retail/commercial leasing operations, including properties located in our consolidated joint venture at Pier Park North and our industrial park, VentureCrossings, which are recognized as earned, using the straight-line method over the life of the lease. Certain leases provide for tenant occupancy during periods for which no rent is due or where minimum rent payments change during the lease term. Accordingly, a receivable or liability is recorded representing the difference between the straight-line rent and the rent that is contractually due from the tenant. Minimum future base rents on non-cancelable leases for the next five years are
$6.8 million
in 2016,
$6.7 million
in 2017,
$6.5 million
in 2018,
$6.2 million
in 2019, and
$5.9 million
in 2020.
Forestry product sales
Revenues from the sale of the Company’s forestry products are primarily delivered under pay-as-cut sales contracts or timber bid sales, which risk of loss and title to the trees transfer to the buyer when cut by the buyer. Under a pay-as-cut sales contract, the buyer or some other third party is responsible for all logging and hauling costs, if any. Prior to the AgReserves Sale, sales of forestry products were recognized generally on delivery of the product to the customer.
Timber bid sales are agreements in which the buyer agrees to purchase and harvest specified timber (i.e. mature pulpwood and/or sawlogs) on a tract of land over the term of the contract. Unlike a pay-as-cut sales contract, risk of loss and title to the trees transfer to the buyer when the contract is signed. The buyer pays the full purchase price when the contract is signed and the Company does not have any additional performance obligations. Under a timber bid sale, the buyer or some other third party is responsible for all logging and hauling costs, if any, and the timing of such activity. Revenue from a timber bid sale is recognized when the contract is signed since the earnings process is complete.
Comprehensive (Loss) Income
The Company’s comprehensive (loss) income includes unrealized gains and temporary losses on available-for-sale securities. During 2014 and 2013, comprehensive income also included changes in the funded status of the Company’s terminated pension plan, which were initially recognized in other comprehensive income and amortized into net income or recognized at the time of a specific event, such as the curtailment of benefit plan obligations or the pension plan termination during 2014. See
Note 18,
Employee Benefit Plans
.
F 11
Cash and Cash Equivalents
Cash and cash equivalents include cash on hand, bank demand accounts, money market instruments and short term commercial paper having original maturities at acquisition date of ninety days or less.
Investments
Investments consist of available-for-sale securities and are recorded at fair value, which is based on observable market inputs. Unrealized gains and temporary losses on investments, net of tax, are recorded in Other comprehensive (loss) income. Realized gains and losses are determined using the specific identification method.
The Company evaluates investments classified as available-for-sale with unrealized losses to determine if they are other-than-temporary impaired. This evaluation is based on various factors, including the financial condition, business prospects, industry and creditworthiness of the issuer, severity and length of time the securities were in a loss position, the Company’s ability and intent to hold investments until unrealized losses are recovered or until maturity and amount of the unrealized loss. If a decline in fair value is considered other-than-temporary, the decline is then bifurcated into its credit and non-credit related components. The amount of the credit-related component is recognized in earnings, and the amount of the non-credit related component is recognized in other comprehensive loss, unless the Company intends to sell the security or it is more likely than not that the Company will be required to sell the security prior to its anticipated recovery. Based on these factors, the unrealized losses related to the Company's debt securities of
$1.1 million
were determined to be temporary at
December 31, 2015
. During 2014, the Company determined that certain unrealized losses were other than temporarily impaired and recorded an other-than-temporary impairment of $
1.3 million
related to credit-related losses in Investment income, net on the Company’s Consolidated Statements of Operations. The non-credit component of
$1.5 million
remained in Accumulated other comprehensive loss as of December 31, 2014.
Restricted Investments
The Company’s restricted investments are related to the Company’s deferred compensation plan. As part of the Pension Plan termination in 2014, the Company directed the Pension Plan to transfer the Pension Plan’s surplus assets into a suspense account in the Company’s 401(k) Plan. The Company has retained the risks and rewards of ownership of these assets; therefore, the assets held in the suspense account are included in the Company’s Consolidated Balance Sheets until they are allocated to current and future 401(k) plan participants for up to the next
six
years. See Note 18,
Employee Benefit Plans
.
Notes Receivable
The Company’s notes receivable are due from customers or homebuilders located within the United States. The Company evaluates the carrying value of notes receivable at each reporting date. Notes receivable balances are adjusted to net realizable value based upon a review of entity specific facts or when terms are modified. The Company maintains an allowance for doubtful accounts for estimated losses resulting from the inability of its customers to make required payments. The allowance for doubtful accounts is based on a review of specifically identified accounts in addition to an overall aging analysis. As of December 31, 2015 and 2014 there was
no
allowance for doubtful accounts. Judgments are made with respect to the collectability of accounts based on historical experience and current economic trends. Actual losses could differ from those estimates.
Investment in Real Estate
The Company capitalizes costs directly associated with development and construction of identified real estate projects. The Company also capitalizes those indirect costs that relate to the projects under development or construction. These indirect costs include construction and development administration, legal fees, capitalized interest, and project administration to the extent that such costs are related to a specific project. Interest is capitalized (up to total interest expense) based on the amount of underlying expenditures and real estate taxes on real estate projects under development.
Real estate development costs also include land and common development costs (such as roads, sewers and amenities), capitalized property taxes, capitalized interest and certain indirect costs. A portion of real estate inventory costs and estimates for costs to complete are allocated to each unit based on the relative sales value of each unit as compared to the estimated sales value of the total project. These estimates are reevaluated at least annually and more frequently if warranted by market conditions, changes in the project’s scope or other factors, with any adjustments being allocated prospectively to the remaining units available for sale.
F 12
The capitalization period relating to direct and indirect project costs is the period in which activities necessary to ready a property for its intended use are in progress. The period begins when such activities commence, typically when the Company begins the entitlement processes for land already owned, and ends when the asset is substantially complete and ready for its intended use. Determination of when construction of a project is substantially complete and ready for its intended use requires judgment. The Company determines when the capitalization period begins and ends through communication with project and other managers responsible for the tracking and oversight of individual projects. In the event that the activities to ready the asset for its intended use are suspended, the capitalization period will cease until such activities are resumed. If the Company determines not to complete a project, any previously capitalized costs are expensed in the period in which the determination is made and recovery is not deemed reasonable. The Company has capitalized indirect development costs of $
0.2 million
,
$0.6 million
and
$0.7 million
during
2015
,
2014
and
2013
, respectively. These capitalized indirect development costs are primarily related to the consolidated joint venture at Pier Park North.
Investment in real estate is carried at cost, net of depreciation and timber depletion, unless circumstances indicate that the carrying value of the assets may not be recoverable. If the Company determines that an impairment exists due to the inability to recover an asset’s carrying value, an impairment charge is recorded to the extent that the carrying value exceeds estimated fair value. If such assets were held for sale, the provision for loss would be recorded to the extent that the carrying value exceeds estimated fair value less costs to sell.
Depreciation is computed on straight-line method over the useful lives of the assets ranging from
five
to
forty
years.
Long-Lived Assets
The Company reviews its long-lived assets for impairment quarterly to determine whether events or changes in circumstances indicate that the carrying value of an asset may not be recoverable. Long-lived assets include the Company’s investments in operating and development property and property and equipment, net. As part of the Company’s review for impairment of its long-lived assets, the Company reviews long-lived asset’s carrying value, current period actual financial results as compared to prior period and forecast contained in the Company’s business plan and other events or changes in circumstances to identify whether an indicator of potential impairment may exist. Some of the events or changes in circumstances that are considered by the Company as indicators of potential impairment include:
|
•
|
a prolonged decrease in the fair value or demand for the Company’s properties;
|
|
•
|
a change in the expected use or development plans for the Company’s properties;
|
|
•
|
a material change in strategy that would affect the fair value of the Company’s properties;
|
|
•
|
continuing operating or cash flow losses for an operating property;
|
|
•
|
an accumulation of costs in excess of the projected costs for a development property; and
|
|
•
|
any other adverse change that may affect the fair value of the property.
|
The Company uses varying methods to determine if an impairment exists, such as (i) considering indicators of potential impairment, (ii) analyzing expected future cash flows and comparing the expected future undiscounted cash flows of the property to its carrying value or (iii) determining market resale values.
For projects under development, an estimate of undiscounted future cash flows is performed using estimated future expenditures necessary to develop and maintain the existing project and using management’s best estimates about future sales prices and holding periods. The projection of undiscounted cash flows requires that management develop various assumptions including:
|
•
|
the projected pace of sales of homesites based on estimated market conditions and the Company’s development plans;
|
|
•
|
estimated pricing and projected price appreciation over time;
|
|
•
|
the amount and trajectory of price appreciation over the estimate selling period;
|
|
•
|
the length of the estimated development and selling periods, which can differ depending on the size of the development and the number of phases to be developed;
|
F 13
|
•
|
the amount of remaining development costs, including the extent of infrastructure or amenities included in such development costs;
|
|
•
|
holding costs to be incurred over the selling period;
|
|
•
|
for bulk land sales of undeveloped and developed parcels future pricing is based upon estimated developed lot pricing less estimated development costs and estimated developer profit;
|
|
•
|
for commercial development property, future pricing is based on sales of comparable property in similar markets; and
|
|
•
|
whether liquidity is available to fund continued development.
|
For operating properties, an estimate of undiscounted cash flows also requires management to make assumptions about the use and disposition of such properties. These assumptions include:
|
•
|
for investments in inns and rental condominium units, average occupancy and room rates, revenues from food and beverage and other amenity operations, operating expenses and capital expenditures, and eventual disposition of such properties as private residence vacation units or condominiums, based on current prices for similar units appreciated to the expected sale date;
|
|
•
|
for investments in commercial or retail property, future occupancy and rental rates and the amount of proceeds to be realized upon eventual disposition of such property at a terminal capitalization rate; and,
|
|
•
|
for investments in golf courses, memberships, future rounds and greens fees, operating expenses and capital expenditures, and the amount of proceeds to be realized upon eventual disposition of such properties at a multiple of terminal year cash flows.
|
Homesites substantially completed and ready for sale are measured at the lower of carrying value or fair value less costs to sell. Management identifies homesites as being substantially completed and ready for sale when the properties are being actively marketed with intent to sell such properties in the near term and under current market conditions. Other homesites for which management does not intend to sell in the near term under current market conditions are evaluated for impairment based on management’s best estimate of the long-term use and eventual disposition of such property.
Other properties that management does not intend to sell in the near term under current market conditions and has the
ability to hold are evaluated for impairment based on management’s best estimate of the long-term use and eventual disposition of the property. The results of impairment analyses for development and operating properties are particularly dependent on the estimated holding and selling period for each asset group.
If a property is considered impaired, the impairment charge is determined by the amount the property’s carrying value exceeds its fair value. The Company uses varying methods to determine fair value, such as (i) analyzing expected future cash flows, (ii) determining resale values by market (iii) applying a capitalization rate to net operating income using prevailing rates in a given market or (iv) applying a multiplier to revenue using prevailing rates in a given market. The fair value of a property may be derived either from discounting projected cash flows at an appropriate discount rate, through appraisals of the underlying property, or a combination thereof.
The Company classifies the assets and liabilities of a long-lived asset as held-for-sale when management approves and commits to a formal plan of sale and it is probable that a sale will be completed. The carrying value of the assets held-for-sale are then recorded at the lower of their carrying value or fair value less estimated costs to sell.
F 14
Timber Inventory
The Company estimates its standing timber inventory on an annual basis utilizing a process referred to as a “timber cruise.” Specifically, the Company conducts field measurements of the number of trees, tree height and tree diameter on a sample area equal to approximately
20%
of our timber holdings each year. Inventory data is used to calculate volumes and products along with growth projections to maintain accurate data. Industry practices are used for modeling including growth projections, volume and product classifications. Depletion is adjusted based on current volumes and accounting practices.
Property and Equipment, net
Property and equipment is stated at cost, net of accumulated depreciation. Major improvements are capitalized while maintenance and repairs are expensed in the period the cost is incurred. Depreciation is computed using the straight-line method over the useful lives of various assets, generally
three
to
thirty years
.
Income Taxes
The Company follows the asset and liability method of accounting for deferred income taxes. Deferred tax assets and liabilities are recognized for the future tax consequences attributable to differences between financial statement carrying amounts of existing assets and liabilities and their respective tax bases and operating loss and tax credit carryforwards. Deferred tax assets and liabilities are measured using enacted tax rates expected to apply to taxable income in the years in which those temporary differences are expected to be recovered or settled. The effect on deferred tax assets and liabilities of a change in tax rates is recognized in income in the period that includes the enactment date. The Company recognizes the effect of income tax positions only if those positions are more likely than not of being sustained. Recognized income tax positions are measured at the largest amount that is greater than fifty percent likely of being realized. Changes in recognition or measurement are reflected in the period in which the change in judgment occurs. The Company records interest related to unrecognized tax benefits, if any, in interest expense and penalties in Other income (expense).
A valuation allowance is recorded if based on the weight of available evidence it is more likely than not that some portion or all of the deferred tax asset will not be realized. Realization of the Company’s deferred tax assets is dependent upon the Company generating sufficient taxable income in future years in the appropriate tax jurisdictions to obtain a benefit from the reversal of deductible temporary differences and from loss carryforwards. The Company records a valuation allowance based on the timing of reversal of existing taxable temporary differences and the Company’s history of losses and future expectations of reporting taxable losses, if management does not believe it met the requirements to realize the benefits of certain of its deferred tax assets.
Concentration of Risks and Uncertainties
The Company’s real estate investments are concentrated in Northwest Florida in a number of specific development projects. Uncertain economic conditions could have an adverse impact on the Company’s real estate values and could cause the Company to sell assets at depressed values in order to pay ongoing obligations.
F 15
Financial instruments that potentially subject the Company to a concentration of credit risk consist of cash, cash equivalents, investments, notes receivable, investments held by special purpose entities, and investments in retained interests. The Company deposits and invests cash with a major financial institution in the United States, which balances exceed the amount of F.D.I.C. insurance provided on such deposits. As of
December 31, 2015
, the Company had
$184.7 million
invested in U.S. Treasury securities,
$6.3 million
invested in
one
issuer of corporate debt securities that is non-investment grade and the Company had investments in short term commercial paper from
eight
issuers of
$175.0 million
.
Earnings Per Share
Basic earnings per share is calculated by dividing net income by the average number of common shares outstanding for the period. Diluted earnings per share is calculated by dividing net income by the weighted average number of common shares outstanding for the period, including all potentially dilutive shares issuable under outstanding stock options. Stock options are not considered in any diluted earnings per share calculation when the Company has a loss from operations as their effect would be anti-dilutive. Non-vested restricted stock is included in outstanding shares at the time of grant. For the three years ended December 31,
2015
basic average shares outstanding were the same as diluted shares outstanding.
Recently Issued Accounting Pronouncements
Revenue recognition
In May 2014, the FASB issued an ASU that establishes the principles used to recognize revenue for all entities. The new guidance will be effective for annual and interim periods beginning after December 15, 2017. Early application will be permitted, but not before annual reporting periods beginning after December 15, 2016. The Company is currently evaluating the impact that the adoption of this guidance will have on its Consolidated Balance Sheets, Statements of Operations, Statements of Comprehensive (Loss) Income or Statements of Cash Flows.
Consolidation
In February 2015, the FASB issued an ASU that amends the existing consolidation guidance related to (i) limited partnerships and similar legal entities, (ii) the evaluation of variable interests for fees paid to decision makers or service providers, (iii) the effect of fee arrangements and related parties on the primary beneficiary determination, and (iv) certain investment funds. These changes are expected to limit the number of consolidation models and place more emphasis on risk of loss when determining a controlling financial interest. The new guidance will be effective for the Company as of January 1, 2016. Early adoption is permitted, including early adoption in an interim period. The Company has evaluated the impact of the adoption of this guidance and determined there will be no impact on the Consolidated Balance Sheets, Statements of Operations, Statements of Comprehensive (Loss) Income or Statements of Cash Flows. The Company had not adopted this ASU as of
December 31, 2015
.
Debt issuance costs
In April 2015, the FASB issued an ASU that requires debt issuance costs related to a recognized debt liability to be presented in the balance sheet as a direct deduction from the carrying amount of that debt liability, consistent with debt discounts. The amendment does not affect the recognition and measurement guidance for debt issuance costs. The new guidance should be applied on a retrospective basis and is effective for the Company as of January 1, 2016. Early adoption is permitted for financial statements that have not been previously issued. The Company has evaluated the impact of the adoption of this guidance and determined that the adoption will not have a material impact on its Consolidated Balance Sheets, Statements of Operations, Statements of Comprehensive (Loss) Income or Statements of Cash Flows. The Company had not adopted this ASU as of December 31, 2015.
Financial Instruments
In January 2016, the FASB issued an ASU that amends existing guidance to address certain aspects of recognition, measurement, presentation, and disclosure of financial instruments. The new guidance will require equity investments (except those accounted for under the equity method of accounting, or those that result in consolidation of the investee) to be measured at fair value with changes in fair value recognized in net income. Additionally, certain disclosure requirements and other aspects of accounting for financial instruments will change as a result of the new guidance, which is effective for interim and annual reporting periods beginning after December 15, 2017. The Company is currently evaluating the impact that the adoption of the new guidance will have on its financial condition and results of operations.
F 16
3. Investment in Real Estate
Real estate by property type and segment includes the following:
|
|
December 31,
2015 |
December 31,
2014 |
|||||
|
Development property:
|
|||||||
|
Residential real estate
|
$
|
99,413
|
|
$
|
102,408
|
|
|
|
Commercial real estate
|
56,587
|
|
59,405
|
|
|||
|
Leasing operations
(1)
|
360
|
|
3,680
|
|
|||
|
Forestry
|
2,681
|
|
3,278
|
|
|||
|
Corporate
|
2,211
|
|
2,019
|
|
|||
|
Total development property
|
161,252
|
|
170,790
|
|
|||
|
Operating property:
|
|
|
|
||||
|
Residential real estate
|
$
|
8,091
|
|
|
$
|
8,084
|
|
|
Resorts and leisure
|
109,425
|
|
|
110,136
|
|
||
|
Leasing operations
(2)
|
79,550
|
|
72,045
|
|
|||
|
Forestry
|
19,300
|
|
|
18,839
|
|
||
|
Other
|
50
|
|
|
50
|
|
||
|
Total operating property
|
216,416
|
|
209,154
|
|
|||
|
Less: Accumulated depreciation
|
64,069
|
|
58,132
|
|
|||
|
Net operating property
|
152,347
|
|
151,022
|
|
|||
|
Investment in real estate, net
|
$
|
313,599
|
|
$
|
321,812
|
|
|
|
(1
|
)
|
Includes $0.3 million and $3.1 million for the Pier Park North joint venture as of December 31, 2015 and 2014, respectively.
|
|
(2
|
)
|
Includes $49.0 million and $41.6 million for the Pier Park North joint venture as of December 31, 2015 and 2014, respectively.
|
Development property consists of land the Company is developing or intends to develop for sale or future operations. Residential real estate includes mixed-use resort, primary and seasonal residential communities and includes costs directly associated with the land, development and construction of these communities, including common development costs such as roads, sewers, and amenities and indirect costs such as development overhead, capitalized interest, marketing and project administration. Commercial real estate includes land for commercial and industrial uses, including land holdings near the Northwest Florida Beaches International Airport and Port of Port St. Joe, and includes costs directly associated with the land and development costs for these properties, which also include common development costs such as roads and sewers. Leasing development property primarily includes the land and construction under development for the consolidated joint venture at Pier Park North. This development property is being reclassified as operating property as tenants commence operations at Pier Park North.
F 17
Operating property includes the following components:
|
December 31,
2015 |
December 31,
2014 |
Estimated Useful Life (in years)
|
|||||||
|
Land and land improvements
|
$
|
73,161
|
|
$
|
72,286
|
|
5 - 20
|
||
|
Buildings and building improvements
|
133,399
|
|
127,577
|
|
20 - 40
|
||||
|
Timber
|
9,856
|
|
9,291
|
|
N/A
|
||||
|
216,416
|
|
209,154
|
|
||||||
|
Less: Accumulated depreciation
|
64,069
|
|
58,132
|
|
|||||
|
Total operating property, net
|
$
|
152,347
|
|
$
|
151,022
|
|
|||
Operating property includes property that the Company uses for operations and activities. The resorts and leisure operating property includes the WaterColor Inn, golf courses and marinas. Leasing operating property includes property developed or purchased by the Company and used for retail and commercial rental purposes, including property in our consolidated joint venture at Pier Park North. Operating property may be sold in the future as part of the Company
’
s principal real estate business. Forestry operating property includes the Company’s timberlands.
Depreciation expense related to real estate investments was
$6.3 million
,
$5.7 million
, and
$5.3 million
in
2015
,
2014
and
2013
, respectively. Depletion expense related to our timber operations was
$0.4 million
,
$0.5 million
, and
$1.2 million
in
2015
,
2014
and
2013
, respectively.
4. Impairments of Long-lived Assets
There were no events or changes in circumstances that would indicate that the carrying value of the Company’s long-lived assets would not be recoverable, and, therefore, the Company did not record any impairment charges during the years ended
December 31, 2015
and
2014
.
In 2013, the Company recorded impairment charges of
$5.1 million
, primarily for a golf course, which incurred negative operating cash flows in 2013 and the future estimated undiscounted cash flows were less than the carrying value of its assets. In addition, during 2013, the Company wrote down a residential property to its fair value less estimated selling costs.
5. Real Estate Sales
AgReserves Sale
On March 5, 2014, the Company completed its previously announced AgReserves Sale for
$562 million
and recorded pre-tax income of
$511.1 million
for the AgReserves Sale, which includes
$1.2 million
of severance costs recorded in Other operating and corporate expenses during 2014. As a result of certain adjustments to the purchase price, consideration received for the AgReserves Sale was (1)
$358.5 million
in cash, (2) a
$200 million
fifteen
year installment note (the “Timber Note”) issued by Panama City Timber Finance Company, LLC, a buyer-sponsored special purpose entity (the “Buyer SPE”), and (3) an Irrevocable Standby Letter of Credit issued by JPMorgan Chase Bank, N.A. (the “Letter of Credit”) at the request of the Buyer SPE, in favor of the Company. The Buyer SPE was created by AgReserves with financial instruments with an aggregate principal balance of
$203.5 million
that secure the Letter of Credit.
In April 2014, the Company contributed the Timber Note and assigned its rights as a beneficiary under the Letter of Credit to Northwest Florida Timber Finance, LLC, a bankruptcy-remote, qualified special purpose entity wholly owned by the Company (“NFTF”). NFTF monetized the Timber Note by issuing
$180 million
aggregate principal amount of its
4.750%
Senior Secured Notes due 2029 (the “Senior Notes”) at an issue price of
98.483%
of the face value to third party investors. The Senior Notes are payable solely by the property of NFTF, which consists solely of (i) the Timber Note, (ii) the Letter of Credit, (iii) any cash, securities and other property in certain NFTF accounts, (iv) the rights of NFTF under the contribution agreement with the Company (which was solely to contribute the Timber Note and the Letter of Credit) and (v) any proceeds relating to the property listed in (i) through (iv) above. The investors holding the Senior Notes of NFTF have no recourse against the Company for payment of the Senior Notes or the related interest expense.
F 18
The Company received
$165.0 million
in cash, net of
$15.0 million
in costs, from the monetization and
expects to receive the remaining
$20.0 million
upon maturity of the Timber Note in 2029 and after payment of the Senior Notes and any other liabilities of NFTF
. The
$15.0 million
of costs from the monetization include (1) a total of
$4.3 million
for the discount and issuance costs for the Senior Notes, which will be amortized over the term of the Senior Notes, (2)
$7.0 million
for U.S. Treasury securities and cash that the Company contributed to NFTF to be used for interest and operating expenses over the fifteen year period and which are recorded in Investments held by special purpose entities on the Company’s Consolidated Balance Sheets and (3)
$3.7 million
of costs related to the monetization that were expensed during 2014 and are recorded in Administrative costs associated with special purpose entities on the Company’s Consolidated Statements of Operations.
The Company owns the equity interest in NFTF, but
no
equity interest in the Buyer SPE. Both the Buyer SPE and NFTF are distinct legal entities and the assets of the Buyer SPE and NFTF are not available to satisfy the Company's liabilities or obligations and the liabilities of the Buyer SPE and NFTF are not the Company's liabilities or obligations.
In the event that proceeds from the financial instruments are insufficient to settle all of the liabilities of the
Buyer SPE
or NFTF, the Company is not obligated to contribute any funds to either the
Buyer SPE
or NFTF.
The Company has determined that it was the primary beneficiary of the Buyer SPE and NFTF as of
December 31, 2015
and
December 31, 2014
, and therefore, the Buyer SPE’s and NFTF’s assets and liabilities are consolidated in the Company’s financial statements as of
December 31, 2015
and
December 31, 2014
. The carrying amounts of the Buyer SPE’s and NFTF’s assets and non-recourse liabilities were
$213.5 million
and
$180.3 million
, respectively, as of
December 31, 2015
. The consolidated assets of the Buyer SPE and NFTF consist of a
$200 million
time deposit that subsequent to April 2, 2014 pays interest at
4.006%
and matures in March 2029, accrued interest of
$3.3 million
on the time deposit, U.S. Treasuries of
$8.5 million
, and cash of
$0.3 million
and deferred issuance costs of
$1.4 million
for the Senior Notes. The consolidated liabilities include the Senior Notes issued by NFTF of
$177.4 million
net of the
$2.5 million
discount and
$2.9 million
accrued interest expense on the Senior Notes.
The Company’s Consolidated Statements of Operations includes the following amounts related to the Buyer SPE and NFTF for (i) interest income on the time deposit and amortization of the discounts on the U.S. Treasuries and (ii) interest expense for the Senior Notes, amortization of the discount and issuance costs:
|
|
2015
|
2014
|
|||||
|
Investment income, net
|
$
|
8,217
|
|
$
|
6,116
|
|
|
|
Interest expense
|
$
|
(8,755
|
)
|
$
|
(6,584
|
)
|
|
The Company has classified the U.S. Treasury securities held by the Buyer SPE and NFTF as held-to-maturity based on their intent and ability to hold these securities to maturity. Accordingly, the debt securities, which mature at various dates over the remaining
fourteen
year period, are recorded at amortized cost, which approximates fair value as of
December 31, 2015
. The U.S. Treasuries mature over the remaining fourteen year period or
$0.8 million
within one year,
$3.6 million
after one year through five years,
$3.0 million
after five years through ten years and
$1.1 million
after ten years.
RiverTown Sale
On April 2, 2014, the Company completed its sale to an affiliate of Mattamy (Jacksonville) Partnership d/b/a Mattamy Homes (
“
Mattamy
”
), of approximately
4,057
acres of real property, which constitutes the RiverTown community in St. Johns County, Florida, along with all of the Company’s related development or developer rights, founder’s rights and certain tangible and intangible personal property in exchange for (1)
$24.0 million
in cash, (2)
$19.6 million
in the form of a purchase money note (the “RiverTown Note”), (3) the assumption of the Company’s Rivers Edge Community Development District (“Rivers Edge CDD”) assessments and (4) the obligation to purchase certain RiverTown community related impact fee credits from the Company as the RiverTown community is developed (the “RiverTown Sale”). The
$19.6 million
purchase money note was paid in full as of June 30, 2015.
Based on Mattamy’s current development plans and St. Johns County’s current costs for impact fees, the Company estimates that it may receive
$20 million
to
$26 million
for the impact fees over the remaining
four
-year period (most of which, the Company expects to receive at the end of that remaining
four
-year period). However, the actual additional consideration received for the impact fees, will be based on Mattamy’s actual development of the RiverTown community, the timing of Mattamy’s development of the RiverTown community and the impact fee rates at the time of such development (as determined by St. Johns County’s then current impact fee rate schedule), which are all factors beyond the Company's control. The Company cannot provide any assurance as to the amount or timing of any payments it may receive for the impact fees. The Company received
$0.1 million
for these impact fees during
2015
and
2014
.
F 19
The Company recorded net earnings of
$26.0 million
before income taxes for the RiverTown Sale in the second quarter of 2014. Mattamy also assumed the Company’s total outstanding Rivers Edge CDD assessments, which were
$11.0 million
, of which
$5.4 million
was recorded on the Company’s Consolidated Balance Sheet as of March 31, 2014.
6. Investments
Investments and restricted investments consist of available-for-sale securities and are recorded at fair value, which is based on quoted market prices. Unrealized gains and temporary losses on investments, net of tax, are recorded in Other comprehensive (loss) income. Realized gains and losses are determined using the specific identification method. The amortized cost of debt securities are adjusted for amortization of premiums and accretion of discounts to maturity computed under the effective interest method. Such amortization is included in Investment income, net. In addition, at
December 31, 2015
, the Company had investments in short term commercial paper that are classified as cash equivalents, since they had maturity dates of ninety days or less from the date of purchase.
At
December 31, 2015
investments and restricted investments classified as available-for-sale securities were as follows:
|
Amortized Cost
|
Gross Unrealized Gains
|
Gross Unrealized Losses
|
Fair Value
|
||||||||||||
|
Debt Securities:
|
|||||||||||||||
|
U.S. Treasury securities
|
$
|
184,819
|
|
$
|
—
|
|
$
|
79
|
|
$
|
184,740
|
|
|||
|
Corporate debt securities
|
7,273
|
|
—
|
|
981
|
|
6,292
|
|
|||||||
|
Preferred stock
|
265
|
|
—
|
|
57
|
|
208
|
|
|||||||
|
192,357
|
|
|
—
|
|
|
1,117
|
|
|
191,240
|
|
|||||
|
Restricted investments:
|
|||||||||||||||
|
Guaranteed income fund
|
7,072
|
|
—
|
|
—
|
|
7,072
|
|
|||||||
|
$
|
199,429
|
|
$
|
—
|
|
$
|
1,117
|
|
$
|
198,312
|
|
||||
At
December 31, 2014
investments and restricted investments classified as available-for-sale securities were as follows:
|
Amortized Cost
|
Gross Unrealized Gains
|
Gross Unrealized Losses
|
Fair Value
|
||||||||||||
|
Debt Securities:
|
|||||||||||||||
|
U.S. Treasury securities
|
$
|
509,783
|
|
$
|
32
|
|
$
|
—
|
|
$
|
509,815
|
|
|||
|
Corporate debt securities
|
101,587
|
|
—
|
|
1,482
|
|
100,105
|
|
|||||||
|
Preferred stock
|
26,963
|
|
—
|
|
5
|
|
26,958
|
|
|||||||
|
638,333
|
|
32
|
|
1,487
|
|
636,878
|
|
||||||||
|
Restricted investments:
|
|||||||||||||||
|
Guaranteed income fund
|
7,940
|
|
—
|
|
—
|
|
7,940
|
|
|||||||
|
$
|
646,273
|
|
$
|
32
|
|
$
|
1,487
|
|
$
|
644,818
|
|
||||
Fairholme Capital has served as an investment advisor to the Company since April 2013. As of
December 31, 2015
, funds managed by Fairholme Capital beneficially owned approximately
32.5%
of the Company’s common stock. Mr. Bruce Berkowitz is the Managing Member of Fairholme Capital and the Chairman of the Company’s Board of Directors. Fairholme Capital receives no compensation for their services as the Company’s investment advisor.
Pursuant to the terms of the Company's Investment Management Agreement as amended (the “Agreement”) with Fairholme Capital, Fairholme Capital agreed to supervise and direct the investments of investment accounts established by the Company in accordance with the investment guidelines and restrictions approved by the Investment Committee of the Company’s Board of Directors. The investment guidelines are set forth in the Agreement and require that, as of the date of any investment: (i) at least
50%
of the investment account be held in cash or cash equivalents, as defined in the Agreement, (ii) no more than
15%
of the investment account may be invested in securities of any one issuer (excluding the U.S. Government) and (iii) any investment in any one issuer (excluding the U.S. Government) that exceeds
10%
but not
15%
, requires the consent of at least two members of the Investment Committee. The investment account may not be invested in common stock securities.
F 20
During
2015
, realized gains from the sale of available-for-sale securities were
$5.3 million
and proceeds from the sale of available-for-sale securities were
$385.7 million
and proceeds from the maturity of available-for-sale securities were
$410.0 million
. During
2014
, realized losses from the sale of available-for-sale securities were
$0.8 million
, proceeds from the sale of available-for-sale securities were
$83.2 million
and proceeds from the maturity of available-for-sale securities were
$150.0 million
.
As of
December 31, 2015
, certain of the Company’s U.S. Treasuries, corporate debt securities and preferred stock had unrealized losses. As of
December 31, 2014
, certain of the Company’s corporate debt securities and preferred stock had unrealized losses. As of
December 31, 2015
, corporate debt securities that had been in a continuous unrealized loss position for less than twelve months, had a fair value of
$6.3 million
and had
$1.0 million
of unrealized losses. As of
December 31, 2014
, corporate debt securities that have been in an unrealized loss position for less than twelve months, had a fair value of
$85.8 million
and had
$1.3 million
of unrealized losses. Corporate debt securities that had been in an unrealized loss position for twelve months or greater had a fair value of
$14.3 million
and had
$0.2 million
of unrealized losses.
The Company evaluates investments classified as available-for-sale with unrealized losses to determine if they are other-than-temporary impaired. This evaluation is based on various factors, including the financial condition, business prospects, industry and creditworthiness of the issuer, severity and length of time the securities were in a loss position, the Company’s ability and intent to hold investments until unrealized losses are recovered or until maturity and amount of the unrealized loss. If a decline in fair value is considered other-than-temporary, the decline is then bifurcated into its credit and non-credit related components. The amount of the credit-related component is recognized in earnings, and the amount of the non-credit related component is recognized in other comprehensive loss, unless the Company intends to sell the security or it is more likely than not that the Company will be required to sell the security prior to its anticipated recovery.
At
December 31, 2015
, the unrealized losses related to the U.S. Treasury securities, corporate debt securities and preferred stock of
$1.1 million
were deemed temporary and included in Accumulated other comprehensive loss as of
December 31, 2015
. As of
December 31, 2015
, corporate debt securities had unrealized losses of
$1.0 million
, U.S. Treasury securities had unrealized losses of less than
$0.1 million
and preferred stock investments had unrealized losses of less than
$0.1 million
. As of December 31, 2014, certain of the Company’s U.S. Treasuries and preferred stock had immaterial unrealized losses. The Company previously reported in its Annual Report on Form 10-K that it had
no
continuous unrealized losses greater than twelve months as a result of recognizing a portion of the unrealized loss in earnings as of
December 31, 2014
. The Company has revised this disclosure in the following table that provides the corporate debt securities in continuous unrealized loss position and their related fair values:
|
As of December 31, 2015
|
As of December 31, 2014
|
||||||||||||||||||||||||||||||
|
Less Than 12 Months
|
12 Months or Greater
|
Less Than 12 Months
|
12 Months or Greater
|
||||||||||||||||||||||||||||
|
Fair Value
|
Unrealized Losses
|
Fair Value
|
Unrealized Losses
|
Fair Value
|
Unrealized Losses
|
Fair Value
|
Unrealized Losses
|
||||||||||||||||||||||||
|
Debt securities:
|
|||||||||||||||||||||||||||||||
|
U.S. Treasury securities
|
$
|
184,740
|
|
$
|
79
|
|
$
|
—
|
|
$
|
—
|
|
$
|
109,984
|
|
$
|
6
|
|
$
|
—
|
|
$
|
—
|
|
|||||||
|
Corporate debt securities
|
6,292
|
|
981
|
|
—
|
|
—
|
|
85,845
|
|
1,294
|
|
14,260
|
|
188
|
|
|||||||||||||||
|
Preferred stock
|
208
|
|
57
|
|
—
|
|
—
|
|
23,683
|
|
10
|
|
—
|
|
—
|
|
|||||||||||||||
|
$
|
191,240
|
|
$
|
1,117
|
|
$
|
—
|
|
$
|
—
|
|
$
|
219,512
|
|
$
|
1,310
|
|
$
|
14,260
|
|
$
|
188
|
|
||||||||
The Company had unrealized losses of
$1.1 million
as of
December 31, 2015
related to U.S. Treasury Securities, corporate debt securities and preferred stock. The Company’s unrealized losses as of December 31, 2014 relate primarily to investments in senior secured debt securities in one issuer that is a national retail chain that is non-investment grade. The Company purchased these investments between the second quarter of 2013 through the second quarter of 2014. During the third quarter of 2014, the Company determined that these investments were other-than-temporarily impaired and recorded
$1.3 million
related to credit-related losses in Investment income, net on the Company's Consolidated Statements of Operations. The credit-losses were measured as the difference between the present value of the expected cash flows of the corporate debt securities discounted using the effective interest rate at the date of purchase and the amortized cost of the corporate debt securities. The non-credit component of was recorded in Accumulated other comprehensive loss as of December 31, 2014. The Company sold these investments during 2015 and recorded a realized gain of
$5.3 million
.
As of December 31, 2015 and 2014, the Company did not intend to sell the investments with unrealized losses and it was not likely that the Company would have been required to sell the security prior to its anticipated recovery, which could have been maturity; therefore, the Company does not believe that its investment in the corporate debt securities was other-than-temporarily impaired at December 31, 2015 and 2014.
F 21
The net carrying value and estimated fair value of investments and restricted investments classified as available-for-sale at
December 31, 2015
, by contractual maturity are shown in the following table. Actual maturities may differ from contractual maturities because certain borrowers have the right to call or prepay obligations.
|
Cost
|
Fair Value
|
||||||
|
Due in one year or less
|
$
|
184,819
|
|
$
|
184,740
|
|
|
|
Due after one year through five years
|
7,175
|
|
6,205
|
|
|||
|
Due after ten through fifteen years
|
98
|
|
87
|
|
|||
|
192,092
|
|
191,032
|
|
||||
|
Preferred stock
|
265
|
|
208
|
|
|||
|
Restricted investments
|
7,072
|
|
|
7,072
|
|
||
|
$
|
199,429
|
|
$
|
198,312
|
|
||
7. Other Income (Expense)
Other income (expense) consists of the following during the three years ended
December 31, 2015
:
|
2015
|
2014
|
2013
|
||||||||||
|
Investment income, net
|
||||||||||||
|
Net investment income from available-for-sale securities
|
||||||||||||
|
Interest and dividend income
|
$
|
5,900
|
|
$
|
6,258
|
|
$
|
1,171
|
|
|||
|
Accretion income
|
2,566
|
|
1,455
|
|
—
|
|
||||||
|
Realized gains (losses) on the sale of investments
|
5,311
|
|
(833
|
)
|
93
|
|
||||||
|
Other-than-temporary impairment losses
|
—
|
|
(1,295
|
)
|
—
|
|
||||||
|
Total net investment income from available-for-sale securities
|
13,777
|
|
5,585
|
|
1,264
|
|
||||||
|
Interest income from investments in special purpose entities
|
8,217
|
|
6,116
|
|
—
|
|
||||||
|
Interest accrued on notes receivable and other interest
|
694
|
|
990
|
|
234
|
|
||||||
|
Total investment income, net
|
22,688
|
|
12,691
|
|
1,498
|
|
||||||
|
Interest expense
|
||||||||||||
|
Interest expense and amortization of discount and issuance costs for Senior Notes issued by special purpose entity
|
(8,755
|
)
|
(6,584
|
)
|
—
|
|
||||||
|
Interest expense
|
(2,674
|
)
|
(2,024
|
)
|
(2,040
|
)
|
||||||
|
Total interest expense
|
(11,429
|
)
|
(8,608
|
)
|
(2,040
|
)
|
||||||
|
Other, net
|
||||||||||||
|
Fees and expenses for the SEC investigation
|
(8,161
|
)
|
—
|
|
—
|
|
||||||
|
Accretion income from retained interest investments
|
913
|
|
889
|
|
793
|
|
||||||
|
Hunting lease income
|
738
|
|
938
|
|
1,850
|
|
||||||
|
Litigation and insurance proceeds received
|
—
|
|
1,814
|
|
560
|
|
||||||
|
Other income, net
|
223
|
|
847
|
|
1,007
|
|
||||||
|
Other, net
|
(6,287
|
)
|
4,488
|
|
4,210
|
|
||||||
|
Total other income
|
$
|
4,972
|
|
$
|
8,571
|
|
$
|
3,668
|
|
|||
Investment income, net
Interest and dividend income includes interest income accrued on the Company’s corporate debt securities and dividend income received from the Company’s preferred stock investments. Accretion income includes the amortization of the premium or accretion of discount related to the Company’s available-for-sale securities, which is amortized based on an effective interest rate method over the term of the available-for-sale security. Realized gains (losses) on the sale of investments includes the gain or loss recognized on the sale of an available for sale security prior to maturity. Other-than-temporary impairment losses include the credit-related losses on the Company’s corporate debt securities. See Note 6,
Investments.
F 22
Interest income from investments in special purpose entities primarily includes interest accrued on the Timber Note, which is used to pay the interest expense for the Senior Notes issued by special purpose entity.
See Note 5,
Real Estate Sales.
Interest expense
Interest expense includes interest expense related to the Company’s Community Development District debt and the construction loan and Refinanced Loan in the Pier Park North joint venture. Borrowing costs, including the discount and issuance costs for the Senior Notes issued by special purpose entity, are amortized based on the effective interest method at an effective rate of
4.9%
.
Other, net
During
2015
, the Company expensed a total of
$8.2 million
related to the recently resolved SEC investigation. This amount was included in Other, net in the Consolidated Statements of Operations. The
$8.2 million
of fees and expenses for the SEC investigation consisted of (i)
$3.5 million
for penalties, disgorgements and interest relating to the SEC investigation and (ii)
$4.7 million
of legal expenses associated with the SEC investigation. On October 27, 2015, the Company fully resolved the SEC investigation and entered into a settlement with the SEC. Without admitting or denying any factual allegations, the Company consented to the SEC’s issuance of an administrative order pursuant to which the Company agreed to pay penalties, disgorgements and interest of approximately
$3.5 million
, including a civil penalty assessed on the Company of
$2.75 million
and other disgorgements and interest subject to indemnification by the Company. During 2015, the Company received correspondence from an insurance carrier related to non-coverage of certain fees and expenses incurred in the SEC investigation and, as a result of this correspondence, the Company recorded
$4.7 million
in legal costs during 2015. See Note 21,
Commitments and Contingencies
.
Litigation and insurance proceeds include the cash receipt of
$1.8 million
as a settlement for a real estate easement litigation during 2014 and the cash receipt of
$0.6 million
for insurance proceeds during 2013, as compared to
no
recoveries in 2015. As of December 31, 2015, the Company did not possess necessary data to determine any insurance or litigation receivables.
The Company records the accretion of investment income from its retained interest investment over the life of the retained interest using the effective yield method with rates ranging from
3.7%
to
11.7%
. Hunting lease income is recognized as income over the term of the lease.
8. Financial Instruments and Fair Value Measurements
Fair value is an exit price, representing the amount that would be received to sell an asset or paid to transfer a liability in an orderly transaction between market participants. As such, fair value is a market-based measurement that should be determined based on assumptions that market participants would use in pricing an asset or a liability. A three-tier fair value hierarchy is established as a basis for considering such assumptions and for inputs used in the valuation methodologies in measuring fair value:
Level 1. Quoted prices in active markets for identical assets or liabilities;
Level 2. Inputs, other than the quoted prices in active markets, that are observable either directly or indirectly; and
Level 3. Unobservable inputs in which there is little or no market data, such as internally-developed valuation models which require the reporting entity to develop its own assumptions.
F 23
The financial instruments measured at fair value on a recurring basis at
December 31, 2015
were as follows:
|
Level 1
|
Level 2
|
Level 3
|
Total Fair Value
|
||||||||||||
|
Cash equivalents:
|
|||||||||||||||
|
Money market funds
|
$
|
18,233
|
|
$
|
—
|
|
$
|
—
|
|
$
|
18,233
|
|
|||
|
Commercial paper
|
174,973
|
|
—
|
|
—
|
|
174,973
|
|
|||||||
|
Debt securities:
|
|||||||||||||||
|
U.S. Treasury securities
|
184,740
|
|
—
|
|
—
|
|
184,740
|
|
|||||||
|
Corporate debt securities
|
—
|
|
6,292
|
|
—
|
|
6,292
|
|
|||||||
|
Preferred stock
|
—
|
|
208
|
|
—
|
|
208
|
|
|||||||
|
Restricted investments:
|
|||||||||||||||
|
Guaranteed income fund
|
—
|
|
7,072
|
|
—
|
|
7,072
|
|
|||||||
|
$
|
377,946
|
|
$
|
13,572
|
|
$
|
—
|
|
$
|
391,518
|
|
||||
The financial instruments measured at fair value on a recurring basis at
December 31, 2014
were as follows:
|
Level 1
|
Level 2
|
Level 3
|
Total Fair Value
|
||||||||||||
|
Cash equivalents:
|
|||||||||||||||
|
Money market funds
|
$
|
19,971
|
|
$
|
—
|
|
$
|
—
|
|
$
|
19,971
|
|
|||
|
Debt securities:
|
|||||||||||||||
|
U.S. treasury securities
|
509,815
|
|
—
|
|
—
|
|
509,815
|
|
|||||||
|
Corporate debt securities
|
—
|
|
100,105
|
|
—
|
|
100,105
|
|
|||||||
|
Preferred stock
|
—
|
|
26,958
|
|
—
|
|
26,958
|
|
|||||||
|
Restricted investments:
|
|||||||||||||||
|
Guaranteed income fund
|
—
|
|
7,940
|
|
—
|
|
7,940
|
|
|||||||
|
$
|
529,786
|
|
$
|
135,003
|
|
$
|
—
|
|
$
|
664,789
|
|
||||
Money market funds, U.S. Treasury securities and commercial paper are measured based on quoted market prices in an active market and categorized within level 1 of the fair value hierarchy. Money market funds and commercial paper with a maturity date of
90 days
or less from the date of purchase are classified as cash equivalents in the Company’s Consolidated Balance Sheets.
Corporate debt securities and preferred stock are measured primarily using pricing data from external pricing services that use prices observed for recently executed market transactions for the corporate debt security or the preferred stock that the Company owns. Corporate debt securities and preferred stock are not traded on a nationally recognized exchange but rather are traded in the U.S. over the counter market where there is less trading activity. For these reasons, the Company has determined that the corporate debt securities and preferred stock are categorized as level 2 financial instruments since their fair values were determined from market inputs in an inactive market.
Restricted investments include certain of the surplus assets that were transferred from the Company’s Pension Plan to a suspense account in the Company’s 401(k) Plan in December 2014. The Company has retained the risks and rewards of ownership of these assets; therefore, the assets held in the suspense account are included in the Company’s Consolidated Balance Sheets until they are allocated to participants. As of
December 31, 2015
and
December 31, 2014
, the assets held in the suspense account were invested in the Prudential Guaranteed Income Fund, which is a stable value fund designed to provide safety of principal, liquidity, and a rate of return. The Prudential Guaranteed Income Fund is valued based upon the contributions made to the fund, plus earnings at guaranteed crediting rates, less withdrawals and fees and are categorized as level 2 financial instruments. The Company’s Retirement Plan Investment Committee is responsible for investing decisions and allocation decisions of the suspense account. Refer to Note 18,
Employee Benefit Plans
.
F 24
Long-lived Assets
The Company reviews its long lived assets for impairment whenever events or changes in circumstances indicate that the carrying amount of an asset may not be recoverable. Homes are measured at lower of carrying value or fair value. The fair value of these homes is determined based upon final sales prices of inventory sold during the period (level 2 inputs) or estimates of selling prices based on current market data (level 3 inputs). Operating properties are evaluated for impairment based on management’s best estimate of undiscounted cash flows and eventual disposition of such properties (level 3 inputs).
The Company uses varying methods to determine fair value, such as (i) analyzing expected future cash flows, (ii) determining resale values by market, (iii) applying a capitalization rate to net operating income using prevailing rates in a given market or (iv) applying a multiple to revenue using prevailing rates in a given market. The fair value of a property may be derived either from discounting projected cash flows at an appropriate discount rate, through appraisals of the underlying property, or a combination thereof.
The Company’s assets measured at fair value on a nonrecurring basis are those assets for which the Company has recorded valuation adjustments and impairments during the year. There were no non-financial assets measured at fair value on a nonrecurring basis at December 31, 2015 or 2014. The Company’s non-financial assets measured at fair value on a nonrecurring basis and level 3 inputs are as follows at December 31, 2013.
|
Financial Statement Line
|
Level 3
Fair Value
|
Total
Impairment
Charge
|
Unobservable Input(s)
|
Range of Inputs Used
|
||||||||
|
December 31, 2013
|
||||||||||||
|
Investment in real estate, net
|
$
|
2,420
|
|
$
|
4,911
|
|
Revenue growth rates
|
5% - 16%
|
||||
|
Discount rate
|
14%
|
|||||||||||
|
Cap rate
|
11.8%
|
|||||||||||
|
Investment in real estate, net
|
$
|
722
|
|
$
|
169
|
|
Estimated selling price based on market data
|
$0.7 million - $0.9 million
|
||||
One of the Company’s golf courses incurred negative operating cash flows in 2013 and the future estimated undiscounted cash flows were less than the carrying value of its operating assets; therefore, the Company recorded an impairment charge of
$4.9 million
. The fair value of the property was determined by discounting projected cash flows. In addition, during 2013, the Company wrote down a residential property to its current fair value less estimated selling costs.
Fair Value of Financial Instruments
The Company uses the following methods and assumptions in estimating fair value for financial instruments:
|
•
|
The fair value of the Company’s pledged treasury securities is based on quoted market prices in an active market.
|
|
•
|
The fair value of the Company’s retained interest investments is based on the present value of the expected future cash flows at the effective yield.
|
|
•
|
The fair value of the Investments held by special purpose entities - time deposit is based on the present value of future cash flows at the current market rate. See Note 5,
Real Estate Sales
.
|
|
•
|
The fair value of the Investments held by special purpose entities - U.S. Treasury securities are measured based on quoted market prices in an active market. See Note 5,
Real Estate Sales
.
|
|
•
|
The fair value of the Senior Notes held by special purpose entity is based on the present value of future cash flows at the current market rate. See Note 5,
Real Estate Sales
.
|
F 25
The carrying amount and fair value of the Company’s financial instruments were as follows:
|
|
December 31, 2015
|
December 31, 2014
|
|||||||||||||||||
|
|
Carrying
value
|
Fair value
|
Level
|
Carrying
value
|
Fair value
|
Level
|
|||||||||||||
|
Assets
|
|||||||||||||||||||
|
Pledged treasury securities
|
$
|
—
|
|
$
|
—
|
|
N/A
|
$
|
25,670
|
|
$
|
26,501
|
|
1
|
|||||
|
Retained interest investments
|
$
|
10,246
|
|
$
|
13,333
|
|
3
|
$
|
9,932
|
|
$
|
13,026
|
|
3
|
|||||
|
Investments held by special purpose entities (Note 5)
|
$
|
208,785
|
|
$
|
209,033
|
|
3
|
$
|
209,857
|
|
$
|
209,679
|
|
3
|
|||||
|
Liabilities
|
|||||||||||||||||||
|
Senior Notes held by special purpose entity (Note 5)
|
$
|
177,445
|
|
$
|
178,035
|
|
3
|
$
|
177,341
|
|
$
|
177,940
|
|
3
|
|||||
Pledged Treasury Securities
In connection with a sale of the Company’s office portfolio in 2007, the Company completed an in-substance defeasance of approximately
$29.3 million
of mortgage debt that was collateralized by one of the commercial buildings. The Company assigned the mortgage debt and deposited sufficient funds with a trustee solely to satisfy the principal and remaining interest obligations on the mortgage debt when due. The interest yield on the pledged securities and the interest expense on the debt are closely related. The transaction did not qualify as an extinguishment of debt, since the Company was responsible if there had been a shortfall in the funds deposited into the trust, which are invested in government backed securities. The trust was not in the Company’s control and the trustee could not sell the securities prior to maturity.
As such, the government backed securities and the related debt (see
Note 13,
Debt
) remained on the Company’s Consolidated Balance Sheets at
December 31, 2014
. In October 2015, the trustee made the final balloon payment on the mortgage debt in the amount of
$25.3 million
, utilizing the pledged treasury securities and cash. There was no shortfall on the payment.
Retained Interest Investments
The Company has a beneficial interest in certain bankruptcy remote qualified special purpose entities (the “SPEs”) used in the installment sale monetization of certain sales of timberlands in 2007 and 2008. The SPEs’ assets are not available to satisfy the Company’s liabilities or obligations and the liabilities of the SPEs are not the Company’s liabilities or obligations.
In the event that proceeds from the financial instruments are insufficient to settle all of the liabilities of the
SPEs
, the Company is not obligated to contribute any funds to the SPEs.
The Company has determined that it is not the primary beneficiary of the SPEs, since the Company is not the primary decision maker with respect to activities that could significantly impact the economic performance of the SPEs, nor does the Company perform any service activity related to the SPEs. Therefore, the SPEs’ assets and liabilities are not consolidated in the Company’s financial statements as of
December 31, 2015
.
The Company has a beneficial or retained interest investment related to these SPEs of
$10.2 million
and
$9.9 million
as of
December 31, 2015
and
2014
, respectively, recorded in Other assets on the Company’s Consolidated Balance Sheets. The Company has classified its retained interest investment as held-to-maturity because the Company has both the intent and the ability to hold its interest in the SPEs to maturity. Accordingly, the Company has recorded the retained interest investment at cost, adjusted for the accretion of investment income over the life of the retained interest using the effective yield method with rates ranging from
3.7%
-
11.7%
. The Company continues to update the expectation of cash flows to be collected over the term of the retained interest. Changes to the previously projected cash flows are accounted for prospectively, unless based on management’s assessment of current information and events, it is determined that there is an other-than-temporary impairment. The Company has not recorded an other-than-temporary impairment related to its retained interest investments during the years ended
December 31, 2015
and
2014
.
In the event of a failure and liquidation of the counterparties involved in the installment sales, the Company could be required to write-off the remaining retained interest recorded on its Consolidated Balance Sheets in connection with the installment sale monetization transactions in 2007 and 2008.
F 26
9. Real Estate Joint Ventures
The Company enters into real estate joint ventures, from time to time, for the purpose of developing real estate in which the Company may or may not have a controlling financial interest. GAAP requires consolidation of variable interest entities (“VIE”) in which an enterprise has a controlling financial interest and is the primary beneficiary. A controlling financial interest will have both of the following characteristics: (a) the power to direct the VIE activities that most significantly impact economic performance and (b) the obligation to absorb the VIE losses and right to receive benefits that are significant to the VIE. The Company examines specific criteria and uses judgment when determining whether the Company is the primary beneficiary and must consolidate a VIE. The Company continues to assess whether it is the primary beneficiary on an ongoing basis.
Consolidated VIEs
During 2012, the Company entered into a joint venture agreement with a partner to develop a retail center at Pier Park North. The Company and its partner have contributed total cash of approximately
$14.4 million
to the joint venture, of which the Company contributed
$9.5 million
, or
66%
, and the Company’s partner contributed
$4.9 million
, or
34%
. Additionally, during 2013 the Company contributed land with an agreed upon value of
$6.0 million
to the joint venture. During 2013, the Company received a cash distribution of
$2.3 million
as the result of a sale of a portion of the property in the joint venture.
In February 2013, the joint venture entered into a
$41.0 million
construction loan agreement that would have matured in February 2016 with the possibility of an option for a
two
year extension. As of
December 31, 2014
,
$31.6 million
was outstanding on the construction loan. In connection with the construction loan agreement the Company had entered into certain limited guarantees. In addition, the Company had agreed to maintain minimum liquidity of
$25 million
and net worth of
$350 million
under the construction loan.
In October 2015, the Pier Park North joint venture refinanced the construction loan and entered into a
$48.2 million
loan. As of
December 31, 2015
,
$48.2 million
was outstanding on the Refinanced Loan. The Refinanced Loan accrues interest at a rate of
4.1%
per annum and matures in November 2025 (the “Refinanced Loan”). The Refinanced Loan provides for interest only payments during the first twelve months and principal and interest payments thereafter with a final balloon payment at maturity. The Refinanced Loan is secured by a first lien on, and security interest in, a majority of Pier Park North joint venture’s property and a short term
$6.62 million
letter of credit.
Upon refinancing of the construction loan,
$6.3 million
was distributed to the Company, including
$3.7 million
as the remaining return for contributed land. As contemplated by the Pier Park North joint venture’s operating agreement, the remaining distribution was used to rebalance the equity ownership in the joint venture, such that the ownership percentage of the Company and its partner was adjusted to
60%
and
40%
, respectively.
In connection with the closing of the Refinanced Loan, each of the Pier Park North joint venture partners executed a limited guarantee in favor of the lender, based on their percentage ownership of the joint venture. The limited guarantee covers losses arising out of certain events, including (i) tenant security deposits; (ii) tenant rents; (iii) costs and expenses related to any environmental clean-up; (iv) liability for fraud or material breach of warranty with respect to the financing; (v) unpaid real estate taxes assessed against the property; (vi) failure to maintain required insurance; (vii) foreclosure of the security instrument; or (viii) failure of the joint venture to comply with certain covenants in the security instrument. In addition, the guarantee can become full recourse in the case of any fraud or intentional misrepresentation by the Pier Park North joint venture; any voluntary transfer or encumbrance of the property in violation of the due-on-sale clause in the security instrument; upon commencement of voluntary or insolvency proceedings; and upon breach of covenants in the security instrument. Pursuant to the guarantee, the Pier Park North joint venture partners are required to maintain a minimum of
$36 million
in combined net worth, not including the value of each partner’s respective equity in the Pier Park North property.
As of
December 31, 2015
, the Company’s capital account represents
60%
of the total equity in the joint venture. The Company’s partner is responsible for the day-to-day activities; however, the Company has significant involvement in the design of the related development plan and approves all major decisions including the project development, annual budgets and loan refinancing. The Company has evaluated the VIE consolidation requirements with respect to this transaction and has determined that the Company is the primary beneficiary as the Company has both the power to direct the activities that most significantly impact the VIE’s economic performance and the obligation to absorb losses and the right to receive benefits that are significant to the VIE; therefore, the results of the VIE have been consolidated within the financial results of the Company as of
December 31, 2015
.
F 27
In addition, the Company is the primary beneficiary of another real estate joint venture, Artisan Park, L.L.C, that is consolidated within the financial results of the Company. The Company is entitled to
74%
of the profits or losses of this VIE and is responsible for the day-to-day activities of the joint venture. The Company has determined that the Company is the primary beneficiary as it has the power to direct the activities that most significantly impact the joint venture’s economic performance; therefore, the results of the VIE have been consolidated within the financial results of the Company.
As of
December 31, 2015
and
2014
, the carrying amounts of the real estate VIEs’ assets that are consolidated were
$60.5 million
and
$51.6 million
and non-recourse liabilities
$49.8 million
and
$34.4 million
, including debt. The Refinanced Loan is secured by a first lien on, and security interest in, a majority of the Pier Park North joint venture’s property and a short term
$6.62 million
letter of credit. The VIE’s assets can only be used to settle obligations of that VIE. Those assets are owned by, and those liabilities are obligations of, the VIE, and not the Company.
Unconsolidated VIEs
During 2015, the Company was a partner in ALP Liquidating Trust (
“
ALP
”
) that is accounted for using the equity method. The joint venture was entered into to develop and sell certain mixed use residential and commercial projects. The Company has evaluated the VIE consolidation requirements with respect to this joint venture and has determined that the Company is not the primary beneficiary, since the Company does not have the power to direct the activities that most significantly impact the economic performance of the VIE. The Company is not required to contribute additional funds to ALP.
Summarized financial information for ALP is as follows:
|
December 31,
2015 |
December 31,
2014 |
||||||
|
BALANCE SHEETS:
|
|||||||
|
Cash and cash equivalents
|
$
|
13,760
|
|
$
|
15,461
|
|
|
|
Other assets
|
58
|
|
57
|
|
|||
|
Total assets
|
$
|
13,818
|
|
$
|
15,518
|
|
|
|
Accounts payable and other liabilities
|
$
|
1,978
|
|
$
|
605
|
|
|
|
Equity
(1)
|
11,840
|
|
14,913
|
|
|||
|
Total liabilities and equity
|
$
|
13,818
|
|
$
|
15,518
|
|
|
(1) In 2008, the Company wrote-off its investment in ALP as a result of ALP reserving its assets to satisfy potential claims and obligations in accordance with its publicly reported liquidation basis of accounting. Subsequently, ALP changed its method of accounting to a going concern basis and reinstated its equity and stated it would report certain expenses as they are incurred. The Company has not recorded any additional equity income as a result of the ALP’s change in accounting.
|
|
2015
|
2014
|
2013
|
||||||||
|
STATEMENTS OF OPERATIONS:
|
|||||||||||
|
Total expenses, net
|
$
|
3,073
|
|
$
|
1,952
|
|
$
|
1,014
|
|
||
|
Net loss
|
$
|
3,073
|
|
$
|
1,952
|
|
$
|
1,014
|
|
||
F 28
10. Notes Receivable, net
Notes receivable, net consists of the following:
|
December 31,
2015 |
December 31,
2014 |
||||||
|
Interest bearing homebuilder note for the RiverTown Sale, secured by the real estate sold — 5.25% interest rate, all accrued interest and remaining principal and interest payment due and paid in June 2015
|
$
|
—
|
|
$
|
19,600
|
|
|
|
Pier Park Community Development District notes, non-interest bearing, due December 2024, net of unamortized discount of $0.1 million, effective rates 5.73% — 8.0%
|
1,985
|
|
2,147
|
|
|||
|
Interest bearing homebuilder notes, secured by the real estate sold — 4.0% interest rate, any remaining payments outstanding are due August 2016
|
90
|
|
2,011
|
|
|||
|
Various mortgage notes, secured by certain real estate bearing interest at various rates
|
480
|
|
512
|
|
|||
|
Total notes receivable, net
|
$
|
2,555
|
|
$
|
24,270
|
|
|
The Company evaluates the carrying value of the notes receivable and the need for an allowance for doubtful notes receivable at each reporting date.
11. Property and Equipment, net
Property and equipment, net consists of the following:
|
December 31,
2015 |
December 31,
2014 |
Estimated Useful Life (in years)
|
|||||||
|
Railroad and equipment
|
$
|
33,626
|
|
$
|
33,627
|
|
15-30
|
||
|
Machinery and equipment
|
15,587
|
|
16,498
|
|
3-10
|
||||
|
Office equipment
|
16,662
|
|
18,844
|
|
3-10
|
||||
|
Autos and trucks
|
1,044
|
|
866
|
|
3-10
|
||||
|
66,919
|
|
69,835
|
|
||||||
|
Less: Accumulated depreciation
|
57,103
|
|
60,284
|
|
|||||
|
9,816
|
|
9,551
|
|
||||||
|
Construction in progress
|
329
|
|
652
|
|
|||||
|
Total property and equipment, net
|
$
|
10,145
|
|
$
|
10,203
|
|
|||
Depreciation expense on property and equipment was
$2.8 million
in
2015
,
$2.2 million
in
2014
and
$2.5 million
in
2013
.
12. Other Assets
Other assets consist of the following:
|
December 31,
2015 |
December 31,
2014 |
||||||
|
Retained interest investments
|
$
|
10,246
|
|
$
|
9,932
|
|
|
|
Accounts receivable, net
|
4,382
|
|
4,385
|
|
|||
|
Prepaid expenses
|
5,849
|
|
4,783
|
|
|||
|
Straight line rent
|
3,732
|
|
2,869
|
|
|||
|
Income tax receivable
|
2,275
|
|
778
|
|
|||
|
Other assets
|
8,822
|
|
6,305
|
|
|||
|
Accrued interest receivable for Senior Notes held by special purpose entity (Note 5)
|
3,338
|
|
2,938
|
|
|||
|
Total other assets
|
$
|
38,644
|
|
$
|
31,990
|
|
|
F 29
Debt consists of the following:
|
December 31,
2015 |
December 31,
2014 |
||||||
|
Refinanced Loan in the Pier Park North joint venture, due November 2025, bearing interest at 4.1% at December 31, 2015
|
$
|
48,200
|
|
$
|
—
|
|
|
|
Community Development District debt, secured by certain real estate and standby note purchase agreements, due May 2016 — May 2039, bearing interest at 2.80% to 7.0% at December 31, 2015 and 2.55% to 7.0% at December 31, 2014
|
6,994
|
|
6,516
|
|
|||
|
Construction loan in the Pier Park North joint venture, paid in October 2015, bearing interest at LIBOR plus 210 basis points, or 2.26% at December 31, 2014
|
—
|
|
31,618
|
|
|||
|
In-substance defeased debt, interest payable at 5.62%, secured and paid by pledged cash and treasury securities, due and paid October 1, 2015
|
—
|
|
25,670
|
|
|||
|
Total debt
|
$
|
55,194
|
|
$
|
63,804
|
|
|
In February 2013, the Company’s Pier Park North joint venture entered into a construction loan agreement for
$41.0 million
that was intended to mature in February 2016 with the possibility of an option for a
two
year extension. As of
December 31, 2014
,
$31.6 million
was outstanding on the construction loan. In October 2015, the Pier Park North joint venture refinanced its February 2013 construction loan and entered into a
$48.2 million
loan. As of
December 31, 2015
$48.2 million
was outstanding on the Refinanced Loan. The Refinanced Loan accrues interest at a rate of
4.1%
per annum and will mature on November 1, 2025. See
Note 9,
Real Estate Joint Ventures
for details on the Refinanced Loan.
Community Development District (“CDD”) bonds financed the construction of infrastructure improvements at several of the Company’s projects. The principal and interest payments on the bonds are paid by assessments on, or from sales proceeds of, the properties benefited by the improvements financed by the bonds. The Company has recorded a liability for CDD assessments that are associated with platted property, which is the point at which the assessments become fixed or determinable. Additionally, the Company has recorded a liability for the balance of the CDD assessment that is associated with unplatted property if it is probable and reasonably estimable that the Company will ultimately be responsible for repaying. The Company has recorded debt of
$7.0 million
and
$6.5 million
related to CDD assessments as of
December 31, 2015
and
2014
, respectively. The Company’s total outstanding CDD assessments were
$22.5 million
and
$22.7 million
at
December 31, 2015
and
2014
, respectively. The Company pays interest on the total outstanding CDD assessments.
In connection with the sale of the Company’s office building portfolio in 2007, the Company completed an in-substance defeasance of debt of approximately
$29.3 million
of mortgage debt, which had a final balloon payment that was made in October
2015
. The Company assigned the mortgage debt and deposited sufficient funds with a trustee solely to satisfy the principal and remaining interest obligations on the mortgage debt when due. The indebtedness remained on the Company’s Consolidated Balance Sheets at December 31,
2014
since the transaction was not considered to be an extinguishment of debt because the Company is liable if, for any reason, the government securities are insufficient to repay the debt. In October 2015, the trustee made the final balloon payment on the mortgage debt in the amount of
$25.3 million
, utilizing the pledged treasury securities and cash. There was no shortfall on the payment.
The aggregate maturities of debt subsequent to
December 31, 2015
are:
|
December 31,
2015 |
|||
|
2016
|
$
|
248
|
|
|
2017
|
988
|
|
|
|
2018
|
1,029
|
|
|
|
2019
|
1,071
|
|
|
|
2020
|
1,116
|
|
|
|
Thereafter
|
50,742
|
|
|
|
$
|
55,194
|
|
|
F 30
14. Accrued Liabilities and Deferred Credits
Accrued liabilities and deferred credits consist of the following:
|
December 31,
2015 |
December 31,
2014 |
||||||
|
Accrued compensation
|
$
|
3,366
|
|
$
|
2,673
|
|
|
|
Deferred revenue
|
15,222
|
|
15,309
|
|
|||
|
Membership deposits
|
7,778
|
|
8,426
|
|
|||
|
Other accrued liabilities
|
6,505
|
|
5,651
|
|
|||
|
Accrued interest expense for Senior Notes held by special purpose entity (Note 5)
|
2,850
|
|
2,852
|
|
|||
|
Total accrued liabilities and deferred credits
|
$
|
35,721
|
|
$
|
34,911
|
|
|
Deferred revenue at
December 31, 2015
and
2014
includes
$12.5 million
related to a 2006 agreement pursuant to which the Company agreed to sell approximately
3,900
acres of rural land to the Florida Department of Transportation (the “FDOT”). Revenue is recognized when title to a specific parcel is legally transferred.
As of
December 31, 2015
, other accrued liabilities include
$1.2 million
in accruals for legal fees and expenses related to the SEC investigation. See Note 21,
Commitments and Contingencies
.
15. Income Taxes
Income tax expense (benefit) for the years ended
December 31, 2015
,
2014
, and
2013
consist of the following:
|
2015
|
2014
|
2013
|
|||||||||
|
Current:
|
|||||||||||
|
Federal
|
$
|
(1,377
|
)
|
$
|
69,245
|
|
$
|
349
|
|
||
|
State
|
(138
|
)
|
135
|
|
169
|
|
|||||
|
Total
|
(1,515
|
)
|
69,380
|
|
518
|
|
|||||
|
Deferred:
|
|||||||||||
|
Federal
|
2,261
|
|
35,314
|
|
(366
|
)
|
|||||
|
State
|
62
|
|
10,813
|
|
(561
|
)
|
|||||
|
Total
|
2,323
|
|
46,127
|
|
(927
|
)
|
|||||
|
Income tax expense (benefit)
|
$
|
808
|
|
$
|
115,507
|
|
$
|
(409
|
)
|
||
|
|
|
|
|||||||||
Total income tax expense (benefit) for the years ended
December 31, 2015
,
2014
, and
2013
was allocated in the consolidated financial statements as follows:
|
2015
|
2014
|
2013
|
|||||||||
|
Income tax expense (benefit)
|
$
|
808
|
|
$
|
115,507
|
|
$
|
(409
|
)
|
||
|
Income tax recorded in Accumulated other comprehensive income
|
|||||||||||
|
Income tax benefit
|
300
|
|
127
|
|
—
|
|
|||||
|
Total income tax expense (benefit)
|
$
|
508
|
|
$
|
115,380
|
|
$
|
(409
|
)
|
||
F 31
Income tax expense (benefit) attributable to income from operations differed from the amount computed by applying the statutory federal income tax rate of
35%
to pre-tax income as a result of the following:
|
|
2015
|
2014
|
2013
|
||||||||
|
Tax at the statutory federal rate
|
$
|
(323
|
)
|
$
|
182,700
|
|
$
|
1,603
|
|
||
|
State income taxes (net of federal benefit)
|
(32
|
)
|
18,270
|
|
160
|
|
|||||
|
Decrease in valuation allowance
|
(164
|
)
|
(86,882
|
)
|
(2,218
|
)
|
|||||
|
Fees and expenses for SEC investigation
|
1,092
|
|
—
|
|
—
|
|
|||||
|
Other
|
235
|
|
1,419
|
|
46
|
|
|||||
|
Total income tax expense (benefit)
|
$
|
808
|
|
$
|
115,507
|
|
$
|
(409
|
)
|
||
|
|
|
|
|||||||||
The tax effects of temporary differences that give rise to significant portions of deferred tax assets and deferred tax liabilities as of
December 31, 2015
and
2014
are presented below:
|
|
2015
|
2014
|
|||||
|
Deferred tax assets:
|
|||||||
|
State net operating loss carryforwards
|
$
|
11,400
|
|
$
|
11,336
|
|
|
|
Impairment losses
|
112,143
|
|
116,451
|
|
|||
|
Prepaid income from land sales
|
5,490
|
|
5,507
|
|
|||
|
Other
|
1,358
|
|
1,398
|
|
|||
|
Total gross deferred tax assets
|
130,391
|
|
134,692
|
|
|||
|
Valuation allowance
|
(6,012
|
)
|
(6,176
|
)
|
|||
|
Total net deferred tax assets
|
124,379
|
|
128,516
|
|
|||
|
Deferred tax liabilities:
|
|||||||
|
Investment in real estate and property and equipment basis differences
|
3,071
|
|
2,484
|
|
|||
|
Deferred gain on land sales and involuntary conversions
|
28,691
|
|
31,574
|
|
|||
|
Installment sales
|
126,741
|
|
126,225
|
|
|||
|
Pension Plan assets transferred to the 401(k) Plan
|
2,723
|
|
3,057
|
|
|||
|
Total gross deferred tax liabilities
|
161,226
|
|
163,340
|
|
|||
|
Net deferred tax liability
|
$
|
(36,847
|
)
|
$
|
(34,824
|
)
|
|
The Company had
no
federal net operating loss carryforwards at
December 31, 2015
and 2014. At December 31,
2015
and
2014
, the Company had state net operating loss carryforwards of
$325.7 million
and
$323.9 million
, respectively. The majority of state net operating losses are available to offset future taxable income through
2031
.
In general, a valuation allowance is recorded if, based on the weight of available evidence, it is more likely than not that some portion or all of the deferred tax asset will not be realized. Realization of the Company’s deferred tax assets is dependent upon the Company generating sufficient taxable income in future years in the appropriate tax jurisdictions to obtain a benefit from the reversal of deductible temporary differences and from loss carryforwards. As of
December 31, 2015
, based on the timing of reversal of future taxable amounts and the Company’s history of losses, management did not believe it met the requirements to realize the benefits of certain of its deferred tax assets; therefore, the Company had maintained a valuation allowance of
$6.0 million
.
As of December 31,
2015
and
2014
, management believed it had not met the requirements to realize the benefits for a portion of its deferred tax assets for state net operating loss carryforwards; therefore, the Company has maintained a valuation allowance of
$6.0 million
and
$6.2 million
, respectively, related to state net operating losses. During
2015
, the Company decreased the valuation allowance by
$0.2 million
to
$6.0 million
.
At December 31, 2013, other deferred tax assets includes a valuation allowance to offset the deferred tax component recognized in Accumulated other comprehensive loss of
$2.1 million
. This valuation allowance was reversed during 2014 and there was
no
valuation allowance in Accumulated other comprehensive loss as of December 31, 2014.
F 32
The Company had approximately
$1.7 million
of total unrecognized tax benefits as of
December 31, 2015
and
2014
, respectively. Of this total, there are no amounts of unrecognized tax benefits that, if recognized, would affect the effective income tax rate. There were no decreases or increases related to prior year or current year tax positions. In addition, as a result of the adoption of the guidance that was effective for the Company on January 1, 2014 related to the presentation of an unrecognized tax benefit, when a net operating loss carryforward, a similar tax loss, or a tax credit carryforward exists, the Company reclassified
$1.7 million
of its unrecognized tax benefit from Accrued liabilities and deferred credits to Deferred tax liabilities as of December 31, 2015 and 2014.
There were no penalties required to be accrued at
December 31, 2015
and
2014
. The Company recognizes interest and/or penalties related to income tax matters in Income tax (expense) benefit.
The Company is currently open to examination by taxing authorities for the years ended December 31, 2012 through 2014. The IRS has completed the examination of the Company’s tax return for 2013 without adjustment.
16. Stock Repurchase Program
As of January 1, 2015, the Company had
$103.8 million
remaining under its Stock Repurchase Program. From January 1 through August 15, 2015, the Company repurchased
634,596
shares of its common stock in open market transactions at an average weighted price of
$16.03
, for a total of
$10.2 million
. On August 15, 2015 the Company’s Board of Directors increased the Stock Repurchase Program authorization to permit the repurchase of up to
$300.0 million
(including
$93.6 million
that remained unused from the previous authorization).
On August 21, 2015, the Company commenced a tender offer to purchase up to
16,666,666
shares of its common stock at a price of
$18.00
per share. Upon consummation of this tender offer, the Company purchased
16,348,143
of its common stock at a purchase price of
$18.00
per share, for a total purchase price of
$294.3 million
and
$0.5 million
in related costs. In October 2015, the Company’s Board of Directors again increased the Stock Repurchase Program authorization to permit the repurchase of an additional
$200.0 million
. As of December 31, 2015, the Company had a total of
$205.7 million
available for purchase of shares under its Stock Repurchase Program. The Company may repurchase stock in open market purchases from time to time pursuant to Rule 10b-18, in privately negotiated transactions or otherwise. The timing and amount of any additional shares to be repurchased will depend upon a variety of factors, including market and business conditions, applicable legal requirements and other factors. Repurchases may be commenced or suspended at any time or from time to time without prior notice. The Stock Repurchase Program will continue until otherwise modified or terminated by the Company’s Board of Directors at any time in its sole discretion. Subsequent to December 31, 2015 but prior to the filing of this annual report, the Company purchased an additional
995,650
shares for an aggregate purchase price of
$14.8
million.
17. Stock Based Compensation
The Company previously offered a stock incentive plan whereby awards were granted to certain employees and non-employee directors of the Company in various forms including restricted shares of Company common stock and options to purchase Company common stock. Awards were discretionary and were determined by the Compensation Committee of the Board of Directors. Stock based compensation cost is measured at the grant date based on the fair value of the award and is typically recognized as expense on a straight-line basis over the requisite service period, which is the vesting period. Upon exercise of stock options or vesting of restricted stock, the Company will use treasury stock or issue new common stock.
During 2015, the Company had
two
equity plans available for issuance of equity compensation instruments, including restricted shares of Company common stock and options to purchase Company common stock, the 2009 Equity Incentive Plan (the “2009 Plan”) and the 2015 Performance and Equity Incentive Plan (the “2015 Plan”). Upon adoption of the 2015 Plan, the remaining shares available for awards under the 2009 Plan were included in the
1.5 million
shares approved under the 2015 Plan. As of December 31, 2015,
1.5 million
shares were available under the 2015 Plan. Stock options previously granted under the 2009 Plan are still outstanding and to the extent that such options are exercised prior to their expiration, shares will be issued under the 2009 Plan.
Total stock-based compensation recorded in Corporate expense, net, on the Consolidated Statements of Operations for the three years ended
December 31, 2015
is as follows:
|
|
2015
|
2014
|
2013
|
||||||||
|
Stock compensation expense before tax benefit
|
$
|
150
|
|
$
|
210
|
|
$
|
247
|
|
||
|
Income tax benefit
|
(58
|
)
|
(81
|
)
|
(95
|
)
|
|||||
|
$
|
92
|
|
$
|
129
|
|
$
|
152
|
|
|||
F 33
The following table sets forth the summary of option activity outstanding under the stock option program for
2015
:
|
|
Number of Shares
|
Weighted Average
Exercise Price
|
Weighted Average
Remaining
Contractual Life
(Years)
|
Aggregate
Intrinsic Value
($000)
|
||||||||
|
Balance at December 31, 2014
|
99,775
|
|
$
|
54.15
|
|
1.9
|
|
—
|
|
|||
|
Forfeited or expired
|
—
|
|
—
|
|
—
|
|
—
|
|
||||
|
Balance at December 31, 2015
|
99,775
|
|
$
|
54.15
|
|
0.9
|
|
—
|
|
|||
|
Vested or expected to vest at December 31, 2015
|
99,775
|
|
$
|
54.15
|
|
0.9
|
|
—
|
|
|||
|
Exercisable at December 31, 2015
|
99,775
|
|
$
|
54.15
|
|
0.9
|
|
—
|
|
|||
As of
December 31, 2015
the Company did not have any unvested restricted stock units outstanding and did not issue any restricted stock units under either the 2009 Plan or 2015 Plan
.
The weighted average grant date fair value of restricted stock units during
2015
,
2014
and
2013
were
$15.53
,
$21.59
and
$20.49
, respectively. The total fair values of restricted stock units and stock options which vested were
zero
during
2015
and
2014
and
$0.5 million
during
2013
. In
2015
, the Company granted less than
0.1 million
of vested restricted stock awards granted to certain of the Company’s directors as fees for services rendered under the 2009 Plan.
18. Employee Benefit Plans
The Company previously sponsored a cash balance defined benefit pension plan that covered substantially all of its salaried employees (the “Pension Plan”). In November 2012, the Board of Directors approved the termination of the Pension Plan. The Pension Plan was frozen in March 2013 pending regulatory approvals, which were received in August 2014. As of December 31, 2014, the Pension Plan assets were distributed to Pension Plan participants and
$7.9 million
was distributed to the Company’s 401(k) Plan to pay additional future benefits to current and future 401(k) plan participants over a period of up to
seven
years. Subsequent to these distributions, the remaining Pension Plan assets of
$23.8 million
were reverted to the Company in December 2014. As a result of the Pension Plan termination, the Company had
no
prepaid pension asset or accumulated benefit obligation at December 31, 2015 and 2014.
There were
no
pension charges in 2015. During 2014, the Company recorded a total of
$13.5 million
in Pension charges on the Company’s Consolidated Statements of Operations, which included
$8.7 million
for net periodic pension costs, including settlements related to the termination of the Pension Plan and
$4.8 million
of excise tax.
During 2013, the Company incurred settlement losses of
$0.7 million
related to cash distributions made to certain participants.
F 34
Obligations and Funded Status
Change in projected benefit obligation and plan assets:
|
|
2014
|
||
|
Projected benefit obligation, beginning of year
|
$
|
23,531
|
|
|
Interest cost
|
625
|
|
|
|
Actuarial loss
|
2,245
|
|
|
|
Benefits paid
|
(95
|
)
|
|
|
Settlements
|
(26,306
|
)
|
|
|
Projected benefit obligation, end of year
|
$
|
—
|
|
|
Fair value of assets, beginning of year
|
$
|
58,648
|
|
|
Actual return on assets
|
14
|
|
|
|
Benefits and expenses paid
|
(595
|
)
|
|
|
Settlements
|
(26,306
|
)
|
|
|
Assets contributed to 401(k) Plan
|
(7,940
|
)
|
|
|
Assets reverted to the Company
|
(23,821
|
)
|
|
|
Fair value of assets, end of year
|
$
|
—
|
|
|
|
|
||
|
Funded status at end of year
|
$
|
—
|
|
|
|
|
||
|
Ratio of plan assets to projected benefit obligation
|
—
|
%
|
|
F 35
A summary of the net periodic pension cost and other amounts recognized in other comprehensive income (loss) are as follows:
|
2014
|
2013
|
||||||
|
Service cost
|
$
|
—
|
|
$
|
225
|
|
|
|
Interest cost
|
625
|
|
653
|
|
|||
|
Expected return on assets
|
550
|
|
(443
|
)
|
|||
|
Amortization of loss
|
465
|
|
326
|
|
|||
|
Settlement charges
|
7,107
|
|
739
|
|
|||
|
Net periodic pension cost
|
$
|
8,747
|
|
$
|
1,500
|
|
|
|
Other changes in plan assets and obligations recognized in Other comprehensive income:
|
|||||||
|
Gain
|
(5,392
|
)
|
|
(3,260
|
)
|
||
|
Total other comprehensive income
|
(5,392
|
)
|
(3,260
|
)
|
|||
|
Total net periodic pension cost and other comprehensive income (loss)
|
$
|
3,355
|
|
|
$
|
(1,760
|
)
|
As of December 31, 2015 and 2014 there were
no
actuarial loss amounts not yet reflected in net periodic pension cost and included in Accumulated other comprehensive loss as they were recognized in net periodic cost during 2014 due to the final settlement of the Pension Plan in 2014. As of December 31, 2013, actuarial loss amounts not yet reflected in net periodic pension cost and included in accumulated other comprehensive loss were
$5.4 million
. In 2014, pension charges on the Consolidated Statements of Operations include
$4.8 million
of excise tax.
Assumptions
Assumptions used to develop net periodic pension cost:
|
2014
|
2013
|
||
|
Discount rate
|
3.75%
|
4.37%
|
|
|
Expected long-term rate on plan assets
|
—%
|
—%
|
|
|
Rate of compensation increase
|
N/A
|
N/A
|
|
F 36
The Pension Plan was terminated in 2014. Prior to that, to develop the expected long-term rate of return on assets assumption, the Company considered the current level of expected returns on risk free investments (primarily government bonds), the historical level of the risk premium associated with the other asset classes in which the portfolio is invested and the expectations for future returns of each asset class. The expected return for each asset class was then weighted based on the target asset allocation to develop the expected long-term rate of return on assets assumption for the portfolio. This resulted in the selection of the
0.00%
assumption in
2013
. Early in 2014, the Pension Plan transferred the majority of its investments held in plan assets to U.S. Treasury securities to maintain the Pension Plan asset balance, which resulted in the selection of a minimal expected long-term rate on plan assets as the U.S. Treasury securities in 2014 and 2013.
Plan Assets
During 2014, the Pension Plan transferred the majority of its investments held in plan assets to U.S. Treasury securities to maintain the Pension Plan asset balance. There were no Plan assets at December 31, 2014. At December 31, 2013, U.S. Treasury securities are fair valued based on quoted market prices in an active market. The following tables sets forth by level within the fair value hierarchy for Plan assets at December 31, 2013.
Assets at Fair Value as of December 31, 2013
|
Asset Category:
|
Level 1
|
Level 2
|
Level 3
|
Total
|
|||||||||||
|
Cash
|
$
|
115
|
|
$
|
—
|
|
$
|
—
|
|
|
$
|
115
|
|
||
|
Money market funds
|
697
|
|
—
|
|
—
|
|
|
697
|
|
||||||
|
U.S. Treasuries
|
57,836
|
|
—
|
|
—
|
|
|
57,836
|
|
||||||
|
Total
|
$
|
58,648
|
|
|
$
|
—
|
|
|
$
|
—
|
|
|
$
|
58,648
|
|
The following table sets forth a summary of changes in the fair value of the Pension Plan’s level 3 assets for the year ended December 31, 2013. There were
no
level 3 assets in the Pension Plan during 2014.
|
2013
|
|||
|
Balance, beginning of year
|
$
|
927
|
|
|
Sales
|
(1,648
|
)
|
|
|
Realized gain on sale
|
721
|
|
|
|
Unrealized gains relating to instruments still held at the reporting date
|
—
|
|
|
|
Balance, end of year
|
$
|
—
|
|
Deferred Compensation Plan
The Company maintains a 401(k) retirement plan covering substantially all officers and employees, which permits participants to defer up to the maximum allowable amount determined by the IRS of their eligible compensation.
As part of the 2014 Pension Plan termination, the Company directed the Pension Plan to transfer
$7.9 million
of the Pension Plan’s surplus assets into a suspense account in the Company’s 401(k) Plan. The Company expects to use the
$7.9 million
, including any income earned on the assets held in the suspense account, for Company contributions under the Company’s 401(k) Plan within the next
six
years. At December 31, 2015 and December 31, 2014, the fair values of these assets were recorded in Restricted investments on the Company’s Consolidated Balance Sheets and were
$7.1 million
and
$7.9 million
, respectively.
F 37
The Company retains the risks and rewards of ownership of the assets held in the suspense account since they have not been allocated to participants as of
December 31, 2015
; therefore, the
$7.1 million
of unallocated assets held in the suspense account are recorded on the Company’s Consolidated Balance Sheet as Restricted investments. The Company will record expense for the fair value of the assets at the time the assets are allocated to participants.
During 2015, the Company recorded an expense of
$1.0 million
for the fair value of the assets that were allocated to participants. Any gains and losses on unallocated assets are reflected in the Company’s Consolidated Statements of Operations and were a
$0.1 million
gain for 2015. In addition, the Company expects to record additional expenses of approximately
$7.1 million
as the assets in our 401(k) Plan are allocated to participants over the next
six
years. Refer to Note 8,
Financial Instruments and Fair Value Measurements.
As of
December 31, 2015
, the assets held in the suspense account were invested in the Guaranteed Income Fund. The Guaranteed Income Fund is valued based upon the contributions made to the fund, plus earnings at guaranteed crediting rates, less withdrawals and fees, and is categorized as a level 2 financial instrument. The Company’s Retirement Plan Investment Committee is responsible for investing decisions and allocation decisions of the suspense account. Refer to Note 8,
Financial Instruments and Fair Value Measurements
for further information on the three-tier fair value hierarchy.
19. Accumulated Other Comprehensive Loss
Following is a summary of the changes in the accumulated balances for each component of accumulated other comprehensive loss, which is presented net of tax, for the year ended
December 31, 2015
and
2014
:
|
Defined Benefit Pension Items
|
Unrealized Gains and (Losses) on Available-for-Sale Securities
|
Total
|
|||||||||
|
Accumulated other comprehensive loss at December 31, 2014
|
$
|
—
|
|
$
|
(1,325
|
)
|
$
|
(1,325
|
)
|
||
|
Other comprehensive income before reclassifications
|
—
|
|
3,428
|
|
3,428
|
|
|||||
|
Amounts reclassified from accumulated other comprehensive loss
|
—
|
|
(2,789
|
)
|
(2,789
|
)
|
|||||
|
Net current year other comprehensive income
|
—
|
|
639
|
|
639
|
|
|||||
|
Accumulated other comprehensive loss at December 31, 2015
|
$
|
—
|
|
$
|
(686
|
)
|
$
|
(686
|
)
|
||
|
Defined Benefit Pension Items
|
Unrealized Gains and (Losses) on Available-for-Sale Securities
|
Total
|
|||||||||
|
Accumulated other comprehensive loss at December 31, 2013
|
$
|
(5,392
|
)
|
$
|
(2,125
|
)
|
$
|
(7,517
|
)
|
||
|
Other comprehensive loss before reclassifications
|
(2,180
|
)
|
(509
|
)
|
(2,689
|
)
|
|||||
|
Amounts reclassified from accumulated other comprehensive loss
|
7,572
|
|
1,309
|
|
8,881
|
|
|||||
|
Net current year other comprehensive income
|
5,392
|
|
800
|
|
6,192
|
|
|||||
|
Accumulated other comprehensive loss at December 31, 2014
|
$
|
—
|
|
$
|
(1,325
|
)
|
$
|
(1,325
|
)
|
||
The following is a summary of the tax effects allocated to each component of other comprehensive income for the year ended
December 31, 2015
:
|
Year Ended December 31, 2015
|
||||||||||||
|
Before-Tax Amount
|
Tax Benefit or (Expense)
|
Net-of-Tax Amount
|
||||||||||
|
Unrealized gains on debt securities:
|
||||||||||||
|
Unrealized gains on available-for-sale investments
|
$
|
5,650
|
|
$
|
(2,222
|
)
|
$
|
3,428
|
|
|||
|
Less: reclassification adjustment for gains included in earnings
|
(5,311
|
)
|
2,522
|
|
(2,789
|
)
|
||||||
|
Net unrealized gains
|
339
|
|
300
|
|
639
|
|
||||||
|
Other comprehensive income
|
$
|
339
|
|
$
|
300
|
|
$
|
639
|
|
|||
F 38
The following is a summary of the tax effects allocated to each component of other comprehensive income for the year ended December 31, 2014:
|
Year Ended December 31, 2014
|
||||||||||||
|
Before-Tax Amount
|
Tax Benefit or (Expense)
|
Net-of-Tax Amount
|
||||||||||
|
Unrealized gains on debt securities:
|
||||||||||||
|
Unrealized losses on available-for-sale investments
|
$
|
(1,455
|
)
|
$
|
947
|
|
$
|
(508
|
)
|
|||
|
Less: reclassification adjustment for other-than-temporary impairment losses included in earnings
|
1,295
|
|
(499
|
)
|
796
|
|
||||||
|
Less: reclassification adjustment for losses included in earnings
|
833
|
|
(321
|
)
|
512
|
|
||||||
|
Net unrealized gains
|
673
|
|
127
|
|
800
|
|
||||||
|
Defined benefit pension plan:
|
||||||||||||
|
Settlement included in net periodic cost
|
7,107
|
|
—
|
|
7,107
|
|
||||||
|
Less: amortization of loss included in net periodic pension cost
|
465
|
|
—
|
|
465
|
|
||||||
|
Net periodic pension cost arising during period
|
7,572
|
|
—
|
|
7,572
|
|
||||||
|
Net loss arising during period
|
(2,180
|
)
|
—
|
|
(2,180
|
)
|
||||||
|
Defined benefit pension plan, net
|
5,392
|
|
—
|
|
5,392
|
|
||||||
|
Other comprehensive income
|
$
|
6,065
|
|
$
|
127
|
|
$
|
6,192
|
|
|||
20. Segment Information
The Company currently conducts primarily all of its business in the following
five
operating segments: 1) residential real estate, 2) commercial real estate, 3) resorts and leisure, 4) leasing operations and 5) forestry. In prior periods, the Company’s reportable operating segments were 1) residential real estate, 2) commercial real estate, 3) resorts, leisure and leasing operations and 4) forestry. The Company’s leasing operations segment currently meets the quantitative and qualitative factors as a reportable operating segment; therefore, the Company has changed its segment presentation to include leasing operations as an operating segment. Leasing operations were historically included with the Company’s resorts, leisure and leasing operating segment. All prior year segment information has been reclassified to conform to the 2015 presentation. The change in reporting segments had no effect on the Consolidated Balance Sheets, Statements of Operations, Statements of Comprehensive (Loss) Income or Statements of Cash Flows for the periods presented.
The residential real estate segment generates revenues from the development and sale of homes and homesites and the sale of parcels of entitled, undeveloped lots. The commercial real estate segment sells undeveloped or developed land and commercial operating property. The resorts and leisure segment generates revenues and costs from the WaterColor Inn and Resort, vacation rental programs, management of The Pearl Hotel,
four
golf courses, marina operations and other related resort activities. The leasing segment generates revenues from retail and commercial leasing operations, including the Company’s consolidated joint venture at Pier Park North. The forestry segment produces and sells woodfiber, sawtimber and other forest products and may sell the Company’s timber or rural land holdings.
The Company’s reportable segments are strategic business units that offer different products and services. They are each managed separately and decisions about allocations of resources are determined by management based on these strategic business units.
The Company uses income from operations before equity in (loss) income from unconsolidated affiliates, income taxes and non-controlling interest for purposes of making decisions about allocating resources to each segment and assessing each segment’s performance, which the Company believes represents current performance measures.
F 39
The accounting policies of the segments are the same as those described herein and in the Company’s Form 10-K. Total revenues represent sales to unaffiliated customers, as reported in the Company’s Consolidated Statements of Operations. All intercompany transactions have been eliminated.
Information by business segment is as follows:
|
|
2015
|
|
2014
|
|
2013
|
||||||
|
OPERATING REVENUES:
|
|||||||||||
|
Residential real estate
(a)
|
$
|
21,203
|
|
$
|
61,444
|
|
$
|
33,735
|
|
||
|
Commercial real estate
|
7,160
|
|
3,265
|
|
10,881
|
|
|||||
|
Resorts and leisure
|
54,488
|
|
48,414
|
|
46,424
|
|
|||||
|
Leasing operations
|
8,978
|
|
6,977
|
|
4,306
|
|
|||||
|
Forestry
(b)
|
12,042
|
|
581,442
|
|
35,450
|
|
|||||
|
Other
|
—
|
|
331
|
|
460
|
|
|||||
|
Consolidated operating revenues
|
$
|
103,871
|
|
$
|
701,873
|
|
$
|
131,256
|
|
||
|
DEPRECIATION, DEPLETION AND AMORTIZATION:
|
|||||||||||
|
Residential real estate
|
$
|
544
|
|
$
|
662
|
|
$
|
863
|
|
||
|
Resorts and leisure
|
5,096
|
|
4,143
|
|
4,211
|
|
|||||
|
Leasing operations
|
3,118
|
|
2,685
|
|
2,126
|
|
|||||
|
Forestry
|
581
|
|
729
|
|
1,775
|
|
|||||
|
Other reportable segments
|
147
|
|
203
|
|
156
|
|
|||||
|
Consolidated depreciation, depletion and amortization
|
$
|
9,486
|
|
$
|
8,422
|
|
$
|
9,131
|
|
||
|
INVESTMENT INCOME, NET
|
|||||||||||
|
Residential real estate and other
|
$
|
571
|
|
$
|
994
|
|
$
|
113
|
|
||
|
Corporate
(c)
|
22,117
|
|
11,697
|
|
1,385
|
|
|||||
|
Consolidated investment income, net
|
$
|
22,688
|
|
$
|
12,691
|
|
$
|
1,498
|
|
||
|
INTEREST EXPENSE
|
|||||||||||
|
Residential real estate
|
$
|
(1,174
|
)
|
$
|
(1,316
|
)
|
$
|
(1,999
|
)
|
||
|
Commercial and other
|
(1,489
|
)
|
(696
|
)
|
(41
|
)
|
|||||
|
Corporate
(d)
|
(8,766
|
)
|
(6,596
|
)
|
—
|
|
|||||
|
Consolidated interest expense
|
$
|
(11,429
|
)
|
$
|
(8,608
|
)
|
$
|
(2,040
|
)
|
||
|
(LOSS) INCOME BEFORE EQUITY IN LOSS FROM UNCONSOLDIATED AFFILIATES AND INCOME TAXES:
|
|||||||||||
|
Residential real estate
(a)(e)
|
$
|
(821
|
)
|
$
|
24,854
|
|
$
|
4,087
|
|
||
|
Commercial real estate
|
126
|
|
(163
|
)
|
3,298
|
|
|||||
|
Resorts and leisure
(f)
|
1,819
|
|
1,559
|
|
(1,561
|
)
|
|||||
|
Leasing operations
|
676
|
|
1,165
|
|
324
|
|
|||||
|
Forestry
(b)
|
10,259
|
|
517,087
|
|
13,406
|
|
|||||
|
Corporate
(c)(d)(g)
|
(13,222
|
)
|
(22,681
|
)
|
(15,109
|
)
|
|||||
|
Consolidated (loss) income before equity in loss from unconsolidated affiliates and income taxes
|
$
|
(1,163
|
)
|
$
|
521,821
|
|
$
|
4,445
|
|
||
F 40
|
|
2015
|
2014
|
2013
|
||||||||
|
CAPITAL EXPENDITURES:
|
|||||||||||
|
Residential real estate
|
$
|
4,923
|
|
$
|
4,981
|
|
$
|
12,284
|
|
||
|
Commercial real estate
|
2,165
|
|
854
|
|
2,388
|
|
|||||
|
Resorts and leisure
|
2,526
|
|
2,198
|
|
3,517
|
|
|||||
|
Leasing operations
|
5,849
|
|
22,600
|
|
19,969
|
|
|||||
|
Forestry
|
1,366
|
|
1,537
|
|
3,678
|
|
|||||
|
Other
|
636
|
|
271
|
|
224
|
|
|||||
|
Total capital expenditures
|
$
|
17,465
|
|
$
|
32,441
|
|
$
|
42,060
|
|
||
|
|
|
|
|||||||||
|
|
December 31,
2015 |
December 31, 2014
|
|||||
|
TOTAL ASSETS:
|
|||||||
|
Residential real estate
|
$
|
109,791
|
|
$
|
135,317
|
|
|
|
Commercial real estate
|
62,649
|
|
62,931
|
|
|||
|
Resorts and leisure
|
75,441
|
|
79,021
|
|
|||
|
Leasing operations
|
82,120
|
|
74,800
|
|
|||
|
Forestry
|
20,244
|
|
20,521
|
|
|||
|
Other
|
634,568
|
|
930,545
|
|
|||
|
Total assets
|
$
|
984,813
|
|
$
|
1,303,135
|
|
|
|
(a)
|
Includes revenues of $43.6 million from the RiverTown Sale in 2014.
|
|
(b)
|
Includes revenues of $570.9 million from the AgReserves Sale in 2014.
|
|
(c)
|
Includes interest income of $8.2 million and $6.1 million from investments in special purpose entities in 2015 and 2014, respectively.
|
|
(d)
|
Includes interest expense of $8.8 million and $6.6 million from Senior Note issued by a special purpose entity in 2015 and 2014, respectively.
|
|
(e)
|
Includes impairment losses of $0.2 million in 2013.
|
|
(f)
|
Includes impairment losses of $4.9 million in 2013.
|
|
(g)
|
Includes pension charges of $13.5 million and $1.5 million in 2014 and 2013, respectively.
|
21. Commitments and Contingencies
The Company establishes an accrued liability when it is both probable that a loss has been incurred and the amount of the loss can be reasonably estimated. The Company will evaluate the range of reasonably estimated losses and record an accrued liability based on the minimum amount in the range, unless an amount within the range is a better estimate than any other amount. In such cases, there may be an exposure to loss in excess of the amounts accrued. The Company evaluates quarterly whether further developments could affect the amount of the accrued liability previously established or would make a loss contingency both probable and reasonably estimable.
The Company also provides disclosure when it is reasonably possible that a loss will be incurred or when it is reasonably possible that the amount of a loss will exceed the recorded liability. The Company reviews loss contingencies at least quarterly to determine whether the likelihood of loss has changed and to assess whether a reasonable estimate of the loss or range of loss can be made. This estimated range of possible loss is based upon currently available information and is subject to significant judgment and a variety of assumptions, and known and unknown uncertainties. The matters underlying the estimated range will change from time to time, and actual results may vary significantly from the current estimate.
F 41
The Company is subject to a variety of litigation, claims, other disputes and governmental proceedings that arise from time to time in the ordinary course of its business. The Company cannot assure that it will be successful in defending these matters. Based on current knowledge, the Company does not believe that loss contingencies arising from pending litigation, claims other disputes and governmental proceedings, including those described herein, will have a material adverse effect on the consolidated financial condition or liquidity of the Company. However, in light of the inherent uncertainties involved in these matters, an adverse outcome in one or more of these matters could be material to the Company’s results of operations or cash flows for any particular reporting period.
On January 4, 2011 the Company received notice from the Staff (the “Staff”) of the SEC of the initiation of an inquiry into the Company’s policies and practices concerning impairment of investment in real estate assets. In January 2015, the Company received a Wells Notice from the Staff related to historical accounting and disclosure practices and real estate asset valuations principally as reflected in the Company’s financial results for 2010, 2009 and prior periods. In June 2015, the Company established a reserve of
$3.5 million
for penalties, disgorgements and interest relating to the SEC investigation. On October 27, 2015, the Company fully resolved the SEC investigation and entered into a settlement with the SEC. Without admitting or denying any factual allegations, the Company consented to the SEC’s issuance of an administrative order pursuant to which the Company agreed to pay penalties, disgorgements and interest of approximately
$3.5 million
, including a civil penalty assessed on the Company of
$2.75 million
and other disgorgements and interest subject to indemnification by the Company.
The Company is subject to costs arising out of environmental laws and regulations, which include obligations to remove or limit the effects on the environment of the disposal or release of certain wastes or substances at various sites, including sites which have been previously sold. It is the Company’s policy to accrue and charge against earnings environmental cleanup costs when it is probable that a liability has been incurred or range of loss can be reasonably estimated. As assessments and cleanups proceed, these accruals are reviewed and adjusted, if necessary, as additional information becomes available.
The Company’s former paper mill site in Gulf County and certain adjacent properties are subject to various Consent Agreements and Brownfield Site Rehabilitation Agreements with the Florida Department of Environmental Protection. The paper mill site has been rehabilitated by Smurfit-Stone Container Corporation in accordance with these agreements and a final Site Rehabilitation Completion Order (SRCO) issued by the Florida Department of Environmental Protection (FDEP) has been received. The Company is in the process of assessing certain neighboring properties. Management is unable to quantify future rehabilitation costs above present accruals at this time or provide a reasonably estimated range of loss.
Other litigation, claims, other disputes and governmental proceedings, including environmental matters, are pending against the Company. Accrued aggregate liabilities related to the matters described above and other litigation matters were
$2.5 million
, including the
$1.2 million
accrual related to the SEC investigation discussed above, and
$1.4 million
at
December 31, 2015
and
2014
, respectively. Although the final resolution of the environmental litigation matters or governmental proceedings is not expected to have a material effect on the Company’s consolidated financial condition, it is possible that any final outcome could have a material impact on the results of operations or cash flows of the Company.
The Company has retained certain self-insurance risks with respect to losses for third party liability and property damage, including our timber assets.
F 42
At
December 31, 2015
and
2014
, the Company was required to provide surety bonds that guarantee completion of certain infrastructure in certain development projects and mitigation banks of
$7.1 million
and
$8.3 million
, respectively and standby letters of credit in the amount of
$0.5 million
, which may potentially result in liability to the Company if certain obligations of the Company are not met.
At
December 31, 2015
, the Company has a total of
$1.4 million
in purchase obligations, of which
$0.7 million
are for 2016,
$0.2 million
are for 2017 and
$0.5 million
are for 2018.
In connection with the Refinanced Loan, the Company guaranteed the joint venture’s obligations under a short term
$6.62 million
letter of credit which is securing a portion of the joint venture’s obligations under the Refinanced Loan. See
Note 9,
Real Estate Joint Ventures
for a further discussion or the Refinanced Loan.
As part of the AgReserves Sale and certain sales of timberlands in 2007 and 2008, the Company generated significant tax gains. The installment notes structure allowed the Company to defer the resulting tax liability of
$61.8 million
until 2022 - 2024 and
$69.3 million
until 2029, respectively, the maturity dates for the installment notes. The Company has a deferred tax liability related to the gains in connection with these sales.
22. Quarterly Financial Data (unaudited)
|
|
Quarters Ended
|
||||||||||||||
|
|
December 31
|
September 30
|
June 30
|
March 31
|
|||||||||||
|
2015
|
|||||||||||||||
|
Operating revenues
|
$
|
21,104
|
|
$
|
27,830
|
|
$
|
37,846
|
|
$
|
17,091
|
|
|||
|
Operating (loss) income
|
$
|
(3,861
|
)
|
$
|
(2,383
|
)
|
$
|
5,811
|
|
$
|
(5,702
|
)
|
|||
|
Net (loss) income attributable to the Company
|
$
|
(2,541
|
)
|
$
|
2,772
|
|
$
|
(224
|
)
|
$
|
(1,738
|
)
|
|||
|
Basic and diluted (loss) income per share attributable to the Company
|
$
|
(0.03
|
)
|
$
|
0.03
|
|
$
|
—
|
|
$
|
(0.02
|
)
|
|||
|
2014
|
|||||||||||||||
|
Operating revenues
|
$
|
15,676
|
|
$
|
23,947
|
|
$
|
68,164
|
|
$
|
594,086
|
|
|||
|
Operating (loss) income
|
$
|
(15,946
|
)
|
$
|
(1,335
|
)
|
$
|
21,038
|
|
$
|
509,493
|
|
|||
|
Net (loss) income attributable to the Company
|
$
|
(11,101
|
)
|
$
|
(50
|
)
|
$
|
14,609
|
|
$
|
402,995
|
|
|||
|
Basic and diluted (loss) income per share attributable to the Company
|
$
|
(0.12
|
)
|
$
|
—
|
|
$
|
0.16
|
|
$
|
4.36
|
|
|||
F 43
THE ST. JOE COMPANY
SCHEDULE III (CONSOLIDATED) - REAL ESTATE AND ACCUMULATED DEPRECIATION
DECEMBER 31,
2015
(in thousands)
|
Initial Cost to Company
|
Gross Amount at December 31, 2015
|
|||||||||||||||||||||||||||||||||||
|
Description
|
Encumbrances
|
Land & Improvements
|
Buildings &
Improvements
|
Costs
Capitalized
Subsequent to
Acquisition or Construction
(1)
|
Land & Land
Improvements
|
Buildings and
Improvements
|
Total
|
Accumulated
Depreciation
|
Date of Construction or Acquisition
|
Depreciation Life (In Years)
|
||||||||||||||||||||||||||
|
Residential development
|
$
|
3,016
|
|
$
|
43,153
|
|
$
|
—
|
|
$
|
56,260
|
|
$
|
99,413
|
|
$
|
—
|
|
$
|
99,413
|
|
$
|
—
|
|
n/a
|
n/a
|
||||||||||
|
Commercial development
|
3,944
|
|
47,745
|
|
—
|
|
9,202
|
|
56,947
|
|
—
|
|
56,947
|
|
42
|
|
n/a
|
n/a
|
||||||||||||||||||
|
Resorts and leisure
|
||||||||||||||||||||||||||||||||||||
|
WaterColor Inn
|
—
|
|
1,202
|
|
14,000
|
|
5,497
|
|
1,558
|
|
19,140
|
|
20,698
|
|
7,558
|
|
2002
|
10 - 40
|
||||||||||||||||||
|
Clubs and golf courses
|
—
|
|
38,447
|
|
24,053
|
|
(4,058
|
)
|
34,863
|
|
23,579
|
|
58,442
|
|
24,868
|
|
2001 - 2007
|
10 - 25
|
||||||||||||||||||
|
Marinas
|
—
|
|
6,252
|
|
9,619
|
|
261
|
|
6,469
|
|
9,663
|
|
16,132
|
|
3,993
|
|
2006 - 2007
|
10 - 25
|
||||||||||||||||||
|
Other
|
—
|
|
—
|
|
32,925
|
|
(18,772
|
)
|
—
|
|
14,154
|
|
14,154
|
|
6,246
|
|
2008 - 2009
|
10 - 30
|
||||||||||||||||||
|
Commercial leasing
|
|
|
||||||||||||||||||||||||||||||||||
|
Pier Park North
|
48,200
|
|
2,641
|
|
—
|
|
45,807
|
|
13,632
|
|
34,816
|
|
48,448
|
|
2,581
|
|
2014 - 2015
|
15 - 40
|
||||||||||||||||||
|
Towncenters
|
—
|
|
777
|
|
30,904
|
|
(12,166
|
)
|
784
|
|
18,731
|
|
19,515
|
|
12,752
|
|
2001 - 2008
|
10 - 25
|
||||||||||||||||||
|
VentureCrossings
|
—
|
|
1,566
|
|
7,899
|
|
—
|
|
1,566
|
|
7,899
|
|
9,465
|
|
—
|
|
2012
|
10 - 25
|
||||||||||||||||||
|
Other
|
34
|
|
7,999
|
|
8,862
|
|
(7,176
|
)
|
7,129
|
|
2,596
|
|
9,725
|
|
3,983
|
|
through 2011
|
10 - 25
|
||||||||||||||||||
|
Timberlands
|
—
|
|
6,494
|
|
1,872
|
|
10,976
|
|
7,201
|
|
12,142
|
|
19,343
|
|
2,046
|
|
n/a
|
n/a
|
||||||||||||||||||
|
Unimproved land
|
—
|
|
—
|
|
—
|
|
5,386
|
|
5,386
|
|
—
|
|
5,386
|
|
—
|
|
n/a
|
n/a
|
||||||||||||||||||
|
Total
|
$
|
55,194
|
|
$
|
156,276
|
|
$
|
130,134
|
|
$
|
91,217
|
|
$
|
234,948
|
|
$
|
142,720
|
|
$
|
377,668
|
|
$
|
64,069
|
|
||||||||||||
|
(1)
|
Includes cumulative impairments.
|
Notes:
|
(A)
|
The aggregate cost of real estate owned at December 31, 2015 for federal income tax purposes is approximately $535 million.
|
|
(B)
|
Reconciliation of real estate owned (in thousands of dollars):
|
|
|
2015
|
2014
|
2013
|
||||||||
|
Balance at beginning of the year
|
$
|
379,944
|
|
$
|
436,264
|
|
|
$
|
418,197
|
|
|
|
Amounts capitalized
|
13,372
|
|
26,047
|
|
|
44,795
|
|
||||
|
Impairments
|
—
|
|
—
|
|
(5,080
|
)
|
|||||
|
Cost of real estate sold
|
(14,584
|
)
|
(76,060
|
)
|
(22,022
|
)
|
|||||
|
Amounts retired or adjusted
|
(1,064
|
)
|
(6,307
|
)
|
374
|
|
|||||
|
Balance at the end of the year
|
$
|
377,668
|
|
$
|
379,944
|
|
|
$
|
436,264
|
|
|
|
|
|
||||||||||
F 44
|
(C)
|
Reconciliation of accumulated depreciation (in thousands of dollars):
|
|
2015
|
2014
|
2013
|
|||||||||
|
Balance at beginning of the year
|
$
|
58,132
|
|
$
|
53,496
|
|
|
$
|
49,772
|
|
|
|
Depreciation expense
|
6,689
|
|
6,170
|
|
|
6,547
|
|
||||
|
Amounts retired or adjusted
|
(752
|
)
|
(1,534
|
)
|
(2,823
|
)
|
|||||
|
Balance at the end of the year
|
$
|
64,069
|
|
$
|
58,132
|
|
|
$
|
53,496
|
|
|
F 45
THE ST. JOE COMPANY
SCHEDULE IV (CONSOLIDATED) - MORTAGE LOANS ON REAL ESTATE
DECEMBER 31,
2015
(in thousands)
|
Description
|
Interest Rate
|
Final Maturity Date
|
Periodic Payment Terms
|
Prior Liens
|
Carrying Amount of Mortgages
|
Principal Amount of Loans Subject to Delinquent Principal or Interest
|
||||||||
|
Seller financing
|
4%
|
August 2016
|
P&I
(a)
|
—
|
$
|
90
|
|
—
|
||||||
|
Various other seller financing
|
4.80% to 7.81%
|
October 2016 through November 2023
|
P&I
(b)
|
—
|
480
|
|
—
|
|||||||
|
Total
(c)
|
$
|
570
|
|
|||||||||||
|
(a)
|
Principal is paid at the closing of each lot together with interest applicable to each lot. On the maturity date, all outstanding principal, all accrued interest and any other customary charges shall be due and payable in full.
|
|
(b)
|
Principal and interest is paid monthly.
|
|
(c)
|
The aggregate cost for federal income tax purposes approximates the amount of unpaid principal.
|
The summarized changes in the carrying amount of mortgage loans are as follows:
|
|
2015
|
2014
|
2013
|
||||||||
|
Balance at beginning of the year
|
$
|
22,122
|
|
$
|
5,354
|
|
|
$
|
1,158
|
|
|
|
Additions during the year - new mortgage loans
|
—
|
|
19,600
|
|
|
5,854
|
|
||||
|
Deductions during the year:
|
|||||||||||
|
Collections of principal
|
21,552
|
|
2,832
|
|
1,363
|
|
|||||
|
Foreclosures
|
—
|
|
—
|
|
295
|
|
|||||
|
Balance at the end of the year
|
$
|
570
|
|
$
|
22,122
|
|
|
$
|
5,354
|
|
|
F 46
TABLE OF CONTENTS
Part IItem 1. BusinessItem 1A. Risk FactorsItem 1B. Unresolved Staff CommentsItem 2. PropertiesItem 3. Legal ProceedingsItem 4. Mine Safety DisclosuresPart IIItem 5. Market For The Registrant S Common Equity, Related Stockholder Matters and Issuer Purchases Of Equity SecuritiesItem 6. Selected Financial DataItem 7. Management S Discussion and Analysis Of Financial Condition and Results Of OperationsItem 7A. Quantitative and Qualitative Disclosures About Market RiskItem 8. Financial Statements and Supplementary DataItem 9. Changes in and Disagreements with Accountants on Accounting and Financial DisclosureItem 9A. Controls and ProceduresItem 9B. Other InformationPart IIIItem 10. Directors, Executive Officers and Corporate GovernanceItem 11. Executive CompensationItem 12. Security Ownership Of Certain Beneficial Owners and Management and Related Stockholder MattersItem 13. Certain Relationships and Related Transactions and Director IndependenceItem 14. Principal Accounting Fees and ServicesPart IVItem 15. Exhibits, Financial Statement Schedules