JOHNSON OUTDOORS INC
10-Ks and 10-Qs
|
|
|
|
|
|
|
|
|
|
|
|
|
|
|
|
|
|
|
|
|
|
|
|
|
|
|
|
|
|
|
|
|
|
|
|
|
|
|
|
|
|
|
|
|
|
|
|
|
|
|
|
|
|
|
|
UNITED STATES
SECURITIES AND EXCHANGE COMMISSION
Washington, D.C. 20549
FORM 10-K
|
[ X ]
|
ANNUAL REPORT PURSUANT TO SECTION 13 OR 15(d) OF THE SECURITIES EXCHANGE ACT OF 1934
|
For the fiscal year ended September 30, 2011
OR
|
[____]
|
TRANSITION REPORT PURSUANT TO SECTION 13 OR 15(d) OF THE SECURITIES EXCHANGE ACT OF 1934
|
For the transition period from
_____
_ to
_____
_
Commission file number 0-16255
JOHNSON OUTDOORS INC.
(Exact name of registrant as specified in its charter)
|
Wisconsin
|
39-1536083
|
|
|
(State or other jurisdiction of
incorporation or organization)
|
(I.R.S. Employer Identification No.)
|
555 Main Street, Racine, Wisconsin 53403
(Address of principal executive offices, including zip code)
(262) 631-6600
(Registrant’s telephone number, including area code)
Securities registered pursuant to Section 12(b) of the Act:
| Title of Each Class | Name of Exchange on Which Registered |
| Class A Common Stock, $.05 par value per share | NASDAQ Global Market SM |
Securities registered pursuant to section 12(g) of the Act: None
Indicate by check mark if the registrant is a well-known seasoned issuer, as defined in Rule 405 of the Securities Act.
Yes [ ] No [ X ]
Indicate by check mark if the registrant is not required to file reports pursuant to Section 13 or Section 15(d) of the Act.
Yes [ ] No [ X ]
Indicate by check mark whether the registrant (1) has filed all reports required to be filed by Section 13 or 15(d) of the Securities Exchange Act of 1934 during the preceding 12 months (or for such shorter period that the registrant was required to file such reports), and (2) has been subject to such filing requirements for the past 90 days. Yes [ X ] No [ ]
Indicate by check mark whether the registrant has submitted electronically and posted on its corporate website, if any, every Interactive Data File required to be submitted and posted pursuant to Rule 405 of Regulation S-T during the preceding 12 months (or for such shorter period that the registrant was required to submit and post such files). Yes [ X ] No [ ]
Indicate by check mark if disclosure of delinquent filers pursuant to Item 405 of Regulation S-K is not contained herein, and will not be contained, to the best of registrant’s knowledge, in definitive proxy or information statements incorporated by reference in Part III of this Form 10-K, or any amendment to this Form 10-K. [X]
Indicate by check mark whether the registrant is a large accelerated filer, an accelerated filer, a non-accelerated filer or a smaller reporting company. See the definitions of "large accelerated filer,” “accelerated filer" and “smaller reporting company” in Rule 12b-2 of the Exchange Act (Check one):
Large Accelerated Filer [ ]
Accelerated Filer [ ]
Non-Accelerated Filer
(do not check if a smaller reporting company)
[ ]
Smaller Reporting Company [ X ]
Indicate by check mark whether the registrant is a shell company (as defined in Rule 12b-2 of the Exchange Act).
Yes [ ] No [ X ]
As of November 29, 2011, 8,567,549 shares of Class A and 1,215,842 shares of Class B common stock of the registrant were outstanding. The aggregate market value of voting and non-voting common stock of the registrant held by nonaffiliates of the registrant was approximately $69,045,752 on April 1, 2011 (the last business day preceding the registrant’s most recently completed second quarter) based on approximately 4,643,292 shares of Class A common stock held by nonaffiliates. For purposes of this calculation only, shares of all voting stock are deemed to have a market value of $14.87 per share, the closing price of the Class A common stock as reported on the NASDAQ Global Market
SM
on April 1, 2011. Shares of common stock held by any executive officer or director of the registrant (including all shares beneficially owned by the Johnson Family) have been excluded from this computation because such persons may be deemed to be affiliates. This determination of affiliate status is not a conclusive determination for other purposes.
DOCUMENTS INCORPORATED BY REFERENCE
Portions of the Proxy Statement for the 2012 Annual Meeting of the Shareholders of the Registrant are incorporated by reference into Part III of this report.
As used in this report, the terms "we," "us," "our," "Johnson Outdoors" and the "Company" mean Johnson Outdoors Inc. and its subsidiaries collectively, unless the context indicates another meaning.
|
TABLE OF CONTENTS
|
Page
|
|
Business
|
1
|
|
Risk Factors
|
7
|
|
Properties
|
12
|
|
Legal Proceedings
|
12
|
|
Market for Registrant’s Common Equity, Related Stockholder Matters and Issuer Purchases of Equity Securities
|
13
|
|
Selected Financial Data
|
14
|
|
Management’s Discussion and Analysis of Financial Condition and Results of Operations
|
15
|
|
Quantitative and Qualitative Disclosures about Market Risk
|
23
|
|
Financial Statements and Supplementary Data
|
23
|
|
Changes in and Disagreements with Accountants on Accounting and Financial Disclosure
|
23
|
|
Controls and Procedures
|
23
|
|
Other Information
|
24
|
|
Directors, and Executive Officers and Corporate Governance
|
24
|
|
Executive Compensation
|
24
|
|
Security Ownership of Certain Beneficial Owners and Management and Related Stockholder Matters
|
24
|
|
Certain Relationships and Related Transactions, and Director Independence
|
25
|
|
Principal Accountant Fees and Services
|
25
|
|
Exhibits and Financial Statement Schedules
|
25
|
|
Signatures
|
26
|
|
Exhibit Index
|
28
|
|
Consolidated Financial Statements
|
F-1
|
Forward Looking Statements
Certain matters discussed in this Form 10-K are “forward-looking statements,” and the Company intends these forward-looking statements to be covered by the safe harbor provisions for forward-looking statements contained in the Private Securities Litigation Reform Act of 1995 and is including this statement for purposes of those safe harbor provisions. These forward-looking statements can generally be identified as such because they include phrases such as the Company “expects,” “believes,” “anticipates,” "intends" or other words of similar meaning. Similarly, statements that describe the Company’s future plans, objectives or goals are also forward-looking statements. Such forward-looking statements are subject to certain risks and uncertainties which could cause actual results or outcomes to differ materially from those currently anticipated.
Factors that could affect actual results or outcomes include the matters described under the caption "Risk Factors" in Item 1A of this report and the following: changes in economic conditions, consumer confidence levels and discretionary spending patterns; the Company’s success in implementing its strategic plan, including its targeted sales growth platforms and focus on innovation; litigation costs related to actions of and disputes with companies, including companies that compete with the Company; the Company’s continued success in working capital management and cost-structure reductions; the Company’s success in meeting financial covenants in its credit agreements with its lenders; the risk of future writedowns of goodwill or other long-lived assets; the ability of the Company's customers to meet payment obligations; movements in foreign currencies, interest rates or commodity costs; fluctuations in the prices of raw materials or the availability of raw materials used by the Company; the success of the Company’s suppliers and customers; the ability of the Company to deploy its capital successfully; unanticipated outcomes related to outsourcing certain manufacturing processes; unanticipated outcomes related to outstanding litigation matters; and adverse weather conditions. Shareholders, potential investors and other readers are urged to consider these factors in evaluating the forward-looking statements and
are cautioned not to place undue reliance on such forward-looking statements. The forward-looking statements included herein are only made as of the date of this filing. The Company assumes no obligation, and disclaims any obligation, to update such forward-looking statements to reflect subsequent events or circumstances.
Trademarks
We have registered the following trademarks, which may be used in this report: Minn Kota®, Cannon®, Humminbird®, Fishin' Buddy®, LakeMaster®, Silva®, Eureka!®, Tech
4
O
™
, Geonav®, Old Town®, Ocean Kayak
™
, Necky®, Extrasport®, Carlisle®, Scubapro®, UWATEC® and SUBGEAR®.
Johnson Outdoors is a leading global manufacturer and marketer of branded seasonal, outdoor recreation products used primarily for fishing, diving, paddling and camping. The Company’s portfolio of well-known consumer brands has attained leading market positions due to continuous innovation, marketing excellence, product performance and quality. Company values and culture support innovation in all areas, promoting and leveraging best practices and synergies within and across its subsidiaries to advance the Company’s strategic vision set by executive management and approved by the Board of Directors. The Company is controlled by Helen P. Johnson-Leipold (Chairman and Chief Executive Officer), members of her family and related entities.
The Company was incorporated in Wisconsin in 1987 as successor to various businesses.
Marine Electronics
The Company’s Marine Electronic segment brands are:
Minn Kota
battery-powered fishing motors for quiet trolling or primary propulsion;
Humminbird
sonar and GPS equipment for fishfinding and navigation;
Cannon
downriggers for controlled-depth fishing and
Geonav
large, leisure boat navigation technology. In 2011, the Company acquired the
LakeMaster
brand of high-definition lake charts.
Marine Electronics brands and related accessories are sold across the globe, with approximately 85% of sales coming from North America through large outdoor specialty retailers, such as Bass Pro Shops and Cabela’s; large retail store chains; marine products distributors; international distributors, original equipment manufacturers (OEM) of boat brands such as Tracker, Skeeter and Ranger; and internet retailers and distributors.
Marine Electronics has achieved market share gains by focusing on product innovation, quality products and effective marketing. Such consumer marketing and promotion activities include: product placements on fishing-related television shows; print advertising and editorial coverage in outdoor, general interest and sport magazines; professional angler and tournament sponsorships; packaging and point-of-purchase materials and offers to increase consumer appeal and sales; branded websites; social media networks; and online promotions.
Outdoor Equipment
The Company’s Outdoor Equipment segment brands are:
Eureka!
consumer, commercial and military tents and accessories, sleeping bags, camping furniture and other recreational camping products;
Silva
field compasses and digital instruments; and
Tech
4
0
performance measurement instruments.
Eureka!
consumer tents, sleeping bags, camping furniture and other recreational camping products are mid- to high-price range products sold in the U.S. and Canada through independent sales representatives, primarily to camping and backpacking specialty stores, sporting goods stores, catalog and mail order houses and through internet retailers. Marketing of the Company’s tents, sleeping bags and other recreational camping products is focused on building the
Eureka!
brand name and establishing the Company as a leader in tent design and innovation. The Company’s camping tents and sleeping bags are
produced by third party manufacturing sources in Asia.
Eureka!
camping products are sold under license in Japan, Australia and Europe.
1
Eureka!
commercial tents include party tents and accessories, sold primarily to general rental stores, and other commercial tents and accessories sold directly to tent erectors. The Company’s tent products range from 10’x10’ canopies to 120’ wide pole tents and other large scale frame structures and are manufactured by the Company at the Company’s Binghamton, New York location.
Commercial tent accessories include lighting systems, interior lining options, and mounting brackets that allow the interior of the tents to be customized to suit the occasion. The Company believes there is a niche market for commercial tents outfitted with common, easy to use accessories.
Eureka!
also designs and manufactures large, heavy-duty tents and lightweight backpacking tents for the military at its Binghamton, New York location. Tents produced for military use in the last twelve months include modular general purpose tents, rapid deployment shelters and various lightweight one and two person tents. The Company manufactures military tent accessories like fabric floors and is also a subcontract manufacturer for other providers of military tents.
Silva
field compasses are manufactured by the Company and marketed exclusively in North America where the Company owns
Silva
trademark rights.
Tech
4
0
digital instruments and other branded products are manufactured by third parties and are primarily sold in the North American market.
Watercraft
The Company’s Watercraft segment designs and markets
Necky
high performance sea touring kayaks; sit on top
Ocean Kayaks
; and
Old Town
canoes and kayaks for family recreation, touring and tripping. These brands are all manufactured at the Company’s facility in Old Town, Maine.
The Company uses a rotational molding process for manufacturing polyethylene kayaks and canoes to compete in the high volume, low and mid price range of the market. These kayaks and canoes feature stiffer and more durable hulls than higher priced boats. The Company uses a thermo-form molding process in the manufacturing of lower priced models. The Company also markets canoes built from Royalex (ABS) and wood. The Company’s United States warehouse and distribution center for all of its Watercraft brands is also located in Old Town, Maine.
Watercraft accessory brands, including
Extrasport
personal flotation devices and
Carlisle
branded paddles, are produced primarily by third-party sources. The Company manufactures its
Pacific
brand kayaks in New Zealand and contracts for manufacturing of Watercraft products with third parties in New Hampshire and the Czech Republic.
The Company’s kayaks, canoes and accessories are sold through multiple channels in the U.S., Europe and the Pacific Basin with an increasing emphasis on specialty retailers, large outdoor specialty retailers such as Bass Pro Shops and Cabela’s, and large retail sporting goods stores.
The Company’s Watercraft business competes in this segment by introducing product innovations, creating quality products and by focusing on the product-specific needs of each marketing channel. Consumer marketing and promotion activities include: print advertising and editorial coverage in outdoor, general interest and sport magazines; direct marketing; branded websites and social media networks.
Diving
The Company manufactures and markets underwater diving products for technical and recreational divers, which it sells and distributes under the
SCUBAPRO
,
UWATEC
and
SUBGEAR
brand names.
The Company markets a complete line of underwater diving and snorkeling equipment, including regulators, buoyancy compensators, dive computers and gauges, wetsuits, masks, fins, snorkels and accessories.
SCUBAPRO
and
UWATEC
diving equipment is marketed to the premium segment of the market for both diving enthusiasts and more technical, advanced divers.
SUBGEAR
products are marketed to the recreational diver interested in owning quality equipment at an affordable price. Products are sold via select distribution to independent specialty dive stores worldwide. These specialty dive stores
sell the Company’s products over the counter as well as through their own websites. In addition, they generally provide a wide range of services to divers, including regular maintenance, product repair, diving education and travel programs. The Company also sells diving gear to dive training centers, aquariums and resorts.
2
The Company focuses on maintaining
SCUBAPRO
and
UWATEC
as the market leaders in innovation. The Company maintains research and development functions in Europe and holds a number of patents on proprietary products. The Company’s consumer communication focuses on building the brand and highlighting exclusive product features and consumer benefits of the
SCUBAPRO
and
UWATEC
product lines. The Company’s communication and distribution strategies reinforce the
SCUBAPRO
and
UWATEC
brands’ position as the industry’s quality and innovation leaders. The Company markets its equipment in diving magazines, via websites and through information and displays in dive specialty stores.
SUBGEAR’S
full line of
dive equipment and accessories compete in the mid-market on the basis of quality and performance at an affordable price.
The Company manufactures regulators, dive computers, gauges, and instruments at its Italian and Indonesian facilities. The Company sources buoyancy compensators, neoprene goods, plastic products, proprietary materials, and other components from third parties.
Financial Information for Business Segments
As noted above, the Company has four reportable business segments. See Note 13 to the consolidated financial statements included elsewhere in this report for financial information concerning each business segment.
International Operations
See Note 13 to the consolidated financial statements included elsewhere in this report for financial information regarding the Company’s domestic and international operations. See Note 1, subheading “Foreign Operations and Related Derivative Financial Instruments,” to the consolidated financial statements included elsewhere in this report for information regarding risks related to the Company’s foreign operations.
Research and Development
The Company commits significant resources to new product research and development in each of its business segments. Marine Electronics conducts its product research, design, engineering and software development activities at its locations in Mankato and Little Falls, Minnesota; Alpharetta, Georgia; Eufaula, Alabama; Shanghai, China; and Viareggio, Italy. Diving maintains research and development facilities in Spreitenbach, Switzerland; and Casarza Ligure, Italy. Research and development activities for Watercraft are performed in Bellingham, Washington. Product research, design and innovation for Outdoor Equipment products are conducted at the Company's Binghamton, New York location.
The Company expenses research and development costs as incurred, except for software development for new electronics products and bathymetry data collection and processing. These costs are capitalized once technological feasibility is established and then amortized over the expected useful life of the software or database. The amounts expensed by the Company in connection with research and development activities for each of the last two fiscal years are set forth in the Company’s Consolidated Statements of Operations included elsewhere in this report.
Industry and Competitive Environment
The Company believes its products compete favorably on the basis of product innovation, product performance and marketing support and, to a lesser extent, price.
Marine Electronics:
Minn Kota’s main competitors in the electric trolling motors business are Motor Guide, owned by Brunswick Corporation, and private label branded motors sourced primarily from manufacturers in Asia. Competition in this business is focused on technological innovation, product quality and durability as well as product benefits and features for fishing.
3
Humminbird’s main competitors in the fishfinder market are Lowrance and Garmin. Competition in this business is primarily focused on the quality of sonar imaging and display as well as the integration of mapping and GPS technology.
Cannon’s main competitors in the downrigger market are Big Jon, Walker and Scotty. Competition in this business primarily focuses on ease of operation, speed and durability.
Geonav’s main competitors in the marine navigation business are Raymarine, Garmin, Simrad, and Furuno. Competition in this business is primarily focused on innovative designs, quality, easy to use graphical interfaces, resolution of display imaging, leading edge processing power, sales and service capabilities and ease of product integration with related marine electronics devices.
LakeMaster’s main competitors in the lake chart market are Navionics and Jeppesen. Competition in this business focuses primarily on quality of data and quantity of available charts for inland lakes and ocean shoreline.
Outdoor Equipment:
The Company’s outdoor equipment brands and products compete in the sporting goods and specialty segments of the outdoor equipment market. Competitive brands with a strong position in the sporting goods channel include Coleman and private label brands. The Company also competes with specialty companies such as Kelty, The North Face and Slumberjack on the basis of materials and innovative designs for consumers who want performance products priced at a value.
The Company’s competitors in the Commercial tent market include Anchor Industries and Aztec for tension, frame and canopy tents. Competition in the commercial tent business is based on price, quality, structure, styling, low cost, ease of installation and technical support.
The Company sells military tents to prime vendors and third party distributors who hold supply contracts from the U.S. Government. Such supply contracts can be for commercial off-the-shelf products in addition to products required to be built to unique specifications. Competitors in the military tent business include HDT, DHS Systems, Alaska Structures,
Camel, Outdoor Venture, and Diamond Brand.
Watercraft:
The Company primarily competes in the kayak and canoe product categories of the paddlesports market. The Company’s main competitors in this market are Confluence Watersports, Pelican, Wenonah Canoe, Jackson Kayak and Legacy Paddlesports, each of which competes on the basis of their product’s design, performance, quality and price.
Diving:
The main competitors in Diving include Aqualung/U.S. Divers, Oceanic, Mares, Cressi-sub, and Suunto.
Competitive advantage in the life support product category of this segment, which consists of regulators, dive computers, and buoyancy compensators, is a function of product innovation, performance, quality and safety.
Competition in the general diving product category of fins, masks, snorkels and wetsuits is characterized by low barriers to entry and numerous competitors who compete on the basis of product innovation, performance, quality and price.
Diving equipment manufacturers are increasingly competing on the basis of financial strength and capital investment. The ability to provide extended credit terms to the specialty dive shop channel offers the opportunity to increase sales in a credit constrained economic environment. Innovation in dive equipment designs drives rapid product cycles, requiring a commitment to investments in research and development in order to maintain market leadership.
Employees
At September 30, 2011, the Company had approximately 1,200 regular, full-time employees. The Company considers its employee relations to be excellent. Temporary employees are utilized primarily to manage peaks in the seasonal manufacturing of products.
4
Patents, Trademarks and Proprietary Rights
The Company has numerous trademarks and trade names which it considers important to its business, many of which are noted in this report. Historically, the Company has vigorously defended its intellectual property rights and the Company expects to continue to do so.
Supply Chain and Sourcing of Materials
The Company manufactures some products that use materials that, due to geographical distance, limited supplier capacity or competing demands for such materials, are only available in a cost effective manner from a single vendor or require the Company to place orders several months in advance of required delivery.
In the past, the Company has experienced product and component shortages in its Marine Electronics and Diving businesses. The Company mitigates such product availability and supply chain risks through purchase of safety stocks, forecast-based supply contracts, and to a lesser extent with just in time inventory deliveries or supplier-owned inventory located close to the Company’s manufacturing locations. The Company strives to balance the businesses’ need to maintain adequate inventory levels with the cost of holding such inventory by manufacturing to forecast for high volume products, utilizing build-to-order strategies wherever possible, and by having contract manufactured products delivered to customers directly from the supplier. The Company also seeks to manage its inventory through on going product design and logistical initiatives with its suppliers to reduce lead times.
As military contracts require utilization of domestic suppliers, the Company is limited to key vendors for materials used in its military tent business. Interruption or loss in the availability of these materials could have a material adverse impact on the sales and operating results of the Company’s Outdoor Equipment business.
A significant driver of the delivered cost of the Company’s watercraft products is fuel prices. The Company seeks to mitigate this cost through negotiated fuel surcharge rates with its shipping firms and by optimizing the loads and routing of its deliveries to customers.
Most of the Company’s products are made using materials that are generally in adequate supply and are available from a variety of third party suppliers.
5
Seasonality
The Company’s products are outdoor recreation-related, which results in seasonal variations in sales and profitability. This seasonal variability is due to customers’ increasing their inventories in the quarters ending March and June, the primary selling season for the Company’s outdoor recreation products, with lower inventory volumes during the quarters ending September and December. The Company mitigates the seasonality of its businesses somewhat by encouraging customers to purchase and take delivery of products more evenly through the year. The following table shows, for the past two fiscal years, the total net sales and operating profit or loss of the Company for each quarter, as a percentage of the total year.
|
Fiscal Year Ended
|
||||||||||||||||
| 2011 | 2010 | |||||||||||||||
|
Quarter Ended
|
Net
Sales
|
Operating
Profit
|
Net
Sales
|
Operating
Profit
|
||||||||||||
|
December
|
19 | % | -8 | % | 18 | % | -24 | % | ||||||||
|
March
|
32 | % | 65 | % | 30 | % | 55 | % | ||||||||
|
June
|
30 | % | 67 | % | 32 | % | 92 | % | ||||||||
|
September
|
19 | % | -24 | % | 20 | % | -23 | % | ||||||||
| 100 | % | 100 | % | 100 | % | 100 | % | |||||||||
Environment and Climate Change
The Company is subject to various supra national, federal, state and local environmental laws, ordinances, regulations, and other requirements of governmental authorities. We believe we comply with such laws and regulations. Expenditures on environmental compliance have not had, and we believe in the future, will not have, a material effect on the Company’s capital expenditures, earnings or competitive position. We do not believe that any direct or indirect consequences of legislation related to climate change will have a material effect on our operating costs, facilities or products.
Available Information
The Company maintains a website at www.johnsonoutdoors.com. On its website, the Company makes available, free of charge, its Annual Report on Form 10-K, quarterly reports on Form 10-Q, current reports on Form 8-K and amendments to those reports, as soon as reasonably practical after the reports have been electronically filed or furnished to the Securities and Exchange Commission. In addition, the Company makes available on its website, free of charge, its (a) Code of Business Conduct; (b) Code of Ethics for its Chief Executive Officer and Senior Financial and Accounting Officers; and (c) the charters for the following committees of the Board of Directors: Audit; Compensation; Executive; and Nominating and Corporate Governance. The Company is not including the information contained on or available through its website as a part of, or incorporating such information by reference into, this Annual Report
on Form 10-K. This
report includes all material information about the Company that is included on the Company’s website and is otherwise required to be included in this report. Copies of any materials the Company files with the Securities and Exchange Commission (SEC) can also be obtained free of charge through the SEC’s website at
www.sec.gov
. The SEC’s Public Reference Room can be contacted at 100 F Street, N.E., Washington, D.C. 20549, or by calling 1 (800) 732-0330.
6
The risks described below are not the only risks we face. Additional risks that we do not yet know of or that we currently think are immaterial may also impair our future business operations. If any of the events or circumstances described in the following risks actually occur, our business, financial condition or results of operations could be materially adversely affected. In such cases, the trading price of our common stock could decline.
Our net sales and profitability depend on our ability to continue to conceive, design and market products that appeal to our consumers.
Our business depends on our ability to continue to conceive, design, manufacture and market new products and upon continued market acceptance of our product offering. Rapidly changing consumer preferences and trends make it difficult to predict how long consumer demand for our existing products will continue or what new products will be successful. A decline in consumer demand for our products, our failure to develop new products on a timely basis in anticipation of changing consumer preferences or the failure of our new products to achieve and sustain consumer acceptance could reduce our net sales and profitability.
Competition in our markets could reduce our net sales and profitability.
We operate in highly competitive markets. We compete with several large domestic and foreign companies such as Brunswick, Lowrance, Confluence and Aqualung/U.S. Divers, with private label products sold by many of our retail customers and with other producers of outdoor recreation products. Some of our competitors have longer operating histories, stronger brand recognition and greater financial, technical, marketing and other resources than us. In addition, we may face competition from new participants in our markets because the outdoor recreation product industries have limited barriers to entry. We experience price competition for our products, and competition for shelf space at retailers, all of which may increase in the future. If we cannot compete in our product markets successfully in the future, our net sales and profitability will likely decline.
General economic conditions affect the Company’s results.
Our revenues are affected by economic conditions and consumer confidence worldwide, but especially in the United States and Europe. In times of economic uncertainty, consumers tend to defer expenditures for discretionary items, which affects demand for our products. Moreover, our businesses are cyclical in nature, and their success is impacted by general economic conditions and specific economic conditions affecting the regions and markets we serve, the overall level of consumer confidence in the economy and discretionary income levels. Any substantial deterioration in general economic conditions that diminish consumer confidence or discretionary income can reduce our sales and adversely affect our financial results. Moreover, declining economic conditions create the potential for future impairments of goodwill and other intangible and long-lived assets that may negatively impact our financial condition and results of operations. The impact of weak consumer credit markets; corporate restructurings; layoffs; continued high unemployment rates; declines in the value of investments and residential real estate; higher fuel prices and increases in federal and state taxation all can negatively affect our operating results.
Intellectual property disputes relating to our products could increase our costs.
Our industry is susceptible to litigation regarding patent infringement and infringement of other intellectual property rights. We could be either a plaintiff or a defendant in trademark, patent and/or other intellectual property infringement or misappropriation claims and claims of breach of license from time to time. The prosecution or defense of any intellectual property litigation is both costly and disruptive of the time and resources of our management, even if the claim or defense against us is without merit. We could also be required to pay substantial damages or settlement costs to resolve intellectual property litigation.
Furthermore, we may rely on trade secret law to protect technologies and proprietary information that we cannot or have chosen not to patent. Trade secrets, however, are difficult to protect. Although we attempt to maintain protection through confidentiality agreements with necessary personnel, contractors and consultants, we cannot guarantee that such contracts will not be breached. Further, confidentiality
agreements may conflict with other agreements which personnel, contractors and consultants have signed with prior employers or clients. In the event of a breach of a confidentiality agreement or the divulgence of proprietary information, we may not have adequate legal remedies to maintain our trade
secret protection.
Litigation to determine the scope of intellectual property rights, even if ultimately successful, could be costly and could divert management’s attention away from the Company’s business.
7
Impairment charges could impact our future financial position and results of operations.
We test our goodwill and other long-lived assets for impairment on an annual basis or when an event occurs that might reduce the fair value of the reporting unit or applicable asset or group of assets below its carrying value. Various uncertainties, including significant adverse changes in business climate, adverse actions by regulators, unanticipated competition, loss of key customers or changes in consumer preferences could impact the expected cash flows to be generated by an asset or group of assets, and may result in an impairment of those assets. Although any such impairment charge would be a non-cash expense, any impairment of our assets could materially increase our expenses and reduce our profitability.
Sales of our products are seasonal, which causes our operating results to vary from quarter to quarter.
Sales of our products are seasonal. Historically, our net sales and profitability have peaked in the second and third fiscal quarters due to the buying patterns of our customers for our products. Seasonal variations in operating results may also cause us to increase our debt levels and interest expense primarily in the second and third fiscal quarters as we fund our working capital requirements.
The trading price of shares of our common stock fluctuates and investors in our common stock may experience substantial losses.
The trading price of our common stock has been volatile and may continue to be volatile in the future. The trading price of our common stock could decline or fluctuate in response to a variety of factors, including:
| ● | the timing of our announcements or those of our competitors concerning significant product developments, acquisitions or financial performance; | |
| ● | fluctuation in our quarterly operating results; | |
| ● | substantial sales of our common stock; | |
| ● | general stock market conditions; or | |
| ● | other economic or external factors. |
You may be unable to sell your stock at or above your purchase price.
A limited number of our shareholders can exert significant influence over the Company.
As of November 29, 2011, Helen P. Johnson-Leipold, members of her family and related entities (hereinafter the Johnson Family), held approximately 77% of the voting power of both classes of our common stock taken as a whole. This voting power would permit these shareholders, if they chose to act together, to exert significant influence over the outcome of shareholder votes, including votes concerning the election of directors, by-law amendments, possible mergers, corporate control contests and other significant corporate transactions. Moreover, certain members of the Johnson Family have entered into a voting trust agreement covering approximately 96% of our outstanding class B common shares. This voting trust agreement permits these shareholders, if they continue to choose to act together, to exert significant influence over the outcome of shareholder votes, including votes concerning the election of directors, by-law amendments, possible mergers, corporate control contests and other significant corporate transactions.
We may experience difficulties in integrating strategic acquisitions.
8
We have, as part of our strategy, historically pursued strategic acquisitions. The pursuit of future growth through acquisitions, including participation in joint ventures, involves significant risks that could have a material adverse effect on our business. Risks associated with integrating strategic acquisitions include:
| ● | the acquired business may experience losses which could adversely affect our profitability; | |
| ● | unanticipated costs relating to the integration of acquired businesses may increase our expenses and reduce our profitability; | |
| ● | possible failure to obtain any necessary consents to the transfer of licenses or other agreements of the acquired company; | |
| ● | possible failure to maintain customer, licensor and other relationships of the acquired company after the closing of the transaction with the acquired company; | |
| ● | difficulties in achieving planned cost savings and synergies may increase our expenses; | |
| ● | diversion of our management’s attention could impair their ability to effectively manage our other business operations; and | |
| ● | unanticipated management or operational problems or liabilities may adversely affect our profitability and financial condition. |
We are dependent upon certain key members of management.
Our success will depend to a significant degree on the abilities and efforts of our senior management. Moreover, our success depends on our ability to attract, retain and motivate qualified management, marketing, technical and sales personnel. These people are in high demand and often have competing employment opportunities. The labor market for skilled employees is highly competitive and we may lose key employees or be forced to increase their compensation to retain these people. Employee turnover could significantly increase our training and other related employee costs. The loss of key personnel, or the failure to attract qualified personnel, could have a material adverse effect on our business, financial condition or results of operations.
Sources of and fluctuations in market prices of raw materials can affect our operating results.
The primary raw materials we use in manufacturing our products are metals, resins and packaging materials. These materials are generally available from a number of suppliers, but we have chosen to concentrate our sourcing with a limited number of vendors for each commodity or purchased component. We believe our sources of raw materials are reliable and adequate for our needs. However, the development of future sourcing issues related to the availability of these materials as well as significant fluctuations in the market prices of these materials may have an adverse effect on our financial results.
Our profitability is also affected by significant fluctuations in the prices of the raw materials we use in our products. We may not be able to pass along any price increases in our raw materials to our customers. As a result, an increase in the cost of raw materials, labor or other costs associated with the manufacturing of our products could increase our costs of sales and reduce our gross margins.
Currency exchange rate fluctuations could adversely affect the Company’s results.
We have significant foreign operations, for which the functional currencies are denominated primarily in euros, Swiss francs, Japanese yen and Canadian dollars. As the values of the currencies of the foreign countries in which we have operations increase or decrease relative to the U.S. dollar, the sales, expenses, profits, losses, assets and liabilities of our foreign operations, as reported in our consolidated financial statements, increase or decrease, accordingly. Approximately 26% of our revenues for the year ended September 30, 2011 were denominated in currencies other than the U.S. dollar. Approximately 15% were denominated in euros, with the remaining 11% denominated in various other foreign currencies. We may mitigate a portion of the fluctuations in certain foreign currencies through the purchase of foreign currency swaps, forward contracts and options to hedge known commitments denominated in foreign currencies or to reduce the risk of changes in foreign currency exchange rates on foreign currency borrowings.
9
Because we rely on foreign suppliers and we sell products in foreign markets, we are susceptible to numerous international business risks that could increase our costs or disrupt the supply of our products.
Our international operations subject us to risks, including:
| ● | economic and political instability; | |
| ● | restrictive actions by foreign governments; | |
| ● | opportunity costs and reputational damage related to the presence of counterfeit versions of the Company’s products in such foreign markets; | |
| ● | greater difficulty enforcing intellectual property rights and weaker laws protecting intellectual property rights; | |
| ● | changes in import duties or import or export restrictions; | |
| ● | timely shipping of product and unloading of product, including the timely rail/truck delivery to our warehouses and/or a customer’s warehouse of our products; | |
| ● | complications in complying with the laws and policies of the United States affecting the importation of goods, including duties, quotas and taxes; and | |
| ● | complications in complying with trade and foreign tax laws. |
Any of these risks, including the cost of compliance with trade and foreign tax laws, could disrupt the supply of our products or increase our expenses.
We are subject to environmental and safety regulations.
We are subject to supra national, federal, state, local and foreign laws and other legal requirements related to the generation, storage, transport, treatment and disposal of materials as a result of our manufacturing and assembly operations. These laws include the Resource Conservation and Recovery Act (as amended), the Clean Air Act (as amended) and the Comprehensive Environmental Response, Compensation and Liability Act (as amended). We believe that our existing environmental management system is adequate and we have no current plans for substantial capital expenditures in the environmental area. We do not currently anticipate any material adverse impact on our results of operations, financial condition or competitive position as a result of our compliance with federal, state, local and foreign environmental laws or other legal requirements. However, risk of environmental liability and changes associated with maintaining compliance with environmental laws is inherent in the nature of our business and there is no assurance that material liabilities or changes would not arise.
We rely on our credit facilities to provide us with sufficient working capital to operate our business.
Historically, we have relied upon our existing credit facilities to provide us with adequate working capital to operate our business. The availability of borrowing amounts under our revolving credit facilities is generally dependent upon the amount and quality of the accounts receivable and inventory collateralizing our credit facilities. As a result, the bankruptcy of a major customer could have a significant negative impact on the availability of borrowing amounts under our revolving credit facilities. If our lenders reduce or terminate our access to amounts under our credit facilities, we may not have sufficient capital to fund our working capital needs and/or we may need to secure additional capital or financing to fund our working capital requirements or to repay outstanding debt under our credit facilities. We can make no assurance that we will be successful in ensuring our availability of amounts under our credit facilities or in connection with raising additional capital and that any amount, if raised, will be sufficient to meet our cash requirements. If we are not able to maintain our borrowing availability under our credit facilities and/or raise additional capital when needed, we may be forced to sharply curtail our efforts to manufacture and promote the sale of our products or to curtail our operations. Ultimately, we may be forced to cease operations.
10
Our debt covenants may limit our ability to complete acquisitions, incur debt, make investments, sell assets, merge or complete other significant transactions.
Our credit facilities and certain other of our debt instruments include limitations on a number of our activities, including our ability to:
| ● | incur additional debt; | |
| ● | create liens on our assets or make guarantees; | |
| ● | make certain investments or loans; | |
| ● | pay dividends; or | |
| ● | dispose of or sell assets, make acquisitions above certain amounts or enter into a merger or similar transaction. |
Our credit facilities also contain a number of financial covenants. The restrictive covenants in our credit facilities may limit our ability to engage in acts that may be in our best long term interests. A breach of any of the restrictive covenants in our credit facilities could result in a default under these facilities. If a default occurs, the lenders under our credit facilities may elect to declare all outstanding borrowings, together with accrued interest, to be immediately due and payable, to terminate any commitments they have to provide further borrowings and to exercise any other rights they have under the facilities or applicable law.
Because our common stock is thinly traded, its market price may fluctuate significantly more than the stock market in general or the stock prices of similar companies, which are exchanged, listed or quoted on NASDAQ. We believe there are 4,699,265 shares of our Class A common stock held by nonaffiliates as of November 29, 2011. Thus, our common stock will be less liquid than the stock of companies with broader public ownership, and as a result, the trading price for our shares of common stock may be more volatile. Among other things, trading of a relatively small volume of our common stock may have a greater impact on the trading price for our stock than would be the case if our public float were larger.
Our business is susceptible to adverse weather conditions or events.
Our success is in part affected by adverse weather conditions, including fires, floods, tornados and other natural disasters. Such events have the tendency to create fluctuations in demand for our products which may impact our borrowing costs, increase our expenses and reduce our profitability. Moreover, our profitability is affected by our ability to successfully manage our inventory levels and demand for our products, which, in part depends upon the efficient operation of our production and delivery systems. These systems are vulnerable to damage or interruption from the aforementioned natural disasters. Such natural disasters could adversely impact our ability to meet delivery requirements of our customers, which may result in our need to incur extra costs to expedite production and delivery of product to meet customer demand. Any of these events could negatively impact our profitability.
Not Applicable.
11
The Company maintains leased and owned manufacturing, warehousing, distribution and office facilities throughout the world. The Company believes that its facilities are well maintained and have capacity adequate to meet its current needs.
See Note 6 to the consolidated financial statements included elsewhere in this report for a discussion of the Company’s lease obligations.
As of September 30, 2011, the Company’s principal manufacturing (identified with an asterisk) and other locations are:
Alpharetta, Georgia (Marine Electronics)
Antibes, France (Diving)
Barcelona, Spain (Diving)
Batam, Indonesia* (Diving and Outdoor Equipment)
Bellingham, Washington (Watercraft)
Binghamton, New York* (Outdoor Equipment)
Brignais, France (Watercraft)
Brussels, Belgium (Diving)
Burlington, Ontario, Canada (Marine Electronics, Outdoor Equipment, Watercraft)
Casarza Ligure, Italy* (Diving)
Chai Wan, Hong Kong (Diving)
Chatswood, Australia (Diving)
El Cajon, California (Diving)
Eufaula, Alabama* (Marine Electronics)
Great Yarmouth, Norfolk, United Kingdom (Watercraft)
Little Falls, Minnesota* (Marine Electronics)
Mankato, Minnesota* (Marine Electronics)
Napier, New Zealand* (Watercraft)
Old Town, Maine* (Watercraft)
Shanghai, China (Marine Electronics)
Silverdale, New Zealand* (Watercraft)
Spreitenbach, Switzerland (Diving)
Viareggio, Italy (Marine Electronics)
Wendelstein, Germany (Diving)
Yokahama, Japan (Diving)
The Company’s corporate headquarters is located in a leased facility in Racine, Wisconsin.
See Note 14 to the consolidated financial statements included elsewhere in this report for a discussion of legal proceedings.
12
| ITEM 5. | MARKET FOR REGISTRANT’S COMMON EQUITY, RELATED STOCKHOLDER MATTERS AND ISSUER PURCHASES EQUITY SECURITIES |
Certain information with respect to this item is included in Notes 10 and 11 to the Company's consolidated financial statements included elsewhere in this report. The Company’s Class A common stock is traded on the NASDAQ Global Market
SM
under the symbol: JOUT. There is no public market for the Company’s Class B common stock. However, the Class B common stock is convertible at all times at the option of the holder into shares of Class A common stock on a share for share basis. As of November 18, 2011, the Company had 671 holders of record of its Class A common stock and 34 holders of record of its Class B common stock. We believe the number of beneficial owners of our Class A common stock on that date was substantially greater.
A summary of the high and low closing prices for the Company’s Class A common stock during each quarter of the years ended September 30, 2011 and October 1, 2010 is as follows:
| First Quarter | Second Quarter | Third Quarter | Fourth Quarter | |||||||||||||||||||||||||||||
|
2011
|
2010
|
2011
|
2010
|
2011
|
2010
|
2011
|
2010
|
|||||||||||||||||||||||||
|
Stock prices:
|
||||||||||||||||||||||||||||||||
|
High
|
$ | 15.22 | $ | 10.75 | $ | 15.81 | $ | 11.52 | $ | 17.98 | $ | 14.67 | $ | 20.99 | $ | 13.21 | ||||||||||||||||
|
Low
|
12.16 | 8.65 | 13.00 | 10.25 | 14.57 | 11.00 | 14.60 | 8.96 | ||||||||||||||||||||||||
On December 4, 2008, the Company’s Board of Directors voted to suspend quarterly dividends to shareholders and as such, the Company did not declare any dividends during the fiscal years ended September 30, 2011 or October 1, 2010.
The following limitations apply to the ability of the Company to pay dividends:
| ● | Pursuant to the Company’s revolving credit and security agreement, dated September 29, 2009, the Company is limited in the amount of restricted payments (primarily dividends and repurchases of common stock) made during each fiscal year. The Company may declare, and pay, dividends in accordance with historical practices, but in no event may the aggregate amount of all dividends for any fiscal year exceed 25% of the Company’s net income for that fiscal year. | |
| ● | The Company’s Articles of Incorporation provide that no dividend, other than a dividend payable in shares of the Company’s common stock, may be declared or paid upon the Class B common stock unless such dividend is declared or paid upon both classes of common stock. Whenever a dividend (other than a dividend payable in shares of Company common stock) is declared or paid upon any shares of Class B common stock, at the same time there must be declared and paid a dividend on shares of Class A common stock equal in value to 110% of the amount per share of the dividend declared and paid on shares of Class B common stock. Whenever a dividend is payable in shares of Company common stock, such dividend must be declared or paid at the same rate on the Class A common stock and the Class B common stock. |
13
Total Shareholder Return
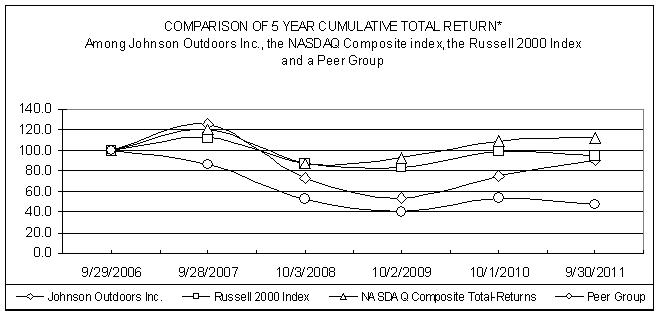
The graph below compares on a cumulative basis the yearly percentage change since September 29, 2006 in the total return (assuming reinvestment of dividends) to shareholders on the Class A common stock with (a) the total return (assuming reinvestment of dividends) on The NASDAQ Stock Market-U.S. Index; (b) the total return (assuming reinvestment of dividends) on the Russell 2000 Index; and (c) the total return (assuming reinvestment of dividends) on a self-constructed peer group index. The peer group consists of Arctic Cat Inc., Brunswick Corporation, Callaway Golf Company, Escalade Inc., Marine Products Corporation and Nautilus, Inc. The graph assumes $100 was invested on September 29, 2006 in the Company’s Class A common stock, The NASDAQ Stock Market-U.S. Index, the Russell 2000 Index and the peer group indices.
|
||
|
* $100 invested on September 29, 2006 in stock or index, including reinvestment of dividends.
Indexes calculated on a mid-month basis
|
|
9/29/2006
|
9/28/2007
|
10/3/2008
|
10/2/2009
|
10/1/2010
|
9/30/2011
|
|||||||||||||||||||
|
Johnson Outdoors Inc.
|
$ | 100.0 | $ | 125.6 | $ | 73.0 | $ | 53.9 | $ | 75.5 | $ | 91.1 | ||||||||||||
|
NASDAQ Composite
|
100.0 | 120.5 | 87.7 | 93.1 | 108.8 | 112.0 | ||||||||||||||||||
|
Russell 2000 Index
|
100.0 | 112.4 | 87.8 | 83.4 | 98.8 | 95.1 | ||||||||||||||||||
|
Peer Group
|
100.0 | 86.5 | 52.8 | 39.9 | 53.1 | 47.3 | ||||||||||||||||||
The information in this section titled “Total Shareholder Return” shall not be deemed to be “soliciting material” or “filed” with the Securities and Exchange Commission or subject to Regulation 14A or 14C promulgated by the Securities and Exchange Commission or subject to the liabilities of section 18 of the Securities Exchange Act of 1934, as amended, and this information shall not be deemed to be incorporated by reference into any filing under the Securities Act of 1933, as amended, or the Securities Exchange Act of 1934, as amended.
Not applicable.
14
Executive Overview
The Company designs, manufactures and markets high quality recreational products for the outdoor enthusiast. Through a combination of innovative products, strong marketing, a talented and passionate workforce and efficient distribution, the Company seeks to set itself apart from the competition. Its subsidiaries operate as a network that promotes innovation and leverages best practices and synergies, following the strategic vision set by executive management and approved by the Company’s Board of Directors.
The Company’s fiscal 2011 revenues improved by over 6% and operating profit grew 21% from the prior year. The growth was driven primarily by growth in its Marine Electronics and Diving businesses, which more than offset declines in the Outdoor Equipment and Watercraft businesses. Net income of $32.6 million increased $26.1 million over fiscal 2010 due significantly to the $24.9 million reduction in the Company’s deferred tax asset valuation allowance during the year.
During 2011, the Company continued its strategic investment in future products, such as Marine Electronics’ Geonav® brand. As of September 30, 2011, the Company has approximately $4.0 million invested in equipment and software development to expand its large leisure boat navigation systems product offerings.
Results of Operations
Summary consolidated financial results from continuing operations for the fiscal years presented were as follows:
|
(millions, except per share data)
|
2011
|
2010
|
||||||
|
Net sales
|
$ | 407.4 | $ | 382.4 | ||||
|
Gross profit
|
163.1 | 153.5 | ||||||
|
Operating expenses
|
145.4 | 138.9 | ||||||
|
Operating profit
|
17.7 | 14.6 | ||||||
|
Interest expense
|
3.2 | 5.1 | ||||||
|
Tax (benefit) expense
|
(20.4 | ) | 2.7 | |||||
|
Net income
|
32.6 | 6.5 | ||||||
15
The Company’s internal and external sales and operating profit (loss) by business segment are summarized as follows:
|
(millions)
|
2011
|
2010
|
||||||
|
Net sales:
|
||||||||
|
Marine Electronics
|
$ | 222.1 | $ | 185.4 | ||||
|
Outdoor Equipment
|
38.9 | 48.7 | ||||||
|
Watercraft
|
57.7 | 64.0 | ||||||
|
Diving
|
89.5 | 85.1 | ||||||
|
Other/corporate/eliminations
|
(0.8 | ) | (0.8 | ) | ||||
| $ | 407.4 | $ | 382.4 | |||||
|
Operating profit (loss):
|
||||||||
|
Marine Electronics
|
$ | 21.1 | $ | 13.9 | ||||
|
Outdoor Equipment
|
3.0 | 5.9 | ||||||
|
Watercraft
|
(1.3 | ) | 1.8 | |||||
|
Diving
|
3.6 | 3.0 | ||||||
|
Other/corporate/eliminations
|
(8.7 | ) | (10.0 | ) | ||||
| $ | 17.7 | $ | 14.6 | |||||
See Note 13 to the Consolidated Financial Statements included elsewhere in this report for the definition of segment net sales and operating profit.
Fiscal 2011 vs Fiscal 2010
Net Sales
Net sales in 2011 increased 6.5% to $407.4 million compared to $382.4 million in 2010. The increase was driven primarily by the success of new products in the Marine Electronics business. Those sales, in addition to favorable foreign currency translations which impacted sales by $6.4 million in comparison to 2010, more than offset significant declines in the Outdoor Equipment and Watercraft businesses.
Net sales for the Marine Electronics business increased $36.7 million, or 19.8% during 2011. Both the Minn Kota and Humminbird brands grew by over 20% in all channels and each exceeded $100 million in sales. The increases were primarily the result of the introduction of successful new products including Talon shallow water anchors and Humminbird Down Imaging fishfinders.
Outdoor Equipment net sales decreased $9.8 million in 2011, or 20.1%, primarily due to significant reductions in military spending and the temporary closure of the Binghamton, New York facility due to the flood that occurred in September 2011. See further discussion of the impact of the flooding at Note 15 to the Consolidated Financial Statements included elsewhere in this report.
The Watercraft business experienced a decline in sales of $6.3 million, or 9.8%, across all sales channels and all brands. Both a slow start to the paddling season due to unfavorable weather conditions and overall weak demand were the primary drivers leading to the decline year over year.
The Diving business saw an increase in sales of $4.4 million, or 5.2% year over year, due in large part to favorable currency translation of $3.7 million, or 4.3%, as well as wider distribution of the new SUBGEAR brand and increased SCUBAPRO demand.
Gross Profit
Gross profit of $163.1 million was 40.0% of net sales on a consolidated basis for the year ended September 30, 2011 compared to $153.5 million or 40.1% of net sales in the prior year. The gross profit increase of $9.6 million was primarily attributable to the increase in sales volume during 2011 as compared to 2010.
16
Gross profit in the Marine Electronics business increased $16.2 million from the prior year due to higher volume. Favorable product mix and increased efficiencies resulting from the higher volumes improved this segment’s gross profit as a percent of net sales from 38.1% in 2010 to 39.1% in the current year.
Gross profit in the Outdoor Equipment business decreased $3.7 million from 2010, and declined as a percent of net sales from 37.0% in the prior year to 36.7% in 2011 primarily due to lower volumes and the related reduced absorption of fixed costs.
Gross profit in the Watercraft segment was 32.5% of net sales in 2011 and was $3.7 million lower than 2010 levels, which were equal to 35.1% of net sales. The decrease in gross profit was due primarily to lower sales volumes and reduced absorption of fixed costs.
Gross profit for the Diving segment increased by $0.8 million but decreased as a percentage of sales from 49.7% in 2010 to 48.2% in 2011 primarily due to increases in product and component costs.
Operating Expenses
Operating expenses increased from the prior year by $6.5 million. The increase was mainly attributable to higher direct expenses related to higher sales volumes, increased R&D spending and higher legal costs.
Operating expenses for the Marine Electronics segment increased by $9.1 million from 2010 levels. The increase was due mainly to increased direct expenses as the result of higher sales volumes and increased legal costs.
Outdoor Equipment operating expenses decreased by $0.9 million from 2010 due primarily to lower marketing related costs driven by the declines in volume.
The Watercraft business saw a decline in operating expenses of $0.5 million from the prior year due primarily to lower direct expenses driven by lower sales volume which were offset in part by increased freight costs.
Operating expenses for the Diving business increased by $0.2 million due primarily to the $2.1 million unfavorable impact of currency translation which was largely offset by the effects of cost reduction efforts undertaken in this segment.
Operating Results
The Company’s operating profit was $17.7 million in 2011 compared to an operating profit of $14.6 million in fiscal 2010. Marine Electronics operating profit increased by $7.2 million from the prior year. Outdoor Equipment operating profit declined to $2.9 million, half the level of 2010. The Watercraft business incurred an operating loss in 2011 of $1.3 million, compared to an operating profit of $1.8 million in the prior year, a decline of $3.1 million. Diving operating profit increased $0.6 million from the prior year.
Other Income and Expenses
Interest expense decreased from the prior year by $1.8 million, due largely to lower amortization of interest rate swaps and interest rate decreases which resulted from renegotiating and amending the Company’s debt agreements during 2011. Interest income was less than $0.1 million in both years.
Other expense of $2.3 million in fiscal 2011 compared to $0.4 million in the prior year. Current year expense reflected currency losses of $1.7 million and market losses of $0.4 million on deferred compensation plan assets. In the prior year, this line item included $1.2 million of currency losses offset in part by market gains of $0.7 million on the deferred compensation plan assets.
17
Pretax Income and Income Taxes
The Company realized pretax income of $12.3 million in fiscal 2011, compared to pretax income of $9.2 million in fiscal 2010. The Company recorded an income tax benefit of $20.4 million in 2011 compared to $2.7 million of income tax expense in 2010. The 2011 income tax benefit reflected the net reduction of its deferred tax asset valuation allowance by $24.9 million which was due primarily to the Company’s determination at the end of fiscal 2011 that it was more likely than not to realize the majority of its deferred tax assets. See further discussion of the deferred tax asset valuation allowance in Note 7 to the Consolidated Financial Statements found elsewhere in this report.
Net Income
The Company recognized net income of $32.6 million in fiscal 2011, or $3.36 per diluted share, compared to net income of $6.5 million in fiscal 2010, or $0.68 per diluted share, based on the factors discussed above.
Adjustments to Net Income Subsequent to Earnings Release
On November 30, 2011, the Company filed a Form 8-K in which it announced financial results for the year ended September 30, 2011. Since that date, final income tax adjustments related to the $24.9 million reduction in the deferred tax asset valuation allowance described above were recorded by the Company which had the effect of reducing net income by $0.1 million from the level reported in the earnings release filed as an exhibit to the Form 8-K which resulted in a $0.01 decrease in dilutive earnings per share. There was no change to the amount of pretax income previously announced
.
Financial Condition, Liquidity and Capital Resources
The Company’s cash flows from operating, investing and financing activities, as reflected in the Consolidated Statements of Cash Flows, are summarized in the following table:
|
(millions)
|
2011
|
2010
|
||||||
|
Cash provided by (used for):
|
||||||||
|
Operating activities
|
$ | 31.0 | $ | 19.8 | ||||
|
Investing activities
|
(13.3 | ) | (9.3 | ) | ||||
|
Financing activities
|
(8.6 | ) | (7.6 | ) | ||||
|
Effect of exchange rate changes on cash and cash equivalents
|
2.1 | 2.5 | ||||||
|
Increase in cash and cash equivalents
|
$ | 11.2 | $ | 5.4 | ||||
Operating Activities
The following table sets forth the Company’s working capital position at the end of each of the past two years:
|
(millions)
|
2011
|
2010
|
||||||
|
Current assets
|
$ | 176.4 | $ | 160.1 | ||||
|
Current liabilities
|
65.0 | 67.0 | ||||||
|
Working capital
|
$ | 111.4 | $ | 93.1 | ||||
|
Current ratio
|
2.7:1
|
2.4:1
|
||||||
Cash flows provided by operations totaled $31.0 million and $19.8 million in fiscal 2011 and 2010, respectively. The most significant drivers in the increase in cash flows from operations year over year were increased income and the decrease in inventory in the current year. This change was offset in part by a lower increase in accounts payable and accrued liabilities of $10.0 million year over year.
Depreciation and amortization charges were $10.9 million in fiscal 2011 and $10.0 million in fiscal 2010.
Investing Activities
Cash flows used for investing activities were $13.3 million and $9.3 million in fiscal 2011 and 2010, respectively. The purchase of Waypoint Technologies Inc. and Pro Map Technologies Inc., the maker of LakeMaster® brand high definition electronic lake charts used $4.0 million of cash in fiscal 2011. Expenditures for property, plant and equipment were $9.4 million and $10.0 million in fiscal 2011 and 2010, respectively. In general, the Company’s ongoing capital expenditures are primarily related to tooling for new products and facilities and information systems improvements.
18
Financing Activities
The following table sets forth the Company’s debt and capital structure at the end of the past two fiscal years:
|
(millions)
|
2011
|
2010
|
||||||
|
Current debt
|
$ | 3.5 | $ | 8.9 | ||||
|
Long-term debt
|
11.5 | 14.9 | ||||||
|
Total debt
|
15.0 | 23.8 | ||||||
|
Shareholders’ equity
|
163.5 | 126.4 | ||||||
|
Total capitalization
|
$ | 178.5 | $ | 150.2 | ||||
|
Total debt to total capitalization
|
8.4 | % | 15.8 | % | ||||
Cash flows used for financing activities totaled $8.6 million in fiscal 2011 compared to $7.6 million in 2010. Payments on long-term debt were $1.3 million and $0.6 million in fiscal 2011 and 2010, respectively.
The Company had current maturities of its long-term debt of $3.5 million and no outstanding borrowings on its revolving credit facilities as of September 30, 2011. As of October 1, 2010, the Company had $7.5 million outstanding on revolving credit facilities and current maturities of long-term debt of approximately $1.4 million. The Company had outstanding borrowings on long-term debt (net of current maturities) of $11.5 million and $14.9 million as of September 30, 2011 and October 1, 2010, respectively.
The Company’s term loans have maturity dates ranging from 15 to 25 years from the September 29, 2009 effective date of the agreements. Each term loan requires monthly payments of principal and interest. Interest on $8.8 million of the aggregate outstanding amount is based on the prime rate plus 2.0%, and the remainder on the prime rate plus 2.75%. The prime rate was 3.25% at September 30, 2011. The term loans are guaranteed in part under the United States Department of Agriculture Rural Development program and are secured by certain real and tangible properties of the Company’s subsidiaries.
Certain of the term loans covering $8.8 million of the aggregate borrowings are subject to a pre-payment penalty. The penalty is currently 8% of the pre-payment amount, and the penalty will decrease by 1% annually on the anniversary of the effective date of the loan agreement.
On November 16, 2010, the Company and certain of its subsidiaries entered into amendments to their Revolving Credit Agreements (or “Revolvers”). The amended terms of the Revolvers, maturing in November 2014, provide for funding of up to $75 million, with the option for an additional $25 million in maximum seasonal financing availability subject to the approval of the lenders. Borrowing availability under the Revolvers is based on certain eligible working capital assets, primarily accounts receivable and inventory of the Company and its subsidiaries. The Revolvers contain a seasonal line reduction that reduces the maximum amount of borrowings to $50 million from mid-July to mid-November, consistent with the Company's reduced working capital needs throughout that period, and requires an annual seasonal pay down to $30 million for 60 consecutive days. The amendments to the Revolvers reset the interest rate calculation each quarter, beginning with the quarter ended April 1, 2011, by instituting an applicable margin based on the Company’s leverage ratio for the trailing twelve month period.
The applicable margin ranges from 2.25% to 3.0%.
The interest rate on the Revolvers is based on LIBOR or the prime rate, at the Company’s discretion, plus an applicable margin. The interest rate in effect on the Revolvers at September 30, 2011, based primarily on LIBOR plus 2.25%, was approximately 2.5%.
The Company’s remaining borrowing availability under the Revolvers was approximately $31.4 million at September 30, 2011.
Under the terms of the Revolvers, the Company is required to comply with certain financial and non-financial covenants. Among other restrictions, the Company is restricted in its ability to pay dividends, incur additional debt and make acquisitions or divestitures above certain amounts. The key financial covenants include a minimum fixed charge coverage ratio, limits on minimum net worth and EBITDA, a limit on capital expenditures, and a seasonal pay-down requirement.
19
See Note 3 to the Consolidated Financial Statements found elsewhere in this report regarding additional information on the Company’s borrowing arrangements, including certain amendments entered into by the Company and certain of its subsidiaries in connection with the Company’s Revolvers.
As of September 30, 2011, the Company held approximately $40,200 of cash and cash equivalents in bank accounts in foreign taxing jurisdictions.
In response to the increasing volatility of foreign exchange rates, the Company initiated a foreign currency hedging program in the first quarter of fiscal 2011. The Company’s goal was to reduce the economic effects of fluctuating foreign exchange rates on the cost of U.S. dollar denominated purchases by its foreign subsidiaries.
Off Balance Sheet Arrangements
The Company utilizes letters of credit primarily as security for the payment of future claims under its workers compensation insurance. Letters of credit outstanding at September 30, 2011 were $2.1 million compared to $2.6 million on October 1, 2010 and were included in the Company’s total loan availability.
The Company anticipates making contributions to its defined benefit pension plans of $0.9 million through September 29, 2012.
The Company has no other off-balance sheet arrangements.
Impact of Inflation
Certain components used in the Company’s products are exposed to commodity price changes. The Company manages this risk through instruments such as purchase orders and non-cancelable supply contracts. Primary commodity price exposures include costs associated with metals, resins and packaging materials.
The Company anticipates that changing costs of basic raw materials may impact future operating costs and, accordingly, the prices of its products. The Company is involved in continuing programs to mitigate the impact of cost increases through changes in product design and identification of sourcing and manufacturing efficiencies. Price increases and, in certain situations, price decreases are implemented for individual products, when appropriate.
The Company’s results of operations and financial condition are presented based on historical cost. The Company does not believe that inflation has significantly affected its results of operations.
Critical Accounting Policies and Estimates
The Company’s management discussion and analysis of its financial condition and results of operations are based upon the Company’s consolidated financial statements, which have been prepared in accordance with accounting principles generally accepted in the U.S. The preparation of these financial statements requires the Company to make estimates and judgments that affect the reported amounts of its assets, liabilities, sales and expenses, and related footnote disclosures. On an on going basis, the Company evaluates its estimates for product returns, bad debts, inventories, long lived assets and goodwill, income taxes, warranty obligations, pensions and other post-retirement benefits, litigation and other subjective matters impacting the financial statements. The Company bases its estimates on historical experience and on various other assumptions that are believed to be reasonable under the circumstances, the results of which form the basis for making judgments about the carrying values of assets and liabilities that are not readily apparent from other sources. Actual results may differ from these estimates under different assumptions or conditions.
The Company believes the following critical accounting policies affect its more significant judgments and estimates used in the preparation of its consolidated financial statements. Management has discussed these policies with the Audit Committee of the Company’s Board of Directors.
20
Revenue Recognition
The Company recognizes revenue when all of the following criteria have been met:
| ● | Persuasive evidence of an arrangement exists. Contracts, internet commerce agreements, and customer purchase orders are generally used to determine the existence of an arrangement. | |
| ● | All substantial risk of ownership transfers to the customer. Shipping documents and customer acceptance, when applicable, are used to verify delivery. | |
| ● | The fee is fixed or determinable. This is assessed based on the payment terms associated with the transaction and whether the sales price is subject to refund or adjustment. | |
| ● | Collectability is reasonably assured. We assess collectability based on the creditworthiness of the customer as determined by credit checks and analysis, as well as by the customer’s payment history. |
Estimated costs of returns and allowances and discounts are accrued as a reduction to sales when revenue is recognized.
Allowance for Doubtful Accounts
Allowances for doubtful accounts are estimated by the individual operating companies based on estimates of losses related to customer accounts receivable balances. Estimates are developed by using standard quantitative measures based on historical losses, adjusting for current economic conditions and, in some cases, evaluating specific customer accounts for risk of loss. The establishment of reserves requires the use of judgment and assumptions regarding the potential for losses on receivable balances. Though the Company considers these balances adequate and proper, changes in economic conditions in specific markets in which the Company operates and any specific customer collection issues the Company identifies could have a favorable or unfavorable effect on required reserve balances.
Inventories
The Company values inventory at the lower of cost (determined using the first-in first-out method) or market. Management’s judgment is required to determine the reserve for obsolete or excess inventory. Inventory on hand may exceed future demand either because the product is outdated or because the amount on hand is more than will be used to meet future needs. Inventory reserves are estimated by the individual operating companies using standard quantitative measures based on criteria established by the Company. The Company also considers current forecast plans, as well as market and industry conditions in establishing reserve levels. Though the Company considers these balances to be adequate, changes in economic conditions, customer inventory levels or competitive conditions could have a favorable or unfavorable effect on required reserve balances.
Deferred Taxes
The Company records a valuation allowance to reduce its deferred tax assets to the amount that is more likely than not to be realized. While the Company has considered future taxable income and ongoing prudent and feasible tax planning strategies in assessing the need for the valuation allowance, in the event the Company were to determine that it would not be able to realize all or part of its net deferred tax assets in the future, an adjustment to the deferred tax assets would be charged to income in the period such determination was made. Likewise, should the Company determine that it would be able to realize its deferred tax assets in the future in excess of its net recorded amount, an adjustment to the deferred tax assets would increase income in the period such determination was made.
Goodwill and Other Intangible Assets Impairment
Goodwill and indefinite-lived intangible assets are tested for impairment annually or more frequently if events or changes in circumstances indicate that the assets might be impaired. Generally, annual impairment tests are performed by the Company in the fourth quarter of each fiscal year.
21
In assessing the recoverability of the Company's goodwill and other intangible assets, the Company estimates the fair value of the businesses to which the goodwill relates. Fair value is estimated using a discounted cash flow analysis. If the fair value of a reporting unit exceeds its net book value, no impairment exists. When fair value is less than the carrying value of the net assets and related goodwill, an impairment test is performed to measure and recognize the amount of the impairment loss, if any.
The discounted cash flow analysis used to estimate fair value requires a number of key estimates and assumptions. We estimate the future cash flows of the reporting units based on historical and forecasted revenues and operating costs. We apply a discount rate to the estimated future cash flows for purposes of the valuation. This discount rate is based on the estimated weighted average cost of capital, which includes certain assumptions made by management such as market capital structure, market betas, risk-fee rate of return and estimated costs of borrowing. Changes in these key estimates and assumptions, or in other assumptions used in this process, could materially affect our impairment analysis in a given year.
A number of factors, many of which the Company has no ability to control, could affect its financial condition, operating results and business prospects and could cause actual results to differ from the estimates and assumptions that the Company uses in its calculation. These factors include: a prolonged
global economic crisis, a significant decrease in demand for the Company’s products, a significant adverse change in legal factors or in the business climate, an adverse action or assessment by a regulator and successful efforts by the Company’s competitors to gain market share.
Impairment of Long-Lived Assets and Long-Lived Assets to be Disposed of
We evaluate long-lived assets for impairment whenever events or changes in circumstances, such as unplanned negative cash flow indicate that the carrying amount of an asset may not be recoverable. Recoverability of assets to be held and used is measured by a comparison of the carrying amount of an asset to future undiscounted cash flows expected to be generated by the asset. If such assets are determined to be impaired, the impairment to be recognized is measured by the amount by which the carrying amount of the assets exceeds the fair value of the assets. Assets to be disposed of are reported at the lower of the carrying amount or fair value less costs to sell. Application of alternative assumptions, such as changes in estimate of future cash flows, could produce significantly different results. Because of the significance of the judgments and estimation processes, it is likely that materially different amounts could be recorded if we used different assumptions or if the underlying circumstances were to change.
Warranties
The Company accrues a warranty reserve for estimated costs to provide warranty services. Warranty reserves are estimated by the individual operating companies using standard quantitative measures based on criteria established by the Company. Estimates of costs to service its warranty obligations are based on historical experience, expectation of future conditions and known product issues. To the extent the Company experiences increased warranty claim activity or increased costs associated with servicing those claims, revisions to the estimated warranty reserve would be required. The Company engages in product quality programs and processes, including monitoring and evaluating the quality of its suppliers, to help minimize warranty obligations.
New Accounting Pronouncements
In September 2011, the Financial Accounting Standards Board (“FASB”) issued ASU 2011-08, “Testing Goodwill for Impairment” (“ASU 2011-08”). ASU 2011-08 allows a company to first assess qualitative factors to determine whether it is more likely than not that the fair value of a reporting unit is less than its carrying amount as a basis for determining whether it is necessary to perform the two-step goodwill impairment test. The more likely than not threshold is defined as having a likelihood of more than 50 percent. The provisions of ASU 2011-08 are effective for annual and interim goodwill impairment tests performed for fiscal years beginning after December 15, 2011 with early adoption permitted. The adoption of the provisions of ASU 2011-08 is not expected to have a material effect on the consolidated financial position, results of operations or cash flows of the Company.
In June 2011, the FASB issued ASU 2011-05, “Presentation of Comprehensive Income” (“ASU 2011-05”). ASU 2011-05 requires companies to present the total of comprehensive income, the components of net income and the components of other comprehensive income either in a single continuous statement of comprehensive income or in two separate but consecutive statements. The provisions of ASU 2011-05 are effective for fiscal years, and interim periods within those years, beginning after December 15, 2011. Since ASU 2011-05 only amends the disclosure requirements concerning comprehensive income, the adoption of ASU 2011-05 will not affect the consolidated financial position, results of operations or cash flows of the Company.
22
Not applicable.
Information with respect to this item is included in the Company’s consolidated financial statements attached to this report on pages F-1 to F-33.
On March 2, 2010, the Company engaged McGladrey & Pullen, LLP to replace Ernst & Yong LLP as its independent registered public accounting firm. Information regarding the change in the independent registered public accounting firm was disclosed in the Company’s Current Report on Form 8-K dated March 2, 2010. There were no disagreements or reportable events requiring disclosure under Item 304(b) of regulation S-K.
a) Evaluation of Disclosure Controls and Procedures
The Company maintains disclosure controls and procedures (as defined in Rules 13a-15(e) and 15d-15(e) under the Securities Exchange Act of 1934) designed to ensure that information required to be disclosed by the Company in the reports that it files or submits under the Securities Exchange Act of 1934 is recorded, processed, summarized and reported within the time periods specified in the Securities and Exchange Commission’s rules and forms, and that the information required to be disclosed by the Company in reports that it files or submits under the Securities Exchange Act of 1934 is accumulated and communicated to its management, including its Chief Executive Officer and Chief Financial Officer, as appropriate to allow timely decisions regarding required disclosure. The Company carried out an evaluation as of September 30, 2011, under the supervision and with the participation of the Company’s management, including its Chief Executive Officer and Chief Financial Officer, of the effectiveness of the design and operation of the Company’s disclosure controls and procedures. Based on such evaluation, the Company’s Chief Executive Officer and Chief Financial Officer concluded that the Company’s disclosure controls and procedures were effective as of September 30, 2011 at reaching a level of reasonable assurance. In designing and evaluating the disclosure controls and procedures, management recognized that any controls and procedures, no matter how well designed and operated, can provide only reasonable assurance of achieving the desired control objectives, and management necessarily was required to apply its judgment in evaluating the cost-benefit relationship of possible controls and procedures. The Company has designed its disclosure controls and procedures to reach a level of reasonable assurance of achieving the desired control objectives.
The report of management required under this Item 9A is included on page F-1 of the Company’s Consolidated Financial Statements attached to this Report under the heading “Management’s Report on Internal Control over Financial Reporting” and is incorporated herein by reference.
b) Changes in Internal Control over Financial Reporting.
There was no change in the Company’s internal control over financial reporting (as defined in Rules 13a-15(f) and 15d-15(f) under the Securities Exchange Act of 1934, as amended) that occurred during the Company’s most recently completed fiscal quarter that has materially affected, or is reasonably likely to materially affect, the Company’s internal control over financial reporting.
23
c) Attestation Report of Independent Registered Public Accounting Firm
This Annual Report on Form 10-K does not include an attestation report of the Company's registered public accounting firm regarding internal control over financial reporting. Management's report was not subject to attestation by the Company's registered public accounting firms pursuant to rules of the Securities and Exchange Commission that permit the Company to provide only management's report in this Annual Report on Form 10-K.
None.
Information with respect to this item is incorporated herein by reference to the discussion under the headings “Election of Directors,” “Executive Officers,” “Section 16(a) Beneficial Ownership Reporting Compliance,” “Corporate Governance-Director Nominations” and “Audit Committee Matters – Audit Committee Financial Expert” in the Company's Proxy Statement for the 2012 Annual Meeting of Shareholders, which will be filed with the Securities and Exchange Commission on or before January 28, 2012. Information regarding the Company’s Code of Business Ethics is incorporated herein by reference to the discussion under “Corporate Governance Matters – Employee Code of Conduct and Code of Ethics and Procedures for Reporting of Accounting Concerns” in the Company's Proxy Statement for the 2012 Annual Meeting of Shareholders.
The Audit Committee of the Company's Board of Directors is an “audit committee” for purposes of Section 3(a)(58)(A) of the Securities Exchange Act of 1934. The members of the Audit Committee are Terry E. London (Chairman), Thomas F. Pyle, Jr. and Edward F. Lang, III.
Information with respect to this item is incorporated herein by reference to the discussion under the headings “Compensation of Directors” and “Executive Compensation” in the Company’s Proxy Statement for the 2012 Annual Meeting of Shareholders, which will be filed with the Securities and Exchange Commission on or before January 28, 2012.
MATTERS
Information with respect to this item is incorporated herein by reference to the discussion under the heading “Stock Ownership of Management and Others” in the Company's Proxy Statement for the 2012 Annual Meeting of Shareholders, which will be filed with the Securities and Exchange Commission on or before January 28, 2012.
24
Equity Compensation Plan Information
The following table summarizes share information, as of September 30, 2011, for the Company’s equity compensation plans, including the Johnson Outdoors Inc. 2003 Non-Employee Director Stock Ownership Plan and the Johnson Outdoors Inc. 2000 Long-Term Stock Incentive Plan and the Johnson Outdoors Inc. 2010 Long-Term Stock Incentive Plan and the Johnson Outdoors Inc. 2009 Employee Stock Purchase Plan. All of these plans have been approved by the Company’s shareholders.
|
Plan Category
|
Number of
Common Shares
to Be Issued Upon
Exercise of
Outstanding
Options, Warrants
and Rights
|
Weighted-average
Exercise Price of
Outstanding
Options, Warrants
a
nd Rights
|
Number of
Common Shares
Available for Future
Issuance Under
Equity
Compensation
Plans
|
|||||||||
|
Equity compensation plans approved by shareholders
|
68,590 | $ | 10.37 | 974,138 | (1) | |||||||
|
(1)
|
All of the available shares under the 2003 Non-Employee Director Stock Ownership Plan (62,116) and under the 2010 Long-Term Stock Incentive Plan (847,945) may be issued upon the exercise of stock options or granted as non-vested stock, and, in the case of the 2010 Long-Term Stock Incentive Plan, as share units. No shares are available for future issuance under the 2000 Long-Term Stock Incentive Plan. Also, includes 64,077 shares available for issuance under the 2009 Employee Stock Purchase Plan.
|
|
(2)
|
Non-vested restricted shares outstanding totaled 472,761 at September 30, 2011.
|
Information with respect to this item is incorporated herein by reference to the discussion under the heading “Certain Relationships and Related Transactions” in the Company's Proxy Statement for the 2012 Annual Meeting of Shareholders,
which will be filed with the Securities and Exchange Commission on or before January 28, 2012. Information regarding director independence is incorporated by reference to the discussions under “Corporate Governance Matters-Director Independence” in the Company’s Proxy Statement for the 2012 Annual Meeting of Shareholders, which will be filed with the Securities and Exchange Commission on or before January 28, 2012.
Information with respect to this item is incorporated herein by reference to the discussion under the heading “Audit Committee Matters – Fees of Independent Registered Public Accounting Firm” in the Company's Proxy Statement for the 2012 Annual Meeting of Shareholders, which will be filed with the Securities and Exchange Commission on or before January 28, 2012.
The following documents are filed as a part of this report:
Financial Statements
Included in Item 8 of Part II of this report are the following:
| ● | Report of Independent Registered Public Accounting Firm | |
| ● | Consolidated Balance Sheets – September 30, 2011 and October 1, 2010 | |
| ● | Consolidated Statements of Operations – Years ended September 30, 2011 and October 1, 2010 | |
| ● | Consolidated Statements of Shareholders’ Equity – Years ended September 30, 2011 and October 1, 2010 | |
| ● | Consolidated Statements of Cash Flows – Years ended September 30, 2011 and October 1, 2010 | |
| ● | Notes to Consolidated Financial Statements |
Exhibits
See Exhibit Index.
25
SIGNATURES
Pursuant to the requirements of Section 13 or 15(d) of the Securities Exchange Act of 1934, the registrant has duly caused this report to be signed on its behalf by the undersigned, thereunto duly authorized, in the City of Racine and State of Wisconsin, on the
16
th day of December 2011.
JOHNSON OUTDOORS INC.
(Registrant)
By:
/s/ Helen P. Johnson-Leipold
Helen P. Johnson-Leipold
Chairman and Chief Executive Officer
26
Pursuant to the requirements of the Securities Exchange Act of 1934, this report has been signed by the following persons on behalf of the registrant and in the capacities indicated on the
16
th day of December 2011.
| /s/ Helen P. Johnson-Leipold |
Chairman and Chief Executive Officer
|
|
|
(Helen P. Johnson-Leipold)
|
and Director
|
|
|
(Principal Executive Officer)
|
||
| /s/ Thomas F. Pye, Jr. |
Vice Chairman of the Board
|
|
|
(Thomas F. Pyle, Jr.)
|
and Lead Outside Director
|
|
| /s/ Terry E. London |
Director
|
|
|
(Terry E. London)
|
||
| /s/ John M. Fahey, Jr. |
Director
|
|
|
(John M. Fahey, Jr.)
|
||
| /s/ W. Lee McCollum |
Director
|
|
|
(W. Lee McCollum)
|
||
| /s/ Edward F. Lang, III |
Director
|
|
|
(Edward F. Lang, III)
|
||
| /s/ David W. Johnson |
Vice President and Chief Financial Officer
|
|
|
(David W. Johnson)
|
(Principal Financial and Accounting Officer)
|
27
EXHIBIT INDEX
|
Exhibit
|
Title
|
|
2
|
Agreement and Plan of Merger, dated October 28, 2004, by and between JO Acquisition Corp. and Johnson Outdoors Inc (Filed as Exhibit 2 to the Company’s Form 8-K dated October 28, 2004 and incorporated herein by reference.)
|
|
3.1
|
Articles of Incorporation of the Company as amended through February 17, 2000. (Filed as Exhibit 3.1(a) to the Company’s Form 10-Q for the quarter ended March 31, 2000 and incorporated herein by reference.)
|
|
3.2
|
Bylaws of the Company as amended and restated through December 6, 2010. (Filed as Exhibit 3.2 to the Company’s Form 10-K for the year ended October 1, 2010 and incorporated herein by reference.)
|
|
4.1
|
Note Agreement dated October 1, 1995. (Filed as Exhibit 4.1 to the Company’s Form 10-Q for the quarter ended December 29, 1995 and incorporated herein by reference.)
|
|
4.2
|
First Amendment dated October 11, 1996 to Note Agreement dated October 1, 1995. (Filed as Exhibit 4.3 to the Company’s Form 10-Q for the quarter ended December 27, 1996 and incorporated herein by reference.)
|
|
4.3
|
Second Amendment dated September 30, 1997 to Note Agreement dated October 1, 1995. (Filed as Exhibit 4.8 to the Company’s Form 10-K for the year ended October 1, 1997 and incorporated herein by reference.)
|
|
4.4
|
Third Amendment dated October 1, 1997 to Note Agreement dated October 1, 1995. (Filed as Exhibit 4.9 to the Company’s Form 10-K for the year ended October 1, 1997 and incorporated herein by reference.)
|
|
4.5
|
Fourth Amendment dated January 10, 2000 to Note Agreement dated October 1, 1995. (Filed as Exhibit 4.9 to the Company’s Form 10-Q for the quarter ended March 31, 2000 and incorporated herein by reference.)
|
|
4.7
|
Consent and Amendment dated September 6, 2002 to Note Agreement dated October 1, 1995. (Filed as Exhibit 4.7 to the Company’s Form 10-K for the year ended October 3, 2003 and incorporated herein by reference.)
|
|
4.8
|
Note Agreement dated as of September 15, 1997. (Filed as Exhibit 4.15 to the Company’s Form 10-K for the year ended October 1, 1997 and incorporated herein by reference.)
|
|
4.9
|
First Amendment dated January 10, 2000 to Note Agreement dated September 15, 1997. (Filed as Exhibit 4.10 to the Company’s Form 10-Q for the quarter ended March 31, 2000 and incorporated herein by reference.)
|
|
4.10
|
Second Amendment dated December 13, 2001 to Note Agreement dated September 15, 1997. (Filed as Exhibit 4.9 to the Company’s Form 10-K for the year ended October 3, 2003 and incorporated herein by reference.)
|
|
4.11
|
Consent and Amendment dated as of September 6, 2002 to Note Agreement dated September 15, 1997. (Filed as Exhibit 4.11 to the Company’s Form 10-K for the year ended October 3, 2003 and incorporated herein by reference.)
|
|
4.12
|
Note Agreement dated as of December 13, 2001. (Filed as Exhibit 4.12 to the Company’s Form 10-K for the year ended October 3, 2003 and incorporated herein by reference.)
|
|
4.13
|
Consent and Amendment dated as of September 6, 2002 to Note Agreement dated as of December 13, 2001. (Filed as Exhibit 4.15 to the Company’s Form 10-K for the year ended October 3, 2003 and incorporated herein by reference.)
|
|
9.1
|
Johnson Outdoors Inc. Class B common stock Amended and Restated Voting Trust Agreement, dated as of February 16, 2010 (Filed as Exhibit 1 to Amendment No. 13 to the Schedule 13D filed by Helen P. Johnson-Leipold on February 3, 2011 and incorporated herein by reference.)
|
28
|
10.1
|
Stock Purchase Agreement, dated as of January 12, 2000, by and between Johnson Outdoors Inc. and Berkley Inc. (Filed as Exhibit 2.1 to the Company’s Form 8-K dated March 31, 2000 and incorporated herein by reference.)
|
|
10.2
|
Amendment to Stock Purchase Agreement, dated as of February 28, 2000, by and between Johnson Outdoors Inc. and Berkley Inc. (Filed as Exhibit 2.2 to the Company’s Form 8-K dated March 31, 2000 and incorporated herein by reference.)
|
|
10.3
+
|
Johnson Outdoors Inc. Amended and Restated 1986 Stock Option Plan. (Filed as Exhibit 10 to the Company’s Form 10-Q for the quarter ended July 2, 1993 and incorporated herein by reference.)
|
|
10.4
|
Registration Rights Agreement regarding Johnson Outdoors Inc. common stock issued to the Johnson family prior to the acquisition of Johnson Diversified, Inc. (Filed as Exhibit 10.6 to the Company’s Form S-1 Registration Statement No. 33-16998 and incorporated herein by reference.)
|
|
10.5
|
Registration Rights Agreement regarding Johnson Outdoors Inc. Class A common stock held by Mr. Samuel C. Johnson. (Filed as Exhibit 28 to the Company’s Form 10-Q for the quarter ended March 29, 1991 and incorporated herein by reference.)
|
|
10.6
+
|
Form of Restricted Stock Agreement. (Filed as Exhibit 10.8 to the Company’s Form S-1 Registration Statement No. 33-23299 and incorporated herein by reference.)
|
|
10.7
+
|
Form of Supplemental Retirement Agreement of Johnson Diversified, Inc. (Filed as Exhibit 10.9 to the Company’s Form S-1 Registration Statement No. 33-16998 and incorporated herein by reference.)
|
|
10.8
+
|
Johnson Outdoors Retirement and Savings Plan. (Filed as Exhibit 10.9 to the Company’s Form 10-K for the year ended September 29, 1989 and incorporated herein by reference.)
|
|
10.9
+
|
Form of Agreement of Indemnity and Exoneration with Directors and Officers. (Filed as Exhibit 10.11 to the Company’s Form S-1 Registration Statement No. 33-16998 and incorporated herein by reference.)
|
|
10.10
|
Consulting and administrative agreements with S. C. Johnson & Son, Inc. (Filed as Exhibit 10.12 to the Company’s Form S-1 Registration Statement No. 33-16998 and incorporated herein by reference.)
|
|
10.11
+
|
Johnson Outdoors Inc. 1994 Long-Term Stock Incentive Plan. (Filed as Exhibit 4 to the Company’s Form S-8 Registration Statement No. 333-88091 and incorporated herein by reference.)
|
|
10.12
+
|
Johnson Outdoors Inc. 1994 Non-Employee Director Stock Ownership Plan. (Filed as Exhibit 4 to the Company’s Form S-8 Registration Statement No. 333-88089 and incorporated herein by reference.)
|
|
10.13
+
|
Johnson Outdoors Economic Value Added Bonus Plan (Filed as Exhibit 10.15 to the Company’s Form 10-K for the year ended October 1, 1997 and incorporated herein by reference.)
|
|
10.14
+
|
Johnson Outdoors Inc. 2000 Long-Term Stock Incentive Plan. (Filed as Exhibit 99.1 to the Company’s Current Report on Form 8-K dated July 29, 2005 and incorporated herein by reference.)
|
|
10.15
+
|
Share Purchase and Transfer Agreement, dated as of August 28, 2002, by and between, among others, Johnson Outdoors Inc. and an affiliate of Bain Capital Fund VII-E (UK), Limited Partnership. (Filed as Exhibit 2.1 to the Company’s Form 8-K dated September 9, 2002 and incorporated herein by reference.)
|
|
10.16
+
|
Johnson Outdoors Inc. Worldwide Key Executive Phantom Share Long-Term Incentive Plan (Filed as Exhibit 10.1 to the Company’s Form 10-Q dated March 28, 2003 and incorporated herein by reference.)
|
|
10.17
+
|
Johnson Outdoors Inc. Worldwide Key Executives’ Discretionary Bonus Plan. (Filed as Exhibit 99.3 to the Company’s Current Report on Form 8-K dated July 29, 2005 and incorporated herein by reference.)
|
29
|
10.18
|
Stock Purchase Agreement by and between Johnson Outdoors Inc. and TFX Equities Incorporated. (Filed as Exhibit 2.1 to the Company’s Form 10-Q dated April 2, 2004 and incorporated herein by reference.)
|
|
10.19
|
Intellectual Property Purchase Agreement by and among Johnson Outdoors Inc., Technology Holding Company II and Teleflex Incorporated. (Filed as Exhibit 2.2 to the Company’s Form 10-Q dated April 2, 2004 and incorporated herein by reference.)
|
|
10.20
+
|
Johnson Outdoors Inc. 1987 Employees’ Stock Purchase Plan as amended. (Filed as Exhibit 99.2 to the Company’s Current Report on Form 8-K dated July 29, 2005 and incorporated herein by reference.)
|
|
10.21
+
|
Johnson Outdoors Inc. 2003 Non-Employee Director Stock Ownership Plan. (Filed as Exhibit 10.2 to the Company’s Form 10-Q dated April 2, 2004 and incorporated herein by reference.)
|
|
10.22
+
|
Form of Restricted Stock Agreement under Johnson Outdoors Inc. 2003 Non-Employee Director Stock Ownership Plan. (Filed as Exhibit 4.2 to the Company’s Form S-8 Registration Statement No. 333-115298 and incorporated herein by reference.)
|
|
10.23
+
|
Form of Stock Option Agreement under Johnson Outdoors Inc. 2003 Non-Employee Director Stock Ownership Plan. (Filed as Exhibit 10.2 to the Company’s Form S-8 Registration Statement No. 333-115298 and incorporated herein by reference.)
|
|
10.24
|
Revolving Credit and Security Agreement dated as of September 29, 2009 among Johnson Outdoors Inc., certain subsidiaries of Johnson Outdoors Inc., PNC Bank, National Association, as lender, as administrative agent and collateral agent, and the other lenders named therein (filed as Exhibit 99.2 to the current report on Form 8-K dated and filed with the Securities and Exchange Commission on September 30, 2009).
|
|
10.25
|
Term Loan Agreement (loan number 15613) dated as of September 29, 2009 among Techsonic Industries Inc., Johnson Outdoors Marine Electronics LLC and Ridgestone Bank (filed as Exhibit 99.3 to the current report on Form 8-K dated and filed with the Securities and Exchange Commission on September 30, 2009).
|
|
10.26
|
Term Loan Agreement (loan number 15612) dated as of September 29, 2009 between Johnson Outdoors Gear LLC and Ridgestone Bank (filed as Exhibit 99.4 to the current report on Form 8-K dated and filed with the Securities and Exchange Commission on September 30, 2009).
|
|
10.27
|
Term Loan Agreement (loan number 15628) dated as of September 29, 2009 between Johnson Outdoors Watercraft Inc. and Ridgestone Bank (filed as Exhibit 99.5 to the current report on Form 8-K dated and filed with the Securities and Exchange Commission on September 30, 2009).
|
|
10.28
|
Term Loan Agreement (loan number 15614) dated as of September 29, 2009 between Johnson Outdoors Watercraft Inc. and Ridgestone Bank (filed as Exhibit 99.6 to the current report on Form 8-K dated and filed with the Securities and Exchange Commission on September 30, 2009).
|
|
10.29
|
Term Loan Agreement (loan number 15627) dated as of September 29, 2009 between Johnson Outdoors Watercraft Inc. and Ridgestone Bank (filed as Exhibit 99.7 to the current report on Form 8-K dated and filed with the Securities and Exchange Commission on September 30, 2009).
|
|
10.30
|
Revolving Credit and Security Agreement dated as of November 4, 2009 among Johnson Outdoors Canada Inc., National City Bank, Canada branch, as administrative agent and collateral agent and the other lenders named therein(filed as Exhibit 10.30 to the annual report on Form 10-K dated and filed with the Securities and Exchange Commission on December 11, 2010).
|
|
10.31
|
First Amendment to Revolving Credit and Security Agreement, made as of November 16, 2010, among Johnson Outdoors Inc., certain subsidiaries of Johnson Outdoors, Inc., PNC Bank National Association as lender, as administrative agent and collateral agent, and the other lenders named therein (filed as Exhibit 99.1 to the current report on Form 8-K dated and filed with the Securities and Exchange Commission on November 22, 2010).
|
30
|
10.32
|
First Amendment to Canadian Revolving Credit and Security Agreement, made as of November 16, 2010, among Johnson Outdoors Canada Inc., PNC Bank Canada Branch as lender, as administrative agent and collateral agent, and the other lenders named therein (filed as Exhibit 99.2 to the current report on Form 8-K dated and filed with the Securities and Exchange Commission on November 22, 2010).
|
|
10.33+
|
Johnson Outdoors Inc. 2009 Employees’ Stock Purchase Plan (filed as Exhibit 99.2 to the current report on Form 8-K dated and filed with the Securities and Exchange Commission on March 8, 2010.
|
|
10.34+
|
Johnson Outdoors Inc. 2010 Long Term Stock Incentive Plan (filed as Exhibit 99.2 to the current report on Form 8-K dated and filed with the Securities and Exchange Commission on March 8, 2010.
|
|
16
|
Letter Regarding Change in Auditors (filed as Exhibit 16.1 to the current report on Form 8-K dated and filed with the Securities and Exchange Commission on March 8, 2010).
|
|
21
|
Subsidiaries of the Company as of September 30, 2011.
|
|
23
|
Consent of Independent Registered Public Accounting Firm.
|
|
31.1
|
Certification of Chief Executive Officer pursuant to Rule 13a-14(a) or 15d-14(a).
|
|
31.2
|
Certification of Chief Financial Officer pursuant to Rule 13a-14(a) or 15d-14(a).
|
|
32.1
|
Certifications of Chief Executive Officer and Chief Financial Officer pursuant to 18 U.S.C. Section 1350.
(1)
|
| 101 |
The following materials from Johnson Outdoors Inc.’s Annual Report on Form 10-K for the fiscal year ended September 30, 2011 formatted in XBRL (eXtensible Business Reporting Language) and furnished electronically herewith: (i) Consolidated Balance Sheets; (ii) Consolidated Statements of Operations; (iii) Consolidated Statements of Shareholders' Equity; (iv) Consolidated Statements of Cash Flows; and (v) Notes to Consolidated Financial Statements*
|
______________________________________________________
+ A management contract or compensatory plan or arrangement.
*
Pursuant to Rule 406T of Regulation S-T, the Interactive Data Files in Exhibit 101 hereto are deemed not filed or part of a registration statement or prospectus for purposes of Sections 11 or 12 of the Securities Act of 1933, as amended, are deemed not filed for purposes of Section 18 of the Securities and Exchange Act of 1934, as amended, and otherwise are not subject to liability under those sections.
|
(1)
|
This certification is not “filed” for purposes of Section 18 of the Securities Exchange Act of 1934, as amended, or incorporated by reference into any filing under the Securities Act of 1933, as amended, or the Securities Exchange Act of 1934, as amended.
|
31
|
CONSOLIDATED FINANCIAL STATEMENTS
|
||
|
Table of Contents
|
Page
|
|
|
Management’s Report on Internal Control over Financial Reporting
|
F-2
|
|
|
Report of Independent Registered Public Accounting Firm
|
F-3
|
|
|
Consolidated Balance Sheets
|
F-4
|
|
|
Consolidated Statements of Operations
|
F-5
|
|
|
Consolidated Statements of Shareholders’ Equity
|
F-6
|
|
|
Consolidated Statements of Cash Flows
|
F-7
|
|
|
Notes to Consolidated Financial Statements
|
F-8
|
|
F-1
MANAGEMENT’S REPORT ON INTERNAL CONTROL OVER FINANCIAL REPORTING
The management of Johnson Outdoors Inc. is responsible for establishing and maintaining adequate internal control over financial reporting, as such term is defined in Rule 13a-15(f) of the Securities Exchange Act of 1934. The Company’s internal control over financial reporting is designed to provide reasonable assurance to the Company’s management and board of directors regarding the preparation and fair presentation of published financial statements. The Company’s internal control over financial reporting includes those policies and procedures that:
|
(a)
|
pertain to the maintenance of records that, in reasonable detail, accurately and fairly reflect the transactions and dispositions of the assets of the Company;
|
|
(b)
|
provide reasonable assurance that transactions are recorded as necessary to permit preparation of financial statements in accordance with generally accepted accounting principles, and that receipts and expenditures of the Company are being made only in accordance with authorizations of management and directors of the Company; and
|
|
(c)
|
provide reasonable assurance regarding prevention or timely detection of unauthorized acquisition, use or disposition of the Company’s assets that could have a material effect on the financial statements.
|
Because of its inherent limitations, internal control over financial reporting may not prevent or detect misstatements. Therefore, even those systems determined to be effective can provide only reasonable assurance with respect to financial statement preparation and presentation. Also, projections of any evaluation of effectiveness to future periods are subject to the risk that controls may become inadequate because of changes in conditions, or that the degree of compliance with the policies or procedures may deteriorate.
Management assessed the effectiveness of the Company’s internal control over financial reporting as of September 30, 2011. In making this assessment, management used the criteria set forth by the Committee of Sponsoring Organizations of the Treadway Commission (COSO) in
Internal Control-Integrated Framework
. Based on our assessment, management believes that, as of September 30, 2011, the Company’s internal control over financial reporting was effective based on those criteria.
| /s/ Helen P. Johnson-Leipold | /s/ David W. Johnson |
|
Helen P. Johnson-Leipold
|
David W. Johnson
|
|
Chairman and Chief Executive Officer
|
Vice President and Chief Financial Officer
|
F-2
Report of Independent Registered Public Accounting Firm
To the Board of Directors and Shareholders
Johnson Outdoors Inc.
We have audited the accompanying consolidated balance sheets of Johnson Outdoors Inc. and subsidiaries as of September 30, 2011 and October 1, 2010, and the related consolidated statements of operations, shareholders' equity, and cash flows for the years then ended. These financial statements are the responsibility of the Company's management. Our responsibility is to express an opinion on these financial statements based on our audits.
We conducted our audits in accordance with the standards of the Public Company Accounting Oversight Board (United States). Those standards require that we plan and perform the audit to obtain reasonable assurance about whether the financial statements are free of material misstatement. The Company is not required to have, nor were we engaged to perform, an audit of its internal control over financial reporting. Our audits included consideration of internal control over financial reporting as a basis for designing audit procedures that are appropriate in the circumstances, but not for the purpose of expressing an opinion on the effectiveness of the Company’s internal control over financial reporting. Accordingly, we express no such opinion. An audit also includes examining, on a test basis, evidence supporting the amounts and disclosures in the financial statements, assessing the accounting principles used and significant estimates made by management, as well as evaluating the overall financial statement presentation. We believe that our audits provide a reasonable basis for our opinion.
In our opinion, the consolidated financial statements referred to above present fairly, in all material respects, the financial position of Johnson Outdoors Inc. and subsidiaries as of September 30, 2011 and October 1, 2010, and the results of their operations and their cash flows for the years then ended, in conformity with U.S. generally accepted accounting principles.
/s/ McGladrey & Pullen, LLP
Milwaukee, Wisconsin
December 16, 2011
F-3
CONSOLIDATED BALANCE SHEETS
|
September 30
|
October 1
|
|||||||
|
(thousands, except share data)
|
2011
|
2010
|
||||||
|
ASSETS
|
||||||||
|
Current assets:
|
||||||||
|
Cash and cash equivalents
|
$ | 44,514 | $ | 33,316 | ||||
|
Accounts receivable, less allowance for doubtful accounts of $3,076 and $2,988, respectively
|
47,209 | 46,928 | ||||||
|
Inventories
|
68,462 | 72,095 | ||||||
|
Deferred income taxes
|
9,732 | 1,844 | ||||||
|
Other current assets
|
6,528 | 5,945 | ||||||
|
Total current assets
|
176,445 | 160,128 | ||||||
|
Property, plant and equipment, net
|
35,158 | 33,767 | ||||||
|
Deferred income taxes
|
19,531 | 3,320 | ||||||
|
Goodwill
|
14,651 | 13,729 | ||||||
|
Other intangible assets, net
|
5,403 | 5,720 | ||||||
|
Other assets
|
8,168 | 10,092 | ||||||
|
Total assets
|
$ | 259,356 | $ | 226,756 | ||||
|
LIABILITIES AND SHAREHOLDERS' EQUITY
|
||||||||
|
Current liabilities:
|
||||||||
|
Short-term notes payable and revolving credit lines
|
$ | - | $ | 7,544 | ||||
|
Current maturities of long-term debt
|
3,494 | 1,327 | ||||||
|
Accounts payable
|
28,339 | 24,103 | ||||||
|
Accrued liabilities:
|
||||||||
|
Salaries, wages and benefits
|
14,286 | 14,481 | ||||||
|
Accrued warranty
|
5,155 | 4,589 | ||||||
|
Income taxes payable
|
1,635 | 1,062 | ||||||
|
Other accrued liabilities
|
12,091 | 13,909 | ||||||
|
Total current liabilities
|
65,000 | 67,015 | ||||||
|
Long-term debt, less current maturities
|
11,478 | 14,939 | ||||||
|
Deferred income taxes
|
348 | 601 | ||||||
|
Retirement benefits
|
10,074 | 8,522 | ||||||
|
Other liabilities
|
8,931 | 9,310 | ||||||
|
Total liabilities
|
95,831 | 100,387 | ||||||
|
Shareholders' equity:
|
||||||||
|
Preferred stock: none issued
|
- | - | ||||||
|
Common stock:
|
||||||||
|
Class A shares issued and outstanding:
|
428 | 418 | ||||||
|
September 30, 2011: 8,567,549
|
||||||||
|
October 1, 2010: 8,363,313
|
||||||||
|
Class B shares issued and outstanding:
|
61 | 61 | ||||||
|
September 30, 2011: 1,215,842
|
||||||||
|
October 1, 2010: 1,216,464
|
||||||||
|
Capital in excess of par value
|
61,521 | 59,779 | ||||||
|
Retained earnings
|
82,683 | 50,039 | ||||||
|
Accumulated other comprehensive income
|
18,832 | 16,073 | ||||||
|
Treasury stock at cost, 0 and 172 shares of Class A
common stock, respectively
|
- | (1 | ) | |||||
|
Total shareholders' equity
|
163,525 | 126,369 | ||||||
|
Total liabilities and shareholders' equity
|
$ | 259,356 | $ | 226,756 | ||||
The accompanying notes are an integral part of the Consolidated Financial Statements.
F-4
CONSOLIDATED STATEMENTS OF OPERATIONS
|
Year Ended
|
||||||||
|
(thousands, except per share data)
|
September 30
2011
|
October 1
2010
|
||||||
|
Net sales
|
$ | 407,422 | $ | 382,432 | ||||
|
Cost of sales
|
244,287 | 228,909 | ||||||
|
Gross profit
|
163,135 | 153,523 | ||||||
|
Operating expenses:
|
||||||||
|
Marketing and selling
|
90,336 | 86,677 | ||||||
|
Administrative management, finance and information
systems
|
40,310 | 38,842 | ||||||
|
Research and development
|
14,819 | 13,450 | ||||||
|
Total operating expenses
|
145,465 | 138,969 | ||||||
|
Operating profit
|
17,670 | 14,554 | ||||||
|
Interest income
|
(90 | ) | (62 | ) | ||||
|
Interest expense
|
3,220 | 5,057 | ||||||
|
Other expense, net
|
2,290 | 367 | ||||||
|
Income before income taxes
|
12,250 | 9,192 | ||||||
|
Income tax (benefit) expense
|
(20,394 | ) | 2,653 | |||||
|
Net income
|
$ | 32,644 | $ | 6,539 | ||||
|
Weighted average common shares – Basic:
|
||||||||
|
Class A
|
8,045 | 8,008 | ||||||
|
Class B
|
1,216 | 1,217 | ||||||
|
Dilutive stock options
|
26 | 42 | ||||||
|
Weighted average common shares – Dilutive
|
9,287 | 9,267 | ||||||
|
Net income per common share – Basic:
|
||||||||
|
Class A
|
$ | 3.40 | $ | 0.69 | ||||
|
Class B
|
$ | 3.07 | $ | 0.63 | ||||
|
Net income per common Class A and B share – Dilutive
|
$ | 3.36 | $ | 0.68 | ||||
The accompanying notes are an integral part of the Consolidated Financial Statements.
F-5
CONSOLIDATED STATEMENTS OF SHAREHOLDERS’ EQUITY
|
(thousands)
|
Shares
|
Common
Stock
|
Capital in
Excess of
Par Value
|
Retained
Earnings
|
Treasury
Stock
|
Accumulated
Other
Comprehensive Income (Loss)
|
Comprehensive Income (Loss)
|
|||||||||||||||||||||
|
BALANCE AT OCTOBER 2, 2009
|
9,283,429 | $ | 465 | $ | 58,343 | $ | 43,500 | $ | (43 | ) | $ | 13,560 | - | |||||||||||||||
|
Net income
|
- | - | 6,539 | - | - | $ | 6,539 | |||||||||||||||||||||
|
Exercise of stock options
|
55,250 | 2 | 373 | - | - | - | - | |||||||||||||||||||||
|
Issuance of stock under employee stock
purchase plan
|
10,448 | - | 109 | - | - | - | - | |||||||||||||||||||||
|
Award of non-vested shares
|
230,650 | 12 | - | - | - | - | - | |||||||||||||||||||||
|
Stock-based compensation
|
- | - | 944 | - | - | - | - | |||||||||||||||||||||
|
Currency translation adjustment
|
- | - | - | - | - | 965 | 965 | |||||||||||||||||||||
|
Change in pension plans
|
- | - | - | - | - | (497 | ) | (497 | ) | |||||||||||||||||||
|
Reissue of treasury stock
|
- | - | 10 | - | 42 | - | - | |||||||||||||||||||||
|
Amoritzation of unrealized loss
on interest rate swaps
|
- | - | - | - | - | 2,045 | 2,045 | |||||||||||||||||||||
|
Comprehensive income
|
- | - | - | - | - | - | $ | 9,052 | ||||||||||||||||||||
|
BALANCE AT OCTOBER 1, 2010
|
9,579,777 | 479 | 59,779 | 50,039 | (1 | ) | 16,073 | - | ||||||||||||||||||||
|
Net income
|
- | - | - | 32,644 | - | - | $ | 32,644 | ||||||||||||||||||||
|
Exercise of stock options
|
40,780 | 2 | 218 | - | - | - | ||||||||||||||||||||||
|
Issuance of stock under employee stock
purchase plan
|
5,475 | - | 88 | - | - | - | ||||||||||||||||||||||
|
Award of non-vested shares
|
157,359 | 8 | - | - | - | - | ||||||||||||||||||||||
|
Stock-based compensation
|
- | - | 1,436 | - | - | - | ||||||||||||||||||||||
|
Currency translation adjustment
|
- | - | - | - | - | 2,506 | 2,506 | |||||||||||||||||||||
|
Change in pension plans, net of tax
|
- | - | - | - | - | (737 | ) | (737 | ) | |||||||||||||||||||
|
Reissue of treasury stock
|
- | - | - | - | 1 | - | ||||||||||||||||||||||
|
Amoritzation of unrealized loss on interest
rate swaps
|
- | - | - | - | - | 990 | 990 | |||||||||||||||||||||
|
Comprehensive income
|
- | - | - | - | - | - | $ | 35,403 | ||||||||||||||||||||
|
BALANCE AT SEPTEMBER 30, 2011
|
9,783,391 | $ | 489 | $ | 61,521 | $ | 82,683 | $ | - | $ | 18,832 | |||||||||||||||||
The accompanying notes are an integral part of the Consolidated Financial Statements.
F-6
CONSOLIDATED STATEMENTS OF CASH FLOWS
|
Year Ended
|
||||||||
|
(thousands)
|
September 30
2011
|
October 1
2010
|
||||||
|
CASH PROVIDED BY OPERATING ACTIVITIES
|
||||||||
|
Net income
|
$ | 32,644 | $ | 6,539 | ||||
|
Adjustments to reconcile net income to net cash provided
by operating activities:
|
||||||||
|
Depreciation
|
9,843 | 8,875 | ||||||
|
Amortization of intangible assets
|
729 | 681 | ||||||
|
Amortization of deferred financing costs
|
305 | 421 | ||||||
|
Impairment losses
|
334 | 114 | ||||||
|
Stock-based compensation
|
1,436 | 956 | ||||||
|
Amortization of deferred loss on interest rate swap
|
990 | 2,045 | ||||||
|
Provision for doubtful accounts receivable
|
448 | 995 | ||||||
|
Provision for inventory reserves
|
3,317 | 1,404 | ||||||
|
Deferred income taxes
|
(21,999 | ) | 415 | |||||
|
Change in operating assets and liabilities, net of effect of businesses acquired:
|
||||||||
|
Accounts receivable
|
(581 | ) | (4,857 | ) | ||||
|
Inventories
|
588 | (12,563 | ) | |||||
|
Accounts payable and accrued liabilities
|
3,095 | 13,114 | ||||||
|
Other current assets
|
708 | 1,986 | ||||||
|
Other non-current assets
|
242 | (913 | ) | |||||
|
Other long-term liabilities
|
(1,276 | ) | 358 | |||||
|
Other, net
|
157 | 181 | ||||||
| 30,980 | 19,751 | |||||||
|
CASH USED FOR INVESTING ACTIVITIES
|
||||||||
|
Payments for purchase of business
|
(3,969 | ) | - | |||||
|
Additions to property, plant and equipment
|
(9,367 | ) | (9,966 | ) | ||||
|
Proceeds from sale of property, plant and equipment
|
13 | 695 | ||||||
| (13,323 | ) | (9,271 | ) | |||||
|
CASH USED FOR FINANCING ACTIVITIES
|
||||||||
|
Net repayments on short-term debt and revolving credit lines
|
(7,546 | ) | (7,289 | ) | ||||
|
Principal payments on senior notes and other long-term debt
|
(1,292 | ) | (594 | ) | ||||
|
Deferred financing costs paid to lenders
|
(133 | ) | (173 | ) | ||||
|
Common stock transactions
|
323 | 484 | ||||||
| (8,648 | ) | (7,572 | ) | |||||
|
Effect of foreign currency fluctuations on cash
|
2,189 | 2,513 | ||||||
|
Increase in cash and cash equivalents
|
11,198 | 5,421 | ||||||
|
CASH AND CASH EQUIVALENTS
|
||||||||
|
Beginning of year
|
33,316 | 27,895 | ||||||
|
End of year
|
$ | 44,514 | $ | 33,316 | ||||
The accompanying notes are an integral part of the Consolidated Financial Statements.
F-7
NOTES TO CONSOLIDATED FINANCIAL STATEMENTS
September 30, 2011
(in thousands except share and per share amounts)
1
SUMMARY OF SIGNIFICANT ACCOUNTING POLICIES
Business
Johnson Outdoors Inc. (“the Company”) is an integrated, global outdoor recreation products company engaged in the design, manufacture and marketing of brand name outdoor equipment, diving, watercraft and marine electronics products.
Principles of Consolidation
The consolidated financial statements include the accounts of Johnson Outdoors Inc. and all majority owned subsidiaries and are stated in conformity with U.S. generally accepted accounting principles. Intercompany accounts and transactions have been eliminated upon consolidation.
Use of Estimates
The preparation of financial statements requires management to make estimates and assumptions that impact the reported amounts of assets, liabilities and operating results and the disclosure of commitments and contingent liabilities. Actual results could differ significantly from those estimates.
Fiscal Year
The Company’s fiscal year ends on the Friday nearest September 30. Both the fiscal year ended September 30, 2011 (hereinafter 2011) and the fiscal year ended October 1, 2010 (hereinafter 2010) comprised 52 weeks.
Cash and Cash Equivalents
The Company considers all short-term investments in interest-bearing bank accounts, securities and other instruments with an original maturity of three months or less, to be equivalent to cash. Cash equivalents are stated at cost which approximates market value.
The Company maintains cash in bank accounts in excess of insured limits. The Company has not experienced any losses and does not believe that significant credit risk exists as a result of this practice.
Accounts Receivable
Accounts receivable are recorded at face value less an allowance for doubtful accounts. The allowance for doubtful accounts is based on a combination of factors. In circumstances where specific collection concerns exist, a reserve is established to reduce the amount recorded to an amount the Company believes will be collected. For all other customers, the Company recognizes allowances for doubtful accounts based on historical experience of bad debts as a percent of accounts receivable for each business unit. Uncollectible accounts are written off against the allowance for doubtful accounts after collection efforts have been exhausted. The Company typically does not require collateral on its accounts receivable.
Inventories
The Company values inventory at the lower of cost (determined using the first-in first-out method) or market. Management’s judgment is required to determine the reserve for obsolete or excess inventory. Inventory on hand may exceed future demand either because the product is outdated or because the amount on hand is more than will be used to meet future needs. Inventory reserves are estimated by the individual operating companies using standard quantitative measures based on criteria established by the Company. The Company also considers current forecast plans, as well as market and industry conditions in establishing reserve levels. Though the Company considers these balances to be adequate, changes in
economic conditions, customer inventory levels or competitive conditions could have a favorable or unfavorable effect on required reserve balances.
F-8
Inventories at the end of the respective fiscal years consist of the following:
|
2011
|
2010
|
|||||||
|
Raw materials
|
$ | 24,260 | $ | 27,777 | ||||
|
Work in process
|
1,780 | 2,341 | ||||||
|
Finished goods
|
42,422 | 41,977 | ||||||
| $ | 68,462 | $ | 72,095 | |||||
Property,
Plant
and Equipment
Property, plant and equipment are stated at cost less accumulated depreciation. Depreciation of plant and equipment is determined by straight-line methods over the following estimated useful lives:
|
Property improvements
|
5-20 years
|
|
Buildings and improvements
|
20-40 years
|
|
Furniture, fixtures and equipment
|
3-10 years
|
Upon retirement or disposition, cost and the related accumulated depreciation are removed from the accounts and any resulting gain or loss is recognized in the results of operations.
Property, plant and equipment at the end of the respective years consist of the following:
|
2011
|
2010
|
|||||||
|
Property and improvements
|
$ | 620 | $ | 651 | ||||
|
Buildings and improvements
|
22,040 | 21,604 | ||||||
|
Furniture, fixtures and equipment
|
109,727 | 99,697 | ||||||
| 132,387 | 121,952 | |||||||
|
Less accumulated depreciation
|
97,229 | 88,185 | ||||||
| $ | 35,158 | $ | 33,767 | |||||
Goodwill
The Company applies a fair value-based impairment test to the net book value of goodwill on an annual basis as of the last day of the eleventh month of the Company’s fiscal year and, if certain events or circumstances indicate that an impairment loss may have been incurred, on an interim basis. The operating segments of the Company also represent the reporting units for goodwill purposes.
The analysis of potential impairment of goodwill requires a two-step process. The first step is the estimation of fair value of the applicable reporting units. Estimated fair value is based on management judgments and assumptions and the Company cannot predict what future events may occur that could adversely affect the reported value of its goodwill. The fair values as determined by management are compared with the aggregate carrying values of the reporting units. If the fair value of the reporting unit is greater than its carrying amount, there is no impairment. If the reporting unit carrying amount is greater than the fair value, then the second step must be completed to measure the amount of impairment, if any.
The second step calculates the implied fair value of the goodwill which is compared to its carrying value. If the implied fair value is less than the carrying value, an impairment loss is recognized equal to the difference.
F-9
The results of the impairment tests performed in 2011 and 2010 indicated no impairment to the Company’s goodwill. Due to the uncertainty of future events, the Company cannot assure that growth rates will not be lower than expected, discount rates will not increase or the projected cash flows of the individual reporting units will not decline, all of which could impact the carrying value of remaining goodwill in future periods.
During 2010, the Company identified an error in purchase accounting related to the 2004 Techsonic Industries acquisition after the allocation period had ended. The Company identified realizable deferred tax assets of $994 that were present at the date of acquisition but were not included in the purchase price accounting. The Company increased long term deferred tax assets by $994 and reduced goodwill by a like amount during 2010.
Total gross goodwill was $54,566 and $53,644 as of September 30, 2011 and October 1, 2010, respectively. Accumulated impairment of such goodwill was $39,915 as of September 30, 2011 and October 1, 2010, resulting in net goodwill of $14,651 and $13,729 as of September 30, 2011 and October 1, 2010, respectively. As of September 30, 2011 and October 1, 2010, the Company’s Outdoor Equipment and Watercraft segments had no carrying amount of goodwill. The changes in the carrying amount of those segments with goodwill for fiscal 2010 and 2011 are as follows:
|
Marine
Electronics
|
Diving
|
Consolidated
|
||||||||||
|
Balance at October 2, 2009
|
$ | 10,705 | $ | 3,954 | $ | 14,659 | ||||||
|
Tax adjustments related to purchase price allocation
|
(994 | ) | - | (994 | ) | |||||||
|
Currency translations
|
(37 | ) | 101 | 64 | ||||||||
|
Balance at October 1, 2010
|
9,674 | 4,055 | 13,729 | |||||||||
|
LakeMaster® acquisition
|
732 | - | 732 | |||||||||
|
Currency translations
|
(9 | ) | 199 | 190 | ||||||||
|
Balance at September 30, 2011
|
$ | 10,397 | $ | 4,254 | $ | 14,651 | ||||||
F-10
Other Intangible Assets
Indefinite-lived intangible assets are also tested for impairment annually. During the fourth quarter of fiscal 2011, the Company completed its annual fair value-based impairment test on indefinite-lived intangibles. There was no impairment of intangibles recorded for the year ended September 30, 2011 or for the year ended October 1, 2010.
Intangible assets with definite lives are stated at cost less accumulated amortization. Amortization is computed using the straight-line method over periods ranging from 3 to 25 years. During 2010, the Company began phasing out the usage of one of its trademarks. As a result, this trademark, which had been classified as indefinite-lived, became definite-lived and is being amortized over its estimated remaining economic life. Amortization of patents and other intangible assets with definite lives was $729 and $681 for 2011 and 2010, respectively. Amortization of these definite-lived intangible assets is expected to be approximately $470 in 2012 and approximately $280 for each of the following four years.
During 2011, the initial allocation of the purchase price related to the LakeMaster® acquisition was completed resulting in indefinite-lived intangible assets of $290.
Intangible assets at the end of the last two years consisted of the following:
|
2011
|
2010
|
|||||||||||||||||||||||
|
Accumulated
|
Accumulated
|
|||||||||||||||||||||||
|
Gross
|
Amortization
|
Net
|
Gross
|
Amortization
|
Net
|
|||||||||||||||||||
| Amortized other intangible assets: | ||||||||||||||||||||||||
|
Patents
|
$ | 3,687 | $ | (3,430 | ) | $ | 257 | $ | 3,644 | $ | (3,328 | ) | $ | 316 | ||||||||||
|
Trademarks
|
1,976 | (1,094 | ) | 882 | 2,000 | (610 | ) | 1,390 | ||||||||||||||||
|
Other
|
1,335 | (611 | ) | 724 | 1,228 | (464 | ) | 764 | ||||||||||||||||
| Non-amortized trademarks | 3,540 | - | 3,540 | 3,250 | - | 3,250 | ||||||||||||||||||
| $ | 10,538 | $ | (5,135 | ) | $ | 5,403 | $ | 10,122 | $ | (4,402 | ) | $ | 5,720 | |||||||||||
Impairment of Long-Lived Assets
The Company reviews long-lived assets for impairment whenever events or changes in business circumstances indicate that the carrying amount of the assets may not be fully recoverable, and it performs an undiscounted cash flow analysis to determine if impairment exists. If impairment is determined to exist, any related impairment loss is calculated based on the difference between the fair value and the carrying value. During 2010, the Company recognized impairment on its Casarza-Ligure, Italy warehouse facility of $114 to write the asset down to its fair value of $656. During 2011, the Company recognized impairment of $334 on part of its facility in Ferndale, Washington in order to write the asset down to its estimated fair value of $1,300.
Warranties
The Company provides for warranties of certain products as they are sold. Warranty reserves are estimated by the individual operating companies using standard quantitative measures based on criteria established by the Company. Estimates of costs to service its warranty obligations are based on historical experience, expectation of future conditions and known product issues. The following table summarizes the warranty activity for the two years in the period ended September 30, 2011.
|
Balance at October 2, 2009
|
$ | 4,196 | ||
|
Expense accruals for warranties issued during the year
|
3,671 | |||
|
Less current year warranty claims paid
|
3,278 | |||
|
Balance at October 1, 2010
|
4,589 | |||
|
Expense accruals for warranties issued during the year
|
4,551 | |||
|
Less current year warranty claims paid
|
3,985 | |||
|
Balance at September 30, 2011
|
$ | 5,155 |
F-11
Accumulated Other Comprehensive Income (Loss)
The components of “Accumulated other comprehensive income (loss)” on the accompanying balance sheets as of fiscal year end 2011 and 2010, respectively, are as follows:
|
2011
|
2010
|
|||||||
|
Foreign currency translation adjustment
|
$ | 25,811 | $ | 23,305 | ||||
|
Unamortized loss on pension plans, net of
|
||||||||
|
tax of $1,584 and $0, respectively
|
(6,052 | ) | (5,315 | ) | ||||
|
Unrealized loss on interest rate swaps, net of
|
||||||||
|
tax of $0 and $0, respectively
|
(927 | ) | (1,917 | ) | ||||
|
Accumulated other comprehensive income
|
$ | 18,832 | $ | 16,073 | ||||
Earnings per Share (“EPS”)
Net income or loss per share of Class A common stock and Class B common stock is computed using the two-class method. Grants of restricted stock which receive non-forfeitable dividends are required to be included as part of the basic weighted average share calculation under the two-class method.
Holders of Class A common stock are entitled to cash dividends equal to 110% of all dividends declared and paid on each share of Class B common stock. The Company grants shares of unvested restricted stock in the form of Class A shares, which carry the same distribution rights as the Class A common stock described above. As such, the undistributed earnings for each period are allocated to each class of common stock based on the proportionate share of the amount of cash dividends that each such class is entitled to receive.
Basic EPS
Basic net income or loss per share is computed by dividing net income or loss allocated to Class A common stock and Class B common stock by the weighted-average number of shares of Class A common stock and Class B common stock outstanding, respectively. In periods with cumulative year to date net income and undistributed income, the undistributed income for each period is allocated to each class of common stock based on the proportionate share of the amount of cash dividends that each such class is entitled to receive. In periods where there is a cumulative year to date net loss or no undistributed income because distributions through dividends exceed net income, Class B shares are treated as anti-dilutive and, therefore, net losses are allocated equally on a per share basis among all participating securities.
For the years ended September 30, 2011 and October 1, 2010, basic income per share for Class A and Class B shares has been presented using the two class method as described above.
Diluted EPS
Diluted net income per share is computed by dividing allocated net income by the weighted-average number of common shares outstanding, adjusted for the effect of dilutive stock options and non-vested restricted stock. Anti-dilutive stock options and non-vested stock are excluded from the calculation of diluted EPS. The computation of diluted net income per share of Class A common stock assumes that Class B common stock is converted into Class A common stock. Therefore, diluted net income per share is the same for both Class A and Class B common shares. In periods where the Company reports a net loss, the effect of anti-dilutive stock options and non-vested stock is excluded and diluted loss per share is equal to basic loss per share.
For the years ended September 30, 2011 and October 1, 2010 diluted net income per share reflects the effect of dilutive stock options and assumes the conversion of Class B common stock into Class A common stock.
Stock options that could potentially dilute earnings per share in the future which were not included in the fully diluted computation because they would have been anti-dilutive totaled 15,066 and 16,063 for the years ended September 30, 2011 and October 1, 2010, respectively. Non-vested stock that could potentially dilute earnings per share in the future which were not included in the fully diluted computation because they would have been anti-dilutive totaled 472,761 and 325,172 for the years ended September 30, 2011 and October 1, 2010, respectively.
F-12
The following table sets forth a reconciliation of net income to dilutive earnings used in the diluted earnings per share calculations and the computation of basic and diluted earnings per common share:
|
2011
|
2010
|
|||||||
|
Net income
|
$ | 32,644 | $ | 6,539 | ||||
|
Less: Undistributed earnings reallocated to non-vested shareholders
|
(1,429 | ) | (201 | ) | ||||
|
Dilutive earnings
|
$ | 31,215 | $ | 6,338 | ||||
|
Weighted average common shares – Basic:
|
||||||||
|
Class A
|
8,045 | 8,008 | ||||||
|
Class B
|
1,216 | 1,217 | ||||||
|
Dilutive stock options
|
26 | 42 | ||||||
|
Weighted average common shares - Dilutive
|
9,287 | 9,267 | ||||||
|
Net income per common share – Basic:
|
||||||||
|
Class A
|
$ | 3.40 | $ | 0.69 | ||||
|
Class B
|
3.07 | 0.63 | ||||||
|
Net income per common Class A and B share – Dilutive
|
3.36 | 0.68 | ||||||
Stock-Based Compensation
Stock-based compensation cost is recorded for all option grants and awards of non-vested stock based on their grant-date fair value. Stock-based compensation expense is recognized on a straight-line basis over the vesting period of each award. No stock options were granted in 2011 or 2010. See Note 11 of the Notes to Consolidated Financial Statements for information regarding the Company’s stock-based incentive plans, including stock options, non-vested stock, and employee stock purchase plans.
Cash flows from income tax benefits resulting from tax deductions in excess of the compensation expense recognized for stock-based awards have been classified as financing cash flows.
Income Taxes
The Company provides for income taxes currently payable and deferred income taxes resulting from temporary differences between financial statement and taxable income. Accrued interest and penalties related to unrecognized tax benefits are recognized as a component of income tax expense. Deferred income tax assets and liabilities are determined based on the difference between the amounts reported in the financial statements and the tax bases of assets and liabilities, using enacted tax rates in effect in the years in which the differences are expected to reverse. Deferred income tax assets and liabilities are adjusted for the effects of changes in tax laws and rates on the date of enactment. A valuation allowance is established if it is more likely than not that some portion or all of a deferred income tax asset will not be realized. See Note 7 of the Notes to Consolidated Financial Statements for further discussion.
Employee Benefits
The Company and certain of its subsidiaries have various retirement and profit sharing plans. The Company does not have any significant foreign retirement plans. Pension obligations, which are generally based on compensation and years of service, are funded by payments to pension fund trustees. The Company’s policy is to annually fund the minimum amount required under the Employee Retirement Income Security Act of 1974 for plans subject thereto. Other retirement costs are funded at least annually. See Note 8 of the Notes to Consolidated Financial Statements for additional discussion.
F-13
Foreign Operations and Related Derivative Financial Instruments
The functional currencies of the Company’s foreign operations are the local currencies. Accordingly, assets and liabilities of foreign operations are translated into U.S. dollars at the rate of exchange existing at the end of the year. Results of operations are translated at monthly average exchange rates. Adjustments resulting from the translation of foreign currency financial statements are classified as Accumulated other comprehensive income (loss), a separate component of Shareholders’ equity.
Currency gains and losses are recognized when assets and liabilities of foreign operations, denominated in other than their local currency, are converted into the local currency of the entity. Additionally, currency gains and losses are recognized through the settlement of transactions denominated in other than the local currency. The Company recognized currency losses from transactions of $2,061 and $610 for 2011 and 2010, respectively, included in the “Other expense, net” line of the Company’s Consolidated Statements of Operations.
Because the Company operates internationally, it has exposure to market risk from movements in foreign currency exchange rates. Approximately 26% of the Company’s revenues for the year ended September 30, 2011 were denominated in currencies other than the U.S. dollar. Approximately 15% were denominated in euros, with the remaining 11% denominated in various other foreign currencies. The Company may mitigate a portion of the fluctuations in certain foreign currencies through the purchase of foreign currency swaps, forward contracts and options to hedge known commitments denominated in foreign currencies or borrowings in foreign currencies. In 2011 and 2010 the Company used foreign currency forward contracts to reduce the economic risk of changes in foreign currency exchange rates on foreign currency borrowings. The Company recognized gains from foreign currency forward contracts of $361 for 2011 and losses of $565 for 2010, included in the “Other expense, net” line of the Company’s Consolidated Statements of Operations. The Company does not enter into foreign exchange contracts for trading or speculative purposes.
Revenue Recognition
The Company recognizes revenue when all of the following criteria have been met:
| ● | Persuasive evidence of an arrangement exists. Contracts, internet commerce agreements, and customer purchase orders are generally used to determine the existence of an arrangement. | |
| ● | All substantial risk of ownership transfers to the customer. Shipping documents and customer acceptance, when applicable, are used to verify delivery. | |
| ● | The fee is fixed or determinable. This is assessed based on the payment terms associated with the transaction and whether the sales price is subject to refund or adjustment. | |
| ● | Collectability is reasonably assured. We assess collectability based on the creditworthiness of the customer as determined by credit checks and analysis, as well as by the customer’s payment history. |
Estimated costs of returns and allowances and discounts are accrued as a reduction to sales when revenue is recognized.
Advertising & Promotions
The Company expenses substantially all costs related to the production of advertising the first time the advertising takes place. Cooperative promotional arrangements are accrued as related revenue is earned.
Advertising and promotions expense in 2011 and 2010 totaled $22,338 and $20,107, respectively. These charges are included in Marketing and selling expenses. Capitalized advertising costs, included in Other current assets, totaled
$752 and $979 at September 30, 2011 and October 1, 2010, respectively, and primarily included catalogs and costs of advertising which have not yet run for the first time.
F-14
Shipping and Handling Costs
Shipping and handling fees billed to customers are included in Net sales. Shipping and handling costs are included in Marketing and selling expenses and totaled $10,591 and $ 9,697 for 2011 and 2010, respectively.
Research and Development
The Company expenses research and development costs as incurred except for costs of software development for new electronic products which are capitalized once technological feasibility is established and are included in Furniture, Fixtures and Equipment. The gross amount capitalized related to software development was $8,380, less accumulated amortization of $4,399, at September 30, 2011 and $6,123, less accumulated amortization of $3,026, at October 1, 2010. These costs are amortized over the expected life of the software of three years. Amortization expense related to capitalized software in 2011 and 2010 was $1,373 and $489, respectively, and is included in Depreciation expense on Plant, Property and Equipment.
Fair Values
The carrying amounts of cash, cash equivalents, accounts receivable, and accounts payable approximated fair value at September 30, 2011 and October 1, 2010 due to the short maturities of these instruments. During 2011 and 2010, the Company held foreign currency forward contracts and investments in equity and debt securities that were carried at fair value. When indicators of impairment are present, the Company may be required to value certain long-lived assets such as property, plant, and equipment, and other intangibles at fair value. See Note 3 of the Notes to Consolidated Financial Statements for disclosures regarding the fair value of long-term debt and Note 5 of the Notes to Consolidated Financial Statements for disclosures regarding fair value measurement of other financial instruments.
Valuation Techniques
Over the Counter Derivative Contracts
The value of over the counter derivative contracts, such as interest rate swaps and foreign currency forward contracts, are derived using pricing models, which take into account the contract terms, as well as other inputs, including, where applicable, the notional values of the contracts, payment terms, maturity dates, credit risk, interest rate yield curves, and contractual and market currency exchange rates. The pricing model used for valuing interest rate swaps does not entail material subjectivity because the methodologies employed do not necessitate significant judgment, and the pricing inputs are observed from actively quoted markets.
Rabbi Trust Assets
Rabbi trust assets, used to fund amounts the Company owes to certain officers and other employees under the Company’s non-qualified deferred compensation plan, are included in other assets, and are classified as trading securities. These assets are comprised of marketable debt and equity securities that are marked to fair value based on unadjusted quoted prices in active markets.
Goodwill and Other Intangible Assets
In assessing the recoverability of the Company's goodwill and other intangible assets, the Company estimates the future discounted cash flows of the businesses to which the goodwill relates. When estimated future discounted cash flows are less than the carrying value of the net assets and related goodwill, an impairment test is performed to measure and recognize the amount of the impairment loss, if any. In determining estimated future cash flows, the Company makes assumptions regarding anticipated financial position, future earnings and other factors to determine the fair value of the respective assets.
See Note 3 of the Notes to Consolidated Financial Statements for disclosures regarding the fair value of long-term debt and Note 5 of the Notes to Consolidated Financial Statements for disclosures regarding fair value measurement.
F-15
Reclassifications
Certain prior year amounts have been reclassified to conform to the 2011 presentation. These reclassifications have no impact on previously reported net income or earnings per share.
New Accounting Pronouncements
In September 2011, the Financial Accounting Standards Board (“FASB”) issued
ASU 2011-08, “Testing Goodwill for Impairment” (“ASU 2011-08”). ASU 2011-08 allows a company to first assess qualitative factors to determine whether it is more likely than not that the fair value of a reporting unit is less than its carrying amount as a basis for determining whether it is necessary to perform the two-step goodwill impairment test. The more likely than not threshold is defined as having a likelihood of more than 50 percent. The provisions of ASU 2011-08 are effective for annual and interim goodwill impairment tests performed for fiscal
years beginning after December 15, 2011 with early adoption permitted. The adoption of the provisions of ASU 2011-08 is not expected to have a material effect on the consolidated financial position, results of operations or cash flows of the Company.
In June 2011, the FASB issued ASU 2011-05, “Presentation of Comprehensive Income” (“ASU 2011-05”). ASU 2011-05 requires companies to present the total of comprehensive income, the components of net income and the components of other comprehensive income either in a single continuous statement of comprehensive income or in two separate but consecutive statements. The provisions of ASU 2011-05 are effective for fiscal years, and interim periods within those years, beginning after December 15, 2011. Since ASU 2011-05 only amends the disclosure requirements concerning comprehensive income, the adoption of ASU 2011-05 will not affect the consolidated financial position, results of operations or cash flows of the Company.
2 ACQUISITIONS
On July 11, 2011, the Company purchased the assets of Waypoint Technologies Inc. (“Waypoint”) and Pro Map Technologies Inc. for cash of approximately $4,000. Waypoint is the maker of LakeMaster® brand high definition electronic lake charts, the premier brand of lake charts for anglers in the Northern United States. The purchase was funded with existing cash and credit facilities. The Company believes the purchase, combined with the Company’s existing marine electronics products, will present new and innovative opportunities to enhance the fishing experience. The Waypoint purchase is included in the Company’s Marine Electronics segment.
The following table summarizes the final allocation of the purchase price of the Waypoint assets.
|
Accounts receivable
|
$ | 138 | ||
|
Inventories
|
77 | |||
|
Other current assets
|
2 | |||
|
Property, plant and equipment
|
2,212 | |||
|
Deferred tax asset
|
625 | |||
|
Trademark
|
290 | |||
|
Goodwill
|
732 | |||
|
Total assets acquired
|
4,076 | |||
|
Total liabilities assumed
|
107 | |||
|
Net assets acquired
|
$ | 3,969 |
As part of the acquisition, the Company acquired a bathymetry database valued at $2,000 which was included in property, plant and equipment. The trademark acquired was determined to have an indefinite life. The Company recognized goodwill as a result of the acquisition related to expected synergies with the Company’s existing Marine Electronics businesses. The goodwill acquired as a part of this acquisition is deductible for tax purposes. The acquisition was accounted for using the acquisition method and, accordingly, the Company’s consolidated financial statements include the results of the acquired business’ operations since the date of acquisition. The Company has not presented pro forma financial information with respect to the acquisition due to the immateriality of the transaction.
F-16
3 INDEBTEDNESS
Debt is comprised of the following at September 30, 2011 and October 1, 2010:
|
2011
|
2010
|
|||||||
|
Term loans
|
$ | 14,367 | $ | 15,474 | ||||
|
Revolvers
|
- | 7,544 | ||||||
|
Other
|
605 | 792 | ||||||
|
Total debt
|
14,972 | 23,810 | ||||||
|
Less current maturities
|
3,494 | 1,327 | ||||||
|
Less Revolvers
|
- | 7,544 | ||||||
|
Total long-term debt
|
$ | 11,478 | $ | 14,939 | ||||
Term Loans
The Company’s term loans have maturity dates ranging from 15 to 25 years from the September 29, 2009 effective date of the underlying agreements. Each term loan requires monthly payments of principal and interest. Interest on $8,753 of the aggregate outstanding amount of the term loans is based on the prime rate plus 2.0%, and the remainder is based on the prime rate plus 2.75%.
The prime rate was 3.25% at September 30, 2011.
The term loans are guaranteed in part under the United States Department of Agriculture Rural Development program and are secured with a first priority lien on land, buildings, machinery and equipment of the Company’s domestic subsidiaries and a second lien on working capital and certain patents and trademarks of the Company and its subsidiaries. Any proceeds from the sale of secured property is first applied against the related term loans and then against the Revolvers. Certain of the term loans covering $8,753 of the aggregate borrowings are subject to a pre-payment penalty. The penalty is currently 8% of the pre-payment amount, and the penalty will decrease by 1% annually on the anniversary date of the loan agreement.
Revolvers
On November 16, 2010, the Company and certain of its subsidiaries entered into amendments to their Revolving Credit Agreements (or “Revolvers”). The amended terms of the Revolvers, maturing in November 2014, provide for funding of up to $75,000, with the option for an additional $25,000 in maximum seasonal financing availability subject to the approval of the lenders. Borrowing availability under the Revolvers is based on certain eligible working capital assets, primarily accounts receivable and inventory of the Company and its subsidiaries. The Revolvers contain a seasonal line reduction that reduces the maximum amount of borrowings to $50,000 from mid-July to mid-November, consistent with the Company's reduced working capital needs throughout that period, and requires an annual seasonal pay down to $30,000 for 60 consecutive days. The amendments to the Revolvers reset the interest rate calculation each quarter, beginning with the quarter ended April 1, 2011, by instituting an applicable margin based on the Company’s leverage ratio for the trailing twelve month period. The applicable margin ranges from 2.25% to 3.0%. The Company incurred $133 of financing fees in conjunction with the amendments to the Revolvers, which were capitalized and added to the previously capitalized financing fees, all of which will be amortized over the remaining term of the amended Revolvers.
The Revolvers are secured with a first priority lien on working capital assets and certain patents and trademarks of the Company and its subsidiaries and a second lien on land, buildings, machinery and equipment of the Company's domestic subsidiaries. As cash collections related to secured assets are applied against the balance outstanding under the Revolvers, the liability is classified as current. The interest rate on the Revolvers is based on LIBOR or the prime rate, at the Company’s discretion, plus an applicable margin. The Company had no borrowings on its Revolvers as of September 30, 2011. If the Company had such borrowings, the interest rate in effect on the Revolvers at September 30, 2011, based on LIBOR plus 2.25%, would have been approximately 2.5%.
F-17
The Company’s remaining borrowing availability under the Revolvers was approximately $31,400 at September 30, 2011.
Under the terms of the Revolvers, the Company is required to comply with certain financial and non-financial covenants. Among other restrictions, the Company is restricted in its ability to pay dividends, incur additional debt and make acquisitions or divestitures above certain amounts. The key financial covenants include a minimum fixed charge coverage ratio, limits on minimum net worth and EBITDA, a limit on capital expenditures, and, as noted above, a seasonal pay-down requirement.
Other Borrowings
The Company had no unsecured revolving credit facilities at its foreign subsidiaries as of September 30, 2011. The Company utilizes letters of credit primarily as security for the payment of future claims under its workers’ compensation insurance which totaled $2,103 and $2,568 at September 30, 2011 and October 1, 2010, respectively. The Company has no unsecured lines of credit as of September 30, 2011 or October 1, 2010.
Aggregate scheduled maturities of long-term debt as of September 30, 2011 are as follows:
|
Fiscal Year
|
||||
|
2012
|
$ | 3,494 | ||
|
2013
|
683 | |||
|
2014
|
670 | |||
|
2015
|
530 | |||
|
2016
|
548 | |||
|
Thereafter
|
9,047 | |||
|
Total
|
$ | 14,972 | ||
Interest paid was $1,919 and $2,537 for 2011 and 2010, respectively.
The weighted average borrowing rate for short-term debt was approximately 3.4% and 5.3% for 2011 and 2010, respectively.
Based on the borrowing rates currently available to the Company for debt with similar terms and maturities, the fair value of the Company’s long-term debt as of September 30, 2011 and October 1, 2010 was approximately $14,972 and $16,266, respectively.
Certain of the Company’s loan agreements require that the Company’s Chief Executive Officer, Helen P. Johnson-Leipold, members of her family and related entities (hereinafter the Johnson Family) continue to own stock having votes sufficient to elect a majority of the directors. At November 29, 2011, the Johnson Family held 3,754,950 shares or approximately 44% of the Class A common stock, 1,211,196 shares or approximately 100% of the Class B common stock and approximately 77% of the voting power of both classes of common stock taken as a whole.
4 DERIVATIVE INSTRUMENTS AND HEDGING ACTIVITIES
The following disclosures describe the Company’s objectives in using derivative instruments, the business purpose or context for using derivative instruments, and how the Company believes the use of derivative instruments helps achieve the stated objectives. In addition, the following disclosures describe the effects of the Company’s use of derivative instruments and hedging activities on its financial statements.
Foreign Exchange Risk
The Company has significant foreign operations, for which the functional currencies are denominated primarily in euros, Swiss francs, Japanese yen and Canadian dollars. As the values of the currencies of the foreign countries in which the Company has operations increase or decrease relative to the U.S. dollar, the sales, expenses, profits, losses, assets and liabilities of the Company’s foreign operations, as reported in the Company’s consolidated financial statements, increase or decrease, accordingly. Approximately 26% of the Company’s revenues for the fiscal year ended September 30, 2011 were denominated in currencies other than the U.S. dollar. Approximately 15% were denominated in euros, with the remaining 11% denominated in various other foreign currencies. Changes in foreign currency exchange rates can cause unexpected financial losses or cash flow needs.
F-18
The Company mitigates a portion of the fluctuations in certain foreign currencies through the use of foreign currency forward contracts. Foreign currency forward contracts enable the Company to lock in the foreign currency exchange rate for a fixed amount of currency to be paid or received on a specified date in the future. The Company uses such foreign currency forward contracts to mitigate the risk associated with changes in foreign currency exchange rates on financial instruments and known commitments denominated in foreign currencies. None of the Company’s derivative financial instruments have been designated as hedging instruments.
Interest Rate Risk
The Company operates in a seasonal business and experiences significant fluctuations in operating cash flow as working capital needs increase in advance of the Company’s primary selling and cash generation season, and decline as accounts receivable are collected and cash is accumulated or debt is repaid. The Company’s goal in managing its interest rate risk is to maintain a mix of floating rate and fixed rate debt such that permanent non-equity capital needs are largely funded with long term fixed rate debt and seasonal working capital needs are funded with short term floating rate debt.
When the appropriate mix of fixed rate or floating rate debt cannot be directly obtained in a cost effective manner, the Company may enter into interest rate swap contracts in order to change floating rate interest into fixed rate interest or vice versa for a specific amount of debt in order to achieve the desired proportions of floating rate and fixed rate debt. An interest rate swap is a contract in which the Company agrees to exchange, at specified intervals, the difference between fixed and variable interest amounts calculated by reference to an agreed upon notional principal amount. The notional amount is the equivalent amount of debt that the Company wishes to change from a fixed interest rate to a floating interest rate or vice versa and is the basis for calculating the related interest payments required under the interest rate swap contract.
On January 2, 2009, the Company’s then effective interest rate swap contract became ineffective as a hedging instrument. Prior to becoming ineffective, the effective portion of the Company’s interest rate swap contract was recorded in accumulated other comprehensive income (“AOCI”), a component of shareholders’ equity. As a result of this cash flow hedge becoming ineffective, $5,937 of unrealized loss in AOCI was frozen and all subsequent changes in the fair value of the swap were recorded directly to interest expense in the Company’s statements of operations. The effective portion frozen in AOCI is amortized over the period of the originally hedged transaction. The remaining amount held in AOCI shall be immediately recognized as interest expense if it ever becomes probable that the Company will not have interest bearing debt through December 14, 2012, the period over which the originally forecasted hedged transactions were expected to occur. The Company expects that approximately $789 of the $927 remaining in AOCI at September 30, 2011 will be amortized into interest expense over the next 12 months.
The Company held no interest rate swap contracts in fiscal 2011 or 2010. As of September 30, 2011, the Company was unhedged with respect to interest rate risk on its floating rate debt.
F-19
The following discloses the location of loss reclassified from AOCI into net income related to derivative instruments during the years ended September 30, 2011 and October 1, 2010, respectively:
|
Loss reclassified from AOCI into:
|
2011
|
2010
|
||||||
|
Interest expense
|
$ | 990 | $ | 2,045 | ||||
The following discloses the location and amount of income or loss recognized for changes in the fair value of derivative instruments not designated as hedging instruments for the years ended September 30, 2011 and October 1, 2010, respectively:
|
Derivatives not designated as hedging instruments
|
Location of (income) or loss
recognized in statement of
operations
|
2011 |
2010
|
|
|
Foreign exchange forward contracts
|
Other expense, net
|
$ (361)
|
$ 565
|
|
5 FAIR VALUE MEASUREMENTS
Fair value is defined as the exchange price that would be received for an asset or paid to transfer a liability (an exit price) in the principal or most advantageous market for the asset or liability in an orderly transaction between market participants on the measurement date. Valuation techniques used to measure fair value must maximize the use of observable inputs and minimize the use of unobservable inputs.
A fair value hierarchy has been established based on three levels of inputs, of which the first two are considered observable and the last unobservable.
| ● | Level 1 - Quoted prices in active markets for identical assets or liabilities. These are typically obtained from real-time quotes for transactions in active exchange markets involving identical assets. | |
| ● | Level 2 - Inputs, other than quoted prices included within Level 1, which are observable for the asset or liability, either directly or indirectly. These are typically obtained from readily-available pricing sources for comparable instruments. | |
| ● | Level 3 - Unobservable inputs, where there is little or no market activity for the asset or liability. These inputs reflect the reporting entity’s own assumptions of the data that market participants would use in pricing the asset or liability, based on the best information available in the circumstances. |
The following table summarizes the Company’s financial assets and liabilities recorded on its balance sheet at fair value on a recurring basis
as of September 30, 2011
:
|
Level 1
|
Level 2
|
Level 3
|
Total
|
|||||||||||||
|
Assets:
|
||||||||||||||||
|
Rabbi trust assets
|
$ | 5,385 | $ | - | $ | - | $ | 5,385 | ||||||||
|
Liabilities:
|
||||||||||||||||
|
Foreign currency forward contracts
|
$ | - | $ | 128 | $ | - | $ | 128 | ||||||||
F-20
The following table summarizes the Company’s financial assets and liabilities recorded on its balance sheet at fair value on a recurring basis as of
October 1, 2010
:
|
Level 1
|
Level 2
|
Level 3
|
Total
|
|||||||||||||
|
Assets:
|
||||||||||||||||
|
Rabbi trust assets
|
$ | 5,452 | $ | - | $ | - | $ | 5,452 | ||||||||
|
Liabilities:
|
||||||||||||||||
|
Foreign currency forward contracts
|
$ | - | $ | 8 | $ | - | $ | 8 | ||||||||
Rabbi trust assets are classified as trading securities and are comprised of marketable debt and equity securities that are marked to fair value based on unadjusted quoted prices in active markets. The rabbi trust assets are used to fund amounts the Company owes to certain officers and other employees under the Company’s non-qualified deferred compensation plan. The mark to market adjustments are recorded in “Other expense, net” in the Consolidated Statements of Operations.
The fair value of the foreign exchange forward contract reported above was measured using the market value approach based on foreign currency exchange rates and the notional amount of the forward contract. The mark to market adjustments are recorded in “Other expense, net.”
The following table summarizes the amount of total income or losses in the period attributable to the changes in fair value of the instruments noted above during the years ended September 30, 2011 and October 1, 2010, respectively:
|
Location of (income) loss
recognized in Statements of
Operations
|
2011
|
2010
|
|||||||
|
Rabbi trust assets
|
Other expense, net
|
$ | 382 | $ | (730 | ) | |||
|
Foreign exchange forward contracts
|
Other expense, net
|
$ | (361 | ) | $ | 565 | |||
Certain assets and liabilities are measured at fair value on a non-recurring basis in periods subsequent to their initial recognition.
During 2011, the Company recognized impairment of $334 on part of its facility in Ferndale, Washington in order to write the asset down to its estimated fair value of approximately $1,300. The fair value of the facility was determined using a market approach based on recent selling prices of comparable properties. The impairment charge was included in “Other expense, net” in the Company’s accompanying Consolidated Statements of Operations in the Watercraft segment. This portion of the facility is anticipated to be sold in the first quarter of fiscal 2012.
The following table summarizes the Company’s assets measured at fair value on a non-recurring basis as of September 30, 2011 and the losses recognized as a result of this measurement in 2011:
|
Level 1
|
Level 2
|
Level 3
|
Losses incurred
|
|||||||||||||
|
Property, plant and equipment
|
$ | - | $ | - | $ | 1,300 | $ | 334 | ||||||||
During 2010, the Company recognized impairment related to a warehouse facility in Casarza – Ligure, Italy of $114 to write the asset down to its fair value of $656. The fair value of the facility was determined using a market approach based on recent selling prices of comparable properties. The impairment charge was included in “Administrative management, finance and information systems” expenses in the Diving segment. This facility was sold in March 2010 for $634.
F-21
The following table summarizes the Company’s assets measured at fair value on a non-recurring basis as of October 1, 2010 and the losses recognized as a result of this measurement in 2010:
|
Level 1
|
Level 2
|
Level 3
|
Losses incurred
|
|||||||||||||
|
Property, plant and equipment
|
$ | - | $ | - | $ | 656 | $ | 114 | ||||||||
6 LEASES AND OTHER COMMITMENTS
The Company leases certain facilities and machinery and equipment under long-term, non-cancelable operating leases. Future minimum rental commitments under non-cancelable operating leases with an initial lease term in excess of one year at September 30, 2011 were as follows:
|
Year
|
Related parties included in total
|
Total
|
|||||
|
2012
|
$ | 1,014 | $ | 6,648 | |||
|
2013
|
820 | 4,455 | |||||
|
2014
|
849 | 3,536 | |||||
|
2015
|
878 | 2,889 | |||||
|
2016
|
939 | 2,643 | |||||
|
Thereafter
|
- | 1,437 | |||||
Rental expense under all leases was approximately $8,731 and $8,990 for 2011 and 2010, respectively. Rent expense to related parties was $849 and $799 for 2011 and 2010, respectively.
7 INCOME TAXES
The U.S. and foreign income before income taxes for the respective years consisted of the following:
|
2011
|
2010
|
|||||||
|
United States
|
$ | 11,133 | $ | 7,873 | ||||
|
Foreign
|
1,117 | 1,319 | ||||||
| $ | 12,250 | $ | 9,192 | |||||
Income tax expense for the respective years consisted of the following:
|
2011
|
2010
|
|||||||
|
Current:
|
||||||||
|
Federal (net of tax benefit from operating loss carryforward of $2,505 and $5,260, respectively)
|
$ | - | $ | - | ||||
|
State
|
642 | 483 | ||||||
|
Foreign
|
2,000 | 1,164 | ||||||
|
Deferred
|
(23,036 | ) | 1,006 | |||||
| $ | (20,394 | ) | $ | 2,653 | ||||
F-22
The tax effects of temporary differences that give rise to deferred tax assets and deferred tax liabilities at the end of the respective years are presented below:
|
2011
|
2010
|
|||||||
|
Deferred tax assets:
|
||||||||
|
Inventories
|
$ | 3,902 | $ | 4,049 | ||||
|
Compensation
|
10,258 | 10,042 | ||||||
|
Tax credit carryforwards
|
8,519 | 8,684 | ||||||
|
Goodwill and other intangibles
|
3,639 | 2,440 | ||||||
|
Net operating loss carryforwards
|
11,109 | 11,069 | ||||||
|
Depreciation and amortization
|
751 | 2,267 | ||||||
|
Other
|
5,385 | 5,791 | ||||||
|
Total gross deferred tax assets
|
43,563 | 44,342 | ||||||
|
Less valuation allowance
|
14,300 | 39,178 | ||||||
|
Deferred tax assets
|
29,263 | 5,164 | ||||||
|
Deferred tax liabilities:
|
||||||||
|
Foreign statutory reserves
|
348 | 601 | ||||||
|
Net deferred tax assets
|
$ | 28,915 | $ | 4,563 | ||||
The net deferred tax assets are recorded in the Consolidated Balance Sheet as follows:
|
2011
|
2010
|
|||||||
|
Current assets
|
$ | 9,732 | $ | 1,844 | ||||
|
Non-current assets
|
19,531 | 3,320 | ||||||
|
Non-current liabilities
|
348 | 601 | ||||||
|
Net deferred tax assets
|
$ | 28,915 | $ | 4,563 | ||||
F-23
The significant differences between the statutory federal tax rate and the effective income tax rates for the Company for the respective years shown below are as follows:
|
2011
|
2010
|
|||||||
|
Statutory U.S. federal income tax rate
|
35.0 | % | 35.0 | % | ||||
|
Foreign rate differential
|
-0.9 | % | -3.6 | % | ||||
|
State income tax, net of federal benefit
|
4.2 | % | 5.3 | % | ||||
|
Decrease in valuation reserve for deferred assets
|
-211.0 | % | -8.1 | % | ||||
|
Other
|
6.2 | % | 0.3 | % | ||||
| -166.5 | % | 28.9 | % | |||||
Under generally accepted accounting principles, the Company considers at each reporting period all available evidence, both positive and negative, to determine whether, based on the weight of that evidence, a valuation allowance is needed to reduce its deferred tax asset to an amount that is more likely than not to be realized. That determination of the need for a valuation allowance for the deferred tax assets is dependent upon management’s evaluation of both positive and negative evidence. Positive evidence includes the probability of achieving forecasted future taxable income, applicable tax strategies and assessments of the current and future economic and business conditions. Negative evidence includes the Company’s cumulative losses and expiring tax carryforwards.
At September 30, 2011, the Company’s federal and state deferred tax assets were comprised of future tax benefits associated with net operating loss carryforwards and future deductions and credits and, prior to a valuation allowance, totaled $34,814 million. Based upon future projections and the fact that the Company’s U.S. operations generated cumulative profits over the three year period ended September 30, 2011, the Company believes it will generate sufficient taxable income before most tax assets will expire. It therefore concluded that a valuation allowance was no longer required for the majority of the federal deferred tax assets.
The decrease in the valuation allowance in 2011, due to usage during the year and the year end reversal, provided a benefit of $25,305 to the effective tax expense. This was partially offset by the increase in foreign valuation allowances of $2,419. In fiscal 2011 the Company established a valuation allowance of $903 against the net deferred tax assets in French tax jurisdictions based upon cumulative earnings deficit. Additional operating losses in Japan, Italy, Spain and United Kingdom also increased the valuation allowance by $1,516 in fiscal 2011.
In 2010, the valuation allowance positive impact of $744 to the effective tax expense was primarily the result of the U.S. usage of tax benefits related to net operating losses and the corresponding reversal of valuation allowances of $2,539 partially offset by the increase in foreign valuation allowances of $1,795. In fiscal 2010 the Company
established a valuation allowance of $1,020 against the net deferred tax assets in an Italian tax jurisdiction based on cumulative earnings deficit and eliminated the valuation allowance of $75 against the net deferred tax assets in the New Zealand tax jurisdiction based on positive cumulative earnings. Continual net operating losses in Japan, Spain and United Kingdom also increased the valuation allowance by $810.
The foreign rate differential of (0.9)% and (3.6)%, for 2011 and 2010, respectively, is comprised of several foreign tax related items including the statutory rate differential in each year, foreign provincial or local income taxes and additional contingency reserves.
At September 30, 2011, the Company has federal operating loss carry forwards of $10,650 which begin to expire in 2029, as well as various state net operating loss carry forwards of $16,816 which expire from 2012 to 2029. In addition, certain of the Company’s foreign subsidiaries have operating loss carry forwards totaling $15,154. These operating loss carry forwards are available to offset future taxable income over the next 2 to approximately 20 years.
Given the uncertain conditions in the outdoor recreation equipment market in the France, Japan, Italy, Spain, and United Kingdom tax jurisdictions, the Company will maintain a valuation allowance against the net deferred tax assets in these jurisdictions that are anticipated to expire unused. Based on projections for these tax jurisdictions, the Company determined that it was more likely than not that certain deferred tax assets will not be realized and a valuation allowance balance of $903, $2,729, $2,061, $586, and $465 was reported against the net deferred tax assets for France, Japan, Italy, Spain, and United Kingdom tax jurisdictions respectively, as of September 30, 2011. In addition, there is a remaining valuation allowance of $7,556 related to various state and federal US deferred tax assets where it is more likely than not that the asset will not be realized due to a lack of apportioned income and limited carryforward periods.
F-24
As of October 1, 2010, the Company’s valuation allowance was comprised of $34,853, $2,404, $1,020, $467, and $434 and was recorded against the net deferred tax assets for the U.S., Japan, Italy, Spain, and United Kingdom tax jurisdictions respectively.
Taxes paid were $878 and $835 for 2011 and 2010, respectively.
A reconciliation of the beginning and ending amount of unrecognized tax benefits is as follows:
|
Balance at October 2, 2009
|
$ | 1,290 | ||
|
Lapse of statute of limitations
|
(240 | ) | ||
|
Gross increases - tax positions in current period
|
205 | |||
|
Balance at October 1, 2010
|
1,255 | |||
|
Settlement
|
(168 | ) | ||
|
Lapse of statute of limitations
|
(122 | ) | ||
|
Gross increases - tax positions in current period
|
719 | |||
|
Balance at September 30, 2011
|
$ | 1,684 |
Unrecognized tax benefits are included in accrued taxes in the consolidated balance sheet.
The Company’s total gross liability for unrecognized tax benefits was $1,684 and $1,255 for the years ended September 30, 2011 and October 1, 2010, respectively. In accordance with its accounting policy, the Company recognizes accrued interest and penalties related to unrecognized tax benefits as a component of income tax expense. The total accrued interest with respect to income taxes was approximately $248 and $256 for the years ended September 30, 2011 and October 1, 2010, respectively. Interest of $39 and $86 was recorded as a component of income tax expense in the Consolidated Statements of Operations during fiscal year 2011 and 2010, respectively.
The Company is currently undergoing examination in the Netherlands and subsequent to September 30, 2011 was notified that Canada will begin an examination of the years 2008 – 2010. There was a change in unrecognized tax benefits as a result of the settlement of a tax audit in Germany in the year ended September 30, 2011. The amount of unrecognized tax benefits recognized within the next twelve months
may decrease due to expiration of the statute of limitations for certain years in various jurisdictions however, it is possible that a jurisdiction may open an audit prior to the statute expiring or one of the above audits may adjust the Company’s tax filings. At this time, an estimate of the range of the reasonably possible change cannot be made.
The Company files income tax returns, including returns for its subsidiaries, with federal, state, local and foreign taxing jurisdictions. The following tax years remain subject to examination by the respective major tax jurisdictions:
|
Jurisdiction
|
Fiscal Years
|
|
|
United States
|
2008-2011
|
|
|
Canada
|
2006-2011
|
|
|
France
|
2008-2011
|
|
|
Germany
|
2009-2011
|
|
|
Italy
|
2006-2011
|
|
|
Japan
|
2009-2011
|
|
|
Switzerland
|
2001-2011
|
F-25
Federal and state income taxes are provided on foreign subsidiary income distributed to, or taxable in, the U.S. during the year. In 2010, the Company reversed $2,900 of U.S. tax on undistributed earnings of its Canadian subsidiary considered not permanently reinvested as a result of attributed dividend repatriation. As of September 30, 2011, net undistributed earnings of foreign subsidiaries totaled approximately $115,546. The Company considers these unremitted earnings to be permanently invested abroad and no provision for federal or state income taxes has been made on these amounts. In the future, if foreign earnings are returned to the U.S., additional tax may result, although the calculation of such additional taxes is not practical at this time.
As of September 30, 2011, the Company held approximately $40,200 of cash and cash equivalents in bank accounts in foreign taxing jurisdictions.
8 EMPLOYEE BENEFITS
The Company has non-contributory defined benefit pension plans covering certain U.S. employees. Retirement benefits are generally provided based on employees’ years of service and average earnings. Normal retirement age is 65, with provisions for earlier retirement. The Company elected to freeze its U.S. defined benefit pension plans as of September 30, 2009 and as a result, there are no benefit accruals related to service performed after that date.
The financial position of the Company’s non-contributory defined benefit plans as of fiscal year end 2011 and 2010 is as follows:
|
2011
|
2010
|
|||||||
|
Projected benefit obligation:
|
||||||||
|
Projected benefit obligation, beginning of year
|
$ | 19,369 | $ | 18,393 | ||||
|
Service cost
|
- | - | ||||||
|
Interest cost
|
1,003 | 993 | ||||||
|
Actuarial loss
|
1,446 | 767 | ||||||
|
Benefits paid
|
(786 | ) | (784 | ) | ||||
|
Projected benefit obligation, end of year
|
$ | 21,032 | $ | 19,369 | ||||
|
Fair value of plan assets:
|
||||||||
|
Fair value of plan assets, beginning of year
|
$ | 11,817 | $ | 10,346 | ||||
|
Actual (loss) gain on plan assets
|
(91 | ) | 1,148 | |||||
|
Company contributions
|
364 | 1,107 | ||||||
|
Benefits paid
|
(786 | ) | (784 | ) | ||||
|
Fair value of plan assets, end of year
|
$ | 11,304 | $ | 11,817 | ||||
|
Funded status of the plan
|
$ | (9,728 | ) | $ | (7,552 | ) | ||
|
Amounts recognized in the Consolidated Balance Sheets consist of:
|
||||||||
|
Current pension liabilities
|
$ | 197 | $ | 192 | ||||
|
Noncurrent pension liabilities
|
9,531 | 7,360 | ||||||
|
Accumulated other comprehensive loss
|
(7,636 | ) | (5,315 | ) | ||||
|
Components of accumulated other comprehensive loss:
|
||||||||
|
Net actuarial loss
|
(7,636 | ) | (5,315 | ) | ||||
|
Accumulated other comprehensive loss
|
$ | (7,636 | ) | $ | (5,315 | ) | ||
F-26
Net periodic benefit cost for the non-contributory defined benefit pension plans for the respective years includes the following components:
|
2011
|
2010
|
|||||||
|
Service cost
|
$ | - | $ | - | ||||
|
Interest cost
|
1,003 | 993 | ||||||
|
Expected return on plan assets
|
(962 | ) | (972 | ) | ||||
|
Amortization of unrecognized net loss
|
177 | 94 | ||||||
|
Net periodic pension cost
|
218 | 115 | ||||||
|
Other changes in benefit obligations recognized i
n other comprehensive income (loss), (OCI):
|
||||||||
|
Net loss
|
2,321 | 497 | ||||||
|
Total recognized in net periodic pension cost and OCI
|
$ | 2,539 | $ | 612 | ||||
The Company expects to recognize $315 of unrecognized loss amortization as a component of net periodic benefit cost in 2012. This amount is included in accumulated other comprehensive income as of September 30, 2011.
The accumulated benefit obligation for all plans was $21,032 and $19,369 at September 30, 2011 and October 1, 2010, respectively.
At September 30, 2011, the aggregate accumulated benefit obligation and aggregate fair value of plan assets for plans with benefit obligations in excess of plan assets was $21,032 and $11,304, respectively, and there were no plans with plan assets in excess of benefit obligations. At October 1, 2010, the aggregate accumulated benefit obligation and aggregate fair value of plan assets for plans with benefit obligations in excess of plan assets was $19,369 and $11,817, respectively, and there were no plans with plan assets in excess of benefit obligations.
The Company anticipates making contributions to the defined benefit pension plans of $885 through September 28, 2012.
Estimated benefit payments from the defined benefit plans to participants for the five years ending September 2016 and five years thereafter are as follows:
|
Year
|
||||
|
2012
|
$ | 837 | ||
|
2013
|
843 | |||
|
2014
|
854 | |||
|
2015
|
868 | |||
|
2016
|
876 | |||
|
Five years thereafter
|
4,886 | |||
Actuarial assumptions used to determine the projected benefit obligation and net periodic pension cost as of the following fiscal years ended are as follows:
|
Projected Benefit
|
Net Periodic
|
|||||||||||||||
|
Obligation
|
Pension Cost
|
|||||||||||||||
|
2011
|
2010
|
2011
|
2010
|
|||||||||||||
|
Discount rate
|
5.00 | % | 5.25 | % | 5.25 | % | 5.50 | % | ||||||||
|
Long-term rate of return
|
N/A | N/A | 7.50 | % | 8.00 | % | ||||||||||
|
Average salary increase rate
|
N/A | N/A | N/A | N/A | ||||||||||||
F-27
The impact of the change in discount rates resulted in an actuarial loss of approximately $747 in 2011 and $705 in 2010. The remainder of the actuarial losses for each year results from adjustments to mortality tables, other modifications to actuarial assumptions and investment returns in excess of, or less than, estimates.
To determine the discount rate assumption used in the Company’s pension valuation, the Company identified a benefit payout stream based on the demographics of the pension plans and constructed a hypothetical bond portfolio using high-quality corporate bonds with cash flows that matched that benefit payout stream. A yield curve was calculated based on this hypothetical portfolio which was used for the discount rate determination.
The Company determines the long-term rate of return assumption for plan assets by using the historical asset returns for various investment asset classes and adjusting them to reflect future expectations. The expected asset class returns are weighted by the targeted asset allocations, resulting in a weighted average return which is rounded to the nearest quarter percent.
The Company uses measurement dates of October 1 to determine pension expenses for each year and the last day of the fiscal year to determine the fair value of the pension assets.
The Company’s pension plans’ weighted average asset allocations at September 30, 2011 and October 1, 2010, by asset category were as follows:
|
2011
|
2010
|
|||||||
|
Equity securities
|
75 | % | 71 | % | ||||
| Fixed income securities | 24 | 27 | ||||||
| Other securities | 1 | 2 | ||||||
| Total | 100 | % | 100 | % | ||||
The Company’s primary investment objective for the plans’ assets is to maximize the probability of meeting the plans’ actuarial target rate of return of 7.5%, with a secondary goal of returning 4% above the rate of inflation. These return objectives are targeted while simultaneously striving to minimize risk of loss to the plans’ assets. The investment horizon over which the investment objectives are expected to be met is a full market cycle or five years, whichever is greater.
The Company’s investment strategy for the plans is to invest in a diversified portfolio that will generate average long-term returns commensurate with the aforementioned objectives while minimizing risk.
The following table summarizes the Company’s pension plan assets as of September 30, 2011:
|
Level 1
|
Level 2
|
Level 3
|
Total
|
|||||||||||||
|
Description:
|
||||||||||||||||
|
Mutual fund
|
$ | 10,854 | $ | - | $ | - | $ | 10,854 | ||||||||
|
Money market funds
|
3 | - | - | 3 | ||||||||||||
|
Group annuity contract
|
- | - | 411 | 411 | ||||||||||||
|
Total
|
$ | 10,857 | $ | - | $ | 411 | $ | 11,268 | ||||||||
The following table summarizes the Company’s pension plan assets as of October 1, 2010:
|
Level 1
|
Level 2
|
Level 3
|
Total
|
|||||||||||||
|
Description:
|
||||||||||||||||
|
Mutual fund
|
$ | 11,303 | $ | - | $ | - | $ | 11,303 | ||||||||
|
Money market funds
|
43 | - | - | 43 | ||||||||||||
|
Group annuity contract
|
- | - | 471 | 471 | ||||||||||||
|
Total
|
$ | 11,346 | $ | - | $ | 471 | $ | 11,817 | ||||||||
F-28
The tables below set forth a summary of changes in fair value of the Company’s Level 3 pension plan assets for the years ended September 30, 2011 and October 1, 2010:
|
2011
|
2010
|
|||||||
|
Level 3 assets, beginning of year
|
$ | 471 | $ | 533 | ||||
|
Unrealized gain (loss)
|
16 | 14 | ||||||
|
Purchases, sales, issuances and settlements, net
|
(76 | ) | (76 | ) | ||||
|
Level 3 assets, end of year
|
$ | 411 | $ | 471 | ||||
The fair values of the money market fund and mutual fund were derived from quoted market prices as substantially all of these instruments have active markets. The fair value of the group annuity contract was derived using a discounted cash flow model with inputs based on current yields of similar instruments with comparable durations. The asset allocation of the mutual fund is a U.S. large-cap blend based on a moderate allocation style, generally investing approximately 70% to 75% in equity securities and the remainder in fixed income securities. The annuity contract consists of high quality bonds.
The Company also has a non-qualified deferred compensation plan that provides certain officers and employees the ability to defer a portion of their compensation until a later date. The deferred amounts and earnings thereon are payable to participants, or designated beneficiaries, at specified future dates upon retirement, death or termination from the Company. The deferred compensation liability, which is classified as other liabilities, was approximately $5,405 and $5,514 as of September 30, 2011 and October 1, 2010, respectively.
A majority of the Company’s full-time employees are covered by defined contribution programs. Expense attributable to the defined contribution programs was approximately $853 and $826 for 2011 and 2010, respectively.
9 PREFERRED STOCK
The Company is authorized to issue 1,000,000 shares of preferred stock in various classes and series, of which there are none currently issued or outstanding.
10 COMMON STOCK
The number of authorized and outstanding shares of each class of the Company's common stock at the end of the respective years was as follows:
|
2011
|
2010
|
|||||||
|
Class A, $0.05 par value:
|
||||||||
|
Authorized
|
20,000,000 | 20,000,000 | ||||||
|
Outstanding
|
8,567,549 | 8,363,313 | ||||||
|
Class B, $0.05 par value:
|
||||||||
|
Authorized
|
3,000,000 | 3,000,000 | ||||||
|
Outstanding
|
1,215,842 | 1,216,464 | ||||||
Holders of Class A common stock are entitled to elect 25% of the members of the Company’s Board of Directors and holders of Class B common stock are entitled to elect the remaining directors. With respect to matters other than the election of directors or any matters for which class voting is required by law, holders of Class A common stock are entitled to one vote per share while holders of Class B common stock are entitled to ten votes per share. If any dividends (other than dividends paid in shares of the Company’s stock) are paid by the Company on its common stock, a dividend would be paid on each share of Class A common stock equal to 110% of the amount paid on each share of Class B common stock. Each share of Class B common stock is convertible at any time into one share of Class A common stock. During 2011 there were 622 shares of Class B common stock converted into Class A common stock. There were no shares of Class A common stock converted into Class B common stock.
F-29
11 STOCK-BASED COMPENSATION AND STOCK OWNERSHIP PLANS
The Company’s current stock ownership plans provide for issuance of options to acquire shares of Class A common stock by key executives and non-employee directors. Current plans also allow for issuance of shares of restricted stock or stock appreciation rights in lieu of options.
Under the Company’s 2010 Long-Term Stock Incentive Plan and the 2003 Non-Employee Director Stock Ownership Plan there were 910,061 shares of the Company’s Class A common stock available for grant to key executives and non-employee directors at September 30, 2011.
Stock Options
All stock options have been granted at a price not less than fair market value at the date of grant and become exercisable over periods of one to three years from the date of grant. Stock options generally have a term of 10 years.
All of the Company’s stock options outstanding are fully vested, with no further compensation expense to be recorded. There were no grants of stock options in 2011 or 2010.
A summary of stock option activity related to the Company’s plans is shown below.
|
Shares
|
Weighted
Average
Exercise Price
|
Weighted
Average
Remaining
Contractural
Term (in years)
|
Aggregate
Intrinsic
Value
|
||||||||||
|
Outstanding at October 2, 2009
|
180,288 | $ | 8.23 | ||||||||||
|
Exercised
|
(55,250 | ) | 7.29 | ||||||||||
|
Cancelled
|
(11,334 | ) | 9.39 | ||||||||||
|
Outstanding at October 1, 2010
|
113,704 | 8.57 | |||||||||||
|
Exercised
|
(40,780 | ) | 5.79 | $ | 331 | ||||||||
|
Cancelled
|
(4,334 | ) | 6.28 | 40 | |||||||||
|
Outstanding and exercisable at September 30, 2011
|
68,590 | 10.37 |
1.1
|
397 | |||||||||
The aggregate intrinsic value in the preceding table represents the total pretax intrinsic value, based on the Company’s closing stock price of $15.38 as of September 30, 2011, which would have been received by the option holders had those option holders exercised their stock options as of that date.
The Company received cash proceeds from stock option exercises totaling $323 and $484 for the years ending September 30, 2011 and October 1, 2010, respectively.
Non-Vested Stock
All shares of non-vested stock awarded by the Company have been granted at their fair market value on the date of grant and vest either immediately or in three to five years after the grant date.
Grants of non-vested stock were 161,825 and 230,650 with a total value of $2,224 and $2,209 during 2011 and 2010, respectively. The fair value at date of grant is based on the number of shares granted and the average of the Company’s high and low stock price on the date of grant or, if the Company’s shares did not trade on the date of grant, the average of the Company’s high and low stock price on the last preceding date on which the Company’s shares traded.
Stock compensation expense, net of forfeitures, related to non-vested stock was $1,436 and $956 during 2011 and 2010, respectively. The intrinsic value of shares vested during 2011 and 2010 was $150 and $125, respectively. There were 4,466 shares of non-vested restricted stock forfeited during 2011, which had an original fair market value at date of grant of $40. There were no forfeitures of non-vested restricted stock during 2010.
F-30
Non-vested stock issued and outstanding as of September 30, 2011 and October 1, 2010 totaled 472,761 and 325,172 shares, having a gross unamortized value of $2,890 and $2,142, respectively, which will be amortized to expense through November 2015 or adjusted for changes in future estimated or actual forfeitures.
Non-vested stock grantees may elect to reimburse the Company for withholding taxes due as a result of the vesting of non-vested shares by tendering a portion of the vested shares back to the Company. No shares were tendered back to the Company during 2011 or 2010.
A summary of non-vested stock activity for the year ended September 30, 2011 related to the Company’s stock ownership plans is as follows:
|
Shares
|
Weighted
Average
Grant
Price
|
|||||||
|
Non-vested stock at October 2, 2009
|
105,827 | $ | 14.08 | |||||
|
Non-vested stock grants
|
230,650 | 9.58 | ||||||
|
Restricted stock vested
|
(11,305 | ) | 11.06 | |||||
|
Non-vested stock at October 1, 2010
|
325,172 | 10.99 | ||||||
|
Non-vested stock grants
|
161,825 | 13.74 | ||||||
|
Non-vested stock cancelled
|
(4,466 | ) | 9.12 | |||||
|
Restricted stock vested
|
(9,770 | ) | 15.35 | |||||
|
Non-vested stock at September 30, 2011
|
472,761 | $ | 11.86 | |||||
Employee Stock Purchase Plan
The 2009 Employees’ Stock Purchase Plan (the “Purchase Plan”) provides for the issuance of shares of Class A common stock at a purchase price of not less than 85% of the fair market value of such shares on the date of grant or at the end of the offering period, whichever is lower. The Company issued 5,475 shares of Class A common stock under the Purchase Plan and recognized expense of $16 in 2011. The Company issued 10,448 shares of Class A common stock under the Purchase Plan and recognized expense of $24 in 2010.
12 RELATED PARTY TRANSACTIONS
The Company conducts transactions with certain related parties including organizations controlled by the Johnson Family and other related parties. These transactions include consulting services, aviation services, office rental, and certain administrative activities. Total costs of these transactions were $1,487 and $1,674 for 2011 and 2010, respectively. Amounts due to/from related parties were immaterial at
September 30, 2011 and October 1, 2010.
13 SEGMENTS OF BUSINESS
The Company conducts its worldwide operations through separate business segments, each of which represent major product lines. Operations are conducted in the U.S. and various foreign countries, primarily in Europe, Canada and the Pacific Basin.
Net sales and operating profit include both sales to customers, as reported in the Company’s Consolidated Statements of Operations, and inter-unit transfers, which are priced to recover costs plus an appropriate profit margin. Total assets represent assets that are used in the Company’s operations in each business segment at the end of the years presented.
F-31
A summary of the Company’s operations by business segment is presented below:
|
2011
|
2010
|
||||||||
|
Net sales:
|
|||||||||
|
Marine Electronics:
|
Unaffiliated customers
|
$ | 221,839 | $ | 185,206 | ||||
|
Interunit transfers
|
276 | 288 | |||||||
|
Outdoor Equipment:
|
Unaffiliated customers
|
38,832 | 48,623 | ||||||
|
Interunit transfers
|
50 | 67 | |||||||
|
Watercraft:
|
Unaffiliated customers
|
57,583 | 63,857 | ||||||
|
Interunit transfers
|
149 | 144 | |||||||
|
Diving:
|
Unaffiliated customers
|
88,627 | 84,222 | ||||||
|
Interunit transfers
|
917 | 854 | |||||||
|
Other/Corporate
|
541 | 524 | |||||||
|
Eliminations
|
(1,392 | ) | (1,353 | ) | |||||
| $ | 407,422 | $ | 382,432 | ||||||
|
Operating profit (loss):
|
|||||||||
|
Marine Electronics
|
$ | 21,074 | $ | 13,938 | |||||
|
Outdoor Equipment
|
2,996 | 5,881 | |||||||
|
Watercraft
|
(1,351 | ) | 1,826 | ||||||
|
Diving
|
3,610 | 3,030 | |||||||
|
Other/Corporate
|
(8,659 | ) | (10,121 | ) | |||||
| $ | 17,670 | $ | 14,554 | ||||||
|
Depreciation and amortization expense:
|
|||||||||
|
Marine Electronics
|
$ | 5,694 | $ | 4,923 | |||||
|
Outdoor Equipment
|
479 | 521 | |||||||
|
Watercraft
|
1,454 | 1,455 | |||||||
|
Diving
|
1,942 | 1,574 | |||||||
|
Other/Corporate
|
1,308 | 1,504 | |||||||
| $ | 10,877 | $ | 9,977 | ||||||
|
Additions to property, plant and equipment:
|
|||||||||
|
Marine Electronics
|
$ | 5,283 | $ | 6,923 | |||||
|
Outdoor Equipment
|
262 | 201 | |||||||
|
Watercraft
|
1,274 | 1,314 | |||||||
|
Diving
|
1,269 | 811 | |||||||
|
Other/Corporate
|
1,279 | 717 | |||||||
| $ | 9,367 | $ | 9,966 | ||||||
|
Total assets:
|
|||||||||
|
Marine Electronics
|
$ | 101,739 | $ | 85,164 | |||||
|
Outdoor Equipment
|
24,046 | 23,192 | |||||||
|
Watercraft
|
34,614 | 34,420 | |||||||
|
Diving
|
67,969 | 70,388 | |||||||
|
Other/Corporate
|
30,988 | 13,592 | |||||||
| $ | 259,356 | $ | 226,756 | ||||||
|
Goodwill, net:
|
|||||||||
|
Marine Electronics
|
$ | 10,397 | $ | 9,674 | |||||
|
Outdoor Equipment
|
- | - | |||||||
|
Watercraft
|
- | - | |||||||
|
Diving
|
4,254 | 4,055 | |||||||
| $ | 14,651 | $ | 13,729 | ||||||
F-32
A summary of the Company’s operations by geographic area is presented below:
|
2011
|
2010
|
|||||||
|
Net sales:
|
||||||||
|
United States:
|
||||||||
|
Unaffiliated customers
|
$ | 298,193 | $ | 274,998 | ||||
|
Interarea transfers
|
18,276 | 15,785 | ||||||
|
Europe:
|
||||||||
|
Unaffiliated customers
|
66,681 | 65,622 | ||||||
|
Interarea transfers
|
9,854 | 9,670 | ||||||
|
Other:
|
||||||||
|
Unaffiliated customers
|
42,548 | 41,812 | ||||||
|
Interarea transfers
|
2,324 | 2,386 | ||||||
|
Eliminations
|
(30,454 | ) | (27,841 | ) | ||||
| $ | 407,422 | $ | 382,432 | |||||
|
Total assets:
|
||||||||
|
United States
|
$ | 161,355 | $ | 128,534 | ||||
|
Europe
|
64,218 | 68,657 | ||||||
|
Other
|
33,783 | 29,565 | ||||||
| $ | 259,356 | $ | 226,756 | |||||
|
Long-term assets:
(1)
|
||||||||
|
United States
|
$ | 53,316 | $ | 52,475 | ||||
|
Europe
|
9,348 | 10,051 | ||||||
|
Other
|
716 | 782 | ||||||
| $ | 63,380 | $ | 63,308 | |||||
|
(1)
Long-term assets consist of net property, plant and equipment, net intangible assets,
|
||||||||
|
goodwill and other assets excluding deferred income taxes.
|
||||||||
The Company had no single customer that accounted for more than 10% of its net sales in fiscal 2011 or 2010.
14 LITIGATION
The Company is subject to various legal actions and proceedings in the normal course of business, including those related to commercial disputes, product liability, intellectual property and environmental matters. The Company is insured against loss for certain of these matters. Although litigation is subject to many uncertainties and the ultimate exposure with respect to these matters cannot be ascertained, management does not believe the final outcome of any pending litigation will have a material adverse effect on the financial condition, results of operations, liquidity or cash flows of the Company.
On July 10, 2007, after considering the costs, risks and business distractions associated with continued litigation, the Company reached a settlement agreement with Confluence Holdings Corp. that ended a long-standing intellectual property dispute between the two companies. The Company has made a claim with its insurance carriers to recover the $4,400 settlement payment, plus litigation costs (approximately $1,300). This matter is presently the subject of litigation in the U.S. District Court for the Eastern District of Wisconsin. The Company is unable to estimate the outcome of the litigation with its insurance carriers,
including the amount of the insurance recovery, if any, at this time and, accordingly, has not recorded a receivable for this matter.
F-33
15 SIGNIFICANT EVENT
On September 12, 2011, the Company announced a temporary closure of its Binghamton, New York manufacturing facility and administrative offices due to flooding from torrential rains. The Binghamton manufacturing facility houses the Company’s consumer, commercial and military tent businesses. The Company’s finished goods warehouse located nearby was unaffected by the flooding and the Company was able to resume shipments of products within a few days. Production resumed on September 28, 2011.
The Company maintains insurance for both property damage and business interruption relating to catastrophic events. Business interruption coverage covers lost profits and other costs incurred. Non-refundable insurance recoveries received in excess of the net book value of damaged assets, clean up and post-event costs are recognized as income in the period received.
The Company has incurred approximately $1,868 of costs related to the clean up and repair of the facility and equipment, losses of inventory and fixed assets, rental of temporary office space for administrative and R&D personnel and payroll expenses for labor idled due to the flood. The Company has received $1,000 of insurance reimbursements associated with these costs and has recorded a receivable with its insurers of $611. The Company has recognized an expense of $257 in Administrative, finance and information systems expense in the Outdoor Equipment segment.
The Company is negotiating insurance recoveries under its business continuation and fixed asset replacement coverages. The amount of these recoveries, if any, can not be estimated at September 30, 2011. Any such recoveries will be recorded as income upon the resolution of gain contingencies.
F-34
TABLE OF CONTENTS
Part IItem 1. BusinessItem 1A. Risk FactorsItem 1A. Unresolved Staff CommentsItem 2. PropertiesItem 3. Legal ProceedingsItem 4. [removed and Reserved]Part IIItem 5. Market For Registrant S Common Equity, Related Stockholder Matters and Issuer Purchases Equity SecuritiesItem 6. Selected Financial DataItem 7. Management S Discussion and Analysis Of Financial Condition and Results Of OperationsItem 7A. Quantitative and Qualitiative Disclosures About Market RiskItem 8. Financial Statements and Supplementary DataItem 9. Changes in and Disagreements with Accountants on Accounting and Financial DisclosureItem 9A. Controls and ProceduresItem 9B. Other InformationPart IIIItem 10. Directors, Executive Officers and Corporate GovernanceItem 11. Executive CompensationItem 12. Security Ownership Of Certain Beneficial Owners and Management and Related StockholderItem 13. Certain Relationships and Related Transactions and Director IndependenceItem 14. Principal Accountant Fees and ServicesPart IVItem 15. Exhibits and Financial Statement Schedules