JPMORGAN CHASE & CO
10-Ks and 10-Qs
|
|
|
|
|
|
|
|
|
|
|
|
|
|
|
|
|
|
|
|
|
|
|
|
|
|
|
|
|
|
|
|
|
|
|
|
|
|
|
|
|
|
|
|
|
|
|
|
|
|
UNITED STATES
SECURITIES AND EXCHANGE COMMISSION
WASHINGTON, D.C. 20549
FORM 10-K
Annual report pursuant to Section 13 or 15(d) of
The Securities Exchange Act of 1934
|
For the fiscal year ended
|
Commission file
|
|
|
December 31, 2014
|
number 1-5805
|
|
JPMorgan Chase & Co.
(Exact name of registrant as specified in its charter)
|
Delaware
|
13-2624428
|
|
|
(State or other jurisdiction of
incorporation or organization)
|
(I.R.S. employer
identification no.)
|
|
|
|
||
|
270 Park Avenue, New York, New York
|
10017
|
|
|
(Address of principal executive offices)
|
(Zip code)
|
|
Registrant’s telephone number, including area code: (212) 270-6000
Securities registered pursuant to Section 12(b) of the Act:
|
Title of each class
|
Name of each exchange on which registered
|
|
|
Common stock
|
The New York Stock Exchange
|
|
|
The London Stock Exchange
|
||
|
The Tokyo Stock Exchange
|
||
|
Warrants, each to purchase one share of Common Stock
|
The New York Stock Exchange
|
|
|
Depositary Shares, each representing a one-four hundredth interest in a share of 5.50% Non-Cumulative Preferred Stock, Series O
|
The New York Stock Exchange
|
|
|
Depositary Shares, each representing a one-four hundredth interest in a share of 5.45% Non-Cumulative Preferred Stock, Series P
|
The New York Stock Exchange
|
|
|
Depositary Shares, each representing a one-four hundredth interest in a share of 6.70% Non-Cumulative Preferred Stock, Series T
|
The New York Stock Exchange
|
|
|
Depositary Shares, each representing a one-four hundredth interest in a share of 6.30% Non-Cumulative Preferred Stock, Series W
|
The New York Stock Exchange
|
|
|
Guarantee of 6.70% Capital Securities, Series CC, of JPMorgan Chase Capital XXIX
|
The New York Stock Exchange
|
|
|
Alerian MLP Index ETNs due May 24, 2024
|
NYSE Arca, Inc.
|
|
Securities registered pursuant to Section 12(g) of the Act: None
Indicate by check mark if the registrant is a well-known seasoned issuer, as defined in Rule 405 of the Securities Act.
ý
Yes
o
No
Indicate by check mark if the registrant is not required to file reports pursuant to Section 13 or
Section 15(d)
of the Act.
o
Yes
ý
No
Indicate by check mark whether the registrant (1) has filed all reports required to be filed by Section 13 or
15(d)
of the Securities Exchange Act of 1934 during the preceding 12 months (or for such shorter period that the registrant was required to file such reports), and (2) has been subject to such filing requirements for the past 90 days.
ý
Yes
o
No
Indicate by check mark whether the registrant has submitted electronically and posted on its corporate Website, if any, every Interactive Data File required to be submitted and posted pursuant to Rule 405 of Regulation S-T (§ 232.405 of this chapter) during the preceding 12 months (or for such shorter period that the registrant was required to submit and post such files).
ý
Yes
o
No
Indicate by check mark if disclosure of delinquent filers pursuant to Item 405 of Regulation S-K (§229.405 of this chapter) is not contained herein, and will not be contained, to the best of registrant’s knowledge, in definitive proxy or information statements incorporated by reference in Part III of this
Form 10-K
or any amendment to this
Form 10-K.
ý
Indicate by check mark whether the registrant is a large accelerated filer, an accelerated filer, a non-accelerated filer, or a smaller reporting company. See definitions of “large accelerated filer,” “accelerated filer,” and “smaller reporting company” in Rule 12b-2 of the Exchange Act.
|
ý
Large accelerated filer
|
o
Accelerated filer
|
o
Non-accelerated filer
(Do not check if a smaller reporting company)
|
o
Smaller reporting company
|
Indicate by check mark whether the registrant is a shell company (as defined in Rule 12b-2 of the Exchange Act).
o
Yes
ý
No
The aggregate market value of
JPMorgan Chase & Co.
common stock held by non-affiliates as of
June 30, 2014
:
$215,577,956,743
Number of shares of common stock outstanding as of
January 31, 2015
:
3,728,312,555
Documents incorporated by reference: Portions of the registrant’s Proxy Statement for the annual meeting of stockholders to be held on
May 19, 2015
, are incorporated by reference in this Form 10-K in response to Items 10, 11, 12, 13 and 14 of Part III.
Form 10-K Index
|
Page
|
||
|
1
|
||
|
1
|
||
|
1
|
||
|
1
|
||
|
1
|
||
|
314–318
|
||
|
62, 307, 314
|
||
|
319
|
||
|
110–127, 238–257,
320–325 |
||
|
128–130, 258–261,
326–327 |
||
|
276, 328
|
||
|
329
|
||
|
8–17
|
||
|
17
|
||
|
17-18
|
||
|
18
|
||
|
18
|
||
|
|
18–19
|
|
|
19
|
||
|
19
|
||
|
19
|
||
|
20
|
||
|
20
|
||
|
20
|
||
|
21
|
||
|
22
|
||
|
23
|
||
|
|
23
|
|
|
23
|
||
|
23
|
||
|
24–27
|
||
Part I
ITEM 1: BUSINESS
Overview
JPMorgan Chase & Co.,
(“JPMorgan Chase” or the “Firm”)
a financial holding company incorporated under Delaware law in 1968, is a leading global financial services firm and one of the largest banking institutions in the
United States of America (“
U.S.
”)
, with operations worldwide; the Firm had
$2.6 trillion
in assets and
$232.1 billion
in stockholders’ equity as of
December 31, 2014
.
The Firm is a leader in investment banking, financial services for consumers and small businesses, commercial banking, financial transaction processing and asset management. Under the J.P. Morgan and Chase brands, the Firm serves millions of customers in the U.S. and many of the world’s most prominent corporate, institutional and government clients.
JPMorgan Chase’s principal bank subsidiaries are JPMorgan Chase Bank, National Association (“JPMorgan Chase Bank, N.A.”), a national banking association with U.S. branches in
23
states, and Chase Bank USA, National Association (“Chase Bank USA, N.A.”), a national banking association that is the Firm’s credit card–issuing bank. JPMorgan Chase’s principal nonbank subsidiary is J.P. Morgan Securities LLC (“JPMorgan Securities”), the Firm’s U.S. investment banking firm. The bank and nonbank subsidiaries of JPMorgan Chase operate nationally as well as through overseas branches and subsidiaries, representative offices and subsidiary foreign banks. One of the Firm’s principal operating subsidiaries in the
United Kingdom (“
U.K.
”)
is J.P. Morgan Securities plc, a subsidiary of JPMorgan Chase Bank, N.A.
The Firm’s website is www.jpmorganchase.com. JPMorgan Chase makes available free of charge, through its website, annual reports on Form 10-K, quarterly reports on Form 10-Q, current reports on Form 8-K, and any amendments to those reports filed or furnished pursuant to Section 13(a) or Section 15(d) of the Securities Exchange Act of 1934, as soon as reasonably practicable after it electronically files such material with, or furnishes such material to, the U.S. Securities and Exchange Commission (the “SEC”). The Firm has adopted, and posted on its website, a Code of Ethics for its Chairman and Chief Executive Officer, Chief Financial Officer, Chief Accounting Officer and other finance professionals of the Firm.
Business segments
JPMorgan Chase’s activities are organized, for management reporting purposes, into
four
major reportable business segments, as well as a Corporate
segment. The Firm’s consumer business is the Consumer & Community Banking segment. The Corporate & Investment Bank, Commercial Banking, and Asset Management segments comprise the Firm’s wholesale businesses.
A description of the Firm’s business segments and the products and services they provide to their respective client bases is provided in the “Business segment results” section of Management’s discussion and analysis of financial condition and results of operations (“MD&A”), beginning on page
64
and in Note 33.
Competition
JPMorgan Chase and its subsidiaries and affiliates operate in a highly competitive environment. Competitors include other banks, brokerage firms, investment banking companies, merchant banks, hedge funds, commodity trading companies, private equity firms, insurance companies, mutual fund companies, investment managers, credit card companies, mortgage banking companies, trust companies, securities processing companies, automobile financing companies, leasing companies, e-commerce and other Internet-based companies, and a variety of other financial services and advisory companies. JPMorgan Chase’s businesses generally compete on the basis of the quality and range of their products and services, transaction execution, innovation and price. Competition also varies based on the types of clients, customers, industries and geographies served. With respect to some of its geographies and products, JPMorgan Chase competes globally; with respect to others, the Firm competes on a national or regional basis. The Firm’s ability to compete also depends on its ability to attract and retain professional and other personnel, and on its reputation.
The financial services industry has experienced consolidation and convergence in recent years, as financial institutions involved in a broad range of financial products and services have merged and, in some cases, failed. This consolidation is expected to continue. Consolidation could result in competitors of JPMorgan Chase gaining greater capital and other resources, such as a broader range of products and services and geographic diversity. It is likely that competition will become even more intense as the Firm’s businesses continue to compete with other financial institutions that may have a stronger local presence in certain geographies or that operate under different rules and regulatory regimes than the Firm.
Supervision and regulation
The Firm is subject to regulation under state and federal laws in the U.S., as well as the applicable laws of each of the various jurisdictions outside the U.S. in which the Firm does business.
As a result of rule-making following the enactment of the Wall Street Reform and Consumer Protection Act (the “Dodd-Frank Act”) and other regulatory reforms enacted and proposed in the U.S. and abroad, the Firm is currently experiencing a period of unprecedented change in regulation and such changes could have a significant impact on how the Firm conducts business. The Firm continues to work diligently in assessing the regulatory changes it is facing, and is devoting substantial resources to implementing all the new regulations, while, at the same time, best meeting the needs and expectations of its
|
1
|
||
Part I
customers, clients and shareholders. The combined effect of numerous rule-makings by multiple governmental agencies and regulators, and the potential conflicts or inconsistencies among such rules, present challenges and risks to the Firm’s business and operations. Given the current status of the regulatory developments, the Firm cannot currently quantify the possible effects on its business and operations of all of the significant changes that are currently underway. For more information, see Risk Factors on
pages 8–17
.
Financial holding company:
Consolidated supervision by the Federal Reserve
. As a bank holding company (“BHC”) and a financial holding company, JPMorgan Chase is subject to comprehensive consolidated supervision, regulation and examination by the Board of Governors of the Federal Reserve System (the “Federal Reserve”). The Federal Reserve acts as an “umbrella regulator” and certain of JPMorgan Chase’s subsidiaries are regulated directly by additional authorities based on the particular activities of those subsidiaries. For example, JPMorgan Chase’s national bank subsidiaries, such as JPMorgan Chase Bank, N.A., and Chase Bank USA, N.A., are subject to supervision and regulation by the Office of the Comptroller of the Currency (“OCC”) and, with respect to certain matters, by the Federal Reserve and the Federal Deposit Insurance Corporation (the “FDIC”). Non-bank subsidiaries, such as the Firm’s U.S. broker-dealers, are subject to supervision and regulation by the Securities and Exchange Commission (“SEC”), and with respect to certain futures-related and swaps-related activities, by the Commodity Futures Trading Commission (“CFTC”). See Securities and broker-dealer regulation, Investment management regulation and Derivatives regulation below.
As a result of the Dodd-Frank Act, JPMorgan Chase is, or will become, subject to (among other things) significantly revised and expanded regulation and supervision, additional limitations on the way it conducts its businesses, and heightened capital and liquidity requirements. In addition, the Consumer Financial Protection Bureau (“CFPB”), which was created by the Dodd-Frank Act, has rulemaking, enforcement and examination authority over JPMorgan Chase and its subsidiaries with respect to federal consumer protection laws.
Scope of permissible business activities.
The Bank Holding Company Act generally restricts BHCs from engaging in business activities other than the business of banking and certain closely related activities. Financial holding companies generally can engage in a broader range of financial activities than are otherwise permissible for BHCs, as long as they continue to meet the eligibility requirements for financial holding companies (including requirements that the financial holding company and each of its U.S. depository institution subsidiaries maintain their status as “well capitalized” and “well managed”). The broader range of permissible activities for financial holding companies includes underwriting, dealing and making markets in
securities, and making merchant banking investments in non-financial companies.
The Federal Reserve has the authority to limit a financial holding company’s ability to conduct activities that would otherwise be permissible if the financial holding company or any of its depositary institution subsidiaries ceases to meet the applicable eligibility requirements. The Federal Reserve may also impose corrective capital and/or managerial requirements on the financial holding company and may require divestiture of the holding company’s depository institutions if the deficiencies persist. Federal regulations also provide that if any depository institution controlled by a financial holding company fails to maintain a satisfactory rating under the Community Reinvestment Act, the Federal Reserve must prohibit the financial holding company and its subsidiaries from engaging in any activities other than those permissible for bank holding companies. In addition, a financial holding company must obtain Federal Reserve approval before engaging in certain banking and other financial activities both in the U.S. and internationally, as further described under Regulation of acquisitions below.
Activities restrictions under the Volcker Rule.
Section 619 of the Dodd-Frank Act (the “Volcker Rule”) prohibits banking entities, including the Firm, from engaging in certain “proprietary trading” activities, subject to exceptions for underwriting, market-making, risk-mitigating hedging and certain other activities. In addition, the Volcker Rule limits the sponsorship, and investment in, “covered funds” (as defined by the Rule) and imposes limits on certain transactions between the Firm and its sponsored funds (see Investment management regulation below). The Volcker Rule requires banking entities to establish comprehensive compliance programs designed to help ensure and monitor compliance with the restrictions under the Volcker Rule, including, in order to distinguish permissible from impermissible risk-taking activities, the measurement and monitoring of seven metrics. The Firm has taken significant steps to comply with the Volcker Rule. However, given the complexity of the new framework, and the fact that many provisions of the Rule still require further regulatory guidance, the full impact of the Volcker Rule is still uncertain and will ultimately depend on the interpretation and implementation by the five regulatory agencies responsible for its oversight.
Capital and liquidity requirements.
The Federal Reserve establishes capital and leverage requirements for the Firm and evaluates its compliance with such capital requirements. The OCC establishes similar capital and leverage requirements for the Firm’s national banking subsidiaries. For more information about the applicable requirements relating to risk-based capital and leverage in the U.S. under the Basel Committee’s most recent capital framework (“Basel III”), see Regulatory capital on
pages 146–153
and Note 28. It is likely that the banking supervisors will continue to refine and enhance the Basel III capital framework for financial institutions. Recent proposals being contemplated by the Basel Committee
|
2
|
||
include, among others, revisions to market risk capital for trading books, credit risk capital calculations, the measurement methodology to calculate counterparty credit risk and revisions to the securitization framework. After a proposal is finalized by the Basel Committee, U.S. banking regulators would then need to propose requirements applicable to U.S. financial institutions. Under Basel III, bank holding companies and banks are required to measure their liquidity against two specific liquidity tests: the liquidity coverage ratio (“LCR”) and the net stable funding ratio (“NSFR”). For additional information on these ratios, see Liquidity Risk Management on
pages 156–160
.
Stress tests.
Pursuant to the Dodd-Frank Act, the Federal Reserve has adopted supervisory stress tests for large bank holding companies, including JPMorgan Chase, which form part of the Federal Reserve’s annual Comprehensive Capital Analysis and Review (“CCAR”) framework. Under the framework, the Firm must conduct semi-annual company-run stress tests, and, in addition, must submit an annual capital plan to the Federal Reserve, taking into account the results of separate stress tests designed by the Firm and the Federal Reserve. In reviewing the Firm’s capital plan, the Federal Reserve will consider both quantitative and qualitative factors. Qualitative assessments will include (among other things) the comprehensiveness of the plan, the assumptions and analysis underlying the plan, and the extent to which the Firm has satisfied certain supervisory matters related to the Firm’s processes and analyses. Moreover, the Firm is required to receive a notice of non-objection from the Federal Reserve before taking capital actions, such as paying dividends, implementing common equity repurchase programs or redeeming or repurchasing capital instruments. The OCC requires JPMorgan Chase Bank, N.A. to perform separate, similar annual stress tests. The Firm publishes on its website each year, in July, the results of its mid-year stress tests under the Firm’s internally-developed “severely adverse” scenario and, in March, the results of its (and its two primary subsidiary banks) annual CCAR stress tests under the Federal Reserve’s “severely adverse” scenario. Commencing with the 2016 CCAR, the annual CCAR submission will be due April 5
th
. Results will be published by the Federal Reserve by June 30
th
, with disclosures of results by BHCs to follow within 15 days. Also commencing in 2016, the mid-cycle capital stress test submissions will be due October 5
th
and BHCs will publish results by November 4
th
.
For additional information on the Firm’s CCAR, see Regulatory capital on
pages 146–153
.
Enhanced prudential standards.
The Dodd-Frank Act established a new oversight body, the Financial Stability Oversight Council (“FSOC”), which (among other things) recommends prudential standards, reporting and disclosure requirements to the Federal Reserve for systemically important financial institutions. BHCs with $50 billion or more in total consolidated assets, such as JPMorgan Chase, became automatically subject to the heightened prudential standards. The Federal Reserve has adopted several rules to
implement certain of the heightened prudential standards contemplated by the Dodd-Frank Act, including final rules relating to risk management and corporate governance of subject bank holding companies. Beginning January 1, 2015, the rules require BHCs with $50 billion or more in total consolidated assets to comply with enhanced liquidity and overall risk management standards, including a buffer of highly liquid assets based on projected funding needs for 30 days, and increased involvement by boards of directors in risk management. Several additional proposed rules are still being considered, including rules relating to single-counterparty credit limits and an “early remediation” framework to address financial distress or material management weaknesses.
Risk reporting.
In January 2013, the Basel Committee issued new regulations relating to risk aggregation and reporting. Under these regulations, the banking institution’s risk governance framework must encompass risk-data aggregation and reporting, and data aggregation must be highly automated and allow for minimal manual intervention. The regulations also impose higher standards for the accuracy, comprehensiveness, granularity and timely distribution of data reporting, and call for regular supervisory review of the banking institution’s risk aggregation and reporting. Global systemically important banks (“G-SIBs”) will be required to comply with these new standards by January 1, 2016.
Orderly liquidation authority and other financial stability measures.
As a BHC with assets of $50 billion or more, the Firm is required to submit annually to the Federal Reserve and the FDIC a plan for resolution under the Bankruptcy Code in the event of material distress or failure (a “resolution plan”). The FDIC also requires each insured depositary institution with $50 billion or more in assets to provide a resolution plan. For more information about the Firm’s resolution plan, see Risk Factors on
pages 8–17
. In addition, under the Dodd-Frank Act, certain financial companies, including JPMorgan Chase and certain of its subsidiaries, can be subjected to resolution under a new “orderly liquidation authority.” The U.S. Treasury Secretary, in consultation with the President of the United States, must first make certain extraordinary financial distress and systemic risk determinations, and action must be recommended by the FDIC and the Federal Reserve. Absent such actions, the Firm, as a BHC, would remain subject to resolution under the Bankruptcy Code. In December 2013, the FDIC released its “single point of entry” strategy for resolution of systemically important financial institutions under the orderly liquidation authority. This strategy seeks to keep operating subsidiaries of the BHC open and impose losses on shareholders and creditors of the holding company in receivership according to their statutory order of priority.
Regulators in the U.S. and abroad continue to be focused on measures to address “too big to fail,” and to provide safeguards so that, if a large financial institution does fail, it can be resolved without the use of public funds. Higher
|
3
|
||
Part I
capital surcharges on G-SIBs, requirements recently introduced by the Federal Reserve that certain large bank holding companies maintain a minimum amount of long-term debt to facilitate orderly resolution of those firms, and the recently adopted ISDA protocol relating to the “close-out” of derivatives transactions during the resolution of a large cross-border financial institution, are examples of initiatives to address “too big to fail.” For further information on the potential impact of the G-SIB framework and Total Loss Absorbing Capacity (“TLAC”), see Regulatory capital on
pages 146–153
, and on the ISDA close-out protocol, see Derivatives regulation below.
Holding company as source of strength for bank subsidiaries
. JPMorgan Chase & Co. is required to serve as a source of financial strength for its depository institution subsidiaries and to commit resources to support those subsidiaries. This support may be required by the Federal Reserve at times when the Firm might otherwise determine not to provide it.
Regulation of acquisitions.
Financial holding companies and bank holding companies are required to obtain the approval of the Federal Reserve before they may acquire more than 5% of the voting shares of an unaffiliated bank. In addition, the Dodd-Frank Act restricts acquisitions by financial companies if, as a result of the acquisition, the total liabilities of the financial company would exceed 10% of the total liabilities of all financial companies. This could have the effect of allowing a non-U.S. financial company to grow to hold significantly more than 10% of the U.S. market without exceeding the concentration limit. In addition, under the Dodd-Frank Act, the Firm must provide written notice to the Federal Reserve prior to acquiring direct or indirect ownership or control of any voting shares of any company with over $10 billion in assets that is engaged in activities that are “financial in nature”.
JPMorgan Chase’s subsidiary banks:
The Firm’s two primary subsidiary banks, JPMorgan Chase Bank, N.A. and Chase Bank USA, N.A., are FDIC-insured national banks regulated by the OCC. As national banks, the activities of JPMorgan Chase Bank, N.A. and Chase Bank USA, N.A. are limited to those specifically authorized under the National Bank Act and related interpretations by the OCC.
FDIC deposit insurance.
The FDIC deposit insurance fund provides insurance coverage for certain deposits, which is funded through assessments on banks, such as JPMorgan Chase Bank, N.A. and Chase Bank USA, N.A. Changes in the methodology of the calculation of such assessments, resulting from the enactment of the Dodd-Frank Act, significantly increased the assessments the Firm’s bank subsidiaries pay annually to the FDIC, and future FDIC rule-making could further increase such assessments.
FDIC powers upon a bank insolvency
. Upon the insolvency of an insured depository institution, such as JPMorgan Chase Bank, N.A., the FDIC may be appointed the conservator or receiver under the Federal Deposit Insurance Act (“FDIA”). In addition, as noted above, where a systemically important financial institution, such as JPMorgan Chase & Co., is in
default or danger of default, the FDIC may be appointed receiver in order to conduct an orderly liquidation. In both cases, the FDIC has broad powers to transfer any assets and liabilities without the approval of the institution’s creditors.
Cross-guarantee
. An FDIC-insured depository institution can be held liable for any loss incurred or expected to be incurred by the FDIC in connection with another FDIC-insured institution under common control with such institution being “in default” or “in danger of default” (commonly referred to as “cross-guarantee” liability). An FDIC cross-guarantee claim against a depository institution is generally superior in right of payment to claims of the holding company and its affiliates against such depository institution.
Prompt corrective action and early remediation
. The Federal Deposit Insurance Corporation Improvement Act of 1991 requires the relevant federal banking regulator to take “prompt corrective action” with respect to a depository institution if that institution does not meet certain capital adequacy standards. While these regulations apply only to banks, such as JPMorgan Chase Bank, N.A. and Chase Bank USA, N.A., the Federal Reserve is authorized to take appropriate action against the parent BHC, such as JPMorgan Chase & Co., based on the undercapitalized status of any bank subsidiary. In certain instances, the BHC would be required to guarantee the performance of the capital restoration plan for its undercapitalized subsidiary.
OCC Heightened Standards.
The OCC has released final regulations and guidelines establishing heightened standards for large banks. The guidelines establish minimum standards for the design and implementation of a risk governance framework for banks. While the bank may use certain components of the parent company’s risk governance framework, the framework must ensure that the bank’s risk profile is easily distinguished and separate from the parent for risk management purposes. The bank’s board or risk committee is responsible for approving the bank’s risk governance framework, providing active oversight of the bank’s risk-taking activities and holding management accountable for adhering to the risk governance framework.
Restrictions on transactions with affiliates
. The bank subsidiaries of JPMorgan Chase are subject to certain restrictions imposed by federal law on extensions of credit to, and certain other transactions with, JPMorgan Chase and certain other affiliates, and on investments in stock or securities of JPMorgan Chase and affiliates. These restrictions prevent JPMorgan Chase and other affiliates from borrowing from a bank subsidiary unless the loans are secured in specified amounts and are subject to certain other limits. For more information, see Note 27. Under the Dodd-Frank Act, these restrictions were extended to derivatives and securities lending transactions. In addition, the Dodd-Frank Act’s Volcker Rule imposes similar restrictions on transactions between banking entities, such as JPMorgan Chase and its subsidiaries, and hedge funds or
|
4
|
||
private equity funds for which the banking entity serves as the investment manager, investment advisor or sponsor.
Dividend restrictions.
Federal law imposes limitations on the payment of dividends by national banks, such as JPMorgan Chase Bank, N.A. and Chase Bank USA, N.A. See Note 27 for the amount of dividends that the Firm’s principal bank subsidiaries could pay, at January 1, 2015, to their respective bank holding companies without the approval of their banking regulators.
In addition to the dividend restrictions described above, the OCC, the Federal Reserve and the FDIC have authority to prohibit or limit the payment of dividends by the banking organizations they supervise, including JPMorgan Chase and its bank and BHC subsidiaries, if, in the banking regulator’s opinion, payment of a dividend would constitute an unsafe or unsound practice in light of the financial condition of the banking organization.
Depositor preference
. Under federal law, the claims of a receiver of an insured depository institution for administrative expense and the claims of holders of U.S. deposit liabilities (including the FDIC) have priority over the claims of other unsecured creditors of the institution, including public noteholders and depositors in non-U.S. offices. As a result, such persons could receive substantially less than the depositors in U.S. offices of the depository institution. The U.K. Prudential Regulation Authority (the “PRA”) has issued a proposal that may require the Firm to either obtain equal treatment for U.K. depositors or “subsidiarize” in the U.K. In September 2013, the FDIC issued a final rule, which clarifies that foreign deposits are considered deposits under the FDIA only if they are also payable in the U.S.
CFPB regulation and supervision, and other consumer regulations.
The CFPB has rulemaking, enforcement and examination authority over JPMorgan Chase and its national bank subsidiaries, including JPMorgan Chase Bank, N.A. and Chase Bank USA, N.A., with respect to federal consumer protection laws, including laws relating to fair lending and the prohibition under the Dodd-Frank Act of unfair, deceptive or abusive acts or practices in connection with the offer, sale or provision of consumer financial products and services. These laws include the Truth-in-Lending, Equal Credit Opportunity (“ECOA”), Fair Credit Reporting, Fair Debt Collection Practice, Electronic Funds Transfer, Credit Card Accountability, Responsibility and Disclosure (“CARD”) and Home Mortgage Disclosure Acts. The CFPB also has authority to impose new disclosure requirements for any consumer financial product or service. The CFPB has issued informal guidance on a variety of topics (such as the collection of consumer debts and credit card marketing practices) and has taken enforcement actions against certain financial institutions. Much of the CFPB’s initial rulemaking efforts have addressed mortgage related topics, including ability-to-repay and qualified mortgage standards, mortgage servicing standards, loan originator compensation standards, high-cost mortgage requirements, Home Mortgage Disclosure Act requirements, appraisal and
escrow standards and requirements for higher-priced mortgages. Other areas of recent focus include “add-on” products, matters involving consumer populations considered vulnerable by the CFPB (such as students), and the furnishing of credit scores to individuals. The CFPB has been focused on automobile dealer discretionary interest rate markups, and on holding the Firm and other purchasers of such contracts (“indirect lenders”) responsible under the ECOA for statistical disparities in markups charged by the dealers to borrowers of different races or ethnicities. The Firm has adopted programs to address these risks, including an active dealer education, monitoring and review programs.
The activities of JPMorgan Chase Bank, N.A. and Chase Bank USA, N.A. as consumer lenders also are subject to regulation under various state statutes which are enforced by the respective state’s Attorney General.
Securities and broker-dealer regulation:
The Firm conducts securities underwriting, dealing and brokerage activities in the U.S. through J.P. Morgan Securities LLC and other broker-dealer subsidiaries, all of which are subject to regulations of the SEC, the Financial Industry Regulatory Authority and the New York Stock Exchange, among others. The Firm conducts similar securities activities outside the U.S. subject to local regulatory requirements. In the United Kingdom, those activities are conducted by J.P. Morgan Securities plc, which is regulated by the PRA (a subsidiary of the Bank of England which has responsibility for prudential regulation of banks and other systemically important institutions) and the Financial Conduct Authority (“FCA”) (which regulates prudential matters for other firms and conduct matters for all market participants). Broker-dealers are subject to laws and regulations covering all aspects of the securities business, including sales and trading practices, securities offerings, publication of research reports, use of customer’s funds, the financing of clients’ purchases, capital structure, record-keeping and retention, and the conduct of their directors, officers and employees. For information on the net capital of J.P. Morgan Securities LLC and J.P. Morgan Clearing Corp., and the applicable requirements relating to risk-based capital for J.P. Morgan Securities plc, see Regulatory capital on
pages 146–153
. Future rule-making mandated by the Dodd-Frank Act will involve (among other things) the standard of care applicable to broker-dealers when dealing with retail customers and additional requirements regarding securitization practices.
Investment management regulation:
The Firm’s investment management business is subject to significant regulation in numerous jurisdictions around the world relating to, among other things, the safeguarding of client assets, offerings of funds, marketing activities, transactions among affiliates and management of client funds. Certain of the Firm’s subsidiaries are registered with, and subject to oversight by, the SEC as investment advisers. As such, the Firm’s registered investment advisers are subject to the fiduciary and other obligations imposed
|
5
|
||
Part I
under the Investment Advisers Act of 1940 and the rules and regulations promulgated thereunder, as well as various states securities laws. The Firm’s asset management business continues to be affected by ongoing rule-making. In July 2013, the SEC adopted amendments to rules that govern money-market funds, requiring a floating net asset value for institutional prime money market funds. Many of the Volcker Rule regulations regarding “covered funds”, and their impact on the Firm’s asset management activities, particularly the seeding of foreign public funds and the criteria for establishing foreign public funds status, await further guidance from the regulators.
Derivatives regulation:
Under the Dodd-Frank Act, the Firm is subject to comprehensive regulation of its derivatives business. The regulations impose capital and margin requirements, require central clearing of standardized over-the-counter derivatives, require that they be traded on regulated exchanges or execution facilities, and provide for reporting of certain mandated information. In addition, the Act requires the registration of “swap dealers” and “major swap participants” with the CFTC and of “security-based swap dealers” and “major security-based swap participants” with the SEC. JPMorgan Chase Bank, N.A., J.P. Morgan Securities LLC, J.P. Morgan Securities plc and J.P. Morgan Ventures Energy Corporation have registered with the CFTC as swap dealers, and JPMorgan Chase Bank, N.A., J.P. Morgan Securities LLC and J.P. Morgan Securities plc have registered with the SEC as security-based swap dealers. As a result of such registration, these entities will be subject to, in addition to new capital requirements, new rules limiting the types of swap activities that may be engaged in by bank entities, a new margin regime for uncleared swaps, new rules regarding segregation of customer collateral, and business conduct and documentation standards with respect to other swaps counterparties, record-keeping and reporting obligations, and anti-fraud and anti-manipulation requirements related to their swaps activities. Further, some of the rules for derivatives apply extraterritorially to U.S. firms doing business with clients outside of the U.S.; however the full scope of the extra-territorial impact of the U.S. swaps regulation remains unclear. The effect of the rules issued under the Dodd-Frank Act will necessitate banking entities, such as the Firm, to modify the structure of their derivatives businesses and face increased operational and regulatory costs. In the European Union (the “EU”), the implementation of the European Market Infrastructure Regulation (“EMIR”) and the revision of the Markets in Financial Instruments Directive (“MiFID II”) will result in comparable, but not identical, changes to the European regulatory regime for derivatives. The combined effect of the U.S. and EU requirements, and the potential conflicts and inconsistencies between them, present challenges and risks to the structure and operating model of the Firm’s derivatives businesses.
The Firm, along with 17 other financial institutions, agreed in November 2014 to adhere to the Resolution Stay Protocol developed by the International Swaps and
Derivatives Association, Inc. in response to regulator concerns that the closeout of derivatives transactions during the resolution of a large cross-border financial institution could impede resolution efforts and potentially destabilize markets. The Resolution Stay Protocol provides for the contractual recognition of cross-border stays under various statutory resolution regimes and a contractual stay on certain cross-default rights.
In the U.S., two subsidiaries of the Firm are registered as futures commission merchants, and other subsidiaries are either registered with the CFTC as commodity pool operators and commodity trading advisors or exempt from such registration. These CFTC-registered subsidiaries are also members of the National Futures Association. The Firm’s financial commodities business is subject to regulation by the Federal Energy Regulatory Commission.
Data regulation:
The Firm and its subsidiaries also are subject to federal, state and international laws and regulations concerning the use and protection of certain customer, employee and other personal and confidential information, including those imposed by the Gramm-Leach-Bliley Act and the Fair Credit Reporting Act, as well as the EU Data Protection Directive, among others. The Firm was the victim of a cyberattack in 2014 that compromised user contact information for certain customers. For more information relating to this cyberattack, see Operational Risk Management on
pages 141–143
.
The Bank Secrecy Act:
The Bank Secrecy Act (“BSA”) requires all financial institutions, including banks and securities broker-dealers, to, among other things, establish a risk-based system of internal controls reasonably designed to prevent money laundering and the financing of terrorism. The BSA includes a variety of record-keeping and reporting requirements (such as cash transaction and suspicious activity reporting), as well as due diligence/know-your-customer documentation requirements. The Firm has established a global anti-money laundering program in order to comply with BSA requirements. In January 2013, the Firm entered into Consent Orders with its banking regulators relating to the Firm’s Bank Secrecy Act/Anti-Money Laundering policies, procedures and controls; the Firm has taken significant steps to modify and enhance its processes and controls with respect to its Anti-Money Laundering procedures and to remediate the issues identified in the Consent Order.
Anti-Corruption:
The Firm is subject to laws and regulations in the jurisdictions in which it operates, such as the U.S. Foreign Corrupt Practices Act and the U.K. Bribery Act, relating to corrupt and illegal payments to government officials and others. The Firm has implemented policies, procedures, and internal controls that are designed to comply with such laws and regulations. Any failure with respect to the Firm’s programs in this area could subject the Firm to substantial liability and regulatory fines. For more information on a
|
6
|
||
current investigation relating to, among other things, the Firm's hiring of persons referred by government officials and clients, see Note 31.
Compensation practices:
The Firm’s compensation practices are subject to oversight by the Federal Reserve, as well as other agencies. The Federal Reserve has issued guidance jointly with the FDIC and the OCC that is designed to ensure that incentive compensation paid by banking organizations does not encourage imprudent risk-taking that threatens the organizations’ safety and soundness. In addition, under the Dodd-Frank Act, federal regulators, including the Federal Reserve, must issue regulations requiring covered financial institutions, including the Firm, to report the structure of all of their incentive-based compensation arrangements and prohibit incentive-based payment arrangements that encourage inappropriate risks by providing compensation that is excessive or that could lead to material financial loss to the entity. The Federal Reserve has conducted a review of the incentive compensation policies and practices of a number of large banking institutions, including the Firm, and the supervisory findings of such review are incorporated in the Firm’s supervisory ratings. In addition to the Federal Reserve, the Financial Stability Board has agreed standards covering compensation principles for banks. In Europe, the Fourth Capital Requirements Directive (CRD IV) includes compensation provisions. In the U.K., compensation standards are governed by the Remuneration Code of the PRA and the FCA. The implementation of the Federal Reserve’s and other banking regulators’ guidelines regarding compensation are expected to evolve over the next several years, and may affect the manner in which the Firm structures its compensation.
Significant international regulatory initiatives:
The EU operates a European Systemic Risk Board which monitors financial stability, together with a framework of European Supervisory Agencies which oversees the regulation of financial institutions across the 28 Member States. The EU has also created a Single Supervisory Mechanism for the euro-zone, under which the regulation of all banks in that zone will be under the auspices of the European Central Bank, together with a Single Resolution Mechanism and Single Resolution Board, having jurisdiction over bank resolution in the zone. In addition, the Group of Twenty Finance Ministers and Central Bank Governors (“G-20”) formed the FSB. At both G-20 and EU levels, various proposals are under consideration to address risks associated with global financial institutions. Some of the initiatives adopted include increased capital requirements for certain trading instruments or exposures and compensation limits on certain employees located in affected countries.
In the EU, there is an extensive and complex program of final and proposed regulatory enhancement which reflects, in part, the EU’s commitments to policies of the G-20 together with other plans specific to the EU. This program includes EMIR, which will require, among other things, the
central clearing of standardized derivatives and which will be phased in by 2015; and MiFID II, which gives effect to the G-20 commitment to trading of derivatives through central clearing houses and exchanges and also includes significantly enhanced requirements for pre- and post-trade transparency and a significant reconfiguration of the regulatory supervision of execution venues.
The EU is also currently considering or executing upon significant revisions to laws covering: depositary activities; credit rating activities; resolution of banks, investment firms and market infrastructures; anti-money-laundering controls; data security and privacy; and corporate governance in financial firms, together with implementation in the EU of the Basel III capital standards.
Following the issuance of the Report of the High Level Expert Group on Reforming the Structure of the EU Banking Sector (the “Liikanen Group”), the EU has proposed legislation providing for a proprietary trading ban and mandatory separation of other trading activities within certain banks, while various EU Member States have separately enacted similar measures. In the U.K., the Independent Commission on Banking (the “Vickers Commission”) proposed certain provisions, which have now been enacted by Parliament and upon which detailed implementing requirements are expected to be finalized during 2015, that mandate the separation (or “ring-fencing”) of deposit-taking activities from securities trading and other analogous activities within banks, subject to certain exemptions. The legislation includes the supplemental recommendation of the Parliamentary Commission on Banking Standards (the “Tyrie Commission”) that such ring-fences should be “electrified” by the imposition of mandatory forced separation on banking institutions that are deemed to test the limits of the safeguards. Parallel but distinct provisions have been enacted by the French and German governments, and others are under consideration in other countries. These measures may separately or taken together have significant implications for the Firm’s organizational structure in Europe, as well as its permitted activities and capital deployment in the EU.
|
7
|
||
Part I
Item 1A: RISK FACTORS
The following discussion sets forth the material risk factors that could affect
JPMorgan Chase
’s financial condition and operations. Readers should not consider any descriptions of such factors to be a complete set of all potential risks that could affect the Firm.
Regulatory Risk
JPMorgan Chase operates within a highly regulated industry, and the Firm’s businesses and results are significantly affected by the laws and regulations to which the Firm is subject.
As a global financial services firm, JPMorgan Chase is subject to extensive and comprehensive regulation under federal and state laws in the U.S. and the laws of the various jurisdictions outside the U.S. in which the Firm does business. These laws and regulations significantly affect the way that the Firm does business, and can restrict the scope of the Firm’s existing businesses, limit the Firm’s ability to expand the products and services that it offers or make its products and services more expensive for clients and customers.
The financial services industry continues to experience an unprecedented increase in regulations and supervision, and such changes could have a significant impact on how the Firm conducts business. Significant and comprehensive new legislation and regulations affecting the financial services industry have been adopted or proposed in recent years, both in the U.S. and globally. The Firm continues to make appropriate adjustments to its business and operations, legal entity structure and capital and liquidity management policies, procedures and controls to comply with these new laws and regulations. However, the cumulative effect of all of the new and proposed legislation and regulations on the Firm’s business, operations and profitability remains uncertain.
The recent legislative and regulatory developments, as well as future legislative or regulatory actions in the U.S. and in the other countries in which the Firm operates, and any required changes to the Firm’s business or operations resulting from such developments and actions, could result in a significant loss of revenue for the Firm, impose additional compliance and other costs on the Firm or otherwise reduce the Firm’s profitability, limit the products and services that the Firm offers or its ability to pursue business opportunities in which it might otherwise consider engaging, require the Firm to dispose of or curtail certain businesses, affect the value of assets that the Firm holds, require the Firm to increase its prices and therefore reduce demand for its products, or otherwise adversely affect the Firm’s businesses.
Non-U.S. regulations and initiatives may be inconsistent or may conflict with current or proposed regulations in the U.S., which could create increased compliance and other costs and adversely affect JPMorgan Chase’s business, operations or profitability.
There can be significant differences in the ways that similar regulatory initiatives affecting the financial services industry are implemented in different countries and regions in which JPMorgan Chase does business. For example, recent EU legislative and regulatory initiatives, including those relating to the resolution of financial institutions, the proposed separation of trading activities from core banking services, mandatory on-exchange trading, position limits and reporting rules for derivatives, conduct of business requirements and restrictions on compensation, could require the Firm to make significant modifications to its non-U.S. business, operations and legal entity structure in order to comply with these requirements. These differences in implemented or proposed non-U.S. regulations and initiatives may be inconsistent or may conflict with current or proposed regulations in the U.S., which could subject the Firm to increased compliance and legal costs, as well as higher operational, capital and liquidity costs, all of which could have an adverse effect on the Firm’s business, results of operations and profitability.
Expanded regulatory and governmental oversight of JPMorgan Chase’s businesses will continue to increase the Firm’s costs and risks.
The Firm’s businesses and operations are increasingly subject to heightened governmental and regulatory oversight and scrutiny. The Firm has paid significant fines (or has provided significant monetary and other relief) to resolve a number of investigations or enforcement actions by governmental agencies. In addition, the Firm continues to devote substantial resources to satisfying the requirements of regulatory consent orders and other settlements to which it is subject, including enhancing its procedures and controls, expanding its risk and control functions within its lines of business, investing in technology and hiring significant numbers of additional risk, control and compliance personnel, all of which have increased the Firm’s operational and compliance costs.
If the Firm fails to meet the requirements of the regulatory settlements to which it is subject, or more generally, to maintain risk and control procedures and processes that meet the heightened standards established by its regulators and other government agencies, it could be required to enter into further orders and settlements, pay additional fines, penalties or judgments, or accept material regulatory restrictions on its businesses. The extent of the Firm’s exposure to legal and regulatory matters may be unpredictable and could, in some cases, substantially exceed the amount of reserves that the Firm has established for such matters.
The Firm expects that it and the financial services industry as a whole will continue to be subject to heightened regulatory scrutiny and governmental investigations and enforcement actions and that violations of law will more frequently be met with formal and punitive enforcement action, including the imposition of significant monetary and other sanctions, rather than with informal supervisory action.
|
8
|
||
In addition, certain regulators have announced policies, or taken measures in connection with specific enforcement actions, which make it more likely that the Firm and other financial institutions may be required to admit wrongdoing in connection with settling such matters. Such admissions can lead to, among other things, greater exposure in civil litigation and reputational harm.
Finally, U.S. government officials have indicated and demonstrated a willingness to bring criminal actions against financial institutions, and have increasingly sought, and obtained, resolutions that include criminal pleas from those institutions. Such resolutions can have significant collateral consequences for a subject financial institution, including loss of customers and business and (absent the forbearance of, or the granting of waivers by, applicable regulators) the inability to offer certain products or services or operate certain businesses for a period of time
.
Requirements for the orderly resolution of the Firm under the Dodd-Frank Act could require JPMorgan Chase to restructure or reorganize its businesses or make costly changes to its capital or funding structure.
Under Title I of the Dodd-Frank Act (“Title I”) and Federal Reserve and FDIC rules, the Firm is required to prepare and submit periodically to the Federal Reserve and the FDIC a detailed plan for the orderly resolution of JPMorgan Chase & Co. and certain of its subsidiaries under the U.S. Bankruptcy Code or other applicable insolvency laws in the event of future material financial distress or failure. In July 2014, the Firm submitted its third Title I resolution plan to the Federal Reserve and FDIC (the “2014 plan”). In August 2014, the Federal Reserve and the FDIC announced the completion of their reviews of the second round of Title I resolution plans submitted by eleven large, complex banking organizations (the “first wave filers”) in 2013, including the Firm’s Title I resolution plan submitted in 2013 (the “2013 plan”). Although the agencies noted some improvements from the original plans submitted by the first wave filers in 2012, the agencies also jointly identified specific shortcomings with the 2013 resolution plans, including the Firm’s 2013 plan, that will need to be addressed in 2015 submissions if not already addressed in the Firm’s 2014 plan. In addition, the FDIC board of directors determined under Title I that the 2013 resolution plans submitted by the first wave filers, including the Firm’s 2013 plan, are not credible and do not facilitate an orderly resolution under the U.S. Bankruptcy Code (although the Federal Reserve Board did not make such a determination). The Federal Reserve Board determined that the first wave filers must take immediate action to improve their resolvability and reflect those improvements in their 2015 submissions.
If the Federal Reserve Board and the FDIC were to jointly determine that the Firm’s Title I resolution plan, or any future update of that plan, is not credible, and the Firm is unable to remedy the identified deficiencies in a timely manner, the regulators may jointly impose more stringent capital, leverage or liquidity requirements on the Firm or
restrictions on growth, activities or operations of the Firm, and could require the Firm to restructure, reorganize or divest businesses, legal entities, operational systems and/or intercompany transactions in ways that could materially and adversely affect the Firm’s operations and strategy. In addition, in order to develop a Title I resolution plan that the Federal Reserve Board and FDIC determine is credible, the Firm may need to take actions to restructure intercompany and external activities, which could result in increased funding or operational costs.
In addition to the Firm’s plan for orderly resolution, the Firm’s resolution plan also recommends to the Federal Reserve and the FDIC its proposed optimal strategy to resolve the Firm under the special resolution procedure provided in Title II of the Dodd-Frank Act (“Title II”). The Firm’s recommendation for its optimal Title II strategy would involve a “single point of entry” recapitalization model in which the FDIC would use its power to create a “bridge entity” for JPMorgan Chase, transfer the systemically important and viable parts of the Firm’s business, principally the stock of JPMorgan Chase & Co.’s main operating subsidiaries and any intercompany claims against such subsidiaries, to the bridge entity, recapitalize those businesses by contributing some or all of such intercompany claims to the capital of such subsidiaries, and by exchanging debt claims against JPMorgan Chase & Co. for equity in the bridge entity. The Federal Reserve is also expected to propose rules regarding the minimum levels of unsecured long-term debt and other loss absorbing capacity that bank holding companies would be required to have issued and outstanding, as well as guidelines defining the terms of qualifying debt instruments, to ensure that adequate levels of debt are maintained at the holding company level for purposes of recapitalization. Issuing debt in the amounts that would be required under these proposed rules could lead to increased funding costs for the Firm. In addition, if the Firm were to be resolved under its recommended Title II strategy, no assurance can be given that the value of the stock of the bridge entity distributed to the holders of debt obligations of JPMorgan Chase & Co. would be sufficient to repay or satisfy all or part of the principal amount of, and interest on, the debt obligations for which such stock was exchanged.
Market Risk
JPMorgan Chase’s results of operations have been, and may continue to be, adversely affected by U.S. and international financial market and economic conditions.
JPMorgan Chase’s businesses are materially affected by economic and market conditions, including the liquidity of the global financial markets; the level and volatility of debt and equity prices, interest rates and currency and commodities prices; investor sentiment; events that reduce confidence in the financial markets; inflation and unemployment; the availability and cost of capital and credit; the economic effects of natural disasters, severe weather conditions, outbreaks of hostilities or terrorism; monetary policies and actions taken by the Federal Reserve
|
9
|
||
Part I
and other central banks; and the health of the U.S. and global economies. These conditions can affect the Firm’s businesses both directly and through their impact on the businesses and activities of the Firm’s clients and customers.
In the Firm’s underwriting and advisory businesses, the above-mentioned factors can affect the volume of transactions that the Firm executes for its clients and customers and, therefore, the revenue that the Firm receives from fees and commissions, as well as the willingness of other financial institutions and investors to participate in loan syndications or underwritings managed by the Firm.
The Firm generally maintains extensive market-making positions in the fixed income, currency, commodities, credit and equity markets to facilitate client demand and provide liquidity to clients. The revenue derived from these positions is affected by many factors, including the Firm’s success in effectively hedging its market and other risks; volatility in interest rates and equity, debt and commodities markets; interest rate and credit spreads; and the availability of liquidity in the capital markets, all of which are affected by global economic and market conditions. Certain of the Firm’s market-making positions could be adversely affected by the lack of pricing transparency or liquidity, which will be influenced by many of these factors. The Firm anticipates that revenue relating to its market-making businesses will continue to experience volatility, which will affect the Firm’s ability to realize returns from such activities and could adversely affect the Firm’s earnings.
The fees that the Firm earns for managing third-party assets are also dependent upon general economic conditions. For example, a higher level of U.S. or non-U.S. interest rates or a downturn in financial markets could affect the valuations of the third-party assets that the Firm manages or holds in custody, which, in turn, could affect the Firm’s revenue. Macroeconomic or market concerns may also prompt outflows from the Firm’s funds or accounts.
Changes in interest rates will affect the level of assets and liabilities held on the Firm’s balance sheet and the revenue that the Firm earns from net interest income. A low interest rate environment has and may continue to have an adverse effect on certain of the Firm’s businesses by compressing net interest margins, reducing the amounts that the Firm earns on its investment securities portfolio, or reducing the value of its mortgage servicing rights (“MSR”) asset, thereby reducing the Firm’s net interest income and other revenues. Conversely, increasing or high interest rates may result in increased funding costs, lower levels of commercial and residential loan originations and diminished returns on the available-for-sale investment securities portfolio (to the extent that the Firm is unable to reinvest contemporaneously in higher-yielding assets), thereby adversely affecting the Firm’s revenues and capital levels.
The Firm’s consumer businesses are particularly affected by U.S. domestic economic conditions, including U.S. interest
rates; the rate of unemployment; housing prices; the level of consumer confidence; changes in consumer spending; and the number of personal bankruptcies. If the current positive trends in the U.S. economy are not sustained, this could diminish demand for the products and services of the Firm’s consumer businesses, or increase the cost to provide such products and services. In addition, adverse economic conditions, such as declines in home prices or persistent high levels of unemployment, could lead to an increase in mortgage, credit card, auto, student and other loan delinquencies and higher net charge-offs, which can reduce the Firm’s earnings.
Widening of credit spreads makes it more expensive for the Firm to borrow on both a secured and unsecured basis. Credit spreads widen or narrow not only in response to Firm-specific events and circumstances, but also as a result of general economic and geopolitical events and conditions. Changes in the Firm’s credit spreads will impact, positively or negatively, the Firm’s earnings on liabilities that are recorded at fair value.
Sudden and significant volatility in the prices of securities and other assets (including loan and derivatives) may curtail the trading markets for such securities and assets, make it difficult to sell or hedge such securities and assets, adversely affect the Firm’s profitability, capital or liquidity, or increase the Firm’s funding costs. Sustained volatility in the financial markets may also negatively affect consumer or investor confidence, which could lead to lower client activity and decreased fee-based income for the Firm.
Credit Risk
The financial condition of JPMorgan Chase’s customers, clients and counterparties, particularly other financial institutions, could adversely affect the Firm.
Financial services institutions are interrelated as a result of market-making, trading, clearing, counterparty or other relationships. The Firm routinely executes transactions with counterparties in the financial services industry, including brokers and dealers, commercial banks, investment banks, mutual and hedge funds, investment managers and other institutional clients. Many of these transactions expose the Firm to credit risk and, in some cases, disputes and litigation in the event of a default by the counterparty or client. In recent years, the perceived interrelationship among financial institutions has also led to claims by other market participants and regulators that the Firm and other financial institutions have allegedly violated anti-trust or anti-competition laws by colluding to manipulate markets, prices or indices.
The Firm is a market leader in providing clearing and custodial services, and also acts as a clearing and custody bank in the securities and repurchase transaction market, including the U.S. tri-party repurchase transaction market. Many of these services expose the Firm to credit risk in the event of a default by the counterparty or client, a central counterparty (“CCP”) or another market participant.
|
10
|
||
As part of providing clearing services, the Firm is a member of a number of CCPs, and may be required to pay a portion of the losses incurred by such organizations as a result of the default of other members. As a clearing member, the Firm is also exposed to the risk of non-performance by its clients, which it seeks to mitigate through the maintenance of adequate collateral. In its role as custodian bank in the securities and repurchase transaction market, the Firm can be exposed to intra-day credit risk of its clients. If a client to which the Firm provides such services becomes bankrupt or insolvent, the Firm may become involved in disputes and litigation with various parties, including one or more CCPs, the client’s bankruptcy estate and other creditors, or involved in regulatory investigations. All of such events can increase the Firm’s operational and litigation costs and may result in losses if any collateral received by the Firm declines in value.
During periods of market stress or illiquidity, the Firm’s credit risk also may be further increased when the Firm cannot realize the fair value of the collateral held by it or when collateral is liquidated at prices that are not sufficient to recover the full amount of the loan, derivative or other exposure due to the Firm. Further, disputes with obligors as to the valuation of collateral could increase in times of significant market stress, volatility or illiquidity, and the Firm could suffer losses during such periods if it is unable to realize the fair value of collateral or manage declines in the value of collateral.
Concentration of credit and market risk could increase the potential for significant losses.
JPMorgan Chase has exposure to increased levels of risk when customers are engaged in similar business activities or activities in the same geographic region, or when they have similar economic features that would cause their ability to meet contractual obligations to be similarly affected by changes in economic conditions. As a result, the Firm regularly monitors various segments of its portfolio exposures to assess potential concentration risks. The Firm’s efforts to diversify or hedge its credit portfolio against concentration risks may not be successful.
In addition, disruptions in the liquidity or transparency of the financial markets may result in the Firm’s inability to sell, syndicate or realize the value of its positions, thereby leading to increased concentrations. The inability to reduce the Firm’s positions may not only increase the market and credit risks associated with such positions, but may also increase the level of risk-weighted assets on the Firm’s balance sheet, thereby increasing its capital requirements and funding costs, all of which could adversely affect the operations and profitability of the Firm’s businesses.
Liquidity Risk
If JPMorgan Chase does not effectively manage its liquidity, its business could suffer.
JPMorgan Chase’s liquidity is critical to its ability to operate its businesses. Some potential conditions that could impair the Firm’s liquidity include markets that become illiquid or
are otherwise experiencing disruption, unforeseen cash or capital requirements (including, among others, commitments that may be triggered to special purpose entities (“SPEs”) or other entities), difficulty in selling or inability to sell assets, unforeseen outflows of cash or collateral, and lack of market or customer confidence in the Firm or financial markets in general. These conditions may be caused by events over which the Firm has little or no control. The widespread crisis in investor confidence and resulting liquidity crisis experienced in 2008 and into early 2009 increased the Firm’s cost of funding and limited its access to some of its traditional sources of liquidity (such as securitized debt offerings backed by mortgages, credit card receivables and other assets) during that time, and there is no assurance that these severe conditions could not occur in the future.
If the Firm’s access to stable and low cost sources of funding, such as bank deposits, is reduced, the Firm may need to raise alternative funding which may be more expensive or of limited availability. In addition, regulations regarding the amount and types of securities that the Firm may use to satisfy applicable liquidity coverage ratio and net stable funding ratio requirements may also affect the Firm’s cost of funding.
As a holding company, JPMorgan Chase & Co. relies on the earnings of its subsidiaries for its cash flow and, consequently, its ability to pay dividends and satisfy its debt and other obligations. These payments by subsidiaries may take the form of dividends, loans or other payments. Several of JPMorgan Chase & Co.’s principal subsidiaries are subject to dividend distribution, capital adequacy or liquidity coverage requirements or other regulatory restrictions on their ability to provide such payments. Limitations in the payments that JPMorgan Chase & Co. receives from its subsidiaries could reduce its ability
to
pay dividends and satisfy its debt and other obligations.
Regulators in some countries in which the Firm has operations have proposed legislation or regulations requiring large banks to conduct certain businesses through separate subsidiaries in those countries, and to maintain independent capital and liquidity for such subsidiaries. If adopted, these requirements could hinder the Firm’s ability to efficiently manage its funding and liquidity in a centralized manner.
Reductions in JPMorgan Chase’s credit ratings may adversely affect its liquidity and cost of funding, as well as the value of debt obligations issued by the Firm.
JPMorgan Chase & Co. and certain of its principal subsidiaries are currently rated by credit rating agencies. Rating agencies evaluate both general and firm- and industry-specific factors when determining their credit ratings for a particular financial institution, including economic and geopolitical trends, regulatory developments, future profitability, risk management practices, legal expenses, assumptions surrounding government support and ratings differentials between bank holding companies and their bank subsidiaries. Although the Firm closely
|
11
|
||
Part I
monitors and manages, to the extent it is able, factors that could influence its credit ratings, there is no assurance that the Firm’s credit ratings will not be lowered in the future, or that any such downgrade would not occur at times of broader market instability when the Firm’s options for responding to events may be more limited and general investor confidence is low.
Furthermore, a reduction in the Firm’s credit ratings could reduce the Firm’s access to capital markets, materially increase the cost of issuing securities, trigger additional collateral or funding requirements, and decrease the number of investors and counterparties willing or permitted, contractually or otherwise, to do business with or lend to the Firm, thereby curtailing the Firm’s business operations and reducing its profitability. In addition, any such reduction in credit ratings may increase the credit spreads charged by the market for taking credit risk on JPMorgan Chase & Co. and its subsidiaries and, as a result, could adversely affect the value of debt and other obligations that JPMorgan Chase & Co. and its subsidiaries have issued or may issue in the future.
Legal Risk
JPMorgan Chase faces significant legal risks, both from regulatory investigations and proceedings and from private actions brought against the Firm.
JPMorgan Chase is named as a defendant or is otherwise involved in various legal proceedings, including class actions and other litigation or disputes with third parties. Actions currently pending against the Firm may result in judgments, settlements, fines, penalties or other results adverse to the Firm, which could materially and adversely affect the Firm’s business, financial condition or results of operations, or cause serious reputational harm to the Firm. As a participant in the financial services industry, it is likely that the Firm will continue to experience a high level of litigation related to its businesses and operations.
In addition, and as noted above, the Firm’s businesses and operations are also subject to heightened regulatory oversight and scrutiny, which may lead to additional regulatory investigations or enforcement actions. As the regulators and other government agencies continue to examine the operations of the Firm and its subsidiaries, there is no assurance that they will not pursue additional regulatory settlements or other enforcement actions against the Firm in the future. A single event may give rise to numerous and overlapping investigations and proceedings, either by multiple federal and state agencies and officials in the U.S. or, in some instances, regulators and other governmental officials in non-U.S. jurisdictions. These and other initiatives from U.S. and non-U.S. governmental authorities and officials may subject the Firm to further judgments, settlements, fines or penalties, or cause the Firm to be required to restructure its operations and activities or to cease offering certain products or services, all of which could harm the Firm’s reputation or lead to
higher operational costs, thereby reducing the Firm’s profitability.
Other Business Risks
JPMorgan Chase’s operations are subject to risk of loss from unfavorable economic, monetary and political developments in the U.S. and around the world.
JPMorgan Chase’s businesses and earnings are affected by the fiscal and other policies that are adopted by various U.S. and non-U.S. regulatory authorities and agencies. The Federal Reserve regulates the supply of money and credit in the U.S. and its policies determine in large part the cost of funds for lending and investing in the U.S. and the return earned on those loans and investments. Changes in Federal Reserve policies (as well as the fiscal and monetary policies of non-U.S. central banks or regulatory authorities and agencies, such as “pegging” the exchange rate of their currency to the currencies of others) are beyond the Firm’s control and may be difficult to predict, and consequently, unanticipated changes in these policies could have a negative impact on the Firm’s activities and results of operations.
The Firm’s businesses and revenue are also subject to risks inherent in investing and market-making in securities, loans and other obligations of companies worldwide. These risks include, among others, negative effects from slowing growth rates or recessionary economic conditions, or the risk of loss from unfavorable political, legal or other developments, including social or political instability, in the countries in which such companies operate, as well as the other risks and considerations as described further below.
Several of the Firm’s businesses engage in transactions with, or trade in obligations of, U.S. and non-U.S. governmental entities, including national, state, provincial, municipal and local authorities. These activities can expose the Firm to enhanced sovereign, credit-related, operational and reputational risks, including the risks that a governmental entity may default on or restructure its obligations or may claim that actions taken by government officials were beyond the legal authority of those officials, which could adversely affect the Firm’s financial condition and results of operations.
Further, various countries in which the Firm operates or invests, or in which the Firm may do so in the future, have in the past experienced severe economic disruptions particular to those countries or regions. The ongoing crisis in Russia and impact of sanctions, coupled with sharp oil price declines, a potential slowdown in the macroeconomic prospects in China, and concerns about potential economic weaknesses in the Eurozone (including the permanent resolution of the Greek “bailout” program), could undermine investor confidence and affect the operating environment in 2015. In some cases, concerns regarding the fiscal condition of one or more countries can cause a contraction of available credit and reduced activity among trading partners or create market volatility that could lead to “market contagion” affecting other countries in the same
|
12
|
||
region or beyond the region. Accordingly, it is possible that economic disruptions in certain countries, even in countries in which the Firm does not conduct business or have operations or engages in only limited activities, will adversely affect the Firm.
JPMorgan Chase’s operations in emerging markets may be hindered by local political, social and economic factors, and will be subject to additional compliance costs and risks.
Some of the countries in which JPMorgan Chase conducts its wholesale businesses have economies or markets that are less developed and more volatile, and may have legal and regulatory regimes that are less established or predictable, than the U.S. and other developed markets in which the Firm currently operates. Some of these countries have in the past experienced severe economic disruptions, including extreme currency fluctuations, high inflation, or low or negative growth, among other negative conditions, or have imposed restrictive monetary policies such as currency exchange controls and other laws and restrictions that adversely affect the local and regional business environment. In addition, these countries have historically been more susceptible to unfavorable political, social or economic developments which have in the past resulted in, and may in the future lead to, social unrest, general strikes and demonstrations, outbreaks of hostilities, overthrow of incumbent governments, terrorist attacks or other forms of internal discord, all of which can adversely affect the Firm’s operations or investments in such countries. Political, social or economic disruption or dislocation in certain countries or regions in which the Firm conducts its wholesale businesses can hinder the growth and profitability of those operations.
Less developed legal and regulatory systems in certain countries can also have adverse consequences on the Firm’s operations in those countries, including, among others, the absence of a statutory or regulatory basis or guidance for engaging in specific types of business or transactions; the promulgation of conflicting or ambiguous laws and regulations or the inconsistent application or interpretation of existing laws and regulations; uncertainty as to the enforceability of contractual obligations; difficulty in competing in economies in which the government controls or protects all or a portion of the local economy or specific businesses, or where graft or corruption may be pervasive; and the threat of arbitrary regulatory investigations, civil litigations or criminal prosecutions.
Revenue from international operations and trading in non-U.S. securities and other obligations may be subject to negative fluctuations as a result of the above considerations, as well as due to governmental actions including expropriation, nationalization, confiscation of assets, price controls, capital controls, exchange controls, and changes in laws and regulations. The impact of these fluctuations could be accentuated as some trading markets are smaller, less liquid and more volatile than larger markets. Also, any of the above-mentioned events or circumstances in one country can affect, and in the past
conditions of these types have affected, the Firm’s operations and investments in another country or countries, including the Firm’s operations in the U.S. As a result, any such unfavorable conditions or developments could have an adverse impact on the Firm’s business and results of operations.
Conducting business in countries with less developed legal and regulatory regimes often requires the Firm to devote significant additional resources to understanding, and monitoring changes in, local laws and regulations, as well as structuring its operations to comply with local laws and regulations and implementing and administering related internal policies and procedures. There can be no assurance that the Firm will always be successful in its efforts to conduct its business in compliance with laws and regulations in countries with less predictable legal and regulatory systems. In addition, the Firm can also incur higher costs, and face greater compliance risks, in structuring and operating its businesses outside the U.S. to comply with U.S. anti-corruption and anti-money laundering laws and regulations.
JPMorgan Chase relies on the integrity of its operating systems and employees, and those of third parties, and certain failures of such systems or misconduct by such employees could materially and adversely affect the Firm’s operations.
JPMorgan Chase’s businesses are dependent on the Firm’s ability to process, record and monitor an increasingly large number of complex transactions and to do so on a faster and more frequent basis. The Firm’s front- and back-office trading systems similarly rely on their access to, and on the functionality of, the operating systems maintained by third parties such as clearing and payment systems, central counterparties, securities exchanges and data processing and technology companies. If the Firm’s financial, accounting, trading or other data processing systems, or the operating systems of third parties on which the Firm’s businesses are dependent, are unable to meet these increasingly demanding standards, or if they fail or have other significant shortcomings, the Firm could be materially and adversely affected. The Firm is similarly dependent on its employees. The Firm could be materially and adversely affected if one or more of its employees causes a significant operational breakdown or failure, either as a result of human error or where an individual purposefully sabotages or fraudulently manipulates the Firm’s operations or systems. In addition, when the Firm changes processes or introduces new products and services and new remote connectivity solutions (including Internet and mobile banking services), the Firm may not fully appreciate or identify new operational risks that may arise from such changes. Any of these occurrences could diminish the Firm’s ability to operate one or more of its businesses, or result in potential liability to clients and customers, increased operating expenses, higher litigation costs (including fines and sanctions), reputational damage, regulatory
|
13
|
||
Part I
intervention or weaker competitive standing, any of which could materially and adversely affect the Firm.
Third parties with which the Firm does business, as well as retailers and other third parties with which the Firm’s customers do business, can also be sources of operational risk to the Firm, particularly where activities of customers are beyond the Firm’s security and control systems, such as through the use of the internet, personal smart phones and other mobile services. Security breaches affecting the Firm’s customers, or systems breakdowns or failures, security breaches or employee misconduct affecting such other third parties, may require the Firm to take steps to protect the integrity of its own operational systems or to safeguard confidential information of the Firm or its customers, thereby increasing the Firm’s operational costs and potentially diminish customer satisfaction.
If personal, confidential or proprietary information of customers or clients in the Firm’s possession were to be mishandled or misused, the Firm could suffer significant regulatory consequences, reputational damage and financial loss. Such mishandling or misuse could include circumstances where, for example, such information was erroneously provided to parties who are not permitted to have the information, either through the fault of the Firm’s systems, employees or counterparties, or where such information was intercepted or otherwise compromised by third parties.
The Firm may be subject to disruptions of its operating systems arising from events that are wholly or partially beyond the Firm’s control, which may include, for example, security breaches (as discussed further below); electrical or telecommunications outages; failures of computer servers or other damage to the Firm’s property or assets; natural disasters or severe weather conditions; health emergencies or pandemics; or events arising from local or larger-scale political events, including outbreaks of hostilities or terrorist acts. JPMorgan Chase maintains a global resiliency and crisis management program that is intended to ensure that the Firm has the ability to recover its critical business functions and supporting assets, including staff, technology and facilities, in the event of a business interruption. While the Firm believes that its current resiliency plans are both sufficient and adequate, there can be no assurance that such plans will fully mitigate all potential business continuity risks to the Firm or its customers and clients. Any failures or disruptions of the Firm’s systems or operations could give rise to losses in service to customers and clients, adversely affect the Firm’s business and results of operations by subjecting the Firm to losses or liability, or require the Firm to expend significant resources to correct the failure or disruption, as well as by exposing the Firm to litigation, regulatory fines or penalties or losses not covered by insurance.
A breach in the security of JPMorgan Chase’s systems could disrupt its businesses, result in the disclosure of confidential information, damage its reputation and
create significant financial and legal exposure for the Firm.
Although JPMorgan Chase devotes significant resources to maintain and regularly update its systems and processes that are designed to protect the security of the Firm’s computer systems, software, networks and other technology assets and the confidentiality, integrity and availability of information belonging to the Firm and its customers and clients, there is no assurance that all of the Firm’s security measures will provide absolute security. JPMorgan Chase and other companies have reported significant breaches in the security of their websites or other systems, some of which have involved sophisticated and targeted attacks intended to obtain unauthorized access to confidential information, destroy data, disrupt or degrade service, sabotage systems or cause other damage, including through the introduction of computer viruses or malware, cyberattacks and other means. A cyberattack against the Firm in 2014 resulted in customer and internal data of the Firm being compromised. The Firm is regularly targeted by unauthorized parties using malicious code and viruses, and has also experienced several significant distributed denial-of-service attacks from technically sophisticated and well-resourced third parties which were intended to disrupt online banking services.
Despite the Firm’s efforts to ensure the integrity of its systems, it is possible that the Firm may not be able to anticipate, detect or recognize threats to its systems or to implement effective preventive measures against all security breaches of these types, especially because the techniques used change frequently or are not recognized until launched, and because cyberattacks can originate from a wide variety of sources, including third parties outside the Firm such as persons who are associated with external service providers or who are or may be involved in organized crime or linked to terrorist organizations or hostile foreign governments. Those parties may also attempt to fraudulently induce employees, customers, third-party service providers or other users of the Firm’s systems to disclose sensitive information in order to gain access to the Firm’s data or that of its customers or clients. These risks may increase in the future as the Firm continues to increase its mobile-payment and other internet-based product offerings and expands its internal usage of web-based products and applications.
A successful penetration or circumvention of the security of the Firm’s systems could cause serious negative consequences for the Firm, including significant disruption of the Firm’s operations, misappropriation of confidential information of the Firm or that of its customers, or damage to computers or systems of the Firm and those of its customers and counterparties, and could result in violations of applicable privacy and other laws, financial loss to the Firm or to its customers, loss of confidence in the Firm’s security measures, customer dissatisfaction, significant litigation exposure and harm to the Firm’s reputation, all of which could have a material adverse effect on the Firm.
|
14
|
||
Risk Management
JPMorgan Chase’s framework for managing risks and its risk management procedures and practices may not be effective in identifying and mitigating every risk to the Firm, thereby resulting in losses.
JPMorgan Chase’s risk management framework seeks to mitigate risk and loss to the Firm. The Firm has established processes and procedures intended to identify, measure, monitor, report and analyze the types of risk to which the Firm is subject. However, as with any risk management framework, there are inherent limitations to the Firm’s risk management strategies because there may exist, or develop in the future, risks that the Firm has not appropriately anticipated or identified. Any lapse in the Firm’s risk management framework and governance structure or other inadequacies in the design or implementation of the Firm’s risk management framework, governance, procedures or practices could, individually or in the aggregate, cause unexpected losses for the Firm, materially and adversely affect the Firm’s financial condition and results of operations, require significant resources to remediate any risk management deficiency, attract heightened regulatory scrutiny, expose the Firm to regulatory investigations or legal proceedings, subject the Firm to fines, penalties or judgments, harm the Firm’s reputation, or otherwise cause a decline in investor confidence.
The Firm’s products, including loans, leases, lending commitments, derivatives, trading account assets and assets held-for-sale, as well as cash management and clearing activities, expose the Firm to credit risk. As one of the nation’s largest lenders, the Firm has exposures arising from its many different products and counterparties, and the credit quality of the Firm’s exposures can have a significant impact on its earnings. The Firm establishes allowances for probable credit losses inherent in its credit exposure, including unfunded lending-related commitments. The Firm also employs stress testing and other techniques to determine the capital and liquidity necessary to protect the Firm in the event of adverse economic or market events. These processes are critical to the Firm’s financial results and condition, and require difficult, subjective and complex judgments, including forecasts of how economic conditions might impair the ability of the Firm’s borrowers and counterparties to repay their loans or other obligations. As is the case with any such assessments, there is always the possibility that the Firm will fail to identify the proper factors or that the Firm will fail to accurately estimate the impact of factors that it identifies.
JPMorgan Chase’s market-making businesses may expose the Firm to unexpected market, credit and operational risks that could cause the Firm to suffer unexpected losses. Severe declines in asset values, unanticipated credit events, or unforeseen circumstances that may cause previously uncorrelated factors to become correlated (and vice versa) may create losses resulting from risks not appropriately taken into account in the development, structuring or
pricing of a financial instrument such as a derivative. Certain of the Firm’s derivative transactions require the physical settlement by delivery of securities or other obligations that the Firm does not own; if the Firm is unable to obtain such securities or obligations within the required timeframe for delivery, this could cause the Firm to forfeit payments otherwise due to it and could result in settlement delays, which could damage the Firm’s reputation and ability to transact future business. In addition, in situations where trades are not settled or confirmed on a timely basis, the Firm may be subject to heightened credit and operational risk, and in the event of a default, the Firm may be exposed to market and operational losses. In particular, disputes regarding the terms or the settlement procedures of derivative contracts could arise, which could force the Firm to incur unexpected costs, including transaction, legal and litigation costs, and impair the Firm’s ability to manage effectively its risk exposure from these products.
In a difficult or less liquid market environment, the Firm’s risk management strategies may not be effective because other market participants may be attempting to use the same or similar strategies to deal with the challenging market conditions. In such circumstances, it may be difficult for the Firm to reduce its risk positions due to the activity of such other market participants.
Many of the Firm’s risk management strategies or techniques have a basis in historical market behavior, and all such strategies and techniques are based to some degree on management’s subjective judgment. For example, many models used by the Firm are based on assumptions regarding correlations among prices of various asset classes or other market indicators. In times of market stress, or in the event of other unforeseen circumstances, previously uncorrelated indicators may become correlated, or conversely, previously correlated indicators may make unrelated movements. These sudden market movements or unanticipated or unidentified market or economic movements have in some circumstances limited and could again limit the effectiveness of the Firm’s risk management strategies, causing the Firm to incur losses.
Many of the models used by the Firm are subject to review not only by the Firm’s Model Risk function but also by the Firm’s regulators in order that the Firm may utilize such models in connection with the Firm’s calculations of market risk risk-weighted assets (“RWA”), credit risk RWA and operational risk RWA under the Advanced Approach of Basel III. The Firm may be subject to higher capital charges, which could adversely affect its financial results or limit its ability to expand its businesses, if such models do not receive approval by its regulators.
In addition, the Firm must comply with enhanced standards for the assessment and management of risks associated with vendors and other third parties that provide services to the Firm. These requirements apply to the Firm both under general guidance issued by its banking regulators and, more specifically, under certain of the consent orders to which the Firm is subject. The Firm has incurred and expects to
|
15
|
||
incur additional costs and expenses in connection with its initiatives to address the risks associated with oversight of its third party relationships. Failure by the Firm to appropriately assess and manage third party relationships, especially those involving significant banking functions, shared services or other critical activities, could result in potential liability to clients and customers, fines, penalties or judgments imposed by the Firm’s regulators, increased operating expenses and harm to the Firm’s reputation, any of which could materially and adversely affect the Firm.
Lapses in disclosure controls and procedures or internal control over financial reporting could materially and adversely affect the Firm’s operations, profitability or reputation.
There can be no assurance that the Firm’s disclosure controls and procedures will be effective in every circumstance or that a material weakness or significant deficiency in internal control over financial reporting will not occur. Any such lapses or deficiencies may materially and adversely affect the Firm’s business and results of operations or financial condition, restrict its ability to access the capital markets, require the Firm to expend significant resources to correct the lapses or deficiencies, expose the Firm to regulatory or legal proceedings, subject it to fines, penalties or judgments, harm the Firm’s reputation, or otherwise cause a decline in investor confidence.
Other Risks
The financial services industry is highly competitive, and JPMorgan Chase’s inability to compete successfully may adversely affect its results of operations.
JPMorgan Chase operates in a highly competitive environment, and the Firm expects that competition in the U.S. and global financial services industry will continue to be intense. Competitors of the Firm include other banks, brokerage firms, investment banking companies, merchant banks, hedge funds, commodity trading companies, private equity firms, insurance companies, mutual fund companies, investment managers, credit card companies, mortgage banking companies, trust companies, securities processing companies, automobile financing companies, leasing companies, e-commerce and other Internet-based companies, and a variety of other financial services and advisory companies. Technological advances and the growth of e-commerce have made it possible for non-depository institutions to offer products and services that traditionally were banking products, and for financial institutions and other companies to provide electronic and Internet-based financial solutions, including electronic securities trading and payment processing. The Firm’s businesses generally compete on the basis of the quality and variety of the Firm’s products and services, transaction execution, innovation, reputation and price. Ongoing or increased competition in any one or all of these areas may put downward pressure on prices for the Firm’s products and services or may cause the Firm to lose market share. Increased competition also
may require the Firm to make additional capital investments in its businesses in order to remain competitive. These investments may increase expense or may require the Firm to extend more of its capital on behalf of clients in order to execute larger, more competitive transactions. The Firm cannot provide assurance that the significant competition in the financial services industry will not materially and adversely affect its future results of operations.
Competitors of the Firm’s non-U.S. wholesale businesses are typically subject to different, and in some cases, less stringent, legislative and regulatory regimes. For example, the regulatory objectives underlying several provisions of the Dodd-Frank Act, including the prohibition on proprietary trading under the Volcker Rule, have not been embraced by governments and regulatory agencies outside the U.S. and may not be implemented into law in most countries. The more restrictive laws and regulations applicable to U.S. financial services institutions, such as JPMorgan Chase, can put the Firm at a competitive disadvantage to its non-U.S. competitors, including prohibiting the Firm from engaging in certain transactions, imposing higher capital requirements on the Firm, making the Firm’s pricing of certain transactions more expensive for clients or adversely affecting the Firm’s cost structure for providing certain products, all of which can reduce the revenue and profitability of the Firm’s wholesale businesses.
JPMorgan Chase’s ability to attract and retain qualified employees is critical to its success.
JPMorgan Chase’s employees are the Firm’s most important resource, and in many areas of the financial services industry, competition for qualified personnel is intense. The Firm endeavors to attract talented and diverse new employees and retain and motivate its existing employees. The Firm also seeks to retain a pipeline of senior employees with superior talent, augmented from time to time by external hires, to provide continuity of succession for the Firm’s Operating Committee, including the Chief Executive Officer position, and senior positions below the Operating Committee. The Firm regularly reviews candidates for senior management positions to assess whether they currently are ready for a next-level role. In addition, the Firm’s Board of Directors is deeply involved in succession planning, including review of the succession plans for the Chief Executive Officer and the members of the Operating Committee. If for any reason the Firm were unable to continue to attract or retain qualified employees, including successors to the Chief Executive Officer or members of the Operating Committee, the Firm’s performance, including its competitive position, could be materially and adversely affected.
JPMorgan Chase’s financial statements are based in part on assumptions and estimates which, if incorrect, could cause unexpected losses in the future.
Under accounting principles generally accepted in the U.S. (“U.S. GAAP”), JPMorgan Chase is required to use certain assumptions and estimates in preparing its financial
|
16
|
||
statements, including in determining allowances for credit losses and reserves related to litigation, among other items. Certain of the Firm’s financial instruments, including trading assets and liabilities, available-for-sale securities, certain loans, MSRs, structured notes and certain repurchase and resale agreements, among other items, require a determination of their fair value in order to prepare the Firm’s financial statements. Where quoted market prices are not available, the Firm may make fair value determinations based on internally developed models or other means which ultimately rely to some degree on management estimates and judgment. In addition, sudden illiquidity in markets or declines in prices of certain loans and securities may make it more difficult to value certain balance sheet items, which may lead to the possibility that such valuations will be subject to further change or adjustment. If assumptions or estimates underlying the Firm’s financial statements are incorrect, the Firm may experience material losses.
Damage to JPMorgan Chase’s reputation could damage its businesses.
Maintaining trust in JPMorgan Chase is critical to the Firm’s ability to attract and maintain customers, investors and employees. Damage to the Firm’s reputation can therefore cause significant harm to the Firm’s business and prospects. Harm to the Firm’s reputation can arise from numerous sources, including, among others, employee misconduct, security breaches, compliance failures, litigation or regulatory outcomes or governmental investigations. The Firm’s reputation could also be harmed by the failure of an affiliate, joint-venturer or merchant banking portfolio company, or a vendor or other third party with which the Firm does business, to comply with laws or regulations. In addition, a failure or perceived failure to deliver appropriate standards of service and quality, to treat customers and clients fairly, or to handle or use confidential information of customers or clients appropriately or in compliance with applicable privacy laws and regulations can result in customer dissatisfaction, litigation and heightened regulatory scrutiny, all of which can lead to lost revenue, higher operating costs and harm to the Firm’s reputation. Adverse publicity or negative information posted on social media websites regarding the Firm, whether or not true, may result in harm to the Firm’s prospects. Actions by the financial services industry generally or by certain members of or individuals in the industry can also affect the Firm’s reputation. For example, the role played by financial services firms during the financial crisis, including concerns that consumers have been treated unfairly by financial institutions, has damaged the reputation of the industry as a whole. Should any of these or other events or factors that can undermine the Firm’s reputation occur, there is no assurance that the additional costs and expenses that the Firm may need to incur to address the issues giving rise to the reputational harm could not adversely affect the Firm’s earnings and results of operations, or that damage to the Firm’s reputation will not impair the Firm’s ability to retain its existing or attract new customers, investors and employees.
Management of potential conflicts of interests has become increasingly complex as the Firm continues to expand its business activities through more numerous transactions, obligations and interests with and among the Firm’s clients. The failure or perceived failure to adequately address conflicts of interest could affect the willingness of clients to deal with the Firm, or give rise to litigation or enforcement actions, as well as cause serious reputational harm to the Firm.
None.
JPMorgan Chase’s headquarters is located in New York City at 270 Park Avenue, a 50-story office building owned by JPMorgan Chase. This location contains 1.3 million square feet of space.
In total, JPMorgan Chase owned or leased 10.5 million square feet of commercial office and retail space in New York City at
December 31, 2014
. JPMorgan Chase and its subsidiaries also own or lease significant administrative and operational facilities in Columbus/Westerville, Ohio (3.7 million square feet); Chicago, Illinois (3.4 million square feet); Wilmington/Newark, Delaware (2.2 million square feet); Houston, Texas (2.2 million square feet); Dallas/Fort Worth, Texas (2.0 million square feet); Phoenix/Tempe, Arizona (1.8 million square feet); Jersey City, New Jersey (1.2 million square feet); as well as owning or leasing 5,602 retail branches in 23 states. At
December 31, 2014
, the Firm occupied a total of 65.5 million square feet of space in the U.S.
At
December 31, 2014
, the Firm also owned or leased 5.5 million square feet of space in Europe, the Middle East and Africa. In the U.K., at December 31, 2014, JPMorgan Chase owned or leased 4.5 million square feet of space, including 1.4 million square feet at 25 Bank Street, the European headquarters of the Corporate & Investment Bank.
In 2008, JPMorgan Chase acquired a 999-year leasehold interest in land at London’s Canary Wharf. JPMorgan Chase has a building agreement in place through October 30, 2016, to develop the Canary Wharf site for future use.
JPMorgan Chase and its subsidiaries also occupy offices and other administrative and operational facilities in the Asia/Pacific region, Latin America and Canada under ownership and leasehold agreements aggregating 5.8 million square feet of space at
December 31, 2014
. This includes leases for administrative and operational facilities in India (2.0 million square feet).
The properties occupied by JPMorgan Chase are used across all of the Firm’s business segments and for corporate purposes. JPMorgan Chase continues to evaluate its current and projected space requirements and may determine from time to time that certain of its premises and facilities are no longer necessary for its operations. There is no assurance that the Firm will be able to dispose of any such excess
|
17
|
||
Parts I and II
premises or that it will not incur charges in connection with such dispositions. Such disposition costs may be material to the Firm’s results of operations in a given period. For information on occupancy expense, see the Consolidated Results of Operations on
pages 68–71
.
For a description of the Firm’s material legal proceedings, see Note 31.
Not applicable.
Part II
Market for registrant’s common equity
The outstanding shares of JPMorgan Chase common stock are listed and traded on the New York Stock Exchange, the London Stock Exchange and the Tokyo Stock Exchange. For the quarterly high and low prices of and cash dividends declared on JPMorgan Chase’s common stock for the last two years, see the section entitled “Supplementary information – Selected quarterly financial data (unaudited)” on
pages 307–308
. For a comparison of the cumulative total return for JPMorgan Chase common stock with the comparable total return of the S&P 500 Index, the KBW Bank Index and the S&P Financial Index over the five-year period ended
December 31, 2014
, see “Five-year stock performance”, on
page 63
.
For information on the common dividend payout ratio, see Capital actions in the Capital Management section of Management’s discussion and analysis on
page 154
. For a discussion of restrictions on dividend payments, see Note 22 and Note 27. At
January 31, 2015
, there were
205,115
holders of record of JPMorgan Chase common stock. For information regarding securities authorized for issuance under the Firm’s employee stock-based compensation plans, see Part III, Item 12 on
page 23
.
Repurchases under the common equity repurchase program
For information regarding repurchases under the Firm’s common equity repurchase program, see Capital actions in the Capital Management section of Management’s discussion and analysis on
page 154
.
|
18
|
||
Shares repurchased, on a settlement-date basis, pursuant to the common equity repurchase program during
2014
were as follows.
|
Year ended December 31, 2014
|
Total shares of common stock repurchased
|
Average price paid per share of common stock
(a)
|
Aggregate repurchases of common equity (in millions)
(a)
|
Dollar value
of remaining
authorized
repurchase
(in millions)
(a)
|
|||||||||||
|
First quarter
|
6,733,494
|
|
$
|
57.31
|
|
$
|
386
|
|
$
|
8,258
|
|
||||
|
Second quarter
|
24,769,261
|
|
55.53
|
|
1,375
|
|
6,883
|
|
|||||||
|
Third quarter
|
25,503,377
|
|
58.37
|
|
1,489
|
|
5,394
|
|
|||||||
|
October
|
9,527,323
|
|
57.92
|
|
552
|
|
4,842
|
|
|||||||
|
November
|
6,180,664
|
|
60.71
|
|
375
|
|
4,467
|
|
|||||||
|
December
|
9,538,119
|
|
61.08
|
|
583
|
|
3,884
|
|
|||||||
|
Fourth quarter
|
25,246,106
|
|
59.80
|
|
1,510
|
|
3,884
|
|
|||||||
|
Year-to-date
|
82,252,238
|
|
$
|
57.87
|
|
$
|
4,760
|
|
$
|
3,884
|
|
||||
|
(a)
|
Excludes commissions cost.
|
Repurchases under the stock-based incentive plans
Participants in the Firm’s stock-based incentive plans may have shares of common stock withheld to cover income taxes. Shares withheld to pay income taxes are repurchased pursuant to the terms of the applicable plan and not under the Firm’s repurchase program. Shares repurchased, on a settlement-date basis, pursuant to these plans during
2014
were as follows.
|
Year ended
December 31, 2014 |
Total shares of common stock
repurchased
|
Average price
paid per share of common stock
|
||||
|
First quarter
|
1,245
|
|
$
|
57.99
|
|
|
|
Second quarter
|
—
|
|
—
|
|
||
|
Third quarter
|
—
|
|
—
|
|
||
|
Fourth quarter
|
—
|
|
—
|
|
||
|
Year-to-date
|
1,245
|
|
$
|
57.99
|
|
|
For five-year selected financial data, see “Five-year summary of consolidated financial highlights (unaudited)” on
page 62
.
Management’s discussion and analysis of financial condition and results of operations, entitled “Management’s discussion and analysis,” appears on
pages 64–169
. Such information should be read in conjunction with the Consolidated Financial Statements and Notes thereto, which appear on
pages 172–306
.
For a discussion of the quantitative and qualitative disclosures about market risk, see the Market Risk Management section of Management’s discussion and analysis on
pages 131–136
.
|
19
|
||
The Consolidated Financial Statements, together with the Notes thereto and the report thereon dated
February 24, 2015
, of PricewaterhouseCoopers LLP, the Firm’s independent registered public accounting firm, appear on
pages 171–306
.
Supplementary financial data for each full quarter within the two years ended
December 31, 2014
, are included on
pages 307–308
in the table entitled “Selected quarterly financial data (unaudited).” Also included is a “Glossary of terms’’ on
pages 309–313
.
None.
In May 2013, the Committee of Sponsoring Organizations of the Treadway Commission (COSO) issued its updated “Internal Control - Integrated Framework (2013)”. The 2013 framework, which provides guidance for designing, implementing and conducting internal control and assessing its effectiveness, updates the original COSO framework, which was published in 1992. The Firm used the 2013 COSO framework to assess the effectiveness of the Firm’s internal control over financial reporting as of
December 31, 2014
. See “Management’s report on internal control over financial reporting” on
page 170
.
As of the end of the period covered by this report, an evaluation was carried out under the supervision and with the participation of the Firm’s management, including its Chairman and Chief Executive Officer and its Chief Financial Officer, of the effectiveness of its disclosure controls and procedures (as defined in Rule 13a-15(e) under the Securities Exchange Act of 1934). Based on that evaluation, the Chairman and Chief Executive Officer and the Chief Financial Officer concluded that these disclosure controls and procedures were effective. See Exhibits 31.1 and 31.2 for the Certification statements issued by the Chairman and Chief Executive Officer and Chief Financial Officer.
The Firm is committed to maintaining high standards of internal control over financial reporting. Nevertheless, because of its inherent limitations, internal control over financial reporting may not prevent or detect misstatements. In addition, in a firm as large and complex as JPMorgan Chase, lapses or deficiencies in internal controls may occur from time to time, and there can be no assurance that any such deficiencies will not result in significant deficiencies or material weaknesses in internal controls in the future. For further information, see “Management’s report on internal control over financial reporting” on
page 170
. There was no change in the Firm’s internal control over financial reporting (as defined in Rule 13a-15(f) under the Securities Exchange Act of 1934) that occurred during the
three months ended
December 31, 2014
, that has materially affected, or is reasonably likely to materially affect, the Firm’s internal control over financial reporting.
|
20
|
||
Pursuant to Section 219 of the Iran Threat Reduction and Syria Human Rights Act of 2012, which added Section 13(r) to the Securities Exchange Act of 1934, as amended (the “Exchange Act”), an issuer is required to disclose in its annual or quarterly reports, as applicable, whether it or any of its affiliates knowingly engaged in certain activities, transactions or dealings relating to Iran or with individuals or entities designated pursuant to certain Executive Orders. Disclosure is generally required even where the activities, transactions or dealings were conducted in compliance with applicable law. Except as set forth below, as of the date of this report, the Firm is not aware of any other activity, transaction or dealing by any of its affiliates during the year ended December 31, 2014 that requires disclosure under Section 219.
Carlson Wagonlit Travel (“CWT”), a business travel management firm in which JPMorgan Chase had invested through its merchant banking activities, may be deemed to be an affiliate of the Firm, as that term is defined in Exchange Act Rule 12b-2. CWT informed the Firm that, during the period January 1, 2014 through August 15, 2014 (the date on which the Firm sold its investment in CWT), CWT booked approximately 2 flights (of the approximately 37 million transactions it booked during the period) to Iran on Iran Air for passengers, including employees of foreign governments and/or non-governmental organizations. Both flights originated outside of the U.S. from countries that permit travel to Iran, and none of such passengers were persons designated under Executive Orders 13224 or 13382 or were employees of foreign governments that are targets of U.S. sanctions. CWT and the Firm believe that this activity is permissible pursuant to certain exemptions from U.S. sanctions for travel-related transactions under the International Emergency Economic Powers Act, as amended. CWT had approximately $5,000 in gross revenues attributable to these transactions.
In addition, during 2014, JPMorgan Chase Bank, N.A. processed one payment from Iran Air on behalf of a U.S. client into such client’s account at JPMorgan Chase Bank, N.A. Iran Air is designated pursuant to Executive Order 13382. This transaction was authorized by and conducted pursuant to a license from the Treasury Department’s Office of Foreign Assets Control (“OFAC”). JPMorgan Chase Bank, N.A. charged a fee of US$ 3.50 for this transaction. Iran Air overpaid such U.S. client when it made the initial payment to the client. Therefore, upon its U.S. client’s request, the Firm transferred the overpayment back to Iran Air in the fourth quarter of 2014 and charged a fee of US$ 5.50 for the transfer. As with the initial transaction, the transfer of the overpayment to Iran Air was authorized by and conducted pursuant to an OFAC license. JPMorgan Chase Bank, N.A. has no current intention to continue such activities but may in the future engage in similar transactions for its clients to the extent permitted by U.S. law.
|
21
|
||
Executive officers of the registrant
(a)
|
Age
|
||
|
Name
|
(at December 31, 2014)
|
Positions and offices
|
|
James Dimon
|
58
|
Chairman of the Board, Chief Executive Officer and President.
|
|
Ashley Bacon
|
45
|
Chief Risk Officer since June 2013. He had been Deputy Chief Risk Officer since June 2012, prior to which he had been Global Head of Market Risk for the Investment Bank (now part of Corporate & Investment Bank).
|
|
Stephen M. Cutler
|
53
|
General Counsel.
|
|
John L. Donnelly
|
58
|
Head of Human Resources since January 2009.
|
|
Mary Callahan Erdoes
|
47
|
Chief Executive Officer of Asset Management since September 2009.
|
|
Marianne Lake
|
45
|
Chief Financial Officer since January 1, 2013, prior to which she had been Chief Financial Officer of Consumer & Community Banking since 2009. She previously had served as Global Controller of the Investment Bank (now part of Corporate & Investment Bank) from 2007 to 2009.
|
|
Douglas B. Petno
|
49
|
Chief Executive Officer of Commercial Banking since January 2012. He had been Chief Operating Officer of Commercial Banking since October 2010, prior to which he had been Global Head of Natural Resources in the Investment Bank (now part of Corporate & Investment Bank).
|
|
Daniel E. Pinto
|
52
|
Chief Executive Officer of the Corporate & Investment Bank since March 2014 and Chief Executive Officer of Europe, the Middle East and Africa since June 2011. He had been Co-Chief Executive Officer of the Corporate & Investment Bank from July 2012 until March 2014, prior to which he had been head or co-head of the Global Fixed Income business from November 2009 until July 2012. He was Global Head of Emerging Markets from 2006 until 2009, and was also responsible for the Global Credit Trading & Syndicate business from 2008 until 2009.
|
|
Gordon A. Smith
|
56
|
Chief Executive Officer of Consumer & Community Banking since December 2012 prior to which he had been Co-Chief Executive Officer since July 2012. He had been Chief Executive Officer of Card Services since 2007 and of the Auto Finance and Student Lending businesses since 2011.
|
|
Matthew E. Zames
|
44
|
Chief Operating Officer since April 2013 and head of Mortgage Banking Capital Markets since January 2012. He had been Co-Chief Operating Officer from July 2012 until April 2013. He had been Chief Investment Officer from May until September 2012, co-head of the Global Fixed Income business from November 2009 until May 2012 and co-head of Mortgage Banking Capital Markets from July 2011 until January 2012, prior to which he had served in a number of senior Investment Banking Fixed Income management roles.
|
(a) All of the executive officers listed in this table are currently members of the Firm’s Operating Committee.
Unless otherwise noted, during the five fiscal years ended
December 31, 2014
, all of JPMorgan Chase’s above-named executive officers have continuously held senior-level positions with JPMorgan Chase. There are no family relationships among the foregoing executive officers. Information to be provided in Items 10, 11, 12, 13 and 14 of the Form 10-K and not otherwise included herein is incorporated by reference to the Firm’s definitive proxy statement for its
2015
Annual Meeting of Stockholders to be held on
May 19, 2015
, which will be filed with the SEC within 120 days of the end of the Firm’s fiscal year ended
December 31, 2014
.
|
22
|
||
See Item 10.
For security ownership of certain beneficial owners and management, see Item 10.
The following table sets forth the total number of shares available for issuance under JPMorgan Chase’s employee stock-based incentive plans (including shares available for issuance to nonemployee directors). The Firm is not authorized to grant stock-based incentive awards to nonemployees, other than to nonemployee directors.
|
December 31, 2014
|
Number of shares to be issued upon exercise of outstanding options/SARs
|
Weighted-average
exercise price of
outstanding
options/SARs
|
Number of shares remaining available for future issuance under stock compensation plans
|
|||||||||
|
Plan category
|
||||||||||||
|
Employee stock-based incentive plans approved by shareholders
|
59,194,831
|
|
$
|
45.00
|
|
266,037,974
|
|
(a)
|
||||
|
Total
|
59,194,831
|
|
$
|
45.00
|
|
266,037,974
|
|
|||||
|
(a)
|
Represents future shares available under the shareholder-approved Long-Term Incentive Plan, as amended and restated effective May 17, 2011.
|
All future shares will be issued under the shareholder-approved Long-Term Incentive Plan, as amended and restated effective May 17, 2011. For further discussion, see Note 10.
See Item 10.
See Item 10.
|
23
|
||
Part IV
Exhibits, financial statement schedules
|
1
|
Financial statements
|
|
|
The Consolidated Financial Statements, the Notes thereto and the report of the Independent Registered Public Accounting Firm thereon listed in Item 8 are set forth commencing on page 171.
|
||
|
2
|
Financial statement schedules
|
|
|
3
|
Exhibits
|
|
|
3.1
|
Restated Certificate of Incorporation of JPMorgan Chase & Co., effective April 5, 2006 (incorporated by reference to Exhibit 3.1 to the Current Report on Form 8-K of JPMorgan Chase & Co. (File No. 1-5805) filed April 7, 2006).
|
|
|
3.2
|
Amendment to the Restated Certificate of Incorporation of JPMorgan Chase & Co., effective June 7, 2013 (incorporated by reference to Appendix F to the Proxy Statement on Schedule 14A of JPMorgan Chase & Co. (File No. 1-5805) filed April 10, 2013).
|
|
|
3.3
|
Certificate of Designations for Fixed-to-Floating Rate Non-Cumulative Preferred Stock, Series I (incorporated by reference to Exhibit 3.1 to the Current Report on Form 8-K of JPMorgan Chase & Co. (File No. 1-5805) filed April 24, 2008).
|
|
|
3.4
|
Certificate of Designations for 5.50% Non-Cumulative Preferred Stock, Series O (incorporated by reference to Exhibit 3.1 to the Current Report on Form 8-K of JPMorgan Chase & Co. (File No. 1-5805) filed August 27, 2012).
|
|
|
3.5
|
Certificate of Designations for 5.45% Non-Cumulative Preferred Stock, Series P (incorporated by reference to Exhibit 3.1 to the Current Report on Form 8-K of JPMorgan Chase & Co. (File No. 1-5805) filed February 5, 2013).
|
|
|
3.6
|
Certificate of Designations for Fixed-to-Floating Rate Non-Cumulative Preferred Stock, Series Q (incorporated by reference to Exhibit 3.1 to the Current Report on Form 8-K of JPMorgan Chase & Co. (File No. 1-5805) filed April 23, 2013).
|
|
|
3.7
|
Certificate of Designations for Fixed-to-Floating Rate Non-Cumulative Preferred Stock, Series R (incorporated by reference to Exhibit 3.1 to the Current Report on Form 8-K of JPMorgan Chase & Co. (File No. 1-5805) filed July 29, 2013).
|
|
|
3.8
|
Certificate of Designations for Fixed-to-Floating Rate Non-Cumulative Preferred Stock, Series S (incorporated by reference to Exhibit 3.1 to the Current Report on Form 8-K of JPMorgan Chase & Co. (File No. 1-5805) filed January 22, 2014).
|
|
|
3.9
|
Certificate of Designations for 6.70% Non-Cumulative Preferred Stock, Series T (incorporated by reference to Exhibit 3.1 to the Current Report on Form 8-K of JPMorgan Chase & Co. (File No. 1-5805) filed January 30, 2014).
|
|
|
3.10
|
Certificate of Designations for Fixed-to-Floating Non-Cumulative Preferred Stock, Series U (incorporated by reference to Exhibit 3.1 to the Current Report on Form 8-K of JPMorgan Chase & Co. (File No. 1-5805) filed on March 10, 2014).
|
|
|
3.11
|
Certificate of Designations for Fixed-to-Floating Non-Cumulative Preferred Stock, Series V (incorporated by reference to Exhibit 3.1 to the Current Report on Form 8-K of JPMorgan Chase & Co. (File No. 1-5805) filed on June 9, 2014).
|
|
|
3.12
|
Certificate of Designations for 6.30% Non-Cumulative Preferred Stock, Series W (incorporated by reference to Exhibit 3.1 to the Current Report on Form 8-K of JPMorgan Chase & Co. (File No. 1-5805) filed on June 23, 2014).
|
|
|
3.13
|
Certificate of Designations for Fixed-to-Floating Non-Cumulative Preferred Stock, Series X (incorporated by reference to Exhibit 3.1 to the Current Report on Form 8-K of JPMorgan Chase & Co. (File No. 1-5805) filed on September 23, 2014).
|
|
|
3.14
|
By-laws of JPMorgan Chase & Co., effective September 17, 2013 (incorporated by reference to Exhibit 3.1 to the Current Report on Form 8-K of JPMorgan Chase & Co. (File No. 1-5805) filed September 20, 2013).
|
|
|
24
|
||
|
4.1
|
Indenture, dated as of October 21, 2010, between JPMorgan Chase & Co. and Deutsche Bank Trust Company Americas, as Trustee (incorporated by reference to Exhibit 4.1 to the Current Report on Form 8-K of JPMorgan Chase & Co. (File No.1-5805) filed October 21, 2010).
|
|
|
4.2
|
Subordinated Indenture, dated as of March 14, 2014, between JPMorgan Chase & Co. and U.S. Bank Trust National Association, as Trustee (incorporated by reference to Exhibit 4.1 to the Current Report on Form 8-K of JPMorgan Chase & Co. (File No.1-5805) filed March 14, 2014).
|
|
|
4.3
|
Indenture, dated as of May 25, 2001, between JPMorgan Chase & Co. and Bankers Trust Company (succeeded by Deutsche Bank Trust Company Americas), as Trustee (incorporated by reference to Exhibit 4(a)(1) to the Registration Statement on Form S-3 of JPMorgan Chase & Co. (File No. 333-52826) filed June 13, 2001).
|
|
|
4.4
|
Form of Deposit Agreement (incorporated by reference to Exhibit 4.3 to the Registration Statement on Form S-3 of JPMorgan Chase & Co. (File No. 333-191692) filed October 11, 2013).
|
|
|
4.5
|
Form of Warrant to purchase common stock (incorporated by reference to Exhibit 4.2 to the Form 8-A of JPMorgan Chase & Co. (File No. 1-5805) filed December 11, 2009).
|
|
|
Other instruments defining the rights of holders of long-term debt securities of JPMorgan Chase & Co. and its subsidiaries are omitted pursuant to Section (b)(4)(iii)(A) of Item 601 of Regulation S-K. JPMorgan Chase & Co. agrees to furnish copies of these instruments to the SEC upon request.
|
||
|
10.1
|
Deferred Compensation Plan for Non-Employee Directors of JPMorgan Chase & Co., as amended and restated July 2001 and as of December 31, 2004 (incorporated by reference to Exhibit 10.1 to the Annual Report on Form 10-K of JPMorgan Chase & Co. (File No. 1-5805) for the year ended December 31, 2007).
(a)
|
|
|
10.2
|
2005 Deferred Compensation Plan for Non-Employee Directors of JPMorgan Chase & Co., effective as of January 1, 2005 (incorporated by reference to Exhibit 10.2 to the Annual Report on Form 10-K of JPMorgan Chase & Co. (File No. 1-5805) for the year ended December 31, 2007).
(a)
|
|
|
10.3
|
2005 Deferred Compensation Program of JPMorgan Chase & Co., restated effective as of December 31, 2008 (incorporated by reference to Exhibit 10.4 to the Annual Report on Form 10-K of JPMorgan Chase & Co. (File No. 1-5805) for the year ended December 31, 2008).
(a)
|
|
|
10.4
|
JPMorgan Chase & Co. Long-Term Incentive Plan as amended and restated effective May 17, 2011 (incorporated by reference to Appendix C of the Schedule 14A of JPMorgan Chase & Co. (File No. 1-5805) filed April 7, 2011).
(a)
|
|
|
10.5
|
Key Executive Performance Plan of JPMorgan Chase & Co., as amended and restated effective January 1, 2014 (incorporated by reference to Appendix G of the Schedule 14A of JPMorgan Chase & Co. (File No. 1-5805) filed April 10, 2013).
(a)
|
|
|
10.6
|
Excess Retirement Plan of JPMorgan Chase & Co., restated and amended as of December 31, 2008, as amended (incorporated by reference to Exhibit 10.7 to the Annual Report on Form 10-K of JPMorgan Chase & Co. (File No. 1-5805) for the year ended December 31, 2009).
(a)
|
|
|
10.7
|
1995 Stock Incentive Plan of J.P. Morgan & Co. Incorporated and Affiliated Companies, as amended, dated December 11, 1996 (incorporated by reference to Exhibit 10.8 to the Annual Report on Form 10-K of JPMorgan Chase & Co. (File No. 1-5805) for the year ended December 31, 2008).
(a)
|
|
|
10.8
|
Executive Retirement Plan of JPMorgan Chase & Co., as amended and restated December 31, 2008 (incorporated by reference to Exhibit 10.9 to the Annual Report on Form 10-K of JPMorgan Chase & Co. (File No. 1-5805) for the year ended December 31, 2008).
(a)
|
|
|
10.9
|
Bank One Corporation Stock Performance Plan, as amended and restated effective February 20, 2001 (incorporated by reference to Exhibit 10.12 to the Annual Report on Form 10-K of JPMorgan Chase & Co. (File No. 1-5805) for the year ended December 31, 2008).
(a)
|
|
|
25
|
||
|
10.10
|
Bank One Corporation Supplemental Savings and Investment Plan, as amended and restated effective December 31, 2008 (incorporated by reference to Exhibit 10.13 to the Annual Report on Form 10-K of JPMorgan Chase & Co. (File No. 1-5805) for the year ended December 31, 2008).
(a)
|
|
|
10.11
|
Banc One Corporation Revised and Restated 1995 Stock Incentive Plan, effective April 17, 1995 (incorporated by reference to Exhibit 10.15 to the Annual Report on Form 10-K of JPMorgan Chase & Co. (File No. 1-5805) for the year ended December 31, 2008).
(a)
|
|
|
10.12
|
Form of JPMorgan Chase & Co. Long-Term Incentive Plan Award Agreement of January 22, 2008 stock appreciation rights (incorporated by reference to Exhibit 10.25 to the Annual Report on Form 10-K of JPMorgan Chase & Co. (File No. 1-5805) for the year ended December 31, 2007).
(a)
|
|
|
10.13
|
Form of JPMorgan Chase & Co. Long-Term Incentive Plan Award Agreement of January 22, 2008 stock appreciation rights for James Dimon (incorporated by reference to Exhibit 10.27 to the Annual Report on Form 10-K of JPMorgan Chase & Co. (File No. 1-5805) for the year ended December 31, 2007).
(a)
|
|
|
10.14
|
Form of JPMorgan Chase & Co. Long-Term Incentive Plan Terms and Conditions for stock appreciation rights, dated as of January 20, 2009 (incorporated by reference to Exhibit 10.20 to the Annual Report on Form 10-K of JPMorgan Chase & Co. (File No. 1-5805) for the year ended December 31, 2008).
(a)
|
|
|
10.15
|
Form of JPMorgan Chase & Co. Long-Term Incentive Plan Terms and Conditions for Operating Committee member stock appreciation rights, dated as of January 20, 2009 (incorporated by reference to Exhibit 10.21 to the Annual Report on Form 10-K of JPMorgan Chase & Co. (File No. 1-5805) for the year ended December 31, 2008).
(a)
|
|
|
10.16
|
Form of JPMorgan Chase & Co. Long-Term Incentive Plan Terms and Conditions for Operating Committee member stock appreciation rights, dated as of February 3, 2010 (incorporated by reference to Exhibit 10.23 to the Annual Report on Form 10-K of JPMorgan Chase & Co. (File No. 1-5805) for the year ended December 31, 2009).
(a)
|
|
|
10.17
|
Forms of JPMorgan Chase & Co. Long-Term Incentive Plan Terms and Conditions for stock appreciation rights and restricted stock units, dated as of January 18, 2012 (incorporated by reference to Exhibit 10.25 to the Annual Report on Form 10-K of JPMorgan Chase & Co. (File No. 1-5805) for the year ended December 31, 2011).
(a)
|
|
|
10.18
|
Forms of JPMorgan Chase & Co. Long-Term Incentive Plan Terms and Conditions for stock appreciation rights and restricted stock units for Operating Committee members, dated as of January 17, 2013 (incorporated by reference to Exhibit 10.23 to the Annual Report on Form 10-K of JPMorgan Chase & Co. (File No. 1-5805) for the year ended December 31, 2012).
(a)
|
|
|
10.19
|
Form of JPMorgan Chase & Co. Long-Term Incentive Plan Terms and Conditions for restricted stock units for Operating Committee members, dated January 22, 2014 (incorporated by reference to Exhibit 10.1 to the Quarterly Report on Form 10-Q of JPMorgan Chase & Co. (File No. 1-5805) for the quarter ended March 31, 2014).
(a)
|
|
|
10.20
|
Form of JPMorgan Chase & Co. Terms and Conditions of Fixed Allowance (UK) (incorporated by reference to Exhibit 10.1 to the Quarterly Report on Form 10-Q of JPMorgan Chase & Co. (File No. 1-5805) for the quarter ended June 30, 2014).
(a)
|
|
|
10.21
|
Form of JPMorgan Chase & Co. Performance-Based Incentive Compensation Plan, effective as of January 1, 2006, as amended (incorporated by reference to Exhibit 10.27 to the Annual Report on Form 10-K of JPMorgan Chase & Co. (File No. 1-5805) for the year ended December 31, 2009).
(a)
|
|
|
10.22
|
Deferred Prosecution Agreement dated January 6, 2014 between the U.S. Attorney’s Office for the Southern District of New York and JPMorgan Chase Bank, N.A. (incorporated by reference to Exhibit 99.1 to the Current Report on Form 8-K of JPMorgan Chase & Co. (File No. 1-5805) filed January 7, 2014).
|
|
|
12.1
|
Computation of ratio of earnings to fixed charges.
(b)
|
|
|
12.2
|
Computation of ratio of earnings to fixed charges and preferred stock dividend requirements.
(b)
|
|
|
21
|
List of subsidiaries of JPMorgan Chase & Co.
(b)
|
|
|
22.1
|
Annual Report on Form 11-K of The JPMorgan Chase 401(k) Savings Plan for the year ended December 31, 2014 (to be filed pursuant to Rule 15d-21 under the Securities Exchange Act of 1934).
|
|
|
23
|
Consent of independent registered public accounting firm.
(b)
|
|
|
31.1
|
Certification.
(b)
|
|
|
31.2
|
Certification.
(b)
|
|
|
32
|
Certification pursuant to Section 906 of the Sarbanes-Oxley Act of 2002.
(c)
|
|
|
26
|
||
|
101.INS
|
XBRL Instance Document.
(b)(d)
|
|
|
101.SCH
|
XBRL Taxonomy Extension Schema
Document.
(b)
|
|
|
101.CAL
|
XBRL Taxonomy Extension Calculation Linkbase Document.
(b)
|
|
|
101.DEF
|
XBRL Taxonomy Extension Definition Linkbase Document.
(b)
|
|
|
101.LAB
|
XBRL Taxonomy Extension Label Linkbase Document.
(b)
|
|
|
101.PRE
|
XBRL Taxonomy Extension Presentation Linkbase Document.
(b)
|
|
|
(a)
|
This exhibit is a management contract or compensatory plan or arrangement.
|
|
(b)
|
Filed herewith.
|
|
(c)
|
Furnished herewith. This exhibit shall not be deemed “filed” for purposes of Section 18 of the Securities Exchange Act of 1934, or otherwise subject to the liability of that Section. Such exhibit shall not be deemed incorporated into any filing under the Securities Act of 1933 or the Securities Exchange Act of 1934.
|
|
(d)
|
Pursuant to Rule 405 of Regulation S-T, includes the following financial information included in the Firm’s Annual Report on Form 10-K for the year ended
December 31, 2014
, formatted in XBRL (eXtensible Business Reporting Language) interactive data files: (i) the Consolidated statements of income for the years ended
December 31, 2014
,
2013
and
2012
, (ii) the Consolidated statements of comprehensive income for the years ended
December 31, 2014
,
2013
and
2012
, (iii) the Consolidated balance sheets as of
December 31, 2014
and
2013
, (iv) the Consolidated statements of changes in stockholders’ equity for the years ended
December 31, 2014
,
2013
and
2012
, (v) the Consolidated statements of cash flows for the years ended
December 31, 2014
,
2013
and
2012
, and (vi) the Notes to Consolidated Financial Statements.
|
|
27
|
||
Pages 28–60
not used
Table of contents
|
Financial:
|
||||||
|
62
|
Five-Year Summary of Consolidated Financial Highlights
|
Audited financial statements:
|
||||
|
63
|
Five-Year Stock Performance
|
170
|
Management’s Report on Internal Control Over Financial Reporting
|
|||
|
Management’s discussion and analysis:
|
171
|
Report of Independent Registered Public Accounting Firm
|
||||
|
64
|
Introduction
|
172
|
Consolidated Financial Statements
|
|||
|
65
|
Executive Overview
|
177
|
Notes to Consolidated Financial Statements
|
|||
|
68
|
Consolidated Results of Operations
|
|||||
|
72
|
Consolidated Balance Sheets Analysis
|
|||||
|
74
|
Off–Balance Sheet Arrangements and Contractual Cash Obligations
|
|||||
|
76
|
Consolidated Cash Flows Analysis
|
|||||
|
77
|
Explanation and Reconciliation of the Firm’s Use of Non-GAAP Financial Measures
|
Supplementary information:
|
||||
|
79
|
Business Segment Results
|
307
|
Selected Quarterly Financial Data
|
|||
|
105
|
Enterprise-wide Risk Management
|
309
|
Glossary of Terms
|
|||
|
110
|
Credit Risk Management
|
|||||
|
131
|
Market Risk Management
|
|||||
|
137
|
Country Risk Management
|
|||||
|
139
|
Model Risk Management
|
|||||
|
140
|
Principal Risk Management
|
|||||
|
141
|
Operational Risk Management
|
|||||
|
144
|
Legal Risk Management & Compliance Risk Management
|
|||||
|
145
|
Fiduciary Risk Management
|
|||||
|
145
|
Reputation Risk Management
|
|||||
|
146
|
Capital Management
|
|||||
|
156
|
Liquidity Risk Management
|
|||||
|
161
|
Critical Accounting Estimates Used by the Firm
|
|||||
|
166
|
Accounting and Reporting Developments
|
|||||
|
168
|
Nonexchange-Traded Commodity Derivative Contracts at Fair Value
|
|||||
|
169
|
Forward-Looking Statements
|
|||||
|
JPMorgan Chase & Co./2014 Annual Report
|
61
|
|
Financial
FIVE-YEAR SUMMARY OF CONSOLIDATED FINANCIAL HIGHLIGHTS
|
(unaudited)
As of or for the year ended December 31,
|
||||||||||||||||
|
(in millions, except per share, ratio, headcount data and where otherwise noted)
|
2014
|
2013
|
2012
|
2011
|
2010
|
|||||||||||
|
Selected income statement data
|
||||||||||||||||
|
Total net revenue
|
$
|
94,205
|
|
$
|
96,606
|
|
$
|
97,031
|
|
$
|
97,234
|
|
$
|
102,694
|
|
|
|
Total noninterest expense
|
61,274
|
|
70,467
|
|
64,729
|
|
62,911
|
|
61,196
|
|
||||||
|
Pre-provision profit
|
32,931
|
|
26,139
|
|
32,302
|
|
34,323
|
|
41,498
|
|
||||||
|
Provision for credit losses
|
3,139
|
|
225
|
|
3,385
|
|
7,574
|
|
16,639
|
|
||||||
|
Income before income tax expense
|
29,792
|
|
25,914
|
|
28,917
|
|
26,749
|
|
24,859
|
|
||||||
|
Income tax expense
|
8,030
|
|
7,991
|
|
7,633
|
|
7,773
|
|
7,489
|
|
||||||
|
Net income
|
$
|
21,762
|
|
$
|
17,923
|
|
$
|
21,284
|
|
$
|
18,976
|
|
$
|
17,370
|
|
|
|
Earnings per share data
|
||||||||||||||||
|
Net income: Basic
|
$
|
5.34
|
|
$
|
4.39
|
|
$
|
5.22
|
|
$
|
4.50
|
|
$
|
3.98
|
|
|
|
Diluted
|
5.29
|
|
4.35
|
|
5.20
|
|
4.48
|
|
3.96
|
|
||||||
|
Average shares: Basic
|
3,763.5
|
|
3,782.4
|
|
3,809.4
|
|
3,900.4
|
|
3,956.3
|
|
||||||
|
Diluted
|
3,797.5
|
|
3,814.9
|
|
3,822.2
|
|
3,920.3
|
|
3,976.9
|
|
||||||
|
Market and per common share data
|
||||||||||||||||
|
Market capitalization
|
$
|
232,472
|
|
$
|
219,657
|
|
$
|
167,260
|
|
$
|
125,442
|
|
$
|
165,875
|
|
|
|
Common shares at period-end
|
3,714.8
|
|
3,756.1
|
|
3,804.0
|
|
3,772.7
|
|
3,910.3
|
|
||||||
|
Share price
(a)
|
||||||||||||||||
|
High
|
$
|
63.49
|
|
$
|
58.55
|
|
$
|
46.49
|
|
$
|
48.36
|
|
$
|
48.20
|
|
|
|
Low
|
52.97
|
|
44.20
|
|
30.83
|
|
27.85
|
|
35.16
|
|
||||||
|
Close
|
62.58
|
|
58.48
|
|
43.97
|
|
33.25
|
|
42.42
|
|
||||||
|
Book value per share
|
57.07
|
|
53.25
|
|
51.27
|
|
46.59
|
|
43.04
|
|
||||||
|
Tangible book value per share (“TBVPS”)
(b)
|
44.69
|
|
40.81
|
|
38.75
|
|
33.69
|
|
30.18
|
|
||||||
|
Cash dividends declared per share
|
1.58
|
|
1.44
|
|
1.20
|
|
1.00
|
|
0.20
|
|
||||||
|
Selected ratios and metrics
|
||||||||||||||||
|
Return on common equity (“ROE”)
|
10
|
%
|
9
|
%
|
11
|
%
|
11
|
%
|
10
|
%
|
||||||
|
Return on tangible common equity (“ROTCE”)
(b)
|
13
|
|
11
|
|
15
|
|
15
|
|
15
|
|
||||||
|
Return on assets (“ROA”)
|
0.89
|
|
0.75
|
|
0.94
|
|
0.86
|
|
0.85
|
|
||||||
|
Overhead ratio
|
65
|
|
73
|
|
67
|
|
65
|
|
60
|
|
||||||
|
Loans-to-deposits ratio
|
56
|
|
57
|
|
61
|
|
64
|
|
74
|
|
||||||
|
High quality liquid assets (“HQLA“) (in billions)
(c)
|
$
|
600
|
|
$
|
522
|
|
$
|
341
|
|
NA
|
|
NA
|
|
|||
|
Common equity tier 1 (“CET1”) capital ratio
(d)
|
10.2
|
%
|
10.7
|
%
|
11.0
|
%
|
10.1
|
%
|
9.8
|
%
|
||||||
|
Tier 1 capital ratio
(d)
|
11.6
|
|
11.9
|
|
12.6
|
|
12.3
|
|
12.1
|
|
||||||
|
Total capital ratio
(d)
|
13.1
|
|
14.4
|
|
15.3
|
|
15.4
|
|
15.5
|
|
||||||
|
Tier 1 leverage ratio
(d)
|
7.6
|
|
7.1
|
|
7.1
|
|
6.8
|
|
7.0
|
|
||||||
|
Selected balance sheet data (period-end)
|
||||||||||||||||
|
Trading assets
|
$
|
398,988
|
|
$
|
374,664
|
|
$
|
450,028
|
|
$
|
443,963
|
|
$
|
489,892
|
|
|
|
Securities
(e)
|
348,004
|
|
354,003
|
|
371,152
|
|
364,793
|
|
316,336
|
|
||||||
|
Loans
|
757,336
|
|
738,418
|
|
733,796
|
|
723,720
|
|
692,927
|
|
||||||
|
Total assets
|
2,573,126
|
|
2,415,689
|
|
2,359,141
|
|
2,265,792
|
|
2,117,605
|
|
||||||
|
Deposits
|
1,363,427
|
|
1,287,765
|
|
1,193,593
|
|
1,127,806
|
|
930,369
|
|
||||||
|
Long-term debt
(f)
|
276,836
|
|
267,889
|
|
249,024
|
|
256,775
|
|
270,653
|
|
||||||
|
Common stockholders’ equity
|
212,002
|
|
200,020
|
|
195,011
|
|
175,773
|
|
168,306
|
|
||||||
|
Total stockholders’ equity
|
232,065
|
|
211,178
|
|
204,069
|
|
183,573
|
|
176,106
|
|
||||||
|
Headcount
|
241,359
|
|
251,196
|
|
258,753
|
|
259,940
|
|
239,515
|
|
||||||
|
Credit quality metrics
|
||||||||||||||||
|
Allowance for credit losses
|
$
|
14,807
|
|
$
|
16,969
|
|
$
|
22,604
|
|
$
|
28,282
|
|
$
|
32,983
|
|
|
|
Allowance for loan losses to total retained loans
|
1.90
|
%
|
2.25
|
%
|
3.02
|
%
|
3.84
|
%
|
4.71
|
%
|
||||||
|
Allowance for loan losses to retained loans excluding purchased credit-impaired loans
(g)
|
1.55
|
|
1.80
|
|
2.43
|
|
3.35
|
|
4.46
|
|
||||||
|
Nonperforming assets
|
$
|
7,967
|
|
$
|
9,706
|
|
$
|
11,906
|
|
$
|
11,315
|
|
$
|
16,682
|
|
|
|
Net charge-offs
|
4,759
|
|
5,802
|
|
9,063
|
|
12,237
|
|
23,673
|
|
||||||
|
Net charge-off rate
|
0.65
|
%
|
0.81
|
%
|
1.26
|
%
|
1.78
|
%
|
3.39
|
%
|
||||||
|
(a)
|
Share prices shown for JPMorgan Chase’s common stock are from the New York Stock Exchange. JPMorgan Chase’s common stock is also listed and traded on the London Stock Exchange and the Tokyo Stock Exchange.
|
|
(b)
|
TBVPS and ROTCE are non-GAAP financial measures. TBVPS represents the Firm’s tangible common equity divided by common shares at period-end. ROTCE measures the Firm’s annualized earnings as a percentage of tangible common equity. For further discussion of these measures, see Explanation and Reconciliation of the Firm’s Use of Non-GAAP Financial Measures on
pages 77–78
.
|
|
(c)
|
HQLA represents the Firm’s estimate of the amount of assets that qualify for inclusion in the liquidity coverage ratio under the final U.S. rule (“U.S. LCR”) as of December 31, 2014, and under the Basel III liquidity coverage ratio (“Basel III LCR”) for prior periods. The Firm did not begin estimating HQLA until December 31, 2012. For additional information, see HQLA on
page 157
.
|
|
(d)
|
Basel III Transitional rules became effective on January 1, 2014; prior period data is based on Basel I rules. As of December 31, 2014 the ratios presented are calculated under the Basel III Advanced Transitional Approach. CET1 capital under Basel III replaced Tier 1 common capital under Basel I. Prior to Basel III becoming effective on January 1, 2014, Tier 1 common capital under Basel I was a non-GAAP financial measure. See Regulatory capital on
pages 146–153
for additional information on Basel III and non-GAAP financial measures of regulatory capital.
|
|
(e)
|
Included held-to-maturity securities of
$49.3 billion
and
$24.0 billion
at December 31, 2014 and 2013, respectively. Held-to-maturity balances for the other periods were not material.
|
|
(f)
|
Included unsecured long-term debt of $207.5 billion, $199.4 billion, $200.6 billion, $231.3 billion and $238.2 billion respectively, as of December 31, of each year presented.
|
|
(g)
|
Excludes the impact of residential real estate purchased credit-impaired (“PCI”) loans. For further discussion, see Allowance for credit losses on
pages 128–130
.
|
|
62
|
JPMorgan Chase & Co./2014 Annual Report
|
|
FIVE-YEAR STOCK PERFORMANCE
The following table and graph compare the five-year cumulative total return for JPMorgan Chase & Co. (“JPMorgan Chase” or the “Firm”) common stock with the cumulative return of the S&P 500 Index, the KBW Bank Index and the S&P Financial Index. The S&P 500 Index is a commonly referenced U.S. equity benchmark consisting of leading companies from different economic sectors. The KBW Bank Index seeks to reflect the performance of banks and thrifts that are publicly traded in the U.S. and is composed of
24
leading national money center and regional banks and thrifts. The S&P Financial Index is an index of
85
financial companies, all of which are components of the S&P 500. The Firm is a component of all three industry indices.
The following table and graph assume simultaneous investments of
$100
on
December 31, 2009
, in JPMorgan Chase common stock and in each of the above indices. The comparison assumes that all dividends are reinvested.
|
December 31,
(in dollars)
|
2009
|
2010
|
2011
|
2012
|
2013
|
2014
|
|||||||||||||||||
|
JPMorgan Chase
|
$
|
100.00
|
|
$
|
102.30
|
|
$
|
81.87
|
|
$
|
111.49
|
|
$
|
152.42
|
|
$
|
167.48
|
|
|||||
|
KBW Bank Index
|
100.00
|
|
123.36
|
|
94.75
|
|
125.91
|
|
173.45
|
|
189.69
|
|
|||||||||||
|
S&P Financial Index
|
100.00
|
|
112.13
|
|
93.00
|
|
119.73
|
|
162.34
|
|
186.98
|
|
|||||||||||
|
S&P 500 Index
|
100.00
|
|
115.06
|
|
117.48
|
|
136.27
|
|
180.39
|
|
205.07
|
|
|||||||||||
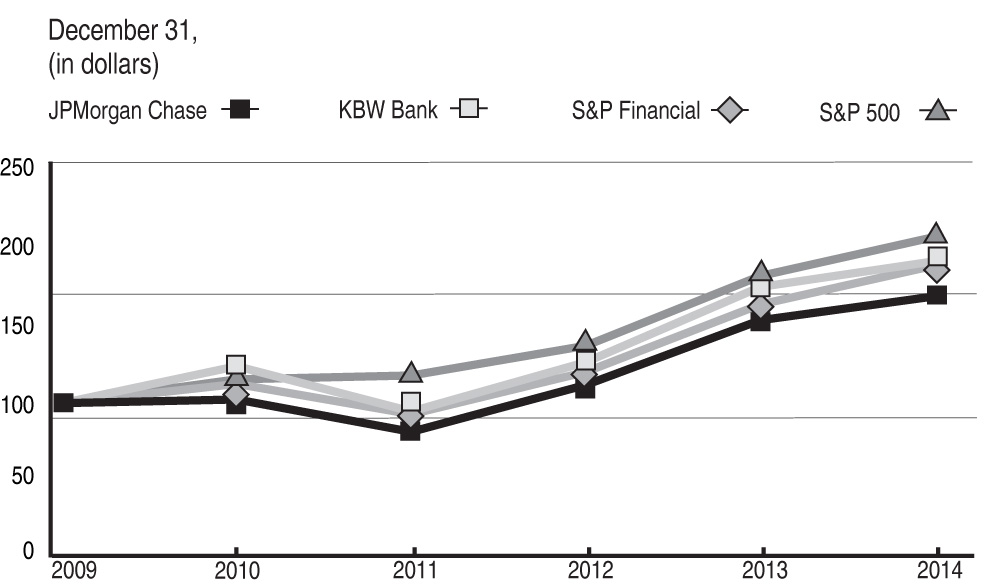
|
JPMorgan Chase & Co./2014 Annual Report
|
63
|
|
Management’s discussion and analysis
This section of JPMorgan Chase’s Annual Report for the year ended
December 31, 2014
(“Annual Report”), provides Management’s discussion and analysis (“MD&A”) of the financial condition and results of operations of
JPMorgan Chase
. See the Glossary of Terms on
pages 309–313
for definitions of terms used throughout this Annual Report. The MD&A included in this Annual Report contains statements that are forward-looking within the meaning of the Private Securities Litigation Reform Act of 1995. Such statements are based on the current beliefs and expectations of JPMorgan Chase’s management and are subject to significant risks and uncertainties. These risks and uncertainties could cause the Firm’s actual results to differ materially from those set forth in such forward-looking statements. Certain of such risks and uncertainties are described herein (see Forward-looking Statements on
page 169
) and in JPMorgan Chase’s Annual Report on Form 10-K for the year ended
December 31, 2014
(“
2014
Form 10-K”), in Part I, Item 1A: Risk factors; reference is hereby made to both.
|
INTRODUCTION
|
||||
JPMorgan Chase & Co.,
a financial holding company incorporated under Delaware law in 1968, is a leading global financial services firm and one of the largest banking institutions in the
U.S.
, with operations worldwide; the Firm had
$2.6 trillion
in assets and
$232.1 billion
in stockholders’ equity as of
December 31, 2014
.
The Firm is a leader in investment banking, financial services for consumers and small businesses, commercial banking, financial transaction processing and asset management. Under the J.P. Morgan and Chase brands, the Firm serves millions of customers in the U.S. and many of the world’s most prominent corporate, institutional and government clients.
JPMorgan Chase’s principal bank subsidiaries are JPMorgan Chase Bank, National Association (“JPMorgan Chase Bank, N.A.”), a national banking association with U.S. branches in
23
states, and Chase Bank USA, National Association (“Chase Bank USA, N.A.”), a national banking association that is the Firm’s credit card–issuing bank. JPMorgan Chase’s principal nonbank subsidiary is J.P. Morgan Securities LLC (“JPMorgan Securities”), the Firm’s U.S. investment banking firm. The bank and nonbank subsidiaries of JPMorgan Chase operate nationally as well as through overseas branches and subsidiaries, representative offices and subsidiary foreign banks. One of the Firm’s principal operating subsidiaries in the
U.K.
is J.P. Morgan Securities plc, a subsidiary of JPMorgan Chase Bank, N.A.
JPMorgan Chase’s activities are organized, for management reporting purposes, into
four
major reportable business segments, as well as a Corporate segment. The Firm’s consumer business is the Consumer & Community Banking (“CCB”) segment. The Corporate & Investment Bank (“CIB”), Commercial Banking (“CB”), and Asset Management (“AM”) segments comprise the Firm’s wholesale businesses. For a description of the Firm’s business segments, and the products and services they provide to their respective client bases refer to Business Segment Results on
pages 79–104
, and Note 33.
|
64
|
JPMorgan Chase & Co./2014 Annual Report
|
|
|
EXECUTIVE OVERVIEW
|
||||
This executive overview of the MD&A highlights selected information and may not contain all of the information that is important to readers of this Annual Report. For a complete description of events, trends and uncertainties, as well as the enterprise risks and critical accounting estimates affecting the Firm and its various lines of business, this Annual Report should be read in its entirety.
|
Financial performance of JPMorgan Chase
|
||||||||||
|
Year ended December 31,
|
||||||||||
|
(in millions, except per share data and ratios)
|
2014
|
2013
|
Change
|
|||||||
|
Selected income statement data
|
||||||||||
|
Total net revenue
|
$
|
94,205
|
|
$
|
96,606
|
|
(2
|
)%
|
||
|
Total noninterest expense
|
61,274
|
|
70,467
|
|
(13
|
)
|
||||
|
Pre-provision profit
|
32,931
|
|
26,139
|
|
26
|
|
||||
|
Provision for credit losses
|
3,139
|
|
225
|
|
NM
|
|||||
|
Net income
|
21,762
|
|
17,923
|
|
21
|
|
||||
|
Diluted earnings per share
|
5.29
|
|
4.35
|
|
22
|
|
||||
|
Return on common equity
|
10
|
%
|
9
|
%
|
||||||
|
Capital ratios
(a)
|
||||||||||
|
CET1
|
10.2
|
|
10.7
|
|
||||||
|
Tier 1 capital
|
11.6
|
|
11.9
|
|
||||||
|
(a)
|
Basel III Transitional rules became effective on January 1, 2014; December 31, 2013 data is based on Basel I rules. As of December 31, 2014 the ratios presented are calculated under the Basel III Advanced Transitional Approach. CET1 capital under Basel III replaced Tier 1 common capital under Basel I. Prior to Basel III becoming effective on January 1, 2014, Tier 1 common capital under Basel I was a non-GAAP financial measure. See Regulatory capital on
pages 146–153
for additional information on Basel III and non-GAAP financial measures of regulatory capital.
|
Summary of 2014 Results
JPMorgan Chase reported record full-year 2014 net income of $21.8 billion, and record earnings per share of $5.29, on net revenue of $94.2 billion. Net income increased by $3.8 billion, or 21%, compared with net income of $17.9 billion, or $4.35 per share, in 2013. ROE for the year was 10%, compared with 9% for the prior year.
The increase in net income in 2014 was driven by lower noninterest expense, largely offset by higher provision for credit losses and lower net revenue. The decrease in noninterest expense was driven by lower legal expense as well as lower compensation expense.
The provision for credit losses increased from the prior year as result of a lower level of benefit from reductions in the consumer allowance for loan losses, partially offset by lower net charge-offs. The decrease in the consumer allowance for loan losses was predominantly the result of continued improvement in home prices and delinquencies in the residential real estate portfolio. The wholesale provision reflected a continued favorable credit environment.
Total firmwide allowance for credit losses was
$14.8 billion
resulting in a loan loss coverage ratio of 1.55%, excluding the purchase credit-impaired (“PCI”) portfolio, compared with 1.80% in the prior year. The Firm’s allowance for loan losses to nonperforming loans retained, excluding the PCI
portfolio and credit card, was 106% compared with 100% in 2013.
Firmwide, net charge-offs were $4.8 billion for the year, down $1.0 billion, or 18% from 2013. Nonperforming assets at year-end were $8.0 billion, down $1.7 billion, or 18%.
The Firm’s results reflected solid underlying performance across its four major reportable business segments, with continued strong lending and deposit growth. Consumer & Community Banking was #1 in deposit growth for the third consecutive year and Consumer & Business Banking within Consumer & Community Banking was #1 in customer satisfaction among the largest U.S. banks for the third consecutive year as measured by The American Customer Satisfaction Index (“ACSI”). Credit card sales volume (excluding Commercial Card) was up 11% for the year. The Corporate & Investment Bank maintained its #1 ranking in Global Investment Banking Fees and moved up to a #1 ranking in Europe, Middle East and Africa (“EMEA”), according to Dealogic. Commercial Banking loans increased to $149 billion, an 8% increase compared with the prior year. Commercial Banking also had record gross investment banking revenue of $2.0 billion, up 18% compared with the prior year. Asset Management achieved twenty-three consecutive quarters of positive net long-term client flows and increased average loan balances by 16% in 2014.
The Firm maintained its fortress balance sheet, ending the year with an estimated Basel III Advanced Fully Phased-in CET1 capital ratio of 10.2%, compared with 9.5% in the prior year. Total deposits increased to $1.4 trillion, up 6% from the prior year. Total stockholders’ equity was $232 billion at December 31, 2014. (The Basel III Advanced Fully Phased-in CET1 capital ratio is a non-GAAP financial measure, which the Firm uses along with the other capital measures, to assess and monitor its capital position. For further discussion of the Firm’s capital ratios, see Regulatory capital on
pages 146–153
.)
During 2014, the Firm continued to serve customers, corporate clients and the communities in which it does business. The Firm provided credit to and raised capital of $2.1 trillion for its clients during 2014; this included $19 billion lent to U.S. small businesses and $75 billion to nonprofit and government entities, including states, municipalities, hospitals and universities.
The discussion that follows highlights the performance of each business segment compared with the prior year and presents results on a managed basis. For more information about managed basis, as well as other non-GAAP financial measures used by management to evaluate the performance of each line of business, see
pages 77–78
.
Consumer & Community Banking
net income was $9.2 billion, a decrease of 17% compared with the prior year, due to higher provision for credit losses and lower net revenue, partially offset by lower noninterest expense. Net interest income decreased, driven by spread compression and lower mortgage warehouse balances, largely offset by higher deposit balances in Consumer & Business Banking
|
JPMorgan Chase & Co./2014 Annual Report
|
65
|
|
Management’s discussion and analysis
and higher loan balances in Credit Card. Noninterest revenue decreased, driven by lower mortgage fees and related income. The provision for credit losses was $3.5 billion, compared with $335 million in the prior year. The current-year provision reflected a $1.3 billion reduction in the allowance for loan losses and total net charge-offs of $4.8 billion. Noninterest expense decreased from the prior year, driven by lower Mortgage Banking expense.
Corporate & Investment Bank
net income was $6.9 billion, a decrease of 22% compared with the prior year, primarily reflecting lower revenue as well as higher noninterest expense. Banking revenues decreased from the prior year primarily due to lower Lending revenues, driven by mark to market losses on securities received from restructured loans, compared to gains in the prior year, partially offset by higher investment banking fees. Markets & Investor Services revenues increased slightly from the prior year as 2013 included losses from FVA/DVA, primarily driven by FVA implementation, while the current year reflected lower Fixed Income Markets revenue. Credit Adjustments & Other revenue was a loss of $272 million. Noninterest expense increased compared with the prior year driven by higher noncompensation expense, predominantly due to higher legal expense and investment in controls. This was partially offset by lower performance-based compensation expense.
Commercial Banking
net income was $2.6 billion, flat compared with the prior year, reflecting lower net revenue and higher noninterest expense, predominantly offset by a lower provision for credit losses. Net interest income decreased from the prior year, reflecting yield compression, the absence of proceeds received in the prior year from a lending-related workout, and lower purchase discounts recognized on loan repayments, partially offset by higher loan balances. Noninterest revenue increased, reflecting higher investment banking revenue, largely offset by business simplification and lower lending fees. Noninterest expense increased from the prior year, largely reflecting higher investments in controls.
Asset Management
net income was $2.2 billion, an increase of 3% from the prior year, reflecting higher net revenue and lower provision for credit losses, predominantly offset by higher noninterest expense. Noninterest revenue increased from the prior year, due to net client inflows and the effect of higher market levels, partially offset by lower valuations of seed capital investments. Noninterest expense increased from the prior year, as the business continues to invest in both infrastructure and controls.
Corporate
net income was $864 million, an increase compared with a loss in the prior year. The current year included $821 million of legal expense, compared with $10.2 billion of legal expense, which included reserves for litigation and regulatory proceedings, in the prior year.
Business outlook
The following forward-looking statements are based on the current beliefs and expectations of JPMorgan Chase’s management and are subject to significant risks and uncertainties. These risks and uncertainties could cause the Firm’s actual results to differ materially from those set forth in such forward-looking statements. See Forward-Looking Statements on
page 169
and the Risk Factors section on
pages 8–17
.
Over the past few years, the Firm has been adapting to the regulatory environment while continuing to serve its clients and customers, invest in its businesses, and deliver strong returns to its shareholders. The Firm’s initiatives include building a fortress control environment, de-risking and simplification of the organization, a disciplined approach to managing expense, evolving its capital assessment framework as well as rigorous optimization of the Firm’s balance sheet and funding.
The Firm has been devoting substantial resources to execute on its control agenda. The Oversight and Control function, established in 2012, has been working closely and extensively with the Firm’s other control disciplines, including Compliance, Risk Management, Legal, Internal Audit, and other functions, to address the Firm's control-related projects that are cross-line of business and that have significant regulatory impact or respond to regulatory actions. The Firm’s investment in the control agenda and investment in technology, are considered by management to be essential to the Firm’s future.
The Firm has substantially completed executing its business simplification agenda. In 2013, the Firm ceased originating student loans, exited certain high risk customers and became more selective about on-boarding certain customers. Following on these initiatives, in 2014, the Firm exited several non-core credit card co-branded relationships, sold the Retirement Plan Services business within AM, exited certain prepaid card businesses, reduced its offering of mortgage banking products, completed the sale of the CIB’s Global Special Opportunity Group investment portfolio, and the sale and liquidation of a significant part of CIB’s physical commodities business. In January 2015, the Firm completed the “spin out” of the One Equity Partners (“OEP”) private equity business (together with a sale of a portion of the OEP portfolio to a group of private equity firms). These actions will allow the Firm to focus on core activities for its core clients and reduce risk to the Firm. While it is anticipated that these exits will reduce revenues and expenses, they are not expected to have a meaningful impact on the Firm’s profitability.
The Firm’s simplification agenda, however, is more extensive than exiting businesses, products or clients that were non-core, not at scale or not returning the appropriate level of return. The Firm is also focused on operational and structural simplicity, and streamlining and centralizing certain operational functions and processes in order to attain more consistencies and efficiencies across the Firm. To that end, the Firm is working on simplifying its legal entity structure, simplifying its Global Technology function,
|
66
|
JPMorgan Chase & Co./2014 Annual Report
|
|
rationalizing its use of vendors, and optimizing its real estate location strategy.
As the Firm continues to experience an unprecedented increase in regulation and supervision, it continues to evolve its financial architecture to respond to this changing landscape. In 2014, the Firm exceeded the minimum capital levels required by the current rules and intends to continue to build capital in response to the higher Global Systemically Important Bank (“G-SIB”) capital surcharge proposed by U.S. banking regulators. In addition, the Firm is adapting its capital assessment framework to review businesses and client relationships against G-SIB and applicable capital requirements, and imposing internal limits on business activities to align or optimize the Firm's balance sheet and RWA with regulatory requirements in order to ensure that business activities generate appropriate levels of shareholder value.
The Firm intends to balance return of capital to shareholders with achieving higher capital ratios over time. The Firm expects the capital ratio calculated under the Basel III Standardized Approach to become its binding constraint by the end of 2015, or slightly thereafter. The Firm anticipates reaching Basel III Fully Phased-In Advanced and Standardized CET1 ratios of approximately 11% by the end of 2015 and is targeting a Basel III CET1 ratio of approximately 12% by the end of 2018, assuming a 4.5% G-SIB capital surcharge. If the Firm's G-SIB capital surcharge is lower than 4.5%, the Firm will adjust its Basel III CET1 target accordingly.
Likewise, the Firm will be evolving its funding framework to ensure it meets the current and proposed more stringent regulatory liquidity rules, including those relating to the availability of adequate Total Loss Absorbing Capacity (“TLAC”) at G-SIB organizations. The Firm estimated that it had, as of December 31, 2014, approximately 15% minimum TLAC as a percentage of Basel III Advanced Fully Phased-in RWA, excluding capital buffers currently in effect, based on its understanding of how the Financial Stability Board's proposal may be implemented in the U.S. While the precise composition and calibration of TLAC, as well as the conformance period, are yet to be defined by U.S. banking regulators, the Firm expects the requirement will lead to incremental debt issuance by the Firm and higher funding costs over the next few years.
The Firm expects it will continue to make appropriate adjustments to its businesses and operations in the year ahead in response to ongoing developments in the legal and regulatory, as well as business and economic, environment in which it operates. The Firm intends to take a disciplined approach to growing revenues and controlling expenses in light of its capital and liquidity constraints. The Firm’s deep client relationships and its investments in its businesses, including branch optimization, new card relationships, expansion into new markets, and hiring additional sales staff and client advisors, are expected to generate significant revenue growth over the next several years. At the same time, the Firm intends to leverage its scale and improve its operating efficiencies so that it can fund these growth initiatives, as well as maintain its control and
technology programs, without increasing its expenses. As a result, the Firm anticipates achieving a managed overhead ratio of
approximately 55% over the next several years, including the impact of revenue growth.
2015 Business Outlook
JPMorgan Chase’s outlook for the full-year 2015 should be viewed against the backdrop of the global and U.S. economies, financial markets activity, the geopolitical environment, the competitive environment, client activity levels, and regulatory and legislative developments in the U.S. and other countries where the Firm does business. Each of these inter-related factors will affect the performance of the Firm and its lines of business.
Management expects core loan growth of approximately 10% in 2015. The Firm continues to experience charge-offs at levels lower than its through-the-cycle expectations; if favorable credit trends continue, management expects the Firm’s total net charge offs could remain low, at an amount modestly over $4 billion in 2015, and expects a reduction in the consumer allowance for loan losses over the next two years.
Firmwide adjusted expense in 2015 is expected to be approximately $57 billion, excluding Firmwide legal expenses and foreclosure-related matters.
In Consumer & Business Banking within CCB, management expects continued spread compression in the deposit margin and a modest decline in net interest income in the first quarter of 2015. In Mortgage Banking within CCB, management expects quarterly servicing expense to decline to below $500 million by the second quarter of 2015 as default volume continues to decline. In Card Services within CCB, management expects the revenue rate in 2015 to remain at the low end of the target range of 12% to 12.5%.
In CIB, Markets revenue in the first quarter of 2015 will be impacted by the Firm’s business simplification initiatives completed in 2014, resulting in a decline of approximately $500 million, or 10%, in Markets revenue and a decline of approximately $300 million in expense, compared to the prior year first quarter. Based on strong performance to date, particularly in January, management currently expects 2015 first quarter Markets revenue to be higher than the prior year first quarter, even with the negative impact of business simplification; however, Markets revenue actual results will depend on performance through the remainder of the quarter, which can be volatile.
Overall, the Firm expects the impact from its business simplification initiatives will be a reduction of approximately $1.6 billion in revenue and a corresponding reduction of approximately $1.6 billion in expense resulting in no meaningful impact on the Firm’s 2015 anticipated net income.
|
JPMorgan Chase & Co./2014 Annual Report
|
67
|
|
Management’s discussion and analysis
|
CONSOLIDATED RESULTS OF OPERATIONS
|
||||
The following section provides a comparative discussion of JPMorgan Chase’s Consolidated Results of Operations on a reported basis for the three-year period ended
December 31, 2014
. Factors that relate primarily to a single business segment are discussed in more detail within that business segment. For a discussion of the Critical Accounting Estimates Used by the Firm that affect the Consolidated Results of Operations, see
pages 161–165
.
|
Revenue
|
|||||||||||
|
Year ended December 31,
|
|||||||||||
|
(in millions)
|
2014
|
|
2013
|
|
2012
|
|
|||||
|
Investment banking fees
|
$
|
6,542
|
|
$
|
6,354
|
|
$
|
5,808
|
|
||
|
Principal transactions
(a)
|
10,531
|
|
10,141
|
|
5,536
|
|
|||||
|
Lending- and deposit-related fees
|
5,801
|
|
5,945
|
|
6,196
|
|
|||||
|
Asset management, administration and commissions
|
15,931
|
|
15,106
|
|
13,868
|
|
|||||
|
Securities gains
|
77
|
|
667
|
|
2,110
|
|
|||||
|
Mortgage fees and related income
|
3,563
|
|
5,205
|
|
8,687
|
|
|||||
|
Card income
|
6,020
|
|
6,022
|
|
5,658
|
|
|||||
|
Other income
(b)
|
2,106
|
|
3,847
|
|
4,258
|
|
|||||
|
Noninterest revenue
|
50,571
|
|
53,287
|
|
52,121
|
|
|||||
|
Net interest income
|
43,634
|
|
43,319
|
|
44,910
|
|
|||||
|
Total net revenue
|
$
|
94,205
|
|
$
|
96,606
|
|
$
|
97,031
|
|
||
|
(a)
|
Included funding valuation adjustments ((“FVA”) effective 2013)) and debit valuation adjustments (“DVA”) on over-the-counter (“OTC”) derivatives and structured notes, measured at fair value. FVA and DVA gains/(losses) were $468 million and $(1.9) billion for the years ended
December 31, 2014
and 2013, respectively. DVA losses were ($930) million for the year ended December 31, 2012.
|
|
(b)
|
Included operating lease income of
$1.7 billion
,
$1.5 billion
and
$1.3 billion
for the years ended
December 31, 2014
,
2013
and
2012
, respectively.
|
2014 compared with 2013
Total net revenue for 2014 was down by $2.4 billion, or 2%, compared with the prior year, predominantly due to lower mortgage fees and related income, and lower other income. The decrease was partially offset by higher asset management, administration and commissions revenue.
Investment banking fees increased compared with the prior year, due to higher advisory and equity underwriting fees, largely offset by lower debt underwriting fees. The increase in advisory fees was driven by the combined impact of a greater share of fees for completed transactions, and growth in industry-wide fee levels. The increase in equity underwriting fees was driven by higher industry-wide issuance. The decrease in debt underwriting fees was primarily related to lower bond underwriting compared with a stronger prior year, and lower loan syndication fees on lower industry-wide fee levels. Investment banking fee share and industry-wide data are sourced from Dealogic, an external vendor. For additional information on investment
banking fees, see CIB segment results on
pages 92–96
, CB segment results on
pages 97–99
, and Note 7.
Principal transactions revenue, which consists of revenue primarily from the Firm’s client-driven market-making and private equity investing activities, increased compared with the prior year as the prior year included a $1.5 billion loss related to the implementation of the FVA framework for OTC derivatives and structured notes. The increase was also due to higher private equity gains as a result of higher net gains on sales. The increase was partially offset by lower fixed income markets revenue in CIB, primarily driven by credit-related and rates products, as well as the impact of business simplification initiatives. For additional information on principal transactions revenue, see CIB and Corporate
segment results on
pages 92–96
and
pages 103–104
, respectively, and Note 7.
Lending- and deposit-related fees decreased compared with the prior year, reflecting the impact of business simplification initiatives and lower trade finance revenue in CIB. For additional information on lending- and deposit-related fees, see the segment results for CCB on
pages 81–91
, CIB on
pages 92–96
and CB on
pages 97–99
.
Asset management, administration and commissions revenue increased compared with the prior year, reflecting higher asset management fees driven by net client inflows and the effect of higher market levels in AM and CCB. The increase was offset partially by lower commissions and other fee revenue in CCB as a result of the exit of a non-core product in the second half of 2013. For additional information on these fees and commissions, see the segment discussions of CCB on
pages 81–91
, AM on
pages 100–102
, and Note 7.
Securities gains decreased compared with the prior year, reflecting lower repositioning activity related to the Firm’s investment securities portfolio. For additional information, see the Corporate segment discussion on
pages 103–104
and Note 12.
Mortgage fees and related income decreased compared with the prior year. The decrease was predominantly due to lower net production revenue driven by lower volumes due to higher levels of mortgage interest rates, and tighter margins. The decline in net production revenue was partially offset by a lower loss on the risk management of mortgage servicing rights (“MSRs”). For additional information, see the segment discussion of CCB on
pages 85–87
and Note 17.
Card income remained relatively flat but included higher net interchange income on credit and debit cards due to growth in sales volume, offset by higher amortization of new account origination costs. For additional information on credit card income, see CCB segment results on
pages 81–91
.
|
68
|
JPMorgan Chase & Co./2014 Annual Report
|
|
Other income decreased from the prior year, predominantly as a result of the absence of two significant items recorded in Corporate in 2013, namely: a $1.3 billion gain on the sale of Visa shares and a $493 million gain from the sale of One Chase Manhattan Plaza. Lower valuations of seed capital investments in AM and losses related to the exit of non-core portfolios in Card also contributed to the decrease. These items were partially offset by higher auto lease income as a result of growth in auto lease volume, and a benefit from a tax settlement.
Net interest income increased slightly from the prior year, predominantly reflecting higher yields on investment securities, the impact of lower interest expense, and higher average loan balances. The increase was partially offset by lower yields on loans due to the run-off of higher-yielding loans and new originations of lower-yielding loans, and lower average interest-earning trading asset balances. The Firm’s average interest-earning assets were
$2.0 trillion
, and the net interest yield on these assets, on a fully taxable-equivalent (“FTE”) basis, was
2.18%
, a decrease of 5 basis points from the prior year.
2013 compared with 2012
Total net revenue for 2013 was down by $425 million, or less than 1%. The 2013 results were driven by lower mortgage fees and related income, net interest income, and securities gains, predominantly offset by higher principal transactions revenue, and asset management, administration and commissions revenue.
Investment banking fees increased compared with the prior year, reflecting higher equity and debt underwriting fees, partially offset by lower advisory fees. Equity and debt underwriting fees increased, driven by strong market issuance and greater share of fees in equity capital markets and loans. Advisory fees decreased, as industry-wide M&A fee levels declined. Investment banking fee share and industry-wide data are sourced from Dealogic, an external vendor.
Principal transactions revenue increased compared with the prior year, reflecting CIB’s strong equity markets revenue, partially offset by a $1.5 billion loss from implementing a FVA framework for OTC derivatives and structured notes in the fourth quarter of 2013, and a $452 million loss from DVA on structured notes and derivative liabilities (compared with a $930 million loss from DVA in the prior year). The prior year also included a $5.8 billion loss on the synthetic credit portfolio incurred by CIO in the six months ended June 30, 2012; a $449 million loss on the index credit derivative positions retained by CIO in the three months ended September 30, 2012; and additional modest losses incurred by CIB from the synthetic credit portfolio in the last six months of 2012. These losses were partially offset by a $665 million gain recognized in 2012 in Corporate, representing the recovery on a Bear Stearns-related subordinated loan.
Lending- and deposit-related fees decreased compared with the prior year, largely due to lower deposit-related fees in CCB, resulting from reductions in certain product and transaction fees.
Asset management, administration and commissions revenue increased from 2012, driven by higher investment management fees in AM due to net client inflows, the effect of higher market levels, and higher performance fees, and to higher investment sales revenue in CCB.
Securities gains decreased compared with the prior-year period, reflecting the results of repositioning the CIO available-for-sale (“AFS”) portfolio.
Mortgage fees and related income decreased in 2013 compared with 2012, reflecting lower Mortgage Banking net production and servicing revenue. The decrease in net production revenue was due to lower margins and volumes. The decrease in net servicing revenue was predominantly due to lower MSR risk management results.
Card income increased compared with the prior year period, driven by higher net interchange income on credit and debit cards and higher merchant servicing revenue due to growth in sales volume.
Other income decreased in 2013 compared with the prior year, predominantly reflecting lower revenues from significant items recorded in Corporate. In 2013, the Firm recognized a $1.3 billion gain on the sale of Visa shares, a $493 million gain from the sale of One Chase Manhattan Plaza, and a modest loss related to the redemption of TruPS. In 2012, the Firm recognized a $1.1 billion benefit from the Washington Mutual bankruptcy settlement and an $888 million extinguishment gain related to the redemption of TruPS. The net decrease was partially offset by higher revenue in CIB, largely from client-driven activity.
Net interest income decreased in 2013 compared with the prior year, primarily reflecting the impact of the runoff of higher yielding loans and originations of lower yielding loans, and lower trading-related net interest income. The decrease in net interest income was partially offset by lower long-term debt and other funding costs. The Firm’s average interest-earning assets were $2.0 trillion in 2013, and the net interest yield on those assets, on a FTE basis, was 2.23%, a decrease of 25 basis points from the prior year.
|
JPMorgan Chase & Co./2014 Annual Report
|
69
|
|
Management’s discussion and analysis
|
Provision for credit losses
|
|||||||||||
|
Year ended December 31,
|
|||||||||||
|
(in millions)
|
2014
|
|
2013
|
|
2012
|
|
|||||
|
Consumer, excluding credit card
|
$
|
419
|
|
$
|
(1,871
|
)
|
$
|
302
|
|
||
|
Credit card
|
3,079
|
|
2,179
|
|
3,444
|
|
|||||
|
Total consumer
|
3,498
|
|
308
|
|
3,746
|
|
|||||
|
Wholesale
|
(359
|
)
|
(83
|
)
|
(361
|
)
|
|||||
|
Total provision for credit losses
|
$
|
3,139
|
|
$
|
225
|
|
$
|
3,385
|
|
||
2014 compared with 2013
The provision for credit losses increased by $2.9 billion from the prior year as result of a lower benefit from reductions in the consumer allowance for loan losses, partially offset by lower net charge-offs. The consumer allowance release in 2014 was primarily related to the consumer, excluding credit card portfolio, and reflected the continued improvement in home prices and delinquencies in the residential real estate portfolio. The wholesale provision reflected a continued favorable credit environment. For a more detailed discussion of the credit portfolio and the allowance for credit losses, see the segment discussions of CCB on
pages 81–91
, CIB on
pages 92–96
and CB on
pages 97–99
, and the Allowance for credit losses section on
pages 128–130
.
2013 compared with 2012
The provision for credit losses decreased by $3.2 billion compared with the prior year, due to a higher benefit from reductions in the allowance for loan losses, as well as lower net charge-offs partially due to incremental charge-offs recorded in 2012 in accordance with regulatory guidance on certain loans discharged under Chapter 7 bankruptcy. The consumer allowance release in 2013 reflected the improvement in home prices in the residential real estate portfolio and improvement in delinquencies in the residential real estate and credit card portfolios. The 2013 wholesale provision reflected a favorable credit environment and stable credit quality trends.
|
Noninterest expense
|
|||||||||||
|
Year ended December 31,
|
|||||||||||
|
(in millions)
|
2014
|
|
2013
|
|
2012
|
|
|||||
|
Compensation expense
|
$
|
30,160
|
|
$
|
30,810
|
|
$
|
30,585
|
|
||
|
Noncompensation expense:
|
|||||||||||
|
Occupancy
|
3,909
|
|
3,693
|
|
3,925
|
|
|||||
|
Technology, communications and equipment
|
5,804
|
|
5,425
|
|
5,224
|
|
|||||
|
Professional and outside services
|
7,705
|
|
7,641
|
|
7,429
|
|
|||||
|
Marketing
|
2,550
|
|
2,500
|
|
2,577
|
|
|||||
|
Other
(a)(b)
|
11,146
|
|
20,398
|
|
14,989
|
|
|||||
|
Total noncompensation expense
|
31,114
|
|
39,657
|
|
34,144
|
|
|||||
|
Total noninterest expense
|
$
|
61,274
|
|
$
|
70,467
|
|
$
|
64,729
|
|
||
|
(a)
|
Included firmwide legal expense of
$2.9 billion
,
$11.1 billion
and
$5.0 billion
for the years ended December 31, 2014, 2013 and 2012, respectively.
|
|
(b)
|
Included FDIC-related expense of
$1.0 billion
,
$1.5 billion
and
$1.7 billion
for the years ended December 31, 2014, 2013 and 2012, respectively.
|
2014 compared with 2013
Total noninterest expense decreased by $9.2 billion, or 13%, from the prior year, driven by lower other expense (in particular, legal expense) and lower compensation expense.
Compensation expense decreased compared with the prior year, predominantly driven by lower headcount in CCB’s Mortgage Banking business, lower performance-based compensation expense in CIB, and lower postretirement benefit costs. The decrease was partially offset by investments in the businesses, including headcount, for controls.
Noncompensation expense decreased compared with the prior year, due to lower other expense, predominantly reflecting lower legal expense. Lower expense for foreclosure-related matters and lower production and servicing-related expense in CCB’s Mortgage Banking business, lower FDIC-related assessments, and lower amortization expense due to the completion of the amortization of certain intangibles, also contributed to the decline. The decrease was offset partially by investments in the businesses, including for controls, and costs related to business simplification initiatives across the Firm. For a further discussion of legal expense, see Note 31. For a discussion of amortization of intangibles, refer to Note 17.
2013 compared with 2012
Total noninterest expense was up by $5.7 billion, or 9%, compared with the prior year, predominantly due to higher legal expense.
Compensation expense increased in 2013 compared with the prior year, due to the impact of investments across the businesses, including front office sales and support staff, and costs related to the Firm’s control agenda; these were partially offset by lower compensation expense in CIB and in CCB’s Mortgage Banking business, reflecting the effect of lower servicing headcount.
|
70
|
JPMorgan Chase & Co./2014 Annual Report
|
|
Noncompensation expense increased in 2013 from the prior year. The increase was due to higher other expense, reflecting
$11.1 billion
of firmwide legal expense, predominantly in Corporate, representing additional reserves for several litigation and regulatory proceedings, compared with
$5.0 billion
of expense in the prior year. Investments in the businesses, higher legal-related professional services expense, and costs related to the Firm’s control agenda also contributed to the increase. The increase was offset partially by lower mortgage servicing expense in CCB and lower occupancy expense for the Firm, which predominantly reflected the absence of charges recognized in 2012 related to vacating excess space.
|
Income tax expense
|
|||||||||||
|
Year ended December 31,
(in millions, except rate)
|
|||||||||||
|
2014
|
2013
|
2012
|
|||||||||
|
Income before income tax expense
|
$
|
29,792
|
|
$
|
25,914
|
|
$
|
28,917
|
|
||
|
Income tax expense
|
8,030
|
|
7,991
|
|
7,633
|
|
|||||
|
Effective tax rate
|
27.0
|
%
|
30.8
|
%
|
26.4
|
%
|
|||||
2014 compared with 2013
The decrease in the effective tax rate from the prior year was largely attributable to the effect of the lower level of nondeductible legal-related penalties, partially offset by higher 2014 pretax income, in combination with changes in the mix of income and expense subject to U.S. federal, state and local income taxes, and lower tax benefits associated with tax adjustments and the settlement of tax audits. For additional information on income taxes, see Critical Accounting Estimates Used by the Firm on
pages 161–165
and Note 26.
2013 compared with 2012
The increase in the effective tax rate compared with the prior year was predominantly due to the effect of higher nondeductible legal-related penalties in 2013. This was largely offset by the impact of lower pretax income, in combination with changes in the mix of income and expense subject to U.S. federal, state and local taxes, business tax credits, tax benefits associated with prior year tax adjustments and audit resolutions.
|
JPMorgan Chase & Co./2014 Annual Report
|
71
|
|
Management’s discussion and analysis
|
CONSOLIDATED BALANCE SHEETS ANALYSIS
|
||||
|
Selected Consolidated balance sheets data
|
|||||||||
|
December 31, (in millions)
|
2014
|
2013
|
Change
|
||||||
|
Assets
|
|||||||||
|
Cash and due from banks
|
$
|
27,831
|
|
$
|
39,771
|
|
(30
|
)%
|
|
|
Deposits with banks
|
484,477
|
|
316,051
|
|
53
|
|
|||
|
Federal funds sold and securities purchased under resale agreements
|
215,803
|
|
248,116
|
|
(13
|
)
|
|||
|
Securities borrowed
|
110,435
|
|
111,465
|
|
(1
|
)
|
|||
|
Trading assets:
|
|||||||||
|
Debt and equity instruments
|
320,013
|
|
308,905
|
|
4
|
|
|||
|
Derivative receivables
|
78,975
|
|
65,759
|
|
20
|
|
|||
|
Securities
|
348,004
|
|
354,003
|
|
(2
|
)
|
|||
|
Loans
|
757,336
|
|
738,418
|
|
3
|
|
|||
|
Allowance for loan losses
|
(14,185
|
)
|
(16,264
|
)
|
(13
|
)
|
|||
|
Loans, net of allowance for loan losses
|
743,151
|
|
722,154
|
|
3
|
|
|||
|
Accrued interest and accounts receivable
|
70,079
|
|
65,160
|
|
8
|
|
|||
|
Premises and equipment
|
15,133
|
|
14,891
|
|
2
|
|
|||
|
Goodwill
|
47,647
|
|
48,081
|
|
(1
|
)
|
|||
|
Mortgage servicing rights
|
7,436
|
|
9,614
|
|
(23
|
)
|
|||
|
Other intangible assets
|
1,192
|
|
1,618
|
|
(26
|
)
|
|||
|
Other assets
|
102,950
|
|
110,101
|
|
(6
|
)
|
|||
|
Total assets
|
$
|
2,573,126
|
|
$
|
2,415,689
|
|
7
|
|
|
|
Liabilities
|
|||||||||
|
Deposits
|
$
|
1,363,427
|
|
$
|
1,287,765
|
|
6
|
|
|
|
Federal funds purchased and securities loaned or sold under repurchase agreements
|
192,101
|
|
181,163
|
|
6
|
|
|||
|
Commercial paper
|
66,344
|
|
57,848
|
|
15
|
|
|||
|
Other borrowed funds
|
30,222
|
|
27,994
|
|
8
|
|
|||
|
Trading liabilities:
|
|||||||||
|
Debt and equity instruments
|
81,699
|
|
80,430
|
|
2
|
|
|||
|
Derivative payables
|
71,116
|
|
57,314
|
|
24
|
|
|||
|
Accounts payable and other liabilities
|
206,954
|
|
194,491
|
|
6
|
|
|||
|
Beneficial interests issued by consolidated VIEs
|
52,362
|
|
49,617
|
|
6
|
|
|||
|
Long-term debt
|
276,836
|
|
267,889
|
|
3
|
|
|||
|
Total liabilities
|
2,341,061
|
|
2,204,511
|
|
6
|
|
|||
|
Stockholders’ equity
|
232,065
|
|
211,178
|
|
10
|
|
|||
|
Total liabilities and stockholders’ equity
|
$
|
2,573,126
|
|
$
|
2,415,689
|
|
7
|
%
|
|
JPMorgan Chase’s total assets and total liabilities increased by $157.4 billion and $136.6 billion, respectively, from December 31, 2013.
The following is a discussion of the significant changes in the Consolidated balance sheets from December 31, 2013.
Cash and due from banks and deposits with banks
The net increase was attributable to higher levels of excess funds primarily as a result of growth in deposits. The Firm’s excess funds were placed with various central banks, predominantly Federal Reserve Banks.
Federal funds sold and securities purchased under resale agreements
The decrease in federal funds sold and securities purchased under resale agreements was predominantly attributable to a shift in the deployment of the Firm’s excess cash by Treasury to deposits with banks and to client activity, including a decline in public deposits that require collateral.
Trading assets and liabilities
–
debt and equity instruments
The increase in trading assets and liabilities predominantly related to client-driven market-making activities in CIB was primarily driven by higher levels of debt securities and trading loans. For additional information, refer to Note 3.
Trading assets and liabilities
–
derivative receivables and payables
The increase in both receivables and payables was predominantly due to client-driven market-making activities in CIB, specifically in interest rate derivatives as a result of market movements; commodity derivatives predominantly driven by the significant decline in oil prices; and foreign exchange derivatives reflecting the appreciation of the U.S. dollar against certain currencies. The increases were partially offset by a decline in equity derivatives. For additional information, refer to Derivative contracts on
pages 125–127
, and Notes 3 and 5.
Securities
The decrease was predominantly due to lower levels of non-U.S. residential mortgage-backed securities and U.S. Treasuries, partially offset by higher levels of obligations of U.S. states and municipalities and U.S. residential mortgage-backed securities. For additional information related to securities, refer to the discussion in the Corporate segment on
pages 103–104
, and Notes 3 and 12.
Loans and allowance for loan losses
The increase in loans was attributable to higher consumer and wholesale loans. The increase in consumer loans was due to prime mortgage originations in CCB and AM, as well as credit card, business banking and auto loan originations in CCB, partially offset by paydowns and charge-offs or liquidation of delinquent loans. The increase in wholesale loans was due to a favorable credit environment throughout 2014, which drove an increase in client activity.
|
72
|
JPMorgan Chase & Co./2014 Annual Report
|
|
The decrease in the allowance for loan losses was driven by a reduction in the consumer allowance, predominantly as a result of continued improvement in home prices and delinquencies in the residential real estate portfolio. For a more detailed discussion of the loan portfolio and the allowance for loan losses, refer to Credit Risk Management on
pages 110–111
, and Notes 3, 4, 14 and 15.
Accrued interest and accounts receivable
The increase was due to higher receivables from security sales that did not settle, and higher client receivables related to client-driven market-making activities in CIB.
Mortgage servicing rights
For additional information on MSRs, see Note 17.
Other assets
The decrease was driven by several factors, including lower deferred tax assets; lower private equity investments due to sales, partially offset by unrealized gains; and lower real estate owned.
Deposits
The increase was attributable to higher consumer and wholesale deposits. The increase in consumer deposits reflected a continuing positive growth trend, resulting from strong customer retention, maturing of recent branch builds, and net new business. The increase in wholesale deposits was driven by client activity and business growth. For more information on consumer deposits, refer to the CCB segment discussion on
pages 81–91
; the Liquidity Risk Management discussion on
pages 156–160
; and Notes 3 and 19. For more information on wholesale client deposits, refer to the AM, CB and CIB segment discussions on
pages 100–102
,
pages 97–99
and
pages 92–96
, respectively, and the Liquidity Risk Management discussion on
pages 156–160
.
Federal funds purchased and securities loaned or sold under repurchase agreements
The increase in federal funds purchased and securities loaned or sold under repurchase agreements was predominantly attributable to higher financing of the Firm’s trading assets-debt and equity instruments. The increase was partially offset by client activity in CIB. For additional information on the Firm’s Liquidity Risk Management, see
pages 156–160
.
Commercial paper
The increase was due to commercial paper issuances in the wholesale markets consistent with Treasury’s liquidity and short-term funding plans and, to a lesser extent, a higher volume of liability balances related to CIB’s liquidity management product whereby clients choose to sweep their deposits into commercial paper. For additional information on the Firm’s other borrowed funds, see Liquidity Risk Management on
pages 156–160
.
Accounts payable and other liabilities
The increase was attributable to higher client payables related to client short positions, and higher payables from security purchases that did not settle, both in CIB. The increase was partially offset by lower legal reserves, largely reflecting the settlement of legal and regulatory matters.
Beneficial interests issued by consolidated VIEs
The increase was predominantly due to net new consolidated credit card and municipal bond vehicles, partially offset by a reduction in conduit commercial paper issued to third parties and the deconsolidation of certain mortgage securitization trusts. For further information on Firm-sponsored VIEs and loan securitization trusts, see Off-Balance Sheet Arrangements on
pages 74–75
and Note 16.
The increase was due to net issuances, consistent with Treasury’s long-term funding plans. For additional information on the Firm’s long-term debt activities, see Liquidity Risk Management on
pages 156–160
.
Stockholders’ equity
The increase was due to net income and preferred stock issuances, partially offset by the declaration of cash dividends on common and preferred stock, and repurchases of common stock. For additional information on accumulated other comprehensive income/(loss) (“AOCI”), see Note 25; for the Firm’s capital actions, see Capital actions on
page 154
.
|
JPMorgan Chase & Co./2014 Annual Report
|
73
|
|
Management’s discussion and analysis
|
OFF-BALANCE SHEET ARRANGEMENTS AND CONTRACTUAL CASH OBLIGATIONS
|
||||
In the normal course of business, the Firm enters into various contractual obligations that may require future cash payments. Certain obligations are recognized on-balance sheet, while others are off-balance sheet under U.S. GAAP. The Firm is involved with several types of off–balance sheet arrangements, including through nonconsolidated special-purpose entities (“SPEs”), which are a type of VIE, and through lending-related financial instruments (e.g., commitments and guarantees).
Special-purpose entities
The most common type of VIE is an SPE. SPEs are commonly used in securitization transactions in order to isolate certain assets and distribute the cash flows from those assets to investors. SPEs are an important part of the financial markets, including the mortgage- and asset-b
a
cked securities and commercial paper markets, as they provide market liquidity by facilitating investors’ access to specific portfolios of assets and risks. SPEs may be organized as trusts, partnerships or corporations and are typically established for a single, discrete purpose. SPEs are not typically operating entities and usually have a limited life and no employees. The basic SPE structure involves a company selling assets to the SPE; the SPE funds the purchase of those assets by issuing securities to investors.
JPMorgan Chase uses SPEs as a source of liquidity for itself and its clients by securitizing financial assets, and by creating investment products for clients. The Firm is involved with SPEs through multi-seller conduits, investor intermediation activities, and loan securitizations. See Note 16 for further information on these types of SPEs.
The Firm holds capital, as deemed appropriate, against all SPE-related transactions and related exposures, such as derivative transactions and lending-related commitments and guarantees.
The Firm has no commitments to issue its own stock to support any SPE transaction, and its policies require that transactions with SPEs be conducted at arm’s length and reflect market pricing. Consistent with this policy, no JPMorgan Chase employee is permitted to invest in SPEs with which the Firm is involved where such investment would violate the Firm’s Code of Conduct. These rules prohibit employees from self-dealing and acting on behalf of the Firm in transactions with which they or their family have any significant financial interest.
Implications of a credit rating downgrade to JPMorgan Chase Bank, N.A.
For certain liquidity commitments to SPEs, JPMorgan Chase Bank, N.A. could be required to provide funding if its short-term credit rating were downgraded below specific levels, primarily “P-1”, “A-1” and “F1” for Moody’s, Standard &
Poor’s and Fitch, respectively. These liquidity commitments support the issuance of asset-backed commercial paper by Firm-administered consolidated SPEs. In the event of a short-term credit rating downgrade, JPMorgan Chase Bank, N.A., absent other solutions, would be required to provide funding to the SPE, if the commercial paper could not be reissued as it matured. The aggregate amounts of commercial paper outstanding held by third parties as of
December 31, 2014
and
2013
, was
$12.1 billion
and
$15.5 billion
, respectively. The aggregate amounts of commercial paper outstanding could increase in future periods should clients of the Firm-administered consolidated SPEs draw down on certain unfunded lending-related commitments. These unfunded lending-related commitments were
$9.9 billion
and
$9.2 billion
at
December 31, 2014
and
2013
, respectively. The Firm could facilitate the refinancing of some of the clients’ assets in order to reduce the funding obligation. For further information, see the discussion of Firm-administered multi-seller conduits in Note 16.
The Firm also acts as liquidity provider for certain municipal bond vehicles. The Firm’s obligation to perform as liquidity provider is conditional and is limited by certain termination events, which include bankruptcy or failure to pay by the municipal bond issuer or credit enhancement provider, an event of taxability on the municipal bonds or the immediate downgrade of the municipal bond to below investment grade. See Note 16 for additional information.
Off–balance sheet lending-related financial instruments, guarantees, and other commitments
JPMorgan Chase
provides lending-related financial instruments (e.g., commitments and guarantees) to meet the financing needs of its customers. The contractual amount of these financial instruments represents the maximum possible credit risk to the Firm should the counterparty draw upon the commitment or the Firm be required to fulfill its obligation under the guarantee, and should the counterparty subsequently fail to perform according to the terms of the contract. Most of these commitments and guarantees expire without being drawn or a default occurring. As a result, the total contractual amount of these instruments is not, in the Firm’s view, representative of its actual future credit exposure or funding requirements. For further discussion of lending-related financial instruments, guarantees and other commitments, and the Firm’s accounting for them, see Lending-related commitments on
page 125
and Note 29. For a discussion of liabilities associated with loan sales-and securitization-related indemnifications, see Note 29.
|
74
|
JPMorgan Chase & Co./2014 Annual Report
|
|
Contractual cash obligations
The accompanying table summarizes, by remaining maturity,
JPMorgan Chase
’s significant contractual cash obligations at
December 31, 2014
. The contractual cash obligations included in the table below reflect the minimum contractual obligation under legally enforceable contracts with terms that are both fixed and determinable. Excluded from the below table are certain liabilities with variable cash flows and/or no obligation to return a stated amount of principal at the maturity.
The carrying amount of on-balance sheet obligations on the Consolidated balance sheets may differ from the minimum contractual amount of the obligations reported below. For a discussion of mortgage repurchase liabilities and other obligations, see Note 29.
|
Contractual cash obligations
|
||||||||||||||||||
|
By remaining maturity at December 31,
(in millions)
|
2014
|
2013
|
||||||||||||||||
|
2015
|
2016-2017
|
2018-2019
|
After 2019
|
Total
|
Total
|
|||||||||||||
|
On-balance sheet obligations
|
||||||||||||||||||
|
Deposits
(a)
|
$
|
1,345,919
|
|
$
|
8,200
|
|
$
|
3,318
|
|
$
|
4,160
|
|
$
|
1,361,597
|
|
$
|
1,286,587
|
|
|
Federal funds purchased and securities loaned or sold under repurchase agreements
|
189,002
|
|
2,655
|
|
30
|
|
441
|
|
192,128
|
|
181,163
|
|
||||||
|
Commercial paper
|
66,344
|
|
—
|
|
—
|
|
—
|
|
66,344
|
|
57,848
|
|
||||||
|
Other borrowed funds
(a)
|
15,734
|
|
—
|
|
—
|
|
—
|
|
15,734
|
|
15,655
|
|
||||||
|
Beneficial interests issued by consolidated VIEs
(a)
|
27,833
|
|
12,860
|
|
6,125
|
|
3,382
|
|
50,200
|
|
47,621
|
|
||||||
|
Long-term debt
(a)
|
33,982
|
|
86,620
|
|
61,468
|
|
80,818
|
|
262,888
|
|
256,739
|
|
||||||
|
Other
(b)
|
3,494
|
|
1,217
|
|
1,022
|
|
2,622
|
|
8,355
|
|
7,720
|
|
||||||
|
Total on-balance sheet obligations
|
1,682,308
|
|
111,552
|
|
71,963
|
|
91,423
|
|
1,957,246
|
|
1,853,333
|
|
||||||
|
Off-balance sheet obligations
|
||||||||||||||||||
|
Unsettled reverse repurchase and securities borrowing agreements
(c)
|
40,993
|
|
—
|
|
—
|
|
—
|
|
40,993
|
|
38,211
|
|
||||||
|
Contractual interest payments
(d)
|
6,980
|
|
10,006
|
|
6,596
|
|
24,456
|
|
48,038
|
|
48,021
|
|
||||||
|
Operating leases
(e)
|
1,722
|
|
3,216
|
|
2,402
|
|
5,101
|
|
12,441
|
|
14,266
|
|
||||||
|
Equity investment commitments
(f)
|
454
|
|
92
|
|
50
|
|
512
|
|
1,108
|
|
2,119
|
|
||||||
|
Contractual purchases and capital expenditures
|
1,216
|
|
970
|
|
366
|
|
280
|
|
2,832
|
|
3,425
|
|
||||||
|
Obligations under affinity and co-brand programs
|
906
|
|
1,262
|
|
96
|
|
39
|
|
2,303
|
|
3,283
|
|
||||||
|
Other
|
—
|
|
—
|
|
—
|
|
—
|
|
—
|
|
11
|
|
||||||
|
Total off-balance sheet obligations
|
52,271
|
|
15,546
|
|
9,510
|
|
30,388
|
|
107,715
|
|
109,336
|
|
||||||
|
Total contractual cash obligations
|
$
|
1,734,579
|
|
$
|
127,098
|
|
$
|
81,473
|
|
$
|
121,811
|
|
$
|
2,064,961
|
|
$
|
1,962,669
|
|
|
(a)
|
Excludes structured notes where the Firm is not obligated to return a stated amount of principal at the maturity of the notes, but is obligated to return an amount based on the performance of the structured notes.
|
|
(b)
|
Primarily includes dividends declared on preferred and common stock, deferred annuity contracts, pension and postretirement obligations and insurance liabilities. Prior periods were revised to conform with the current presentation.
|
|
(c)
|
For further information, refer to unsettled reverse repurchase and securities borrowing agreements in Note 29.
|
|
(d)
|
Includes accrued interest and future contractual interest obligations. Excludes interest related to structured notes where the Firm’s payment obligation is based on the performance of certain benchmarks.
|
|
(e)
|
Includes noncancelable operating leases for premises and equipment used primarily for banking purposes and for energy-related tolling service agreements. Excludes the benefit of noncancelable sublease rentals of
$2.2 billion
and $
2.6 billion
at
December 31, 2014
and
2013
, respectively.
|
|
(f)
|
At
December 31, 2014
and
2013
, included unfunded commitments of $
147 million
and
$215 million
, respectively, to third-party private equity funds; and
$961 million
and
$1.9 billion
of unfunded commitments, respectively, to other equity investments.
|
|
JPMorgan Chase & Co./2014 Annual Report
|
75
|
|
Management’s discussion and analysis
|
CONSOLIDATED CASH FLOWS ANALYSIS
|
||||
|
(in millions)
|
Year ended December 31,
|
|||||||||||
|
2014
|
2013
|
2012
|
||||||||||
|
Net cash provided by/(used in)
|
||||||||||||
|
Operating activities
|
$
|
36,593
|
|
$
|
107,953
|
|
$
|
25,079
|
|
|||
|
Investing activities
|
(165,636
|
)
|
(150,501
|
)
|
(119,825
|
)
|
||||||
|
Financing activities
|
118,228
|
|
28,324
|
|
87,707
|
|
||||||
|
Effect of exchange rate changes on cash
|
(1,125
|
)
|
272
|
|
1,160
|
|
||||||
|
Net decrease in cash and due from banks
|
$
|
(11,940
|
)
|
$
|
(13,952
|
)
|
$
|
(5,879
|
)
|
|||
Operating activities
JPMorgan Chase’s operating assets and liabilities support the Firm’s capital markets and lending activities, including the origination or purchase of loans initially designated as held-for-sale. Operating assets and liabilities can vary significantly in the normal course of business due to the amount and timing of cash flows, which are affected by client-driven and risk management activities and market conditions. The Firm believes cash flows from operations, available cash balances and the Firm’s ability to generate cash through short- and long-term borrowings are sufficient to fund the Firm’s operating liquidity needs.
Cash provided by operating activities in 2014 predominantly resulted from net income after noncash operating adjustments and reflected higher net proceeds from loan securitizations and sales activities when compared with 2013. In 2013 cash provided reflected a decrease in trading assets from client-driven market-making activities in CIB, resulting in lower levels of debt securities. Cash used in 2013 for loans originated and purchased with an initial intent to sell was slightly higher than the cash proceeds received from sales and paydowns of loans and reflected significantly higher levels of activities over the prior-year period. Cash provided during 2012 resulted from a decrease in securities borrowed reflecting a shift in the deployment of excess cash to resale agreements as well as lower client activity in CIB; partially offset by a decrease in accounts payable and other liabilities predominantly due to lower CIB client balances.
Investing activities
The Firm’s investing activities predominantly include loans originated to be held for investment, the investment securities portfolio and other short-term interest-earning assets. Cash used in investing activities during 2014, 2013, and 2012 resulted from increases in deposits with banks, attributable to higher levels of excess funds; in 2014, cash was used for growth in wholesale and consumer loans, while in 2013 and 2012 cash used reflected growth in wholesale loans. Partially offsetting these cash outflows in 2014 and 2013 was a net decline in securities purchased under resale agreements due to a shift in the deployment of the Firm’s excess cash by Treasury, and a net decline in consumer loans in 2013 and 2012 from paydowns and portfolio runoff or liquidation of delinquent loans. In 2012, additional cash was used for securities purchased under resale agreements. All years reflected cash proceeds from net maturities and sales of investment securities.
Financing activities
The Firm’s financing activities includes cash from customer deposits, and cash proceeds from issuing long-term debt, and preferred and common stock. Cash provided by financing activities in 2014 predominantly resulted from higher consumer and wholesale deposits. The increase in consumer deposits reflected a continuing positive growth trend resulting from strong customer retention, maturing of recent branch builds, and net new business. The increase in wholesale deposits was driven by client activity and deposit growth. Cash provided in 2013 was driven by growth in both wholesale and consumer deposits, net proceeds from long-term borrowings, and net issuance of preferred stock; partially offset by a decrease in securities loaned or sold under repurchase agreements, predominantly due to changes in the mix of the Firm’s funding sources. Cash provided in 2012 was due to growth in both consumer and wholesale deposits and an increase in federal funds purchased and securities loaned or sold under repurchase agreements due to higher secured financings of the Firm’s assets. In all periods, cash proceeds were offset by repurchases of common stock and cash dividends on common and preferred stock.
* * *
For a further discussion of the activities affecting the Firm’s cash flows, see Balance Sheet Analysis on
pages 72–73
.
|
76
|
JPMorgan Chase & Co./2014 Annual Report
|
|
|
EXPLANATION AND RECONCILIATION OF THE FIRM’S USE OF NON-GAAP FINANCIAL MEASURES
|
The Firm prepares its Consolidated Financial Statements using U.S. GAAP; these financial statements appear on
pages 172–176
. That presentation, which is referred to as “reported” basis, provides the reader with an understanding of the Firm’s results that can be tracked consistently from year to year and enables a comparison of the Firm’s performance with other companies’ U.S. GAAP financial statements.
In addition to analyzing the Firm’s results on a reported basis, management reviews the Firm’s results and the results of the lines of business on a “managed” basis, which is a non-GAAP financial measure. The Firm’s definition of managed basis starts with the reported U.S. GAAP results and includes certain reclassifications to present total net revenue for the Firm (and each of the reportable business segments) on a FTE basis. Accordingly, revenue from investments that receive tax credits and tax-exempt securities is presented in the managed results on a basis
comparable to taxable investments and securities. This non-GAAP financial measure allows management to assess the comparability of revenue arising from both taxable and tax-exempt sources. The corresponding income tax impact related to tax-exempt items is recorded within income tax expense. These adjustments have no impact on net income as reported by the Firm as a whole or by the lines of business.
Management also uses certain non-GAAP financial measures at the business-segment level, because it believes these other non-GAAP financial measures provide information to investors about the underlying operational performance and trends of the particular business segment and, therefore, facilitate a comparison of the business segment with the performance of its competitors. Non- GAAP financial measures used by the Firm may not be comparable to similarly named non-GAAP financial measures used by other companies.
The following summary table provides a reconciliation from the Firm’s reported U.S. GAAP results to managed basis.
|
2014
|
2013
|
2012
|
|||||||||||||||||||||||||||||||||
|
Year ended
December 31,
(in millions, except ratios)
|
Reported
Results
|
Fully taxable-equivalent adjustments
(a)
|
Managed
basis
|
Reported
Results
|
Fully taxable-equivalent adjustments
(a)
|
Managed
basis
|
Reported
Results
|
Fully taxable-equivalent adjustments
(a)
|
Managed
basis
|
||||||||||||||||||||||||||
|
Other income
|
$
|
2,106
|
|
$
|
2,733
|
|
$
|
4,839
|
|
$
|
3,847
|
|
$
|
2,495
|
|
$
|
6,342
|
|
$
|
4,258
|
|
$
|
2,116
|
|
$
|
6,374
|
|
||||||||
|
Total noninterest revenue
|
50,571
|
|
2,733
|
|
53,304
|
|
53,287
|
|
2,495
|
|
55,782
|
|
52,121
|
|
2,116
|
|
54,237
|
|
|||||||||||||||||
|
Net interest income
|
43,634
|
|
985
|
|
44,619
|
|
43,319
|
|
697
|
|
44,016
|
|
44,910
|
|
743
|
|
45,653
|
|
|||||||||||||||||
|
Total net revenue
|
94,205
|
|
3,718
|
|
97,923
|
|
96,606
|
|
3,192
|
|
99,798
|
|
97,031
|
|
2,859
|
|
99,890
|
|
|||||||||||||||||
|
Pre-provision profit
|
32,931
|
|
3,718
|
|
36,649
|
|
26,139
|
|
3,192
|
|
29,331
|
|
32,302
|
|
2,859
|
|
35,161
|
|
|||||||||||||||||
|
Income before income tax expense
|
29,792
|
|
3,718
|
|
33,510
|
|
25,914
|
|
3,192
|
|
29,106
|
|
28,917
|
|
2,859
|
|
31,776
|
|
|||||||||||||||||
|
Income tax expense
|
8,030
|
|
3,718
|
|
11,748
|
|
7,991
|
|
3,192
|
|
11,183
|
|
7,633
|
|
2,859
|
|
10,492
|
|
|||||||||||||||||
|
Overhead ratio
|
65
|
%
|
NM
|
|
63
|
%
|
73
|
%
|
NM
|
|
71
|
%
|
67
|
%
|
NM
|
|
65
|
%
|
|||||||||||||||||
|
(a)
|
Predominantly recognized in CIB and CB business segments and Corporate.
|
|
Calculation of certain U.S. GAAP and non-GAAP financial measures
|
||||
|
Certain U.S. GAAP and non-GAAP financial measures are calculated as follows:
|
||||
|
Book value per share (“BVPS”)
Common stockholders’ equity at period-end /
Common shares at period-end
|
||||
|
Overhead ratio
Total noninterest expense / Total net revenue
|
||||
|
Return on assets (“ROA”)
Reported net income / Total average assets
|
||||
|
Return on common equity (“ROE”)
Net income* / Average common stockholders’ equity
|
||||
|
Return on tangible common equity (“ROTCE”)
Net income* / Average tangible common equity
|
||||
|
Tangible book value per share (“TBVPS”)
Tangible common equity at period-end / Common shares at period-end
|
||||
|
* Represents net income applicable to common equity
|
||||
Tangible common equity (“TCE”), ROTCE and TBVPS are each non-GAAP financial measures. TCE represents the Firm’s common stockholders’ equity (i.e., total stockholders’ equity less preferred stock) less goodwill and identifiable intangible assets (other than MSRs), net of related deferred tax liabilities. ROTCE measures the Firm’s earnings as a percentage of average TCE. TBVPS represents the Firm’s TCE at period-end divided by common shares at period-end. TCE, ROTCE, and TBVPS are meaningful to the Firm, as well as investors and analysts, in assessing the Firm’s use of equity.
Additionally, certain credit and capital metrics and ratios disclosed by the Firm are non-GAAP measures. For additional information on these non-GAAP measures, see Credit Risk Management on
pages 110–111
, and Regulatory capital on
pages 146–153
.
|
JPMorgan Chase & Co./2014 Annual Report
|
77
|
|
Management’s discussion and analysis
|
Tangible common equity
|
||||||||||||||||
|
Period-end
|
Average
|
|||||||||||||||
|
Dec 31,
2014 |
Dec 31,
2013 |
Year ended December 31,
|
||||||||||||||
|
(in millions, except per share and ratio data)
|
2014
|
2013
|
2012
|
|||||||||||||
|
Common stockholders’ equity
|
$
|
212,002
|
|
$
|
200,020
|
|
$
|
207,400
|
|
$
|
196,409
|
|
$
|
184,352
|
|
|
|
Less: Goodwill
|
47,647
|
|
48,081
|
|
48,029
|
|
48,102
|
|
48,176
|
|
||||||
|
Less: Certain identifiable intangible assets
|
1,192
|
|
1,618
|
|
1,378
|
|
1,950
|
|
2,833
|
|
||||||
|
Add: Deferred tax liabilities
(a)
|
2,853
|
|
2,953
|
|
2,950
|
|
2,885
|
|
2,754
|
|
||||||
|
Tangible common equity
|
$
|
166,016
|
|
$
|
153,274
|
|
$
|
160,943
|
|
$
|
149,242
|
|
$
|
136,097
|
|
|
|
Return on tangible common equity
|
NA
|
|
NA
|
|
13
|
%
|
11
|
%
|
15
|
%
|
||||||
|
Tangible book value per share
|
$
|
44.69
|
|
$
|
40.81
|
|
NA
|
NA
|
NA
|
|||||||
|
(a)
|
Represents deferred tax liabilities related to tax-deductible goodwill and to identifiable intangibles created in nontaxable transactions, which are netted against goodwill and other intangibles when calculating TCE.
|
Core net interest income
In addition to reviewing net interest income on a managed basis, management also reviews core net interest income to assess the performance of its core lending, investing (including asset-liability management) and deposit-raising activities. These activities exclude the impact of CIB’s market-based activities. The core data presented below are non-GAAP financial measures due to the exclusion of CIB’s market-based net interest income and related assets. Management believes this exclusion provides investors and analysts another measure by which to analyze the non-market-related business trends of the Firm and provides a comparable measure to other financial institutions that are primarily focused on core lending, investing and deposit-raising activities.
|
Core net interest income data
|
|||||||||
|
Year ended December 31,
(in millions, except rates)
|
2014
|
|
2013
|
|
2012
|
|
|||
|
Net interest income - managed
basis
(a)(b)
|
$
|
44,619
|
|
$
|
44,016
|
|
$
|
45,653
|
|
|
Less: Market-based net interest income
(c)
|
5,552
|
|
5,492
|
|
6,223
|
|
|||
|
Core net interest income
(a)(c)
|
$
|
39,067
|
|
$
|
38,524
|
|
$
|
39,430
|
|
|
Average interest-earning assets
|
$
|
2,049,093
|
|
$
|
1,970,231
|
|
$
|
1,842,417
|
|
|
Less: Average market-based earning assets
|
510,261
|
|
504,218
|
|
499,339
|
|
|||
|
Core average interest-earning assets
|
$
|
1,538,832
|
|
$
|
1,466,013
|
|
$
|
1,343,078
|
|
|
Net interest yield on interest-earning assets - managed basis
|
2.18
|
%
|
2.23
|
%
|
2.48
|
%
|
|||
|
Net interest yield on market-based
activities
(c)
|
1.09
|
|
1.09
|
|
1.25
|
|
|||
|
Core net interest yield
on core average
interest-earning assets
(c)
|
2.54
|
%
|
2.63
|
%
|
2.94
|
%
|
|||
|
(a)
|
Interest includes the effect of related hedging derivatives. Taxable-equivalent amounts are used where applicable.
|
|
(b)
|
For a reconciliation of net interest income on a reported and managed basis, see reconciliation from the Firm’s reported U.S. GAAP results to managed basis on page
77
.
|
|
(c)
|
Effective with the fourth quarter of 2014, the Firm changed the methodology it uses to allocate preferred stock dividends to the lines of business. Prior period amounts were revised to conform with the current allocation methodology. The Firm’s Consolidated balance sheets and consolidated results of operations were not affected by this reporting change. For further discussion please see Preferred stock dividend allocation reporting change on
pages 79–80
.
|
2014
compared with
2013
Core net interest income increased by
$543 million
in
2014
to
$39.1 billion
, and core average interest-earning assets increased by
$72.8 billion
to
$1.5 trillion
. The increase in net interest income in
2014
predominantly reflected higher yields on investment securities, the impact of lower interest expense, and higher average loan balances. The increase was partially offset by lower yields on loans due to the run-off of higher-yielding loans and new originations of lower-yielding loans. The increase in average interest-earning assets largely reflected the impact of higher average balance of deposits with banks. These changes in net interest income and interest-earning assets resulted in the core net interest yield decreasing by
9
basis points to
2.54%
for
2014
.
2013
compared with
2012
Core net interest income decreased by
$906 million
in
2013
to
$38.5 billion
, and core average interest-earning assets increased by
$122.9 billion
to
$1.5 trillion
. The decline in net interest income in
2013
primarily reflected the impact of the runoff of higher-yielding loans and originations of lower-yielding loans. The decrease in net interest income was partially offset by lower long-term debt and other funding costs. The increase in average interest-earning assets reflected the impact of higher deposits with banks. The core net interest yield decreased by
31
basis points to
2.63%
in
2013
, primarily reflecting the impact of a significant increase in deposits with banks and lower loan yields, partially offset by the impact of lower long-term debt yields and deposit rates.
|
78
|
JPMorgan Chase & Co./2014 Annual Report
|
|
|
BUSINESS SEGMENT RESULTS
|
||||
The Firm is managed on a line of business basis. There are four major reportable business segments – Consumer & Community Banking, Corporate & Investment Bank, Commercial Banking and Asset Management. In addition, there is a Corporate segment.
The business segments are determined based on the products and services provided, or the type of customer served, and they reflect the manner in which financial information is currently evaluated by management. Results of these lines of business are presented on a managed basis. For a definition of managed basis, see Explanation and Reconciliation of the Firm’s use of non-GAAP financial measures, on
pages 77–78
.
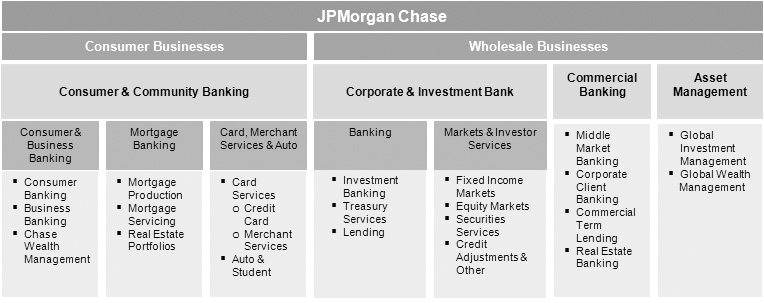
Description of business segment reporting methodology
Results of the business segments are intended to reflect each segment as if it were essentially a stand-alone business. The management reporting process that derives business segment results allocates income and expense using market-based methodologies. The Firm continues to assess the assumptions, methodologies and reporting classifications used for segment reporting, and further refinements may be implemented in future periods.
Revenue sharing
When business segments join efforts to sell products and services to the Firm’s clients, the participating business segments agree to share revenue from those transactions. The segment results reflect these revenue-sharing agreements.
Funds transfer pricing
Funds transfer pricing is used to allocate interest income and expense to each business and transfer the primary interest rate risk exposures to the Treasury group within Corporate. The allocation process is unique to each business segment and considers the interest rate risk, liquidity risk and regulatory requirements of that segment as if it were operating independently, and as compared with its stand-alone peers. This process is overseen by senior management and reviewed by the Firm’s Asset-Liability Committee (“ALCO”).
Preferred stock dividend allocation reporting change
As part of its funds transfer pricing process, the Firm allocates substantially all of the cost of its outstanding preferred stock to its reportable business segments, while retaining the balance of the cost in Corporate. Prior to the fourth quarter of 2014, this cost was allocated to the Firm’s reportable business segments as interest expense, with an offset recorded as interest income in Corporate. Effective with the fourth quarter of 2014, this cost is no longer included in interest income and interest expense in the segments, but rather is now included in net income applicable to common equity to be consistent with the presentation of firmwide results. As a result of this reporting change, net interest income and net income in the reportable business segments increases; however, there was no impact to the segments’ return on common equity (“ROE”). The Firm’s net interest income, net income, Consolidated balance sheets and consolidated results of operations were not impacted by this reporting change, as preferred stock dividends have been and continue to be distributed from retained earnings and, accordingly, were never reported as a component of the Firm’s consolidated net interest income or net income. Prior period segment and core net interest income amounts throughout this Annual Report have been revised to conform with the current period presentation.
|
JPMorgan Chase & Co./2014 Annual Report
|
79
|
|
Management’s discussion and analysis
The following chart depicts how preferred stock dividends were allocated to the business segments before and after the aforementioned methodology change.
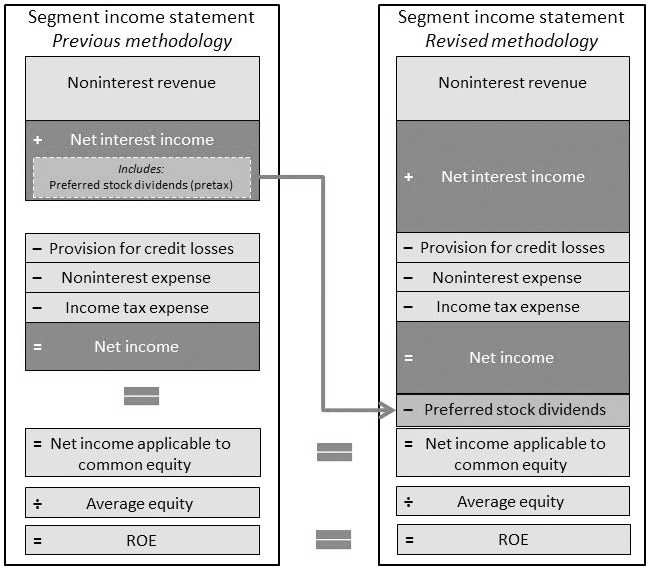
Business segment capital allocation changes
Each business segment is allocated capital by taking into consideration stand-alone peer comparisons, regulatory capital requirements (as estimated under Basel III Advanced Fully Phased-In) and economic risk measures. The amount of capital assigned to each business is referred to as equity.
On at least an annual basis, the Firm assesses the level of capital required for each line of business as well as the assumptions and methodologies used to allocate capital to its lines of business and updates the equity allocations to its lines of business as refinements are implemented.
For further information about these capital changes, see Line of business equity on
page 153
.
Expense allocation
Where business segments use services provided by support units within the Firm, or another business segment, the costs of those services are allocated to the respective business segments. The expense is generally allocated based on actual cost and upon usage of the services provided. In contrast, certain other expense related to certain corporate functions, or to certain technology and operations, are not allocated to the business segments and are retained in Corporate. Retained expense includes: parent company costs that would not be incurred if the segments were stand-alone businesses; adjustments to align certain corporate staff, technology and operations allocations with market prices; and other items not aligned with a particular business segment.
Segment Results – Managed Basis
(a)
The following table summarizes the business segment results for the periods indicated.
|
Year ended December 31,
|
Total net revenue
|
Total noninterest expense
|
Pre-provision profit/(loss)
|
||||||||||||||||||||||||||
|
(in millions)
|
2014
|
|
2013
|
|
2012
|
|
2014
|
|
2013
|
|
2012
|
|
2014
|
|
2013
|
|
2012
|
|
|||||||||||
|
Consumer & Community Banking
|
$
|
44,368
|
|
$
|
46,537
|
|
$
|
50,278
|
|
$
|
25,609
|
|
$
|
27,842
|
|
$
|
28,827
|
|
$
|
18,759
|
|
$
|
18,695
|
|
$
|
21,451
|
|
||
|
Corporate & Investment Bank
|
34,633
|
|
34,786
|
|
34,762
|
|
23,273
|
|
21,744
|
|
21,850
|
|
11,360
|
|
13,042
|
|
12,912
|
|
|||||||||||
|
Commercial Banking
|
6,882
|
|
7,092
|
|
6,912
|
|
2,695
|
|
2,610
|
|
2,389
|
|
4,187
|
|
4,482
|
|
4,523
|
|
|||||||||||
|
Asset Management
|
12,028
|
|
11,405
|
|
10,010
|
|
8,538
|
|
8,016
|
|
7,104
|
|
3,490
|
|
3,389
|
|
2,906
|
|
|||||||||||
|
Corporate
|
12
|
|
(22
|
)
|
(2,072
|
)
|
1,159
|
|
10,255
|
|
4,559
|
|
(1,147
|
)
|
(10,277
|
)
|
(6,631
|
)
|
|||||||||||
|
Total
|
$
|
97,923
|
|
$
|
99,798
|
|
$
|
99,890
|
|
$
|
61,274
|
|
$
|
70,467
|
|
$
|
64,729
|
|
$
|
36,649
|
|
$
|
29,331
|
|
$
|
35,161
|
|
||
|
Year ended December 31,
|
Provision for credit losses
|
Net income/(loss)
|
Return on equity
|
|||||||||||||||||||||||
|
(in millions, except ratios)
|
2014
|
|
2013
|
|
2012
|
|
2014
|
|
2013
|
|
2012
|
|
2014
|
|
2013
|
|
2012
|
|
||||||||
|
Consumer & Community Banking
|
$
|
3,520
|
|
$
|
335
|
|
$
|
3,774
|
|
$
|
9,185
|
|
$
|
11,061
|
|
$
|
10,791
|
|
18
|
%
|
23
|
%
|
25
|
%
|
||
|
Corporate & Investment Bank
|
(161
|
)
|
(232
|
)
|
(479
|
)
|
6,925
|
|
8,887
|
|
8,672
|
|
10
|
|
15
|
|
18
|
|
||||||||
|
Commercial Banking
|
(189
|
)
|
85
|
|
41
|
|
2,635
|
|
2,648
|
|
2,699
|
|
18
|
|
19
|
|
28
|
|
||||||||
|
Asset Management
|
4
|
|
65
|
|
86
|
|
2,153
|
|
2,083
|
|
1,742
|
|
23
|
|
23
|
|
24
|
|
||||||||
|
Corporate
|
(35
|
)
|
(28
|
)
|
(37
|
)
|
864
|
|
(6,756
|
)
|
(2,620
|
)
|
NM
|
|
NM
|
|
NM
|
|
||||||||
|
Total
|
$
|
3,139
|
|
$
|
225
|
|
$
|
3,385
|
|
$
|
21,762
|
|
$
|
17,923
|
|
$
|
21,284
|
|
10
|
%
|
9
|
%
|
11
|
%
|
||
|
(a)
|
Effective with the fourth quarter of 2014, the Firm changed the methodology it uses to allocate preferred stock dividends to the lines of business. Prior period amounts for net revenue, pre-provision profit/(loss) and net income/(loss) for each of the business segments were revised to conform with the current allocation methodology. The Firm’s Consolidated balance sheets and consolidated results of operations were not affected by this reporting change. For further discussion please see Preferred stock dividend allocation reporting change in Business Segment Results on
pages 79–80
.
|
|
80
|
JPMorgan Chase & Co./2014 Annual Report
|
|
|
CONSUMER & COMMUNITY BANKING
|
||||
|
Consumer & Community Banking serves consumers and businesses through personal service at bank branches and through ATMs, online, mobile and telephone banking. CCB is organized into Consumer & Business Banking, Mortgage Banking (including Mortgage Production, Mortgage Servicing and Real Estate Portfolios) and Card, Merchant Services & Auto (“Card”). Consumer & Business Banking offers deposit and investment products and services to consumers, and lending, deposit, and cash management and payment solutions to small businesses. Mortgage Banking includes mortgage origination and servicing activities, as well as portfolios comprised of residential mortgages and home equity loans, including the PCI portfolio acquired in the Washington Mutual transaction. Card issues credit cards to consumers and small businesses, provides payment services to corporate and public sector clients through its commercial card products, offers payment processing services to merchants, and provides auto and student loan services.
|
|
Selected income statement data
|
|||||||||||
|
Year ended December 31,
|
|||||||||||
|
(in millions, except ratios)
|
2014
|
2013
|
2012
|
||||||||
|
Revenue
|
|||||||||||
|
Lending- and deposit-related fees
|
$
|
3,039
|
|
$
|
2,983
|
|
$
|
3,121
|
|
||
|
Asset management, administration and commissions
|
2,096
|
|
2,116
|
|
2,093
|
|
|||||
|
Mortgage fees and related income
|
3,560
|
|
5,195
|
|
8,680
|
|
|||||
|
Card income
|
5,779
|
|
5,785
|
|
5,446
|
|
|||||
|
All other income
|
1,463
|
|
1,473
|
|
1,473
|
|
|||||
|
Noninterest revenue
|
15,937
|
|
17,552
|
|
20,813
|
|
|||||
|
Net interest income
|
28,431
|
|
28,985
|
|
29,465
|
|
|||||
|
Total net revenue
|
44,368
|
|
|
46,537
|
|
50,278
|
|
||||
|
Provision for credit losses
|
3,520
|
|
335
|
|
3,774
|
|
|||||
|
Noninterest expense
|
|||||||||||
|
Compensation expense
|
10,538
|
|
11,686
|
|
11,632
|
|
|||||
|
Noncompensation expense
|
15,071
|
|
16,156
|
|
17,195
|
|
|||||
|
Total noninterest expense
|
25,609
|
|
27,842
|
|
28,827
|
|
|||||
|
Income before income tax expense
|
15,239
|
|
18,360
|
|
17,677
|
|
|||||
|
Income tax expense
|
6,054
|
|
7,299
|
|
6,886
|
|
|||||
|
Net income
|
$
|
9,185
|
|
$
|
11,061
|
|
$
|
10,791
|
|
||
|
Financial ratios
|
|||||||||||
|
Return on common equity
|
18
|
%
|
23
|
%
|
25
|
%
|
|||||
|
Overhead ratio
|
58
|
|
60
|
|
57
|
|
|||||
Note: As discussed on
pages 79–80
, effective with the fourth quarter of 2014 the Firm changed its methodology for allocating the cost of preferred stock to its reportable business segments. Prior periods have been revised to conform with the current period presentation.
Note: In the discussion and the tables which follow, CCB presents certain financial measures which exclude the impact of PCI loans; these are non-GAAP financial measures. For additional information, see Explanation and Reconciliation of the Firm’s Use of Non-GAAP Financial Measures.
2014 compared with 2013
Consumer & Community Banking net income was $9.2 billion, a decrease of $1.9 billion, or 17%, compared with the prior year, due to higher provision for credit losses and lower net revenue, partially offset by lower noninterest expense.
Net revenue was $44.4 billion, a decrease of $2.2 billion, or 5%, compared with the prior year. Net interest income was $28.4 billion, down $554 million, or 2%, driven by spread compression and lower mortgage warehouse balances, largely offset by higher deposit balances in Consumer & Business Banking and higher loan balances in Credit Card. Noninterest revenue was $16.0 billion, a decrease of $1.6 billion, or 9%, driven by lower mortgage fees and related income.
The provision for credit losses was $3.5 billion, compared with $335 million in the prior year. The current-year provision reflected a $1.3 billion reduction in the allowance for loan losses and total net charge-offs of $4.8 billion. The prior-year provision reflected a $5.5 billion reduction in the allowance for loan losses and total net charge-offs of $5.8 billion. For more information, including net charge-off amounts and rates, see Consumer Credit Portfolio.
Noninterest expense was $25.6 billion, a decrease of $2.2 billion, or 8%, from the prior year, driven by lower Mortgage Banking expense.
2013 compared with 2012
Consumer & Community Banking net income was $11.1 billion, an increase of $270 million, or 3%, compared with the prior year, due to lower provision for credit losses and lower noninterest expense, predominantly offset by lower net revenue.
Net revenue was $46.5 billion, a decrease of $3.7 billion, or 7%, compared with the prior year. Net interest income was $29.0 billion, down $480 million, or 2%, driven by lower deposit margins, lower loan balances due to net portfolio runoff and spread compression in Credit Card, largely offset by higher deposit balances. Noninterest revenue was $17.6 billion, a decrease of $3.3 billion, or 16%, driven by lower mortgage fees and related income, partially offset by higher card income.
The provision for credit losses was $335 million, compared with $3.8 billion in the prior year. The current-year provision reflected a $5.5 billion reduction in the allowance for loan losses and total net charge-offs of $5.8 billion. The prior-year provision reflected a $5.5 billion reduction in the allowance for loan losses and total net charge-offs of $9.3 billion, including $800 million of incremental charge-offs related to regulatory guidance. For more information, including net charge-off amounts and rates, see Consumer Credit Portfolio on
pages 113–119
.
|
JPMorgan Chase & Co./2014 Annual Report
|
81
|
|
Management’s discussion and analysis
Noninterest expense was $27.8 billion, a decrease of $985 million, or 3%, from the prior year, driven by lower mortgage servicing expense, partially offset by investments in Chase Private Client expansion, higher non-MBS related legal expense in Mortgage Production, higher auto lease depreciation, and costs related to the control agenda.
|
Selected metrics
|
|||||||||||
|
As of or for the year ended December 31,
|
|||||||||||
|
(in millions, except headcount)
|
2014
|
2013
|
2012
|
||||||||
|
Selected balance sheet data (period-end)
|
|||||||||||
|
Total assets
|
$
|
455,634
|
|
$
|
452,929
|
|
$
|
467,282
|
|
||
|
Trading assets - loans
(a)
|
8,423
|
|
6,832
|
|
18,801
|
|
|||||
|
Loans:
|
|||||||||||
|
Loans retained
|
396,288
|
|
393,351
|
|
402,963
|
|
|||||
|
Loans held-for-sale
|
3,416
|
|
940
|
|
—
|
|
|||||
|
Total loans
|
399,704
|
|
394,291
|
|
402,963
|
|
|||||
|
Deposits
|
502,520
|
|
464,412
|
|
438,517
|
|
|||||
|
Equity
(b)
|
51,000
|
|
46,000
|
|
43,000
|
|
|||||
|
Selected balance sheet data (average)
|
|||||||||||
|
Total assets
|
$
|
447,750
|
|
$
|
456,468
|
|
$
|
467,641
|
|
||
|
Trading assets - loans
(a)
|
8,040
|
|
15,603
|
|
17,573
|
|
|||||
|
Loans:
|
|||||||||||
|
Loans retained
|
389,967
|
|
392,797
|
|
408,559
|
|
|||||
|
Loans held-for-sale
|
917
|
|
209
|
|
433
|
|
|||||
|
Total loans
|
$
|
390,884
|
|
$
|
393,006
|
|
$
|
408,992
|
|
||
|
Deposits
|
486,919
|
|
453,304
|
|
413,948
|
|
|||||
|
Equity
(b)
|
51,000
|
|
46,000
|
|
43,000
|
|
|||||
|
Headcount
|
137,186
|
|
151,333
|
|
164,391
|
|
|||||
|
(a)
|
Predominantly consists of prime mortgages originated with the intent to sell that are accounted for at fair value.
|
|
(b)
|
2014 includes $3.0 billion of capital held at the CCB level related to legacy mortgage servicing matters.
|
|
Selected metrics
|
|||||||||
|
As of or for the year ended December 31,
|
|||||||||
|
(in millions, except ratios and where otherwise noted)
|
2014
|
2013
|
2012
|
||||||
|
Credit data and quality statistics
|
|||||||||
|
Net charge-offs
(a)(b)
|
$
|
4,773
|
|
$
|
5,826
|
|
$
|
9,280
|
|
|
Nonaccrual loans
(c)(d)
|
6,401
|
|
7,455
|
|
9,114
|
|
|||
|
Nonperforming assets
(c)(d)(e)
|
6,872
|
|
8,109
|
|
9,791
|
|
|||
|
Allowance for loan losses
(a)
|
10,404
|
|
12,201
|
|
17,752
|
|
|||
|
Net charge-off rate
(a)(b)
|
1.22
|
%
|
1.48
|
%
|
2.27
|
%
|
|||
|
Net charge-off rate,
excluding PCI loans
(b)
|
1.40
|
|
1.73
|
|
2.68
|
|
|||
|
Allowance for loan losses to period-end loans retained
|
2.63
|
|
3.10
|
|
4.41
|
|
|||
|
Allowance for loan losses to period-end loans retained,
excluding PCI loans
(f)
|
2.02
|
|
2.36
|
|
3.51
|
|
|||
|
Allowance for loan losses to nonaccrual loans retained, excluding credit card
(c)(f)
|
58
|
|
57
|
|
72
|
|
|||
|
Nonaccrual loans to total period-end loans, excluding
credit card
(e)
|
2.38
|
|
2.80
|
|
3.31
|
|
|||
|
Nonaccrual loans to total period-end loans, excluding credit card and PCI loans
(c)(e)
|
2.88
|
|
3.49
|
|
4.23
|
|
|||
|
Business metrics
|
|||||||||
|
Number of:
|
|||||||||
|
Branches
|
5,602
|
|
5,630
|
|
5,614
|
|
|||
|
ATMs
(g)
|
18,056
|
|
20,290
|
|
19,062
|
|
|||
|
Active online customers (in thousands)
|
36,396
|
|
33,742
|
|
31,114
|
|
|||
|
Active mobile customers (in thousands)
|
19,084
|
|
15,629
|
|
12,359
|
|
|||
|
(a)
|
Net charge-offs and the net charge-off rates excluded
$533 million
and
$53 million
of write-offs in the PCI portfolio for the years ended December 31, 2014 and 2013, respectively. These write-offs decreased the allowance for loan losses for PCI loans. For further information on PCI write-offs, see Allowance for Credit Losses on
pages 128–130
.
|
|
(b)
|
Net charge-offs and net charge-off rates for the year ended December 31, 2012, included $800 million of charge-offs, recorded in accordance with regulatory guidance on certain loans discharged under Chapter 7 bankruptcy and not reaffirmed by the borrower (“Chapter 7 loans”) to be charged off to the net realizable value of the collateral and to be considered nonaccrual, regardless of their delinquency status. Excluding these charges-offs, net charge-offs for the year ended December 31, 2012, would have been $8.5 billion and excluding these charge-offs and PCI loans, the net charge-off rate for the year ended December 31, 2012, would have been 2.45%.
|
|
(c)
|
Excludes PCI loans. The Firm is recognizing interest income on each pool of PCI loans as they are all performing.
|
|
(d)
|
At December 31, 2014, 2013 and 2012, nonperforming assets excluded: (1) mortgage loans insured by U.S. government agencies of $7.8 billion, $8.4 billion and $10.6 billion, respectively, that are 90 or more days past due; (2) student loans insured by U.S. government agencies under the Federal Family Education Loan Program (“FFELP”) of $367 million, $428 million and $525 million respectively, that are 90 or more days past due; (3) real estate owned (“REO”) insured by U.S. government agencies of $462 million, $2.0 billion and $1.6 billion, respectively. These amounts have been excluded based upon the government guarantee.
|
|
(e)
|
Prior periods were revised to conform with the current presentation.
|
|
(f)
|
The allowance for loan losses for PCI loans of $3.3 billion, $4.2 billion and $5.7 billion at December 31, 2014, December 31, 2013, and December 31, 2012, respectively; these amounts were also excluded from the applicable ratios.
|
|
(g)
|
Includes eATMs, formerly Express Banking Kiosks (“EBK”). Prior periods were revised to conform with the current presentation.
|
|
82
|
JPMorgan Chase & Co./2014 Annual Report
|
|
Consumer & Business Banking
|
Selected income statement data
|
|||||||||||
|
As of or for the year ended December 31,
|
|||||||||||
|
(in millions, except ratios)
|
2014
|
2013
|
2012
|
||||||||
|
Revenue
|
|||||||||||
|
Lending- and deposit-related fees
|
$
|
3,010
|
|
$
|
2,942
|
|
$
|
3,068
|
|
||
|
Asset management, administration and commissions
|
2,025
|
|
1,815
|
|
1,638
|
|
|||||
|
Card income
|
1,605
|
|
1,495
|
|
1,353
|
|
|||||
|
All other income
|
534
|
|
492
|
|
498
|
|
|||||
|
Noninterest revenue
|
7,174
|
|
6,744
|
|
6,557
|
|
|||||
|
Net interest income
|
11,052
|
|
10,668
|
|
10,629
|
|
|||||
|
Total net revenue
|
18,226
|
|
17,412
|
|
17,186
|
|
|||||
|
Provision for credit losses
|
305
|
|
347
|
|
311
|
|
|||||
|
Noninterest expense
|
12,149
|
|
12,162
|
|
11,490
|
|
|||||
|
Income before income tax expense
|
5,772
|
|
4,903
|
|
5,385
|
|
|||||
|
Net income
|
$
|
3,443
|
|
$
|
2,943
|
|
$
|
3,224
|
|
||
|
Return on common equity
|
31
|
%
|
26
|
%
|
36
|
%
|
|||||
|
Overhead ratio
|
67
|
|
70
|
|
67
|
|
|||||
|
Equity (period-end and average)
|
$
|
11,000
|
|
$
|
11,000
|
|
$
|
9,000
|
|
||
2014 compared with 2013
Consumer & Business Banking
net income was $3.4 billion, an increase of $500 million, or 17%, compared with the prior year, due t
o higher net revenue.
Net revenue was $18.2 billion, up 5% compared with the prior year. Net interest income was $11.1 billion, up $384 million, or 4% compared with the prior year, driven by higher deposit balances, largely offset by deposit spread compression. Noninterest revenue was $7.2 billion, up $430 million, or 6%, driven by higher investment revenue, reflecting record client investment assets, higher debit card revenue, reflecting an increase in transaction volume, and higher deposit-related fees as a result of an increase in customer accounts.
Noninterest expense was $12.1 billion, flat from the prior year, reflecting lower costs driven by efficiencies implemented in the business, offset by the increased cost of controls.
2013 compared with 2012
Consumer & Business Banking
net income was $2.9 billion, a decrease of $281 million, or 9%, compared with the prior year, due to higher noninterest expense, partially offset by higher noninterest revenue.
Net revenue was $17.4 billion, up 1% compared with the prior year. Net interest income was $10.7 billion, flat compared with the prior year, driven by higher deposit balances, offset by lower deposit margin. Noninterest revenue was $6.7 billion, an increase of 3%, driven by higher investment sales revenue and debit card revenue, partially offset by lower deposit-related fees.
Noninterest expense was $12.2 billion, up 6% from the prior year, reflecting continued investments in the business, and costs related to the control agenda.
|
Selected metrics
|
|||||||||||
|
As of or for the year ended December 31,
|
|||||||||||
|
(in millions, except ratios)
|
2014
|
2013
|
2012
|
||||||||
|
Business metrics
|
|||||||||||
|
Business banking origination volume
|
$
|
6,599
|
|
$
|
5,148
|
|
$
|
6,542
|
|
||
|
Period-end loans
|
21,200
|
|
19,416
|
|
18,883
|
|
|||||
|
Period-end deposits:
|
|||||||||||
|
Checking
|
213,049
|
|
187,182
|
|
170,354
|
|
|||||
|
Savings
|
255,148
|
|
238,223
|
|
216,422
|
|
|||||
|
Time and other
|
21,349
|
|
26,022
|
|
31,753
|
|
|||||
|
Total period-end deposits
|
489,546
|
|
451,427
|
|
418,529
|
|
|||||
|
Average loans
|
20,152
|
|
18,844
|
|
18,104
|
|
|||||
|
Average deposits:
|
|||||||||||
|
Checking
|
198,996
|
|
176,005
|
|
153,422
|
|
|||||
|
Savings
|
249,281
|
|
229,341
|
|
204,449
|
|
|||||
|
Time and other
|
24,057
|
|
29,227
|
|
34,224
|
|
|||||
|
Total average deposits
|
472,334
|
|
434,573
|
|
392,095
|
|
|||||
|
Deposit margin
|
2.21
|
%
|
2.32
|
%
|
2.57
|
%
|
|||||
|
Average assets
|
$
|
38,298
|
|
$
|
37,174
|
|
$
|
34,431
|
|
||
|
Selected metrics
|
|||||||||||
|
As of or for the year ended December 31,
|
|||||||||||
|
(in millions, except ratios and where otherwise noted)
|
2014
|
2013
|
2012
|
||||||||
|
Credit data and quality statistics
|
|||||||||||
|
Net charge-offs
|
$
|
305
|
|
$
|
337
|
|
$
|
411
|
|
||
|
Net charge-off rate
|
1.51
|
%
|
1.79
|
%
|
2.27
|
%
|
|||||
|
Allowance for loan losses
|
$
|
703
|
|
$
|
707
|
|
$
|
698
|
|
||
|
Nonperforming assets
|
286
|
|
391
|
|
488
|
|
|||||
|
Retail branch business metrics
|
|||||||||||
|
Net new investment assets
|
$
|
16,088
|
|
$
|
16,006
|
|
$
|
11,128
|
|
||
|
Client investment assets
|
213,459
|
|
188,840
|
|
158,502
|
|
|||||
|
% managed accounts
|
39
|
%
|
36
|
%
|
29
|
%
|
|||||
|
Number of:
|
|||||||||||
|
Chase Private Client locations
|
2,514
|
|
2,149
|
|
1,218
|
|
|||||
|
Personal bankers
|
21,039
|
|
23,588
|
|
23,674
|
|
|||||
|
Sales specialists
|
3,994
|
|
5,740
|
|
6,076
|
|
|||||
|
Client advisors
|
3,090
|
|
3,044
|
|
2,963
|
|
|||||
|
Chase Private Clients
|
325,653
|
|
215,888
|
|
105,700
|
|
|||||
|
Accounts (in thousands)
(a)
|
30,481
|
|
29,437
|
|
28,073
|
|
|||||
|
Households (in millions)
|
25.7
|
|
25.0
|
|
24.1
|
|
|||||
(a) Includes checking accounts and Chase Liquid
®
cards.
|
JPMorgan Chase & Co./2014 Annual Report
|
83
|
|
Management’s discussion and analysis
Mortgage Banking
|
Selected Financial statement data
|
|||||||||||
|
As of or for the year ended December 31,
|
|||||||||||
|
(in millions, except ratios)
|
2014
|
2013
|
2012
|
||||||||
|
Revenue
|
|||||||||||
|
Mortgage fees and related income
|
$
|
3,560
|
|
$
|
5,195
|
|
$
|
8,680
|
|
||
|
All other income
|
37
|
|
283
|
|
475
|
|
|||||
|
Noninterest revenue
|
3,597
|
|
5,478
|
|
9,155
|
|
|||||
|
Net interest income
|
4,229
|
|
4,758
|
|
5,016
|
|
|||||
|
Total net revenue
|
7,826
|
|
10,236
|
|
14,171
|
|
|||||
|
Provision for credit losses
|
(217
|
)
|
(2,681
|
)
|
(490
|
)
|
|||||
|
Noninterest expense
|
5,284
|
|
7,602
|
|
9,121
|
|
|||||
|
Income before income tax expense
|
2,759
|
|
5,315
|
|
5,540
|
|
|||||
|
Net income
|
$
|
1,668
|
|
$
|
3,211
|
|
$
|
3,468
|
|
||
|
Return on common equity
|
9
|
%
|
16
|
%
|
19
|
%
|
|||||
|
Overhead ratio
|
68
|
|
74
|
|
64
|
|
|||||
|
Equity (period-end and average)
|
$
|
18,000
|
|
$
|
19,500
|
|
$
|
17,500
|
|
||
2014 compared with 2013
Mortgage Banking
net income was $1.7 billion, a decrease of $1.5 billion, or 48%, from the prior year, driven by a lower benefit from the provision for credit losses and lower net revenue, partially offset by lower noninterest expense.
Net revenue was $7.8 billion, a decrease of $2.4 billion, or 24%, compared with the prior year. Net interest income was $4.2 billion, a decrease of $529 million, or 11%, driven by spread compression and lower loan balances due to portfolio runoff and lower warehouse balances. Noninterest revenue was $3.6 billion, a decrease of $1.9 billion, or 34%, driven by lower mortgage fees and related income.
The provision for credit losses was a benefit of $217 million, compared with a benefit of $2.7 billion in the prior year. The current year reflected a $700 million reduction in the allowance for loan losses, reflecting continued improvement in home prices and delinquencies. The prior year included a $3.8 billion reduction in the allowance for loan losses. Net charge-offs were $483 million, compared with $1.1 billion in the prior year.
Noninterest expense was $5.3 billion, a decrease of $2.3 billion, or 30%, from the prior year, due to lower expense in production and servicing reflecting lower headcount-related expense, the absence of non-MBS related legal expense and lower expense on foreclosure-related matters.
2013 compared with 2012
Mortgage Banking
net income was $3.2 billion, a decrease of $257 million, or 7%, compared with the prior year, driven by lower net revenue, predominantly offset by a higher benefit from the provision for credit losses and lower noninterest expense.
Net revenue was $10.2 billion, a decrease of $3.9 billion, or 28%, compared with the prior year. Net interest income was $4.8 billion, a decrease of $258 million, or 5%, driven by lower loan balances due to net portfolio runoff. Noninterest revenue was $5.5 billion, a decrease of $3.7 billion, driven by lower mortgage fees and related income.
The provision for credit losses was a benefit of $2.7 billion, compared with a benefit of $490 million in the prior year. The current year reflected a $3.8 billion reduction in the allowance for loan losses due to continued improvement in home prices and delinquencies. The prior year included a $3.9 billion reduction in the allowance for loan losses.
Noninterest expense was $7.6 billion, a decrease of $1.5 billion, or 17%, from the prior year, due to lower servicing expense, partially offset by higher non-MBS related legal expense in Mortgage Production.
|
84
|
JPMorgan Chase & Co./2014 Annual Report
|
|
|
Functional results
|
|||||||||||
|
Year ended December 31,
|
|||||||||||
|
(in millions, except ratios)
|
2014
|
2013
|
2012
|
||||||||
|
Mortgage Production
|
|||||||||||
|
Production revenue and other Income
(a)
|
$
|
1,060
|
|
$
|
2,973
|
|
$
|
5,877
|
|
||
|
Production-related net interest income
(a)
|
422
|
|
635
|
|
705
|
|
|||||
|
Production-related revenue, excluding repurchase (losses)/benefits
|
1,482
|
|
3,608
|
|
6,582
|
|
|||||
|
Production expense
(b)
|
1,646
|
|
3,088
|
|
2,747
|
|
|||||
|
Income, excluding repurchase (losses)/benefits
|
(164
|
)
|
520
|
|
3,835
|
|
|||||
|
Repurchase (losses)/benefits
|
458
|
|
331
|
|
(272
|
)
|
|||||
|
Income before income tax expense
|
294
|
|
851
|
|
3,563
|
|
|||||
|
Mortgage Servicing
|
|||||||||||
|
Loan servicing revenue and other income
(a)
|
3,294
|
|
3,744
|
|
4,110
|
|
|||||
|
Servicing-related net interest income
(a)
|
314
|
|
253
|
|
93
|
|
|||||
|
Servicing-related revenue
|
3,608
|
|
3,997
|
|
4,203
|
|
|||||
|
Changes in MSR asset fair value due to collection/realization of expected cash flows
|
(905
|
)
|
(1,094
|
)
|
(1,222
|
)
|
|||||
|
Net servicing-related revenue
|
2,703
|
|
2,903
|
|
2,981
|
|
|||||
|
Default servicing expense
|
1,406
|
|
2,069
|
|
3,707
|
|
|||||
|
Core servicing expense
(b)
|
865
|
|
904
|
|
1,033
|
|
|||||
|
Servicing Expense
|
2,271
|
|
2,973
|
|
4,740
|
|
|||||
|
Income/(loss), excluding MSR risk management
|
432
|
|
(70
|
)
|
(1,759
|
)
|
|||||
|
MSR risk management, including related net interest income/(expense)
|
(28
|
)
|
(268
|
)
|
616
|
|
|||||
|
Income/(loss) before income tax expense/(benefit)
|
404
|
|
(338
|
)
|
(1,143
|
)
|
|||||
|
Real Estate Portfolios
|
|||||||||||
|
Noninterest revenue
|
(282
|
)
|
(209
|
)
|
43
|
|
|||||
|
Net interest income
|
3,493
|
|
3,871
|
|
4,221
|
|
|||||
|
Total net revenue
|
3,211
|
|
3,662
|
|
4,264
|
|
|||||
|
Provision for credit losses
|
(223
|
)
|
(2,693
|
)
|
(509
|
)
|
|||||
|
Noninterest expense
|
1,373
|
|
1,553
|
|
1,653
|
|
|||||
|
Income before income tax expense
|
2,061
|
|
4,802
|
|
3,120
|
|
|||||
|
Mortgage Banking income before income tax expense
|
$
|
2,759
|
|
$
|
5,315
|
|
$
|
5,540
|
|
||
|
Mortgage Banking net income
|
$
|
1,668
|
|
$
|
3,211
|
|
$
|
3,468
|
|
||
|
Overhead ratios
|
|||||||||||
|
Mortgage Production
|
85
|
%
|
78
|
%
|
43
|
%
|
|||||
|
Mortgage Servicing
|
85
|
|
113
|
132
|
|
||||||
|
Real Estate Portfolios
|
43
|
|
42
|
|
39
|
|
|||||
|
(a)
|
Prior periods were revised to conform with the current presentation.
|
|
(b)
|
Includes provision for credit losses.
|
2014 compared with 2013
Mortgage Production
pretax income was $294 million, a decrease of $557 million, or 65%, from the prior year, reflecting lower revenue, largely offset by lower expense and higher benefit from repurchase losses. Mortgage production-related revenue, excluding repurchase losses, was $1.5 billion, a decrease of $2.1 billion, from the prior year, driven by lower volumes due to higher levels of mortgage interest rates and tighter margins. Production expense was $1.6 billion, a decrease of $1.4 billion, or 47%, from the prior year, driven by lower headcount-related expense and the absence of non-MBS related legal expense.
Mortgage Servicing
pretax income was $404 million, compared with a loss of $338 million in the prior year, reflecting lower expenses and lower MSR risk management loss, partially offset by lower net revenue. Mortgage net servicing-related revenue was $2.7 billion, a decrease of $200 million, or 7%, from the prior year, driven by lower average third-party loans serviced and lower revenue from an exited non-core product, partially offset by lower MSR asset amortization expense as a result of lower MSR asset value. MSR risk management was a loss of $28 million, compared with a loss of $268 million in the prior year. See Note 17 for further information regarding changes in value of the MSR asset and related hedges. Servicing expense was $2.3 billion, a decrease of $702 million, or 24%, from the prior year, reflecting lower headcount-related expense and lower expense for foreclosure related matters.
Real Estate Portfolios
pretax income was $2.1 billion, down $2.7 billion, or 57%, from the prior year, due to a lower benefit from the provision for credit losses and lower net revenue, partially offset by lower noninterest expense. Net revenue was $3.2 billion, a decrease of $451 million, or 12%, from the prior year, driven by lower net interest income as a result of spread compression and lower loan balances due to portfolio runoff. The provision for credit losses was a benefit of $223 million, compared with a benefit of $2.7 billion in the prior year. The current-year provision reflected a $700 million reduction in the allowance for loan losses, $400 million from the non credit-impaired allowance and $300 million from the purchased credit-impaired allowance, due to continued improvement in home prices and delinquencies. The prior-year provision reflected a $3.8 billion reduction in the allowance for loan losses, $2.3 billion from the non credit-impaired allowance and $1.5 billion from the purchased credit-impaired allowance. Net charge-offs were $477 million, compared with $1.1 billion in the prior year. See Consumer Credit Portfolio on
pages 113–119
for the net charge-off amounts and rates. Noninterest expense was $1.4 billion, a decrease of $180 million, or 12%, compared with the prior year, driven by lower FDIC-related expense and lower foreclosed asset expense due to lower foreclosure inventory.
|
JPMorgan Chase & Co./2014 Annual Report
|
85
|
|
Management’s discussion and analysis
2013 compared with 2012
Mortgage Production
pretax income was $851 million, a decrease of $2.7 billion from the prior year, reflecting lower margins, lower volumes and higher legal expense, partially offset by a benefit in repurchase losses. Production-related revenue, excluding repurchase losses, was $3.6 billion, a decrease of $3.0 billion, or 45%, from the prior year, largely reflecting lower margins and lower volumes from rising rates. Production expense was $3.1 billion, an increase of $341 million, or 12%, from the prior year, due to higher non-MBS related legal expense and higher compensation-related expense. Repurchase losses for the current year reflected a benefit of $331 million, compared with repurchase losses of $272 million in the prior year. The current year reflected a reduction in the repurchase liability largely as a result of the settlement with the GSEs.
Mortgage Servicing
pretax loss was $338 million, compared with a pretax loss of $1.1 billion in the prior year, driven by lower expense, partially offset by a MSR risk management loss. Mortgage net servicing-related revenue was $2.9 billion, a decrease of $78 million. MSR risk management was a loss of $268 million, compared with income of $616 million in the prior year, driven by the net impact of various changes in model inputs and assumptions. See Note 17 for further information regarding changes in value of the MSR asset and related hedges. Servicing expense was $3.0 billion, a decrease of $1.8 billion, or 37%, from the prior year, reflecting lower costs associated with the Independent Foreclosure Review and lower servicing headcount.
Real Estate Portfolios
pretax income was $4.8 billion, up $1.7 billion from the prior year, or 54%, due to a higher benefit from the provision for credit losses, partially offset by lower net revenue. Net revenue was $3.7 billion, a decrease of $602 million, or 14%, from the prior year. This decrease was due to lower net interest income, resulting from lower loan balances due to net portfolio runoff, and lower noninterest revenue due to higher loan retention. The provision for credit losses was a benefit of $2.7 billion, compared with a benefit of $509 million in the prior year. The current-year provision reflected a $3.8 billion reduction in the allowance for loan losses, $2.3 billion from the non credit-impaired allowance and $1.5 billion from the purchased credit-impaired allowance, reflecting continued improvement in home prices and delinquencies. The prior-year provision included a $3.9 billion reduction in the allowance for loan losses from the non credit-impaired allowance. Net charge-offs were $1.1 billion, compared with $3.3 billion in the prior year. Prior-year total net charge-offs included $744 million of incremental charge-offs reported in accordance with regulatory guidance on certain loans discharged under Chapter 7 bankruptcy. Noninterest expense was $1.6 billion, a decrease of $100 million, or 6%, compared with the prior year, driven by lower foreclosed asset expense due to lower foreclosure inventory, largely offset by higher FDIC-related expense.
|
Mortgage Production and Mortgage Servicing
|
|||||||||||
|
Selected metrics
|
|||||||||||
|
As of or for the year ended December 31,
|
|||||||||||
|
(in millions, except ratios)
|
2014
|
2013
|
2012
|
||||||||
|
Selected balance sheet data (Period-end)
|
|||||||||||
|
Trading assets - loans
(a)
|
$
|
8,423
|
|
$
|
6,832
|
|
$
|
18,801
|
|
||
|
Loans:
|
|||||||||||
|
Prime mortgage, including option ARMs
(b)
|
$
|
13,557
|
|
$
|
15,136
|
|
$
|
17,290
|
|
||
|
Loans held-for-sale
|
314
|
|
614
|
|
—
|
|
|||||
|
Selected balance sheet data (average)
|
|||||||||||
|
Trading assets - loans
(a)
|
8,040
|
|
15,603
|
|
17,573
|
|
|||||
|
Loans:
|
|||||||||||
|
Prime mortgage, including option ARMs
(b)
|
14,993
|
|
16,495
|
|
17,335
|
|
|||||
|
Loans held-for-sale
|
394
|
|
114
|
|
—
|
|
|||||
|
Average assets
|
42,456
|
|
57,131
|
|
59,837
|
|
|||||
|
Repurchase liability (period-end)
|
249
|
|
651
|
|
2,530
|
|
|||||
|
Credit data and quality statistics
|
|||||||||||
|
Net charge-offs:
|
|||||||||||
|
Prime mortgage, including option ARMs
|
6
|
|
12
|
|
19
|
|
|||||
|
Net charge-off rate:
|
|||||||||||
|
Prime mortgage, including option ARMs
|
0.04
|
%
|
0.07
|
%
|
0.11
|
%
|
|||||
|
30+ day delinquency rate
(c)
|
2.06
|
|
2.75
|
|
3.05
|
|
|||||
|
Nonperforming assets
(d)(e)
|
$
|
389
|
|
$
|
519
|
|
$
|
599
|
|
||
|
(a)
|
Predominantly consists of prime mortgages originated with the intent to sell that are accounted for at fair value.
|
|
(b)
|
Predominantly represents prime mortgage loans repurchased from Government National Mortgage Association (“Ginnie Mae”) pools, which are insured by U.S. government agencies.
|
|
(c)
|
At December 31, 2014, 2013 and 2012, excluded mortgage loans insured by U.S. government agencies of $9.7 billion, $9.6 billion and $11.8 billion respectively, that are 30 or more days past due. These amounts have been excluded based upon the government guarantee. For further discussion, see Note 14 which summarizes loan delinquency information.
|
|
(d)
|
At December 31, 2014, 2013 and 2012, nonperforming assets excluded: (1) mortgage loans insured by U.S. government agencies of $7.8 billion, $8.4 billion and $10.6 billion respectively, that are 90 or more days past due; and (2) REO insured by U.S. government agencies of $462 million, $2.0 billion and $1.6 billion, respectively. These amounts have been excluded based upon the government guarantee.
|
|
(e)
|
Prior periods were revised to conform with the current presentation.
|
|
86
|
JPMorgan Chase & Co./2014 Annual Report
|
|
|
Selected metrics
|
|||||||||||
|
As of or for the year ended
December 31,
|
|||||||||||
|
(in billions, except ratios)
|
2014
|
2013
|
2012
|
||||||||
|
Business metrics
|
|||||||||||
|
Mortgage origination volume by channel
|
|||||||||||
|
Retail
|
$
|
29.5
|
|
$
|
77.0
|
|
$
|
101.4
|
|
||
|
Correspondent
(a)
|
48.5
|
|
88.5
|
|
79.4
|
|
|||||
|
Total mortgage origination volume
(b)
|
$
|
78.0
|
|
$
|
165.5
|
|
$
|
180.8
|
|
||
|
Mortgage application volume by channel
|
|||||||||||
|
Retail
|
$
|
55.6
|
|
$
|
108.0
|
|
$
|
164.5
|
|
||
|
Correspondent
(a)
|
63.2
|
|
89.2
|
|
101.2
|
|
|||||
|
Total mortgage application volume
|
$
|
118.8
|
|
$
|
197.2
|
|
$
|
265.7
|
|
||
|
Third-party mortgage loans serviced (period-end)
|
$
|
751.5
|
|
$
|
815.5
|
|
$
|
859.4
|
|
||
|
Third-party mortgage loans serviced (average)
|
784.6
|
|
837.3
|
|
847.0
|
|
|||||
|
MSR carrying value (period-end)
|
7.4
|
|
9.6
|
|
7.6
|
|
|||||
|
Ratio of MSR carrying value (period-end) to third-party mortgage loans serviced (period-end)
|
0.98
|
%
|
1.18
|
%
|
0.88
|
%
|
|||||
|
Ratio of loan servicing-related revenue to third-party mortgage loans serviced (average)
|
0.36
|
|
0.40
|
|
0.46
|
|
|||||
|
MSR revenue multiple
(c)
|
2.72
|
x
|
2.95
|
x
|
1.91x
|
|
|||||
|
(a)
|
Includes rural housing loans sourced through correspondents, and prior to November 2013, through both brokers and correspondents, which are underwritten and closed with pre-funding loan approval from the U.S. Department of Agriculture Rural Development, which acts as the guarantor in the transaction.
|
|
(b)
|
Firmwide mortgage origination volume was $83.3 billion, $176.4 billion and $189.9 billion for the years ended December 31, 2014, 2013 and 2012, respectively.
|
|
(c)
|
Represents the ratio of MSR carrying value (period-end) to third-party mortgage loans serviced (period-end) divided by the ratio of loan servicing-related revenue to third-party mortgage loans serviced (average).
|
|
Real Estate Portfolios
|
|||||||||||
|
Selected metrics
|
|||||||||||
|
As of or for the year ended December 31,
|
|||||||||||
|
(in millions)
|
2014
|
2013
|
2012
|
||||||||
|
Loans, excluding PCI
|
|||||||||||
|
Period-end loans owned:
|
|||||||||||
|
Home equity
|
$
|
50,899
|
|
$
|
57,863
|
|
$
|
67,385
|
|
||
|
Prime mortgage, including option ARMs
|
66,543
|
|
49,463
|
|
41,316
|
|
|||||
|
Subprime mortgage
|
5,083
|
|
7,104
|
|
8,255
|
|
|||||
|
Other
|
477
|
|
551
|
|
633
|
|
|||||
|
Total period-end loans owned
|
$
|
123,002
|
|
$
|
114,981
|
|
$
|
117,589
|
|
||
|
Average loans owned:
|
|||||||||||
|
Home equity
|
$
|
54,410
|
|
$
|
62,369
|
|
$
|
72,674
|
|
||
|
Prime mortgage, including option ARMs
|
56,104
|
|
44,988
|
|
42,311
|
|
|||||
|
Subprime mortgage
|
6,257
|
|
7,687
|
|
8,947
|
|
|||||
|
Other
|
511
|
|
588
|
|
675
|
|
|||||
|
Total average loans owned
|
$
|
117,282
|
|
$
|
115,632
|
|
$
|
124,607
|
|
||
|
PCI loans
|
|||||||||||
|
Period-end loans owned:
|
|||||||||||
|
Home equity
|
$
|
17,095
|
|
$
|
18,927
|
|
$
|
20,971
|
|
||
|
Prime mortgage
|
10,220
|
|
12,038
|
|
13,674
|
|
|||||
|
Subprime mortgage
|
3,673
|
|
4,175
|
|
4,626
|
|
|||||
|
Option ARMs
|
15,708
|
|
17,915
|
|
20,466
|
|
|||||
|
Total period-end loans owned
|
$
|
46,696
|
|
$
|
53,055
|
|
$
|
59,737
|
|
||
|
Average loans owned:
|
|||||||||||
|
Home equity
|
$
|
18,030
|
|
$
|
19,950
|
|
$
|
21,840
|
|
||
|
Prime mortgage
|
11,257
|
|
12,909
|
|
14,400
|
|
|||||
|
Subprime mortgage
|
3,921
|
|
4,416
|
|
4,777
|
|
|||||
|
Option ARMs
|
16,794
|
|
19,236
|
|
21,545
|
|
|||||
|
Total average loans owned
|
$
|
50,002
|
|
$
|
56,511
|
|
$
|
62,562
|
|
||
|
Total Real Estate Portfolios
|
|||||||||||
|
Period-end loans owned:
|
|||||||||||
|
Home equity
|
$
|
67,994
|
|
$
|
76,790
|
|
$
|
88,356
|
|
||
|
Prime mortgage, including option ARMs
|
92,471
|
|
79,416
|
|
75,456
|
|
|||||
|
Subprime mortgage
|
8,756
|
|
11,279
|
|
12,881
|
|
|||||
|
Other
|
477
|
|
551
|
|
633
|
|
|||||
|
Total period-end loans owned
|
$
|
169,698
|
|
$
|
168,036
|
|
$
|
177,326
|
|
||
|
Average loans owned:
|
|||||||||||
|
Home equity
|
$
|
72,440
|
|
$
|
82,319
|
|
$
|
94,514
|
|
||
|
Prime mortgage, including option ARMs
|
84,155
|
|
77,133
|
|
78,256
|
|
|||||
|
Subprime mortgage
|
10,178
|
|
12,103
|
|
13,724
|
|
|||||
|
Other
|
511
|
|
588
|
|
675
|
|
|||||
|
Total average loans owned
|
$
|
167,284
|
|
$
|
172,143
|
|
$
|
187,169
|
|
||
|
Average assets
|
$
|
164,387
|
|
$
|
163,898
|
|
$
|
175,712
|
|
||
|
Home equity origination volume
|
3,102
|
|
2,124
|
|
1,420
|
|
|||||
|
JPMorgan Chase & Co./2014 Annual Report
|
87
|
|
Management’s discussion and analysis
|
Credit data and quality statistics
|
|||||||||||
|
As of or for the year ended December 31,
(in millions, except ratios)
|
2014
|
2013
|
2012
|
||||||||
|
Net charge-offs/(recoveries), excluding PCI loans:
(a)(b)
|
|||||||||||
|
Home equity
|
$
|
473
|
|
$
|
966
|
|
$
|
2,385
|
|
||
|
Prime mortgage, including option ARMs
|
22
|
|
41
|
|
454
|
|
|||||
|
Subprime mortgage
|
(27
|
)
|
90
|
|
486
|
|
|||||
|
Other
|
9
|
|
10
|
|
16
|
|
|||||
|
Total net charge-offs/(recoveries), excluding PCI loans
|
$
|
477
|
|
$
|
1,107
|
|
$
|
3,341
|
|
||
|
Net charge-off/(recovery) rate, excluding PCI loans:
(b)
|
|||||||||||
|
Home equity
|
0.87
|
%
|
1.55
|
%
|
3.28
|
%
|
|||||
|
Prime mortgage, including option ARMs
|
0.04
|
|
0.09
|
|
1.07
|
|
|||||
|
Subprime mortgage
|
(0.43
|
)
|
1.17
|
|
5.43
|
|
|||||
|
Other
|
1.76
|
|
1.70
|
|
2.37
|
|
|||||
|
Total net charge-off/(recovery) rate, excluding PCI loans
|
0.41
|
|
0.96
|
|
2.68
|
|
|||||
|
Net charge-off/(recovery) rate – reported:
(a)(b)
|
|||||||||||
|
Home equity
|
0.65
|
%
|
1.17
|
%
|
2.52
|
%
|
|||||
|
Prime mortgage, including option ARMs
|
0.03
|
|
0.05
|
|
0.58
|
|
|||||
|
Subprime mortgage
|
(0.27
|
)
|
0.74
|
|
3.54
|
|
|||||
|
Other
|
1.76
|
|
1.70
|
|
2.37
|
|
|||||
|
Total net charge-off/(recovery) rate – reported
|
0.29
|
|
0.64
|
|
1.79
|
|
|||||
|
30+ day delinquency rate, excluding PCI loans
(c)
|
2.67
|
%
|
3.66
|
%
|
5.03
|
%
|
|||||
|
Allowance for loan losses, excluding PCI loans
|
$
|
2,168
|
|
$
|
2,568
|
|
$
|
4,868
|
|
||
|
Allowance for PCI loans
(a)
|
3,325
|
|
4,158
|
|
5,711
|
|
|||||
|
Allowance for loan losses
|
$
|
5,493
|
|
$
|
6,726
|
|
$
|
10,579
|
|
||
|
Nonperforming assets
(d)
|
5,786
|
|
6,919
|
|
8,439
|
|
|||||
|
Allowance for loan losses to period-end loans retained
|
3.24
|
%
|
4.00
|
%
|
5.97
|
%
|
|||||
|
Allowance for loan losses to period-end loans retained, excluding PCI loans
|
1.76
|
|
2.23
|
|
4.14
|
|
|||||
|
(a)
|
Net charge-offs and the net charge-off rates excluded
$533 million
and
$53 million
of write-offs in the PCI portfolio for the years ended December 31, 2014 and 2013, respectively. These write-offs decreased the allowance for loan losses for PCI loans. For further information on PCI write-offs, see Allowance for Credit Losses on
pages 128–130
.
|
|
(b)
|
Net charge-offs and net charge-off rates for the year ended December 31, 2012, included $744 million of charge-offs related to regulatory guidance. Excluding these charges-offs, net charge-offs for the year ended December 31, 2012, would have been $1.8 billion, $410 million and $416 million for the home equity, prime mortgage, including option ARMs, and subprime mortgage portfolios, respectively. Net charge-off rates for the same period, excluding these charge-offs and PCI loans, would have been 2.41%, 0.97% and 4.65% for the home equity, prime mortgage, including option ARMs, and subprime mortgage portfolios, respectively.
|
|
(c)
|
The 30+ day delinquency rate for PCI loans was 13.33% 15.31% and 20.14% at December 31, 2014, 2013 and 2012, respectively.
|
|
(d)
|
Excludes PCI loans. The Firm is recognizing interest income on each pool of PCI loans as they are all performing.
|
Mortgage servicing-related matters
The financial crisis resulted in unprecedented levels of delinquencies and defaults of 1-4 family residential real estate loans. Such loans required varying degrees of loss mitigation activities. Foreclosure is usually a last resort, and accordingly, the Firm has made, and continues to make, significant efforts to help borrowers remain in their homes.
The Firm has entered into various Consent Orders and settlements with federal and state governmental agencies and private parties related to mortgage servicing, origination, and residential mortgage-backed securities activities. The requirements of these Consent Orders and settlements vary, but in the aggregate, include cash compensatory payments (in addition to fines) and/or “borrower relief,” which may include principal reduction, refinancing, short sale assistance, and other specified types of borrower relief. Other obligations required under certain Consent Orders and settlements, as well as under new regulatory requirements, include enhanced mortgage servicing and foreclosure standards and processes. The Firm has satisfied or is committed to satisfying these obligations within the mandated timeframes.
The mortgage servicing Consent Orders and settlements are subject to ongoing oversight by the Mortgage Compliance Committee of the Firm’s Board of Directors. In addition, certain of the Consent Orders and settlements are the subject of ongoing reporting to various regulators and independent overseers.
The Firm’s compliance with the Global Settlement and the RMBS Settlement are detailed in periodic reports published by the independent overseers.
|
88
|
JPMorgan Chase & Co./2014 Annual Report
|
|
Card, Merchant Services & Auto
|
Selected income statement data
|
|||||||||||
|
As of or for the year
ended December 31,
(in millions, except ratios)
|
2014
|
2013
|
2012
|
||||||||
|
Revenue
|
|||||||||||
|
Card income
|
$
|
4,173
|
|
$
|
4,289
|
|
$
|
4,092
|
|
||
|
All other income
|
993
|
|
1,041
|
|
1,009
|
|
|||||
|
Noninterest revenue
|
5,166
|
|
5,330
|
|
5,101
|
|
|||||
|
Net interest income
|
13,150
|
|
13,559
|
|
13,820
|
|
|||||
|
Total net revenue
|
18,316
|
|
|
18,889
|
|
|
18,921
|
|
|||
|
Provision for credit losses
|
3,432
|
|
2,669
|
|
3,953
|
|
|||||
|
Noninterest expense
(a)
|
8,176
|
|
8,078
|
|
8,216
|
|
|||||
|
Income before income tax expense
|
6,708
|
|
8,142
|
|
6,752
|
|
|||||
|
Net income
|
$
|
4,074
|
|
|
$
|
4,907
|
|
|
$
|
4,099
|
|
|
Return on common equity
|
21
|
%
|
31
|
%
|
24
|
%
|
|||||
|
Overhead ratio
|
45
|
|
43
|
|
43
|
|
|||||
|
Equity (period-end and average)
|
$
|
19,000
|
|
$
|
15,500
|
|
$
|
16,500
|
|
||
|
(a)
|
Included operating lease depreciation expense of $1.2 billion, $972 million and $817 million for the years ended December 31, 2014, 2013 and 2012, respectively.
|
2014 compared with 2013
Card
net income was $4.1 billion, a decrease of $833 million, or 17%, compared with the prior year, predominantly driven by higher provision for credit losses and lower net revenue.
Net revenue was $18.3 billion, down $573 million or 3% compared with the prior year. Net interest income was $13.2 billion, a decrease of $409 million, or 3%, from the prior year primarily driven by spread compression in Credit Card and Auto, partially offset by higher average loan balances. Noninterest revenue was $5.2 billion, down $164 million, or 3%, from the prior year. The decrease was primarily driven by higher amortization of new account origination costs and the impact of non-core portfolio exits, largely offset by higher auto lease income and net interchange income from higher sales volume.
The provision for credit losses was $3.4 billion, compared with $2.7 billion in the prior year. The current-year provision reflected lower net charge-offs and a $554 million reduction in the allowance for loan losses. The reduction in the allowance for loan losses was primarily related to a decrease in the asset-specific allowance resulting from increased granularity of the impairment estimates and lower balances related to credit card loans modified in TDRs, runoff in the student loan portfolio, and lower estimated losses in auto loans. The prior-year provision included a $1.7 billion reduction in the allowance for loan losses.
Noninterest expense was $8.2 billion, up $98 million, or 1% from the prior year primarily driven by higher auto lease depreciation expense and higher investment in controls, predominantly offset by lower intangible amortization and lower remediation costs.
2013 compared with 2012
Card
net income was $4.9 billion, an increase of $808 million, or 20%, compared with the prior year, driven by lower provision for credit losses.
Net revenue was $18.9 billion, flat compared with the prior year. Net interest income was $13.6 billion, down $261 million, or 2%, from the prior year. The decrease was primarily driven by spread compression in Credit Card and Auto and lower average credit card loan balances, largely offset by the impact of lower revenue reversals associated with lower net charge-offs in Credit Card. Noninterest revenue was $5.3 billion, an increase of $229 million, or 4%, compared with the prior year primarily driven by higher net interchange income, auto lease income and merchant servicing revenue, largely offset by lower revenue from an exited non-core product and a gain on an investment security recognized in the prior year.
The provision for credit losses was $2.7 billion, compared with $4.0 billion in the prior year. The current-year provision reflected lower net charge-offs and a $1.7 billion reduction in the allowance for loan losses due to lower estimated losses reflecting improved delinquency trends and restructured loan performance. The prior-year provision included a $1.6 billion reduction in the allowance for loan losses. The Credit Card net charge-off rate was 3.14%, down from 3.95% in the prior year; and the 30+ day delinquency rate was 1.67%, down from 2.10% in the prior year. The Auto net charge-off rate was 0.31%, down from 0.39% in the prior year.
Noninterest expense was $8.1 billion, a decrease of $138 million, or 2%, from the prior year. This decrease was due to one-time expense items recognized in the prior year related to the exit of a non-core product and the write-off of intangible assets associated with a non-strategic relationship. The reduction in expenses was partially offset by increased auto lease depreciation and payments to customers required by a regulatory Consent Order during 2013.
|
JPMorgan Chase & Co./2014 Annual Report
|
89
|
|
Management’s discussion and analysis
|
Selected metrics
|
|||||||||||
|
As of or for the year
ended December 31,
(in millions, except ratios and where otherwise noted)
|
2014
|
2013
|
2012
|
||||||||
|
Selected balance sheet data (period-end)
|
|||||||||||
|
Loans:
|
|||||||||||
|
Credit Card
|
$
|
131,048
|
|
$
|
127,791
|
|
$
|
127,993
|
|
||
|
Auto
|
54,536
|
|
52,757
|
|
49,913
|
|
|||||
|
Student
|
9,351
|
|
10,541
|
|
11,558
|
|
|||||
|
Total loans
|
$
|
194,935
|
|
$
|
191,089
|
|
$
|
189,464
|
|
||
|
Selected balance sheet
data (average)
|
|||||||||||
|
Total assets
|
$
|
202,609
|
|
$
|
198,265
|
|
$
|
197,661
|
|
||
|
Loans:
|
|||||||||||
|
Credit Card
|
125,113
|
|
123,613
|
|
125,464
|
|
|||||
|
Auto
|
52,961
|
|
50,748
|
|
48,413
|
|
|||||
|
Student
|
9,987
|
|
11,049
|
|
12,507
|
|
|||||
|
Total loans
|
$
|
188,061
|
|
$
|
185,410
|
|
$
|
186,384
|
|
||
|
Business metrics
|
|||||||||||
|
Credit Card, excluding Commercial Card
|
|||||||||||
|
Sales volume (in billions)
|
$
|
465.6
|
|
$
|
419.5
|
|
$
|
381.1
|
|
||
|
New accounts opened
|
8.8
|
|
7.3
|
|
6.7
|
|
|||||
|
Open accounts
|
64.6
|
|
65.3
|
|
64.5
|
|
|||||
|
Accounts with sales activity
|
34.0
|
|
32.3
|
|
30.6
|
|
|||||
|
% of accounts acquired online
|
56
|
%
|
55
|
%
|
51
|
%
|
|||||
|
Merchant Services (Chase Paymentech Solutions)
|
|||||||||||
|
Merchant processing volume (in billions)
|
$
|
847.9
|
|
$
|
750.1
|
|
$
|
655.2
|
|
||
|
Total transactions
(in billions)
|
38.1
|
|
35.6
|
|
29.5
|
|
|||||
|
Auto
|
|||||||||||
|
Origination volume
(in billions)
|
27.5
|
|
26.1
|
|
23.4
|
|
|||||
|
The following are brief descriptions of selected business metrics within Card, Merchant Services & Auto.
|
|
Card Services
includes the Credit Card and Merchant Services businesses.
|
|
Merchant Services
processes transactions for merchants.
|
|
Total transactions
– Number of transactions and authorizations processed for merchants.
|
|
Commercial Card
provides a wide range of payment services to corporate and public sector clients worldwide through the commercial card products. Services include procurement, corporate travel and entertainment, expense management services, and business-to-business payment solutions.
|
|
Sales volume
– Dollar amount of cardmember purchases, net of returns.
|
|
Open accounts
– Cardmember accounts with charging privileges.
|
|
Auto origination volume
– Dollar amount of auto loans and leases originated.
|
|
Selected metrics
|
||||||||||||
|
As of or for the year
ended December 31,
(in millions, except ratios) |
2014
|
2013
|
2012
|
|||||||||
|
Credit data and quality statistics
|
||||||||||||
|
Net charge-offs:
|
||||||||||||
|
Credit Card
|
$
|
3,429
|
|
$
|
3,879
|
|
$
|
4,944
|
|
|||
|
Auto
(a)
|
181
|
|
158
|
|
188
|
|
||||||
|
Student
|
375
|
|
333
|
|
377
|
|
||||||
|
Total net charge-offs
|
$
|
3,985
|
|
$
|
4,370
|
|
$
|
5,509
|
|
|||
|
Net charge-off rate:
|
||||||||||||
|
Credit Card
(b)
|
2.75
|
%
|
3.14
|
%
|
3.95
|
%
|
||||||
|
Auto
(a)
|
0.34
|
|
0.31
|
|
0.39
|
|
||||||
|
Student
|
3.75
|
|
3.01
|
|
3.01
|
|
||||||
|
Total net charge-off rate
|
2.12
|
|
2.36
|
|
2.96
|
|
||||||
|
Delinquency rates
|
||||||||||||
|
30+ day delinquency rate:
|
||||||||||||
|
Credit Card
(c)
|
1.44
|
|
1.67
|
|
2.10
|
|
||||||
|
Auto
|
1.23
|
|
1.15
|
|
1.25
|
|
||||||
|
Student
(d)
|
2.35
|
|
2.56
|
|
2.13
|
|
||||||
|
Total 30+ day delinquency rate
|
1.42
|
|
1.58
|
|
1.87
|
|
||||||
|
90+ day delinquency rate – Credit Card
(c)
|
0.70
|
|
0.80
|
|
1.02
|
|
||||||
|
Nonperforming assets
(e)
|
$
|
411
|
|
$
|
280
|
|
$
|
265
|
|
|||
|
Allowance for loan losses:
|
||||||||||||
|
Credit Card
|
$
|
3,439
|
|
$
|
3,795
|
|
$
|
5,501
|
|
|||
|
Auto & Student
|
749
|
|
953
|
|
954
|
|
||||||
|
Total allowance for loan losses
|
$
|
4,188
|
|
$
|
4,748
|
|
$
|
6,455
|
|
|||
|
Allowance for loan losses to period-end loans:
|
||||||||||||
|
Credit Card
(c)
|
2.69
|
%
|
2.98
|
%
|
4.30
|
%
|
||||||
|
Auto & Student
|
1.17
|
|
1.51
|
|
1.55
|
|
||||||
|
Total allowance for loan losses to period-end loans
|
2.18
|
|
2.49
|
|
3.41
|
|
||||||
|
(a)
|
Net charge-offs and net charge-off rates for the year ended December 31, 2012, included $53 million of charge-offs of Chapter 7 loans. Excluding these incremental charge-offs, net charge-offs for the year ended December 31, 2012 would have been $135 million, and the net charge-off rate would have been 0.28%.
|
|
(b)
|
Average credit card loans included loans held-for-sale of $509 million, $95 million and $433 million for the years ended December 31, 2014, 2013 and 2012, respectively. These amounts are excluded when calculating the net charge-off rate.
|
|
(c)
|
Period-end credit card loans included loans held-for-sale of $3.0 billion and $326 million at December 31, 2014 and 2013, respectively. There were no loans held-for-sale at December 31, 2012. These amounts are excluded when calculating delinquency rates and the allowance for loan losses to period-end loans.
|
|
(d)
|
Excluded student loans insured by U.S. government agencies under the FFELP of $654 million, $737 million and $894 million at December 31, 2014, 2013 and 2012, respectively, that are 30 or more days past due. These amounts have been excluded based upon the government guarantee.
|
|
(e)
|
Nonperforming assets excluded student loans insured by U.S. government agencies under the FFELP of $367 million, $428 million and $525 million at December 31, 2014, 2013 and 2012, respectively, that are 90 or more days past due. These amounts have been excluded from nonaccrual loans based upon the government guarantee.
|
|
90
|
JPMorgan Chase & Co./2014 Annual Report
|
|
|
Card Services supplemental information
|
|||||||||||
|
Year ended December 31,
(in millions, except ratios)
|
2014
|
2013
|
2012
|
||||||||
|
Revenue
|
|||||||||||
|
Noninterest revenue
|
$
|
3,593
|
|
$
|
3,977
|
|
$
|
3,887
|
|
||
|
Net interest income
|
11,462
|
|
11,638
|
|
11,745
|
|
|||||
|
Total net revenue
|
15,055
|
|
15,615
|
|
15,632
|
|
|||||
|
Provision for credit losses
|
3,079
|
|
2,179
|
|
3,444
|
|
|||||
|
Noninterest expense
|
6,152
|
|
6,245
|
|
6,566
|
|
|||||
|
Income before income tax expense
|
5,824
|
|
7,191
|
|
5,622
|
|
|||||
|
Net income
|
$
|
3,547
|
|
$
|
4,340
|
|
$
|
3,426
|
|
||
|
Percentage of average loans:
|
|||||||||||
|
Noninterest revenue
|
2.87
|
%
|
3.22
|
%
|
3.10
|
%
|
|||||
|
Net interest income
|
9.16
|
|
9.41
|
|
9.36
|
|
|||||
|
Total net revenue
|
12.03
|
|
12.63
|
|
12.46
|
|
|||||
|
JPMorgan Chase & Co./2014 Annual Report
|
91
|
|
Management’s discussion and analysis
|
CORPORATE & INVESTMENT BANK
|
||||
|
The Corporate & Investment Bank, comprised of Banking and Markets & Investor Services, offers a broad suite of investment banking, market-making, prime brokerage, and treasury and securities products and services to a global client base of corporations, investors, financial institutions, government and municipal entities. Within Banking, the CIB offers a full range of investment banking products and services in all major capital markets, including advising on corporate strategy and structure, capital-raising in equity and debt markets, as well as loan origination and syndication. Also included in Banking is Treasury Services, which includes transaction services, comprised primarily of cash management and liquidity solutions, and trade finance products. The Markets & Investor Services segment of the CIB is a global market-maker in cash securities and derivative instruments, and also offers sophisticated risk management solutions, prime brokerage, and research. Markets & Investor Services also includes the Securities Services business, a leading global custodian which includes custody, fund accounting and administration, and securities lending products sold principally to asset managers, insurance companies and public and private investment funds.
|
|
Selected income statement data
|
|||||||||||
|
Year ended December 31,
|
|||||||||||
|
(in millions)
|
2014
|
2013
|
2012
|
||||||||
|
Revenue
|
|||||||||||
|
Investment banking fees
|
$
|
6,570
|
|
$
|
6,331
|
|
$
|
5,769
|
|
||
|
Principal transactions
(a)
|
8,947
|
|
9,289
|
|
9,510
|
|
|||||
|
Lending- and deposit-related fees
|
1,742
|
|
1,884
|
|
1,948
|
|
|||||
|
Asset management, administration and commissions
|
4,687
|
|
4,713
|
|
4,693
|
|
|||||
|
All other income
|
1,512
|
|
1,593
|
|
1,184
|
|
|||||
|
Noninterest revenue
|
23,458
|
|
23,810
|
|
23,104
|
|
|||||
|
Net interest income
|
11,175
|
|
10,976
|
|
11,658
|
|
|||||
|
Total net revenue
(b)
|
34,633
|
|
34,786
|
|
34,762
|
|
|||||
|
Provision for credit losses
|
(161
|
)
|
(232
|
)
|
(479
|
)
|
|||||
|
Noninterest expense
|
|||||||||||
|
Compensation expense
|
10,449
|
|
10,835
|
|
11,313
|
|
|||||
|
Noncompensation expense
|
12,824
|
|
10,909
|
|
10,537
|
|
|||||
|
Total noninterest expense
|
23,273
|
|
21,744
|
|
21,850
|
|
|||||
|
Income before income tax expense
|
11,521
|
|
13,274
|
|
13,391
|
|
|||||
|
Income tax expense
|
4,596
|
|
4,387
|
|
4,719
|
|
|||||
|
Net income
|
$
|
6,925
|
|
$
|
8,887
|
|
$
|
8,672
|
|
||
Note: As discussed on
pages 79–80
, effective with the fourth quarter of 2014 the Firm changed its methodology for allocating the cost of preferred stock to its reportable business segments. Prior periods have been revised to conform with the current period presentation.
|
(a)
|
Included FVA (effective 2013) and DVA on OTC derivatives and structured notes, measured at fair value. FVA and DVA gains/(losses) were $468 million and $(1.9) billion for the years ended
December 31, 2014
and 2013, respectively. DVA losses were ($930) million for the year ended December 31, 2012.
|
|
(b)
|
Included tax-equivalent adjustments, predominantly due to income tax credits related to affordable housing and alternative energy investments, as well as tax-exempt income from municipal bond investments, of $2.5 billion, $2.3 billion and $2.0 billion for the years ended December 31, 2014, 2013 and 2012, respectively.
|
|
Selected income statement data
|
|||||||||||
|
Year ended December 31,
|
|||||||||||
|
(in millions, except ratios)
|
2014
|
2013
|
2012
|
||||||||
|
Financial ratios
|
|||||||||||
|
Return on common equity
(a)
|
10
|
%
|
15
|
%
|
18
|
%
|
|||||
|
Overhead ratio
(b)
|
67
|
|
63
|
|
63
|
|
|||||
|
Compensation expense as
percentage of total net
revenue
(c)
|
30
|
|
31
|
|
33
|
|
|||||
|
Revenue by business
|
|||||||||||
|
Advisory
|
$
|
1,627
|
|
$
|
1,315
|
|
$
|
1,491
|
|
||
|
Equity underwriting
|
1,571
|
|
1,499
|
|
1,026
|
|
|||||
|
Debt underwriting
|
3,372
|
|
3,517
|
|
3,252
|
|
|||||
|
Total investment banking fees
|
6,570
|
|
6,331
|
|
5,769
|
|
|||||
|
Treasury Services
|
4,145
|
|
4,171
|
|
4,249
|
|
|||||
|
Lending
|
1,130
|
|
1,669
|
|
1,389
|
|
|||||
|
Total Banking
|
11,845
|
|
12,171
|
|
11,407
|
|
|||||
|
Fixed Income Markets
(d)
|
13,848
|
|
15,832
|
|
15,701
|
|
|||||
|
Equity Markets
|
4,861
|
|
4,803
|
|
4,448
|
|
|||||
|
Securities Services
|
4,351
|
|
4,100
|
|
4,000
|
|
|||||
|
Credit Adjustments & Other
(e)
|
(272
|
)
|
(2,120
|
)
|
(794
|
)
|
|||||
|
Total Markets & Investor Services
|
22,788
|
|
22,615
|
|
23,355
|
|
|||||
|
Total net revenue
|
$
|
34,633
|
|
$
|
34,786
|
|
$
|
34,762
|
|
||
|
(a)
|
Return on equity excluding FVA (effective 2013) and DVA, a non-GAAP financial measure, was 17% and 19% for the years ended December 31, 2013 and 2012, respectively.
|
|
(b)
|
Overhead ratio excluding FVA (effective 2013) and DVA, a non-GAAP financial measure, was 59% and 61% for the years ended December 31, 2013 and 2012, respectively.
|
|
(c)
|
Compensation expense as a percentage of total net revenue excluding FVA (effective 2013) and DVA, a non-GAAP financial measure, was 30% and 32% for the years ended December 31, 2013 and 2012, respectively.
|
|
(d)
|
Includes results of the synthetic credit portfolio that was transferred from the CIO effective July 2, 2012.
|
|
(e)
|
Consists primarily of credit valuation adjustments (“CVA”) managed by the credit portfolio group, and FVA (effective 2013) and DVA on OTC derivatives and structured notes. Results are presented net of associated hedging activities and net of CVA and FVA amounts allocated to Fixed Income Markets and Equity Markets.
|
Prior to January 1, 2014, CIB provided several non-GAAP financial measures excluding the impact of implementing the FVA framework (effective 2013) and DVA on: net revenue, net income, compensation ratio, overhead ratio, and return on equity. Beginning in the first quarter 2014, the Firm did not exclude FVA and DVA from its assessment of business performance; however, the Firm continues to present these non-GAAP measures for the periods prior to January 1, 2014, as they reflected how management assessed the underlying business performance of the CIB in those prior periods. In addition, the ratio for the allowance for loan losses to end-of-period loans, also a non-GAAP financial measure, is
|
92
|
JPMorgan Chase & Co./2014 Annual Report
|
|
calculated excluding the impact of consolidated Firm-administered multi-seller conduits and trade finance, to provide a more meaningful assessment of CIB’s allowance coverage ratio. These measures are used by management to assess the underlying performance of the business and for comparability with peers.
2014 compared with 2013
Net income was $6.9 billion, down 22% compared with $8.9 billion in the prior year. These results primarily reflected lower revenue as well as higher noninterest expense. Net revenue was $34.6 billion, flat compared with the prior year.
Banking revenue was $11.8 billion, down 3% from the prior year. Investment banking fees were $6.6 billion, up 4% from the prior year. The increase was driven by higher advisory and equity underwriting fees, partially offset by lower debt underwriting fees. Advisory fees were $1.6 billion up 24% on stronger share of fees for completed transactions as well as growth in the industry-wide fee levels, according to Dealogic. Equity underwriting fees were $1.6 billion up 5%, driven by higher industry wide issuance. Debt underwriting fees were $3.4 billion, down 4%, primarily related to lower loan syndication fees on lower industry-wide fee levels and lower bond underwriting fees. The Firm also ranked #1 globally in fees and volumes share across high grade, high yield and loan products. The Firm maintained its #2 ranking for M&A, and improved share of fees both globally and in the U.S. compared to the prior year. Treasury Services revenue was $4.1 billion, down 1% compared with the prior year, primarily driven by lower trade finance revenue as well as the impact of business simplification initiatives, largely offset by higher net interest income from increased deposits. Lending revenue was $1.1 billion, down from $1.7 billion in the prior year, driven by losses, compared with gains in the prior periods, on securities received from restructured loans, as well as lower net interest income.
Markets & Investor Services revenue was $22.8 billion, up 1% from the prior year. Fixed Income Markets revenue was $13.8 billion down 13% from the prior year driven by lower revenues in Fixed Income primarily from credit-related and rates products as well as the impact of business simplification. Equity Markets revenue was $4.9 billion up 1% as higher prime services revenue was partially offset by lower equity derivatives revenue. Securities Services revenue was $4.4 billion, up 6% from the prior year, primarily driven by higher net interest income on increased deposits and higher fees and commissions. Credit Adjustments & Other revenue was a loss of $272 million driven by net CVA losses partially offset by gains, net of hedges, related to FVA/DVA. The prior year was a loss of $2.1 billion (including the FVA implementation loss of $1.5 billion and DVA losses of $452 million).
Noninterest expense was $23.3 billion, up 7% compared to the prior year as a result of higher legal expense and investment in controls. This was partially offset by lower performance-based compensation expense as well as the impact of business simplification, including the sale or liquidation of a significant part of the physical commodities
business. The compensation expense to net revenue ratio was 30%.
Return on equity was 10% on $61.0 billion of average allocated capital.
2013 compared with 2012
Net income was $8.9 billion, up 2% compared with the prior year.
Net revenue was $34.8 billion, flat compared with the prior year. Net revenue in 2013 included a $1.5 billion loss as a result of implementing a FVA framework for OTC derivatives and structured notes. The FVA framework incorporates the impact of funding into the Firm’s valuation estimates for OTC derivatives and structured notes and reflects an industry migration towards incorporating the market cost of unsecured funding in the valuation of such instruments. The loss recorded in 2013 was a one-time adjustment arising on implementation of the new FVA framework.
Net revenue in 2013 also included a $452 million loss from DVA on structured notes and derivative liabilities, compared with a loss of $930 million in the prior year. Excluding the impact of FVA and DVA, net revenue was $36.7 billion and net income was $10.1 billion, compared with $35.7 billion and $9.2 billion, respectively in the prior year.
Banking revenue was $12.2 billion, compared with $11.4 billion in the prior year. Investment banking fees were $6.3 billion, up 10% from the prior year, driven by higher equity underwriting fees of $1.5 billion (up 46%) and record debt underwriting fees of $3.5 billion (up 8%), partially offset by lower advisory fees of $1.3 billion (down 12%). Equity underwriting results were driven by higher industry-wide issuance and an increase in share of fees compared with the prior year, according to Dealogic. Industry-wide loan syndication volumes and fees increased as the low-rate environment continued to fuel refinancing activity. The Firm also ranked #1 in industry-wide fee shares across high grade, high yield and loan products. Advisory fees were lower compared with the prior year as industry-wide completed M&A industry-wide fee levels declined 13%. The Firm maintained its #2 ranking and improved share for both announced and completed volumes during the year.
Treasury Services revenue was $4.2 billion, down 2% compared with the prior year, primarily reflecting lower trade finance spreads, partially offset by higher net interest income on higher deposit balances. Lending revenue was $1.7 billion, up from $1.4 billion, in the prior year reflecting net interest income on retained loans, fees on lending-related commitments, and gains on securities received from restructured loans.
Markets and Investor Services revenue was $22.6 billion compared to $23.4 billion in the prior year. Combined Fixed Income and Equity Markets revenue was $20.6 billion, up from $20.1 billion the prior year. Fixed Income Markets revenue was $15.8 billion slightly higher reflecting consistently strong client revenue and lower losses from the synthetic credit portfolio, which was partially offset by lower rates-related revenue given an uncertain rate outlook and low spread environment. Equities Markets revenue was
|
JPMorgan Chase & Co./2014 Annual Report
|
93
|
|
Management’s discussion and analysis
$4.8 billion up 8% compared with the prior year driven by higher revenue in derivatives and cash equities products and Prime Services primarily on higher balances. Securities Services revenue was $4.1 billion compared with $4.0 billion in the prior year on higher custody and fund services revenue primarily driven by higher assets under custody of $20.5 trillion. Credit Adjustments & Other was a loss of $2.1 billion predominantly driven by FVA (effective 2013) and DVA.
The provision for credit losses was a benefit of $232 million, compared with a benefit of $479 million in the prior year. The 2013 benefit reflected lower recoveries as compared with 2012 as the prior year benefited from the restructuring of certain nonperforming loans. Net recoveries were $78 million, compared with $284 million in the prior year reflecting a continued favorable credit environment with stable credit quality trends. Nonperforming loans were down 57% from the prior year.
Noninterest expense was $21.7 billion slightly down compared with the prior year, driven by lower compensation expense, offset by higher noncompensation expense related to higher litigation expense as compared with the prior year. The compensation ratio, excluding the impact of DVA and FVA (effective 2013), was 30% and 32% for 2013 and 2012, respectively.
Return on equity was 15% on $56.5 billion of average allocated capital and 17% excluding FVA (effective 2013) and DVA.
|
Selected metrics
|
|||||||||||
|
As of or for the year ended
December 31,
(in millions, except headcount)
|
|||||||||||
|
2014
|
2013
|
2012
|
|||||||||
|
Selected balance sheet data (period-end)
|
|||||||||||
|
Assets
|
$
|
861,819
|
|
$
|
843,577
|
|
$
|
876,107
|
|
||
|
Loans:
|
|||||||||||
|
Loans retained
(a)
|
96,409
|
|
95,627
|
|
109,501
|
|
|||||
|
Loans held-for-sale and loans at fair value
|
5,567
|
|
11,913
|
|
5,749
|
|
|||||
|
Total loans
|
101,976
|
|
107,540
|
|
115,250
|
|
|||||
|
Equity
|
61,000
|
|
56,500
|
|
47,500
|
|
|||||
|
Selected balance sheet data (average)
|
|||||||||||
|
Assets
|
$
|
854,712
|
|
$
|
859,071
|
|
$
|
854,670
|
|
||
|
Trading assets-debt and equity instruments
|
317,535
|
|
321,585
|
|
312,944
|
|
|||||
|
Trading assets-derivative receivables
|
64,833
|
|
70,353
|
|
74,874
|
|
|||||
|
Loans:
|
|||||||||||
|
Loans retained
(a)
|
95,764
|
|
104,864
|
|
110,100
|
|
|||||
|
Loans held-for-sale and loans at fair value
|
7,599
|
|
5,158
|
|
3,502
|
|
|||||
|
Total loans
|
103,363
|
|
110,022
|
|
113,602
|
|
|||||
|
Equity
|
61,000
|
|
56,500
|
|
47,500
|
|
|||||
|
Headcount
|
51,129
|
|
52,250
|
|
52,022
|
|
|||||
|
(a)
|
Loans retained includes credit portfolio loans, trade finance loans, other held-for-investment loans and overdrafts.
|
|
Selected metrics
|
|||||||||||
|
As of or for the year ended
December 31,
(in millions, except ratios and where otherwise noted)
|
|||||||||||
|
2014
|
2013
|
2012
|
|||||||||
|
Credit data and quality statistics
|
|||||||||||
|
Net charge-offs/(recoveries)
|
$
|
(12
|
)
|
$
|
(78
|
)
|
$
|
(284
|
)
|
||
|
Nonperforming assets:
|
|||||||||||
|
Nonaccrual loans:
|
|||||||||||
|
Nonaccrual loans retained
(a)(b)
|
110
|
|
163
|
|
535
|
|
|||||
|
Nonaccrual loans
held-for-sale and loans at fair value
|
11
|
|
180
|
|
254
|
|
|||||
|
Total nonaccrual loans
|
121
|
|
343
|
|
789
|
|
|||||
|
Derivative receivables
|
275
|
|
415
|
|
239
|
|
|||||
|
Assets acquired in loan satisfactions
|
67
|
|
80
|
|
64
|
|
|||||
|
Total nonperforming assets
|
463
|
|
838
|
|
1,092
|
|
|||||
|
Allowance for credit losses:
|
|||||||||||
|
Allowance for loan losses
|
1,034
|
|
1,096
|
|
1,300
|
|
|||||
|
Allowance for lending-related commitments
|
439
|
|
525
|
|
473
|
|
|||||
|
Total allowance for credit losses
|
1,473
|
|
1,621
|
|
1,773
|
|
|||||
|
Net charge-off/(recovery) rate
(a)
|
(0.01
|
)%
|
(0.07
|
)%
|
(0.26
|
)%
|
|||||
|
Allowance for loan losses to period-end loans
retained
(a)
|
1.07
|
|
1.15
|
|
1.19
|
|
|||||
|
Allowance for loan losses to period-end loans retained, excluding trade finance and conduits
|
1.82
|
|
2.02
|
|
2.52
|
|
|||||
|
Allowance for loan losses to nonaccrual loans
retained
(a)(b)
|
940
|
|
672
|
|
243
|
|
|||||
|
Nonaccrual loans to total period-end loans
|
0.12
|
|
0.32
|
|
0.68
|
|
|||||
|
(a)
|
Loans retained includes credit portfolio loans, trade finance loans, other held-for-investment loans and overdrafts.
|
|
(b)
|
Allowance for loan losses of $18 million, $51 million and $153 million were held against these nonaccrual loans at December 31, 2014, 2013 and 2012, respectively.
|
|
94
|
JPMorgan Chase & Co./2014 Annual Report
|
|
|
Business metrics
|
|||||||||||
|
As of or for the year ended
December 31,
(in millions, except ratios and where otherwise noted)
|
|||||||||||
|
2014
|
2013
|
2012
|
|||||||||
|
Market risk-related revenue – trading loss days
(a)
|
9
|
|
0
|
|
7
|
|
|||||
|
Assets under custody (“AUC”) by asset class (period-end) in billions:
|
|||||||||||
|
Fixed Income
|
$
|
12,328
|
|
$
|
11,903
|
|
$
|
11,745
|
|
||
|
Equity
|
6,524
|
|
6,913
|
|
5,637
|
|
|||||
|
Other
(b)
|
1,697
|
|
1,669
|
|
1,453
|
|
|||||
|
Total AUC
|
$
|
20,549
|
|
$
|
20,485
|
|
$
|
18,835
|
|
||
|
Client deposits and other third party liabilities (average)
(c)
|
$
|
417,369
|
|
$
|
383,667
|
|
$
|
355,766
|
|
||
|
Trade finance loans (period-end)
|
25,713
|
|
30,752
|
|
35,783
|
|
|||||
|
(a)
|
Market risk-related revenue is defined as the change in value of: principal transactions revenue; trading-related net interest income; brokerage commissions, underwriting fees or other revenue; and revenue from syndicated lending facilities that the Firm intends to distribute; gains and losses from DVA and FVA are excluded. Market risk-related revenue – trading loss days represent the number of days for which the CIB posted losses under this measure. The loss days determined under this measure differ from the loss days that are determined based on the disclosure of market risk-related gains and losses for the Firm in the VaR back-testing discussion on pages 134–135.
|
|
(b)
|
Consists of mutual funds, unit investment trusts, currencies, annuities, insurance contracts, options and other contracts.
|
|
(c)
|
Client deposits and other third party liabilities pertain to the Treasury Services and Securities Services businesses, and include deposits, as well as deposits that are swept to on-balance sheet liabilities (e.g., commercial paper, federal funds purchased and securities loaned or sold under repurchase agreements) as part of their client cash management program.
|
|
League table results – IB Fee Share
(a)
|
League table results – volumes
(e)
|
|||||||||||||||||||
|
2014
|
2013
|
2012
|
2014
|
2013
|
2012
|
|||||||||||||||
|
Year ended
December 31, |
Fee Share
|
Rankings
|
Fee Share
|
Rankings
|
Fee Share
|
Rankings
|
Year ended
December 31,
|
Market Share
|
Rankings
|
Market Share
|
Rankings
|
Market Share
|
Rankings
|
|||||||
|
Debt, equity and equity-related
|
Debt, equity and equity-related
|
|||||||||||||||||||
|
Global
|
7.6%
|
#1
|
8.3%
|
#1
|
7.8%
|
#1
|
Global
|
6.8%
|
#1
|
7.3%
|
#1
|
7.2%
|
#1
|
|||||||
|
U.S.
|
10.7
|
1
|
11.5
|
1
|
11.1
|
1
|
U.S.
|
11.8
|
1
|
12.0
|
1
|
11.5
|
1
|
|||||||
|
Long-term debt
(b)
|
Long-term debt
(b)
|
|||||||||||||||||||
|
Global
|
8.0
|
1
|
8.2
|
1
|
8.3
|
1
|
Global
|
6.7
|
1
|
7.2
|
1
|
7.1
|
1
|
|||||||
|
U.S.
|
11.6
|
1
|
11.6
|
1
|
11.7
|
1
|
U.S.
|
11.3
|
1
|
11.7
|
1
|
11.6
|
1
|
|||||||
|
Equity and equity-related
|
Equity and equity-related
|
|||||||||||||||||||
|
Global
(c)
|
7.1
|
3
|
8.4
|
2
|
7.1
|
1
|
Global
(c)
|
7.6
|
3
|
8.2
|
2
|
7.8
|
4
|
|||||||
|
U.S.
|
9.6
|
2
|
11.3
|
2
|
10.1
|
2
|
U.S.
|
11.0
|
2
|
12.1
|
2
|
10.4
|
5
|
|||||||
|
M&A
(d)
|
M&A announced
(d)
|
|||||||||||||||||||
|
Global
|
8.2
|
2
|
7.6
|
2
|
6.5
|
2
|
Global
|
21.6
|
2
|
23.5
|
2
|
20.0
|
2
|
|||||||
|
U.S.
|
10.0
|
2
|
8.8
|
2
|
7.7
|
2
|
U.S.
|
27.8
|
2
|
36.4
|
2
|
24.3
|
2
|
|||||||
|
Loan syndications
|
Loan syndications
|
|||||||||||||||||||
|
Global
|
9.5
|
1
|
9.9
|
1
|
8.2
|
2
|
Global
|
12.4
|
1
|
11.6
|
1
|
11.6
|
1
|
|||||||
|
U.S.
|
13.3
|
1
|
13.8
|
1
|
11.2
|
2
|
U.S.
|
19.4
|
1
|
17.8
|
1
|
18.2
|
1
|
|||||||
|
Global Investment Banking fees
|
8.1%
|
#1
|
8.5%
|
#1
|
7.5%
|
#1
|
||||||||||||||
|
(a) Source: Dealogic. Reflects the ranking and share of Global Investment Banking fees
(b) Long-term debt rankings include investment-grade, high-yield, supranationals, sovereigns, agencies, covered bonds, asset-backed securities (“ABS”) and mortgage-backed
securities; and exclude money market, short-term debt, and U.S. municipal securities.
(c) Global equity and equity-related rankings include rights offerings and Chinese A-Shares.
(d) M&A and Announced M&A rankings reflect the removal of any withdrawn transactions. U.S. M&A revenue wallet represents wallet from client parents based in the U.S. U.S.
announced M&A volumes represents any U.S. involvement ranking.
(e) Source: Dealogic. Reflects transaction volume and market share. Global announced M&A is based on transaction value at announcement; because of joint M&A
assignments, M&A market share of all participants will add up to more than 100%. All other transaction volume-based rankings are based on proceeds, with full credit to
each book manager/equal if joint.
|
||||||||||||||||||||
|
JPMorgan Chase & Co./2014 Annual Report
|
95
|
|
Management’s discussion and analysis
|
International metrics
|
|||||||||||
|
Year ended December 31,
|
|||||||||||
|
(in millions)
|
2014
|
2013
|
2012
|
||||||||
|
Total net revenue
(a)
|
|||||||||||
|
Europe/Middle East/Africa
|
$
|
11,598
|
|
$
|
10,689
|
|
$
|
10,787
|
|
||
|
Asia/Pacific
|
4,698
|
|
4,736
|
|
4,128
|
|
|||||
|
Latin America/Caribbean
|
1,179
|
|
1,340
|
|
1,533
|
|
|||||
|
Total international net revenue
|
17,475
|
|
16,765
|
|
16,448
|
|
|||||
|
North America
|
17,158
|
|
18,021
|
|
18,314
|
|
|||||
|
Total net revenue
|
$
|
34,633
|
|
$
|
34,786
|
|
$
|
34,762
|
|
||
|
Loans (period-end)
(a)
|
|||||||||||
|
Europe/Middle East/Africa
|
$
|
27,155
|
|
$
|
29,392
|
|
$
|
30,266
|
|
||
|
Asia/Pacific
|
19,992
|
|
22,151
|
|
27,193
|
|
|||||
|
Latin America/Caribbean
|
8,950
|
|
8,362
|
|
10,220
|
|
|||||
|
Total international loans
|
56,097
|
|
59,905
|
|
67,679
|
|
|||||
|
North America
|
40,312
|
|
35,722
|
|
41,822
|
|
|||||
|
Total loans
|
$
|
96,409
|
|
$
|
95,627
|
|
$
|
109,501
|
|
||
|
Client deposits and other third-party liabilities (average)
(a)
|
|||||||||||
|
Europe/Middle East/Africa
|
$
|
152,712
|
|
$
|
143,807
|
|
$
|
127,326
|
|
||
|
Asia/Pacific
|
66,933
|
|
54,428
|
|
51,180
|
|
|||||
|
Latin America/Caribbean
|
22,360
|
|
15,301
|
|
11,052
|
|
|||||
|
Total international
|
$
|
242,005
|
|
$
|
213,536
|
|
$
|
189,558
|
|
||
|
North America
|
175,364
|
|
170,131
|
|
166,208
|
|
|||||
|
Total client deposits and other third-party liabilities
|
$
|
417,369
|
|
$
|
383,667
|
|
$
|
355,766
|
|
||
|
AUC (period-end) (in billions)
(a)
|
|||||||||||
|
North America
|
$
|
11,987
|
|
$
|
11,299
|
|
$
|
10,504
|
|
||
|
All other regions
|
8,562
|
|
9,186
|
|
8,331
|
|
|||||
|
Total AUC
|
$
|
20,549
|
|
$
|
20,485
|
|
$
|
18,835
|
|
||
|
(a)
|
Total net revenue is based predominantly on the domicile of the client or location of the trading desk, as applicable. Loans outstanding (excluding loans held-for-sale and loans at fair value), client deposits and other third-party liabilities, and AUC are based predominantly on the domicile of the client.
|
|
96
|
JPMorgan Chase & Co./2014 Annual Report
|
|
|
COMMERCIAL BANKING
|
||||
|
Commercial Banking delivers extensive industry knowledge, local
expertise and dedicated service to U.S. and U.S. multinational clients, including corporations, municipalities, financial institutions and nonprofit entities with annual revenue generally ranging from $20 million to $2 billion. CB provides financing to real estate investors and owners. Partnering with the Firm’s other businesses, CB provides comprehensive financial solutions, including lending, treasury services, investment banking and asset management to meet its clients’ domestic and international financial needs.
|
|
Selected income statement data
|
|||||||||||
|
Year ended December 31,
(in millions, except ratios)
|
2014
|
2013
|
2012
|
||||||||
|
Revenue
|
|||||||||||
|
Lending- and deposit-related fees
|
$
|
978
|
|
$
|
1,033
|
|
$
|
1,072
|
|
||
|
Asset management, administration and commissions
|
92
|
|
116
|
|
130
|
|
|||||
|
All other income
(a)
|
1,279
|
|
1,149
|
|
1,081
|
|
|||||
|
Noninterest revenue
|
2,349
|
|
2,298
|
|
2,283
|
|
|||||
|
Net interest income
|
4,533
|
|
4,794
|
|
4,629
|
|
|||||
|
Total net revenue
(b)
|
6,882
|
|
7,092
|
|
6,912
|
|
|||||
|
Provision for credit losses
|
(189
|
)
|
85
|
|
41
|
|
|||||
|
Noninterest expense
|
|||||||||||
|
Compensation expense
|
1,203
|
|
1,115
|
|
1,014
|
|
|||||
|
Noncompensation expense
|
1,492
|
|
1,495
|
|
1,375
|
|
|||||
|
Total noninterest expense
|
2,695
|
|
2,610
|
|
2,389
|
|
|||||
|
Income before income tax expense
|
4,376
|
|
4,397
|
|
4,482
|
|
|||||
|
Income tax expense
|
1,741
|
|
1,749
|
|
1,783
|
|
|||||
|
Net income
|
$
|
2,635
|
|
$
|
2,648
|
|
$
|
2,699
|
|
||
|
Revenue by product
|
|||||||||||
|
Lending
|
$
|
3,576
|
|
$
|
3,945
|
|
$
|
3,762
|
|
||
|
Treasury services
|
2,448
|
|
2,429
|
|
2,428
|
|
|||||
|
Investment banking
|
684
|
|
575
|
|
545
|
|
|||||
|
Other
|
174
|
|
143
|
|
177
|
|
|||||
|
Total Commercial Banking net revenue
|
$
|
6,882
|
|
$
|
7,092
|
|
$
|
6,912
|
|
||
|
Investment banking revenue, gross
|
$
|
1,986
|
|
$
|
1,676
|
|
$
|
1,597
|
|
||
|
Revenue by client segment
|
|||||||||||
|
Middle Market Banking
|
$
|
2,838
|
|
$
|
3,075
|
|
$
|
3,010
|
|
||
|
Corporate Client Banking
|
1,935
|
|
1,851
|
|
1,843
|
|
|||||
|
Commercial Term Lending
|
1,252
|
|
1,239
|
|
1,206
|
|
|||||
|
Real Estate Banking
|
495
|
|
561
|
|
450
|
|
|||||
|
Other
|
362
|
|
366
|
|
403
|
|
|||||
|
Total Commercial Banking net revenue
|
$
|
6,882
|
|
$
|
7,092
|
|
$
|
6,912
|
|
||
|
Financial ratios
|
|||||||||||
|
Return on common equity
|
18
|
%
|
19
|
%
|
28
|
%
|
|||||
|
Overhead ratio
|
39
|
|
37
|
|
35
|
|
|||||
Note: As discussed on
pages 79–80
, effective with the fourth quarter of 2014 the Firm changed its methodology for allocating the cost of preferred stock to its reportable business segments. Prior periods have been revised to conform with the current period presentation.
|
(a)
|
Includes revenue from investment banking products and commercial card transactions.
|
|
(b)
|
Total net revenue included tax-equivalent adjustments from income tax credits related to equity investments in designated community development entities that provide loans to qualified businesses in low-income communities, as well as tax-exempt income from municipal bond activity of $462 million, $407 million and $381 million for the years ended
December 31, 2014
,
2013
and
2012
, respectively.
|
2014
compared with
2013
Net income was $2.6 billion, flat compared with the prior year, reflecting lower net revenue and higher noninterest expense, predominantly offset by a lower provision for credit losses.
Net revenue was $6.9 billion, a decrease of $210 million, or 3%, compared with the prior year. Net interest income was $4.5 billion, a decrease of $261 million, or 5%, reflecting yield compression, the absence of proceeds received in the prior year from a lending-related workout, and lower purchase discounts recognized on loan repayments, partially offset by higher loan balances. Noninterest revenue was $2.3 billion, up $51 million, or 2%, reflecting higher investment banking revenue largely offset by business simplification and lower lending fees.
Noninterest expense was $2.7 billion, an increase of $85 million, or 3%, from the prior year, largely reflecting higher investments in controls.
2013
compared with
2012
Net income was $2.6 billion, a decrease of $51 million, or 2%, from the prior year, driven by an increase in noninterest expense and the provision for credit losses, partially offset by an increase in net revenue.
Net revenue was a record $7.1 billion, an increase of $180 million, or 3%, from the prior year. Net interest income was $4.8 billion, up by $165 million, or 4%, driven by higher loan balances and proceeds from a lending-related workout, partially offset by lower purchase discounts recognized on loan repayments. Noninterest revenue was $2.3 billion, flat compared with the prior year.
Noninterest expense was $2.6 billion, an increase of $221 million, or 9%, from the prior year, reflecting higher product- and headcount-related expense.
|
JPMorgan Chase & Co./2014 Annual Report
|
97
|
|
Management’s discussion and analysis
|
CB revenue comprises the following:
|
||||
|
Lending
includes a variety of financing alternatives, which are predominantly secured by receivables, inventory, equipment, real estate or other assets. Products include term loans, revolving lines of credit, bridge financing, asset-based structures, leases, commercial card products and standby letters of credit.
|
||||
|
Treasury services
includes revenue from a broad range of products and services that enable CB clients to manage payments and receipts, as well as invest and manage funds.
|
||||
|
Investment banking
includes revenue from a range of products that provide CB clients with sophisticated capital-raising alternatives, as well as balance sheet and risk management tools through advisory, equity underwriting, and loan syndications. Revenue from Fixed income and Equity market products used by CB clients is also included. Investment banking revenue, gross, represents total revenue related to investment banking products sold to
CB clients.
|
||||
|
Other
product revenue primarily includes tax-equivalent adjustments generated from Community Development Banking activities and certain income derived from principal transactions.
|
||||
|
CB is divided into four primary client segments: Middle Market Banking, Corporate Client Banking, Commercial Term Lending, and Real Estate Banking.
|
||||
|
Middle Market Banking
covers corporate, municipal and nonprofit clients, with annual revenue generally ranging between $20 million and $500 million.
|
||||
|
Corporate Client Banking
covers clients with annual revenue generally ranging between $500 million and $2 billion and focuses on clients that have broader investment banking needs.
|
||||
|
Commercial Term Lending
primarily provides term financing to real estate investors/owners for multifamily properties as well as office, retail and industrial properties.
|
||||
|
Real Estate Banking
provides full-service banking to investors and developers of institutional-grade real estate investment properties.
|
||||
|
Other
primarily includes lending and investment activities within the Community Development Banking and Chase Capital businesses.
|
||||
|
Selected metrics
|
|||||||||||
|
As of or for the year ended December 31, (in millions, except headcount)
|
2014
|
2013
|
2012
|
||||||||
|
Selected balance sheet data (period-end)
|
|||||||||||
|
Total assets
|
$
|
195,267
|
|
$
|
190,782
|
|
$
|
181,502
|
|
||
|
Loans:
|
|||||||||||
|
Loans retained
|
147,661
|
|
135,750
|
|
126,996
|
|
|||||
|
Loans held-for-sale and loans at fair value
|
845
|
|
1,388
|
|
1,212
|
|
|||||
|
Total loans
|
$
|
148,506
|
|
$
|
137,138
|
|
$
|
128,208
|
|
||
|
Equity
|
14,000
|
|
13,500
|
|
9,500
|
|
|||||
|
Period-end loans by client segment
|
|||||||||||
|
Middle Market Banking
|
$
|
53,635
|
|
$
|
52,289
|
|
$
|
50,552
|
|
||
|
Corporate Client Banking
|
22,695
|
|
20,925
|
|
21,707
|
|
|||||
|
Commercial Term Lending
|
54,038
|
|
48,925
|
|
43,512
|
|
|||||
|
Real Estate Banking
|
13,298
|
|
11,024
|
|
8,552
|
|
|||||
|
Other
|
4,840
|
|
3,975
|
|
3,885
|
|
|||||
|
Total Commercial Banking loans
|
$
|
148,506
|
|
$
|
137,138
|
|
$
|
128,208
|
|
||
|
Selected balance sheet data (average)
|
|||||||||||
|
Total assets
|
$
|
191,857
|
|
$
|
185,776
|
|
$
|
165,111
|
|
||
|
Loans:
|
|||||||||||
|
Loans retained
|
140,982
|
|
131,100
|
|
119,218
|
|
|||||
|
Loans held-for-sale and loans at fair value
|
782
|
|
930
|
|
882
|
|
|||||
|
Total loans
|
$
|
141,764
|
|
$
|
132,030
|
|
$
|
120,100
|
|
||
|
Client deposits and other third-party liabilities
|
204,017
|
|
198,356
|
|
195,912
|
|
|||||
|
Equity
|
14,000
|
|
13,500
|
|
9,500
|
|
|||||
|
Average loans by client segment
|
|||||||||||
|
Middle Market Banking
|
$
|
52,444
|
|
$
|
51,830
|
|
$
|
47,009
|
|
||
|
Corporate Client Banking
|
21,608
|
|
20,918
|
|
19,572
|
|
|||||
|
Commercial Term Lending
|
51,120
|
|
45,989
|
|
40,872
|
|
|||||
|
Real Estate Banking
|
12,080
|
|
9,582
|
|
8,562
|
|
|||||
|
Other
|
4,512
|
|
3,711
|
|
4,085
|
|
|||||
|
Total Commercial Banking loans
|
$
|
141,764
|
|
$
|
132,030
|
|
$
|
120,100
|
|
||
|
Headcount
|
7,262
|
|
6,848
|
|
6,117
|
|
|||||
|
98
|
JPMorgan Chase & Co./2014 Annual Report
|
|
|
Selected metrics (continued)
|
|||||||||||
|
As of or for the year ended December 31, (in millions, except ratios)
|
2014
|
2013
|
2012
|
||||||||
|
Credit data and quality statistics
|
|||||||||||
|
Net charge-offs/(recoveries)
|
$
|
(7
|
)
|
$
|
43
|
|
$
|
35
|
|
||
|
Nonperforming assets
|
|||||||||||
|
Nonaccrual loans:
|
|||||||||||
|
Nonaccrual loans retained
(a)
|
317
|
|
471
|
|
644
|
|
|||||
|
Nonaccrual loans held-for-sale and loans at fair value
|
14
|
|
43
|
|
29
|
|
|||||
|
Total nonaccrual loans
|
331
|
|
514
|
|
673
|
|
|||||
|
Assets acquired in loan satisfactions
|
10
|
|
15
|
|
14
|
|
|||||
|
Total nonperforming assets
|
341
|
|
529
|
|
687
|
|
|||||
|
Allowance for credit losses:
|
|||||||||||
|
Allowance for loan losses
|
2,466
|
|
2,669
|
|
2,610
|
|
|||||
|
Allowance for lending-related commitments
|
165
|
|
142
|
|
183
|
|
|||||
|
Total allowance for credit losses
|
2,631
|
|
2,811
|
|
2,793
|
|
|||||
|
Net charge-off/(recovery) rate
(b)
|
—
|
|
0.03
|
%
|
0.03
|
%
|
|||||
|
Allowance for loan losses to period-end loans
retained
|
1.67
|
|
1.97
|
|
2.06
|
|
|||||
|
Allowance for loan losses to nonaccrual loans retained
(a)
|
778
|
|
567
|
|
405
|
|
|||||
|
Nonaccrual loans to total period-end loans
|
0.22
|
|
0.37
|
|
0.52
|
|
|||||
|
(a)
|
An allowance for loan losses of
$45 million
,
$81 million
and
$107 million
was held against nonaccrual loans retained at
December 31, 2014
,
2013
and
2012
, respectively.
|
|
(b)
|
Loans held-for-sale and loans at fair value were excluded when calculating the net charge-off/(recovery) rate.
|
|
JPMorgan Chase & Co./2014 Annual Report
|
99
|
|
Management’s discussion and analysis
|
ASSET MANAGEMENT
|
||||
|
Asset Management, with client assets of $2.4 trillion, is a global leader in investment and wealth management. AM clients include institutions, high-net-worth individuals and retail investors in every major market throughout the world. AM offers investment management across all major asset classes including equities, fixed income, alternatives and money market funds. AM also offers multi-asset investment management, providing solutions for a broad range of clients’ investment needs. For Global Wealth Management clients, AM also provides retirement products and services, brokerage and banking services including trusts and estates, loans, mortgages and deposits. The majority of AM’s client assets are in actively managed portfolios.
|
|
Selected income statement data
|
|||||||||
|
Year ended December 31,
(in millions, except ratios
and headcount)
|
2014
|
2013
|
2012
|
||||||
|
Revenue
|
|||||||||
|
Asset management, administration and commissions
|
$
|
9,024
|
|
$
|
8,232
|
|
$
|
7,041
|
|
|
All other income
|
564
|
|
797
|
|
806
|
|
|||
|
Noninterest revenue
|
9,588
|
|
9,029
|
|
7,847
|
|
|||
|
Net interest income
|
2,440
|
|
2,376
|
|
2,163
|
|
|||
|
Total net revenue
|
12,028
|
|
11,405
|
|
10,010
|
|
|||
|
Provision for credit losses
|
4
|
|
65
|
|
86
|
|
|||
|
Noninterest expense
|
|||||||||
|
Compensation expense
|
5,082
|
|
4,875
|
|
4,405
|
|
|||
|
Noncompensation expense
|
3,456
|
|
3,141
|
|
2,699
|
|
|||
|
Total noninterest expense
|
8,538
|
|
8,016
|
|
7,104
|
|
|||
|
Income before income tax expense
|
3,486
|
|
3,324
|
|
2,820
|
|
|||
|
Income tax expense
|
1,333
|
|
1,241
|
|
1,078
|
|
|||
|
Net income
|
$
|
2,153
|
|
$
|
2,083
|
|
$
|
1,742
|
|
|
Revenue by line of business
|
|||||||||
|
Global Investment Management
|
$
|
6,327
|
|
$
|
5,951
|
|
$
|
5,141
|
|
|
Global Wealth Management
|
5,701
|
|
5,454
|
|
4,869
|
|
|||
|
Total net revenue
|
$
|
12,028
|
|
$
|
11,405
|
|
$
|
10,010
|
|
|
Financial ratios
|
|||||||||
|
Return on common equity
|
23
|
%
|
23
|
%
|
24
|
%
|
|||
|
Overhead ratio
|
71
|
|
70
|
|
71
|
|
|||
|
Pretax margin ratio:
|
|||||||||
|
Global Investment Management
|
31
|
|
32
|
|
30
|
|
|||
|
Global Wealth Management
|
27
|
|
26
|
|
26
|
|
|||
|
Asset Management
|
29
|
|
29
|
|
28
|
|
|||
|
Headcount
|
19,735
|
|
20,048
|
|
18,645
|
|
|||
|
Number of client advisors
|
2,836
|
|
2,962
|
2,821
|
|
||||
Note: As discussed on
pages 79–80
, effective with the fourth quarter of 2014 the Firm changed its methodology for allocating the cost of preferred stock to its reportable business segments. Prior periods have been revised to conform with the current period presentation.
2014
compared with
2013
Net income was $2.2 billion, an increase of $70 million, or 3%, from the prior year, reflecting higher net revenue and lower provision for credit losses, predominantly offset by higher noninterest expense.
Net revenue was $12.0 billion, an increase of $623 million, or 5%, from the prior year. Noninterest revenue was $9.6 billion, up $559 million, or 6%, from the prior year, due to net client inflows and the effect of higher market levels, partially offset by lower valuations of seed capital investments. Net interest income was $2.4 billion, up $64 million, or 3%, from the prior year, due to higher loan and deposit balances, largely offset by spread compression.
Revenue from Global Investment Management was $6.3 billion, up 6% due to net client inflows and the effect of higher market levels, partially offset by lower valuations of seed capital investments. Revenue from Global Wealth Management was $5.7 billion, up 5% from the prior year due to higher net interest income from loan and deposit balances and net client inflows, partially offset by spread compression and lower brokerage revenue.
Noninterest expense was $8.5 billion, an increase of $522 million, or 7%, from the prior year, as the business continues to invest in both infrastructure and controls.
2013
compared with
2012
Net income was $2.1 billion, an increase of $341 million, or 20%, from the prior year, reflecting higher net revenue, largely offset by higher noninterest expense.
Net revenue was $11.4 billion, an increase of $1.4 billion, or 14%, from the prior year. Noninterest revenue was $9.0 billion, up $1.2 billion, or 15%, from the prior year, due to net client inflows, the effect of higher market levels and higher performance fees. Net interest income was $2.4 billion, up $213 million, or 10%, from the prior year, due to higher loan and deposit balances, partially offset by narrower loan and deposit spreads.
Revenue from Global Investment Management was $6.0 billion, up 16% due to net client inflows, the effect of higher market levels and higher performance fees. Revenue from Global Wealth Management was $5.5 billion, up 12% from the prior year due to higher net interest income from loan and deposit balances and higher brokerage revenue.
Noninterest expense was $8.0 billion, an increase of $912 million, or 13%, from the prior year, primarily due to higher headcount-related expense driven by continued front office expansion efforts, higher performance-based compensation and costs related to the control agenda.
|
100
|
JPMorgan Chase & Co./2014 Annual Report
|
|
|
AM’s lines of business comprise the following:
|
||||
|
Global Investment Management
provides comprehensive global investment services, including asset management, pension analytics, asset-liability management and active risk-budgeting strategies.
|
||||
|
Global Wealth Management
offers investment advice and wealth management, including investment management, capital markets and risk management, tax and estate planning, banking, lending and specialty-wealth advisory services.
|
||||
|
AM’s client segments comprise the following:
|
||||
|
Private Banking
clients include high- and ultra-high-net-worth individuals, families, money managers, business owners and small corporations worldwide.
|
||||
|
Institutional
clients include both corporate and public institutions, endowments, foundations, nonprofit organizations and governments worldwide.
|
||||
|
Retail
clients include financial intermediaries and individual investors.
|
||||
|
J.P. Morgan Asset Management has two high-level measures of its overall fund performance.
|
||||
|
•
Percentage of mutual fund assets under management in funds rated 4- or 5-star:
Mutual fund rating services rank funds based on their risk-adjusted performance over various periods. A 5-star rating is the best rating and represents the top 10% of industry-wide ranked funds. A 4-star rating represents the next 22.5% of industry-wide ranked funds. A 3-star rating represents the next 35% of industry-wide ranked funds. A 2-star rating represents the next 22.5% of industry-wide ranked funds. A 1-star rating is the worst rating and represents the bottom 10% of industry-wide ranked funds. The
“
overall Morningstar rating
”
is derived from a weighted average of the performance figures associated with a fund’s three-, five- and ten-year (if applicable) Morningstar Rating metrics. For U.S. domiciled funds, separate star ratings are given at the individual share class level. The Nomura
“
star rating
”
is based on three-year risk-adjusted performance only. Funds with fewer than three years of history are not rated and hence excluded from this analysis. All ratings, the assigned peer categories and the asset values used to derive this analysis are sourced from these fund rating providers as mentioned in footnote (a). The data providers re-denominate the asset values into USD. This % of AUM is based on star ratings at the share class level for U.S. domiciled funds, and at a
“
primary share class
”
level to represent the star rating of all other funds except for Japan where Nomura provides ratings at the fund level. The “primary share class”, as defined by Morningstar, denotes the share class recommended as being the best proxy for the portfolio and in most cases will be the most retail version (based upon annual management charge, minimum investment, currency and other factors). Past performance is not indicative of future results.
|
||||
|
•
Percentage of mutual fund assets under management in funds ranked in the 1st or 2nd quartile (one, three and five years)
: All quartile rankings, the assigned peer categories and the asset values used to derive this analysis are sourced from the fund ranking providers mentioned in footnote (b). Quartile rankings are done on the net-of-fee absolute return of each fund. The data providers re-denominate the asset values into USD. This % of AUM is based on fund performance and associated peer rankings at the share class level for U.S. domiciled funds, at a
“
primary share class” level to represent the quartile ranking of Luxembourg, U.K. and Hong Kong funds and at the fund level for all other funds. The
“
primary share class
”
, as defined by Morningstar, denotes the share class recommended as being the best proxy for the portfolio and in most cases will be the most retail version (based upon annual management charge, minimum investment, currency and other factors). Where peer group rankings given for a fund are in more than one “primary share class” territory both rankings are included to reflect local market competitiveness (applies to “Offshore Territories” and “HK SFC Authorized” funds only). Past performance is not indicative of future results.
|
||||
|
Selected metrics
|
|||||||||
|
As of or for the year ended December 31,
(in millions, except ranking data and ratios)
|
2014
|
2013
|
2012
|
||||||
|
% of JPM mutual fund assets rated as 4- or 5-star
(a)
|
52
|
%
|
49
|
%
|
47
|
%
|
|||
|
% of JPM mutual fund assets ranked in 1
st
or 2
nd
quartile:
(b)
|
|||||||||
|
1 year
|
72
|
|
68
|
|
67
|
|
|||
|
3 years
|
72
|
|
68
|
|
74
|
|
|||
|
5 years
|
76
|
|
69
|
|
76
|
|
|||
|
Selected balance sheet data (period-end)
|
|||||||||
|
Total assets
|
$
|
128,701
|
|
$
|
122,414
|
|
$
|
108,999
|
|
|
Loans
(c)
|
104,279
|
|
95,445
|
|
80,216
|
|
|||
|
Deposits
|
155,247
|
|
146,183
|
|
144,579
|
|
|||
|
Equity
|
9,000
|
|
9,000
|
|
7,000
|
|
|||
|
Selected balance sheet data (average)
|
|||||||||
|
Total assets
|
$
|
126,440
|
|
$
|
113,198
|
|
$
|
97,447
|
|
|
Loans
|
99,805
|
|
86,066
|
|
68,719
|
|
|||
|
Deposits
|
150,121
|
|
139,707
|
129,208
|
|
||||
|
Equity
|
9,000
|
|
9,000
|
|
7,000
|
|
|||
|
Credit data and quality statistics
|
|||||||||
|
Net charge-offs
|
$
|
6
|
|
$
|
40
|
|
$
|
64
|
|
|
Nonaccrual loans
|
218
|
|
167
|
|
250
|
|
|||
|
Allowance for credit losses:
|
|||||||||
|
Allowance for loan losses
|
271
|
|
278
|
|
248
|
|
|||
|
Allowance for lending-related commitments
|
5
|
|
5
|
|
5
|
|
|||
|
Total allowance for credit losses
|
276
|
|
283
|
|
253
|
|
|||
|
Net charge-off rate
|
0.01
|
%
|
0.05
|
%
|
0.09
|
%
|
|||
|
Allowance for loan losses to period-end loans
|
0.26
|
|
0.29
|
|
0.31
|
|
|||
|
Allowance for loan losses to nonaccrual loans
|
124
|
|
166
|
|
99
|
|
|||
|
Nonaccrual loans to period-end loans
|
0.21
|
|
0.17
|
|
0.31
|
|
|||
|
(a)
|
Represents the “overall star rating” derived from Morningstar for the U.S., the U.K., Luxembourg, Hong Kong and Taiwan domiciled funds; and Nomura ’star rating’ for Japan domiciled funds. Includes only retail open ended mutual funds that have a rating. Excludes money market funds, Undiscovered Managers Fund, and Brazil and India domiciled funds.
|
|
(b)
|
Quartile ranking sourced from: Lipper for the U.S. and Taiwan domiciled funds; Morningstar for the U.K., Luxembourg and Hong Kong domiciled funds; Nomura for Japan domiciled funds and FundDoctor for South Korea domiciled funds. Includes only retail open ended mutual funds that are ranked by the aforementioned sources. Excludes money market funds, Undiscovered Managers Fund, and Brazil and India domiciled funds.
|
|
(c)
|
Included
$22.1 billion
,
$18.9 billion
and
$10.9 billion
of prime mortgage loans reported in the Consumer, excluding credit card, loan portfolio at December 31, 2014, 2013 and 2012, respectively. For the same periods, excluded
$2.7 billion
,
$3.7 billion
and
$6.7 billion
, respectively, of prime mortgage loans reported in the CIO portfolio within the Corporate segment.
|
|
JPMorgan Chase & Co./2014 Annual Report
|
101
|
|
Management’s discussion and analysis
Client assets
2014
compared with
2013
Client assets were $2.4 trillion, an increase of $44 billion, or 2%, compared with the prior year. Excluding the sale of Retirement Plan Services, client assets were up 8% compared with the prior year. Assets under management were $1.7 trillion, an increase of $146 billion, or 9%, from the prior year, due to net inflows to long-term products and the effect of higher market levels.
2013
compared with
2012
Client assets were $2.3 trillion at December 31, 2013, an increase of $248 billion, or 12%, compared with the prior year. Assets under management were $1.6 trillion, an increase of $172 billion, or 12%, from the prior year, due to net inflows to long-term products and the effect of higher market levels. Custody, brokerage, administration and deposit balances were $745 billion, up $76 billion, or 11%, from the prior year, due to the effect of higher market levels and custody inflows, partially offset by brokerage outflows.
|
Client assets
|
|||||||||
|
December 31,
(in billions)
|
2014
|
|
2013
|
|
2012
|
||||
|
Assets by asset class
|
|||||||||
|
Liquidity
|
$
|
461
|
|
$
|
451
|
|
$
|
458
|
|
|
Fixed income
|
359
|
|
330
|
|
330
|
|
|||
|
Equity
|
375
|
|
370
|
|
277
|
|
|||
|
Multi-asset and alternatives
|
549
|
|
447
|
|
361
|
|
|||
|
Total assets under management
|
1,744
|
|
1,598
|
|
1,426
|
|
|||
|
Custody/brokerage/administration/deposits
|
643
|
|
745
|
|
669
|
|
|||
|
Total client assets
|
$
|
2,387
|
|
$
|
2,343
|
|
$
|
2,095
|
|
|
Memo:
|
|||||||||
|
Alternatives client assets
(a)
|
166
|
|
158
|
|
142
|
|
|||
|
Assets by client segment
|
|||||||||
|
Private Banking
|
$
|
428
|
|
$
|
361
|
|
$
|
318
|
|
|
Institutional
|
827
|
|
777
|
|
741
|
|
|||
|
Retail
|
489
|
|
460
|
|
367
|
|
|||
|
Total assets under management
|
$
|
1,744
|
|
$
|
1,598
|
|
$
|
1,426
|
|
|
Private Banking
|
$
|
1,057
|
|
$
|
977
|
|
$
|
877
|
|
|
Institutional
|
835
|
|
777
|
|
741
|
|
|||
|
Retail
|
495
|
|
589
|
|
477
|
|
|||
|
Total client assets
|
$
|
2,387
|
|
$
|
2,343
|
|
$
|
2,095
|
|
|
(a)
|
Represents assets under management, as well as client balances in brokerage accounts.
|
|
Client assets (continued)
|
|||||||||
|
Year ended December 31,
(in billions)
|
2014
|
2013
|
2012
|
||||||
|
Assets under management rollforward
|
|||||||||
|
Beginning balance
|
$
|
1,598
|
|
$
|
1,426
|
|
$
|
1,336
|
|
|
Net asset flows:
|
|||||||||
|
Liquidity
|
18
|
|
(4
|
)
|
(41
|
)
|
|||
|
Fixed income
|
33
|
|
8
|
|
27
|
|
|||
|
Equity
|
5
|
|
34
|
|
8
|
|
|||
|
Multi-asset and alternatives
|
42
|
|
48
|
|
23
|
|
|||
|
Market/performance/other impacts
|
48
|
|
86
|
|
73
|
|
|||
|
Ending balance, December 31
|
$
|
1,744
|
|
$
|
1,598
|
|
$
|
1,426
|
|
|
Client assets rollforward
|
|||||||||
|
Beginning balance
|
$
|
2,343
|
|
$
|
2,095
|
|
$
|
1,921
|
|
|
Net asset flows
|
118
|
|
80
|
|
60
|
|
|||
|
Market/performance/other impacts
|
(74
|
)
|
168
|
|
114
|
|
|||
|
Ending balance, December 31
|
$
|
2,387
|
|
$
|
2,343
|
|
$
|
2,095
|
|
|
International metrics
|
|||||||||
|
Year ended December 31,
(in billions,
except where otherwise noted)
|
2014
|
2013
|
2012
|
||||||
|
Total net revenue
(in millions)
(a)
|
|||||||||
|
Europe/Middle East/Africa
|
$
|
2,080
|
|
$
|
1,881
|
|
$
|
1,641
|
|
|
Asia/Pacific
|
1,199
|
|
1,133
|
|
958
|
|
|||
|
Latin America/Caribbean
|
841
|
|
879
|
|
773
|
|
|||
|
North America
|
7,908
|
|
7,512
|
|
6,638
|
|
|||
|
Total net revenue
|
$
|
12,028
|
|
$
|
11,405
|
|
$
|
10,010
|
|
|
Assets under management
|
|||||||||
|
Europe/Middle East/Africa
|
$
|
329
|
|
$
|
305
|
|
$
|
258
|
|
|
Asia/Pacific
|
126
|
|
132
|
|
114
|
|
|||
|
Latin America/Caribbean
|
46
|
|
47
|
|
45
|
|
|||
|
North America
|
1,243
|
|
1,114
|
|
1,009
|
|
|||
|
Total assets under management
|
$
|
1,744
|
|
$
|
1,598
|
|
$
|
1,426
|
|
|
Client assets
|
|||||||||
|
Europe/Middle East/Africa
|
$
|
391
|
|
$
|
367
|
|
$
|
317
|
|
|
Asia/Pacific
|
174
|
|
180
|
|
160
|
|
|||
|
Latin America/Caribbean
|
115
|
|
117
|
|
110
|
|
|||
|
North America
|
1,707
|
|
1,679
|
|
1,508
|
|
|||
|
Total client assets
|
$
|
2,387
|
|
$
|
2,343
|
|
$
|
2,095
|
|
|
(a)
|
Regional revenue is based on the domicile of the client.
|
|
102
|
JPMorgan Chase & Co./2014 Annual Report
|
|
|
CORPORATE
|
||||
|
The Corporate segment comprises Private Equity, Treasury and Chief Investment Office (“CIO”) and Other Corporate, which includes corporate staff units and expense that is centrally managed. Treasury and CIO are predominantly responsible for measuring, monitoring, reporting and managing the Firm’s liquidity, funding and structural interest rate and foreign exchange risks, as well as executing the Firm’s capital plan. The major Other Corporate units include Real Estate, Enterprise Technology, Legal, Compliance, Finance, Human Resources, Internal Audit, Risk Management, Oversight & Control, Corporate Responsibility and various Other Corporate groups. Other centrally managed expense includes the Firm’s occupancy and pension-related expenses that are subject to allocation to the businesses.
|
|
Selected income statement data
|
|||||||||||
|
Year ended December 31,
(in millions, except headcount)
|
2014
|
|
2013
|
|
2012
|
|
|||||
|
Revenue
|
|||||||||||
|
Principal transactions
|
$
|
1,197
|
|
$
|
563
|
|
$
|
(4,268
|
)
|
||
|
Securities gains
|
71
|
|
666
|
|
2,024
|
|
|||||
|
All other income
|
704
|
|
1,864
|
|
2,434
|
|
|||||
|
Noninterest revenue
|
1,972
|
|
3,093
|
|
190
|
|
|||||
|
Net interest income
|
(1,960
|
)
|
(3,115
|
)
|
(2,262
|
)
|
|||||
|
Total net revenue
(a)
|
12
|
|
(22
|
)
|
(2,072
|
)
|
|||||
|
Provision for credit losses
|
(35
|
)
|
(28
|
)
|
(37
|
)
|
|||||
|
Noninterest expense
|
|||||||||||
|
Compensation expense
|
2,888
|
|
2,299
|
|
2,221
|
|
|||||
|
Noncompensation expense
(b)
|
4,589
|
|
13,208
|
|
6,972
|
|
|||||
|
Subtotal
|
7,477
|
|
15,507
|
|
9,193
|
|
|||||
|
Net expense allocated to other businesses
|
(6,318
|
)
|
(5,252
|
)
|
(4,634
|
)
|
|||||
|
Total noninterest expense
|
1,159
|
|
10,255
|
|
4,559
|
|
|||||
|
Income/(loss) before income tax expense/(benefit)
|
(1,112
|
)
|
(10,249
|
)
|
(6,594
|
)
|
|||||
|
Income tax expense/(benefit)
|
(1,976
|
)
|
(3,493
|
)
|
(3,974
|
)
|
|||||
|
Net income/(loss)
|
$
|
864
|
|
$
|
(6,756
|
)
|
$
|
(2,620
|
)
|
||
|
Total net revenue
|
|||||||||||
|
Private equity
|
$
|
1,118
|
|
$
|
589
|
|
$
|
645
|
|
||
|
Treasury and CIO
|
(1,317
|
)
|
(2,068
|
)
|
(4,089
|
)
|
|||||
|
Other Corporate
|
211
|
|
1,457
|
|
1,372
|
|
|||||
|
Total net revenue
|
$
|
12
|
|
$
|
(22
|
)
|
$
|
(2,072
|
)
|
||
|
Net income/(loss)
|
|||||||||||
|
Private equity
|
$
|
400
|
|
$
|
285
|
|
$
|
319
|
|
||
|
Treasury and CIO
|
(1,165
|
)
|
(1,454
|
)
|
(2,718
|
)
|
|||||
|
Other Corporate
|
1,629
|
|
(5,587
|
)
|
(221
|
)
|
|||||
|
Total net income/(loss)
|
$
|
864
|
|
$
|
(6,756
|
)
|
$
|
(2,620
|
)
|
||
|
Total assets (period-end)
|
$
|
931,705
|
|
$
|
805,987
|
|
$
|
725,251
|
|
||
|
Headcount
|
26,047
|
|
20,717
|
|
17,758
|
|
|||||
Note: As discussed on
pages 79–80
, effective with the fourth quarter of 2014 the Firm changed its methodology for allocating the cost of preferred stock to its reportable business segments. Prior periods have been revised to conform with the current period presentation.
|
(a)
|
Included tax-equivalent adjustments, predominantly due to tax-exempt income from municipal bond investments of
$730 million
,
$480 million
and
$443 million
for the years ended
December 31, 2014
,
2013
and
2012
, respectively.
|
|
(b)
|
Included legal expense of
$821 million
,
$10.2 billion
and
$3.7 billion
for the years ended December 31, 2014, 2013 and 2012, respectively.
|
2014 compared with 2013
Net income was $864 million, compared with a net loss of $6.8 billion in the prior year.
Private Equity reported net income of $400 million, compared with net income of $285 million in the prior year, primarily due to higher net gains on sales, largely offset by higher noninterest expense related to goodwill impairment.
Treasury and CIO reported a net loss of $1.2 billion, compared with a net loss of $1.5 billion in the prior year. Net revenue was a loss of $1.3 billion, compared with a loss of $2.1 billion in the prior year. Current year net interest income was a loss of $1.7 billion compared with a loss of $2.7 billion in the prior year, primarily reflecting higher yields on investment securities. Securities gains were $71 million, compared to $659 million in the prior year, reflecting lower repositioning activity of the investment securities portfolio in the current period.
Other Corporate reported net income of $1.6 billion, compared with a net loss of $5.6 billion in the prior year. Current year noninterest revenue was $353 million compared with $1.8 billion in the prior year. Prior year noninterest revenue included gains of $1.3 billion and $493 million on the sales of Visa shares and One Chase Manhattan Plaza, respectively. The current year included $821 million of legal expense, compared with $10.2 billion, which included reserves for litigation and regulatory proceedings, in the prior year.
2013 compared with 2012
Net loss was $6.8 billion, compared with a net loss of $2.6 billion in the prior year.
Private Equity reported net income of $285 million, compared with net income of $319 million in the prior year. Net revenue was of $589 million, compared with $645 million in the prior year.
Treasury and CIO reported a net loss of $1.5 billion, compared with a net loss of $2.7 billion in the prior year. Net revenue was a loss of $2.1 billion, compared with a loss of $4.1 billion in the prior year. Net revenue in 2013 included $659 million of net securities gains from sales of available-for-sale investment securities, compared with securities gains of $2.0 billion; and $888 million of pretax extinguishment gains related to the redemption of trust preferred securities in the prior year. The extinguishment gains were related to adjustments applied to the cost basis of the trust preferred securities during the period they were in a qualified hedge accounting relationship. The prior year loss also reflected $5.8 billion of losses incurred by CIO from the synthetic credit portfolio for the six months ended June 30, 2012, and $449 million of losses from the retained index credit derivative positions for the three
|
JPMorgan Chase & Co./2014 Annual Report
|
103
|
|
Management’s discussion and analysis
months ended September 30, 2012. Net interest income in 2013 was a loss of $2.7 billion compared with a loss of $1.7 billion in the prior year, primarily due to low interest rates and limited reinvestment opportunities. Net interest income improved in the fourth quarter of 2013 due to higher interest rates and better reinvestment opportunities.
Other Corporate reported a net loss of $5.6 billion, compared with a net loss of $221 million in the prior year. Noninterest revenue in 2013 was $1.8 billion, down 2% compared with the prior year. In 2013, noninterest revenue included gains of $1.3 billion and $493 million on the sales of Visa shares and One Chase Manhattan Plaza, respectively. Noninterest revenue in the prior year included a $1.1 billion benefit for the Washington Mutual bankruptcy settlement and a $665 million gain from the recovery on a Bear Stearns-related subordinated loan. Noninterest expense of $9.7 billion was up $5.9 billion compared with the prior year. Included in 2013 noninterest expense was $10.2 billion of legal expense, including reserves for litigation and regulatory proceedings, compared with $3.7 billion of expense for additional litigation reserves, largely for mortgage-related matters, in the prior year.
Treasury and
CIO
overview
Treasury and CIO are predominantly responsible for measuring, monitoring, reporting and managing the Firm’s liquidity, funding and structural interest rate and foreign exchange risks,
as well as executing the Firm’s capital plan
. The risks managed by Treasury and CIO arise from the activities undertaken by the Firm’s four major reportable business segments to serve their respective client bases, which generate both on- and off-balance sheet assets and liabilities.
Treasury and CIO achieve the Firm’s asset-liability management objectives generally by investing in high-quality securities that are managed for the longer-term as part of the Firm’s investment securities portfolio. Treasury and CIO also use derivatives to meet the Firm
’
s asset-liability management objectives. For further information on derivatives, see Note 6. The investment securities portfolio primarily consists of U.S. and non-U.S. government securities, agency and nonagency mortgage-backed securities, other asset-backed securities, corporate debt securities and obligations of U.S. states and municipalities. At
December 31, 2014
, the investment securities portfolio was
$343.1 billion
, and the average credit rating of the securities comprising the portfolio was AA+ (based upon external ratings where available and where not available, based primarily upon internal ratings that correspond to ratings as defined by S&P and Moody’s). See Note 12 for further information on the details of the Firm’s investment securities portfolio.
For further information on liquidity and funding risk, see Liq
uidity Risk Management on
pages 156–160
. For information on interest rate, foreign exchange and other risks, Treasury and CIO Value-at-risk (“VaR”) and the Firm’s structural interest rate-sensitive revenue at risk, see Market Risk Management on
pages 131–136
.
|
Selected income statement and balance sheet data
|
|||||||||||
|
As of or for the year ended December 31, (in millions)
|
2014
|
|
2013
|
|
2012
|
|
|||||
|
Securities gains
|
$
|
71
|
|
$
|
659
|
|
$
|
2,028
|
|
||
|
Investment securities portfolio (average)
|
349,285
|
|
353,712
|
|
358,029
|
|
|||||
|
Investment securities portfolio (period–end)
(a)
|
343,146
|
|
347,562
|
|
365,421
|
|
|||||
|
Mortgage loans (average)
|
3,308
|
|
5,145
|
|
10,241
|
|
|||||
|
Mortgage loans (period-end)
|
2,834
|
|
3,779
|
|
7,037
|
|
|||||
|
(a)
|
Period-end investment securities included held-to-maturity securities of
$49.3 billion
and
$24.0 billion
at December 31, 2014, and 2013, respectively. Held-to-maturity securities as of December 31, 2012, were not material.
|
Private Equity portfolio
|
Selected income statement and balance sheet data
|
|||||||||||
|
Year ended December 31,
(in millions)
|
2014
|
|
2013
|
|
2012
|
|
|||||
|
Private equity gains/(losses)
|
|||||||||||
|
Realized gains
|
$
|
1,164
|
|
$
|
(170
|
)
|
$
|
17
|
|
||
|
Unrealized gains/(losses)
(a)
|
43
|
|
734
|
|
639
|
|
|||||
|
Total direct investments
|
1,207
|
|
564
|
|
656
|
|
|||||
|
Third-party fund investments
|
34
|
|
137
|
|
134
|
|
|||||
|
Total private equity gains/(losses)
(b)
|
$
|
1,241
|
|
$
|
701
|
|
$
|
790
|
|
||
|
(a)
|
Includes reversals of unrealized gains and losses that were recognized in prior periods and have now been realized.
|
|
(b)
|
Included in principal transactions revenue in the Consolidated statements of income.
|
|
Private equity portfolio information
(a)
|
|||||||||||
|
December 31, (in millions)
|
2014
|
|
2013
|
|
2012
|
|
|||||
|
Publicly held securities
|
|||||||||||
|
Carrying value
|
$
|
878
|
|
$
|
1,035
|
|
$
|
578
|
|
||
|
Cost
|
583
|
|
672
|
|
350
|
|
|||||
|
Quoted public value
|
893
|
|
1,077
|
|
578
|
|
|||||
|
Privately held direct securities
|
|||||||||||
|
Carrying value
|
4,555
|
|
5,065
|
|
5,379
|
|
|||||
|
Cost
|
5,275
|
|
6,022
|
|
6,584
|
|
|||||
|
Third-party fund investments
(b)
|
|||||||||||
|
Carrying value
|
433
|
|
1,768
|
|
2,117
|
|
|||||
|
Cost
|
423
|
|
1,797
|
|
1,963
|
|
|||||
|
Total private equity portfolio
|
|||||||||||
|
Carrying value
|
$
|
5,866
|
|
$
|
7,868
|
|
$
|
8,074
|
|
||
|
Cost
|
6,281
|
|
8,491
|
|
8,897
|
|
|||||
|
(a)
|
For more information on the Firm’s methodologies regarding the valuation of the Private Equity portfolio, see Note 3. For information on the sale of a portion of the Private Equity business in January 2015, see Note 2.
|
|
(b)
|
Unfunded commitments to third-party private equity funds were
$147 million
,
$215 million
and
$370 million
at
December 31, 2014
,
2013
and
2012
, respectively.
|
2014 compared with 2013
The carrying value of the private equity portfolio at December 31, 2014 was $5.9 billion, down from $7.9 billion at December 31, 2013. The decrease in the portfolio was predominantly driven by sales of investments, partially offset by unrealized gains.
2013 compared with 2012
The carrying value of the private equity portfolio at December 31, 2013 was $7.9 billion, down from $8.1 billion at December 31, 2012. The decrease in the portfolio was predominantly driven by sales of investments, partially offset by new investments and unrealized gains.
|
104
|
JPMorgan Chase & Co./2014 Annual Report
|
|
|
ENTERPRISE-WIDE RISK MANAGEMENT
|
||||
Risk is an inherent part of JPMorgan Chase’s business activities. When the Firm extends a consumer or wholesale loan, advises customers on their investment decisions, makes markets in securities, or conducts any number of other services or activities, the Firm takes on some degree of risk. The Firm’s overall objective in managing risk is to protect the safety and soundness of the Firm, avoid excessive risk taking, and manage and balance risk in a manner that serves the interest of our clients, customers and shareholders.
The Firm’s approach to risk management covers a broad spectrum of risk areas, such as credit, market, liquidity, model, structural interest rate, principal, country, operational, fiduciary and reputation risk.
The Firm believes that effective risk management requires:
|
•
|
Acceptance of responsibility, including identification and escalation of risk issues, by all individuals within the Firm;
|
|
•
|
Ownership of risk management within each line of business and corporate functions; and
|
|
•
|
Firmwide structures for risk governance.
|
Firmwide Risk Management is overseen and managed on an enterprise-wide basis. The Firm’s Chief Executive Officer (“CEO”), Chief Financial Officer (“CFO”), Chief Risk Officer (“CRO”) and Chief Operating Officer (“COO”) develop and set the risk management framework and governance structure for the Firm, which is intended to provide comprehensive controls and ongoing management of the major risks inherent in the Firm’s business activities. The Firm’s risk management framework is intended to create a culture of transparency, awareness and personal responsibility through reporting, collaboration, discussion, escalation and sharing of information. The CEO, CFO, CRO and COO are ultimately responsible and accountable to the Firm’s Board of Directors.
The Firm’s risk culture strives for continual improvement through ongoing employee training and development, as well as talent retention. The Firm also approaches its incentive compensation arrangements through an integrated risk, compensation and financial management framework to encourage a culture of risk awareness and personal accountability.
|
JPMorgan Chase & Co./2014 Annual Report
|
105
|
|
Management’s discussion and analysis
The following sections outline the key risks that are inherent in the Firm’s business activities.
|
Risk
|
Definition
|
Key risk management metrics
|
Page
references
|
|
Capital risk
|
The risk the Firm has an insufficient level and composition of capital to support the Firm’s business activities and associated risks during normal economic environments and stressed conditions.
|
Risk-based capital ratios, Supplementary Leverage ratio
|
146-155
|
|
Compliance risk
|
The risk of fines or sanctions or of financial damage or loss due to the failure to comply with laws, rules, and regulations.
|
Not Applicable
|
144
|
|
Country risk
|
The risk that a sovereign event or action alters the value or terms of contractual obligations of obligors, counterparties and issuers or adversely affects markets related to a particular country.
|
Default exposure at 0% recovery, Stress
|
137-138
|
|
Credit risk
|
The risk of loss arising from the default of a customer, client or counterparty.
|
Total exposure; industry, geographic and customer concentrations; risk ratings; delinquencies; loss experience; stress
|
110-130
|
|
Fiduciary risk
|
The risk of a failure to exercise the applicable high standard of care, to act in the best interests of clients or to treat clients fairly, as required under applicable law or regulation.
|
Not Applicable
|
145
|
|
Legal risk
|
The risk of loss or imposition of damages, fines, penalties or other liability arising from failure to comply with a contractual obligation or to comply with laws or regulations to which the Firm is subject.
|
Not Applicable
|
144
|
|
Liquidity risk
|
The risk that the Firm will not have the appropriate amount, composition and tenor of funding and liquidity in support of its assets, and that the Firm will be unable to meet its contractual and contingent obligations through normal economic cycles and market stress events.
|
LCR; Stress
|
156-160
|
|
Market risk
|
The risk of loss arising from potential adverse changes in the value of the Firm’s assets and liabilities resulting from changes in market variables such as interest rates, foreign exchange rates, equity prices, commodity prices, implied volatilities or credit spreads.
|
VaR, Stress, Sensitivities
|
131-136
|
|
Model risk
|
The risk of the potential for adverse consequences from decisions based on incorrect or misused model outputs and reports.
|
Model Status, Model Tier
|
139
|
|
Non-USD FX risk
|
The risk arising from capital investments, forecasted expense and revenue, investment securities portfolio or issuing debt in denominations other than the U.S. dollar.
|
FX Net Open Position (“NOP”)
|
203, 211-213
|
|
Operational risk
|
The risk of loss resulting from inadequate or failed processes or systems or due to external events that are neither market nor credit-related.
|
Firm-specific loss experience; industry loss experience; business environment and internal control factors (“BEICF”)
|
140-143
|
|
Principal risk
|
The risk of an adverse change in the value of privately-held financial assets and instruments, typically representing an ownership or junior capital position. These positions have unique risks due to their illiquidity or for which there is less observable market or valuation data.
|
Carrying Value, Stress
|
140
|
|
Reputation risk
|
The risk that an action, transaction, investment or event will reduce the trust that clients, shareholders, employees or the broader public has in the Firm’s integrity or competence.
|
Not Applicable
|
145
|
|
Structural interest rate risk
|
The risk resulting from the Firm’s traditional banking activities (both on- and off-balance sheet positions) arising from the extension of loans and credit facilities, taking deposits and issuing debt (collectively referred to as “non-trading activities”), and also the impact from the CIO investment securities portfolio and other related CIO, Treasury activities.
|
Earnings-at-risk
|
136
|
Risk organization
The LOBs are responsible for managing the risks inherent in their respective business activities. The Risk organization operates independently from the revenue-generating businesses, providing a credible challenge to them. The CRO is the head of the Risk organization and is responsible for the overall direction of Risk oversight. The CRO is supported by individuals and organizations that align to lines of business and corporate functions, as well as others that align to specific risk types.
The Firm’s Risk Management Organization and other Firmwide functions with risk-related responsibilities (i.e., Regulatory Capital Management Office (“RCMO”), Firmwide Oversight and Control Group, Valuation Control Group (“VCG”), Legal and Compliance) provide independent oversight of the monitoring, evaluation and escalation of risk.
Risk governance
The independent stature of the Risk organization is supported by a governance structure that provides for escalation of risk issues up to senior management and the Board of Directors.
|
106
|
JPMorgan Chase & Co./2014 Annual Report
|
|
The chart below illustrates the governance structure and certain senior management level committees and forums that are primarily responsible for key risk-related functions. There are additional committees and forums not represented in the chart that are also responsible for management and oversight of risk.
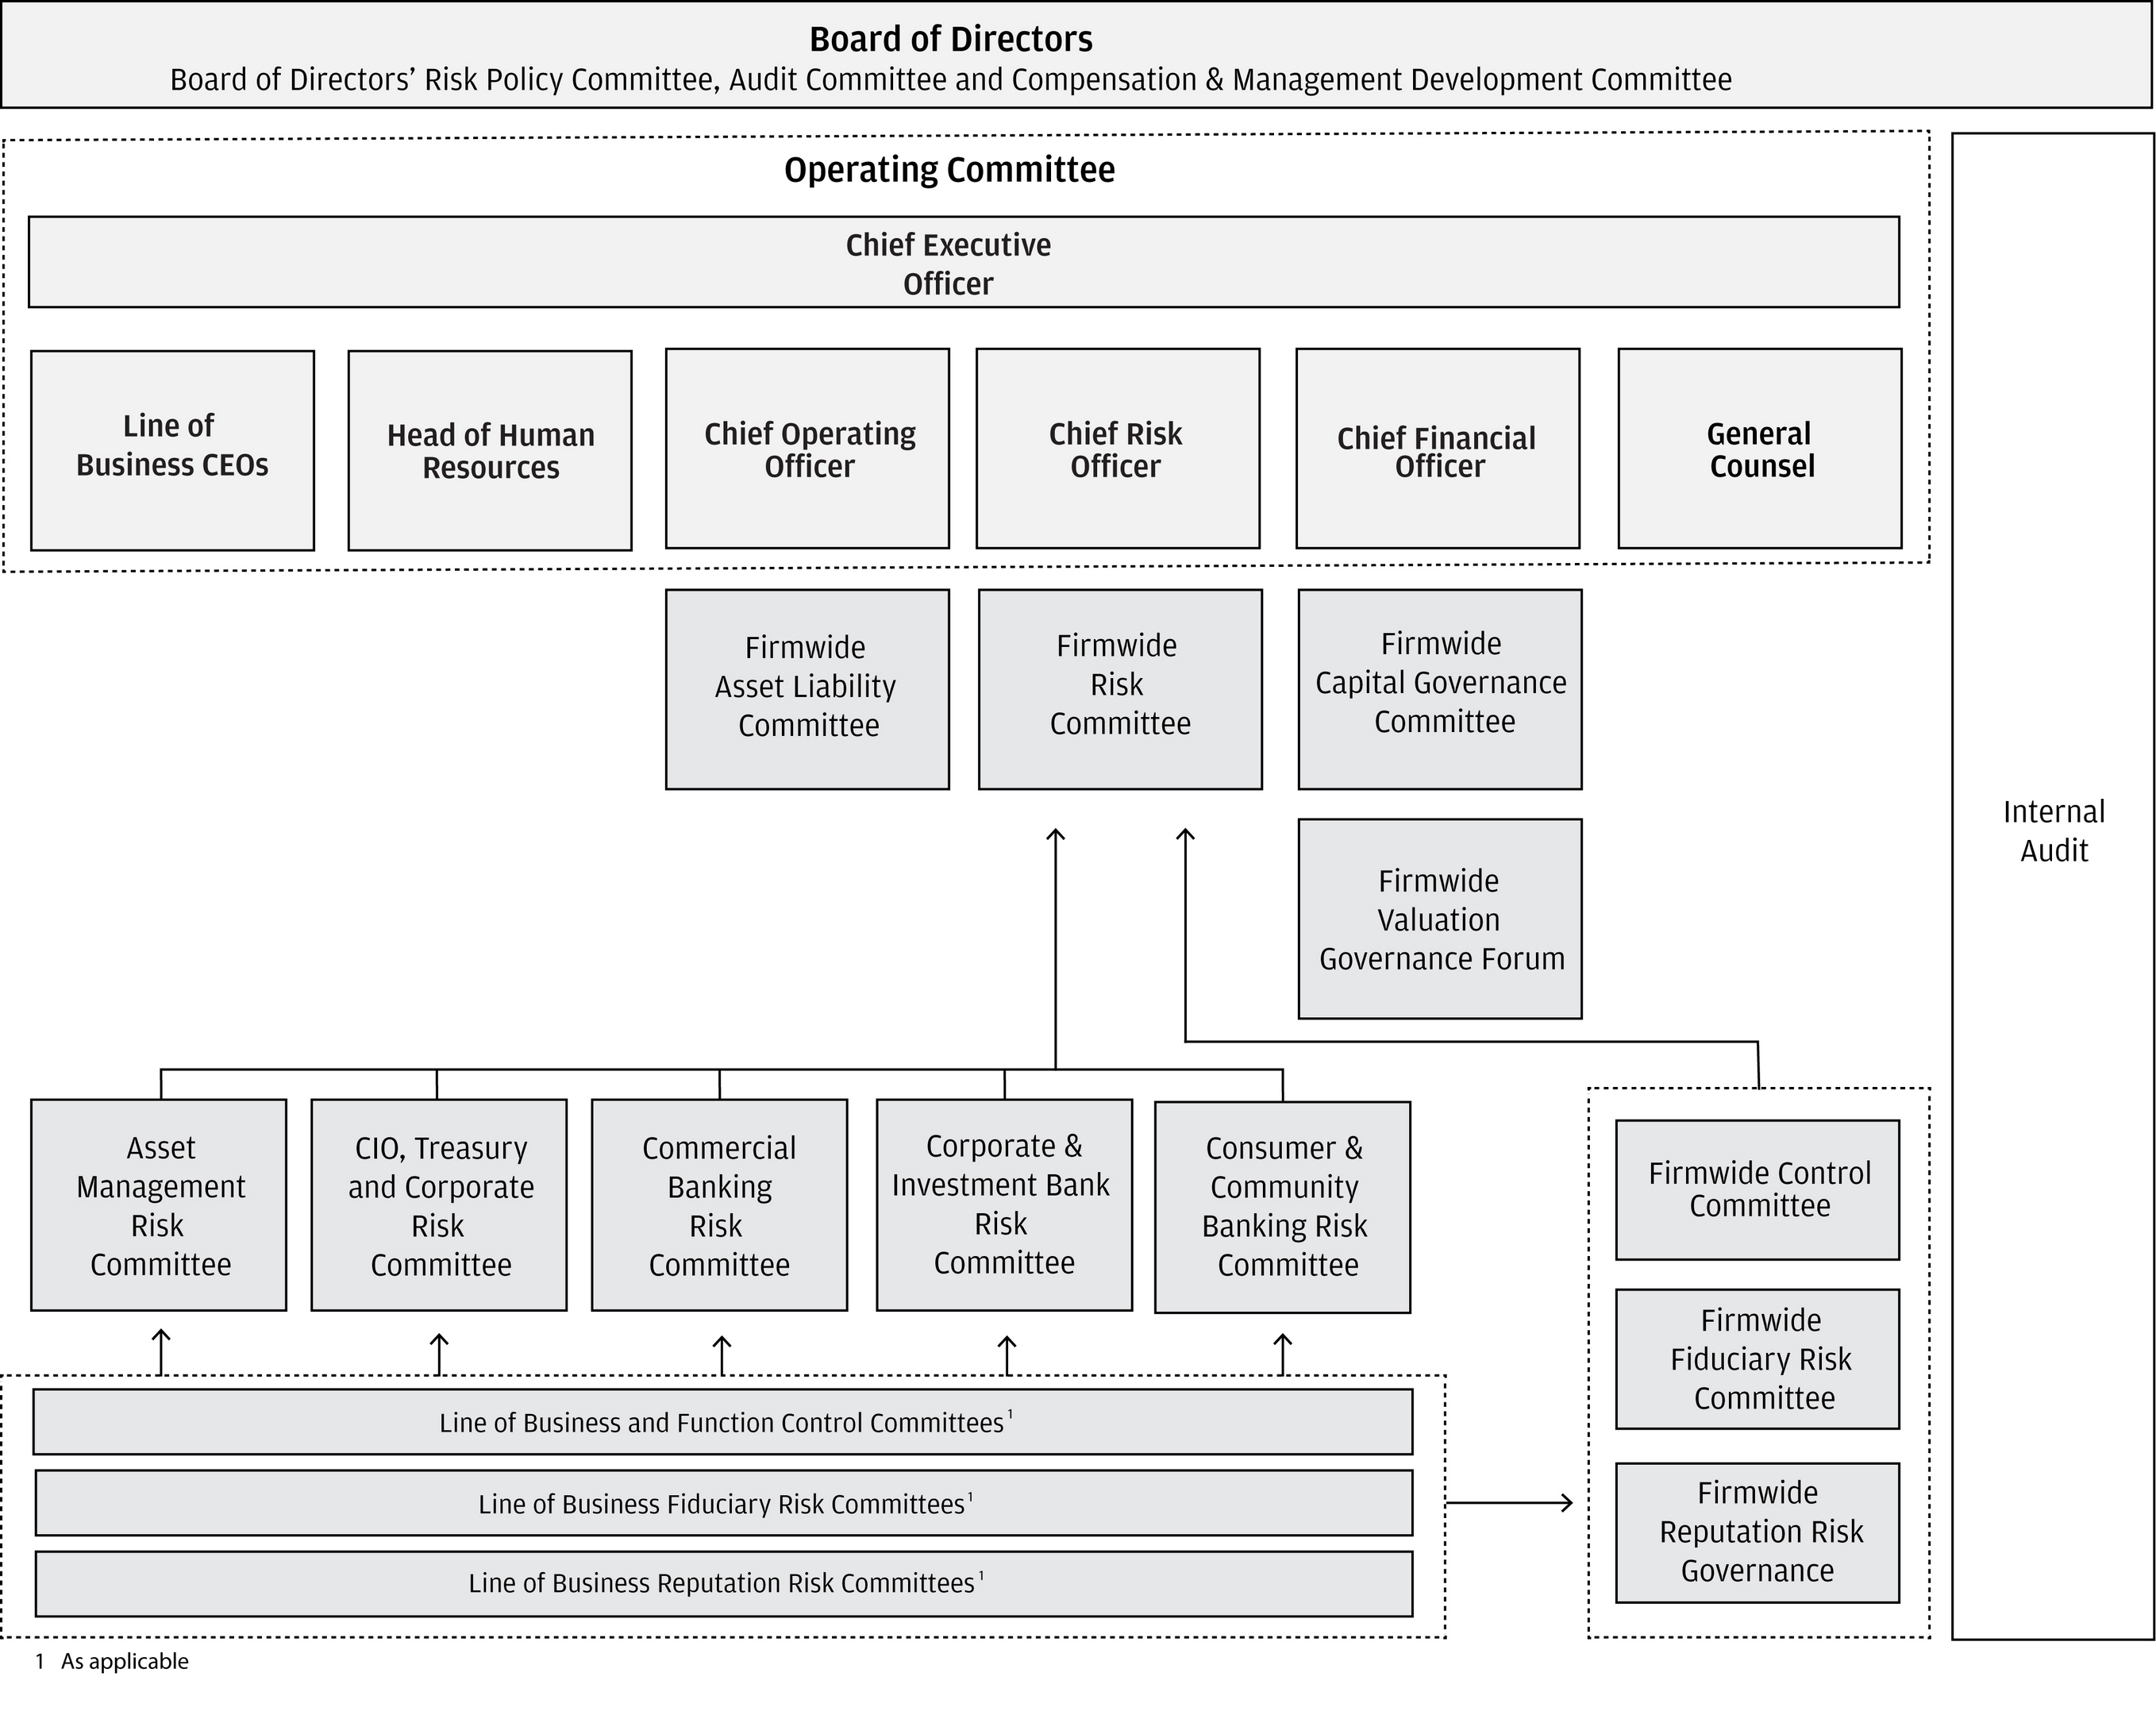
The Board of Directors provides oversight of risk principally through the Board of Directors’ Risk Policy Committee (“DRPC”), Audit Committee and, with respect to compensation, Compensation & Management Development Committee. Each committee of the Board oversees reputation risk issues within its scope of responsibility.
The Directors’ Risk Policy Committee
approves and periodically reviews the primary risk-management policies of the Firm’s global operations and oversees the operation of the Firm’s global risk management framework. The committee’s responsibilities include oversight of management’s exercise of its responsibility to assess and manage: (i) credit risk, market risk, liquidity risk, model risk, structural interest rate risk, principal risk and country risk; (ii) the governance frameworks or policies for operational, fiduciary, reputational risks and the New Business Initiative Approval (“NBIA”) process; and (iii) capital and liquidity planning and analysis. The DRPC
reviews the firmwide value-at-risk and market stress tolerances, as well as any other parameter tolerances established by management in accordance with the Firm’s Risk Appetite Policy. It reviews reports of significant issues identified by risk management officers, including reports describing the Firm’s credit risk profile, and information about concentrations and country risks. The Firm’s CRO, LOB CROs, LOB CEOs, heads of risk for Country Risk, Market Risk, Structural Interest Rate Risk, Liquidity Risk, Principal Risk, Wholesale Credit Risk, Consumer Credit Risk, Model Risk, Risk Management Policy, Reputation Risk Governance, Fiduciary Risk Governance, and Operational Risk Governance (all referred to as Firmwide Risk Executives) meet with and provide updates to the DRPC. Additionally, breaches in risk appetite tolerances, liquidity issues that may have a material adverse impact on the Firm and other significant matters as determined by the CRO or Firmwide functions with risk responsibility are escalated to the DRPC.
|
JPMorgan Chase & Co./2014 Annual Report
|
107
|
|
Management’s discussion and analysis
The Audit Committee
has primary responsibility for assisting the Board in its oversight of the system of controls designed to reasonably assure the quality and integrity of the Firm’s financial statements and that are relied upon to provide reasonable assurance of the Firm’s management of operational risk. The Audit Committee also assists the Board in its oversight of legal and compliance risk. Internal Audit, an independent function within the Firm that provides independent and objective assessments of the control environment, reports directly to the Audit Committee and administratively to the CEO. Internal Audit conducts independent reviews to
evaluate the Firm’s internal control structure and compliance with applicable regulatory requirements and is responsible for providing the Audit Committee, senior management and regulators with an independent assessment of the Firm’s ability to manage and control risk.
The Compensation & Management Development Committee
assists the Board in its oversight of the Firm’s compensation programs and reviews and approves the Firm’s overall compensation philosophy and practices. The Committee reviews the Firm’s compensation practices as they relate to risk and risk management in light of the Firm’s objectives, including its safety and soundness and the avoidance of practices that encourage excessive risk taking. The Committee reviews and approves the terms of compensation award programs, including recovery provisions, vesting periods, and restrictive covenants, taking into account regulatory requirements. The Committee also reviews and approves the Firm’s overall incentive compensation pools and reviews those of each of the Firm’s lines of business and the Corporate segment. The Committee reviews the goals relevant to compensation for the Firm’s Operating Committee, reviews Operating Committee members’ performance against such goals, and approves their compensation awards. The Committee recommends to the full Board’s independent directors, for ratification, the CEO’s compensation. In addition, the Committee periodically reviews the Firm’s management development and succession planning, as well as the Firm’s diversity programs.
Among the Firm’s senior management level committees that are primarily responsible for key risk-related functions are:
The Firmwide Risk Committee (“FRC”)
is the Firm’s highest management-level Risk Committee. It provides oversight of the risks inherent in the Firm’s businesses, including credit risk, market risk, liquidity risk, model risk, structural interest rate risk, principal risk and country risk. It also provides oversight of the governance frameworks for operational, fiduciary and reputational risks. The Committee is co-chaired by the Firm’s CEO and CRO. Members of the committee include the Firm’s COO, the Firm’s CFO, LOB CEOs, LOB CROs, General Counsel, and other senior managers from risk and control functions. This committee serves as an escalation point for risk topics and issues raised by its members, the Line of Business Risk Committees, Firmwide Control Committee, Firmwide
Fiduciary Risk Committee, Reputation Risk committees and regional Risk Committees. The committee escalates significant issues to the Board of Directors, as appropriate.
The Firmwide Control Committee (“FCC”)
is a forum to review and discuss firmwide operational risk, metrics and management, including existing and emerging issues, and execution against the operational risk management framework. The committee is co-chaired by the Firm’s Chief Control Officer and the head of Firmwide Operational Risk Governance/Model Risk and Development. It serves as an escalation point for the line of business, function and regional Control Committees and escalates significant issues to the Firmwide Risk Committee, as appropriate.
The Firmwide Fiduciary Risk Committee (“FFRC”)
is a forum for risk matters related to the Firm’s fiduciary activities and oversees the firmwide fiduciary risk governance framework, which supports the consistent identification and escalation of fiduciary risk matters by the relevant lines of business or corporate functions responsible for managing fiduciary activities. The committee escalates significant issues to the Firmwide Risk Committee and any other committee considered appropriate.
The Firmwide Reputation Risk Governance group
seeks to promote consistent management of reputational risk across the Firm. Its objectives are to increase visibility of reputation risk governance; promote and maintain a globally consistent governance model for reputation risk across lines of business; promote early self-identification of potential reputation risks to the Firm; and provide thought leadership on cross-line of business reputation risk issues.
Each line of business has a separate reputation risk governance structure which includes, in most cases, one or more dedicated reputation risk committees.
Line of business, corporate function, and regional risk and control committees:
Risk committees oversee the inherent risks in the respective line of business, function or region, including the review, assessment and decision making relating to specific risks, risk strategy, policy and controls. These committees escalate issues to the Firmwide Risk Committee, as appropriate.
Control committees oversee the operational risks and control environment of the respective line of business, function or region. These committees escalate operational risk issues to their respective line of business, function or regional Risk committee and also escalate significant risk issues (and/or risk issues with potential firmwide impact) to the Firmwide Control Committee.
The Asset-Liability Committee (“ALCO”),
chaired by the Corporate Treasurer under the direction of the COO, monitors the Firm’s overall balance sheet, liquidity risk and interest rate risk. ALCO is responsible for reviewing and approving the Firm’s funds transfer pricing policy (through which lines of business “transfer” interest rate and foreign exchange risk to Treasury). ALCO is responsible for reviewing the Firm’s Liquidity Risk Management and
|
108
|
JPMorgan Chase & Co./2014 Annual Report
|
|
Oversight Policy and contingency funding plan. ALCO also reviews the Firm’s overall structural interest rate risk position, funding requirements and strategy, and the Firm’s securitization programs (and any required liquidity support by the Firm of such programs).
The Capital Governance Committee,
chaired by the Head of Regulatory Capital Management Office (under the direction of the Firm’s CFO) is responsible for reviewing the Firm’s Capital Management Policy and the principles underlying capital issuance and distribution alternatives. The Committee is also responsible for governing the capital adequacy assessment process, including overall design, assumptions and risk streams and ensuring that capital stress test programs are designed to adequately capture the idiosyncratic risks across the Firm’s businesses.
Other corporate functions and forums with risk management-related responsibilities include:
The Firmwide Oversight and Control Group
is comprised of dedicated control officers within each of the lines of business and corporate functional areas, as well as a central oversight team. The group is charged with enhancing the Firm’s controls by looking within and across the lines of business and corporate functional areas to identify and control issues. The group enables the Firm to detect control problems more quickly, escalate issues promptly and get the right people involved to understand common themes and interdependencies among the various parts of the Firm. The group works closely with the Firm’s other control-related functions, including Compliance, Legal, Internal Audit and Risk Management, to effectively remediate identified control issues across all affected areas of the Firm. As a result, the group facilitates the effective execution of the Firm’s control framework and helps support operational risk management across the Firm.
The Firmwide Valuation Governance Forum (“VGF”)
is composed of senior finance and risk executives and is responsible for overseeing the management of risks arising from valuation activities conducted across the Firm. The VGF is chaired by the firmwide head of the Valuation Control function (under the direction of the Firm’s CFO), and also includes sub-forums for the CIB, Consumer & Community Banking, Commercial Banking, Asset Management and certain corporate functions, including Treasury and CIO.
In addition to the committees, forums and groups listed above, the Firm has other management committees and forums at the LOB and regional levels, where risk-related topics are discussed and escalated as necessary. The membership of these committees is composed of senior management of the Firm including representation from the business and various control functions. The committees meet regularly to discuss a broad range of topics.
The JPMorgan Chase Bank N.A. Board of Directors is responsible for the oversight of management on behalf of JPMorgan Chase Bank N.A. The JPMorgan Chase Bank N.A. Board accomplishes this function acting directly and through the principal standing committees of the Firm’s Board of Directors. Risk oversight on behalf of JPMorgan Chase Bank N.A. is primarily the responsibility of the Firm’s DRPC, Audit Committee and, with respect to compensation-related matters, the Compensation & Management Development Committee.
Risk appetite
The Firm’s overall risk appetite is established by management taking into consideration the Firm’s capital and liquidity positions, earnings power, and diversified business model. The risk appetite framework is a tool to measure the capacity to take risk and is expressed in loss tolerance parameters at the Firm and/or LOB levels, including net income loss tolerances, liquidity limits and market limits. Performance against these parameters informs management’s strategic decisions and is reported to the DRPC.
The Firm-level risk appetite parameters are set and approved by the Firm’s CEO, CFO, CRO and COO. LOB-level risk appetite parameters are set by the LOB CEO, CFO, and CRO and are approved by the Firm’s functional heads as noted above. Firmwide LOB diversification allows the sum of the LOBs’ loss tolerances to be greater than the Firmwide loss tolerance.
Risk identification for large exposures
The Firm has certain potential low-probability but plausible and material, idiosyncratic risks not well captured by its other existing risk analysis and reporting for credit, market, and other risks. These idiosyncratic risks may arise in a number of forms, e.g. changes in legislation, an unusual combination of market events, or specific counterparty events. These identified risks are grouped under the term Risk Identification for Large Exposures (“RIFLEs”). The identified and monitored RIFLEs allow the Firm to monitor earnings vulnerability that is not adequately covered by its other standard risk measurements.
|
JPMorgan Chase & Co./2014 Annual Report
|
109
|
|
Management’s discussion and analysis
|
CREDIT RISK MANAGEMENT
|
||||
Credit risk is the risk of loss arising from the default of a customer, client or counterparty. The Firm provides credit to a variety of customers, ranging from large corporate and institutional clients to individual consumers and small businesses. In its consumer businesses, the Firm is exposed to credit risk primarily through its residential real estate, credit card, auto, business banking and student lending businesses. Originated mortgage loans are retained in the mortgage portfolio, or securitized or sold to U.S. government agencies and U.S. government-sponsored enterprises; other types of consumer loans are typically retained on the balance sheet. In its wholesale businesses, the Firm is exposed to credit risk through its underwriting, lending and derivatives activities with and for clients and counterparties, as well as through its operating services activities, such as cash management and clearing activities. A portion of the loans originated or acquired by the Firm’s wholesale businesses are generally retained on the balance sheet; the Firm’s syndicated loan business distributes a significant percentage of originations into the market and is an important component of portfolio management.
Credit risk organization
Credit risk management is overseen by the Firm’s CRO. The Firm’s credit risk management governance consists of the following activities:
|
•
|
Establishing a comprehensive credit risk policy framework
|
|
•
|
Monitoring and managing credit risk across all portfolio segments, including transaction and line approval
|
|
•
|
Assigning and managing credit authorities in connection with the approval of all credit exposure
|
|
•
|
Managing criticized exposures and delinquent loans
|
|
•
|
Determining the allowance for credit losses and ensuring appropriate credit risk-based capital management
|
Risk identification and measurement
The Credit Risk Management function identifies, measures, limits, manages and monitors credit risk across our businesses. To measure credit risk, the Firm employs several methodologies for estimating the likelihood of obligor or counterparty default. Methodologies for measuring credit risk vary depending on several factors, including type of asset (e.g., consumer versus wholesale), risk measurement parameters (e.g., delinquency status and borrower’s credit score versus wholesale risk-rating) and risk management and collection processes (e.g., retail collection center versus centrally managed workout groups). Credit risk measurement is based on the probability of default of an obligor or counterparty, the loss severity given a default event and the exposure at default.
Based on these factors and related market-based inputs, the Firm estimates credit losses for its exposures. Probable credit losses inherent in the consumer and wholesale loan portfolios are reflected in the allowance for loan losses, and
probable credit losses inherent in lending-related commitments are reflected in the allowance for lending-related commitments. These losses are estimated using statistical analyses and other factors as described in Note 15. In addition, potential and unexpected credit losses are reflected in the allocation of credit risk capital and represent the potential volatility of actual losses relative to the established allowances for loan losses and lending-related commitments. The analyses for these losses include stress testing (considering alternative economic scenarios) as described in the Stress testing section below.
The methodologies used to estimate credit losses depend on the characteristics of the credit exposure, as described below.
Scored exposure
The scored portfolio is generally held in CCB and predominantly includes residential real estate loans, credit card loans, certain auto and business banking loans, and student loans. For the scored portfolio, credit loss estimates are based on statistical analysis of credit losses over discrete periods of time and are estimated using portfolio modeling, credit scoring, and decision-support tools, which consider loan-level factors such as delinquency status, credit scores, collateral values, and other risk factors. Credit loss analyses also consider, as appropriate, uncertainties and other factors, including those related to current macroeconomic and political conditions, the quality of underwriting standards, and other internal and external factors. The factors and analysis are updated on a quarterly basis or more frequently as market conditions dictate.
Risk-rated exposure
Risk-rated portfolios are generally held in CIB, CB and AM, but also include certain business banking and auto dealer loans held in CCB that are risk-rated because they have characteristics similar to commercial loans. For the risk-rated portfolio, credit loss estimates are based on estimates of the probability of default (“PD”) and loss severity given a default. The estimation process begins with risk-ratings that are assigned to each loan facility to differentiate risk within the portfolio. These risk ratings are reviewed regularly by Credit Risk management and revised as needed to reflect the borrower’s current financial position, risk profile and related collateral. The probability of default is the likelihood that a loan will default and not be fully repaid by the borrower. The loss given default (“LGD”) is the estimated loss on the loan that would be realized upon the default of the borrower and takes into consideration collateral and structural support for each credit facility. The probability of default is estimated for each borrower, and a loss given default is estimated for each credit facility. The calculations and assumptions are based on historic experience and management judgment and are reviewed regularly.
|
110
|
JPMorgan Chase & Co./2014 Annual Report
|
|
Stress testing
Stress testing is important in measuring and managing credit risk in the Firm’s credit portfolio. The process assesses the potential impact of alternative economic and business scenarios on estimated credit losses for the Firm. Economic scenarios, and the parameters underlying those scenarios, are defined centrally, are articulated in terms of macroeconomic factors, and applied across the businesses. The stress test results may indicate credit migration, changes in delinquency trends and potential losses in the credit portfolio. In addition to the periodic stress testing processes, management also considers additional stresses outside these scenarios, as necessary. The Firm uses stress testing to inform decisions on setting risk appetite both at a Firm and LOB level, as well as to assess the impact of stress on industry concentrations.
Risk monitoring and management
The Firm has developed policies and practices that are designed to preserve the independence and integrity of the approval and decision-making process of extending credit to ensure credit risks are assessed accurately, approved properly, monitored regularly and managed actively at both the transaction and portfolio levels. The policy framework establishes credit approval authorities, concentration limits, risk-rating methodologies, portfolio review parameters and guidelines for management of distressed exposures. In addition, certain models, assumptions and inputs used in evaluating and monitoring credit risk are independently validated by groups that are separate from the line of businesses.
For consumer credit risk, delinquency and other trends, including any concentrations at the portfolio level, are monitored, as certain of these trends can be modified through changes in underwriting policies and portfolio guidelines. Consumer Risk Management evaluates delinquency and other trends against business expectations, current and forecasted economic conditions, and industry benchmarks. Historical and forecasted trends are incorporated into the modeling of estimated consumer credit losses and are part of the monitoring of the credit risk profile of the portfolio. Under the Firm’s model risk policy, new significant risk management models, as well as major changes to such models, are required to be reviewed and approved by the Model Review Group prior to implementation into the operating environment. Internal Audit also periodically tests the internal controls around the modeling process including the integrity of the data utilized. For a discussion of the Model Review Group, see
page 139
. For further discussion of consumer loans, see Note 14.
Wholesale credit risk is monitored regularly at an aggregate portfolio, industry and individual client and counterparty level with established concentration limits that are reviewed and revised as deemed appropriate by management, typically on an annual basis. Industry and counterparty limits, as measured in terms of exposure and economic credit risk capital, are subject to stress-based loss constraints.
Management of the Firm’s wholesale credit risk exposure is accomplished through a number of means, including:
|
•
|
Loan underwriting and credit approval process
|
|
•
|
Loan syndications and participations
|
|
•
|
Loan sales and securitizations
|
|
•
|
Credit derivatives
|
|
•
|
Master netting agreements
|
|
•
|
Collateral and other risk-reduction techniques
|
In addition to Risk Management, Internal Audit performs periodic exams, as well as continuous review, where appropriate, of the Firm’s consumer and wholesale portfolios. For risk-rated portfolios, a credit review group within Internal Audit is responsible for:
|
•
|
Independently assessing and validating the changing risk grades assigned to exposures; and
|
|
•
|
Evaluating the effectiveness of business units’ risk-ratings, including the accuracy and consistency of risk grades, the timeliness of risk grade changes and the justification of risk grades in credit memoranda
|
Risk reporting
To enable monitoring of credit risk and effective decision-making, aggregate credit exposure, credit quality forecasts, concentration levels and risk profile changes are reported regularly to senior Credit Risk Management. Detailed portfolio reporting of industry, customer, product and geographic concentrations occurs monthly, and the appropriateness of the allowance for credit losses is reviewed by senior management at least on a quarterly basis. Through the risk reporting and governance structure, credit risk trends and limit exceptions are provided regularly to, and discussed with, senior management and the Board of Directors as appropriate.
|
JPMorgan Chase & Co./2014 Annual Report
|
111
|
|
Management’s discussion and analysis
|
CREDIT PORTFOLIO
|
||||
2014
Credit Risk Overview
In
2014
, the consumer credit environment continued to improve and the wholesale credit environment remained favorable. Over the course of the year, the Firm continued to actively manage its underperforming and nonaccrual loans and reduce such exposures through loan restructurings, loan sales and workouts. The Firm saw decreased downgrade, default and charge-off activity and improved consumer delinquency trends. The Firm increased its overall lending activity in both wholesale and consumer businesses. The combination of these factors resulted in an improvement in the credit quality of the portfolio compared with
2013
and contributed to the Firm’s reduction in the allowance for credit losses. For further discussion of the consumer credit environment and consumer loans, see Consumer Credit Portfolio on
pages 113–119
and Note 14. For further discussion of wholesale credit environment and wholesale loans, see Wholesale Credit Portfolio on
pages 120–127
and Note 14.
In the following tables, reported loans include loans retained (i.e., held-for-investment); loans held-for-sale (which are carried at the lower of cost or fair value, with valuation changes recorded in noninterest revenue); and certain loans accounted for at fair value. In addition, the Firm records certain loans accounted for at fair value in trading assets. For further information regarding these loans, see Note 3 and Note 4. For additional information on the Firm’s loans and derivative receivables, including the Firm’s accounting policies, see Note 14 and Note 6.
For further information regarding the credit risk inherent in the Firm’s investment securities portfolio, see Note 12.
|
Total credit portfolio
|
|||||||||||||
|
December 31,
(in millions)
|
Credit exposure
|
Nonperforming
(b)(c)(d)
|
|||||||||||
|
2014
|
2013
|
2014
|
2013
|
||||||||||
|
Loans retained
|
$
|
747,508
|
|
$
|
724,177
|
|
$
|
7,017
|
|
$
|
8,317
|
|
|
|
Loans held-for-sale
|
7,217
|
|
12,230
|
|
95
|
|
26
|
|
|||||
|
Loans at fair value
|
2,611
|
|
2,011
|
|
21
|
|
197
|
|
|||||
|
Total loans – reported
|
757,336
|
|
738,418
|
|
7,133
|
|
8,540
|
|
|||||
|
Derivative receivables
|
78,975
|
|
65,759
|
|
275
|
|
415
|
|
|||||
|
Receivables from customers and other
|
29,080
|
|
26,883
|
|
—
|
|
—
|
|
|||||
|
Total credit-related assets
|
865,391
|
|
831,060
|
|
7,408
|
|
8,955
|
|
|||||
|
Assets acquired in loan satisfactions
|
|||||||||||||
|
Real estate owned
|
NA
|
|
NA
|
|
515
|
|
710
|
|
|||||
|
Other
|
NA
|
|
NA
|
|
44
|
|
41
|
|
|||||
|
Total
assets acquired in loan satisfactions
|
NA
|
|
NA
|
|
559
|
|
751
|
|
|||||
|
Total assets
|
865,391
|
|
831,060
|
|
7,967
|
|
9,706
|
|
|||||
|
Lending-related commitments
|
1,056,172
|
|
1,031,672
|
|
103
|
|
206
|
|
|||||
|
Total credit portfolio
|
$
|
1,921,563
|
|
$
|
1,862,732
|
|
$
|
8,070
|
|
$
|
9,912
|
|
|
|
Credit Portfolio Management derivatives notional, net
(a)
|
$
|
(26,703
|
)
|
$
|
(27,996
|
)
|
$
|
—
|
|
$
|
(5
|
)
|
|
|
Liquid securities and other cash collateral held against derivatives
|
(19,604
|
)
|
(14,435
|
)
|
NA
|
|
NA
|
|
|||||
|
Year ended December 31,
(in millions, except ratios)
|
2014
|
2013
|
|||||
|
Net charge-offs
|
$
|
4,759
|
|
$
|
5,802
|
|
|
|
Average retained loans
|
|||||||
|
Loans – reported
|
729,876
|
|
720,152
|
|
|||
|
Loans – reported, excluding
residential real estate PCI loans
|
679,869
|
|
663,629
|
|
|||
|
Net charge-off rates
|
|||||||
|
Loans – reported
|
0.65
|
%
|
0.81
|
%
|
|||
|
Loans – reported, excluding PCI
|
0.70
|
|
0.87
|
|
|||
|
(a)
|
Represents the net notional amount of protection purchased and sold through credit derivatives used to manage both performing and nonperforming wholesale credit exposures; these derivatives do not qualify for hedge accounting under U.S. GAAP. For additional information, see Credit derivatives on
page 127
and Note 6.
|
|
(b)
|
Excludes PCI loans. The Firm is recognizing interest income on each pool of PCI loans as they are all performing.
|
|
(c)
|
At
December 31, 2014
and
2013
, nonperforming assets excluded: (1) mortgage loans insured by U.S. government agencies of
$7.8 billion
and
$8.4 billion
, respectively, that are 90 or more days past due; (2) student loans insured by U.S. government agencies under the FFELP of
$367 million
and
$428 million
, respectively, that are 90 or more days past due; and (3) real estate owned (“REO”) insured by U.S. government agencies of
$462 million
and
$2.0 billion
, respectively. These amounts have been excluded based upon the government guarantee. In addition, the Firm’s policy is generally to exempt credit card loans from being placed on nonaccrual status as permitted by regulatory guidance issued by the Federal Financial Institutions Examination Council (“FFIEC”).
|
|
(d)
|
At
December 31, 2014
and
2013
, total nonaccrual loans represented
0.94%
and
1.16%
, respectively, of total loans.
|
|
112
|
JPMorgan Chase & Co./2014 Annual Report
|
|
|
CONSUMER CREDIT PORTFOLIO
|
||||
The Firm’s consumer portfolio consists primarily of residential real estate loans, credit card loans, auto loans, business banking loans, and student loans. The Firm’s focus is on serving the prime segment of the consumer credit market. For further information on consumer loans, see
Note 14.
The credit performance of the consumer portfolio continues to benefit from the improvement in the economy and home prices. Both early-stage delinquencies (30–89 days delinquent) and late-stage delinquencies (150+ days delinquent) for residential real estate, excluding government
guaranteed loans, declined from
December 31, 2013
. Although late-stage delinquencies declined, they remain elevated due to loss-mitigation activities and to elongated foreclosure processing timelines. Losses related to these loans continue to be recognized in accordance with the Firm’s standard charge-off practices, but some delinquent loans that would otherwise have been foreclosed upon remain in the mortgage and home equity loan portfolios.
The Credit Card 30+ day delinquency rate remains near historic lows.
The following table presents consumer credit-related information with respect to the credit portfolio held by CCB, prime mortgage and home equity loans held by AM, and prime mortgage loans held by Corpora
te.
For further information about the Firm’s nonaccrual and charge-off accounting policies, see Note 14.
|
Consumer credit portfolio
|
||||||||||||||||||||||||||
|
As of or for the year ended December 31,
(in millions, except ratios)
|
Credit exposure
|
Nonaccrual loans
(f)(g)
|
Net charge-offs/(recoveries)
(h)
|
Average annual net charge-off/(recovery) rate
(h)(i)
|
||||||||||||||||||||||
|
2014
|
2013
|
2014
|
2013
|
2014
|
2013
|
2014
|
2013
|
|||||||||||||||||||
|
Consumer, excluding credit card
|
||||||||||||||||||||||||||
|
Loans, excluding PCI loans and loans held-for-sale
|
||||||||||||||||||||||||||
|
Home equity – senior lien
|
$
|
16,367
|
|
$
|
17,113
|
|
$
|
938
|
|
$
|
932
|
|
$
|
82
|
|
$
|
132
|
|
0.50
|
%
|
0.72
|
%
|
||||
|
Home equity – junior lien
|
36,375
|
|
40,750
|
|
1,590
|
|
1,876
|
|
391
|
|
834
|
|
1.03
|
|
1.90
|
|
||||||||||
|
Prime mortgage, including option ARMs
|
104,921
|
|
87,162
|
|
2,190
|
|
2,666
|
|
39
|
|
59
|
|
0.04
|
|
0.07
|
|
||||||||||
|
Subprime mortgage
|
5,056
|
|
7,104
|
|
1,036
|
|
1,390
|
|
(27
|
)
|
90
|
|
(0.43
|
)
|
1.17
|
|
||||||||||
|
Auto
(a)
|
54,536
|
|
52,757
|
|
115
|
|
161
|
|
181
|
|
158
|
|
0.34
|
|
0.31
|
|
||||||||||
|
Business banking
|
20,058
|
|
18,951
|
|
279
|
|
385
|
|
305
|
|
337
|
|
1.58
|
|
1.81
|
|
||||||||||
|
Student and other
|
10,970
|
|
11,557
|
|
270
|
|
86
|
|
347
|
|
297
|
|
3.07
|
|
2.51
|
|
||||||||||
|
Total loans, excluding PCI loans and loans held-for-sale
|
248,283
|
|
235,394
|
|
6,418
|
|
7,496
|
|
1,318
|
|
1,907
|
|
0.55
|
|
0.82
|
|
||||||||||
|
Loans – PCI
|
||||||||||||||||||||||||||
|
Home equity
|
17,095
|
|
18,927
|
|
NA
|
|
NA
|
|
NA
|
|
NA
|
|
NA
|
|
NA
|
|
||||||||||
|
Prime mortgage
|
10,220
|
|
12,038
|
|
NA
|
|
NA
|
|
NA
|
|
NA
|
|
NA
|
|
NA
|
|
||||||||||
|
Subprime mortgage
|
3,673
|
|
4,175
|
|
NA
|
|
NA
|
|
NA
|
|
NA
|
|
NA
|
|
NA
|
|
||||||||||
|
Option ARMs
|
15,708
|
|
17,915
|
|
NA
|
|
NA
|
|
NA
|
|
NA
|
|
NA
|
|
NA
|
|
||||||||||
|
Total loans – PCI
|
46,696
|
|
53,055
|
|
NA
|
|
NA
|
|
NA
|
|
NA
|
|
NA
|
|
NA
|
|
||||||||||
|
Total loans – retained
|
294,979
|
|
288,449
|
|
6,418
|
|
7,496
|
|
1,318
|
|
1,907
|
|
0.46
|
|
0.66
|
|
||||||||||
|
Loans held-for-sale
|
395
|
|
(e)
|
614
|
|
(e)
|
91
|
|
—
|
|
—
|
|
—
|
|
—
|
|
—
|
|
||||||||
|
Total consumer, excluding credit card loans
|
295,374
|
|
289,063
|
|
6,509
|
|
7,496
|
|
1,318
|
|
1,907
|
|
0.46
|
|
0.66
|
|
||||||||||
|
Lending-related commitments
(b)
|
58,153
|
|
56,057
|
|
||||||||||||||||||||||
|
Receivables from customers
(c)
|
108
|
|
139
|
|
||||||||||||||||||||||
|
Total consumer exposure, excluding credit card
|
353,635
|
|
345,259
|
|
||||||||||||||||||||||
|
Credit Card
|
||||||||||||||||||||||||||
|
Loans retained
(d)
|
128,027
|
|
127,465
|
|
—
|
|
—
|
|
3,429
|
|
3,879
|
|
2.75
|
|
3.14
|
|
||||||||||
|
Loans held-for-sale
|
3,021
|
|
326
|
|
—
|
|
—
|
|
—
|
|
—
|
|
—
|
|
—
|
|
||||||||||
|
Total credit card loans
|
131,048
|
|
127,791
|
|
—
|
|
—
|
|
3,429
|
|
3,879
|
|
2.75
|
|
3.14
|
|
||||||||||
|
Lending-related commitments
(b)
|
525,963
|
|
529,383
|
|
||||||||||||||||||||||
|
Total credit card exposure
|
657,011
|
|
657,174
|
|
||||||||||||||||||||||
|
Total consumer credit portfolio
|
$
|
1,010,646
|
|
$
|
1,002,433
|
|
$
|
6,509
|
|
$
|
7,496
|
|
$
|
4,747
|
|
$
|
5,786
|
|
1.15
|
%
|
1.40
|
%
|
||||
|
Memo: Total consumer credit portfolio, excluding PCI
|
$
|
963,950
|
|
$
|
949,378
|
|
$
|
6,509
|
|
$
|
7,496
|
|
$
|
4,747
|
|
$
|
5,786
|
|
1.30
|
%
|
1.62
|
%
|
||||
|
(a)
|
At
December 31, 2014
and
2013
, excluded operating lease-related assets of
$6.7 billion
and
$5.5 billion
, respectively.
|
|
(b)
|
Credit card and home equity lending-related commitments represent the total available lines of credit for these products. The Firm has not experienced, and does not anticipate, that all available lines of credit would be used at the same time. For credit card and home equity commitments (if certain conditions are met), the Firm can reduce or cancel these lines of credit by providing the borrower notice or, in some cases as permitted by law, without notice.
|
|
(c)
|
Receivables from customers represent margin loans to retail brokerage customers, and are included in accrued interest and accounts receivable on the Consolidated balance sheets.
|
|
JPMorgan Chase & Co./2014 Annual Report
|
113
|
|
Management’s discussion and analysis
|
(d)
|
Includes accrued interest and fees net of an allowance for the uncollectible portion of accrued interest and fee income.
|
|
(e)
|
Predominantly represents prime mortgage loans held-for-sale.
|
|
(f)
|
At
December 31, 2014
and
2013
, nonaccrual loans excluded: (1) mortgage loans insured by U.S. government agencies of
$7.8 billion
and
$8.4 billion
, respectively, that are 90 or more days past due; and (2) student loans insured by U.S. government agencies under the FFELP of
$367 million
and
$428 million
, respectively, that are 90 or more days past due. These amounts have been excluded from nonaccrual loans based upon the government guarantee. In addition, the Firm’s policy is generally to exempt credit card loans from being placed on nonaccrual status as permitted by regulatory guidance.
|
|
(g)
|
Excludes PCI loans. The Firm is recognizing interest income on each pool of PCI loans as they are all performing.
|
|
(h)
|
Net charge-offs and net charge-off rates excluded
$533 million
and
$53 million
of write-offs of prime mortgages in the PCI portfolio for the years ended
December 31, 2014
and
2013
. These write-offs decreased the allowance for loan losses for PCI loans. See Allowance for Credit Losses on
pages 128–130
for further details.
|
|
(i)
|
Average consumer loans held-for-sale were
$917 million
and
$209 million
, respectively, for the years ended
December 31, 2014
and
2013
. These amounts were excluded when calculating net charge-off rates.
|
Consumer, excluding credit card
Portfolio analysis
Consumer loan balances increased during the year ended
December 31, 2014
, due to prime mortgage, business banking and auto loan originations, partially offset by paydowns and the charge-off or liquidation of delinquent loans. Credit performance has improved across most portfolios but delinquent residential real estate loans and home equity charge-offs remain elevated compared with pre-recessionary levels.
In the following discussion of loan and lending-related categories, PCI loans are excluded from individual loan product discussions and are addressed separately below. For further information about the Firm’s consumer portfolio, including information about delinquencies, loan modifications and other credit quality indicators, see
Note 14.
Home equity:
The home equity portfolio declined from
December 31, 2013
primarily reflecting loan paydowns and charge-offs. Early-stage delinquencies showed improvement from
December 31, 2013
. Late-stage delinquencies continue to be elevated as improvement in the number of loans becoming severely delinquent was offset by a higher number of loans remaining in late-stage delinquency due to higher average carrying values on these delinquent loans, reflecting improving collateral values. Senior lien nonaccrual loans were flat compared with the prior year while junior lien nonaccrual loans decreased in 2014. Net charge-offs for both senior and junior lien home equity loans declined when compared with the prior year as a result of improvement in home prices and delinquencies.
Approximately
15%
of the Firm’s home equity portfolio consists of home equity loans (“HELOANs”) and the remainder consists of home equity lines of credit (“HELOCs”). HELOANs are generally fixed-rate, closed-end, amortizing loans, with terms ranging from 3–30 years. Approximately half of the HELOANs are senior liens and the remainder are junior liens. In general, HELOCs originated by the Firm are revolving loans for a 10-year period, after which time the HELOC recasts into a loan with a 20-year amortization period. At the time of origination, the borrower typically selects one of two minimum payment options that will generally remain in effect during the revolving period: a monthly payment of 1% of the outstanding balance, or interest-only payments based on a variable index (typically Prime). HELOCs originated by Washington Mutual were generally revolving loans for a 10-year period, after which time the HELOC converts to an
interest-only loan with a balloon payment at the end of the loan’s term.
The unpaid principal balance of non-PCI HELOCs outstanding was
$47 billion
at
December 31, 2014
. Of the
$47 billion
, approximately
$29 billion
have recently recast or are scheduled to recast from interest-only to fully amortizing payments, with
$3 billion
having recast in 2014;
$6 billion
,
$7 billion
, and
$6 billion
are scheduled to recast in 2015, 2016, and 2017, respectively; and $7 billion is scheduled to recast after 2017. However, of the total
$26 billion
still remaining to recast,
$18 billion
are expected to actually recast; and the remaining
$8 billion
represents loans to borrowers who are expected either to pre-pay or charge-off prior to recast. In the third quarter of 2014, the Firm refined its approach for estimating the number of HELOCs expected to voluntarily pre-pay prior to recast. Based on the refined methodology, the number of loans expected to pre-pay declined, resulting in an increase in the number of loans expected to recast. The Firm has considered this payment recast risk in its allowance for loan losses based upon the estimated amount of payment shock (i.e., the excess of the fully-amortizing payment over the interest-only payment in effect prior to recast) expected to occur at the payment recast date, along with the corresponding estimated probability of default and loss severity assumptions. Certain factors, such as future developments in both unemployment rates and home prices, could have a significant impact on the performance of these loans.
The Firm manages the risk of HELOCs during their revolving period by closing or reducing the undrawn line to the extent permitted by law when borrowers are exhibiting a material deterioration in their credit risk profile. The Firm will continue to evaluate both the near-term and longer-term repricing and recast risks inherent in its HELOC portfolio to ensure that changes in the Firm’s estimate of incurred losses are appropriately considered in the allowance for loan losses and that the Firm’s account management practices are appropriate given the portfolio’s risk profile.
High-risk seconds are loans where the borrower has a first mortgage loan that is either delinquent or has been modified. Such loans are considered to pose a higher risk of default than junior lien loans for which the senior lien is neither delinquent nor modified. At
December 31, 2014
, the Firm estimated that its home equity portfolio contained approximately
$1.8 billion
of current high-risk seconds, compared with
$2.3 billion
at
December 31, 2013
. The Firm estimates the balance of its total exposure to high-risk seconds on a quarterly basis using internal data and loan
|
114
|
JPMorgan Chase & Co./2014 Annual Report
|
|
level credit bureau data (which typically provides the delinquency status of the senior lien). The estimated balance of these high-risk seconds may vary from quarter to quarter for reasons such as the movement of related senior liens into and out of the 30+ day delinquency bucket.
|
Current high-risk seconds
|
||||||||||
|
December 31, (in billions)
|
2014
|
2013
|
||||||||
|
Junior liens subordinate to:
|
||||||||||
|
Modified current senior lien
|
$
|
0.7
|
|
$
|
0.9
|
|
||||
|
Senior lien 30 – 89 days delinquent
|
0.5
|
|
0.6
|
|
||||||
|
Senior lien 90 days or more delinquent
(a)
|
0.6
|
|
0.8
|
|
||||||
|
Total current high-risk seconds
|
$
|
1.8
|
|
$
|
2.3
|
|
||||
|
(a)
|
Junior liens subordinate to senior liens that are 90 days or more past due are classified as nonaccrual loans. At
December 31, 2014
and
2013
, excluded approximately
$50 million
and approximately
$100 million
, respectively, of junior liens that are performing but not current, which were placed on nonaccrual in accordance with the regulatory guidance.
|
Of the estimated
$1.8 billion
of current high-risk seconds at
December 31, 2014
, the Firm owns approximately
10%
and services approximately
25%
of the related senior lien loans to the same borrowers. The performance of the Firm’s junior lien loans is generally consistent regardless of whether the Firm owns, services or does not own or service the senior lien. The increased probability of default associated with these higher-risk junior lien loans was considered in estimating the allowance for loan losses.
Mortgage:
Prime mortgages, including option adjustable-rate mortgages (“ARMs”) and loans held-for-sale, increased from
December 31, 2013
due to higher retained originations partially offset by paydowns, the run-off of option ARM loans and the charge-off or liquidation of delinquent loans. Excluding loans insured by U.S. government agencies, both early-stage and late-stage delinquencies showed improvement from
December 31, 2013
. Nonaccrual loans decreased from the prior year but remain elevated primarily due to loss mitigation activities and elongated foreclosure processing timelines. Net charge-offs remain low, reflecting continued improvement in home prices and delinquencies.
At
December 31, 2014
and
2013
, the Firm’s prime mortgage portfolio included
$12.4 billion
and
$14.3 billion
, respectively, of mortgage loans insured and/or guaranteed by U.S. government agencies, of which
$9.7 billion
and
$9.6 billion
, respectively, were 30 days or more past due (of these past due loans,
$7.8 billion
and
$8.4 billion
, respectively, were 90 days or more past due). The Firm has entered into a settlement regarding loans insured under federal mortgage insurance programs overseen by the FHA, HUD, and VA; the Firm will continue to monitor exposure on future claim payments for government insured loans, but any financial impact related to exposure on future claims is not expected to be significant and was considered in estimating the allowance for loan losses. For further discussion of the settlement, see Note 31.
At
December 31, 2014
and
2013
, the Firm’s prime mortgage portfolio included
$16.3 billion
and
$15.6 billion
, respectively, of interest-only loans, which represented
15%
and
18%
, respectively, of the prime mortgage portfolio. These loans have an interest-only payment period generally followed by an adjustable-rate or fixed-rate fully amortizing payment period to maturity and are typically originated as higher-balance loans to higher-income borrowers. To date, losses on this portfolio generally have been consistent with the broader prime mortgage portfolio and the Firm’s expectations. The Firm continues to monitor the risks associated with these loans.
Subprime mortgages continued to decrease due to portfolio runoff. Early-stage and late-stage delinquencies have improved from
December 31, 2013
, but remain at elevated levels. Net charge-offs continued to improve as a result of improvement in home prices and delinquencies.
Auto
: Auto loans increased from
December 31, 2013
as new originations outpaced paydowns and payoffs. Nonaccrual loans improved compared with
December 31, 2013
. Net charge-offs for the year ended
December 31, 2014
increased compared with the prior year, reflecting higher average loss per default as national used car valuations declined from historically strong levels. The auto loan portfolio reflects a high concentration of prime-quality credits.
Business banking:
Business banking loans increased from
December 31, 2013
due to an increase in loan originations. Nonaccrual loans improved compared with
December 31, 2013
. Net charge-offs for the year ended
December 31, 2014
decreased from the prior year.
Student and other:
Student and other loans decreased from
December 31, 2013
due primarily to the run-off of the student loan portfolio. Student nonaccrual loans increased from December 31, 2013 due to a modification program began in May 2014 that extended the deferment period for up to 24 months for certain student loans, which resulted in extending the maturity of these loans at their original contractual interest rates.
Purchased credit-impaired loans:
PCI loans acquired in the Washington Mutual transaction decreased as the portfolio continues to run off.
As of
December 31, 2014
, approximately
16%
of the option ARM PCI loans were delinquent and approximately
57%
of the portfolio has been modified into fixed-rate, fully amortizing loans. Substantially all of the remaining loans are making amortizing payments, although such payments are not necessarily fully amortizing. This latter group of loans is subject to the risk of payment shock due to future payment recast. Default rates generally increase on option ARM loans when payment recast results in a payment increase. The expected increase in default rates is considered in the Firm’s quarterly impairment assessment.
|
JPMorgan Chase & Co./2014 Annual Report
|
115
|
|
Management’s discussion and analysis
The following table provides a summary of lifetime principal loss estimates included in either the nonaccretable difference or the allowance for loan losses.
|
Summary of lifetime principal loss estimates
|
|||||||||||||||
|
December 31,
(in billions)
|
Lifetime loss
estimates
(a)
|
LTD liquidation
losses
(b)
|
|||||||||||||
|
2014
|
2013
|
2014
|
2013
|
||||||||||||
|
Home equity
|
$
|
14.6
|
|
$
|
14.7
|
|
$
|
12.4
|
|
$
|
12.1
|
|
|||
|
Prime mortgage
|
3.8
|
|
3.8
|
|
3.5
|
|
3.3
|
|
|||||||
|
Subprime mortgage
|
3.3
|
|
3.3
|
|
2.8
|
|
2.6
|
|
|||||||
|
Option ARMs
|
9.9
|
|
10.2
|
|
9.3
|
|
8.8
|
|
|||||||
|
Total
|
$
|
31.6
|
|
$
|
32.0
|
|
$
|
28.0
|
|
$
|
26.8
|
|
|||
|
(a)
|
Includes the original nonaccretable difference established in purchase accounting of
$30.5 billion
for principal losses plus additional principal losses recognized subsequent to acquisition through the provision and
|
allowance for loan losses. The remaining nonaccretable difference for principal losses was
$2.3 billion
and
$3.8 billion
at
December 31, 2014
and
2013
, respectively.
|
(b)
|
Life-to-date (“LTD”) liquidation losses represent both realization of loss upon loan resolution and any principal forgiven upon modification.
|
Lifetime principal
loss estimates declined from
December 31, 2013
, to
December 31, 2014
, reflecting improvement in home prices and delinquencies. The decline in lifetime principal loss estimates during the year ended
December 31, 2014
, resulted in a
$300 million
reduction of the PCI allowance for loan losses related to option ARM loans. In addition, for the year ended
December 31, 2014
, PCI write-offs of
$533 million
were recorded against the prime mortgage allowance for loan losses. For further information on the Firm’s PCI loans, including write-offs, see Note 14.
Geographic composition of residential real estate loans
At
December 31, 2014
,
$94.3 billion
, or
63%
of total retained residential real estate loan portfolio, excluding mortgage loans insured by U.S. government agencies and PCI loans, were concentrated in California, New York, Illinois, Florida and Texas, compared with
$85.9 billion
, or
62%
, at
December 31, 2013
. California had the greatest concentration of these loans with
26%
at
December 31, 2014
, compared with
25%
at
December 31, 2013
. The unpaid principal balance of PCI loans concentrated in these five states represented
74%
of total PCI loans at both
December 31, 2014
and
December 31, 2013
. For further information on the geographic composition of the Firm’s residential real estate loans, see Note 14.
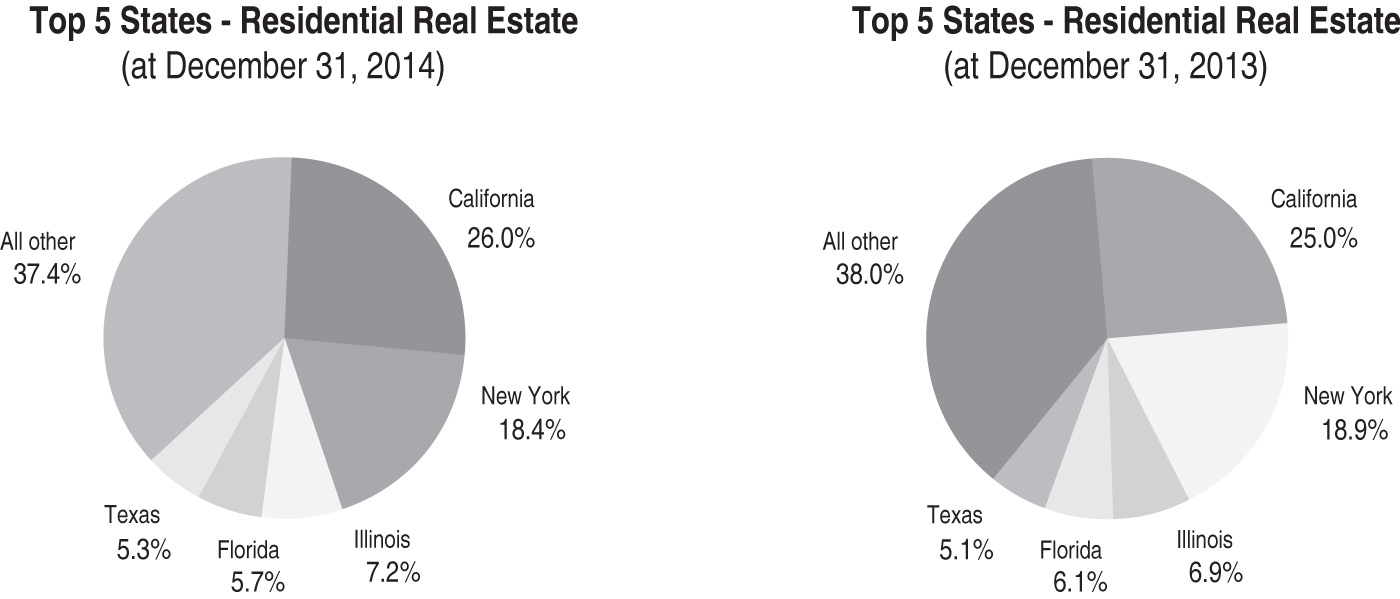
Current estimated LTVs of residential real estate loans
The current estimated average loan-to-value (“LTV”) ratio for residential real estate loans retained, excluding mortgage loans insured by U.S. government agencies and PCI loans, was
71%
at
December 31, 2014
, compared with
75%
at
December 31, 2013
.
Although home prices continue to recover, the decline in
home prices since 2007 has had a significant impact on the collateral values underlying the Firm’s residential real estate loan portfolio. In general, the delinquency rate for loans with high LTV ratios is greater than the delinquency rate for loans in which the borrower has greater equity in the collateral. While a large portion of the loans with current estimated LTV ratios greater than 100% continue to pay and are current, the continued willingness and ability of these borrowers to pay remains a risk.
|
116
|
JPMorgan Chase & Co./2014 Annual Report
|
|
The following table presents the current estimated LTV ratios for PCI loans, as well as the ratios of the carrying value of the underlying loans to the current estimated collateral value. Because such loans were initially measured at fair value, the ratios of the carrying value to the current estimated collateral value will be lower than the current estimated LTV ratios, which are based on the unpaid principal balances. The estimated collateral values used to calculate these ratios do not represent actual appraised loan-level collateral values; as such, the resulting ratios are necessarily imprecise and should therefore be viewed as estimates.
|
LTV ratios and ratios of carrying values to current estimated collateral values – PCI loans
|
||||||||||||||||||||||||
|
2014
|
2013
|
|||||||||||||||||||||||
|
December 31,
(in millions,
except ratios)
|
Unpaid principal balance
|
Current estimated
LTV ratio
(a)
|
Net carrying value
(c)
|
Ratio of net
carrying value
to current estimated
collateral value
(c)
|
Unpaid principal
balance
|
Current estimated
LTV ratio
(a)
|
Net carrying value
(c)
|
Ratio of net
carrying value
to current estimated
collateral value
(c)
|
||||||||||||||||
|
Home equity
|
$
|
17,740
|
|
83
|
%
|
(b)
|
$
|
15,337
|
|
72
|
%
|
$
|
19,830
|
|
90
|
%
|
(b)
|
$
|
17,169
|
|
78
|
%
|
||
|
Prime mortgage
|
10,249
|
|
76
|
|
9,027
|
|
67
|
|
11,876
|
|
83
|
|
10,312
|
|
72
|
|
||||||||
|
Subprime mortgage
|
4,652
|
|
82
|
|
3,493
|
|
62
|
|
5,471
|
|
91
|
|
3,995
|
|
66
|
|
||||||||
|
Option ARMs
|
16,496
|
|
74
|
|
15,514
|
|
70
|
|
19,223
|
|
82
|
|
17,421
|
|
74
|
|
||||||||
|
(a)
|
Represents the aggregate unpaid principal balance of loans divided by the estimated current property value. Current property values are estimated at least quarterly based on home valuation models that utilize nationally recognized home price index valuation estimates; such models incorporate actual data to the extent available and forecasted data where actual data is not available.
|
|
(b)
|
Represents current estimated combined LTV for junior home equity liens, which considers all available lien positions, as well as unused lines, related to the property. All other products are presented without consideration of subordinate liens on the property.
|
|
(c)
|
Net carrying value includes the effect of fair value adjustments that were applied to the consumer PCI portfolio at the date of acquisition and is also net of the allowance for loan losses at
December 31, 2014
and
2013
of
$1.2 billion
and
$1.7 billion
for prime mortgage,
$194 million
and
$494 million
for option ARMs, respectively, and
$1.8 billion
for home equity and
$180 million
for subprime mortgage for both periods.
|
The current estimated average LTV ratios were
77%
and
88%
for California and Florida PCI loans, respectively, at
December 31, 2014
, compared with
85%
and
103%
, respectively, at
December 31, 2013
. Average LTV ratios have declined consistent with recent improvements in home prices. Although home prices have improved, home prices in most areas of California and Florida are still lower than at the peak of the housing market; this continues to negatively contribute to current estimated average LTV ratios and the ratio of net carrying value to current estimated collateral value for loans in the PCI portfolio. Of the total PCI portfolio,
15%
had a current estimated LTV ratio greater than 100%, and
3%
had a current LTV ratio of greater than 125% at
December 31, 2014
, compared with
26%
and
7%
, respectively, at
December 31, 2013
.
While the current estimated collateral value is greater than the net carrying value of PCI loans, the ultimate performance of this portfolio is highly dependent on borrowers’ behavior and ongoing ability and willingness to continue to make payments on homes with negative equity, as well as on the cost of alternative housing.
For further information on current estimated LTVs of residential real estate loans, see Note 14.
Loan modification activities – residential real estate loans
The performance of modified loans generally differs by product type due to differences in both the credit quality and the types of modifications provided. Performance metrics for the residential real estate portfolio, excluding PCI loans, that have been modified and seasoned more than six months show weighted-average redefault rates of
20%
for senior lien home equity,
22%
for junior lien home equity,
16%
for prime mortgages including option ARMs, and
29%
for subprime mortgages. The cumulative performance metrics for the PCI residential real estate
portfolio modified and seasoned more than six months show weighted average redefault rates of
20%
for home equity,
17%
for prime mortgages,
15%
for option ARMs and
32%
for subprime mortgages. The favorable performance of the PCI option ARM modifications is the result of a targeted proactive program which fixed the borrower’s payment to the amount at the point of modification. The cumulative redefault rates reflect the performance of modifications completed under both the Home Affordable Modification Program (“HAMP”) and the Firm’s proprietary modification programs (primarily the Firm’s modification program that was modeled after HAMP) from October 1, 2009, through
December 31, 2014
.
Certain loans that were modified under HAMP and the Firm’s proprietary modification programs have interest rate reset provisions (“step-rate modifications”). Interest rates on these loans will generally increase beginning in 2014 by 1% per year until the rate reaches a specified cap, typically at a prevailing market interest rate for a fixed-rate loan as of the modification date. The carrying value of non-PCI loans modified in step-rate modifications was
$5 billion
at
December 31, 2014
, with
$1 billion
scheduled to experience the initial interest rate increase in each of 2015 and 2016. The unpaid principal balance of PCI loans modified in step-rate modifications was
$10 billion
at
December 31, 2014
, with
$2 billion
and
$3 billion
scheduled to experience the initial interest rate increase in 2015 and 2016, respectively. The impact of these potential interest rate increases is considered in the Firm’s allowance for loan losses. The Firm will continue to monitor this risk exposure to ensure that it is appropriately considered in the Firm’s allowance for loan losses.
|
JPMorgan Chase & Co./2014 Annual Report
|
117
|
|
Management’s discussion and analysis
The following table presents information as of
December 31, 2014
and
2013
, relating to modified retained residential real estate loans for which concessions have been granted to borrowers experiencing financial difficulty. Modifications of PCI loans continue to be accounted for and reported as PCI loans, and the impact of the modification is incorporated into the Firm’s quarterly assessment of estimated future cash flows. Modifications of consumer loans other than PCI loans are generally accounted for and reported as troubled debt restructurings (“TDRs”). For further information on modifications for the years ended
December 31, 2014
and
2013
, see Note 14.
|
Modified residential real estate loans
|
|||||||||||||
|
2014
|
2013
|
||||||||||||
|
December 31,
(in millions)
|
On–balance
sheet loans
|
Nonaccrual on–balance sheet
loans
(d)
|
On–balance
sheet loans
|
Nonaccrual on–balance sheet
loans
(d)
|
|||||||||
|
Modified residential real estate loans, excluding PCI loans
(a)(b)
|
|||||||||||||
|
Home equity – senior lien
|
$
|
1,101
|
|
$
|
628
|
|
$
|
1,146
|
|
$
|
641
|
|
|
|
Home equity –
junior lien
|
1,304
|
|
632
|
|
1,319
|
|
666
|
|
|||||
|
Prime mortgage, including option ARMs
|
6,145
|
|
1,559
|
|
7,004
|
|
1,737
|
|
|||||
|
Subprime mortgage
|
2,878
|
|
931
|
|
3,698
|
|
1,127
|
|
|||||
|
Total modified residential real estate loans, excluding PCI loans
|
$
|
11,428
|
|
$
|
3,750
|
|
$
|
13,167
|
|
$
|
4,171
|
|
|
|
Modified PCI loans
(c)
|
|||||||||||||
|
Home equity
|
$
|
2,580
|
|
NA
|
|
$
|
2,619
|
|
NA
|
|
|||
|
Prime mortgage
|
6,309
|
|
NA
|
|
6,977
|
|
NA
|
|
|||||
|
Subprime mortgage
|
3,647
|
|
NA
|
|
4,168
|
|
NA
|
|
|||||
|
Option ARMs
|
11,711
|
|
NA
|
|
13,131
|
|
NA
|
|
|||||
|
Total modified PCI loans
|
$
|
24,247
|
|
NA
|
|
$
|
26,895
|
|
NA
|
|
|||
|
(a)
|
Amounts represent the carrying value of modified residential real estate loans.
|
|
(b)
|
At
December 31, 2014
and
2013
,
$4.9 billion
and
$7.6 billion
, respectively, of loans modified subsequent to repurchase from Ginnie Mae in accordance with the standards of the appropriate government agency (i.e., FHA, VA, RHS) are not included in the table above. When such loans perform subsequent to modification in accordance with Ginnie Mae guidelines, they are generally sold back into Ginnie Mae loan pools. Modified loans that do not re-perform become subject to foreclosure. For additional information about sales of loans in securitization transactions with Ginnie Mae, see Note 16.
|
|
(c)
|
Amounts represent the unpaid principal balance of modified PCI loans.
|
|
(d)
|
As of
December 31, 2014
and
2013
, nonaccrual loans included
$2.9 billion
and
$3.0 billion
, respectively, of TDRs for which the borrowers were less than 90 days past due. For additional information about loans modified in a TDR that are on nonaccrual status, see Note 14.
|
Nonperforming assets
The following table presents information as of
December 31, 2014
and
2013
, about consumer, excluding credit card, nonperforming assets.
|
Nonperforming assets
(a)
|
|||||||
|
December 31, (in millions)
|
2014
|
2013
|
|||||
|
Nonaccrual loans
(b)
|
|||||||
|
Residential real estate
|
$
|
5,845
|
|
$
|
6,864
|
|
|
|
Other consumer
|
664
|
|
632
|
|
|||
|
Total nonaccrual loans
|
6,509
|
|
7,496
|
|
|||
|
Assets acquired in loan satisfactions
|
|||||||
|
Real estate owned
|
437
|
|
614
|
|
|||
|
Other
|
36
|
|
41
|
|
|||
|
Total assets acquired in loan satisfactions
|
473
|
|
655
|
|
|||
|
Total nonperforming assets
|
$
|
6,982
|
|
$
|
8,151
|
|
|
|
(a)
|
At
December 31, 2014
and
2013
, nonperforming assets excluded: (1) mortgage loans insured by U.S. government agencies of
$7.8 billion
and
$8.4 billion
, respectively, that are 90 or more days past due; (2) student loans insured by U.S. government agencies under the FFELP of
$367 million
and
$428 million
, respectively, that are 90 or more days past due; and (3) real estate owned insured by U.S. government agencies of
$462 million
and
$2.0 billion
, respectively. These amounts have been excluded based upon the government guarantee.
|
|
(b)
|
Excludes PCI loans that were acquired as part of the Washington Mutual transaction, which are accounted for on a pool basis. Since each pool is accounted for as a single asset with a single composite interest rate and an aggregate expectation of cash flows, the past-due status of the pools, or that of individual loans within the pools, is not meaningful. Because the Firm is recognizing interest income on each pool of loans, they are all considered to be performing.
|
Nonaccrual loans in the residential real estate portfolio totaled
$5.8 billion
and
$6.9 billion
at
December 31, 2014
and
December 31, 2013
, respectively, of which
32%
and
34%
, respectively, were
greater than 150 days past due. In the aggregate, the unpaid principal balance of residential real estate loans greater than 150 days past due was charged down by approximately
50%
to the estimated net realizable value of the collateral at both
December 31, 2014
and
2013
. The elongated foreclosure processing timelines are expected to continue to result in elevated levels of nonaccrual loans in the residential real estate portfolios.
Active and suspended foreclosure:
For information on loans that were in the process of active or suspended foreclosure, see Note 14.
Nonaccrual loans:
The following table presents changes in the consumer, excluding credit card, nonaccrual loans for the
years ended
December 31, 2014
and
2013
.
|
Nonaccrual loans
|
|||||||
|
Year ended December 31,
|
|||||||
|
(in millions)
|
2014
|
2013
|
|||||
|
Beginning balance
|
$
|
7,496
|
|
$
|
9,174
|
|
|
|
Additions
|
4,905
|
|
6,618
|
|
|||
|
Reductions:
|
|||||||
|
Principal payments and other
(a)
|
1,859
|
|
1,559
|
|
|||
|
Charge-offs
|
1,306
|
|
1,869
|
|
|||
|
Returned to performing status
|
2,083
|
|
3,793
|
|
|||
|
Foreclosures and other liquidations
|
644
|
|
1,075
|
|
|||
|
Total reductions
|
5,892
|
|
8,296
|
|
|||
|
Net additions/(reductions)
|
(987
|
)
|
(1,678
|
)
|
|||
|
Ending balance
|
$
|
6,509
|
|
$
|
7,496
|
|
|
|
(a)
|
Other reductions includes loan sales.
|
|
118
|
JPMorgan Chase & Co./2014 Annual Report
|
|
Credit Card
Total credit card loans increased from
December 31, 2013
due to higher new account originations and increased credit card sales volume. The 30+ day delinquency rate decreased to
1.44%
at
December 31, 2014
, from
1.67%
at
December 31, 2013
. For the years ended
December 31, 2014
and
2013
, the net charge-off rates were
2.75%
and
3.14%
, respectively. Charge-offs have improved compared with a year ago as a result of improvement in delinquent loans. The credit card portfolio continues to reflect a well-seasoned, largely rewards-based portfolio that has good U.S. geographic diversification.
Loans outstanding in the top five states of California, Texas, New York, Illinois and Florida consisted of
$54.9 billion
in receivables, or
43%
of the retained loan portfolio, at
December 31, 2014
, compared with
$52.7 billion
, or
41%
, at
December 31, 2013
. The greatest geographic concentration of credit card retained loans is in California, which represented
14%
and
13%
of total retained loans at
December 31, 2014
and
2013
, respectively. For further information on the geographic composition of the Firm’s credit card loans, see Note 14.
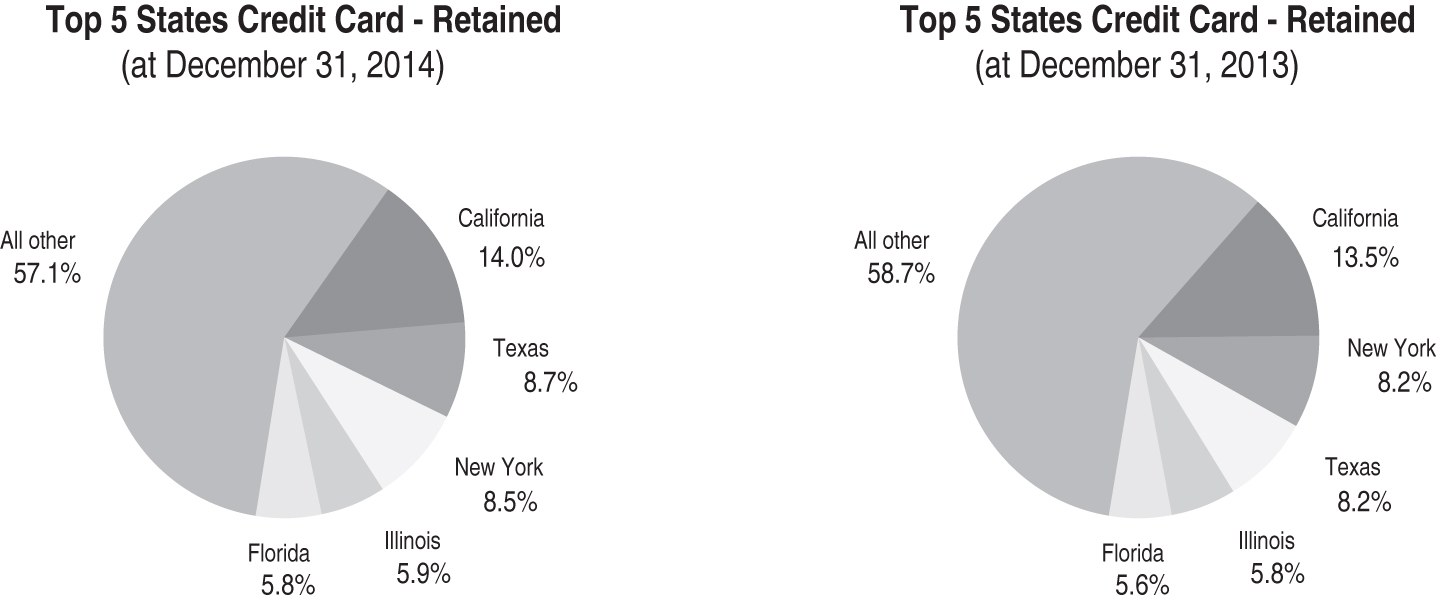
Modifications of credit card loans
At
December 31, 2014
and
2013
, the Firm had
$2.0 billion
and
$3.1 billion
, respectively, of credit card loans outstanding that have been modified in TDRs. These balances included both credit card loans with modified payment terms and credit card loans that reverted back to their pre-modification payment terms because the cardholder did not comply with the modified payment terms. The decrease in modified credit card loans outstanding from
December 31, 2013
, was attributable to a reduction in new modifications as well as ongoing payments and charge-offs on previously modified credit card loans.
Consistent with the Firm’s policy, all credit card loans typically remain on accrual status until charged-off. However, the Firm establishes an allowance, which is offset against loans and charged to interest income, for the estimated uncollectible portion of accrued interest and fee income.
For additional information about loan modification programs to borrowers, see Note 14.
|
JPMorgan Chase & Co./2014 Annual Report
|
119
|
|
Management’s discussion and analysis
|
WHOLESALE CREDIT PORTFOLIO
|
||||
The Firm’s wholesale businesses are exposed to credit risk through underwriting, lending and trading activities with and for clients and counterparties, as well as through various operating services such as cash management and clearing activities. A portion of the loans originated or acquired by the Firm’s wholesale businesses is generally retained on the balance sheet. The Firm distributes a significant percentage of the loans it originates into the market as part of its syndicated loan business and to manage portfolio concentrations and credit risk.
The wholesale credit environment remained favorable throughout 2014 driving an increase in client activity. Growth in loans retained was driven primarily by activity in Commercial Banking, while growth in lending-related commitments reflected increased activity in both the Corporate & Investment Bank and Commercial Banking.
Discipline in underwriting across all areas of lending continues to remain a key point of focus, consistent with evolving market conditions and the Firm’s risk management activities. The wholesale portfolio is actively managed, in part by conducting ongoing, in-depth reviews of client credit quality and transaction structure, inclusive of collateral where applicable; and of industry, product and client concentrations. During the year, wholesale criticized assets decreased from 2013, including a reduction in nonaccrual loans by
40%
.
|
Wholesale credit portfolio
|
|||||||||||||
|
December 31,
|
Credit exposure
|
Nonperforming
(d)
|
|||||||||||
|
(in millions)
|
2014
|
2013
|
2014
|
2013
|
|||||||||
|
Loans retained
|
$
|
324,502
|
|
$
|
308,263
|
|
$
|
599
|
|
$
|
821
|
|
|
|
Loans held-for-sale
|
3,801
|
|
11,290
|
|
4
|
|
26
|
|
|||||
|
Loans at fair value
|
2,611
|
|
2,011
|
|
21
|
|
197
|
|
|||||
|
Loans – reported
|
330,914
|
|
321,564
|
|
624
|
|
1,044
|
|
|||||
|
Derivative receivables
|
78,975
|
|
65,759
|
|
275
|
|
415
|
|
|||||
|
Receivables from customers and other
(a)
|
28,972
|
|
26,744
|
|
—
|
|
—
|
|
|||||
|
Total wholesale credit-related assets
|
438,861
|
|
414,067
|
|
899
|
|
1,459
|
|
|||||
|
Lending-related commitments
(b)
|
472,056
|
|
446,232
|
|
103
|
|
206
|
|
|||||
|
Total wholesale credit exposure
|
$
|
910,917
|
|
$
|
860,299
|
|
$
|
1,002
|
|
$
|
1,665
|
|
|
|
Credit Portfolio Management derivatives notional, net
(c)
|
$
|
(26,703
|
)
|
$
|
(27,996
|
)
|
$
|
—
|
|
$
|
(5
|
)
|
|
|
Liquid securities and other cash collateral held against derivatives
|
(19,604
|
)
|
(14,435
|
)
|
NA
|
|
NA
|
|
|||||
|
(a)
|
Receivables from customers and other include
$28.8 billion
and
$26.5 billion
of margin loans at
December 31, 2014
and
2013
, respectively, to prime and retail brokerage customers; these are classified in accrued interest and accounts receivable on the Consolidated balance sheets.
|
|
(b)
|
Includes unused advised lines of credit of
$105.2 billion
and
$102.0 billion
as of
December 31, 2014
and
2013
, respectively. An advised line of credit is a revolving credit line which specifies the maximum amount the Firm may make available to an obligor, on a nonbinding basis. The borrower receives written or oral advice of this facility. The Firm may cancel this facility at any time by providing the borrower notice or, in some cases, without notice as permitted by law.
|
|
(c)
|
Represents the net notional amount of protection purchased and sold through credit derivatives used to manage both performing and nonperforming wholesale credit exposures; these derivatives do not qualify for hedge accounting under U.S. GAAP. For additional information, see Credit derivatives on
page 127
, and Note 6.
|
|
(d)
|
Excludes assets acquired in loan satisfactions.
|
|
120
|
JPMorgan Chase & Co./2014 Annual Report
|
|
The following tables present the maturity and ratings profiles of the wholesale credit portfolio as of
December 31, 2014
and
2013
. The ratings scale is based on the Firm’s internal risk ratings, which generally correspond to the ratings as defined by S&P and Moody’s.
|
Wholesale credit exposure – maturity and ratings profile
|
||||||||||||||||||||||||||
|
Maturity profile
(e)
|
Ratings profile
|
|||||||||||||||||||||||||
|
December 31, 2014
|
Due in 1 year or less
|
Due after 1 year through 5 years
|
Due after 5 years
|
Total
|
Investment-grade
|
Noninvestment-grade
|
Total
|
Total %
of IG
|
||||||||||||||||||
|
(in millions, except ratios)
|
AAA/Aaa to BBB-/Baa3
|
BB+/Ba1 & below
|
||||||||||||||||||||||||
|
Loans retained
|
$
|
112,411
|
|
$
|
134,277
|
|
$
|
77,814
|
|
$
|
324,502
|
|
$
|
241,666
|
|
$
|
82,836
|
|
$
|
324,502
|
|
74
|
%
|
|||
|
Derivative receivables
|
78,975
|
|
78,975
|
|
||||||||||||||||||||||
|
Less: Liquid securities and other cash collateral held against derivatives
|
(19,604
|
)
|
(19,604
|
)
|
||||||||||||||||||||||
|
Total derivative receivables, net of all collateral
|
20,032
|
|
16,130
|
|
23,209
|
|
59,371
|
|
52,150
|
|
7,221
|
|
59,371
|
|
88
|
|
||||||||||
|
Lending-related commitments
|
185,451
|
|
276,793
|
|
9,812
|
|
472,056
|
|
379,214
|
|
92,842
|
|
472,056
|
|
80
|
|
||||||||||
|
Subtotal
|
317,894
|
|
427,200
|
|
110,835
|
|
855,929
|
|
673,030
|
|
182,899
|
|
855,929
|
|
79
|
|
||||||||||
|
Loans held-for-sale and loans at fair value
(a)
|
6,412
|
|
6,412
|
|
||||||||||||||||||||||
|
Receivables from customers and other
|
28,972
|
|
28,972
|
|
||||||||||||||||||||||
|
Total exposure – net of liquid securities and other cash collateral held against derivatives
|
$
|
891,313
|
|
$
|
891,313
|
|
||||||||||||||||||||
|
Credit Portfolio Management derivatives net
notional by reference entity ratings profile
(b)(c)(d)
|
$
|
(2,050
|
)
|
$
|
(18,653
|
)
|
$
|
(6,000
|
)
|
$
|
(26,703
|
)
|
$
|
(23,571
|
)
|
$
|
(3,132
|
)
|
$
|
(26,703
|
)
|
88
|
%
|
|||
|
Maturity profile
(e)
|
Ratings profile
|
|||||||||||||||||||||||||
|
December 31, 2013
|
Due in 1 year or less
|
Due after 1 year through 5 years
|
Due after 5 years
|
Total
|
Investment-grade
|
Noninvestment-grade
|
Total
|
Total %
of IG
|
||||||||||||||||||
|
(in millions, except ratios)
|
AAA/Aaa to BBB-/Baa3
|
BB+/Ba1 & below
|
||||||||||||||||||||||||
|
Loans retained
|
$
|
108,392
|
|
$
|
124,111
|
|
$
|
75,760
|
|
$
|
308,263
|
|
$
|
226,070
|
|
$
|
82,193
|
|
$
|
308,263
|
|
73
|
%
|
|||
|
Derivative receivables
|
65,759
|
|
65,759
|
|
||||||||||||||||||||||
|
Less: Liquid securities and other cash collateral held against derivatives
|
(14,435
|
)
|
(14,435
|
)
|
||||||||||||||||||||||
|
Total derivative receivables, net of all collateral
|
13,550
|
|
15,935
|
|
21,839
|
|
51,324
|
|
41,104
|
|
(f)
|
10,220
|
|
(f)
|
51,324
|
|
80
|
|
||||||||
|
Lending-related commitments
|
179,301
|
|
255,426
|
|
11,505
|
|
446,232
|
|
353,974
|
|
92,258
|
|
446,232
|
|
79
|
|
||||||||||
|
Subtotal
|
301,243
|
|
395,472
|
|
109,104
|
|
805,819
|
|
621,148
|
|
184,671
|
|
805,819
|
|
77
|
|
||||||||||
|
Loans held-for-sale and loans at fair value
(a)
|
13,301
|
|
13,301
|
|
||||||||||||||||||||||
|
Receivables from customers and other
|
26,744
|
|
26,744
|
|
||||||||||||||||||||||
|
Total exposure – net of liquid securities and other cash collateral held against derivatives
|
$
|
845,864
|
|
$
|
845,864
|
|
||||||||||||||||||||
|
Credit Portfolio Management derivatives net
notional by reference entity ratings profile
(b)(c)(d)
|
$
|
(1,149
|
)
|
$
|
(19,516
|
)
|
$
|
(7,331
|
)
|
$
|
(27,996
|
)
|
$
|
(24,649
|
)
|
$
|
(3,347
|
)
|
$
|
(27,996
|
)
|
88
|
%
|
|||
|
(a)
|
Represents loans held-for-sale, primarily related to syndicated loans and loans transferred from the retained portfolio, and loans at fair value.
|
|
(b)
|
These derivatives do not quality for hedge accounting under U.S. GAAP.
|
|
(c)
|
The notional amounts are presented on a net basis by underlying reference entity and the ratings profile shown is based on the ratings of the reference entity on which protection has been purchased.
|
|
(d)
|
Predominantly all of the credit derivatives entered into by the Firm where it has purchased protection, including Credit Portfolio Management derivatives, are executed with investment grade counterparties.
|
|
(e)
|
The maturity profile of retained loans, lending-related commitments and derivative receivables is based on remaining contractual maturity. Derivative contracts that are in a receivable position at
December 31, 2014
, may become a payable prior to maturity based on their cash flow profile or changes in market conditions.
|
|
(f)
|
The prior period amounts have been revised to conform with the current period presentation.
|
Wholesale credit exposure – selected industry exposures
The Firm focuses on the management and diversification of its industry exposures, paying particular attention to industries with actual or potential credit concerns. Exposures deemed criticized align with the U.S. banking regulators’ definition of criticized exposures, which consist of the special mention, substandard and doubtful categories. The total criticized component of the portfolio, excluding loans held-for-sale and loans at fair value, decreased by
16%
to
$10.2 billion
at
December 31, 2014
, from
$12.2 billion
at
December 31, 2013
.
|
JPMorgan Chase & Co./2014 Annual Report
|
121
|
|
Management’s discussion and analysis
Below are summaries of the top 25 industry exposures as of
December 31, 2014
and
2013
. For additional information on industry concentrations, see Note 5.
|
Selected metrics
|
|||||||||||||||||||||||||||
|
30 days or more past due and accruing
loans |
Net charge-offs/
(recoveries)
|
Credit derivative hedges
(e)
|
Liquid securities
and other cash collateral held against derivative
receivables |
||||||||||||||||||||||||
|
Noninvestment-grade
|
|||||||||||||||||||||||||||
|
Credit
exposure
(d)
|
Investment-
grade
|
Noncriticized
|
Criticized performing
|
Criticized
nonperforming
|
|||||||||||||||||||||||
|
As of or for the year ended
December 31, 2014
(in millions)
|
|||||||||||||||||||||||||||
|
Top 25 industries
(a)
|
|||||||||||||||||||||||||||
|
Real Estate
|
$
|
107,386
|
|
$
|
80,219
|
|
$
|
25,558
|
|
$
|
1,356
|
|
$
|
253
|
|
$
|
309
|
|
$
|
(9
|
)
|
$
|
(36
|
)
|
$
|
(27
|
)
|
|
Banks & Finance Cos
|
68,203
|
|
58,360
|
|
9,266
|
|
508
|
|
69
|
|
46
|
|
(4
|
)
|
(1,232
|
)
|
(9,369
|
)
|
|||||||||
|
Healthcare
|
57,707
|
|
49,361
|
|
7,816
|
|
488
|
|
42
|
|
193
|
|
17
|
|
(94
|
)
|
(244
|
)
|
|||||||||
|
Oil & Gas
|
48,315
|
|
33,547
|
|
14,685
|
|
82
|
|
1
|
|
15
|
|
2
|
|
(144
|
)
|
(161
|
)
|
|||||||||
|
Consumer Products
|
37,818
|
|
26,070
|
|
11,081
|
|
650
|
|
17
|
|
21
|
|
—
|
|
(20
|
)
|
(2
|
)
|
|||||||||
|
Asset Managers
|
36,374
|
|
31,880
|
|
4,436
|
|
57
|
|
1
|
|
38
|
|
(12
|
)
|
(9
|
)
|
(4,545
|
)
|
|||||||||
|
State & Municipal Govt
(b)
|
31,858
|
|
30,919
|
|
837
|
|
102
|
|
—
|
|
69
|
|
24
|
|
(148
|
)
|
(130
|
)
|
|||||||||
|
Retail & Consumer Services
|
28,258
|
|
18,233
|
|
9,023
|
|
971
|
|
31
|
|
56
|
|
4
|
|
(47
|
)
|
(1
|
)
|
|||||||||
|
Utilities
|
28,060
|
|
24,058
|
|
3,747
|
|
255
|
|
—
|
|
198
|
|
(3
|
)
|
(155
|
)
|
(193
|
)
|
|||||||||
|
Central Govt
|
21,081
|
|
20,868
|
|
155
|
|
58
|
|
—
|
|
—
|
|
—
|
|
(11,297
|
)
|
(1,071
|
)
|
|||||||||
|
Technology
|
20,977
|
|
13,759
|
|
6,557
|
|
641
|
|
20
|
|
24
|
|
(3
|
)
|
(225
|
)
|
—
|
|
|||||||||
|
Machinery & Equipment Mfg
|
20,573
|
|
12,094
|
|
8,229
|
|
250
|
|
—
|
|
5
|
|
(2
|
)
|
(157
|
)
|
(19
|
)
|
|||||||||
|
Transportation
|
16,365
|
|
11,444
|
|
4,835
|
|
86
|
|
—
|
|
5
|
|
(3
|
)
|
(34
|
)
|
(107
|
)
|
|||||||||
|
Business Services
|
16,201
|
|
8,450
|
|
7,512
|
|
224
|
|
15
|
|
10
|
|
5
|
|
(9
|
)
|
—
|
|
|||||||||
|
Metals/Mining
|
15,911
|
|
8,845
|
|
6,562
|
|
504
|
|
—
|
|
—
|
|
18
|
|
(377
|
)
|
(19
|
)
|
|||||||||
|
Media
|
14,534
|
|
9,131
|
|
5,107
|
|
266
|
|
30
|
|
1
|
|
(1
|
)
|
(69
|
)
|
(6
|
)
|
|||||||||
|
Building Materials/Construction
|
13,672
|
|
6,721
|
|
6,271
|
|
674
|
|
6
|
|
12
|
|
2
|
|
(104
|
)
|
—
|
|
|||||||||
|
Insurance
|
13,637
|
|
10,790
|
|
2,605
|
|
80
|
|
162
|
|
—
|
|
—
|
|
(52
|
)
|
(2,372
|
)
|
|||||||||
|
Automotive
|
13,586
|
|
8,647
|
|
4,778
|
|
161
|
|
—
|
|
1
|
|
(1
|
)
|
(140
|
)
|
—
|
|
|||||||||
|
Chemicals/Plastics
|
13,545
|
|
9,800
|
|
3,716
|
|
29
|
|
—
|
|
1
|
|
(2
|
)
|
(14
|
)
|
—
|
|
|||||||||
|
Telecom Services
|
13,136
|
|
8,277
|
|
4,303
|
|
546
|
|
10
|
|
—
|
|
(2
|
)
|
(813
|
)
|
(6
|
)
|
|||||||||
|
Securities Firms & Exchanges
|
8,936
|
|
6,198
|
|
2,726
|
|
10
|
|
2
|
|
20
|
|
4
|
|
(102
|
)
|
(216
|
)
|
|||||||||
|
Agriculture/Paper Mfg
|
7,242
|
|
4,890
|
|
2,224
|
|
122
|
|
6
|
|
36
|
|
(1
|
)
|
(4
|
)
|
(4
|
)
|
|||||||||
|
Aerospace/Defense
|
6,070
|
|
5,088
|
|
958
|
|
24
|
|
—
|
|
—
|
|
—
|
|
(71
|
)
|
—
|
|
|||||||||
|
Leisure
|
5,562
|
|
2,937
|
|
2,023
|
|
478
|
|
124
|
|
6
|
|
—
|
|
(5
|
)
|
(23
|
)
|
|||||||||
|
All other
(c)
|
210,526
|
|
190,135
|
|
19,581
|
|
622
|
|
188
|
|
1,235
|
|
(21
|
)
|
(11,345
|
)
|
(1,089
|
)
|
|||||||||
|
Subtotal
|
$
|
875,533
|
|
$
|
690,721
|
|
$
|
174,591
|
|
$
|
9,244
|
|
$
|
977
|
|
$
|
2,301
|
|
$
|
12
|
|
$
|
(26,703
|
)
|
$
|
(19,604
|
)
|
|
Loans held-for-sale and loans at fair value
|
6,412
|
|
|||||||||||||||||||||||||
|
Receivables from customers and other
|
28,972
|
|
|||||||||||||||||||||||||
|
Total
|
$
|
910,917
|
|
||||||||||||||||||||||||
|
122
|
JPMorgan Chase & Co./2014 Annual Report
|
|
|
Selected metrics
|
|||||||||||||||||||||||||||||
|
30 days or more past due and accruing
loans |
Net charge-offs/
(recoveries)
|
Credit derivative hedges
(e)
|
Liquid securities
and other cash collateral held against derivative
receivables |
||||||||||||||||||||||||||
|
Noninvestment-grade
|
|||||||||||||||||||||||||||||
|
Credit
exposure
(d)
|
Investment-
grade
|
Noncriticized
|
Criticized performing
|
Criticized
nonperforming
|
|||||||||||||||||||||||||
|
As of or for the year ended
December 31, 2013
(in millions)
|
|||||||||||||||||||||||||||||
|
Top 25 industries
(a)
|
|||||||||||||||||||||||||||||
|
Real Estate
|
$
|
87,102
|
|
$
|
62,964
|
|
$
|
21,505
|
|
$
|
2,286
|
|
$
|
347
|
|
$
|
178
|
|
$
|
6
|
|
$
|
(66
|
)
|
$
|
(125
|
)
|
||
|
Banks & Finance Cos
|
66,881
|
|
56,675
|
|
9,707
|
|
431
|
|
68
|
|
14
|
|
(22
|
)
|
(2,692
|
)
|
(6,227
|
)
|
|||||||||||
|
Healthcare
|
45,910
|
|
37,635
|
|
7,952
|
|
317
|
|
6
|
|
49
|
|
3
|
|
(198
|
)
|
(195
|
)
|
|||||||||||
|
Oil & Gas
|
46,934
|
|
34,708
|
|
11,779
|
|
436
|
|
11
|
|
34
|
|
13
|
|
(227
|
)
|
(67
|
)
|
|||||||||||
|
Consumer Products
|
34,145
|
|
21,100
|
|
12,505
|
|
537
|
|
3
|
|
4
|
|
11
|
|
(149
|
)
|
(1
|
)
|
|||||||||||
|
Asset Managers
|
33,506
|
|
26,991
|
|
6,477
|
|
38
|
|
—
|
|
217
|
|
(7
|
)
|
(5
|
)
|
(3,191
|
)
|
|||||||||||
|
State & Municipal Govt
(b)
|
35,666
|
|
34,563
|
|
826
|
|
157
|
|
120
|
|
40
|
|
1
|
|
(161
|
)
|
(144
|
)
|
|||||||||||
|
Retail & Consumer Services
|
25,068
|
|
16,101
|
|
8,453
|
|
492
|
|
22
|
|
6
|
|
—
|
|
(91
|
)
|
—
|
|
|||||||||||
|
Utilities
|
28,983
|
|
25,521
|
|
3,045
|
|
411
|
|
6
|
|
2
|
|
28
|
|
(445
|
)
|
(306
|
)
|
|||||||||||
|
Central Govt
|
21,049
|
|
20,633
|
|
345
|
|
71
|
|
—
|
|
—
|
|
—
|
|
(10,088
|
)
|
(1,541
|
)
|
|||||||||||
|
Technology
|
21,403
|
|
13,787
|
|
6,771
|
|
825
|
|
20
|
|
—
|
|
—
|
|
(512
|
)
|
—
|
|
|||||||||||
|
Machinery & Equipment Mfg
|
19,078
|
|
11,154
|
|
7,549
|
|
368
|
|
7
|
|
20
|
|
(18
|
)
|
(257
|
)
|
(8
|
)
|
|||||||||||
|
Transportation
|
13,975
|
|
9,683
|
|
4,165
|
|
100
|
|
27
|
|
10
|
|
8
|
|
(68
|
)
|
—
|
|
|||||||||||
|
Business Services
|
14,601
|
|
7,838
|
|
6,447
|
|
286
|
|
30
|
|
9
|
|
10
|
|
(10
|
)
|
(2
|
)
|
|||||||||||
|
Metals/Mining
|
17,434
|
|
9,266
|
|
7,508
|
|
594
|
|
66
|
|
1
|
|
16
|
|
(621
|
)
|
(36
|
)
|
|||||||||||
|
Media
|
13,858
|
|
7,783
|
|
5,658
|
|
315
|
|
102
|
|
6
|
|
36
|
|
(26
|
)
|
(5
|
)
|
|||||||||||
|
Building Materials/Construction
|
12,901
|
|
5,701
|
|
6,354
|
|
839
|
|
7
|
|
15
|
|
3
|
|
(132
|
)
|
—
|
|
|||||||||||
|
Insurance
|
13,761
|
|
10,681
|
|
2,757
|
|
84
|
|
239
|
|
—
|
|
(2
|
)
|
(98
|
)
|
(1,935
|
)
|
|||||||||||
|
Automotive
|
12,532
|
|
7,881
|
|
4,490
|
|
159
|
|
2
|
|
3
|
|
(3
|
)
|
(472
|
)
|
—
|
|
|||||||||||
|
Chemicals/Plastics
|
10,637
|
|
7,189
|
|
3,211
|
|
222
|
|
15
|
|
—
|
|
—
|
|
(13
|
)
|
(83
|
)
|
|||||||||||
|
Telecom Services
|
13,906
|
|
9,130
|
|
4,284
|
|
482
|
|
10
|
|
—
|
|
7
|
|
(272
|
)
|
(8
|
)
|
|||||||||||
|
Securities Firms & Exchanges
|
10,035
|
|
4,208
|
|
(f)
|
5,806
|
|
(f)
|
14
|
|
7
|
|
1
|
|
(68
|
)
|
(4,169
|
)
|
(175
|
)
|
|||||||||
|
Agriculture/Paper Mfg
|
7,387
|
|
4,238
|
|
3,064
|
|
82
|
|
3
|
|
31
|
|
—
|
|
(4
|
)
|
(4
|
)
|
|||||||||||
|
Aerospace/Defense
|
6,873
|
|
5,447
|
|
1,426
|
|
—
|
|
—
|
|
—
|
|
—
|
|
(142
|
)
|
(1
|
)
|
|||||||||||
|
Leisure
|
5,331
|
|
2,950
|
|
1,797
|
|
495
|
|
89
|
|
5
|
|
—
|
|
(10
|
)
|
(14
|
)
|
|||||||||||
|
All other
(c)
|
201,298
|
|
180,460
|
|
19,911
|
|
692
|
|
235
|
|
1,249
|
|
(6
|
)
|
(7,068
|
)
|
(367
|
)
|
|||||||||||
|
Subtotal
|
$
|
820,254
|
|
$
|
634,287
|
|
$
|
173,792
|
|
$
|
10,733
|
|
$
|
1,442
|
|
$
|
1,894
|
|
$
|
16
|
|
$
|
(27,996
|
)
|
$
|
(14,435
|
)
|
||
|
Loans held-for-sale and loans at fair value
|
13,301
|
|
|||||||||||||||||||||||||||
|
Receivables from customers and other
|
26,744
|
|
|||||||||||||||||||||||||||
|
Total
|
$
|
860,299
|
|
||||||||||||||||||||||||||
|
(a)
|
The industry rankings presented in the table as of
December 31, 2013
, are based on the industry rankings of the corresponding exposures at
December 31, 2014
, not actual rankings of such exposures at
December 31, 2013
.
|
|
(b)
|
In addition to the credit risk exposure to states and municipal governments (both U.S. and non-U.S.) at
December 31, 2014
and
2013
, noted above, the Firm held:
$10.6 billion
and
$7.9 billion
, respectively, of trading securities;
$30.1 billion
and
$29.5 billion
, respectively, of AFS securities; and
$10.2 billion
and
$920 million
, respectively, of HTM securities, issued by U.S. state and municipal governments. For further information, see Note 3 and Note 12.
|
|
(c)
|
All other includes: individuals, private education and civic organizations; SPEs; and holding companies, representing approximately
68%
,
21%
and
5%
, respectively, at
December 31, 2014
, and
64%
,
22%
and
5%
, respectively, at
December 31, 2013
.
|
|
(d)
|
Credit exposure is net of risk participations and excludes the benefit of “Credit Portfolio Management derivatives net notional” held against derivative receivables or loans and “Liquid securities and other cash collateral held against derivative receivables”.
|
|
(e)
|
Represents the net notional amounts of protection purchased and sold through credit derivatives used to manage the credit exposures; these derivatives do not qualify for hedge accounting under U.S. GAAP. The all other category includes purchased credit protection on certain credit indices.
|
|
(f)
|
The prior period amounts have been revised to conform with the current period presentation.
|
|
JPMorgan Chase & Co./2014 Annual Report
|
123
|
|
Management’s discussion and analysis
Presented below is a discussion of several industries to which the Firm has significant exposure and/or present actual or potential credit concerns. The Firm is actively monitoring these exposures. For additional information, refer to the tables on the previous pages.
|
•
|
Real Estate:
Exposure to this industry increased by
$20.3 billion
or
23%
, in
2014
to
$107.4 billion
. The increase was largely driven by growth in multifamily exposure in the CB. The credit quality of this industry improved as the investment-grade portion of the exposures to this industry increased to 75% in 2014 from 72% in
2013
. The ratio of nonaccrual retained loans to total retained loans decreased to
0.32%
at December 31, 2014 from
0.50%
at December 31, 2013. For further information on commercial real estate loans, see Note 14.
|
|
•
|
Oil & Gas:
Exposure to this industry increased by $1.4 billion in
2014
to
$48.3 billion
, of which
$15.6 billion
was drawn at year-end. The portfolio largely consisted of exposure in North America, and was concentrated in the Exploration and Production subsector. The Oil & Gas portfolio was comprised of 69% investment-grade exposure, and was approximately 5% of the Firm’s total wholesale credit exposure as of December 31, 2014.
|
Loans
In the normal course of its wholesale business, the Firm provides loans to a variety of customers, ranging from large corporate and institutional clients to high-net-worth individuals. For further discussion on loans, including information on credit quality indicators, see Note 14.
The Firm actively manages its wholesale credit exposure. One way of managing credit risk is through secondary market sales of loans and lending-related commitments. During the years ended
December 31, 2014
and
2013
, the Firm sold
$22.8 billion
and
$16.3 billion
, respectively, of loans and lending-related commitments.
The following table presents the change in the nonaccrual loan portfolio for the years ended
December 31, 2014
and
2013
.
|
Wholesale nonaccrual loan activity
|
|||||||
|
Year ended December 31, (in millions)
|
2014
|
2013
|
|||||
|
Beginning balance
|
$
|
1,044
|
|
$
|
1,717
|
|
|
|
Additions
|
882
|
|
1,293
|
|
|||
|
Reductions:
|
|||||||
|
Paydowns and other
|
756
|
|
1,075
|
|
|||
|
Gross charge-offs
|
148
|
|
241
|
|
|||
|
Returned to performing status
|
303
|
|
279
|
|
|||
|
Sales
|
95
|
|
371
|
|
|||
|
Total reductions
|
1,302
|
|
1,966
|
|
|||
|
Net reductions
|
(420
|
)
|
(673
|
)
|
|||
|
Ending balance
|
$
|
624
|
|
$
|
1,044
|
|
|
The following table presents net charge-offs, which are defined as gross charge-offs less recoveries, for the years ended
December 31, 2014
and
2013
. The amounts in the table below do not include gains or losses from sales of nonaccrual loans.
|
Wholesale net charge-offs
|
||||||
|
Year ended December 31,
(in millions, except ratios)
|
2014
|
2013
|
||||
|
Loans – reported
|
||||||
|
Average loans retained
|
$
|
316,060
|
|
$
|
307,340
|
|
|
Gross charge-offs
|
151
|
|
241
|
|
||
|
Gross recoveries
|
(139
|
)
|
(225
|
)
|
||
|
Net charge-offs
|
12
|
|
16
|
|
||
|
Net charge-off rate
|
—
|
%
|
0.01
|
%
|
||
Receivables from customers
Receivables from customers primarily represent margin loans to prime and retail brokerage clients that are collateralized through a pledge of assets maintained in clients’ brokerage accounts that are subject to daily minimum collateral requirements. In the event that the collateral value decreases, a maintenance margin call is made to the client to provide additional collateral into the account. If additional collateral is not provided by the client, the client’s position may be liquidated by the Firm to meet the minimum collateral requirements.
|
124
|
JPMorgan Chase & Co./2014 Annual Report
|
|
Lending-related commitments
The Firm uses lending-related financial instruments, such as commitments (including revolving credit facilities) and guarantees, to meet the financing needs of its customers. The contractual amounts of these financial instruments represent the maximum possible credit risk should the counterparties draw down on these commitments or the Firm fulfills its obligations under these guarantees, and the counterparties subsequently fail to perform according to the terms of these contracts.
In the Firm’s view, the total contractual amount of these wholesale lending-related commitments is not representative of the Firm’s actual future credit exposure or funding requirements. In determining the amount of credit risk exposure the Firm has to wholesale lending-related commitments, which is used as the basis for allocating credit risk capital to these commitments, the Firm has established a “loan-equivalent” amount for each commitment; this amount represents the portion of the unused commitment or other contingent exposure that is expected, based on average portfolio historical experience, to become drawn upon in an event of a default by an obligor. The loan-equivalent amount of the Firm’s lending-related commitments was
$229.6 billion
and
$218.9 billion
as of
December 31, 2014
and
2013
, respectively.
Clearing services
The Firm provides clearing services for clients entering into securities and derivative transactions. Through the provision of these services the Firm is exposed to the risk of non-performance by its clients and may be required to share in losses incurred by central counterparties (“CCPs”). Where possible, the Firm seeks to mitigate its credit risk to its clients through the collection of adequate margin at inception and throughout the life of the transactions and can also cease provision of clearing services if clients do not adhere to their obligations under the clearing agreement. For further discussion of Clearing services, see Note 29.
Derivative contracts
In the normal course of business, the Firm uses derivative instruments predominantly for market-making activities. Derivatives enable customers to manage exposures to fluctuations in interest rates, currencies and other markets. The Firm also uses derivative instruments to manage its own credit exposure. The nature of the counterparty and the settlement mechanism of the derivative affect the credit risk to which the Firm is exposed. For OTC derivatives the Firm is exposed to the credit risk of the derivative counterparty. For exchange-traded derivatives (“ETD”) such as futures and options, and “cleared” over-the-counter (“OTC-cleared”) derivatives, the Firm is generally exposed to the credit risk of the relevant CCP. Where possible, the Firm seeks to mitigate its credit risk exposures arising from derivative transactions through the use of legally enforceable master netting arrangements and collateral agreements. For further discussion of derivative contracts, counterparties and settlement types, see Note 6.
The following table summarizes the net derivative receivables for the periods presented.
|
Derivative receivables
|
||||||
|
December 31, (in millions)
|
2014
|
2013
|
||||
|
Interest rate
|
$
|
33,725
|
|
$
|
25,782
|
|
|
Credit derivatives
|
1,838
|
|
1,516
|
|
||
|
Foreign exchange
|
21,253
|
|
16,790
|
|
||
|
Equity
|
8,177
|
|
12,227
|
|
||
|
Commodity
|
13,982
|
|
9,444
|
|
||
|
Total, net of cash collateral
|
78,975
|
|
65,759
|
|
||
|
Liquid securities and other cash collateral held against derivative receivables
|
(19,604
|
)
|
(14,435
|
)
|
||
|
Total, net of all collateral
|
$
|
59,371
|
|
$
|
51,324
|
|
Derivative receivables reported on the Consolidated balance sheets were
$79.0 billion
and
$65.8 billion
at
December 31, 2014
and
2013
, respectively. These amounts represent the fair value of the derivative contracts, after giving effect to legally enforceable master netting agreements and cash collateral held by the Firm. However, in management’s view, the appropriate measure of current credit risk should also take into consideration additional liquid securities (primarily U.S. government and agency securities and other G7 government bonds) and other cash collateral held by the Firm aggregating
$19.6 billion
and
$14.4 billion
at
December 31, 2014
and
2013
, respectively, that may be used as security when the fair value of the client’s exposure is in the Firm’s favor.
In addition to the collateral described in the preceding paragraph, the Firm also holds additional collateral (primarily: cash; G7 government securities; other liquid government-agency and guaranteed securities; and corporate debt and equity securities) delivered by clients at the initiation of transactions, as well as collateral related to contracts that have a non-daily call frequency and collateral that the Firm has agreed to return but has not yet settled as of the reporting date. Although this collateral does not reduce the balances and is not included in the table above, it is available as security against potential exposure that could arise should the fair value of the client’s derivative transactions move in the Firm’s favor. As of
December 31, 2014
and
2013
, the Firm held
$48.6 billion
and
$50.8 billion
, respectively, of this additional collateral. The prior period amount has been revised to conform with the current period presentation. The derivative receivables fair value, net of all collateral, also does not include other credit enhancements, such as letters of credit. For additional information on the Firm’s use of collateral agreements, see Note 6.
|
JPMorgan Chase & Co./2014 Annual Report
|
125
|
|
Management’s discussion and analysis
While useful as a current view of credit exposure, the net fair value of the derivative receivables does not capture the potential future variability of that credit exposure. To capture the potential future variability of credit exposure, the Firm calculates, on a client-by-client basis, three measures of potential derivatives-related credit loss: Peak, Derivative Risk Equivalent (“DRE”), and Average exposure (“AVG”). These measures all incorporate netting and collateral benefits, where applicable.
Peak exposure to a counterparty is an extreme measure of exposure calculated at a
97.5%
confidence level. DRE exposure is a measure that expresses the risk of derivative exposure on a basis intended to be equivalent to the risk of loan exposures. The measurement is done by equating the unexpected loss in a derivative counterparty exposure (which takes into consideration both the loss volatility and the credit rating of the counterparty) with the unexpected loss in a loan exposure (which takes into consideration only the credit rating of the counterparty). DRE is a less extreme measure of potential credit loss than Peak and is the primary measure used by the Firm for credit approval of derivative transactions.
Finally, AVG is a measure of the expected fair value of the Firm’s derivative receivables at future time periods, including the benefit of collateral. AVG exposure over the total life of the derivative contract is used as the primary metric for pricing purposes and is used to calculate credit capital and the CVA, as further described below. The three year AVG exposure was
$37.5 billion
and
$35.4 billion
at
December 31, 2014
and
2013
, respectively, compared with derivative receivables, net of all collateral, of
$59.4 billion
and
$51.3 billion
at
December 31, 2014
and
2013
, respectively.
The fair value of the Firm’s derivative receivables incorporates an adjustment, the CVA, to reflect the credit quality of counterparties. The CVA is based on the Firm’s AVG to a counterparty and the counterparty’s credit spread in the credit derivatives market. The primary components of changes in CVA are credit spreads, new deal activity or unwinds, and changes in the underlying market environment. The Firm believes that active risk management is essential to controlling the dynamic credit risk in the derivatives portfolio. In addition, the Firm’s risk management process takes into consideration the potential impact of wrong-way risk, which is broadly defined as the potential for increased correlation between the Firm’s exposure to a counterparty (AVG) and the counterparty’s credit quality. Many factors may influence the nature and magnitude of these correlations over time. To the extent that these correlations are identified, the Firm may adjust the CVA associated with that counterparty’s AVG. The Firm risk manages exposure to changes in CVA by entering into credit derivative transactions, as well as interest rate, foreign exchange, equity and commodity derivative transactions.
The accompanying graph shows exposure profiles to the Firm’s current derivatives portfolio over the next 10 years as calculated by the DRE and AVG metrics. The two measures generally show that exposure will decline after the first year, if no new trades are added to the portfolio.
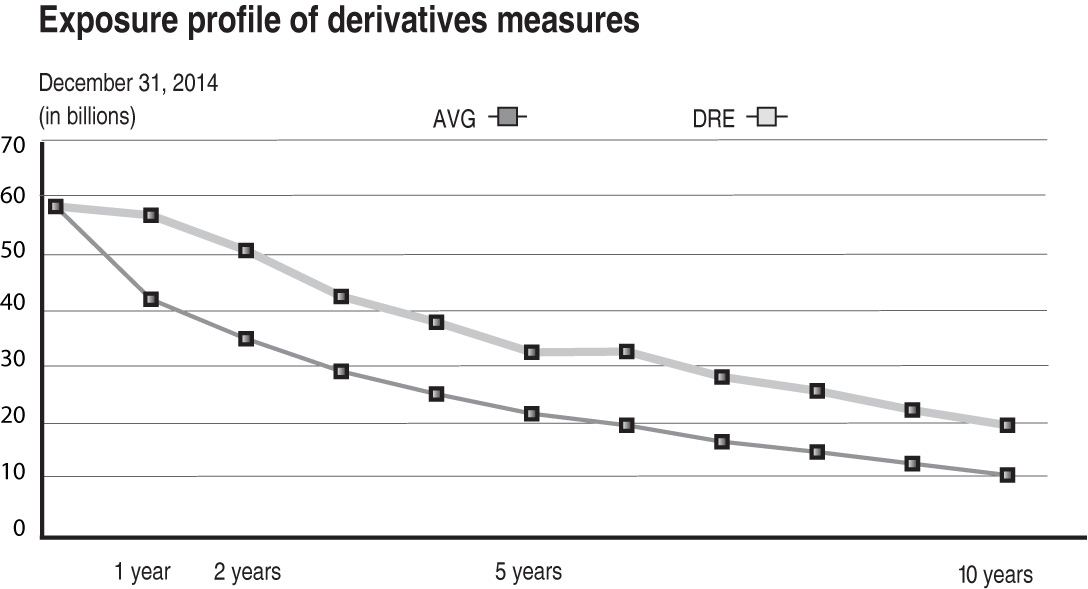
The following table summarizes the ratings profile by derivative counterparty of the Firm’s derivative receivables, including credit derivatives, net of other liquid securities collateral, for the dates indicated. The ratings scale is based on the Firm’s internal ratings, which generally correspond to the ratings as defined by S&P and Moody’s.
|
Ratings profile of derivative receivables
|
|||||||||||
|
Rating equivalent
|
2014
|
2013
(a)
|
|||||||||
|
December 31,
(in millions, except ratios)
|
Exposure net of all collateral
|
% of exposure net of all collateral
|
Exposure net of all collateral
|
% of exposure net of all collateral
|
|||||||
|
AAA/Aaa to AA-/Aa3
|
$
|
19,202
|
|
32
|
%
|
$
|
12,953
|
|
25
|
%
|
|
|
A+/A1 to A-/A3
|
13,940
|
|
24
|
|
12,930
|
|
25
|
|
|||
|
BBB+/Baa1 to BBB-/Baa3
|
19,008
|
|
32
|
|
15,220
|
|
30
|
|
|||
|
BB+/Ba1 to B-/B3
|
6,384
|
|
11
|
|
6,806
|
|
13
|
|
|||
|
CCC+/Caa1 and below
|
837
|
|
1
|
|
3,415
|
|
7
|
|
|||
|
Total
|
$
|
59,371
|
|
100
|
%
|
$
|
51,324
|
|
100
|
%
|
|
(a) The prior period amounts have been revised to conform with the current period presentation.
|
126
|
JPMorgan Chase & Co./2014 Annual Report
|
|
As noted above, the Firm uses collateral agreements to mitigate counterparty credit risk. The percentage of the Firm’s derivatives transactions subject to collateral agreements – excluding foreign exchange spot trades, which are not typically covered by collateral agreements due to their short maturity – was
88%
as of
December 31, 2014
, largely unchanged compared with
86%
as of
December 31, 2013
.
Credit derivatives
The Firm uses credit derivatives for two primary purposes: first, in its capacity as a market-maker; and second, as an end-user, to manage the Firm’s own credit risk associated with various exposures. For a detailed description of credit derivatives, see Credit derivatives in Note 6.
Credit portfolio management activities
Included in the Firm’s end-user activities are credit derivatives used to mitigate the credit risk associated with traditional lending activities (loans and unfunded commitments) and derivatives counterparty exposure in the Firm’s wholesale businesses (collectively, “credit portfolio management” activities). Information on credit portfolio management activities is provided in the table below. For further information on derivatives used in credit portfolio management activities, see Credit derivatives in Note 6.
The Firm also uses credit derivatives as an end-user to manage other exposures, including credit risk arising from certain securities held in the Firm’s market-making businesses. These credit derivatives are not included in credit portfolio management activities; for further information on these credit derivatives as well as credit derivatives used in the Firm’s capacity as a market maker in credit derivatives, see Credit derivatives in Note 6.
|
Credit derivatives used in credit portfolio management activities
|
|||||||
|
Notional amount of protection
purchased and sold
(a)
|
|||||||
|
December 31, (in millions)
|
2014
|
2013
|
|||||
|
Credit derivatives used to manage:
|
|||||||
|
Loans and lending-related commitments
|
$
|
2,047
|
|
$
|
2,764
|
|
|
|
Derivative receivables
|
24,656
|
|
25,328
|
|
|||
|
Total net protection purchased
|
26,703
|
|
28,092
|
|
|||
|
Total net protection sold
|
—
|
|
96
|
|
|||
|
Credit portfolio management derivatives notional, net
|
$
|
26,703
|
|
$
|
27,996
|
|
|
|
(a)
|
Amounts are presented net, considering the Firm’s net protection purchased or sold with respect to each underlying reference entity or index.
|
The credit derivatives used in credit portfolio management activities do not qualify for hedge accounting under U.S. GAAP; these derivatives are reported at fair value, with gains and losses recognized in principal transactions revenue. In contrast, the loans and lending-related commitments being risk-managed are accounted for on an accrual basis. This asymmetry in accounting treatment, between loans and lending-related commitments and the credit derivatives used in credit portfolio management activities, causes earnings volatility that is not representative, in the Firm’s view, of the true changes in value of the Firm’s overall credit exposure.
The effectiveness of the Firm’s credit default swap (“CDS”) protection as a hedge of the Firm’s exposures may vary depending on a number of factors, including the named reference entity (i.e., the Firm may experience losses on specific exposures that are different than the named reference entities in the purchased CDS); the contractual terms of the CDS (which may have a defined credit event that does not align with an actual loss realized by the Firm); and the maturity of the Firm’s CDS protection (which in some cases may be shorter than the Firm’s exposures). However, the Firm generally seeks to purchase credit protection with a maturity date that is the same or similar to the maturity date of the exposure for which the protection was purchased, and remaining differences in maturity are actively monitored and managed by the Firm.
|
JPMorgan Chase & Co./2014 Annual Report
|
127
|
|
Management’s discussion and analysis
|
ALLOWANCE FOR CREDIT LOSSES
|
||||
JPMorgan Chase
’s allowance for loan losses covers both the consumer (primarily scored) portfolio and wholesale (risk-rated) portfolio. The allowance represents management’s estimate of probable credit losses inherent in the Firm’s loan portfolio. Management also determines an allowance for wholesale and certain consumer lending-related commitments.
The allowance for loan losses includes an asset-specific component, a formula-based component, and a component related to PCI loans. For a further discussion of the components of the allowance for credit losses and related management judgments, see Critical Accounting Estimates Used by the Firm on
pages 161–165
and Note 15.
At least quarterly, the allowance for credit losses is reviewed by the Chief Risk Officer, the Chief Financial Officer and the Controller of the Firm, and discussed with the DRPC and Audit Committees of the Board of Directors of the Firm. As of
December 31, 2014
,
JPMorgan Chase
deemed the allowance for credit losses to be appropriate and sufficient to absorb probable credit losses inherent in the portfolio.
The allowance for credit losses was
$14.8 billion
at
December 31, 2014
, a decrease of
$2.2 billion
from
$17.0 billion
at
December 31, 2013
.
The consumer, excluding credit card, allowance for loan losses reflected a reduction from
December 31, 2013
, primarily due to the continued improvement in home prices and delinquencies in the residential real estate portfolio and the run-off of the student loan portfolio. For additional information about delinquencies and nonaccrual loans in the consumer, excluding credit card, loan portfolio, see Consumer Credit Portfolio on
pages 113–119
and Note 14.
The credit card allowance for loan losses reflected a reduction from
December 31, 2013
, primarily related to a decrease in the asset-specific allowance resulting from increased granularity of the impairment estimates and lower balances related to credit card loans modified in TDRs. For additional information about delinquencies in the credit card loan portfolio, see Consumer Credit Portfolio on
pages 113–119
and Note 14.
The wholesale allowance for credit losses decreased from December 31, 2013, reflecting a continued favorable credit environment as evidenced by low charge-off rates, and declining nonaccrual balances and other portfolio activity.
|
128
|
JPMorgan Chase & Co./2014 Annual Report
|
|
|
Summary of changes in the allowance for credit losses
|
|||||||||||||||||||||||||
|
2014
|
2013
|
||||||||||||||||||||||||
|
Year ended December 31,
|
Consumer, excluding
credit card
|
Credit card
|
Wholesale
|
Total
|
Consumer, excluding
credit card
|
Credit card
|
Wholesale
|
Total
|
|||||||||||||||||
|
(in millions, except ratios)
|
|||||||||||||||||||||||||
|
Allowance for loan losses
|
|||||||||||||||||||||||||
|
Beginning balance at January 1,
|
$
|
8,456
|
|
$
|
3,795
|
|
$
|
4,013
|
|
$
|
16,264
|
|
$
|
12,292
|
|
$
|
5,501
|
|
$
|
4,143
|
|
$
|
21,936
|
|
|
|
Gross charge-offs
|
2,132
|
|
3,831
|
|
151
|
|
6,114
|
|
2,754
|
|
4,472
|
|
241
|
|
7,467
|
|
|||||||||
|
Gross recoveries
|
(814
|
)
|
(402
|
)
|
(139
|
)
|
(1,355
|
)
|
(847
|
)
|
(593
|
)
|
(225
|
)
|
(1,665
|
)
|
|||||||||
|
Net charge-offs
|
1,318
|
|
3,429
|
|
12
|
|
4,759
|
|
1,907
|
|
3,879
|
|
16
|
|
5,802
|
|
|||||||||
|
Write-offs of PCI loans
(a)
|
533
|
|
—
|
|
—
|
|
533
|
|
53
|
|
—
|
|
—
|
|
53
|
|
|||||||||
|
Provision for loan losses
|
414
|
|
3,079
|
|
(269
|
)
|
3,224
|
|
(1,872
|
)
|
2,179
|
|
(119
|
)
|
188
|
|
|||||||||
|
Other
|
31
|
|
(6
|
)
|
(36
|
)
|
(11
|
)
|
(4
|
)
|
(6
|
)
|
5
|
|
(5
|
)
|
|||||||||
|
Ending balance at December 31,
|
$
|
7,050
|
|
$
|
3,439
|
|
$
|
3,696
|
|
$
|
14,185
|
|
$
|
8,456
|
|
$
|
3,795
|
|
$
|
4,013
|
|
$
|
16,264
|
|
|
|
Impairment methodology
|
|||||||||||||||||||||||||
|
Asset-specific
(b)
|
$
|
539
|
|
$
|
500
|
|
$
|
87
|
|
$
|
1,126
|
|
$
|
601
|
|
$
|
971
|
|
$
|
181
|
|
$
|
1,753
|
|
|
|
Formula-based
|
3,186
|
|
2,939
|
|
3,609
|
|
9,734
|
|
3,697
|
|
2,824
|
|
3,832
|
|
10,353
|
|
|||||||||
|
PCI
|
3,325
|
|
—
|
|
—
|
|
3,325
|
|
4,158
|
|
—
|
|
—
|
|
4,158
|
|
|||||||||
|
Total allowance for loan losses
|
$
|
7,050
|
|
$
|
3,439
|
|
$
|
3,696
|
|
$
|
14,185
|
|
$
|
8,456
|
|
$
|
3,795
|
|
$
|
4,013
|
|
$
|
16,264
|
|
|
|
Allowance for lending-related commitments
|
|||||||||||||||||||||||||
|
Beginning balance at January 1,
|
$
|
8
|
|
$
|
—
|
|
$
|
697
|
|
$
|
705
|
|
$
|
7
|
|
$
|
—
|
|
$
|
661
|
|
$
|
668
|
|
|
|
Provision for lending-related commitments
|
5
|
|
—
|
|
(90
|
)
|
(85
|
)
|
1
|
|
—
|
|
36
|
|
37
|
|
|||||||||
|
Other
|
—
|
|
—
|
|
2
|
|
2
|
|
—
|
|
—
|
|
—
|
|
—
|
|
|||||||||
|
Ending balance at December 31,
|
$
|
13
|
|
$
|
—
|
|
$
|
609
|
|
$
|
622
|
|
$
|
8
|
|
$
|
—
|
|
$
|
697
|
|
$
|
705
|
|
|
|
Impairment methodology
|
|||||||||||||||||||||||||
|
Asset-specific
|
$
|
—
|
|
$
|
—
|
|
$
|
60
|
|
$
|
60
|
|
$
|
—
|
|
$
|
—
|
|
$
|
60
|
|
$
|
60
|
|
|
|
Formula-based
|
13
|
|
—
|
|
549
|
|
562
|
|
8
|
|
—
|
|
637
|
|
645
|
|
|||||||||
|
Total allowance for lending-related commitments
(c)
|
$
|
13
|
|
$
|
—
|
|
$
|
609
|
|
$
|
622
|
|
$
|
8
|
|
$
|
—
|
|
$
|
697
|
|
$
|
705
|
|
|
|
Total allowance for credit losses
|
$
|
7,063
|
|
$
|
3,439
|
|
$
|
4,305
|
|
$
|
14,807
|
|
$
|
8,464
|
|
$
|
3,795
|
|
$
|
4,710
|
|
$
|
16,969
|
|
|
|
Memo:
|
|||||||||||||||||||||||||
|
Retained loans, end of period
|
$
|
294,979
|
|
$
|
128,027
|
|
$
|
324,502
|
|
$
|
747,508
|
|
$
|
288,449
|
|
$
|
127,465
|
|
$
|
308,263
|
|
$
|
724,177
|
|
|
|
Retained loans, average
|
289,212
|
|
124,604
|
|
316,060
|
|
729,876
|
|
289,294
|
|
123,518
|
|
307,340
|
|
720,152
|
|
|||||||||
|
PCI loans, end of period
|
46,696
|
|
—
|
|
4
|
|
46,700
|
|
53,055
|
|
—
|
|
6
|
|
53,061
|
|
|||||||||
|
Credit ratios
|
|||||||||||||||||||||||||
|
Allowance for loan losses to retained loans
|
2.39
|
%
|
2.69
|
%
|
1.14
|
%
|
1.90
|
%
|
2.93
|
%
|
2.98
|
%
|
1.30
|
%
|
2.25
|
%
|
|||||||||
|
Allowance for loan losses to retained nonaccrual loans
(d)
|
110
|
|
NM
|
617
|
|
202
|
|
113
|
|
NM
|
489
|
|
196
|
|
|||||||||||
|
Allowance for loan losses to retained nonaccrual loans excluding credit card
|
110
|
|
NM
|
617
|
|
153
|
|
113
|
|
NM
|
489
|
|
150
|
|
|||||||||||
|
Net charge-off rates
|
0.46
|
|
2.75
|
|
—
|
|
0.65
|
|
0.66
|
|
3.14
|
|
0.01
|
|
0.81
|
|
|||||||||
|
Credit ratios, excluding residential real estate PCI loans
|
|||||||||||||||||||||||||
|
Allowance for loan losses to
retained loans |
1.50
|
|
2.69
|
|
1.14
|
|
1.55
|
|
1.83
|
|
2.98
|
|
1.30
|
|
1.80
|
|
|||||||||
|
Allowance for loan losses to
retained nonaccrual loans (d) |
58
|
|
NM
|
617
|
|
155
|
|
57
|
|
NM
|
489
|
|
146
|
|
|||||||||||
|
Allowance for loan losses to
retained nonaccrual loans excluding credit card |
58
|
|
NM
|
617
|
|
106
|
|
57
|
|
NM
|
489
|
|
100
|
|
|||||||||||
|
Net charge-off rates
|
0.55
|
%
|
2.75
|
%
|
—
|
%
|
0.70
|
%
|
0.82
|
%
|
3.14
|
%
|
0.01
|
%
|
0.87
|
%
|
|||||||||
|
Note:
|
In the table above, the financial measures which exclude the impact of PCI loans are non-GAAP financial measures. For additional information, see Explanation and Reconciliation of the Firm’s Use of Non-GAAP Financial Measures on
pages 77–78
.
|
|
(a)
|
Write-offs of PCI loans are recorded against the allowance for loan losses when actual losses for a pool exceed estimated losses that were recorded as purchase accounting adjustments at the time of acquisition. A write-off of a PCI loan is recognized when the underlying loan is removed from a pool (e.g., upon liquidation). During the fourth quarter of 2014, the Firm recorded a $291 million adjustment to reduce the PCI allowance and the recorded investment in the Firm’s PCI loan portfolio, primarily reflecting the cumulative effect of interest forgiveness modifications. This adjustment had no impact to the Firm’s Consolidated statements of income.
|
|
(b)
|
Includes risk-rated loans that have been placed on nonaccrual status and loans that have been modified in a TDR.
|
|
(c)
|
The allowance for lending-related commitments is reported in other liabilities on the Consolidated balance sheets.
|
|
(d)
|
The Firm’s policy is generally to exempt credit card loans from being placed on nonaccrual status as permitted by regulatory guidance.
|
|
JPMorgan Chase & Co./2014 Annual Report
|
129
|
|
Management’s discussion and analysis
Provision for credit losses
For the year ended
December 31, 2014
, the provision for credit losses was
$3.1 billion
, compared with
$225 million
for the year ended
December 31, 2013
.
The increase in consumer, excluding credit card, provision for credit losses for the year ended
December 31, 2014
reflected a $904 million reduction in the allowance for loan losses, as noted above in the Allowance for Credit Losses discussion, which was lower than the $3.8 billion reduction in the prior year. The lower allowance reduction was partially offset by lower net charge-offs in 2014.
The increase in credit card provision for credit losses for the year ended
December 31, 2014
reflected a $350 million
reduction in the allowance for loan losses, as noted above in the Allowance for Credit Losses discussion, which was lower than the $1.7 billion reduction in the prior year. The lower allowance reduction was partially offset by lower net charge-offs in 2014.
The wholesale provision for credit losses for the year ended
December 31, 2014
reflected a continued favorable credit environment as evidenced by low charge-off rates, and declining nonaccrual balances and other portfolio activity.
For further information on the provision for credit losses, see the Consolidated Results of Operations on
pages 68–71
.
|
Year ended December 31,
|
Provision for loan losses
|
Provision for
lending-related commitments
|
Total provision for credit losses
|
|||||||||||||||||||||||||||
|
(in millions)
|
2014
|
|
2013
|
|
2012
|
2014
|
|
2013
|
|
2012
|
|
2014
|
|
2013
|
|
2012
|
|
|||||||||||||
|
Consumer, excluding credit card
|
$
|
414
|
|
$
|
(1,872
|
)
|
$
|
302
|
|
$
|
5
|
|
$
|
1
|
|
$
|
—
|
|
$
|
419
|
|
$
|
(1,871
|
)
|
$
|
302
|
|
|||
|
Credit card
|
3,079
|
|
2,179
|
|
3,444
|
|
—
|
|
—
|
|
—
|
|
3,079
|
|
2,179
|
|
3,444
|
|
||||||||||||
|
Total consumer
|
3,493
|
|
307
|
|
3,746
|
|
5
|
|
1
|
|
—
|
|
3,498
|
|
308
|
|
3,746
|
|
||||||||||||
|
Wholesale
|
(269
|
)
|
(119
|
)
|
(359
|
)
|
(90
|
)
|
36
|
|
(2
|
)
|
(359
|
)
|
(83
|
)
|
(361
|
)
|
||||||||||||
|
Total
|
$
|
3,224
|
|
$
|
188
|
|
$
|
3,387
|
|
$
|
(85
|
)
|
$
|
37
|
|
$
|
(2
|
)
|
$
|
3,139
|
|
$
|
225
|
|
$
|
3,385
|
|
|||
|
130
|
JPMorgan Chase & Co./2014 Annual Report
|
|
|
MARKET RISK MANAGEMENT
|
||||
Market risk is the potential for adverse changes in the value of the Firm’s assets and liabilities resulting from changes in market variables such as interest rates, foreign exchange rates, equity prices, commodity prices, implied volatilities or credit spreads.
Market risk management
Market Risk is an independent risk management function that identifies and monitors market risks throughout the Firm and defines market risk policies and procedures. The Market Risk function reports to the Firm’s CRO.
Market Risk seeks to control risk, facilitate efficient risk/return decisions, reduce volatility in operating performance and provide transparency into the Firm’s market risk profile for senior management, the Board of Directors and regulators. Market Risk is responsible for the following functions:
|
•
|
Establishment of a market risk policy framework
|
|
•
|
Independent measurement, monitoring and control of line of business and firmwide market risk
|
|
•
|
Definition, approval and monitoring of limits
|
|
•
|
Performance of stress testing and qualitative risk assessments
|
Risk identification and classification
Each line of business is responsible for the management of the market risks within its units. The independent risk management group responsible for overseeing each line of business is charged with ensuring that all material market risks are appropriately identified, measured, monitored and managed in accordance with the risk policy framework set out by Market Risk.
Risk measurement
Tools used to measure risk
Because no single measure can reflect all aspects of market risk, the Firm uses various metrics, both statistical and nonstatistical, including:
|
•
|
VaR
|
|
•
|
Economic-value stress testing
|
|
•
|
Nonstatistical risk measures
|
|
•
|
Loss advisories
|
|
•
|
Profit and loss drawdowns
|
|
•
|
Earnings-at-risk
|
Risk monitoring and control
Market risk is controlled primarily through a series of limits set in the context of the market environment and business strategy. In setting limits, the Firm takes into consideration factors such as market volatility, product liquidity and accommodation of client business and management experience. The Firm maintains different levels of limits. Corporate level limits include VaR and stress limits. Similarly, line of business limits include VaR and stress limits and may be supplemented by loss advisories, nonstatistical measurements and profit and loss drawdowns. Limits may also be set within the lines of business, as well at the portfolio or legal entity level.
Limits are set by Market Risk and are regularly reviewed and updated as appropriate, with any changes approved by lines of business management and Market Risk. Senior management, including the Firm’s CEO and CRO, are responsible for reviewing and approving certain of these risk limits on an ongoing basis. All limits that have not been reviewed within specified time periods by Market Risk are escalated to senior management. The lines of business are responsible for adhering to established limits against which exposures are monitored and reported.
Limit breaches are required to be reported in a timely manner by Risk Management to limit approvers, Market Risk and senior management. In the event of a breach, Market Risk consults with Firm senior management and lines of business senior management to determine the appropriate course of action required to return to compliance, which may include a reduction in risk in order to remedy the breach. Certain Firm or line of business-level limits that have been breached for three business days or longer, or by more than 30%, are escalated to senior management and the Firmwide Risk Committee.
|
JPMorgan Chase & Co./2014 Annual Report
|
131
|
|
Management’s discussion and analysis
The following table summarizes by LOB the predominant business activities that give rise to market risk, and the market risk management tools utilized to manage those risks; CB is not presented in the table below as it does not give rise to significant market risk.
|
Risk identification and classification for business activities
|
||||
|
LOB
|
Predominant business activities and related market risks
|
Positions included in Risk Management VaR
|
Positions included in other risk measures
(Not included in Risk Management VaR)
|
|
|
CIB
|
• Makes markets and services clients across fixed income, foreign exchange, equities and commodities
• Market risk arising from a potential decline in net income as a result of changes in market prices; e.g. rates and credit spreads
|
• Market risk
(a)
related to:
• Trading assets/liabilities - debt and equity instruments, and derivatives, including hedges of the retained loan portfolio and CVA
• Certain securities purchased under resale agreements and securities borrowed
• Certain securities loaned or sold under repurchase agreements
• Structured notes
• Derivative CVA
|
• Principal investing activities
• Retained loan portfolio
• Deposits
• DVA and FVA on derivatives and structured notes
|
|
|
CCB
|
• Originates and services mortgage loans
• Complex, non-linear interest rate and basis risk
• Non-linear risk arises primarily from prepayment options embedded in mortgages and changes in the probability of newly originated mortgage commitments actually closing
• Basis risk results from differences in the relative movements of the rate indices underlying mortgage exposure and other interest rates
|
Mortgage Banking
• Mortgage pipeline loans, classified as derivatives
• Warehouse loans, classified as trading assets - debt instruments
• MSRs
• Hedges of the MSRs and loans, classified as derivatives
• Interest-only securities, classified as trading assets and related hedges classified as derivatives
|
• Retained loan portfolio
• Deposits
|
|
|
Corporate
|
• Manages the Firm’s liquidity, funding, structural interest rate and foreign exchange risks arising from activities undertaken by the Firm’s four major reportable business segments
|
Treasury and CIO
• Primarily derivative positions measured at fair value through earnings, classified as derivatives
|
• Private equity and other related investments
• Investment securities portfolio and related hedges
• Deposits
• Long-term debt and related hedges
|
|
|
AM
|
• Market risk arising from the Firm’s initial capital investments in products, such as mutual funds, managed by AM
|
• Initial seed capital investments and related hedges classified as derivatives
|
• Capital invested alongside third-party investors, typically in privately distributed collective vehicles managed by AM (i.e., co-Investments)
• Retained loan portfolio
• Deposits
|
|
|
(a)
|
Market risk for derivatives is generally measured after consideration of DVA and FVA on those positions; market risk for structured notes is generally measured without consideration to such adjustments.
|
|
132
|
JPMorgan Chase & Co./2014 Annual Report
|
|
Value-at-risk
JPMorgan Chase utilizes VaR, a statistical risk measure, to estimate the potential loss from adverse market moves in a normal market environment. The Firm has a single overarching VaR model framework used for calculating Risk Management VaR and Regulatory VaR.
The framework is employed across the Firm using historical simulation based on data for the previous 12 months. The framework’s approach assumes that historical changes in market values are representative of the distribution of potential outcomes in the immediate future. The Firm believes the use of Risk Management VaR provides a stable measure of VaR that closely aligns to the day-to-day risk management decisions made by the lines of business and provides necessary/appropriate information to respond to risk events on a daily basis.
Risk Management VaR is calculated assuming a one-day holding period and an expected tail-loss methodology which approximates a 95% confidence level. This means that, assuming current changes in market values are consistent with the historical changes used in the simulation, the Firm would expect to incur VaR “band breaks,” defined as losses greater than that predicted by VaR estimates, not more than five times every 100 trading days. The number of VaR band breaks observed can differ from the statistically expected number of band breaks if the current level of market volatility is materially different from the level of market volatility during the twelve months of historical data used in the VaR calculation.
Underlying the overall VaR model framework are individual VaR models that simulate historical market returns for individual products and/or risk factors. To capture material market risks as part of the Firm’s risk management framework, comprehensive VaR model calculations are performed daily for businesses whose activities give rise to market risk. These VaR models are granular and incorporate numerous risk factors and inputs to simulate daily changes in market values over the historical period; inputs are selected based on the risk profile of each portfolio as sensitivities and historical time series used to generate daily market values may be different across product types or risk management systems. The VaR model results across all portfolios are aggregated at the Firm level.
Data sources used in VaR models may be the same as those used for financial statement valuations. However, in cases where market prices are not observable, or where proxies are used in VaR historical time series, the sources may differ. In addition, the daily market data used in VaR models may be different than the independent third-party data collected for VCG price testing in their monthly valuation process (see Valuation process in Note 3 for further information on the Firm’s valuation process). VaR model calculations require daily data and a consistent source for valuation and therefore it is not practical to use the data collected in the VCG monthly valuation process.
VaR provides a consistent framework to measure risk profiles and levels of diversification across product types and is used for aggregating risks across businesses and monitoring limits. These VaR results are reported to senior management, the Board of Directors and regulators.
Since VaR is based on historical data, it is an imperfect measure of market risk exposure and potential losses, and it is not used to estimate the impact of stressed market conditions or to manage any impact from potential stress events. In addition, based on their reliance on available historical data, limited time horizons, and other factors, VaR measures are inherently limited in their ability to measure certain risks and to predict losses, particularly those associated with market illiquidity and sudden or severe shifts in market conditions. The Firm therefore considers other measures in addition to VaR, such as stress testing, to capture and manage its market risk pos
itions.
In addition, for certain products, specific risk parameters are not captured in VaR due to the lack of inherent liquidity and availability of appropriate historical data. The Firm uses proxies to estimate the VaR for these and other products when daily time series are not available. It is likely that using an actual price-based time series for these products, if available, would affect the VaR results presented.
The Firm uses alternative methods to capture and measure those risk parameters that are not otherwise captured in VaR, including economic-value stress testing and nonstatistical measures as described further below.
The Firm’s VaR model calculations are periodically evaluated and enhanced in response to changes in the composition of the Firm’s portfolios, changes in market conditions, improvements in the Firm’s modeling techniques and other factors. Such changes will also affect historical comparisons of VaR results. Model changes go through a review and approval process by the Model Review Group prior to implementation into the operating environment. For further information, see Model risk on
page 139
.
Separately, the Firm calculates a daily aggregated VaR in accordance with regulatory rules (“Regulatory VaR”), which is used to derive the Firm’s regulatory VaR-based capital requirements under Basel III. This Regulatory VaR model framework currently assumes a ten business-day holding period and an expected tail loss methodology which approximates a 99% confidence level. Regulatory VaR is applied to “covered” positions as defined by Basel III, which may be different than the positions included in the Firm’s Risk Management VaR. For example, credit derivative hedges of accrual loans are included in the Firm’s Risk Management VaR, while Regulatory VaR excludes these credit derivative hedges. In addition, in contrast to the Firm’s Risk Management VaR, Regulatory VaR currently excludes the diversification benefit for certain VaR models.
|
JPMorgan Chase & Co./2014 Annual Report
|
133
|
|
Management’s discussion and analysis
For additional information on Regulatory VaR and the other components of market risk regulatory capital (e.g. VaR-based measure, stressed VaR-based measure and the respective backtesting) for the Firm, see JPMorgan Chase’s
Basel III Pillar 3 Regulatory Capital Disclosures reports, which are available on the Firm’s website (http://investor.shareholder.com/jpmorganchase/basel.cfm).
The table below shows the results of the Firm’s Risk Management VaR measure using a 95% confidence level.
|
Total VaR
|
||||||||||||||||||||||||||||||||||
|
As of or for the year ended December 31,
|
2014
|
2013
|
At December 31,
|
|||||||||||||||||||||||||||||||
|
(in millions)
|
Avg.
|
Min
|
Max
|
Avg.
|
Min
|
Max
|
2014
|
2013
|
||||||||||||||||||||||||||
|
CIB trading VaR by risk type
|
||||||||||||||||||||||||||||||||||
|
Fixed income
|
$
|
34
|
|
$
|
23
|
|
$
|
45
|
|
$
|
43
|
|
$
|
23
|
|
$
|
62
|
|
$
|
34
|
|
$
|
36
|
|
||||||||||
|
Foreign exchange
|
8
|
|
4
|
|
25
|
|
7
|
|
5
|
|
11
|
|
8
|
|
9
|
|
||||||||||||||||||
|
Equities
|
15
|
|
10
|
|
23
|
|
13
|
|
9
|
|
21
|
|
22
|
|
14
|
|
||||||||||||||||||
|
Commodities and other
|
8
|
|
5
|
|
14
|
|
14
|
|
11
|
|
18
|
|
6
|
|
13
|
|
||||||||||||||||||
|
Diversification benefit to CIB trading VaR
|
(30
|
)
|
(a)
|
NM
|
|
(b)
|
NM
|
|
(b)
|
(34
|
)
|
(a)
|
NM
|
|
(b)
|
NM
|
|
(b)
|
(32
|
)
|
(a)
|
(36
|
)
|
(a)
|
||||||||||
|
CIB trading VaR
|
35
|
|
24
|
|
49
|
|
43
|
|
21
|
|
66
|
|
38
|
|
36
|
|
||||||||||||||||||
|
Credit portfolio VaR
|
13
|
|
8
|
|
18
|
|
13
|
|
10
|
|
18
|
|
16
|
|
11
|
|
||||||||||||||||||
|
Diversification benefit to CIB VaR
|
(8
|
)
|
(a)
|
NM
|
|
(b)
|
NM
|
|
(b)
|
(9
|
)
|
(a)
|
NM
|
|
(b)
|
NM
|
|
(b)
|
(9
|
)
|
(a)
|
(5
|
)
|
(a)
|
||||||||||
|
CIB VaR
|
40
|
|
29
|
|
56
|
|
47
|
|
25
|
|
74
|
|
45
|
|
42
|
|
||||||||||||||||||
|
Mortgage Banking VaR
|
7
|
|
2
|
|
28
|
|
12
|
|
4
|
|
24
|
|
3
|
|
5
|
|
||||||||||||||||||
|
Treasury and CIO VaR
(c)
|
4
|
|
3
|
|
6
|
|
6
|
|
3
|
|
14
|
|
4
|
|
4
|
|
||||||||||||||||||
|
Asset Management VaR
|
3
|
|
2
|
|
4
|
|
4
|
|
2
|
|
5
|
|
2
|
|
3
|
|
||||||||||||||||||
|
Diversification benefit to other VaR
|
(4
|
)
|
(a)
|
NM
|
|
(b)
|
NM
|
|
(b)
|
(8
|
)
|
(a)
|
NM
|
|
(b)
|
NM
|
|
(b)
|
(3
|
)
|
(a)
|
(5
|
)
|
(a)
|
||||||||||
|
Other VaR
|
10
|
|
5
|
|
27
|
|
14
|
|
6
|
|
28
|
|
6
|
|
7
|
|
||||||||||||||||||
|
Diversification benefit to CIB and other VaR
|
(7
|
)
|
(a)
|
NM
|
|
(b)
|
NM
|
|
(b)
|
(9
|
)
|
(a)
|
NM
|
|
(b)
|
NM
|
|
(b)
|
(5
|
)
|
(a)
|
(5
|
)
|
(a)
|
||||||||||
|
Total VaR
|
$
|
43
|
|
$
|
30
|
|
$
|
70
|
|
$
|
52
|
|
$
|
29
|
|
$
|
87
|
|
$
|
46
|
|
$
|
44
|
|
||||||||||
|
(a)
|
Average portfolio VaR and period-end portfolio VaR were less than the sum of the VaR of the components described above, which is due to portfolio diversification. The diversification effect reflects the fact that risks are not perfectly correlated.
|
|
(b)
|
Designated as not meaningful (“NM”), because the minimum and maximum may occur on different days for distinct risk components, and hence it is not meaningful to compute a portfolio-diversification effect.
|
|
(c)
|
The Treasury and CIO VaR includes Treasury VaR as of the third quarter of 2013.
|
As presented in the table above, average Total VaR and average CIB VaR decreased during 2014, compared with 2013. The decrease in Total VaR was primarily due to risk reduction in CIB and Mortgage Banking as well as lower volatility in the historical one-year look-back period during 2014 versus 2013.
Average CIB trading VaR decreased during 2014 primarily due to lower VaR in Fixed Income (driven by unwinding of risk and redemptions in the synthetic credit portfolio, and lower volatility in the historical one-year look-back period) and to reduced risk positions in commodities.
Average Mortgage Banking VaR decreased during 2014 as a result of reduced exposures due to lower loan originations.
Average Treasury and CIO VaR decreased during 2014, compared with 2013. The decrease predominantly reflected the unwind and roll-off of certain marked to market positions, and lower market volatility in the historical one-year look-back period.
The Firm’s average Total VaR diversification benefit was $7 million or 16% of the sum for 2014, compared with $9 million or 17% of the sum for 2013. In general, over the course of the year, VaR exposure can vary significantly as positions change, market volatility fluctuates and diversification benefits change.
VaR back-testing
The Firm evaluates the effectiveness of its VaR methodology by back-testing, which compares the daily Risk Management VaR results with the daily gains and losses recognized on market-risk related revenue.
The Firm’s definition of market risk-related gains and losses is consistent with the definition used by the banking regulators under Basel III. Under this definition market risk-related gains and losses are defined as: profits and losses on the Firm’s Risk Management positions, excluding fees, commissions, certain valuation adjustments (e.g., liquidity and DVA), net interest income, and gains and losses arising from intraday trading.
|
134
|
JPMorgan Chase & Co./2014 Annual Report
|
|
The following chart compares the daily market risk-related gains and losses on the Firm’s Risk Management positions for the year ended December 31, 2014. As the chart presents market risk-related gains and losses related to those positions included in the Firm’s Risk Management VaR, the results in the table below differ from the results of backtesting disclosed in the Market Risk section of the
Firm’s Basel III Pillar 3 Regulatory Capital Disclosures reports, which are based on Regulatory VaR applied to covered positions. The chart shows that for the year ended December 31, 2014, the Firm observed five VaR band breaks and posted gains on 157 of the 260 days in this period.
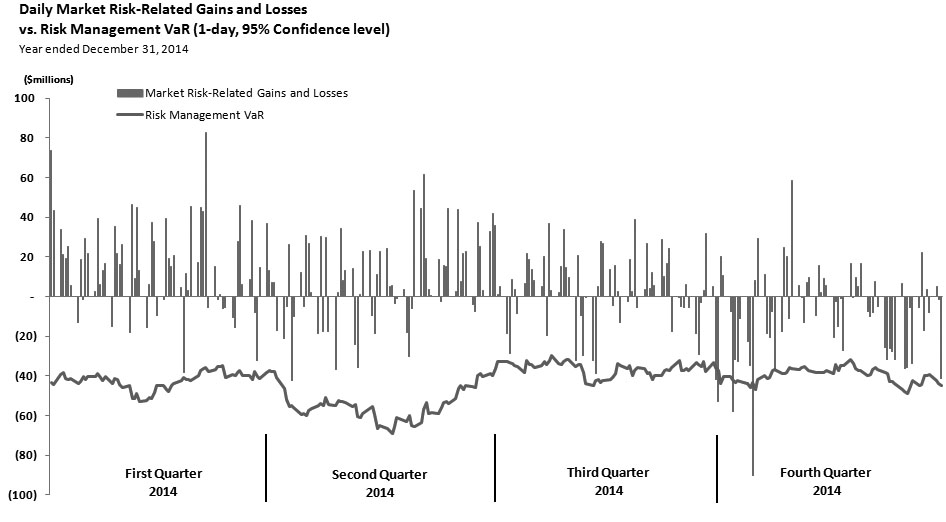
Other risk measures
Economic-value stress testing
Along with VaR, stress testing is an important tool in measuring and controlling risk. While VaR reflects the risk of loss due to adverse changes in markets using recent historical market behavior as an indicator of losses, stress testing is intended to capture the Firm’s exposure to unlikely but plausible events in abnormal markets. The Firm runs weekly stress tests on market-related risks across the lines of business using multiple scenarios that assume significant changes in risk factors such as credit spreads, equity prices, interest rates, currency rates or commodity prices. The framework uses a grid-based approach, which calculates multiple magnitudes of stress for both market rallies and market sell-offs for each risk factor. Stress-test results, trends and explanations based on current market risk positions are reported to the Firm’s senior management and to the lines of business to allow them to better understand the sensitivity of positions to certain defined events and to enable them to manage their risks with more transparency.
Stress scenarios are defined and reviewed by Market Risk, and significant changes are reviewed by the relevant Risk Committees. While most of the scenarios estimate losses based on significant market moves, such as an equity market collapse or credit crisis, the Firm also develops scenarios to quantify risk arising from specific portfolios or concentrations of risks, which attempt to capture certain idiosyncratic market movements. Scenarios may be redefined on an ongoing basis to reflect current market conditions. Ad hoc scenarios are run in response to specific market events or concerns. The Firm’s stress testing framework is utilized in calculating results under scenarios mandated by the Federal Reserve’s CCAR and ICAAP (“Internal Capital Adequacy Assessment Process”) processes.
|
JPMorgan Chase & Co./2014 Annual Report
|
135
|
|
Management’s discussion and analysis
Nonstatistical risk measures
Nonstatistical risk measures include sensitivities to variables used to value positions, such as credit spread sensitivities, interest rate basis point values and market values. These measures provide granular information on the Firm’s market risk exposure. They are aggregated by line-of-business and by risk type, and are used for tactical control and monitoring limits.
Loss advisories and profit and loss drawdowns
Loss advisories and profit and loss drawdowns are tools used to highlight trading losses above certain levels of risk tolerance. Profit and loss drawdowns are defined as the decline in net profit and loss since the year-to-date peak revenue level.
Earnings-at-risk
The VaR and stress-test measures described above illustrate the total economic sensitivity of the Firm’s Consolidated balance sheets to changes in market variables. The effect of interest rate exposure on the Firm’s reported net income is also important as interest rate risk represents one of the Firm’s significant market risks. Interest rate risk arises not only from trading activities but also from the Firm’s traditional banking activities, which include extension of loans and credit facilities, taking deposits and issuing debt. The Firm evaluates its structural interest rate risk exposure through earnings-at-risk, which measures the extent to which changes in interest rates will affect the Firm’s core net interest income (see
page 78
for further discussion of core net interest income) and interest rate-sensitive fees. Earnings-at-risk excludes the impact of trading activities and MSR, as these sensitivities are captured under VaR.
The CIO, Treasury and Corporate (“CTC”) Risk Committee establishes the Firm’s structural interest rate risk policies and market risk limits, which are subject to approval by the Risk Policy Committee of the Firm’s Board of Directors. CIO, working in partnership with the lines of business, calculates the Firm’s structural interest rate risk profile and reviews it with senior management including the CTC Risk Committee and the Firm’s ALCO. In addition, oversight of structural interest rate risk is managed through a dedicated risk function reporting to the CTC CRO. This risk function is responsible for providing independent oversight and governance around assumptions; and establishing and monitoring limits for structural interest rate risk.
Structural interest rate risk can occur due to a variety of factors, including:
|
•
|
Differences in the timing among the maturity or repricing of assets, liabilities and off-balance sheet instruments.
|
|
•
|
Differences in the amounts of assets, liabilities and off-balance sheet instruments that are repricing at the same time.
|
|
•
|
Differences in the amounts by which short-term and long-term market interest rates change (for example, changes in the slope of the yield curve).
|
|
•
|
The impact of changes in the maturity of various assets, liabilities or off-balance sheet instruments as interest rates change.
|
The Firm manages interest rate exposure related to its assets and liabilities on a consolidated, corporate-wide basis. Business units transfer their interest rate risk to Treasury through a transfer-pricing system, which takes into account the elements of interest rate exposure that can be risk-managed in financial markets. These elements include asset and liability balances and contractual rates of interest, contractual principal payment schedules, expected prepayment experience, interest rate reset dates and maturities, rate indices used for repricing, and any interest rate ceilings or floors for adjustable rate products. All transfer-pricing assumptions are dynamically reviewed.
The Firm manages structural interest rate risk generally through its investment securities portfolio and related derivatives.
The Firm conducts simulations of changes in structural interest rate-sensitive revenue under a variety of interest rate scenarios. Earnings-at-risk scenarios estimate the potential change in this revenue, and the corresponding impact to the Firm’s pretax core net interest income, over the following 12 months, utilizing multiple assumptions as described below. These scenarios highlight exposures to changes in interest rates, pricing sensitivities on deposits, optionality and changes in product mix. The scenarios include forecasted balance sheet changes, as well as prepayment and reinvestment behavior. Mortgage prepayment assumptions are based on current interest rates compared with underlying contractual rates, the time since origination, and other factors which are updated periodically based on historical experience.
|
JPMorgan Chase’s 12-month pretax core net interest income sensitivity profiles.
|
||||||||||||
|
(Excludes the impact of trading activities and MSRs)
|
||||||||||||
|
Instantaneous change in rates
|
||||||||||||
|
(in millions)
|
+200 bps
|
+100 bps
|
-100 bps
|
-200 bps
|
||||||||
|
December 31, 2014
|
$
|
4,667
|
|
|
$
|
2,864
|
|
|
NM
|
(a)
|
NM
|
(a)
|
|
(a)
|
Downward 100- and 200-basis-points parallel shocks result in a federal funds target rate of zero and negative three- and six-month U.S. Treasury rates. The earnings-at-risk results of such a low-probability scenario are not meaningful.
|
The Firm’s benefit to rising rates is largely a result of reinvesting at higher yields and assets re-pricing at a faster pace than deposits.
Additionally, another interest rate scenario used by the Firm — involving a steeper yield curve with long-term rates rising by 100 basis points and short-term rates staying at current levels — results in a 12-month pretax core net interest income benefit of
$566 million
. The increase in core net interest income under this scenario reflects the Firm reinvesting at the higher long-term rates, with funding costs remaining unchanged.
|
136
|
JPMorgan Chase & Co./2014 Annual Report
|
|
|
COUNTRY RISK MANAGEMENT
|
||||
Country risk is the risk that a sovereign event or action alters the value or terms of contractual obligations of obligors, counterparties and issuers or adversely affects markets related to a particular country. The Firm has a comprehensive country risk management framework for assessing country risks, determining risk tolerance, and measuring and monitoring direct country exposures in the Firm. The Country Risk Management group is responsible for developing guidelines and policies for managing country risk in both emerging and developed countries. The Country Risk Management group actively monitors the various portfolios giving rise to country risk to ensure the Firm’s country risk exposures are diversified and that exposure levels are appropriate given the Firm’s strategy and risk tolerance relative to a country.
Country risk organization
The Country Risk Management group is an independent risk management function which works in close partnership with other risk functions to identify and monitor country risk within the Firm. The Firmwide Risk Executive for Country Risk reports to the Firm’s CRO.
Country Risk Management is responsible for the following functions:
|
•
|
Developing guidelines and policies consistent with a comprehensive country risk framework
|
|
•
|
Assigning sovereign ratings and assessing country risks
|
|
•
|
Measuring and monitoring country risk exposure and stress across the Firm
|
|
•
|
Managing country limits and reporting trends and limit breaches to senior management
|
|
•
|
Developing surveillance tools for early identification of potential country risk concerns
|
|
•
|
Providing country risk scenario analysis
|
Country risk identification and measurement
The Firm is exposed to country risk through its lending, investing, and market-making activities, whether cross-border or locally funded. Country exposure includes activity with both government and private-sector entities in a country. Under the Firm’s internal country risk management approach, country exposure is reported based on the country where the majority of the assets of the obligor, counterparty, issuer or guarantor are located or where the majority of its revenue is derived, which may be different than the domicile (legal residence) or country of incorporation of the obligor, counterparty, issuer or guarantor. Country exposures are generally measured by considering the Firm’s risk to an immediate default of the counterparty or obligor, with zero recovery. Assumptions are sometimes required in determining the measurement and allocation of country exposure, particularly in the case of certain tranched credit derivatives. Different measurement approaches or assumptions would affect the amount of reported country exposure.
Under the Firm’s internal country risk measurement framework:
|
•
|
Lending exposures are measured at the total committed amount (funded and unfunded), net of the allowance for credit losses and cash and marketable securities collateral received
|
|
•
|
Securities financing exposures are measured at their receivable balance, net of collateral received
|
|
•
|
Debt and equity securities are measured at the fair value of all positions, including both long and short positions
|
|
•
|
Counterparty exposure on derivative receivables is measured at the derivative’s fair value, net of the fair value of the related collateral. Counterparty exposure on derivatives can change significantly because of market movements.
|
|
•
|
Credit derivatives protection purchased and sold is reported based on the underlying reference entity and is measured at the notional amount of protection purchased or sold, net of the fair value of the recognized derivative receivable or payable. Credit derivatives protection purchased and sold in the Firm’s market-making activities is measured on a net basis, as such activities often result in selling and purchasing protection related to the same underlying reference entity; this reflects the manner in which the Firm manages these exposures
|
|
JPMorgan Chase & Co./2014 Annual Report
|
137
|
|
Management’s discussion and analysis
The Firm also has indirect exposures to country risk (for example, related to the collateral received on securities financing receivables or related to client clearing activities). These indirect exposures are managed in the normal course of business through the Firm’s credit, market, and operational risk governance, rather than through Country Risk Management.
The Firm’s internal country risk reporting differs from the reporting provided under the Federal Financial Institutions Examination Council (“FFIEC”) bank regulatory requirements as there are significant differences in reporting methodology. For further information on the FFIEC’s reporting methodology, see Cross-border outstandings on
page 325
.
Country risk stress testing
The country risk stress framework aims to identify potential losses arising from a country crisis by capturing the impact of large asset price movements in a country based on market shocks combined with counterparty specific assumptions. Country Risk Management periodically defines and runs ad hoc stress scenarios for individual countries in response to specific market events and sector performance concerns.
Country risk monitoring and control
The Country Risk Management Group establishes guidelines for sovereign ratings reviews and limit management. Country stress and nominal exposures are measured under a comprehensive country limit framework. Country ratings and limits activity are actively monitored and reported on a regular basis. Country limit requirements are reviewed and approved by senior management as often as necessary, but at least annually. In addition, the Country Risk Management group uses surveillance tools for early identification of potential country risk concerns, such as signaling models and ratings indicators.
Country risk reporting
The following table presents the Firm’s top 20 exposures by country (excluding the U.S.) as of
December 31, 2014
. The selection of countries is based solely on the Firm’s largest total exposures by country, based on the Firm’s internal country risk management approach, and does not represent the Firm’s view of any actual or potentially adverse credit conditions. Country exposures may fluctuate from period-to-period due to normal client activity and market flows.
|
Top 20 country exposures
|
|||||||||||||
|
December 31, 2014
|
|||||||||||||
|
(in billions)
|
Lending
(a)
|
Trading and investing
(b)(c)
|
Other
(d)
|
Total exposure
|
|||||||||
|
United Kingdom
|
$
|
25.8
|
|
$
|
31.1
|
|
$
|
1.4
|
|
$
|
58.3
|
|
|
|
Germany
|
23.5
|
|
21.6
|
|
0.2
|
|
45.3
|
|
|||||
|
Netherlands
|
6.1
|
|
19.2
|
|
2.1
|
|
27.4
|
|
|||||
|
France
|
11.4
|
|
15.2
|
|
0.2
|
|
26.8
|
|
|||||
|
China
|
10.8
|
|
7.0
|
|
0.5
|
|
18.3
|
|
|||||
|
Japan
|
11.5
|
|
5.5
|
|
0.4
|
|
17.4
|
|
|||||
|
Australia
|
6.4
|
|
10.8
|
|
—
|
|
17.2
|
|
|||||
|
Canada
|
12.4
|
|
4.2
|
|
0.3
|
|
16.9
|
|
|||||
|
Switzerland
|
9.3
|
|
1.7
|
|
2.3
|
|
13.3
|
|
|||||
|
India
|
5.8
|
|
6.2
|
|
0.6
|
|
12.6
|
|
|||||
|
Brazil
|
6.3
|
|
6.3
|
|
—
|
|
12.6
|
|
|||||
|
Korea
|
5.1
|
|
5.2
|
|
0.1
|
|
10.4
|
|
|||||
|
Spain
|
3.4
|
|
3.5
|
|
—
|
|
6.9
|
|
|||||
|
Hong Kong
|
1.7
|
|
4.1
|
|
1.0
|
|
6.8
|
|
|||||
|
Italy
|
2.4
|
|
3.4
|
|
0.2
|
|
6.0
|
|
|||||
|
Belgium
|
3.1
|
|
2.6
|
|
0.1
|
|
5.8
|
|
|||||
|
Taiwan
|
2.2
|
|
3.5
|
|
—
|
|
5.7
|
|
|||||
|
Singapore
|
3.1
|
|
1.9
|
|
0.5
|
|
5.5
|
|
|||||
|
Mexico
|
2.5
|
|
3.0
|
|
—
|
|
5.5
|
|
|||||
|
Luxembourg
|
3.5
|
|
0.3
|
|
1.1
|
|
4.9
|
|
|||||
|
(a)
|
Lending includes loans and accrued interest receivable, net of collateral and the allowance for loan losses, deposits with banks, acceptances, other monetary assets, issued letters of credit net of participations, and undrawn commitments to extend credit. Excludes intra-day and operating exposures, such as from settlement and clearing activities.
|
|
(b)
|
Includes market-making inventory, securities held in AFS accounts, counterparty exposure on derivative and securities financings net of collateral and hedging.
|
|
(c)
|
Includes single-name and index and tranched credit derivatives for which one or more of the underlying reference entities is in a country listed in the above table.
|
|
(d)
|
Includes capital invested in local entities and physical commodity inventory.
|
The Firm’s country exposure to Russia was $4.2 billion at December 31, 2014. The Firm is closely monitoring events in the region, and assessing the impact of falling oil prices, a weakening currency, ongoing sanctions and potential countermeasures such as capital controls. The Firm is also focused on possible contagion effects, via trade, financial or political channels.
|
138
|
JPMorgan Chase & Co./2014 Annual Report
|
|
|
MODEL RISK MANAGEMENT
|
||||
Model risk
Model risk is the potential for adverse consequences from decisions based on incorrect or misused model outputs and reports.
The Firm uses models, for many purposes, but primarily for the measurement, monitoring and management of risk positions. Valuation models are employed by the Firm to value certain financial instruments that cannot otherwise be valued using quoted prices. These valuation models may also be employed as inputs to risk management models, including VaR and economic stress models. The Firm also makes use of models for a number of other purposes, including the calculation of regulatory capital requirements and estimating the allowance for credit losses.
Models are owned by various functions within the Firm based on the specific purposes of such models. For example, VaR models and certain regulatory capital models are owned by the line of business-aligned risk management functions. Owners of models are responsible for the development, implementation and testing of their models, as well as referral of models to the Model Risk function (within the Model Risk and Development unit) for review and approval. Once models have been approved, model owners are responsible for the maintenance of a robust operating environment and must monitor and evaluate the performance of the models on an ongoing basis. Model owners may seek to enhance models in response to changes in the portfolios and for changes in product and market developments, as well as to capture improvements in available modeling techniques and systems capabilities.
The Model Risk review and governance functions are independent of the model owners and they review and approve a wide range of models, including risk management, valuation and regulatory capital models used by the Firm. The Model Risk review and governance functions are part of the Firm’s Model Risk and Development unit, and the Firmwide Model Risk and Development Executive reports to the Firm’s CRO.
Models are tiered based on an internal standard according to their complexity, the exposure associated with the model and the Firm’s reliance on the model. This tiering is subject to the approval of the Model Risk function. A model review conducted by the Model Risk function considers the model’s suitability for the specific uses to which it will be put. The factors considered in reviewing a model include whether the model accurately reflects the characteristics of the product and its significant risks, the selection and reliability of model inputs, consistency with models for similar products, the appropriateness of any model-related adjustments, and sensitivity to input parameters and assumptions that cannot be observed from the market. When reviewing a model, the Model Risk function analyzes and challenges the model methodology and the reasonableness of model assumptions and may perform or require additional testing, including back-testing of model outcomes. Model reviews are approved by the appropriate level of management within the Model Risk function based on the relevant tier of the model.
Under the Firm’s model risk policy, new models, as well as material changes to existing models, are reviewed and approved by the Model Risk function prior to implementation in the operating environment.
In the event that the Model Risk function does not approve a model, the model owner is required to remediate the model within a time period agreed upon with the Model Risk function. The model owner is also required to resubmit the model for review to the Model Risk function and to take appropriate actions to mitigate the model risk if it is to be used in the interim. These actions will depend on the model and may include, for example, limitation of trading activity. The Firm may also implement other appropriate risk measurement tools to augment the model that is subject to remediation. In certain circumstances, exceptions to the Firm’s model risk policy may be granted by the head of the Model Risk function to allow a model to be used prior to review or approval.
For a summary of valuations based on models, see Critical Accounting Estimates Used by the Firm and Note 3.
|
JPMorgan Chase & Co./2014 Annual Report
|
139
|
|
Management’s discussion and analysis
|
PRINCIPAL RISK MANAGEMENT
|
||||
Principal investments are predominantly privately-held financial assets and instruments, typically representing an ownership or junior capital position, that have unique risks due to their illiquidity or for which there is less observable market or valuation data. Such investing activities are typically intended to be held over extended investment periods and, accordingly, the Firm has no expectation for short-term gain with respect to these investments. Principal investments cover multiple asset classes and are made either in stand-alone investing businesses or as part of a broader business platform. Asset classes include tax-oriented investments including affordable housing and alternative energy investments, private equity, and mezzanine/junior debt investments.
The Firm’s principal investments are managed under various lines of business and are captured within the respective LOB’s financial results. The Firm’s approach to managing principal risk is consistent with the Firm’s general risk governance structure. A Firmwide risk policy framework exists for all principal investing activities. All investments are approved by investment committees that include executives who are independent from the investing businesses. The Firm’s independent control functions are responsible for reviewing the appropriateness of the carrying value of principal investments in accordance with relevant policies. Targeted levels for total and annual investments are established in order to manage the overall size of the portfolios. Industry, geographic, and position level concentration limits are in place intended to ensure diversification of the portfolios. The Firm also conducts stress testing on these portfolios using specific scenarios that estimate losses based on significant market moves and/or other risk events.
The Firm has taken steps to reduce its exposure to principal investments, selling portions of Corporate’s One Equity Partners private equity portfolio and the CIB’s Global Special Opportunities Group equity and mezzanine financing portfolio.
|
140
|
JPMorgan Chase & Co./2014 Annual Report
|
|
|
OPERATIONAL RISK MANAGEMENT
|
||||
Operational risk is the risk of loss resulting from inadequate or failed processes or systems or due to external events that are neither market nor credit-related. Operational risk is inherent in the Firm’s activities and
can manifest itself in various ways, including fraudulent acts, business interruptions, inappropriate behavior of employees, failure to comply with applicable laws and regulations or failure of vendors to perform in accordance with their arrangements. These events could result in financial losses, litigation and regulatory fines, as well as other damage to the Firm. The goal is to keep operational risk at appropriate levels, in light of the Firm’s financial strength, the characteristics of its businesses, the markets in which it operates, and the competitive and regulatory environment to which it is subject.
Overview
To monitor and control operational risk, the Firm maintains an overall Operational Risk Management Framework (“ORMF”) which comprises governance oversight, risk assessment, capital measurement, and reporting and monitoring. The ORMF is intended to enable the Firm to function with a sound and well-controlled operational environment.
Risk Management is responsible for prescribing the ORMF to the lines of business and corporate functions and to provide independent oversight of its implementation. In 2014, Operational Risk Officers (“OROs”) were appointed across each line of business and corporate function to provide this independent oversight.
The lines of business and corporate functions are responsible for implementing the ORMF. The Firmwide Oversight and Control Group,
comprised of dedicated control officers within each of the lines of business and corporate functional areas, as well as a central oversight team, is responsible for day to day review and monitoring of ORMF execution.
Operational risk management framework
The components of the Operational Risk Management Framework are:
Oversight and governance
Control committees oversee the operational risks and control environment of the respective line of business, function or region. These committees escalate operational risk issues to their respective line of business, function or regional Risk committee and also escalate significant risk issues (and/or risk issues with potential Firmwide impact) to the Firmwide Control Committee (“FCC”). The FCC provides a monthly forum for reviewing and discussing Firmwide operational risk metrics and management, including existing and emerging issues, and reviews execution against the ORMF. It escalates significant issues to the Firmwide Risk Committee, as appropriate. For additional information on the Firmwide Control Committee, see Risk Governance on
pages 106–109
.
Risk self-assessment
In order to evaluate and monitor operational risk, the lines of business and functions utilize the Firm’s standard risk and control self-assessment (“RCSA”) process and supporting architecture. The RCSA process requires management to identify material inherent operational risks, assess the design and operating effectiveness of relevant controls in place to mitigate such risks, and evaluate residual risk. Action plans are developed for control issues that are identified, and businesses are held accountable for tracking and resolving issues on a timely basis. Commencing in 2015, Risk Management will perform sample independent challenge of the RCSA program.
Risk reporting and monitoring
Operational risk management and control reports provide information, including actual operational loss levels, self-assessment results and the status of issue resolution to the lines of business and senior management. The purpose of these reports is to enable management to maintain operational risk at appropriate levels within each line of business, to escalate issues and to provide consistent data aggregation across the Firm’s businesses and functions.
The Firm has a process for capturing, tracking and monitoring operational risk events. The Firm analyzes errors and losses and identifies trends. Such analysis enables identification of the causes associated with risk events faced by the lines of business.
Capital measurement
Operational risk capital is measured primarily using a statistical model based on the Loss Distribution Approach (“LDA”). The operational risk capital model uses actual losses (internal and external to the Firm), an inventory of material forward-looking potential loss scenarios and adjustments to reflect changes in the quality of the control environment in determining Firmwide operational risk capital. This methodology is designed to comply with the Advanced Measurement rules under the Basel framework.
The Firm’s capital methodology incorporates four required elements of the Advanced Measurement Approach (“AMA”):
|
•
|
Internal losses,
|
|
•
|
External losses,
|
|
•
|
Scenario analysis, and
|
|
•
|
Business environment and internal control factors (“BEICF”).
|
The primary component of the operational risk capital estimate is the result of a statistical model, the LDA, which simulates the frequency and severity of future operational risk losses based on historical data. The LDA model is used to estimate an aggregate operational loss over a one-year time horizon, at a 99.9% confidence level. The LDA model incorporates actual
operational losses in the quarter following the period in which those losses were realized,
|
JPMorgan Chase & Co./2014 Annual Report
|
141
|
|
Management’s discussion and analysis
and the calculation generally continues to reflect such losses even after the issues or business activities giving rise to the losses have been remediated or reduced.
The LDA is supplemented by both management’s view of plausible tail risk, which is captured as part of the Scenario Analysis process, and evaluation of key LOB internal control metrics (BEICF). The Firm may further supplement such analysis to incorporate management judgment and feedback from its bank regulators. For information related to operational risk RWA, see Regulatory capital on
pages 146–153
.
Audit alignment
Internal Audit utilizes a risk-based program of audit coverage to provide an independent assessment of the design and effectiveness of key controls over the Firm’s operations, regulatory compliance and reporting. This includes reviewing the operational risk framework, the effectiveness of the RCSA process, and the loss data-collection and reporting activities.
Insurance
One of the ways operational loss is mitigated is through insurance maintained by the Firm. The Firm purchases insurance to be in compliance with local laws and regulations (e.g., workers compensation), as well as to serve other needs (e.g., property loss and public liability). Insurance may also be required by third parties with whom the Firm does business. The insurance purchased is reviewed and approved by senior management.
Cybersecurity
The Firm devotes significant resources to maintain and regularly update its systems and processes that are designed to protect the security of the Firm’s computer systems, software, networks and other technology assets against attempts by unauthorized parties to obtain access to confidential information, destroy data, disrupt or degrade service, sabotage systems or cause other damage. In 2014, the Firm spent more than $250 million, and had approximately 1,000 people focused on cybersecurity efforts, and these efforts are expected to grow significantly over the coming years.
Third parties with which the Firm does business or that facilitate the Firm’s business activities (e.g., vendors, exchanges, clearing houses, central depositories, and financial intermediaries) could also be sources of cybersecurity risk to the Firm, including with respect to breakdowns or failures of their systems, misconduct by the employees of such parties, or cyberattacks which could affect their ability to deliver a product or service to the Firm or result in lost or compromised information of the Firm or its clients. In addition, customers with which or whom the Firm does business can also be sources of cybersecurity risk to the Firm, particularly when their activities and systems are beyond the Firm’s own security and control systems. Customers will generally be responsible for losses incurred due to their own failure to maintain the security of their own systems and processes.
The Firm and several other U.S. financial institutions have experienced significant distributed denial-of-service attacks from technically sophisticated and well-resourced unauthorized parties which are intended to disrupt online banking services. The Firm and its clients are also regularly targeted by unauthorized parties using malicious code and viruses.
On September 10, 2014, the Firm disclosed that a cyberattack against the Firm had occurred. On October 2, 2014, the Firm updated that information and disclosed that, while user contact information (name, address, phone number and email address) and internal JPMorgan Chase information relating to such users had been compromised, there had been no evidence that account information for such affected customers -- account numbers, passwords, user IDs, dates of birth or Social Security numbers -- was compromised during the attack. The Firm continues to vigilantly monitor the situation. In addition, as of the October 2, 2014 announcement, as well as of the date of this Annual Report, the Firm has not seen any unusual customer fraud related to this incident. The Firm is cooperating with government agencies in connection with their investigation of the incident. The Firm also notified its customers that they were not liable for unauthorized transactions in their accounts attributable to this attack that they promptly alerted the Firm about.
The Firm has established, and continues to establish, defenses on an ongoing basis to mitigate this and other possible future attacks. The cyberattacks experienced to date have not resulted in any material disruption to the Firm’s operations or had a material adverse effect on the Firm’s results of operations. The Board of Directors and the Audit Committee are regularly apprised regarding the cybersecurity policies and practices of the Firm as well as the Firm’s efforts regarding this attack and other significant cybersecurity events.
Cybersecurity attacks, like the one experienced by the Firm, highlight the need for continued and increased cooperation among businesses and the government, and the Firm continues to work with the appropriate government and law enforcement agencies and other businesses, including the Firm’s third-party service providers, to continue to enhance defenses and improve resiliency to cybersecurity threats.
Business and Technology Resiliency
JPMorgan Chase’s global resiliency and crisis management program is intended to ensure that the Firm has the ability to recover its critical business functions and supporting assets (i.e., staff, technology and facilities) in the event of a business interruption, and to remain in compliance with global laws and regulations as they relate to resiliency risk. The program includes corporate governance, awareness and training, as well as strategic and tactical initiatives aimed to ensure that risks are properly identified, assessed, and managed.
|
142
|
JPMorgan Chase & Co./2014 Annual Report
|
|
The Firm has established comprehensive tracking and reporting of resiliency plans in order to proactively anticipate and manage various potential disruptive circumstances such as severe weather, technology and communications outages, flooding, mass transit shutdowns and terrorist threats, among others. The resiliency measures utilized by the Firm include backup infrastructure for data centers, a geographically distributed workforce, dedicated recovery facilities, providing technological capabilities to support remote work capacity for displaced staff and accommodation of employees at alternate locations. JPMorgan Chase continues to coordinate its global resiliency program across the Firm and mitigate business continuity risks by reviewing and testing recovery procedures. The strength and proficiency of the Firm’s global resiliency program has played an integral role in maintaining the Firm’s business operations during and quickly after various events in 2014 that have resulted in business interruptions, such as severe winter weather in the U.S., tropical storms in the Philippines, and geopolitical events in Brazil and Hong Kong.
|
JPMorgan Chase & Co./2014 Annual Report
|
143
|
|
Management’s discussion and analysis
|
LEGAL RISK MANAGEMENT
|
||||
Legal risk is the risk of loss or imposition of damages, fines, penalties or other liability arising from failure to comply with a contractual obligation or to comply with laws or regulations to which the Firm is subject.
Overview
In addition to providing legal services and advice to the Firm, and communicating and helping the lines business adjust to the legal and regulatory changes they face, including the heightened scrutiny and expectations of the Firm’s regulators, the global Legal function is responsible for working with the businesses and corporate functions to fully understand and assess their adherence to laws and regulations, as well as potential exposures on key litigation and transactional matters. In particular, Legal assists Oversight & Control, Risk, Finance, Compliance and Internal Audit in their efforts to ensure compliance with all applicable laws and regulations and the Firm’s corporate standards for doing business. The Firm’s lawyers also advise the Firm on potential legal exposures on key litigation and transactional matters, and perform a significant defense and advocacy role by defending the Firm against claims and potential claims and, when needed, pursuing claims against others.
Governance and Oversight
The Firm’s General Counsel reports to the CEO and is a member of the Operating Committee, the Firmwide Risk Committee and the Firmwide Control Committee. The General Counsel’s leadership team includes a General Counsel for each line of business, the heads of the Litigation and Corporate & Regulatory practices, as well as the Firm’s Corporate Secretary. Each region (e.g., Latin America, Asia Pacific) has a General Counsel who is responsible for managing legal risk across all lines of business and functions in the region.
Legal works with various committees (including new business initiative and reputation risk committees) and the Firm’s businesses to protect the Firm’s reputation beyond any particular legal requirements. In addition, the Firm’s Conflicts Office examines the Firm’s wholesale transactions that may have the potential to create conflicts of interest for the Firm.
|
COMPLIANCE RISK MANAGEMENT
|
||||
Compliance risk is the risk fines or sanctions or of financial damage or loss due to the failure to comply with laws, rules, and regulations.
Overview
Global Compliance Risk Management’s (“Compliance”) role is to identify, measure, monitor, and report on and provide oversight regarding compliance risks arising from business operations, and provide guidance on how the Firm can mitigate these risks.
While each line of business is accountable for managing its compliance risk, the Firm’s Compliance teams work closely with the Operating Committee and senior management to provide independent review and oversight of the lines of business operations, with a focus on compliance with applicable global, regional and local laws and regulations. In recent years, the Firm has experienced heightened scrutiny by its regulators of its compliance with regulations, and with respect to its controls and operational processes. The Firm expects such regulatory scrutiny will continue.
Governance and Oversight
Compliance operates independent of the lines of business, and is led by the Chief Compliance Officer (“CCO”) who reports directly to the Firm’s COO. The Firm maintains oversight and coordination in its Compliance Risk Management practices globally through ongoing dialog and reporting between the lines of business, Regional Chief Compliance Officers and the CCO regarding significant compliance and regulatory management matters, as well as implementation of the Compliance program across the lines of business and Regions.
The Firm has in place a Code of Conduct (the “Code”), and each employee is given annual training in respect of the Code and is required annually to affirm his or her compliance with the Code. The Code sets forth the Firm’s core principles and fundamental values, including that no employee should ever sacrifice integrity - or give the impression that he or she has - even if one thinks it would help the Firm’s business. The Code requires prompt reporting of any known or suspected violation of the Code, any internal Firm policy, or any law or regulation applicable to the Firm’s business. It also requires the reporting of any illegal conduct, or conduct that violates the underlying principles of the Code, by any of the Firm’s customers, suppliers, contract workers, business partners, or agents. Specified employees are specially trained and designated as “code specialists” who act as a resource to employees on Code of Conduct matters. In addition, concerns may be reported anonymously and the Firm prohibits retaliation against employees for the good faith reporting of any actual or suspected violations of the Code.
|
144
|
JPMorgan Chase & Co./2014 Annual Report
|
|
|
FIDUCIARY RISK MANAGEMENT
|
||||
Fiduciary risk is the risk of a failure to exercise the applicable high standard of care, to act in the best interests of clients or to treat clients fairly, as required under applicable law or regulation.
Depending on the fiduciary activity and capacity in which the Firm is acting, federal and state statutes and regulations, and common law require the Firm to adhere to specific duties in which the Firm must always place the client’s interests above its own.
Fiduciary risk governance
Fiduciary Risk Management is the responsibility of the relevant LOB risk and/or other governance committees. Senior business, legal, risk and compliance managers, who have particular responsibility for fiduciary matters, work with the relevant LOB risk committees with the goal of ensuring that businesses providing investment, trusts and estates, or other fiduciary products or services that give rise to fiduciary duties to clients perform at the appropriate standard relative to their fiduciary relationship with a client. Each LOB and its respective risk and/or other governance committees are responsible for the oversight and management of the fiduciary risks in their businesses. Of particular focus are the policies and practices that address a business’s responsibilities to a client, including performance and service requirements and expectations; client suitability determinations; and disclosure obligations and communications. In this way, the relevant LOB risk and/or other governance committees provide oversight of the Firm’s efforts to monitor, measure and control the performance and delivery of the products or services to clients that may give rise to such fiduciary duties, as well as the Firm’s fiduciary responsibilities with respect to the Firm’s employee benefit plans.
The Firmwide Fiduciary Risk Committee (“FFRC”) is a forum for risk matters related to the Firm’s fiduciary activities and oversees the firmwide fiduciary risk governance framework. It supports the consistent identification and escalation of fiduciary risk matters by the relevant lines of business or corporate functions responsible for managing fiduciary activities. The committee escalates significant issues to the Firmwide Risk Committee and any other committee considered appropriate.
|
REPUTATION RISK MANAGEMENT
|
||||
Reputation risk is the risk that an action, transaction, investment or event will reduce the trust that clients, shareholders, employees or the broader public has in the Firm’s integrity or competence. Maintaining the Firm’s reputation is the responsibility of each individual employee of the Firm
.
The Firm’s Reputation Risk policy explicitly vests each employee with the responsibility to consider the reputation of the Firm when engaging in any activity. Since the types of events that could harm the Firm’s reputation are so varied across the Firm’s lines of business, each line of business has a separate reputation risk governance infrastructure in place, which comprises three key elements: clear, documented escalation criteria appropriate to the business footprint; a designated primary discussion forum – in most cases, one or more dedicated reputation risk committees; and a list of designated contacts. Line of business reputation risk governance is overseen by a Firmwide Reputation Risk Governance function, which provides oversight of the governance infrastructure and process to support the consistent identification, escalation, management and reporting of reputation risk issues firmwide.
|
JPMorgan Chase & Co./2014 Annual Report
|
145
|
|
Management’s discussion and analysis
|
CAPITAL MANAGEMENT
|
||||
A strong capital position is essential to the Firm’s business strategy and competitive position. The Firm’s capital strategy focuses on long-term stability, which enables the Firm to build and invest in market-leading businesses, even in a highly stressed environment. Prior to making any decisions on future business activities, senior management considers the implications on the Firm’s capital. In addition to considering the Firm’s earnings outlook, senior management evaluates all sources and uses of capital with a view to preserving the Firm’s capital strength. Maintaining a strong balance sheet to manage through economic volatility is considered a strategic imperative by the Firm’s Board of Directors, CEO and Operating Committee. The Firm’s balance sheet philosophy focuses on risk-adjusted returns, strong capital and reserves, and robust liquidity.
The Firm’s capital management objectives are to hold capital sufficient to:
|
•
|
Cover all material risks underlying the Firm’s business activities;
|
|
•
|
Maintain “well-capitalized” status under regulatory requirements;
|
|
•
|
Maintain debt ratings that enable the Firm to optimize its funding mix and liquidity sources while minimizing costs;
|
|
•
|
Retain flexibility to take advantage of future investment opportunities;
|
|
•
|
Maintain sufficient capital in order to continue to build and invest in its businesses through the cycle and in stressed environments; and
|
|
•
|
Distribute excess capital to shareholders while balancing other stated objectives.
|
These objectives are achieved through ongoing monitoring of the Firm’s capital position, regular stress testing, and a capital governance framework. Capital management is intended to be flexible in order to react to a range of potential events. JPMorgan Chase has firmwide and LOB processes for ongoing monitoring and active management of its capital position.
Capital strategy and governance
The Firm’s CEO, in conjunction with the Board and its subcommittees, establish principles and guidelines for capital planning, capital issuance, usage and distributions, and establish capital targets for the level and composition of capital in both business-as-usual and highly stressed environments.
The Firm’s senior management recognizes the importance of a capital management function that supports strategic decision-making. The Firm has established the Capital Governance Committee and the Regulatory Capital Management Office (“RCMO”) as key components in support of this objective. The Capital Governance Committee is responsible for reviewing the Firm’s Capital Management Policy and the principles underlying capital issuance and distribution alternatives. The Committee is also responsible
for governing the capital adequacy assessment process, including overall design, assumptions and risk streams, and ensuring that capital stress test programs are designed to adequately capture the idiosyncratic risks across the Firm’s businesses. RCMO, which reports to the Firm’s CFO, is responsible for reviewing, approving and monitoring the implementation of the Firm’s capital policies and strategies, as well as its capital adequacy assessment process. The DRPC assesses the Firm’s capital adequacy process and its components. This review determines the effectiveness of the capital adequacy process, the appropriateness of the risk tolerance levels, and the strength of the control infrastructure. For additional discussion on the DRPC, see Enterprise-wide Risk Management on
pages 105–109
.
Capital disciplines
In its capital management, the Firm uses three primary disciplines, which are further described below:
|
•
|
Regulatory capital
|
|
•
|
Economic capital
|
|
•
|
Line of business equity
|
Regulatory capital
The Federal Reserve establishes capital requirements, including well-capitalized standards, for the consolidated financial holding company. The Office of the Comptroller of the Currency (“OCC”) establishes similar capital requirements and standards for the Firm’s national banks, including JPMorgan Chase Bank, N.A. and Chase Bank USA, N.A.
The U.S. capital requirements follow the Capital Accord of the Basel Committee, as amended from time to time. Prior to January 1, 2014, the Firm and its banking subsidiaries were subject to the capital requirements of Basel I and Basel 2.5. Effective January 1, 2014, the Firm became subject to Basel III (which incorporates Basel 2.5).
Basel III overview
Basel III, for U.S. bank holding companies and banks, revises, among other things, the definition of capital and introduces a new common equity Tier 1 capital (“CET1 capital”) requirement; presents two comprehensive methodologies for calculating risk-weighted assets (“RWA”), a general (Standardized) approach, which replaces Basel I RWA (“Basel III Standardized”) and an advanced approach, which replaces Basel II RWA (“Basel III Advanced”); and sets out minimum capital ratios and overall capital adequacy standards. Certain of the requirements of Basel III are subject to phase-in periods that began January 1, 2014 and continue through the end of 2018 (“Transitional period”) as described below. Both Basel III Standardized and Basel III Advanced became effective commencing January 1, 2014 for large and internationally active U.S. bank holding companies and banks, including the Firm and its insured depository institution (“IDI”) subsidiaries.
|
146
|
JPMorgan Chase & Co./2014 Annual Report
|
|
Prior to the implementation of Basel III Advanced, the Firm was required to complete a qualification period (“parallel run”) during which it needed to demonstrate that it met the requirements of the rule to the satisfaction of its U.S. banking regulators. On February 21, 2014, the Federal Reserve and the OCC informed the Firm and its national bank subsidiaries that they had satisfactorily completed the parallel run requirements and were approved to calculate capital under Basel III Advanced, in addition to Basel III Standardized, as of April 1, 2014. In conjunction with its exit from the parallel run, the capital adequacy of the Firm and its national bank subsidiaries is evaluated against the Basel III approach (Standardized or Advanced) which results, for each quarter beginning with the second quarter of 2014, in the lower ratio (the “Collins Floor”), as required by the Collins Amendment of the Dodd-Frank Act.
Definition of capital
Basel III revises Basel I and II by narrowing the definition of capital and increasing the capital requirements for specific exposures. Under Basel III, CET1 capital predominantly includes common stockholders’ equity (including capital for AOCI related to debt and equity securities classified as AFS as well as for defined benefit pension and other post-retirement employee benefit (“OPEB”) plans), less certain deductions for goodwill, MSRs and deferred tax assets that arise from net operating loss (“NOL”) and tax credit carryforwards. Tier 1 capital is predominantly comprised of CET1 capital as well as perpetual preferred stock. Tier 2 capital includes long-term debt qualifying as Tier 2 and qualifying allowance for credit losses. Total capital is Tier 1 capital plus Tier 2 capital. The revisions to CET1 capital, Tier 1 capital and Tier 2 capital are subject to phase-in periods that began January 1, 2014, and continue through the end of 2018, and during that period, CET1 capital, Tier 1 capital and Tier 2 capital represent Basel III Transitional capital.
Risk-weighted assets
Basel III establishes two comprehensive methodologies for calculating RWA (a Standardized approach and an Advanced approach) which include capital requirements for credit risk, market risk, and in the case of Basel III Advanced, also operational risk. Key differences in the calculation of credit risk RWA between the Standardized and Advanced approaches are that for Basel III Advanced, credit risk RWA is based on risk-sensitive approaches which largely rely on the use of internal credit models and parameters, whereas for Basel III Standardized, credit risk RWA is generally based on supervisory risk-weightings which vary primarily by counterparty type and asset class. Market risk RWA is calculated on a generally consistent basis between Basel III Standardized and Basel III Advanced, both of which incorporate the requirements set forth in Basel 2.5. In addition to the RWA calculated under these methodologies, the Firm may supplement such amounts to incorporate management judgment and feedback from its bank regulators.
Supplementary leverage ratio (“SLR”)
Basel III also includes a requirement for Advanced Approach banking organizations, including the Firm, to calculate a SLR. The SLR, a non-GAAP financial measure, is defined as Tier 1 capital under Basel III divided by the Firm’s total leverage exposure. Total leverage exposure is calculated by taking the Firm’s total average on-balance sheet assets, less amounts permitted to be deducted for Tier 1 capital, and adding certain off-balance sheet exposures, such as undrawn commitments and derivatives potential future exposure.
On September 3, 2014, the U.S. banking regulators adopted a final rule for the calculation of the SLR. The U.S. final rule requires public disclosure of the SLR beginning with the first quarter of 2015, and also requires U.S. bank holding companies, including the Firm, to have a minimum SLR of at least 5% and IDI subsidiaries, including JPMorgan Chase Bank, N.A. and Chase Bank USA, N.A., to have a minimum SLR of at least 6%, both beginning January 1, 2018.
|
JPMorgan Chase & Co./2014 Annual Report
|
147
|
|
Management’s discussion and analysis
Capital ratios
The basis to calculate the Firm’s capital ratios (both risk-based and leverage) under Basel III during the transitional period and when fully phased-in are shown in the table below.
|
Transitional period
|
Fully Phased-In
|
||||||
|
2014
|
2015 – 2017
|
2018
|
2019+
|
||||
|
Capital (Numerator)
|
Basel III Transitional Capital
(a)
|
Basel III Capital
|
|||||
|
RWA (Denominator)
|
Standardized Approach
|
Basel I with 2.5
(b)
|
Basel III Standardized
|
||||
|
Advanced
Approach
|
Basel III Advanced
|
||||||
|
Leverage (Denominator)
|
Tier 1 Leverage
|
Adjusted average assets
(c)
|
|||||
|
Supplementary leverage
|
Adjusted average assets
(c)
+ off-balance sheet exposures
|
||||||
|
(a)
|
Trust preferred securities (“TruPS”) are being phased out from inclusion in Basel III capital commencing January 1, 2014, continuing through the end of 2021.
|
|
(b)
|
Defined as Basel III Standardized Transitional for 2014. Beginning January 1, 2015, Basel III Standardized RWA is calculated under the Basel III definition of the Standardized Approach.
|
|
(c)
|
Adjusted average assets, for purposes of calculating the leverage ratio and SLR, includes total quarterly average assets adjusted for unrealized gains/(losses) on securities, less deductions for disallowed goodwill and other intangible assets, investments in certain subsidiaries, and the total adjusted carrying value of nonfinancial equity investments that are subject to deductions from Tier 1 capital.
|
Risk-based capital regulatory minimums
The Basel III rules include minimum capital ratio requirements that are also subject to phase-in periods through January 1, 2019.
In addition to the regulatory minimum capital requirements, certain banking organizations, including the Firm, will be required to hold an additional 2.5% of CET1 capital to serve as a “capital conservation buffer.” The capital conservation buffer is intended to be used to absorb potential losses in times of financial or economic stress; if not maintained, the Firm could be limited in the amount of capital that may be distributed, including dividends and common equity repurchases. The capital conservation buffer will be phased-in beginning January 1, 2016.
Moreover, G-SIBs will be required to maintain, in addition to the capital conservation buffer, further amounts of capital ranging from 1% to 2.5% across all tiers of regulatory capital. In November 2014, based upon data as of December 31, 2013, the Financial Stability Board (“FSB”) indicated that certain G-SIBs, including the Firm, would be required to hold the additional 2.5% of capital; the requirement will be phased-in beginning January 1, 2016.
The Basel Committee has stated that G-SIBs could in the future be required to hold 3.5% or more of additional capital if their relative systemic importance were to increase. Currently, no G-SIB is required to hold more than the additional 2.5% of capital.
Consequently, based upon the final rules currently in effect, the minimum Basel III CET1 capital ratio requirement for the Firm is expected to be 9.5%, comprised of the minimum ratio of 4.5% plus the 2.5% capital conservation buffer and the 2.5% G-SIB requirement both beginning January 1, 2019.
Basel III also establishes a minimum 6.5% CET1 standard for the definition of “well capitalized” under the Prompt Corrective Action (“PCA”) requirements of the FDIC Improvement Act (“FDICIA”). The CET1 standard is effective beginning with the first quarter of 2015.
|
148
|
JPMorgan Chase & Co./2014 Annual Report
|
|
The following chart presents the Basel III minimum CET1 capital ratio during the transitional periods and on a fully phased-in basis under the Basel III rules currently in effect. It is the Firm’s current expectation that its Basel III CET1 ratio will exceed the regulatory minimums, both during the transition period and upon full implementation in 2019 and thereafter.
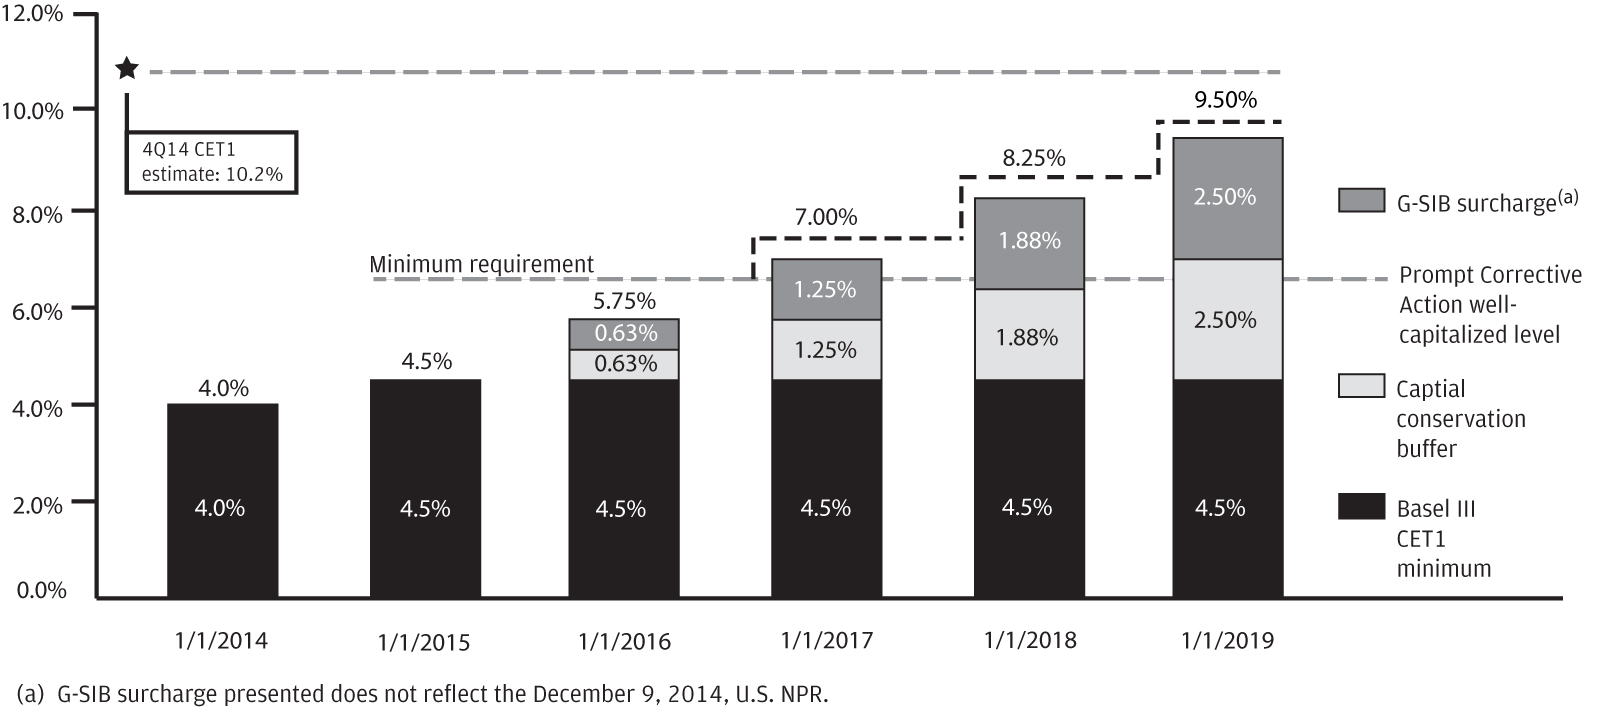
On December 9, 2014, the Federal Reserve issued a Notice of Proposed Rulemaking (“NPR”) that would establish a new capital surcharge across all tiers of regulatory capital for G-SIBs in the U.S., including the Firm. The Firm estimates its fully phased-in G-SIB surcharge (based upon data as of December 31, 2013) would be 4.5% under the NPR, compared to a fully phased-in G-SIB surcharge of 2.5% as estimated under the Basel III rules currently in effect.
Basel III Advanced Fully Phased-In
Based on the U.S. capital rules currently in effect, Basel III capital rules will become fully phased-in on January 1, 2019, at which point the Firm will continue to calculate its capital ratios under both the Basel III Standardized and Advanced Approaches, and the Firm will continue to have its capital adequacy evaluated against the approach that results in the lower ratio. While the Firm has recently imposed Basel III Standardized Fully Phased-In RWA limits on the lines of business in adapting its capital framework, the Firm currently expects to manage each of the businesses (including line of business equity allocations), as well as the corporate functions, primarily on a Basel III Advanced Fully Phased-In basis.
The Firm’s capital, RWA and capital ratios that are presented under Basel III Advanced Fully Phased-In (and CET1 under Basel I as of December 31, 2013), are non-GAAP financial measures. However, such measures are used by bank regulators, investors and analysts to assess the Firm’s capital position and to compare the Firm’s capital to that of other financial services companies.
The Firm’s estimates of its Basel III Advanced Fully Phased-In capital, RWA and capital ratios and of the Firm’s, JPMorgan Chase Bank, N.A.’s, and Chase Bank USA, N.A.’s SLRs reflect management’s current understanding of the U.S. Basel III rules based on the current published rules and
on the application of such rules to the Firm’s businesses as currently conducted. The actual impact on the Firm’s capital ratios and SLR as of the effective date of the rules may differ from the Firm’s current estimates depending on changes the Firm may make to its businesses in the future, further implementation guidance from the regulators, and regulatory approval of certain of the Firm’s internal risk models (or, alternatively, regulatory disapproval of the Firm’s internal risk models that have previously been conditionally approved).
The following table presents the estimated Basel III Advanced Fully Phased-In Capital ratios for JPMorgan Chase at December 31, 2014. Also included in the table are the regulatory minimum ratios currently expected to be in effect beginning January 1, 2019.
|
Basel III Advanced Fully Phased-In
|
||||||||||
|
December 31, 2014
|
Fully phased-in minimum capital ratios
(a)
|
Fully phased-in well-capitalized ratios
(b)
|
||||||||
|
Risk-based capital ratios:
|
||||||||||
|
CET1 capital
|
10.2
|
%
|
9.5
|
%
|
6.5
|
%
|
||||
|
Tier 1 capital
|
11.4
|
|
11.0
|
|
8.0
|
|
||||
|
Total capital
|
12.8
|
|
13.0
|
|
10.0
|
|
||||
|
Leverage ratio:
|
||||||||||
|
Tier 1
|
7.5
|
|
4.0
|
|
5.0
|
|
||||
|
SLR
|
5.6
|
|
3.0
|
|
5.0
|
|
||||
|
(a)
|
Represents the minimum capital ratios applicable to the Firm under fully phased-in Basel III rules currently in effect.
|
|
(b)
|
Represents the minimum Basel III Fully Phased-In capital ratios applicable to the Firm under the PCA requirements of FDICIA.
|
|
JPMorgan Chase & Co./2014 Annual Report
|
149
|
|
Management’s discussion and analysis
A reconciliation of total stockholders’ equity to Basel III Advanced Fully Phased-In CET1 capital, Tier 1 capital and Total qualifying capital is presented in the table below.
|
Risk-based capital components and assets
|
||||
|
Basel III Advanced
Fully Phased-In
|
||||
|
(in millions)
|
December 31, 2014
|
|||
|
Total stockholders’ equity
|
$
|
232,065
|
|
|
|
Less: Preferred stock
|
20,063
|
|
||
|
Common stockholders’ equity
|
212,002
|
|
||
|
Less:
|
||||
|
Goodwill
(a)
|
44,925
|
|
||
|
Other intangible assets
(a)
|
1,062
|
|
||
|
Other CET1 capital adjustments
|
1,163
|
|
||
|
CET1 capital
|
164,852
|
|
||
|
Preferred stock
|
20,063
|
|
||
|
Less:
|
||||
|
Other Tier 1 adjustments
|
5
|
|
||
|
Total Tier 1 capital
|
184,910
|
|
||
|
Long-term debt and other instruments qualifying as Tier 2 capital
|
17,504
|
|
||
|
Qualifying allowance for credit losses
|
4,266
|
|
||
|
Other
|
(86
|
)
|
||
|
Total Tier 2 capital
|
21,684
|
|
||
|
Total capital
|
$
|
206,594
|
|
|
|
Credit risk RWA
|
$
|
1,040,087
|
|
|
|
Market risk RWA
|
179,200
|
|
||
|
Operational risk RWA
|
400,000
|
|
||
|
Total RWA
|
$
|
1,619,287
|
|
|
|
SLR leverage exposure
|
$
|
3,320,404
|
|
|
|
(a)
|
Goodwill and other intangible assets are net of any associated deferred tax liabilities.
|
Capital rollforward
The following table presents the changes in CET1 capital, Tier 1 capital and Tier 2 capital for the year ended December 31, 2014. Under Basel I CET1 represents Tier 1 common capital.
|
Year ended December 31, (in millions)
|
2014
|
||
|
Basel I CET1 capital at December 31, 2013
|
$
|
148,887
|
|
|
Effect of rule changes
(a)
|
2,315
|
|
|
|
Basel III Advanced Fully Phased-In CET1 capital at December 31, 2013
|
151,202
|
|
|
|
Net income applicable to common equity
|
20,637
|
|
|
|
Dividends declared on common stock
|
(6,078
|
)
|
|
|
Net purchases of treasury stock
|
(3,009
|
)
|
|
|
Changes in additional paid-in capital
|
(558
|
)
|
|
|
Changes related to AOCI
|
1,327
|
|
|
|
Adjustment related to FVA/DVA
|
580
|
|
|
|
Other
|
751
|
|
|
|
Increase in CET1 capital
|
13,650
|
|
|
|
Basel III Advanced Fully Phased-In CET1 capital at December 31, 2014
|
$
|
164,852
|
|
|
Basel I Tier 1 capital at December 31, 2013
|
$
|
165,663
|
|
|
Effect of rule changes
(b)
|
(3,295
|
)
|
|
|
Basel III Advanced Fully Phased-In Tier 1 capital at December 31, 2013
|
162,368
|
|
|
|
Change in CET1 capital
|
13,650
|
|
|
|
Net issuance of noncumulative perpetual preferred stock
|
8,905
|
|
|
|
Other
|
(13
|
)
|
|
|
Increase in Tier 1 capital
|
22,542
|
|
|
|
Basel III Advanced Fully Phased-In Tier 1 capital at December 31, 2014
|
$
|
184,910
|
|
|
Basel I Tier 2 capital at December 31, 2013
|
$
|
33,623
|
|
|
Effect of rule changes
(c)
|
(11,644
|
)
|
|
|
Basel III Advanced Fully Phased-In Tier 2 capital at December 31, 2013
|
21,979
|
|
|
|
Change in long-term debt and other instruments qualifying as Tier 2
|
809
|
|
|
|
Change in allowance for credit losses
|
(1,063
|
)
|
|
|
Other
|
(41
|
)
|
|
|
Decrease in Tier 2 capital
|
(295
|
)
|
|
|
Basel III Advanced Fully Phased-In Tier 2 capital at December 31, 2014
|
$
|
21,684
|
|
|
Basel III Advanced Fully Phased-In Total capital at December 31, 2014
|
$
|
206,594
|
|
|
(a)
|
Predominantly represents: (1) the addition of certain exposures, which were deducted from capital under Basel I, that are risk-weighted under Basel III; (2) adjustments related to AOCI for AFS securities and defined benefit pension and OPEB plans; and (3) a deduction for deferred tax assets related to NOL carryforwards.
|
|
(b)
|
Predominantly represents the exclusion of TruPS from Tier 1 capital under Basel III.
|
|
(c)
|
Predominantly represents a change in the calculation of qualifying allowance for credit losses under Basel III.
|
|
150
|
JPMorgan Chase & Co./2014 Annual Report
|
|
RWA rollforward
The following table presents changes in the components of RWA under Basel III Advanced Fully Phased-In for the year ended December 31, 2014. The amounts in the rollforward categories are estimates, based on the predominant driver of the change.
|
Year ended December 31, (in millions)
|
|||||||||||||||
|
(in billions)
|
Credit risk RWA
|
Market risk RWA
|
Operational risk RWA
|
Total RWA
|
|||||||||||
|
Basel I RWA at December 31, 2013
|
$
|
1,223
|
|
$
|
165
|
|
NA
|
|
$
|
1,388
|
|
||||
|
Effect of rule changes
(a)
|
(168
|
)
|
(4
|
)
|
375
|
|
203
|
|
|||||||
|
Basel III Advanced Fully Phased-In RWA at December 31, 2013
|
1,055
|
|
161
|
|
375
|
|
1,591
|
|
|||||||
|
Model & data changes
(b)
|
56
|
|
36
|
|
25
|
|
117
|
|
|||||||
|
Portfolio runoff
(c)
|
(22
|
)
|
(22
|
)
|
—
|
|
(44
|
)
|
|||||||
|
Movement in portfolio levels
(d)
|
(49
|
)
|
4
|
|
—
|
|
(45
|
)
|
|||||||
|
Changes in RWA
|
(15
|
)
|
18
|
|
25
|
|
28
|
|
|||||||
|
Basel III Advanced Fully Phased-In RWA at December 31, 2014
|
$
|
1,040
|
|
$
|
179
|
|
$
|
400
|
|
$
|
1,619
|
|
|||
|
(a)
|
Effect of rule changes refers to movements in levels of RWA as a result of changing to calculating RWA under the Basel III Advanced Fully Phased-In rules. See Risk-weighted assets on
page 147
for additional information on the calculation of RWA under Basel III.
|
|
(b)
|
Model & data changes refer to movements in levels of RWA as a result of revised methodologies and/or treatment per regulatory guidance (exclusive of rule changes).
|
|
(c)
|
Portfolio runoff for credit risk RWA reflects lower loan balances in Mortgage Banking and reduced risk from position rolloffs in legacy portfolios, and for market risk RWA reflects reduced risk from position rolloffs in legacy portfolios.
|
|
(d)
|
Movement in portfolio levels for credit risk RWA refers to changes in book size, composition, credit quality, and market movements; and for market risk RWA, refers to changes in position and market movements.
|
Basel III Transitional
Basel III Transitional capital requirements became effective on January 1, 2014, and will become fully phased-in on January 1, 2019. The following table presents a reconciliation of the Firm’s Basel III Advanced Transitional capital and RWA to the Firm’s estimated Basel III Advanced Fully Phased-In capital and RWA as of December 31, 2014.
|
December 31, 2014
(in millions)
|
|||
|
Basel III Advanced Transitional CET1 capital
|
$
|
164,764
|
|
|
AOCI phase-in
(a)
|
2,249
|
|
|
|
CET1 capital deduction phased-in
(b)
|
(1,212
|
)
|
|
|
Intangibles deduction phase-in
(c)
|
(850
|
)
|
|
|
Other adjustments to CET1 capital
(d)
|
(99
|
)
|
|
|
Basel III Advanced Fully Phased-In CET1 capital
|
$
|
164,852
|
|
|
Basel III Advanced Transitional Additional Tier 1 capital
|
$
|
21,868
|
|
|
Non-qualifying instruments phase-out
|
(2,670
|
)
|
|
|
Tier 1 capital deduction phased-out
(b)
|
1,212
|
|
|
|
Other adjustments to Tier 1 capital
(d)
|
(352
|
)
|
|
|
Basel III Advanced Fully Phased-In Additional Tier 1 capital
|
$
|
20,058
|
|
|
Basel III Advanced Fully Phased-In Tier 1 capital
|
$
|
184,910
|
|
|
Basel III Advanced Transitional Tier 2 capital
|
$
|
24,390
|
|
|
Non-qualifying instruments phase-out
|
(2,670
|
)
|
|
|
Other adjustments to Tier 2 capital
(e)
|
(36
|
)
|
|
|
Basel III Advanced Fully Phased-In Tier 2 capital
|
$
|
21,684
|
|
|
Basel III Advanced Fully Phased-In Total capital
|
$
|
206,594
|
|
|
Basel III Advanced Transitional RWA
|
$
|
1,608,240
|
|
|
Adjustment related to change in risk-weighting
(f)
|
11,047
|
|
|
|
Basel III Advanced Fully Phased-In RWA
|
$
|
1,619,287
|
|
|
(a)
|
Includes the remaining balance of AOCI related to AFS debt securities and defined benefit pension and OPEB plans that will qualify as Basel III CET1 capital upon full phase-in.
|
|
(b)
|
Predominantly includes regulatory adjustments related to changes in FVA/DVA, as well as CET1 deductions for defined benefit pension plan assets and DTA related to net operating loss carryforwards.
|
|
(c)
|
Relates to intangible assets, other than goodwill and MSRs, that are required to be deducted from CET1 capital upon full phase-in.
|
|
(d)
|
Includes minority interest and the Firm’s investments in its own CET1 capital instruments.
|
|
(e)
|
Includes the Firm’s investments in its own Tier 2 capital instruments and unrealized gains on AFS equity securities.
|
|
(f)
|
Primarily relates to the risk-weighting of items not subject to capital deduction thresholds including MSRs.
|
|
JPMorgan Chase & Co./2014 Annual Report
|
151
|
|
Management’s discussion and analysis
The following table presents the regulatory capital ratios as of December 31 2014, under Basel III Standardized Transitional and Basel III Advanced Transitional. Also included in the table are the regulatory minimum ratios in effect as of December 31, 2014.
|
December 31, 2014
|
||||||||||
|
Basel III Standardized Transitional
|
Basel III Advanced Transitional
|
Minimum capital ratios
(b)
|
Well-capitalized ratios
(c)
|
|||||||
|
Risk-based capital ratios
(a)
:
|
||||||||||
|
CET1 capital
|
11.2
|
%
|
10.2
|
%
|
4.0
|
%
|
NA
|
|
(d)
|
|
|
Tier 1 capital
|
12.7
|
|
11.6
|
|
5.5
|
|
6.0
|
%
|
||
|
Total capital
|
15.0
|
|
13.1
|
|
8.0
|
|
10.0
|
|
||
|
Leverage ratio:
|
||||||||||
|
Tier 1 leverage
|
7.6
|
|
7.6
|
|
4.0
|
|
5.0
|
|
||
|
(a)
|
For each of the risk-based capital ratios the lower of the Standardized Transitional or Advanced Transitional ratio represents the Collins Floor.
|
|
(b)
|
Represents the minimum capital ratios for 2014 currently applicable to the Firm under Basel III.
|
|
(c)
|
Represents the minimum capital ratios for 2014 currently applicable to the Firm under the PCA requirements of the FDICIA.
|
|
(d)
|
The CET1 capital ratio became a relevant measure of capital under the prompt corrective action requirements on January 1, 2015.
|
At December 31, 2014, JPMorgan Chase maintained Basel III Standardized Transitional and Basel III Advanced Transitional capital ratios in excess of the well-capitalized standards established by the Federal Reserve.
Additional information regarding the Firm’s capital ratios and the U.S. federal regulatory capital standards to which the Firm is subject is presented in Note 28. For further information on the Firm’s Basel III measures, see the Firm’s consolidated Pillar 3 Regulatory Capital Disclosures reports, which are available on the Firm’s website (http://investor.shareholder.com/jpmorganchase/basel.cfm).
Supplementary leverage ratio
The Firm estimates that if the U.S. SLR final rule were in effect at December 31, 2014, the Firm’s SLR would have been approximately 5.6% and JPMorgan Chase Bank, N.A.’s and Chase Bank USA, N.A.’s SLRs would have been approximately 5.9% and 8.1%, respectively, at that date.
Comprehensive Capital Analysis and Review (“CCAR”)
The Federal Reserve requires large bank holding companies, including the Firm, to submit a capital plan on an annual basis. The Federal Reserve uses the CCAR and Dodd-Frank Act stress test processes to ensure that large bank holding companies have sufficient capital during periods of economic and financial stress, and have robust, forward-looking capital assessment and planning processes in place that address each BHC’s unique risks to enable them to have the ability to absorb losses under certain stress scenarios. Through the CCAR, the Federal Reserve evaluates each BHC’s capital adequacy and internal capital adequacy assessment processes, as well as its plans to make capital distributions, such as dividend payments or stock repurchases.
On March 26, 2014, the Federal Reserve informed the Firm that it did not object, on either a quantitative or qualitative basis, to the Firm’s 2014 capital plan. For information on actions taken by the Firm’s Board of Directors following the 2014 CCAR results, see Capital actions on
page 154
.
On January 5, 2015, the Firm submitted its 2015 capital plan to the Federal Reserve under the Federal Reserve’s 2015 CCAR process. The Firm expects to receive the Federal Reserve’s final response to its plan no later than March 31, 2015.
The Firm’s CCAR process is integrated into and employs the same methodologies utilized in the Firm’s Internal Capital Adequacy Assessment Process (“ICAAP”) process, as discussed below.
Internal Capital Adequacy Assessment Process
Semiannually, the Firm completes the ICAAP, which provides management with a view of the impact of severe and unexpected events on earnings, balance sheet positions, reserves and capital. The Firm’s ICAAP integrates stress testing protocols with capital planning.
The process assesses the potential impact of alternative economic and business scenarios on the Firm’s earnings and capital. Economic scenarios, and the parameters underlying those scenarios, are defined centrally and applied uniformly across the businesses. These scenarios are articulated in terms of macroeconomic factors, which are key drivers of business results; global market shocks, which generate short-term but severe trading losses; and idiosyncratic operational risk events. The scenarios are intended to capture and stress key vulnerabilities and idiosyncratic risks facing the Firm. However, when defining a broad range of scenarios, realized events can always be worse. Accordingly, management considers additional stresses outside these scenarios, as necessary. ICAAP results are reviewed by management and the Board of Directors.
Minimum Total Loss Absorbing Capacity (“TLAC”)
In November 2014, the FSB, in consultation with the Basel Committee on Banking Supervision, issued a consultative document proposing that, in order for G-SIBs to have sufficient loss absorbing and recapitalization capacity to support an orderly resolution, they would be required to have outstanding a sufficient amount and type of debt and capital instruments. This amount and type of debt and capital instruments (or “total loss absorbing capacity” or TLAC) is intended to effectively absorb losses, as necessary, upon a failure of a G-SIB, without imposing such losses on taxpayers of the relevant jurisdiction or causing severe systemic disruptions, and thereby ensuring the continuity of the G-SIBs critical functions. The document identifies specific criteria that must be met for instruments to be considered eligible under TLAC and sets out minimum requirements that include existing Basel III minimum capital requirements, excluding capital buffers. The FSB’s proposed range for a common minimum TLAC requirement is 16-20% of the financial institution’s RWA and at least twice its Basel III Tier 1 leverage ratio. The Firm estimated that it has approximately 15% minimum TLAC as a percentage of
|
152
|
JPMorgan Chase & Co./2014 Annual Report
|
|
Basel III Advanced Fully Phased-in RWA, excluding capital buffers currently in effect, at year end 2014 based on its understanding of how the FSB proposal may be implemented in the United States. The FSB is expected to revise its proposal following a period of public consultation and findings from a quantitative impact study and market survey to be conducted in the first quarter of 2015. The final proposal is expected to be submitted to the G-20 in advance of the G-20 Summit scheduled for fourth quarter of 2015. U.S. banking regulators are expected to issue an NPR that would outline TLAC requirements specific to U.S. banks.
Regulatory capital outlook
The Firm expects to continue to accrete capital in the near term and believes its current capital levels enable it to retain market access, continue its strategy to invest in and grow its businesses and maintain flexibility to distribute excess capital. The Firm intends to balance return of capital to shareholders with achieving higher capital ratios over time. Additionally, the Firm expects the capital ratio calculated under the Basel III Standardized Fully Phased-In Approach to become its binding constraint by the end of 2015, or slightly thereafter. As a result, the Firm expects to reach Basel III Advanced and Standardized Fully Phased-In CET1 ratios of approximately 11% by the end of 2015 and is targeting reaching a Basel III CET1 ratio of approximately 12% by the end of 2018.
The Firm’s capital targets take into consideration the current U.S. Basel III requirements and contemplate the requirements under the U.S. G-SIB proposal issued on December 9, 2014 and therefore, assume a 4.5% G-SIB capital surcharge. These targets are subject to revision in the future as a result of changes that may be introduced by banking regulators to the required minimum ratios to which the Firm is subject. In particular, if the Firm’s G-SIB capital surcharge is determined to be lower than 4.5%, the capital targets would be adjusted accordingly. The Firm intends to manage its capital so that it achieves the required capital levels and composition in line with or in advance of the required timetables of current and proposed rules.
Economic risk capital
Economic risk capital is another of the disciplines the Firm uses to assess the capital required to support its businesses. Economic risk capital is a measure of the capital needed to cover JPMorgan Chase’s business activities in the event of unexpected losses. The Firm measures economic risk capital using internal risk-assessment methodologies and models based primarily on four risk factors: credit, market, operational and private equity risk and considers factors, assumptions and inputs that differ from those required to be used for regulatory capital requirements. Accordingly, economic risk capital provides a complementary measure to regulatory capital. As economic risk capital is a separate component of the capital framework for Advanced Approach banking organizations under Basel III, the Firm continues to enhance its economic risk capital framework.
Line of business equity
The Firm’s framework for allocating capital to its business segments is based on the following objectives:
|
•
|
Integrate firmwide and line of business capital management activities;
|
|
•
|
Measure performance consistently across all lines of business; and
|
|
•
|
Provide comparability with peer firms for each of the lines of business
|
Equity for a line of business represents the amount the Firm believes the business would require if it were operating independently, considering capital levels for similarly rated peers, regulatory capital requirements (as estimated under Basel III Advanced Fully Phased-In) and economic risk measures. Capital is also allocated to each line of business for, among other things, goodwill and other intangibles associated with acquisitions effected by the line of business. ROE is measured and internal targets for expected returns are established as key measures of a business segment’s performance.
|
Line of business equity
|
Yearly average
|
|||||||||||
|
Year ended December 31,
(in billions)
|
2014
|
|
2013
|
|
2012
|
|
||||||
|
Consumer & Community Banking
|
$
|
51.0
|
|
$
|
46.0
|
|
$
|
43.0
|
|
|||
|
Corporate & Investment Bank
|
61.0
|
|
56.5
|
|
47.5
|
|
||||||
|
Commercial Banking
|
14.0
|
|
13.5
|
|
9.5
|
|
||||||
|
Asset Management
|
9.0
|
|
9.0
|
|
7.0
|
|
||||||
|
Corporate
|
72.4
|
|
71.4
|
|
77.4
|
|
||||||
|
Total common stockholders’ equity
|
$
|
207.4
|
|
$
|
196.4
|
|
$
|
184.4
|
|
|||
Effective January 1, 2013, the Firm refined the capital allocation framework to align it with the revised line of business structure that became effective in the fourth quarter of 2012. The change in equity levels for the lines of businesses was largely driven by the evolving regulatory requirements and higher capital targets the Firm had established under the Basel III Advanced Approach.
On at least an annual basis, the Firm assesses the level of capital required for each line of business as well as the assumptions and methodologies used to allocate capital to its lines of business and updates the equity allocations to its lines of business as refinements are implemented.
|
Line of business equity
|
January 1,
|
|
December 31,
|
||||||||
|
(in billions)
|
2015
(a)
|
2014
|
2013
|
||||||||
|
Consumer & Community Banking
|
$
|
51.0
|
|
$
|
51.0
|
|
$
|
46.0
|
|
||
|
Corporate & Investment Bank
|
62.0
|
|
61.0
|
|
56.5
|
|
|||||
|
Commercial Banking
|
14.0
|
|
14.0
|
|
13.5
|
|
|||||
|
Asset Management
|
9.0
|
|
9.0
|
|
9.0
|
|
|||||
|
Corporate
|
76.0
|
|
77.0
|
|
75.0
|
|
|||||
|
Total common stockholders’ equity
|
$
|
212.0
|
|
$
|
212.0
|
|
$
|
200.0
|
|
||
|
(a)
|
Reflects refined capital allocations effective January 1, 2015.
|
|
JPMorgan Chase & Co./2014 Annual Report
|
153
|
|
Management’s discussion and analysis
Capital actions
Dividends
The Firm’s common stock dividend policy reflects JPMorgan Chase’s earnings outlook, desired dividend payout ratio, capital objectives, and alternative investment opportunities.
The Firm’s current expectation is to continue to target a payout ratio of approximately 30% of normalized earnings over time. Following the Federal Reserve’s non-objection to the Firm’s 2014 capital plan, the Board of Directors increased the quarterly common stock dividend on May 20, 2014, from $0.38 to $0.40 per share, effective beginning with the dividend paid on July 31, 2014, to stockholders of record on July 3, 2014.
For information regarding dividend restrictions, see Note 22 and Note 27.
The following table shows the common dividend payout ratio based on reported net income.
|
Year ended December 31,
|
2014
|
|
2013
|
|
2012
|
|
||
|
Common dividend payout ratio
|
29
|
%
|
33
|
%
|
23
|
%
|
||
Preferred stock
During the year ended December 31, 2014, the Firm issued
$8.9 billion
of noncumulative preferred stock. Preferred stock dividends declared were $1.1 billion for the year ended December 31, 2014. Assuming all preferred stock issuances were outstanding for the entire year and quarterly dividends were declared on such issuances, preferred stock dividends would have been $1.3 billion for the year ended December 31, 2014. For additional information on the Firm’s preferred stock, see Note 22.
Redemption of outstanding trust preferred securities
On May 8, 2013, the Firm redeemed approximately $5.0 billion, or 100% of the liquidation amount, of the following eight series of trust preferred securities: JPMorgan Chase Capital X, XI, XII, XIV, XVI, XIX, XXIV, and BANK ONE Capital VI. For a further discussion of trust preferred securities, see Note 21.
Common equity
On
March 13, 2012
, the Board of Directors authorized a
$15.0 billion
common equity (i.e., common stock and warrants) repurchase program. As of
December 31, 2014
,
$3.8 billion
(on a trade-date basis) of authorized repurchase capacity remained under the program. The amount of equity that may be repurchased by the Firm is also subject to the amount that is set forth in the Firm’s annual capital plan submitted to the Federal Reserve as part of the CCAR process. In conjunction with the Federal Reserve’s release of its 2014 CCAR results, the Firm’s Board of Directors has authorized the Firm to repurchase
$6.5 billion
of common equity between April 1, 2014, and March 31, 2015. As of December 31, 2014,
$2.1 billion
(on a trade-date basis) of such repurchase capacity remains. This authorization includes shares repurchased to offset issuances under the Firm’s equity-based compensation plans.
The following table sets forth the Firm’s repurchases of common equity for the years ended December 31, 2014, 2013 and 2012, on a trade-date basis. There were no warrants repurchased during the years ended December 31, 2014, and 2013.
|
Year ended December 31, (in millions)
|
2014
|
2013
|
2012
|
|||||||||
|
Total number of shares of common stock repurchased
|
83.4
|
|
96.1
|
|
30.9
|
|
||||||
|
Aggregate purchase price of common stock repurchases
|
$
|
4,834
|
|
$
|
4,789
|
|
$
|
1,329
|
|
|||
|
Total number of warrants repurchased
|
—
|
|
—
|
|
18.5
|
|
||||||
|
Aggregate purchase price of warrant repurchases
|
$
|
—
|
|
$
|
—
|
|
$
|
238
|
|
|||
The Firm may, from time to time, enter into written trading plans under Rule 10b5-1 of the Securities Exchange Act of 1934 to facilitate repurchases in accordance with the common equity repurchase program. A Rule 10b5-1 repurchase plan allows the Firm to repurchase its equity during periods when it would not otherwise be repurchasing common equity — for example, during internal trading “blackout periods.” All purchases under a Rule 10b5-1 plan must be made according to a predefined plan established when the Firm is not aware of material nonpublic information.
The authorization to repurchase common equity will be utilized at management’s discretion, and the timing of purchases and the exact amount of common equity that may be repurchased is subject to various factors, including market conditions; legal and regulatory considerations affecting the amount and timing of repurchase activity; the Firm’s capital position (taking into account goodwill and intangibles); internal capital generation; and alternative investment opportunities. The repurchase program does not include specific price targets or timetables; may be executed through open market purchases or privately negotiated transactions, or utilizing Rule 10b5-1 programs; and may be suspended at any time.
For additional information regarding repurchases of the Firm’s equity securities, see Part II, Item 5: Market for registrant’s common equity, related stockholder matters and issuer purchases of equity securities on
pages 18–19
.
|
154
|
JPMorgan Chase & Co./2014 Annual Report
|
|
Broker-dealer regulatory capital
JPMorgan Chase’s principal U.S. broker-dealer subsidiaries are J.P. Morgan Securities LLC (“JPMorgan Securities”) and J.P. Morgan Clearing Corp. (“JPMorgan Clearing”). JPMorgan Clearing is a subsidiary of JPMorgan Securities and provides clearing and settlement services. JPMorgan Securities and JPMorgan Clearing are each subject to Rule 15c3-1 under the Securities Exchange Act of 1934 (the “Net Capital Rule”). JPMorgan Securities and JPMorgan Clearing are also each registered as futures commission merchants and subject to Rule 1.17 of the Commodity Futures Trading Commission (“CFTC”).
JPMorgan Securities and JPMorgan Clearing have elected to compute their minimum net capital requirements in accordance with the “Alternative Net Capital Requirements” of the Net Capital Rule. At December 31, 2014, JPMorgan Securities’ net capital, as defined by the Net Capital Rule, was $12.8 billion, exceeding the minimum requirement by $10.6 billion, and JPMorgan Clearing’s net capital was $7.5 billion, exceeding the minimum requirement by $5.6 billion.
In addition to its minimum net capital requirement, JPMorgan Securities is required to hold tentative net capital in excess of $1.0 billion and is also required to notify the Securities and Exchange Commission (“SEC”) in the event that tentative net capital is less than $5.0 billion, in accordance with the market and credit risk standards of Appendix E of the Net Capital Rule. As of December 31, 2014, JPMorgan Securities had tentative net capital in excess of the minimum and notification requirements.
J.P. Morgan Securities plc is a wholly owned subsidiary of JPMorgan Chase Bank, N.A. and is the Firm’s principal operating subsidiary in the U.K. It has authority to engage in banking, investment banking and broker-dealer activities. J.P. Morgan Securities plc is jointly regulated by the U.K. Prudential Regulation Authority (“PRA”) and Financial Conduct Authority (“FCA”). Commencing January 1, 2014, J.P. Morgan Securities plc became subject to the U.K. Basel III capital rules.
At December 31, 2014, J.P. Morgan Securities plc had estimated total capital of $30.1 billion; its estimated CET1 capital ratio was 10.7% and its estimated Total capital ratio was 14.1%. Both ratios exceeded the minimum transitional standards (4.0% and 8.0% for the CET1 ratio and Total capital ratio, respectively) as established by the Capital Requirements Directive and Regulation (the European Union (“EU”) implementation of Basel III) as well as additional minimum requirements specified by the Prudential Regulatory Authority as Individual Capital Guidance and PRA Buffer requirements.
|
JPMorgan Chase & Co./2014 Annual Report
|
155
|
|
Management’s discussion and analysis
|
LIQUIDITY RISK MANAGEMENT
|
||||
Liquidity risk is the risk that the Firm will be unable to meet its contractual and contingent obligations. Liquidity risk management is intended to ensure that the Firm has the appropriate amount, composition and tenor of funding and liquidity in support of its assets.
Liquidity Risk Oversight
The Firm has an independent liquidity risk oversight function whose primary objective is to provide assessment, measurement, monitoring, and control of liquidity risk across the Firm. Liquidity risk oversight is managed through a dedicated firmwide Liquidity Risk Oversight group reporting into the CIO, Treasury, and Corporate (“CTC”) Chief Risk Officer (“CRO”). The CTC CRO has responsibility for firmwide Liquidity Risk Oversight and reports to the Firm’s CRO. Liquidity Risk Oversight’s responsibilities include but are not limited to:
|
•
|
Establishing and monitoring limits, indicators, and thresholds, including liquidity appetite tolerances;
|
|
•
|
Defining and monitoring internal Firmwide and legal entity stress tests and regulatory defined stress testing;
|
|
•
|
Reporting and monitoring liquidity positions, balance sheet variances and funding activities;
|
|
•
|
Conducting ad hoc analysis to identify potential emerging liquidity risks.
|
Risk Governance and Measurement
Specific committees responsible for liquidity governance include firmwide ALCO as well as lines of business and regional ALCOs, and the CTC Risk Committee. For further discussion of the risk and risk-related committees, see Enterprise-wide Risk Management on
pages 105–109
.
Internal Stress testing
Liquidity stress tests are intended to ensure sufficient liquidity for the Firm under a variety of adverse scenarios. Results of stress tests are therefore considered in the formulation of the Firm’s funding plan and assessment of its liquidity position. Liquidity outflow assumptions are modeled across a range of time horizons and contemplate both market and idiosyncratic stress. Standard stress tests are performed on a regular basis and ad hoc stress tests are performed in response to specific market events or concerns. In addition, stress scenarios are produced for the parent holding company and the Firm’s major subsidiaries.
Liquidity stress tests assume all of the Firm’s contractual obligations are met and then take into consideration varying levels of access to unsecured and secured funding markets. Additionally, assumptions with respect to potential non-contractual and contingent outflows are contemplated.
Liquidity Management
Treasury is responsible for liquidity management. The primary objectives of effective liquidity management are to ensure that the Firm’s core businesses are able to operate in support of client needs, meet contractual and contingent obligations through normal economic cycles as well as during stress events, ensure funding mix optimization, and
availability of liquidity sources. The Firm manages liquidity and funding using a centralized, global approach in order to optimize liquidity sources and uses.
In the context of the Firm’s liquidity management, Treasury is responsible for:
|
•
|
Analyzing and understanding the liquidity characteristics of the Firm, lines of business and legal entities’ assets and liabilities, taking into account legal, regulatory, and operational restrictions;
|
|
•
|
Defining and monitoring firmwide and legal entity liquidity strategies, policies, guidelines, and contingency funding plans;
|
|
•
|
Managing liquidity within approved liquidity risk appetite tolerances and limits;
|
|
•
|
Setting transfer pricing in accordance with underlying liquidity characteristics of balance sheet assets and liabilities as well as certain off-balance sheet items.
|
Contingency funding plan
The Firm’s contingency funding plan (“CFP”), which is reviewed by ALCO and approved by the DRPC, is a compilation of procedures and action plans for managing liquidity through stress events. The CFP incorporates the limits and indicators set by the Liquidity Risk Oversight group. These limits and indicators are reviewed regularly to identify the emergence of risks or vulnerabilities in the Firm’s liquidity position. The CFP identifies the alternative contingent liquidity resources available to the Firm in a stress event.
Parent holding company and subsidiary funding
The parent holding company acts as a source of funding to its subsidiaries. The Firm’s liquidity management is intended to maintain liquidity at the parent holding company, in addition to funding and liquidity raised at the subsidiary operating level, at levels sufficient to fund the operations of the parent holding company and its subsidiaries for an extended period of time in a stress environment where access to normal funding sources is disrupted. The parent holding company currently holds more than 18 months of pre-funding assuming no access to wholesale funding markets.
LCR and NSFR
In December 2010, the Basel Committee introduced two new measures of liquidity risk: the liquidity coverage ratio (“LCR”), which is intended to measure the amount of “high-quality liquid assets” (“HQLA”) held by the Firm in relation to estimated net cash outflows within a 30-day period during an acute stress event; and the net stable funding ratio (“NSFR”) which is intended to measure the “available” amount of stable funding relative to the “required” amount of stable funding over a one-year horizon. The standards require that the LCR be no lower than 100% and the NSFR be greater than 100%.
|
156
|
JPMorgan Chase & Co./2014 Annual Report
|
|
On September 3, 2014, the U.S. banking regulators approved the final LCR rule (“U.S. LCR”), which became effective on January 1, 2015. Under the final rules, the LCR is required to be 80% at January 1, 2015, increasing by 10% each year until reaching 100% at January 1, 2017. At December 31, 2014, the Firm was compliant with the fully phased-in U.S. LCR based on its current understanding of the final rule. The Firm’s LCR may fluctuate from period-to-period due to normal flows from client activity.
On October 31, 2014, the Basel Committee issued the final standard for the NSFR which will become a minimum standard by January 1, 2018. At December 31, 2014, the Firm was compliant with the NSFR based on its current understanding of the final Basel rule. The U.S. Banking Regulators are expected to issue a proposal on the NSFR that would outline requirements specific to U.S. banks.
HQLA
HQLA is the estimated amount of assets that qualify for inclusion in the U.S. LCR. HQLA primarily consists of cash and certain unencumbered high quality liquid assets as defined in the rule.
As of
December 31, 2014
, HQLA was estimated to be approximately
$600 billion
, as determined under the U.S. LCR final rule, compared with
$522 billion
as of December 31, 2013, which was calculated using the Basel Committee’s definition of HQLA. The increase in HQLA was due to higher cash balances largely driven by higher deposit balances, partially offset by the impact of the application of the U.S. LCR rule which excludes certain types of securities that are permitted under the Basel Rules. HQLA may fluctuate from period-to-period primarily due to normal flows from client activity.
The following table presents the estimated HQLA included in the U.S. LCR broken out by HQLA-eligible cash and HQLA-eligible securities as of
December 31, 2014
.
|
(in billions)
|
December 31, 2014
|
|||
|
HQLA
|
||||
|
Eligible cash
(a)
|
$
|
454
|
|
|
|
Eligible securities
(b)
|
146
|
|
||
|
Total HQLA
|
$
|
600
|
|
|
|
(a)
|
Predominantly cash on deposit at central banks.
|
|
(b)
|
Predominantly includes U.S. agency mortgage-backed securities, U.S. Treasuries, and sovereign bonds.
|
In addition to HQLA, as of
December 31, 2014
, the Firm has approximately $321 billion of unencumbered marketable securities, such as equity securities and fixed income debt securities, available to raise liquidity, if required. Furthermore, the Firm maintains borrowing capacity at various Federal Home Loan Banks (“FHLBs”), the Federal Reserve Bank discount window and various other central banks as a result of collateral pledged by the Firm to such banks. Although available, the Firm does not view the borrowing capacity at the Federal Reserve Bank discount
window and the various other central banks as a primary source of liquidity. As of
December 31, 2014
, the Firm’s remaining borrowing capacity at various FHLBs and the Federal Reserve Bank discount window was approximately $143 billion. This borrowing capacity excludes the benefit of securities included above in HQLA or other unencumbered securities held at the Federal Reserve Bank discount window for which the Firm has not drawn liquidity.
Funding
Sources of funds
Management believes that the Firm’s unsecured and secured funding capacity is sufficient to meet its on- and off-balance sheet obligations.
The Firm funds its global balance sheet through diverse sources of funding including a stable deposit franchise as well as secured and unsecured funding in the capital markets. The Firm’s loan portfolio (aggregating approximately
$757.3 billion
at
December 31, 2014
), is funded with a portion of the Firm’s deposits (aggregating approximately
$1,363.4 billion
at
December 31, 2014
) and through securitizations and, with respect to a portion of the Firm’s real estate-related loans, with secured borrowings from the FHLBs. Deposits in excess of the amount utilized to fund loans are primarily invested in the Firm’s investment securities portfolio or deployed in cash or other short-term liquid investments based on their interest rate and liquidity risk characteristics. Capital markets secured financing assets and trading assets are primarily funded by the Firm’s capital markets secured financing liabilities, trading liabilities and a portion of the Firm’s long-term debt and stockholders’ equity.
In addition to funding capital markets assets, proceeds from the Firm’s debt and equity issuances are used to fund certain loans, and other financial and non-financial assets, or may be invested in the Firm’s investment securities portfolio. See the discussion below for additional disclosures relating to Deposits, Short-term funding, and Long-term funding and issuance.
Deposits
A key strength of the Firm is its diversified deposit franchise, through each of its lines of business, which provides a stable source of funding and limits reliance on the wholesale funding markets. As of
December 31, 2014
, the Firm’s loans-to-deposits ratio was
56%
, compared with
57%
at December 31, 2013.
As of
December 31, 2014
, total deposits for the Firm were
$1,363.4 billion
, compared with
$1,287.8 billion
at December 31, 2013 (
58%
of total liabilities at both
December 31, 2014
and 2013). The increase was due to growth in both wholesale and consumer deposits. For further information, see Balance Sheet Analysis on
pages 72–73
.
|
JPMorgan Chase & Co./2014 Annual Report
|
157
|
|
Management’s discussion and analysis
The Firm typically experiences higher customer deposit inflows at period-ends. Therefore, the Firm believes average deposit balances are more representative of deposit trends. The table below summarizes, by line of business, the period-end and average deposit balances as of and for the years ended
December 31, 2014
and 2013.
|
Deposits
|
Year ended December 31,
|
||||||||||||
|
As of or for the period ended December 31,
|
Average
|
||||||||||||
|
(in millions)
|
2014
|
2013
|
2014
|
2013
|
|||||||||
|
Consumer & Community Banking
|
$
|
502,520
|
|
$
|
464,412
|
|
$
|
486,919
|
|
$
|
453,304
|
|
|
|
Corporate & Investment Bank
|
468,423
|
|
446,237
|
|
417,517
|
|
384,289
|
|
|||||
|
Commercial Banking
|
213,682
|
|
206,127
|
|
190,425
|
|
184,409
|
|
|||||
|
Asset Management
|
155,247
|
|
146,183
|
|
150,121
|
|
139,707
|
|
|||||
|
Corporate
|
23,555
|
|
24,806
|
|
19,319
|
|
27,433
|
|
|||||
|
Total Firm
|
$
|
1,363,427
|
|
$
|
1,287,765
|
|
$
|
1,264,301
|
|
$
|
1,189,142
|
|
|
A significant portion of the Firm’s deposits are consumer deposits (
37%
and
36%
at
December 31, 2014
and 2013, respectively), which are considered particularly stable as they are less sensitive to interest rate changes or market volatility. Additionally, the majority of the Firm’s institutional deposits are also considered to be stable sources of funding since they are generated from customers that maintain operating service relationships with the Firm. For further discussions of deposit and liability balance trends, see the discussion of the results for the Firm’s business segments and the Balance Sheet Analysis on
pages 79–104
and
pages 72–73
, respectively.
The following table summarizes short-term and long-term funding, excluding deposits, as of
December 31, 2014
and 2013, and average balances for the years ended December 31, 2014 and 2013. For additional information, see the Balance Sheet Analysis on
pages 72–73
and Note 21.
|
Sources of funds (excluding deposits)
|
2014
|
2013
|
|||||||||||
|
As of or for the year ended December 31,
|
Average
|
||||||||||||
|
(in millions)
|
2014
|
2013
|
|||||||||||
|
Commercial paper:
|
|||||||||||||
|
Wholesale funding
|
$
|
24,052
|
|
$
|
17,249
|
|
$
|
19,442
|
|
$
|
17,785
|
|
|
|
Client cash management
|
42,292
|
|
40,599
|
|
40,474
|
|
35,932
|
|
|||||
|
Total commercial paper
|
$
|
66,344
|
|
$
|
57,848
|
|
$
|
59,916
|
|
$
|
53,717
|
|
|
|
Obligations of Firm-administered multi-seller conduits
(a)
|
$
|
12,047
|
|
$
|
14,892
|
|
$
|
10,427
|
|
$
|
15,504
|
|
|
|
Other borrowed funds
|
$
|
30,222
|
|
$
|
27,994
|
|
$
|
31,721
|
|
$
|
30,449
|
|
|
|
Securities loaned or sold under agreements to repurchase:
|
|||||||||||||
|
Securities sold under agreements to repurchase
|
$
|
167,077
|
|
$
|
155,808
|
|
$
|
181,186
|
|
$
|
207,106
|
|
|
|
Securities loaned
|
21,798
|
|
19,509
|
|
22,586
|
|
26,068
|
|
|||||
|
Total securities loaned or sold under agreements to repurchase
(b)(c)(d)
|
$
|
188,875
|
|
$
|
175,317
|
|
$
|
203,772
|
|
$
|
233,174
|
|
|
|
Total senior notes
|
$
|
142,480
|
|
$
|
135,754
|
|
$
|
139,707
|
|
$
|
137,662
|
|
|
|
Trust preferred securities
|
5,496
|
|
5,445
|
|
5,471
|
|
7,178
|
|
|||||
|
Subordinated debt
|
29,472
|
|
29,578
|
|
29,082
|
|
27,955
|
|
|||||
|
Structured notes
|
30,021
|
|
28,603
|
|
30,311
|
|
29,517
|
|
|||||
|
Total long-term unsecured funding
|
$
|
207,469
|
|
$
|
199,380
|
|
$
|
204,571
|
|
$
|
202,312
|
|
|
|
Credit card securitization
|
$
|
31,239
|
|
$
|
26,580
|
|
$
|
28,935
|
|
$
|
27,834
|
|
|
|
Other securitizations
(e)
|
2,008
|
|
3,253
|
|
2,734
|
|
3,501
|
|
|||||
|
FHLB advances
|
64,994
|
|
61,876
|
|
60,667
|
|
55,487
|
|
|||||
|
Other long-term secured funding
(f)
|
4,373
|
|
6,633
|
|
5,031
|
|
6,284
|
|
|||||
|
Total long-term secured funding
|
$
|
102,614
|
|
$
|
98,342
|
|
$
|
97,367
|
|
$
|
93,106
|
|
|
|
Preferred stock
(g)
|
$
|
20,063
|
|
$
|
11,158
|
|
17,018
|
|
$
|
10,960
|
|
||
|
Common stockholders’ equity
(g)
|
$
|
212,002
|
|
$
|
200,020
|
|
207,400
|
|
$
|
196,409
|
|
||
|
(a)
|
Included in beneficial interests issued by consolidated variable interest entities on the Firm’s Consolidated balance sheets.
|
|
(b)
|
Excludes federal funds purchased.
|
|
(c)
|
Excluded long-term structured repurchase agreements of
$2.7 billion
and
$4.6 billion
as of
December 31, 2014
and 2013, respectively, and average balance of
$4.2 billion
for the years ended
December 31, 2014
and 2013.
|
|
158
|
JPMorgan Chase & Co./2014 Annual Report
|
|
|
(d)
|
Excluded long-term securities loaned of
$483 million
as of December 31, 2013, and average balance of
$24 million
and
$414 million
for the years ended
December 31, 2014
and 2013, respectively. There were no long-term securities loaned as of December 31, 2014.
|
|
(e)
|
Other securitizations includes securitizations of residential mortgages and student loans. The Firm’s wholesale businesses also securitize loans for client-driven transactions; those client-driven loan securitizations are not considered to be a source of funding for the Firm and are not included in the table.
|
|
(f)
|
Includes long-term structured notes which are secured.
|
|
(g)
|
For additional information on preferred stock and common stockholders’ equity see Capital Management on
pages 146–155
, Consolidated statements of changes in stockholders’ equity, Note 22 and Note 23.
|
Short-term funding
A significant portion of the Firm’s total commercial paper liabilities, approximately
64%
as of
December 31, 2014
, were not sourced from wholesale funding markets, but were originated from deposits that customers choose to sweep into commercial paper liabilities as a cash management program offered to customers of the Firm.
The Firm’s sources of short-term secured funding primarily consist of securities loaned or sold under agreements to repurchase. Securities loaned or sold under agreements to repurchase are secured predominantly by high-quality securities collateral, including government-issued debt, agency debt and agency MBS, and constitute a significant portion of the federal funds purchased and securities loaned or sold under purchase agreements. The amounts of securities loaned or sold under agreements to repurchase at
December 31, 2014
, increased predominantly due to a change in the mix of the Firm’s funding sources. The decrease in average balances for the year ended
December 31, 2014
, compared with December 31, 2013, was predominantly due to less secured financing of the Firm’s investment securities portfolio, and a change in the mix of the Firm’s funding sources. The balances associated with securities loaned or sold under agreements to repurchase fluctuate over time due to customers’ investment and financing activities; the Firm’s demand for financing; the ongoing management of the mix of the Firm’s liabilities, including its secured and unsecured financing (for both the investment securities and market-making portfolios); and other market and portfolio factors.
Long-term funding and issuance
Long-term funding provides additional sources of stable funding and liquidity for the Firm. The Firm’s long-term funding plan is driven by expected client activity, liquidity considerations, and regulatory requirements. Long-term funding objectives include maintaining diversification, maximizing market access and optimizing funding costs, as well as maintaining a certain level of pre-funding at the parent holding company. The Firm evaluates various funding markets, tenors and currencies in creating its optimal long-term funding plan.
The significant majority of the Firm’s long-term unsecured funding is issued by the parent holding company to provide maximum flexibility in support of both bank and nonbank subsidiary funding. The following table summarizes long-term unsecured issuance and maturities or redemptions for the years ended
December 31, 2014
and 2013. For additional information, see Note 21.
|
Long-term unsecured funding
|
||||||
|
Year ended December 31,
(in millions)
|
2014
|
2013
|
||||
|
Issuance
|
||||||
|
Senior notes issued in the U.S. market
|
$
|
16,373
|
|
$
|
19,835
|
|
|
Senior notes issued in non-U.S. markets
|
11,221
|
|
8,843
|
|
||
|
Total senior notes
|
27,594
|
|
28,678
|
|
||
|
Subordinated debt
|
4,979
|
|
3,232
|
|
||
|
Structured notes
|
19,806
|
|
16,979
|
|
||
|
Total long-term unsecured funding – issuance
|
$
|
52,379
|
|
$
|
48,889
|
|
|
Maturities/redemptions
|
||||||
|
Total senior notes
|
$
|
21,169
|
|
$
|
18,418
|
|
|
Trust preferred securities
|
—
|
|
5,052
|
|
||
|
Subordinated debt
|
4,487
|
|
2,418
|
|
||
|
Structured notes
|
18,554
|
|
17,785
|
|
||
|
Total long-term unsecured funding – maturities/redemptions
|
$
|
44,210
|
|
$
|
43,673
|
|
In addition, from January 1, 2015, through
February 24, 2015
, the Firm issued $10.1 billion of senior notes.
The Firm raises secured long-term funding through securitization of consumer credit card loans and advances from the FHLBs. It may also in the future raise long-term funding through securitization of residential mortgages, auto loans and student loans, which will increase funding and investor diversity.
The following table summarizes the securitization issuance and FHLB advances and their respective maturities or redemption for the years ended
December 31, 2014
and 2013.
|
Long-term secured funding
|
|||||||||||||
|
Year ended
December 31,
|
Issuance
|
Maturities/Redemptions
|
|||||||||||
|
(in millions)
|
2014
|
2013
|
2014
|
2013
|
|||||||||
|
Credit card securitization
|
$
|
8,350
|
|
$
|
8,434
|
|
$
|
3,774
|
|
$
|
11,853
|
|
|
|
Other securitizations
(a)
|
—
|
|
—
|
|
309
|
|
427
|
|
|||||
|
FHLB advances
|
15,200
|
|
23,650
|
|
12,079
|
|
3,815
|
|
|||||
|
Other long-term secured funding
|
$
|
802
|
|
$
|
751
|
|
$
|
3,076
|
|
$
|
159
|
|
|
|
Total long-term secured funding
|
$
|
24,352
|
|
$
|
32,835
|
|
$
|
19,238
|
|
$
|
16,254
|
|
|
|
(a)
|
Other securitizations includes securitizations of residential mortgages and student loans.
|
|
JPMorgan Chase & Co./2014 Annual Report
|
159
|
|
Management’s discussion and analysis
The Firm’s wholesale businesses also securitize loans for client-driven transactions; those client-driven loan securitizations are not considered to be a source of funding for the Firm and are not included in the table above. For further description of the client-driven loan securitizations, see Note 16.
Credit ratings
The cost and availability of financing are influenced by credit ratings. Reductions in these ratings could have an adverse effect on the Firm’s access to liquidity sources, increase the cost of funds, trigger additional collateral or
funding requirements and decrease the number of investors and counterparties willing to lend to the Firm. Additionally, the Firm’s funding requirements for VIEs and other third party commitments may be adversely affected by a decline in credit ratings. For additional information on the impact of a credit ratings downgrade on the funding requirements for VIEs, and on derivatives and collateral agreements, see Special-purpose entities on
page 74
, and Credit risk, liquidity risk and credit-related contingent features in
Note 6.
The credit ratings of the parent holding company and the Firm’s principal bank and nonbank subsidiaries as of December 31, 2014, were as follows.
|
JPMorgan Chase & Co.
|
JPMorgan Chase Bank, N.A.
Chase Bank USA, N.A.
|
J.P. Morgan Securities LLC
|
|||||||||
|
December 31, 2014
|
Long-term issuer
|
Short-term issuer
|
Outlook
|
Long-term issuer
|
Short-term issuer
|
Outlook
|
Long-term issuer
|
Short-term issuer
|
Outlook
|
||
|
Moody’s Investor Services
|
A3
|
P-2
|
Stable
|
Aa3
|
P-1
|
Stable
|
Aa3
|
P-1
|
Stable
|
||
|
Standard & Poor’s
|
A
|
A-1
|
Negative
|
A+
|
A-1
|
Stable
|
A+
|
A-1
|
Stable
|
||
|
Fitch Ratings
|
A+
|
F1
|
Stable
|
A+
|
F1
|
Stable
|
A+
|
F1
|
Stable
|
||
Downgrades of the Firm’s long-term ratings by one or two notches could result in a downgrade of the Firm’s short-term ratings. If this were to occur, the Firm believes its cost of funds could increase and access to certain funding markets could be reduced as noted above. The nature and magnitude of the impact of ratings downgrades depends on numerous contractual and
behavioral factors (which the Firm believes are incorporated in its liquidity risk and stress testing metrics). The Firm believes it maintains sufficient liquidity to withstand a potential decrease in funding capacity due to ratings downgrades.
JPMorgan Chase’s unsecured debt does not contain requirements that would call for an acceleration of payments, maturities or changes in the structure of the existing debt, provide any limitations on future borrowings or require additional collateral, based on unfavorable changes in the Firm’s credit ratings, financial ratios, earnings, or stock price.
Critical factors in maintaining high credit ratings include a stable and diverse earnings stream, strong capital ratios, strong credit quality and risk management controls, diverse funding sources, and disciplined liquidity monitoring procedures. Rating agencies continue to evaluate economic and geopolitical trends, regulatory developments, rating uplift assumptions surrounding government support, future profitability, risk management practices, and litigation matters, as well as their broader ratings methodologies. Changes in any of these factors could lead to changes in the Firm’s credit ratings.
On September 18, 2014, S&P revised its ratings methodology for hybrid capital securities issued by financial institutions, and on September 29, 2014, the ratings of the Firm’s hybrid capital securities (including trust preferred securities and preferred stock) were lowered by 1 notch from BBB to BBB-, reflecting the new methodology. Furthermore, S&P has announced a Request for Comment on a proposed change to rating criteria related to additional loss absorbing capacity. In addition, Moody’s and Fitch are in the process of reviewing their ratings methodologies: Moody’s has announced a Request for Comment on the revision to its Bank Rating Methodology and Fitch has announced a review of the ratings differential that it applies between bank holding companies and their bank subsidiaries.
Although the Firm closely monitors and endeavors to manage, to the extent it is able, factors influencing its credit ratings, there is no assurance that its credit ratings will not be changed in the future.
|
160
|
JPMorgan Chase & Co./2014 Annual Report
|
|
|
CRITICAL ACCOUNTING ESTIMATES USED BY THE FIRM
|
||||
JPMorgan Chase
’s accounting policies and use of estimates are integral to understanding its reported results. The Firm’s most complex accounting estimates require management’s judgment to ascertain the appropriate carrying value of assets and liabilities. The Firm has established policies and control procedures intended to ensure that estimation methods, including any judgments made as part of such methods, are well-controlled, independently reviewed and applied consistently from period to period. The methods used and judgments made reflect, among other factors, the nature of the assets or liabilities and the related business and risk management strategies, which may vary across the Firm’s businesses and portfolios. In addition, the policies and procedures are intended to ensure that the process for changing methodologies occurs in an appropriate manner. The Firm believes its estimates for determining the carrying value of its assets and liabilities are appropriate. The following is a brief description of the Firm’s critical accounting estimates involving significant judgments.
Allowance for credit losses
JPMorgan Chase
’s allowance for credit losses covers the retained consumer and wholesale loan portfolios, as well as the Firm’s consumer and wholesale lending-related commitments. The allowance for loan losses is intended to adjust the carrying value of the Firm’s loan assets to reflect probable credit losses inherent in the loan portfolio as of the balance sheet date. Similarly, the allowance for lending-related commitments is established to cover probable credit losses inherent in the lending-related commitments portfolio as of the balance sheet date.
The allowance for loan losses includes an asset-specific component, a formula-based component, and a component related to PCI loans. The determination of each of these components involves significant judgment on a number of matters, as discussed below. For further discussion of the methodologies used in establishing the Firm’s allowance for credit losses, see Note 15.
Asset-specific component
The asset-specific allowance for loan losses for each of the Firm’s portfolio segments is generally measured as the difference between the recorded investment in the impaired loan and the present value of the cash flows expected to be collected, discounted at the loan’s original effective interest rate. Estimating the timing and amounts of future cash flows is highly judgmental as these cash flow projections rely upon estimates such as redefault rates, loss severities, the amounts and timing of prepayments and other factors that are reflective of current and expected future market conditions. These estimates are, in turn, dependent on factors such as the level of future home prices, the duration of current overall economic conditions, and other macroeconomic and portfolio-specific factors. All of these estimates and assumptions require significant management judgment and certain assumptions are highly subjective.
Formula-based component - Consumer loans and lending-related commitments, excluding PCI loans
The formula-based allowance for credit losses for the consumer portfolio, including credit card, is calculated by applying statistical credit loss factors to outstanding principal balances over an estimated loss emergence period to arrive at an estimate of incurred credit losses in the portfolio. The loss emergence period represents the time period between the date at which the loss is estimated to have been incurred and the ultimate realization of that loss (through a charge-off). Estimated loss emergence periods may vary by product and may change over time; management applies judgment in estimating loss emergence periods, using available credit information and trends. In addition, management applies judgment to the statistical loss estimates for each loan portfolio category, using delinquency trends and other risk characteristics to estimate the total incurred credit losses in the portfolio. Management uses additional statistical methods and considers portfolio and collateral valuation trends to review the appropriateness of the primary statistical loss estimate.
The statistical calculation is then adjusted to take into consideration model imprecision, external factors and current economic events that have occurred but that are not yet reflected in the factors used to derive the statistical calculation; these adjustments are accomplished in part by analyzing the historical loss experience for each major product segment. However, it is difficult to predict whether historical loss experience is indicative of future loss levels. Management applies judgment in making this adjustment, taking into account uncertainties associated with current macroeconomic and political conditions, quality of underwriting standards, borrower behavior, the potential impact of payment recasts within the HELOC portfolio, and other relevant internal and external factors affecting the credit quality of the portfolio. In certain instances, the interrelationships between these factors create further uncertainties. For example, the performance of a HELOC that experiences a payment recast may be affected by both the quality of underwriting standards applied in originating the loan and the general economic conditions in effect at the time of the payment recast. For junior lien products, management considers the delinquency and/or modification status of any senior liens in determining the adjustment. The application of different inputs into the statistical calculation, and the assumptions used by management to adjust the statistical calculation, are subject to management judgment, and emphasizing one input or assumption over another, or considering other inputs or assumptions, could affect the estimate of the allowance for loan losses for the consumer credit portfolio.
Overall, the allowance for credit losses for the consumer portfolio, including credit card, is sensitive to changes in the economic environment (e.g., unemployment rates), delinquency rates, the realizable value of collateral (e.g.,
|
JPMorgan Chase & Co./2014 Annual Report
|
161
|
|
Management’s discussion and analysis
housing prices), FICO scores, borrower behavior and other risk factors. While all of these factors are important determinants of overall allowance levels, changes in the various factors may not occur at the same time or at the same rate, or changes may be directionally inconsistent such that improvement in one factor may offset deterioration in the other. In addition, changes in these factors would not necessarily be consistent across all geographies or product types. Finally, it is difficult to predict the extent to which changes in these factors would ultimately affect the frequency of losses, the severity of losses or both.
PCI loans
In connection with the Washington Mutual transaction, JPMorgan Chase acquired certain PCI loans, which are accounted for as described in Note 14. The allowance for loan losses for the PCI portfolio is based on quarterly estimates of the amount of principal and interest cash flows expected to be collected over the estimated remaining lives of the loans.
These cash flow projections are based on estimates regarding default rates (including redefault rates on modified loans), loss severities, the amounts and timing of prepayments and other factors that are reflective of current and expected future market conditions. These estimates are dependent on assumptions regarding the level of future home price declines, and the duration of current overall economic conditions, among other factors. These estimates and assumptions require significant management judgment and certain assumptions are highly subjective.
Formula-based component - Wholesale loans and lending-related commitments
The Firm’s methodology for determining the allowance for loan losses and the allowance for lending-related commitments requires the early identification of credits that are deteriorating. The formula-based component of the allowance calculation for wholesale loans and lending-related components is the product of an estimated PD and estimated LGD. These factors are determined based on the credit quality and specific attributes of the Firm’s loans and lending-related commitments to each obligor.
The Firm uses a risk rating system to determine the credit quality of its wholesale loans and lending-related commitments. In assessing the risk rating of a particular loan or lending-related commitment, among the factors considered are the obligor’s debt capacity and financial flexibility, the level of the obligor’s earnings, the amount and sources for repayment, the level and nature of contingencies, management strength, and the industry and geography in which the obligor operates. These factors are based on an evaluation of historical and current information and involve subjective assessment and interpretation. Emphasizing one factor over another or considering additional factors could affect the risk rating assigned by the Firm to that loan.
PD estimates are based on observable external through-the-cycle data, using credit rating agency default statistics. A LGD estimate is assigned to each loan or lending-related commitment. The estimate represents the amount of economic loss if the obligor were to default. The type of obligor, quality of collateral, and the seniority of the Firm’s loans in the obligor’s capital structure affect LGD. LGD estimates are based on the Firm’s history of actual credit losses over more than one credit cycle. Changes to the time period used for PD and LGD estimates (for example, point-in-time loss versus longer views of the credit cycle) could also affect the allowance for credit losses.
The Firm applies judgment in estimating PD and LGD used in calculating the allowances. Wherever possible, the Firm uses independent, verifiable data or the Firm’s own historical loss experience in its models for estimating the allowances, but differences in loan characteristics between the Firm’s specific loan portfolio and those reflected in external and Firm-specific historical data could affect loss estimates. Estimates of PD and LGD are subject to periodic refinement based on any changes to underlying external and Firm-specific historical data. The use of different inputs would change the amount of the allowance for credit losses determined appropriate by the Firm.
Management also applies its judgment to adjust the modeled loss estimates, taking into consideration model imprecision, external factors and economic events that have occurred but are not yet reflected in the loss factors. Historical experience of both LGD and PD are considered when estimating these adjustments. Factors related to concentrated and deteriorating industries also are incorporated where relevant. These estimates are based on management’s view of uncertainties that relate to current macroeconomic and political conditions, quality of underwriting standards and other relevant internal and external factors affecting the credit quality of the current portfolio.
Allowance for credit losses sensitivity
As noted above, the Firm’s allowance for credit losses is sensitive to numerous factors, depending on the portfolio. Changes in economic conditions or in the Firm’s assumptions could affect its estimate of probable credit losses inherent in the portfolio at the balance sheet date. For example, changes in the inputs below would have the following effects on the Firm’s modeled loss estimates as of
December 31, 2014
, without consideration of any offsetting or correlated effects of other inputs in the Firm’s allowance for loan losses:
|
•
|
For PCI loans, a combined
5%
decline in housing prices and a
1%
increase in unemployment from current levels could imply an increase to modeled credit loss estimates of approximately
$1.2 billion
.
|
|
•
|
For the residential real estate portfolio, excluding PCI loans, a combined
5%
decline in housing prices and a
1%
increase in unemployment from current levels could
|
|
162
|
JPMorgan Chase & Co./2014 Annual Report
|
|
imply an increase to modeled annual loss estimates of approximately
$100 million
.
|
•
|
A
50
basis point deterioration in forecasted credit card loss rates could imply an increase to modeled annualized credit card loan loss estimates of approximately
$600 million
.
|
|
•
|
A one-notch downgrade in the Firm’s internal risk ratings for its entire wholesale loan portfolio could imply an increase in the Firm’s modeled loss estimates of approximately
$1.8 billion
.
|
|
•
|
A
100
basis point increase in estimated loss given default for the Firm’s entire wholesale loan portfolio could imply an increase in the Firm’s modeled loss estimates of approximately
$140 million
.
|
The purpose of these sensitivity analyses is to provide an indication of the isolated impacts of hypothetical alternative assumptions on modeled loss estimates. The changes in the inputs presented above are not intended to imply management’s expectation of future deterioration of those risk factors. In addition, these analyses are not intended to estimate changes in the overall allowance for loan losses, which would also be influenced by the judgment management applies to the modeled loss estimates to reflect the uncertainty and imprecision of these modeled loss estimates based on then current circumstances and conditions.
It is difficult to estimate how potential changes in specific factors might affect the overall allowance for credit losses because management considers a variety of factors and inputs in estimating the allowance for credit losses. Changes in these factors and inputs may not occur at the same rate and may not be consistent across all geographies or product types, and changes in factors may be directionally inconsistent, such that improvement in one factor may offset deterioration in other factors. In addition, it is difficult to predict how changes in specific economic conditions or assumptions could affect borrower behavior or other factors considered by management in estimating the allowance for credit losses. Given the process the Firm follows and the judgments made in evaluating the risk factors related to its loans and credit card loss estimates, management believes that its current estimate of the allowance for credit loss is appropriate.
Fair value of financial instruments, MSRs and commodities inventory
JPMorgan Chase carries a portion of its assets and liabilities at fair value. The majority of such assets and liabilities are measured at fair value on a recurring basis. Certain assets and liabilities are measured at fair value on a nonrecurring basis, including certain mortgage, home equity and other loans, where the carrying value is based on the fair value of the underlying collateral.
Assets measured at fair value
The following table includes the Firm’s assets measured at fair value and the portion of such assets that are classified within level 3 of the valuation hierarchy. For further information, see Note 3.
|
December 31, 2014
(in billions, except ratio data)
|
Total assets at fair value
|
Total level 3 assets
|
||||||
|
Trading debt and equity instruments
|
$
|
320.0
|
|
$
|
22.5
|
|
||
|
Derivative receivables
|
79.0
|
|
12.6
|
|
||||
|
Trading assets
|
399.0
|
|
35.1
|
|
||||
|
AFS securities
|
298.8
|
|
1.0
|
|
||||
|
Loans
|
2.6
|
|
2.5
|
|
||||
|
MSRs
|
7.4
|
|
7.4
|
|
||||
|
Private equity investments
(a)
|
5.7
|
|
2.5
|
|
||||
|
Other
|
36.2
|
|
2.4
|
|
||||
|
Total assets measured
at fair value on a recurring basis
|
749.7
|
|
50.9
|
|
||||
|
Total assets measured at fair value on a nonrecurring basis
|
4.5
|
|
3.2
|
|
||||
|
Total assets measured
at fair value
|
$
|
754.2
|
|
$
|
54.1
|
|
||
|
Total Firm assets
|
$
|
2,573.1
|
|
|||||
|
Level 3 assets as a percentage of total Firm assets
|
2.1
|
%
|
||||||
|
Level 3 assets as a percentage of total Firm assets at fair value
|
7.2
|
%
|
||||||
|
(a)
|
Private equity instruments represent investments within the Corporate line of business.
|
Valuation
Details of the Firm’s processes for determining fair value are set out in Note 3. Estimating fair value requires the application of judgment. The type and level of judgment required is largely dependent on the amount of observable market information available to the Firm. For instruments valued using internally developed models that use significant unobservable inputs and are therefore classified within level 3 of the valuation hierarchy, judgments used to estimate fair value are more significant than those required when estimating the fair value of instruments classified within levels 1 and 2.
In arriving at an estimate of fair value for an instrument within level 3, management must first determine the appropriate model to use. Second, the lack of observability of certain significant inputs requires management to assess all relevant empirical data in deriving valuation inputs — including, for example, transaction details, yield curves, interest rates, prepayment rates, default rates, volatilities, correlations, equity or debt prices, valuations of comparable instruments, foreign exchange rates and credit curves. For further discussion of the valuation of level 3 instruments, including unobservable inputs used, see
Note 3.
For instruments classified in levels 2 and 3, management judgment must be applied to assess the appropriate level of valuation adjustments to reflect counterparty credit quality, the Firm’s credit-worthiness, market funding rates, liquidity considerations, unobservable parameters, and for portfolios that meet specified criteria, the size of the net open risk
|
JPMorgan Chase & Co./2014 Annual Report
|
163
|
|
Management’s discussion and analysis
position. The judgments made are typically affected by the type of product and its specific contractual terms, and the level of liquidity for the product or within the market as a whole. For further discussion of valuation adjustments applied by the Firm see Note 3.
Imprecision in estimating unobservable market inputs or other factors can affect the amount of gain or loss recorded for a particular position. Furthermore, while the Firm believes its valuation methods are appropriate and consistent with those of other market participants, the methods and assumptions used reflect management judgment and may vary across the Firm’s businesses and portfolios.
The Firm uses various methodologies and assumptions in the determination of fair value. The use of methodologies or assumptions different than those used by the Firm could result in a different estimate of fair value at the reporting date. For a detailed discussion of the Firm’s valuation process and hierarchy, and its determination of fair value for individual financial instruments, see Note 3.
Goodwill impairment
Under U.S. GAAP, goodwill must be allocated to reporting units and tested for impairment at least annually. The Firm’s process and methodology used to conduct goodwill impairment testing is described in Note 17.
Management applies significant judgment when estimating the fair value of its reporting units. Estimates of fair value are dependent upon estimates of (a) the future earnings potential of the Firm’s reporting units, including the estimated effects of regulatory and legislative changes, such as the Dodd-Frank Act, (b) long-term growth rates and (c) the relevant cost of equity. Imprecision in estimating these factors can affect the estimated fair value of the reporting units.
During
2014
, the Firm recognized an impairment of the Private Equity business’ goodwill totaling
$276 million
. Remaining goodwill of
$101 million
at
December 31, 2014
associated with the Private Equity business was disposed of as part of the Private Equity sale completed in January 2015. For further information on the Private Equity sale, see Note 2.
Based upon the updated valuations for all of its reporting units, the Firm concluded that the goodwill allocated to its other reporting units was not impaired at
December 31, 2014
. The fair values of these reporting units exceeded their carrying values. Except for the Firm’s mortgage banking business, the excess fair value as a percentage of carrying value ranged from approximately 20-210% for the other reporting units and did not indicate a significant risk of goodwill impairment based on current projections and valuations. The fair value of the Firm’s Mortgage Banking business exceeded its carrying value by less than 5% and accordingly, the associated goodwill of approximately $2 billion remains at an elevated risk for goodwill impairment.
The projections for all of the Firm’s reporting units are consistent with the short-term assumptions discussed in the Business outlook on
pages 66–67
, and in the longer term, incorporate a set of macroeconomic assumptions and the Firm’s best estimates of long-term growth and returns of its businesses. Where possible, the Firm uses third-party and peer data to benchmark its assumptions and estimates.
Deterioration in economic market conditions, increased estimates of the effects of recent regulatory or legislative changes, or additional regulatory or legislative changes may result in declines in projected business performance beyond management’s current expectations. For example, in the Firm’s Mortgage Banking business, such declines could result from increases in primary mortgage interest rates, lower mortgage origination volume, higher costs to resolve foreclosure-related matters or from deterioration in economic conditions, including decreases in home prices that result in increased credit losses. Declines in business performance, increases in equity capital requirements, or increases in the estimated cost of equity, could cause the estimated fair values of the Firm’s reporting units or their associated goodwill to decline in the future, which could result in a material impairment charge to earnings in a future period related to some portion of the associated goodwill.
For additional information on goodwill, see Note 17.
Income taxes
JPMorgan Chase is subject to the income tax laws of the various jurisdictions in which it operates, including U.S. federal, state and local and non-U.S. jurisdictions. These laws are often complex and may be subject to different interpretations. To determine the financial statement impact of accounting for income taxes, including the provision for income tax expense and unrecognized tax benefits, JPMorgan Chase must make assumptions and judgments about how to interpret and apply these complex tax laws to numerous transactions and business events, as well as make judgments regarding the timing of when certain items may affect taxable income in the U.S. and non-U.S. tax jurisdictions.
JPMorgan Chase’s interpretations of tax laws around the world are subject to review and examination by the various taxing authorities in the jurisdictions where the Firm operates, and disputes may occur regarding its view on a tax position. These disputes over interpretations with the various taxing authorities may be settled by audit, administrative appeals or adjudication in the court systems of the tax jurisdictions in which the Firm operates. JPMorgan Chase regularly reviews whether it may be assessed additional income taxes as a result of the resolution of these matters, and the Firm records additional reserves as appropriate. In addition, the Firm may revise its estimate of income taxes due to changes in income tax laws, legal interpretations and tax planning strategies. It is possible that revisions in the Firm’s estimate of income
|
164
|
JPMorgan Chase & Co./2014 Annual Report
|
|
taxes may materially affect the Firm’s results of operations in any reporting period.
The Firm’s provision for income taxes is composed of current and deferred taxes. Deferred taxes arise from differences between assets and liabilities measured for financial reporting versus income tax return purposes. Deferred tax assets are recognized if, in management’s judgment, their realizability is determined to be more likely than not. The Firm has also recognized deferred tax assets in connection with certain NOLs. The Firm performs regular reviews to ascertain whether deferred tax assets are realizable. These reviews include management’s estimates and assumptions regarding future taxable income, which also incorporates various tax planning strategies, including strategies that may be available to utilize NOLs before they expire. In connection with these reviews, if it is determined that a deferred tax asset is not realizable, a valuation allowance is established. The valuation allowance may be reversed in a subsequent reporting period if the Firm determines that, based on revised estimates of future taxable income or changes in tax planning strategies, it is more likely than not that all or part of the deferred tax asset will become realizable. As of
December 31, 2014
, management has determined it is more likely than not that the Firm will realize its deferred tax assets, net of the existing valuation allowance.
JPMorgan Chase does not record U.S. federal income taxes on the undistributed earnings of certain non-U.S. subsidiaries, to the extent that such earnings have been reinvested abroad for an indefinite period of time. Changes to the income tax rates applicable to these non-U.S. subsidiaries may have a material impact on the effective tax rate in a future period if such changes were to occur.
The Firm adjusts its unrecognized tax benefits as necessary when additional information becomes available. Uncertain tax positions that meet the more-likely-than-not recognition threshold are measured to determine the amount of benefit to recognize. An uncertain tax position is measured at the largest amount of benefit that management believes is more likely than not to be realized upon settlement. It is possible that the reassessment of JPMorgan Chase’s unrecognized tax benefits may have a material impact on its effective tax rate in the period in which the reassessment occurs.
For additional information on income taxes, see Note 26.
Litigation reserves
For a description of the significant estimates and judgments associated with establishing litigation reserves, see
Note 31.
|
JPMorgan Chase & Co./2014 Annual Report
|
165
|
|
Management’s discussion and analysis
|
ACCOUNTING AND REPORTING DEVELOPMENTS
|
||||
Amendments to the consolidation analysis
In February 2015, the Financial Accounting Standards Board (“FASB”) issued guidance regarding consolidation of legal entities such as limited partnerships, limited liability corporations, and securitization structures. The guidance eliminates the deferral issued by the FASB in February 2010 of the accounting guidance for VIEs for certain investment funds, including mutual funds, private equity funds and hedge funds. In addition, the guidance amends the evaluation of fees paid to a decision maker or a service provider, and exempts certain money market funds from consolidation. The guidance will be effective in the first quarter of 2016 with early adoption permitted. The Firm is currently evaluating the potential impact on the Consolidated Financial Statements.
Reclassification of residential real estate collateralized consumer mortgage loans upon foreclosure and classification of certain government-guaranteed mortgage loans upon foreclosure
In January 2014, the FASB issued guidance which clarified the timing of when a creditor is considered to have taken physical possession of residential real estate collateral for a consumer mortgage loan, resulting in the reclassification of the loan receivable to real estate owned. The final standard also requires disclosure of outstanding foreclosed residential real estate and the amount of the recorded investment in residential real estate mortgage loans in the process of foreclosure. In August 2014, the FASB issued separate guidance clarifying the classification and measurement of certain foreclosed government-guaranteed mortgage loans. Under the final standard, certain foreclosed government-insured mortgage loan amounts were reclassified on the balance sheet as a receivable from the guarantor at the guaranteed amount. The Firm early adopted both of these new standards in the third quarter of 2014 with a cumulative-effect adjustment as of January 1, 2014; the adoption of these standards (and related reclassification adjustment) had no material impact on the Firm’s Consolidated Financial Statements.
Measuring the financial assets and financial liabilities of a consolidated collateralized financing entity
In August 2014, the FASB issued guidance to address diversity in the accounting for differences in the measurement of the fair values of financial assets and liabilities of consolidated financing VIEs. The new guidance provides an alternative for consolidated financing VIEs to elect: (1) to measure their financial assets and liabilities separately under existing U.S. GAAP for fair value measurement with any differences in such fair values reflected in earnings; or (2) to measure both their financial assets and liabilities using the more observable of the fair value of the financial assets or the fair value of the financial liabilities. The guidance will become effective in the first quarter of 2016, with early adoption permitted. The
adoption of this guidance is not expected to have a material impact on the Firm’s Consolidated Financial Statements.
Repurchase agreements and similar transactions
In June 2014, the FASB issued guidance that amends the accounting for certain secured financing transactions, and requires enhanced disclosures with respect to transactions recognized as sales in which exposure to the derecognized asset is retained through a separate agreement with the counterparty. In addition, the guidance requires enhanced disclosures with respect to the types and quality of financial assets pledged in secured financing transactions. The guidance will become effective in the first quarter of 2015, except for the disclosures regarding the types and quality of financial assets pledged, which will become effective in the second quarter of 2015. The adoption of this guidance is not expected to have a material impact on the Firm’s Consolidated Financial Statements.
Revenue recognition – revenue from contracts with customers
In May 2014, the FASB issued revenue recognition guidance that is intended to create greater consistency with respect to how and when revenue from contracts with customers is shown in the statements of income. The guidance requires that revenue from contracts with customers be recognized upon delivery of a good or service based on the amount of consideration expected to be received, and requires additional disclosures about revenue. The guidance will be effective in the first quarter of 2017 and early adoption is prohibited. The Firm is currently evaluating the potential impact on the Consolidated Financial Statements.
Reporting discontinued operations and disclosures of disposals of components of an entity
In April 2014, the FASB issued guidance regarding the reporting of discontinued operations. The guidance changes the criteria for determining whether a disposition qualifies for discontinued operations presentation. It also requires enhanced disclosures about discontinued operations and significant dispositions that do not qualify to be presented as discontinued operations. The guidance will become effective in the first quarter of 2015. The adoption of this guidance is not expected to have a material impact on the Firm’s Consolidated Financial Statements.
|
166
|
JPMorgan Chase & Co./2014 Annual Report
|
|
Investments in qualified affordable housing projects
In January 2014, the FASB issued guidance regarding the accounting for investments in affordable housing projects that qualify for the low-income housing tax credit. The guidance replaces the effective yield method and allows companies to make an accounting policy election to amortize the initial cost of its investments in proportion to the tax credits and other benefits received if certain criteria are met, and to present the amortization as a component of income tax expense. The guidance will become effective in the first quarter of 2015 and is required to be applied retrospectively, such that the Firm’s results of operations for prior periods will be revised to reflect the guidance.
The Firm intends to adopt the guidance for all qualifying investments. The adoption of this guidance is estimated to reduce retained earnings by approximately $230 million. The Firm expects that reported other income and income tax expense will each increase as a result of presenting the amortization of the initial cost of its investments as component of income tax expense. The amount of this increase in each period depends on the size and characteristics of the Firm’s portfolio of affordable housing investments; the estimated increase for 2014 is approximately $900 million. The effect of this guidance on the Firm’s net income is not expected to be material.
|
JPMorgan Chase & Co./2014 Annual Report
|
167
|
|
Management’s discussion and analysis
|
NONEXCHANGE-TRADED COMMODITY DERIVATIVE CONTRACTS AT FAIR VALUE
|
||||
In the normal course of business, JPMorgan Chase trades nonexchange-traded commodity derivative contracts. To determine the fair value of these contracts, the Firm uses various fair value estimation techniques, primarily based on internal models with significant observable market parameters. The Firm’s nonexchange-traded commodity derivative contracts are primarily energy-related.
The following table summarizes the changes in fair value for nonexchange-traded commodity derivative contracts for the year ended
December 31, 2014
.
|
Year ended December 31, 2014
(in millions)
|
Asset position
|
Liability position
|
|||||
|
Net fair value of contracts outstanding at January 1, 2014
|
$
|
8,128
|
|
$
|
9,929
|
|
|
|
Effect of legally enforceable master netting agreements
|
15,082
|
|
15,318
|
|
|||
|
Gross fair value of contracts outstanding at January 1, 2014
|
23,210
|
|
25,247
|
|
|||
|
Contracts realized or otherwise settled
|
(14,451
|
)
|
(15,557
|
)
|
|||
|
Fair value of new contracts
|
13,954
|
|
15,664
|
|
|||
|
Changes in fair values attributable to changes in valuation techniques and assumptions
|
—
|
|
—
|
|
|||
|
Other changes in fair value
|
1,440
|
|
1,783
|
|
|||
|
Gross fair value of contracts outstanding at December 31, 2014
|
24,153
|
|
27,137
|
|
|||
|
Effect of legally enforceable master netting agreements
|
(14,327
|
)
|
(13,211
|
)
|
|||
|
Net fair value of contracts outstanding at December 31, 2014
|
$
|
9,826
|
|
$
|
13,926
|
|
|
The following table indicates the maturities of nonexchange-traded commodity derivative contracts at
December 31, 2014
.
|
December 31, 2014 (in millions)
|
Asset position
|
Liability position
|
|||||
|
Maturity less than 1 year
|
$
|
15,635
|
|
$
|
16,376
|
|
|
|
Maturity 1–3 years
|
6,561
|
|
8,459
|
|
|||
|
Maturity 4–5 years
|
1,230
|
|
1,790
|
|
|||
|
Maturity in excess of 5 years
|
727
|
|
512
|
|
|||
|
Gross fair value of contracts outstanding at December 31, 2014
|
24,153
|
|
27,137
|
|
|||
|
Effect of legally enforceable master netting agreements
|
(14,327
|
)
|
(13,211
|
)
|
|||
|
Net fair value of contracts outstanding at December 31, 2014
|
$
|
9,826
|
|
$
|
13,926
|
|
|
|
168
|
JPMorgan Chase & Co./2014 Annual Report
|
|
|
FORWARD-LOOKING STATEMENTS
|
||||
From time to time, the Firm has made and will make forward-looking statements. These statements can be identified by the fact that they do not relate strictly to historical or current facts. Forward-looking statements often use words such as “anticipate,” “target,” “expect,” “estimate,” “intend,” “plan,” “goal,” “believe,” or other words of similar meaning. Forward-looking statements provide JPMorgan Chase’s current expectations or forecasts of future events, circumstances, results or aspirations. JPMorgan Chase’s disclosures in this Annual Report contain forward-looking statements within the meaning of the Private Securities Litigation Reform Act of 1995. The Firm also may make forward-looking statements in its other documents filed or furnished with the Securities and Exchange Commission. In addition, the Firm’s senior management may make forward-looking statements orally to investors, analysts, representatives of the media and others.
All forward-looking statements are, by their nature, subject to risks and uncertainties, many of which are beyond the Firm’s control. JPMorgan Chase’s actual future results may differ materially from those set forth in its forward-looking statements. While there is no assurance that any list of risks and uncertainties or risk factors is complete, below are certain factors which could cause actual results to differ from those in the forward-looking statements:
|
•
|
Local, regional and international business, economic and political conditions and geopolitical events;
|
|
•
|
Changes in laws and regulatory requirements;
|
|
•
|
Changes in trade, monetary and fiscal policies and laws;
|
|
•
|
Securities and capital markets behavior, including changes in market liquidity and volatility;
|
|
•
|
Changes in investor sentiment or consumer spending or savings behavior;
|
|
•
|
Ability of the Firm to manage effectively its capital and liquidity, including approval of its capital plans by banking regulators;
|
|
•
|
Changes in credit ratings assigned to the Firm or its subsidiaries;
|
|
•
|
Damage to the Firm’s reputation;
|
|
•
|
Ability of the Firm to deal effectively with an economic slowdown or other economic or market disruption;
|
|
•
|
Technology changes instituted by the Firm, its counterparties or competitors;
|
|
•
|
The success of the Firm’s business simplification initiatives and the effectiveness of its control agenda;
|
|
•
|
Ability of the Firm to develop new products and services, and the extent to which products or services previously sold by the Firm (including but not limited to mortgages and asset-backed securities) require the Firm to incur liabilities or absorb losses not contemplated at their initiation or origination;
|
|
•
|
Ability of the Firm to address enhanced regulatory requirements affecting its consumer businesses;
|
|
•
|
Acceptance of the Firm’s new and existing products and services by the marketplace and the ability of the Firm to increase market share;
|
|
•
|
Ability of the Firm to attract and retain qualified employees;
|
|
•
|
Ability of the Firm to control expense;
|
|
•
|
Competitive pressures;
|
|
•
|
Changes in the credit quality of the Firm’s customers and counterparties;
|
|
•
|
Adequacy of the Firm’s risk management framework, disclosure controls and procedures and internal control over financial reporting;
|
|
•
|
Adverse judicial or regulatory proceedings;
|
|
•
|
Changes in applicable accounting policies;
|
|
•
|
Ability of the Firm to determine accurate values of certain assets and liabilities;
|
|
•
|
Occurrence of natural or man-made disasters or calamities or conflicts;
|
|
•
|
Ability of the Firm to maintain the security of its financial, accounting, technology, data processing and other operating systems and facilities;
|
|
•
|
The other risks and uncertainties detailed in Part I, Item 1A: Risk Factors in the Firm’s Annual Report on Form 10-K for the year ended
December 31, 2014
.
|
Any forward-looking statements made by or on behalf of the Firm speak only as of the date they are made, and JPMorgan Chase does not undertake to update forward-looking statements to reflect the impact of circumstances or events that arise after the date the forward-looking statements were made. The reader should, however, consult any further disclosures of a forward-looking nature the Firm may make in any subsequent Annual Reports on Form 10-K, Quarterly Reports on Form 10-Q, or Current Reports on Form 8-K.
|
JPMorgan Chase & Co./2014 Annual Report
|
169
|
|
Management’s report on internal control over financial reporting
Management of JPMorgan Chase & Co. (“
JPMorgan Chase
” or the “Firm”) is responsible for establishing and maintaining adequate internal control over financial reporting. Internal control over financial reporting is a process designed by, or under the supervision of, the Firm’s principal executive and principal financial officers, or persons performing similar functions, and effected by
JPMorgan Chase
’s Board of Directors, management and other personnel, to provide reasonable assurance regarding the reliability of financial reporting and the preparation of financial statements for external purposes in accordance with accounting principles generally accepted in the United States of America.
JPMorgan Chase
’s internal control over financial reporting includes those policies and procedures that (1) pertain to the maintenance of records, that, in reasonable detail, accurately and fairly reflect the transactions and dispositions of the Firm’s assets; (2) provide reasonable assurance that transactions are recorded as necessary to permit preparation of financial statements in accordance with generally accepted accounting principles, and that receipts and expenditures of the Firm are being made only in accordance with authorizations of
JPMorgan Chase
’s management and directors; and (3) provide reasonable assurance regarding prevention or timely detection of unauthorized acquisition, use or disposition of the Firm’s assets that could have a material effect on the financial statements.
Because of its inherent limitations, internal control over financial reporting may not prevent or detect misstatements. Also, projections of any evaluation of effectiveness to future periods are subject to the risk that controls may become inadequate because of changes in conditions, or that the degree of compliance with the policies or procedures may deteriorate. Management has completed an assessment of the effectiveness of the Firm’s internal control over financial reporting as of
December 31, 2014
. In making the assessment, management used the framework in “Internal Control - Integrated Framework (2013)” promulgated by the Committee of Sponsoring Organizations of the Treadway Commission, commonly referred to as the “COSO” criteria.
Based upon the assessment performed, management concluded that as of
December 31, 2014
,
JPMorgan Chase
’s internal control over financial reporting was effective based upon the COSO 2013 criteria. Additionally, based upon management’s assessment, the Firm determined that there were no material weaknesses in its internal control over financial reporting as of
December 31, 2014
.
The effectiveness of the Firm’s internal control over financial reporting as of
December 31, 2014
, has been audited by PricewaterhouseCoopers LLP, an independent registered public accounting firm, as stated in their report which appears herein.

James Dimon
Chairman and Chief Executive Officer

Marianne Lake
Executive Vice President and Chief Financial Officer
February 24, 2015
|
170
|
JPMorgan Chase & Co./2014 Annual Report
|
|
Report of independent registered public accounting firm

To the Board of Directors and Stockholders of JPMorgan Chase & Co.:
In our opinion, the accompanying consolidated balance sheets and the related consolidated statements of income, comprehensive income, changes in stockholders’ equity and cash flows present fairly, in all material respects, the financial position of JPMorgan Chase & Co. and its subsidiaries (the “Firm”)
at
December 31, 2014
and 2013 and the results of their operations and their cash flows for each of the three years in the period ended
December 31, 2014
in conformity with accounting principles generally accepted in the United States of America. Also in our opinion, the Firm maintained, in all material respects, effective internal control over financial reporting as of
December 31, 2014
based on criteria established in
Internal Control - Integrated Framework (2013)
issued by the Committee of Sponsoring Organizations of the Treadway Commission (COSO). The Firm’s management is responsible for these financial statements, for maintaining effective internal control over financial reporting and for its assessment of the effectiveness of internal control over financial reporting, included in the accompanying “Management’s report on internal control over financial reporting”. Our responsibility is to express opinions on these financial statements and on the Firm’s internal control over financial reporting based on our integrated audits. We conducted our audits in accordance with the standards of the Public Company Accounting Oversight Board (United States). Those standards require that we plan and perform the audits to obtain reasonable assurance about whether the financial statements are free of material misstatement and whether effective internal control over financial reporting was maintained in all material respects. Our audits of the financial statements included examining, on a test basis, evidence supporting the amounts and disclosures in the financial statements, assessing the accounting principles used and significant estimates made by management, and evaluating the overall financial statement presentation. Our audit of internal control over financial reporting included obtaining an understanding of internal control over financial reporting, assessing the risk that a material weakness exists, and testing and evaluating the
design and operating effectiveness of internal control based on the assessed risk. Our audits also included performing such other procedures as we considered necessary in the circumstances. We believe that our audits provide a reasonable basis for our opinions.
A company’s internal control over financial reporting is a process designed to provide reasonable assurance regarding the reliability of financial reporting and the preparation of financial statements for external purposes in accordance with generally accepted accounting principles. A company’s internal control over financial reporting includes those policies and procedures that (i) pertain to the maintenance of records that, in reasonable detail, accurately and fairly reflect the transactions and dispositions of the assets of the company; (ii) provide reasonable assurance that transactions are recorded as necessary to permit preparation of financial statements in accordance with generally accepted accounting principles, and that receipts and expenditures of the company are being made only in accordance with authorizations of management and directors of the company; and (iii) provide reasonable assurance regarding prevention or timely detection of unauthorized acquisition, use, or disposition of the company’s assets that could have a material effect on the financial statements.
Because of its inherent limitations, internal control over financial reporting may not prevent or detect misstatements. Also, projections of any evaluation of effectiveness to future periods are subject to the risk that controls may become inadequate because of changes in conditions, or that the degree of compliance with the policies or procedures may deteriorate.

February 24, 2015
|
PricewaterhouseCoopers LLP
Ÿ
300 Madison Avenue
Ÿ
New York, NY 10017
|
|
JPMorgan Chase & Co./2014 Annual Report
|
171
|
|
|
Year ended December 31, (in millions, except per share data)
|
2014
|
|
2013
|
|
2012
|
|
||||||
|
Revenue
|
||||||||||||
|
Investment banking fees
|
$
|
6,542
|
|
$
|
6,354
|
|
$
|
5,808
|
|
|||
|
Principal transactions
|
10,531
|
|
10,141
|
|
5,536
|
|
||||||
|
Lending- and deposit-related fees
|
5,801
|
|
5,945
|
|
6,196
|
|
||||||
|
Asset management, administration and commissions
|
15,931
|
|
15,106
|
|
13,868
|
|
||||||
|
Securities gains
(a)
|
77
|
|
667
|
|
2,110
|
|
||||||
|
Mortgage fees and related income
|
3,563
|
|
5,205
|
|
8,687
|
|
||||||
|
Card income
|
6,020
|
|
6,022
|
|
5,658
|
|
||||||
|
Other income
|
2,106
|
|
3,847
|
|
4,258
|
|
||||||
|
Noninterest revenue
|
50,571
|
|
53,287
|
|
52,121
|
|
||||||
|
Interest income
|
51,531
|
|
52,669
|
|
55,953
|
|
||||||
|
Interest expense
|
7,897
|
|
9,350
|
|
11,043
|
|
||||||
|
Net interest income
|
43,634
|
|
43,319
|
|
44,910
|
|
||||||
|
Total net revenue
|
94,205
|
|
96,606
|
|
97,031
|
|
||||||
|
Provision for credit losses
|
3,139
|
|
225
|
|
3,385
|
|
||||||
|
Noninterest expense
|
||||||||||||
|
Compensation expense
|
30,160
|
|
30,810
|
|
30,585
|
|
||||||
|
Occupancy expense
|
3,909
|
|
3,693
|
|
3,925
|
|
||||||
|
Technology, communications and equipment expense
|
5,804
|
|
5,425
|
|
5,224
|
|
||||||
|
Professional and outside services
|
7,705
|
|
7,641
|
|
7,429
|
|
||||||
|
Marketing
|
2,550
|
|
2,500
|
|
2,577
|
|
||||||
|
Other expense
|
11,146
|
|
20,398
|
|
14,989
|
|
||||||
|
Total noninterest expense
|
61,274
|
|
70,467
|
|
64,729
|
|
||||||
|
Income before income tax expense
|
29,792
|
|
25,914
|
|
28,917
|
|
||||||
|
Income tax expense
|
8,030
|
|
7,991
|
|
7,633
|
|
||||||
|
Net income
|
$
|
21,762
|
|
$
|
17,923
|
|
$
|
21,284
|
|
|||
|
Net income applicable to common stockholders
|
$
|
20,093
|
|
$
|
16,593
|
|
$
|
19,877
|
|
|||
|
Net income per common share data
|
||||||||||||
|
Basic earnings per share
|
$
|
5.34
|
|
$
|
4.39
|
|
$
|
5.22
|
|
|||
|
Diluted earnings per share
|
5.29
|
|
4.35
|
|
5.20
|
|
||||||
|
Weighted-average basic shares
|
3,763.5
|
|
3,782.4
|
|
3,809.4
|
|
||||||
|
Weighted-average diluted shares
|
3,797.5
|
|
3,814.9
|
|
3,822.2
|
|
||||||
|
Cash dividends declared per common share
|
$
|
1.58
|
|
$
|
1.44
|
|
$
|
1.20
|
|
|||
|
(a)
|
The following other-than-temporary impairment losses are included in securities gains for the periods presented
.
|
|
Year ended December 31, (in millions)
|
2014
|
|
2013
|
|
2012
|
|
||||||
|
Debt securities the Firm does not intend to sell that have credit losses
|
||||||||||||
|
Total other-than-temporary impairment losses
|
$
|
(2
|
)
|
$
|
(1
|
)
|
$
|
(113
|
)
|
|||
|
Losses recorded in/(reclassified from) accumulated other comprehensive income
|
—
|
|
—
|
|
85
|
|
||||||
|
Total credit losses recognized in income
|
(2
|
)
|
(1
|
)
|
(28
|
)
|
||||||
|
Securities the Firm intends to sell
|
(2
|
)
|
(20
|
)
|
(15
|
)
|
||||||
|
Total other-than-temporary impairment losses recognized in income
|
$
|
(4
|
)
|
$
|
(21
|
)
|
$
|
(43
|
)
|
|||
The Notes to Consolidated Financial Statements are an integral part of these statements.
|
172
|
JPMorgan Chase & Co./2014 Annual Report
|
|
Consolidated statements of comprehensive income
|
Year ended December 31, (in millions)
|
2014
|
|
2013
|
|
2012
|
|
||||||
|
Net income
|
$
|
21,762
|
|
$
|
17,923
|
|
$
|
21,284
|
|
|||
|
Other comprehensive income/(loss), after–tax
|
||||||||||||
|
Unrealized gains/(losses) on investment securities
|
1,975
|
|
(4,070
|
)
|
3,303
|
|
||||||
|
Translation adjustments, net of hedges
|
(11
|
)
|
(41
|
)
|
(69
|
)
|
||||||
|
Cash flow hedges
|
44
|
|
(259
|
)
|
69
|
|
||||||
|
Defined benefit pension and OPEB plans
|
(1,018
|
)
|
1,467
|
|
(145
|
)
|
||||||
|
Total other comprehensive income/(loss), after–tax
|
990
|
|
(2,903
|
)
|
3,158
|
|
||||||
|
Comprehensive income
|
$
|
22,752
|
|
$
|
15,020
|
|
$
|
24,442
|
|
|||
The Notes to Consolidated Financial Statements are an integral part of these statements.
|
JPMorgan Chase & Co./2014 Annual Report
|
173
|
|
Consolidated balance sheets
|
December 31, (in millions, except share data)
|
2014
|
2013
|
|||||
|
Assets
|
|||||||
|
Cash and due from banks
|
$
|
27,831
|
|
$
|
39,771
|
|
|
|
Deposits with banks
|
484,477
|
|
316,051
|
|
|||
|
Federal funds sold and securities purchased under resale agreements (included
$28,585
and $25,135 at fair value)
|
215,803
|
|
248,116
|
|
|||
|
Securities borrowed (included
$992
and $3,739 at fair value)
|
110,435
|
|
111,465
|
|
|||
|
Trading assets (included assets pledged of
$125,034
and $116,499)
|
398,988
|
|
374,664
|
|
|||
|
Securities (included
$298,752
and $329,977 at fair value and assets pledged of
$24,912
and $23,446)
|
348,004
|
|
354,003
|
|
|||
|
Loans (included
$2,611
and $2,011 at fair value)
|
757,336
|
|
738,418
|
|
|||
|
Allowance for loan losses
|
(14,185
|
)
|
(16,264
|
)
|
|||
|
Loans, net of allowance for loan losses
|
743,151
|
|
722,154
|
|
|||
|
Accrued interest and accounts receivable
|
70,079
|
|
65,160
|
|
|||
|
Premises and equipment
|
15,133
|
|
14,891
|
|
|||
|
Goodwill
|
47,647
|
|
48,081
|
|
|||
|
Mortgage servicing rights
|
7,436
|
|
9,614
|
|
|||
|
Other intangible assets
|
1,192
|
|
1,618
|
|
|||
|
Other assets (included
$12,366
and $15,187 at fair value and assets pledged of
$1,396
and $2,066)
|
102,950
|
|
110,101
|
|
|||
|
Total assets
(a)
|
$
|
2,573,126
|
|
$
|
2,415,689
|
|
|
|
Liabilities
|
|||||||
|
Deposits (included
$8,807
and $6,624 at fair value)
|
$
|
1,363,427
|
|
$
|
1,287,765
|
|
|
|
Federal funds purchased and securities loaned or sold under repurchase agreements (included
$2,979
and $5,426 at fair value)
|
192,101
|
|
181,163
|
|
|||
|
Commercial paper
|
66,344
|
|
57,848
|
|
|||
|
Other borrowed funds (included
$14,739
and $13,306 at fair value)
|
30,222
|
|
27,994
|
|
|||
|
Trading liabilities
|
152,815
|
|
137,744
|
|
|||
|
Accounts payable and other liabilities (included
$36
and $25 at fair value)
|
206,954
|
|
194,491
|
|
|||
|
Beneficial interests issued by consolidated variable interest entities (included
$2,162
and $1,996 at fair value)
|
52,362
|
|
49,617
|
|
|||
|
Long-term debt (included
$30,226
and $28,878 at fair value)
|
276,836
|
|
267,889
|
|
|||
|
Total liabilities
(a)
|
2,341,061
|
|
2,204,511
|
|
|||
|
Commitments and contingencies (see Notes 29, 30 and 31)
|
|
|
|
|
|||
|
Stockholders’ equity
|
|||||||
|
Preferred stock ($1 par value; authorized
200,000,000 shares: issued
2,006,250
and 1,115,750 shares)
|
20,063
|
|
11,158
|
|
|||
|
Common stock ($1 par value; authorized 9,000,000,000 shares; issued
4,104,933,895
shares)
|
4,105
|
|
4,105
|
|
|||
|
Additional paid-in capital
|
93,270
|
|
93,828
|
|
|||
|
Retained earnings
|
130,315
|
|
115,756
|
|
|||
|
Accumulated other comprehensive income
|
2,189
|
|
1,199
|
|
|||
|
Shares held in RSU trust, at cost (
472,953
and 476,642 shares)
|
(21
|
)
|
(21
|
)
|
|||
|
Treasury stock, at cost (
390,144,630
and 348,825,583 shares)
|
(17,856
|
)
|
(14,847
|
)
|
|||
|
Total stockholders’ equity
|
232,065
|
|
211,178
|
|
|||
|
Total liabilities and stockholders’ equity
|
$
|
2,573,126
|
|
$
|
2,415,689
|
|
|
|
(a)
|
The following table presents information on assets and liabilities related to VIEs that are consolidated by the Firm at
December 31, 2014
and
2013
. The difference between total VIE assets and liabilities represents the Firm’s interests in those entities, which were eliminated in consolidation.
|
|
December 31, (in millions)
|
2014
|
2013
|
|||||
|
Assets
|
|||||||
|
Trading assets
|
$
|
9,090
|
|
$
|
6,366
|
|
|
|
Loans
|
68,880
|
|
70,072
|
|
|||
|
All other assets
|
1,815
|
|
2,168
|
|
|||
|
Total assets
|
$
|
79,785
|
|
$
|
78,606
|
|
|
|
Liabilities
|
|||||||
|
Beneficial interests issued by consolidated variable interest entities
|
$
|
52,362
|
|
$
|
49,617
|
|
|
|
All other liabilities
|
949
|
|
1,061
|
|
|||
|
Total liabilities
|
$
|
53,311
|
|
$
|
50,678
|
|
|
The assets of the consolidated VIEs are used to settle the liabilities of those entities. The holders of the beneficial interests do not have recourse to the general credit of JPMorgan Chase. At
December 31, 2014
and
2013
, the Firm provided limited program-wide credit enhancement of
$2.0 billion
and
$2.6 billion
, respectively, related to its Firm-administered multi-seller conduits, which are eliminated in consolidation. For further discussion, see Note 16.
The Notes to Consolidated Financial Statements are an integral part of these statements.
|
174
|
JPMorgan Chase & Co./2014 Annual Report
|
|
Consolidated statements of changes in stockholders’ equity
|
Year ended December 31, (in millions, except per share data)
|
2014
|
2013
|
2012
|
|||||||||
|
Preferred stock
|
||||||||||||
|
Balance at January 1
|
$
|
11,158
|
|
$
|
9,058
|
|
$
|
7,800
|
|
|||
|
Issuance of preferred stock
|
8,905
|
|
3,900
|
|
1,258
|
|
||||||
|
Redemption of preferred stock
|
—
|
|
(1,800
|
)
|
—
|
|
||||||
|
Balance at December 31
|
20,063
|
|
11,158
|
|
9,058
|
|
||||||
|
Common stock
|
||||||||||||
|
Balance at January 1 and December 31
|
4,105
|
|
4,105
|
|
4,105
|
|
||||||
|
Additional paid-in capital
|
||||||||||||
|
Balance at January 1
|
93,828
|
|
94,604
|
|
95,602
|
|
||||||
|
Shares issued and commitments to issue common stock for employee stock-based compensation awards, and related tax effects
|
(508
|
)
|
(752
|
)
|
(736
|
)
|
||||||
|
Other
|
(50
|
)
|
(24
|
)
|
(262
|
)
|
||||||
|
Balance at December 31
|
93,270
|
|
93,828
|
|
94,604
|
|
||||||
|
Retained earnings
|
||||||||||||
|
Balance at January 1
|
115,756
|
|
104,223
|
|
88,315
|
|
||||||
|
Net income
|
21,762
|
|
17,923
|
|
21,284
|
|
||||||
|
Dividends declared:
|
||||||||||||
|
Preferred stock
|
(1,125
|
)
|
(805
|
)
|
(647
|
)
|
||||||
|
Common stock (
$1.58
, $1.44 and $1.20 per share for 2014, 2013 and 2012, respectively)
|
(6,078
|
)
|
(5,585
|
)
|
(4,729
|
)
|
||||||
|
Balance at December 31
|
130,315
|
|
115,756
|
|
104,223
|
|
||||||
|
Accumulated other comprehensive income/(loss)
|
||||||||||||
|
Balance at January 1
|
1,199
|
|
4,102
|
|
944
|
|
||||||
|
Other comprehensive income/(loss)
|
990
|
|
(2,903
|
)
|
3,158
|
|
||||||
|
Balance at December 31
|
2,189
|
|
1,199
|
|
4,102
|
|
||||||
|
Shares held in RSU Trust, at cost
|
||||||||||||
|
Balance at January 1
|
(21
|
)
|
(21
|
)
|
(38
|
)
|
||||||
|
Reissuance from RSU Trust
|
—
|
|
—
|
|
17
|
|
||||||
|
Balance at December 31
|
(21
|
)
|
(21
|
)
|
(21
|
)
|
||||||
|
Treasury stock, at cost
|
||||||||||||
|
Balance at January 1
|
(14,847
|
)
|
(12,002
|
)
|
(13,155
|
)
|
||||||
|
Purchase of treasury stock
|
(4,760
|
)
|
(4,789
|
)
|
(1,415
|
)
|
||||||
|
Reissuance from treasury stock
|
1,751
|
|
1,944
|
|
2,574
|
|
||||||
|
Share repurchases related to employee stock-based compensation awards
|
—
|
|
—
|
|
(6
|
)
|
||||||
|
Balance at December 31
|
(17,856
|
)
|
(14,847
|
)
|
(12,002
|
)
|
||||||
|
Total stockholders
’
equity
|
$
|
232,065
|
|
$
|
211,178
|
|
$
|
204,069
|
|
|||
The Notes to Consolidated Financial Statements are an integral part of these statements.
|
JPMorgan Chase & Co./2014 Annual Report
|
175
|
|
|
Year ended December 31, (in millions)
|
2014
|
2013
|
2012
|
||||||||
|
Operating activities
|
|||||||||||
|
Net income
|
$
|
21,762
|
|
$
|
17,923
|
|
$
|
21,284
|
|
||
|
Adjustments to reconcile net income to net cash provided by/(used in) operating activities:
|
|||||||||||
|
Provision for credit losses
|
3,139
|
|
225
|
|
3,385
|
|
|||||
|
Depreciation and amortization
|
4,759
|
|
5,306
|
|
5,147
|
|
|||||
|
Deferred tax expense
|
4,210
|
|
8,003
|
|
1,130
|
|
|||||
|
Investment securities gains
|
(77
|
)
|
(667
|
)
|
(2,110
|
)
|
|||||
|
Stock-based compensation
|
2,190
|
|
2,219
|
|
2,545
|
|
|||||
|
Originations and purchases of loans held-for-sale
|
(67,525
|
)
|
(75,928
|
)
|
(34,026
|
)
|
|||||
|
Proceeds from sales, securitizations and paydowns of loans held-for-sale
|
71,407
|
|
73,566
|
|
33,202
|
|
|||||
|
Net change in:
|
|||||||||||
|
Trading assets
|
(24,814
|
)
|
89,110
|
|
(5,379
|
)
|
|||||
|
Securities borrowed
|
1,020
|
|
7,562
|
|
23,455
|
|
|||||
|
Accrued interest and accounts receivable
|
(3,637
|
)
|
(2,340
|
)
|
1,732
|
|
|||||
|
Other assets
|
(9,166
|
)
|
526
|
|
(4,683
|
)
|
|||||
|
Trading liabilities
|
26,818
|
|
(9,772
|
)
|
(3,921
|
)
|
|||||
|
Accounts payable and other liabilities
|
6,065
|
|
(5,743
|
)
|
(13,069
|
)
|
|||||
|
Other operating adjustments
|
442
|
|
(2,037
|
)
|
(3,613
|
)
|
|||||
|
Net cash provided by operating activities
|
36,593
|
|
107,953
|
|
25,079
|
|
|||||
|
Investing activities
|
|||||||||||
|
Net change in:
|
|||||||||||
|
Deposits with banks
|
(168,426
|
)
|
(194,363
|
)
|
(36,595
|
)
|
|||||
|
Federal funds sold and securities purchased under resale agreements
|
30,848
|
|
47,726
|
|
(60,821
|
)
|
|||||
|
Held-to-maturity securities:
|
|||||||||||
|
Proceeds from paydowns and maturities
|
4,169
|
|
189
|
|
4
|
|
|||||
|
Purchases
|
(10,345
|
)
|
(24,214
|
)
|
—
|
|
|||||
|
Available-for-sale securities:
|
|||||||||||
|
Proceeds from paydowns and maturities
|
90,664
|
|
89,631
|
|
112,633
|
|
|||||
|
Proceeds from sales
|
38,411
|
|
73,312
|
|
81,957
|
|
|||||
|
Purchases
|
(121,504
|
)
|
(130,266
|
)
|
(189,630
|
)
|
|||||
|
Proceeds from sales and securitizations of loans held-for-investment
|
20,115
|
|
12,033
|
|
6,430
|
|
|||||
|
Other changes in loans, net
|
(51,749
|
)
|
(23,721
|
)
|
(30,491
|
)
|
|||||
|
Net cash received from/(used in) business acquisitions or dispositions
|
843
|
|
(149
|
)
|
88
|
|
|||||
|
All other investing activities, net
|
1,338
|
|
(679
|
)
|
(3,400
|
)
|
|||||
|
Net cash used in investing activities
|
(165,636
|
)
|
(150,501
|
)
|
(119,825
|
)
|
|||||
|
Financing activities
|
|||||||||||
|
Net change in:
|
|||||||||||
|
Deposits
|
89,346
|
|
81,476
|
|
67,250
|
|
|||||
|
Federal funds purchased and securities loaned or sold under repurchase agreements
|
10,905
|
|
(58,867
|
)
|
26,546
|
|
|||||
|
Commercial paper and other borrowed funds
|
9,242
|
|
2,784
|
|
9,315
|
|
|||||
|
Beneficial interests issued by consolidated variable interest entities
|
(834
|
)
|
(10,433
|
)
|
345
|
|
|||||
|
Proceeds from long-term borrowings
|
78,515
|
|
83,546
|
|
86,271
|
|
|||||
|
Payments of long-term borrowings
|
(65,275
|
)
|
(60,497
|
)
|
(96,473
|
)
|
|||||
|
Excess tax benefits related to stock-based compensation
|
407
|
|
137
|
|
255
|
|
|||||
|
Proceeds from issuance of preferred stock
|
8,847
|
|
3,873
|
|
1,234
|
|
|||||
|
Redemption of preferred stock
|
—
|
|
(1,800
|
)
|
—
|
|
|||||
|
Treasury stock and warrants repurchased
|
(4,760
|
)
|
(4,789
|
)
|
(1,653
|
)
|
|||||
|
Dividends paid
|
(6,990
|
)
|
(6,056
|
)
|
(5,194
|
)
|
|||||
|
All other financing activities, net
|
(1,175
|
)
|
(1,050
|
)
|
(189
|
)
|
|||||
|
Net cash provided by financing activities
|
118,228
|
|
28,324
|
|
87,707
|
|
|||||
|
Effect of exchange rate changes on cash and due from banks
|
(1,125
|
)
|
272
|
|
1,160
|
|
|||||
|
Net decrease in cash and due from banks
|
(11,940
|
)
|
(13,952
|
)
|
(5,879
|
)
|
|||||
|
Cash and due from banks at the beginning of the period
|
39,771
|
|
53,723
|
|
59,602
|
|
|||||
|
Cash and due from banks at the end of the period
|
$
|
27,831
|
|
$
|
39,771
|
|
$
|
53,723
|
|
||
|
Cash interest paid
|
$
|
8,194
|
|
$
|
9,573
|
|
$
|
11,161
|
|
||
|
Cash income taxes paid, net
|
1,392
|
|
3,502
|
|
2,050
|
|
|||||
The Notes to Consolidated Financial Statements are an integral part of these statements.
|
176
|
JPMorgan Chase & Co./2014 Annual Report
|
|
Notes to consolidated financial statements
JPMorgan Chase & Co. (“
JPMorgan Chase
” or the “Firm”), a financial holding company incorporated under Delaware law in 1968, is a leading global financial services firm and one of the largest banking institutions in the United States of America (“U.S.”), with operations worldwide. The Firm is a leader in investment banking, financial services for consumers and small business, commercial banking, financial transaction processing and asset management. For a discussion of the Firm’s business segments, see Note 33.
The accounting and financial reporting policies of
JPMorgan Chase
and its subsidiaries conform to accounting principles generally accepted in the U.S. (“U.S. GAAP”). Additionally, where applicable, the policies conform to the accounting and reporting guidelines prescribed by regulatory authorities.
Certain amounts reported in prior periods have been reclassified to conform with the current presentation.
Consolidation
The Consolidated Financial Statements include the accounts of JPMorgan Chase and other entities in which the Firm has a controlling financial interest. All material intercompany balances and transactions have been eliminated.
Assets held for clients in an agency or fiduciary capacity by the Firm are not assets of JPMorgan Chase and are not included on the Consolidated balance sheets.
The Firm determines whether it has a controlling financial interest in an entity by first evaluating whether the entity is a voting interest entity or a variable interest entity (“VIE”).
Voting Interest Entities
Voting interest entities are entities that have sufficient equity and provide the equity investors voting rights that enable them to make significant decisions relating to the entity’s operations. For these types of entities, the Firm’s determination of whether it has a controlling interest is primarily based on the amount of voting equity interests held. Entities in which the Firm has a controlling financial interest, through ownership of the majority of the entities’ voting equity interests, or through other contractual rights that give the Firm control, are consolidated by the Firm.
Investments in companies in which the Firm has significant influence over operating and financing decisions (but does not own a majority of the voting equity interests) are accounted for (i) in accordance with the equity method of accounting (which requires the Firm to recognize its proportionate share of the entity’s net earnings), or (ii) at fair value if the fair value option was elected. These investments are generally included in other assets, with income or loss included in other income.
Certain Firm-sponsored asset management funds are structured as limited partnerships or limited liability companies. For many of these entities, the Firm is the general partner or managing member, but the non-affiliated
partners or members have the ability to remove the Firm as the general partner or managing member without cause (i.e., kick-out rights), based on a simple majority vote, or the non-affiliated partners or members have rights to participate in important decisions. Accordingly, the Firm does not consolidate these funds. In the limited cases where the nonaffiliated partners or members do not have substantive kick-out or participating rights, the Firm consolidates the funds.
The Firm’s investment companies have investments in both publicly-held and privately-held entities, including investments in buyouts, growth equity and venture opportunities. These investments are accounted for under investment company guidelines and accordingly, irrespective of the percentage of equity ownership interests held, are carried on the Consolidated balance sheets at fair value, and are recorded in other assets.
Variable Interest Entities
VIEs are entities that, by design, either (1) lack sufficient equity to permit the entity to finance its activities without additional subordinated financial support from other parties, or (2) have equity investors that do not have the ability to make significant decisions relating to the entity’s operations through voting rights, or do not have the obligation to absorb the expected losses, or do not have the right to receive the residual returns of the entity.
The most common type of VIE is a special purpose entity (“SPE”). SPEs are commonly used in securitization transactions in order to isolate certain assets and distribute the cash flows from those assets to investors. The basic SPE structure involves a company selling assets to the SPE; the SPE funds the purchase of those assets by issuing securities to investors. The legal documents that govern the transaction specify how the cash earned on the assets must be allocated to the SPE’s investors and other parties that have rights to those cash flows. SPEs are generally structured to insulate investors from claims on the SPE’s assets by creditors of other entities, including the creditors of the seller of the assets.
The primary beneficiary of a VIE (i.e., the party that has a controlling financial interest) is required to consolidate the assets and liabilities of the VIE. The primary beneficiary is the party that has both (1) the power to direct the activities of the VIE that most significantly impact the VIE’s economic performance; and (2) through its interests in the VIE, the obligation to absorb losses or the right to receive benefits from the VIE that could potentially be significant to the VIE.
To assess whether the Firm has the power to direct the activities of a VIE that most significantly impact the VIE’s economic performance, the Firm considers all the facts and circumstances, including its role in establishing the VIE and its ongoing rights and responsibilities. This assessment includes, first, identifying the activities that most significantly impact the VIE’s economic performance; and second, identifying which party, if any, has power over those activities. In general, the parties that make the most
|
JPMorgan Chase & Co./2014 Annual Report
|
177
|
|
Notes to consolidated financial statements
significant decisions affecting the VIE (such as asset managers, collateral managers, servicers, or owners of call options or liquidation rights over the VIE’s assets) or have the right to unilaterally remove those decision-makers are deemed to have the power to direct the activities of a VIE.
To assess whether the Firm has the obligation to absorb losses of the VIE or the right to receive benefits from the VIE that could potentially be significant to the VIE, the Firm considers all of its economic interests, including debt and equity investments, servicing fees, and derivative or other arrangements deemed to be variable interests in the VIE. This assessment requires that the Firm apply judgment in determining whether these interests, in the aggregate, are considered potentially significant to the VIE. Factors considered in assessing significance include: the design of the VIE, including its capitalization structure; subordination of interests; payment priority; relative share of interests held across various classes within the VIE’s capital structure; and the reasons why the interests are held by the Firm.
The Firm performs on-going reassessments of: (1) whether entities previously evaluated under the majority voting-interest framework have become VIEs, based on certain events, and therefore subject to the VIE consolidation framework; and (2) whether changes in the facts and circumstances regarding the Firm’s involvement with a VIE cause the Firm’s consolidation conclusion to change.
In February 2010, the Financial Accounting Standards Board (“FASB”) issued an amendment which deferred the requirements of the accounting guidance for VIEs for certain investment funds, including mutual funds, private equity funds and hedge funds. For the funds to which the deferral applies, the Firm continues to apply other existing authoritative accounting guidance to determine whether such funds should be consolidated.
Use of estimates in the preparation of consolidated financial statements
The preparation of the Consolidated Financial Statements requires management to make estimates and assumptions that affect the reported amounts of assets and liabilities, revenue and expense, and disclosures of contingent assets and liabilities. Actual results could be different from these estimates.
Foreign currency translation
JPMorgan Chase revalues assets, liabilities, revenue and expense denominated in non-U.S. currencies into U.S. dollars using applicable exchange rates.
Gains and losses relating to translating functional currency financial statements for U.S. reporting are included in other comprehensive income/(loss) (“OCI”) within stockholders’ equity. Gains and losses relating to nonfunctional currency transactions, including non-U.S. operations where the functional currency is the U.S. dollar, are reported in the Consolidated statements of income.
Offsetting assets and liabilities
U.S. GAAP permits entities to present derivative receivables and derivative payables with the same counterparty and the related cash collateral receivables and payables on a net basis on the balance sheet when a legally enforceable master netting agreement exists. U.S. GAAP also permits securities sold and purchased under repurchase agreements to be presented net when specified conditions are met, including the existence of a legally enforceable master netting agreement. The Firm has elected to net such balances when the specified conditions are met.
The Firm uses master netting agreements to mitigate counterparty credit risk in certain transactions, including derivatives transactions, repurchase and reverse repurchase agreements, and securities borrowed and loaned agreements. A master netting agreement is a single contract with a counterparty that permits multiple transactions governed by that contract to be terminated and settled through a single payment in a single currency in the event of a default (e.g., bankruptcy, failure to make a required payment or securities transfer or deliver collateral or margin when due after expiration of any grace period). Upon the exercise of termination rights by the non-defaulting party (i) all transactions are terminated, (ii) all transactions are valued and the positive value or “in the money” transactions are netted against the negative value or “out of the money” transactions and (iii) the only remaining payment obligation is of one of the parties to pay the netted termination amount. Upon exercise of repurchase agreement and securities loaned default rights (i) all securities loan transactions are terminated and accelerated, (ii) all values of securities or cash held or to be delivered are calculated, and all such sums are netted against each other and (iii) the only remaining payment obligation is of one of the parties to pay the netted termination amount.
|
178
|
JPMorgan Chase & Co./2014 Annual Report
|
|
Typical master netting agreements for these types of transactions also often contain a collateral/margin agreement that provides for a security interest in, or title transfer of, securities or cash collateral/margin to the party that has the right to demand margin (the “demanding party”). The collateral/margin agreement typically requires a party to transfer collateral/margin to the demanding party with a value equal to the amount of the margin deficit on a net basis across all transactions governed by the master netting agreement, less any threshold. The collateral/margin agreement grants to the demanding party, upon default by the counterparty, the right to set-off any amounts payable by the counterparty against any posted collateral or the cash equivalent of any posted collateral/margin. It also grants to the demanding party the right to liquidate collateral/margin and to apply the proceeds to an amount payable by the counterparty.
For further discussion of the Firm’s derivative instruments, see Note 6. For further discussion of the Firm’s repurchase and reverse repurchase agreements, and securities borrowing and lending agreements, see Note 13.
Statements of cash flows
For JPMorgan Chase’s Consolidated statements of cash flows, cash is defined as those amounts included in cash and due from banks.
Significant accounting policies
The following table identifies JPMorgan Chase’s other significant accounting policies and the Note and page where a detailed description of each policy can be found.
|
Fair value measurement
|
Note 3
|
Page 180
|
|
|
Fair value option
|
Note 4
|
Page 199
|
|
|
Derivative instruments
|
Note 6
|
Page 203
|
|
|
Noninterest revenue
|
Note 7
|
Page 216
|
|
|
Interest income and interest expense
|
Note 8
|
Page 218
|
|
|
Pension and other postretirement employee benefit plans
|
Note 9
|
Page 218
|
|
|
Employee stock-based incentives
|
Note 10
|
Page 228
|
|
|
Securities
|
Note 12
|
Page 230
|
|
|
Securities financing activities
|
Note 13
|
Page 235
|
|
|
Loans
|
Note 14
|
Page 238
|
|
|
Allowance for credit losses
|
Note 15
|
Page 258
|
|
|
Variable interest entities
|
Note 16
|
Page 262
|
|
|
Goodwill and other intangible assets
|
Note 17
|
Page 271
|
|
|
Premises and equipment
|
Note 18
|
Page 276
|
|
|
Long-term debt
|
Note 21
|
Page 277
|
|
|
Income taxes
|
Note 26
|
Page 282
|
|
|
Off–balance sheet lending-related financial instruments, guarantees and other commitments
|
Note 29
|
Page 287
|
|
|
Litigation
|
Note 31
|
Page 295
|
|
Subsequent events
As part of the Firm’s business simplification agenda, the sale of a portion of the Private Equity Business (“Private Equity sale”) was completed on January 9, 2015. Concurrent with the sale, a new independent management company was formed by the former One Equity Partners (“OEP”) investment professionals. The new management company will provide investment management services to the acquirer of the investments sold in the Private Equity sale and for the portion of private equity investments retained by the Firm. Upon closing, this transaction did not have a material impact on the Firm’s Consolidated balance sheets or its results of operations.
|
JPMorgan Chase & Co./2014 Annual Report
|
179
|
|
Notes to consolidated financial statements
JPMorgan Chase carries a portion of its assets and liabilities at fair value. These assets and liabilities are predominantly carried at fair value on a recurring basis (i.e., assets and liabilities that are measured and reported at fair value on the Firm’s Consolidated balance sheets). Certain assets (e.g., certain mortgage, home equity and other loans where the carrying value is based on the fair value of the underlying collateral), liabilities and unfunded lending-related commitments are measured at fair value on a nonrecurring basis; that is, they are not measured at fair value on an ongoing basis but are subject to fair value adjustments only in certain circumstances (for example, when there is evidence of impairment).
Fair value is defined as the price that would be received to sell an asset or paid to transfer a liability in an orderly transaction between market participants at the measurement date. Fair value is based on quoted market prices, where available. If listed prices or quotes are not available, fair value is based on models that consider relevant transaction characteristics (such as maturity) and use as inputs observable or unobservable market parameters, including but not limited to yield curves, interest rates, volatilities, equity or debt prices, foreign exchange rates and credit curves. Valuation adjustments may be made to ensure that financial instruments are recorded at fair value, as described below.
The level of precision in estimating unobservable market inputs or other factors can affect the amount of gain or loss recorded for a particular position. Furthermore, while the Firm believes its valuation methods are appropriate and consistent with those of other market participants, the methods and assumptions used reflect management judgment and may vary across the Firm’s businesses and portfolios.
The Firm uses various methodologies and assumptions in the determination of fair value. The use of different methodologies or assumptions to those used by the Firm could result in a different estimate of fair value at the reporting date.
Valuation process
Risk-taking functions are responsible for providing fair value estimates for assets and liabilities carried on the Consolidated balance sheets at fair value. The Firm’s valuation control function, which is part of the Firm’s Finance function and independent of the risk-taking functions, is responsible for verifying these estimates and determining any fair value adjustments that may be required to ensure that the Firm’s positions are recorded at fair value. In addition, the Firm has a firmwide Valuation Governance Forum (“VGF”) comprised of senior finance and risk executives to oversee the management of risks arising from valuation activities conducted across the Firm. The VGF is chaired by the Firmwide head of the valuation control function, and also includes sub-forums for the Corporate & Investment Bank (“CIB”), Mortgage Banking, (part of
Consumer & Community Banking) and certain corporate functions including Treasury and Chief Investment Office (“CIO”).
The valuation control function verifies fair value estimates provided by the risk-taking functions by leveraging independently derived prices, valuation inputs and other market data, where available. Where independent prices or inputs are not available, additional review is performed by the valuation control function to ensure the reasonableness of the estimates, and may include: evaluating the limited market activity including client unwinds; benchmarking of valuation inputs to those for similar instruments; decomposing the valuation of structured instruments into individual components; comparing expected to actual cash flows; reviewing profit and loss trends; and reviewing trends in collateral valuation. In addition there are additional levels of management review for more significant or complex positions.
The valuation control function determines any valuation adjustments that may be required to the estimates provided by the risk-taking functions. No adjustments are applied to the quoted market price for instruments classified within level 1 of the fair value hierarchy (see below for further information on the fair value hierarchy). For other positions, judgment is required to assess the need for valuation adjustments to appropriately reflect liquidity considerations, unobservable parameters, and, for certain portfolios that meet specified criteria, the size of the net open risk position. The determination of such adjustments follows a consistent framework across the Firm:
|
•
|
Liquidity valuation adjustments are considered where an observable external price or valuation parameter exists but is of lower reliability, potentially due to lower market activity. Liquidity valuation adjustments are applied and determined based on current market conditions. Factors that may be considered in determining the liquidity adjustment include analysis of: (1) the estimated bid-offer spread for the instrument being traded; (2) alternative pricing points for similar instruments in active markets; and (3) the range of reasonable values that the price or parameter could take.
|
|
•
|
The Firm manages certain portfolios of financial instruments on the basis of net open risk exposure and, as permitted by U.S. GAAP, has elected to estimate the fair value of such portfolios on the basis of a transfer of the entire net open risk position in an orderly transaction. Where this is the case, valuation adjustments may be necessary to reflect the cost of exiting a larger-than-normal market-size net open risk position. Where applied, such adjustments are based on factors that a relevant market participant would consider in the transfer of the net open risk position including the size of the adverse market move that is likely to occur during the period required to reduce the net open risk position to a normal market-size.
|
|
180
|
JPMorgan Chase & Co./2014 Annual Report
|
|
|
•
|
Unobservable parameter valuation adjustments may be made when positions are valued using prices or input parameters to valuation models that are unobservable due to a lack of market activity or because they cannot be implied from observable market data. Such prices or parameters must be estimated and are, therefore, subject to management judgment. Unobservable parameter valuation adjustments are applied to reflect the uncertainty inherent in the resulting valuation estimate.
|
Where appropriate, the Firm also applies adjustments to its estimates of fair value in order to appropriately reflect counterparty credit quality, the Firm’s own creditworthiness and the impact of funding, applying a consistent framework across the Firm. For more information on such adjustments see Credit and funding adjustments on
pages 196–197
of this Note.
Valuation model review and approval
If prices or quotes are not available for an instrument or a similar instrument, fair value is generally determined using valuation models that consider relevant transaction data such as maturity and use as inputs market-based or independently sourced parameters. Where this is the case the price verification process described above is applied to the inputs to those models.
The Model Risk function is independent of the model owners and reviews and approves a wide range of models, including risk management, valuation and certain regulatory capital models used by the Firm. The Model Risk function is part of the Firm’s Model Risk and Development unit, and the Firmwide Model Risk and Development Executive reports to the Firm’s CRO. When reviewing a model, the Model Risk function analyzes and challenges the model methodology and the reasonableness of model assumptions and may perform or require additional testing, including back-testing of model outcomes.
New significant valuation models, as well as material changes to existing valuation models, are reviewed and approved prior to implementation except where specified conditions are met. The Model Risk function performs an annual firmwide model risk assessment where developments in the product or market are considered in determining whether valuation models which have already been reviewed need to be reviewed and approved again.
Valuation hierarchy
A three-level valuation hierarchy has been established under U.S. GAAP for disclosure of fair value measurements. The valuation hierarchy is based on the transparency of inputs to the valuation of an asset or liability as of the measurement date. The three levels are defined as follows.
|
•
|
Level 1 – inputs to the valuation methodology are quoted prices (unadjusted) for identical assets or liabilities in active markets.
|
|
•
|
Level 2 – inputs to the valuation methodology include quoted prices for similar assets and liabilities in active markets, and inputs that are observable for the asset or liability, either directly or indirectly, for substantially the full term of the financial instrument.
|
|
•
|
Level 3 – one or more inputs to the valuation methodology are unobservable and significant to the fair value measurement.
|
A financial instrument’s categorization within the valuation hierarchy is based on the lowest level of input that is significant to the fair value measurement.
|
JPMorgan Chase & Co./2014 Annual Report
|
181
|
|
Notes to consolidated financial statements
The following table describes the valuation methodologies used by the Firm to measure its more significant products/instruments at fair value, including the general classification of such instruments pursuant to the valuation hierarchy.
|
Product/instrument
|
Valuation methodology
|
Classifications in the valuation hierarchy
|
|
|
Securities financing agreements
|
Valuations are based on discounted cash flows, which consider:
|
Level 2
|
|
|
• Derivative features. For further information refer to the
discussion of derivatives below.
|
|||
|
• Market rates for the respective maturity
|
|||
|
• Collateral
|
|||
|
Loans and lending-related commitments - wholesale
|
|||
|
Trading portfolio
|
Where observable market data is available, valuations are based on:
|
Level 2 or 3
|
|
|
• Observed market prices (circumstances are infrequent)
|
|||
|
• Relevant broker quotes
|
|||
|
• Observed market prices for similar instruments
|
|||
|
Where observable market data is unavailable or limited, valuations are based on discounted cash flows, which consider the following:
|
|||
|
• Yield
|
|||
|
• Lifetime credit losses
|
|||
|
• Loss severity
|
|||
|
• Prepayment speed
|
|||
|
• Servicing costs
|
|||
|
Loans held for investment and associated lending-related commitments
|
Valuations are based on discounted cash flows, which consider:
|
Predominantly level 3
|
|
|
• Credit spreads, derived from the cost of credit default swaps (“CDS”); or benchmark credit curves developed by the Firm, by industry and credit rating, and which take into account the difference in loss severity rates between bonds and loans
|
|||
|
• Prepayment speed
|
|||
|
Lending-related commitments are valued similar to loans and reflect the portion of an unused commitment expected, based on the Firm’s average portfolio historical experience, to become funded prior to an obligor default
|
|||
|
For information regarding the valuation of loans measured at collateral value, see Note 14.
|
|||
|
Loans - consumer
|
|||
|
Held for investment consumer loans, excluding credit card
|
Valuations are based on discounted cash flows, which consider:
|
Predominantly level 3
|
|
|
• Discount rates (derived from primary origination rates and market activity)
|
|||
|
• Expected lifetime credit losses (considering expected and current default rates for existing portfolios, collateral prices, and economic environment expectations (e.g., unemployment rates))
|
|||
|
•
Estimated prepayments
|
|||
|
•
Servicing costs
|
|||
|
• Market liquidity
|
|||
|
For information regarding the valuation of loans measured at collateral value, see Note 14.
|
|||
|
Held for investment credit card receivables
|
Valuations are based on discounted cash flows, which consider:
|
Level 3
|
|
|
• Projected interest income and late fee revenue, servicing and credit costs, and loan repayment rates
|
|||
|
• Estimated life of receivables (based on projected loan payment rates)
|
|||
|
• Discount rate - based on cost of funding and expected return on receivables
|
|||
|
• Credit costs - allowance for loan losses is considered a reasonable proxy for the credit cost based on the short-term nature of credit card receivables
|
|||
|
Trading loans - Conforming residential mortgage loans expected to be sold
|
Fair value is based upon observable prices for mortgage-backed securities with similar collateral and incorporates adjustments to these prices to account for differences between the securities and the value of the underlying loans, which include credit characteristics, portfolio composition, and liquidity.
|
Predominantly level 2
|
|
|
182
|
JPMorgan Chase & Co./2014 Annual Report
|
|
|
Product/instrument
|
Valuation methodology, inputs and assumptions
|
Classifications in the valuation hierarchy
|
|
Securities
|
Quoted market prices are used where available.
|
Level 1
|
|
In the absence of quoted market prices, securities are valued based on:
|
Level 2 or 3
|
|
|
• Observable market prices for similar securities
|
||
|
•
Relevant broker quotes
|
||
|
•
Discounted cash flows
|
||
|
In addition, the following inputs to discounted cash flows are used for the following products:
|
||
|
Mortgage- and asset-backed securities specific inputs:
|
||
|
•
Collateral characteristics
|
||
|
• Deal-specific payment and loss allocations
|
||
|
• Current market assumptions related to yield, prepayment speed, conditional default rates and loss severity
|
||
|
Collateralized loan obligations (“CLOs”), specific inputs:
|
||
|
•
Collateral characteristics
|
||
|
•
Deal-specific payment and loss allocations
|
||
|
•
Expected prepayment speed, conditional default rates, loss severity
|
||
|
•
Credit spreads
|
||
|
• Credit rating data
|
||
|
Physical commodities
|
Valued using observable market prices or data
|
Predominantly Level 1 and 2
|
|
Derivatives
|
Exchange-traded derivatives that are actively traded and valued using the exchange price, and over-the-counter contracts where quoted prices are available in an active market.
|
Level 1
|
|
Derivatives that are valued using models such as the Black-Scholes option pricing model, simulation models, or a combination of models, that use observable or unobservable valuation inputs (e.g., plain vanilla options and interest rate and credit default swaps). Inputs include:
|
Level 2 or 3
|
|
|
•
Contractual terms including the period to maturity
|
||
|
•
Readily observable parameters including interest rates and volatility
|
||
|
•
Credit quality of the counterparty and of the Firm
|
||
|
•
Market funding levels
|
||
|
•
Correlation levels
|
||
|
In addition, the following specific inputs are used for the following derivatives that are valued based on models with significant unobservable inputs:
|
||
|
Structured credit derivatives specific inputs include:
|
||
|
•
CDS spreads and recovery rates
|
||
|
•
Credit correlation between the underlying debt instruments (levels are modeled on a transaction basis and calibrated to liquid benchmark tranche indices)
|
||
|
•
Actual transactions, where available, are used to regularly recalibrate unobservable parameters
|
||
|
Certain long-dated equity option specific inputs include:
|
||
|
•
Long-dated equity volatilities
|
||
|
Certain interest rate and foreign exchange (“FX
”
) exotic options specific inputs include:
|
||
|
•
Interest rate correlation
|
||
|
•
Interest rate spread volatility
|
||
|
•
Foreign exchange correlation
|
||
|
•
Correlation between interest rates and foreign exchange rates
|
||
|
•
Parameters describing the evolution of underlying interest rates
|
||
|
Certain commodity derivatives specific inputs include:
|
||
|
•
Commodity volatility
|
||
|
• Forward commodity price
|
||
|
Additionally, adjustments are made to reflect counterparty credit quality (credit valuation adjustments or “CVA”), the Firm’s own creditworthiness (debit valuation adjustments or “DVA”), and funding valuation adjustment (“FVA”) to incorporate the impact of funding. See pages 196
–
197 of this Note.
|
||
|
JPMorgan Chase & Co./2014 Annual Report
|
183
|
|
Notes to consolidated financial statements
|
Product/instrument
|
Valuation methodology, inputs and assumptions
|
Classification in the valuation hierarchy
|
|
|
Mortgage servicing rights (“MSRs”)
|
See Mortgage servicing rights in Note 17.
|
Level 3
|
|
|
Private equity direct investments
|
Private equity direct investments
|
Level 2 or 3
|
|
|
Fair value is estimated using all available information and considering the range of potential inputs, including:
|
|
||
|
•
Transaction prices
|
|||
|
•
Trading multiples of comparable public companies
|
|||
|
• Operating performance of the underlying portfolio company
|
|||
|
•
Additional available inputs relevant to the investment
|
|||
|
•
Adjustments as required, since comparable public companies are not identical to the company being valued, and for company-specific issues and lack of liquidity
|
|||
|
Public investments held in the Private Equity portfolio
|
Level 1 or 2
|
||
|
•
Valued using observable market prices less adjustments for relevant restrictions, where applicable
|
|||
|
Fund investments (i.e., mutual/collective investment funds, private equity funds, hedge funds, and real estate funds)
|
Net asset value (“NAV”)
|
||
|
•
NAV is validated by sufficient level of observable activity (i.e., purchases and sales)
|
Level 1
|
||
|
•
Adjustments to the NAV as required, for restrictions on redemption (e.g., lock up periods or withdrawal limitations) or where observable activity is limited
|
Level 2 or 3
|
||
|
Beneficial interests issued by consolidated VIEs
|
Valued using observable market information, where available
|
Level 2 or 3
|
|
|
In the absence of observable market information, valuations are based on the fair value of the underlying assets held by the VIE
|
|||
|
Long-term debt, not carried at fair value
|
Valuations are based on discounted cash flows, which consider:
|
Predominantly level 2
|
|
|
•
Market rates for respective maturity
|
|||
|
• The Firm’s own creditworthiness (DVA). See pages 196-197 of this Note.
|
|||
|
Structured notes (included in deposits, other borrowed funds and long-term debt)
|
• Valuations are based on discounted cash flow analyses that consider the embedded derivative and the terms and payment structure of the note.
• The embedded derivative features are considered using models such as the Black-Scholes option pricing model, simulation models, or a combination of models that use observable or unobservable valuation inputs, depending on the embedded derivative. The specific inputs used vary according to the nature of the embedded derivative features, as described in the discussion above regarding derivative valuation. Adjustments are then made to this base valuation to reflect the Firm’s own creditworthiness (DVA) and to incorporate the impact of funding (FVA). See pages 196
–
197 of this Note.
|
Level 2 or 3
|
|
|
184
|
JPMorgan Chase & Co./2014 Annual Report
|
|
The following table presents the asset and liabilities reported at fair value as of
December 31, 2014
and
2013
, by major product category and fair value hierarchy.
|
Assets and liabilities measured at fair value on a recurring basis
|
|||||||||||||||||
|
Fair value hierarchy
|
|||||||||||||||||
|
December 31, 2014 (in millions)
|
Level 1
|
Level 2
|
Level 3
|
Derivative netting adjustments
|
Total fair value
|
||||||||||||
|
Federal funds sold and securities purchased under resale agreements
|
$
|
—
|
|
$
|
28,585
|
|
$
|
—
|
|
$
|
—
|
|
$
|
28,585
|
|
||
|
Securities borrowed
|
—
|
|
992
|
|
—
|
|
—
|
|
992
|
|
|||||||
|
Trading assets:
|
|||||||||||||||||
|
Debt instruments:
|
|||||||||||||||||
|
Mortgage-backed securities:
|
|||||||||||||||||
|
U.S. government agencies
(a)
|
14
|
|
31,904
|
|
922
|
|
—
|
|
32,840
|
|
|||||||
|
Residential – nonagency
|
—
|
|
1,381
|
|
663
|
|
—
|
|
2,044
|
|
|||||||
|
Commercial – nonagency
|
—
|
|
927
|
|
306
|
|
—
|
|
1,233
|
|
|||||||
|
Total mortgage-backed securities
|
14
|
|
34,212
|
|
1,891
|
|
—
|
|
36,117
|
|
|||||||
|
U.S. Treasury and government agencies
(a)
|
17,816
|
|
8,460
|
|
—
|
|
—
|
|
26,276
|
|
|||||||
|
Obligations of U.S. states and municipalities
|
—
|
|
9,298
|
|
1,273
|
|
—
|
|
10,571
|
|
|||||||
|
Certificates of deposit, bankers’ acceptances and commercial paper
|
—
|
|
1,429
|
|
—
|
|
—
|
|
1,429
|
|
|||||||
|
Non-U.S. government debt securities
|
25,854
|
|
27,294
|
|
302
|
|
—
|
|
53,450
|
|
|||||||
|
Corporate debt securities
|
—
|
|
28,099
|
|
2,989
|
|
—
|
|
31,088
|
|
|||||||
|
Loans
(b)
|
—
|
|
23,080
|
|
13,287
|
|
—
|
|
36,367
|
|
|||||||
|
Asset-backed securities
|
—
|
|
3,088
|
|
1,264
|
|
—
|
|
4,352
|
|
|||||||
|
Total debt instruments
|
43,684
|
|
134,960
|
|
21,006
|
|
—
|
|
199,650
|
|
|||||||
|
Equity securities
|
104,890
|
|
748
|
|
431
|
|
—
|
|
106,069
|
|
|||||||
|
Physical commodities
(c)
|
2,739
|
|
1,741
|
|
2
|
|
—
|
|
4,482
|
|
|||||||
|
Other
|
—
|
|
8,762
|
|
1,050
|
|
—
|
|
9,812
|
|
|||||||
|
Total debt and equity instruments
(d)
|
151,313
|
|
146,211
|
|
22,489
|
|
—
|
|
320,013
|
|
|||||||
|
Derivative receivables:
|
|||||||||||||||||
|
Interest rate
|
473
|
|
951,901
|
|
4,149
|
|
(922,798
|
)
|
33,725
|
|
|||||||
|
Credit
|
—
|
|
73,853
|
|
2,989
|
|
(75,004
|
)
|
1,838
|
|
|||||||
|
Foreign exchange
|
758
|
|
205,887
|
|
2,276
|
|
(187,668
|
)
|
21,253
|
|
|||||||
|
Equity
|
—
|
|
44,240
|
|
2,552
|
|
(38,615
|
)
|
8,177
|
|
|||||||
|
Commodity
|
247
|
|
42,807
|
|
599
|
|
(29,671
|
)
|
13,982
|
|
|||||||
|
Total derivative receivables
(e)
|
1,478
|
|
1,318,688
|
|
12,565
|
|
(1,253,756
|
)
|
78,975
|
|
|||||||
|
Total trading assets
|
152,791
|
|
1,464,899
|
|
35,054
|
|
(1,253,756
|
)
|
398,988
|
|
|||||||
|
Available-for-sale securities:
|
|||||||||||||||||
|
Mortgage-backed securities:
|
|||||||||||||||||
|
U.S. government agencies
(a)
|
—
|
|
65,319
|
|
—
|
|
—
|
|
65,319
|
|
|||||||
|
Residential – nonagency
|
—
|
|
50,865
|
|
30
|
|
—
|
|
50,895
|
|
|||||||
|
Commercial – nonagency
|
—
|
|
21,009
|
|
99
|
|
—
|
|
21,108
|
|
|||||||
|
Total mortgage-backed securities
|
—
|
|
137,193
|
|
129
|
|
—
|
|
137,322
|
|
|||||||
|
U.S. Treasury and government agencies
(a)
|
13,591
|
|
54
|
|
—
|
|
—
|
|
13,645
|
|
|||||||
|
Obligations of U.S. states and municipalities
|
—
|
|
30,068
|
|
—
|
|
—
|
|
30,068
|
|
|||||||
|
Certificates of deposit
|
—
|
|
1,103
|
|
—
|
|
—
|
|
1,103
|
|
|||||||
|
Non-U.S. government debt securities
|
24,074
|
|
28,669
|
|
—
|
|
—
|
|
52,743
|
|
|||||||
|
Corporate debt securities
|
—
|
|
18,532
|
|
—
|
|
—
|
|
18,532
|
|
|||||||
|
Asset-backed securities:
|
|||||||||||||||||
|
Collateralized loan obligations
|
—
|
|
29,402
|
|
792
|
|
—
|
|
30,194
|
|
|||||||
|
Other
|
—
|
|
12,499
|
|
116
|
|
—
|
|
12,615
|
|
|||||||
|
Equity securities
|
2,530
|
|
—
|
|
—
|
|
—
|
|
2,530
|
|
|||||||
|
Total available-for-sale securities
|
40,195
|
|
257,520
|
|
1,037
|
|
—
|
|
298,752
|
|
|||||||
|
Loans
|
—
|
|
70
|
|
2,541
|
|
—
|
|
2,611
|
|
|||||||
|
Mortgage servicing rights
|
—
|
|
—
|
|
7,436
|
|
—
|
|
7,436
|
|
|||||||
|
Other assets:
|
|||||||||||||||||
|
Private equity investments
(f)
|
648
|
|
2,624
|
|
2,475
|
|
—
|
|
5,747
|
|
|||||||
|
All other
|
4,018
|
|
230
|
|
2,371
|
|
—
|
|
6,619
|
|
|||||||
|
Total other assets
|
4,666
|
|
2,854
|
|
4,846
|
|
—
|
|
12,366
|
|
|||||||
|
Total assets measured at fair value on a recurring basis
|
$
|
197,652
|
|
$
|
1,754,920
|
|
(g)
|
$
|
50,914
|
|
(g)
|
$
|
(1,253,756
|
)
|
$
|
749,730
|
|
|
Deposits
|
$
|
—
|
|
$
|
5,948
|
|
$
|
2,859
|
|
$
|
—
|
|
$
|
8,807
|
|
||
|
Federal funds purchased and securities loaned or sold under repurchase agreements
|
—
|
|
2,979
|
|
—
|
|
—
|
|
2,979
|
|
|||||||
|
Other borrowed funds
|
—
|
|
13,286
|
|
1,453
|
|
—
|
|
14,739
|
|
|||||||
|
Trading liabilities:
|
|
|
|||||||||||||||
|
Debt and equity instruments
(d)
|
62,914
|
|
18,713
|
|
72
|
|
—
|
|
81,699
|
|
|||||||
|
Derivative payables:
|
|
|
|||||||||||||||
|
Interest rate
|
499
|
|
920,623
|
|
3,523
|
|
(906,900
|
)
|
17,745
|
|
|||||||
|
Credit
|
—
|
|
73,095
|
|
2,800
|
|
(74,302
|
)
|
1,593
|
|
|||||||
|
Foreign exchange
|
746
|
|
214,800
|
|
2,802
|
|
(195,378
|
)
|
22,970
|
|
|||||||
|
Equity
|
—
|
|
46,228
|
|
4,337
|
|
(38,825
|
)
|
11,740
|
|
|||||||
|
Commodity
|
141
|
|
44,318
|
|
1,164
|
|
(28,555
|
)
|
17,068
|
|
|||||||
|
Total derivative payables
(e)
|
1,386
|
|
1,299,064
|
|
14,626
|
|
(1,243,960
|
)
|
71,116
|
|
|||||||
|
Total trading liabilities
|
64,300
|
|
1,317,777
|
|
14,698
|
|
(1,243,960
|
)
|
152,815
|
|
|||||||
|
Accounts payable and other liabilities
|
—
|
|
—
|
|
36
|
|
—
|
|
36
|
|
|||||||
|
Beneficial interests issued by consolidated VIEs
|
—
|
|
1,016
|
|
1,146
|
|
—
|
|
2,162
|
|
|||||||
|
Long-term debt
|
—
|
|
18,349
|
|
11,877
|
|
—
|
|
30,226
|
|
|||||||
|
Total liabilities measured at fair value on a recurring basis
|
$
|
64,300
|
|
$
|
1,359,355
|
|
$
|
32,069
|
|
$
|
(1,243,960
|
)
|
$
|
211,764
|
|
||
|
JPMorgan Chase & Co./2014 Annual Report
|
185
|
|
Notes to consolidated financial statements
|
Fair value hierarchy
|
|||||||||||||||||
|
December 31, 2013 (in millions)
|
Level 1
|
Level 2
|
Level 3
|
Derivative netting adjustments
|
Total fair value
|
||||||||||||
|
Federal funds sold and securities purchased under resale agreements
|
$
|
—
|
|
$
|
25,135
|
|
$
|
—
|
|
$
|
—
|
|
$
|
25,135
|
|
||
|
Securities borrowed
|
—
|
|
3,739
|
|
—
|
|
—
|
|
3,739
|
|
|||||||
|
Trading assets:
|
|||||||||||||||||
|
Debt instruments:
|
|||||||||||||||||
|
Mortgage-backed securities:
|
|||||||||||||||||
|
U.S. government agencies
(a)
|
4
|
|
25,582
|
|
1,005
|
|
—
|
|
26,591
|
|
|||||||
|
Residential – nonagency
|
—
|
|
1,749
|
|
726
|
|
—
|
|
2,475
|
|
|||||||
|
Commercial – nonagency
|
—
|
|
871
|
|
432
|
|
—
|
|
1,303
|
|
|||||||
|
Total mortgage-backed securities
|
4
|
|
28,202
|
|
2,163
|
|
—
|
|
30,369
|
|
|||||||
|
U.S. Treasury and government agencies
(a)
|
14,933
|
|
10,547
|
|
—
|
|
—
|
|
25,480
|
|
|||||||
|
Obligations of U.S. states and municipalities
|
—
|
|
6,538
|
|
1,382
|
|
—
|
|
7,920
|
|
|||||||
|
Certificates of deposit, bankers’ acceptances and commercial paper
|
—
|
|
3,071
|
|
—
|
|
—
|
|
3,071
|
|
|||||||
|
Non-U.S. government debt securities
|
25,762
|
|
22,379
|
|
143
|
|
—
|
|
48,284
|
|
|||||||
|
Corporate debt securities
(h)
|
—
|
|
24,802
|
|
5,920
|
|
—
|
|
30,722
|
|
|||||||
|
Loans
(b)
|
—
|
|
17,331
|
|
13,455
|
|
—
|
|
30,786
|
|
|||||||
|
Asset-backed securities
|
—
|
|
3,647
|
|
1,272
|
|
—
|
|
4,919
|
|
|||||||
|
Total debt instruments
|
40,699
|
|
116,517
|
|
24,335
|
|
—
|
|
181,551
|
|
|||||||
|
Equity securities
|
107,667
|
|
954
|
|
885
|
|
—
|
|
109,506
|
|
|||||||
|
Physical commodities
(c)
|
4,968
|
|
5,217
|
|
4
|
|
—
|
|
10,189
|
|
|||||||
|
Other
|
—
|
|
5,659
|
|
2,000
|
|
—
|
|
7,659
|
|
|||||||
|
Total debt and equity instruments
(d)
|
153,334
|
|
128,347
|
|
27,224
|
|
—
|
|
308,905
|
|
|||||||
|
Derivative receivables:
|
|||||||||||||||||
|
Interest rate
|
419
|
|
848,862
|
|
5,398
|
|
(828,897
|
)
|
25,782
|
|
|||||||
|
Credit
|
—
|
|
79,754
|
|
3,766
|
|
(82,004
|
)
|
1,516
|
|
|||||||
|
Foreign exchange
|
434
|
|
151,521
|
|
1,644
|
|
(136,809
|
)
|
16,790
|
|
|||||||
|
Equity
|
—
|
|
45,892
|
|
7,039
|
|
(40,704
|
)
|
12,227
|
|
|||||||
|
Commodity
|
320
|
|
34,696
|
|
722
|
|
(26,294
|
)
|
9,444
|
|
|||||||
|
Total derivative receivables
(e)
|
1,173
|
|
1,160,725
|
|
18,569
|
|
(1,114,708
|
)
|
65,759
|
|
|||||||
|
Total trading assets
|
154,507
|
|
1,289,072
|
|
45,793
|
|
(1,114,708
|
)
|
374,664
|
|
|||||||
|
Available-for-sale securities:
|
|||||||||||||||||
|
Mortgage-backed securities:
|
|||||||||||||||||
|
U.S. government agencies
(a)
|
—
|
|
77,815
|
|
—
|
|
—
|
|
77,815
|
|
|||||||
|
Residential – nonagency
|
—
|
|
61,760
|
|
709
|
|
—
|
|
62,469
|
|
|||||||
|
Commercial – nonagency
|
—
|
|
15,900
|
|
525
|
|
—
|
|
16,425
|
|
|||||||
|
Total mortgage-backed securities
|
—
|
|
155,475
|
|
1,234
|
|
—
|
|
156,709
|
|
|||||||
|
U.S. Treasury and government agencies
(a)
|
21,091
|
|
298
|
|
—
|
|
—
|
|
21,389
|
|
|||||||
|
Obligations of U.S. states and municipalities
|
—
|
|
29,461
|
|
—
|
|
—
|
|
29,461
|
|
|||||||
|
Certificates of deposit
|
—
|
|
1,041
|
|
—
|
|
—
|
|
1,041
|
|
|||||||
|
Non-U.S. government debt securities
|
25,648
|
|
30,600
|
|
—
|
|
—
|
|
56,248
|
|
|||||||
|
Corporate debt securities
|
—
|
|
21,512
|
|
—
|
|
—
|
|
21,512
|
|
|||||||
|
Asset-backed securities:
|
|||||||||||||||||
|
Collateralized loan obligations
|
—
|
|
27,409
|
|
821
|
|
—
|
|
28,230
|
|
|||||||
|
Other
|
—
|
|
11,978
|
|
267
|
|
—
|
|
12,245
|
|
|||||||
|
Equity securities
|
3,142
|
|
—
|
|
—
|
|
—
|
|
3,142
|
|
|||||||
|
Total available-for-sale securities
|
49,881
|
|
277,774
|
|
2,322
|
|
—
|
|
329,977
|
|
|||||||
|
Loans
|
—
|
|
80
|
|
1,931
|
|
—
|
|
2,011
|
|
|||||||
|
Mortgage servicing rights
|
—
|
|
—
|
|
9,614
|
|
—
|
|
9,614
|
|
|||||||
|
Other assets:
|
|||||||||||||||||
|
Private equity investments
(f)
|
606
|
|
429
|
|
6,474
|
|
—
|
|
7,509
|
|
|||||||
|
All other
|
4,213
|
|
289
|
|
3,176
|
|
—
|
|
7,678
|
|
|||||||
|
Total other assets
|
4,819
|
|
718
|
|
9,650
|
|
—
|
|
15,187
|
|
|||||||
|
Total assets measured at fair value on a recurring basis
|
$
|
209,207
|
|
$
|
1,596,518
|
|
(g)
|
$
|
69,310
|
|
(g)
|
$
|
(1,114,708
|
)
|
$
|
760,327
|
|
|
Deposits
|
$
|
—
|
|
$
|
4,369
|
|
$
|
2,255
|
|
$
|
—
|
|
$
|
6,624
|
|
||
|
Federal funds purchased and securities loaned or sold under repurchase agreements
|
—
|
|
5,426
|
|
—
|
|
—
|
|
5,426
|
|
|||||||
|
Other borrowed funds
|
—
|
|
11,232
|
|
2,074
|
|
—
|
|
13,306
|
|
|||||||
|
Trading liabilities:
|
|||||||||||||||||
|
Debt and equity instruments
(d)
|
61,262
|
|
19,055
|
|
113
|
|
—
|
|
80,430
|
|
|||||||
|
Derivative payables:
|
|||||||||||||||||
|
Interest rate
|
321
|
|
822,014
|
|
3,019
|
|
(812,071
|
)
|
13,283
|
|
|||||||
|
Credit
|
—
|
|
78,731
|
|
3,671
|
|
(80,121
|
)
|
2,281
|
|
|||||||
|
Foreign exchange
|
443
|
|
156,838
|
|
2,844
|
|
(144,178
|
)
|
15,947
|
|
|||||||
|
Equity
|
—
|
|
46,552
|
|
8,102
|
|
(39,935
|
)
|
14,719
|
|
|||||||
|
Commodity
|
398
|
|
36,609
|
|
607
|
|
(26,530
|
)
|
11,084
|
|
|||||||
|
Total derivative payables
(e)
|
1,162
|
|
1,140,744
|
|
18,243
|
|
(1,102,835
|
)
|
57,314
|
|
|||||||
|
Total trading liabilities
|
62,424
|
|
1,159,799
|
|
18,356
|
|
(1,102,835
|
)
|
137,744
|
|
|||||||
|
Accounts payable and other liabilities
|
—
|
|
—
|
|
25
|
|
—
|
|
25
|
|
|||||||
|
Beneficial interests issued by consolidated VIEs
|
—
|
|
756
|
|
1,240
|
|
—
|
|
1,996
|
|
|||||||
|
Long-term debt
|
—
|
|
18,870
|
|
10,008
|
|
—
|
|
28,878
|
|
|||||||
|
Total liabilities measured at fair value on a recurring basis
|
$
|
62,424
|
|
$
|
1,200,452
|
|
$
|
33,958
|
|
$
|
(1,102,835
|
)
|
$
|
193,999
|
|
||
|
(a)
|
At
December 31, 2014
and
2013
, included total U.S. government-sponsored enterprise obligations of
$84.1 billion
and
$91.5 billion
, respectively, which were predominantly mortgage-related.
|
|
(b)
|
At
December 31, 2014
and
2013
, included within trading loans were
$17.0 billion
and
$14.8 billion
, respectively, of residential first-lien mortgages, and
$5.8 billion
and
$2.1 billion
, respectively, of commercial first-lien mortgages. Residential mortgage loans include conforming mortgage loans originated with the intent to sell to U.S. government agencies of
$7.7 billion
and
$6.0 billion
, respectively, and reverse mortgages of
$3.4 billion
and
$3.6 billion
, respectively.
|
|
186
|
JPMorgan Chase & Co./2014 Annual Report
|
|
|
(c)
|
Physical commodities inventories are generally accounted for at the lower of cost or market. “Market” is a term defined in U.S. GAAP as not exceeding fair value less costs to sell (“transaction costs”). Transaction costs for the Firm’s physical commodities inventories are either not applicable or immaterial to the value of the inventory. Therefore, market approximates fair value for the Firm’s physical commodities inventories. When fair value hedging has been applied (or when market is below cost), the carrying value of physical commodities approximates fair value, because under fair value hedge accounting, the cost basis is adjusted for changes in fair value. For a further discussion of the Firm’s hedge accounting relationships, see Note 6. To provide consistent fair value disclosure information, all physical commodities inventories have been included in each period presented.
|
|
(d)
|
Balances reflect the reduction of securities owned (long positions) by the amount of identical securities sold but not yet purchased (short positions).
|
|
(e)
|
As permitted under U.S. GAAP, the Firm has elected to net derivative receivables and derivative payables and the related cash collateral received and paid when a legally enforceable master netting agreement exists. For purposes of the tables above, the Firm does not reduce derivative receivables and derivative payables balances for this netting adjustment, either within or across the levels of the fair value hierarchy, as such netting is not relevant to a presentation based on the transparency of inputs to the valuation of an asset or liability. Therefore, the balances reported in the fair value hierarchy table are gross of any counterparty netting adjustments. However, if the Firm were to net such balances within level 3, the reduction in the level 3 derivative receivables and payables balances would be
$2.5 billion
and
$7.6 billion
at
December 31, 2014
and
2013
, respectively; this is exclusive of the netting benefit associated with cash collateral, which would further reduce the level 3 balances.
|
|
(f)
|
Private equity instruments represent investments within the Corporate line of business. The cost basis of the private equity investment portfolio totaled
$6.0 billion
and
$8.0 billion
at
December 31, 2014
and
2013
, respectively.
|
|
(g)
|
Includes investments in hedge funds, private equity funds, real estate and other funds that do not have readily determinable fair values. The Firm uses net asset value per share when measuring the fair value of these investments. At
December 31, 2014
and
2013
, the fair values of these investments were
$1.8 billion
and
$3.2 billion
, respectively, of which
$337 million
and
$899 million
, respectively were classified in level 2, and
$1.4 billion
and
$2.3 billion
, respectively, in level 3.
|
Transfers between levels for instruments carried at fair value on a recurring basis
For the year ended
December 31, 2014
and 2013, there were no significant transfers between levels 1 and 2.
During the year ended
December 31, 2014
, transfers from level 3 to level 2 included the following:
|
•
|
$4.3 billion
and
$4.4 billion
of gross equity derivative receivables and payables, respectively, due to increased observability of certain equity option valuation inputs;
|
|
•
|
$2.7 billion
of trading loans,
$2.6 billion
of margin loans,
$2.3 billion
of private equity investments,
$2.0 billion
of corporate debt, and
$1.3 billion
of long-term debt, based on increased liquidity and price transparency.
|
Transfers from level 2 into level 3 included
$1.1 billion
of other borrowed funds,
$1.1 billion
of trading loans and
$1.0 billion
of long-term debt, based on a decrease in observability of valuation inputs and price transparency.
During the year ended December 31, 2013, transfers from level 3 to level 2 included certain highly rated CLOs, including
$27.4 billion
held in the Firm
’
s available-for-sale (“AFS”) securities portfolio and
$1.4 billion
held in the trading portfolio, based on increased liquidity and price transparency; and
$1.3 billion
of long-term debt, largely driven by an increase in observability of certain equity structured notes. Transfers from level 2 to level 3 included
$1.4 billion
of corporate debt securities in the trading portfolio largely driven by a decrease in observability for certain credit instruments.
For the year ended December 31, 2012,
$113.9 billion
of settled U.S. government agency mortgage-backed securities were transferred from level 1 to level 2. While the U.S. government agency mortgage-backed securities market remained highly liquid and transparent, the transfer reflected greater market price differentiation between settled securities based on certain underlying loan specific factors. There were no significant transfers from level 2 to level 1 for the year ended December 31, 2012.
For the year ended December 31, 2012, there were no significant transfers from level 2 into level 3. For the year ended December 31, 2012, transfers from level 3 into level 2 included
$1.2 billion
of derivative payables based on increased observability of certain structured equity derivatives; and
$1.8 billion
of long-term debt due to increased observability of certain equity structured notes.
All transfers are assumed to occur at the beginning of the quarterly reporting period in which they occur.
|
JPMorgan Chase & Co./2014 Annual Report
|
187
|
|
Notes to consolidated financial statements
Level 3 valuations
The Firm has established well-documented processes for determining fair value, including for instruments where fair value is estimated using significant unobservable inputs (level 3). For further information on the Firm’s valuation process and a detailed discussion of the determination of fair value for individual financial instruments, see
pages 181–184
of this Note.
Estimating fair value requires the application of judgment. The type and level of judgment required is largely dependent on the amount of observable market information available to the Firm. For instruments valued using internally developed models that use significant unobservable inputs and are therefore classified within level 3 of the fair value hierarchy, judgments used to estimate fair value are more significant than those required when estimating the fair value of instruments classified within levels 1 and 2.
In arriving at an estimate of fair value for an instrument within level 3, management must first determine the appropriate model to use. Second, due to the lack of observability of significant inputs, management must assess all relevant empirical data in deriving valuation inputs including, but not limited to, transaction details, yield curves, interest rates, prepayment speed, default rates, volatilities, correlations, equity or debt prices, valuations of comparable instruments, foreign exchange rates and credit curves.
The following table presents the Firm’s primary level 3 financial instruments, the valuation techniques used to measure the fair value of those financial instruments, the significant unobservable inputs, the range of values for those inputs and, for certain instruments, the weighted averages of such inputs. While the determination to classify an instrument within level 3 is based on the significance of the unobservable inputs to the overall fair value measurement, level 3 financial instruments typically include observable components (that is, components that are actively quoted and can be validated to external sources) in addition to the unobservable components. The level 1 and/or level 2 inputs are not included in the table. In addition, the Firm manages the risk of the observable components of level 3 financial instruments using securities and derivative
positions that are classified within levels 1 or 2 of the fair value hierarchy.
The range of values presented in the table is representative of the highest and lowest level input used to value the significant groups of instruments within a product/instrument classification. Where provided, the weighted averages of the input values presented in the table are calculated based on the fair value of the instruments that the input is being used to value.
In the Firm’s view, the input range and the weighted average value do not reflect the degree of input uncertainty or an assessment of the reasonableness of the Firm’s estimates and assumptions. Rather, they reflect the characteristics of the various instruments held by the Firm and the relative distribution of instruments within the range of characteristics. For example, two option contracts may have similar levels of market risk exposure and valuation uncertainty, but may have significantly different implied volatility levels because the option contracts have different underlyings, tenors, or strike prices. The input range and weighted average values will therefore vary from period-to-period and parameter to parameter based on the characteristics of the instruments held by the Firm at each balance sheet date.
For the Firm’s derivatives and structured notes positions classified within level 3, the equity and interest rate correlation inputs used in estimating fair value were concentrated at the upper end of the range presented, while the credit correlation inputs were distributed across the range presented and the foreign exchange correlation inputs were concentrated at the lower end of the range presented. In addition, the interest rate volatility inputs used in estimating fair value were concentrated at the upper end of the range presented and the foreign exchange correlation inputs were concentrated at the lower end of the range presented. The equity volatility is concentrated in the lower half end of the range. The forward commodity prices used in estimating the fair value of commodity derivatives were concentrated within the lower end of the range presented.
|
188
|
JPMorgan Chase & Co./2014 Annual Report
|
|
|
Level 3 inputs
(a)
|
||||||||||||
|
December 31, 2014 (in millions, except for ratios and basis points)
|
||||||||||||
|
Product/Instrument
|
Fair value
|
Principal valuation technique
|
Unobservable inputs
|
Range of input values
|
Weighted average
|
|||||||
|
Residential mortgage-backed securities and loans
|
$
|
8,917
|
|
Discounted cash flows
|
Yield
|
1%
|
|
-
|
25%
|
5%
|
||
|
Prepayment speed
|
0%
|
|
-
|
18%
|
6%
|
|||||||
|
Conditional default rate
|
0%
|
|
-
|
100%
|
22%
|
|||||||
|
Loss severity
|
0%
|
|
-
|
90%
|
27%
|
|||||||
|
Commercial mortgage-backed securities and loans
(b)
|
5,319
|
|
Discounted cash flows
|
Yield
|
2%
|
|
-
|
32%
|
5%
|
|||
|
Conditional default rate
|
0%
|
|
-
|
100%
|
8%
|
|||||||
|
Loss severity
|
0%
|
|
-
|
50%
|
29%
|
|||||||
|
Corporate debt securities, obligations of U.S. states and municipalities, and other
(c)
|
6,387
|
|
Discounted cash flows
|
Credit spread
|
53 bps
|
|
-
|
270 bps
|
140 bps
|
|||
|
Yield
|
1%
|
|
-
|
22%
|
7%
|
|||||||
|
6,629
|
|
Market comparables
|
Price
|
$
|
—
|
|
-
|
$131
|
$90
|
|||
|
Net interest rate derivatives
|
626
|
|
Option pricing
|
Interest rate correlation
|
(75
|
)%
|
-
|
95%
|
||||
|
Interest rate spread volatility
|
0%
|
|
-
|
60%
|
||||||||
|
Net credit derivatives
(b)(c)
|
189
|
|
Discounted cash flows
|
Credit correlation
|
47%
|
|
-
|
90%
|
||||
|
Net foreign exchange derivatives
|
(526
|
)
|
Option pricing
|
Foreign exchange correlation
|
0%
|
|
-
|
60%
|
||||
|
Net equity derivatives
|
(1,785
|
)
|
Option pricing
|
Equity volatility
|
15%
|
|
-
|
65%
|
||||
|
Net commodity derivatives
|
(565
|
)
|
Discounted cash flows
|
Forward commodity price
|
$
|
50
|
|
-
|
$90 per barrel
|
|||
|
Collateralized loan obligations
|
792
|
|
Discounted cash flows
|
Credit spread
|
260 bps
|
|
-
|
675 bps
|
279 bps
|
|||
|
Prepayment speed
|
20%
|
20%
|
||||||||||
|
Conditional default rate
|
2%
|
2%
|
||||||||||
|
Loss severity
|
40%
|
40%
|
||||||||||
|
393
|
|
Market comparables
|
Price
|
$
|
—
|
|
-
|
$146
|
$79
|
|||
|
Mortgage servicing rights
|
7,436
|
|
Discounted cash flows
|
Refer to Note 17
|
||||||||
|
Private equity direct investments
|
2,054
|
|
Market comparables
|
EBITDA multiple
|
6x
|
|
-
|
12.4x
|
9.1x
|
|||
|
Liquidity adjustment
|
0%
|
|
-
|
15%
|
7%
|
|||||||
|
Private equity fund investments
|
421
|
|
Net asset value
|
Net asset value
(e)
|
||||||||
|
Long-term debt, other borrowed funds, and deposits
(d)
|
15,069
|
|
Option pricing
|
Interest rate correlation
|
(75
|
)%
|
-
|
95%
|
||||
|
Interest rate spread volatility
|
0%
|
|
-
|
60%
|
||||||||
|
Foreign exchange correlation
|
0%
|
|
-
|
60%
|
||||||||
|
Equity correlation
|
(55
|
)%
|
-
|
85%
|
||||||||
|
1,120
|
|
Discounted cash flows
|
Credit correlation
|
47%
|
|
-
|
90%
|
|||||
|
(a)
|
The categories presented in the table have been aggregated based upon the product type, which may differ from their classification on the Consolidated balance sheets.
|
|
(b)
|
The unobservable inputs and associated input ranges for approximately
$491 million
of credit derivative receivables and
$433 million
of credit derivative payables with underlying commercial mortgage risk have been included in the inputs and ranges provided for commercial mortgage-backed securities and loans.
|
|
(c)
|
The unobservable inputs and associated input ranges for approximately
$795 million
of credit derivative receivables and
$715 million
of credit derivative payables with underlying asset-backed securities risk have been included in the inputs and ranges provided for corporate debt securities, obligations of U.S. states and municipalities and other.
|
|
(d)
|
Long-term debt, other borrowed funds and deposits include structured notes issued by the Firm that are predominantly financial instruments containing embedded derivatives. The estimation of the fair value of structured notes is predominantly based on the derivative features embedded within the instruments. The significant unobservable inputs are broadly consistent with those presented for derivative receivables.
|
|
(e)
|
The range has not been disclosed due to the wide range of possible values given the diverse nature of the underlying investments.
|
|
JPMorgan Chase & Co./2014 Annual Report
|
189
|
|
Notes to consolidated financial statements
Changes in and ranges of unobservable inputs
The following discussion provides a description of the impact on a fair value measurement of a change in each unobservable input in isolation, and the interrelationship between unobservable inputs, where relevant and significant. The impact of changes in inputs may not be independent as a change in one unobservable input may give rise to a change in another unobservable input; where relationships exist between two unobservable inputs, those relationships are discussed below. Relationships may also exist between observable and unobservable inputs (for example, as observable interest rates rise, unobservable prepayment rates decline); such relationships have not been included in the discussion below. In addition, for each of the individual relationships described below, the inverse relationship would also generally apply.
In addition, the following discussion provides a description of attributes of the underlying instruments and external market factors that affect the range of inputs used in the valuation of the Firm’s positions.
Yield – The yield of an asset is the interest rate used to discount future cash flows in a discounted cash flow calculation. An increase in the yield, in isolation, would result in a decrease in a fair value measurement.
Credit spread – The credit spread is the amount of additional annualized return over the market interest rate that a market participant would demand for taking exposure to the credit risk of an instrument. The credit spread for an instrument forms part of the discount rate used in a discounted cash flow calculation. Generally, an increase in the credit spread would result in a decrease in a fair value measurement.
The yield and the credit spread of a particular mortgage-backed security primarily reflect the risk inherent in the instrument. The yield is also impacted by the absolute level of the coupon paid by the instrument (which may not correspond directly to the level of inherent risk). Therefore, the range of yield and credit spreads reflects the range of risk inherent in various instruments owned by the Firm. The risk inherent in mortgage-backed securities is driven by the subordination of the security being valued and the characteristics of the underlying mortgages within the collateralized pool, including borrower FICO scores, loan-to-value ratios for residential mortgages and the nature of the property and/or any tenants for commercial mortgages. For corporate debt securities, obligations of U.S. states and municipalities and other similar instruments, credit spreads reflect the credit quality of the obligor and the tenor of the obligation.
Prepayment speed – The prepayment speed is a measure of the voluntary unscheduled principal repayments of a prepayable obligation in a collateralized pool. Prepayment speeds generally decline as borrower delinquencies rise. An increase in prepayment speeds, in isolation, would result in a decrease in a fair value measurement of assets valued at a premium to par and an increase in a fair value measurement of assets valued at a discount to par.
Prepayment speeds may vary from collateral pool to collateral pool, and are driven by the type and location of the underlying borrower, the remaining tenor of the obligation as well as the level and type (e.g., fixed or floating) of interest rate being paid by the borrower. Typically collateral pools with higher borrower credit quality have a higher prepayment rate than those with lower borrower credit quality, all other factors being equal.
Conditional default rate – The conditional default rate is a measure of the reduction in the outstanding collateral balance underlying a collateralized obligation as a result of defaults. While there is typically no direct relationship between conditional default rates and prepayment speeds, collateralized obligations for which the underlying collateral has high prepayment speeds will tend to have lower conditional default rates. An increase in conditional default rates would generally be accompanied by an increase in loss severity and an increase in credit spreads. An increase in the conditional default rate, in isolation, would result in a decrease in a fair value measurement. Conditional default rates reflect the quality of the collateral underlying a securitization and the structure of the securitization itself. Based on the types of securities owned in the Firm’s market-making portfolios, conditional default rates are most typically at the lower end of the range presented.
Loss severity – The loss severity (the inverse concept is the recovery rate) is the expected amount of future realized losses resulting from the ultimate liquidation of a particular loan, expressed as the net amount of loss relative to the outstanding loan balance. An increase in loss severity is generally accompanied by an increase in conditional default rates. An increase in the loss severity, in isolation, would result in a decrease in a fair value measurement.
The loss severity applied in valuing a mortgage-backed security investment depends on a host of factors relating to the underlying mortgages. This includes the loan-to-value ratio, the nature of the lender’s lien on the property and various other instrument-specific factors.
|
190
|
JPMorgan Chase & Co./2014 Annual Report
|
|
Correlation – Correlation is a measure of the relationship between the movements of two variables (e.g., how the change in one variable influences the change in the other). Correlation is a pricing input for a derivative product where the payoff is driven by one or more underlying risks. Correlation inputs are related to the type of derivative (e.g., interest rate, credit, equity and foreign exchange) due to the nature of the underlying risks. When parameters are positively correlated, an increase in one parameter will result in an increase in the other parameter. When parameters are negatively correlated, an increase in one parameter will result in a decrease in the other parameter. An increase in correlation can result in an increase or a decrease in a fair value measurement. Given a short correlation position, an increase in correlation, in isolation, would generally result in a decrease in a fair value measurement. The range of correlation inputs between risks within the same asset class are generally narrower than those between underlying risks across asset classes. In addition, the ranges of credit correlation inputs tend to be narrower than those affecting other asset classes.
The level of correlation used in the valuation of derivatives with multiple underlying risks depends on a number of factors including the nature of those risks. For example, the correlation between two credit risk exposures would be different than that between two interest rate risk exposures. Similarly, the tenor of the transaction may also impact the correlation input as the relationship between the underlying risks may be different over different time periods. Furthermore, correlation levels are very much dependent on market conditions and could have a relatively wide range of levels within or across asset classes over time, particularly in volatile market conditions.
Volatility – Volatility is a measure of the variability in possible returns for an instrument, parameter or market index given how much the particular instrument, parameter or index changes in value over time. Volatility is a pricing input for options, including equity options, commodity options, and interest rate options. Generally, the higher the volatility of the underlying, the riskier the instrument. Given a long position in an option, an increase in volatility, in isolation, would generally result in an increase in a fair value measurement.
The level of volatility used in the valuation of a particular option-based derivative depends on a number of factors, including the nature of the risk underlying the option (e.g., the volatility of a particular equity security may be significantly different from that of a particular commodity index), the tenor of the derivative as well as the strike price of the option.
EBITDA multiple – EBITDA multiples refer to the input (often derived from the value of a comparable company) that is multiplied by the historic and/or expected earnings before interest, taxes, depreciation and amortization (“EBITDA”) of a company in order to estimate the company’s value. An increase in the EBITDA multiple, in isolation, net of adjustments, would result in an increase in a fair value measurement.
Net asset value – Net asset value is the total value of a fund’s assets less liabilities. An increase in net asset value would result in an increase in a fair value measurement.
Changes in level 3 recurring fair value measurements
The following tables include a rollforward of the Consolidated balance sheets amounts (including changes in fair value) for financial instruments classified by the Firm within level 3 of the fair value hierarchy for the years ended
December 31, 2014
,
2013
and
2012
. When a determination is made to classify a financial instrument within level 3, the determination is based on the significance of the unobservable parameters to the overall fair value measurement. However, level 3 financial instruments typically include, in addition to the unobservable or level 3 components, observable components (that is, components that are actively quoted and can be validated to external sources); accordingly, the gains and losses in the table below include changes in fair value due in part to observable factors that are part of the valuation methodology. Also, the Firm risk-manages the observable components of level 3 financial instruments using securities and derivative positions that are classified within level 1 or 2 of the fair value hierarchy; as these level 1 and level 2 risk management instruments are not included below, the gains or losses in the following tables do not reflect the effect of the Firm’s risk management activities related to such level 3 instruments.
|
JPMorgan Chase & Co./2014 Annual Report
|
191
|
|
Notes to consolidated financial statements
|
Fair value measurements using significant unobservable inputs
|
||||||||||||||||||||||||||||||
|
Year ended
December 31, 2014
(in millions)
|
Fair value at January 1, 2014
|
Total realized/unrealized gains/(losses)
|
Transfers into and/or out of level 3
(h)
|
Fair value at Dec. 31, 2014
|
Change in unrealized gains/(losses) related to financial instruments held at Dec. 31, 2014
|
|||||||||||||||||||||||||
|
Purchases
(g)
|
Sales
|
Settlements
|
||||||||||||||||||||||||||||
|
Assets:
|
||||||||||||||||||||||||||||||
|
Trading assets:
|
||||||||||||||||||||||||||||||
|
Debt instruments:
|
||||||||||||||||||||||||||||||
|
Mortgage-backed securities:
|
||||||||||||||||||||||||||||||
|
U.S. government agencies
|
$
|
1,005
|
|
$
|
(97
|
)
|
$
|
351
|
|
$
|
(186
|
)
|
$
|
(121
|
)
|
$
|
(30
|
)
|
$
|
922
|
|
$
|
(92
|
)
|
||||||
|
Residential – nonagency
|
726
|
|
66
|
|
827
|
|
(761
|
)
|
(41
|
)
|
(154
|
)
|
663
|
|
(15
|
)
|
||||||||||||||
|
Commercial – nonagency
|
432
|
|
17
|
|
980
|
|
(914
|
)
|
(60
|
)
|
(149
|
)
|
306
|
|
(12
|
)
|
||||||||||||||
|
Total mortgage-backed securities
|
2,163
|
|
(14
|
)
|
2,158
|
|
(1,861
|
)
|
(222
|
)
|
(333
|
)
|
1,891
|
|
(119
|
)
|
||||||||||||||
|
Obligations of U.S. states and municipalities
|
1,382
|
|
90
|
|
298
|
|
(358
|
)
|
(139
|
)
|
—
|
|
1,273
|
|
(27
|
)
|
||||||||||||||
|
Non-U.S. government debt securities
|
143
|
|
24
|
|
719
|
|
(617
|
)
|
(3
|
)
|
36
|
|
302
|
|
10
|
|
||||||||||||||
|
Corporate debt securities
|
5,920
|
|
210
|
|
5,854
|
|
(3,372
|
)
|
(4,531
|
)
|
(1,092
|
)
|
2,989
|
|
379
|
|
||||||||||||||
|
Loans
|
13,455
|
|
387
|
|
13,551
|
|
(7,917
|
)
|
(4,623
|
)
|
(1,566
|
)
|
13,287
|
|
123
|
|
||||||||||||||
|
Asset-backed securities
|
1,272
|
|
19
|
|
2,240
|
|
(2,126
|
)
|
(283
|
)
|
142
|
|
1,264
|
|
(30
|
)
|
||||||||||||||
|
Total debt instruments
|
24,335
|
|
716
|
|
24,820
|
|
(16,251
|
)
|
(9,801
|
)
|
(2,813
|
)
|
21,006
|
|
336
|
|
||||||||||||||
|
Equity securities
|
885
|
|
112
|
|
248
|
|
(272
|
)
|
(290
|
)
|
(252
|
)
|
431
|
|
46
|
|
||||||||||||||
|
Physical commodities
|
4
|
|
(1
|
)
|
—
|
|
—
|
|
(1
|
)
|
—
|
|
2
|
|
—
|
|
||||||||||||||
|
Other
|
2,000
|
|
239
|
|
1,426
|
|
(276
|
)
|
(201
|
)
|
(2,138
|
)
|
1,050
|
|
329
|
|
||||||||||||||
|
Total trading assets – debt and equity instruments
|
27,224
|
|
1,066
|
|
(c)
|
26,494
|
|
(16,799
|
)
|
(10,293
|
)
|
(5,203
|
)
|
22,489
|
|
711
|
|
(c)
|
||||||||||||
|
Net derivative receivables:
(a)
|
||||||||||||||||||||||||||||||
|
Interest rate
|
2,379
|
|
184
|
|
198
|
|
(256
|
)
|
(1,771
|
)
|
(108
|
)
|
626
|
|
(853
|
)
|
||||||||||||||
|
Credit
|
95
|
|
(149
|
)
|
272
|
|
(47
|
)
|
92
|
|
(74
|
)
|
189
|
|
(107
|
)
|
||||||||||||||
|
Foreign exchange
|
(1,200
|
)
|
(137
|
)
|
139
|
|
(27
|
)
|
668
|
|
31
|
|
(526
|
)
|
(62
|
)
|
||||||||||||||
|
Equity
|
(1,063
|
)
|
154
|
|
2,044
|
|
(2,863
|
)
|
10
|
|
(67
|
)
|
(1,785
|
)
|
583
|
|
||||||||||||||
|
Commodity
|
115
|
|
(465
|
)
|
1
|
|
(113
|
)
|
(109
|
)
|
6
|
|
(565
|
)
|
(186
|
)
|
||||||||||||||
|
Total net derivative receivables
|
326
|
|
(413
|
)
|
(c)
|
2,654
|
|
(3,306
|
)
|
(1,110
|
)
|
(212
|
)
|
(2,061
|
)
|
(625
|
)
|
(c)
|
||||||||||||
|
Available-for-sale securities:
|
||||||||||||||||||||||||||||||
|
Asset-backed securities
|
1,088
|
|
(41
|
)
|
275
|
|
(2
|
)
|
(101
|
)
|
(311
|
)
|
908
|
|
(40
|
)
|
||||||||||||||
|
Other
|
1,234
|
|
(19
|
)
|
122
|
|
—
|
|
(223
|
)
|
(985
|
)
|
129
|
|
(2
|
)
|
||||||||||||||
|
Total available-for-sale securities
|
2,322
|
|
(60
|
)
|
(d)
|
397
|
|
(2
|
)
|
(324
|
)
|
(1,296
|
)
|
1,037
|
|
(42
|
)
|
(d)
|
||||||||||||
|
Loans
|
1,931
|
|
(254
|
)
|
(c)
|
3,258
|
|
(845
|
)
|
(1,549
|
)
|
—
|
|
2,541
|
|
(234
|
)
|
(c)
|
||||||||||||
|
Mortgage servicing rights
|
9,614
|
|
(1,826
|
)
|
(e)
|
768
|
|
(209
|
)
|
(911
|
)
|
—
|
|
7,436
|
|
(1,826
|
)
|
(e)
|
||||||||||||
|
Other assets:
|
||||||||||||||||||||||||||||||
|
Private equity investments
|
6,474
|
|
443
|
|
(c)
|
164
|
|
(1,967
|
)
|
(360
|
)
|
(2,279
|
)
|
2,475
|
|
26
|
|
(c)
|
||||||||||||
|
All other
|
3,176
|
|
33
|
|
(f)
|
190
|
|
(451
|
)
|
(577
|
)
|
—
|
|
2,371
|
|
11
|
|
(f)
|
||||||||||||
|
Fair value measurements using significant unobservable inputs
|
||||||||||||||||||||||||||||||
|
Year ended
December 31, 2014
(in millions)
|
Fair value at January 1, 2014
|
Total realized/unrealized (gains)/losses
|
Transfers into and/or out of level 3
(h)
|
Fair value at Dec. 31, 2014
|
Change in unrealized (gains)/losses related to financial instruments held at Dec. 31, 2014
|
|||||||||||||||||||||||||
|
Purchases
(g)
|
Sales
|
Issuances
|
Settlements
|
|||||||||||||||||||||||||||
|
Liabilities:
(b)
|
||||||||||||||||||||||||||||||
|
Deposits
|
$
|
2,255
|
|
$
|
149
|
|
(c)
|
$
|
—
|
|
$
|
—
|
|
$
|
1,578
|
|
$
|
(197
|
)
|
$
|
(926
|
)
|
$
|
2,859
|
|
$
|
130
|
|
(c)
|
|
|
Other borrowed funds
|
2,074
|
|
(596
|
)
|
(c)
|
—
|
|
—
|
|
5,377
|
|
(6,127
|
)
|
725
|
|
1,453
|
|
(415
|
)
|
(c)
|
||||||||||
|
Trading liabilities – debt and equity instruments
|
113
|
|
(5
|
)
|
(c)
|
(305
|
)
|
323
|
|
—
|
|
(5
|
)
|
(49
|
)
|
72
|
|
2
|
|
(c)
|
||||||||||
|
Accounts payable and other liabilities
|
25
|
|
27
|
|
(f)
|
—
|
|
—
|
|
—
|
|
(16
|
)
|
—
|
|
36
|
|
—
|
|
(f)
|
||||||||||
|
Beneficial interests issued by consolidated VIEs
|
1,240
|
|
(4
|
)
|
(c)
|
—
|
|
—
|
|
775
|
|
(763
|
)
|
(102
|
)
|
1,146
|
|
(22
|
)
|
(c)
|
||||||||||
|
Long-term debt
|
10,008
|
|
(40
|
)
|
(c)
|
—
|
|
—
|
|
7,421
|
|
(5,231
|
)
|
(281
|
)
|
11,877
|
|
(9
|
)
|
(c)
|
||||||||||
|
192
|
JPMorgan Chase & Co./2014 Annual Report
|
|
|
Fair value measurements using significant unobservable inputs
|
||||||||||||||||||||||||||||||||
|
Year ended
December 31, 2013
(in millions)
|
Fair value at January 1, 2013
|
Total realized/unrealized gains/(losses)
|
Transfers into and/or out of level 3
(h)
|
Fair value at
Dec. 31, 2013
|
Change in unrealized gains/(losses) related to financial instruments held at Dec. 31, 2013
|
|||||||||||||||||||||||||||
|
Purchases
(g)
|
Sales
|
Settlements
|
||||||||||||||||||||||||||||||
|
Assets:
|
||||||||||||||||||||||||||||||||
|
Trading assets:
|
||||||||||||||||||||||||||||||||
|
Debt instruments:
|
||||||||||||||||||||||||||||||||
|
Mortgage-backed securities:
|
||||||||||||||||||||||||||||||||
|
U.S. government agencies
|
$
|
498
|
|
$
|
169
|
|
$
|
819
|
|
$
|
(381
|
)
|
$
|
(100
|
)
|
$
|
—
|
|
$
|
1,005
|
|
$
|
200
|
|
||||||||
|
Residential – nonagency
|
663
|
|
407
|
|
780
|
|
(1,028
|
)
|
(91
|
)
|
(5
|
)
|
726
|
|
205
|
|
||||||||||||||||
|
Commercial – nonagency
|
1,207
|
|
114
|
|
841
|
|
(1,522
|
)
|
(208
|
)
|
—
|
|
432
|
|
(4
|
)
|
||||||||||||||||
|
Total mortgage-backed securities
|
2,368
|
|
690
|
|
2,440
|
|
(2,931
|
)
|
(399
|
)
|
(5
|
)
|
2,163
|
|
401
|
|
||||||||||||||||
|
Obligations of U.S. states and municipalities
|
1,436
|
|
71
|
|
472
|
|
(251
|
)
|
(346
|
)
|
—
|
|
1,382
|
|
18
|
|
||||||||||||||||
|
Non-U.S. government debt securities
|
67
|
|
4
|
|
1,449
|
|
(1,479
|
)
|
(8
|
)
|
110
|
|
143
|
|
(1
|
)
|
||||||||||||||||
|
Corporate debt securities
|
5,308
|
|
103
|
|
7,602
|
|
(5,975
|
)
|
(1,882
|
)
|
764
|
|
5,920
|
|
466
|
|
||||||||||||||||
|
Loans
|
10,787
|
|
665
|
|
10,411
|
|
(7,431
|
)
|
(685
|
)
|
(292
|
)
|
13,455
|
|
315
|
|
||||||||||||||||
|
Asset-backed securities
|
3,696
|
|
191
|
|
1,912
|
|
(2,379
|
)
|
(292
|
)
|
(1,856
|
)
|
1,272
|
|
105
|
|
||||||||||||||||
|
Total debt instruments
|
23,662
|
|
1,724
|
|
24,286
|
|
(20,446
|
)
|
(3,612
|
)
|
(1,279
|
)
|
24,335
|
|
1,304
|
|
||||||||||||||||
|
Equity securities
|
1,114
|
|
(41
|
)
|
328
|
|
(266
|
)
|
(135
|
)
|
(115
|
)
|
885
|
|
46
|
|
||||||||||||||||
|
Physical Commodities
|
—
|
|
(4
|
)
|
—
|
|
(8
|
)
|
—
|
|
16
|
|
4
|
|
(4
|
)
|
||||||||||||||||
|
Other
|
863
|
|
558
|
|
659
|
|
(95
|
)
|
(120
|
)
|
135
|
|
2,000
|
|
1,074
|
|
||||||||||||||||
|
Total trading assets – debt and equity instruments
|
25,639
|
|
2,237
|
|
(c)
|
25,273
|
|
(20,815
|
)
|
(3,867
|
)
|
(1,243
|
)
|
27,224
|
|
2,420
|
|
(c)
|
||||||||||||||
|
Net derivative receivables:
(a)
|
||||||||||||||||||||||||||||||||
|
Interest rate
|
3,322
|
|
1,358
|
|
344
|
|
(220
|
)
|
(2,391
|
)
|
(34
|
)
|
2,379
|
|
107
|
|
||||||||||||||||
|
Credit
|
1,873
|
|
(1,697
|
)
|
115
|
|
(12
|
)
|
(357
|
)
|
173
|
|
95
|
|
(1,449
|
)
|
||||||||||||||||
|
Foreign exchange
|
(1,750
|
)
|
(101
|
)
|
3
|
|
(4
|
)
|
683
|
|
(31
|
)
|
(1,200
|
)
|
(110
|
)
|
||||||||||||||||
|
Equity
|
(1,806
|
)
|
2,528
|
|
(i)
|
1,305
|
|
(i)
|
(2,111
|
)
|
(i)
|
(1,353
|
)
|
374
|
|
(1,063
|
)
|
872
|
|
|||||||||||||
|
Commodity
|
254
|
|
816
|
|
105
|
|
(3
|
)
|
(1,107
|
)
|
50
|
|
115
|
|
410
|
|
||||||||||||||||
|
Total net derivative receivables
|
1,893
|
|
2,904
|
|
(c)
|
1,872
|
|
(2,350
|
)
|
(4,525
|
)
|
532
|
|
326
|
|
(170
|
)
|
(c)
|
||||||||||||||
|
Available-for-sale securities:
|
||||||||||||||||||||||||||||||||
|
Asset-backed securities
|
28,024
|
|
4
|
|
579
|
|
(57
|
)
|
(57
|
)
|
(27,405
|
)
|
1,088
|
|
4
|
|
||||||||||||||||
|
Other
|
892
|
|
26
|
|
508
|
|
(216
|
)
|
(6
|
)
|
30
|
|
1,234
|
|
25
|
|
||||||||||||||||
|
Total available-for-sale securities
|
28,916
|
|
30
|
|
(d)
|
1,087
|
|
(273
|
)
|
(63
|
)
|
(27,375
|
)
|
2,322
|
|
29
|
|
(d)
|
||||||||||||||
|
Loans
|
2,282
|
|
81
|
|
(c)
|
1,065
|
|
(191
|
)
|
(1,306
|
)
|
—
|
|
1,931
|
|
(21
|
)
|
(c)
|
||||||||||||||
|
Mortgage servicing rights
|
7,614
|
|
1,612
|
|
(e)
|
2,215
|
|
(725
|
)
|
(1,102
|
)
|
—
|
|
9,614
|
|
1,612
|
|
(e)
|
||||||||||||||
|
Other assets:
|
||||||||||||||||||||||||||||||||
|
Private equity investments
|
7,181
|
|
645
|
|
(c)
|
673
|
|
(1,137
|
)
|
(687
|
)
|
(201
|
)
|
6,474
|
|
262
|
|
(c)
|
||||||||||||||
|
All other
|
4,258
|
|
98
|
|
(f)
|
272
|
|
(730
|
)
|
(722
|
)
|
—
|
|
3,176
|
|
53
|
|
(f)
|
||||||||||||||
|
Fair value measurements using significant unobservable inputs
|
||||||||||||||||||||||||||||||||
|
Year ended
December 31, 2013
(in millions)
|
Fair value at January 1, 2013
|
Total realized/unrealized (gains)/losses
|
Transfers into and/or out of level 3
(h)
|
Fair value at Dec. 31, 2013
|
Change in unrealized (gains)/losses related to financial instruments held at Dec. 31, 2013
|
|||||||||||||||||||||||||||
|
Purchases
(g)
|
Sales
|
Issuances
|
Settlements
|
|||||||||||||||||||||||||||||
|
Liabilities:
(b)
|
||||||||||||||||||||||||||||||||
|
Deposits
|
$
|
1,983
|
|
$
|
(82
|
)
|
(c)
|
$
|
—
|
|
$
|
—
|
|
$
|
1,248
|
|
$
|
(222
|
)
|
$
|
(672
|
)
|
$
|
2,255
|
|
$
|
(88
|
)
|
(c)
|
|||
|
Other borrowed funds
|
1,619
|
|
(177
|
)
|
(c)
|
—
|
|
—
|
|
7,108
|
|
(6,845
|
)
|
369
|
|
2,074
|
|
291
|
|
(c)
|
||||||||||||
|
Trading liabilities – debt and equity instruments
|
205
|
|
(83
|
)
|
(c)
|
(2,418
|
)
|
2,594
|
|
—
|
|
(54
|
)
|
(131
|
)
|
113
|
|
(100
|
)
|
(c)
|
||||||||||||
|
Accounts payable and other liabilities
|
36
|
|
(2
|
)
|
(f)
|
—
|
|
—
|
|
—
|
|
(9
|
)
|
—
|
|
25
|
|
(2
|
)
|
(f)
|
||||||||||||
|
Beneficial interests issued by consolidated VIEs
|
925
|
|
174
|
|
(c)
|
—
|
|
—
|
|
353
|
|
(212
|
)
|
—
|
|
1,240
|
|
167
|
|
(c)
|
||||||||||||
|
Long-term debt
|
8,476
|
|
(435
|
)
|
(c)
|
—
|
|
—
|
|
6,830
|
|
(4,362
|
)
|
(501
|
)
|
10,008
|
|
(85
|
)
|
(c)
|
||||||||||||
|
JPMorgan Chase & Co./2014 Annual Report
|
193
|
|
Notes to consolidated financial statements
|
Fair value measurements using significant unobservable inputs
|
||||||||||||||||||||||||||||||||
|
Year ended
December 31, 2012
(in millions)
|
Fair value at January 1, 2012
|
Total realized/unrealized gains/(losses)
|
Transfers into and/or out of level 3
(h)
|
Fair value at
Dec. 31, 2012
|
Change in unrealized gains/(losses) related to financial instruments held at Dec. 31, 2012
|
|||||||||||||||||||||||||||
|
Purchases
(g)
|
Sales
|
Settlements
|
||||||||||||||||||||||||||||||
|
Assets:
|
||||||||||||||||||||||||||||||||
|
Trading assets:
|
||||||||||||||||||||||||||||||||
|
Debt instruments:
|
||||||||||||||||||||||||||||||||
|
Mortgage-backed securities:
|
||||||||||||||||||||||||||||||||
|
U.S. government agencies
|
$
|
86
|
|
$
|
(44
|
)
|
$
|
575
|
|
$
|
(103
|
)
|
$
|
(16
|
)
|
$
|
—
|
|
$
|
498
|
|
$
|
(21
|
)
|
||||||||
|
Residential – nonagency
|
796
|
|
151
|
|
417
|
|
(533
|
)
|
(145
|
)
|
(23
|
)
|
663
|
|
74
|
|
||||||||||||||||
|
Commercial – nonagency
|
1,758
|
|
(159
|
)
|
287
|
|
(475
|
)
|
(104
|
)
|
(100
|
)
|
1,207
|
|
(145
|
)
|
||||||||||||||||
|
Total mortgage-backed securities
|
2,640
|
|
(52
|
)
|
1,279
|
|
(1,111
|
)
|
(265
|
)
|
(123
|
)
|
2,368
|
|
(92
|
)
|
||||||||||||||||
|
Obligations of U.S. states and municipalities
|
1,619
|
|
37
|
|
336
|
|
(552
|
)
|
(4
|
)
|
—
|
|
1,436
|
|
(15
|
)
|
||||||||||||||||
|
Non-U.S. government debt securities
|
104
|
|
(6
|
)
|
661
|
|
(668
|
)
|
(24
|
)
|
—
|
|
67
|
|
(5
|
)
|
||||||||||||||||
|
Corporate debt securities
|
6,373
|
|
187
|
|
8,391
|
|
(6,186
|
)
|
(3,045
|
)
|
(412
|
)
|
5,308
|
|
689
|
|
||||||||||||||||
|
Loans
|
12,209
|
|
836
|
|
5,342
|
|
(3,269
|
)
|
(3,801
|
)
|
(530
|
)
|
10,787
|
|
411
|
|
||||||||||||||||
|
Asset-backed securities
|
7,965
|
|
272
|
|
2,550
|
|
(6,468
|
)
|
(614
|
)
|
(9
|
)
|
3,696
|
|
184
|
|
||||||||||||||||
|
Total debt instruments
|
30,910
|
|
1,274
|
|
18,559
|
|
(18,254
|
)
|
(7,753
|
)
|
(1,074
|
)
|
23,662
|
|
1,172
|
|
||||||||||||||||
|
Equity securities
|
1,177
|
|
(209
|
)
|
460
|
|
(379
|
)
|
(12
|
)
|
77
|
|
1,114
|
|
(112
|
)
|
||||||||||||||||
|
Other
|
880
|
|
186
|
|
68
|
|
(108
|
)
|
(163
|
)
|
—
|
|
863
|
|
180
|
|
||||||||||||||||
|
Total trading assets – debt and equity instruments
|
32,967
|
|
1,251
|
|
(c)
|
19,087
|
|
(18,741
|
)
|
(7,928
|
)
|
(997
|
)
|
25,639
|
|
1,240
|
|
(c)
|
||||||||||||||
|
Net derivative receivables:
(a)
|
||||||||||||||||||||||||||||||||
|
Interest rate
|
3,561
|
|
6,930
|
|
406
|
|
(194
|
)
|
(7,071
|
)
|
(310
|
)
|
3,322
|
|
905
|
|
||||||||||||||||
|
Credit
|
7,732
|
|
(4,487
|
)
|
124
|
|
(84
|
)
|
(1,416
|
)
|
4
|
|
1,873
|
|
(3,271
|
)
|
||||||||||||||||
|
Foreign exchange
|
(1,263
|
)
|
(800
|
)
|
112
|
|
(184
|
)
|
436
|
|
(51
|
)
|
(1,750
|
)
|
(957
|
)
|
||||||||||||||||
|
Equity
|
(3,105
|
)
|
160
|
|
(i)
|
1,279
|
|
(i)
|
(2,174
|
)
|
(i)
|
899
|
|
1,135
|
|
(1,806
|
)
|
580
|
|
|||||||||||||
|
Commodity
|
(687
|
)
|
(673
|
)
|
74
|
|
64
|
|
1,278
|
|
198
|
|
254
|
|
(160
|
)
|
||||||||||||||||
|
Total net derivative receivables
|
6,238
|
|
1,130
|
|
(c)
|
1,995
|
|
(2,572
|
)
|
(5,874
|
)
|
976
|
|
1,893
|
|
(2,903
|
)
|
(c)
|
||||||||||||||
|
Available-for-sale securities:
|
||||||||||||||||||||||||||||||||
|
Asset-backed securities
|
24,958
|
|
135
|
|
9,280
|
|
(3,361
|
)
|
(3,104
|
)
|
116
|
|
28,024
|
|
118
|
|
||||||||||||||||
|
Other
|
528
|
|
55
|
|
667
|
|
(113
|
)
|
(245
|
)
|
—
|
|
892
|
|
59
|
|
||||||||||||||||
|
Total available-for-sale securities
|
25,486
|
|
190
|
|
(d)
|
9,947
|
|
(3,474
|
)
|
(3,349
|
)
|
116
|
|
28,916
|
|
177
|
|
(d)
|
||||||||||||||
|
Loans
|
1,647
|
|
695
|
|
(c)
|
1,536
|
|
(22
|
)
|
(1,718
|
)
|
144
|
|
2,282
|
|
12
|
|
(c)
|
||||||||||||||
|
Mortgage servicing rights
|
7,223
|
|
(635
|
)
|
(e)
|
2,833
|
|
(579
|
)
|
(1,228
|
)
|
—
|
|
7,614
|
|
(635
|
)
|
(e)
|
||||||||||||||
|
Other assets:
|
||||||||||||||||||||||||||||||||
|
Private equity investments
|
6,751
|
|
420
|
|
(c)
|
1,545
|
|
(512
|
)
|
(977
|
)
|
(46
|
)
|
7,181
|
|
333
|
|
(c)
|
||||||||||||||
|
All other
|
4,374
|
|
(195
|
)
|
(f)
|
818
|
|
(238
|
)
|
(501
|
)
|
—
|
|
4,258
|
|
(200
|
)
|
(f)
|
||||||||||||||
|
Fair value measurements using significant unobservable inputs
|
||||||||||||||||||||||||||||||||
|
Year ended
December 31, 2012
(in millions)
|
Fair value at January 1, 2012
|
Total realized/unrealized (gains)/losses
|
Transfers into and/or out of level 3
(h)
|
Fair value at Dec. 31, 2012
|
Change in unrealized (gains)/losses related to financial instruments held at Dec. 31, 2012
|
|||||||||||||||||||||||||||
|
Purchases
(g)
|
Sales
|
Issuances
|
Settlements
|
|||||||||||||||||||||||||||||
|
Liabilities:
(b)
|
||||||||||||||||||||||||||||||||
|
Deposits
|
$
|
1,418
|
|
$
|
212
|
|
(c)
|
$
|
—
|
|
$
|
—
|
|
$
|
1,236
|
|
$
|
(380
|
)
|
$
|
(503
|
)
|
$
|
1,983
|
|
$
|
185
|
|
(c)
|
|||
|
Other borrowed funds
|
1,507
|
|
148
|
|
(c)
|
—
|
|
—
|
|
1,646
|
|
(1,774
|
)
|
92
|
|
1,619
|
|
72
|
|
(c)
|
||||||||||||
|
Trading liabilities – debt and equity instruments
|
211
|
|
(16
|
)
|
(c)
|
(2,875
|
)
|
2,940
|
|
—
|
|
(50
|
)
|
(5
|
)
|
205
|
|
(12
|
)
|
(c)
|
||||||||||||
|
Accounts payable and other liabilities
|
51
|
|
1
|
|
(f)
|
—
|
|
—
|
|
—
|
|
(16
|
)
|
—
|
|
36
|
|
1
|
|
(f)
|
||||||||||||
|
Beneficial interests issued by consolidated VIEs
|
791
|
|
181
|
|
(c)
|
—
|
|
—
|
|
221
|
|
(268
|
)
|
—
|
|
925
|
|
143
|
|
(c)
|
||||||||||||
|
Long-term debt
|
10,310
|
|
328
|
|
(c)
|
—
|
|
—
|
|
3,662
|
|
(4,511
|
)
|
(1,313
|
)
|
8,476
|
|
(101
|
)
|
(c)
|
||||||||||||
|
(a)
|
All level 3 derivatives are presented on a net basis, irrespective of underlying counterparty.
|
|
(b)
|
Level 3 liabilities as a percentage of total Firm liabilities accounted for at fair value (including liabilities measured at fair value on a nonrecurring basis) were
15%
,
18%
and
18%
at
December 31, 2014
,
2013
and
2012
, respectively.
|
|
(c)
|
Predominantly reported in principal transactions revenue, except for changes in fair value for CCB mortgage loans, lending-related commitments originated with the intent to sell, and mortgage loan purchase commitments, which are reported in mortgage fees and related income.
|
|
194
|
JPMorgan Chase & Co./2014 Annual Report
|
|
|
(d)
|
Realized gains/(losses) on AFS securities, as well as other-than-temporary impairment losses that are recorded in earnings, are reported in securities gains. Unrealized gains/(losses) are reported in Other Comprehensive Income (“OCI”). Realized gains/(losses) and foreign exchange remeasurement adjustments recorded in income on AFS securities were
$(43) million
,
$17 million
, and
$145 million
for the years ended
December 31, 2014
,
2013
and
2012
, respectively. Unrealized gains/(losses) recorded on AFS securities in OCI were
$(16) million
,
$13 million
and
$45 million
for the years ended
December 31, 2014
,
2013
and
2012
, respectively.
|
|
(e)
|
Changes in fair value for CCB mortgage servicing rights are reported in mortgage fees and related income.
|
|
(f)
|
Predominantly reported in other income.
|
|
(g)
|
Loan originations are included in purchases.
|
|
(h)
|
All transfers into and/or out of level 3 are assumed to occur at the beginning of the quarterly reporting period in which they occur.
|
|
(i)
|
The prior period amounts have been revised. The revision had no impact on the Firm’s Consolidated balance sheets or its results of operations.
|
Level 3 analysis
Consolidated balance sheets changes
Level 3 assets (including assets measured at fair value on a nonrecurring basis) were
2.1%
of total Firm assets at
December 31, 2014
. The following describes significant changes to level 3 assets since December 31, 2013, for those items measured at fair value on a recurring basis. For further information on changes impacting items measured at fair value on a nonrecurring basis, see Assets and liabilities measured at fair value on a nonrecurring basis on
page 197
.
For the year ended
December 31, 2014
Level 3 assets were
$50.9 billion
at
December 31, 2014
, reflecting a decrease of
$18.4 billion
from December 31, 2013, due to the following:
|
•
|
$6.0 billion
decrease in gross derivative receivables due to a
$4.5 billion
decrease in equity derivative receivables due to expirations and a transfer from level 3 into level 2 as a result of an increase in observability of certain equity option valuation inputs; and a
|
$1.2 billion
decrease in interest rate derivatives due to market movements;
|
•
|
$4.7 billion
decrease in trading assets - debt and equity instruments is largely due to a decrease of
$2.9 billion
in corporate debt securities. The decrease in corporate debt securities is driven by transfers from level 3 to level 2 as a result of an increase in observability of certain valuation inputs, as well as net sales and maturities;
|
|
•
|
$4.0 billion
decrease in private equity investments predominantly driven by
$2.0 billion
in sales and
$2.3 billion
of transfers into level 2 based on an increase in observability and price transparency;
|
|
•
|
$2.2 billion
decrease in MSRs. For further discussion of the change, refer to Note 17.
|
Gains and losses
The following describes significant components of total realized/unrealized gains/(losses) for instruments measured at fair value on a recurring basis for the years ended December 31, 2014, 2013 and 2012. For further information on these instruments, see Changes in level 3 recurring fair value measurements rollforward tables on
pages 191–195
.
2014
|
•
|
$1.8 billion
of losses on MSRs. For further discussion of the change, refer to Note 17;
|
|
•
|
$1.1 billion
of net gains on trading assets - debt and equity instruments, largely driven by market movements and client-driven financing transactions.
|
2013
|
•
|
$
2.9 billion
of net gains on derivatives, largely driven by $
2.5 billion
of gains on equity derivatives, primarily related to client-driven market-making activity and a rise in equity markets; and $
1.4 billion
of gains, predominantly on interest rate lock and mortgage loan purchase commitments; partially offset by $
1.7 billion
of losses on credit derivatives from the impact of tightening reference entity credit spreads;
|
|
•
|
$
2.2 billion
of net gains on trading assets - debt and equity instruments, largely driven by market making and credit spread tightening in nonagency mortgage-backed securities and trading loans, and the impact of market movements on client-driven financing transactions;
|
|
•
|
$
1.6 billion
of net gains on MSRs. For further discussion of the change, refer to Note 17.
|
2012
|
•
|
$1.3 billion
of net gains on trading assets - debt and equity instruments, largely driven by tightening of credit spreads and fluctuation in foreign exchange rates;
|
•
$1.1 billion
of net gains on derivatives, driven by
$6.9 billion
of net gains predominantly on interest rate lock commitments due to increased volumes and lower interest rates, partially offset by
$4.5 billion
of net losses on credit derivatives largely as a result of tightening of reference entity credit spreads.
|
JPMorgan Chase & Co./2014 Annual Report
|
195
|
|
Notes to consolidated financial statements
Credit and funding adjustments
When determining the fair value of an instrument, it may be necessary to record adjustments to the Firm’s estimates of fair value in order to reflect counterparty credit quality, the Firm’s own creditworthiness, and the impact of funding:
|
•
|
Credit valuation adjustments (“CVA”) are taken to reflect the credit quality of a counterparty in the valuation of derivatives. CVA are necessary when the market price (or parameter) is not indicative of the credit quality of the counterparty. As few classes of derivative contracts are listed on an exchange, derivative positions are predominantly valued using models that use as their basis observable market parameters. An adjustment therefore may be necessary to reflect the credit quality of each derivative counterparty to arrive at fair value.
|
The Firm estimates derivatives CVA using a scenario analysis to estimate the expected credit exposure across all of the Firm’s positions with each counterparty, and then estimates losses as a result of a counterparty credit event. The key inputs to this methodology are (i) the expected positive exposure to each counterparty based on a simulation that assumes the current population of existing derivatives with each counterparty remains unchanged and considers contractual factors designed to mitigate the Firm’s credit exposure, such as collateral and legal rights of offset; (ii) the probability of a default event occurring for each counterparty, as derived from observed or estimated CDS spreads; and (iii) estimated recovery rates implied by CDS, adjusted to consider the differences in recovery rates as a derivative creditor relative to those reflected in CDS spreads, which generally reflect senior unsecured creditor risk. As such, the Firm estimates derivatives CVA relative to the relevant benchmark interest rate.
|
•
|
DVA is taken to reflect the credit quality of the Firm in the valuation of liabilities measured at fair value. The DVA calculation methodology is generally consistent with the CVA methodology described above and incorporates JPMorgan Chase’s credit spread as observed through the CDS market to estimate the probability of default and loss given default as a result of a systemic event affecting the Firm. Structured notes DVA is estimated using the current fair value of the structured note as the exposure amount, and is otherwise consistent with the derivative DVA methodology.
|
|
•
|
The Firm incorporates the impact of funding in its valuation estimates where there is evidence that a market participant in the principal market would incorporate it in a transfer of the instrument. As a result, the fair value of collateralized derivatives is estimated by discounting expected future cash flows at the relevant overnight indexed swap (“OIS”) rate given the underlying collateral agreement with the counterparty. Effective in 2013, the Firm implemented a FVA framework to incorporate the impact of funding into its
|
valuation estimates for uncollateralized (including partially collateralized) over-the-counter (“OTC”) derivatives and structured notes. The Firm’s FVA framework leverages its existing CVA and DVA calculation methodologies, and considers the fact that the Firm’s own credit risk is a significant component of funding costs. The key inputs are: (i) the expected funding requirements arising from the Firm’s positions with each counterparty and collateral arrangements; (ii) for assets, the estimated market funding cost in the principal market; and (iii) for liabilities, the hypothetical market funding cost for a transfer to a market participant with a similar credit standing as the Firm.
Upon the implementation of the FVA framework in 2013, the Firm recorded a one time
$1.5 billion
loss in principal transactions revenue that was recorded in the CIB. While the FVA framework applies to both assets and liabilities, the loss on implementation largely related to uncollateralized derivative receivables given that the impact of the Firm’s own credit risk, which is a significant component of funding costs, was already incorporated in the valuation of liabilities through the application of DVA.
The following table provides the credit and funding adjustments, excluding the effect of any associated hedging activities, reflected within the Consolidated balance sheets as of the dates indicated.
|
December 31, (in millions)
|
2014
|
2013
|
|||||
|
Derivative receivables balance
(a)
|
$
|
78,975
|
|
$
|
65,759
|
|
|
|
Derivative payables balance
(a)
|
71,116
|
|
57,314
|
|
|||
|
Derivatives CVA
(b)
|
(2,674
|
)
|
(2,352
|
)
|
|||
|
Derivatives DVA and FVA
(b)(c)
|
(380
|
)
|
(322
|
)
|
|||
|
Structured notes balance
(a)(d)
|
53,772
|
|
48,808
|
|
|||
|
Structured notes DVA and FVA
(b)(e)
|
1,152
|
|
952
|
|
|||
|
(a)
|
Balances are presented net of applicable CVA and DVA/FVA.
|
|
(b)
|
Positive CVA and DVA/FVA represent amounts that increased receivable balances or decreased payable balances; negative CVA and DVA/FVA represent amounts that decreased receivable balances or increased payable balances.
|
|
(c)
|
At
December 31, 2014
and
2013
, included derivatives DVA of
$714 million
and
$715 million
, respectively.
|
|
(d)
|
Structured notes are predominantly financial instruments containing embedded derivatives that are measured at fair value based on the Firm’s election under the fair value option. At
December 31, 2014
and
2013
, included
$943 million
and
$1.1 billion
, respectively, of financial instruments with no embedded derivative for which the fair value option has also been elected. For further information on these elections, see Note 4.
|
|
(e)
|
At
December 31, 2014
and
2013
, included structured notes DVA of
$1.4 billion
and
$1.4 billion
, respectively.
|
|
196
|
JPMorgan Chase & Co./2014 Annual Report
|
|
The following table provides the impact of credit and funding adjustments on Principal transactions revenue in the respective periods, excluding the effect of any associated hedging activities.
|
Year ended December 31,
(in millions)
|
2014
|
2013
|
2012
|
||||||||
|
Credit adjustments:
|
|||||||||||
|
Derivatives CVA
|
$
|
(322
|
)
|
$
|
1,886
|
|
$
|
2,698
|
|
||
|
Derivatives DVA and FVA
(a)
|
(58
|
)
|
(1,152
|
)
|
(590
|
)
|
|||||
|
Structured notes DVA and FVA
(b)
|
200
|
|
(760
|
)
|
(340
|
)
|
|||||
|
(a)
|
Included derivatives DVA of
$(1) million
,
$(115) million
and
$(590) million
for the years ended
December 31, 2014
,
2013
and
2012
, respectively.
|
|
(b)
|
Included structured notes DVA of
$20 million
,
$(337) million
and
$(340) million
for the years ended
December 31, 2014
,
2013
and
2012
, respectively.
|
Assets and liabilities measured at fair value on a nonrecurring basis
At
December 31, 2014
and 2013, assets measured at fair value on a nonrecurring basis were
$4.5 billion
and
$6.2 billion
, respectively, comprised predominantly of loans that had fair value adjustments for the year ended December 31, 2014. At December 31, 2014,
$1.3 billion
and
$3.2 billion
of these assets were classified in levels 2 and 3 of the fair value hierarchy, respectively. At December 31, 2013, $
339 million
and $
5.8 billion
of these assets were classified in levels 2 and 3 of the fair value hierarchy, respectively. Liabilities measured at fair value on a nonrecurring basis were not significant at December 31, 2014 and 2013. For the years ended December 31, 2014, 2013 and 2012, there were no significant transfers between levels 1, 2
and 3.
Of the
$3.2 billion
of the level 3 assets measured at fair value on a nonrecurring basis as of December 31, 2014:
|
•
|
$1.6 billion
related to consumer loans that were reclassified to held-for-sale during the fourth quarter of 2014 subject to a lower of cost or fair value adjustment. These loans were classified as level 3, as they are valued based on the Firm’s internal valuation methodology;
|
|
•
|
$809 million
related to residential real estate loans carried at the net realizable value of the underlying collateral (i.e., collateral-dependent loans and other loans charged off in accordance with regulatory guidance). These amounts are classified as level 3, as they are valued using a broker’s price opinion and discounted based upon the Firm’s experience with actual liquidation values. These discounts to the broker price opinions ranged from
8%
to
66%
, with a weighted average of
26%
.
|
The total change in the recorded value of assets and liabilities for which a fair value adjustment has been included in the Consolidated statements of income for the years ended December 31, 2014, 2013 and 2012, related to financial instruments held at those dates were losses of
$992 million
,
$789 million
and
$1.6 billion
, respectively; these reductions were predominantly associated with loans.
For further information about the measurement of impaired collateral-dependent loans, and other loans where the carrying value is based on the fair value of the underlying collateral (e.g., residential mortgage loans charged off in accordance with regulatory guidance), see Note 14.
Additional disclosures about the fair value of financial instruments that are not carried on the Consolidated balance sheets at fair value
U.S. GAAP requires disclosure of the estimated fair value of certain financial instruments, and the methods and significant assumptions used to estimate their fair value. Financial instruments within the scope of these disclosure requirements are included in the following table. However, certain financial instruments and all nonfinancial instruments are excluded from the scope of these disclosure requirements. Accordingly, the fair value disclosures provided in the following table include only a partial estimate of the fair value of JPMorgan Chase’s assets and liabilities. For example, the Firm has developed long-term relationships with its customers through its deposit base and credit card accounts, commonly referred to as core deposit intangibles and credit card relationships. In the opinion of management, these items, in the aggregate, add significant value to JPMorgan Chase, but their fair value is not disclosed in this Note.
Financial instruments for which carrying value approximates fair value
Certain financial instruments that are not carried at fair value on the Consolidated balance sheets are carried at amounts that approximate fair value, due to their short-term nature and generally negligible credit risk. These instruments include cash and due from banks; deposits with banks; federal funds sold; securities purchased under resale agreements and securities borrowed with short-dated maturities; short-term receivables and accrued interest receivable; commercial paper; federal funds purchased; securities loaned and sold under repurchase agreements with short-dated maturities; other borrowed funds; accounts payable; and accrued liabilities. In addition, U.S. GAAP requires that the fair value of deposit liabilities with no stated maturity (i.e., demand, savings and certain money market deposits) be equal to their carrying value; recognition of the inherent funding value of these instruments is not permitted.
|
JPMorgan Chase & Co./2014 Annual Report
|
197
|
|
Notes to consolidated financial statements
The following table presents by fair value hierarchy classification the carrying values and estimated fair values at
December 31, 2014
and
2013
, of financial assets and liabilities, excluding financial instruments which are carried at fair value on a recurring basis. For additional information regarding the financial instruments within the scope of this disclosure, and the methods and significant assumptions used to estimate their fair value, see
pages 181–184
of this Note.
|
December 31, 2014
|
December 31, 2013
|
||||||||||||||||||||||||||||||
|
Estimated fair value hierarchy
|
Estimated fair value hierarchy
|
||||||||||||||||||||||||||||||
|
(in billions)
|
Carrying
value
|
Level 1
|
Level 2
|
Level 3
|
Total estimated
fair value
|
Carrying
value
|
Level 1
|
Level 2
|
Level 3
|
Total estimated
fair value
|
|||||||||||||||||||||
|
Financial assets
|
|||||||||||||||||||||||||||||||
|
Cash and due from banks
|
$
|
27.8
|
|
$
|
27.8
|
|
$
|
—
|
|
$
|
—
|
|
$
|
27.8
|
|
$
|
39.8
|
|
$
|
39.8
|
|
$
|
—
|
|
$
|
—
|
|
$
|
39.8
|
|
|
|
Deposits with banks
|
484.5
|
|
480.4
|
|
4.1
|
|
—
|
|
484.5
|
|
316.1
|
|
309.7
|
|
6.4
|
|
—
|
|
316.1
|
|
|||||||||||
|
Accrued interest and accounts receivable
|
70.1
|
|
—
|
|
70.0
|
|
0.1
|
|
70.1
|
|
65.2
|
|
—
|
|
64.9
|
|
0.3
|
|
65.2
|
|
|||||||||||
|
Federal funds sold and securities purchased under resale agreements
|
187.2
|
|
—
|
|
187.2
|
|
—
|
|
187.2
|
|
223.0
|
|
—
|
|
223.0
|
|
—
|
|
223.0
|
|
|||||||||||
|
Securities borrowed
|
109.4
|
|
—
|
|
109.4
|
|
—
|
|
109.4
|
|
107.7
|
|
—
|
|
107.7
|
|
—
|
|
107.7
|
|
|||||||||||
|
Securities, held-to-maturity
(a)
|
49.3
|
|
—
|
|
51.2
|
|
—
|
|
51.2
|
|
24.0
|
|
—
|
|
23.7
|
|
—
|
|
23.7
|
|
|||||||||||
|
Loans, net of allowance for loan losses
(b)
|
740.5
|
|
—
|
|
21.8
|
|
723.1
|
|
744.9
|
|
720.1
|
|
—
|
|
23.0
|
|
697.2
|
|
720.2
|
|
|||||||||||
|
Other
(c)
|
58.1
|
|
—
|
|
55.7
|
|
7.1
|
|
62.8
|
|
58.2
|
|
—
|
|
54.5
|
|
7.4
|
|
61.9
|
|
|||||||||||
|
Financial liabilities
|
|||||||||||||||||||||||||||||||
|
Deposits
|
$
|
1,354.6
|
|
$
|
—
|
|
$
|
1,353.6
|
|
$
|
1.2
|
|
$
|
1,354.8
|
|
$
|
1,281.1
|
|
$
|
—
|
|
$
|
1,280.3
|
|
$
|
1.2
|
|
$
|
1,281.5
|
|
|
|
Federal funds purchased and securities loaned or sold under repurchase agreements
|
189.1
|
|
—
|
|
189.1
|
|
—
|
|
189.1
|
|
175.7
|
|
—
|
|
175.7
|
|
—
|
|
175.7
|
|
|||||||||||
|
Commercial paper
|
66.3
|
|
—
|
|
66.3
|
|
—
|
|
66.3
|
|
57.8
|
|
—
|
|
57.8
|
|
—
|
|
57.8
|
|
|||||||||||
|
Other borrowed funds
|
15.5
|
|
|
|
15.5
|
|
—
|
|
15.5
|
|
14.7
|
|
—
|
|
14.7
|
|
—
|
|
14.7
|
|
|||||||||||
|
Accounts payable and other liabilities
|
176.7
|
|
—
|
|
173.7
|
|
2.8
|
|
176.5
|
|
160.2
|
|
—
|
|
158.2
|
|
1.8
|
|
160.0
|
|
|||||||||||
|
Beneficial interests issued by consolidated VIEs
|
50.2
|
|
—
|
|
48.2
|
|
2.0
|
|
50.2
|
|
47.6
|
|
—
|
|
44.3
|
|
3.2
|
|
47.5
|
|
|||||||||||
|
Long-term debt and junior subordinated deferrable interest debentures
(d)
|
246.6
|
|
—
|
|
251.6
|
|
3.8
|
|
255.4
|
|
239.0
|
|
—
|
|
240.8
|
|
6.0
|
|
246.8
|
|
|||||||||||
|
(a)
|
Carrying value includes unamortized discount or premium.
|
|
(b)
|
Fair value is typically estimated using a discounted cash flow model that incorporates the characteristics of the underlying loans (including principal, contractual interest rate and contractual fees) and other key inputs, including expected lifetime credit losses, interest rates, prepayment rates, and primary origination or secondary market spreads. For certain loans, the fair value is measured based on the value of the underlying collateral. The difference between the estimated fair value and carrying value of a financial asset or liability is the result of the different methodologies used to determine fair value as compared with carrying value. For example, credit losses are estimated for a financial asset’s remaining life in a fair value calculation but are estimated for a loss emergence period in the allowance for loan loss calculation; future loan income (interest and fees) is incorporated in a fair value calculation but is generally not considered in the allowance for loan losses. For a further discussion of the Firm’s methodologies for estimating the fair value of loans and lending-related commitments, see Valuation hierarchy on
pages 181–184
.
|
|
(c)
|
Current period amounts have been updated to include certain nonmarketable equity securities. Prior period amounts have been revised to conform to the current presentation.
|
|
(d)
|
Carrying value includes unamortized original issue discount and other valuation adjustments.
|
|
198
|
JPMorgan Chase & Co./2014 Annual Report
|
|
The majority of the Firm’s lending-related commitments are not carried at fair value on a recurring basis on the Consolidated balance sheets, nor are they actively traded. The carrying value and estimated fair value of the Firm’s wholesale lending-related commitments were as follows for the periods indicated.
|
December 31, 2014
|
December 31, 2013
|
||||||||||||||||||||||||||||||
|
Estimated fair value hierarchy
|
Estimated fair value hierarchy
|
||||||||||||||||||||||||||||||
|
(in billions)
|
Carrying value
(a)
|
Level 1
|
Level 2
|
Level 3
|
Total estimated fair value
|
Carrying value
(a)
|
Level 1
|
Level 2
|
Level 3
|
Total estimated fair value
|
|||||||||||||||||||||
|
Wholesale lending-related commitments
|
$
|
0.6
|
|
$
|
—
|
|
$
|
—
|
|
$
|
1.6
|
|
$
|
1.6
|
|
$
|
0.7
|
|
$
|
—
|
|
$
|
—
|
|
$
|
1.0
|
|
$
|
1.0
|
|
|
|
(a)
|
Represents the allowance for wholesale lending-related commitments. Excludes the current carrying values of the guarantee liability and the offsetting asset, each of which are recognized at fair value at the inception of guarantees.
|
The Firm does not estimate the fair value of consumer lending-related commitments. In many cases, the Firm can reduce or cancel these commitments by providing the borrower notice or, in some cases as permitted by law, without notice. For a further discussion of the valuation of lending-related commitments, see
page 182
of this Note.
Trading assets and liabilities
Trading assets include debt and equity instruments owned by JPMorgan Chase (“long” positions) that are held for client market-making and client-driven activities, as well as for certain risk management activities, certain loans managed on a fair value basis and for which the Firm has elected the fair value option, and physical commodities
inventories that are generally accounted for at the lower of cost or market (market approximates fair value). Trading liabilities include debt and equity instruments that the Firm has sold to other parties but does not own (“short” positions). The Firm is obligated to purchase instruments at a future date to cover the short positions. Included in trading assets and trading liabilities are the reported receivables (unrealized gains) and payables (unrealized losses) related to derivatives. Trading assets and liabilities are carried at fair value on the Consolidated balance sheets. Balances reflect the reduction of securities owned (long positions) by the amount of identical securities sold but not yet purchased (short positions).
Trading assets and liabilities – average balances
Average trading assets and liabilities were as follows for the periods indicated.
|
Year ended December 31, (in millions)
|
2014
|
2013
|
2012
|
|||||||||
|
Trading assets – debt and equity instruments
|
$
|
327,259
|
|
$
|
340,449
|
|
$
|
349,337
|
|
|||
|
Trading assets – derivative receivables
|
67,123
|
|
72,629
|
|
85,744
|
|
||||||
|
Trading liabilities – debt and equity instruments
(a)
|
84,707
|
|
77,706
|
|
69,001
|
|
||||||
|
Trading liabilities – derivative payables
|
54,758
|
|
64,553
|
|
76,162
|
|
||||||
|
(a)
|
Primarily represent securities sold, not yet purchased.
|
The fair value option provides an option to elect fair value as an alternative measurement for selected financial assets, financial liabilities, unrecognized firm commitments, and written loan commitments not previously carried at fair value.
The Firm has elected to measure certain instruments at fair value in order to:
|
•
|
Mitigate income statement volatility caused by the differences in the measurement basis of elected instruments (for example, certain instruments elected were previously accounted for on an accrual basis) while the associated risk management arrangements are accounted for on a fair value basis;
|
|
•
|
Eliminate the complexities of applying certain accounting models (e.g., hedge accounting or bifurcation accounting for hybrid instruments); and/or
|
|
•
|
Better reflect those instruments that are managed on a fair value basis.
|
The Firm has elected to measure the following instruments at fair value:
|
•
|
Loans purchased or originated as part of securitization warehousing activity, subject to bifurcation accounting, or managed on a fair value basis.
|
|
•
|
Securities financing arrangements with an embedded derivative and/or a maturity of greater than one year.
|
|
•
|
Owned beneficial interests in securitized financial assets that contain embedded credit derivatives, which would otherwise be required to be separately accounted for as a derivative instrument.
|
|
•
|
Certain investments that receive tax credits and other equity investments acquired as part of the Washington Mutual transaction.
|
|
•
|
Structured notes issued as part of CIB’s client-driven activities. (Structured notes are predominantly financial instruments that contain embedded derivatives.)
|
|
•
|
Long-term beneficial interests issued by CIB’s consolidated securitization trusts where the underlying assets are carried at fair value.
|
|
JPMorgan Chase & Co./2014 Annual Report
|
199
|
|
Notes to consolidated financial statements
Changes in fair value under the fair value option election
The following table presents the changes in fair value included in the Consolidated statements of income for the years ended
December 31, 2014
,
2013
and
2012
, for items for which the fair value option was elected. The profit and loss information presented below only includes the financial instruments that were elected to be measured at fair value; related risk management instruments, which are required to be measured at fair value, are not included in the table.
|
2014
|
2013
|
2012
|
||||||||||||||||||||||||||||||
|
December 31, (in millions)
|
Principal transactions
|
All other income
|
Total changes in fair value recorded
|
Principal transactions
|
All other income
|
Total changes in fair value recorded
|
Principal transactions
|
All other income
|
Total changes in fair value recorded
|
|||||||||||||||||||||||
|
Federal funds sold and securities purchased under resale agreements
|
$
|
(15
|
)
|
$
|
—
|
|
$
|
(15
|
)
|
$
|
(454
|
)
|
$
|
—
|
|
$
|
(454
|
)
|
$
|
161
|
|
$
|
—
|
|
$
|
161
|
|
|||||
|
Securities borrowed
|
(10
|
)
|
—
|
|
(10
|
)
|
10
|
|
—
|
|
10
|
|
10
|
|
—
|
|
10
|
|
||||||||||||||
|
Trading assets:
|
—
|
|
—
|
|
||||||||||||||||||||||||||||
|
Debt and equity instruments, excluding loans
|
639
|
|
—
|
|
639
|
|
582
|
|
7
|
|
589
|
|
513
|
|
7
|
|
520
|
|
||||||||||||||
|
Loans reported as trading assets:
|
|
|
|
|
||||||||||||||||||||||||||||
|
Changes in instrument-specific credit risk
|
885
|
|
29
|
|
(c)
|
914
|
|
1,161
|
|
23
|
|
(c)
|
1,184
|
|
1,489
|
|
81
|
|
(c)
|
1,570
|
|
|||||||||||
|
Other changes in fair value
|
352
|
|
1,353
|
|
(c)
|
1,705
|
|
(133
|
)
|
1,833
|
|
(c)
|
1,700
|
|
(183
|
)
|
7,670
|
|
(c)
|
7,487
|
|
|||||||||||
|
Loans:
|
|
|
|
|
||||||||||||||||||||||||||||
|
Changes in instrument-specific credit risk
|
40
|
|
—
|
|
40
|
|
36
|
|
—
|
|
36
|
|
(14
|
)
|
—
|
|
(14
|
)
|
||||||||||||||
|
Other changes in fair value
|
34
|
|
—
|
|
34
|
|
17
|
|
—
|
|
17
|
|
676
|
|
—
|
|
676
|
|
||||||||||||||
|
Other assets
|
24
|
|
(122
|
)
|
(d)
|
(98
|
)
|
32
|
|
(29
|
)
|
(d)
|
3
|
|
—
|
|
(339
|
)
|
(d)
|
(339
|
)
|
|||||||||||
|
Deposits
(a)
|
(287
|
)
|
—
|
|
(287
|
)
|
260
|
|
—
|
|
260
|
|
(188
|
)
|
—
|
|
(188
|
)
|
||||||||||||||
|
Federal funds purchased and securities loaned or sold under repurchase agreements
|
(33
|
)
|
—
|
|
(33
|
)
|
73
|
|
—
|
|
73
|
|
(25
|
)
|
—
|
|
(25
|
)
|
||||||||||||||
|
Other borrowed funds
(a)
|
(891
|
)
|
—
|
|
(891
|
)
|
(399
|
)
|
—
|
|
(399
|
)
|
494
|
|
—
|
|
494
|
|
||||||||||||||
|
Trading liabilities
|
(17
|
)
|
—
|
|
(17
|
)
|
(46
|
)
|
—
|
|
(46
|
)
|
(41
|
)
|
—
|
|
(41
|
)
|
||||||||||||||
|
Beneficial interests issued by consolidated VIEs
|
(233
|
)
|
—
|
|
(233
|
)
|
(278
|
)
|
—
|
|
(278
|
)
|
(166
|
)
|
—
|
|
(166
|
)
|
||||||||||||||
|
Other liabilities
|
(27
|
)
|
—
|
|
(27
|
)
|
—
|
|
2
|
|
2
|
|
—
|
|
—
|
|
—
|
|
||||||||||||||
|
Long-term debt:
|
|
|
|
|
||||||||||||||||||||||||||||
|
Changes in instrument-specific credit risk
(a)
|
101
|
|
—
|
|
101
|
|
(271
|
)
|
—
|
|
(271
|
)
|
(835
|
)
|
—
|
|
(835
|
)
|
||||||||||||||
|
Other changes in fair value
(b)
|
(615
|
)
|
—
|
|
(615
|
)
|
1,280
|
|
—
|
|
1,280
|
|
(1,025
|
)
|
—
|
|
(1,025
|
)
|
||||||||||||||
|
(a)
|
Total changes in instrument-specific credit risk (DVA) related to structured notes were
$20 million
,
$(337) million
and
$(340) million
for the years ended
December 31, 2014
,
2013
and
2012
, respectively. These totals include such changes for structured notes classified within deposits and other borrowed funds, as well as long-term debt.
|
|
(b)
|
Structured notes are predominantly financial instruments containing embedded derivatives. Where present, the embedded derivative is the primary driver of risk. Although the risk associated with the structured notes is actively managed, the gains/(losses) reported in this table do not include the income statement impact of the risk management instruments used to manage such risk.
|
|
(c)
|
Reported in mortgage fees and related income.
|
|
(d)
|
Reported in other income.
|
Determination of instrument-specific credit risk for items for which a fair value election was made
The following describes how the gains and losses included in earnings that are attributable to changes in instrument-specific credit risk, were determined.
|
•
|
Loans and lending-related commitments: For floating-rate instruments, all changes in value are attributed to instrument-specific credit risk. For fixed-rate instruments, an allocation of the changes in value for the period is made between those changes in value that are interest rate-related and changes in value that are credit-related. Allocations are generally based on an analysis of borrower-specific credit spread and recovery
|
information, where available, or benchmarking to similar entities or industries.
|
•
|
Long-term debt: Changes in value attributable to instrument-specific credit risk were derived principally from observable changes in the Firm’s credit spread.
|
|
•
|
Resale and repurchase agreements, securities borrowed agreements and securities lending agreements: Generally, for these types of agreements, there is a requirement that collateral be maintained with a market value equal to or in excess of the principal amount loaned; as a result, there would be no adjustment or an immaterial adjustment for instrument-specific credit risk related to these agreements.
|
|
200
|
JPMorgan Chase & Co./2014 Annual Report
|
|
Difference between aggregate fair value and aggregate remaining contractual principal balance outstanding
The following table reflects the difference between the aggregate fair value and the aggregate remaining contractual principal balance outstanding as of
December 31, 2014
and
2013
, for loans, long-term debt and long-term beneficial interests for which the fair value option has been elected.
|
2014
|
2013
|
||||||||||||||||||||
|
December 31, (in millions)
|
Contractual principal outstanding
|
Fair value
|
Fair value over/(under) contractual principal outstanding
|
Contractual principal outstanding
|
Fair value
|
Fair value over/(under) contractual principal outstanding
|
|||||||||||||||
|
Loans
(a)
|
|||||||||||||||||||||
|
Nonaccrual loans
|
|||||||||||||||||||||
|
Loans reported as trading assets
|
$
|
3,847
|
|
$
|
905
|
|
$
|
(2,942
|
)
|
$
|
5,156
|
|
$
|
1,491
|
|
$
|
(3,665
|
)
|
|||
|
Loans
|
7
|
|
7
|
|
—
|
|
209
|
|
154
|
|
(55
|
)
|
|||||||||
|
Subtotal
|
3,854
|
|
912
|
|
(2,942
|
)
|
5,365
|
|
1,645
|
|
(3,720
|
)
|
|||||||||
|
All other performing loans
|
|||||||||||||||||||||
|
Loans reported as trading assets
|
37,608
|
|
35,462
|
|
(2,146
|
)
|
33,069
|
|
29,295
|
|
(3,774
|
)
|
|||||||||
|
Loans
|
2,397
|
|
2,389
|
|
(8
|
)
|
1,618
|
|
1,563
|
|
(55
|
)
|
|||||||||
|
Total loans
|
$
|
43,859
|
|
$
|
38,763
|
|
$
|
(5,096
|
)
|
$
|
40,052
|
|
$
|
32,503
|
|
$
|
(7,549
|
)
|
|||
|
Long-term debt
|
|||||||||||||||||||||
|
Principal-protected debt
|
$
|
14,660
|
|
(c)
|
$
|
15,484
|
|
$
|
824
|
|
$
|
15,797
|
|
(c)
|
$
|
15,909
|
|
$
|
112
|
|
|
|
Nonprincipal-protected debt
(b)
|
NA
|
|
14,742
|
|
NA
|
|
NA
|
|
12,969
|
|
NA
|
|
|||||||||
|
Total long-term debt
|
NA
|
|
$
|
30,226
|
|
NA
|
|
NA
|
|
$
|
28,878
|
|
NA
|
|
|||||||
|
Long-term beneficial interests
|
|||||||||||||||||||||
|
Nonprincipal-protected debt
(b)
|
NA
|
|
$
|
2,162
|
|
NA
|
|
NA
|
|
$
|
1,996
|
|
NA
|
|
|||||||
|
Total long-term beneficial interests
|
NA
|
|
|
$
|
2,162
|
|
NA
|
|
NA
|
|
$
|
1,996
|
|
NA
|
|
||||||
|
(a)
|
There were
no
performing loans that were ninety days or more past due as of
December 31, 2014
and
2013
, respectively.
|
|
(b)
|
Remaining contractual principal is not applicable to nonprincipal-protected notes. Unlike principal-protected structured notes, for which the Firm is obligated to return a stated amount of principal at the maturity of the note, nonprincipal-protected structured notes do not obligate the Firm to return a stated amount of principal at maturity, but to return an amount based on the performance of an underlying variable or derivative feature embedded in the note. However, investors are exposed to the credit risk of the Firm as issuer for both nonprincipal-protected and principal protected notes.
|
|
(c)
|
Where the Firm issues principal-protected zero-coupon or discount notes, the balance reflected as the remaining contractual principal is the final principal payment at maturity.
|
At
December 31, 2014
and
2013
, the contractual amount of letters of credit for which the fair value option was elected was
$4.5 billion
and
$4.5 billion
, respectively, with a corresponding fair value of
$(147) million
and
$(99) million
, respectively. For further information regarding off-balance sheet lending-related financial instruments, see Note 29.
Structured note products by balance sheet classification and risk component
The table below presents the fair value of the structured notes issued by the Firm, by balance sheet classification and the primary risk to which the structured notes’ embedded derivative relates.
|
December 31, 2014
|
December 31, 2013
|
||||||||||||||||||||||||
|
(in millions)
|
Long-term debt
|
Other borrowed funds
|
Deposits
|
Total
|
Long-term debt
|
Other borrowed funds
|
Deposits
|
Total
|
|||||||||||||||||
|
Risk exposure
|
|||||||||||||||||||||||||
|
Interest rate
|
$
|
10,858
|
|
$
|
460
|
|
$
|
2,119
|
|
$
|
13,437
|
|
$
|
9,516
|
|
$
|
615
|
|
$
|
1,270
|
|
$
|
11,401
|
|
|
|
Credit
|
4,023
|
|
450
|
|
—
|
|
4,473
|
|
4,248
|
|
13
|
|
—
|
|
4,261
|
|
|||||||||
|
Foreign exchange
|
2,150
|
|
211
|
|
17
|
|
2,378
|
|
2,321
|
|
194
|
|
27
|
|
2,542
|
|
|||||||||
|
Equity
|
12,348
|
|
12,412
|
|
4,415
|
|
29,175
|
|
11,082
|
|
11,936
|
|
3,736
|
|
26,754
|
|
|||||||||
|
Commodity
|
710
|
|
644
|
|
2,012
|
|
3,366
|
|
1,260
|
|
310
|
|
1,133
|
|
2,703
|
|
|||||||||
|
Total structured notes
|
$
|
30,089
|
|
$
|
14,177
|
|
$
|
8,563
|
|
$
|
52,829
|
|
$
|
28,427
|
|
$
|
13,068
|
|
$
|
6,166
|
|
$
|
47,661
|
|
|
|
JPMorgan Chase & Co./2014 Annual Report
|
201
|
|
Notes to consolidated financial statements
Concentrations of credit risk arise when a number of customers are engaged in similar business activities or activities in the same geographic region, or when they have similar economic features that would cause their ability to meet contractual obligations to be similarly affected by changes in economic conditions.
JPMorgan Chase
regularly monitors various segments of its credit portfolios to assess potential concentration risks and to obtain collateral when deemed necessary. Senior management is significantly involved in the credit approval and review process, and risk levels are adjusted as needed to reflect the Firm’s risk appetite.
In the Firm’s consumer portfolio, concentrations are evaluated primarily by product and by U.S. geographic region, with a key focus on trends and concentrations at the portfolio level, where potential risk concentrations can be remedied through changes in underwriting policies and portfolio guidelines. In the wholesale portfolio, risk
concentrations are evaluated primarily by industry and monitored regularly on both an aggregate portfolio level and on an individual customer basis. The Firm’s wholesale exposure is managed through loan syndications and participations, loan sales, securitizations, credit derivatives, master netting agreements, and collateral and other risk-reduction techniques. For additional information on loans, see Note 14.
The Firm does not believe that its exposure to any particular loan product (e.g., option adjustable rate mortgages (“ARMs”)), industry segment (e.g., commercial real estate) or its exposure to residential real estate loans with high loan-to-value ratios results in a significant concentration of credit risk. Terms of loan products and collateral coverage are included in the Firm’s assessment when extending credit and establishing its allowance for loan losses.
The table below presents both on–balance sheet and off–balance sheet consumer and wholesale-related credit exposure by the Firm’s three credit portfolio segments as of
December 31, 2014
and
2013
.
|
2014
|
2013
|
||||||||||||||||||||||||
|
Credit exposure
|
On-balance sheet
|
Off-balance sheet
(d)
|
Credit exposure
|
On-balance sheet
|
Off-balance sheet
(d)
|
||||||||||||||||||||
|
December 31, (in millions)
|
Loans
|
Derivatives
|
Loans
|
Derivatives
|
|||||||||||||||||||||
|
Total consumer, excluding credit card
|
$
|
353,635
|
|
$
|
295,374
|
|
$
|
—
|
|
$
|
58,153
|
|
$
|
345,259
|
|
$
|
289,063
|
|
$
|
—
|
|
$
|
56,057
|
|
|
|
Total credit card
|
657,011
|
|
131,048
|
|
—
|
|
525,963
|
|
657,174
|
|
127,791
|
|
—
|
|
529,383
|
|
|||||||||
|
Total consumer
|
1,010,646
|
|
426,422
|
|
—
|
|
584,116
|
|
1,002,433
|
|
416,854
|
|
—
|
|
585,440
|
|
|||||||||
|
Wholesale-related
|
|||||||||||||||||||||||||
|
Real Estate
|
107,386
|
|
79,113
|
|
333
|
|
27,940
|
|
87,102
|
|
69,151
|
|
460
|
|
17,491
|
|
|||||||||
|
Banks & Finance Cos
|
68,203
|
|
24,244
|
|
22,057
|
|
21,902
|
|
66,881
|
|
25,482
|
|
18,888
|
|
22,511
|
|
|||||||||
|
Healthcare
|
57,707
|
|
13,793
|
|
4,630
|
|
39,284
|
|
46,934
|
|
14,383
|
|
2,203
|
|
30,348
|
|
|||||||||
|
Oil & Gas
|
48,315
|
|
15,616
|
|
1,872
|
|
30,827
|
|
45,910
|
|
13,319
|
|
3,202
|
|
29,389
|
|
|||||||||
|
Consumer Products
|
37,818
|
|
10,646
|
|
593
|
|
26,579
|
|
35,666
|
|
8,708
|
|
3,319
|
|
23,639
|
|
|||||||||
|
Asset Managers
|
36,374
|
|
8,043
|
|
9,569
|
|
18,762
|
|
34,145
|
|
9,099
|
|
715
|
|
24,331
|
|
|||||||||
|
State & Municipal Govt
|
31,858
|
|
7,593
|
|
4,079
|
|
20,186
|
|
33,506
|
|
5,656
|
|
7,175
|
|
20,675
|
|
|||||||||
|
Retail & Consumer Services
|
28,258
|
|
7,752
|
|
361
|
|
20,145
|
|
28,983
|
|
5,582
|
|
2,248
|
|
21,153
|
|
|||||||||
|
Utilities
|
28,060
|
|
4,843
|
|
2,317
|
|
20,900
|
|
25,068
|
|
7,504
|
|
273
|
|
17,291
|
|
|||||||||
|
Central Govt
|
21,081
|
|
1,081
|
|
11,819
|
|
8,181
|
|
21,403
|
|
4,426
|
|
1,392
|
|
15,585
|
|
|||||||||
|
Technology
|
20,977
|
|
4,727
|
|
1,341
|
|
14,909
|
|
21,049
|
|
1,754
|
|
9,998
|
|
9,297
|
|
|||||||||
|
Machinery & Equipment Mfg
|
20,573
|
|
6,537
|
|
553
|
|
13,483
|
|
19,078
|
|
5,969
|
|
476
|
|
12,633
|
|
|||||||||
|
Transportation
|
16,365
|
|
9,107
|
|
699
|
|
6,559
|
|
17,434
|
|
5,825
|
|
560
|
|
11,049
|
|
|||||||||
|
Business Services
|
16,201
|
|
4,867
|
|
456
|
|
10,878
|
|
14,601
|
|
4,497
|
|
594
|
|
9,510
|
|
|||||||||
|
Metals/Mining
|
15,911
|
|
5,628
|
|
601
|
|
9,682
|
|
13,975
|
|
6,845
|
|
621
|
|
6,509
|
|
|||||||||
|
All other
(a)
|
320,446
|
|
120,912
|
|
17,695
|
|
181,839
|
|
308,519
|
|
120,063
|
|
13,635
|
|
174,821
|
|
|||||||||
|
Subtotal
|
875,533
|
|
324,502
|
|
78,975
|
|
472,056
|
|
820,254
|
|
308,263
|
|
65,759
|
|
446,232
|
|
|||||||||
|
Loans held-for-sale and loans at fair value
|
6,412
|
|
6,412
|
|
—
|
|
—
|
|
13,301
|
|
13,301
|
|
—
|
|
—
|
|
|||||||||
|
Receivables from customers and other
(b)
|
28,972
|
|
—
|
|
—
|
|
—
|
|
26,744
|
|
—
|
|
—
|
|
—
|
|
|||||||||
|
Total wholesale-related
|
910,917
|
|
330,914
|
|
78,975
|
|
472,056
|
|
860,299
|
|
321,564
|
|
65,759
|
|
446,232
|
|
|||||||||
|
Total exposure
(c)
|
$
|
1,921,563
|
|
$
|
757,336
|
|
$
|
78,975
|
|
$
|
1,056,172
|
|
$
|
1,862,732
|
|
$
|
738,418
|
|
$
|
65,759
|
|
$
|
1,031,672
|
|
|
|
(a)
|
For more information on exposures to SPEs included within All other, see Note 16.
|
|
(b)
|
Primarily consists of margin loans to prime brokerage customers that are generally over-collateralized through a pledge of assets maintained in clients’ brokerage accounts and are subject to daily minimum collateral requirements. As a result of the Firm’s credit risk mitigation practices, the Firm did not hold any reserves for credit impairment on these receivables.
|
|
(c)
|
For further information regarding on–balance sheet credit concentrations by major product and/or geography, see Note 6 and Note 14. For information regarding concentrations of off–balance sheet lending-related financial instruments by major product, see Note 29.
|
|
(d)
|
Represents lending-related financial instruments.
|
|
202
|
JPMorgan Chase & Co./2014 Annual Report
|
|
Derivative instruments enable end-users to modify or mitigate exposure to credit or market risks. Counterparties to a derivative contract seek to obtain risks and rewards similar to those that could be obtained from purchasing or selling a related cash instrument without having to exchange upfront the full purchase or sales price. JPMorgan Chase makes markets in derivatives for customers and also uses derivatives to hedge or manage its own risk exposures. Predominantly all of the Firm’s derivatives are entered into for market-making or risk management purposes.
Market-making derivatives
The majority of the Firm’s derivatives are entered into for market-making purposes. Customers use derivatives to mitigate or modify interest rate, credit, foreign exchange, equity and commodity risks. The Firm actively manages the risks from its exposure to these derivatives by entering into other derivative transactions or by purchasing or selling other financial instruments that partially or fully offset the exposure from client derivatives. The Firm also seeks to earn a spread between the client derivatives and offsetting positions, and from the remaining open risk positions.
Risk management derivatives
The Firm manages its market risk exposures using various derivative instruments.
Interest rate contracts are used to minimize fluctuations in earnings that are caused by changes in interest rates. Fixed-rate assets and liabilities appreciate or depreciate in market value as interest rates change. Similarly, interest income and expense increases or decreases as a result of variable-rate assets and liabilities resetting to current market rates, and as a result of the repayment and subsequent origination or issuance of fixed-rate assets and liabilities at current market rates. Gains or losses on the derivative instruments that are related to such assets and liabilities are expected to substantially offset this variability in earnings. The Firm generally uses interest rate swaps, forwards and futures to manage the impact of interest rate fluctuations on earnings.
Foreign currency forward contracts are used to manage the foreign exchange risk associated with certain foreign currency–denominated (i.e., non-U.S. dollar) assets and liabilities and forecasted transactions, as well as the Firm’s net investments in certain non-U.S. subsidiaries or branches whose functional currencies are not the U.S. dollar. As a result of fluctuations in foreign currencies, the U.S. dollar–equivalent values of the foreign currency–denominated assets and liabilities or forecasted revenue or expense increase or decrease. Gains or losses on the derivative instruments related to these foreign currency–denominated assets or liabilities, or forecasted transactions, are expected to substantially offset this variability.
Commodities contracts are used to manage the price risk of certain commodities inventories. Gains or losses on these derivative instruments are expected to substantially offset the depreciation or appreciation of the related inventory.
Credit derivatives are used to manage the counterparty credit risk associated with loans and lending-related commitments. Credit derivatives compensate the purchaser when the entity referenced in the contract experiences a credit event, such as bankruptcy or a failure to pay an obligation when due. Credit derivatives primarily consist of credit default swaps. For a further discussion of credit derivatives, see the discussion in the Credit derivatives section on
pages 213–215
of this Note.
For more information about risk management derivatives, see the risk management derivatives gains and losses table on
page 213
of this Note, and the hedge accounting gains and losses tables on
pages 211–213
of this Note.
Derivative counterparties and settlement types
The Firm enters into OTC derivatives, which are negotiated and settled bilaterally with the derivative counterparty. The Firm also enters into, as principal, certain exchange-traded derivatives (“ETD”) such as futures and options, and “cleared” over-the-counter (“OTC-cleared”) derivative contracts with central counterparties (“CCPs”). ETD contracts are generally standardized contracts traded on an exchange and cleared by the CCP, which is the counterparty from the inception of the transactions. OTC-cleared derivatives are traded on a bilateral basis and then novated to the CCP for clearing.
Derivative Clearing Services
The Firm provides clearing services for clients where the Firm acts as a clearing member with respect to certain derivative exchanges and clearinghouses. The Firm does not reflect the clients’ derivative contracts in its Consolidated Financial Statements. For further information on the Firm’s clearing services, see Note 29.
Accounting for derivatives
All free-standing derivatives that the Firm executes for its own account are required to be recorded on the Consolidated balance sheets at fair value.
As permitted under U.S. GAAP, the Firm nets derivative assets and liabilities, and the related cash collateral receivables and payables, when a legally enforceable master netting agreement exists between the Firm and the derivative counterparty. For further discussion of the offsetting of assets and liabilities, see Note 1. The accounting for changes in value of a derivative depends on whether or not the transaction has been designated and qualifies for hedge accounting. Derivatives that are not designated as hedges are reported and measured at fair value through earnings. The tabular disclosures on
pages 207–213
of this Note provide additional information on the amount of, and reporting for, derivative assets, liabilities, gains and losses. For further discussion of derivatives embedded in structured notes, see Notes 3 and 4.
|
JPMorgan Chase & Co./2014 Annual Report
|
203
|
|
Notes to consolidated financial statements
Derivatives designated as hedges
The Firm applies hedge accounting to certain derivatives executed for risk management purposes – generally interest rate, foreign exchange and commodity derivatives. However, JPMorgan Chase does not seek to apply hedge accounting to all of the derivatives involved in the Firm’s risk management activities. For example, the Firm does not apply hedge accounting to purchased credit default swaps used to manage the credit risk of loans and lending-related commitments, because of the difficulties in qualifying such contracts as hedges. For the same reason, the Firm does not apply hedge accounting to certain interest rate and commodity derivatives used for risk management purposes.
To qualify for hedge accounting, a derivative must be highly effective at reducing the risk associated with the exposure being hedged. In addition, for a derivative to be designated as a hedge, the risk management objective and strategy must be documented. Hedge documentation must identify the derivative hedging instrument, the asset or liability or forecasted transaction and type of risk to be hedged, and how the effectiveness of the derivative is assessed prospectively and retrospectively. To assess effectiveness, the Firm uses statistical methods such as regression analysis, as well as nonstatistical methods including dollar-value comparisons of the change in the fair value of the derivative to the change in the fair value or cash flows of the hedged item. The extent to which a derivative has been, and is expected to continue to be, effective at offsetting changes in the fair value or cash flows of the hedged item must be assessed and documented at least quarterly. Any hedge ineffectiveness (i.e., the amount by which the gain or loss on the designated derivative instrument does not exactly offset the change in the hedged item attributable to the hedged risk) must be reported in current-period earnings. If it is determined that a derivative is not highly effective at hedging the designated exposure, hedge accounting is discontinued.
There are three types of hedge accounting designations: fair value hedges, cash flow hedges and net investment hedges. JPMorgan Chase uses fair value hedges primarily to hedge fixed-rate long-term debt, AFS securities and certain commodities inventories. For qualifying fair value hedges, the changes in the fair value of the derivative, and in the value of the hedged item for the risk being hedged, are recognized in earnings. If the hedge relationship is terminated, then the adjustment to the hedged item continues to be reported as part of the basis of the hedged item and for interest-bearing instruments is amortized to earnings as a yield adjustment. Derivative amounts affecting earnings are recognized consistent with the classification of the hedged item – primarily net interest income and principal transactions revenue.
JPMorgan Chase uses cash flow hedges primarily to hedge the exposure to variability in forecasted cash flows from floating-rate assets and liabilities and foreign currency–denominated revenue and expense. For qualifying cash flow hedges, the effective portion of the change in the fair value of the derivative is recorded in OCI and recognized in the Consolidated statements of income when the hedged cash flows affect earnings. Derivative amounts affecting earnings are recognized consistent with the classification of the hedged item – primarily interest income, interest expense, noninterest revenue and compensation expense. The ineffective portions of cash flow hedges are immediately recognized in earnings. If the hedge relationship is terminated, then the value of the derivative recorded in accumulated other comprehensive income/(loss) (“AOCI”) is recognized in earnings when the cash flows that were hedged affect earnings. For hedge relationships that are discontinued because a forecasted transaction is not expected to occur according to the original hedge forecast, any related derivative values recorded in AOCI are immediately recognized in earnings.
JPMorgan Chase uses foreign currency hedges to protect the value of the Firm’s net investments in certain non-U.S. subsidiaries or branches whose functional currencies are not the U.S. dollar. For foreign currency qualifying net investment hedges, changes in the fair value of the derivatives are recorded in the translation adjustments account within AOCI.
|
204
|
JPMorgan Chase & Co./2014 Annual Report
|
|
The following table outlines the Firm’s primary uses of derivatives and the related hedge accounting designation or disclosure category.
|
Type of Derivative
|
Use of Derivative
|
Designation and disclosure
|
Affected segment or unit
|
Page reference
|
|
Manage specifically identified risk exposures in qualifying hedge accounting relationships:
|
||||
|
◦ Interest rate
|
Hedge fixed rate assets and liabilities
|
Fair value hedge
|
Corporate
|
211
|
|
◦ Interest rate
|
Hedge floating rate assets and liabilities
|
Cash flow hedge
|
Corporate
|
212
|
|
◦
Foreign exchange
|
Hedge foreign currency-denominated assets and liabilities
|
Fair value hedge
|
Corporate
|
211
|
|
◦
Foreign exchange
|
Hedge forecasted revenue and expense
|
Cash flow hedge
|
Corporate
|
212
|
|
◦
Foreign exchange
|
Hedge the value of the Firm’s investments in non-U.S. subsidiaries
|
Net investment hedge
|
Corporate
|
213
|
|
◦
Commodity
|
Hedge commodity inventory
|
Fair value hedge
|
CIB
|
211
|
|
Manage specifically identified risk exposures not designated in qualifying hedge accounting relationships:
|
||||
|
◦
Interest rate
|
Manage the risk of the mortgage pipeline, warehouse loans and MSRs
|
Specified risk management
|
CCB
|
213
|
|
◦
Credit
|
Manage the credit risk of wholesale lending exposures
|
Specified risk management
|
CIB
|
213
|
|
◦
Commodity
|
Manage the risk of certain commodities-related contracts and investments
|
Specified risk management
|
CIB
|
213
|
|
◦
Interest rate and foreign exchange
|
Manage the risk of certain other specified assets and liabilities
|
Specified risk management
|
Corporate
|
213
|
|
Market-making derivatives and other activities:
|
||||
|
•
Various
|
Market-making and related risk management
|
Market-making and other
|
CIB
|
213
|
|
•
Various
|
Other derivatives
(a)
|
Market-making and other
|
CIB, Corporate
|
213
|
|
(a)
|
Other derivatives included the synthetic credit portfolio. The synthetic credit portfolio was a portfolio of index credit derivatives, including short and long positions, that was originally held by CIO. On July 2, 2012, CIO transferred the synthetic credit portfolio, other than a portion that aggregated to a notional amount of approximately
$12 billion
, to CIB; these retained positions were effectively closed out during the third quarter of 2012. CIB effectively sold the positions that had been transferred to it by the end of 2014. The results of the synthetic credit portfolio, including the portion transferred to CIB, have been included in the gains and losses on derivatives related to market-making activities and other derivatives category discussed on
page 213
of this Note.
|
|
JPMorgan Chase & Co./2014 Annual Report
|
205
|
|
Notes to consolidated financial statements
Notional amount of derivative contracts
The following table summarizes the notional amount of derivative contracts outstanding as of
December 31, 2014
and
2013
.
|
Notional amounts
(c)
|
||||||
|
December 31, (in billions)
|
2014
|
|
2013
|
|
||
|
Interest rate contracts
|
||||||
|
Swaps
|
$
|
29,734
|
|
$
|
35,221
|
|
|
Futures and forwards
(a)
|
10,189
|
|
11,238
|
|
||
|
Written options
(a)
|
3,903
|
|
4,059
|
|
||
|
Purchased options
|
4,259
|
|
4,187
|
|
||
|
Total interest rate contracts
|
48,085
|
|
54,705
|
|
||
|
Credit derivatives
(a)(b)
|
4,249
|
|
5,331
|
|
||
|
Foreign exchange contracts
|
|
|
||||
|
Cross-currency swaps
|
3,346
|
|
3,488
|
|
||
|
Spot, futures and forwards
|
4,669
|
|
3,773
|
|
||
|
Written options
|
790
|
|
659
|
|
||
|
Purchased options
|
780
|
|
652
|
|
||
|
Total foreign exchange contracts
|
9,585
|
|
8,572
|
|
||
|
Equity contracts
|
||||||
|
Swaps
(a)
|
206
|
|
187
|
|
||
|
Futures and forwards
(a)
|
50
|
|
50
|
|
||
|
Written options
|
432
|
|
425
|
|
||
|
Purchased options
|
375
|
|
380
|
|
||
|
Total equity contracts
|
1,063
|
|
1,042
|
|
||
|
Commodity contracts
|
|
|
||||
|
Swaps
|
126
|
|
124
|
|
||
|
Spot, futures and forwards
|
193
|
|
234
|
|
||
|
Written options
|
181
|
|
202
|
|
||
|
Purchased options
|
180
|
|
203
|
|
||
|
Total commodity contracts
|
680
|
|
763
|
|
||
|
Total derivative notional amounts
|
$
|
63,662
|
|
$
|
70,413
|
|
|
(a)
|
The prior period amounts have been revised. This revision had no impact on the Firm’s Consolidated balance sheets or its results of operations.
|
|
(b)
|
For more information on volumes and types of credit derivative contracts, see the Credit derivatives discussion on
pages 213–215
of this Note.
|
|
(c)
|
Represents the sum of gross long and gross short third-party notional derivative contracts.
|
While the notional amounts disclosed above give an indication of the volume of the Firm’s derivatives activity, the notional amounts significantly exceed, in the Firm’s view, the possible losses that could arise from such transactions. For most derivative transactions, the notional amount is not exchanged; it is used simply as a reference to calculate payments.
|
206
|
JPMorgan Chase & Co./2014 Annual Report
|
|
Impact of derivatives on the Consolidated balance sheets
The following table summarizes information on derivative receivables and payables (before and after netting adjustments) that are reflected on the Firm’s Consolidated balance sheets as of
December 31, 2014
and
2013
, by accounting designation (e.g., whether the derivatives were designated in qualifying hedge accounting relationships or not) and contract type.
|
Free-standing derivative receivables and payables
(a)
|
||||||||||||||||||||||||||||
|
Gross derivative receivables
|
Gross derivative payables
|
|||||||||||||||||||||||||||
|
December 31, 2014
(in millions)
|
Not designated as hedges
|
Designated as hedges
|
Total derivative receivables
|
Net derivative receivables
(b)
|
Not designated as hedges
|
Designated as hedges
|
Total derivative payables
|
Net derivative payables
(b)
|
||||||||||||||||||||
|
Trading assets and liabilities
|
||||||||||||||||||||||||||||
|
Interest rate
|
$
|
951,151
|
|
$
|
5,372
|
|
$
|
956,523
|
|
$
|
33,725
|
|
$
|
921,634
|
|
$
|
3,011
|
|
$
|
924,645
|
|
$
|
17,745
|
|
||||
|
Credit
|
76,842
|
|
—
|
|
76,842
|
|
1,838
|
|
75,895
|
|
—
|
|
75,895
|
|
1,593
|
|
||||||||||||
|
Foreign exchange
|
205,271
|
|
3,650
|
|
208,921
|
|
21,253
|
|
217,722
|
|
626
|
|
218,348
|
|
22,970
|
|
||||||||||||
|
Equity
|
46,792
|
|
—
|
|
46,792
|
|
8,177
|
|
50,565
|
|
—
|
|
50,565
|
|
11,740
|
|
||||||||||||
|
Commodity
|
43,151
|
|
502
|
|
43,653
|
|
13,982
|
|
45,455
|
|
168
|
|
45,623
|
|
17,068
|
|
||||||||||||
|
Total fair value of trading assets and liabilities
|
$
|
1,323,207
|
|
$
|
9,524
|
|
$
|
1,332,731
|
|
$
|
78,975
|
|
$
|
1,311,271
|
|
$
|
3,805
|
|
$
|
1,315,076
|
|
$
|
71,116
|
|
||||
|
Gross derivative receivables
|
Gross derivative payables
|
|||||||||||||||||||||||||||
|
December 31, 2013
(in millions)
|
Not designated as hedges
|
Designated as hedges
|
Total derivative receivables
|
Net derivative receivables
(b)
|
Not designated as hedges
|
Designated as hedges
|
Total derivative payables
|
Net derivative payables
(b)
|
||||||||||||||||||||
|
Trading assets and liabilities
|
||||||||||||||||||||||||||||
|
Interest rate
|
$
|
851,189
|
|
$
|
3,490
|
|
$
|
854,679
|
|
$
|
25,782
|
|
$
|
820,811
|
|
$
|
4,543
|
|
$
|
825,354
|
|
$
|
13,283
|
|
||||
|
Credit
|
83,520
|
|
—
|
|
83,520
|
|
1,516
|
|
82,402
|
|
—
|
|
82,402
|
|
2,281
|
|
||||||||||||
|
Foreign exchange
|
152,240
|
|
1,359
|
|
153,599
|
|
16,790
|
|
158,728
|
|
1,397
|
|
160,125
|
|
15,947
|
|
||||||||||||
|
Equity
|
52,931
|
|
—
|
|
52,931
|
|
12,227
|
|
54,654
|
|
—
|
|
54,654
|
|
14,719
|
|
||||||||||||
|
Commodity
|
34,344
|
|
1,394
|
|
35,738
|
|
9,444
|
|
37,605
|
|
9
|
|
37,614
|
|
11,084
|
|
||||||||||||
|
Total fair value of trading assets and liabilities
|
$
|
1,174,224
|
|
$
|
6,243
|
|
$
|
1,180,467
|
|
$
|
65,759
|
|
$
|
1,154,200
|
|
$
|
5,949
|
|
$
|
1,160,149
|
|
$
|
57,314
|
|
||||
|
(a)
|
Balances exclude structured notes for which the fair value option has been elected. See Note 4 for further information.
|
|
(b)
|
As permitted under U.S. GAAP, the Firm has elected to net derivative receivables and derivative payables and the related cash collateral receivables and payables when a legally enforceable master netting agreement exists.
|
|
JPMorgan Chase & Co./2014 Annual Report
|
207
|
|
Notes to consolidated financial statements
The following table presents, as of December 31, 2014 and 2013, the gross and net derivative receivables by contract and settlement type. Derivative receivables have been netted on the Consolidated balance sheets against derivative payables and cash collateral payables to the same counterparty with respect to derivative contracts for which the Firm has obtained an appropriate legal opinion with respect to the master netting agreement. Where such a legal opinion has not been either sought or obtained, the receivables are not eligible under U.S. GAAP for netting on the Consolidated balance sheets, and are shown separately in the table below.
|
2014
|
2013
|
|||||||||||||||||||||
|
December 31, (in millions)
|
Gross derivative receivables
|
Amounts netted on the Consolidated balance sheets
|
Net derivative receivables
|
Gross derivative receivables
|
Amounts netted on the Consolidated balance sheets
|
Net derivative receivables
|
||||||||||||||||
|
U.S. GAAP nettable derivative receivables
|
||||||||||||||||||||||
|
Interest rate contracts:
|
||||||||||||||||||||||
|
OTC
|
$
|
548,373
|
|
$
|
(521,180
|
)
|
$
|
27,193
|
|
$
|
486,449
|
|
$
|
(466,493
|
)
|
$
|
19,956
|
|
||||
|
OTC–cleared
|
401,656
|
|
(401,618
|
)
|
38
|
|
362,426
|
|
(362,404
|
)
|
22
|
|
||||||||||
|
Exchange-traded
(a)
|
—
|
|
—
|
|
—
|
|
—
|
|
—
|
|
—
|
|
||||||||||
|
Total interest rate contracts
|
950,029
|
|
(922,798
|
)
|
27,231
|
|
848,875
|
|
(828,897
|
)
|
19,978
|
|
||||||||||
|
Credit contracts:
|
||||||||||||||||||||||
|
OTC
|
66,636
|
|
(65,720
|
)
|
916
|
|
66,269
|
|
(65,725
|
)
|
544
|
|
||||||||||
|
OTC–cleared
|
9,320
|
|
(9,284
|
)
|
36
|
|
16,841
|
|
(16,279
|
)
|
562
|
|
||||||||||
|
Total credit contracts
|
75,956
|
|
(75,004
|
)
|
952
|
|
83,110
|
|
(82,004
|
)
|
1,106
|
|
||||||||||
|
Foreign exchange contracts:
|
||||||||||||||||||||||
|
OTC
|
202,537
|
|
(187,634
|
)
|
14,903
|
|
148,953
|
|
(136,763
|
)
|
12,190
|
|
||||||||||
|
OTC–cleared
|
36
|
|
(34
|
)
|
2
|
|
46
|
|
(46
|
)
|
—
|
|
||||||||||
|
Exchange-traded
(a)
|
—
|
|
—
|
|
—
|
|
—
|
|
—
|
|
—
|
|
||||||||||
|
Total foreign exchange contracts
|
202,573
|
|
(187,668
|
)
|
14,905
|
|
148,999
|
|
(136,809
|
)
|
12,190
|
|
||||||||||
|
Equity contracts:
|
||||||||||||||||||||||
|
OTC
|
23,258
|
|
(22,826
|
)
|
432
|
|
31,870
|
|
(29,289
|
)
|
2,581
|
|
||||||||||
|
OTC–cleared
|
—
|
|
—
|
|
—
|
|
—
|
|
—
|
|
—
|
|
||||||||||
|
Exchange-traded
(a)
|
18,143
|
|
(15,789
|
)
|
2,354
|
|
17,732
|
|
(11,415
|
)
|
6,317
|
|
||||||||||
|
Total equity contracts
|
41,401
|
|
(38,615
|
)
|
2,786
|
|
49,602
|
|
(40,704
|
)
|
8,898
|
|
||||||||||
|
Commodity contracts:
|
||||||||||||||||||||||
|
OTC
|
22,555
|
|
(14,327
|
)
|
8,228
|
|
21,619
|
|
(15,082
|
)
|
6,537
|
|
||||||||||
|
OTC–cleared
|
—
|
|
—
|
|
—
|
|
—
|
|
—
|
|
—
|
|
||||||||||
|
Exchange-traded
(a)
|
19,500
|
|
(15,344
|
)
|
4,156
|
|
12,528
|
|
(11,212
|
)
|
1,316
|
|
||||||||||
|
Total commodity contracts
|
42,055
|
|
(29,671
|
)
|
12,384
|
|
34,147
|
|
(26,294
|
)
|
7,853
|
|
||||||||||
|
Derivative receivables with appropriate legal opinion
|
$
|
1,312,014
|
|
$
|
(1,253,756
|
)
|
(b)
|
$
|
58,258
|
|
$
|
1,164,733
|
|
$
|
(1,114,708
|
)
|
(b)
|
$
|
50,025
|
|
||
|
Derivative receivables where an appropriate legal opinion has not been either sought or obtained
|
20,717
|
|
20,717
|
|
15,734
|
|
15,734
|
|
||||||||||||||
|
Total derivative receivables recognized on the Consolidated balance sheets
|
$
|
1,332,731
|
|
$
|
78,975
|
|
$
|
1,180,467
|
|
$
|
65,759
|
|
||||||||||
|
(a)
|
Exchange-traded derivative amounts that relate to futures contracts are settled daily.
|
|
(b)
|
Included cash collateral netted of
$74.0 billion
and
$63.9 billion
at December 31, 2014, and 2013, respectively.
|
|
208
|
JPMorgan Chase & Co./2014 Annual Report
|
|
The following table presents, as of December 31, 2014 and 2013, the gross and net derivative payables by contract and settlement type. Derivative payables have been netted on the Consolidated balance sheets against derivative receivables and cash collateral receivables from the same counterparty with respect to derivative contracts for which the Firm has obtained an appropriate legal opinion with respect to the master netting agreement. Where such a legal opinion has not been either sought or obtained, the payables are not eligible under U.S. GAAP for netting on the Consolidated balance sheets, and are shown separately in the table below.
|
2014
|
2013
|
|||||||||||||||||||||
|
December 31, (in millions)
|
Gross derivative payables
|
Amounts netted on the Consolidated balance sheets
|
Net derivative payables
|
Gross derivative payables
|
Amounts netted on the Consolidated balance sheets
|
Net derivative payables
|
||||||||||||||||
|
U.S. GAAP nettable derivative payables
|
||||||||||||||||||||||
|
Interest rate contracts:
|
||||||||||||||||||||||
|
OTC
|
$
|
522,170
|
|
$
|
(509,650
|
)
|
$
|
12,520
|
|
$
|
467,850
|
|
$
|
(458,081
|
)
|
$
|
9,769
|
|
||||
|
OTC–cleared
|
398,518
|
|
(397,250
|
)
|
1,268
|
|
354,698
|
|
(353,990
|
)
|
708
|
|
||||||||||
|
Exchange-traded
(a)
|
—
|
|
—
|
|
—
|
|
—
|
|
—
|
|
—
|
|
||||||||||
|
Total interest rate contracts
|
920,688
|
|
(906,900
|
)
|
13,788
|
|
822,548
|
|
(812,071
|
)
|
10,477
|
|
||||||||||
|
Credit contracts:
|
||||||||||||||||||||||
|
OTC
|
65,432
|
|
(64,904
|
)
|
528
|
|
65,223
|
|
(63,671
|
)
|
1,552
|
|
||||||||||
|
OTC–cleared
|
9,398
|
|
(9,398
|
)
|
—
|
|
16,506
|
|
(16,450
|
)
|
56
|
|
||||||||||
|
Total credit contracts
|
74,830
|
|
(74,302
|
)
|
528
|
|
81,729
|
|
(80,121
|
)
|
1,608
|
|
||||||||||
|
Foreign exchange contracts:
|
||||||||||||||||||||||
|
OTC
|
211,732
|
|
(195,312
|
)
|
16,420
|
|
155,110
|
|
(144,119
|
)
|
10,991
|
|
||||||||||
|
OTC–cleared
|
66
|
|
(66
|
)
|
—
|
|
61
|
|
(59
|
)
|
2
|
|
||||||||||
|
Exchange-traded
(a)
|
—
|
|
—
|
|
—
|
|
—
|
|
—
|
|
—
|
|
||||||||||
|
Total foreign exchange contracts
|
211,798
|
|
(195,378
|
)
|
16,420
|
|
155,171
|
|
(144,178
|
)
|
10,993
|
|
||||||||||
|
Equity contracts:
|
||||||||||||||||||||||
|
OTC
|
27,908
|
|
(23,036
|
)
|
4,872
|
|
33,295
|
|
(28,520
|
)
|
4,775
|
|
||||||||||
|
OTC–cleared
|
—
|
|
—
|
|
—
|
|
—
|
|
—
|
|
—
|
|
||||||||||
|
Exchange-traded
(a)
|
17,167
|
|
(15,789
|
)
|
1,378
|
|
17,349
|
|
(11,415
|
)
|
5,934
|
|
||||||||||
|
Total equity contracts
|
45,075
|
|
(38,825
|
)
|
6,250
|
|
50,644
|
|
(39,935
|
)
|
10,709
|
|
||||||||||
|
Commodity contracts:
|
||||||||||||||||||||||
|
OTC
|
25,129
|
|
(13,211
|
)
|
11,918
|
|
21,993
|
|
(15,318
|
)
|
6,675
|
|
||||||||||
|
OTC–cleared
|
—
|
|
—
|
|
—
|
|
—
|
|
—
|
|
—
|
|
||||||||||
|
Exchange-traded
(a)
|
18,486
|
|
(15,344
|
)
|
3,142
|
|
12,367
|
|
(11,212
|
)
|
1,155
|
|
||||||||||
|
Total commodity contracts
|
43,615
|
|
(28,555
|
)
|
15,060
|
|
34,360
|
|
(26,530
|
)
|
7,830
|
|
||||||||||
|
Derivative payables with appropriate legal opinions
|
$
|
1,296,006
|
|
$
|
(1,243,960
|
)
|
(b)
|
$
|
52,046
|
|
$
|
1,144,452
|
|
$
|
(1,102,835
|
)
|
(b)
|
$
|
41,617
|
|
||
|
Derivative payables where an appropriate legal opinion has not been either sought or obtained
|
19,070
|
|
19,070
|
|
15,697
|
|
15,697
|
|
||||||||||||||
|
Total derivative payables recognized on the Consolidated balance sheets
|
$
|
1,315,076
|
|
$
|
71,116
|
|
$
|
1,160,149
|
|
$
|
57,314
|
|
||||||||||
|
(a)
|
Exchange-traded derivative balances that relate to futures contracts are settled daily.
|
|
(b)
|
Included cash collateral netted of
$64.2 billion
and
$52.1 billion
related to OTC and OTC-cleared derivatives at December 31, 2014, and 2013, respectively.
|
In addition to the cash collateral received and transferred that is presented on a net basis with net derivative receivables and payables, the Firm receives and transfers additional collateral (financial instruments and cash). These amounts mitigate counterparty credit risk associated with the Firm’s derivative instruments but are not eligible for net presentation, because (a) the collateral is comprised of
non-cash financial instruments (generally U.S. government and agency securities and other G7 government bonds), (b) the amount of collateral held or transferred exceeds the fair value exposure, at the individual counterparty level, as of the date presented, or (c) the collateral relates to derivative receivables or payables where an appropriate legal opinion has not been either sought or obtained.
|
JPMorgan Chase & Co./2014 Annual Report
|
209
|
|
Notes to consolidated financial statements
The following tables present information regarding certain financial instrument collateral received and transferred as of December 31, 2014 and 2013, that is not eligible for net presentation under U.S. GAAP. The collateral included in these tables relates only to the derivative instruments for which appropriate legal opinions have been obtained; excluded are (i) additional collateral that exceeds the fair value exposure and (ii) all collateral related to derivative instruments where an appropriate legal opinion has not been either sought or obtained.
|
Derivative receivable collateral
|
|||||||||||||||||||||
|
2014
|
2013
|
||||||||||||||||||||
|
December 31, (in millions)
|
Net derivative receivables
|
Collateral not nettable on the Consolidated balance sheets
|
Net exposure
|
Net derivative receivables
|
Collateral not nettable on the Consolidated balance sheets
|
Net exposure
|
|||||||||||||||
|
Derivative receivables with appropriate legal opinions
|
$
|
58,258
|
|
$
|
(16,194
|
)
|
(a)
|
$
|
42,064
|
|
$
|
50,025
|
|
$
|
(12,414
|
)
|
(a)
|
$
|
37,611
|
|
|
|
Derivative payable collateral
(b)
|
|||||||||||||||||||||
|
2014
|
2013
|
||||||||||||||||||||
|
December 31, (in millions)
|
Net derivative payables
|
Collateral not nettable on the Consolidated balance sheets
|
Net amount
(c)
|
Net derivative payables
|
Collateral not nettable on the Consolidated balance sheets
|
Net amount
(c)
|
|||||||||||||||
|
Derivative payables with appropriate legal opinions
|
$
|
52,046
|
|
$
|
(10,505
|
)
|
(a)
|
$
|
41,541
|
|
$
|
41,617
|
|
$
|
(6,873
|
)
|
(a)
|
$
|
34,744
|
|
|
|
(a)
|
Represents liquid security collateral as well as cash collateral held at third party custodians. For some counterparties, the collateral amounts of financial instruments may exceed the derivative receivables and derivative payables balances. Where this is the case, the total amount reported is limited to the net derivative receivables and net derivative payables balances with that counterparty.
|
|
(b)
|
Derivative payable collateral relates only to OTC and OTC-cleared derivative instruments. Amounts exclude collateral transferred related to exchange-traded derivative instruments.
|
|
(c)
|
Net amount represents exposure of counterparties to the Firm.
|
Liquidity risk and credit-related contingent features
In addition to the specific market risks introduced by each derivative contract type, derivatives expose JPMorgan Chase to credit risk — the risk that derivative counterparties may fail to meet their payment obligations under the derivative contracts and the collateral, if any, held by the Firm proves to be of insufficient value to cover the payment obligation. It is the policy of JPMorgan Chase to actively pursue, where possible, the use of legally enforceable master netting arrangements and collateral agreements to mitigate derivative counterparty credit risk. The amount of derivative receivables reported on the Consolidated balance sheets is the fair value of the derivative contracts after giving effect to legally enforceable master netting agreements and cash collateral held by the Firm.
While derivative receivables expose the Firm to credit risk, derivative payables expose the Firm to liquidity risk, as the derivative contracts typically require the Firm to post cash or securities collateral with counterparties as the fair value of the contracts moves in the counterparties’ favor or upon specified downgrades in the Firm’s and its subsidiaries’ respective credit ratings. Certain derivative contracts also provide for termination of the contract, generally upon a downgrade of either the Firm or the counterparty, at the fair value of the derivative contracts. The following table shows the aggregate fair value of net derivative payables related to OTC and OTC-cleared derivatives that contain contingent collateral or termination features that may be triggered upon a ratings downgrade, and the associated collateral the Firm has posted in the normal course of business, at December 31, 2014 and 2013.
|
OTC and OTC-cleared derivative payables containing downgrade triggers
|
||||||
|
December 31, (in millions)
|
2014
|
2013
|
||||
|
Aggregate fair value of net derivative payables
|
$
|
32,303
|
|
$
|
24,631
|
|
|
Collateral posted
|
27,585
|
|
20,346
|
|
||
The following table shows the impact of a single-notch and two-notch downgrade of the long-term issuer ratings of JPMorgan Chase & Co. and its subsidiaries, predominantly JPMorgan Chase Bank, National Association (“JPMorgan Chase Bank, N.A.”), at December 31, 2014 and 2013, related to OTC and OTC-cleared derivative contracts with contingent collateral or termination features that may be triggered upon a ratings downgrade. Derivatives contracts generally require additional collateral to be posted or terminations to be triggered when the predefined threshold rating is breached. A downgrade by a single rating agency that does not result in a rating lower than a preexisting corresponding rating provided by another major rating agency will generally not result in additional collateral, except in certain instances in which additional initial margin may be required upon a ratings downgrade, or termination payment requirements. The liquidity impact in the table is calculated based upon a downgrade below the lowest current rating of the rating agencies referred to in the derivative contract.
|
210
|
JPMorgan Chase & Co./2014 Annual Report
|
|
|
Liquidity impact of downgrade triggers on OTC and
OTC-cleared derivatives
|
|||||||||||||
|
2014
|
2013
|
||||||||||||
|
December 31, (in millions)
|
Single-notch downgrade
|
Two-notch downgrade
|
Single-notch downgrade
|
Two-notch downgrade
|
|||||||||
|
Amount of additional collateral to be posted upon downgrade
(a)
|
$
|
1,046
|
|
$
|
3,331
|
|
$
|
952
|
|
$
|
3,244
|
|
|
|
Amount required to settle contracts with termination triggers upon downgrade
(b)
|
366
|
|
1,388
|
|
540
|
|
876
|
|
|||||
|
(a)
|
Includes the additional collateral to be posted for initial margin.
|
|
(b)
|
Amounts represent fair value of derivative payables, and do not reflect collateral posted.
|
Impact of derivatives on the Consolidated statements of income
The following tables provide information related to gains and losses recorded on derivatives based on their hedge accounting
designation or purpose.
Fair value hedge gains and losses
The following tables present derivative instruments, by contract type, used in fair value hedge accounting relationships, as well as pretax gains/(losses) recorded on such derivatives and the related hedged items for the years ended
December 31, 2014
,
2013
and
2012
, respectively. The Firm includes gains/(losses) on the hedging derivative and the related hedged item in the same line item in the Consolidated statements of income.
|
Gains/(losses) recorded in income
|
Income statement impact due to:
|
||||||||||||||||||
|
Year ended December 31, 2014 (in millions)
|
Derivatives
|
Hedged items
|
Total income statement impact
|
Hedge ineffectiveness
(d)
|
Excluded components
(e)
|
||||||||||||||
|
Contract type
|
|||||||||||||||||||
|
Interest rate
(a)
|
$
|
2,106
|
|
$
|
(801
|
)
|
$
|
1,305
|
|
$
|
131
|
|
$
|
1,174
|
|
||||
|
Foreign exchange
(b)
|
8,279
|
|
(8,532
|
)
|
(253
|
)
|
—
|
|
(253
|
)
|
|||||||||
|
Commodity
(c)
|
49
|
|
145
|
|
194
|
|
42
|
|
152
|
|
|||||||||
|
Total
|
$
|
10,434
|
|
$
|
(9,188
|
)
|
$
|
1,246
|
|
$
|
173
|
|
$
|
1,073
|
|
||||
|
Gains/(losses) recorded in income
|
Income statement impact due to:
|
||||||||||||||||||
|
Year ended December 31, 2013 (in millions)
|
Derivatives
|
Hedged items
|
Total income statement impact
|
Hedge ineffectiveness
(d)
|
Excluded components
(e)
|
||||||||||||||
|
Contract type
|
|||||||||||||||||||
|
Interest rate
(a)
|
$
|
(3,469
|
)
|
$
|
4,851
|
|
$
|
1,382
|
|
$
|
(132
|
)
|
$
|
1,514
|
|
||||
|
Foreign exchange
(b)
|
(1,096
|
)
|
864
|
|
(232
|
)
|
—
|
|
(232
|
)
|
|||||||||
|
Commodity
(c)
|
485
|
|
(1,304
|
)
|
(819
|
)
|
38
|
|
(857
|
)
|
|||||||||
|
Total
|
$
|
(4,080
|
)
|
$
|
4,411
|
|
$
|
331
|
|
$
|
(94
|
)
|
$
|
425
|
|
||||
|
Gains/(losses) recorded in income
|
Income statement impact due to:
|
||||||||||||||||||
|
Year ended December 31, 2012 (in millions)
|
Derivatives
|
Hedged items
|
Total income statement impact
|
Hedge ineffectiveness
(d)
|
Excluded components
(e)
|
||||||||||||||
|
Contract type
|
|||||||||||||||||||
|
Interest rate
(a)
|
$
|
(1,238
|
)
|
$
|
1,879
|
|
$
|
641
|
|
$
|
(28
|
)
|
$
|
669
|
|
||||
|
Foreign exchange
(b)
|
(3,027
|
)
|
2,925
|
|
(102
|
)
|
—
|
|
(102
|
)
|
|||||||||
|
Commodity
(c)
|
(2,530
|
)
|
1,131
|
|
(1,399
|
)
|
107
|
|
(1,506
|
)
|
|||||||||
|
Total
|
$
|
(6,795
|
)
|
$
|
5,935
|
|
$
|
(860
|
)
|
$
|
79
|
|
$
|
(939
|
)
|
||||
|
(a)
|
Primarily consists of hedges of the benchmark (e.g., London Interbank Offered Rate (“LIBOR”)) interest rate risk of fixed-rate long-term debt and AFS securities. Gains and losses were recorded in net interest income. The current presentation excludes accrued interest.
|
|
(b)
|
Primarily consists of hedges of the foreign currency risk of long-term debt and AFS securities for changes in spot foreign currency rates. Gains and losses related to the derivatives and the hedged items, due to changes in foreign currency rates, were recorded in principal transactions revenue and net interest income.
|
|
(c)
|
Consists of overall fair value hedges of physical commodities inventories that are generally carried at the lower of cost or market (market approximates fair value). Gains and losses were recorded in principal transactions revenue.
|
|
(d)
|
Hedge ineffectiveness is the amount by which the gain or loss on the designated derivative instrument does not exactly offset the gain or loss on the hedged item attributable to the hedged risk.
|
|
(e)
|
The assessment of hedge effectiveness excludes certain components of the changes in fair values of the derivatives and hedged items such as forward points on foreign exchange forward contracts and time values.
|
|
JPMorgan Chase & Co./2014 Annual Report
|
211
|
|
Notes to consolidated financial statements
Cash flow hedge gains and losses
The following tables present derivative instruments, by contract type, used in cash flow hedge accounting relationships, and the pretax gains/(losses) recorded on such derivatives, for the years ended
December 31, 2014
,
2013
and
2012
, respectively. The Firm includes the gain/(loss) on the hedging derivative and the change in cash flows on the hedged item in the same line item in the Consolidated statements of income.
|
Gains/(losses) recorded in income and other comprehensive income/(loss)
(c)
|
|||||||||||||||||||||||
|
Year ended December 31, 2014
(in millions)
|
Derivatives – effective portion reclassified from AOCI to income
|
Hedge ineffectiveness recorded directly in income
(d)
|
Total income statement impact
|
Derivatives – effective portion recorded in OCI
|
Total change
in OCI
for period
|
||||||||||||||||||
|
Contract type
|
|||||||||||||||||||||||
|
Interest rate
(a)
|
$
|
(54
|
)
|
$
|
—
|
|
$
|
(54
|
)
|
$
|
189
|
|
$
|
243
|
|
||||||||
|
Foreign exchange
(b)
|
78
|
|
—
|
|
78
|
|
(91
|
)
|
(169
|
)
|
|||||||||||||
|
Total
|
$
|
24
|
|
$
|
—
|
|
$
|
24
|
|
$
|
98
|
|
$
|
74
|
|
||||||||
|
Gains/(losses) recorded in income and other comprehensive income/(loss)
(c)
|
|||||||||||||||||||||||
|
Year ended December 31, 2013
(in millions)
|
Derivatives – effective portion reclassified from AOCI to income
|
Hedge ineffectiveness recorded directly in income
(d)
|
Total income statement impact
|
Derivatives – effective portion recorded in OCI
|
Total change
in OCI for period |
||||||||||||||||||
|
Contract type
|
|||||||||||||||||||||||
|
Interest rate
(a)
|
$
|
(108
|
)
|
$
|
—
|
|
$
|
(108
|
)
|
$
|
(565
|
)
|
$
|
(457
|
)
|
||||||||
|
Foreign exchange
(b)
|
7
|
|
—
|
|
7
|
|
40
|
|
33
|
|
|||||||||||||
|
Total
|
$
|
(101
|
)
|
$
|
—
|
|
$
|
(101
|
)
|
$
|
(525
|
)
|
$
|
(424
|
)
|
||||||||
|
Gains/(losses) recorded in income and other comprehensive income/(loss)
(c)
|
|||||||||||||||||||||||
|
Year ended December 31, 2012
(in millions)
|
Derivatives – effective portion reclassified from AOCI to income
|
Hedge ineffectiveness recorded directly in income
(d)
|
Total income statement impact
|
Derivatives – effective portion recorded in OCI
|
Total change
in OCI for period |
||||||||||||||||||
|
Contract type
|
|||||||||||||||||||||||
|
Interest rate
(a)
|
$
|
(3
|
)
|
$
|
5
|
|
$
|
2
|
|
$
|
13
|
|
$
|
16
|
|
||||||||
|
Foreign exchange
(b)
|
31
|
|
—
|
|
31
|
|
128
|
|
97
|
|
|||||||||||||
|
Total
|
$
|
28
|
|
$
|
5
|
|
$
|
33
|
|
$
|
141
|
|
$
|
113
|
|
||||||||
|
(a)
|
Primarily consists of benchmark interest rate hedges of LIBOR-indexed floating-rate assets and floating-rate liabilities. Gains and losses were recorded in net interest income.
|
|
(b)
|
Primarily consists of hedges of the foreign currency risk of non-U.S. dollar-denominated revenue and expense. The income statement classification of gains and losses follows the hedged item – primarily noninterest revenue and compensation expense.
|
|
(c)
|
The Firm did not experience any forecasted transactions that failed to occur for the years ended
December 31, 2014
, 2013 or 2012.
|
|
(d)
|
Hedge ineffectiveness is the amount by which the cumulative gain or loss on the designated derivative instrument exceeds the present value of the cumulative expected change in cash flows on the hedged item attributable to the hedged risk.
|
Over the next 12 months, the Firm expects that
$33 million
(after-tax) of net losses recorded in AOCI at
December 31, 2014
, related to cash flow hedges will be recognized in income. The maximum length of time over which forecasted transactions are hedged is
9 years
, and such transactions primarily relate to core lending and borrowing activities.
|
212
|
JPMorgan Chase & Co./2014 Annual Report
|
|
Net investment hedge gains and losses
The following table presents hedging instruments, by contract type, that were used in net investment hedge accounting relationships, and the pretax gains/(losses) recorded on such instruments for the years ended
December 31, 2014
,
2013
and
2012
.
|
Gains/(losses) recorded in income and other comprehensive income/(loss)
|
||||||||
|
2014
|
2013
|
2012
|
||||||
|
Year ended December 31,
(in millions)
|
Excluded components recorded directly in income
(a)
|
Effective portion recorded in OCI
|
Excluded components recorded directly in income
(a)
|
Effective portion recorded in OCI
|
Excluded components recorded directly in income
(a)
|
Effective portion recorded in OCI
|
||
|
Foreign exchange derivatives
|
$(448)
|
$1,698
|
$(383)
|
$773
|
$(306)
|
$(82)
|
||
|
(a)
|
Certain components of hedging derivatives are permitted to be excluded from the assessment of hedge effectiveness, such as forward points on foreign exchange forward contracts. Amounts related to excluded components are recorded in current-period income. The Firm measures the ineffectiveness of net investment hedge accounting relationships based on changes in spot foreign currency rates, and therefore there was no significant ineffectiveness for net investment hedge accounting relationships during
2014
,
2013
and
2012
.
|
Gains and losses on derivatives used for specified risk management purposes
The following table presents pretax gains/(losses) recorded on a limited number of derivatives, not designated in hedge accounting relationships, that are used to manage risks associated with certain specified assets and liabilities, including certain risks arising from the mortgage pipeline, warehouse loans, MSRs, wholesale lending exposures, AFS securities, foreign currency-denominated liabilities, and commodities-related contracts and investments.
|
Derivatives gains/(losses)
recorded in income
|
|||||||||
|
Year ended December 31,
(in millions)
|
2014
|
|
2013
|
|
2012
|
|
|||
|
Contract type
|
|||||||||
|
Interest rate
(a)
|
$
|
2,308
|
|
$
|
617
|
|
$
|
5,353
|
|
|
Credit
(b)
|
(58
|
)
|
(142
|
)
|
(175
|
)
|
|||
|
Foreign exchange
(c)
|
(7
|
)
|
1
|
|
47
|
|
|||
|
Commodity
(d)
|
156
|
|
178
|
|
94
|
|
|||
|
Total
|
$
|
2,399
|
|
$
|
654
|
|
$
|
5,319
|
|
|
(a)
|
Primarily represents interest rate derivatives used to hedge the interest rate risk inherent in the mortgage pipeline, warehouse loans and MSRs, as well as written commitments to originate warehouse loans. Gains and losses were recorded predominantly in mortgage fees and related income.
|
|
(b)
|
Relates to credit derivatives used to mitigate credit risk associated with lending exposures in the Firm’s wholesale businesses. These derivatives do not include credit derivatives used to mitigate counterparty credit risk arising from derivative receivables, which is included in gains and losses on derivatives related to market-making activities and other derivatives. Gains and losses were recorded in principal transactions revenue.
|
|
(c)
|
Primarily relates to hedges of the foreign exchange risk of specified foreign currency-denominated assets and liabilities. Gains and losses were recorded in principal transactions revenue.
|
|
(d)
|
Primarily relates to commodity derivatives used to mitigate energy price risk associated with energy-related contracts and investments. Gains and losses were recorded in principal transactions revenue.
|
Gains and losses on derivatives related to market-making activities and other derivatives
The Firm makes markets in derivatives in order to meet the needs of customers and uses derivatives to manage certain risks associated with net open risk positions from the Firm’s market-making activities, including the counterparty credit risk arising from derivative receivables. All derivatives not included in the hedge accounting or specified risk management categories above are included in this category. Gains and losses on these derivatives are primarily recorded in principal transactions revenue. See Note 7 for information on principal transactions revenue.
Credit derivatives
Credit derivatives are financial instruments whose value is derived from the credit risk associated with the debt of a third-party issuer (the reference entity) and which allow one party (the protection purchaser) to transfer that risk to another party (the protection seller). Credit derivatives expose the protection purchaser to the creditworthiness of the protection seller, as the protection seller is required to make payments under the contract when the reference entity experiences a credit event, such as a bankruptcy, a failure to pay its obligation or a restructuring. The seller of credit protection receives a premium for providing protection but has the risk that the underlying instrument referenced in the contract will be subject to a credit event.
The Firm is both a purchaser and seller of protection in the credit derivatives market and uses these derivatives for two primary purposes. First, in its capacity as a market-maker, the Firm actively manages a portfolio of credit derivatives by purchasing and selling credit protection, predominantly on corporate debt obligations, to meet the needs of customers. Second, as an end-user, the Firm uses credit derivatives to manage credit risk associated with lending exposures (loans and unfunded commitments) and derivatives counterparty exposures in the Firm’s wholesale businesses, and to manage the credit risk arising from certain financial instruments in the Firm’s market-making businesses. Following is a summary of various types of credit derivatives.
|
JPMorgan Chase & Co./2014 Annual Report
|
213
|
|
Notes to consolidated financial statements
Credit default swaps
Credit derivatives may reference the credit of either a single reference entity (“single-name”) or a broad-based index. The Firm purchases and sells protection on both single- name and index-reference obligations. Single-name CDS and index CDS contracts are typically OTC-cleared derivative contracts. Single-name CDS are used to manage the default risk of a single reference entity, while index CDS contracts are used to manage the credit risk associated with the broader credit markets or credit market segments. Like the S&P 500 and other market indices, a CDS index comprises a portfolio of CDS across many reference entities. New series of CDS indices are periodically established with a new underlying portfolio of reference entities to reflect changes in the credit markets. If one of the reference entities in the index experiences a credit event, then the reference entity that defaulted is removed from the index. CDS can also be referenced against specific portfolios of reference names or against customized exposure levels based on specific client demands: for example, to provide protection against the first
$1 million
of realized credit losses in a
$10 million
portfolio of exposure. Such structures are commonly known as tranche CDS.
For both single-name CDS contracts and index CDS contracts, upon the occurrence of a credit event, under the terms of a CDS contract neither party to the CDS contract has recourse to the reference entity. The protection purchaser has recourse to the protection seller for the difference between the face value of the CDS contract and the fair value of the reference obligation at settlement of the credit derivative contract, also known as the recovery value. The protection purchaser does not need to hold the debt instrument of the underlying reference entity in order to receive amounts due under the CDS contract when a credit event occurs.
Credit-related notes
A credit-related note is a funded credit derivative where the issuer of the credit-related note purchases from the note investor credit protection on a reference entity or an index. Under the contract, the investor pays the issuer the par value of the note at the inception of the transaction, and in return, the issuer pays periodic payments to the investor, based on the credit risk of the referenced entity. The issuer also repays the investor the par value of the note at maturity unless the reference entity experiences a specified credit event (or one of the entities that makes up a reference index). If a credit event occurs, the issuer is not obligated to repay the par value of the note, but rather, the issuer pays the investor the difference between the par value of the note and the fair value of the defaulted reference obligation at the time of settlement. Neither party to the credit-related note has recourse to the defaulting reference entity. For a further discussion of credit-related notes, see Note 16.
The following tables present a summary of the notional amounts of credit derivatives and credit-related notes the Firm sold and purchased as of
December 31, 2014
and
2013
. Upon a credit event, the Firm as a seller of protection would typically pay out only a percentage of the full notional amount of net protection sold, as the amount actually required to be paid on the contracts takes into account the recovery value of the reference obligation at the time of settlement. The Firm manages the credit risk on contracts to sell protection by purchasing protection with identical or similar underlying reference entities. Other purchased protection referenced in the following tables includes credit derivatives bought on related, but not identical, reference positions (including indices, portfolio coverage and other reference points) as well as protection purchased through credit-related notes.
|
214
|
JPMorgan Chase & Co./2014 Annual Report
|
|
The Firm does not use notional amounts of credit derivatives as the primary measure of risk management for such derivatives, because the notional amount does not take into account the probability of the occurrence of a credit event, the recovery value of the reference obligation, or related cash instruments and economic hedges, each of which reduces, in the Firm’s view, the risks associated with such derivatives.
Total credit derivatives and credit-related notes
|
Maximum payout/Notional amount
|
||||||||||||||||
|
Protection sold
|
Protection purchased with identical underlyings
(c)
|
Net protection (sold)/purchased
(d)
|
Other protection purchased
(e)
|
|||||||||||||
|
December 31, 2014
(in millions)
|
||||||||||||||||
|
Credit derivatives
|
||||||||||||||||
|
Credit default swaps
|
$
|
(2,056,982
|
)
|
$
|
2,078,096
|
|
$
|
21,114
|
|
$
|
18,631
|
|
||||
|
Other credit derivatives
(a)
|
(43,281
|
)
|
32,048
|
|
(11,233
|
)
|
19,475
|
|
||||||||
|
Total credit derivatives
|
(2,100,263
|
)
|
2,110,144
|
|
9,881
|
|
38,106
|
|
||||||||
|
Credit-related notes
|
(40
|
)
|
—
|
|
(40
|
)
|
3,704
|
|
||||||||
|
Total
|
$
|
(2,100,303
|
)
|
$
|
2,110,144
|
|
$
|
9,841
|
|
$
|
41,810
|
|
||||
|
Maximum payout/Notional amount
|
||||||||||||||||
|
Protection sold
|
Protection purchased with identical underlyings
(c)
|
Net protection (sold)/purchased
(d)
|
Other protection purchased
(e)
|
|||||||||||||
|
December 31, 2013 (in millions)
|
||||||||||||||||
|
Credit derivatives
|
||||||||||||||||
|
Credit default swaps
|
$
|
(2,601,581
|
)
|
$
|
2,610,198
|
|
$
|
8,617
|
|
$
|
8,722
|
|
||||
|
Other credit derivatives
(a)
|
(44,137
|
)
|
(b)
|
45,921
|
|
1,784
|
|
20,480
|
|
(b)
|
||||||
|
Total credit derivatives
|
(2,645,718
|
)
|
2,656,119
|
|
10,401
|
|
29,202
|
|
||||||||
|
Credit-related notes
|
(130
|
)
|
—
|
|
(130
|
)
|
2,720
|
|
||||||||
|
Total
|
$
|
(2,645,848
|
)
|
$
|
2,656,119
|
|
$
|
10,271
|
|
$
|
31,922
|
|
||||
|
(a)
|
Other credit derivatives predominantly consists of credit swap options.
|
|
(b)
|
The prior period amounts have been revised. This revision had no impact on the Firm’s Consolidated balance sheets or its results of operations.
|
|
(c)
|
Represents the total notional amount of protection purchased where the underlying reference instrument is identical to the reference instrument on protection sold; the notional amount of protection purchased for each individual identical underlying reference instrument may be greater or lower than the notional amount of protection sold.
|
|
(d)
|
Does not take into account the fair value of the reference obligation at the time of settlement, which would generally reduce the amount the seller of protection pays to the buyer of protection in determining settlement value.
|
|
(e)
|
Represents protection purchased by the Firm on referenced instruments (single-name, portfolio or index) where the Firm has not sold any protection on the identical reference instrument.
|
The following tables summarize the notional amounts by the ratings and maturity profile, and the total fair value, of credit derivatives as of
December 31, 2014
and
2013
, where
JPMorgan Chase
is the seller of protection. The maturity profile is based on the remaining contractual maturity of the credit derivative contracts. The ratings profile is based on the rating of the reference entity on which the credit derivative contract is based. The ratings and maturity profile of credit derivatives and credit-related notes where JPMorgan Chase is the purchaser of protection are comparable to the profile reflected below.
|
Protection sold – credit derivatives and credit-related notes ratings
(a)
/maturity profile
|
||||||||||||||||||||||||||||
|
December 31, 2014
(in millions)
|
<1 year
|
1–5 years
|
>5 years
|
Total notional amount
|
Fair value of receivables
(c)
|
Fair value of payables
(c)
|
Net fair value
|
|||||||||||||||||||||
|
Risk rating of reference entity
|
||||||||||||||||||||||||||||
|
Investment-grade
|
$
|
(323,398
|
)
|
$
|
(1,118,293
|
)
|
$
|
(79,486
|
)
|
$
|
(1,521,177
|
)
|
$
|
25,767
|
|
$
|
(6,314
|
)
|
$
|
19,453
|
|
|||||||
|
Noninvestment-grade
|
(157,281
|
)
|
(396,798
|
)
|
(25,047
|
)
|
(579,126
|
)
|
20,677
|
|
(22,455
|
)
|
(1,778
|
)
|
||||||||||||||
|
Total
|
$
|
(480,679
|
)
|
$
|
(1,515,091
|
)
|
$
|
(104,533
|
)
|
$
|
(2,100,303
|
)
|
$
|
46,444
|
|
$
|
(28,769
|
)
|
$
|
17,675
|
|
|||||||
|
December 31, 2013
(in millions)
|
<1 year
|
1–5 years
|
>5 years
|
Total notional amount
|
Fair value of receivables
(c)
|
Fair value of payables
(c)
|
Net fair value
|
|||||||||||||||||||||
|
Risk rating of reference entity
|
||||||||||||||||||||||||||||
|
Investment-grade
|
$
|
(368,712
|
)
|
(b)
|
$
|
(1,469,773
|
)
|
(b)
|
$
|
(93,209
|
)
|
(b)
|
$
|
(1,931,694
|
)
|
(b)
|
$
|
31,730
|
|
(b)
|
$
|
(5,664
|
)
|
(b)
|
$
|
26,066
|
|
(b)
|
|
Noninvestment-grade
|
(140,540
|
)
|
(544,671
|
)
|
(28,943
|
)
|
(714,154
|
)
|
27,426
|
|
(16,674
|
)
|
10,752
|
|
||||||||||||||
|
Total
|
$
|
(509,252
|
)
|
$
|
(2,014,444
|
)
|
$
|
(122,152
|
)
|
$
|
(2,645,848
|
)
|
$
|
59,156
|
|
$
|
(22,338
|
)
|
$
|
36,818
|
|
|||||||
|
(a)
|
The ratings scale is primarily based on external credit ratings defined by S&P and Moody’s.
|
|
(b)
|
The prior period amounts have been revised. This revision had no impact on the Firm’s Consolidated balance sheets or its results of operations.
|
|
(c)
|
Amounts are shown on a gross basis, before the benefit of legally enforceable master netting agreements and cash collateral received by the Firm.
|
|
JPMorgan Chase & Co./2014 Annual Report
|
215
|
|
Notes to consolidated financial statements
Investment banking fees
This revenue category includes equity and debt underwriting and advisory fees. Underwriting fees are recognized as revenue when the Firm has rendered all services to the issuer and is entitled to collect the fee from the issuer, as long as there are no other contingencies associated with the fee. Underwriting fees are net of syndicate expense; the Firm recognizes credit arrangement and syndication fees as revenue after satisfying certain retention, timing and yield criteria. Advisory fees are recognized as revenue when the related services have been performed and the fee has been earned.
The following table presents the components of investment banking fees.
|
Year ended December 31,
(in millions)
|
2014
|
2013
|
2012
|
||||||||
|
Underwriting
|
|||||||||||
|
Equity
|
$
|
1,571
|
|
$
|
1,499
|
|
$
|
1,026
|
|
||
|
Debt
|
3,340
|
|
3,537
|
|
3,290
|
|
|||||
|
Total underwriting
|
4,911
|
|
5,036
|
|
4,316
|
|
|||||
|
Advisory
|
1,631
|
|
1,318
|
|
1,492
|
|
|||||
|
Total investment banking fees
|
$
|
6,542
|
|
$
|
6,354
|
|
$
|
5,808
|
|
||
Principal transactions
Principal transactions revenue consists of realized and unrealized gains and losses on derivatives and other instruments (including those accounted for under the fair value option) used in client-driven market-making activities and on private equity investments. In connection with its client-driven market-making activities, the Firm transacts in debt and equity instruments, derivatives and commodities (including physical commodities inventories and financial instruments that reference commodities).
Principal transactions revenue also includes realized and unrealized gains and losses related to hedge accounting and specified risk-management activities, including: (a) certain derivatives designated in qualifying hedge accounting relationships (primarily fair value hedges of commodity and foreign exchange risk), (b) certain derivatives used for specific risk management purposes, primarily to mitigate credit risk, foreign exchange risk and commodity risk, and (c) other derivatives, including the synthetic credit portfolio. For further information on the income statement classification of gains and losses from derivatives activities, see Note 6.
In the financial commodity markets, the Firm transacts in OTC derivatives (e.g., swaps, forwards, options) and exchange-traded derivatives that reference a wide range of underlying commodities. In the physical commodity markets, the Firm primarily purchases and sells precious and base metals and may hold other commodities inventories under financing and other arrangements with clients. Prior to the 2014 sale of certain parts of its physical commodity business, the Firm also engaged in the
purchase, sale, transport and storage of power, gas,
liquefied natural gas, coal, crude oil and refined products.
Physical commodities inventories are generally carried at the lower of cost or market (market approximates fair value) subject to any applicable fair value hedge accounting adjustments, with realized gains and losses and unrealized losses recorded in principal transactions revenue.
The following table presents all realized and unrealized gains and losses recorded in principal transactions revenue. This table excludes interest income and interest expense on trading assets and liabilities, which are an integral part of the overall performance of the Firm’s client-driven market-making activities. See Note 8 for further information on interest income and interest expense. Trading revenue is presented primarily by instrument type. The Firm’s client-driven market-making businesses generally utilize a variety of instrument types in connection with their market-making and related risk-management activities; accordingly, the trading revenue presented in the table below is not representative of the total revenue of any individual line of business.
|
Year ended December 31,
(in millions)
|
2014
|
2013
|
2012
|
||||||||
|
Trading revenue by instrument type
(a)
|
|||||||||||
|
Interest rate
(b)
|
$
|
1,362
|
|
$
|
284
|
|
$
|
4,002
|
|
||
|
Credit
(c)
|
1,880
|
|
2,654
|
|
(4,975
|
)
|
|||||
|
Foreign exchange
|
1,556
|
|
1,801
|
|
918
|
|
|||||
|
Equity
|
2,563
|
|
2,517
|
|
2,455
|
|
|||||
|
Commodity
(d)
|
1,663
|
|
2,083
|
|
2,365
|
|
|||||
|
Total trading revenue
(e)
|
9,024
|
|
9,339
|
|
4,765
|
|
|||||
|
Private equity gains
(f)
|
1,507
|
|
802
|
|
771
|
|
|||||
|
Principal transactions
|
$
|
10,531
|
|
$
|
10,141
|
|
$
|
5,536
|
|
||
|
(a)
|
Prior to the second quarter of 2014, trading revenue was presented by major underlying type of risk exposure, generally determined based upon the business primarily responsible for managing that risk exposure. Prior period amounts have been revised to conform with the current period presentation. This revision had no impact on the Firm’s Consolidated balance sheets or results of operations.
|
|
(b)
|
Includes a pretax gain of
$665 million
for the year ended December 31, 2012, reflecting the recovery on a Bear Stearns-related subordinated loan.
|
|
(c)
|
Includes
$5.8 billion
of losses incurred by CIO from the synthetic credit portfolio for the six months ended June 30, 2012, and
$449 million
of losses incurred by CIO from the retained index credit derivative positions for the three months ended September 30, 2012; and losses incurred by CIB from the synthetic credit portfolio.
|
|
(d)
|
Commodity derivatives are frequently used to manage the Firm’s risk exposure to its physical commodities inventories. For gains/(losses) related to commodity fair value hedges, see Note 6.
|
|
(e)
|
During 2013, the Firm implemented a FVA framework in order to incorporate the impact of funding into its valuation estimates for OTC derivatives and structured notes. As a result, the Firm recorded a
$1.5 billion
loss in principal transactions revenue in 2013, reported in the CIB. This reflected an industry migration towards incorporating the cost of unsecured funding in the valuation of such instruments.
|
|
(f)
|
Includes revenue on private equity investments held in the Private Equity business within Corporate, as well as those held in other business segments.
|
|
216
|
JPMorgan Chase & Co./2014 Annual Report
|
|
Lending- and deposit-related fees
This revenue category includes fees from loan commitments, standby letters of credit, financial guarantees, deposit-related fees in lieu of compensating balances, cash management-related activities or transactions, deposit accounts and other loan-servicing activities. These fees are recognized over the period in which the related service is provided.
Asset management, administration and commissions
This revenue category includes fees from investment management and related services, custody, brokerage services, insurance premiums and commissions, and other products. These fees are recognized over the period in which the related service is provided. Performance-based fees, which are earned based on exceeding certain benchmarks or other performance targets, are accrued and recognized at the end of the performance period in which the target is met. The Firm has contractual arrangements with third parties to provide certain services in connection with its asset management activities. Amounts paid to third-party service providers are predominantly expensed, such that asset management fees are recorded gross of payments made to third parties.
The following table presents components of asset management, administration and commissions.
|
Year ended December 31,
(in millions)
|
2014
|
2013
|
2012
|
||||||||
|
Asset management fees
|
|||||||||||
|
Investment management fees
(a)
|
$
|
9,169
|
|
$
|
8,044
|
|
$
|
6,744
|
|
||
|
All other asset management fees
(b)
|
477
|
|
505
|
|
357
|
|
|||||
|
Total asset management fees
|
9,646
|
|
8,549
|
|
7,101
|
|
|||||
|
Total administration fees
(c)
|
2,179
|
|
2,101
|
|
2,135
|
|
|||||
|
Commissions and other fees
|
|||||||||||
|
Brokerage commissions
|
2,270
|
|
2,321
|
|
2,331
|
|
|||||
|
All other commissions and fees
|
1,836
|
|
2,135
|
|
2,301
|
|
|||||
|
Total commissions and fees
|
4,106
|
|
4,456
|
|
4,632
|
|
|||||
|
Total asset management, administration and commissions
|
$
|
15,931
|
|
$
|
15,106
|
|
$
|
13,868
|
|
||
|
(a)
|
Represents fees earned from managing assets on behalf of Firm clients, including investors in Firm-sponsored funds and owners of separately managed investment accounts.
|
|
(b)
|
Represents fees for services that are ancillary to investment management services, such as commissions earned on the sales or distribution of mutual funds to clients.
|
|
(c)
|
Predominantly includes fees for custody, securities lending, funds services and securities clearance.
|
Mortgage fees and related income
This revenue category primarily reflects CCB’s Mortgage Production and Mortgage Servicing revenue, including fees and income derived from mortgages originated with the intent to sell; mortgage sales and servicing including losses related to the repurchase of previously sold loans; the impact of risk-management activities associated with the mortgage pipeline, warehouse loans and MSRs; and revenue related to any residual interests held from mortgage securitizations. This revenue category also includes gains and losses on sales and lower of cost or fair value adjustments for mortgage loans held-for-sale, as well as changes in fair value for mortgage loans originated with the intent to sell and measured at fair value under the fair value option. Changes in the fair value of CCB MSRs are reported in mortgage fees and related income. Net interest income from mortgage loans is recorded in interest income. For a further discussion of MSRs, see Note 17.
Card income
This revenue category includes interchange income from credit and debit cards and net fees earned from processing credit card transactions for merchants. Card income is recognized as earned. Cost related to rewards programs is recorded when the rewards are earned by the customer and presented as a reduction to interchange income. Annual fees and direct loan origination costs are deferred and recognized on a straight-line basis over a
12
-month period.
Credit card revenue sharing agreements
The Firm has contractual agreements with numerous co-brand partners and affinity organizations (collectively, “partners”), which grant the Firm exclusive rights to market to the customers or members of such partners. These partners endorse the credit card programs and provide their customer and member lists to the Firm, and they may also conduct marketing activities and provide awards under the various credit card programs. The terms of these agreements generally range from
three
to
ten
years.
The Firm typically makes incentive payments to the partners based on new account originations, charge volumes and the cost of the partners’ marketing activities and awards. Payments based on new account originations are accounted for as direct loan origination costs. Payments to partners based on sales volumes are deducted from interchange income as the related revenue is earned. Payments based on marketing efforts undertaken by the partners are expensed by the Firm as incurred and reported as noninterest expense.
Other income
Included in other income is operating lease income of
$1.7 billion
,
$1.5 billion
and
$1.3 billion
for the years ended
December 31, 2014
,
2013
and
2012
, respectively. Additionally, included in other income for the year ended
December 31, 2013
, is a net pretax gain of approximately
$1.3 billion
, from the sale of Visa B Shares.
|
JPMorgan Chase & Co./2014 Annual Report
|
217
|
|
Notes to consolidated financial statements
Interest income and interest expense are recorded in the Consolidated statements of income and classified based on the nature of the underlying asset or liability. Interest income and interest expense includes the current-period interest accruals for financial instruments measured at fair value, except for financial instruments containing embedded derivatives that would be separately accounted for in accordance with U.S. GAAP absent the fair value option election; for those instruments, all changes in fair value, including any interest elements, are reported in principal transactions revenue. For financial instruments that are not measured at fair value, the related interest is included within interest income or interest expense, as applicable.
Details of interest income and interest expense were as follows.
|
Year ended December 31,
(in millions)
|
2014
|
2013
|
2012
|
|||||||||
|
Interest income
|
||||||||||||
|
Loans
|
$
|
32,218
|
|
$
|
33,489
|
|
$
|
35,832
|
|
|||
|
Taxable securities
|
7,617
|
|
6,916
|
|
7,231
|
|
||||||
|
Non-taxable securities
(a)
|
1,423
|
|
896
|
|
708
|
|
||||||
|
Total securities
|
9,040
|
|
7,812
|
|
7,939
|
|
||||||
|
Trading assets
(b)
|
7,312
|
|
8,099
|
|
8,929
|
|
||||||
|
Federal funds sold and securities purchased under resale agreements
|
1,642
|
|
1,940
|
|
2,442
|
|
||||||
|
Securities borrowed
(c)
|
(501
|
)
|
(127
|
)
|
(3
|
)
|
||||||
|
Deposits with banks
|
1,157
|
|
918
|
|
555
|
|
||||||
|
Other assets
(d)
|
663
|
|
538
|
|
259
|
|
||||||
|
Total interest income
(b)
|
51,531
|
|
52,669
|
|
55,953
|
|
||||||
|
Interest expense
|
||||||||||||
|
Interest-bearing deposits
|
1,633
|
|
2,067
|
|
2,655
|
|
||||||
|
Short-term and other liabilities
(b)(e)
|
1,450
|
|
1,798
|
|
1,678
|
|
||||||
|
Long-term debt
|
4,409
|
|
5,007
|
|
6,062
|
|
||||||
|
Beneficial interests issued by consolidated VIEs
|
405
|
|
478
|
|
648
|
|
||||||
|
Total interest expense
(b)
|
7,897
|
|
9,350
|
|
11,043
|
|
||||||
|
Net interest income
|
43,634
|
|
43,319
|
|
44,910
|
|
||||||
|
Provision for credit losses
|
3,139
|
|
225
|
|
3,385
|
|
||||||
|
Net interest income after provision for credit losses
|
$
|
40,495
|
|
$
|
43,094
|
|
$
|
41,525
|
|
|||
|
(a)
|
Represents securities which are tax exempt for U.S. Federal Income Tax purposes.
|
|
(b)
|
Prior period amounts have been reclassified to conform with the current period presentation.
|
|
(c)
|
Negative interest income for the years ended December 31, 2014, 2013 and 2012, is a result of increased client-driven demand for certain securities combined with the impact of low interest rates; the offset of this matched book activity is reflected as lower net interest expense reported within short-term and other liabilities.
|
|
(d)
|
Largely margin loans.
|
|
(e)
|
Includes brokerage customer payables.
|
The Firm’s defined benefit pension plans and its other postretirement employee benefit (“OPEB”) plans are accounted for in accordance with U.S. GAAP for retirement benefits.
Defined benefit pension plans
The Firm has a qualified noncontributory U.S. defined benefit pension plan that provides benefits to substantially all U.S. employees. The U.S. plan employs a cash balance formula in the form of pay and interest credits to determine the benefits to be provided at retirement, based on years of service and eligible compensation (generally base pay capped at
$100,000
annually; effective January 1, 2015, in addition to base pay, eligible compensation will include certain other types of variable incentive compensation capped at $100,000 annually). Employees begin to accrue plan benefits after completing
one year
of service, and benefits generally vest after
three years
of service. The Firm also offers benefits through defined benefit pension plans to qualifying employees in certain non-U.S. locations based on factors such as eligible compensation, age and/or years of service.
It is the Firm’s policy to fund the pension plans in amounts sufficient to meet the requirements under applicable laws. The Firm does
no
t anticipate at this time any contribution to the U.S. defined benefit pension plan in
2015
. The
2015
contributions to the non-U.S. defined benefit pension plans are expected to be
$47 million
of which
$31 million
are contractually required.
JPMorgan Chase also has a number of defined benefit pension plans that are not subject to Title IV of the Employee Retirement Income Security Act. The most significant of these plans is the Excess Retirement Plan, pursuant to which certain employees previously earned pay credits on compensation amounts above the maximum stipulated by law under a qualified plan; no further pay credits are allocated under this plan. The Excess Retirement Plan had an unfunded projected benefit obligation (“PBO”) in the amount of
$257 million
and
$245 million
, at
December 31, 2014
and
2013
, respectively.
Defined contribution plans
JPMorgan Chase currently provides two qualified defined contribution plans in the U.S. and other similar arrangements in certain non-U.S. locations, all of which are administered in accordance with applicable local laws and regulations. The most significant of these plans is The JPMorgan Chase 401(k) Savings Plan (the “401(k) Savings Plan”), which covers substantially all U.S. employees. Employees can contribute to the 401(k) Savings Plan on a pretax and/or Roth 401(k) after-tax basis. The JPMorgan Chase Common Stock Fund, which is an investment option under the 401(k) Savings Plan, is a nonleveraged employee stock ownership plan.
|
218
|
JPMorgan Chase & Co./2014 Annual Report
|
|
The Firm matches eligible employee contributions up to
5%
of eligible compensation (generally base pay; effective January 1, 2015, in addition to base pay, eligible compensation will include certain other types of variable incentive compensation) on an annual basis. Employees begin to receive matching contributions after completing a
one
-year-of-service requirement. Employees with total annual cash compensation of
$250,000
or more are not eligible for matching contributions. Matching contributions vest after
three years
of service for employees hired on or after May 1, 2009. The 401(k) Savings Plan also permits discretionary profit-sharing contributions by participating companies for certain employees, subject to a specified vesting schedule.
OPEB plans
JPMorgan Chase offers postretirement medical and life insurance benefits to certain retirees and postretirement medical benefits to qualifying U.S. employees. These benefits vary with the length of service and the date of hire and provide for limits on the Firm’s share of covered medical benefits. The medical and life insurance benefits are both contributory. Postretirement medical benefits also are offered to qualifying United Kingdom (“U.K.”) employees.
JPMorgan Chase’s U.S. OPEB obligation is funded with corporate-owned life insurance (“COLI”) purchased on the lives of eligible employees and retirees. While the Firm owns the COLI policies, COLI proceeds (death benefits, withdrawals and other distributions) may be used only to reimburse the Firm for its net postretirement benefit claim payments and related administrative expense. The U.K. OPEB plan is unfunded.
The following table presents the changes in benefit obligations, plan assets and funded status amounts reported on the Consolidated balance sheets for the Firm’s U.S. and non-U.S. defined benefit pension and OPEB plans.
|
|
Defined benefit pension plans
|
||||||||||||||||||||||
|
As of or for the year ended December 31,
|
U.S.
|
Non-U.S.
|
OPEB plans
(d)
|
||||||||||||||||||||
|
(in millions)
|
2014
|
2013
|
2014
|
2013
|
2014
|
2013
|
|||||||||||||||||
|
Change in benefit obligation
|
|||||||||||||||||||||||
|
Benefit obligation, beginning of year
|
$
|
(10,776
|
)
|
$
|
(11,478
|
)
|
$
|
(3,433
|
)
|
$
|
(3,243
|
)
|
$
|
(826
|
)
|
$
|
(990
|
)
|
|||||
|
Benefits earned during the year
|
(281
|
)
|
(314
|
)
|
(33
|
)
|
(34
|
)
|
—
|
|
(1
|
)
|
|||||||||||
|
Interest cost on benefit obligations
|
(534
|
)
|
(447
|
)
|
(137
|
)
|
(125
|
)
|
(38
|
)
|
(35
|
)
|
|||||||||||
|
Plan amendments
|
(53
|
)
|
—
|
|
—
|
|
—
|
|
—
|
|
—
|
|
|||||||||||
|
Special termination benefits
|
—
|
|
—
|
|
(1
|
)
|
—
|
|
—
|
|
—
|
|
|||||||||||
|
Curtailments
|
—
|
|
—
|
|
—
|
|
—
|
|
(3
|
)
|
—
|
|
|||||||||||
|
Employee contributions
|
NA
|
|
NA
|
|
(7
|
)
|
(7
|
)
|
(62
|
)
|
(72
|
)
|
|||||||||||
|
Net gain/(loss)
|
(1,669
|
)
|
794
|
|
(408
|
)
|
(62
|
)
|
(58
|
)
|
138
|
|
|||||||||||
|
Benefits paid
|
777
|
|
669
|
|
119
|
|
106
|
|
145
|
|
144
|
|
|||||||||||
|
Expected Medicare Part D subsidy receipts
|
NA
|
|
NA
|
|
NA
|
|
NA
|
|
(2
|
)
|
(10
|
)
|
|||||||||||
|
Foreign exchange impact and other
|
—
|
|
—
|
|
260
|
|
(68
|
)
|
2
|
|
—
|
|
|||||||||||
|
Benefit obligation, end of year
|
$
|
(12,536
|
)
|
$
|
(10,776
|
)
|
$
|
(3,640
|
)
|
$
|
(3,433
|
)
|
$
|
(842
|
)
|
$
|
(826
|
)
|
|||||
|
Change in plan assets
|
|||||||||||||||||||||||
|
Fair value of plan assets, beginning of year
|
$
|
14,354
|
|
$
|
13,012
|
|
$
|
3,532
|
|
$
|
3,330
|
|
$
|
1,757
|
|
$
|
1,563
|
|
|||||
|
Actual return on plan assets
|
1,010
|
|
1,979
|
|
518
|
|
187
|
|
159
|
|
211
|
|
|||||||||||
|
Firm contributions
|
36
|
|
32
|
|
46
|
|
45
|
|
3
|
|
2
|
|
|||||||||||
|
Employee contributions
|
—
|
|
—
|
|
7
|
|
7
|
|
—
|
|
—
|
|
|||||||||||
|
Benefits paid
|
(777
|
)
|
(669
|
)
|
(119
|
)
|
(106
|
)
|
(16
|
)
|
(19
|
)
|
|||||||||||
|
Foreign exchange impact and other
|
—
|
|
—
|
|
(266
|
)
|
69
|
|
—
|
|
—
|
|
|||||||||||
|
Fair value of plan assets, end of year
|
$
|
14,623
|
|
$
|
14,354
|
|
(b)(c)
|
$
|
3,718
|
|
$
|
3,532
|
|
$
|
1,903
|
|
$
|
1,757
|
|
||||
|
Net funded status
(a)
|
$
|
2,087
|
|
$
|
3,578
|
|
$
|
78
|
|
$
|
99
|
|
$
|
1,061
|
|
$
|
931
|
|
|||||
|
Accumulated benefit obligation, end of year
|
$
|
(12,375
|
)
|
$
|
(10,685
|
)
|
$
|
(3,615
|
)
|
$
|
(3,406
|
)
|
NA
|
|
NA
|
|
|||||||
|
(a)
|
Represents plans with an aggregate overfunded balance of
$3.9 billion
and
$5.1 billion
at
December 31, 2014
and
2013
, respectively, and plans with an aggregate underfunded balance of
$708 million
and
$540 million
at
December 31, 2014
and
2013
, respectively.
|
|
(b)
|
At
December 31, 2014
and
2013
, approximately
$336 million
and
$429 million
, respectively, of U.S. plan assets included participation rights under participating annuity contracts.
|
|
(c)
|
At
December 31, 2014
and
2013
, defined benefit pension plan amounts not measured at fair value included
$106 million
and
$96 million
, respectively, of accrued receivables, and
$257 million
and
$104 million
, respectively, of accrued liabilities, for U.S. plans.
|
|
(d)
|
Includes an unfunded accumulated postretirement benefit obligation of
$37 million
and
$34 million
at
December 31, 2014
and
2013
, respectively, for the U.K. plan.
|
|
JPMorgan Chase & Co./2014 Annual Report
|
219
|
|
Notes to consolidated financial statements
Gains and losses
For the Firm’s defined benefit pension plans, fair value is used to determine the expected return on plan assets. Amortization of net gains and losses is included in annual net periodic benefit cost if, as of the beginning of the year, the net gain or loss exceeds
10%
of the greater of the PBO or the fair value of the plan assets. Any excess is amortized over the average future service period of defined benefit pension plan participants, which for the U.S. defined benefit pension plan is currently
seven years
. In addition, prior service costs are amortized over the average remaining service period of active employees expected to receive benefits under the plan when the prior service cost is first recognized. The average remaining amortization period for current prior service costs is
five years
.
For the Firm’s OPEB plans, a calculated value that recognizes changes in fair value over a
five
-year period is used to determine the expected return on plan assets. This value is referred to as the market related value of assets. Amortization of net gains and losses, adjusted for gains and losses not yet recognized, is included in annual net periodic benefit cost if, as of the beginning of the year, the net gain or loss exceeds
10%
of the greater of the accumulated postretirement benefit obligation or the market related value of assets. Any excess net gain or loss is amortized over the average expected lifetime of retired participants, which is currently
twelve years
; however, prior service costs resulting from plan changes are amortized over the average years of service remaining to full eligibility age, which is currently
two years
.
The following table presents pretax pension and OPEB amounts recorded in AOCI.
|
Defined benefit pension plans
|
|
||||||||||||||||||||||
|
December 31,
|
U.S.
|
Non-U.S.
|
OPEB plans
|
||||||||||||||||||||
|
(in millions)
|
2014
|
2013
|
2014
|
2013
|
2014
|
2013
|
|||||||||||||||||
|
Net gain/(loss)
|
$
|
(3,346
|
)
|
$
|
(1,726
|
)
|
$
|
(628
|
)
|
$
|
(658
|
)
|
$
|
130
|
|
$
|
125
|
|
|||||
|
Prior service credit/(cost)
|
102
|
|
196
|
|
11
|
|
14
|
|
—
|
|
1
|
|
|||||||||||
|
Accumulated other comprehensive income/(loss), pretax, end of year
|
$
|
(3,244
|
)
|
$
|
(1,530
|
)
|
$
|
(617
|
)
|
$
|
(644
|
)
|
$
|
130
|
|
$
|
126
|
|
|||||
The following table presents the components of net periodic benefit costs reported in the Consolidated statements of income and other comprehensive income for the Firm’s U.S. and non-U.S. defined benefit pension, defined contribution and OPEB plans.
|
Pension plans
|
|||||||||||||||||||||||||||||||
|
U.S.
|
Non-U.S.
|
OPEB plans
|
|||||||||||||||||||||||||||||
|
Year ended December 31, (in millions)
|
2014
|
|
2013
|
|
2012
|
|
2014
|
|
2013
|
|
2012
|
|
2014
|
|
2013
|
|
2012
|
|
|||||||||||||
|
Components of net periodic benefit cost
|
|||||||||||||||||||||||||||||||
|
Benefits earned during the year
|
$
|
281
|
|
$
|
314
|
|
$
|
272
|
|
$
|
33
|
|
$
|
34
|
|
$
|
41
|
|
$
|
—
|
|
$
|
1
|
|
$
|
1
|
|
||||
|
Interest cost on benefit obligations
|
534
|
|
447
|
|
466
|
|
137
|
|
125
|
|
126
|
|
38
|
|
35
|
|
44
|
|
|||||||||||||
|
Expected return on plan assets
|
(985
|
)
|
(956
|
)
|
(861
|
)
|
(172
|
)
|
(142
|
)
|
(137
|
)
|
(101
|
)
|
(92
|
)
|
(90
|
)
|
|||||||||||||
|
Amortization:
|
|||||||||||||||||||||||||||||||
|
Net (gain)/loss
|
25
|
|
271
|
|
289
|
|
47
|
|
49
|
|
36
|
|
—
|
|
1
|
|
(1
|
)
|
|||||||||||||
|
Prior service cost/(credit)
|
(41
|
)
|
(41
|
)
|
(41
|
)
|
(2
|
)
|
(2
|
)
|
—
|
|
(1
|
)
|
—
|
|
—
|
|
|||||||||||||
|
Net periodic defined benefit cost
|
(186
|
)
|
35
|
|
125
|
|
43
|
|
64
|
|
66
|
|
(64
|
)
|
(55
|
)
|
(46
|
)
|
|||||||||||||
|
Other defined benefit pension plans
(a)
|
14
|
|
15
|
|
15
|
|
6
|
|
14
|
|
8
|
|
NA
|
|
NA
|
|
NA
|
|
|||||||||||||
|
Total defined benefit plans
|
(172
|
)
|
50
|
|
140
|
|
49
|
|
78
|
|
74
|
|
(64
|
)
|
(55
|
)
|
(46
|
)
|
|||||||||||||
|
Total defined contribution plans
|
438
|
|
447
|
|
409
|
|
329
|
|
321
|
|
302
|
|
NA
|
|
NA
|
|
NA
|
|
|||||||||||||
|
Total pension and OPEB cost included in compensation expense
|
$
|
266
|
|
$
|
497
|
|
$
|
549
|
|
$
|
378
|
|
$
|
399
|
|
$
|
376
|
|
$
|
(64
|
)
|
$
|
(55
|
)
|
$
|
(46
|
)
|
||||
|
Changes in plan assets and benefit obligations recognized in other comprehensive income
|
|||||||||||||||||||||||||||||||
|
Net (gain)/loss arising during the year
|
$
|
1,645
|
|
$
|
(1,817
|
)
|
$
|
434
|
|
$
|
57
|
|
$
|
19
|
|
$
|
146
|
|
$
|
(5
|
)
|
$
|
(257
|
)
|
$
|
(43
|
)
|
||||
|
Prior service credit arising during the year
|
53
|
|
—
|
|
—
|
|
—
|
|
—
|
|
(6
|
)
|
—
|
|
—
|
|
—
|
|
|||||||||||||
|
Amortization of net loss
|
(25
|
)
|
(271
|
)
|
(289
|
)
|
(47
|
)
|
(49
|
)
|
(36
|
)
|
—
|
|
(1
|
)
|
1
|
|
|||||||||||||
|
Amortization of prior service (cost)/credit
|
41
|
|
41
|
|
41
|
|
2
|
|
2
|
|
—
|
|
1
|
|
—
|
|
—
|
|
|||||||||||||
|
Foreign exchange impact and other
|
—
|
|
—
|
|
—
|
|
(39
|
)
|
(a)
|
14
|
|
(a)
|
22
|
|
(a)
|
—
|
|
—
|
|
(1
|
)
|
||||||||||
|
Total recognized in other comprehensive income
|
$
|
1,714
|
|
$
|
(2,047
|
)
|
$
|
186
|
|
$
|
(27
|
)
|
$
|
(14
|
)
|
$
|
126
|
|
$
|
(4
|
)
|
$
|
(258
|
)
|
$
|
(43
|
)
|
||||
|
Total recognized in net periodic benefit cost and other comprehensive income
|
$
|
1,528
|
|
$
|
(2,012
|
)
|
$
|
311
|
|
$
|
16
|
|
$
|
50
|
|
$
|
192
|
|
$
|
(68
|
)
|
$
|
(313
|
)
|
$
|
(89
|
)
|
||||
|
(a)
|
Includes various defined benefit pension plans which are individually immaterial.
|
|
220
|
JPMorgan Chase & Co./2014 Annual Report
|
|
The estimated pretax amounts that will be amortized from AOCI into net periodic benefit cost in
2015
are as follows.
|
|
Defined benefit pension plans
|
OPEB plans
|
||||||||||||||
|
(in millions)
|
U.S.
|
Non-U.S.
|
U.S.
|
Non-U.S.
|
||||||||||||
|
Net loss/(gain)
|
$
|
257
|
|
$
|
37
|
|
$
|
—
|
|
$
|
—
|
|
||||
|
Prior service cost/(credit)
|
(34
|
)
|
(2
|
)
|
—
|
|
—
|
|
||||||||
|
Total
|
$
|
223
|
|
$
|
35
|
|
$
|
—
|
|
$
|
—
|
|
||||
The following table presents the actual rate of return on plan assets for the U.S. and non-U.S. defined benefit pension and OPEB plans.
|
|
U.S.
|
Non-U.S.
|
||||||||||||
|
Year ended December 31,
|
2014
|
|
2013
|
|
2012
|
|
2014
|
2013
|
2012
|
|||||
|
Actual rate of return:
|
|
|
|
|
|
|
||||||||
|
Defined benefit pension plans
|
7.29
|
%
|
15.95
|
%
|
12.66
|
%
|
5.62 - 17.69%
|
3.74 - 23.80%
|
7.21 - 11.72%
|
|||||
|
OPEB plans
|
9.84
|
|
13.88
|
|
10.10
|
|
NA
|
NA
|
NA
|
|||||
Plan assumptions
JPMorgan Chase’s expected long-term rate of return for U.S. defined benefit pension and OPEB plan assets is a blended average of the investment advisor’s projected long-term (
10 years
or more) returns for the various asset classes, weighted by the asset allocation. Returns on asset classes are developed using a forward-looking approach and are not strictly based on historical returns. Equity returns are generally developed as the sum of inflation, expected real earnings growth and expected long-term dividend yield. Bond returns are generally developed as the sum of inflation, real bond yield and risk spread (as appropriate), adjusted for the expected effect on returns from changing yields. Other asset-class returns are derived from their relationship to the equity and bond markets. Consideration is also given to current market conditions and the short-term portfolio mix of each plan.
For the U.K. defined benefit pension plans, which represent the most significant of the non-U.S. defined benefit pension plans, procedures similar to those in the U.S. are used to develop the expected long-term rate of return on plan assets, taking into consideration local market conditions and the specific allocation of plan assets. The expected long-term rate of return on U.K. plan assets is an average of projected long-term returns for each asset class. The return on equities has been selected by reference to the yield on long-term U.K. government bonds plus an equity risk premium above the risk-free rate. The expected return on “AA” rated long-term corporate bonds is based on an implied yield for similar bonds.
The discount rate used in determining the benefit obligation under the U.S. defined benefit pension and OPEB plans was selected by reference to the yields on portfolios of bonds with maturity dates and coupons that closely match each of the plan’s projected cash flows; such portfolios are derived from a broad-based universe of high-quality corporate bonds as of the measurement date. In years in which these hypothetical bond portfolios generate excess cash, such excess is assumed to be reinvested at the
one
-year forward
rates implied by the Citigroup Pension Discount Curve published as of the measurement date. The discount rate for the U.K. defined benefit pension plan represents a rate of appropriate duration from the analysis of yield curves provided by our actuaries.
In 2014, the Society of Actuaries (“SOA”) completed a comprehensive review of mortality experience of uninsured private retirement plans in the U.S. In October 2014, the SOA published new mortality tables and a new mortality improvement scale that reflects improved life expectancies and an expectation that this trend will continue. The Firm has adopted the SOA’s tables and projection scale, resulting in an estimated increase in PBO of
$533 million
.
At
December 31, 2014
, the Firm decreased the discount rates used to determine its benefit obligations for the U.S. defined benefit pension and OPEB plans in light of current market interest rates, which will result in an increase in expense of approximately
$139 million
for
2015
. The
2015
expected long-term rate of return on U.S. defined benefit pension plan assets and U.S. OPEB plan assets are
6.50%
and
6.00%
, respectively. For 2015, the initial health care benefit obligation trend assumption has been set at
6.00%
, and the ultimate health care trend assumption and the year to reach the ultimate rate remains at
5.00%
and
2017
, respectively, unchanged from 2014. As of
December 31, 2014
, the interest crediting rate assumption and the assumed rate of compensation increase remained at
5.00%
and
3.50%
, respectively.
The following tables present the weighted-average annualized actuarial assumptions for the projected and accumulated postretirement benefit obligations, and the components of net periodic benefit costs, for the Firm’s significant U.S. and non-U.S. defined benefit pension and OPEB plans, as of and for the periods indicated.
|
JPMorgan Chase & Co./2014 Annual Report
|
221
|
|
Notes to consolidated financial statements
|
Weighted-average assumptions used to determine benefit obligations
|
|||||||||||
|
|
U.S.
|
Non-U.S.
|
|||||||||
|
December 31,
|
2014
|
|
2013
|
|
2014
|
|
2013
|
|
|||
|
Discount rate:
|
|
|
|
|
|||||||
|
Defined benefit pension plans
|
4.00
|
%
|
5.00
|
%
|
1.00 - 3.60%
|
|
1.10 - 4.40%
|
|
|||
|
OPEB plans
|
4.10
|
|
4.90
|
|
—
|
|
—
|
|
|||
|
Rate of compensation increase
|
3.50
|
|
3.50
|
|
2.75 - 4.20
|
|
2.75 - 4.60
|
|
|||
|
Health care cost trend rate:
|
|
|
|
||||||||
|
Assumed for next year
|
6.00
|
|
6.50
|
|
—
|
|
—
|
|
|||
|
Ultimate
|
5.00
|
|
5.00
|
|
—
|
|
—
|
|
|||
|
Year when rate will reach ultimate
|
2017
|
|
2017
|
|
—
|
|
—
|
|
|||
|
Weighted-average assumptions used to determine net periodic benefit costs
|
|||||||||||||||||
|
|
U.S.
|
Non-U.S.
|
|||||||||||||||
|
Year ended December 31,
|
2014
|
|
2013
|
|
2012
|
|
2014
|
|
2013
|
|
2012
|
|
|||||
|
Discount rate:
|
|
|
|
|
|
|
|||||||||||
|
Defined benefit pension plans
|
5.00
|
%
|
3.90
|
%
|
4.60
|
%
|
1.10 - 4.40%
|
|
1.40 - 4.40%
|
|
1.50 - 4.80%
|
|
|||||
|
OPEB plans
|
4.90
|
|
3.90
|
|
4.70
|
|
—
|
|
—
|
|
—
|
|
|||||
|
Expected long-term rate of return on plan assets:
|
|
|
|
||||||||||||||
|
Defined benefit pension plans
|
7.00
|
|
7.50
|
|
7.50
|
|
1.20 - 5.30
|
|
2.40 - 4.90
|
|
2.50 - 4.60
|
|
|||||
|
OPEB plans
|
6.25
|
|
6.25
|
|
6.25
|
|
NA
|
|
NA
|
|
NA
|
|
|||||
|
Rate of compensation increase
|
3.50
|
|
4.00
|
|
4.00
|
|
2.75 - 4.60
|
|
2.75 - 4.10
|
|
2.75 - 4.20
|
|
|||||
|
Health care cost trend rate:
|
|
|
|
||||||||||||||
|
Assumed for next year
|
6.50
|
|
7.00
|
|
7.00
|
|
—
|
|
—
|
|
—
|
|
|||||
|
Ultimate
|
5.00
|
|
5.00
|
|
5.00
|
|
—
|
|
—
|
|
—
|
|
|||||
|
Year when rate will reach ultimate
|
2017
|
|
2017
|
|
2017
|
|
—
|
|
—
|
|
—
|
|
|||||
The following table presents the effect of a one-percentage-point change in the assumed health care cost trend rate on JPMorgan Chase’s accumulated postretirement benefit obligation. As of
December 31, 2014
, there was no material effect on total service and interest cost.
|
Year ended December 31, 2014
(in millions)
|
1-Percentage point increase
|
1-Percentage point decrease
|
|||||
|
Effect on accumulated postretirement benefit obligation
|
$
|
9
|
|
$
|
(8
|
)
|
|
JPMorgan Chase’s U.S. defined benefit pension and OPEB plan expense is sensitive to the expected long-term rate of return on plan assets and the discount rate. With all other assumptions held constant, a 25-basis point decline in the expected long-term rate of return on U.S. plan assets would result in an aggregate increase of approximately
$40 million
in
2015
U.S. defined benefit pension and OPEB plan expense. A 25-basis point decline in the discount rate for the U.S. plans would result in an increase in
2015
U.S. defined benefit pension and OPEB plan expense of approximately an aggregate
$36 million
and an increase in the related benefit obligations of approximately an aggregate
$333 million
. A 25-basis point decrease in the interest crediting rate for the U.S. defined benefit pension plan would result in a decrease in
2015
U.S. defined benefit pension expense of approximately
$36 million
and a decrease in the related PBO of approximately
$148 million
. A 25-basis point decline in the discount rates for the non-U.S. plans would result in an increase in the
2015
non-U.S. defined benefit pension plan expense of approximately
$19 million
.
|
222
|
JPMorgan Chase & Co./2014 Annual Report
|
|
Investment strategy and asset allocation
The Firm’s U.S. defined benefit pension plan assets are held in trust and are invested in a well-diversified portfolio of equity and fixed income securities, cash and cash equivalents, and alternative investments (e.g., hedge funds, private equity, real estate and real assets). Non-U.S. defined benefit pension plan assets are held in various trusts and are also invested in well-diversified portfolios of equity, fixed income and other securities. Assets of the Firm’s COLI policies, which are used to partially fund the U.S. OPEB plan, are held in separate accounts of an insurance company and are allocated to investments intended to replicate equity and fixed income indices.
The investment policy for the Firm’s U.S. defined benefit pension plan assets is to optimize the risk-return relationship as appropriate to the needs and goals of the plan using a global portfolio of various asset classes diversified by market segment, economic sector, and issuer. Assets are managed by a combination of internal and external investment managers. Periodically the Firm performs a comprehensive analysis on the U.S. defined benefit pension plan asset allocations, incorporating projected asset and liability data, which focuses on the short- and long-term impact of the asset allocation on cumulative pension expense, economic cost, present value of contributions and funded status. As the U.S. defined benefit pension plan is overfunded, the investment strategy for this plan was adjusted in 2013 to provide for greater liquidity.
Currently, approved asset allocation ranges are: U.S. equity
0%
to
45%
, international equity
0%
to
40%
, debt securities
0%
to
80%
, hedge funds
0%
to
5%
, real estate
0%
to
10%
, real assets
0%
to
10%
and private equity
0%
to
20%
. Asset allocations are not managed to a specific target but seek to shift asset class allocations within these stated ranges. Investment strategies incorporate the economic outlook and the anticipated implications of the
macroeconomic environment on the various asset classes while maintaining an appropriate level of liquidity for the plan. The Firm regularly reviews the asset allocations and asset managers, as well as other factors that impact the portfolio, which is rebalanced when deemed necessary.
For the U.K. defined benefit pension plans, which represent the most significant of the non-U.S. defined benefit pension plans, the assets are invested to maximize returns subject to an appropriate level of risk relative to the plans’ liabilities. In order to reduce the volatility in returns relative to the plans’ liability profiles, the U.K. defined benefit pension plans’ largest asset allocations are to debt securities of appropriate durations. Other assets, mainly equity securities, are then invested for capital appreciation, to provide long-term investment growth. Similar to the U.S. defined benefit pension plan, asset allocations and asset managers for the U.K. plans are reviewed regularly and the portfolio is rebalanced when deemed necessary.
Investments held by the Plans include financial instruments which are exposed to various risks such as interest rate, market and credit risks. Exposure to a concentration of credit risk is mitigated by the broad diversification of both U.S. and non-U.S. investment instruments. Additionally, the investments in each of the common/collective trust funds and registered investment companies are further diversified into various financial instruments. As of
December 31, 2014
, assets held by the Firm’s U.S. and non-U.S. defined benefit pension and OPEB plans do not include JPMorgan Chase common stock, except through indirect exposures through investments in third-party stock-index funds. The plans hold investments in funds that are sponsored or managed by affiliates of JPMorgan Chase in the amount of
$3.7 billion
and
$2.9 billion
for U.S. plans and
$1.4 billion
and
$242 million
for non-U.S. plans, as of
December 31, 2014
and
2013
, respectively.
The following table presents the weighted-average asset allocation of the fair values of total plan assets at December 31 for the years indicated, as well as the respective approved range/target allocation by asset category, for the Firm’s U.S. and non-U.S. defined benefit pension and OPEB plans.
|
|
Defined benefit pension plans
|
|
|||||||||||||||||||||||
|
|
U.S.
|
Non-U.S.
|
OPEB plans
(c)
|
||||||||||||||||||||||
|
|
Target
|
% of plan assets
|
Target
|
% of plan assets
|
Target
|
% of plan assets
|
|||||||||||||||||||
|
December 31,
|
Allocation
|
2014
|
|
2013
|
|
Allocation
|
2014
|
|
2013
|
|
Allocation
|
2014
|
|
2013
|
|
||||||||||
|
Asset category
|
|
|
|
|
|
|
|
|
|
||||||||||||||||
|
Debt securities
(a)
|
0-80%
|
31
|
%
|
25
|
%
|
62
|
%
|
61
|
%
|
63
|
%
|
30-70%
|
|
50
|
%
|
50
|
%
|
||||||||
|
Equity securities
|
0-85
|
46
|
|
48
|
|
37
|
|
38
|
|
36
|
|
30-70
|
|
50
|
|
50
|
|
||||||||
|
Real estate
|
0-10
|
4
|
|
4
|
|
—
|
|
—
|
|
—
|
|
—
|
|
—
|
|
—
|
|
||||||||
|
Alternatives
(b)
|
0-35
|
19
|
|
23
|
|
1
|
|
1
|
|
1
|
|
—
|
|
—
|
|
—
|
|
||||||||
|
Total
|
100%
|
100
|
%
|
100
|
%
|
100
|
%
|
100
|
%
|
100
|
%
|
100
|
%
|
100
|
%
|
100
|
%
|
||||||||
|
(a)
|
Debt securities primarily include corporate debt, U.S. federal, state, local and non-U.S. government, and mortgage-backed securities.
|
|
(b)
|
Alternatives primarily include limited partnerships.
|
|
(c)
|
Represents the U.S. OPEB plan only, as the U.K. OPEB plan is unfunded.
|
|
JPMorgan Chase & Co./2014 Annual Report
|
223
|
|
Notes to consolidated financial statements
Fair value measurement of the plans’ assets and liabilities
For information on fair value measurements, including descriptions of level 1, 2, and 3 of the fair value hierarchy and the valuation methods employed by the Firm, see Note 3.
|
Pension and OPEB plan assets and liabilities measured at fair value
|
|||||||||||||||||||||||||||
|
|
U.S. defined benefit pension plans
|
Non-U.S. defined benefit pension plans
(i)
|
|||||||||||||||||||||||||
|
December 31, 2014
(in millions)
|
Level 1
|
Level 2
|
Level 3
|
Total fair value
|
Level 1
|
Level 2
|
Total fair value
|
||||||||||||||||||||
|
Cash and cash equivalents
|
$
|
87
|
|
$
|
—
|
|
$
|
—
|
|
$
|
87
|
|
$
|
128
|
|
$
|
1
|
|
$
|
129
|
|
||||||
|
Equity securities:
|
|
|
|
|
|
|
|
||||||||||||||||||||
|
Capital equipment
|
1,249
|
|
—
|
|
—
|
|
1,249
|
|
96
|
|
24
|
|
120
|
|
|||||||||||||
|
Consumer goods
|
1,198
|
|
8
|
|
—
|
|
1,206
|
|
250
|
|
32
|
|
282
|
|
|||||||||||||
|
Banks and finance companies
|
778
|
|
7
|
|
—
|
|
785
|
|
279
|
|
31
|
|
310
|
|
|||||||||||||
|
Business services
|
458
|
|
—
|
|
—
|
|
458
|
|
277
|
|
18
|
|
295
|
|
|||||||||||||
|
Energy
|
267
|
|
—
|
|
—
|
|
267
|
|
50
|
|
15
|
|
65
|
|
|||||||||||||
|
Materials
|
319
|
|
1
|
|
—
|
|
320
|
|
40
|
|
9
|
|
49
|
|
|||||||||||||
|
Real Estate
|
46
|
|
—
|
|
—
|
|
46
|
|
1
|
|
—
|
|
1
|
|
|||||||||||||
|
Other
|
971
|
|
4
|
|
4
|
|
979
|
|
26
|
|
40
|
|
66
|
|
|||||||||||||
|
Total equity securities
|
5,286
|
|
20
|
|
4
|
|
5,310
|
|
1,019
|
|
169
|
|
1,188
|
|
|||||||||||||
|
Common/collective trust funds
(a)
|
345
|
|
1,277
|
|
8
|
|
1,630
|
|
112
|
|
251
|
|
363
|
|
|||||||||||||
|
Limited partnerships:
(b)
|
|
|
|
|
|
|
|
||||||||||||||||||||
|
Hedge funds
|
—
|
|
26
|
|
77
|
|
103
|
|
—
|
|
—
|
|
—
|
|
|||||||||||||
|
Private equity
|
—
|
|
—
|
|
2,208
|
|
2,208
|
|
—
|
|
—
|
|
—
|
|
|||||||||||||
|
Real estate
|
—
|
|
—
|
|
533
|
|
533
|
|
—
|
|
—
|
|
—
|
|
|||||||||||||
|
Real assets
(c)
|
70
|
|
—
|
|
202
|
|
272
|
|
—
|
|
—
|
|
—
|
|
|||||||||||||
|
Total limited partnerships
|
70
|
|
26
|
|
3,020
|
|
3,116
|
|
—
|
|
—
|
|
—
|
|
|||||||||||||
|
Corporate debt securities
(d)
|
—
|
|
1,454
|
|
9
|
|
1,463
|
|
—
|
|
724
|
|
724
|
|
|||||||||||||
|
U.S. federal, state, local and non-U.S. government debt securities
|
446
|
|
161
|
|
—
|
|
607
|
|
235
|
|
540
|
|
775
|
|
|||||||||||||
|
Mortgage-backed securities
|
1
|
|
73
|
|
1
|
|
75
|
|
2
|
|
77
|
|
79
|
|
|||||||||||||
|
Derivative receivables
|
—
|
|
114
|
|
—
|
|
114
|
|
—
|
|
258
|
|
258
|
|
|||||||||||||
|
Other
(e)
|
2,031
|
|
27
|
|
337
|
|
2,395
|
|
283
|
|
58
|
|
341
|
|
|||||||||||||
|
Total assets measured at fair value
(f)
|
$
|
8,266
|
|
$
|
3,152
|
|
$
|
3,379
|
|
$
|
14,797
|
|
(g)
|
$
|
1,779
|
|
$
|
2,078
|
|
$
|
3,857
|
|
|||||
|
Derivative payables
|
$
|
—
|
|
$
|
(23
|
)
|
$
|
—
|
|
$
|
(23
|
)
|
$
|
—
|
|
$
|
(139
|
)
|
$
|
(139
|
)
|
||||||
|
Total liabilities measured at fair value
|
$
|
—
|
|
$
|
(23
|
)
|
$
|
—
|
|
$
|
(23
|
)
|
(h)
|
$
|
—
|
|
$
|
(139
|
)
|
$
|
(139
|
)
|
|||||
|
224
|
JPMorgan Chase & Co./2014 Annual Report
|
|
|
|
U.S. defined benefit pension plans
|
Non-U.S. defined benefit pension plans
(i)
|
|||||||||||||||||||||||||
|
December 31, 2013
(in millions)
|
Level 1
|
Level 2
|
Level 3
|
Total fair value
|
Level 1
|
Level 2
|
Total fair value
|
||||||||||||||||||||
|
Cash and cash equivalents
|
$
|
62
|
|
$
|
—
|
|
$
|
—
|
|
$
|
62
|
|
$
|
221
|
|
$
|
3
|
|
$
|
224
|
|
||||||
|
Equity securities:
|
|
|
|
|
|
|
|
|
|
|
|
|
|
|
|||||||||||||
|
Capital equipment
|
1,084
|
|
—
|
|
—
|
|
1,084
|
|
86
|
|
17
|
|
103
|
|
|||||||||||||
|
Consumer goods
|
1,085
|
|
—
|
|
—
|
|
1,085
|
|
225
|
|
50
|
|
275
|
|
|||||||||||||
|
Banks and finance companies
|
737
|
|
—
|
|
—
|
|
737
|
|
233
|
|
29
|
|
262
|
|
|||||||||||||
|
Business services
|
510
|
|
—
|
|
—
|
|
510
|
|
209
|
|
14
|
|
223
|
|
|||||||||||||
|
Energy
|
292
|
|
—
|
|
—
|
|
292
|
|
64
|
|
20
|
|
84
|
|
|||||||||||||
|
Materials
|
344
|
|
—
|
|
—
|
|
344
|
|
36
|
|
9
|
|
45
|
|
|||||||||||||
|
Real estate
|
38
|
|
—
|
|
—
|
|
38
|
|
—
|
|
1
|
|
1
|
|
|||||||||||||
|
Other
|
1,337
|
|
18
|
|
4
|
|
1,359
|
|
25
|
|
103
|
|
128
|
|
|||||||||||||
|
Total equity securities
|
5,427
|
|
18
|
|
4
|
|
5,449
|
|
878
|
|
243
|
|
1,121
|
|
|||||||||||||
|
Common/collective trust funds
(a)
|
—
|
|
1,308
|
|
4
|
|
1,312
|
|
98
|
|
248
|
|
346
|
|
|||||||||||||
|
Limited partnerships:
(b)
|
|
|
|
|
|
|
|
|
|
|
|
|
|
|
|||||||||||||
|
Hedge funds
|
—
|
|
355
|
|
718
|
|
1,073
|
|
—
|
|
—
|
|
—
|
|
|||||||||||||
|
Private equity
|
—
|
|
—
|
|
1,969
|
|
1,969
|
|
—
|
|
—
|
|
—
|
|
|||||||||||||
|
Real estate
|
—
|
|
—
|
|
558
|
|
558
|
|
—
|
|
—
|
|
—
|
|
|||||||||||||
|
Real assets
(c)
|
—
|
|
—
|
|
271
|
|
271
|
|
—
|
|
—
|
|
—
|
|
|||||||||||||
|
Total limited partnerships
|
—
|
|
355
|
|
3,516
|
|
3,871
|
|
—
|
|
—
|
|
—
|
|
|||||||||||||
|
Corporate debt securities
(d)
|
—
|
|
1,223
|
|
7
|
|
1,230
|
|
—
|
|
787
|
|
787
|
|
|||||||||||||
|
U.S. federal, state, local and non-U.S. government debt securities
|
343
|
|
299
|
|
—
|
|
642
|
|
—
|
|
777
|
|
777
|
|
|||||||||||||
|
Mortgage-backed securities
|
37
|
|
50
|
|
—
|
|
87
|
|
73
|
|
—
|
|
73
|
|
|||||||||||||
|
Derivative receivables
|
—
|
|
30
|
|
—
|
|
30
|
|
—
|
|
302
|
|
302
|
|
|||||||||||||
|
Other
(e)
|
1,214
|
|
41
|
|
430
|
|
1,685
|
|
148
|
|
52
|
|
200
|
|
|||||||||||||
|
Total assets measured at fair value
(f)
|
$
|
7,083
|
|
$
|
3,324
|
|
$
|
3,961
|
|
$
|
14,368
|
|
(g)
|
$
|
1,418
|
|
$
|
2,412
|
|
$
|
3,830
|
|
|||||
|
Derivative payables
|
$
|
—
|
|
$
|
(6
|
)
|
$
|
—
|
|
$
|
(6
|
)
|
$
|
—
|
|
$
|
(298
|
)
|
$
|
(298
|
)
|
||||||
|
Total liabilities measured at fair value
|
$
|
—
|
|
$
|
(6
|
)
|
$
|
—
|
|
$
|
(6
|
)
|
(h)
|
$
|
—
|
|
$
|
(298
|
)
|
$
|
(298
|
)
|
|||||
|
(a)
|
At
December 31, 2014
and
2013
, common/collective trust funds primarily included a mix of short-term investment funds, domestic and international equity investments (including index) and real estate funds.
|
|
(b)
|
Unfunded commitments to purchase limited partnership investments for the plans were
$1.2 billion
and
$1.6 billion
for 2014 and 2013, respectively.
|
|
(c)
|
Real assets include investments in productive assets such as agriculture, energy rights, mining and timber properties and exclude raw land to be developed for real estate purposes.
|
|
(d)
|
Corporate debt securities include debt securities of U.S. and non-U.S. corporations.
|
|
(e)
|
Other consists of money markets, exchange-traded funds and participating and non-participating annuity contracts. Money markets and exchange-traded funds are primarily classified within level 1 of the fair value hierarchy given they are valued using market observable prices. Participating and non-participating annuity contracts are classified within level 3 of the fair value hierarchy due to lack of market mechanisms for transferring each policy and surrender restrictions.
|
|
(f)
|
At
December 31, 2014
and
2013
, the fair value of investments valued at NAV were
$2.1 billion
and
$2.7 billion
, respectively, which were classified within the valuation hierarchy as follows:
$500 million
and
$100 million
in level 1,
$1.6 billion
and
$1.9 billion
in level 2,
zero
and
$700 million
in level 3.
|
|
(g)
|
At
December 31, 2014
and
2013
, excluded U.S. defined benefit pension plan receivables for investments sold and dividends and interest receivables of
$106 million
and
$96 million
, respectively.
|
|
(h)
|
At
December 31, 2014
and
2013
, excluded
$241 million
and
$102 million
, respectively, of U.S. defined benefit pension plan payables for investments purchased; and $
16 million
and
$2 million
, respectively, of other liabilities.
|
|
(i)
|
There were
no
assets or liabilities classified as level 3 for the non-U.S. defined benefit pension plans as of Decem
ber 31, 2014 and 2013.
|
The Firm’s U.S. OPEB plan was partially funded with COLI policies of
$1.9 billion
and
$1.7 billion
at December 31, 2014 and 2013, respectively, which were classified in level 3 of the valuation hierarchy.
|
JPMorgan Chase & Co./2014 Annual Report
|
225
|
|
Notes to consolidated financial statements
|
Changes in level 3 fair value measurements using significant unobservable inputs
|
||||||||||||||||||||||||
|
Year ended December 31, 2014
(in millions)
|
Fair value, January 1, 2014
|
Actual return on plan assets
|
Purchases, sales and settlements, net
|
Transfers in and/or out of level 3
|
Fair value, December 31, 2014
|
|||||||||||||||||||
|
Realized gains/(losses)
|
Unrealized gains/(losses)
|
|||||||||||||||||||||||
|
U.S. defined benefit pension plans
|
|
|
|
|
|
|||||||||||||||||||
|
Equities
|
$
|
4
|
|
$
|
—
|
|
$
|
—
|
|
$
|
—
|
|
$
|
—
|
|
$
|
4
|
|
||||||
|
Common/collective trust funds
|
4
|
|
—
|
|
1
|
|
3
|
|
—
|
|
8
|
|
||||||||||||
|
Limited partnerships:
|
||||||||||||||||||||||||
|
Hedge funds
|
718
|
|
193
|
|
(180
|
)
|
(662
|
)
|
8
|
|
77
|
|
||||||||||||
|
Private equity
|
1,969
|
|
192
|
|
173
|
|
(126
|
)
|
—
|
|
2,208
|
|
||||||||||||
|
Real estate
|
558
|
|
29
|
|
36
|
|
(90
|
)
|
—
|
|
533
|
|
||||||||||||
|
Real assets
|
271
|
|
27
|
|
(6
|
)
|
(90
|
)
|
—
|
|
202
|
|
||||||||||||
|
Total limited partnerships
|
3,516
|
|
441
|
|
23
|
|
(968
|
)
|
8
|
|
3,020
|
|
||||||||||||
|
Corporate debt securities
|
7
|
|
(2
|
)
|
2
|
|
4
|
|
(2
|
)
|
9
|
|
||||||||||||
|
Mortgage-backed securities
|
—
|
|
—
|
|
—
|
|
1
|
|
—
|
|
1
|
|
||||||||||||
|
Other
|
430
|
|
—
|
|
(93
|
)
|
—
|
|
—
|
|
337
|
|
||||||||||||
|
Total U.S. defined benefit pension plans
|
$
|
3,961
|
|
$
|
439
|
|
$
|
(67
|
)
|
$
|
(960
|
)
|
$
|
6
|
|
$
|
3,379
|
|
||||||
|
OPEB plans
|
||||||||||||||||||||||||
|
COLI
|
$
|
1,749
|
|
$
|
—
|
|
$
|
154
|
|
$
|
—
|
|
$
|
—
|
|
$
|
1,903
|
|
||||||
|
Total OPEB plans
|
$
|
1,749
|
|
$
|
—
|
|
$
|
154
|
|
$
|
—
|
|
$
|
—
|
|
$
|
1,903
|
|
||||||
|
Year ended December 31, 2013
(in millions)
|
Fair value, January 1, 2013
|
Actual return on plan assets
|
Purchases, sales and settlements, net
|
Transfers in and/or out of level 3
|
Fair value, December 31, 2013
|
|||||||||||||||||||
|
Realized gains/(losses)
|
Unrealized gains/(losses)
|
|||||||||||||||||||||||
|
U.S. defined benefit pension plans
|
|
|
|
|
|
|||||||||||||||||||
|
Equities
|
$
|
4
|
|
$
|
—
|
|
$
|
—
|
|
$
|
—
|
|
$
|
—
|
|
$
|
4
|
|
||||||
|
Common/collective trust funds
|
199
|
|
59
|
|
(32
|
)
|
(222
|
)
|
—
|
|
4
|
|
||||||||||||
|
Limited partnerships:
|
|
|||||||||||||||||||||||
|
Hedge funds
|
1,166
|
|
137
|
|
14
|
|
(593
|
)
|
(6
|
)
|
718
|
|
||||||||||||
|
Private equity
|
1,743
|
|
108
|
|
170
|
|
(4
|
)
|
(48
|
)
|
1,969
|
|
||||||||||||
|
Real estate
|
467
|
|
21
|
|
44
|
|
26
|
|
—
|
|
558
|
|
||||||||||||
|
Real assets
|
311
|
|
4
|
|
12
|
|
(98
|
)
|
42
|
|
271
|
|
||||||||||||
|
Total limited partnerships
|
3,687
|
|
270
|
|
240
|
|
(669
|
)
|
(12
|
)
|
3,516
|
|
||||||||||||
|
Corporate debt securities
|
1
|
|
—
|
|
—
|
|
—
|
|
6
|
|
7
|
|
||||||||||||
|
Mortgage-backed securities
|
—
|
|
—
|
|
—
|
|
—
|
|
—
|
|
—
|
|
||||||||||||
|
Other
|
420
|
|
—
|
|
10
|
|
—
|
|
—
|
|
430
|
|
||||||||||||
|
Total U.S. defined benefit pension plans
|
$
|
4,311
|
|
$
|
329
|
|
$
|
218
|
|
$
|
(891
|
)
|
$
|
(6
|
)
|
$
|
3,961
|
|
||||||
|
OPEB plans
|
||||||||||||||||||||||||
|
COLI
|
$
|
1,554
|
|
$
|
—
|
|
$
|
195
|
|
$
|
—
|
|
$
|
—
|
|
$
|
1,749
|
|
||||||
|
Total OPEB plans
|
$
|
1,554
|
|
$
|
—
|
|
$
|
195
|
|
$
|
—
|
|
$
|
—
|
|
$
|
1,749
|
|
||||||
|
226
|
JPMorgan Chase & Co./2014 Annual Report
|
|
|
Year ended December 31, 2012
(in millions)
|
Fair value, January 1, 2012
|
Actual return on plan assets
|
Purchases, sales and settlements, net
|
Transfers in and/or out of level 3
|
Fair value, December 31, 2012
|
|||||||||||||||||||
|
Realized gains/(losses)
|
Unrealized gains/(losses)
|
|||||||||||||||||||||||
|
U.S. defined benefit pension plans
|
|
|
|
|
|
|||||||||||||||||||
|
Equities
|
$
|
1
|
|
$
|
—
|
|
$
|
(1
|
)
|
$
|
—
|
|
$
|
4
|
|
$
|
4
|
|
||||||
|
Common/collective trust funds
|
202
|
|
2
|
|
22
|
|
(27
|
)
|
—
|
|
199
|
|
||||||||||||
|
Limited partnerships:
|
|
|||||||||||||||||||||||
|
Hedge funds
|
1,039
|
|
1
|
|
71
|
|
55
|
|
—
|
|
1,166
|
|
||||||||||||
|
Private equity
|
1,367
|
|
59
|
|
54
|
|
263
|
|
—
|
|
1,743
|
|
||||||||||||
|
Real estate
|
306
|
|
16
|
|
1
|
|
144
|
|
—
|
|
467
|
|
||||||||||||
|
Real assets
|
264
|
|
—
|
|
10
|
|
37
|
|
—
|
|
311
|
|
||||||||||||
|
Total limited partnerships
|
2,976
|
|
76
|
|
136
|
|
499
|
|
—
|
|
3,687
|
|
||||||||||||
|
Corporate debt securities
|
2
|
|
—
|
|
—
|
|
(1
|
)
|
—
|
|
1
|
|
||||||||||||
|
Mortgage-backed securities
|
—
|
|
—
|
|
—
|
|
—
|
|
—
|
|
—
|
|
||||||||||||
|
Other
|
427
|
|
—
|
|
(7
|
)
|
—
|
|
—
|
|
420
|
|
||||||||||||
|
Total U.S. defined benefit pension plans
|
$
|
3,608
|
|
$
|
78
|
|
$
|
150
|
|
$
|
471
|
|
$
|
4
|
|
$
|
4,311
|
|
||||||
|
OPEB plans
|
||||||||||||||||||||||||
|
COLI
|
$
|
1,427
|
|
$
|
—
|
|
$
|
127
|
|
$
|
—
|
|
$
|
—
|
|
$
|
1,554
|
|
||||||
|
Total OPEB plans
|
$
|
1,427
|
|
$
|
—
|
|
$
|
127
|
|
$
|
—
|
|
$
|
—
|
|
$
|
1,554
|
|
||||||
Estimated future benefit payments
The following table presents benefit payments expected to be paid, which include the effect of expected future service, for the years indicated. The OPEB medical and life insurance payments are net of expected retiree contributions.
|
Year ended December 31,
(in millions)
|
U.S. defined benefit pension plans
|
Non-U.S. defined benefit pension plans
|
OPEB before Medicare Part D subsidy
|
Medicare Part D subsidy
|
||||||||||||
|
2015
|
$
|
712
|
|
$
|
110
|
|
$
|
73
|
|
$
|
1
|
|
||||
|
2016
|
765
|
|
113
|
|
71
|
|
1
|
|
||||||||
|
2017
|
899
|
|
118
|
|
70
|
|
1
|
|
||||||||
|
2018
|
926
|
|
128
|
|
68
|
|
1
|
|
||||||||
|
2019
|
966
|
|
132
|
|
66
|
|
1
|
|
||||||||
|
Years 2020–2024
|
4,357
|
|
746
|
|
293
|
|
5
|
|
||||||||
|
JPMorgan Chase & Co./2014 Annual Report
|
227
|
|
Notes to consolidated financial statements
Employee stock-based awards
In
2014
,
2013
and
2012
,
JPMorgan Chase
granted long-term stock-based awards to certain employees under its Long-Term Incentive Plan, which was last amended in May 2011 (“LTIP”). Under the terms of the LTIP, as of
December 31, 2014
,
266 million
shares of common stock were available for issuance through May 2015. The LTIP is the only active plan under which the Firm is currently granting stock-based incentive awards. In the following discussion, the LTIP, plus prior Firm plans and plans assumed as the result of acquisitions, are referred to collectively as the “LTI Plans,” and such plans constitute the Firm’s stock-based incentive plans.
Restricted stock units (“RSUs”) are awarded at no cost to the recipient upon their grant. Generally, RSUs are granted annually and vest at a rate of 50% after
two years
and 50% after
three years
and are converted into shares of common stock as of the vesting date. In addition, RSUs typically include full-career eligibility provisions, which allow employees to continue to vest upon voluntary termination, subject to post-employment and other restrictions based on age or service-related requirements. All RSUs awards are subject to forfeiture until vested and contain clawback provisions that may result in cancellation under certain specified circumstances. RSUs entitle the recipient to receive cash payments equivalent to any dividends paid on the underlying common stock during the period the RSUs are outstanding and, as such, are considered participating securities as discussed in Note 24.
Under the LTI Plans, stock options and stock appreciation rights (“SARs”) have generally been granted with an exercise price equal to the fair value of
JPMorgan Chase
’s common stock on the grant date. The Firm periodically grants employee stock options to individual employees. There were no material grants of stock options or SARs
in 2014. Grants of SARs in 2013 and 2012 become exercisable ratably over
five years
(i.e.,
20%
per year)
and contain clawback provisions similar to RSUs. The
2013
and
2012
grants of SARs contain full-career
eligibility provisions. SARs generally expire
ten years
after the grant date.
The Firm separately recognizes compensation expense for each tranche of each award as if it were a separate award with its own vesting date. Generally, for each tranche granted, compensation expense is recognized on a straight-line basis from the grant date until the vesting date of the respective tranche, provided that the employees will not become full-career eligible during the vesting period. For awards with full-career eligibility provisions and awards granted with no future substantive service requirement, the Firm accrues the estimated value of awards expected to be awarded to employees as of the grant date without giving consideration to the impact of post-employment restrictions. For each tranche granted to employees who will become full-career eligible during the vesting period, compensation expense is recognized on a straight-line basis from the grant date until the earlier of the employee’s full-career eligibility date or the vesting date of the respective tranche.
The Firm’s policy for issuing shares upon settlement of employee stock-based incentive awards is to issue either new shares of common stock or treasury shares. During
2014
,
2013
and
2012
, the Firm settled all of its employee stock-based awards by issuing treasury shares.
In January 2008, the Firm awarded to its Chairman and Chief Executive Officer up to
2 million
SARs. The terms of this award are distinct from, and more restrictive than, other equity grants regularly awarded by the Firm. On July 15, 2014, the Compensation Committee and Board of Directors determined that all requirements for the vesting of the
2 million
SAR awards had been met and thus, the awards became exercisable. The SARs, which will expire in January 2018, have an exercise price of
$39.83
(the price of JPMorgan Chase common stock on the date of grant). The expense related to this award was dependent on changes in fair value of the SARs through July 15, 2014 (the date when the vested number of SARs were determined), and the cumulative expense was recognized ratably over the service period, which was initially assumed to be
five years
but, effective in the first quarter of 2013, had been extended to
six and one-half years
. The Firm recognized
$3 million
,
$14 million
and
$5 million
in compensation expense in
2014
,
2013
and
2012
, respectively, for this award.
|
228
|
JPMorgan Chase & Co./2014 Annual Report
|
|
RSUs, employee stock options and SARs activity
Compensation expense for RSUs is measured based on the number of shares granted multiplied by the stock price at the grant date, and for employee stock options and SARs, is measured at the grant date using the Black-Scholes valuation model. Compensation expense for these awards is recognized in net income as described previously. The following table summarizes
JPMorgan Chase
’s RSUs, employee stock options and SARs activity for
2014
.
|
RSUs
|
Options/SARs
|
|||||||||||||||||
|
Year ended December 31, 2014
|
Number of
shares
|
Weighted-average grant
date fair value
|
Number of awards
|
Weighted-average exercise price
|
Weighted-average remaining contractual life
(in years)
|
Aggregate intrinsic value
|
||||||||||||
|
(in thousands, except weighted-average data, and where otherwise stated)
|
||||||||||||||||||
|
Outstanding, January 1
|
121,241
|
|
$
|
41.47
|
|
87,075
|
|
$
|
44.24
|
|
||||||||
|
Granted
|
37,817
|
|
57.88
|
|
101
|
|
59.18
|
|
||||||||||
|
Exercised or vested
|
(54,265
|
)
|
40.67
|
|
(24,950
|
)
|
36.59
|
|
||||||||||
|
Forfeited
|
(4,225
|
)
|
47.32
|
|
(2,059
|
)
|
41.90
|
|
||||||||||
|
Canceled
|
NA
|
|
NA
|
|
(972
|
)
|
200.86
|
|
||||||||||
|
Outstanding, December 31
|
100,568
|
|
$
|
47.81
|
|
59,195
|
|
$
|
45.00
|
|
5.2
|
$
|
1,313,939
|
|
||||
|
Exercisable, December 31
|
NA
|
|
NA
|
|
37,171
|
|
46.46
|
|
4.3
|
862,374
|
|
|||||||
The total fair value of RSUs that vested during the years ended December 31, 2014, 2013 and 2012, was
$3.2 billion
, $
2.9 billion
and
$2.8 billion
, respectively. There were no material grants of stock options or SARs in 2014. The weighted-average grant date per share fair value of stock options and SARs granted during the years ended
December 31, 2013
and
2012
, was
$9.58
and
$8.89
, respectively. The total intrinsic value of options exercised during the years ended
December 31, 2014
,
2013
and
2012
, was
$539 million
,
$507 million
and
$283 million
, respectively.
Compensation expense
The Firm recognized the following noncash compensation expense related to its various employee stock-based incentive plans in its Consolidated statements of income.
|
Year ended December 31, (in millions)
|
2014
|
|
2013
|
|
2012
|
|
||||||
|
Cost of prior grants of RSUs and SARs that are amortized over their applicable vesting periods
|
$
|
1,371
|
|
$
|
1,440
|
|
$
|
1,810
|
|
|||
|
Accrual of estimated costs of stock-based awards to be granted in future periods including those to full-career eligible employees
|
819
|
|
779
|
|
735
|
|
||||||
|
Total noncash compensation expense related to employee stock-based incentive plans
|
$
|
2,190
|
|
$
|
2,219
|
|
$
|
2,545
|
|
|||
At
December 31, 2014
, approximately
$758 million
(pretax) of compensation cost related to unvested awards had not yet been charged to net income. That cost is expected to be amortized into compensation expense over a weighted-average period of
1.0
year. The Firm does not capitalize any compensation cost related to share-based compensation awards to employees.
Cash flows and tax benefits
Income tax benefits related to stock-based incentive arrangements recognized in the Firm’s Consolidated statements of income for the years ended
December 31, 2014
,
2013
and
2012
, were
$854 million
,
$865 million
and
$1.0 billion
, respectively.
The following table sets forth the cash received from the exercise of stock options under all stock-based incentive arrangements, and the actual income tax benefit realized related to tax deductions from the exercise of the stock options.
|
Year ended December 31, (in millions)
|
2014
|
|
2013
|
|
2012
|
|
||||||
|
Cash received for options exercised
|
$
|
63
|
|
$
|
166
|
|
$
|
333
|
|
|||
|
Tax benefit realized
(a)
|
104
|
|
42
|
|
53
|
|
||||||
|
(a)
|
The tax benefit realized from dividends or dividend equivalents paid on equity-classified share-based payment awards that are charged to retained earnings are recorded as an increase to additional paid-in capital and included in the pool of excess tax benefits available to absorb tax deficiencies on share-based payment awards.
|
Valuation assumptions
The following table presents the assumptions used to value employee stock options and SARs granted during the years ended December 31,
2013
and
2012
, under the Black-Scholes valuation model. There were no material grants of stock options or SARs for the year ended December 31, 2014.
|
Year ended December 31,
|
2013
|
|
2012
|
|
||
|
Weighted-average annualized valuation assumptions
|
|
|
||||
|
Risk-free interest rate
|
1.18
|
%
|
1.19
|
%
|
||
|
Expected dividend yield
|
2.66
|
|
3.15
|
|
||
|
Expected common stock price volatility
|
28
|
|
35
|
|
||
|
Expected life (in years)
|
6.6
|
6.6
|
||||
The expected dividend yield is determined using forward-looking assumptions. The expected volatility assumption is derived from the implied volatility of
JPMorgan Chase
’s stock options. The expected life assumption is an estimate of the length of time that an employee might hold an option or SAR before it is exercised or canceled, and the assumption is based on the Firm’s historical experience.
|
JPMorgan Chase & Co./2014 Annual Report
|
229
|
|
Notes to consolidated financial statements
The following table presents the components of noninterest expense.
|
Year ended December 31,
(in millions)
|
2014
|
|
2013
|
|
2012
|
|
|||||
|
Compensation expense
|
$
|
30,160
|
|
$
|
30,810
|
|
$
|
30,585
|
|
||
|
Noncompensation expense:
|
|||||||||||
|
Occupancy
|
3,909
|
|
3,693
|
|
3,925
|
|
|||||
|
Technology, communications and equipment
|
5,804
|
|
5,425
|
|
5,224
|
|
|||||
|
Professional and outside services
|
7,705
|
|
7,641
|
|
7,429
|
|
|||||
|
Marketing
|
2,550
|
|
2,500
|
|
2,577
|
|
|||||
|
Other
(a)(b)
|
11,146
|
|
20,398
|
|
14,989
|
|
|||||
|
Total noncompensation expense
|
31,114
|
|
39,657
|
|
34,144
|
|
|||||
|
Total noninterest expense
|
$
|
61,274
|
|
$
|
70,467
|
|
$
|
64,729
|
|
||
|
(a)
|
Included firmwide legal expense of
$2.9 billion
,
$11.1 billion
and
$5.0 billion
and for the years ended
December 31, 2014
,
2013
and
2012
, respectively.
|
|
(b)
|
Included FDIC-related expense of
$1.0 billion
,
$1.5 billion
and
$1.7 billion
for the years ended
December 31, 2014
,
2013
and
2012
, respectively.
|
Securities are classified as trading, AFS or held-to-maturity (“HTM”). Securities classified as trading assets are discussed in Note 3. Predominantly all of the Firm’s AFS and HTM investment securities (the “investment securities portfolio”) are held by CIO in connection with its asset-liability management objectives. At December 31, 2014, the average credit rating of the debt securities comprising the investment securities portfolio was
AA+
(based upon external ratings where available, and where not available, based primarily upon internal ratings which correspond to ratings as defined by S&P and Moody’s). AFS securities are carried at fair value on the Consolidated balance sheets. Unrealized gains and losses, after any applicable hedge accounting adjustments, are reported as net increases or decreases to accumulated other comprehensive income/(loss). The specific identification method is used to determine realized gains and losses on AFS securities, which are included in securities gains/(losses) on the Consolidated statements of income. HTM debt securities, which management has the intent and ability to hold until maturity, are carried at amortized cost on the Consolidated balance sheets. For both AFS and HTM debt securities, purchase discounts or premiums are generally amortized into interest income over the contractual life of the security.
During the first quarter of 2014, the Firm transferred U.S. government agency mortgage-backed securities and obligations of U.S. states and municipalities with a fair value of
$19.3 billion
from AFS to HTM. These securities were transferred at fair value, and the transfer was a non-cash transaction. AOCI included net pretax unrealized losses of
$9 million
on the securities at the date of transfer. The transfer reflected the Firm’s intent to hold the securities to maturity in order to reduce the impact of price volatility on AOCI and certain capital measures under Basel III.
Other-than-temporary impairment
AFS debt and equity securities and HTM debt securities in unrealized loss positions are analyzed as part of the Firm’s ongoing assessment of other-than-temporary impairment (“OTTI”). For most types of debt securities, the Firm considers a decline in fair value to be other-than-temporary when the Firm does not expect to recover the entire amortized cost basis of the security. For beneficial interests in securitizations that are rated below “AA” at their acquisition, or that can be contractually prepaid or otherwise settled in such a way that the Firm would not recover substantially all of its recorded investment, the Firm considers an OTTI to have occurred when there is an adverse change in expected cash flows. For AFS equity securities, the Firm considers a decline in fair value to be other-than-temporary if it is probable that the Firm will not recover its cost basis.
Potential OTTI is considered using a variety of factors, including the length of time and extent to which the market value has been less than cost; adverse conditions specifically related to the industry, geographic area or financial condition of the issuer or underlying collateral of a security; payment structure of the security; changes to the rating of the security by a rating agency; the volatility of the fair value changes; and the Firm’s intent and ability to hold the security until recovery.
For AFS debt securities, the Firm recognizes OTTI losses in earnings if the Firm has the intent to sell the debt security, or if it is more likely than not that the Firm will be required to sell the debt security before recovery of its amortized cost basis. In these circumstances the impairment loss is equal to the full difference between the amortized cost basis and the fair value of the securities. For debt securities in an unrealized loss position that the Firm has the intent and ability to hold, the expected cash flows to be received from the securities are evaluated to determine if a credit loss exists. In the event of a credit loss, only the amount of impairment associated with the credit loss is recognized in income. Amounts relating to factors other than credit losses are recorded in OCI.
The Firm’s cash flow evaluations take into account the factors noted above and expectations of relevant market and economic data as of the end of the reporting period. For securities issued in a securitization, the Firm estimates cash flows considering underlying loan-level data and structural features of the securitization, such as subordination, excess spread, overcollateralization or other forms of credit enhancement, and compares the losses projected for the underlying collateral (“pool losses”) against the level of credit enhancement in the securitization structure to determine whether these features are sufficient to absorb the pool losses, or whether a credit loss exists. The Firm also performs other analyses to support its cash flow projections, such as first-loss analyses or stress scenarios.
|
230
|
JPMorgan Chase & Co./2014 Annual Report
|
|
For equity securities, OTTI losses are recognized in earnings if the Firm intends to sell the security. In other cases the Firm considers the relevant factors noted above, as well as the Firm’s intent and ability to retain its investment for a period of time sufficient to allow for any anticipated recovery in market value, and whether evidence exists to support a realizable value equal to or greater than the cost basis. Any impairment loss on an equity security is equal to the full difference between the cost basis and the fair value of the security.
Realized gains and losses
The following table presents realized gains and losses and credit losses that were recognized in income from AFS securities.
|
Year ended December 31,
(in millions)
|
2014
|
|
2013
|
|
2012
|
|
|||||
|
Realized gains
|
$
|
314
|
|
$
|
1,302
|
|
$
|
2,610
|
|
||
|
Realized losses
|
(233
|
)
|
(614
|
)
|
(457
|
)
|
|||||
|
Net realized gains
|
81
|
|
688
|
|
2,153
|
|
|||||
|
OTTI losses
|
|
|
|
|
|
|
|||||
|
Credit-related
|
(2
|
)
|
(1
|
)
|
(28
|
)
|
|||||
|
Securities the Firm intends to sell
(a)
|
(2
|
)
|
(20
|
)
|
(15
|
)
|
|||||
|
Total OTTI losses recognized in income
|
(4
|
)
|
(21
|
)
|
(43
|
)
|
|||||
|
Net securities gains
|
$
|
77
|
|
$
|
667
|
|
$
|
2,110
|
|
||
|
(a)
|
Excludes realized losses on securities sold of
$3 million
,
$12 million
and
$24 million
for the years ended December 31, 2014, 2013 and 2012, respectively that had been previously reported as an OTTI loss due to the intention to sell the securities.
|
The amortized costs and estimated fair values of the investment securities portfolio were as follows for the dates indicated.
|
2014
|
2013
|
||||||||||||||||||||||||||
|
December 31, (in millions)
|
Amortized cost
|
Gross unrealized gains
|
Gross unrealized losses
|
Fair
value
|
Amortized cost
|
Gross unrealized gains
|
Gross unrealized losses
|
Fair
value
|
|||||||||||||||||||
|
Available-for-sale debt securities
|
|||||||||||||||||||||||||||
|
Mortgage-backed securities:
|
|||||||||||||||||||||||||||
|
U.S. government agencies
(a)
|
$
|
63,089
|
|
$
|
2,302
|
|
$
|
72
|
|
$
|
65,319
|
|
$
|
76,428
|
|
$
|
2,364
|
|
$
|
977
|
|
$
|
77,815
|
|
|||
|
Residential:
|
|||||||||||||||||||||||||||
|
Prime and Alt-A
|
5,595
|
|
78
|
|
29
|
|
5,644
|
|
2,744
|
|
61
|
|
27
|
|
2,778
|
|
|||||||||||
|
Subprime
|
677
|
|
14
|
|
—
|
|
691
|
|
908
|
|
23
|
|
1
|
|
930
|
|
|||||||||||
|
Non-U.S.
|
43,550
|
|
1,010
|
|
—
|
|
44,560
|
|
57,448
|
|
1,314
|
|
1
|
|
58,761
|
|
|||||||||||
|
Commercial
|
20,687
|
|
438
|
|
17
|
|
21,108
|
|
15,891
|
|
560
|
|
26
|
|
16,425
|
|
|||||||||||
|
Total mortgage-backed securities
|
133,598
|
|
3,842
|
|
118
|
|
137,322
|
|
153,419
|
|
4,322
|
|
1,032
|
|
156,709
|
|
|||||||||||
|
U.S. Treasury and government agencies
(a)
|
13,603
|
|
56
|
|
14
|
|
13,645
|
|
21,310
|
|
385
|
|
306
|
|
21,389
|
|
|||||||||||
|
Obligations of U.S. states and municipalities
|
27,841
|
|
2,243
|
|
16
|
|
30,068
|
|
29,741
|
|
707
|
|
987
|
|
29,461
|
|
|||||||||||
|
Certificates of deposit
|
1,103
|
|
1
|
|
1
|
|
1,103
|
|
1,041
|
|
1
|
|
1
|
|
1,041
|
|
|||||||||||
|
Non-U.S. government debt securities
|
51,492
|
|
1,272
|
|
21
|
|
52,743
|
|
55,507
|
|
863
|
|
122
|
|
56,248
|
|
|||||||||||
|
Corporate debt securities
|
18,158
|
|
398
|
|
24
|
|
18,532
|
|
21,043
|
|
498
|
|
29
|
|
21,512
|
|
|||||||||||
|
Asset-backed securities:
|
|||||||||||||||||||||||||||
|
Collateralized loan obligations
|
30,229
|
|
147
|
|
182
|
|
30,194
|
|
28,130
|
|
236
|
|
136
|
|
28,230
|
|
|||||||||||
|
Other
|
12,442
|
|
184
|
|
11
|
|
12,615
|
|
12,062
|
|
186
|
|
3
|
|
12,245
|
|
|||||||||||
|
Total available-for-sale debt securities
|
288,466
|
|
8,143
|
|
387
|
|
296,222
|
|
322,253
|
|
7,198
|
|
2,616
|
|
326,835
|
|
|||||||||||
|
Available-for-sale equity securities
|
2,513
|
|
17
|
|
—
|
|
2,530
|
|
3,125
|
|
17
|
|
—
|
|
3,142
|
|
|||||||||||
|
Total available-for-sale securities
|
$
|
290,979
|
|
$
|
8,160
|
|
$
|
387
|
|
$
|
298,752
|
|
$
|
325,378
|
|
$
|
7,215
|
|
$
|
2,616
|
|
$
|
329,977
|
|
|||
|
Total held-to-maturity securities
(b)
|
$
|
49,252
|
|
$
|
1,902
|
|
$
|
—
|
|
$
|
51,154
|
|
$
|
24,026
|
|
$
|
22
|
|
$
|
317
|
|
$
|
23,731
|
|
|||
|
(a)
|
Includes total U.S. government-sponsored enterprise obligations with fair values of
$59.3 billion
and
$67.0 billion
at
December 31, 2014
and
2013
, respectively, which were predominantly mortgage-related.
|
|
(b)
|
As of December 31, 2014, consists of MBS issued by U.S. government-sponsored enterprises with an amortized cost of
$35.3 billion
, MBS issued by U.S. government agencies with an amortized cost of
$3.7 billion
and obligations of U.S. states and municipalities with an amortized cost of
$10.2 billion
. As of December 31, 2013, consists of MBS issued by U.S. government-sponsored enterprises with an amortized cost of
$23.1 billion
and obligations of U.S. states and municipalities with an amortized cost of
$920 million
.
|
|
JPMorgan Chase & Co./2014 Annual Report
|
231
|
|
Notes to consolidated financial statements
Securities impairment
The following tables present the fair value and gross unrealized losses for the investment securities portfolio by aging category at
December 31, 2014
and
2013
.
|
Securities with gross unrealized losses
|
|||||||||||||||||||
|
Less than 12 months
|
12 months or more
|
||||||||||||||||||
|
December 31, 2014 (in millions)
|
Fair value
|
Gross unrealized losses
|
Fair value
|
Gross unrealized losses
|
Total fair value
|
Total gross unrealized losses
|
|||||||||||||
|
Available-for-sale debt securities
|
|||||||||||||||||||
|
Mortgage-backed securities:
|
|||||||||||||||||||
|
U.S. government agencies
|
$
|
1,118
|
|
$
|
5
|
|
$
|
4,989
|
|
$
|
67
|
|
$
|
6,107
|
|
$
|
72
|
|
|
|
Residential:
|
|||||||||||||||||||
|
Prime and Alt-A
|
1,840
|
|
10
|
|
405
|
|
19
|
|
2,245
|
|
29
|
|
|||||||
|
Subprime
|
—
|
|
—
|
|
—
|
|
—
|
|
—
|
|
—
|
|
|||||||
|
Non-U.S.
|
—
|
|
—
|
|
—
|
|
—
|
|
—
|
|
—
|
|
|||||||
|
Commercial
|
4,803
|
|
15
|
|
92
|
|
2
|
|
4,895
|
|
17
|
|
|||||||
|
Total mortgage-backed securities
|
7,761
|
|
30
|
|
5,486
|
|
88
|
|
13,247
|
|
118
|
|
|||||||
|
U.S. Treasury and government agencies
|
8,412
|
|
14
|
|
—
|
|
—
|
|
8,412
|
|
14
|
|
|||||||
|
Obligations of U.S. states and municipalities
|
1,405
|
|
15
|
|
130
|
|
1
|
|
1,535
|
|
16
|
|
|||||||
|
Certificates of deposit
|
1,050
|
|
1
|
|
—
|
|
—
|
|
1,050
|
|
1
|
|
|||||||
|
Non-U.S. government debt securities
|
4,433
|
|
4
|
|
906
|
|
17
|
|
5,339
|
|
21
|
|
|||||||
|
Corporate debt securities
|
2,492
|
|
22
|
|
80
|
|
2
|
|
2,572
|
|
24
|
|
|||||||
|
Asset-backed securities:
|
|||||||||||||||||||
|
Collateralized loan obligations
|
13,909
|
|
76
|
|
9,012
|
|
106
|
|
22,921
|
|
182
|
|
|||||||
|
Other
|
2,258
|
|
11
|
|
—
|
|
—
|
|
2,258
|
|
11
|
|
|||||||
|
Total available-for-sale debt securities
|
41,720
|
|
173
|
|
15,614
|
|
214
|
|
57,334
|
|
387
|
|
|||||||
|
Available-for-sale equity securities
|
—
|
|
—
|
|
—
|
|
—
|
|
—
|
|
—
|
|
|||||||
|
Held-to-maturity securities
|
—
|
|
—
|
|
—
|
|
—
|
|
—
|
|
—
|
|
|||||||
|
Total securities with gross unrealized losses
|
$
|
41,720
|
|
$
|
173
|
|
$
|
15,614
|
|
$
|
214
|
|
$
|
57,334
|
|
$
|
387
|
|
|
|
Securities with gross unrealized losses
|
|||||||||||||||||||
|
Less than 12 months
|
12 months or more
|
||||||||||||||||||
|
December 31, 2013 (in millions)
|
Fair value
|
Gross unrealized losses
|
Fair value
|
Gross unrealized losses
|
Total fair value
|
Total gross unrealized losses
|
|||||||||||||
|
Available-for-sale debt securities
|
|||||||||||||||||||
|
Mortgage-backed securities:
|
|||||||||||||||||||
|
U.S. government agencies
|
$
|
20,293
|
|
$
|
895
|
|
$
|
1,150
|
|
$
|
82
|
|
$
|
21,443
|
|
$
|
977
|
|
|
|
Residential:
|
|||||||||||||||||||
|
Prime and Alt-A
|
1,061
|
|
27
|
|
—
|
|
—
|
|
1,061
|
|
27
|
|
|||||||
|
Subprime
|
152
|
|
1
|
|
—
|
|
—
|
|
152
|
|
1
|
|
|||||||
|
Non-U.S.
|
—
|
|
—
|
|
158
|
|
1
|
|
158
|
|
1
|
|
|||||||
|
Commercial
|
3,980
|
|
26
|
|
—
|
|
—
|
|
3,980
|
|
26
|
|
|||||||
|
Total mortgage-backed securities
|
25,486
|
|
949
|
|
1,308
|
|
83
|
|
26,794
|
|
1,032
|
|
|||||||
|
U.S. Treasury and government agencies
|
6,293
|
|
250
|
|
237
|
|
56
|
|
6,530
|
|
306
|
|
|||||||
|
Obligations of U.S. states and municipalities
|
15,387
|
|
975
|
|
55
|
|
12
|
|
15,442
|
|
987
|
|
|||||||
|
Certificates of deposit
|
988
|
|
1
|
|
—
|
|
—
|
|
988
|
|
1
|
|
|||||||
|
Non-U.S. government debt securities
|
11,286
|
|
110
|
|
821
|
|
12
|
|
12,107
|
|
122
|
|
|||||||
|
Corporate debt securities
|
1,580
|
|
21
|
|
505
|
|
8
|
|
2,085
|
|
29
|
|
|||||||
|
Asset-backed securities:
|
|||||||||||||||||||
|
Collateralized loan obligations
|
18,369
|
|
129
|
|
393
|
|
7
|
|
18,762
|
|
136
|
|
|||||||
|
Other
|
1,114
|
|
3
|
|
—
|
|
—
|
|
1,114
|
|
3
|
|
|||||||
|
Total available-for-sale debt securities
|
80,503
|
|
2,438
|
|
3,319
|
|
178
|
|
83,822
|
|
2,616
|
|
|||||||
|
Available-for-sale equity securities
|
—
|
|
—
|
|
—
|
|
—
|
|
—
|
|
—
|
|
|||||||
|
Held-to-maturity securities
|
20,745
|
|
317
|
|
—
|
|
—
|
|
20,745
|
|
317
|
|
|||||||
|
Total securities with gross unrealized losses
|
$
|
101,248
|
|
$
|
2,755
|
|
$
|
3,319
|
|
$
|
178
|
|
$
|
104,567
|
|
$
|
2,933
|
|
|
|
232
|
JPMorgan Chase & Co./2014 Annual Report
|
|
Other-than-temporary impairment
The following table presents OTTI losses that are included in the securities gains and losses table above.
|
Year ended December 31,
(in millions)
|
2014
|
|
2013
|
|
2012
|
|
|||||||
|
Debt securities the Firm does not intend to sell that have credit losses
|
|||||||||||||
|
Total OTTI
(a)
|
$
|
(2
|
)
|
$
|
(1
|
)
|
$
|
(113
|
)
|
||||
|
Losses recorded in/(reclassified from) AOCI
|
—
|
|
—
|
|
85
|
|
|||||||
|
Total credit losses recognized in income
|
(2
|
)
|
(1
|
)
|
(28
|
)
|
|||||||
|
Securities the Firm intends to sell
(b)
|
(2
|
)
|
(20
|
)
|
(15
|
)
|
|||||||
|
Total OTTI losses recognized in income
|
$
|
(4
|
)
|
$
|
(21
|
)
|
$
|
(43
|
)
|
||||
|
(a)
|
For initial OTTI, represents the excess of the amortized cost over the fair value of AFS debt securities. For subsequent impairments of the same security, represents additional declines in fair value subsequent to previously recorded OTTI, if applicable.
|
|
(b)
|
Excludes realized losses on securities sold of
$3 million
,
$12 million
and
$24 million
for the years ended December 31, 2014, 2013 and 2012, respectively that had been previously reported as an OTTI loss due to the intention to sell the securities.
|
Changes in the credit loss component of credit-impaired debt securities
The following table presents a rollforward for the years ended
December 31, 2014
,
2013
and
2012
, of the credit loss component of OTTI losses that have been recognized in income, related to AFS debt securities that the Firm does not intend to sell.
|
Year ended December 31, (in millions)
|
2014
|
|
2013
|
|
2012
|
|
|||
|
Balance, beginning of period
|
$
|
1
|
|
$
|
522
|
|
$
|
708
|
|
|
Additions:
|
|||||||||
|
Newly credit-impaired securities
|
2
|
|
1
|
|
21
|
|
|||
|
Losses reclassified from other comprehensive income on previously credit-impaired securities
|
—
|
|
—
|
|
7
|
|
|||
|
Reductions:
|
|||||||||
|
Sales and redemptions of credit-impaired securities
|
—
|
|
(522
|
)
|
(214
|
)
|
|||
|
Balance, end of period
|
$
|
3
|
|
$
|
1
|
|
$
|
522
|
|
Gross unrealized losses
Gross unrealized losses have generally decreased since December 31, 2013. Though losses on securities that have been in an unrealized loss position for 12 months or more have increased, the increase is not material. The Firm has recognized the unrealized losses on securities it intends to sell. As of December 31, 2014, the Firm does not intend to sell any securities with a loss position in AOCI, and it is not likely that the Firm will be required to sell these securities before recovery of their amortized cost basis. Except for the securities reported in the table above, for which credit losses have been recognized in income, the Firm believes that the securities with an unrealized loss in AOCI are not other-than-temporarily impaired as of December 31, 2014.
|
JPMorgan Chase & Co./2014 Annual Report
|
233
|
|
Notes to consolidated financial statements
Contractual maturities and yields
The following table presents the amortized cost and estimated fair value at
December 31, 2014
, of
JPMorgan Chase
’s investment securities portfolio by contractual maturity.
|
By remaining maturity
December 31, 2014
(in millions)
|
Due in one
year or less
|
Due after one year through five years
|
Due after five years through 10 years
|
Due after
10 years
(c)
|
Total
|
||||||||||
|
Available-for-sale debt securities
|
|||||||||||||||
|
Mortgage-backed securities
(a)
|
|||||||||||||||
|
Amortized cost
|
$
|
996
|
|
$
|
14,132
|
|
$
|
5,768
|
|
$
|
112,702
|
|
$
|
133,598
|
|
|
Fair value
|
1,003
|
|
14,467
|
|
5,974
|
|
115,878
|
|
137,322
|
|
|||||
|
Average yield
(b)
|
2.65
|
%
|
1.85
|
%
|
3.12
|
%
|
2.93
|
%
|
2.82
|
%
|
|||||
|
U.S. Treasury and government agencies
(a)
|
|||||||||||||||
|
Amortized cost
|
$
|
2,209
|
|
$
|
—
|
|
$
|
10,284
|
|
$
|
1,110
|
|
$
|
13,603
|
|
|
Fair value
|
2,215
|
|
—
|
|
10,275
|
|
1,155
|
|
13,645
|
|
|||||
|
Average yield
(b)
|
0.80
|
%
|
—
|
%
|
0.62
|
%
|
0.35
|
%
|
0.63
|
%
|
|||||
|
Obligations of U.S. states and municipalities
|
|||||||||||||||
|
Amortized cost
|
$
|
65
|
|
$
|
498
|
|
$
|
1,432
|
|
$
|
25,846
|
|
$
|
27,841
|
|
|
Fair value
|
66
|
|
515
|
|
1,508
|
|
27,979
|
|
30,068
|
|
|||||
|
Average yield
(b)
|
2.13
|
%
|
4.00
|
%
|
4.93
|
%
|
6.78
|
%
|
6.63
|
%
|
|||||
|
Certificates of deposit
|
|||||||||||||||
|
Amortized cost
|
$
|
1,052
|
|
$
|
51
|
|
$
|
—
|
|
$
|
—
|
|
$
|
1,103
|
|
|
Fair value
|
1,050
|
|
53
|
|
—
|
|
—
|
|
1,103
|
|
|||||
|
Average yield
(b)
|
0.84
|
%
|
3.28
|
%
|
—
|
%
|
—
|
%
|
0.95
|
%
|
|||||
|
Non-U.S. government debt securities
|
|||||||||||||||
|
Amortized cost
|
$
|
13,559
|
|
$
|
14,276
|
|
$
|
21,220
|
|
$
|
2,437
|
|
$
|
51,492
|
|
|
Fair value
|
13,588
|
|
14,610
|
|
21,957
|
|
2,588
|
|
52,743
|
|
|||||
|
Average yield
(b)
|
3.31
|
%
|
2.04
|
%
|
1.04
|
%
|
1.19
|
%
|
1.90
|
%
|
|||||
|
Corporate debt securities
|
|||||||||||||||
|
Amortized cost
|
$
|
3,830
|
|
$
|
9,619
|
|
$
|
4,523
|
|
$
|
186
|
|
$
|
18,158
|
|
|
Fair value
|
3,845
|
|
9,852
|
|
4,651
|
|
184
|
|
18,532
|
|
|||||
|
Average yield
(b)
|
2.39
|
%
|
2.40
|
%
|
2.56
|
%
|
3.43
|
%
|
2.45
|
%
|
|||||
|
Asset-backed securities
|
|||||||||||||||
|
Amortized cost
|
$
|
—
|
|
$
|
2,240
|
|
$
|
17,439
|
|
$
|
22,992
|
|
$
|
42,671
|
|
|
Fair value
|
—
|
|
2,254
|
|
17,541
|
|
23,014
|
|
42,809
|
|
|||||
|
Average yield
(b)
|
—
|
%
|
1.66
|
%
|
1.75
|
%
|
1.73
|
%
|
1.73
|
%
|
|||||
|
Total available-for-sale debt securities
|
|||||||||||||||
|
Amortized cost
|
$
|
21,711
|
|
$
|
40,816
|
|
$
|
60,666
|
|
$
|
165,273
|
|
$
|
288,466
|
|
|
Fair value
|
21,767
|
|
41,751
|
|
61,906
|
|
170,798
|
|
296,222
|
|
|||||
|
Average yield
(b)
|
2.74
|
%
|
2.06
|
%
|
1.58
|
%
|
3.32
|
%
|
2.73
|
%
|
|||||
|
Available-for-sale equity securities
|
|||||||||||||||
|
Amortized cost
|
$
|
—
|
|
$
|
—
|
|
$
|
—
|
|
$
|
2,513
|
|
$
|
2,513
|
|
|
Fair value
|
—
|
|
—
|
|
—
|
|
2,530
|
|
2,530
|
|
|||||
|
Average yield
(b)
|
—
|
%
|
—
|
%
|
—
|
%
|
0.25
|
%
|
0.25
|
%
|
|||||
|
Total available-for-sale securities
|
|||||||||||||||
|
Amortized cost
|
$
|
21,711
|
|
$
|
40,816
|
|
$
|
60,666
|
|
$
|
167,786
|
|
$
|
290,979
|
|
|
Fair value
|
21,767
|
|
41,751
|
|
61,906
|
|
173,328
|
|
298,752
|
|
|||||
|
Average yield
(b)
|
2.74
|
%
|
2.06
|
%
|
1.58
|
%
|
3.28
|
%
|
2.71
|
%
|
|||||
|
Total held-to-maturity securities
|
|||||||||||||||
|
Amortized cost
|
$
|
—
|
|
$
|
54
|
|
$
|
487
|
|
$
|
48,711
|
|
$
|
49,252
|
|
|
Fair value
|
—
|
|
54
|
|
512
|
|
50,588
|
|
51,154
|
|
|||||
|
Average yield
(b)
|
—
|
%
|
4.33
|
%
|
4.81
|
%
|
3.98
|
%
|
3.98
|
%
|
|||||
|
(a)
|
U.S. government-sponsored enterprises were the only issuers whose securities exceeded
10%
of
JPMorgan Chase
’s total stockholders’ equity at
December 31, 2014
.
|
|
(b)
|
Average yield is computed using the effective yield of each security owned at the end of the period, weighted based on the amortized cost of each security. The effective yield considers the contractual coupon, amortization of premiums and accretion of discounts, and the effect of related hedging derivatives. Taxable-equivalent amounts are used where applicable. The effective yield excludes unscheduled principal prepayments; and accordingly, actual maturities of securities may differ from their contractual or expected maturities as certain securities may be prepaid.
|
|
(c)
|
Includes securities with no stated maturity. Substantially all of the Firm’s residential mortgage-backed securities and collateralized mortgage obligations are due in
10 years
or more, based on contractual maturity. The estimated duration, which reflects anticipated future prepayments, is approximately
five years
for agency residential mortgage-backed securities,
three years
for agency residential collateralized mortgage obligations and
four years
for nonagency residential collateralized mortgage obligations.
|
|
234
|
JPMorgan Chase & Co./2014 Annual Report
|
|
JPMorgan Chase enters into resale agreements, repurchase agreements, securities borrowed transactions and securities loaned transactions (collectively, “securities financing agreements”) primarily to finance the Firm’s inventory positions, acquire securities to cover short positions, accommodate customers’ financing needs, and settle other securities obligations.
Securities financing agreements are treated as collateralized financings on the Firm’s Consolidated balance sheets. Resale and repurchase agreements are generally carried at the amounts at which the securities will be subsequently sold or repurchased. Securities borrowed and securities loaned transactions are generally carried at the amount of cash collateral advanced or received. Where appropriate under applicable accounting guidance, resale and repurchase agreements with the same counterparty are reported on a net basis. For further discussion of the offsetting of assets and liabilities, see Note 1. Fees received
and paid in connection with securities financing agreements are recorded in interest income and interest expense on the Consolidated statements of income.
The Firm has elected the fair value option for certain securities financing agreements. For further information regarding the fair value option, see Note 4. The securities financing agreements for which the fair value option has been elected are reported within securities purchased under resale agreements; securities loaned or sold under repurchase agreements; and securities borrowed on the Consolidated balance sheets. Generally, for agreements carried at fair value, current-period interest accruals are recorded within interest income and interest expense, with changes in fair value reported in principal transactions revenue. However, for financial instruments containing embedded derivatives that would be separately accounted for in accordance with accounting guidance for hybrid instruments, all changes in fair value, including any interest elements, are reported in principal transactions revenue.
The following table presents as of
December 31, 2014
and
2013
, the gross and net securities purchased under resale agreements and securities borrowed. Securities purchased under resale agreements have been presented on the Consolidated balance sheets net of securities sold under repurchase agreements where the Firm has obtained an appropriate legal opinion with respect to the master netting agreement, and where the other relevant criteria have been met. Where such a legal opinion has not been either sought or obtained, the securities purchased under resale agreements are not eligible for netting and are shown separately in the table below. Securities borrowed are presented on a gross basis on the Consolidated balance sheets.
|
2014
|
2013
|
||||||||||||||||||||
|
December 31, (in millions)
|
Gross asset balance
|
Amounts netted on the Consolidated balance sheets
|
Net asset balance
|
Gross asset balance
|
Amounts netted on the Consolidated balance sheets
|
Net asset balance
|
|||||||||||||||
|
Securities purchased under resale agreements
|
|||||||||||||||||||||
|
Securities purchased under resale agreements with an appropriate legal opinion
|
$
|
341,989
|
|
$
|
(142,719
|
)
|
$
|
199,270
|
|
$
|
354,814
|
|
$
|
(115,408
|
)
|
$
|
239,406
|
|
|||
|
Securities purchased under resale agreements where an appropriate legal opinion has not been either sought or obtained
|
15,751
|
|
15,751
|
|
8,279
|
|
8,279
|
|
|||||||||||||
|
Total securities purchased under resale agreements
|
$
|
357,740
|
|
$
|
(142,719
|
)
|
$
|
215,021
|
|
(a)
|
$
|
363,093
|
|
$
|
(115,408
|
)
|
$
|
247,685
|
|
(a)
|
|
|
Securities borrowed
|
$
|
110,435
|
|
N/A
|
|
$
|
110,435
|
|
(b)(c)
|
$
|
111,465
|
|
N/A
|
|
$
|
111,465
|
|
(b)(c)
|
|||
|
(a)
|
At
December 31, 2014
and
2013
, included securities purchased under resale agreements of
$28.6 billion
and
$25.1 billion
, respectively, accounted for at fair value.
|
|
(b)
|
At
December 31, 2014
and
2013
, included securities borrowed of
$992 million
and
$3.7 billion
, respectively, accounted for at fair value.
|
|
(c)
|
Included
$28.0 billion
and
$26.9 billion
at
December 31, 2014
and
2013
, respectively, of securities borrowed where an appropriate legal opinion has not been either sought or obtained with respect to the master netting agreement.
|
|
JPMorgan Chase & Co./2014 Annual Report
|
235
|
|
Notes to consolidated financial statements
The following table presents information as of
December 31, 2014
and
2013
, regarding the securities purchased under resale agreements and securities borrowed for which an appropriate legal opinion has been obtained with respect to the master netting agreement. The below table excludes information related to resale agreements and securities borrowed where such a legal opinion has not been either sought or obtained.
|
2014
|
2013
|
||||||||||||||||||||||||||
|
Amounts not nettable on the Consolidated balance sheets
(a)
|
Amounts not nettable on the Consolidated balance sheets
(a)
|
||||||||||||||||||||||||||
|
December 31, (in millions)
|
Net asset balance
|
Financial instruments
(b)
|
Cash collateral
|
Net exposure
|
Net asset balance
|
Financial instruments
(b)
|
Cash collateral
|
Net exposure
|
|||||||||||||||||||
|
Securities purchased under resale agreements with an appropriate legal opinion
|
$
|
199,270
|
|
$
|
(196,136
|
)
|
$
|
(232
|
)
|
$
|
2,902
|
|
$
|
239,406
|
|
$
|
(234,495
|
)
|
$
|
(98
|
)
|
$
|
4,813
|
|
|||
|
Securities borrowed
|
$
|
82,464
|
|
$
|
(80,267
|
)
|
$
|
—
|
|
$
|
2,197
|
|
$
|
84,531
|
|
$
|
(81,127
|
)
|
$
|
—
|
|
$
|
3,404
|
|
|||
|
(a)
|
For some counterparties, the sum of the financial instruments and cash collateral not nettable on the Consolidated balance sheets may exceed the net asset balance. Where this is the case the total amounts reported in these two columns are limited to the balance of the net reverse repurchase agreement or securities borrowed asset with that counterparty. As a result a net exposure amount is reported even though the Firm, on an aggregate basis for its securities purchased under resale agreements and securities borrowed, has received securities collateral with a total fair value that is greater than the funds provided to counterparties.
|
|
(b)
|
Includes financial instrument collateral received, repurchase liabilities and securities loaned liabilities with an appropriate legal opinion with respect to the master netting agreement; these amounts are not presented net on the Consolidated balance sheets because other U.S. GAAP netting criteria are not met.
|
The following table presents as of
December 31, 2014
and
2013
, the gross and net securities sold under repurchase agreements and securities loaned. Securities sold under repurchase agreements have been presented on the Consolidated balance sheets net of securities purchased under resale agreements where the Firm has obtained an appropriate legal opinion with respect to the master netting agreement, and where the other relevant criteria have been met. Where such a legal opinion has not been either sought or obtained, the securities sold under repurchase agreements are not eligible for netting and are shown separately in the table below. Securities loaned are presented on a gross basis on the Consolidated balance sheets.
|
2014
|
2013
|
||||||||||||||||||||
|
December 31, (in millions)
|
Gross liability balance
|
Amounts netted on the Consolidated balance sheets
|
Net liability balance
|
Gross liability balance
|
Amounts netted on the Consolidated balance sheets
|
Net liability balance
|
|||||||||||||||
|
Securities sold under repurchase agreements
|
|||||||||||||||||||||
|
Securities sold under repurchase agreements with an appropriate legal opinion
|
$
|
289,619
|
|
$
|
(142,719
|
)
|
$
|
146,900
|
|
$
|
257,630
|
|
(f)
|
$
|
(115,408
|
)
|
$
|
142,222
|
|
(f)
|
|
|
Securities sold under repurchase agreements where an appropriate legal opinion has not been either sought or obtained
(a)
|
22,906
|
|
22,906
|
|
18,143
|
|
(f)
|
18,143
|
|
(f)
|
|||||||||||
|
Total securities sold under repurchase agreements
|
$
|
312,525
|
|
$
|
(142,719
|
)
|
$
|
169,806
|
|
(c)
|
$
|
275,773
|
|
$
|
(115,408
|
)
|
$
|
160,365
|
|
(c)
|
|
|
Securities loaned
(b)
|
$
|
25,927
|
|
N/A
|
|
$
|
25,927
|
|
(d)(e)
|
$
|
25,769
|
|
N/A
|
|
$
|
25,769
|
|
(d)(e)
|
|||
|
(a)
|
Includes repurchase agreements that are not subject to a master netting agreement but do provide rights to collateral.
|
|
(b)
|
Included securities-for-securities borrow vs. pledge transactions of
$4.1 billion
and
$5.8 billion
at
December 31, 2014
and
2013
, respectively, when acting as lender and as presented within other liabilities in the Consolidated balance sheets.
|
|
(c)
|
At
December 31, 2014
and
2013
, included securities sold under repurchase agreements of
$3.0 billion
and
$4.9 billion
, respectively, accounted for at fair value.
|
|
(d)
|
At December 31,
2013
, included securities loaned of
$483 million
accounted for at fair value; there were
no
securities loaned accounted for at fair value at
December 31, 2014
.
|
|
(e)
|
Included
$537 million
and
$397 million
at
December 31, 2014
and
2013
, respectively, of securities loaned where an appropriate legal opinion has not been either sought or obtained with respect to the master netting agreement.
|
|
(f)
|
The prior period amounts have been revised with a corresponding impact in the table below. This revision had no impact on the Firm’s Consolidated balance sheets or its results of operations.
|
|
236
|
JPMorgan Chase & Co./2014 Annual Report
|
|
The following table presents information as of
December 31, 2014
and
2013
, regarding the securities sold under repurchase agreements and securities loaned for which an appropriate legal opinion has been obtained with respect to the master netting agreement. The below table excludes information related to repurchase agreements and securities loaned where such a legal opinion has not been either sought or obtained.
|
2014
|
2013
|
|||||||||||||||||||||||||||
|
Amounts not nettable on the Consolidated balance sheets
(a)
|
Amounts not nettable on the Consolidated balance sheets
(a)
|
|||||||||||||||||||||||||||
|
December 31, (in millions)
|
Net liability balance
|
Financial instruments
(b)
|
Cash collateral
|
Net amount
(c)
|
Net liability balance
|
Financial instruments
(b)
|
Cash collateral
|
Net amount
(c)
|
||||||||||||||||||||
|
Securities sold under repurchase agreements with an appropriate legal opinion
|
$
|
146,900
|
|
$
|
(143,985
|
)
|
$
|
(363
|
)
|
$
|
2,552
|
|
$
|
142,222
|
|
(d)
|
$
|
(139,051
|
)
|
(d)
|
$
|
(450
|
)
|
$
|
2,721
|
|
||
|
Securities loaned
|
$
|
25,390
|
|
$
|
(25,040
|
)
|
$
|
—
|
|
$
|
350
|
|
$
|
25,372
|
|
$
|
(25,125
|
)
|
$
|
—
|
|
$
|
247
|
|
||||
|
(a)
|
For some counterparties the sum of the financial instruments and cash collateral not nettable on the Consolidated balance sheets may exceed the net liability balance. Where this is the case the total amounts reported in these two columns are limited to the balance of the net repurchase agreement or securities loaned liability with that counterparty.
|
|
(b)
|
Includes financial instrument collateral transferred, reverse repurchase assets and securities borrowed assets with an appropriate legal opinion with respect to the master netting agreement; these amounts are not presented net on the Consolidated balance sheets because other U.S. GAAP netting criteria are not met.
|
|
(c)
|
Net amount represents exposure of counterparties to the Firm.
|
|
(d)
|
The prior period amounts have been revised with a corresponding impact in the table above. This revision had no impact on the Firm’s Consolidated balance sheets or its results of operations.
|
JPMorgan Chase’s policy is to take possession, where possible, of securities purchased under resale agreements and of securities borrowed. The Firm monitors the value of the underlying securities (primarily G7 government securities, U.S. agency securities and agency MBS, and equities) that it has received from its counterparties and either requests additional collateral or returns a portion of the collateral when appropriate in light of the market value of the underlying securities. Margin levels are established initially based upon the counterparty and type of collateral and monitored on an ongoing basis to protect against declines in collateral value in the event of default. JPMorgan Chase typically enters into master netting agreements and other collateral arrangements with its resale agreement and securities borrowed counterparties, which provide for the right to liquidate the purchased or borrowed securities in the event of a customer default. As a result of the Firm’s credit risk mitigation practices with respect to resale and securities borrowed agreements as described above, the Firm did not hold any reserves for credit impairment with respect to these agreements as of
December 31, 2014
and
2013
.
For further information regarding assets pledged and collateral received in securities financing agreements, see Note 30.
Transfers not qualifying for sale accounting
In addition, at
December 31, 2014
and
2013
, the Firm held
$13.8 billion
and
$14.6 billion
, respectively, of financial assets for which the rights have been transferred to third parties; however, the transfers did not qualify as a sale in accordance with U.S. GAAP. These transfers have been recognized as collateralized financing transactions. The transferred assets are recorded in trading assets, other assets and loans, and the corresponding liabilities are predominantly recorded in other borrowed funds on the Consolidated balance sheets.
|
JPMorgan Chase & Co./2014 Annual Report
|
237
|
|
Notes to consolidated financial statements
Loan accounting framework
The accounting for a loan depends on management’s strategy for the loan, and on whether the loan was credit-impaired at the date of acquisition. The Firm accounts for loans based on the following categories:
|
•
|
Originated or purchased loans held-for-investment (i.e., “retained”), other than purchased credit-impaired (“PCI”) loans
|
|
•
|
Loans held-for-sale
|
|
•
|
Loans at fair value
|
|
•
|
PCI loans held-for-investment
|
The following provides a detailed accounting discussion of these loan categories:
Loans held-for-investment (other than PCI loans)
Originated or purchased loans held-for-investment, other than PCI loans, are measured at the principal amount outstanding, net of the following: allowance for loan losses; net charge-offs; interest applied to principal (for loans accounted for on the cost recovery method); unamortized discounts and premiums; and net deferred loan fees or costs. Credit card loans also include billed finance charges and fees net of an allowance for uncollectible amounts.
Interest income
Interest income on performing loans held-for-investment, other than PCI loans, is accrued and recognized as interest income at the contractual rate of interest. Purchase price discounts or premiums, as well as net deferred loan fees or costs, are amortized into interest income over the life of the loan to produce a level rate of return.
Nonaccrual loans
Nonaccrual loans are those on which the accrual of interest has been suspended. Loans (other than credit card loans and certain consumer loans insured by U.S. government agencies) are placed on nonaccrual status and considered nonperforming when full payment of principal and interest is in doubt, or when principal and interest has been in default for a period of
90 days
or more, unless the loan is both well-secured and in the process of collection. A loan is determined to be past due when the minimum payment is not received from the borrower by the contractually specified due date or for certain loans (e.g., residential real estate loans), when a monthly payment is due and unpaid for
30 days
or more. Finally, collateral-dependent loans are typically maintained on nonaccrual status.
On the date a loan is placed on nonaccrual status, all interest accrued but not collected is reversed against interest income. In addition, the amortization of deferred amounts is suspended. Interest income on nonaccrual loans may be recognized as cash interest payments are received (i.e., on a cash basis) if the recorded loan balance is deemed fully collectible; however, if there is doubt regarding the ultimate collectibility of the recorded loan balance, all interest cash receipts are applied to reduce the carrying value of the loan (the cost recovery method). For consumer loans, application of this policy typically results in the Firm recognizing interest income on nonaccrual consumer loans on a cash basis.
A loan may be returned to accrual status when repayment is reasonably assured and there has been demonstrated performance under the terms of the loan or, if applicable, the terms of the restructured loan.
As permitted by regulatory guidance, credit card loans are generally exempt from being placed on nonaccrual status; accordingly, interest and fees related to credit card loans continue to accrue until the loan is charged off or paid in full. However, the Firm separately establishes an allowance for the estimated uncollectible portion of accrued interest and fee income on credit card loans. The allowance is established with a charge to interest income and is reported as an offset to loans.
Allowance for loan losses
The allowance for loan losses represents the estimated probable credit losses inherent in the held-for-investment loan portfolio at the balance sheet date. Changes in the allowance for loan losses are recorded in the provision for credit losses on the Firm’s Consolidated statements of income. See Note 15 for further information on the Firm’s accounting policies for the allowance for loan losses.
Charge-offs
Consumer loans, other than risk-rated business banking, risk-rated auto and PCI loans, are generally charged off or charged down to the net realizable value of the underlying collateral (i.e., fair value less costs to sell), with an offset to the allowance for loan losses, upon reaching specified stages of delinquency in accordance with standards established by the Federal Financial Institutions Examination Council (“FFIEC”). Residential real estate loans, non-modified credit card loans and scored business banking loans are generally charged off at
180 days
past due. In the second quarter of
2013
, the Firm revised its policy to charge-off modified credit card loans that do not comply with their modified payment terms at
120 days
past due rather than
180 days
past due. Auto and student loans are charged off no later than
120 days
past due.
|
238
|
JPMorgan Chase & Co./2014 Annual Report
|
|
Certain consumer loans will be charged off earlier than the FFIEC charge-off standards in certain circumstances as follows:
|
•
|
A charge-off is recognized when a loan is modified in a TDR if the loan is determined to be collateral-dependent. A loan is considered to be collateral-dependent when repayment of the loan is expected to be provided solely by the underlying collateral, rather than by cash flows from the borrower’s operations, income or other resources.
|
|
•
|
Loans to borrowers who have experienced an event (e.g., bankruptcy) that suggests a loss is either known or highly certain are subject to accelerated charge-off standards. Residential real estate and auto loans are charged off when the loan becomes
60 days
past due, or sooner if the loan is determined to be collateral-dependent. Credit card and scored business banking loans are charged off within
60 days
of receiving notification of the bankruptcy filing or other event. Student loans are generally charged off when the loan becomes
60 days
past due after receiving notification of a bankruptcy.
|
|
•
|
Auto loans are written down to net realizable value upon repossession of the automobile and after a redemption period (i.e., the period during which a borrower may cure the loan) has passed.
|
Other than in certain limited circumstances, the Firm typically does not recognize charge-offs on government-guaranteed loans.
Wholesale loans, risk-rated business banking loans and risk-rated auto loans are charged off when it is highly certain that a loss has been realized, including situations where a loan is determined to be both impaired and collateral-dependent. The determination of whether to recognize a charge-off includes many factors, including the prioritization of the Firm’s claim in bankruptcy, expectations of the workout/restructuring of the loan and valuation of the borrower’s equity or the loan collateral.
When a loan is charged down to the estimated net realizable value, the determination of the fair value of the collateral depends on the type of collateral (e.g., securities, real estate). In cases where the collateral is in the form of liquid securities, the fair value is based on quoted market prices or broker quotes. For illiquid securities or other financial assets, the fair value of the collateral is estimated using a discounted cash flow model.
For residential real estate loans, collateral values are based upon external valuation sources. When it becomes likely that a borrower is either unable or unwilling to pay, the Firm obtains a broker’s price opinion of the home based on an exterior-only valuation (“exterior opinions”), which is then updated at least every
six months
thereafter. As soon as practicable after the Firm receives the property in satisfaction of a debt (e.g., by taking legal title or physical possession), generally, either through foreclosure or upon the execution of a deed in lieu of foreclosure transaction with the borrower, the Firm obtains an appraisal based on an inspection that includes the interior of the home (“interior appraisals”). Exterior opinions and interior appraisals are discounted based upon the Firm’s experience with actual liquidation values as compared to the estimated values provided by exterior opinions and interior appraisals, considering state- and product-specific factors.
For commercial real estate loans, collateral values are generally based on appraisals from internal and external valuation sources. Collateral values are typically updated every
six
to
twelve months
, either by obtaining a new appraisal or by performing an internal analysis, in accordance with the Firm’s policies. The Firm also considers both borrower- and market-specific factors, which may result in obtaining appraisal updates or broker price opinions at more frequent intervals.
Loans held-for-sale
Held-for-sale loans are measured at the lower of cost or fair value, with valuation changes recorded in noninterest revenue. For consumer loans, the valuation is performed on a portfolio basis. For wholesale loans, the valuation is performed on an individual loan basis.
Interest income on loans held-for-sale is accrued and recognized based on the contractual rate of interest.
Loan origination fees or costs and purchase price discounts or premiums are deferred in a contra loan account until the related loan is sold. The deferred fees and discounts or premiums are an adjustment to the basis of the loan and therefore are included in the periodic determination of the lower of cost or fair value adjustments and/or the gain or loss recognized at the time of sale.
Held-for-sale loans are subject to the nonaccrual policies described above.
Because held-for-sale loans are recognized at the lower of cost or fair value, the Firm’s allowance for loan losses and charge-off policies do not apply to these loans.
|
JPMorgan Chase & Co./2014 Annual Report
|
239
|
|
Notes to consolidated financial statements
Loans at fair value
Loans used in a market-making strategy or risk managed on a fair value basis are measured at fair value, with changes in fair value recorded in noninterest revenue.
For these loans, the earned current contractual interest payment is recognized in interest income. Changes in fair value are recognized in noninterest revenue. Loan origination fees are recognized upfront in noninterest revenue. Loan origination costs are recognized in the associated expense category as incurred.
Because these loans are recognized at fair value, the Firm’s nonaccrual, allowance for loan losses, and charge-off policies do not apply to these loans.
See Note 4 for further information on the Firm’s elections of fair value accounting under the fair value option. See Note 3 and Note 4 for further information on loans carried at fair value and classified as trading assets.
PCI loans
PCI loans held-for-investment are initially measured at fair value. PCI loans have evidence of credit deterioration since the loan’s origination date and therefore it is probable, at acquisition, that all contractually required payments will not be collected. Because PCI loans are initially measured at fair value, which includes an estimate of future credit losses, no allowance for loan losses related to PCI loans is recorded at the acquisition date. See
page 251
of this Note for information on accounting for PCI loans subsequent to their acquisition.
Loan classification changes
Loans in the held-for-investment portfolio that management decides to sell are transferred to the held-for-sale portfolio at the lower of cost or fair value on the date of transfer. Credit-related losses are charged against the allowance for loan losses; non-credit related losses such as those due to changes in interest rates or foreign currency exchange rates are recognized in noninterest revenue.
In the event that management decides to retain a loan in the held-for-sale portfolio, the loan is transferred to the held-for-investment portfolio at the lower of cost or fair value on the date of transfer. These loans are subsequently assessed for impairment based on the Firm’s allowance methodology. For a further discussion of the methodologies used in establishing the Firm’s allowance for loan losses, see Note 15.
Loan modifications
The Firm seeks to modify certain loans in conjunction with its loss-mitigation activities. Through the modification,
JPMorgan Chase
grants one or more concessions to a borrower who is experiencing financial difficulty in order to minimize the Firm’s economic loss, avoid foreclosure or repossession of the collateral, and to ultimately maximize payments received by the Firm from the borrower. The concessions granted vary by program and by borrower-specific characteristics, and may include interest rate reductions, term extensions, payment deferrals, principal forgiveness, or the acceptance of equity or other assets in lieu of payments.
Such modifications are accounted for and reported as troubled debt restructurings (“TDRs”). A loan that has been modified in a TDR is generally considered to be impaired until it matures, is repaid, or is otherwise liquidated, regardless of whether the borrower performs under the modified terms. In certain limited cases, the effective interest rate applicable to the modified loan is at or above the current market rate at the time of the restructuring. In such circumstances, and assuming that the loan subsequently performs under its modified terms and the Firm expects to collect all contractual principal and interest cash flows, the loan is disclosed as impaired and as a TDR only during the year of the modification; in subsequent years, the loan is not disclosed as an impaired loan or as a TDR so long as repayment of the restructured loan under its modified terms is reasonably assured.
Loans, except for credit card loans, modified in a TDR are generally placed on nonaccrual status, although in many cases such loans were already on nonaccrual status prior to modification. These loans may be returned to performing status (the accrual of interest is resumed) if the following criteria are met: (a) the borrower has performed under the modified terms for a minimum of
six months
and/or
six
payments, and (b) the Firm has an expectation that repayment of the modified loan is reasonably assured based on, for example, the borrower’s debt capacity and level of future earnings, collateral values, loan-to-value (“LTV”) ratios, and other current market considerations. In certain limited and well-defined circumstances in which the loan is current at the modification date, such loans are not placed on nonaccrual status at the time of modification.
Because loans modified in TDRs are considered to be impaired, these loans are measured for impairment using the Firm’s established asset-specific allowance methodology, which considers the expected re-default rates for the modified loans. A loan modified in a TDR remains subject to the asset-specific allowance methodology throughout its remaining life, regardless of whether the loan is performing and has been returned to accrual status and/or the loan has been removed from the impaired loans disclosures (i.e., loans restructured at market rates). For further discussion of the methodology used to estimate the Firm’s asset-specific allowance, see Note 15.
|
240
|
JPMorgan Chase & Co./2014 Annual Report
|
|
Foreclosed property
The Firm acquires property from borrowers through loan restructurings, workouts, and foreclosures. Property acquired may include real property (e.g., residential real estate, land, and buildings) and commercial and personal property (e.g., automobiles, aircraft, railcars, and ships).
The Firm recognizes foreclosed property upon receiving assets in satisfaction of a loan (e.g., by taking legal title or physical possession). For loans collateralized by real property, the Firm generally recognizes the asset received at foreclosure sale or upon the execution of a deed in lieu of
foreclosure transaction with the borrower. Foreclosed assets are reported in other assets on the Consolidated balance sheets and initially recognized at fair value less costs to sell. Each quarter the fair value of the acquired property is reviewed and adjusted, if necessary, to the lower of cost or fair value. Subsequent adjustments to fair value are charged/credited to noninterest revenue. Operating expense, such as real estate taxes and maintenance, are charged to other expense.
Loan portfolio
The Firm’s loan portfolio is divided into three portfolio segments, which are the same segments used by the Firm to determine the allowance for loan losses: Consumer, excluding credit card; Credit card; and Wholesale. Within each portfolio segment, the Firm monitors and assesses the credit risk in the following classes of loans, based on the risk characteristics of each loan class:
|
Consumer, excluding
credit card
(a)
|
Credit card
|
Wholesale
(c)
|
||
|
Residential real estate – excluding PCI
• Home equity – senior lien
• Home equity – junior lien
• Prime mortgage, including
option ARMs
• Subprime mortgage
Other consumer loans
• Auto
(b)
• Business banking
(b)
• Student and other
Residential real estate – PCI
• Home equity
• Prime mortgage
• Subprime mortgage
• Option ARMs
|
• Credit card loans
|
• Commercial and industrial
• Real estate
• Financial institutions
• Government agencies
• Other
(d)
|
||
|
(a)
|
Includes loans held in CCB, prime mortgage and home equity loans held in AM and prime mortgage loans held in Corporate.
|
|
(b)
|
Includes certain business banking and auto dealer risk-rated loans that apply the wholesale methodology for determining the allowance for loan losses; these loans are managed by CCB, and therefore, for consistency in presentation, are included with the other consumer loan classes.
|
|
(c)
|
Includes loans held in CIB, CB, AM and Corporate. Excludes prime mortgage and home equity loans held in AM and prime mortgage loans held in Corporate. Classes are internally defined and may not align with regulatory definitions.
|
|
(d)
|
Other primarily includes loans to SPEs and loans to private banking clients. See Note 1 for additional information on SPEs.
|
|
JPMorgan Chase & Co./2014 Annual Report
|
241
|
|
Notes to consolidated financial statements
The following tables summarize the Firm’s loan balances by portfolio segment.
|
December 31, 2014
|
Consumer, excluding credit card
|
Credit card
(a)
|
Wholesale
|
Total
|
||||||||||||||||
|
(in millions)
|
||||||||||||||||||||
|
Retained
|
$
|
294,979
|
|
$
|
128,027
|
|
$
|
324,502
|
|
$
|
747,508
|
|
(b)
|
|||||||
|
Held-for-sale
|
395
|
|
3,021
|
|
3,801
|
|
7,217
|
|
||||||||||||
|
At fair value
|
—
|
|
—
|
|
2,611
|
|
2,611
|
|
||||||||||||
|
Total
|
$
|
295,374
|
|
$
|
131,048
|
|
$
|
330,914
|
|
$
|
757,336
|
|
||||||||
|
December 31, 2013
|
Consumer, excluding credit card
|
Credit card
(a)
|
Wholesale
|
Total
|
||||||||||||||||
|
(in millions)
|
||||||||||||||||||||
|
Retained
|
$
|
288,449
|
|
$
|
127,465
|
|
$
|
308,263
|
|
$
|
724,177
|
|
(b)
|
|||||||
|
Held-for-sale
|
614
|
|
326
|
|
11,290
|
|
12,230
|
|
||||||||||||
|
At fair value
|
—
|
|
—
|
|
2,011
|
|
2,011
|
|
||||||||||||
|
Total
|
$
|
289,063
|
|
$
|
127,791
|
|
$
|
321,564
|
|
$
|
738,418
|
|
||||||||
|
(a)
|
Includes billed finance charges and fees net of an allowance for uncollectible amounts.
|
|
(b)
|
Loans (other than PCI loans and those for which the fair value option has been elected) are presented net of unearned income, unamortized discounts and premiums, and net deferred loan costs of
$1.3 billion
and
$1.9 billion
at
December 31, 2014
and
2013
, respectively.
|
The following tables provide information about the carrying value of retained loans purchased, sold and reclassified to held-for-sale during the periods indicated. These tables exclude loans recorded at fair value.
The Firm manages its exposure to credit risk on an ongoing basis. Selling loans is one way that the Firm reduces its credit exposures.
|
2014
|
||||||||||||||||||||
|
Year ended December 31,
(in millions) |
Consumer, excluding
credit card
|
Credit card
|
Wholesale
|
Total
|
||||||||||||||||
|
Purchases
|
$
|
7,434
|
|
(a)(b)
|
$
|
—
|
|
$
|
885
|
|
$
|
8,319
|
|
|||||||
|
Sales
|
6,655
|
|
291
|
|
7,381
|
|
14,327
|
|
||||||||||||
|
Retained loans reclassified to held-for-sale
|
1,190
|
|
3,039
|
|
581
|
|
4,810
|
|
||||||||||||
|
2013
|
||||||||||||||||||||
|
Year ended December 31,
(in millions) |
Consumer, excluding
credit card
|
Credit card
|
Wholesale
|
Total
|
||||||||||||||||
|
Purchases
|
$
|
7,616
|
|
(a)(b)
|
$
|
328
|
|
$
|
697
|
|
$
|
8,641
|
|
|||||||
|
Sales
|
4,845
|
|
—
|
|
4,232
|
|
9,077
|
|
||||||||||||
|
Retained loans reclassified to held-for-sale
|
1,261
|
|
309
|
|
5,641
|
|
7,211
|
|
||||||||||||
|
2012
|
||||||||||||||||||||
|
Year ended December 31,
(in millions) |
Consumer, excluding
credit card
|
Credit card
|
Wholesale
|
Total
|
||||||||||||||||
|
Purchases
|
$
|
6,601
|
|
(a)(b)
|
$
|
—
|
|
$
|
827
|
|
$
|
7,428
|
|
|||||||
|
Sales
|
1,852
|
|
—
|
|
3,423
|
|
5,275
|
|
||||||||||||
|
Retained loans reclassified to held-for-sale
|
—
|
|
1,043
|
|
504
|
|
1,547
|
|
||||||||||||
|
(a)
|
Purchases predominantly represent the Firm’s voluntary repurchase of certain delinquent loans from loan pools as permitted by Ginnie Mae guidelines. The Firm typically elects to repurchase these delinquent loans as it continues to service them and/or manage the foreclosure process in accordance with applicable requirements of Ginnie Mae, the Federal Housing Administration (“FHA”), Rural Housing Services (“RHS”) and/or the U.S. Department of Veterans Affairs (“VA”).
|
|
(b)
|
Excluded retained loans purchased from correspondents that were originated in accordance with the Firm’s underwriting standards. Such purchases were
$15.1 billion
,
$5.7 billion
and
$1.4 billion
for the
years ended
December 31, 2014
,
2013
and
2012
, respectively.
|
The following table provides information about gains and losses, including lower of cost or fair value adjustments, on loan sales by portfolio segment.
|
Year ended December 31, (in millions)
|
2014
|
2013
|
2012
|
||||||
|
Net gains/(losses) on sales of loans (including lower of cost or fair value adjustments)
(a)
|
|||||||||
|
Consumer, excluding credit card
|
$
|
341
|
|
$
|
313
|
|
$
|
122
|
|
|
Credit card
|
(241
|
)
|
3
|
|
(9
|
)
|
|||
|
Wholesale
|
101
|
|
(76
|
)
|
180
|
|
|||
|
Total net gains/(losses) on sales of loans (including lower of cost or fair value adjustments)
|
$
|
201
|
|
$
|
240
|
|
$
|
293
|
|
|
(a)
|
Excludes sales related to loans accounted for at fair value.
|
|
242
|
JPMorgan Chase & Co./2014 Annual Report
|
|
Consumer, excluding credit card, loan portfolio
Consumer loans, excluding credit card loans, consist primarily of residential mortgages, home equity loans and lines of credit, auto loans, business banking loans, and student and other loans, with a focus on serving the prime consumer credit market. The portfolio also includes home equity loans secured by junior liens, prime mortgage loans with an interest-only payment period, and certain payment-option loans originated by Washington Mutual that may result in negative amortization.
The table below provides information about retained consumer loans, excluding credit card, by class.
|
December 31, (in millions)
|
2014
|
2013
|
||||
|
Residential real estate – excluding PCI
|
||||||
|
Home equity:
|
||||||
|
Senior lien
|
$
|
16,367
|
|
$
|
17,113
|
|
|
Junior lien
|
36,375
|
|
40,750
|
|
||
|
Mortgages:
|
||||||
|
Prime, including option ARMs
|
104,921
|
|
87,162
|
|
||
|
Subprime
|
5,056
|
|
7,104
|
|
||
|
Other consumer loans
|
||||||
|
Auto
|
54,536
|
|
52,757
|
|
||
|
Business banking
|
20,058
|
|
18,951
|
|
||
|
Student and other
|
10,970
|
|
11,557
|
|
||
|
Residential real estate – PCI
|
||||||
|
Home equity
|
17,095
|
|
18,927
|
|
||
|
Prime mortgage
|
10,220
|
|
12,038
|
|
||
|
Subprime mortgage
|
3,673
|
|
4,175
|
|
||
|
Option ARMs
|
15,708
|
|
17,915
|
|
||
|
Total retained loans
|
$
|
294,979
|
|
$
|
288,449
|
|
Delinquency rates are a primary credit quality indicator for consumer loans. Loans that are more than
30 days
past due provide an early warning of borrowers who may be experiencing financial difficulties and/or who may be unable or unwilling to repay the loan. As the loan continues to age, it becomes more clear that the borrower is likely either unable or unwilling to pay. In the case of residential real estate loans, late-stage delinquencies (greater than
150 days
past due) are a strong indicator of loans that will ultimately result in a foreclosure or similar liquidation transaction. In addition to delinquency rates, other credit quality indicators for consumer loans vary based on the class of loan, as follows:
|
•
|
For residential real estate loans, including both non-PCI and PCI portfolios, the current estimated LTV ratio, or the combined LTV ratio in the case of junior lien loans, is an indicator of the potential loss severity in the event of default. Additionally, LTV or combined LTV can provide
|
insight into a borrower’s continued willingness to pay, as the delinquency rate of high-LTV loans tends to be greater than that for loans where the borrower has equity in the collateral. The geographic distribution of the loan collateral also provides insight as to the credit quality of the portfolio, as factors such as the regional economy, home price changes and specific events such as natural disasters, will affect credit quality. The borrower’s current or “refreshed” FICO score is a secondary credit-quality indicator for certain loans, as FICO scores are an indication of the borrower’s credit payment history. Thus, a loan to a borrower with a low FICO score (
660
or below) is considered to be of higher risk than a loan to a borrower with a high FICO score. Further, a loan to a borrower with a high LTV ratio and a low FICO score is at greater risk of default than a loan to a borrower that has both a high LTV ratio and a high FICO score.
|
•
|
For scored auto, scored business banking and student loans, geographic distribution is an indicator of the credit performance of the portfolio. Similar to residential real estate loans, geographic distribution provides insights into the portfolio performance based on regional economic activity and events.
|
|
•
|
Risk-rated business banking and auto loans are similar to wholesale loans in that the primary credit quality indicators are the risk rating that is assigned to the loan and whether the loans are considered to be criticized and/or nonaccrual. Risk ratings are reviewed on a regular and ongoing basis by Credit Risk Management and are adjusted as necessary for updated information about borrowers’ ability to fulfill their obligations. For further information about risk-rated wholesale loan credit quality indicators, see
page 255
of this Note.
|
Residential real estate – excluding PCI loans
The following table provides information by class for residential real estate – excluding retained PCI loans in the consumer, excluding credit card, portfolio segment.
The following factors should be considered in analyzing certain credit statistics applicable to the Firm’s residential real estate – excluding PCI loans portfolio: (i) junior lien home equity loans may be fully charged off when the loan becomes
180 days
past due, and the value of the collateral does not support the repayment of the loan, resulting in relatively high charge-off rates for this product class; and (ii) the lengthening of loss-mitigation timelines may result in higher delinquency rates for loans carried at the net realizable value of the collateral that remain on the Firm’s Consolidated balance sheets.
|
JPMorgan Chase & Co./2014 Annual Report
|
243
|
|
Notes to consolidated financial statements
|
Residential real estate – excluding PCI loans
|
||||||||||||||||||||||||||||||||||
|
Home equity
|
Mortgages
|
|||||||||||||||||||||||||||||||||
|
December 31,
(in millions, except ratios)
|
Senior lien
|
Junior lien
|
Prime, including option ARMs
|
Subprime
|
Total residential real estate – excluding PCI
|
|||||||||||||||||||||||||||||
|
2014
|
2013
|
2014
|
2013
|
2014
|
2013
|
2014
|
2013
|
2014
|
2013
|
|||||||||||||||||||||||||
|
Loan delinquency
(a)
|
||||||||||||||||||||||||||||||||||
|
Current
|
$
|
15,730
|
|
$
|
16,470
|
|
$
|
35,575
|
|
$
|
39,864
|
|
$
|
93,951
|
|
$
|
76,108
|
|
$
|
4,296
|
|
$
|
5,956
|
|
$
|
149,552
|
|
$
|
138,398
|
|
||||
|
30–149 days past due
|
275
|
|
298
|
|
533
|
|
662
|
|
4,091
|
|
3,155
|
|
489
|
|
646
|
|
5,388
|
|
4,761
|
|
||||||||||||||
|
150 or more days past due
|
362
|
|
345
|
|
267
|
|
224
|
|
6,879
|
|
7,899
|
|
271
|
|
502
|
|
7,779
|
|
8,970
|
|
||||||||||||||
|
Total retained loans
|
$
|
16,367
|
|
$
|
17,113
|
|
$
|
36,375
|
|
$
|
40,750
|
|
$
|
104,921
|
|
$
|
87,162
|
|
$
|
5,056
|
|
$
|
7,104
|
|
$
|
162,719
|
|
$
|
152,129
|
|
||||
|
% of 30+ days past due to total retained loans
(b)
|
3.89
|
%
|
3.76
|
%
|
2.20
|
%
|
2.17
|
%
|
1.42
|
%
|
2.32
|
%
|
15.03
|
%
|
16.16
|
%
|
2.27
|
%
|
3.09
|
%
|
||||||||||||||
|
90 or more days past due and still accruing
|
$
|
—
|
|
$
|
—
|
|
$
|
—
|
|
$
|
—
|
|
$
|
—
|
|
$
|
—
|
|
$
|
—
|
|
$
|
—
|
|
$
|
—
|
|
$
|
—
|
|
||||
|
90 or more days past due and government guarantee
d
(c)
|
—
|
|
—
|
|
—
|
|
—
|
|
7,544
|
|
7,823
|
|
—
|
|
—
|
|
7,544
|
|
7,823
|
|
||||||||||||||
|
Nonaccrual loans
|
938
|
|
932
|
|
1,590
|
|
1,876
|
|
2,190
|
|
2,666
|
|
1,036
|
|
1,390
|
|
5,754
|
|
6,864
|
|
||||||||||||||
|
Current estimated LTV ratios
(d)(e)(f)(g)
|
||||||||||||||||||||||||||||||||||
|
Greater than 125% and refreshed FICO scores:
|
||||||||||||||||||||||||||||||||||
|
Equal to or greater than 660
|
$
|
21
|
|
$
|
40
|
|
$
|
467
|
|
$
|
1,101
|
|
$
|
120
|
|
$
|
236
|
|
$
|
10
|
|
$
|
52
|
|
$
|
618
|
|
$
|
1,429
|
|
||||
|
Less than 660
|
10
|
|
22
|
|
138
|
|
346
|
|
103
|
|
281
|
|
51
|
|
197
|
|
302
|
|
846
|
|
||||||||||||||
|
101% to 125% and refreshed FICO scores:
|
||||||||||||||||||||||||||||||||||
|
Equal to or greater than 660
|
134
|
|
212
|
|
3,149
|
|
4,645
|
|
648
|
|
1,210
|
|
118
|
|
249
|
|
4,049
|
|
6,316
|
|
||||||||||||||
|
Less than 660
|
69
|
|
107
|
|
923
|
|
1,407
|
|
340
|
|
679
|
|
298
|
|
597
|
|
1,630
|
|
2,790
|
|
||||||||||||||
|
80% to 100% and refreshed FICO scores:
|
||||||||||||||||||||||||||||||||||
|
Equal to or greater than 660
|
633
|
|
858
|
|
6,481
|
|
7,995
|
|
3,863
|
|
4,749
|
|
432
|
|
614
|
|
11,409
|
|
14,216
|
|
||||||||||||||
|
Less than 660
|
226
|
|
326
|
|
1,780
|
|
2,128
|
|
1,026
|
|
1,590
|
|
770
|
|
1,141
|
|
3,802
|
|
5,185
|
|
||||||||||||||
|
Less than 80% and refreshed FICO scores:
|
||||||||||||||||||||||||||||||||||
|
Equal to or greater than 660
|
13,048
|
|
13,186
|
|
20,030
|
|
19,732
|
|
81,805
|
|
59,634
|
|
1,586
|
|
1,961
|
|
116,469
|
|
94,513
|
|
||||||||||||||
|
Less than 660
|
2,226
|
|
2,362
|
|
3,407
|
|
3,396
|
|
4,906
|
|
5,071
|
|
1,791
|
|
2,293
|
|
12,330
|
|
13,122
|
|
||||||||||||||
|
U.S. government-guaranteed
|
—
|
|
—
|
|
—
|
|
—
|
|
12,110
|
|
13,712
|
|
—
|
|
—
|
|
12,110
|
|
13,712
|
|
||||||||||||||
|
Total retained loans
|
$
|
16,367
|
|
$
|
17,113
|
|
$
|
36,375
|
|
$
|
40,750
|
|
$
|
104,921
|
|
$
|
87,162
|
|
$
|
5,056
|
|
$
|
7,104
|
|
$
|
162,719
|
|
$
|
152,129
|
|
||||
|
Geographic region
|
||||||||||||||||||||||||||||||||||
|
California
|
$
|
2,232
|
|
$
|
2,397
|
|
$
|
8,144
|
|
$
|
9,240
|
|
$
|
28,133
|
|
$
|
21,876
|
|
$
|
718
|
|
$
|
1,069
|
|
$
|
39,227
|
|
$
|
34,582
|
|
||||
|
New York
|
2,805
|
|
2,732
|
|
7,685
|
|
8,429
|
|
16,550
|
|
14,085
|
|
677
|
|
942
|
|
27,717
|
|
26,188
|
|
||||||||||||||
|
Illinois
|
1,306
|
|
1,248
|
|
2,605
|
|
2,815
|
|
6,654
|
|
5,216
|
|
207
|
|
280
|
|
10,772
|
|
9,559
|
|
||||||||||||||
|
Florida
|
861
|
|
847
|
|
1,923
|
|
2,167
|
|
5,106
|
|
4,598
|
|
632
|
|
885
|
|
8,522
|
|
8,497
|
|
||||||||||||||
|
Texas
|
1,845
|
|
2,044
|
|
1,087
|
|
1,199
|
|
4,935
|
|
3,565
|
|
177
|
|
220
|
|
8,044
|
|
7,028
|
|
||||||||||||||
|
New Jersey
|
654
|
|
630
|
|
2,233
|
|
2,442
|
|
3,361
|
|
2,679
|
|
227
|
|
339
|
|
6,475
|
|
6,090
|
|
||||||||||||||
|
Arizona
|
927
|
|
1,019
|
|
1,595
|
|
1,827
|
|
1,805
|
|
1,385
|
|
112
|
|
144
|
|
4,439
|
|
4,375
|
|
||||||||||||||
|
Washington
|
506
|
|
555
|
|
1,216
|
|
1,378
|
|
2,410
|
|
1,951
|
|
109
|
|
150
|
|
4,241
|
|
4,034
|
|
||||||||||||||
|
Michigan
|
736
|
|
799
|
|
848
|
|
976
|
|
1,203
|
|
998
|
|
121
|
|
178
|
|
2,908
|
|
2,951
|
|
||||||||||||||
|
Ohio
|
1,150
|
|
1,298
|
|
778
|
|
907
|
|
615
|
|
466
|
|
112
|
|
161
|
|
2,655
|
|
2,832
|
|
||||||||||||||
|
All other
(h)
|
3,345
|
|
3,544
|
|
8,261
|
|
9,370
|
|
34,149
|
|
30,343
|
|
1,964
|
|
2,736
|
|
47,719
|
|
45,993
|
|
||||||||||||||
|
Total retained loans
|
$
|
16,367
|
|
$
|
17,113
|
|
$
|
36,375
|
|
$
|
40,750
|
|
$
|
104,921
|
|
$
|
87,162
|
|
$
|
5,056
|
|
$
|
7,104
|
|
$
|
162,719
|
|
$
|
152,129
|
|
||||
|
(a)
|
Individual delinquency classifications include mortgage loans insured by U.S. government agencies as follows: current included
$2.6 billion
and
$4.7 billion
;
30
–
149
days past due included
$3.5 billion
and
$2.4 billion
; and
150
or more days past due included
$6.0 billion
and
$6.6 billion
at
December 31, 2014
and
2013
, respectively.
|
|
(b)
|
At
December 31, 2014
and
2013
, Prime, including option ARMs loans excluded mortgage loans insured by U.S. government agencies of
$9.5 billion
and
$9.0 billion
, respectively. These amounts have been excluded from nonaccrual loans based upon the government guarantee.
|
|
(c)
|
These balances, which are
90 days
or more past due but insured by U.S. government agencies, are excluded from nonaccrual loans. In predominantly all cases,
100%
of the principal balance of the loans is insured and interest is guaranteed at a specified reimbursement rate subject to meeting agreed-upon servicing guidelines. These amounts have been excluded from nonaccrual loans based upon the government guarantee. At
December 31, 2014
and
2013
, these balances included
$4.2 billion
and
$4.7 billion
, respectively, of loans that are no longer accruing interest because interest has been curtailed by the U.S. government agencies although, in predominantly all cases,
100%
of the principal is still insured. For the remaining balance, interest is being accrued at the guaranteed reimbursement rate.
|
|
(d)
|
Represents the aggregate unpaid principal balance of loans divided by the estimated current property value. Current property values are estimated, at a minimum, quarterly, based on home valuation models using nationally recognized home price index valuation estimates incorporating actual data to the extent available and forecasted data where actual data is not available. These property values do not represent actual appraised loan level collateral values; as such, the resulting ratios are necessarily imprecise and should be viewed as estimates.
|
|
(e)
|
Junior lien represents combined LTV, which considers all available lien positions, as well as unused lines, related to the property. All other products are presented without consideration of subordinate liens on the property.
|
|
(f)
|
Refreshed FICO scores represent each borrower’s most recent credit score, which is obtained by the Firm on at least a quarterly basis.
|
|
(g)
|
The prior period prime, including option ARMs have been revised. This revision had no impact on the Firm’s Consolidated balance sheets or its results of operations.
|
|
(h)
|
At
December 31, 2014
and
2013
, included mortgage loans insured by U.S. government agencies of
$12.1 billion
and
$13.7 billion
, respectively.
|
|
244
|
JPMorgan Chase & Co./2014 Annual Report
|
|
The following tables represent the Firm’s delinquency statistics for junior lien home equity loans and lines as of
December 31, 2014
and
2013
.
|
Delinquencies
|
Total 30+ day delinquency rate
|
||||||||||||||||||
|
December 31, 2014
|
30–89 days past due
|
90–149 days past due
|
150+ days
past due
|
Total loans
|
|||||||||||||||
|
(in millions, except ratios)
|
|||||||||||||||||||
|
HELOCs:
(a)
|
|||||||||||||||||||
|
Within the revolving period
(b)
|
$
|
233
|
|
$
|
69
|
|
$
|
141
|
|
$
|
25,252
|
|
1.75
|
%
|
|||||
|
Beyond the revolving period
|
108
|
|
37
|
|
107
|
|
7,979
|
|
3.16
|
|
|||||||||
|
HELOANs
|
66
|
|
20
|
|
19
|
|
3,144
|
|
3.34
|
|
|||||||||
|
Total
|
$
|
407
|
|
$
|
126
|
|
$
|
267
|
|
$
|
36,375
|
|
2.20
|
%
|
|||||
|
Delinquencies
|
Total 30+ day delinquency rate
|
||||||||||||||||||
|
December 31, 2013
|
30–89 days past due
|
90–149 days past due
|
150+ days
past due
|
Total loans
|
|||||||||||||||
|
(in millions, except ratios)
|
|||||||||||||||||||
|
HELOCs:
(a)
|
|||||||||||||||||||
|
Within the revolving period
(b)
|
$
|
341
|
|
$
|
104
|
|
$
|
162
|
|
$
|
31,848
|
|
1.91
|
%
|
|||||
|
Beyond the revolving period
|
84
|
|
21
|
|
46
|
|
4,980
|
|
3.03
|
|
|||||||||
|
HELOANs
|
86
|
|
26
|
|
16
|
|
3,922
|
|
3.26
|
|
|||||||||
|
Total
|
$
|
511
|
|
$
|
151
|
|
$
|
224
|
|
$
|
40,750
|
|
2.17
|
%
|
|||||
(a) These HELOCs are predominantly revolving loans for a
10
-year period, after which time the HELOC converts to a loan with a
20
-year amortization period, but also include HELOCs originated by Washington Mutual that require interest-only payments beyond the revolving period.
(b) The Firm manages the risk of HELOCs during their revolving period by closing or reducing the undrawn line to the extent permitted by law when borrowers are experiencing financial difficulty or when the collateral does not support the loan amount.
Home equity lines of credit (“HELOCs”) beyond the revolving period and home equity loans (“HELOANs”) have higher delinquency rates than do HELOCs within the revolving period. That is primarily because the fully-amortizing payment that is generally required for those products is higher than the minimum payment options
available for HELOCs within the revolving period. The higher delinquency rates associated with amortizing HELOCs and HELOANs are factored into the loss estimates produced by the Firm’s delinquency roll-rate methodology, which estimates defaults based on the current delinquency status of a portfolio.
|
JPMorgan Chase & Co./2014 Annual Report
|
245
|
|
Notes to consolidated financial statements
Impaired loans
The table below sets forth information about the Firm’s residential real estate impaired loans, excluding PCI loans. These loans are considered to be impaired as they have been modified in a TDR. All impaired loans are evaluated for an asset-specific allowance as described in Note 15.
|
Home equity
|
Mortgages
|
Total residential
real estate
– excluding PCI
|
||||||||||||||||||||||||||||||||
|
December 31,
(in millions)
|
Senior lien
|
Junior lien
|
Prime, including
option ARMs
|
Subprime
|
||||||||||||||||||||||||||||||
|
2014
|
2013
|
2014
|
2013
|
2014
|
2013
|
2014
|
2013
|
2014
|
2013
|
|||||||||||||||||||||||||
|
Impaired loans
|
||||||||||||||||||||||||||||||||||
|
With an allowance
|
$
|
552
|
|
$
|
567
|
|
$
|
722
|
|
$
|
727
|
|
$
|
4,949
|
|
$
|
5,871
|
|
$
|
2,239
|
|
$
|
2,989
|
|
$
|
8,462
|
|
$
|
10,154
|
|
||||
|
Without an allowance
(a)
|
549
|
|
579
|
|
582
|
|
592
|
|
1,196
|
|
1,133
|
|
639
|
|
709
|
|
2,966
|
|
3,013
|
|
||||||||||||||
|
Total impaired loans
(b)(c)
|
$
|
1,101
|
|
$
|
1,146
|
|
$
|
1,304
|
|
$
|
1,319
|
|
$
|
6,145
|
|
$
|
7,004
|
|
$
|
2,878
|
|
$
|
3,698
|
|
$
|
11,428
|
|
$
|
13,167
|
|
||||
|
Allowance for loan losses related to impaired loans
|
$
|
84
|
|
$
|
94
|
|
$
|
147
|
|
$
|
162
|
|
$
|
127
|
|
$
|
144
|
|
$
|
64
|
|
$
|
94
|
|
$
|
422
|
|
$
|
494
|
|
||||
|
Unpaid principal balance of impaired loans
(d)
|
1,451
|
|
1,515
|
|
2,603
|
|
2,625
|
|
7,813
|
|
8,990
|
|
4,200
|
|
5,461
|
|
16,067
|
|
18,591
|
|
||||||||||||||
|
Impaired loans on nonaccrual status
(e)
|
628
|
|
641
|
|
632
|
|
666
|
|
1,559
|
|
1,737
|
|
931
|
|
1,127
|
|
3,750
|
|
4,171
|
|
||||||||||||||
|
(a)
|
Represents collateral-dependent residential mortgage loans that are charged off to the fair value of the underlying collateral less cost to sell. The Firm reports, in accordance with regulatory guidance, residential real estate loans that have been discharged under Chapter 7 bankruptcy and not reaffirmed by the borrower (“Chapter 7 loans”) as collateral-dependent nonaccrual TDRs, regardless of their delinquency status. At
December 31, 2014
, Chapter 7 residential real estate loans included approximately
19%
of senior lien home equity,
12%
of junior lien home equity,
25%
of prime mortgages, including option ARMs, and
18%
of subprime mortgages that were
30 days
or more past due.
|
|
(b)
|
At
December 31, 2014
and
2013
,
$4.9 billion
and
$7.6 billion
, respectively, of loans modified subsequent to repurchase from Government National Mortgage Association (“Ginnie Mae”) in accordance with the standards of the appropriate government agency (i.e., FHA, VA, RHS) are not included in the table above. When such loans perform subsequent to modification in accordance with Ginnie Mae guidelines, they are generally sold back into Ginnie Mae loan pools. Modified loans that do not re-perform become subject to foreclosure.
|
|
(c)
|
Predominantly all residential real estate impaired loans, excluding PCI loans, are in the U.S.
|
|
(d)
|
Represents the contractual amount of principal owed at
December 31, 2014
and
2013
. The unpaid principal balance differs from the impaired loan balances due to various factors, including charge-offs, net deferred loan fees or costs; and unamortized discounts or premiums on purchased loans.
|
|
(e)
|
As of
December 31, 2014
and
2013
, nonaccrual loans included
$2.9 billion
and
$3.0 billion
, respectively, of TDRs for which the borrowers were less than
90 days
past due. For additional information about loans modified in a TDR that are on nonaccrual status refer to the Loan accounting framework on
pages 238–240
of this Note.
|
The following table presents average impaired loans and the related interest income reported by the Firm.
|
Year ended December 31,
|
Average impaired loans
|
Interest income on
impaired loans
(a)
|
Interest income on impaired
loans on a cash basis
(a)
|
||||||||||||||||||||||||||
|
(in millions)
|
2014
|
2013
|
2012
|
2014
|
2013
|
2012
|
2014
|
2013
|
2012
|
||||||||||||||||||||
|
Home equity
|
|||||||||||||||||||||||||||||
|
Senior lien
|
$
|
1,122
|
|
$
|
1,151
|
|
$
|
610
|
|
$
|
55
|
|
$
|
59
|
|
$
|
27
|
|
$
|
37
|
|
$
|
40
|
|
$
|
12
|
|
||
|
Junior lien
|
1,313
|
|
1,297
|
|
848
|
|
82
|
|
82
|
|
42
|
|
53
|
|
55
|
|
16
|
|
|||||||||||
|
Mortgages
|
|
|
|
||||||||||||||||||||||||||
|
Prime, including option ARMs
|
6,730
|
|
7,214
|
|
5,989
|
|
262
|
|
280
|
|
238
|
|
54
|
|
59
|
|
28
|
|
|||||||||||
|
Subprime
|
3,444
|
|
3,798
|
|
3,494
|
|
182
|
|
200
|
|
183
|
|
51
|
|
55
|
|
31
|
|
|||||||||||
|
Total residential real estate – excluding PCI
|
$
|
12,609
|
|
$
|
13,460
|
|
$
|
10,941
|
|
$
|
581
|
|
$
|
621
|
|
$
|
490
|
|
$
|
195
|
|
$
|
209
|
|
$
|
87
|
|
||
|
(a)
|
Generally, interest income on loans modified in TDRs is recognized on a cash basis until such time as the borrower has made a minimum of
six
payments under the new terms.
|
|
246
|
JPMorgan Chase & Co./2014 Annual Report
|
|
Loan modifications
The Firm is required to provide borrower relief under the terms of certain Consent Orders and settlements entered into by the Firm related to its mortgage servicing, originations and residential mortgage-backed securities activities. This borrower relief includes reductions of principal and forbearance.
Modifications of residential real estate loans, excluding PCI loans, are generally accounted for and reported as TDRs. There were no additional commitments to lend to borrowers whose residential real estate loans, excluding PCI loans, have been modified in TDRs.
The following table presents new TDRs reported by the Firm.
|
Year ended December 31,
(in millions) |
2014
|
2013
|
2012
|
||||||
|
Home equity:
|
|||||||||
|
Senior lien
|
$
|
110
|
|
$
|
210
|
|
$
|
835
|
|
|
Junior lien
|
211
|
|
388
|
|
711
|
|
|||
|
Mortgages:
|
|||||||||
|
Prime, including option ARMs
|
287
|
|
770
|
|
2,918
|
|
|||
|
Subprime
|
124
|
|
319
|
|
1,043
|
|
|||
|
Total residential real estate – excluding PCI
|
$
|
732
|
|
$
|
1,687
|
|
$
|
5,507
|
|
Nature and extent of modifications
Making Home Affordable (“MHA”), as well as the Firm’s proprietary modification programs, generally provide various concessions to financially troubled borrowers including, but not limited to, interest rate reductions, term or payment extensions and deferral of principal and/or interest payments that would otherwise have been required under the terms of the original agreement.
The following table provides information about how residential real estate loans, excluding PCI loans, were modified under the Firm’s loss mitigation programs during the periods presented. This table excludes Chapter 7 loans where the sole concession granted is the discharge of debt.
|
Year ended Dec. 31,
|
Home equity
|
Mortgages
|
Total residential real estate
- excluding PCI
|
|||||||||||||||||||||||||||||||
|
Senior lien
|
Junior lien
|
Prime, including
option ARMs
|
Subprime
|
|||||||||||||||||||||||||||||||
|
2014
|
2013
|
2012
|
2014
|
2013
|
2012
|
2014
|
2013
|
2012
|
2014
|
2013
|
2012
|
2014
|
2013
|
2012
|
||||||||||||||||||||
|
Number
of loans approved
for a trial modification
|
939
|
|
1,719
|
|
1,695
|
|
626
|
|
884
|
|
918
|
|
1,052
|
|
2,846
|
|
3,895
|
|
2,056
|
|
4,233
|
|
4,841
|
|
4,673
|
|
9,682
|
|
11,349
|
|
||||
|
Number
of loans permanently modified
|
1,171
|
|
1,765
|
|
4,385
|
|
2,813
|
|
5,040
|
|
7,430
|
|
2,507
|
|
4,356
|
|
9,043
|
|
3,141
|
|
5,364
|
|
9,964
|
|
9,632
|
|
16,525
|
|
30,822
|
|
||||
|
Concession granted:
(a)
|
||||||||||||||||||||||||||||||||||
|
Interest rate reduction
|
53
|
%
|
70
|
%
|
83
|
%
|
84
|
%
|
88
|
%
|
88
|
%
|
43
|
%
|
73
|
%
|
74
|
%
|
47
|
%
|
72
|
%
|
69
|
%
|
58
|
%
|
77
|
%
|
77
|
%
|
||||
|
Term or payment extension
|
67
|
|
76
|
|
47
|
|
83
|
|
80
|
|
76
|
|
51
|
|
73
|
|
57
|
|
53
|
|
56
|
|
41
|
|
63
|
|
70
|
|
55
|
|
||||
|
Principal and/or interest deferred
|
16
|
|
12
|
|
6
|
|
23
|
|
24
|
|
17
|
|
19
|
|
30
|
|
16
|
|
12
|
|
13
|
|
7
|
|
18
|
|
21
|
|
12
|
|
||||
|
Principal forgiveness
|
36
|
|
38
|
|
11
|
|
22
|
|
32
|
|
23
|
|
51
|
|
38
|
|
29
|
|
53
|
|
48
|
|
42
|
|
41
|
|
39
|
|
29
|
|
||||
|
Other
(b)
|
—
|
|
—
|
|
—
|
|
—
|
|
—
|
|
—
|
|
10
|
|
23
|
|
29
|
|
10
|
|
14
|
|
8
|
|
6
|
|
11
|
|
11
|
|
||||
|
(a)
|
Represents concessions granted in permanent modifications as a percentage of the number of loans permanently modified. The sum of the percentages exceeds
100%
because predominantly all of the modifications include more than one type of concession. A significant portion of trial modifications include interest rate reductions and/or term or payment extensions.
|
|
(b)
|
Represents variable interest rate to fixed interest rate modifications.
|
|
JPMorgan Chase & Co./2014 Annual Report
|
247
|
|
Notes to consolidated financial statements
Financial effects of modifications and redefaults
The following table provides information about the financial effects of the various concessions granted in modifications of residential real estate loans, excluding PCI, under the Firm’s loss mitigation programs and about redefaults of certain loans modified in TDRs for the periods presented. Because the specific types and amounts of concessions offered to borrowers frequently change between the trial modification and the permanent modification, the following table presents only the financial effects of permanent modifications. This table also excludes Chapter 7 loans where the sole concession granted is the discharge of debt.
|
Year ended
December 31,
(in millions, except weighted-average data and number of loans) |
Home equity
|
Mortgages
|
Total residential real estate – excluding PCI
|
||||||||||||||||||||||||||||||||||||||||||||||
|
Senior lien
|
Junior lien
|
Prime, including
option ARMs
|
Subprime
|
||||||||||||||||||||||||||||||||||||||||||||||
|
2014
|
2013
|
2012
|
2014
|
2013
|
2012
|
2014
|
2013
|
2012
|
2014
|
2013
|
2012
|
2014
|
2013
|
2012
|
|||||||||||||||||||||||||||||||||||
|
Weighted-average interest rate of loans with interest rate reductions – before TDR
|
6.38
|
%
|
6.35
|
%
|
7.20
|
%
|
4.81
|
%
|
5.05
|
%
|
5.45
|
%
|
4.82
|
%
|
5.28
|
%
|
6.14
|
%
|
7.16
|
%
|
7.33
|
%
|
7.73
|
%
|
5.61
|
%
|
5.88
|
%
|
6.57
|
%
|
|||||||||||||||||||
|
Weighted-average interest rate of loans with interest rate reductions – after TDR
|
3.03
|
|
3.23
|
|
4.61
|
|
2.00
|
|
2.14
|
|
1.94
|
|
2.69
|
|
2.77
|
|
3.67
|
|
3.37
|
|
3.52
|
|
4.14
|
|
2.78
|
|
2.92
|
|
3.69
|
|
|||||||||||||||||||
|
Weighted-average remaining contractual term (in years) of loans with term or payment extensions – before TDR
|
17
|
|
19
|
|
18
|
|
19
|
|
20
|
|
20
|
|
25
|
|
25
|
|
25
|
|
24
|
|
24
|
|
24
|
|
23
|
|
23
|
|
24
|
|
|||||||||||||||||||
|
Weighted-average remaining contractual term (in years) of loans with term or payment extensions – after TDR
|
30
|
|
31
|
|
28
|
|
35
|
|
34
|
|
32
|
|
37
|
|
37
|
|
36
|
|
36
|
|
35
|
|
32
|
|
36
|
|
36
|
|
34
|
|
|||||||||||||||||||
|
Charge-offs recognized upon permanent modification
|
$
|
2
|
|
$
|
7
|
|
$
|
8
|
|
$
|
25
|
|
$
|
70
|
|
$
|
65
|
|
$
|
9
|
|
$
|
16
|
|
$
|
35
|
|
$
|
3
|
|
$
|
5
|
|
$
|
29
|
|
$
|
39
|
|
$
|
98
|
|
$
|
137
|
|
||||
|
Principal deferred
|
5
|
|
7
|
|
4
|
|
11
|
|
24
|
|
23
|
|
39
|
|
129
|
|
133
|
|
19
|
|
43
|
|
43
|
|
74
|
|
203
|
|
203
|
|
|||||||||||||||||||
|
Principal forgiven
|
14
|
|
30
|
|
20
|
|
21
|
|
51
|
|
58
|
|
83
|
|
206
|
|
249
|
|
89
|
|
218
|
|
324
|
|
207
|
|
505
|
|
651
|
|
|||||||||||||||||||
|
Balance of loans that redefaulted within one year of permanent modification
(a)
|
$
|
19
|
|
$
|
26
|
|
$
|
30
|
|
$
|
10
|
|
$
|
20
|
|
$
|
46
|
|
$
|
121
|
|
$
|
164
|
|
$
|
255
|
|
$
|
93
|
|
$
|
106
|
|
$
|
156
|
|
$
|
243
|
|
$
|
316
|
|
$
|
487
|
|
||||
|
(a)
|
Represents loans permanently modified in TDRs that experienced a payment default in the periods presented, and for which the payment default occurred within
one year
of the modification. The dollar amounts presented represent the balance of such loans at the end of the reporting period in which such loans defaulted. For residential real estate loans modified in TDRs, payment default is deemed to occur when the loan becomes
two
contractual payments past due. In the event that a modified loan redefaults, it is probable that the loan will ultimately be liquidated through foreclosure or another similar type of liquidation transaction. Redefaults of loans modified within the last
12 months
may not be representative of ultimate redefault levels.
|
At
December 31, 2014
, the weighted-average estimated remaining lives of residential real estate loans, excluding PCI loans, permanently modified in TDRs were
6
years for senior lien home equity,
8
years for junior lien home equity,
9
years for prime mortgages, including option ARMs, and
8
years for subprime mortgage. The estimated remaining lives of these loans reflect estimated prepayments, both voluntary and involuntary (i.e., foreclosures and other forced liquidations).
Active and suspended foreclosure
At
December 31, 2014
and
2013
, the Firm had non-PCI residential real estate loans, excluding those insured by U.S. government agencies, with a carrying value of
$1.5 billion
and
$2.1 billion
, respectively, that were not included in REO, but were in the process of active or suspended foreclosure.
|
248
|
JPMorgan Chase & Co./2014 Annual Report
|
|
Other consumer loans
The table below provides information for other consumer retained loan classes, including auto, business banking and student loans.
|
December 31,
(in millions, except ratios)
|
Auto
|
Business banking
|
Student and other
|
Total other consumer
|
|||||||||||||||||||||||||||
|
2014
|
2013
|
2014
|
2013
|
2014
|
2013
|
2014
|
2013
|
||||||||||||||||||||||||
|
Loan delinquency
(a)
|
|||||||||||||||||||||||||||||||
|
Current
|
$
|
53,866
|
|
$
|
52,152
|
|
$
|
19,710
|
|
$
|
18,511
|
|
$
|
10,080
|
|
$
|
10,529
|
|
$
|
83,656
|
|
$
|
81,192
|
|
|||||||
|
30–119 days past due
|
663
|
|
599
|
|
208
|
|
280
|
|
576
|
|
660
|
|
1,447
|
|
1,539
|
|
|||||||||||||||
|
120 or more days past due
|
7
|
|
6
|
|
140
|
|
160
|
|
314
|
|
368
|
|
461
|
|
534
|
|
|||||||||||||||
|
Total retained loans
|
$
|
54,536
|
|
$
|
52,757
|
|
$
|
20,058
|
|
$
|
18,951
|
|
$
|
10,970
|
|
$
|
11,557
|
|
$
|
85,564
|
|
$
|
83,265
|
|
|||||||
|
% of 30+ days past due to total retained loans
|
1.23
|
%
|
1.15
|
%
|
1.73
|
%
|
2.32
|
%
|
2.15
|
%
|
(d)
|
2.52
|
%
|
(d)
|
1.47
|
%
|
(d)
|
1.60
|
%
|
(d)
|
|||||||||||
|
90 or more days past due and still accruing
(b)
|
$
|
—
|
|
$
|
—
|
|
$
|
—
|
|
$
|
—
|
|
$
|
367
|
|
$
|
428
|
|
$
|
367
|
|
$
|
428
|
|
|||||||
|
Nonaccrual loans
|
115
|
|
161
|
|
279
|
|
385
|
|
270
|
|
86
|
|
664
|
|
632
|
|
|||||||||||||||
|
Geographic region
|
|||||||||||||||||||||||||||||||
|
California
|
$
|
6,294
|
|
$
|
5,615
|
|
$
|
3,008
|
|
$
|
2,374
|
|
$
|
1,143
|
|
$
|
1,112
|
|
$
|
10,445
|
|
$
|
9,101
|
|
|||||||
|
New York
|
3,662
|
|
3,898
|
|
3,187
|
|
3,084
|
|
1,259
|
|
1,218
|
|
8,108
|
|
8,200
|
|
|||||||||||||||
|
Illinois
|
3,175
|
|
2,917
|
|
1,373
|
|
1,341
|
|
729
|
|
740
|
|
5,277
|
|
4,998
|
|
|||||||||||||||
|
Florida
|
2,301
|
|
2,012
|
|
827
|
|
646
|
|
521
|
|
539
|
|
3,649
|
|
3,197
|
|
|||||||||||||||
|
Texas
|
5,608
|
|
5,310
|
|
2,626
|
|
2,646
|
|
868
|
|
878
|
|
9,102
|
|
8,834
|
|
|||||||||||||||
|
New Jersey
|
1,945
|
|
2,014
|
|
451
|
|
392
|
|
378
|
|
397
|
|
2,774
|
|
2,803
|
|
|||||||||||||||
|
Arizona
|
2,003
|
|
1,855
|
|
1,083
|
|
1,046
|
|
239
|
|
252
|
|
3,325
|
|
3,153
|
|
|||||||||||||||
|
Washington
|
1,019
|
|
950
|
|
258
|
|
234
|
|
235
|
|
227
|
|
1,512
|
|
1,411
|
|
|||||||||||||||
|
Michigan
|
1,633
|
|
1,902
|
|
1,375
|
|
1,383
|
|
466
|
|
513
|
|
3,474
|
|
3,798
|
|
|||||||||||||||
|
Ohio
|
2,157
|
|
2,229
|
|
1,354
|
|
1,316
|
|
629
|
|
708
|
|
4,140
|
|
4,253
|
|
|||||||||||||||
|
All other
|
24,739
|
|
24,055
|
|
4,516
|
|
4,489
|
|
4,503
|
|
4,973
|
|
33,758
|
|
33,517
|
|
|||||||||||||||
|
Total retained loans
|
$
|
54,536
|
|
$
|
52,757
|
|
$
|
20,058
|
|
$
|
18,951
|
|
$
|
10,970
|
|
$
|
11,557
|
|
$
|
85,564
|
|
$
|
83,265
|
|
|||||||
|
Loans by risk ratings
(c)
|
|||||||||||||||||||||||||||||||
|
Noncriticized
|
$
|
9,822
|
|
$
|
9,968
|
|
$
|
14,619
|
|
$
|
13,622
|
|
NA
|
|
NA
|
|
$
|
24,441
|
|
$
|
23,590
|
|
|||||||||
|
Criticized performing
|
35
|
|
54
|
|
708
|
|
711
|
|
NA
|
|
NA
|
|
743
|
|
765
|
|
|||||||||||||||
|
Criticized nonaccrual
|
—
|
|
38
|
|
213
|
|
316
|
|
NA
|
|
NA
|
|
213
|
|
354
|
|
|||||||||||||||
|
(a)
|
Individual delinquency classifications included loans insured by U.S. government agencies under the Federal Family Education Loan Program (“FFELP”) as follows: current included
$4.3 billion
and
$4.9 billion
;
30
-
119 days
past due included
$364 million
and
$387 million
; and
120
or more days past due included
$290 million
and
$350 million
at
December 31, 2014
and
2013
, respectively.
|
|
(b)
|
These amounts represent student loans, which are insured by U.S. government agencies under the FFELP. These amounts were accruing as reimbursement of insured amounts is proceeding normally.
|
|
(c)
|
For risk-rated business banking and auto loans, the primary credit quality indicator is the risk rating of the loan, including whether the loans are considered to be criticized and/or nonaccrual.
|
|
(d)
|
December 31, 2014
and
2013
, excluded loans
30 days
or more past due and still accruing, which are insured by U.S. government agencies under the FFELP, of
$654 million
and
$737 million
, respectively. These amounts were excluded as reimbursement of insured amounts is proceeding normally.
|
|
JPMorgan Chase & Co./2014 Annual Report
|
249
|
|
Notes to consolidated financial statements
Other consumer impaired loans and loan modifications
The table below sets forth information about the Firm’s other consumer impaired loans, including risk-rated business banking and auto loans that have been placed on nonaccrual status, and loans that have been modified in TDRs.
|
December 31,
(in millions)
|
2014
|
2013
|
||||
|
Impaired loans
|
||||||
|
With an allowance
|
$
|
557
|
|
$
|
571
|
|
|
Without an allowance
(a)
|
35
|
|
47
|
|
||
|
Total impaired loans
(b)(c)
|
$
|
592
|
|
$
|
618
|
|
|
Allowance for loan losses related to impaired loans
|
$
|
117
|
|
$
|
107
|
|
|
Unpaid principal balance of impaired loans
(d)
|
719
|
|
788
|
|
||
|
Impaired loans on nonaccrual status
|
456
|
|
441
|
|
||
|
(a)
|
When discounted cash flows, collateral value or market price equals or exceeds the recorded investment in the loan, the loan does not require an allowance. This typically occurs when the impaired loans have been partially charged off and/or there have been interest payments received and applied to the loan balance.
|
|
(b)
|
Predominantly all other consumer impaired loans are in the U.S.
|
|
(c)
|
Other consumer average impaired loans were
$599 million
,
$648 million
and
$733 million
for the years ended
December 31, 2014
,
2013
and
2012
, respectively. The related interest income on impaired loans, including those on a cash basis, was not material for the years ended
December 31, 2014
,
2013
and
2012
.
|
|
(d)
|
Represents the contractual amount of principal owed at
December 31, 2014
and
2013
. The unpaid principal balance differs from the impaired loan balances due to various factors, including charge-offs; interest payments received and applied to the principal balance; net deferred loan fees or costs; and unamortized discounts or premiums on purchased loans.
|
Loan modifications
The following table provides information about the Firm’s other consumer loans modified in TDRs. All of these TDRs are reported as impaired loans in the tables above.
|
December 31,
(in millions) |
2014
|
2013
|
||||
|
Loans modified in troubled debt restructurings
(a)(b)
|
$
|
442
|
|
$
|
378
|
|
|
TDRs on nonaccrual status
|
306
|
|
201
|
|
||
|
(a)
|
The impact of these modifications was not material to the Firm for the years ended
December 31, 2014
and
2013
.
|
|
(b)
|
Additional commitments to lend to borrowers whose loans have been modified in TDRs as of
December 31, 2014
and
2013
were immaterial.
|
Other consumer new TDRs were
$291 million
,
$156 million
, and
$249 million
for the years ended
December 31, 2014
,
2013
and
2012
, respectively.
Financial effects of modifications and redefaults
For auto loans, TDRs typically occur in connection with the bankruptcy of the borrower. In these cases, the loan is modified with a revised repayment plan that typically incorporates interest rate reductions and, to a lesser extent, principal forgiveness.
For business banking loans, concessions are dependent on individual borrower circumstances and can be of a short-term nature for borrowers who need temporary relief or longer term for borrowers experiencing more fundamental financial difficulties. Concessions are predominantly term or payment extensions, but also may include interest rate reductions.
The balance of business banking loans modified in TDRs that experienced a payment default, and for which the payment default occurred within
one year
of the modification, was
$25 million
,
$43 million
and
$42 million
, during the years ended
December 31, 2014
,
2013
and
2012
, respectively. The balance of auto loans modified in TDRs that experienced a payment default, and for which the payment default occurred within
one year
of the modification, was
$43 million
,
$54 million
, and
$46 million
, during the years ended
December 31, 2014
,
2013
, and
2012
, respectively. A payment default is deemed to occur as follows: (1) for scored auto and business banking loans, when the loan is
two
payments past due; and (2) for risk-rated business banking loans and auto loans, when the borrower has not made a loan payment by its scheduled due date after giving effect to the contractual grace period, if any.
In May 2014 the Firm began extending the deferment period for up to
24 months
for certain student loans, which resulted in extending the maturity of the loans at their original contractual interest rates. These modified loans are considered TDRs and placed on nonaccrual status.
|
250
|
JPMorgan Chase & Co./2014 Annual Report
|
|
Purchased credit-impaired loans
PCI loans are initially recorded at fair value at acquisition. PCI loans acquired in the same fiscal quarter may be aggregated into one or more pools, provided that the loans have common risk characteristics. A pool is then accounted for as a single asset with a single composite interest rate and an aggregate expectation of cash flows. With respect to the Washington Mutual transaction, all of the consumer PCI loans were aggregated into pools of loans with common risk characteristics.
On a quarterly basis, the Firm estimates the total cash flows (both principal and interest) expected to be collected over the remaining life of each pool. These estimates incorporate assumptions regarding default rates, loss severities, the amounts and timing of prepayments and other factors that reflect then-current market conditions. Probable decreases in expected cash flows (i.e., increased credit losses) trigger the recognition of impairment, which is then measured as the present value of the expected principal loss plus any related foregone interest cash flows, discounted at the pool’s effective interest rate. Impairments are recognized through the provision for credit losses and an increase in the allowance for loan losses. Probable and significant increases in expected cash flows (e.g., decreased credit losses, the net benefit of modifications) would first reverse any previously recorded allowance for loan losses with any remaining increases recognized prospectively as a yield adjustment over the remaining estimated lives of the underlying loans. The impacts of (i) prepayments, (ii) changes in variable interest rates, and (iii) any other changes in the timing of expected cash flows are recognized prospectively as adjustments to interest income.
The Firm continues to modify certain PCI loans. The impact of these modifications is incorporated into the Firm’s quarterly assessment of whether a probable and significant change in expected cash flows has occurred, and the loans continue to be accounted for and reported as PCI loans. In evaluating the effect of modifications on expected cash flows, the Firm incorporates the effect of any foregone interest and also considers the potential for redefault. The Firm develops product-specific probability of default estimates, which are used to compute expected credit losses. In developing these probabilities of default, the Firm considers the relationship between the credit quality characteristics of the underlying loans and certain assumptions about home prices and unemployment based upon industry-wide data. The Firm also considers its own historical loss experience to-date based on actual redefaulted modified PCI loans.
The excess of cash flows expected to be collected over the carrying value of the underlying loans is referred to as the accretable yield. This amount is not reported on the Firm’s Consolidated balance sheets but is accreted into interest income at a level rate of return over the remaining estimated lives of the underlying pools of loans.
If the timing and/or amounts of expected cash flows on PCI loans were determined not to be reasonably estimable, no interest would be accreted and the loans would be reported as nonaccrual loans; however, since the timing and amounts of expected cash flows for the Firm’s PCI consumer loans are reasonably estimable, interest is being accreted and the loans are being reported as performing loans.
The liquidation of PCI loans, which may include sales of loans, receipt of payment in full by the borrower, or foreclosure, results in removal of the loans from the underlying PCI pool. When the amount of the liquidation proceeds (e.g., cash, real estate), if any, is less than the unpaid principal balance of the loan, the difference is first applied against the PCI pool’s nonaccretable difference for principal losses (i.e., the lifetime credit loss estimate established as a purchase accounting adjustment at the acquisition date). When the nonaccretable difference for a particular loan pool has been fully depleted, any excess of the unpaid principal balance of the loan over the liquidation proceeds is written off against the PCI pool’s allowance for loan losses. Beginning in the fourth quarter of 2014, write-offs of PCI loans also include other adjustments, primarily related to interest forgiveness modifications. Because the Firm’s PCI loans are accounted for at a pool level, the Firm does not recognize charge-offs of PCI loans when they reach specified stages of delinquency (i.e., unlike non-PCI consumer loans, these loans are not charged off based on FFIEC standards).
The PCI portfolio affects the Firm’s results of operations primarily through: (i) contribution to net interest margin; (ii) expense related to defaults and servicing resulting from the liquidation of the loans; and (iii) any provision for loan losses. The PCI loans acquired in the Washington Mutual transaction were funded based on the interest rate characteristics of the loans. For example, variable-rate loans were funded with variable-rate liabilities and fixed-rate loans were funded with fixed-rate liabilities with a similar maturity profile. A net spread will be earned on the declining balance of the portfolio, which is estimated as of
December 31, 2014
, to have a remaining weighted-average life of
8 years
.
|
JPMorgan Chase & Co./2014 Annual Report
|
251
|
|
Notes to consolidated financial statements
Residential real estate – PCI loans
The table below sets forth information about the Firm’s consumer, excluding credit card, PCI loans.
|
December 31,
(in millions, except ratios)
|
Home equity
|
Prime mortgage
|
Subprime mortgage
|
Option ARMs
|
Total PCI
|
|||||||||||||||||||||||||||||
|
2014
|
2013
|
2014
|
2013
|
2014
|
2013
|
2014
|
2013
|
2014
|
2013
|
|||||||||||||||||||||||||
|
Carrying value
(a)
|
$
|
17,095
|
|
$
|
18,927
|
|
$
|
10,220
|
|
$
|
12,038
|
|
$
|
3,673
|
|
$
|
4,175
|
|
$
|
15,708
|
|
$
|
17,915
|
|
$
|
46,696
|
|
$
|
53,055
|
|
||||
|
Related allowance for loan losses
(b)
|
1,758
|
|
1,758
|
|
1,193
|
|
1,726
|
|
180
|
|
180
|
|
194
|
|
494
|
|
3,325
|
|
4,158
|
|
||||||||||||||
|
Loan delinquency (based on unpaid principal balance)
|
||||||||||||||||||||||||||||||||||
|
Current
|
$
|
16,295
|
|
$
|
18,135
|
|
$
|
8,912
|
|
$
|
10,118
|
|
$
|
3,565
|
|
$
|
4,012
|
|
$
|
13,814
|
|
$
|
15,501
|
|
$
|
42,586
|
|
$
|
47,766
|
|
||||
|
30–149 days past due
|
445
|
|
583
|
|
500
|
|
589
|
|
536
|
|
662
|
|
858
|
|
1,006
|
|
2,339
|
|
2,840
|
|
||||||||||||||
|
150 or more days past due
|
1,000
|
|
1,112
|
|
837
|
|
1,169
|
|
551
|
|
797
|
|
1,824
|
|
2,716
|
|
4,212
|
|
5,794
|
|
||||||||||||||
|
Total loans
|
$
|
17,740
|
|
$
|
19,830
|
|
$
|
10,249
|
|
$
|
11,876
|
|
$
|
4,652
|
|
$
|
5,471
|
|
$
|
16,496
|
|
$
|
19,223
|
|
$
|
49,137
|
|
$
|
56,400
|
|
||||
|
% of 30+ days past due to total loans
|
8.15
|
%
|
8.55
|
%
|
13.05
|
%
|
14.80
|
%
|
23.37
|
%
|
26.67
|
%
|
16.26
|
%
|
19.36
|
%
|
13.33
|
%
|
15.31
|
%
|
||||||||||||||
|
Current estimated LTV ratios (based on unpaid principal balance)
(c)(d)
|
||||||||||||||||||||||||||||||||||
|
Greater than 125% and refreshed FICO scores:
|
||||||||||||||||||||||||||||||||||
|
Equal to or greater than 660
|
$
|
513
|
|
$
|
1,168
|
|
$
|
45
|
|
$
|
240
|
|
$
|
34
|
|
$
|
115
|
|
$
|
89
|
|
$
|
301
|
|
$
|
681
|
|
$
|
1,824
|
|
||||
|
Less than 660
|
273
|
|
662
|
|
97
|
|
290
|
|
160
|
|
459
|
|
150
|
|
575
|
|
680
|
|
1,986
|
|
||||||||||||||
|
101% to 125% and refreshed FICO scores:
|
||||||||||||||||||||||||||||||||||
|
Equal to or greater than 660
|
2,245
|
|
3,248
|
|
456
|
|
1,017
|
|
215
|
|
316
|
|
575
|
|
1,164
|
|
3,491
|
|
5,745
|
|
||||||||||||||
|
Less than 660
|
1,073
|
|
1,541
|
|
402
|
|
884
|
|
509
|
|
919
|
|
771
|
|
1,563
|
|
2,755
|
|
4,907
|
|
||||||||||||||
|
80% to 100% and refreshed FICO scores:
|
||||||||||||||||||||||||||||||||||
|
Equal to or greater than 660
|
4,171
|
|
4,473
|
|
2,154
|
|
2,787
|
|
519
|
|
544
|
|
2,418
|
|
3,311
|
|
9,262
|
|
11,115
|
|
||||||||||||||
|
Less than 660
|
1,647
|
|
1,782
|
|
1,316
|
|
1,699
|
|
1,006
|
|
1,197
|
|
1,996
|
|
2,769
|
|
5,965
|
|
7,447
|
|
||||||||||||||
|
Lower than 80% and refreshed FICO scores:
|
||||||||||||||||||||||||||||||||||
|
Equal to or greater than 660
|
5,824
|
|
5,077
|
|
3,663
|
|
2,897
|
|
719
|
|
521
|
|
6,593
|
|
5,671
|
|
16,799
|
|
14,166
|
|
||||||||||||||
|
Less than 660
|
1,994
|
|
1,879
|
|
2,116
|
|
2,062
|
|
1,490
|
|
1,400
|
|
3,904
|
|
3,869
|
|
9,504
|
|
9,210
|
|
||||||||||||||
|
Total unpaid principal balance
|
$
|
17,740
|
|
$
|
19,830
|
|
$
|
10,249
|
|
$
|
11,876
|
|
$
|
4,652
|
|
$
|
5,471
|
|
$
|
16,496
|
|
$
|
19,223
|
|
$
|
49,137
|
|
$
|
56,400
|
|
||||
|
Geographic region (based on unpaid principal balance)
|
||||||||||||||||||||||||||||||||||
|
California
|
$
|
10,671
|
|
$
|
11,937
|
|
$
|
5,965
|
|
$
|
6,845
|
|
$
|
1,138
|
|
$
|
1,293
|
|
$
|
9,190
|
|
$
|
10,419
|
|
$
|
26,964
|
|
$
|
30,494
|
|
||||
|
New York
|
876
|
|
962
|
|
672
|
|
807
|
|
463
|
|
563
|
|
933
|
|
1,196
|
|
2,944
|
|
3,528
|
|
||||||||||||||
|
Illinois
|
405
|
|
451
|
|
301
|
|
353
|
|
229
|
|
283
|
|
397
|
|
481
|
|
1,332
|
|
1,568
|
|
||||||||||||||
|
Florida
|
1,696
|
|
1,865
|
|
689
|
|
826
|
|
432
|
|
526
|
|
1,440
|
|
1,817
|
|
4,257
|
|
5,034
|
|
||||||||||||||
|
Texas
|
273
|
|
327
|
|
92
|
|
106
|
|
281
|
|
328
|
|
85
|
|
100
|
|
731
|
|
861
|
|
||||||||||||||
|
New Jersey
|
348
|
|
381
|
|
279
|
|
334
|
|
165
|
|
213
|
|
553
|
|
701
|
|
1,345
|
|
1,629
|
|
||||||||||||||
|
Arizona
|
323
|
|
361
|
|
167
|
|
187
|
|
85
|
|
95
|
|
227
|
|
264
|
|
802
|
|
907
|
|
||||||||||||||
|
Washington
|
959
|
|
1,072
|
|
225
|
|
266
|
|
95
|
|
112
|
|
395
|
|
463
|
|
1,674
|
|
1,913
|
|
||||||||||||||
|
Michigan
|
53
|
|
62
|
|
166
|
|
189
|
|
130
|
|
145
|
|
182
|
|
206
|
|
531
|
|
602
|
|
||||||||||||||
|
Ohio
|
20
|
|
23
|
|
48
|
|
55
|
|
72
|
|
84
|
|
69
|
|
75
|
|
209
|
|
237
|
|
||||||||||||||
|
All other
|
2,116
|
|
2,389
|
|
1,645
|
|
1,908
|
|
1,562
|
|
1,829
|
|
3,025
|
|
3,501
|
|
8,348
|
|
9,627
|
|
||||||||||||||
|
Total unpaid principal balance
|
$
|
17,740
|
|
$
|
19,830
|
|
$
|
10,249
|
|
$
|
11,876
|
|
$
|
4,652
|
|
$
|
5,471
|
|
$
|
16,496
|
|
$
|
19,223
|
|
$
|
49,137
|
|
$
|
56,400
|
|
||||
|
(a)
|
Carrying value includes the effect of fair value adjustments that were applied to the consumer PCI portfolio at the date of acquisition.
|
|
(b)
|
Management concluded as part of the Firm’s regular assessment of the PCI loan pools that it was probable that higher expected credit losses would result in a decrease in expected cash flows. As a result, an allowance for loan losses for impairment of these pools has been recognized.
|
|
(c)
|
Represents the aggregate unpaid principal balance of loans divided by the estimated current property value. Current property values are estimated, at a minimum, quarterly, based on home valuation models using nationally recognized home price index valuation estimates incorporating actual data to the extent available and forecasted data where actual data is not available. These property values do not represent actual appraised loan level collateral values; as such, the resulting ratios are necessarily imprecise and should be viewed as estimates. Current estimated combined LTV for junior lien home equity loans considers all available lien positions, as well as unused lines, related to the property.
|
|
(d)
|
Refreshed FICO scores represent each borrower’s most recent credit score, which is obtained by the Firm on at least a quarterly basis.
|
|
252
|
JPMorgan Chase & Co./2014 Annual Report
|
|
Approximately
20%
of the PCI home equity portfolio are senior lien loans; the remaining balance are junior lien HELOANs or HELOCs. The following tables set forth delinquency statistics for PCI junior lien home equity loans and lines of credit based on unpaid principal balance as of
December 31, 2014
and
2013
.
|
Delinquencies
|
Total 30+ day delinquency rate
|
||||||||||||||||||
|
December 31, 2014
|
30–89 days past due
|
90–149 days past due
|
150+ days
past due
|
Total loans
|
|||||||||||||||
|
(in millions, except ratios)
|
|||||||||||||||||||
|
HELOCs:
(a)
|
|||||||||||||||||||
|
Within the revolving period
(b)
|
$
|
155
|
|
$
|
50
|
|
$
|
371
|
|
$
|
8,972
|
|
6.42
|
%
|
|||||
|
Beyond the revolving period
(c)
|
76
|
|
24
|
|
166
|
|
4,143
|
|
6.42
|
|
|||||||||
|
HELOANs
|
20
|
|
7
|
|
38
|
|
736
|
|
8.83
|
|
|||||||||
|
Total
|
$
|
251
|
|
$
|
81
|
|
$
|
575
|
|
$
|
13,851
|
|
6.55
|
%
|
|||||
|
Delinquencies
|
Total 30+ day delinquency rate
|
||||||||||||||||||
|
December 31, 2013
|
30–89 days past due
|
90–149 days past due
|
150+ days
past due
|
Total loans
|
|||||||||||||||
|
(in millions, except ratios)
|
|||||||||||||||||||
|
HELOCs:
(a)
|
|||||||||||||||||||
|
Within the revolving period
(b)
|
$
|
243
|
|
$
|
88
|
|
$
|
526
|
|
$
|
12,670
|
|
6.76
|
%
|
|||||
|
Beyond the revolving period
(c)
|
54
|
|
21
|
|
82
|
|
2,336
|
|
6.72
|
|
|||||||||
|
HELOANs
|
24
|
|
11
|
|
39
|
|
908
|
|
8.15
|
|
|||||||||
|
Total
|
$
|
321
|
|
$
|
120
|
|
$
|
647
|
|
$
|
15,914
|
|
6.84
|
%
|
|||||
|
(a)
|
In general, these HELOCs are revolving loans for a
10
-year period, after which time the HELOC converts to an interest-only loan with a balloon payment at the end of the loan’s term.
|
|
(b)
|
Substantially all undrawn HELOCs within the revolving period have been closed.
|
|
(c)
|
Includes loans modified into fixed-rate amortizing loans.
|
The table below sets forth the accretable yield activity for the Firm’s PCI consumer loans for the years ended
December 31, 2014
,
2013
and
2012
, and represents the Firm’s estimate of gross interest income expected to be earned over the remaining life of the PCI loan portfolios. The table excludes the cost to fund the PCI portfolios, and therefore the accretable yield does not represent net interest income expected to be earned on these portfolios.
|
Year ended December 31,
(in millions, except ratios) |
Total PCI
|
||||||||||
|
2014
|
2013
|
2012
|
|||||||||
|
Beginning balance
|
$
|
16,167
|
|
$
|
18,457
|
|
$
|
19,072
|
|
||
|
Accretion into interest income
|
(1,934
|
)
|
(2,201
|
)
|
(2,491
|
)
|
|||||
|
Changes in interest rates on variable-rate loans
|
(174
|
)
|
(287
|
)
|
(449
|
)
|
|||||
|
Other changes in expected cash flows
(a)
|
533
|
|
198
|
|
2,325
|
|
|||||
|
Balance at December 31
|
$
|
14,592
|
|
$
|
16,167
|
|
$
|
18,457
|
|
||
|
Accretable yield percentage
|
4.19
|
%
|
4.31
|
%
|
4.38
|
%
|
|||||
|
(a)
|
Other changes in expected cash flows may vary from period to period as the Firm continues to refine its cash flow model and periodically updates model assumptions. For the year ended
December 31, 2014
, other changes in expected cash flows were driven by changes in prepayment assumptions. For the year ended
December 31, 2013
, other changes in expected cash flows were due to refining the expected interest cash flows on HELOCs with balloon payments, partially offset by changes in prepayment assumptions. For the year ended
December 31, 2012
, other changes in expected cash flows were principally driven by the impact of modifications, but also related to changes in prepayment assumptions.
|
The factors that most significantly affect estimates of gross cash flows expected to be collected, and accordingly the accretable yield balance, include: (i) changes in the benchmark interest rate indices for variable-rate products such as option ARM and home equity loans; and (ii) changes in prepayment assumptions.
Since the date of acquisition, the decrease in the accretable yield percentage has been primarily related to a decrease in interest rates on variable-rate loans and, to a lesser extent, extended loan liquidation periods. Certain events, such as extended or shortened loan liquidation periods, affect the timing of expected cash flows and the accretable yield percentage, but not the amount of cash expected to be received (i.e., the accretable yield balance). While extended
loan liquidation periods reduce the accretable yield percentage (because the same accretable yield balance is recognized against a higher-than-expected loan balance over a longer-than-expected period of time), shortened loan liquidation periods would have the opposite effect.
Active and suspended foreclosure
At
December 31, 2014
and
2013
, the Firm had PCI residential real estate loans with an unpaid principal balance of
$3.2 billion
and
$4.8 billion
, respectively, that were not included in REO, but were in the process of active or suspended foreclosure.
|
JPMorgan Chase & Co./2014 Annual Report
|
253
|
|
Notes to consolidated financial statements
Credit card loan portfolio
The credit card portfolio segment includes credit card loans originated and purchased by the Firm. Delinquency rates are the primary credit quality indicator for credit card loans as they provide an early warning that borrowers may be experiencing difficulties (
30 days
past due); information on those borrowers that have been delinquent for a longer period of time (
90 days
past due) is also considered. In addition to delinquency rates, the geographic distribution of the loans provides insight as to the credit quality of the portfolio based on the regional economy.
While the borrower’s credit score is another general indicator of credit quality, the Firm does not view credit scores as a primary indicator of credit quality because the borrower’s credit score tends to be a lagging indicator. However, the distribution of such scores provides a general indicator of credit quality trends within the portfolio. Refreshed FICO score information, which is obtained at least quarterly, for a statistically significant random sample of the credit card portfolio is indicated in the table below; FICO is considered to be the industry benchmark for credit scores.
The Firm generally originates new card accounts to prime consumer borrowers. However, certain cardholders’ FICO scores may decrease over time, depending on the performance of the cardholder and changes in credit score technology.
The table below sets forth information about the Firm’s credit card loans.
|
As of or for the year ended December 31,
(in millions, except ratios)
|
2014
|
2013
|
||||
|
Net charge-offs
|
$
|
3,429
|
|
$
|
3,879
|
|
|
% of net charge-offs to retained loans
|
2.75
|
%
|
3.14
|
%
|
||
|
Loan delinquency
|
||||||
|
Current and less than 30 days past due
and still accruing |
$
|
126,189
|
|
$
|
125,335
|
|
|
30–89 days past due and still accruing
|
943
|
|
1,108
|
|
||
|
90 or more days past due and still accruing
|
895
|
|
1,022
|
|
||
|
Nonaccrual loans
|
—
|
|
—
|
|
||
|
Total retained credit card loans
|
$
|
128,027
|
|
$
|
127,465
|
|
|
Loan delinquency ratios
|
||||||
|
% of 30+ days past due to total retained loans
|
1.44
|
%
|
1.67
|
%
|
||
|
% of 90+ days past due to total retained loans
|
0.70
|
|
0.80
|
|
||
|
Credit card loans by geographic region
|
||||||
|
California
|
$
|
17,940
|
|
$
|
17,194
|
|
|
Texas
|
11,088
|
|
10,400
|
|
||
|
New York
|
10,940
|
|
10,497
|
|
||
|
Illinois
|
7,497
|
|
7,412
|
|
||
|
Florida
|
7,398
|
|
7,178
|
|
||
|
New Jersey
|
5,750
|
|
5,554
|
|
||
|
Ohio
|
4,707
|
|
4,881
|
|
||
|
Pennsylvania
|
4,489
|
|
4,462
|
|
||
|
Michigan
|
3,552
|
|
3,618
|
|
||
|
Virginia
|
3,263
|
|
3,239
|
|
||
|
All other
|
51,403
|
|
53,030
|
|
||
|
Total retained credit card loans
|
$
|
128,027
|
|
$
|
127,465
|
|
|
Percentage of portfolio based on carrying value with estimated refreshed FICO scores
|
||||||
|
Equal to or greater than 660
|
85.7
|
%
|
85.1
|
%
|
||
|
Less than 660
|
14.3
|
|
14.9
|
|
||
|
254
|
JPMorgan Chase & Co./2014 Annual Report
|
|
Credit card impaired loans and loan modifications
The table below sets forth information about the Firm’s impaired credit card loans. All of these loans are considered to be impaired as they have been modified in TDRs.
|
December 31, (in millions)
|
2014
|
2013
|
||||
|
Impaired credit card loans with an allowance
(a)(b)
|
||||||
|
Credit card loans with modified payment terms
(c)
|
$
|
1,775
|
|
$
|
2,746
|
|
|
Modified credit card loans that have reverted to pre-modification payment terms
(d)
|
254
|
|
369
|
|
||
|
Total impaired credit card loans
(e)
|
$
|
2,029
|
|
$
|
3,115
|
|
|
Allowance for loan losses related to impaired credit card loans
|
$
|
500
|
|
$
|
971
|
|
|
(a)
|
The carrying value and the unpaid principal balance are the same for credit card impaired loans.
|
|
(b)
|
There were no impaired loans without an allowance.
|
|
(c)
|
Represents credit card loans outstanding to borrowers enrolled in a credit card modification program as of the date presented.
|
|
(d)
|
Represents credit card loans that were modified in TDRs but that have subsequently reverted back to the loans’ pre-modification payment terms. At
December 31, 2014
and
2013
,
$159 million
and
$226 million
, respectively, of loans have reverted back to the pre-modification payment terms of the loans due to noncompliance with the terms of the modified loans. The remaining
$95 million
and
$143 million
at
December 31, 2014
and
2013
, respectively, of these loans are to borrowers who have successfully completed a short-term modification program. The Firm continues to report these loans as TDRs since the borrowers’ credit lines remain closed.
|
|
(e)
|
Predominantly all impaired credit card loans are in the U.S.
|
The following table presents average balances of impaired credit card loans and interest income recognized on those loans.
|
Year ended December 31,
(in millions)
|
2014
|
2013
|
2012
|
|||||||
|
Average impaired credit card loans
|
$
|
2,503
|
|
$
|
3,882
|
|
$
|
5,893
|
|
|
|
Interest income on
impaired credit card loans
|
123
|
|
198
|
|
308
|
|
||||
Loan modifications
JPMorgan Chase
may offer one of a number of loan modification programs to credit card borrowers who are experiencing financial difficulty. Most of the credit card loans have been modified under long-term programs for borrowers who are experiencing financial difficulties. Modifications under long-term programs involve placing the customer on a fixed payment plan, generally for
60 months
. The Firm may also offer short-term programs for borrowers who may be in need of temporary relief; however, none are currently being offered. Modifications under all short- and long-term programs typically include reducing the interest rate on the credit card. Substantially all modifications are considered to be TDRs.
If the cardholder does not comply with the modified payment terms, then the credit card loan agreement reverts back to its pre-modification payment terms. Assuming that the cardholder does not begin to perform in accordance with those payment terms, the loan continues to age and will ultimately be charged-off in accordance with the Firm’s standard charge-off policy. In addition, if a borrower successfully completes a short-term modification program,
then the loan reverts back to its pre-modification payment terms. However, in most cases, the Firm does not reinstate the borrower’s line of credit.
New enrollments in these loan modification programs for the years ended
December 31, 2014
,
2013
and
2012
, were
$807 million
,
$1.2 billion
and
$1.7 billion
, respectively.
Financial effects of modifications and redefaults
The following table provides information about the financial effects of the concessions granted on credit card loans modified in TDRs and redefaults for the periods presented.
|
Year ended December 31,
(in millions, except
weighted-average data)
|
2014
|
2013
|
2012
|
|||||||
|
Weighted-average interest rate of loans – before TDR
|
14.96
|
%
|
15.37
|
%
|
15.67
|
%
|
||||
|
Weighted-average interest rate of loans – after TDR
|
4.40
|
|
4.38
|
|
5.19
|
|
||||
|
Loans that redefaulted within one year of modification
(a)
|
$
|
119
|
|
$
|
167
|
|
$
|
309
|
|
|
|
(a)
|
Represents loans modified in TDRs that experienced a payment default in the periods presented, and for which the payment default occurred within
one year
of the modification. The amounts presented represent the balance of such loans as of the end of the quarter in which they defaulted.
|
For credit card loans modified in TDRs, payment default is deemed to have occurred when the loans become
two
payments past due. A substantial portion of these loans is expected to be charged-off in accordance with the Firm’s standard charge-off policy. Based on historical experience, the estimated weighted-average default rate for credit card loans modified was expected to be
27.91%
,
30.72%
and
38.23%
as of
December 31, 2014
,
2013
and
2012
, respectively.
Wholesale loan portfolio
Wholesale loans include loans made to a variety of customers, ranging from large corporate and institutional clients to high-net-worth individuals.
The primary credit quality indicator for wholesale loans is the risk rating assigned each loan. Risk ratings are used to identify the credit quality of loans and differentiate risk within the portfolio. Risk ratings on loans consider the probability of default (“PD”) and the loss given default (“LGD”). The PD is the likelihood that a loan will default and not be fully repaid by the borrower. The LGD is the estimated loss on the loan that would be realized upon the default of the borrower and takes into consideration collateral and structural support for each credit facility.
Management considers several factors to determine an appropriate risk rating, including the obligor’s debt capacity and financial flexibility, the level of the obligor’s earnings, the amount and sources for repayment, the level and nature of contingencies, management strength, and the industry and geography in which the obligor operates. The Firm’s definition of criticized aligns with the banking regulatory definition of criticized exposures, which consist of special mention, substandard and doubtful categories. Risk ratings generally represent ratings profiles similar to those defined
|
JPMorgan Chase & Co./2014 Annual Report
|
255
|
|
Notes to consolidated financial statements
by S&P and Moody’s. Investment-grade ratings range from “AAA/Aaa” to “BBB-/Baa3.” Noninvestment-grade ratings are classified as noncriticized (“BB+/Ba1 and B-/B3”) and criticized (“CCC+”/“Caa1 and below”), and the criticized portion is further subdivided into performing and nonaccrual loans, representing management’s assessment of the collectibility of principal and interest. Criticized loans have a higher probability of default than noncriticized loans.
Risk ratings are reviewed on a regular and ongoing basis by Credit Risk Management and are adjusted as necessary for
updated information affecting the obligor’s ability to fulfill its obligations.
As noted above, the risk rating of a loan considers the industry in which the obligor conducts its operations. As part of the overall credit risk management framework, the Firm focuses on the management and diversification of its industry and client exposures, with particular attention paid to industries with actual or potential credit concern. See Note 5 for further detail on industry concentrations.
The table below provides information by class of receivable for the retained loans in the Wholesale portfolio segment.
|
As of or for the year ended December 31,
(in millions, except ratios)
|
Commercial
and industrial
|
Real estate
|
Financial
institutions |
Government agencies
|
Other
(d)
|
Total
retained loans |
|||||||||||||||||||||||||||||||||||
|
2014
|
2013
|
2014
|
2013
|
2014
|
2013
|
2014
|
2013
|
2014
|
2013
|
2014
|
2013
|
||||||||||||||||||||||||||||||
|
Loans by risk ratings
|
|||||||||||||||||||||||||||||||||||||||||
|
Investment grade
|
$
|
63,069
|
|
$
|
57,690
|
|
$
|
61,006
|
|
$
|
52,195
|
|
$
|
27,111
|
|
$
|
26,712
|
|
$
|
8,393
|
|
$
|
9,979
|
|
$
|
82,087
|
|
$
|
79,494
|
|
$
|
241,666
|
|
$
|
226,070
|
|
|||||
|
Noninvestment grade:
|
|||||||||||||||||||||||||||||||||||||||||
|
Noncriticized
|
44,117
|
|
43,477
|
|
16,541
|
|
14,381
|
|
7,085
|
|
6,674
|
|
300
|
|
440
|
|
10,075
|
|
10,992
|
|
78,118
|
|
75,964
|
|
|||||||||||||||||
|
Criticized performing
|
2,251
|
|
2,385
|
|
1,313
|
|
2,229
|
|
316
|
|
272
|
|
3
|
|
42
|
|
236
|
|
480
|
|
4,119
|
|
5,408
|
|
|||||||||||||||||
|
Criticized nonaccrual
|
188
|
|
294
|
|
253
|
|
346
|
|
18
|
|
25
|
|
—
|
|
1
|
|
140
|
|
155
|
|
599
|
|
821
|
|
|||||||||||||||||
|
Total noninvestment grade
|
46,556
|
|
46,156
|
|
18,107
|
|
16,956
|
|
7,419
|
|
6,971
|
|
303
|
|
483
|
|
10,451
|
|
11,627
|
|
82,836
|
|
82,193
|
|
|||||||||||||||||
|
Total retained loans
|
$
|
109,625
|
|
$
|
103,846
|
|
$
|
79,113
|
|
$
|
69,151
|
|
$
|
34,530
|
|
$
|
33,683
|
|
$
|
8,696
|
|
$
|
10,462
|
|
$
|
92,538
|
|
$
|
91,121
|
|
$
|
324,502
|
|
$
|
308,263
|
|
|||||
|
% of total criticized to total retained loans
|
2.22
|
%
|
2.58
|
%
|
1.98
|
%
|
3.72
|
%
|
0.97
|
%
|
0.88
|
%
|
0.03
|
%
|
0.41
|
%
|
0.41
|
%
|
0.70
|
%
|
1.45
|
%
|
2.02
|
%
|
|||||||||||||||||
|
% of nonaccrual loans to total retained loans
|
0.17
|
|
0.28
|
|
0.32
|
|
0.50
|
|
0.05
|
|
0.07
|
|
—
|
|
0.01
|
|
0.15
|
|
0.17
|
|
0.18
|
|
0.27
|
|
|||||||||||||||||
|
Loans by geographic distribution
(a)
|
|||||||||||||||||||||||||||||||||||||||||
|
Total non-U.S.
|
$
|
33,739
|
|
$
|
34,440
|
|
$
|
2,099
|
|
$
|
1,369
|
|
$
|
20,944
|
|
$
|
22,726
|
|
$
|
1,122
|
|
$
|
2,146
|
|
$
|
42,961
|
|
$
|
43,376
|
|
$
|
100,865
|
|
$
|
104,057
|
|
|||||
|
Total U.S.
|
75,886
|
|
69,406
|
|
77,014
|
|
67,782
|
|
13,586
|
|
10,957
|
|
7,574
|
|
8,316
|
|
49,577
|
|
47,745
|
|
223,637
|
|
204,206
|
|
|||||||||||||||||
|
Total retained loans
|
$
|
109,625
|
|
$
|
103,846
|
|
$
|
79,113
|
|
$
|
69,151
|
|
$
|
34,530
|
|
$
|
33,683
|
|
$
|
8,696
|
|
$
|
10,462
|
|
$
|
92,538
|
|
$
|
91,121
|
|
$
|
324,502
|
|
$
|
308,263
|
|
|||||
|
Net charge-offs/(recoveries)
|
$
|
22
|
|
$
|
99
|
|
$
|
(9
|
)
|
$
|
6
|
|
$
|
(12
|
)
|
$
|
(99
|
)
|
$
|
25
|
|
$
|
1
|
|
$
|
(14
|
)
|
$
|
9
|
|
$
|
12
|
|
$
|
16
|
|
|||||
|
% of net charge-offs/(recoveries) to end-of-period retained loans
|
0.02
|
%
|
0.10
|
%
|
(0.01
|
)%
|
0.01
|
%
|
(0.04
|
)%
|
(0.29
|
)%
|
0.29
|
%
|
0.01
|
%
|
(0.02
|
)%
|
0.01
|
%
|
—
|
%
|
0.01
|
%
|
|||||||||||||||||
|
Loan delinquency
(b)
|
|||||||||||||||||||||||||||||||||||||||||
|
Current and less than 30 days past due and still accruing
|
$
|
108,857
|
|
$
|
103,357
|
|
$
|
78,552
|
|
$
|
68,627
|
|
$
|
34,408
|
|
$
|
33,426
|
|
$
|
8,627
|
|
$
|
10,421
|
|
$
|
91,168
|
|
$
|
89,717
|
|
$
|
321,612
|
|
$
|
305,548
|
|
|||||
|
30–89 days past due and still accruing
|
566
|
|
181
|
|
275
|
|
164
|
|
104
|
|
226
|
|
69
|
|
40
|
|
1,201
|
|
1,233
|
|
2,215
|
|
1,844
|
|
|||||||||||||||||
|
90 or more days past due and still accruing
(c)
|
14
|
|
14
|
|
33
|
|
14
|
|
—
|
|
6
|
|
—
|
|
—
|
|
29
|
|
16
|
|
76
|
|
50
|
|
|||||||||||||||||
|
Criticized nonaccrual
|
188
|
|
294
|
|
253
|
|
346
|
|
18
|
|
25
|
|
—
|
|
1
|
|
140
|
|
155
|
|
599
|
|
821
|
|
|||||||||||||||||
|
Total retained loans
|
$
|
109,625
|
|
$
|
103,846
|
|
$
|
79,113
|
|
$
|
69,151
|
|
$
|
34,530
|
|
$
|
33,683
|
|
$
|
8,696
|
|
$
|
10,462
|
|
$
|
92,538
|
|
$
|
91,121
|
|
$
|
324,502
|
|
$
|
308,263
|
|
|||||
|
(a)
|
The U.S. and non-U.S. distribution is determined based predominantly on the domicile of the borrower.
|
|
(b)
|
The credit quality of wholesale loans is assessed primarily through ongoing review and monitoring of an obligor’s ability to meet contractual obligations rather than relying on the past due status, which is generally a lagging indicator of credit quality. For a discussion of more significant risk factors, see
pages 255–256
of this Note.
|
|
(c)
|
Represents loans that are considered well-collateralized and therefore still accruing interest.
|
|
(d)
|
Other primarily includes loans to SPEs and loans to private banking clients. See Note 1 for additional information on SPEs.
|
|
256
|
JPMorgan Chase & Co./2014 Annual Report
|
|
The following table presents additional information on the real estate class of loans within the Wholesale portfolio segment for the periods indicated. The real estate class primarily consists of secured commercial loans mainly to borrowers for multi-family and commercial lessor properties. Multifamily lending specifically finances apartment buildings. Commercial lessors receive financing specifically for real estate leased to retail, office and industrial tenants. Commercial construction and development loans represent financing for the construction of apartments, office and professional buildings and malls. Other real estate loans include lodging, real estate investment trusts (“REITs”), single-family, homebuilders and other real estate.
|
December 31,
(in millions, except ratios)
|
Multifamily
|
Commercial lessors
|
Commercial construction and development
|
Other
|
Total real estate loans
|
|||||||||||||||||||||||||||||
|
2014
|
2013
|
2014
|
2013
|
2014
|
2013
|
2014
|
2013
|
2014
|
2013
|
|||||||||||||||||||||||||
|
Real estate retained loans
|
$
|
51,049
|
|
$
|
44,389
|
|
$
|
17,438
|
|
$
|
15,949
|
|
$
|
4,264
|
|
$
|
3,674
|
|
$
|
6,362
|
|
$
|
5,139
|
|
$
|
79,113
|
|
$
|
69,151
|
|
||||
|
Criticized
|
652
|
|
1,142
|
|
841
|
|
1,323
|
|
42
|
|
81
|
|
31
|
|
29
|
|
1,566
|
|
2,575
|
|
||||||||||||||
|
% of criticized to total real estate retained loans
|
1.28
|
%
|
2.57
|
%
|
4.82
|
%
|
8.30
|
%
|
0.98
|
%
|
2.20
|
%
|
0.49
|
%
|
0.56
|
%
|
1.98
|
%
|
3.72
|
%
|
||||||||||||||
|
Criticized nonaccrual
|
$
|
126
|
|
$
|
191
|
|
$
|
110
|
|
$
|
143
|
|
$
|
—
|
|
$
|
3
|
|
$
|
17
|
|
$
|
9
|
|
$
|
253
|
|
$
|
346
|
|
||||
|
% of criticized nonaccrual to total real estate retained loans
|
0.25
|
%
|
0.43
|
%
|
0.63
|
%
|
0.90
|
%
|
—
|
%
|
0.08
|
%
|
0.27
|
%
|
0.18
|
%
|
0.32
|
%
|
0.50
|
%
|
||||||||||||||
Wholesale impaired loans and loan modifications
Wholesale impaired loans are comprised of loans that have been placed on nonaccrual status and/or that have been modified in a TDR. All impaired loans are evaluated for an asset-specific allowance as described in Note 15.
The table below sets forth information about the Firm’s wholesale impaired loans.
|
December 31,
(in millions)
|
Commercial
and industrial
|
Real estate
|
Financial
institutions
|
Government
agencies
|
Other
|
Total
retained loans
|
|||||||||||||||||||||||||||||||||||||
|
2014
|
2013
|
2014
|
2013
|
2014
|
2013
|
2014
|
2013
|
2014
|
2013
|
2014
|
2013
|
||||||||||||||||||||||||||||||||
|
Impaired loans
|
|||||||||||||||||||||||||||||||||||||||||||
|
With an allowance
|
$
|
174
|
|
$
|
236
|
|
$
|
193
|
|
$
|
258
|
|
$
|
15
|
|
$
|
17
|
|
$
|
—
|
|
$
|
1
|
|
$
|
89
|
|
$
|
85
|
|
$
|
471
|
|
$
|
597
|
|
|||||||
|
Without an allowance
(a)
|
24
|
|
58
|
|
87
|
|
109
|
|
3
|
|
8
|
|
—
|
|
—
|
|
52
|
|
73
|
|
166
|
|
248
|
|
|||||||||||||||||||
|
Total
impaired loans
|
$
|
198
|
|
$
|
294
|
|
$
|
280
|
|
$
|
367
|
|
$
|
18
|
|
$
|
25
|
|
$
|
—
|
|
$
|
1
|
|
$
|
141
|
|
$
|
158
|
|
$
|
637
|
|
(c)
|
$
|
845
|
|
(c)
|
|||||
|
Allowance for loan losses related to impaired loans
|
$
|
34
|
|
$
|
75
|
|
$
|
36
|
|
$
|
63
|
|
$
|
4
|
|
$
|
16
|
|
$
|
—
|
|
$
|
—
|
|
$
|
13
|
|
$
|
27
|
|
$
|
87
|
|
$
|
181
|
|
|||||||
|
Unpaid principal balance of impaired loans
(b)
|
266
|
|
448
|
|
345
|
|
454
|
|
22
|
|
24
|
|
—
|
|
1
|
|
202
|
|
241
|
|
835
|
|
1,168
|
|
|||||||||||||||||||
|
(a)
|
When the discounted cash flows, collateral value or market price equals or exceeds the recorded investment in the loan, the loan does not require an allowance. This typically occurs when the impaired loans have been partially charged-off and/or there have been interest payments received and applied to the loan balance.
|
|
(b)
|
Represents the contractual amount of principal owed at
December 31, 2014
and
2013
. The unpaid principal balance differs from the impaired loan balances due to various factors, including charge-offs; interest payments received and applied to the carrying value; net deferred loan fees or costs; and unamortized discount or premiums on purchased loans.
|
|
(c)
|
Based upon the domicile of the borrower, predominantly all wholesale impaired loans are in the U.S.
|
The following table presents the Firm’s average impaired loans for the years ended
2014
,
2013
and
2012
.
|
Year ended December 31, (in millions)
|
2014
|
2013
|
2012
|
||||||
|
Commercial and industrial
|
$
|
243
|
|
$
|
412
|
|
$
|
873
|
|
|
Real estate
|
297
|
|
484
|
|
784
|
|
|||
|
Financial institutions
|
20
|
|
17
|
|
17
|
|
|||
|
Government agencies
|
—
|
|
—
|
|
9
|
|
|||
|
Other
|
155
|
|
211
|
|
277
|
|
|||
|
Total
(a)
|
$
|
715
|
|
$
|
1,124
|
|
$
|
1,960
|
|
|
(a)
|
The related interest income on accruing impaired loans and interest income recognized on a cash basis were not material for the years ended
December 31, 2014
,
2013
and
2012
.
|
Certain loan modifications are considered to be TDRs as they provide various concessions to borrowers who are experiencing financial difficulty. All TDRs are reported as impaired loans in the tables above. TDRs were not material as of
December 31, 2014
and
2013
.
|
JPMorgan Chase & Co./2014 Annual Report
|
257
|
|
Notes to consolidated financial statements
JPMorgan Chase
’s allowance for loan losses covers the consumer, including credit card, portfolio segments (primarily scored); and wholesale (risk-rated) portfolio, and represents management’s estimate of probable credit losses inherent in the Firm’s loan portfolio. The allowance for loan losses includes an asset-specific component, a formula-based component and a component related to PCI loans, as described below. Management also estimates an allowance for wholesale and consumer lending-related commitments using methodologies similar to those used to estimate the allowance on the underlying loans. During
2014
, the Firm did not make any significant changes to the methodologies or policies used to determine its allowance for credit losses; such policies are described in the following paragraphs.
The asset-specific component of the allowance relates to loans considered to be impaired, which includes loans that have been modified in TDRs as well as risk-rated loans that have been placed on nonaccrual status. To determine the asset-specific component of the allowance, larger loans are evaluated individually, while smaller loans are evaluated as pools using historical loss experience for the respective class of assets. Scored loans (i.e., consumer loans) are pooled by product type, while risk-rated loans (primarily wholesale loans) are segmented by risk rating.
The Firm generally measures the asset-specific allowance as the difference between the recorded investment in the loan and the present value of the cash flows expected to be collected, discounted at the loan’s original effective interest rate. Subsequent changes in impairment are reported as an adjustment to the provision for loan losses. In certain cases, the asset-specific allowance is determined using an observable market price, and the allowance is measured as the difference between the recorded investment in the loan and the loan’s fair value. Impaired collateral-dependent loans are charged down to the fair value of collateral less costs to sell and therefore may not be subject to an asset-specific reserve as are other impaired loans. See Note 14 for more information about charge-offs and collateral-dependent loans.
The asset-specific component of the allowance for impaired loans that have been modified in TDRs incorporates the effects of foregone interest, if any, in the present value calculation and also incorporates the effect of the modification on the loan’s expected cash flows, which considers the potential for redefault. For residential real estate loans modified in TDRs, the Firm develops product-specific probability of default estimates, which are applied at a loan level to compute expected losses. In developing these probabilities of default, the Firm considers the relationship between the credit quality characteristics of the underlying loans and certain assumptions about home prices and unemployment, based upon industry-wide data. The Firm also considers its own historical loss experience to date based on actual redefaulted modified loans. For credit card loans modified in TDRs, expected losses incorporate projected redefaults based on the Firm’s historical experience by type of modification program. For wholesale loans modified in TDRs, expected losses incorporate redefaults based on management’s expectation of the borrower’s ability to repay under the modified terms.
The formula-based component is based on a statistical calculation to provide for incurred credit losses in performing risk-rated loans and all consumer loans, except for any loans restructured in TDRs and PCI loans. See Note 14 for more information on PCI loans.
For scored loans, the statistical calculation is performed on pools of loans with similar risk characteristics (e.g., product type) and generally computed by applying loss factors to outstanding principal balances over an estimated loss emergence period. The loss emergence period represents the time period between the date at which the loss is estimated to have been incurred and the ultimate realization of that loss (through a charge-off). Estimated loss emergence periods may vary by product and may change over time; management applies judgment in estimating loss emergence periods, using available credit information and trends.
|
258
|
JPMorgan Chase & Co./2014 Annual Report
|
|
Loss factors are statistically derived and sensitive to changes in delinquency status, credit scores, collateral values and other risk factors. The Firm uses a number of different forecasting models to estimate both the PD and the loss severity, including delinquency roll rate models and credit loss severity model
s.
In developing PD and loss severity assumptions, the Firm also considers known and anticipated changes in the economic environment, including changes in home prices, unemployment rates and other risk indicators.
A nationally recognized home price index measure is used to estimate both the PD and the loss severity on residential real estate loans at the metropolitan statistical areas (“MSA”) level. Loss severity estimates are regularly validated by comparison to actual losses recognized on defaulted loans, market-specific real estate appraisals and property sales activity. The economic impact of potential modifications of residential real estate loans is not included in the statistical calculation because of the uncertainty regarding the type and results of such modifications.
For risk-rated loans, the statistical calculation is the product of an estimated PD and an estimated LGD. These factors are differentiated by risk rating and expected maturity. In assessing the risk rating of a particular loan, among the factors considered are the obligor’s debt capacity and financial flexibility, the level of the obligor’s earnings, the amount and sources for repayment, the level and nature of contingencies, management strength, and the industry and geography in which the obligor operates. These factors are based on an evaluation of historical and current information, and involve subjective assessment and interpretation. Emphasizing one factor over another or considering additional factors could impact the risk rating assigned by the Firm to that loan. PD estimates are based on observable external through-the-cycle data, using credit-rating agency default statistics. LGD estimates are based on the Firm’s history of actual credit losses over more than one credit cycle. Estimates of PD and LGD are subject to periodic refinement based on changes to underlying external and Firm-specific historical data.
Management applies judgment within an established framework to adjust the results of applying the statistical calculation described above. The determination of the appropriate adjustment is based on management’s view of loss events that have occurred but that are not yet reflected in the loss factors and that relate to current macroeconomic and political conditions, the quality of underwriting standards and other relevant internal and external factors affecting the credit quality of the portfolio. For the scored loan portfolios, adjustments to the statistical calculation are made in part by analyzing the historical loss experience for each major product segment. Factors related to unemployment, home prices, borrower behavior and lien position, the estimated effects of the mortgage foreclosure-related settlement with federal and state officials and uncertainties regarding the ultimate success of loan modifications are incorporated into the calculation, as appropriate. For junior lien products, management considers the delinquency and/or modification status of any senior liens in determining the adjustment. In addition, for the risk-rated portfolios, any adjustments made to the statistical calculation take into consideration model imprecision, deteriorating conditions within an industry, product or portfolio type, geographic location, credit concentration, and current economic events that have occurred but that are not yet reflected in the factors used to derive the statistical calculation.
Management establishes an asset-specific allowance for lending-related commitments that are considered impaired and computes a formula-based allowance for performing consumer and wholesale lending-related commitments. These are computed using a methodology similar to that used for the wholesale loan portfolio, modified for expected maturities and probabilities of drawdown.
Determining the appropriateness of the allowance is complex and requires judgment by management about the effect of matters that are inherently uncertain. Subsequent evaluations of the loan portfolio, in light of the factors then prevailing, may result in significant changes in the allowances for loan losses and lending-related commitments in future periods. At least quarterly, the allowance for credit losses is reviewed by the Chief Risk Officer, the Chief Financial Officer and the Controller of the Firm and discussed with the Risk Policy and Audit Committees of the Board of Directors of the Firm. As of
December 31, 2014
,
JPMorgan Chase
deemed the allowance for credit losses to be appropriate (i.e., sufficient to absorb probable credit losses inherent in the portfolio).
|
JPMorgan Chase & Co./2014 Annual Report
|
259
|
|
Notes to consolidated financial statements
Allowance for credit losses and loans and lending-related commitments by impairment methodology
The table below summarizes information about the allowance for loan losses, loans by impairment methodology, the allowance for lending-related commitments and lending-related commitments by impairment methodology.
|
|
|||||||||||||||
|
2014
|
|||||||||||||||
|
Year ended December 31,
(in millions)
|
Consumer,
excluding
credit card
|
Credit card
|
Wholesale
|
Total
|
|||||||||||
|
Allowance for loan losses
|
|||||||||||||||
|
Beginning balance at January 1,
|
$
|
8,456
|
|
$
|
3,795
|
|
$
|
4,013
|
|
$
|
16,264
|
|
|||
|
Gross charge-offs
|
2,132
|
|
|
3,831
|
|
151
|
|
6,114
|
|
||||||
|
Gross recoveries
|
(814
|
)
|
(402
|
)
|
(139
|
)
|
(1,355
|
)
|
|||||||
|
Net charge-offs/(recoveries)
|
1,318
|
|
|
3,429
|
|
12
|
|
4,759
|
|
||||||
|
Write-offs of PCI loans
(a)
|
533
|
|
—
|
|
—
|
|
533
|
|
|||||||
|
Provision for loan losses
|
414
|
|
3,079
|
|
(269
|
)
|
3,224
|
|
|||||||
|
Other
|
31
|
|
|
(6
|
)
|
(36
|
)
|
(11
|
)
|
||||||
|
Ending balance at December 31,
|
$
|
7,050
|
|
$
|
3,439
|
|
$
|
3,696
|
|
$
|
14,185
|
|
|||
|
Allowance for loan losses by impairment methodology
|
|||||||||||||||
|
Asset-specific
(b)
|
$
|
539
|
|
$
|
500
|
|
(c)
|
$
|
87
|
|
$
|
1,126
|
|
||
|
Formula-based
|
3,186
|
|
2,939
|
|
3,609
|
|
9,734
|
|
|||||||
|
PCI
|
3,325
|
|
—
|
|
—
|
|
3,325
|
|
|||||||
|
Total allowance for loan losses
|
$
|
7,050
|
|
$
|
3,439
|
|
$
|
3,696
|
|
$
|
14,185
|
|
|||
|
Loans by impairment methodology
|
|||||||||||||||
|
Asset-specific
|
$
|
12,020
|
|
$
|
2,029
|
|
$
|
637
|
|
$
|
14,686
|
|
|||
|
Formula-based
|
236,263
|
|
125,998
|
|
323,861
|
|
686,122
|
|
|||||||
|
PCI
|
46,696
|
|
—
|
|
4
|
|
46,700
|
|
|||||||
|
Total retained loans
|
$
|
294,979
|
|
$
|
128,027
|
|
$
|
324,502
|
|
$
|
747,508
|
|
|||
|
Impaired collateral-dependent loans
|
|||||||||||||||
|
Net charge-offs
|
$
|
133
|
|
|
$
|
—
|
|
$
|
21
|
|
$
|
154
|
|
||
|
Loans measured at fair value of collateral less cost to sell
|
3,025
|
|
—
|
|
326
|
|
3,351
|
|
|||||||
|
Allowance for lending-related commitments
|
|||||||||||||||
|
Beginning balance at January 1,
|
$
|
8
|
|
$
|
—
|
|
$
|
697
|
|
$
|
705
|
|
|||
|
Provision for lending-related commitments
|
5
|
|
—
|
|
(90
|
)
|
(85
|
)
|
|||||||
|
Other
|
—
|
|
—
|
|
2
|
|
2
|
|
|||||||
|
Ending balance at December 31,
|
$
|
13
|
|
$
|
—
|
|
$
|
609
|
|
$
|
622
|
|
|||
|
Allowance for lending-related commitments by impairment methodology
|
|||||||||||||||
|
Asset-specific
|
$
|
—
|
|
$
|
—
|
|
$
|
60
|
|
$
|
60
|
|
|||
|
Formula-based
|
13
|
|
—
|
|
549
|
|
562
|
|
|||||||
|
Total allowance for lending-related commitments
|
$
|
13
|
|
$
|
—
|
|
$
|
609
|
|
$
|
622
|
|
|||
|
Lending-related commitments by impairment methodology
|
|||||||||||||||
|
Asset-specific
|
$
|
—
|
|
$
|
—
|
|
$
|
103
|
|
$
|
103
|
|
|||
|
Formula-based
|
58,153
|
|
525,963
|
|
471,953
|
|
1,056,069
|
|
|||||||
|
Total lending-related commitments
|
$
|
58,153
|
|
$
|
525,963
|
|
$
|
472,056
|
|
$
|
1,056,172
|
|
|||
|
(a)
|
Write-offs of PCI loans are recorded against the allowance for loan losses when actual losses for a pool exceed estimated losses that were recorded as purchase accounting adjustments at the time of acquisition. A write-off of a PCI loan is recognized when the underlying loan is removed from a pool (e.g., upon liquidation). During the fourth quarter of 2014, the Firm recorded a
$291 million
adjustment to reduce the PCI allowance and the recorded investment in the Firm’s PCI loan portfolio, primarily reflecting the cumulative effect of interest forgiveness modifications. This adjustment had no impact to the Firm’s Consolidated statements of income.
|
|
(b)
|
Includes risk-rated loans that have been placed on nonaccrual status and loans that have been modified in a TDR.
|
|
(c)
|
The asset-specific credit card allowance for loan losses is related to loans that have been modified in a TDR; such allowance is calculated based on the loans’ original contractual interest rates and does not consider any incremental penalty rates.
|
|
260
|
JPMorgan Chase & Co./2014 Annual Report
|
|
|
(table continued from previous page)
|
||||||||||||||||||||||||||||
|
2013
|
2012
|
|||||||||||||||||||||||||||
|
Consumer,
excluding
credit card
|
Credit card
|
Wholesale
|
Total
|
Consumer,
excluding
credit card
|
Credit card
|
Wholesale
|
Total
|
|||||||||||||||||||||
|
$
|
12,292
|
|
$
|
5,501
|
|
$
|
4,143
|
|
$
|
21,936
|
|
$
|
16,294
|
|
$
|
6,999
|
|
$
|
4,316
|
|
$
|
27,609
|
|
|||||
|
2,754
|
|
4,472
|
|
241
|
|
7,467
|
|
4,805
|
|
5,755
|
|
346
|
|
10,906
|
|
|||||||||||||
|
(847
|
)
|
(593
|
)
|
(225
|
)
|
(1,665
|
)
|
(508
|
)
|
(811
|
)
|
(524
|
)
|
(1,843
|
)
|
|||||||||||||
|
1,907
|
|
3,879
|
|
16
|
|
5,802
|
|
4,297
|
|
4,944
|
|
(178
|
)
|
9,063
|
|
|||||||||||||
|
53
|
|
—
|
|
—
|
|
53
|
|
—
|
|
—
|
|
—
|
|
—
|
|
|||||||||||||
|
(1,872
|
)
|
2,179
|
|
(119
|
)
|
188
|
|
302
|
|
3,444
|
|
(359
|
)
|
3,387
|
|
|||||||||||||
|
(4
|
)
|
(6
|
)
|
5
|
|
(5
|
)
|
(7
|
)
|
2
|
|
8
|
|
3
|
|
|||||||||||||
|
$
|
8,456
|
|
$
|
3,795
|
|
$
|
4,013
|
|
$
|
16,264
|
|
$
|
12,292
|
|
$
|
5,501
|
|
$
|
4,143
|
|
$
|
21,936
|
|
|||||
|
$
|
601
|
|
$
|
971
|
|
(c)
|
$
|
181
|
|
$
|
1,753
|
|
$
|
729
|
|
$
|
1,681
|
|
(c)
|
$
|
319
|
|
$
|
2,729
|
|
|||
|
3,697
|
|
2,824
|
|
3,832
|
|
10,353
|
|
5,852
|
|
3,820
|
|
3,824
|
|
13,496
|
|
|||||||||||||
|
4,158
|
|
—
|
|
—
|
|
4,158
|
|
5,711
|
|
—
|
|
—
|
|
5,711
|
|
|||||||||||||
|
$
|
8,456
|
|
$
|
3,795
|
|
$
|
4,013
|
|
$
|
16,264
|
|
$
|
12,292
|
|
$
|
5,501
|
|
$
|
4,143
|
|
$
|
21,936
|
|
|||||
|
$
|
13,785
|
|
$
|
3,115
|
|
$
|
845
|
|
$
|
17,745
|
|
$
|
13,938
|
|
$
|
4,762
|
|
$
|
1,475
|
|
$
|
20,175
|
|
|||||
|
221,609
|
|
124,350
|
|
307,412
|
|
653,371
|
|
218,945
|
|
123,231
|
|
304,728
|
|
646,904
|
|
|||||||||||||
|
53,055
|
|
—
|
|
6
|
|
53,061
|
|
59,737
|
|
—
|
|
19
|
|
59,756
|
|
|||||||||||||
|
$
|
288,449
|
|
$
|
127,465
|
|
$
|
308,263
|
|
$
|
724,177
|
|
$
|
292,620
|
|
$
|
127,993
|
|
$
|
306,222
|
|
$
|
726,835
|
|
|||||
|
$
|
235
|
|
$
|
—
|
|
$
|
37
|
|
$
|
272
|
|
$
|
973
|
|
$
|
—
|
|
$
|
77
|
|
$
|
1,050
|
|
|||||
|
3,105
|
|
—
|
|
362
|
|
3,467
|
|
3,272
|
|
—
|
|
445
|
|
3,717
|
|
|||||||||||||
|
$
|
7
|
|
$
|
—
|
|
$
|
661
|
|
$
|
668
|
|
$
|
7
|
|
$
|
—
|
|
$
|
666
|
|
$
|
673
|
|
|||||
|
1
|
|
—
|
|
36
|
|
37
|
|
—
|
|
—
|
|
(2
|
)
|
(2
|
)
|
|||||||||||||
|
—
|
|
—
|
|
—
|
|
—
|
|
—
|
|
—
|
|
(3
|
)
|
(3
|
)
|
|||||||||||||
|
$
|
8
|
|
$
|
—
|
|
$
|
697
|
|
$
|
705
|
|
$
|
7
|
|
$
|
—
|
|
$
|
661
|
|
$
|
668
|
|
|||||
|
$
|
—
|
|
$
|
—
|
|
$
|
60
|
|
$
|
60
|
|
$
|
—
|
|
$
|
—
|
|
$
|
97
|
|
$
|
97
|
|
|||||
|
8
|
|
—
|
|
637
|
|
645
|
|
7
|
|
—
|
|
564
|
|
571
|
|
|||||||||||||
|
$
|
8
|
|
$
|
—
|
|
$
|
697
|
|
$
|
705
|
|
$
|
7
|
|
$
|
—
|
|
$
|
661
|
|
$
|
668
|
|
|||||
|
$
|
—
|
|
$
|
—
|
|
$
|
206
|
|
$
|
206
|
|
$
|
—
|
|
$
|
—
|
|
$
|
355
|
|
$
|
355
|
|
|||||
|
56,057
|
|
529,383
|
|
446,026
|
|
1,031,466
|
|
60,156
|
|
533,018
|
|
434,459
|
|
1,027,633
|
|
|||||||||||||
|
$
|
56,057
|
|
$
|
529,383
|
|
$
|
446,232
|
|
$
|
1,031,672
|
|
$
|
60,156
|
|
$
|
533,018
|
|
$
|
434,814
|
|
$
|
1,027,988
|
|
|||||
|
JPMorgan Chase & Co./2014 Annual Report
|
261
|
|
Notes to consolidated financial statements
For a further description of JPMorgan Chase’s accounting policies regarding consolidation of VIEs, see Note 1.
The following table summarizes the most significant types of Firm-sponsored VIEs by business segment. The Firm considers a “sponsored” VIE to include any entity where: (1) JPMorgan Chase is the principal beneficiary of the structure; (2) the VIE is used by JPMorgan Chase to securitize Firm assets; (3) the VIE issues financial instruments with the JPMorgan Chase name; or (4) the entity is a JPMorgan Chase–administered asset-backed commercial paper conduit.
|
Line-of-Business
|
Transaction Type
|
Activity
|
Annual Report
page references
|
|
CCB
|
Credit card securitization trusts
|
Securitization of both originated and purchased credit card receivables
|
262
|
|
Mortgage securitization trusts
|
Securitization of originated and purchased residential mortgages
|
263-265
|
|
|
Other securitization trusts
|
Securitization of originated student loans
|
263-265
|
|
|
CIB
|
Mortgage and other securitization trusts
|
Securitization of both originated and purchased residential and commercial mortgages, automobile and student loans
|
263-265
|
|
Multi-seller conduits
Investor intermediation activities:
|
Assist clients in accessing the financial markets in a cost-efficient manner and structures transactions to meet investor needs
|
265-267
|
|
|
Municipal bond vehicles
|
265-266
|
||
|
Credit-related note and asset swap vehicles
|
267
|
||
The Firm’s other business segments are also involved with VIEs, but to a lesser extent, as follows:
|
•
|
Asset Management: Sponsors and manages certain funds that are deemed VIEs. As asset manager of the funds, AM earns a fee based on assets managed; the fee varies with each fund’s investment objective and is competitively priced. For fund entities that qualify as VIEs, AM’s interests are, in certain cases, considered to be significant variable interests that result in consolidation of the financial results of these entities.
|
|
•
|
Commercial Banking: CB makes investments in and provides lending to community development entities that may meet the definition of a VIE. In addition, CB provides financing and lending-related services to certain client-sponsored VIEs. In general, CB does not control the activities of these entities and does not consolidate these entities.
|
|
•
|
Corporate
:
The Private Equity business, within Corporate, may be involved with entities that are deemed VIEs. However, the Firm’s private equity business is subject to specialized investment company accounting, which does not require the consolidation of investments, including VIEs.
|
The Firm also invests in and provides financing and other services to VIEs sponsored by third parties, as described on
page 268
of this Note.
Significant Firm-sponsored variable interest entities
Credit card securitizations
The Card business securitizes originated and purchased credit card loans, primarily through the Chase Issuance Trust (the “Trust”). The Firm’s continuing involvement in credit card securitizations includes servicing the receivables, retaining an undivided seller’s interest in the receivables, retaining certain senior and subordinated securities and maintaining escrow accounts.
The Firm is considered to be the primary beneficiary of these Firm-sponsored credit card securitization trusts based on the Firm’s ability to direct the activities of these VIEs through its servicing responsibilities and other duties, including making decisions as to the receivables that are transferred into those trusts and as to any related modifications and workouts. Additionally, the nature and extent of the Firm’s other continuing involvement with the trusts, as indicated above, obligates the Firm to absorb losses and gives the Firm the right to receive certain benefits from these VIEs that could potentially be significant.
The underlying securitized credit card receivables and other assets of the securitization trusts are available only for payment of the beneficial interests issued by the securitization trusts; they are not available to pay the Firm’s other obligations or the claims of the Firm’s other creditors.
The agreements with the credit card securitization trusts require the Firm to maintain a minimum undivided interest in the credit card trusts (which is generally
4%
). As of
December 31, 2014
and
2013
, the Firm held undivided interests in Firm-sponsored credit card securitization trusts of
$10.9 billion
and
$14.3 billion
, respectively. The Firm maintained an average undivided interest in principal receivables owned by those trusts of approximately
22%
and
30%
for the years ended December 31, 2014 and 2013, respectively. The Firm also retained
$40 million
and
$130 million
of senior securities and
$5.3 billion
and
$5.5 billion
of subordinated securities in certain of its credit card securitization trusts as of
December 31, 2014
and
2013
, respectively. The Firm’s undivided interests in the credit card trusts and securities retained are eliminated in consolidation.
|
262
|
JPMorgan Chase & Co./2014 Annual Report
|
|
Firm-sponsored mortgage and other securitization trusts
The Firm securitizes (or has securitized) originated and purchased residential mortgages, commercial mortgages and other consumer loans (including automobile and student loans) primarily in its CCB and CIB businesses.
Depending on the particular transaction, as well as the line of business involved, the Firm may act as the servicer of the loans and/or retain certain beneficial interests in the securitization trusts.
The following table presents the total unpaid principal amount of assets held in Firm-sponsored private-label securitization entities, including those in which the Firm has continuing involvement, and those that are consolidated by the Firm. Continuing involvement includes servicing the loans; holding senior interests or subordinated interests; recourse or guarantee arrangements; and derivative transactions. In certain instances, the Firm’s only continuing involvement is servicing the loans. See Securitization activity on
page 269
of this Note for further information regarding the Firm’s cash flows with and interests retained in nonconsolidated VIEs, and
pages 269–270
of this Note for information on the Firm’s loan sales to U.S. government agencies.
|
Principal amount outstanding
|
JPMorgan Chase interest in securitized assets in nonconsolidated VIEs
(c)(d)(e)
|
||||||||||||||||||
|
December 31, 2014
(a)
(in billions)
|
Total assets held by securitization VIEs
|
Assets held in consolidated securitization VIEs
|
Assets held in nonconsolidated securitization VIEs with continuing involvement
|
Trading assets
|
AFS securities
|
Total interests held by JPMorgan Chase
|
|||||||||||||
|
Securitization-related
|
|||||||||||||||||||
|
Residential mortgage:
|
|||||||||||||||||||
|
Prime/Alt-A and Option ARMs
|
$
|
96.3
|
|
$
|
2.7
|
|
$
|
78.3
|
|
$
|
0.5
|
|
$
|
0.7
|
|
$
|
1.2
|
|
|
|
Subprime
|
28.4
|
|
0.8
|
|
25.7
|
|
0.1
|
|
—
|
|
0.1
|
|
|||||||
|
Commercial and other
(b)
|
129.6
|
|
0.2
|
|
94.4
|
|
0.4
|
|
3.5
|
|
3.9
|
|
|||||||
|
Total
|
$
|
254.3
|
|
$
|
3.7
|
|
$
|
198.4
|
|
$
|
1.0
|
|
$
|
4.2
|
|
$
|
5.2
|
|
|
|
Principal amount outstanding
|
JPMorgan Chase interest in securitized assets in nonconsolidated VIEs
(c)(d)(e)
|
||||||||||||||||||
|
December 31, 2013
(a)
(in billions)
|
Total assets held by securitization VIEs
|
Assets held in consolidated securitization VIEs
|
Assets held in nonconsolidated securitization VIEs with continuing involvement
|
Trading assets
|
AFS securities
|
Total interests held by JPMorgan Chase
|
|||||||||||||
|
Securitization-related
|
|||||||||||||||||||
|
Residential mortgage:
|
|||||||||||||||||||
|
Prime/Alt-A and Option ARMs
|
$
|
109.2
|
|
$
|
3.2
|
|
$
|
90.4
|
|
$
|
0.5
|
|
$
|
0.3
|
|
$
|
0.8
|
|
|
|
Subprime
|
32.1
|
|
1.3
|
|
28.0
|
|
0.1
|
|
—
|
|
0.1
|
|
|||||||
|
Commercial and other
(b)
|
130.4
|
|
—
|
|
98.0
|
|
0.5
|
|
3.5
|
|
4.0
|
|
|||||||
|
Total
|
$
|
271.7
|
|
$
|
4.5
|
|
$
|
216.4
|
|
$
|
1.1
|
|
$
|
3.8
|
|
$
|
4.9
|
|
|
|
(a)
|
Excludes U.S. government agency securitizations. See
pages 269–270
of this Note for information on the Firm’s loan sales to U.S. government agencies.
|
|
(b)
|
Consists of securities backed by commercial loans (predominantly real estate) and non-mortgage-related consumer receivables purchased from third parties. The Firm generally does not retain a residual interest in its sponsored commercial mortgage securitization transactions.
|
|
(c)
|
The table above excludes the following: retained servicing (see Note 17 for a discussion of MSRs); securities retained from loan sales to U.S. government agencies; interest rate and foreign exchange derivatives primarily used to manage interest rate and foreign exchange risks of securitization entities (See Note 6 for further information on derivatives); senior and subordinated securities of
$136 million
and
$34 million
, respectively, at
December 31, 2014
, and
$151 million
and
$30 million
, respectively, at
December 31, 2013
, which the Firm purchased in connection with CIB’s secondary market-making activities.
|
|
(d)
|
Includes interests held in re-securitization transactions.
|
|
(e)
|
As of
December 31, 2014
and
2013
,
77%
and
69%
, respectively, of the Firm’s retained securitization interests, which are carried at fair value, were risk-rated “A” or better, on an S&P-equivalent basis. The retained interests in prime residential mortgages consisted of
$1.1 billion
and
$551 million
of investment-grade and
$185 million
and
$260 million
of noninvestment-grade retained interests at
December 31, 2014
and 2013, respectively. The retained interests in commercial and other securitizations trusts consisted of
$3.7 billion
and
$3.9 billion
of investment-grade and
$194 million
and
$80 million
of noninvestment-grade retained interests at
December 31, 2014
and
2013
, respectively.
|
|
JPMorgan Chase & Co./2014 Annual Report
|
263
|
|
Notes to consolidated financial statements
Residential mortgage
The Firm securitizes residential mortgage loans originated by CCB, as well as residential mortgage loans purchased from third parties by either CCB or CIB. CCB generally retains servicing for all residential mortgage loans originated or purchased by CCB, and for certain mortgage loans purchased by CIB. For securitizations serviced by CCB, the Firm has the power to direct the significant activities of the VIE because it is responsible for decisions related to loan modifications and workouts. CCB may also retain an interest upon securitization.
In addition, CIB engages in underwriting and trading activities involving securities issued by Firm-sponsored securitization trusts. As a result, CIB at times retains senior and/or subordinated interests (including residual interests) in residential mortgage securitizations upon securitization, and/or reacquires positions in the secondary market in the normal course of business. In certain instances, as a result of the positions retained or reacquired by CIB or held by CCB, when considered together with the servicing arrangements entered into by CCB, the Firm is deemed to be the primary beneficiary of certain securitization trusts. See the table on
page 268
of this Note for more information on consolidated residential mortgage securitizations.
The Firm does not consolidate a residential mortgage securitization (Firm-sponsored or third-party-sponsored) when it is not the servicer (and therefore does not have the power to direct the most significant activities of the trust) or does not hold a beneficial interest in the trust that could potentially be significant to the trust. At December 31, 2014 and 2013, the Firm did not consolidate the assets of certain Firm-sponsored residential mortgage securitization VIEs, in which the Firm had continuing involvement, primarily due to the fact that the Firm did not hold an interest in these trusts that could potentially be significant to the trusts. See the table on
page 268
of this Note for more information on the consolidated residential mortgage securitizations, and the table on the previous page of this Note for further information on interests held in nonconsolidated residential mortgage securitizations.
Commercial mortgages and other consumer securitizations
CIB originates and securitizes commercial mortgage loans, and engages in underwriting and trading activities involving the securities issued by securitization trusts. CIB may retain unsold senior and/or subordinated interests in commercial mortgage securitizations at the time of securitization but, generally, the Firm does not service commercial loan securitizations. For commercial mortgage securitizations the power to direct the significant activities of the VIE generally is held by the servicer or investors in a specified class of securities (“controlling class”). See the table on
page 268
of this Note for more information on the consolidated commercial mortgage securitizations,
and the table on the previous page of this Note for further information on interests held in nonconsolidated securitizations.
The Firm retains servicing responsibilities for certain student loan securitizations. The Firm has the power to direct the activities of these VIEs through these servicing responsibilities. See the table on
page 268
of this Note for more information on the consolidated student loan securitizations, and the table on the previous page of this Note for further information on interests held in nonconsolidated securitizations.
Re-securitizations
The Firm engages in certain re-securitization transactions in which debt securities are transferred to a VIE in exchange for new beneficial interests. These transfers occur in connection with both agency (Fannie Mae, Freddie Mac and Ginnie Mae) and nonagency (private-label) sponsored VIEs, which may be backed by either residential or commercial mortgages. The Firm’s consolidation analysis is largely dependent on the Firm’s role and interest in the re-securitization trusts. During the years ended
December 31, 2014
,
2013
and
2012
, the Firm transferred
$22.7 billion
,
$25.3 billion
and
$10.0 billion
, respectively, of securities to agency VIEs, and
$1.1 billion
,
$55 million
and
$286 million
, respectively, of securities to private-label VIEs.
Most re-securitizations with which the Firm is involved are client-driven transactions in which a specific client or group of clients is seeking a specific return or risk profile. For these transactions, the Firm has concluded that the decision-making power of the entity is shared between the Firm and its clients, considering the joint effort and decisions in establishing the re-securitization trust and its assets, as well as the significant economic interest the client holds in the re-securitization trust; therefore the Firm does not consolidate the re-securitization VIE.
In more limited circumstances, the Firm creates a re-securitization trust independently and not in conjunction with specific clients. In these circumstances, the Firm is deemed to have the unilateral ability to direct the most significant activities of the re-securitization trust because of the decisions made during the establishment and design of the trust; therefore, the Firm consolidates the re-securitization VIE if the Firm holds an interest that could potentially be significant.
Additionally, the Firm may invest in beneficial interests of third-party securitizations and generally purchases these interests in the secondary market. In these circumstances, the Firm does not have the unilateral ability to direct the most significant activities of the re-securitization trust, either because it was not involved in the initial design of the trust, or the Firm is involved with an independent third-party sponsor and demonstrates shared power over the creation of the trust; therefore, the Firm does not consolidate the re-securitization VIE.
As of
December 31, 2014
and
2013
, the Firm did not consolidate any agency re-securitizations. As of
December 31, 2014
and
2013
, the Firm consolidated assets of
$77 million
and
$86 million
, respectively, and liabilities of
$21 million
and
$23 million
, respectively, of
|
264
|
JPMorgan Chase & Co./2014 Annual Report
|
|
private-label re-securitizations. See the table on
page 268
of this Note for more information on the consolidated re-securitization transactions.
As of
December 31, 2014
and
2013
, total assets (including the notional amount of interest-only securities) of nonconsolidated Firm-sponsored private-label re-securitization entities in which the Firm has continuing involvement were
$2.9 billion
and
$2.8 billion
, respectively. At
December 31, 2014
and
2013
, the Firm held approximately
$2.4 billion
and
$1.3 billion
, respectively, of interests in nonconsolidated agency re-securitization entities, and
$36 million
and
$6 million
, respectively, of senior and subordinated interests in nonconsolidated private-label re-securitization entities. See the table on
page 263
of this Note for further information on interests held in nonconsolidated securitizations.
Multi-seller conduits
Multi-seller conduit entities are separate bankruptcy remote entities that purchase interests in, and make loans secured by, pools of receivables and other financial assets pursuant to agreements with customers of the Firm. The conduits fund their purchases and loans through the issuance of highly rated commercial paper. The primary source of repayment of the commercial paper is the cash flows from the pools of assets. In most instances, the assets are structured with deal-specific credit enhancements provided to the conduits by the customers (i.e., sellers) or other third parties. Deal-specific credit enhancements are generally structured to cover a multiple of historical losses expected on the pool of assets, and are typically in the form of overcollateralization provided by the seller. The deal-specific credit enhancements mitigate the Firm’s potential losses on its agreements with the conduits.
To ensure timely repayment of the commercial paper, and to provide the conduits with funding to purchase interests in or make loans secured by pools of receivables in the event that the conduits do not obtain funding in the commercial paper market, each asset pool financed by the conduits has a minimum 100% deal-specific liquidity facility associated with it provided by JPMorgan Chase Bank, N.A. JPMorgan Chase Bank, N.A. also provides the multi-seller conduit vehicles with uncommitted program-wide liquidity facilities and program-wide credit enhancement in the form of standby letters of credit. The amount of program-wide credit enhancement required is based upon commercial paper issuance and approximates
10%
of the outstanding balance.
The Firm consolidates its Firm-administered multi-seller conduits, as the Firm has both the power to direct the significant activities of the conduits and a potentially significant economic interest in the conduits. As administrative agent and in its role in structuring transactions, the Firm makes decisions regarding asset types and credit quality, and manages the commercial paper funding needs of the conduits. The Firm’s interests that could potentially be significant to the VIEs include the fees received as administrative agent and liquidity and
program-wide credit enhancement provider, as well as the potential exposure created by the liquidity and credit enhancement facilities provided to the conduits. See
page 268
of this Note for further information on consolidated VIE assets and liabilities.
In the normal course of business, JPMorgan Chase makes markets in and invests in commercial paper issued by the Firm-administered multi-seller conduits. The Firm held
$5.7 billion
and
$4.1 billion
of the commercial paper issued by the Firm-administered multi-seller conduits at
December 31, 2014
and
2013
, respectively. The Firm’s investments reflect the Firm’s funding needs and capacity and were not driven by market illiquidity. The Firm is not obligated under any agreement to purchase the commercial paper issued by the Firm-administered multi-seller conduits.
Deal-specific liquidity facilities, program-wide liquidity and credit enhancement provided by the Firm have been eliminated in consolidation. The Firm or the Firm-administered multi-seller conduits provide lending-related commitments to certain clients of the Firm-administered multi-seller conduits. The unfunded portion of these commitments was
$9.9 billion
and
$9.1 billion
at
December 31, 2014
and
2013
, respectively, and are reported as off-balance sheet lending-related commitments. For more information on off-balance sheet lending-related commitments, see Note 29.
VIEs associated with investor intermediation activities
As a financial intermediary, the Firm creates certain types of VIEs and also structures transactions with these VIEs, typically using derivatives, to meet investor needs. The Firm may also provide liquidity and other support. The risks inherent in the derivative instruments or liquidity commitments are managed similarly to other credit, market or liquidity risks to which the Firm is exposed. The principal types of VIEs for which the Firm is engaged in on behalf of clients are municipal bond vehicles, credit-related note vehicles and asset swap vehicles.
Municipal bond vehicles
The Firm has created a series of trusts that provide short-term investors with qualifying tax-exempt investments, and that allow investors in tax-exempt securities to finance their investments at short-term tax-exempt rates. In a typical transaction, the vehicle purchases fixed-rate longer-term highly rated municipal bonds and funds the purchase by issuing two types of securities: (1) puttable floating-rate certificates and (2) inverse floating-rate residual interests (“residual interests”). The maturity of each of the puttable floating-rate certificates and the residual interests is equal to the life of the vehicle, while the maturity of the underlying municipal bonds is typically longer. Holders of the puttable floating-rate certificates may “put,” or tender, the certificates if the remarketing agent cannot successfully remarket the floating-rate certificates to another investor. A liquidity facility conditionally obligates the liquidity provider to fund the purchase of the tendered floating-rate certificates. Upon termination of the vehicle, proceeds from
|
JPMorgan Chase & Co./2014 Annual Report
|
265
|
|
Notes to consolidated financial statements
the sale of the underlying municipal bonds would first repay any funded liquidity facility or outstanding floating-rate certificates and the remaining amount, if any, would be paid to the residual interests. If the proceeds from the sale of the underlying municipal bonds are not sufficient to repay the liquidity facility, in certain transactions the liquidity provider has recourse to the residual interest holders for reimbursement. Certain residual interest holders may be required to post collateral with the Firm, as liquidity provider, to support such reimbursement obligations should the market value of the municipal bonds decline.
JPMorgan Chase Bank, N.A. often serves as the sole liquidity provider, and J.P. Morgan Securities LLC serves as remarketing agent, of the puttable floating-rate certificates. The liquidity provider’s obligation to perform is conditional and is limited by certain termination events, which include bankruptcy or failure to pay by the municipal bond issuer or credit enhancement provider, an event of taxability on the municipal bonds or the immediate downgrade of the municipal bond to below investment grade. In addition, the Firm’s exposure as liquidity provider is further limited by the high credit quality of the underlying municipal bonds, the excess collateralization in the vehicle, or in certain transactions, the reimbursement agreements with the residual interest holders.
The long-term credit ratings of the puttable floating rate certificates are directly related to the credit ratings of the underlying municipal bonds, the credit rating of any insurer of the underlying municipal bond, and the Firm’s short-term credit rating as liquidity provider. A downgrade in any of these ratings would affect the rating of the puttable
floating-rate certificates and could cause demand for these certificates by investors to decline or disappear. However, a downgrade of JPMorgan Chase Bank, N.A.’s short-term rating does not affect the Firm’s obligation under the liquidity facility.
As remarketing agent, the Firm may hold puttable floating-rate certificates of the municipal bond vehicles. At
December 31, 2014
and
2013
, the Firm held
$55 million
and
$262 million
, respectively, of these certificates on its Consolidated balance sheets. The largest amount held by the Firm at any end of day during
2014
was
$250 million
, or
3.0%
, of the municipal bond vehicles’ aggregate outstanding puttable floating-rate certificates. The Firm did not have and continues not to have any intent to protect any residual interest holder from potential losses on any of the municipal bond holdings.
The Firm consolidates municipal bond vehicles if it owns the residual interest. The residual interest generally allows the owner to make decisions that significantly impact the economic performance of the municipal bond vehicle, primarily by directing the sale of the municipal bonds owned by the vehicle. In addition, the residual interest owners have the right to receive benefits and bear losses that could potentially be significant to the municipal bond vehicle. The Firm does not consolidate municipal bond vehicles if it does not own the residual interests, since the Firm does not have the power to make decisions that significantly impact the economic performance of the municipal bond vehicle.
See
page 268
of this Note for further information on consolidated municipal bond vehicles.
The Firm’s exposure to nonconsolidated municipal bond VIEs at
December 31, 2014
and
2013
, including the ratings profile of the VIEs’ assets, was as follows.
|
December 31,
(in billions)
|
Fair value of assets held by VIEs
|
Liquidity facilities
|
Excess/(deficit)
(a)
|
Maximum exposure
|
||||||||
|
Nonconsolidated municipal bond vehicles
|
||||||||||||
|
2014
|
$
|
11.5
|
|
$
|
6.3
|
|
$
|
5.2
|
|
$
|
6.3
|
|
|
2013
|
11.8
|
|
6.9
|
|
4.9
|
|
6.9
|
|
||||
|
Ratings profile of VIE assets
(b)
|
Fair value of assets held by VIEs
|
Wt. avg. expected life of assets (years)
|
||||||||||||||||||
|
Investment-grade
|
Noninvestment- grade
|
|||||||||||||||||||
|
December 31,
(in billions, except where otherwise noted)
|
AAA to AAA-
|
AA+ to AA-
|
A+ to A-
|
BBB+ to BBB-
|
BB+ and below
|
|||||||||||||||
|
2014
|
$
|
2.7
|
|
$
|
8.4
|
|
$
|
0.4
|
|
$
|
—
|
|
$
|
—
|
|
$
|
11.5
|
|
4.9
|
|
|
2013
|
2.7
|
|
8.9
|
|
0.2
|
|
—
|
|
—
|
|
$
|
11.8
|
|
7.2
|
||||||
|
(a)
|
Represents the excess/(deficit) of the fair values of municipal bond assets available to repay the liquidity facilities, if drawn.
|
|
(b)
|
The ratings scale is presented on an S&P-equivalent basis.
|
|
266
|
JPMorgan Chase & Co./2014 Annual Report
|
|
Credit-related note and asset swap vehicles
Credit-related note vehicles
The Firm structures transactions with credit-related note vehicles in which the VIE purchases highly rated assets (generally investment-grade), such as government bonds, corporate bonds or asset-backed securities, and enters into a credit derivative contract with the Firm to obtain exposure to a referenced credit which the VIE otherwise does not hold. The VIE then issues credit-linked notes (“CLNs”) to transfer the risk of the referenced credit to the VIE’s investors. Clients and investors often prefer using a CLN vehicle since they may be of the view that the CLNs issued by the VIE is of a higher credit quality than equivalent notes issued directly by JPMorgan Chase. The Firm divides its credit-related note structures broadly into two types: static and managed. In a static credit-related note structure, the CLNs and associated credit derivative contract either reference a single credit (e.g., a multi-national corporation), or all or part of a fixed portfolio of credits. In a managed credit-related note structure, the CLNs and associated credit derivative generally reference all or part of an actively managed portfolio of credits.
The Firm’s involvement with CLN vehicles is generally limited to being a derivative counterparty and it does not act as a portfolio manager for managed CLN VIEs. The Firm does not provide any additional contractual financial support to the VIE over and above its contractual obligations as derivative counterparty, but may also make a market in the CLNs issued by such VIEs, although it is under no obligation to do so. The Firm has not historically provided any financial support to the CLN vehicles over and above its contractual obligations. As a derivative counterparty the assets held by the VIE serve as collateral for any derivatives receivables. As such the collateral represents the maximum exposure the Firm has to these vehicles, which was
$5.9 billion
and
$8.7 billion
as of December 31, 2014 and 2013, respectively. The Firm’s maximum exposure arises through the derivatives executed with the VIEs; the exposure varies over time with changes in the fair value of the derivatives. The Firm relies on the collateral held by the VIEs to pay any amounts due under the derivatives; the vehicles are structured at inception so that the par value of the collateral is expected to be sufficient to pay amounts due under the derivative contracts
Since each CLN is established to the specifications of the investors, the investors have the power over the activities of that VIE that most significantly affect the performance of the CLN. The Firm consolidates credit-related note entities only in limited circumstances where it holds positions in these entities that provided the Firm with control over the entity. The Firm consolidated credit-related note vehicles with collateral fair values of
$163 million
and
$311 million
, at December 31, 2014 and 2013, respectively. These consolidated VIEs included some that were structured by the Firm where the Firm provides the credit derivative, and
some that have been structured by third parties where the Firm is not the credit derivative provider.
The Firm reports derivatives with unconsolidated CLN vehicles as well as any CLNs that it holds as market-maker on its Consolidated balance sheets at fair value with changes in fair value reported in principal transactions revenue. The Firm’s exposure to non-consolidated CLN VIEs as of December 31, 2014 and 2013 was not material.
Asset swap vehicles
The Firm structures transactions with asset swap vehicles on behalf of investors. In such transactions, the VIE purchases a specific asset or assets (substantially all of which are investment-grade) and then enters into a derivative with the Firm in order to tailor the interest rate or foreign exchange currency risk, or both, according to investors’ requirements. Investors typically invest in the notes issued by such VIEs in order to obtain exposure to the credit risk of the specific assets, as well as exposure to foreign exchange and interest rate risk that is tailored to their specific needs.
The Firm’s involvement with asset swap vehicles is generally limited to being an interest rate or foreign exchange derivative counterparty. The Firm does not provide any additional contractual financial support to the VIE over and above its contractual obligations as derivative counterparty, but may also make a market in the notes issued by such VIEs, although it is under no obligation to do so. The Firm has not historically provided any financial support to asset swap vehicles over and above its contractual obligations. As a derivative counterparty the assets held by the VIE serve as collateral for any derivatives receivables. As such the collateral represents the maximum exposure the Firm has to these vehicles, which was
$5.7 billion
and
$7.7 billion
as of December 31, 2014 and 2013, respectively. The Firm’s maximum exposure arises through the derivatives executed with the VIEs; the exposure varies over time with changes in the fair value of the derivatives. The Firm relies on the collateral held by the VIEs to pay any amounts due under the derivatives; the vehicles are structured at inception so that the par value of the collateral is expected to be sufficient to pay amounts due under the derivative contracts
Since each asset swap vehicle is established to the specifications of the investors, the investors have the power over the activities of that VIE that most significantly affect the performance of the entity. Accordingly, the Firm does not generally consolidate these asset swap vehicles and did not consolidate any asset swap vehicles at December 31, 2014 and 2013.
The Firm reports derivatives with unconsolidated asset swap vehicles that it holds as market-maker on its Consolidated balance sheets at fair value with changes in fair value reported in principal transactions revenue. The Firm’s exposure to non-consolidated asset swap VIEs as of December 31, 2014 and 2013 was not material.
|
JPMorgan Chase & Co./2014 Annual Report
|
267
|
|
Notes to consolidated financial statements
VIEs sponsored by third parties
The Firm enters into transactions with VIEs structured by other parties. These include, for example, acting as a derivative counterparty, liquidity provider, investor, underwriter, placement agent, trustee or custodian. These transactions are conducted at arm’s-length, and individual credit decisions are based on the analysis of the specific VIE, taking into consideration the quality of the underlying assets. Where the Firm does not have the power to direct
the activities of the VIE that most significantly impact the VIE’s economic performance, or a variable interest that could potentially be significant, the Firm records and reports these positions on its Consolidated balance sheets similarly to the way it would record and report positions in respect of any other third-party transaction.
Consolidated VIE assets and liabilities
The following table presents information on assets and liabilities related to VIEs consolidated by the Firm as of
December 31, 2014
and
2013
.
|
Assets
|
Liabilities
|
|||||||||||||||||||||
|
December 31, 2014 (in billions)
(a)
|
Trading assets
|
Loans
|
Other
(c)
|
Total
assets (d) |
Beneficial interests in
VIE assets (e) |
Other
(f)
|
Total
liabilities |
|||||||||||||||
|
VIE program type
|
||||||||||||||||||||||
|
Firm-sponsored credit card trusts
|
$
|
—
|
|
$
|
48.3
|
|
$
|
0.7
|
|
$
|
49.0
|
|
$
|
31.2
|
|
$
|
—
|
|
$
|
31.2
|
|
|
|
Firm-administered multi-seller conduits
|
—
|
|
17.7
|
|
0.1
|
|
17.8
|
|
12.0
|
|
—
|
|
12.0
|
|
||||||||
|
Municipal bond vehicles
|
5.3
|
|
—
|
|
—
|
|
5.3
|
|
4.9
|
|
—
|
|
4.9
|
|
||||||||
|
Mortgage securitization entities
(b)
|
3.3
|
|
0.7
|
|
—
|
|
4.0
|
|
2.1
|
|
0.8
|
|
2.9
|
|
||||||||
|
Student loan securitization entities
|
0.2
|
|
2.2
|
|
—
|
|
2.4
|
|
2.1
|
|
—
|
|
2.1
|
|
||||||||
|
Other
|
0.3
|
|
—
|
|
1.0
|
|
1.3
|
|
0.1
|
|
0.1
|
|
0.2
|
|
||||||||
|
Total
|
$
|
9.1
|
|
$
|
68.9
|
|
$
|
1.8
|
|
$
|
79.8
|
|
$
|
52.4
|
|
$
|
0.9
|
|
$
|
53.3
|
|
|
|
Assets
|
Liabilities
|
|||||||||||||||||||||
|
December 31, 2013 (in billions)
(a)
|
Trading assets
|
Loans
|
Other
(c)
|
Total
assets (d) |
Beneficial interests in
VIE assets (e) |
Other
(f)
|
Total
liabilities |
|||||||||||||||
|
VIE program type
|
||||||||||||||||||||||
|
Firm-sponsored credit card trusts
|
$
|
—
|
|
$
|
46.9
|
|
$
|
1.1
|
|
$
|
48.0
|
|
$
|
26.6
|
|
$
|
—
|
|
$
|
26.6
|
|
|
|
Firm-administered multi-seller conduits
|
—
|
|
19.0
|
|
0.1
|
|
19.1
|
|
14.9
|
|
—
|
|
14.9
|
|
||||||||
|
Municipal bond vehicles
|
3.4
|
|
—
|
|
—
|
|
3.4
|
|
2.9
|
|
—
|
|
2.9
|
|
||||||||
|
Mortgage securitization entities
(b)
|
2.3
|
|
1.7
|
|
—
|
|
4.0
|
|
2.9
|
|
0.9
|
|
3.8
|
|
||||||||
|
Student loan securitization entities
|
—
|
|
2.4
|
|
0.1
|
|
2.5
|
|
2.2
|
|
—
|
|
2.2
|
|
||||||||
|
Other
|
0.7
|
|
0.1
|
|
0.9
|
|
1.7
|
|
0.1
|
|
0.2
|
|
0.3
|
|
||||||||
|
Total
|
$
|
6.4
|
|
$
|
70.1
|
|
$
|
2.2
|
|
$
|
78.7
|
|
$
|
49.6
|
|
$
|
1.1
|
|
$
|
50.7
|
|
|
|
(a)
|
Excludes intercompany transactions, which were eliminated in consolidation.
|
|
(b)
|
Includes residential and commercial mortgage securitizations as well as re-securitizations.
|
|
(c)
|
Includes assets classified as cash, derivative receivables, AFS securities, and other assets within the Consolidated balance sheets.
|
|
(d)
|
The assets of the consolidated VIEs included in the program types above are used to settle the liabilities of those entities. The difference between total assets and total liabilities recognized for consolidated VIEs represents the Firm’s interest in the consolidated VIEs for each program type.
|
|
(e)
|
The interest-bearing beneficial interest liabilities issued by consolidated VIEs are classified in the line item on the Consolidated balance sheets titled, “Beneficial interests issued by consolidated variable interest entities.” The holders of these beneficial interests do not have recourse to the general credit of
JPMorgan Chase
. Included in beneficial interests in VIE assets are long-term beneficial interests of
$35.4 billion
and
$31.8 billion
at
December 31, 2014
and
2013
, respectively. The maturities of the long-term beneficial interests as of
December 31, 2014
, were as follows:
$10.9 billion
under one year,
$19.0 billion
between one and five years, and
$5.5 billion
over five years, all respectively.
|
|
(f)
|
Includes liabilities classified as accounts payable and other liabilities in the Consolidated balance sheets.
|
|
268
|
JPMorgan Chase & Co./2014 Annual Report
|
|
Loan securitizations
The Firm has securitized and sold a variety of loans, including residential mortgage, credit card, automobile, student and commercial (primarily related to real estate) loans, as well as debt securities. The primary purposes of these securitization transactions were to satisfy investor demand and to generate liquidity for the Firm.
For loan securitizations in which the Firm is not required to consolidate the trust, the Firm records the transfer of the loan receivable to the trust as a sale when the accounting criteria for a sale are met. Those criteria are: (1) the transferred financial assets are legally isolated from the Firm’s creditors; (2) the transferee or beneficial interest
holder can pledge or exchange the transferred financial assets; and (3) the Firm does not maintain effective control over the transferred financial assets (e.g., the Firm cannot repurchase the transferred assets before their maturity and it does not have the ability to unilaterally cause the holder to return the transferred assets).
For loan securitizations accounted for as a sale, the Firm recognizes a gain or loss based on the difference between the value of proceeds received (including cash, beneficial interests, or servicing assets received) and the carrying value of the assets sold. Gains and losses on securitizations are reported in noninterest revenue.
Securitization activity
The following table provides information related to the Firm’s securitization activities for the years ended
December 31, 2014
,
2013
and
2012
, related to assets held in
JPMorgan Chase
-sponsored securitization entities that were not consolidated by the Firm, and where sale accounting was achieved based on the accounting rules in effect at the time of the securitization.
|
2014
|
2013
|
2012
|
|||||||||||||||||||
|
Year ended December 31,
(in millions, except rates)
(a)
|
Residential mortgage
(d)(e)
|
Commercial and other
(e)(f)
|
Residential mortgage
(d)(e)
|
Commercial and other
(e)(f)
|
Residential mortgage
(d)(e)
|
Commercial and other
(e)(f)
|
|||||||||||||||
|
Principal securitized
|
$
|
2,558
|
|
$
|
11,911
|
|
$
|
1,404
|
|
$
|
11,318
|
|
$
|
—
|
|
$
|
5,421
|
|
|||
|
All cash flows during the period:
|
|||||||||||||||||||||
|
Proceeds from new securitizations
(b)
|
$
|
2,569
|
|
$
|
12,079
|
|
$
|
1,410
|
|
$
|
11,507
|
|
$
|
—
|
|
$
|
5,705
|
|
|||
|
Servicing fees collected
|
557
|
|
4
|
|
576
|
|
5
|
|
662
|
|
4
|
|
|||||||||
|
Purchases of previously transferred financial assets (or the underlying collateral)
(c)
|
121
|
|
—
|
|
294
|
|
—
|
|
222
|
|
—
|
|
|||||||||
|
Cash flows received on interests
|
179
|
|
578
|
|
156
|
|
325
|
|
185
|
|
163
|
|
|||||||||
|
(a)
|
Excludes re-securitization transactions.
|
|
(b)
|
Proceeds from residential mortgage securitizations were received in the form of securities. During 2014,
$2.4 billion
of residential mortgage securitizations were received as securities and classified in level 2, and
$185 million
were in level 3 of the fair value hierarchy. During 2013,
$1.4 billion
of residential mortgage securitizations were received as securities and classified in level 2 of the fair value hierarchy. Proceeds from commercial mortgage securitizations were received as securities and cash. During 2014,
$11.4 billion
of proceeds from commercial mortgage securitizations were received as securities and classified in level 2, and
$130 million
of proceeds were classified as level 3 of the fair value hierarchy; and
$568 million
of proceeds from commercial mortgage securitizations were received as cash. During 2013,
$11.3 billion
of commercial mortgage securitizations were classified in level 2 of the fair value hierarchy, and
$207 million
of proceeds from commercial mortgage securitizations were received as cash. During 2012,
$5.7 billion
of commercial mortgage securitizations were classified in level 2 of the fair value hierarchy.
|
|
(c)
|
Includes cash paid by the Firm to reacquire assets from off–balance sheet, nonconsolidated entities – for example, loan repurchases due to representation and warranties and servicer clean-up calls.
|
|
(d)
|
Includes prime, Alt-A, subprime, and option ARMs. Excludes certain loan securitization transactions entered into with Ginnie Mae, Fannie Mae and Freddie Mac.
|
|
(e)
|
Key assumptions used to measure residential mortgage retained interests originated during the year included weighted-average life (in years) of
|
5.9
and
3.9
for the years ended December 31, 2014 and 2013, respectively, and weighted-average discount rate of
3.4%
and
2.5%
for the years ended December 31, 2014 and 2013, respectively. There were no residential mortgage securitizations during 2012. Key assumptions used to measure commercial and other retained interests originated during the year included weighted-average life (in years) of
6.5
,
8.3
and
8.8
for the years ended December 31, 2014, 2013, and 2012, respectively, and weighted-average discount rate of
4.8%
,
3.2%
and
3.6%
for the years ended December 31, 2014, 2013 and 2012, respectively.
(f) Includes commercial and student loan securitizations
.
Loans and excess MSRs sold to the GSEs, loans in securitization transactions pursuant to Ginnie Mae guidelines, and other third-party-sponsored securitization entities
In addition to the amounts reported in the securitization activity tables above, the Firm, in the normal course of business, sells originated and purchased mortgage loans and certain originated excess MSRs on a nonrecourse basis, predominantly to Fannie Mae and Freddie Mac (the “GSEs”). These loans and excess MSRs are sold primarily for the purpose of securitization by the GSEs, who provide certain
guarantee provisions (e.g., credit enhancement of the loans). The Firm also sells loans into securitization transactions pursuant to Ginnie Mae guidelines; these loans are typically insured or guaranteed by another U.S. government agency. The Firm does not consolidate the securitization vehicles underlying these transactions as it is not the primary beneficiary. For a limited number of loan sales, the Firm is obligated to share a portion of the credit risk associated with the sold loans with the purchaser. See Note 29 for additional information about the Firm’s loan sales- and securitization-related indemnifications.
|
JPMorgan Chase & Co./2014 Annual Report
|
269
|
|
Notes to consolidated financial statements
See Note 17 for additional information about the impact of the Firm’s sale of certain excess mortgage servicing rights.
The following table summarizes the activities related to loans sold to the GSEs, loans in securitization transactions pursuant to Ginnie Mae guidelines, and other third-party-sponsored securitization entities.
|
Year ended December 31,
(in millions)
|
2014
|
2013
|
2012
|
||||||
|
Carrying value of loans sold
(a)
|
$
|
55,802
|
|
$
|
166,028
|
|
$
|
179,008
|
|
|
Proceeds received from loan sales as cash
|
$
|
260
|
|
$
|
782
|
|
$
|
195
|
|
|
Proceeds from loans sales as securities
(b)
|
55,117
|
|
163,373
|
|
176,592
|
|
|||
|
Total proceeds received from loan sales
(c)
|
$
|
55,377
|
|
$
|
164,155
|
|
$
|
176,787
|
|
|
Gains on loan sales
(d)
|
$
|
316
|
|
$
|
302
|
|
$
|
141
|
|
|
(a)
|
Predominantly to the GSEs and in securitization transactions pursuant to Ginnie Mae guidelines.
|
|
(b)
|
Predominantly includes securities from the GSEs and Ginnie Mae that are generally sold shortly after receipt.
|
|
(c)
|
Excludes the value of MSRs retained upon the sale of loans. Gains on loans sales include the value of MSRs.
|
|
(d)
|
The carrying value of the loans accounted for at fair value approximated the proceeds received upon loan sale.
|
Options to repurchase delinquent loans
In addition to the Firm’s obligation to repurchase certain loans due to material breaches of representations and warranties as discussed in Note 29, the Firm also has the option to repurchase delinquent loans that it services for Ginnie Mae loan pools, as well as for other U.S. government agencies under certain arrangements. The Firm typically elects to repurchase delinquent loans from Ginnie Mae loan pools as it continues to service them and/or manage the foreclosure process in accordance with the applicable requirements, and such loans continue to be insured or guaranteed. When the Firm’s repurchase option becomes exercisable, such loans must be reported on the Consolidated balance sheets as a loan with a corresponding liability. As of
December 31, 2014
and
2013
, the Firm had recorded on its Consolidated balance sheets
$12.4 billion
and
$14.3 billion
, respectively, of loans that either had been repurchased or for which the Firm had an option to repurchase. Predominantly all of these amounts relate to loans that have been repurchased from Ginnie Mae loan pools. Additionally, real estate owned resulting from voluntary repurchases of loans was
$464 million
and
$2.0 billion
as of
December 31, 2014
and
2013
, respectively. Substantially all of these loans and real estate owned are insured or guaranteed by U.S. government agencies. For additional information, refer to Note 14.
Loan delinquencies and liquidation losses
The table below includes information about components of nonconsolidated securitized financial assets, in which the Firm has continuing involvement, and delinquencies as of
December 31, 2014
and
2013
.
|
Securitized assets
|
90 days past due
|
Liquidation losses
|
||||||||||||||||||
|
As of or for the year ended December 31, (in millions)
|
2014
|
2013
|
2014
|
2013
|
2014
|
2013
|
||||||||||||||
|
Securitized loans
(a)
|
||||||||||||||||||||
|
Residential mortgage:
|
||||||||||||||||||||
|
Prime/ Alt-A & Option ARMs
|
$
|
78,294
|
|
$
|
90,381
|
|
$
|
11,363
|
|
$
|
14,882
|
|
$
|
2,166
|
|
$
|
4,688
|
|
||
|
Subprime mortgage
|
25,659
|
|
28,008
|
|
6,473
|
|
7,726
|
|
1,931
|
|
2,420
|
|
||||||||
|
Commercial and other
|
94,438
|
|
98,018
|
|
1,522
|
|
2,350
|
|
1,267
|
|
1,003
|
|
||||||||
|
Total loans securitized
(b)
|
$
|
198,391
|
|
$
|
216,407
|
|
$
|
19,358
|
|
$
|
24,958
|
|
$
|
5,364
|
|
$
|
8,111
|
|
||
|
(a)
|
Total assets held in securitization-related SPEs were
$254.3 billion
and
$271.7 billion
, respectively, at
December 31, 2014
and
2013
. The
$198.4 billion
and
$216.4 billion
, respectively, of loans securitized at
December 31, 2014
and
2013
, excludes:
$52.2 billion
and
$50.8 billion
, respectively, of securitized loans in which the Firm has no continuing involvement, and
$3.7 billion
and
$4.5 billion
, respectively, of loan securitizations consolidated on the Firm’s Consolidated balance sheets at
December 31, 2014
and
2013
.
|
|
(b)
|
Includes securitized loans that were previously recorded at fair value and classified as trading assets.
|
|
270
|
JPMorgan Chase & Co./2014 Annual Report
|
|
Goodwill
Goodwill is recorded upon completion of a business combination as the difference between the purchase price and the fair value of the net assets acquired. Subsequent to initial recognition, goodwill is not amortized but is tested for impairment during the fourth quarter of each fiscal year, or more often if events or circumstances, such as adverse changes in the business climate, indicate there may be impairment.
The goodwill associated with each business combination is allocated to the related reporting units, which are determined based on how the Firm’s businesses are managed and how they are reviewed by the Firm’s Operating Committee. The following table presents goodwill attributed to the business segments.
|
December 31, (in millions)
|
2014
|
2013
|
2012
|
||||||
|
Consumer & Community Banking
|
$
|
30,941
|
|
$
|
30,985
|
|
$
|
31,048
|
|
|
Corporate & Investment Bank
|
6,780
|
|
6,888
|
|
6,895
|
|
|||
|
Commercial Banking
|
2,861
|
|
2,862
|
|
2,863
|
|
|||
|
Asset Management
|
6,964
|
|
6,969
|
|
6,992
|
|
|||
|
Corporate
(a)
|
101
|
|
377
|
|
377
|
|
|||
|
Total goodwill
|
$
|
47,647
|
|
$
|
48,081
|
|
$
|
48,175
|
|
|
(a)
|
The remaining
$101 million
of Private Equity goodwill was disposed of as part of the Private Equity sale completed in January 2015. For further information on the Private Equity sale, see Note 2.
|
The following table presents changes in the carrying amount of goodwill.
|
Year ended December 31,
(in millions)
|
2014
|
2013
|
2012
|
||||||||
|
Balance at beginning of period
|
$
|
48,081
|
|
$
|
48,175
|
|
$
|
48,188
|
|
||
|
Changes during the period from:
|
|
|
|||||||||
|
Business combinations
|
43
|
|
64
|
|
43
|
|
|||||
|
Dispositions
|
(80
|
)
|
(5
|
)
|
(4
|
)
|
|||||
|
Other
(a)
|
(397
|
)
|
(153
|
)
|
(52
|
)
|
|||||
|
Balance at December 31,
|
$
|
47,647
|
|
$
|
48,081
|
|
$
|
48,175
|
|
||
|
(a)
|
Includes foreign currency translation adjustments, other tax-related adjustments, and, during
2014
, goodwill impairment associated with the Firm’s Private Equity business of
$276 million
.
|
Impairment testing
During
2014
, the Firm recognized impairments of the Private Equity business’ goodwill totaling
$276 million
.
The Firm’s remaining goodwill was not impaired at
December 31, 2014
. Further, the Firm’s goodwill was not impaired at
December 31, 2013
nor was any goodwill written off due to impairment during
2013
or
2012
.
The goodwill impairment test is performed in two steps. In the first step, the current fair value of each reporting unit is compared with its carrying value, including goodwill. If the fair value is in excess of the carrying value (including goodwill), then the reporting unit’s goodwill is considered not to be impaired. If the fair value is less than the carrying value (including goodwill), then a second step is performed. In the second step, the implied current fair value of the reporting unit’s goodwill is determined by comparing the
fair value of the reporting unit (as determined in step one) to the fair value of the net assets of the reporting unit, as if the reporting unit were being acquired in a business combination. The resulting implied current fair value of goodwill is then compared with the carrying value of the reporting unit’s goodwill. If the carrying value of the goodwill exceeds its implied current fair value, then an impairment charge is recognized for the excess. If the carrying value of goodwill is less than its implied current fair value, then no goodwill impairment is recognized.
The Firm uses the reporting units’ allocated equity plus goodwill capital as a proxy for the carrying amounts of equity for the reporting units in the goodwill impairment testing. Reporting unit equity is determined on a similar basis as the allocation of equity to the Firm’s lines of business, which takes into consideration the capital the business segment would require if it were operating independently, incorporating sufficient capital to address regulatory capital requirements (including Basel III), economic risk measures and capital levels for similarly rated peers. Proposed line of business equity levels are incorporated into the Firm’s annual budget process, which is reviewed by the Firm’s Board of Directors. Allocated equity is further reviewed on a periodic basis and updated as needed.
The primary method the Firm uses to estimate the fair value of its reporting units is the income approach. The models project cash flows for the forecast period and use the perpetuity growth method to calculate terminal values. These cash flows and terminal values are then discounted using an appropriate discount rate. Projections of cash flows are based on the reporting units’ earnings forecasts, which include the estimated effects of regulatory and legislative changes (including, but not limited to the Dodd-Frank Wall Street Reform and Consumer Protection Act (the “Dodd-Frank Act”)), and which are reviewed with the senior management of the Firm. The discount rate used for each reporting unit represents an estimate of the cost of equity for that reporting unit and is determined considering the Firm’s overall estimated cost of equity (estimated using the Capital Asset Pricing Model), as adjusted for the risk characteristics specific to each reporting unit (for example, for higher levels of risk or uncertainty associated with the business or management’s forecasts and assumptions). To assess the reasonableness of the discount rates used for each reporting unit management compares the discount rate to the estimated cost of equity for publicly traded institutions with similar businesses and risk characteristics. In addition, the weighted average cost of equity (aggregating the various reporting units) is compared with the Firms’ overall estimated cost of equity to ensure reasonableness.
The valuations derived from the discounted cash flow models are then compared with market-based trading and transaction multiples for relevant competitors. Trading and transaction comparables are used as general indicators to assess the general reasonableness of the estimated fair
|
JPMorgan Chase & Co./2014 Annual Report
|
271
|
|
Notes to consolidated financial statements
values, although precise conclusions generally cannot be drawn due to the differences that naturally exist between the Firm’s businesses and competitor institutions. Management also takes into consideration a comparison between the aggregate fair value of the Firm’s reporting units and JPMorgan Chase’s market capitalization. In evaluating this comparison, management considers several factors, including (a) a control premium that would exist in a market transaction, (b) factors related to the level of execution risk that would exist at the firmwide level that do not exist at the reporting unit level and (c) short-term market volatility and other factors that do not directly affect the value of individual reporting units.
Deterioration in economic market conditions, increased estimates of the effects of regulatory or legislative changes, or additional regulatory or legislative changes may result in declines in projected business performance beyond management’s current expectations. For example, in the Firm’s Mortgage Banking business, such declines could result from increases in primary mortgage interest rates, lower mortgage origination volume, higher costs to resolve foreclosure-related matters or from deterioration in economic conditions, including decreases in home prices that result in increased credit losses. Declines in business performance, increases in equity capital requirements, or increases in the estimated cost of equity, could cause the estimated fair values of the Firm’s reporting units or their associated goodwill to decline in the future, which could result in a material impairment charge to earnings in a future period related to some portion of the associated goodwill.
Mortgage servicing rights
Mortgage servicing rights represent the fair value of expected future cash flows for performing servicing activities for others. The fair value considers estimated future servicing fees and ancillary revenue, offset by estimated costs to service the loans, and generally declines over time as net servicing cash flows are received, effectively amortizing the MSR asset against contractual servicing and ancillary fee income. MSRs are either purchased from third parties or recognized upon sale or securitization of mortgage loans if servicing is retained.
As permitted by U.S. GAAP, the Firm has elected to account for its MSRs at fair value. The Firm treats its MSRs as a single class of servicing assets based on the availability of market inputs used to measure the fair value of its MSR asset and its treatment of MSRs as one aggregate pool for risk management purposes. The Firm estimates the fair value of MSRs using an option-adjusted spread (“OAS”) model, which projects MSR cash flows over multiple interest rate scenarios in conjunction with the Firm’s prepayment model, and then discounts these cash flows at risk-adjusted rates. The model considers portfolio characteristics, contractually specified servicing fees, prepayment assumptions, delinquency rates, costs to service, late charges and other ancillary revenue, and other economic factors. The Firm compares fair value estimates and assumptions to observable market data where available, and also considers recent market activity and actual portfolio experience.
|
272
|
JPMorgan Chase & Co./2014 Annual Report
|
|
The fair value of MSRs is sensitive to changes in interest rates, including their effect on prepayment speeds. MSRs typically decrease in value when interest rates decline because declining interest rates tend to increase prepayments and therefore reduce the expected life of the net servicing cash flows that comprise the MSR asset. Conversely, securities (e.g., mortgage-backed securities), principal-only certificates and certain derivatives (i.e.,
those for which the Firm receives fixed-rate interest payments) increase in value when interest rates decline. JPMorgan Chase uses combinations of derivatives and securities to manage changes in the fair value of MSRs. The intent is to offset any interest-rate related changes in the fair value of MSRs with changes in the fair value of the related risk management instruments.
The following table summarizes MSR activity for the years ended
December 31, 2014
,
2013
and
2012
.
|
As of or for the year ended December 31, (in millions, except where otherwise noted)
|
2014
|
|
2013
|
|
2012
|
|
|||||
|
Fair value at beginning of period
|
$
|
9,614
|
|
$
|
7,614
|
|
$
|
7,223
|
|
||
|
MSR activity:
|
|||||||||||
|
Originations of MSRs
|
757
|
|
2,214
|
|
2,376
|
|
|||||
|
Purchase of MSRs
|
11
|
|
1
|
|
457
|
|
|||||
|
Disposition of MSRs
(a)
|
(209
|
)
|
(725
|
)
|
(579
|
)
|
|||||
|
Net additions
|
559
|
|
1,490
|
|
2,254
|
|
|||||
|
Changes due to collection/realization of expected cash flows
(b)
|
(911
|
)
|
(1,102
|
)
|
(1,228
|
)
|
|||||
|
Changes in valuation due to inputs and assumptions:
|
|||||||||||
|
Changes due to market interest rates and other
(c)
|
(1,608
|
)
|
2,122
|
|
(589
|
)
|
|||||
|
Changes in valuation due to other inputs and assumptions:
|
|||||||||||
|
Projected cash flows (e.g., cost to service)
(d)
|
133
|
|
109
|
|
(452
|
)
|
|||||
|
Discount rates
|
(459
|
)
|
(h)
|
(78
|
)
|
(98
|
)
|
||||
|
Prepayment model changes and other
(e)
|
108
|
|
(541
|
)
|
504
|
|
|||||
|
Total changes in valuation due to other inputs and assumptions
|
(218
|
)
|
(510
|
)
|
(46
|
)
|
|||||
|
Total changes in valuation due to inputs and assumptions
(b)
|
$
|
(1,826
|
)
|
$
|
1,612
|
|
$
|
(635
|
)
|
||
|
Fair value at December 31,
(f)
|
$
|
7,436
|
|
$
|
9,614
|
|
$
|
7,614
|
|
||
|
Change in unrealized gains/(losses) included in income related to MSRs
held at December 31, |
$
|
(1,826
|
)
|
$
|
1,612
|
|
$
|
(635
|
)
|
||
|
Contractual service fees, late fees and other ancillary fees included in income
|
$
|
2,884
|
|
$
|
3,309
|
|
$
|
3,783
|
|
||
|
Third-party mortgage loans serviced at December 31, (in billions)
|
$
|
756
|
|
$
|
822
|
|
$
|
867
|
|
||
|
Servicer advances, net of an allowance for uncollectible amounts, at December 31, (in billions)
(g)
|
$
|
8.5
|
|
$
|
9.6
|
|
$
|
10.9
|
|
||
|
(a)
|
Predominantly represents excess mortgage servicing rights transferred to agency-sponsored trusts in exchange for stripped mortgage backed securities (“SMBS”). In each transaction, a portion of the SMBS was acquired by third parties at the transaction date; the Firm acquired and has retained the remaining balance of those SMBS as trading securities. Also includes sales of MSRs in 2013 and 2012.
|
|
(b)
|
Included changes related to commercial real estate of
$(7) million
,
$(5) million
and
$(8) million
for the years ended
December 31, 2014
,
2013
and
2012
, respectively.
|
|
(c)
|
Represents both the impact of changes in estimated future prepayments due to changes in market interest rates, and the difference between actual and expected prepayments.
|
|
(d)
|
For the year ended December 31, 2013, the increase was driven by the inclusion in the MSR valuation model of servicing fees receivable on certain delinquent loans.
|
|
(e)
|
Represents changes in prepayments other than those attributable to changes in market interest rates. For the year ended December 31, 2013, the decrease was driven by changes in the inputs and assumptions used to derive prepayment speeds, primarily increases in home prices.
|
|
(f)
|
Included
$11 million
,
$18 million
and
$23 million
related to commercial real estate at
December 31, 2014
,
2013
, and
2012
, respectively.
|
|
(g)
|
Represents amounts the Firm pays as the servicer (e.g., scheduled principal and interest to a trust, taxes and insurance), which will generally be reimbursed within a short period of time after the advance from future cash flows from the trust or the underlying loans. The Firm’s credit risk associated with these advances is minimal because reimbursement of the advances is typically senior to all cash payments to investors. In addition, the Firm maintains the right to stop payment to investors if the collateral is insufficient to cover the advance. However, certain of these servicer advances may not be recoverable if they were not made in accordance with applicable rules and agreements.
|
|
(h)
|
For the year ending December 31, 2014, the decrease was primarily related to higher capital allocated to the Mortgage Servicing business, which, in turn, resulted in an increase in the option adjusted spread (“OAS”). The resulting OAS assumption continues to be consistent with capital and return requirements that the Firm believes a market participant would consider, taking into account factors such as the current operating risk environment and regulatory and economic capital requirements.
|
|
JPMorgan Chase & Co./2014 Annual Report
|
273
|
|
Notes to consolidated financial statements
The following table presents the components of mortgage fees and related income (including the impact of MSR risk management activities) for the years ended
December 31, 2014
,
2013
and
2012
.
|
Year ended December 31,
(in millions)
|
2014
|
2013
|
2012
|
||||||||
|
CCB mortgage fees and related income
|
|||||||||||
|
Net production revenue:
|
|||||||||||
|
Production revenue
|
$
|
732
|
|
$
|
2,673
|
|
$
|
5,783
|
|
||
|
Repurchase (losses)/benefits
|
458
|
|
331
|
|
(272
|
)
|
|||||
|
Net production revenue
|
1,190
|
|
3,004
|
|
5,511
|
|
|||||
|
Net mortgage servicing revenue
|
|
|
|||||||||
|
Operating revenue:
|
|
|
|||||||||
|
Loan servicing revenue
|
3,303
|
|
3,552
|
|
3,772
|
|
|||||
|
Changes in MSR asset fair value due to collection/realization of expected cash flows
|
(905
|
)
|
(1,094
|
)
|
(1,222
|
)
|
|||||
|
Total operating revenue
|
2,398
|
|
2,458
|
|
2,550
|
|
|||||
|
Risk management:
|
|
|
|||||||||
|
Changes in MSR asset fair value
due to market interest rates and
other
(a)
|
(1,606
|
)
|
2,119
|
|
(587
|
)
|
|||||
|
Other changes in MSR asset fair value due to other inputs and assumptions in model
(b)
|
(218
|
)
|
(511
|
)
|
(46
|
)
|
|||||
|
Change in derivative fair value and other
|
1,796
|
|
(1,875
|
)
|
1,252
|
|
|||||
|
Total risk management
|
(28
|
)
|
(267
|
)
|
619
|
|
|||||
|
Total CCB net mortgage servicing revenue
|
2,370
|
|
2,191
|
|
3,169
|
|
|||||
|
All other
|
3
|
|
10
|
|
7
|
|
|||||
|
Mortgage fees and related income
|
$
|
3,563
|
|
$
|
5,205
|
|
$
|
8,687
|
|
||
|
(a)
|
Represents both the impact of changes in estimated future prepayments due to changes in market interest rates, and the difference between actual and expected prepayments.
|
|
(b)
|
Represents the aggregate impact of changes in model inputs and assumptions such as projected cash flows (e.g., cost to service), discount rates and changes in prepayments other than those attributable to changes in market interest rates (e.g., changes in prepayments due to changes in home prices). For the year ended December 31, 2013, the decrease was driven by changes in the inputs and assumptions used to derive prepayment speeds, primarily increases in home prices.
|
The table below outlines the key economic assumptions used to determine the fair value of the Firm’s MSRs at
December 31, 2014
and
2013
, and outlines the sensitivities of those fair values to immediate adverse changes in those assumptions, as defined below.
|
December 31,
(in millions, except rates)
|
2014
|
2013
|
|||||
|
Weighted-average prepayment speed assumption (“CPR”)
|
9.80
|
%
|
8.07
|
%
|
|||
|
Impact on fair value of 10% adverse change
|
$
|
(337
|
)
|
$
|
(362
|
)
|
|
|
Impact on fair value of 20% adverse change
|
(652
|
)
|
(705
|
)
|
|||
|
Weighted-average option adjusted spread
|
9.43
|
%
|
7.77
|
%
|
|||
|
Impact on fair value of 100 basis points adverse change
|
$
|
(300
|
)
|
$
|
(389
|
)
|
|
|
Impact on fair value of 200 basis points adverse change
|
(578
|
)
|
(750
|
)
|
|||
CPR: Constant prepayment rate.
The sensitivity analysis in the preceding table is hypothetical and should be used with caution. Changes in fair value based on variation in assumptions generally cannot be easily extrapolated, because the relationship of the change in the assumptions to the change in fair value are often highly interrelated and may not be linear. In this table, the effect that a change in a particular assumption may have on the fair value is calculated without changing any other assumption. In reality, changes in one factor may result in changes in another, which would either magnify or counteract the impact of the initial change.
Other intangible assets
Other intangible assets are recorded at their fair value upon completion of a business combination or certain other transactions, and generally represent the value of customer relationships or arrangements. Subsequently, the Firm’s intangible assets with finite lives, including core deposit intangibles, purchased credit card relationships, and other intangible assets, are amortized over their useful lives in a manner that best reflects the economic benefits of the intangible asset. The
$426 million
decrease in other intangible assets during
2014
was predominantly due to
$380 million
in amortization.
|
274
|
JPMorgan Chase & Co./2014 Annual Report
|
|
The components of credit card relationships, core deposits and other intangible assets were as follows.
|
2014
|
2013
|
||||||||||||||||||
|
Gross amount
(a)
|
Accumulated amortization
(a)
|
Net
carrying value
|
Gross amount
|
Accumulated amortization
|
Net
carrying value
|
||||||||||||||
|
December 31, (in millions)
|
|||||||||||||||||||
|
Purchased credit card relationships
|
$
|
200
|
|
$
|
166
|
|
$
|
34
|
|
$
|
3,540
|
|
$
|
3,409
|
|
$
|
131
|
|
|
|
Other credit card-related intangibles
|
497
|
|
378
|
|
$
|
119
|
|
542
|
|
369
|
|
$
|
173
|
|
|||||
|
Core deposit intangibles
|
814
|
|
757
|
|
$
|
57
|
|
4,133
|
|
3,974
|
|
$
|
159
|
|
|||||
|
Other intangibles
(b)
|
1,880
|
|
898
|
|
$
|
982
|
|
2,374
|
|
1,219
|
|
$
|
1,155
|
|
|||||
|
Total other intangible assets
|
$
|
3,391
|
|
$
|
2,199
|
|
$
|
1,192
|
|
$
|
10,589
|
|
$
|
8,971
|
|
$
|
1,618
|
|
|
|
(a)
|
The decrease in the gross amount and accumulated amortization from
December 31, 2013
, was due to the removal of fully amortized assets, predominantly related to intangible assets acquired in the 2004 merger with Bank One Corporation (“Bank One”).
|
|
(b)
|
Includes intangible assets of approximately
$600 million
consisting primarily of asset management advisory contracts, which were determined to have an indefinite life and are not amortized.
|
Amortization expense
The following table presents amortization expense related to credit card relationships, core deposits and other intangible assets.
|
Year ended December 31, (in millions)
|
2014
|
2013
|
2012
|
||||||||
|
Purchased credit card relationships
|
$
|
97
|
|
$
|
195
|
|
$
|
309
|
|
||
|
Other credit card-related intangibles
|
51
|
|
58
|
|
265
|
|
|||||
|
Core deposit intangibles
|
102
|
|
196
|
|
239
|
|
|||||
|
Other intangibles
|
130
|
|
188
|
|
144
|
|
|||||
|
Total amortization expense
(a)
|
$
|
380
|
|
$
|
637
|
|
$
|
957
|
|
||
|
(a)
|
The decline in amortization expense during 2014 predominantly related to intangible assets acquired in the 2004 merger with Bank One, most of which became fully amortized during the second quarter of 2014.
|
Future amortization expense
The following table presents estimated future amortization expense related to credit card relationships, core deposits and other intangible assets at
December 31, 2014
.
|
Year ended December 31, (in millions)
|
Purchased credit card relationships
|
Other credit
card-related intangibles
|
Core deposit intangibles
|
Other
intangibles
|
Total
|
||||||||||
|
2015
|
$
|
13
|
|
$
|
38
|
|
$
|
26
|
|
$
|
89
|
|
$
|
166
|
|
|
2016
|
6
|
|
33
|
|
14
|
|
73
|
|
126
|
|
|||||
|
2017
|
5
|
|
28
|
|
7
|
|
70
|
|
110
|
|
|||||
|
2018
|
3
|
|
20
|
|
5
|
|
50
|
|
78
|
|
|||||
|
2019
|
2
|
|
—
|
|
3
|
|
37
|
|
42
|
|
|||||
Impairment testing
The Firm’s intangible assets are tested for impairment annually or more often if events or changes in circumstances indicate that the asset might be impaired.
The impairment test for a finite-lived intangible asset compares the undiscounted cash flows associated with the use or disposition of the intangible asset to its carrying value. If the sum of the undiscounted cash flows exceeds its carrying value, then no impairment charge is recorded. If the sum of the undiscounted cash flows is less than its carrying value, then an impairment charge is recognized in amortization expense to the extent the carrying amount of the asset exceeds its fair value.
The impairment test for indefinite-lived intangible assets compares the fair value of the intangible asset to its carrying amount. If the carrying value exceeds the fair value, then an impairment charge is recognized in amortization expense for the difference.
|
JPMorgan Chase & Co./2014 Annual Report
|
275
|
|
Notes to consolidated financial statements
Premises and equipment, including leasehold improvements, are carried at cost less accumulated depreciation and amortization.
JPMorgan Chase
computes depreciation using the straight-line method over the estimated useful life of an asset. For leasehold improvements, the Firm uses the straight-line method computed over the lesser of the remaining term of the leased facility or the estimated useful life of the leased asset.
JPMorgan Chase
capitalizes certain costs associated with the acquisition or development of internal-use software. Once the software is ready for its intended use, these costs are amortized on a straight-line basis over the software’s expected useful life and reviewed for impairment on an ongoing basis.
At
December 31, 2014
and
2013
, noninterest-bearing and interest-bearing deposits were as follows.
|
December 31, (in millions)
|
2014
|
|
2013
|
|
|||
|
U.S. offices
|
|||||||
|
Noninterest-bearing
|
$
|
437,558
|
|
$
|
389,863
|
|
|
|
Interest-bearing
|
|||||||
|
Demand
(a)
|
90,319
|
|
84,631
|
|
|||
|
Savings
(b)
|
466,730
|
|
450,405
|
|
|||
|
Time (included
$7,501
and $
5,995
at fair value)
(c)
|
86,301
|
|
91,356
|
|
|||
|
Total interest-bearing deposits
|
643,350
|
|
626,392
|
|
|||
|
Total deposits in U.S. offices
|
1,080,908
|
|
1,016,255
|
|
|||
|
Non-U.S. offices
|
|||||||
|
Noninterest-bearing
|
19,078
|
|
17,611
|
|
|||
|
Interest-bearing
|
|||||||
|
Demand
|
217,011
|
|
214,391
|
|
|||
|
Savings
|
2,673
|
|
1,083
|
|
|||
|
Time (included
$1,306
and $629 at fair value)
(c)
|
43,757
|
|
38,425
|
|
|||
|
Total interest-bearing deposits
|
263,441
|
|
253,899
|
|
|||
|
Total deposits in non-U.S. offices
|
282,519
|
|
271,510
|
|
|||
|
Total deposits
|
$
|
1,363,427
|
|
$
|
1,287,765
|
|
|
|
(a)
|
Includes Negotiable Order of Withdrawal (“NOW”) accounts, and certain trust accounts.
|
|
(b)
|
Includes Money Market Deposit Accounts (“MMDAs”).
|
|
(c)
|
Includes structured notes classified as deposits for which the fair value option has been elected. For further discussion, see Note 4.
|
At
December 31, 2014
and
2013
, time deposits in denominations of $100,000 or more were as follows.
|
December 31, (in millions)
|
2014
|
|
2013
|
|
||||
|
U.S. offices
|
$
|
71,630
|
|
$
|
74,804
|
|
||
|
Non-U.S. offices
|
43,743
|
|
38,412
|
|
||||
|
Total
|
$
|
115,373
|
|
$
|
113,216
|
|
||
At
December 31, 2014
, the maturities of interest-bearing time deposits were as follows.
|
December 31, 2014
|
|
|
|
|
|
|
||||||
|
(in millions)
|
U.S.
|
Non-U.S.
|
Total
|
|||||||||
|
2015
|
$
|
70,929
|
|
$
|
43,031
|
|
$
|
113,960
|
|
|||
|
2016
|
6,511
|
|
424
|
|
6,935
|
|
||||||
|
2017
|
1,480
|
|
61
|
|
1,541
|
|
||||||
|
2018
|
1,750
|
|
75
|
|
1,825
|
|
||||||
|
2019
|
1,423
|
|
166
|
|
1,589
|
|
||||||
|
After 5 years
|
4,208
|
|
—
|
|
4,208
|
|
||||||
|
Total
|
$
|
86,301
|
|
$
|
43,757
|
|
$
|
130,058
|
|
|||
Accounts payable and other liabilities consist of payables to customers; payables to brokers, dealers and clearing organizations; payables from security purchases that did not settle; income taxes payables; accrued expense, including interest-bearing liabilities; and all other liabilities, including litigation reserves and obligations to return securities received as collateral.
The following table details the components of accounts payable and other liabilities.
|
December 31, (in millions)
|
2014
|
|
2013
|
|
||||
|
Brokerage payables
(a)
|
$
|
134,467
|
|
$
|
116,391
|
|
||
|
Accounts payable and other liabilities
(b)
|
72,487
|
|
78,100
|
|
||||
|
Total
|
$
|
206,954
|
|
$
|
194,491
|
|
||
|
(a)
|
Includes payables to customers, brokers, dealers and clearing organizations, and payables from security purchases that did not settle.
|
|
(b)
|
Includes
$36 million
and
$25 million
accounted for at fair value at
December 31, 2014
and
2013
, respectively.
|
|
276
|
JPMorgan Chase & Co./2014 Annual Report
|
|
JPMorgan Chase issues long-term debt denominated in various currencies, although predominantly U.S. dollars, with both fixed and variable interest rates. Included in senior and subordinated debt below are various equity-linked or other indexed instruments, which the Firm has elected to measure at fair value. Changes in fair value are recorded in principal transactions revenue in the Consolidated statements of income. The following table is a summary of long-term debt carrying values (including unamortized original issue discount, valuation adjustments and fair value adjustments, where applicable) by remaining contractual maturity as of
December 31, 2014
.
|
By remaining maturity at
December 31,
|
|
2014
|
2013
|
|
||||||||||||||||
|
(in millions, except rates)
|
|
Under 1 year
|
|
1-5 years
|
|
After 5 years
|
|
Total
|
|
Total
|
|
|||||||||
|
Parent company
|
|
|
|
|
|
|
|
|
||||||||||||
|
Senior debt:
|
Fixed rate
|
$
|
13,214
|
|
$
|
46,275
|
|
$
|
49,300
|
|
$
|
108,789
|
|
$
|
101,074
|
|
||||
|
|
Variable rate
|
7,196
|
|
28,482
|
|
6,572
|
|
42,250
|
|
41,030
|
|
|||||||||
|
|
Interest rates
(a)
|
0.33-6.75%
|
|
0.27-7.25%
|
|
0.18-6.40%
|
|
0.18-7.25%
|
|
0.19-7.25%
|
|
|||||||||
|
Subordinated debt:
|
Fixed rate
|
$
|
2,581
|
|
$
|
2,373
|
|
$
|
11,763
|
|
$
|
16,717
|
|
$
|
15,198
|
|
||||
|
|
Variable rate
|
1,446
|
|
2,000
|
|
9
|
|
3,455
|
|
4,566
|
|
|||||||||
|
|
Interest rates
(a)
|
0.48-5.25%
|
|
1.06-8.53%
|
|
3.38-8.00%
|
|
0.48-8.53%
|
|
0.63-8.53%
|
|
|||||||||
|
|
Subtotal
|
$
|
24,437
|
|
$
|
79,130
|
|
$
|
67,644
|
|
$
|
171,211
|
|
$
|
161,868
|
|
||||
|
Subsidiaries
|
|
|
|
|
|
|
|
|
|
|
|
|||||||||
|
Federal Home Loan Banks (“FHLB”) advances:
|
Fixed rate
|
$
|
2,006
|
|
$
|
32
|
|
$
|
166
|
|
$
|
2,204
|
|
$
|
3,236
|
|
||||
|
Variable rate
|
7,800
|
|
53,490
|
|
1,500
|
|
62,790
|
|
58,640
|
|
||||||||||
|
Interest rates
(a)
|
0.27-2.04%
|
|
0.11-0.43%
|
|
0.39
|
%
|
0.11-2.04%
|
|
0.16-2.04%
|
|
||||||||||
|
Senior debt:
|
Fixed rate
|
$
|
334
|
|
$
|
1,493
|
|
$
|
3,924
|
|
$
|
5,751
|
|
$
|
5,428
|
|
||||
|
|
Variable rate
|
3,805
|
|
13,692
|
|
2,587
|
|
20,084
|
|
23,458
|
|
|||||||||
|
|
Interest rates
(a)
|
0.36-0.48%
|
|
0.26-8.00%
|
|
1.30-7.28%
|
|
0.26-8.00%
|
|
0.12-8.00%
|
|
|||||||||
|
Subordinated debt:
|
Fixed rate
|
$
|
—
|
|
$
|
5,289
|
|
$
|
1,647
|
|
$
|
6,936
|
|
$
|
7,286
|
|
||||
|
|
Variable rate
|
—
|
|
2,364
|
|
—
|
|
2,364
|
|
2,528
|
|
|||||||||
|
|
Interest rates
(a)
|
—
|
%
|
0.57-6.00%
|
|
4.38-8.25%
|
|
0.57-8.25%
|
|
0.57-8.25%
|
|
|||||||||
|
|
Subtotal
|
$
|
13,945
|
|
$
|
76,360
|
|
$
|
9,824
|
|
$
|
100,129
|
|
$
|
100,576
|
|
||||
|
Junior subordinated debt:
|
Fixed rate
|
$
|
—
|
|
$
|
—
|
|
$
|
2,226
|
|
$
|
2,226
|
|
$
|
2,176
|
|
||||
|
|
Variable rate
|
—
|
|
—
|
|
3,270
|
|
3,270
|
|
3,269
|
|
|||||||||
|
|
Interest rates
(a)
|
—
|
%
|
—
|
%
|
0.73-8.75%
|
|
0.73-8.75%
|
|
0.74-8.75%
|
|
|||||||||
|
|
Subtotal
|
$
|
—
|
|
$
|
—
|
|
$
|
5,496
|
|
$
|
5,496
|
|
$
|
5,445
|
|
||||
|
Total long-term debt
(b)(c)(d)
|
|
$
|
38,382
|
|
$
|
155,490
|
|
$
|
82,964
|
|
$
|
276,836
|
|
(f)(g)
|
$
|
267,889
|
|
|||
|
Long-term beneficial interests:
|
|
|
|
|
|
|
|
|
|
|
|
|||||||||
|
|
Fixed rate
|
$
|
4,650
|
|
$
|
7,924
|
|
$
|
1,398
|
|
$
|
13,972
|
|
$
|
10,958
|
|
||||
|
|
Variable rate
|
6,230
|
|
11,079
|
|
4,128
|
|
21,437
|
|
20,872
|
|
|||||||||
|
|
Interest rates
|
0.18-1.36%
|
|
0.20-5.23%
|
|
0.05-15.93%
|
|
0.05-15.93%
|
|
0.04-15.93%
|
|
|||||||||
|
Total long-term beneficial interests
(e)
|
|
$
|
10,880
|
|
$
|
19,003
|
|
$
|
5,526
|
|
$
|
35,409
|
|
$
|
31,830
|
|
||||
|
(a)
|
The interest rates shown are the range of contractual rates in effect at year-end, including non-U.S. dollar fixed- and variable-rate issuances, which excludes the effects of the associated derivative instruments used in hedge accounting relationships, if applicable. The use of these derivative instruments modifies the Firm’s exposure to the contractual interest rates disclosed in the table above. Including the effects of the hedge accounting derivatives, the range of modified rates in effect at
December 31, 2014
, for total long-term debt was
(0.10)%
to
8.55%
, versus the contractual range of
0.11%
to
8.75%
presented in the table above. The interest rate ranges shown exclude structured notes accounted for at fair value.
|
|
(b)
|
Included long-term debt of
$69.2 billion
and
$68.4 billion
secured by assets totaling
$156.7 billion
and
$131.3 billion
at
December 31, 2014
and
2013
, respectively. The amount of long-term debt secured by assets does not include amounts related to hybrid instruments.
|
|
(c)
|
Included
$30.2 billion
and
$28.9 billion
of long-term debt accounted for at fair value at
December 31, 2014
and
2013
, respectively.
|
|
(d)
|
Included
$2.9 billion
and
$2.7 billion
of outstanding zero-coupon notes at
December 31, 2014
and
2013
, respectively. The aggregate principal amount of these notes at their respective maturities is
$7.5 billion
and
$4.5 billion
, respectively.
|
|
(e)
|
Included on the Consolidated balance sheets in beneficial interests issued by consolidated VIEs. Also included
$2.2 billion
and
$2.0 billion
of outstanding structured notes accounted for at fair value at
December 31, 2014
and
2013
, respectively. Excluded short-term commercial paper and other short-term beneficial interests of
$17.0 billion
and
$17.8 billion
at
December 31, 2014
and
2013
, respectively.
|
|
(f)
|
At
December 31, 2014
, long-term debt in the aggregate of
$23.5 billion
was redeemable at the option of JPMorgan Chase, in whole or in part, prior to maturity, based on the terms specified in the respective notes.
|
|
(g)
|
The aggregate carrying values of debt that matures in each of the five years subsequent to 2014 is
$38.4 billion
in 2015,
$50.0 billion
in 2016,
$42.0 billion
in 2017,
$35.3 billion
in 2018 and
$28.2 billion
in 2019.
|
|
JPMorgan Chase & Co./2014 Annual Report
|
277
|
|
Notes to consolidated financial statements
The weighted-average contractual interest rates for total long-term debt excluding structured notes accounted for at fair value were
2.43%
and
2.56%
as of
December 31, 2014
and
2013
, respectively. In order to modify exposure to interest rate and currency exchange rate movements, JPMorgan Chase utilizes derivative instruments, primarily interest rate and cross-currency interest rate swaps, in conjunction with some of its debt issues. The use of these instruments modifies the Firm’s interest expense on the associated debt. The modified weighted-average interest rates for total long-term debt, including the effects of related derivative instruments, were
1.50%
and
1.54%
as of
December 31, 2014
and
2013
, respectively.
The Parent Company has guaranteed certain long-term debt of its subsidiaries, including both long-term debt and structured notes sold as part of the Firm’s market-making activities. These guarantees rank on parity with all of the Firm’s other unsecured and unsubordinated indebtedness. Guaranteed liabilities were
$352 million
and
$478 million
at
December 31, 2014
and
2013
, respectively.
The Firm’s unsecured debt does not contain requirements that would call for an acceleration of payments, maturities or changes in the structure of the existing debt, provide any limitations on future borrowings or require additional collateral, based on unfavorable changes in the Firm’s credit ratings, financial ratios, earnings or stock price.
Junior subordinated deferrable interest debentures held by trusts that issued guaranteed capital debt securities
On May 8, 2013, the Firm redeemed approximately
$5.0 billion
, or
100%
of the liquidation amount, of the following eight series of guaranteed capital debt securities (“trust preferred securities”): JPMorgan Chase Capital X, XI, XII, XIV, XVI, XIX and XXIV, and BANK ONE Capital VI. Other
income for the year ended December 31, 2013, reflected a modest loss related to the redemption of trust preferred securities. On July 12, 2012, the Firm redeemed
$9.0 billion
, or
100%
of the liquidation amount, of the following nine series of trust preferred securities: JPMorgan Chase Capital XV, XVII, XVIII, XX, XXII, XXV, XXVI, XXVII and XXVIII. Other income for the year ended December 31, 2012, reflected
$888 million
of pretax extinguishment gains related to adjustments applied to the cost basis of the redeemed trust preferred securities during the period they were in a qualified hedge accounting relationship.
At
December 31, 2014
, the Firm had outstanding
nine
wholly owned Delaware statutory business trusts (“issuer trusts”) that had issued guaranteed capital debt securities.
The junior subordinated deferrable interest debentures issued by the Firm to the issuer trusts, totaling
$5.5 billion
and
$5.4 billion
at
December 31, 2014
and
2013
, respectively, were reflected on the Firm’s Consolidated balance sheets in long-term debt, and in the table on the preceding page under the caption “Junior subordinated debt” (i.e., trust preferred securities). The Firm also records the common capital securities issued by the issuer trusts in other assets in its Consolidated balance sheets at
December 31, 2014
and
2013
. Beginning in 2014, the debentures issued to the issuer trusts by the Firm, less the common capital securities of the issuer trusts, began being phased out from inclusion as Tier 1 capital under Basel III. As of
December 31, 2014
,
$2.7 billion
of these debentures qualified as Tier 1 capital, while
$2.7 billion
qualified as Tier 2 capital. As of
December 31, 2013
, under Basel I, the entire balance of these debentures qualified as Tier 1 capital.
The following is a summary of the outstanding trust preferred securities, including unamortized original issue discount, issued by each trust, and the junior subordinated deferrable interest debenture issued to each trust, as of
December 31, 2014
.
|
December 31, 2014
(in millions)
|
Amount of trust preferred securities issued by trust
(a)
|
Principal amount of debenture issued to trust
(b)
|
Issue date
|
Stated maturity of trust preferred securities and debentures
|
Earliest redemption date
|
Interest rate of trust preferred securities and debentures
|
Interest payment/distribution dates
|
|||||||||||
|
Bank One Capital III
|
$
|
474
|
|
$
|
726
|
|
2000
|
2030
|
Any time
|
8.75%
|
Semiannually
|
|||||||
|
Chase Capital II
|
482
|
|
498
|
|
1997
|
2027
|
Any time
|
LIBOR + 0.50%
|
Quarterly
|
|||||||||
|
Chase Capital III
|
296
|
|
305
|
|
1997
|
2027
|
Any time
|
LIBOR + 0.55%
|
Quarterly
|
|||||||||
|
Chase Capital VI
|
242
|
|
249
|
|
1998
|
2028
|
Any time
|
LIBOR + 0.625%
|
Quarterly
|
|||||||||
|
First Chicago NBD Capital I
|
249
|
|
257
|
|
1997
|
2027
|
Any time
|
LIBOR + 0.55%
|
Quarterly
|
|||||||||
|
JPMorgan Chase Capital XIII
|
466
|
|
480
|
|
2004
|
2034
|
Any time
|
LIBOR + 0.95%
|
Quarterly
|
|||||||||
|
JPMorgan Chase Capital XXI
|
836
|
|
838
|
|
2007
|
2037
|
Any time
|
LIBOR + 0.95%
|
Quarterly
|
|||||||||
|
JPMorgan Chase Capital XXIII
|
643
|
|
643
|
|
2007
|
2047
|
Any time
|
LIBOR + 1.00%
|
Quarterly
|
|||||||||
|
JPMorgan Chase Capital XXIX
|
1,500
|
|
1,500
|
|
2010
|
2040
|
2015
|
6.70%
|
Quarterly
|
|||||||||
|
Total
|
$
|
5,188
|
|
$
|
5,496
|
|
|
|
|
|
|
|||||||
|
(a)
|
Represents the amount of trust preferred securities issued to the public by each trust, including unamortized original-issue discount.
|
|
(b)
|
Represents the principal amount of JPMorgan Chase debentures issued to each trust, including unamortized original-issue discount. The principal amount of debentures issued to the trusts includes the impact of hedging and purchase accounting fair value adjustments that were recorded on the Firm’s Consolidated Financial Statements.
|
|
278
|
JPMorgan Chase & Co./2014 Annual Report
|
|
At
December 31, 2014
and
2013
,
JPMorgan Chase
was authorized to issue
200 million
shares of preferred stock, in one or more series, with a par value of
$1.00
per share.
In the event of a liquidation or dissolution of the Firm,
JPMorgan Chase
’s preferred stock then outstanding takes precedence over the Firm’s common stock for the payment of dividends and the distribution of assets.
The following is a summary of
JPMorgan Chase
’s non-cumulative preferred stock outstanding as of
December 31, 2014
and
2013
.
|
Shares at December 31, (represented by
depositary shares) (a) |
Carrying value
(in millions) at December 31, |
Issue date
|
Contractual rate
in effect at December 31, 2014 |
Earliest redemption date
|
Date at which dividend rate becomes floating
|
Floating annual
rate of three-month LIBOR plus: |
||||||||||||||
|
2014
|
2013
|
2014
|
2013
|
|||||||||||||||||
|
Fixed-rate:
|
||||||||||||||||||||
|
Series O
|
125,750
|
|
125,750
|
|
$
|
1,258
|
|
$
|
1,258
|
|
8/27/2012
|
5.500
|
%
|
9/1/2017
|
NA
|
NA
|
||||
|
Series P
|
90,000
|
|
90,000
|
|
900
|
|
900
|
|
2/5/2013
|
5.450
|
|
3/1/2018
|
NA
|
NA
|
||||||
|
Series T
|
92,500
|
|
—
|
|
925
|
|
—
|
|
1/30/2014
|
6.700
|
|
3/1/2019
|
NA
|
NA
|
||||||
|
Series W
|
88,000
|
|
—
|
|
880
|
|
—
|
|
6/23/2014
|
6.300
|
|
9/1/2019
|
NA
|
NA
|
||||||
|
Fixed-to-floating rate:
|
||||||||||||||||||||
|
Series I
|
600,000
|
|
600,000
|
|
6,000
|
|
6,000
|
|
4/23/2008
|
7.900
|
%
|
4/30/2018
|
4/30/2018
|
LIBOR + 3.47
|
%
|
|||||
|
Series Q
|
150,000
|
|
150,000
|
|
1,500
|
|
1,500
|
|
4/23/2013
|
5.150
|
|
5/1/2023
|
5/1/2023
|
LIBOR + 3.25
|
||||||
|
Series R
|
150,000
|
|
150,000
|
|
1,500
|
|
1,500
|
|
7/29/2013
|
6.000
|
|
8/1/2023
|
8/1/2023
|
LIBOR + 3.30
|
||||||
|
Series S
|
200,000
|
|
—
|
|
2,000
|
|
—
|
|
1/22/2014
|
6.750
|
|
2/1/2024
|
2/1/2024
|
LIBOR + 3.78
|
||||||
|
Series U
|
100,000
|
|
—
|
|
1,000
|
|
—
|
|
3/10/2014
|
6.125
|
|
4/30/2024
|
4/30/2024
|
LIBOR + 3.33
|
||||||
|
Series V
|
250,000
|
|
—
|
|
2,500
|
|
—
|
|
6/9/2014
|
5.000
|
|
7/1/2019
|
7/1/2019
|
LIBOR + 3.32
|
||||||
|
Series X
|
160,000
|
|
—
|
|
1,600
|
|
—
|
|
9/23/2014
|
6.100
|
|
10/1/2024
|
10/1/2024
|
LIBOR + 3.33
|
||||||
|
Total preferred stock
|
2,006,250
|
|
1,115,750
|
|
$
|
20,063
|
|
$
|
11,158
|
|
||||||||||
|
(a)
|
Represented by depositary shares.
|
Each series of preferred stock has a liquidation value and redemption price per share of
$10,000
, plus any accrued but unpaid dividends.
Dividends on fixed-rate preferred stock are payable quarterly. Dividends on fixed-to-floating rate preferred stock are payable semiannually while at a fixed rate, and will become payable quarterly after converting to a floating rate.
On
September 1, 2013
, the Firm redeemed all of the outstanding shares of its
8.625%
Non-Cumulative Preferred Stock, Series J at their stated redemption value.
Redemption rights
Each series of the Firm’s preferred stock may be redeemed on any dividend payment date on or after the earliest redemption date for that series. All outstanding preferred stock series except Series I may also be redeemed following a capital treatment event, as described in the terms of each series. Any redemption of the Firm’s preferred stock is subject to non-objection from the Federal Reserve.
Subsequent events
Issuance of preferred stock
On
February 12, 2015
, the Firm issued
$1.4 billion
of noncumulative preferred stock.
At
December 31, 2014
and
2013
,
JPMorgan Chase
was authorized to issue
9.0 billion
shares of common stock with a par value of
$1
per share.
Common shares issued (newly issued or distributed from treasury) by
JPMorgan Chase
during the years ended
December 31, 2014
,
2013
and
2012
were as follows.
|
Year ended December 31,
(in millions)
|
2014
|
|
2013
|
|
2012
|
|
|
Total issued – balance at January 1 and December 31
|
4,104.9
|
|
4,104.9
|
|
4,104.9
|
|
|
Treasury – balance at January 1
|
(348.8
|
)
|
(300.9
|
)
|
(332.2
|
)
|
|
Purchase of treasury stock
|
(82.3
|
)
|
(96.1
|
)
|
(33.5
|
)
|
|
Share repurchases related to employee stock-based awards
(a)
|
—
|
|
—
|
|
(0.2
|
)
|
|
Issued from treasury:
|
||||||
|
Employee benefits and compensation plans
|
39.8
|
|
47.1
|
|
63.7
|
|
|
Employee stock purchase plans
|
1.2
|
|
1.1
|
|
1.3
|
|
|
Total issued from treasury
|
41.0
|
|
48.2
|
|
65.0
|
|
|
Total treasury – balance at December 31
|
(390.1
|
)
|
(348.8
|
)
|
(300.9
|
)
|
|
Outstanding
|
3,714.8
|
|
3,756.1
|
|
3,804.0
|
|
|
(a)
|
Participants in the Firm’s stock-based incentive plans may have shares withheld to cover income taxes.
|
|
JPMorgan Chase & Co./2014 Annual Report
|
279
|
|
Notes to consolidated financial statements
At each of
December 31, 2014
,
2013
, and
2012
, respectively, the Firm had
59.8 million
warrants outstanding to purchase shares of common stock (the “Warrants”). The Warrants are currently traded on the New York Stock Exchange, and they are exercisable, in whole or in part, at any time and from time to time until
October 28, 2018
. The original warrant exercise price was
$42.42
per share. The number of shares issuable upon the exercise of each warrant and the warrant exercise price is subject to adjustment upon the occurrence of certain events, including, but not limited to, the extent regular quarterly cash dividends exceed
$0.38
per share. As a result of the increase in the Firm’s quarterly common stock dividend to
$0.40
per share commencing with the second quarter of 2014, the exercise price of the Warrants was adjusted each subsequent quarter, and was
$42.391
as of
December 31, 2014
. There has been no change in the number of shares issuable upon exercise.
On
March 13, 2012
, the Board of Directors authorized a
$15.0 billion
common equity (i.e., common stock and warrants) repurchase program. As of
December 31, 2014
,
$3.8 billion
(on a trade-date basis) of authorized repurchase capacity remained under the program. The amount of equity that may be repurchased by the Firm is also subject to the amount that is set forth in the Firm’s annual capital plan that is submitted to the Federal Reserve as part of the Comprehensive Capital Analysis and Review (“CCAR”) process.
The following table sets forth the Firm’s repurchases of common equity for the
years ended
December 31, 2014
,
2013
and
2012
, on a trade-date basis. There were no warrants repurchased during the years ended
December 31, 2014
, and
2013
.
|
Year ended December 31, (in millions)
|
2014
|
2013
|
2012
|
|||||||||
|
Total number of shares of common stock repurchased
|
83.4
|
|
96.1
|
|
30.9
|
|
||||||
|
Aggregate purchase price of common stock repurchases
|
$
|
4,834
|
|
$
|
4,789
|
|
$
|
1,329
|
|
|||
|
Total number of Warrants repurchased
|
—
|
|
—
|
|
18.5
|
|
||||||
|
Aggregate purchase price of Warrant repurchases
|
$
|
—
|
|
$
|
—
|
|
$
|
238
|
|
|||
The Firm may, from time to time, enter into written trading plans under Rule 10b5-1 of the Securities Exchange Act of 1934 to facilitate repurchases in accordance with the common equity repurchase program. A Rule 10b5-1 repurchase plan allows the Firm to repurchase its equity during periods when it would not otherwise be repurchasing common equity — for example, during internal trading “blackout periods.” All purchases under a Rule 10b5-1 plan must be made according to a predefined plan established when the Firm is not aware of material nonpublic information. For additional information regarding repurchases of the Firm’s equity securities, see Part II, Item 5: Market for registrant’s common equity, related stockholder matters and issuer purchases of equity securities, on
pages 18–19
.
As of
December 31, 2014
, approximately
240 million
unissued shares of common stock were reserved for issuance under various employee incentive, compensation, option and stock purchase plans, director compensation plans, and the Warrants, as discussed above.
Earnings per share (“EPS”) is calculated under the two-class method under which all earnings (distributed and undistributed) are allocated to each class of common stock and participating securities based on their respective rights to receive dividends.
JPMorgan Chase
grants restricted stock and RSUs to certain employees under its stock-based compensation programs, which entitle recipients to receive nonforfeitable dividends during the vesting period on a basis equivalent to the dividends paid to holders of common stock; these unvested awards meet the definition of participating securities. Options issued under employee benefit plans that have an antidilutive effect are excluded from the computation of diluted EPS.
The following table presents the calculation of basic and diluted EPS for the years ended
December 31, 2014
,
2013
and
2012
.
|
Year ended December 31,
(in millions,
except per share amounts)
|
2014
|
2013
|
2012
|
||||||
|
Basic earnings per share
|
|||||||||
|
Net income
|
$
|
21,762
|
|
$
|
17,923
|
|
$
|
21,284
|
|
|
Less: Preferred stock dividends
|
1,125
|
|
805
|
|
653
|
|
|||
|
Net income applicable to common equity
|
20,637
|
|
17,118
|
|
20,631
|
|
|||
|
Less: Dividends and undistributed earnings allocated to participating securities
|
544
|
|
525
|
|
754
|
|
|||
|
Net income applicable to common stockholders
|
$
|
20,093
|
|
$
|
16,593
|
|
$
|
19,877
|
|
|
Total weighted-average basic shares outstanding
|
3,763.5
|
|
3,782.4
|
|
3,809.4
|
|
|||
|
Net income per share
|
$
|
5.34
|
|
$
|
4.39
|
|
$
|
5.22
|
|
|
Diluted earnings per share
|
|||||||||
|
Net income applicable to common stockholders
|
$
|
20,093
|
|
$
|
16,593
|
|
$
|
19,877
|
|
|
Total weighted-average basic shares outstanding
|
3,763.5
|
|
3,782.4
|
|
3,809.4
|
|
|||
|
Add: Employee stock options, SARs and warrants
(a)
|
34.0
|
|
32.5
|
|
12.8
|
|
|||
|
Total weighted-average diluted shares outstanding
(b)
|
3,797.5
|
|
3,814.9
|
|
3,822.2
|
|
|||
|
Net income per share
|
$
|
5.29
|
|
$
|
4.35
|
|
$
|
5.20
|
|
|
(a)
|
Excluded from the computation of diluted EPS (due to the antidilutive effect) were certain options issued under employee benefit plans and the Warrants. The aggregate number of shares issuable upon the exercise of such options and Warrants was
1 million
,
6 million
and
148 million
for the years ended
December 31, 2014
,
2013
and
2012
, respectively.
|
|
(b)
|
Participating securities were included in the calculation of diluted EPS using the two-class method, as this computation was more dilutive than the calculation using the treasury stock method.
|
|
280
|
JPMorgan Chase & Co./2014 Annual Report
|
|
AOCI includes the after-tax change in unrealized gains and losses on investment securities, foreign currency translation adjustments (including the impact of related derivatives), cash flow hedging activities, and net loss and prior service costs/(credit) related to the Firm’s defined benefit pension and OPEB plans.
|
Year ended December 31,
|
Unrealized gains/(losses) on investment securities
(a)
|
Translation adjustments, net of hedges
|
Cash flow hedges
|
Defined benefit pension and OPEB plans
|
Accumulated other comprehensive income/(loss)
|
||||||||||||||||||||||||
|
(in millions)
|
|||||||||||||||||||||||||||||
|
Balance at December 31, 2011
|
$
|
3,565
|
|
(b)
|
$
|
(26
|
)
|
$
|
51
|
|
$
|
(2,646
|
)
|
$
|
944
|
|
|||||||||||||
|
Net change
|
3,303
|
|
(69
|
)
|
69
|
|
(145
|
)
|
3,158
|
|
|||||||||||||||||||
|
Balance at December 31, 2012
|
$
|
6,868
|
|
(b)
|
$
|
(95
|
)
|
$
|
120
|
|
$
|
(2,791
|
)
|
$
|
4,102
|
|
|||||||||||||
|
Net change
|
(4,070
|
)
|
(41
|
)
|
(259
|
)
|
1,467
|
|
(2,903
|
)
|
|||||||||||||||||||
|
Balance at December 31, 2013
|
$
|
2,798
|
|
(b)
|
$
|
(136
|
)
|
$
|
(139
|
)
|
$
|
(1,324
|
)
|
$
|
1,199
|
|
|||||||||||||
|
Net change
|
1,975
|
|
(11
|
)
|
44
|
|
(1,018
|
)
|
990
|
|
|||||||||||||||||||
|
Balance at December 31, 2014
|
$
|
4,773
|
|
(b)
|
$
|
(147
|
)
|
$
|
(95
|
)
|
$
|
(2,342
|
)
|
$
|
2,189
|
|
|||||||||||||
|
(a)
|
Represents the after-tax difference between the fair value and amortized cost of securities accounted for as AFS including, as of the date of transfer during the first quarter of 2014,
$9 million
of net unrealized losses related to AFS securities that were transferred to HTM. Subsequent to transfer, includes any net unamortized unrealized gains and losses related to the transferred securities.
|
|
(b)
|
At December 31, 2011, included after-tax non-credit related unrealized losses of
$56 million
on debt securities for which credit losses have been recognized in income. There were
no
such losses for the other periods presented.
|
The following table presents the before- and after-tax changes in the components of other comprehensive income/(loss).
|
2014
|
2013
|
2012
|
|||||||||||||||||||||||||||||||||
|
Year ended December 31, (in millions)
|
Pretax
|
Tax effect
|
After-tax
|
Pretax
|
Tax effect
|
After-tax
|
Pretax
|
Tax effect
|
After-tax
|
||||||||||||||||||||||||||
|
Unrealized gains/(losses) on investment securities:
|
|||||||||||||||||||||||||||||||||||
|
Net unrealized gains/(losses) arising during the period
|
$
|
3,193
|
|
$
|
(1,170
|
)
|
$
|
2,023
|
|
$
|
(5,987
|
)
|
$
|
2,323
|
|
$
|
(3,664
|
)
|
$
|
7,521
|
|
$
|
(2,930
|
)
|
$
|
4,591
|
|
||||||||
|
Reclassification adjustment for realized (gains)/losses included in net income
(a)
|
(77
|
)
|
29
|
|
(48
|
)
|
(667
|
)
|
261
|
|
(406
|
)
|
(2,110
|
)
|
822
|
|
(1,288
|
)
|
|||||||||||||||||
|
Net change
|
3,116
|
|
(1,141
|
)
|
1,975
|
|
(6,654
|
)
|
2,584
|
|
(4,070
|
)
|
5,411
|
|
(2,108
|
)
|
3,303
|
|
|||||||||||||||||
|
Translation adjustments:
|
|||||||||||||||||||||||||||||||||||
|
Translation
(b)
|
(1,638
|
)
|
588
|
|
(1,050
|
)
|
(807
|
)
|
295
|
|
(512
|
)
|
(26
|
)
|
8
|
|
(18
|
)
|
|||||||||||||||||
|
Hedges
(b)
|
1,698
|
|
(659
|
)
|
1,039
|
|
773
|
|
(302
|
)
|
471
|
|
(82
|
)
|
31
|
|
(51
|
)
|
|||||||||||||||||
|
Net change
|
60
|
|
(71
|
)
|
(11
|
)
|
(34
|
)
|
(7
|
)
|
(41
|
)
|
(108
|
)
|
39
|
|
(69
|
)
|
|||||||||||||||||
|
Cash flow hedges:
|
|||||||||||||||||||||||||||||||||||
|
Net unrealized gains/(losses) arising during the period
|
98
|
|
(39
|
)
|
59
|
|
(525
|
)
|
206
|
|
(319
|
)
|
141
|
|
(55
|
)
|
86
|
|
|||||||||||||||||
|
Reclassification adjustment for realized (gains)/losses included in net income
(c)
|
(24
|
)
|
9
|
|
(15
|
)
|
101
|
|
(41
|
)
|
60
|
|
(28
|
)
|
11
|
|
(17
|
)
|
|||||||||||||||||
|
Net change
|
74
|
|
(30
|
)
|
44
|
|
(424
|
)
|
165
|
|
(259
|
)
|
113
|
|
(44
|
)
|
69
|
|
|||||||||||||||||
|
Defined benefit pension and OPEB plans:
|
|||||||||||||||||||||||||||||||||||
|
Prior service credits arising during the period
|
(53
|
)
|
21
|
|
(32
|
)
|
—
|
|
—
|
|
—
|
|
6
|
|
(2
|
)
|
4
|
|
|||||||||||||||||
|
Net gains/(losses) arising during the period
|
(1,697
|
)
|
688
|
|
(1,009
|
)
|
2,055
|
|
(750
|
)
|
1,305
|
|
(537
|
)
|
228
|
|
(309
|
)
|
|||||||||||||||||
|
Reclassification adjustments included in
net income
(d)
:
|
|
|
|
|
|
|
|||||||||||||||||||||||||||||
|
Amortization of net loss
|
72
|
|
(29
|
)
|
43
|
|
321
|
|
(124
|
)
|
197
|
|
324
|
|
(126
|
)
|
198
|
|
|||||||||||||||||
|
Prior service costs/(credits)
|
(44
|
)
|
17
|
|
(27
|
)
|
(43
|
)
|
17
|
|
(26
|
)
|
(41
|
)
|
16
|
|
(25
|
)
|
|||||||||||||||||
|
Foreign exchange and other
|
39
|
|
(32
|
)
|
7
|
|
(14
|
)
|
5
|
|
(9
|
)
|
(21
|
)
|
8
|
|
(13
|
)
|
|||||||||||||||||
|
Net change
|
(1,683
|
)
|
665
|
|
(1,018
|
)
|
2,319
|
|
(852
|
)
|
1,467
|
|
(269
|
)
|
124
|
|
(145
|
)
|
|||||||||||||||||
|
Total other comprehensive income/(loss)
|
$
|
1,567
|
|
$
|
(577
|
)
|
$
|
990
|
|
$
|
(4,793
|
)
|
$
|
1,890
|
|
$
|
(2,903
|
)
|
$
|
5,147
|
|
$
|
(1,989
|
)
|
$
|
3,158
|
|
||||||||
|
(a)
|
The pretax amount is reported in securities gains in the Consolidated statements of income.
|
|
(b)
|
Reclassifications of pretax realized gains/(losses) on translation adjustments and related hedges are reported in other income/expense in the Consolidated statements of income. The amounts were not material for the periods presented.
|
|
(c)
|
The pretax amount is reported in the same line as the hedged items, which are predominantly recorded in net interest income in the Consolidated statements of income.
|
|
(d)
|
The pretax amount is reported in compensation expense in the Consolidated statements of income.
|
|
JPMorgan Chase & Co./2014 Annual Report
|
281
|
|
Notes to consolidated financial statements
JPMorgan Chase
and its eligible subsidiaries file a consolidated U.S. federal income tax return.
JPMorgan Chase
uses the asset and liability method to provide income taxes on all transactions recorded in the Consolidated Financial Statements. This method requires that income taxes reflect the expected future tax consequences of temporary differences between the carrying amounts of assets or liabilities for book and tax purposes. Accordingly, a deferred tax asset or liability for each temporary difference is determined based on the tax rates that the Firm expects to be in effect when the underlying items of income and expense are realized.
JPMorgan Chase
’s expense for income taxes includes the current and deferred portions of that expense. A valuation allowance is established to reduce deferred tax assets to the amount the Firm expects to realize.
Due to the inherent complexities arising from the nature of the Firm’s businesses, and from conducting business and being taxed in a substantial number of jurisdictions, significant judgments and estimates are required to be made. Agreement of tax liabilities between
JPMorgan Chase
and the many tax jurisdictions in which the Firm files tax returns may not be finalized for several years. Thus, the Firm’s final tax-related assets and liabilities may ultimately be different from those currently reported.
A reconciliation of the applicable statutory U.S. income tax rate to the effective tax rate for each of the years ended
December 31, 2014
,
2013
and
2012
, is presented in the following table.
|
Effective tax rate
|
|||||||||
|
Year ended December 31,
|
2014
|
|
2013
|
|
2012
|
|
|||
|
Statutory U.S. federal tax rate
|
35.0
|
%
|
35.0
|
%
|
35.0
|
%
|
|||
|
Increase/(decrease) in tax rate resulting from:
|
|||||||||
|
U.S. state and local income taxes, net of U.S. federal income tax benefit
|
2.7
|
|
2.2
|
|
1.6
|
|
|||
|
Tax-exempt income
|
(3.1
|
)
|
(3.1
|
)
|
(2.9
|
)
|
|||
|
Non-U.S. subsidiary earnings
(a)
|
(2.0
|
)
|
(4.9
|
)
|
(2.4
|
)
|
|||
|
Business tax credits
|
(5.4
|
)
|
(5.4
|
)
|
(4.2
|
)
|
|||
|
Nondeductible legal expense
|
2.4
|
|
8.0
|
|
(0.2
|
)
|
|||
|
Other, net
|
(2.6
|
)
|
(1.0
|
)
|
(0.5
|
)
|
|||
|
Effective tax rate
|
27.0
|
%
|
30.8
|
%
|
26.4
|
%
|
|||
|
(a)
|
Predominantly includes earnings of U.K. subsidiaries that are deemed to be reinvested indefinitely.
|
The components of income tax expense/(benefit) included in the Consolidated statements of income were as follows for each of the years ended
December 31, 2014
,
2013
, and
2012
.
|
Income tax expense/(benefit)
|
||||||||||||
|
Year ended December 31,
(in millions)
|
2014
|
|
2013
|
|
2012
|
|
||||||
|
Current income tax expense/(benefit)
|
||||||||||||
|
U.S. federal
|
$
|
1,610
|
|
$
|
(1,316
|
)
|
$
|
3,225
|
|
|||
|
Non-U.S.
|
1,353
|
|
1,308
|
|
1,782
|
|
||||||
|
U.S. state and local
|
857
|
|
(4
|
)
|
1,496
|
|
||||||
|
Total current income tax expense/(benefit)
|
3,820
|
|
(12
|
)
|
6,503
|
|
||||||
|
Deferred income tax expense/(benefit)
|
||||||||||||
|
U.S. federal
|
3,738
|
|
7,080
|
|
2,238
|
|
||||||
|
Non-U.S.
|
71
|
|
10
|
|
(327
|
)
|
||||||
|
U.S. state and local
|
401
|
|
913
|
|
(781
|
)
|
||||||
|
Total deferred income tax expense/(benefit)
|
4,210
|
|
8,003
|
|
1,130
|
|
||||||
|
Total income tax expense
|
$
|
8,030
|
|
$
|
7,991
|
|
$
|
7,633
|
|
|||
Total income tax expense includes
$451 million
,
$531 million
and
$200 million
of tax benefits recorded in
2014
,
2013
, and
2012
, respectively, as a result of tax audit resolutions. In 2013, the relationship between current and deferred income tax expense was largely driven by the reversal of significant deferred tax assets as well as prior-year tax adjustments and audit resolutions.
The preceding table does not reflect the tax effect of certain items that are recorded each period directly in stockholders’ equity and certain tax benefits associated with the Firm’s employee stock-based compensation plans. The tax effect of all items recorded directly to stockholders’ equity resulted in a decrease of
$140 million
in
2014
, an increase of
$2.1 billion
in
2013
, and a decrease of
$1.9 billion
in
2012
.
U.S. federal income taxes have not been provided on the undistributed earnings of certain non-U.S. subsidiaries, to the extent that such earnings have been reinvested abroad for an indefinite period of time. Based on
JPMorgan Chase
’s ongoing review of the business requirements and capital needs of its non-U.S. subsidiaries, combined with the formation of specific strategies and steps taken to fulfill these requirements and needs, the Firm has determined that the undistributed earnings of certain of its subsidiaries would be indefinitely reinvested to fund current and future growth of the related businesses. As management does not intend to use the earnings of these subsidiaries as a source of funding for its U.S. operations, such earnings will not be distributed to the U.S. in the foreseeable future. For
2014
, pretax earnings of
$2.6 billion
were generated and will be indefinitely reinvested in these subsidiaries. At
December 31, 2014
, the cumulative amount of undistributed pretax earnings in these subsidiaries were
$31.1 billion
. If the Firm were to record a deferred tax liability associated with these undistributed earnings, the amount would be
$7.0 billion
at
December 31, 2014
.
|
282
|
JPMorgan Chase & Co./2014 Annual Report
|
|
These undistributed earnings are related to subsidiaries located predominantly in the U.K. where the 2014 statutory tax rate was
21.5%
.
Tax expense applicable to securities gains and losses for the years
2014
,
2013
and
2012
was
$30 million
,
$261 million
, and
$822 million
, respectively.
Deferred income tax expense/(benefit) results from differences between assets and liabilities measured for financial reporting purposes versus income tax return purposes. Deferred tax assets are recognized if, in management’s judgment, their realizability is determined to be more likely than not. If a deferred tax asset is determined to be unrealizable, a valuation allowance is established. The significant components of deferred tax assets and liabilities are reflected in the following table as of
December 31, 2014
and
2013
.
|
Deferred taxes
|
||||||||
|
December 31, (in millions)
|
2014
|
|
2013
|
|
||||
|
Deferred tax assets
|
||||||||
|
Allowance for loan losses
|
$
|
5,756
|
|
$
|
6,593
|
|
||
|
Employee benefits
|
3,378
|
|
4,468
|
|
||||
|
Accrued expenses and other
|
8,637
|
|
9,179
|
|
||||
|
Non-U.S. operations
|
5,106
|
|
5,493
|
|
||||
|
Tax attribute carryforwards
|
570
|
|
748
|
|
||||
|
Gross deferred tax assets
|
23,447
|
|
26,481
|
|
||||
|
Valuation allowance
|
(820
|
)
|
(724
|
)
|
||||
|
Deferred tax assets, net of valuation allowance
|
$
|
22,627
|
|
$
|
25,757
|
|
||
|
Deferred tax liabilities
|
||||||||
|
Depreciation and amortization
|
$
|
3,073
|
|
$
|
3,196
|
|
||
|
Mortgage servicing rights, net of hedges
|
5,533
|
|
5,882
|
|
||||
|
Leasing transactions
|
2,495
|
|
2,352
|
|
||||
|
Non-U.S. operations
|
4,444
|
|
4,705
|
|
||||
|
Other, net
|
4,891
|
|
3,459
|
|
||||
|
Gross deferred tax liabilities
|
20,436
|
|
19,594
|
|
||||
|
Net deferred tax assets
|
$
|
2,191
|
|
$
|
6,163
|
|
||
JPMorgan Chase has recorded deferred tax assets of
$570 million
at
December 31, 2014
, in connection with U.S. federal net operating loss (“NOL”) carryforwards. At
December 31, 2014
, total U.S. federal NOL carryforwards were approximately
$1.6 billion
. If not utilized, the U.S. federal NOL carryforwards will expire between 2025 and 2034.
The valuation allowance at
December 31, 2014
, was due to losses associated with non-U.S. subsidiaries.
At
December 31, 2014
,
2013
and
2012
,
JPMorgan Chase
’s unrecognized tax benefits, excluding related interest expense and penalties, were
$4.9 billion
,
$5.5 billion
and
$7.2 billion
, respectively, of which
$3.5 billion
,
$3.7 billion
and
$4.2 billion
, respectively, if recognized, would reduce the annual effective tax rate. Included in the amount of unrecognized tax benefits are certain items that would not affect the effective tax rate if they were recognized in the Consolidated statements of income. These unrecognized items include the tax effect of certain temporary differences, the portion of gross state and local unrecognized tax benefits that would be offset by the benefit from associated U.S. federal income tax deductions, and the portion of gross non-U.S. unrecognized tax benefits that would have offsets in other jurisdictions.
JPMorgan Chase
is presently under audit by a number of taxing authorities, most notably by the Internal Revenue Service, New York State and City, and the State of California as summarized in the Tax examination status table below. Based upon the status of all of the tax examinations currently in process, it is reasonably possible that over the next 12 months the resolution of these examinations could result in a reduction in the gross balance of unrecognized tax benefits in the range of
$0
to approximately
$2 billion
. Upon settlement of an audit, the gross unrecognized tax benefits would decline either because of tax payments or the recognition of tax benefits.
The following table presents a reconciliation of the beginning and ending amount of unrecognized tax benefits for the years ended
December 31, 2014
,
2013
and
2012
.
|
Unrecognized tax benefits
|
||||||||||||
|
Year ended December 31,
(in millions)
|
2014
|
|
2013
|
|
2012
|
|
||||||
|
Balance at January 1,
|
$
|
5,535
|
|
$
|
7,158
|
|
$
|
7,189
|
|
|||
|
Increases based on tax positions related to the current period
|
810
|
|
542
|
|
680
|
|
||||||
|
Increases based on tax positions related to prior periods
|
477
|
|
88
|
|
234
|
|
||||||
|
Decreases based on tax positions related to prior periods
|
(1,902
|
)
|
(2,200
|
)
|
(853
|
)
|
||||||
|
Decreases related to settlements with taxing authorities
|
(9
|
)
|
(53
|
)
|
(50
|
)
|
||||||
|
Decreases related to a lapse of applicable statute of limitations
|
—
|
|
—
|
|
(42
|
)
|
||||||
|
Balance at December 31,
|
$
|
4,911
|
|
$
|
5,535
|
|
$
|
7,158
|
|
|||
After-tax interest expense/(benefit) and penalties related to income tax liabilities recognized in income tax expense were
$17 million
,
$(184) million
and
$147 million
in
2014
,
2013
and
2012
, respectively.
At both
December 31, 2014
and
2013
, in addition to the liability for unrecognized tax benefits, the Firm had accrued
$1.2 billion
for income tax-related interest and penalties.
|
JPMorgan Chase & Co./2014 Annual Report
|
283
|
|
Notes to consolidated financial statements
JPMorgan Chase
is continually under examination by the Internal Revenue Service, by taxing authorities throughout the world, and by many states throughout the U.S. The following table summarizes the status of significant income tax examinations of
JPMorgan Chase
and its consolidated subsidiaries as of
December 31, 2014
.
|
Tax examination status
|
||||
|
December 31, 2014
|
Periods under examination
|
Status
|
||
|
JPMorgan Chase – U.S.
|
2003 - 2005
|
Field examination completed; at Appellate level
|
||
|
JPMorgan Chase – U.S.
|
2006 - 2010
|
Field examination
|
||
|
JPMorgan Chase – U.K.
|
2006 – 2012
|
Field examination of certain select entities
|
||
|
JPMorgan Chase – New York State and City
|
2005 – 2007
|
Field examination
|
||
|
JPMorgan Chase – California
|
2006 – 2010
|
Field examination
|
||
The following table presents the U.S. and non-U.S. components of income before income tax expense for the years ended
December 31, 2014
,
2013
and
2012
.
|
Income before income tax expense - U.S. and non-U.S.
|
||||||||||||
|
Year ended December 31,
(in millions)
|
2014
|
|
2013
|
|
2012
|
|
||||||
|
U.S.
|
$
|
22,515
|
|
$
|
17,229
|
|
$
|
24,895
|
|
|||
|
Non-U.S.
(a)
|
7,277
|
|
8,685
|
|
4,022
|
|
||||||
|
Income before income tax expense
|
$
|
29,792
|
|
$
|
25,914
|
|
$
|
28,917
|
|
|||
|
(a)
|
For purposes of this table, non-U.S. income is defined as income generated from operations located outside the U.S.
|
The business of JPMorgan Chase Bank, National Association (“
JPMorgan Chase Bank, N.A.
”) is subject to examination and regulation by the OCC. The Bank is a member of the U.S. Federal Reserve System, and its deposits in the U.S. are insured by the FDIC.
The Federal Reserve requires depository institutions to maintain cash reserves with a Federal Reserve Bank. The average amount of reserve balances deposited by the Firm’s bank subsidiaries with various Federal Reserve Banks was approximately
$10.6 billion
and
$5.3 billion
in
2014
and
2013
, respectively.
Restrictions imposed by U.S. federal law prohibit
JPMorgan Chase
and certain of its affiliates from borrowing from banking subsidiaries unless the loans are secured in specified amounts. Such secured loans to the Firm or to other affiliates are generally limited to
10%
of the banking subsidiary’s total capital, as determined by the risk-based capital guidelines; the aggregate amount of all such loans is limited to
20%
of the banking subsidiary’s total capital.
The principal sources of
JPMorgan Chase
’s income (on a parent company-only basis) are dividends and interest from
JPMorgan Chase Bank, N.A.
, and the other banking and nonbanking subsidiaries of
JPMorgan Chase
. In addition to dividend restrictions set forth in statutes and regulations, the Federal Reserve, the Office of the Comptroller of the Currency (“OCC”) and the FDIC have authority under the Financial Institutions Supervisory Act to prohibit or to limit the payment of dividends by the banking organizations they supervise, including
JPMorgan Chase
and its subsidiaries that are banks or bank holding companies, if, in the banking regulator’s opinion, payment of a dividend would constitute an unsafe or unsound practice in light of the financial condition of the banking organization.
At
January 1, 2015
,
JPMorgan Chase
’s banking subsidiaries could pay, in the aggregate, approximately
$31 billion
in dividends to their respective bank holding companies without the prior approval of their relevant banking regulators. The capacity to pay dividends in
2015
will be supplemented by the banking subsidiaries’ earnings during the year.
In compliance with rules and regulations established by U.S. and non-U.S. regulators, as of
December 31, 2014
and
2013
, cash in the amount of
$16.8 billion
and
$17.2 billion
, respectively, and securities with a fair value of
$10.1 billion
and
$1.5 billion
, respectively, were segregated in special bank accounts for the benefit of securities and futures brokerage customers. In addition, as of
December 31, 2014
and
2013
, the Firm had other restricted cash of
$3.3 billion
and
$3.9 billion
, respectively, primarily representing cash reserves held at non-U.S. central banks and held for other general purposes.
|
284
|
JPMorgan Chase & Co./2014 Annual Report
|
|
The Federal Reserve establishes capital requirements, including well-capitalized standards, for the consolidated financial holding company. The OCC establishes similar capital requirements and standards for the Firm’s national banks, including JPMorgan Chase Bank, N.A. and Chase Bank USA, N.A.
Basel III rules under the transitional Standardized and Advanced Approaches (“Basel III Standardized Transitional” and “Basel III Advanced Transitional,” respectively) became effective on January 1, 2014; December 31, 2013 data is based on Basel I rules. Basel III establishes two comprehensive methodologies for calculating RWA (a Standardized approach and an Advanced approach) which include capital requirements for credit risk, market risk, and in the case of Basel III Advanced, also operational risk. Key differences in the calculation of credit risk RWA between the Standardized and Advanced approaches are that for Basel III Advanced, credit risk RWA is based on risk-sensitive approaches which largely rely on the use of internal credit models and parameters, whereas for Basel III Standardized, credit risk RWA is generally based on supervisory risk-weightings which vary primarily by counterparty type and asset class. Market risk RWA is calculated mostly consistent across Basel III Standardized and Basel III Advanced, both of which incorporate the requirements set forth in Basel 2.5. For 2014, Basel III Standardized Transitional requires the Firm to calculate its capital ratios using the Basel III definition of capital divided by the Basel I definition of RWA, inclusive of Basel 2.5 for market risk.
Beginning in 2014, there are three categories of risk-based capital under the Basel III Transitional rules: Common Equity Tier 1 capital (“CET1 capital”), as well as Tier 1 capital and Tier 2 capital. CET1 capital predominantly includes common stockholders’ equity (including capital for AOCI related to debt and equity securities classified as AFS as well as for defined benefit pension and OPEB plans), less certain deductions for goodwill, MSRs and deferred tax assets that arise from NOL and tax credit carryforwards. Tier 1 capital is predominantly comprised of CET1 capital as well as perpetual preferred stock. Tier 2 capital includes long-term debt qualifying as Tier 2 and qualifying allowance for credit losses. Total capital is Tier 1 capital plus Tier 2 capital.
On February 21, 2014, the Federal Reserve and the OCC informed the Firm and its national bank subsidiaries that they had satisfactorily completed the parallel run requirements and were approved to calculate capital under Basel III Advanced, in addition to Basel III Standardized, as of April 1, 2014. In conjunction with its exit from the parallel run, the capital adequacy of the Firm and its national bank subsidiaries is evaluated against the Basel III approach (Standardized or Advanced) which results, for each quarter beginning with the second quarter of 2014, in the lower ratio (the “Collins Floor”), as required by the Collins Amendment of the Dodd-Frank Act.
The following tables present the regulatory capital, assets and risk-based capital ratios for JPMorgan Chase and its significant national bank subsidiaries under both Basel III Standardized Transitional and Basel III Advanced Transitional at December 31, 2014, and under Basel I at December 31, 2013.
|
JPMorgan Chase & Co.
(d)
|
|||||||||||
|
Basel III Standardized Transitional
|
Basel III Advanced Transitional
|
Basel I
|
|||||||||
|
(in millions,
except ratios)
|
Dec 31,
2014 |
Dec 31,
2014 |
Dec 31,
2013 |
||||||||
|
Regulatory capital
|
|
|
|
||||||||
|
CET1 capital
|
$
|
164,764
|
|
$
|
164,764
|
|
NA
|
||||
|
Tier 1 capital
(a)
|
186,632
|
|
186,632
|
|
$
|
165,663
|
|
||||
|
Total capital
|
221,563
|
|
211,022
|
|
199,286
|
|
|||||
|
Assets
|
|
|
|
||||||||
|
Risk-weighted
|
1,472,602
|
|
1,608,240
|
|
1,387,863
|
|
|||||
|
Adjusted average
(b)
|
2,465,414
|
|
2,465,414
|
|
2,343,713
|
|
|||||
|
Capital ratios
(c)
|
|
|
|
||||||||
|
CET1
|
11.2
|
%
|
10.2
|
%
|
NA
|
||||||
|
Tier 1
(a)
|
12.7
|
|
11.6
|
|
11.9
|
%
|
|||||
|
Total
|
15.0
|
|
13.1
|
|
14.4
|
|
|||||
|
Tier 1 leverage
|
7.6
|
|
7.6
|
|
7.1
|
|
|||||
|
JPMorgan Chase Bank, N.A.
(d)
|
|||||||||||
|
Basel III Standardized Transitional
|
Basel III Advanced Transitional
|
Basel I
|
|||||||||
|
(in millions,
except ratios)
|
Dec 31,
2014 |
Dec 31,
2014 |
Dec 31,
2013 |
||||||||
|
Regulatory capital
|
|
|
|
||||||||
|
CET1 capital
|
$
|
156,898
|
|
$
|
156,898
|
|
NA
|
||||
|
Tier 1 capital
(a)
|
157,222
|
|
157,222
|
|
$
|
139,727
|
|
||||
|
Total capital
|
173,659
|
|
166,662
|
|
165,496
|
|
|||||
|
Assets
|
|
|
|
||||||||
|
Risk-weighted
|
1,230,358
|
|
1,330,175
|
|
1,171,574
|
|
|||||
|
Adjusted average
(b)
|
1,968,131
|
|
1,968,131
|
|
1,900,770
|
|
|||||
|
Capital ratios
(c)
|
|
|
|
||||||||
|
CET1
|
12.8
|
%
|
11.8
|
%
|
NA
|
||||||
|
Tier 1
(a)
|
12.8
|
|
11.8
|
|
11.9
|
%
|
|||||
|
Total
|
14.1
|
|
12.5
|
|
14.1
|
|
|||||
|
Tier 1 leverage
|
8.0
|
|
8.0
|
|
7.4
|
|
|||||
|
JPMorgan Chase & Co./2014 Annual Report
|
285
|
|
Notes to consolidated financial statements
|
Chase Bank USA, N.A.
(d)
|
|||||||||||
|
Basel III Standardized Transitional
|
Basel III Advanced Transitional
|
Basel I
|
|||||||||
|
(in millions,
except ratios)
|
Dec 31,
2014 |
Dec 31,
2014 |
Dec 31,
2013 |
||||||||
|
Regulatory capital
|
|
|
|
||||||||
|
CET1 capital
|
$
|
14,556
|
|
$
|
14,556
|
|
NA
|
||||
|
Tier 1 capital
(a)
|
14,556
|
|
14,556
|
|
$
|
12,956
|
|
||||
|
Total capital
|
20,517
|
|
19,206
|
|
16,389
|
|
|||||
|
Assets
|
|
|
|
||||||||
|
Risk-weighted
|
103,468
|
|
157,565
|
|
100,990
|
|
|||||
|
Adjusted average
(b)
|
128,111
|
|
128,111
|
|
109,731
|
|
|||||
|
Capital ratios
(c)
|
|
|
|
||||||||
|
CET1
|
14.1
|
%
|
9.2
|
%
|
NA
|
||||||
|
Tier 1
(a)
|
14.1
|
|
9.2
|
|
12.8
|
%
|
|||||
|
Total
|
19.8
|
|
12.2
|
|
16.2
|
|
|||||
|
Tier 1 leverage
|
11.4
|
|
11.4
|
|
11.8
|
|
|||||
|
(a)
|
At December 31, 2014, trust preferred securities included in Basel III Tier 1 capital were
$2.7 billion
and
$300 million
for
JPMorgan Chase
and JPMorgan Chase Bank, N.A., respectively. At December 31, 2014, Chase Bank USA, N.A. had
no
trust preferred securities.
|
|
(b)
|
Adjusted average assets, for purposes of calculating the leverage ratio, includes total quarterly average assets adjusted for unrealized gains/(losses) on securities, less deductions for disallowed goodwill and other intangible assets, investments in certain subsidiaries, and the total adjusted carrying value of nonfinancial equity investments that are subject to deductions from Tier 1 capital.
|
|
(c)
|
For each of the risk-based capital ratios the lower of the Standardized Transitional or Advanced Transitional ratio represents the Collins Floor.
|
|
(d)
|
Asset and capital amounts for
JPMorgan Chase
’s banking subsidiaries reflect intercompany transactions; whereas the respective amounts for
JPMorgan Chase
reflect the elimination of intercompany transactions.
|
|
Note:
|
Rating agencies allow measures of capital to be adjusted upward for deferred tax liabilities, which have resulted from both non-taxable business combinations and from tax-deductible goodwill. The Firm had deferred tax liabilities resulting from non-taxable business combinations totaling
$130 million
and
$192 million
at December 31, 2014, and December 31, 2013, respectively; and deferred tax liabilities resulting from tax-deductible goodwill of
$2.7 billion
and
$2.8 billion
at December 31, 2014, and December 31, 2013, respectively.
|
Under the risk-based capital guidelines of the Federal Reserve, JPMorgan Chase is required to maintain minimum ratios of Tier 1 and Total capital to risk-weighted assets,
as well as minimum leverage ratios (which are defined as Tier 1 capital divided by adjusted quarterly average assets). Failure to meet these minimum requirements could cause the Federal Reserve to take action. Bank subsidiaries also are subject to these capital requirements by their respective primary regulators. The following table presents the minimum ratios to which the Firm and its national bank subsidiaries are subject as of December 31, 2014.
|
Minimum capital ratios
(a)
|
Well-capitalized ratios
(a)
|
|
||||
|
Capital ratios
|
|
|
|
|||
|
CET1
|
4.0
|
%
|
NA
|
|
||
|
Tier 1
|
5.5
|
|
6.0
|
%
|
||
|
Total
|
8.0
|
|
10.0
|
|
|
|
|
Tier 1 leverage
|
4.0
|
|
5.0
|
|
(b)
|
|
|
(a)
|
As defined by the regulations issued by the Federal Reserve, OCC and FDIC. The CET1 capital ratio became a relevant measure of capital under the prompt corrective action requirements on January 1, 2015.
|
|
(b)
|
Represents requirements for bank subsidiaries pursuant to regulations issued under the FDIC Improvement Act. There is no Tier 1 leverage component in the definition of a well-capitalized bank holding company.
|
As of December 31, 2014, and 2013, JPMorgan Chase and all of its banking subsidiaries were well-capitalized and met all capital requirements to which each was subject.
|
286
|
JPMorgan Chase & Co./2014 Annual Report
|
|
JPMorgan Chase
provides lending-related financial instruments (e.g., commitments and guarantees) to meet the financing needs of its customers. The contractual amount of these financial instruments represents the maximum possible credit risk to the Firm should the counterparty draw upon the commitment or the Firm be required to fulfill its obligation under the guarantee, and should the counterparty subsequently fail to perform according to the terms of the contract. Most of these commitments and guarantees expire without being drawn or a default occurring. As a result, the total contractual amount of these instruments is not, in the Firm’s view, representative of its actual future credit exposure or funding requirements.
To provide for probable credit losses inherent in consumer (excluding credit card) and wholesale lending commitments, an allowance for credit losses on lending-related
commitments is maintained. See Note 15 for further discussion regarding the allowance for credit losses on lending-related commitments. The following table summarizes the contractual amounts and carrying values of off-balance sheet lending-related financial instruments, guarantees and other commitments at
December 31, 2014
and
2013
. The amounts in the table below for credit card and home equity lending-related commitments represent the total available credit for these products. The Firm has not experienced, and does not anticipate, that all available lines of credit for these products will be utilized at the same time. The Firm can reduce or cancel credit card lines of credit by providing the borrower notice or, in some cases as permitted by law, without notice. The Firm may reduce or close home equity lines of credit when there are significant decreases in the value of the underlying property, or when there has been a demonstrable decline in the creditworthiness of the borrower. Also, the Firm typically closes credit card lines when the borrower is
60 days
or more past due.
|
JPMorgan Chase & Co./2014 Annual Report
|
287
|
|
Notes to consolidated financial statements
|
Off–balance sheet lending-related financial instruments, guarantees and other commitments
|
||||||||||||||||||||||||||
|
Contractual amount
|
Carrying value
(i)
|
|||||||||||||||||||||||||
|
2014
|
2013
|
2014
|
2013
|
|||||||||||||||||||||||
|
By remaining maturity at December 31,
(in millions)
|
Expires in 1 year or less
|
Expires after
1 year through 3 years |
Expires after
3 years through 5 years |
Expires after 5 years
|
Total
|
Total
|
||||||||||||||||||||
|
Lending-related
|
||||||||||||||||||||||||||
|
Consumer, excluding credit card:
|
||||||||||||||||||||||||||
|
Home equity – senior lien
|
$
|
2,166
|
|
$
|
4,389
|
|
$
|
1,841
|
|
$
|
3,411
|
|
$
|
11,807
|
|
$
|
13,158
|
|
$
|
—
|
|
$
|
—
|
|
||
|
Home equity – junior lien
|
3,469
|
|
5,920
|
|
2,141
|
|
3,329
|
|
14,859
|
|
17,837
|
|
—
|
|
—
|
|
||||||||||
|
Prime mortgage
(a)
|
8,579
|
|
—
|
|
—
|
|
—
|
|
8,579
|
|
4,817
|
|
—
|
|
—
|
|
||||||||||
|
Subprime mortgage
|
—
|
|
—
|
|
—
|
|
—
|
|
—
|
|
—
|
|
—
|
|
—
|
|
||||||||||
|
Auto
|
9,302
|
|
921
|
|
192
|
|
47
|
|
10,462
|
|
8,309
|
|
2
|
|
1
|
|
||||||||||
|
Business banking
|
10,557
|
|
807
|
|
117
|
|
413
|
|
11,894
|
|
11,251
|
|
11
|
|
7
|
|
||||||||||
|
Student and other
|
97
|
|
8
|
|
—
|
|
447
|
|
552
|
|
685
|
|
—
|
|
—
|
|
||||||||||
|
Total consumer, excluding credit card
|
34,170
|
|
12,045
|
|
4,291
|
|
7,647
|
|
58,153
|
|
56,057
|
|
13
|
|
8
|
|
||||||||||
|
Credit card
|
525,963
|
|
—
|
|
—
|
|
—
|
|
525,963
|
|
529,383
|
|
—
|
|
—
|
|
||||||||||
|
Total consumer
(b)
|
560,133
|
|
12,045
|
|
4,291
|
|
7,647
|
|
584,116
|
|
585,440
|
|
13
|
|
8
|
|
||||||||||
|
Wholesale:
|
||||||||||||||||||||||||||
|
Other unfunded commitments to extend credit
(c)(d)
|
68,688
|
|
83,877
|
|
112,992
|
|
7,119
|
|
272,676
|
|
246,495
|
|
374
|
|
432
|
|
||||||||||
|
Standby letters of credit and other financial guarantees
(c)(d)(e)
|
22,584
|
|
29,753
|
|
34,982
|
|
2,555
|
|
89,874
|
|
92,723
|
|
788
|
|
943
|
|
||||||||||
|
Unused advised lines of credit
|
90,816
|
|
13,702
|
|
519
|
|
138
|
|
105,175
|
|
101,994
|
|
—
|
|
—
|
|
||||||||||
|
Other letters of credit
(c)
|
3,363
|
|
877
|
|
91
|
|
—
|
|
4,331
|
|
5,020
|
|
1
|
|
2
|
|
||||||||||
|
Total wholesale
(f)
|
185,451
|
|
128,209
|
|
148,584
|
|
9,812
|
|
472,056
|
|
446,232
|
|
1,163
|
|
1,377
|
|
||||||||||
|
Total lending-related
|
$
|
745,584
|
|
$
|
140,254
|
|
$
|
152,875
|
|
$
|
17,459
|
|
$
|
1,056,172
|
|
$
|
1,031,672
|
|
$
|
1,176
|
|
$
|
1,385
|
|
||
|
Other guarantees and commitments
|
||||||||||||||||||||||||||
|
Securities lending indemnification agreements and guarantees
(g)
|
$
|
171,059
|
|
$
|
—
|
|
$
|
—
|
|
$
|
—
|
|
$
|
171,059
|
|
$
|
169,709
|
|
$
|
—
|
|
$
|
—
|
|
||
|
Derivatives qualifying as guarantees
|
3,009
|
|
167
|
|
12,313
|
|
38,100
|
|
53,589
|
|
56,274
|
|
80
|
|
72
|
|
||||||||||
|
Unsettled reverse repurchase and securities borrowing agreements
|
40,993
|
|
—
|
|
—
|
|
—
|
|
40,993
|
|
38,211
|
|
—
|
|
—
|
|
||||||||||
|
Loan sale and securitization-related indemnifications:
|
|
|
|
|
|
|
|
|
|
|
|
|
||||||||||||||
|
Mortgage repurchase liability
|
NA
|
|
NA
|
|
NA
|
|
NA
|
|
NA
|
|
NA
|
|
275
|
|
681
|
|
||||||||||
|
Loans sold with recourse
|
NA
|
|
NA
|
|
NA
|
|
NA
|
|
6,063
|
|
7,692
|
|
102
|
|
131
|
|
||||||||||
|
Other guarantees and commitments
(h)
|
487
|
|
506
|
|
3,391
|
|
1,336
|
|
5,720
|
|
6,786
|
|
(121
|
)
|
(99
|
)
|
||||||||||
|
(a)
|
Includes certain commitments to purchase loans from correspondents.
|
|
(b)
|
Predominantly all consumer lending-related commitments are in the U.S.
|
|
(c)
|
At
December 31, 2014
and
2013
, reflects the contractual amount net of risk participations totaling
$243 million
and
$476 million
, respectively, for other unfunded commitments to extend credit;
$13.0 billion
and
$14.8 billion
, respectively, for standby letters of credit and other financial guarantees; and
$469 million
and
$622 million
, respectively, for other letters of credit. In regulatory filings with the Federal Reserve these commitments are shown gross of risk participations.
|
|
(d)
|
At
December 31, 2014
and
2013
, included credit enhancements and bond and commercial paper liquidity commitments to U.S. states and municipalities, hospitals and other non-profit entities of
$14.8 billion
and
$18.9 billion
, respectively, within other unfunded commitments to extend credit; and
$13.3 billion
and
$17.2 billion
, respectively, within standby letters of credit and other financial guarantees. Other unfunded commitments to extend credit also include liquidity facilities to nonconsolidated municipal bond VIEs; see Note 16.
|
|
(e)
|
At
December 31, 2014
and
2013
, included unissued standby letters of credit commitments of
$45.6 billion
and
$42.8 billion
, respectively.
|
|
(f)
|
At
December 31, 2014
and
2013
, the U.S. portion of the contractual amount of total wholesale lending-related commitments was
65%
and
68%
, respectively.
|
|
(g)
|
At
December 31, 2014
and
2013
, collateral held by the Firm in support of securities lending indemnification agreements was
$177.1 billion
and
$176.4 billion
, respectively. Securities lending collateral comprises primarily cash and securities issued by governments that are members of the Organisation for Economic Co-operation and Development (“OECD”) and U.S. government agencies.
|
|
(h)
|
At
December 31, 2014
and
2013
, included unfunded commitments of
$147 million
and
$215 million
, respectively, to third-party private equity funds; and
$961 million
and
$1.9 billion
, respectively, to other equity investments. These commitments included
$150 million
and
$184 million
, respectively, related to investments that are generally fair valued at net asset value as discussed in Note 3. In addition, at both
December 31, 2014
and
2013
, included letters of credit hedged by derivative transactions and managed on a market risk basis of
$4.5 billion
.
|
|
(i)
|
For lending-related products, the carrying value represents the allowance for lending-related commitments and the guarantee liability; for derivative-related products, the carrying value represents the fair value.
|
|
288
|
JPMorgan Chase & Co./2014 Annual Report
|
|
Other unfunded commitments to extend credit
Other unfunded commitments to extend credit generally comprise commitments for working capital and general corporate purposes, extensions of credit to support commercial paper facilities and bond financings in the event that those obligations cannot be remarketed to new investors, as well as committed liquidity facilities to clearing organizations.
Also included in other unfunded commitments to extend credit are commitments to noninvestment-grade counterparties in connection with leveraged finance activities, which were
$23.7 billion
and
$18.3 billion
at
December 31, 2014
and
2013
, respectively. For further information, see Note 3 and Note 4.
The Firm acts as a settlement and custody bank in the U.S. tri-party repurchase transaction market. In its role as settlement and custody bank, the Firm is exposed to the intra-day credit risk of its cash borrower clients, usually broker-dealers. This exposure is secured by collateral and typically extinguished by the end of the day. During 2014, the Firm extended secured clearance advance facilities to its clients (i.e. cash borrowers); these facilities contractually limit the Firm’s intra-day credit risk to the facility amount and must be repaid by the end of the day. Through these facilities, the Firm has reduced its intra-day credit risk substantially; the average daily tri-party repo balance was
$253 billion
during the year ended December 31, 2013, and as of December 31, 2014, the secured clearance advance facility maximum outstanding commitment amount was
$12.6 billion
.
Guarantees
U.S. GAAP requires that a guarantor recognize, at the inception of a guarantee, a liability in an amount equal to the fair value of the obligation undertaken in issuing the guarantee. U.S. GAAP defines a guarantee as a contract that contingently requires the guarantor to pay a guaranteed party based upon: (a) changes in an underlying asset, liability or equity security of the guaranteed party; or (b) a third party’s failure to perform under a specified agreement. The Firm considers the following off–balance sheet lending-related arrangements to be guarantees under U.S. GAAP: standby letters of credit and financial guarantees, securities lending indemnifications, certain indemnification agreements included within third-party contractual arrangements and certain derivative contracts.
As required by U.S. GAAP, the Firm initially records guarantees at the inception date fair value of the obligation assumed (e.g., the amount of consideration received or the net present value of the premium receivable). For certain types of guarantees, the Firm records this fair value amount in other liabilities with an offsetting entry recorded in cash (for premiums received), or other assets (for premiums receivable). Any premium receivable recorded in other assets is reduced as cash is received under the contract, and the fair value of the liability recorded at inception is amortized into income as lending and deposit-related fees over the life of the guarantee contract. For indemnifications provided in sales agreements, a portion of the sale proceeds is allocated to the guarantee, which adjusts the gain or loss that would otherwise result from the transaction. For these indemnifications, the initial liability is amortized to income as the Firm’s risk is reduced (i.e., over time or when the indemnification expires). Any contingent liability that exists as a result of issuing the guarantee or indemnification is recognized when it becomes probable and reasonably estimable. The contingent portion of the liability is not recognized if the estimated amount is less than the carrying amount of the liability recognized at inception (adjusted for any amortization). The recorded amounts of the liabilities related to guarantees and indemnifications at
December 31, 2014
and
2013
, excluding the allowance for credit losses on lending-related commitments, are discussed below.
Standby letters of credit and other financial guarantees
Standby letters of credit (“SBLC”) and other financial guarantees are conditional lending commitments issued by the Firm to guarantee the performance of a customer to a third party under certain arrangements, such as commercial paper facilities, bond financings, acquisition financings, trade and similar transactions. The carrying values of standby and other letters of credit were
$789 million
and
$945 million
at
December 31, 2014
and
2013
, respectively, which were classified in accounts payable and other liabilities on the Consolidated balance sheets; these carrying values included
$235 million
and
$265 million
, respectively, for the allowance for lending-related commitments, and
$554 million
and
$680 million
, respectively, for the guarantee liability and corresponding asset.
|
JPMorgan Chase & Co./2014 Annual Report
|
289
|
|
Notes to consolidated financial statements
The following table summarizes the types of facilities under which standby letters of credit and other letters of credit arrangements are outstanding by the ratings profiles of the Firm’s customers, as of
December 31, 2014
and
2013
.
Standby letters of credit, other financial guarantees and other letters of credit
|
2014
|
2013
|
||||||||||||||||
|
December 31,
(in millions)
|
Standby letters of
credit and other financial guarantees
|
Other letters
of credit
|
Standby letters of
credit and other financial guarantees
|
Other letters
of credit
|
|||||||||||||
|
Investment-grade
(a)
|
$
|
66,856
|
|
$
|
3,476
|
|
$
|
69,109
|
|
$
|
3,939
|
|
|||||
|
Noninvestment-grade
(a)
|
23,018
|
|
855
|
|
23,614
|
|
1,081
|
|
|||||||||
|
Total contractual amount
|
$
|
89,874
|
|
$
|
4,331
|
|
$
|
92,723
|
|
$
|
5,020
|
|
|||||
|
Allowance for lending-related commitments
|
$
|
234
|
|
$
|
1
|
|
$
|
263
|
|
$
|
2
|
|
|||||
|
Commitments with collateral
|
39,726
|
|
1,509
|
|
40,410
|
|
1,473
|
|
|||||||||
|
(a)
|
The ratings scale is based on the Firm’s internal ratings, which generally correspond to ratings as defined by S&P and Moody’s.
|
Advised lines of credit
An advised line of credit is a revolving credit line which specifies the maximum amount the Firm may make available to an obligor, on a nonbinding basis. The borrower receives written or oral advice of this facility. The Firm may cancel this facility at any time by providing the borrower notice or, in some cases, without notice as permitted by law.
Securities lending indemnifications
Through the Firm’s securities lending program, customers’ securities, via custodial and non-custodial arrangements, may be lent to third parties. As part of this program, the Firm provides an indemnification in the lending agreements which protects the lender against the failure of the borrower to return the lent securities. To minimize its liability under these indemnification agreements, the Firm obtains cash or other highly liquid collateral with a market value exceeding
100%
of the value of the securities on loan from the borrower. Collateral is marked to market daily to help assure that collateralization is adequate. Additional collateral is called from the borrower if a shortfall exists, or collateral may be released to the borrower in the event of overcollateralization. If a borrower defaults, the Firm would use the collateral held to purchase replacement securities in the market or to credit the lending customer with the cash equivalent thereof.
Derivatives qualifying as guarantees
In addition to the contracts described above, the Firm transacts certain derivative contracts that have the characteristics of a guarantee under U.S. GAAP. These contracts include written put options that require the Firm to purchase assets upon exercise by the option holder at a specified price by a specified date in the future. The Firm may enter into written put option contracts in order to meet client needs, or for other trading purposes. The terms of written put options are typically five years or less. Derivatives deemed to be guarantees also include contracts such as stable value derivatives that require the Firm to make a payment of the difference between the market value and the book value of a counterparty’s reference portfolio of assets in the event that market value is less than book value and certain other conditions have been met. Stable value derivatives, commonly referred to as
“stable value wraps”, are transacted in order to allow investors to realize investment returns with less volatility than an unprotected portfolio and are typically longer-term or may have no stated maturity, but allow the Firm to terminate the contract under certain conditions.
Derivatives deemed to be guarantees are recorded on the Consolidated balance sheets at fair value in trading assets and trading liabilities. The total notional value of the derivatives that the Firm deems to be guarantees was
$53.6 billion
and
$56.3 billion
at
December 31, 2014
and
2013
, respectively. The notional amount generally represents the Firm’s maximum exposure to derivatives qualifying as guarantees. However, exposure to certain stable value contracts is contractually limited to a substantially lower percentage of the notional amount; the notional amount on these stable value contracts was
$27.5 billion
and
$27.0 billion
at
December 31, 2014
and
2013
, respectively, and the maximum exposure to loss was
$2.9 billion
and
$2.8 billion
at both
December 31, 2014
and
2013
. The fair values of the contracts reflect the probability of whether the Firm will be required to perform under the contract. The fair value of derivatives that the Firm deems to be guarantees were derivative payables of
$102 million
and
$109 million
and derivative receivables of
$22 million
and
$37 million
at
December 31, 2014
and
2013
, respectively. The Firm reduces exposures to these contracts by entering into offsetting transactions, or by entering into contracts that hedge the market risk related to the derivative guarantees.
In addition to derivative contracts that meet the characteristics of a guarantee, the Firm is both a purchaser and seller of credit protection in the credit derivatives market. For a further discussion of credit derivatives, see Note 6.
Unsettled reverse repurchase and securities borrowing agreements
In the normal course of business, the Firm enters into reverse repurchase agreements and securities borrowing agreements that settle at a future date. At settlement, these commitments require that the Firm advance cash to and accept securities from the counterparty. These agreements generally do not meet the definition of a derivative, and
|
290
|
JPMorgan Chase & Co./2014 Annual Report
|
|
therefore, are not recorded on the Consolidated balance sheets until settlement date. The unsettled reverse repurchase agreements and securities borrowing agreements predominantly consist of agreements with regular-way settlement periods.
Loan sales- and securitization-related indemnifications
Mortgage repurchase liability
In connection with the Firm’s mortgage loan sale and securitization activities with the GSEs, as described in Note 16, the Firm has made representations and warranties that the loans sold meet certain requirements. The Firm has been, and may be, required to repurchase loans and/or indemnify the GSEs (e.g., with “make-whole” payments to reimburse the GSEs for their realized losses on liquidated loans). To the extent that repurchase demands that are received relate to loans that the Firm purchased from third parties that remain viable, the Firm typically will have the right to seek a recovery of related repurchase losses from the third party. Generally, the maximum amount of future payments the Firm would be required to make for breaches of these representations and warranties would be equal to the unpaid principal balance of such loans that are deemed to have defects that were sold to purchasers (including securitization-related SPEs) plus, in certain circumstances, accrued interest on such loans and certain expense.
The following table summarizes the change in the mortgage repurchase liability for each of the periods presented.
|
Summary of changes in mortgage repurchase liability
(a)
|
||||||||||||
|
Year ended December 31,
(in millions)
|
2014
|
2013
|
2012
|
|||||||||
|
Repurchase liability at beginning of period
|
$
|
681
|
|
$
|
2,811
|
|
$
|
3,557
|
|
|||
|
Net realized gains/(losses)
(b)
|
53
|
|
(1,561
|
)
|
(1,158
|
)
|
||||||
|
Reclassification to litigation reserve
|
—
|
|
(179
|
)
|
—
|
|
||||||
|
(Benefit)/provision for repurchase
(c)
|
(459
|
)
|
(390
|
)
|
412
|
|
||||||
|
Repurchase liability at end of period
|
$
|
275
|
|
$
|
681
|
|
$
|
2,811
|
|
|||
|
(a)
|
On October 25, 2013, the Firm announced that it had reached a
$1.1 billion
agreement with the FHFA to resolve, other than certain limited types of exposures, outstanding and future mortgage repurchase demands associated with loans sold to the GSEs from 2000 to 2008.
|
|
(b)
|
Presented net of third-party recoveries and included principal losses and accrued interest on repurchased loans, “make-whole” settlements, settlements with claimants, and certain related expense. Make-whole settlements were
$11 million
,
$414 million
and
$524 million
, for the years ended
December 31, 2014
,
2013
and
2012
, respectively.
|
|
(c)
|
Included a provision related to new loan sales of
$4 million
,
$20 million
and
$112 million
, for the years ended
December 31, 2014
,
2013
and
2012
, respectively.
|
Private label securitizations
The liability related to repurchase demands associated with private label securitizations is separately evaluated by the Firm in establishing its litigation reserves.
On November 15, 2013, the Firm announced that it had reached a
$4.5 billion
agreement with
21
major institutional investors to make a binding offer to the trustees of
330
residential mortgage-backed securities trusts issued by J.P.Morgan, Chase, and Bear Stearns (“RMBS Trust Settlement”) to resolve all representation and warranty claims, as well as all servicing claims, on all trusts issued by J.P. Morgan, Chase, and Bear Stearns between 2005 and 2008. The
seven
trustees (or separate and successor trustees) for this group of
330
trusts have accepted the RMBS Trust Settlement for
319
trusts in whole or in part and excluded from the settlement
16
trusts in whole or in part. The trustees’ acceptance is subject to a judicial approval proceeding initiated by the trustees, which is pending in New York state court.
In addition, from 2005 to 2008, Washington Mutual made certain loan level representations and warranties in connection with approximately
$165 billion
of residential mortgage loans that were originally sold or deposited into private-label securitizations by Washington Mutual. Of the
$165 billion
, approximately
$78 billion
has been repaid. In addition, approximately
$49 billion
of the principal amount of such loans has liquidated with an average loss severity of
59%
. Accordingly, the remaining outstanding principal balance of these loans as of
December 31, 2014
, was approximately
$38 billion
, of which
$8 billion
was
60 days
or more past due. The Firm believes that any repurchase obligations related to these loans remain with the FDIC receivership.
For additional information regarding litigation, see Note 31.
Loans sold with recourse
The Firm provides servicing for mortgages and certain commercial lending products on both a recourse and nonrecourse basis. In nonrecourse servicing, the principal credit risk to the Firm is the cost of temporary servicing advances of funds (i.e., normal servicing advances). In recourse servicing, the servicer agrees to share credit risk with the owner of the mortgage loans, such as Fannie Mae or Freddie Mac or a private investor, insurer or guarantor. Losses on recourse servicing predominantly occur when foreclosure sales proceeds of the property underlying a defaulted loan are less than the sum of the outstanding principal balance, plus accrued interest on the loan and the cost of holding and disposing of the underlying property. The Firm’s securitizations are predominantly nonrecourse, thereby effectively transferring the risk of future credit losses to the purchaser of the mortgage-backed securities issued by the trust. At
December 31, 2014
and
2013
, the unpaid principal balance of loans sold with recourse totaled
$6.1 billion
and
$7.7 billion
, respectively. The carrying value of the related liability that the Firm has recorded, which is representative of the Firm’s view of the likelihood it
|
JPMorgan Chase & Co./2014 Annual Report
|
291
|
|
Notes to consolidated financial statements
will have to perform under its recourse obligations, was
$102 million
and
$131 million
at
December 31, 2014
and
2013
, respectively.
Other off-balance sheet arrangements
Indemnification agreements – general
In connection with issuing securities to investors, the Firm may enter into contractual arrangements with third parties that require the Firm to make a payment to them in the event of a change in tax law or an adverse interpretation of tax law. In certain cases, the contract also may include a termination clause, which would allow the Firm to settle the contract at its fair value in lieu of making a payment under the indemnification clause. The Firm may also enter into indemnification clauses in connection with the licensing of software to clients (“software licensees”) or when it sells a business or assets to a third party (“third-party purchasers”), pursuant to which it indemnifies software licensees for claims of liability or damages that may occur subsequent to the licensing of the software, or third-party purchasers for losses they may incur due to actions taken by the Firm prior to the sale of the business or assets. It is difficult to estimate the Firm’s maximum exposure under these indemnification arrangements, since this would require an assessment of future changes in tax law and future claims that may be made against the Firm that have not yet occurred. However, based on historical experience, management expects the risk of loss to be remote.
Credit card charge-backs
Chase Paymentech Solutions, Card’s merchant services business and a subsidiary of JPMorgan Chase Bank, N.A., is a global leader in payment processing and merchant acquiring.
Under the rules of Visa USA, Inc., and MasterCard International, JPMorgan Chase Bank, N.A., is primarily liable for the amount of each processed credit card sales transaction that is the subject of a dispute between a cardmember and a merchant. If a dispute is resolved in the cardmember’s favor, Chase Paymentech will (through the cardmember’s issuing bank) credit or refund the amount to the cardmember and will charge back the transaction to the merchant. If Chase Paymentech is unable to collect the amount from the merchant, Chase Paymentech will bear the loss for the amount credited or refunded to the cardmember. Chase Paymentech mitigates this risk by withholding future settlements, retaining cash reserve accounts or by obtaining other security. However, in the unlikely event that: (1) a merchant ceases operations and is unable to deliver products, services or a refund; (2) Chase Paymentech does not have sufficient collateral from the merchant to provide customer refunds; and (3) Chase Paymentech does not have sufficient financial resources to provide customer refunds, JPMorgan Chase Bank, N.A., would recognize the loss.
Chase Paymentech incurred aggregate losses of
$10 million
,
$14 million
, and
$16 million
on
$847.9 billion
,
$750.1 billion
, and
$655.2 billion
of aggregate volume processed for the years ended
December 31, 2014
,
2013
and
2012
, respectively. Incurred losses from merchant charge-backs are charged to other expense, with the offset recorded in a valuation allowance against accrued interest and accounts receivable on the Consolidated balance sheets. The carrying value of the valuation allowance was
$4 million
and
$5 million
at
December 31, 2014
and
2013
, respectively, which the Firm believes, based on historical experience and the collateral held by Chase Paymentech of
$174 million
and
$208 million
at
December 31, 2014
and
2013
, respectively, is representative of the payment or performance risk to the Firm related to charge-backs.
Clearing Services - Client Credit Risk
The Firm provides clearing services for clients entering into securities purchases and sales and derivative transactions, with central counterparties (“CCPs”), including exchange-traded derivatives (“ETDs”) such as futures and options, as well as OTC-cleared derivative contracts. As a clearing member, the Firm stands behind the performance of its clients, collects cash and securities collateral (margin) as well as any settlement amounts due from or to clients, and remits them to the relevant CCP or client in whole or part. There are two types of margin. Variation margin is posted on a daily basis based on the value of clients’ derivative contracts. Initial margin is posted at inception of a derivative contract, generally on the basis of the potential changes in the variation margin requirement for the contract.
As clearing member, the Firm is exposed to the risk of non-performance by its clients, but is not liable to clients for the performance of the CCPs. Where possible, the Firm seeks to mitigate its risk to the client through the collection of appropriate amounts of margin at inception and throughout the life of the transactions. The Firm can also cease provision of clearing services if clients do not adhere to their obligations under the clearing agreement. In the event of non-performance by a client, the Firm would close out the client’s positions and access available margin. The CCP would utilize any margin it holds to make itself whole, with any remaining shortfalls required to be paid by the Firm as clearing member.
The Firm reflects its exposure to non-performance risk of the client through the recognition of margin payables or receivables to clients and CCPs, but does not reflect the clients’ underlying securities or derivative contracts in its Consolidated Financial Statements.
It is difficult to estimate the Firm’s maximum possible exposure through its role as clearing member, as this would require an assessment of transactions that clients may execute in the future. However, based upon historical experience, and the credit risk mitigants available to the Firm, management believes it is unlikely that the Firm will
|
292
|
JPMorgan Chase & Co./2014 Annual Report
|
|
have to make any material payments under these arrangements and the risk of loss is expected to be remote.
For information on the derivatives that the Firm executes for its own account and records in its Consolidated Financial Statements, see Note 6.
Exchange & Clearing House Memberships
Through the provision of clearing services, the Firm is a member of several securities and derivative exchanges and clearinghouses, both in the U.S. and other countries. Membership in some of these organizations requires the Firm to pay a pro rata share of the losses incurred by the organization as a result of the default of another member. Such obligations vary with different organizations. These obligations may be limited to members who dealt with the defaulting member or to the amount (or a multiple of the amount) of the Firm’s contribution to the guarantee fund maintained by a clearing house or exchange as part of the resources available to cover any losses in the event of a member default. Alternatively, these obligations may be a full pro-rata share of the residual losses after applying the guarantee fund. Additionally, certain clearinghouses require the Firm as a member to pay a pro rata share of losses resulting from the clearinghouse’s investment of guarantee fund contributions and initial margin, unrelated to and independent of the default of another member. Generally a payment would only be required should such losses exceed the resources of the clearing house or exchange that are contractually required to absorb the losses in the first instance. It is difficult to estimate the Firm’s maximum possible exposure under these membership agreements, since this would require an assessment of future claims that may be made against the Firm that have not yet occurred. However, based on historical experience, management expects the risk of loss to be remote.
Guarantees of subsidiaries
In the normal course of business, JPMorgan Chase & Co. (“Parent Company”) may provide counterparties with guarantees of certain of the trading and other obligations of its subsidiaries on a contract-by-contract basis, as negotiated with the Firm’s counterparties. The obligations of the subsidiaries are included on the Firm’s Consolidated balance sheets or are reflected as off-balance sheet commitments; therefore, the Parent Company has not recognized a separate liability for these guarantees. The Firm believes that the occurrence of any event that would trigger payments by the Parent Company under these guarantees is remote.
The Parent Company has guaranteed certain debt of its subsidiaries, including both long-term debt and structured notes sold as part of the Firm’s market-making activities. These guarantees are not included in the table on
page 288
of this Note. For additional information, see Note 21.
|
JPMorgan Chase & Co./2014 Annual Report
|
293
|
|
Notes to consolidated financial statements
Lease commitments
At
December 31, 2014
, JPMorgan Chase and its subsidiaries were obligated under a number of noncancelable operating leases for premises and equipment used primarily for banking purposes, and for energy-related tolling service agreements. Certain leases contain renewal options or escalation clauses providing for increased rental payments based on maintenance, utility and tax increases, or they require the Firm to perform restoration work on leased premises. No lease agreement imposes restrictions on the Firm’s ability to pay dividends, engage in debt or equity financing transactions or enter into further lease agreements.
The following table presents required future minimum rental payments under operating leases with noncancelable lease terms that expire after
December 31, 2014
.
|
Year ended December 31, (in millions)
|
|||
|
2015
|
$
|
1,722
|
|
|
2016
|
1,682
|
|
|
|
2017
|
1,534
|
|
|
|
2018
|
1,281
|
|
|
|
2019
|
1,121
|
|
|
|
After 2019
|
5,101
|
|
|
|
Total minimum payments required
(a)
|
12,441
|
|
|
|
Less: Sublease rentals under noncancelable subleases
|
(2,238
|
)
|
|
|
Net minimum payment required
|
$
|
10,203
|
|
|
(a)
|
Lease restoration obligations are accrued in accordance with U.S. GAAP, and are not reported as a required minimum lease payment.
|
Total rental expense was as follows.
|
Year ended December 31,
|
||||||||||||
|
(in millions)
|
2014
|
2013
|
2012
|
|||||||||
|
Gross rental expense
|
$
|
2,255
|
|
$
|
2,187
|
|
$
|
2,212
|
|
|||
|
Sublease rental income
|
(383
|
)
|
(341
|
)
|
(288
|
)
|
||||||
|
Net rental expense
|
$
|
1,872
|
|
$
|
1,846
|
|
$
|
1,924
|
|
|||
Pledged assets
Financial assets are pledged to maintain potential borrowing capacity with central banks and for other purposes, including to secure borrowings and public deposits, and to collateralize repurchase and other securities financing agreements. Certain of these pledged assets may be sold or repledged by the secured parties and are identified as financial instruments owned (pledged to various parties) on the Consolidated balance sheets. At
December 31, 2014
and
2013
, the Firm had pledged assets of
$324.5 billion
and
$251.3 billion
, respectively, at Federal Reserve Banks and FHLBs. In addition, as of
December 31, 2014
and
2013
, the Firm had pledged to third parties
$60.1 billion
and
$68.4 billion
, respectively, of financial instruments it owns that may not be sold or repledged by such secured parties. Total assets pledged do not include assets of consolidated VIEs; these assets are used to settle the liabilities of those entities. See Note 16 for additional information on assets and liabilities of consolidated VIEs. For additional information on the Firm’s securities financing activities and long-term debt, see Note 13 and Note 21, respectively. The significant components of the Firm’s pledged assets were as follows.
|
December 31, (in billions)
|
2014
|
2013
|
||||||
|
Securities
|
$
|
118.7
|
|
$
|
68.1
|
|
||
|
Loans
|
248.2
|
|
230.3
|
|
||||
|
Trading assets and other
|
169.0
|
|
163.3
|
|
||||
|
Total assets pledged
|
$
|
535.9
|
|
$
|
461.7
|
|
||
Collateral
At
December 31, 2014
and
2013
, the Firm had accepted assets as collateral that it could sell or repledge, deliver or otherwise use with a fair value of approximately
$761.7 billion
and
$725.0 billion
, respectively. This collateral was generally obtained under resale agreements, securities borrowing agreements, customer margin loans and derivative agreements. Of the collateral received, approximately
$596.8 billion
and
$520.1 billion
, respectively, were sold or repledged, generally as collateral under repurchase agreements, securities lending agreements or to cover short sales and to collateralize deposits and derivative agreements.
Certain prior period amounts for both collateral, as well as pledged assets (including the corresponding pledged assets parenthetical disclosure for trading assets on the Consolidated balance sheets) have been revised to conform with the current period presentation.
|
294
|
JPMorgan Chase & Co./2014 Annual Report
|
|
Contingencies
As of December 31, 2014, the Firm and its subsidiaries are defendants or putative defendants in numerous legal proceedings, including private, civil litigations and regulatory/government investigations. The litigations range from individual actions involving a single plaintiff to class action lawsuits with potentially millions of class members. Investigations involve both formal and informal proceedings, by both governmental agencies and self-regulatory organizations. These legal proceedings are at varying stages of adjudication, arbitration or investigation, and involve each of the Firm’s lines of business and geographies and a wide variety of claims (including common law tort and contract claims and statutory antitrust, securities and consumer protection claims), some of which present novel legal theories.
The Firm believes the estimate of the aggregate range of reasonably possible losses, in excess of reserves established, for its legal proceedings is from
$0
to approximately
$5.8 billion
at December 31, 2014. This estimated aggregate range of reasonably possible losses is based upon currently available information for those proceedings in which the Firm is involved, taking into account the Firm’s best estimate of such losses for those cases for which such estimate can be made. For certain cases, the Firm does not believe that an estimate can currently be made. The Firm’s estimate involves significant judgment, given the varying stages of the proceedings (including the fact that many are currently in preliminary stages), the existence in many such proceedings of multiple defendants (including the Firm) whose share of liability has yet to be determined, the numerous yet-unresolved issues in many of the proceedings (including issues regarding class certification and the scope of many of the claims) and the attendant uncertainty of the various potential outcomes of such proceedings, particularly proceedings that could result from government investigations. Accordingly, the Firm’s estimate will change from time to time, and actual losses may vary.
Set forth below are descriptions of the Firm’s material legal proceedings.
Auto Dealer Regulatory Matter
. The Firm is engaged in discussions with the U.S. Department of Justice (“DOJ”) about potential statistical disparities in markups charged to different races and ethnicities by automobile dealers on loans originated by those dealers and purchased by the Firm.
CIO Litigation.
The Firm has been sued in a consolidated shareholder putative class action, a consolidated putative class action brought under the Employee Retirement Income Security Act (“ERISA”) and
seven
shareholder derivative actions brought in Delaware state court and in New York federal and state courts relating to 2012 losses in the synthetic credit portfolio managed by the Firm’s Chief Investment Office (“CIO”).
Four
of the shareholder derivative actions have been dismissed, and plaintiffs in
three
of those actions have appealed those dismissals. Motions to dismiss have also been filed in
two
other shareholder derivative actions.
Credit Default Swaps Investigations and Litigation
. In July 2013, the European Commission (the “EC”) filed a Statement of Objections against the Firm (including various subsidiaries) and other industry members in connection with its ongoing investigation into the credit default swaps (“CDS”) marketplace. The EC asserts that between 2006 and 2009, a number of investment banks acted collectively through the International Swaps and Derivatives Association (“ISDA”) and Markit Group Limited (“Markit”) to foreclose exchanges from the potential market for exchange-traded credit derivatives. The Firm submitted a response to the Statement of Objections in January 2014, and the EC held a hearing in May 2014. DOJ also has an ongoing investigation into the CDS marketplace, which was initiated in July 2009.
Separately, the Firm and other industry members are defendants in a consolidated putative class action filed in the United States District Court for the Southern District of New York on behalf of purchasers and sellers of CDS. The complaint refers to the ongoing investigations by the EC and DOJ into the CDS market, and alleges that the defendant investment banks and dealers, including the Firm, as well as Markit and/or ISDA, collectively prevented new entrants into the market for exchange-traded CDS products. Defendants moved to dismiss this action, and in September 2014, the Court granted defendants’ motion in part, dismissing claims for damages based on transactions effected before the Autumn of 2008, as well as certain other claims.
Foreign Exchange Investigations and Litigation
. In November 2014, JPMorgan Chase Bank, N.A. reached separate settlements with the U.K. Financial Conduct Authority (“FCA”), the U.S. Commodity Futures Trading Commission (“CFTC”) and the U.S. Office of the Comptroller of the Currency (“OCC”) to resolve the agencies’ respective civil enforcement claims relating to the Bank’s foreign exchange (“FX”) trading business (collectively, the “Settlement Agreements”). Under the Settlement Agreements, JPMorgan Chase Bank, N.A. agreed to take certain remedial measures and paid penalties of
£222 million
to the FCA,
$310 million
to the CFTC and
$350 million
to the OCC.
In December 2014, the Hong Kong Monetary Authority (“HKMA”) announced the conclusion of its FX-related investigation regarding JPMorgan Chase Bank, N.A. and several other banks. The HKMA required the banks, including JPMorgan Chase Bank, N.A., to take certain remedial measures.
Other FX-related regulatory investigations of the Firm are ongoing, including a criminal investigation by DOJ. These investigations are focused on the Firm’s spot FX trading and sales activities as well as controls applicable to those activities. The Firm continues to cooperate with these investigations. The Firm is also engaged in discussions regarding potential resolution with DOJ.
|
JPMorgan Chase & Co./2014 Annual Report
|
295
|
|
Notes to consolidated financial statements
Since November 2013, a number of class actions have been filed in the United States District Court for the Southern District of New York against a number of foreign exchange dealers, including the Firm, for alleged violations of federal and state antitrust laws and unjust enrichment based on an alleged conspiracy to manipulate foreign exchange rates reported on the WM/Reuters service. In March 2014, plaintiffs filed a consolidated amended U.S. class action complaint;
two
other class actions were brought by non-U.S.-based plaintiffs. The Court denied defendants’ motion to dismiss the U.S. class action and granted the motion to dismiss the
two
non-U.S. class actions. In January 2015, the Firm settled the U.S. class action, and this settlement is subject to court approval.
General Motors Litigation.
JPMorgan Chase Bank, N.A. participated in, and was the Administrative Agent on behalf of a syndicate of lenders on, a
$1.5 billion
syndicated Term Loan facility (“Term Loan”) for General Motors Corporation (“GM”). In July 2009, in connection with the GM bankruptcy proceedings, the Official Committee of Unsecured Creditors of Motors Liquidation Company (“Creditors Committee”) filed a lawsuit against JPMorgan Chase Bank, N.A., in its individual capacity and as Administrative Agent for other lenders on the Term Loan, seeking to hold the underlying lien invalid. In March 2013, the Bankruptcy Court granted JPMorgan Chase Bank, N.A.’s motion for summary judgment and dismissed the Creditors Committee’s complaint on the grounds that JPMorgan Chase Bank, N.A. did not authorize the filing of the UCC-3 termination statement at issue. The Creditors Committee appealed the Bankruptcy Court’s dismissal of its claim to the United States Court of Appeals for the Second Circuit. In January 2015, the Court of Appeals reversed the Bankruptcy Court’s dismissal of the Creditors Committee’s claim and remanded the case to the Bankruptcy Court with instructions to enter partial summary judgment for the Creditors Committee as to the termination statement. JPMorgan Chase Bank, N.A. has filed a petition requesting that the full Court of Appeals rehear the case en banc. In the event that the request for rehearing is denied, continued proceedings in the Bankruptcy Court are anticipated with respect to, among other things, additional defenses asserted by JPMorgan Chase Bank, N.A. and the value of additional collateral on the Term Loan, which was not the subject of the termination statement.
Interchange Litigation.
A group of merchants and retail associations filed a series of class action complaints alleging that Visa and MasterCard, as well as certain banks, conspired to set the price of credit and debit card interchange fees, enacted respective rules in violation of antitrust laws, and engaged in tying/bundling and exclusive dealing. The parties have entered into an agreement to settle the cases for a cash payment of
$6.1 billion
to the class plaintiffs (of which the Firm’s share is approximately
20%
) and an amount equal to
ten
basis points of credit card interchange for a period of
eight
months to be measured from a date within
60 days
of the end of the opt-out period. The agreement also provides for modifications to each credit card network’s rules, including those that
prohibit surcharging credit card transactions. In December 2013, the Court issued a decision granting final approval of the settlement. A number of merchants have appealed. Certain merchants that opted out of the class settlement have filed actions against Visa and MasterCard, as well as against the Firm and other banks. Defendants’ motion to dismiss the actions was denied in July 2014.
Investment Management Litigation.
The Firm is defending
two
pending cases that allege that investment portfolios managed by J.P. Morgan Investment Management (“JPMIM”) were inappropriately invested in securities backed by residential real estate collateral. Plaintiffs Assured Guaranty (U.K.) and Ambac Assurance UK Limited claim that JPMIM is liable for losses of more than
$1 billion
in market value of these securities. Discovery is proceeding.
Lehman Brothers Bankruptcy Proceedings.
In May 2010, Lehman Brothers Holdings Inc. (“LBHI”) and its Official Committee of Unsecured Creditors (the “Committee”) filed a complaint (and later an amended complaint) against JPMorgan Chase Bank, N.A. in the United States Bankruptcy Court for the Southern District of New York that asserts both federal bankruptcy law and state common law claims, and seeks, among other relief, to recover
$7.9 billion
in collateral that was transferred to JPMorgan Chase Bank, N.A. in the weeks preceding LBHI’s bankruptcy. The amended complaint also seeks unspecified damages on the grounds that JPMorgan Chase Bank, N.A.’s collateral requests hastened LBHI’s bankruptcy. The Court dismissed the counts of the amended complaint that sought to void the allegedly constructively fraudulent and preferential transfers made to the Firm during the months of August and September 2008. The Firm has filed counterclaims against LBHI alleging that LBHI fraudulently induced the Firm to make large extensions of credit against inappropriate collateral in connection with the Firm’s role as the clearing bank for Lehman Brothers Inc. (“LBI”), LBHI’s broker-dealer subsidiary. These extensions of credit left the Firm with more than
$25 billion
in claims against the estate of LBI. The case has been transferred from the Bankruptcy Court to the District Court, and the Firm has moved for summary judgment seeking the dismissal of all of LBHI’s claims. LBHI has also moved for summary judgment on certain of its claims and seeking the dismissal of the Firm’s counterclaims.
In the Bankruptcy Court proceedings, LBHI and several of its subsidiaries that had been Chapter 11 debtors have filed a separate complaint and objection to derivatives claims asserted by the Firm alleging that the amount of the derivatives claims had been overstated and challenging certain set-offs taken by JPMorgan Chase entities to recover on the claims. The Firm responded to this separate complaint and objection in February 2013. LBHI and the Committee have also filed an objection to the claims asserted by JPMorgan Chase Bank, N.A. against LBHI with respect to clearing advances made to LBI, principally on the grounds that the Firm had not conducted the sale of the securities collateral held for its claims in a commercially reasonable manner. Discovery regarding both objections is
|
296
|
JPMorgan Chase & Co./2014 Annual Report
|
|
ongoing. In January 2015, LBHI filed additional objections relating to a variety of claims that the Firm had filed in the Bankruptcy Court proceedings. The bankruptcy claims and other claims of the Firm against Lehman entities have been paid in full, subject to potential adjustment depending on the outcome of the objections filed by LBHI and the Committee.
LIBOR and Other Benchmark Rate Investigations and Litigation.
JPMorgan Chase has received subpoenas and requests for documents and, in some cases, interviews, from federal and state agencies and entities, including DOJ, the CFTC, the Securities and Exchange Commission (the “SEC”) and various state attorneys general, as well as the EC, the FCA, the Canadian Competition Bureau, the Swiss Competition Commission and other regulatory authorities and banking associations around the world relating primarily to the process by which interest rates were submitted to the British Bankers Association (“BBA”) in connection with the setting of the BBA’s London Interbank Offered Rate (“LIBOR”) for various currencies, principally in 2007 and 2008. Some of the inquiries also relate to similar processes by which information on rates is submitted to the European Banking Federation (“EBF”) in connection with the setting of the EBF’s Euro Interbank Offered Rates (“EURIBOR”) and to the Japanese Bankers’ Association for the setting of Tokyo Interbank Offered Rates (“TIBOR”) as well as to other processes for the setting of other reference rates in various parts of the world during similar time periods. The Firm is responding to and continuing to cooperate with these inquiries. In December 2013, JPMorgan Chase reached a settlement with the EC regarding its Japanese Yen LIBOR investigation and agreed to pay a fine of
€80 million
. In January 2014, the Canadian Competition Bureau announced that it has discontinued its investigation related to Yen LIBOR. In May 2014, the EC issued a Statement of Objections outlining its case against the Firm (and others) as to EURIBOR, to which the Firm has filed a response. In October 2014, JPMorgan Chase reached a settlement with the EC regarding the EC’s Swiss franc LIBOR investigation and agreed to pay a fine of
€72 million
. In January 2015, the FCA informed JPMorgan Chase that it has discontinued its investigation of the Firm concerning LIBOR and EURIBOR.
In addition, the Firm has been named as a defendant along with other banks in a series of individual and class actions filed in various United States District Courts,
in which plaintiffs make varying allegations that in various periods, starting in 2000 or later, defendants either individually or collectively manipulated the U.S. dollar LIBOR, Yen LIBOR, Swiss franc LIBOR, Euroyen TIBOR and/or EURIBOR rates by submitting rates that were artificially low or high. Plaintiffs allege that they transacted in loans, derivatives or other financial instruments whose values are affected by changes in U.S. dollar LIBOR, Yen LIBOR, Swiss franc LIBOR, Euroyen TIBOR or EURIBOR and assert a variety of claims
including antitrust claims seeking treble damages.
The U.S. dollar LIBOR-related putative class actions were consolidated for pre-trial purposes in the United States
District Court for the Southern District of New York. The Court stayed all related cases while motions to dismiss the three lead class actions were pending. In March 2013, the Court granted in part and denied in part the defendants’ motions to dismiss the claims in the
three
lead class actions, including dismissal with prejudice of the antitrust claims. In relation to the Firm, the Court has permitted certain claims under the Commodity Exchange Act and common law claims to proceed. In September 2013, class plaintiffs in
two
of the
three
lead class actions filed amended complaints, which defendants moved to dismiss. Plaintiffs in the third class action appealed the dismissal of the antitrust claims and the United States Court of Appeals for the Second Circuit dismissed the appeal for lack of jurisdiction. In January 2015, the United States Supreme Court reversed the decision of the Court of Appeals, holding that plaintiffs have the jurisdictional right to appeal and remanding the case to the Court of Appeals for further proceedings. In February 2015, the District Court entered a judgment on certain other plaintiffs’ antitrust claims so that those plaintiffs could also participate in the appeal. Motions to dismiss are pending in the remaining previously stayed individual actions and class actions.
The Firm is one of the defendants in a putative class action alleging manipulation of Euroyen TIBOR and Yen LIBOR which was filed in the United States District Court for the Southern District of New York on behalf of plaintiffs who purchased or sold exchange-traded Euroyen futures and options contracts. In March 2014, the Court granted in part and denied in part the defendants’ motions to dismiss, including dismissal of plaintiff’s antitrust and unjust enrichment claims.
The Firm is one of the defendants in a putative class action filed in the United States District Court for the Southern District of New York relating to the interest rate benchmark EURIBOR. The case is currently stayed.
The Firm is also one of the defendants in a number of putative class actions alleging that defendant banks and ICAP conspired to manipulate the U.S. dollar ISDAFIX rates. Plaintiffs primarily assert claims under the federal antitrust laws and Commodities Exchange Act. In December 2014, defendants filed a motion to dismiss.
Madoff Litigation.
Various subsidiaries of the Firm, including J.P. Morgan Securities plc, have been named as defendants in lawsuits filed in Bankruptcy Court in New York arising out of the liquidation proceedings of Fairfield Sentry Limited and Fairfield Sigma Limited, so-called Madoff feeder funds. These actions seek to recover payments made by the funds to defendants totaling approximately
$155 million
. All but
two
of these actions have been dismissed.
In addition, a putative class action was brought by investors in certain feeder funds against JPMorgan Chase in the United States District Court for the Southern District of New York, as was a motion by separate potential class plaintiffs to add claims against the Firm and certain subsidiaries to an already pending putative class action in the same court. The allegations in these complaints largely track those
|
JPMorgan Chase & Co./2014 Annual Report
|
297
|
|
Notes to consolidated financial statements
previously raised by the court-appointed trustee for Bernard L. Madoff Investment Securities LLC. The District Court dismissed these complaints and the United States Court of Appeals for the Second Circuit affirmed the District Court’s decision. Plaintiffs have petitioned the United States Supreme Court for a writ of certiorari.
The Firm is a defendant in
five
other Madoff-related individual investor actions pending in New York state court. The allegations in all of these actions are essentially identical, and involve claims against the Firm for, among other things, aiding and abetting breach of fiduciary duty, conversion and unjust enrichment. In August 2014, the Court dismissed all claims against the Firm. Plaintiffs have filed a notice of appeal.
A putative class action has been filed in the United States District Court for the District of New Jersey by investors who were net winners (i.e., Madoff customers who had taken more money out of their accounts than had been invested) in Madoff’s Ponzi scheme and were not included in the previous class action settlement. These plaintiffs allege violations of the federal securities law, federal and state racketeering statutes and multiple common law and statutory claims including breach of trust, aiding and abetting embezzlement, unjust enrichment, conversion and commercial bad faith. A similar action has been filed in the United States District Court for the Middle District of Florida, although it is not styled as a class action, and includes a claim pursuant to a Florida statute. The Firm has moved to transfer these cases to the United States District Court for the Southern District of New York.
Three
shareholder derivative actions have also been filed in New York federal and state court against the Firm, as nominal defendant, and certain of its current and former Board members, alleging breach of fiduciary duty in connection with the Firm’s relationship with Bernard Madoff and the alleged failure to maintain effective internal controls to detect fraudulent transactions. The actions seek declaratory relief and damages. In July 2014, the federal court granted defendants’ motions to dismiss
two
of the actions. One plaintiff chose not to appeal and the other filed a motion for reconsideration which was denied in November 2014. The latter plaintiff has filed an appeal. In the remaining state court action, a hearing on defendants’ motion to dismiss was held in October 2014, and the court reserved decision.
MF Global.
J.P. Morgan Securities LLC has been named as
one
of several defendants in a number of putative class actions filed by purchasers of MF Global’s publicly traded securities asserting violations of federal securities laws and alleging that the offering documents contained materially false and misleading statements and omissions regarding MF Global. These actions have been settled, subject to final approval by the court. The Firm also has responded to inquiries from the CFTC relating to the Firm’s banking and other business relationships with MF Global, including as a depository for MF Global’s customer segregated accounts.
Mortgage-Backed Securities and Repurchase Litigation and Related Regulatory Investigations.
JPMorgan Chase and affiliates (together, “JPMC”), Bear Stearns and affiliates (together, “Bear Stearns”) and certain Washington Mutual affiliates (together, “Washington Mutual”) have been named as defendants in a number of cases in their various roles in offerings of mortgage-backed securities (“MBS”). These cases include class action suits on behalf of MBS purchasers, actions by individual MBS purchasers and actions by monoline insurance companies that guaranteed payments of principal and interest for particular tranches of MBS offerings. Following the settlements referred to under “Repurchase Litigation” and “Government Enforcement Investigations and Litigation” below, there are currently pending and tolled investor and monoline insurer claims involving MBS with an original principal balance of approximately
$41 billion
, of which
$38 billion
involves JPMC, Bear Stearns or Washington Mutual as issuer and
$3 billion
involves JPMC, Bear Stearns or Washington Mutual solely as underwriter. The Firm and certain of its current and former officers and Board members have also been sued in shareholder derivative actions relating to the Firm’s MBS activities, and trustees have asserted or have threatened to assert claims that loans in securitization trusts should be repurchased.
Issuer Litigation – Class Actions.
Two
class actions remain pending against JPMC and Bear Stearns as MBS issuers in the United States District Court for the Southern District of New York. In the action concerning JPMC, plaintiffs’ motion for class certification has been granted with respect to liability but denied without prejudice as to damages. In the action concerning Bear Stearns, the parties have reached a settlement in principle, which is subject to court approval. The Firm is also defending a class action brought against Bear Stearns in the United States District Court for the District of Massachusetts, in which the court’s decision on defendants’ motion to dismiss is pending.
Issuer Litigation – Individual Purchaser Actions.
In addition to class actions, the Firm is defending individual actions brought against JPMC, Bear Stearns and Washington Mutual as MBS issuers (and, in some cases, also as underwriters of their own MBS offerings). These actions are pending in federal and state courts across the U.S. and are in various stages of litigation.
Monoline Insurer Litigation.
The Firm is defending
two
pending actions relating to the same monoline insurer’s guarantees of principal and interest on certain classes of
11
different Bear Stearns MBS offerings. These actions are pending in state court in New York and are in various stages of litigation.
Underwriter Actions.
In actions against the Firm solely as an underwriter of other issuers’ MBS offerings, the Firm has contractual rights to indemnification from the issuers. However, those indemnity rights may prove effectively unenforceable in various situations, such as where the issuers are now defunct. There are currently actions of this type pending against the Firm in federal and state courts in
|
298
|
JPMorgan Chase & Co./2014 Annual Report
|
|
various stages of litigation. One such class action has been settled, subject to final approval by the court.
Repurchase Litigation.
The Firm is defending a number of actions brought by trustees, securities administrators or master servicers of various MBS trusts and others on behalf of purchasers of securities issued by those trusts. These cases generally allege breaches of various representations and warranties regarding securitized loans and seek repurchase of those loans or equivalent monetary relief, as well as indemnification of attorneys’ fees and costs and other remedies. Deutsche Bank National Trust Company, acting as trustee for various MBS trusts, has filed such a suit against JPMorgan Chase Bank, N.A. and the Federal Deposit Insurance Corporation (the “FDIC”) in connection with a significant number of MBS issued by Washington Mutual; that case is described in the Washington Mutual Litigations section below. Other repurchase actions, each specific to one or more MBS transactions issued by JPMC and/or Bear Stearns, are in various stages of litigation.
In addition, the Firm and a group of
21
institutional MBS investors made a binding offer to the trustees of MBS issued by JPMC and Bear Stearns providing for the payment of
$4.5 billion
and the implementation of certain servicing changes by JPMC, to resolve all repurchase and servicing claims that have been asserted or could have been asserted with respect to the
330
MBS trusts issued between 2005 and 2008. The offer does not resolve claims relating to Washington Mutual MBS. The
seven
trustees (or separate and successor trustees) for this group of
330
trusts has accepted the settlement for
319
trusts in whole or in part and excluded from the settlement
16
trusts in whole or in part. The trustees’ acceptance is subject to a judicial approval proceeding initiated by the trustees and pending in New York state court. Certain investors in some of the trusts for which the settlement has been accepted have intervened in the judicial approval proceeding, challenging the trustees’ acceptance of the settlement.
Additional actions have been filed against third-party trustees that relate to loan repurchase and servicing claims involving trusts that the Firm sponsored.
Derivative Actions.
Shareholder derivative actions relating to the Firm’s MBS activities have been filed against the Firm, as nominal defendant, and certain of its current and former officers and members of its Board of Directors, in New York state court and California federal court.
Two
of the New York actions have been dismissed and one is on appeal. A consolidated action in California federal court has been dismissed without prejudice for lack of personal jurisdiction and plaintiffs are pursuing discovery.
Government Enforcement Investigations and Litigation.
The Firm is responding to an ongoing investigation being conducted by the Criminal Division of the United States Attorney’s Office for the Eastern District of California relating to MBS offerings securitized and sold by the Firm and its subsidiaries. The Firm has also received subpoenas and informal requests for information from state authorities concerning the issuance and underwriting of MBS-related
matters. The Firm continues to respond to these MBS-related regulatory inquiries.
In addition, the Firm continues to cooperate with investigations by DOJ, including the U.S. Attorney’s Office for the District of Connecticut, the SEC Division of Enforcement and the Office of the Special Inspector General for the Troubled Asset Relief Program, all of which relate to, among other matters, communications with counterparties in connection with certain secondary market trading in residential and commercial MBS.
The Firm has entered into agreements with a number of entities that purchased MBS that toll applicable limitations periods with respect to their claims, and has settled, and in the future may settle, tolled claims. There is no assurance that the Firm will not be named as a defendant in additional MBS-related litigation.
Mortgage-Related Investigations and Litigation.
The Attorney General of Massachusetts filed an action against the Firm, other servicers and a mortgage recording company, asserting claims for various alleged wrongdoings relating to mortgage assignments and use of the industry’s electronic mortgage registry. In January 2015, the Firm entered into a settlement resolving this action.
The Firm entered into a settlement resolving a putative class action lawsuit relating to its filing of affidavits or other documents in connection with mortgage foreclosure proceedings, and the court granted final approval of the settlement in January 2015.
One
shareholder derivative action has been filed in New York Supreme Court against the Firm’s Board of Directors alleging that the Board failed to exercise adequate oversight as to wrongful conduct by the Firm regarding mortgage servicing. In December 2014, the court granted defendants’ motion to dismiss the complaint.
The Civil Division of the United States Attorney’s Office for the Southern District of New York is conducting an investigation concerning the Firm’s compliance with the Fair Housing Act (“FHA”) and Equal Credit Opportunity Act (“ECOA”) in connection with its mortgage lending practices. In addition,
three
municipalities and a school district have commenced litigation against the Firm alleging violations of an unfair competition law and of the FHA and ECOA and seeking statutory damages for the unfair competition claim, and, for the FHA and ECOA claims, damages in the form of lost tax revenue and increased municipal costs associated with foreclosed properties. The court denied a motion to dismiss in one of the municipal actions, the school district action was dismissed with prejudice, another municipal action was recently served, and motions to dismiss are pending in the remaining actions.
JPMorgan Chase Bank, N.A. is responding to inquiries by the Executive Office of the U.S. Bankruptcy Trustee and various regional U.S. Bankruptcy Trustees relating to mortgage payment change notices and escrow statements in bankruptcy proceedings.
|
JPMorgan Chase & Co./2014 Annual Report
|
299
|
|
Notes to consolidated financial statements
Municipal Derivatives Litigation.
Several civil actions were commenced in New York and Alabama courts against the Firm relating to certain Jefferson County, Alabama (the “County”) warrant underwritings and swap transactions. The claims in the civil actions generally alleged that the Firm made payments to certain third parties in exchange for being chosen to underwrite more than
$3 billion
in warrants issued by the County and to act as the counterparty for certain swaps executed by the County. The County filed for bankruptcy in November 2011. In June 2013, the County filed a Chapter 9 Plan of Adjustment, as amended (the “Plan of Adjustment”), which provided that all the above-described actions against the Firm would be released and dismissed with prejudice. In November 2013, the Bankruptcy Court confirmed the Plan of Adjustment, and in December 2013, certain sewer rate payers filed an appeal challenging the confirmation of the Plan of Adjustment. All conditions to the Plan of Adjustment’s effectiveness, including the dismissal of the actions against the Firm, were satisfied or waived and the transactions contemplated by the Plan of Adjustment occurred in December 2013. Accordingly, all the above-described actions against the Firm have been dismissed pursuant to the terms of the Plan of Adjustment. The appeal of the Bankruptcy Court’s order confirming the Plan of Adjustment remains pending.
Parmalat
.
In 2003, following the bankruptcy of the Parmalat group of companies (“Parmalat”), criminal prosecutors in Italy investigated the activities of Parmalat, its directors and the financial institutions that had dealings with them following the collapse of the company. In March 2012, the criminal prosecutor served a notice indicating an intention to pursue criminal proceedings against
four
former employees of the Firm (but not against the Firm) on charges of conspiracy to cause Parmalat’s insolvency by underwriting bonds and continuing derivatives trading when Parmalat’s balance sheet was false.
A preliminary hearing, in which the judge will determine whether to recommend that the matter go to a full trial, is ongoing. The final hearings have been scheduled for March 2015.
In addition, the administrator of Parmalat commenced
five
civil actions against JPMorgan Chase entities including:
two
claw-back actions; a claim relating to bonds issued by Parmalat in which it is alleged that JPMorgan Chase kept Parmalat “artificially” afloat and delayed the declaration of insolvency; and similar allegations in
two
claims relating to derivatives transactions.
Petters Bankruptcy and Related Matters.
JPMorgan Chase and certain of its affiliates, including One Equity Partners (“OEP”), have been named as defendants in several actions filed in connection with the receivership and bankruptcy proceedings pertaining to Thomas J. Petters and certain affiliated entities (collectively, “Petters”) and the Polaroid Corporation. The principal actions against JPMorgan Chase and its affiliates have been brought by a court-appointed receiver for Petters and the trustees in bankruptcy proceedings for
three
Petters entities. These actions generally seek to avoid certain putative transfers in
connection with (i) the 2005 acquisition by Petters of Polaroid, which at the time was majority-owned by OEP; (ii) two credit facilities that JPMorgan Chase and other financial institutions entered into with Polaroid; and (iii) a credit line and investment accounts held by Petters. The actions collectively seek recovery of approximately
$450 million
. Defendants have moved to dismiss the complaints in the actions filed by the Petters bankruptcy trustees.
Power Matters.
The United States Attorney’s Office for the Southern District of New York is investigating matters relating to the bidding activities that were the subject of the July 2013 settlement between J.P. Morgan Ventures Energy Corp. and the Federal Energy Regulatory Commission. The Firm is responding to and cooperating with the investigation.
Referral Hiring Practices Investigations.
Various regulators are investigating, among other things, the Firm’s compliance with the Foreign Corrupt Practices Act and other laws with respect to the Firm’s hiring practices related to candidates referred by clients, potential clients and government officials, and its engagement of consultants in the Asia Pacific region. The Firm is responding to and continuing to cooperate with these investigations.
Sworn Documents, Debt Sales and Collection Litigation Practices
. The Firm has been responding to formal and informal inquiries from various state and federal regulators regarding practices involving credit card collections litigation (including with respect to sworn documents), the sale of consumer credit card debt and securities backed by credit card receivables.
Separately, the Consumer Financial Protection Bureau and multiple state Attorneys General are conducting investigations into the Firm’s collection and sale of consumer credit card debt. The California and Mississippi Attorneys General have filed separate civil actions against JPMorgan Chase & Co., Chase Bank USA, N.A. and Chase BankCard Services, Inc. alleging violations of law relating to debt collection practices.
Washington Mutual Litigations.
Proceedings related to Washington Mutual’s failure are pending before the United States District Court for the District of Columbia and include a lawsuit brought by Deutsche Bank National Trust Company, initially against the FDIC and amended to include JPMorgan Chase Bank, N.A. as a defendant, asserting an estimated
$6 billion
to
$10 billion
in damages based upon alleged breach of various mortgage securitization agreements and alleged violation of certain representations and warranties given by certain Washington Mutual affiliates in connection with those securitization agreements. The case includes assertions that JPMorgan Chase Bank, N.A. may have assumed liabilities for the alleged breaches of representations and warranties in the mortgage securitization agreements. The Firm and the FDIC have filed opposing motions, each seeking a ruling that the liabilities at issue are borne by the other.
Certain holders of Washington Mutual Bank debt filed an action against JPMorgan Chase which alleged that by
|
300
|
JPMorgan Chase & Co./2014 Annual Report
|
|
acquiring substantially all of the assets of Washington Mutual Bank from the FDIC, JPMorgan Chase Bank, N.A. caused Washington Mutual Bank to default on its bond obligations. JPMorgan Chase and the FDIC moved to dismiss this action and the District Court dismissed the case except as to the plaintiffs’ claim that JPMorgan Chase tortiously interfered with the plaintiffs’ bond contracts with Washington Mutual Bank prior to its closure. Discovery is ongoing.
JPMorgan Chase has also filed a complaint in the United States District Court for the District of Columbia against the FDIC in its capacity as receiver for Washington Mutual Bank and in its corporate capacity asserting multiple claims for indemnification under the terms of the Purchase & Assumption Agreement between JPMorgan Chase and the FDIC relating to JPMorgan Chase’s purchase of most of the assets and certain liabilities of Washington Mutual Bank.
* * *
In addition to the various legal proceedings discussed above, JPMorgan Chase and its subsidiaries are named as defendants or are otherwise involved in a substantial number of other legal proceedings. The Firm believes it has meritorious defenses to the claims asserted against it in its currently outstanding legal proceedings and it intends to defend itself vigorously in all such matters. Additional legal proceedings may be initiated from time to time in the future.
The Firm has established reserves for several hundred of its currently outstanding legal proceedings. In accordance with the provisions of U.S. GAAP for contingencies, the Firm accrues for a litigation-related liability when it is probable that such a liability has been incurred and the amount of the loss can be reasonably estimated. The Firm evaluates its outstanding legal proceedings each quarter to assess its litigation reserves, and makes adjustments in such reserves, upwards or downward, as appropriate, based on management’s best judgment after consultation with counsel. During the years ended December 31, 2014, 2013 and 2012, the Firm incurred
$2.9 billion
,
$11.1 billion
and
$5.0 billion
, respectively, of legal expense. There is no assurance that the Firm’s litigation reserves will not need to be adjusted in the future.
In view of the inherent difficulty of predicting the outcome of legal proceedings, particularly where the claimants seek very large or indeterminate damages, or where the matters present novel legal theories, involve a large number of
parties or are in early stages of discovery, the Firm cannot state with confidence what will be the eventual outcomes of the currently pending matters, the timing of their ultimate resolution or the eventual losses, fines, penalties or impact related to those matters. JPMorgan Chase believes, based upon its current knowledge, after consultation with counsel and after taking into account its current litigation reserves, that the legal proceedings currently pending against it should not have a material adverse effect on the Firm’s consolidated financial condition. The Firm notes, however, that in light of the uncertainties involved in such proceedings, there is no assurance the ultimate resolution of these matters will not significantly exceed the reserves it has currently accrued; as a result, the outcome of a particular matter may be material to JPMorgan Chase’s operating results for a particular period, depending on, among other factors, the size of the loss or liability imposed and the level of JPMorgan Chase’s income for that period.
|
JPMorgan Chase & Co./2014 Annual Report
|
301
|
|
Notes to consolidated financial statements
The following table presents income statement-related and balance sheet-related information for JPMorgan Chase by major international geographic area. The Firm defines international activities for purposes of this footnote presentation as business transactions that involve clients residing outside of the U.S., and the information presented below is based predominantly on the domicile of the client, the location from which the client relationship is managed, or the location of the trading desk. However, many of the Firm’s U.S. operations serve international businesses.
As the Firm’s operations are highly integrated, estimates and subjective assumptions have been made to apportion revenue and expense between U.S. and international operations. These estimates and assumptions are consistent with the allocations used for the Firm’s segment reporting as set forth in Note 33.
The Firm’s long-lived assets for the periods presented are not considered by management to be significant in relation to total assets. The majority of the Firm’s long-lived assets are located in the U.S.
|
As of or for the year ended December 31, (in millions)
|
Revenue
(b)
|
Expense
(c)
|
Income before income tax
expense
|
Net income
|
Total assets
|
||||||||||||||||
|
2014
|
|
|
|
|
|||||||||||||||||
|
Europe/Middle East and Africa
|
$
|
16,013
|
|
$
|
10,123
|
|
$
|
5,890
|
|
$
|
3,935
|
|
$
|
481,328
|
|
(d)
|
|||||
|
Asia and Pacific
|
6,083
|
|
4,478
|
|
1,605
|
|
1,051
|
|
147,357
|
|
|||||||||||
|
Latin America and the Caribbean
|
2,047
|
|
1,626
|
|
421
|
|
269
|
|
44,567
|
|
|||||||||||
|
Total international
|
24,143
|
|
16,227
|
|
7,916
|
|
5,255
|
|
673,252
|
|
|||||||||||
|
North America
(a)
|
70,062
|
|
48,186
|
|
21,876
|
|
16,507
|
|
1,899,874
|
|
|||||||||||
|
Total
|
$
|
94,205
|
|
$
|
64,413
|
|
$
|
29,792
|
|
$
|
21,762
|
|
$
|
2,573,126
|
|
||||||
|
2013
|
|||||||||||||||||||||
|
Europe/Middle East and Africa
|
$
|
15,585
|
|
$
|
9,069
|
|
$
|
6,516
|
|
$
|
4,842
|
|
$
|
514,747
|
|
(d)
|
|||||
|
Asia and Pacific
|
6,168
|
|
4,248
|
|
1,920
|
|
1,254
|
|
145,999
|
|
|||||||||||
|
Latin America and the Caribbean
|
2,251
|
|
1,626
|
|
625
|
|
381
|
|
41,473
|
|
|||||||||||
|
Total international
|
24,004
|
|
14,943
|
|
9,061
|
|
6,477
|
|
702,219
|
|
|||||||||||
|
North America
(a)
|
72,602
|
|
55,749
|
|
16,853
|
|
11,446
|
|
1,713,470
|
|
|||||||||||
|
Total
|
$
|
96,606
|
|
$
|
70,692
|
|
$
|
25,914
|
|
$
|
17,923
|
|
$
|
2,415,689
|
|
||||||
|
2012
|
|||||||||||||||||||||
|
Europe/Middle East and Africa
|
$
|
10,522
|
|
$
|
9,326
|
|
$
|
1,196
|
|
$
|
1,508
|
|
$
|
553,147
|
|
(d)
|
|||||
|
Asia and Pacific
|
5,605
|
|
3,952
|
|
1,653
|
|
1,048
|
|
167,955
|
|
|||||||||||
|
Latin America and the Caribbean
|
2,328
|
|
1,580
|
|
748
|
|
454
|
|
53,984
|
|
|||||||||||
|
Total international
|
18,455
|
|
14,858
|
|
3,597
|
|
3,010
|
|
775,086
|
|
|||||||||||
|
North America
(a)
|
78,576
|
|
53,256
|
|
25,320
|
|
18,274
|
|
1,584,055
|
|
|||||||||||
|
Total
|
$
|
97,031
|
|
$
|
68,114
|
|
$
|
28,917
|
|
$
|
21,284
|
|
$
|
2,359,141
|
|
||||||
|
(a)
|
Substantially reflects the U.S.
|
|
(b)
|
Revenue is composed of net interest income and noninterest revenue.
|
|
(c)
|
Expense is composed of noninterest expense and the provision for credit losses.
|
|
(d)
|
Total assets for the U.K. were approximately
$434 billion
,
$451 billion
, and
$498 billion
at
December 31, 2014
,
2013
and
2012
, respectively.
|
|
302
|
JPMorgan Chase & Co./2014 Annual Report
|
|
The Firm is managed on a line of business basis. There are
four
major reportable business segments – Consumer & Community Banking, Corporate & Investment Bank, Commercial Banking and Asset Management. In addition, there is a Corporate segment. The business segments are determined based on the products and services provided, or the type of customer served, and they reflect the manner in which financial information is currently evaluated by management. Results of these lines of business are presented on a managed basis. For a definition of managed basis, see Explanation and Reconciliation of the Firm’s use of non-GAAP financial measures, on
pages 77–78
. For a further discussion concerning
JPMorgan Chase
’s business segments, see Business Segment Results on
pages 79–80
.
The following is a description of each of the Firm’s business segments, and the products and services they provide to their respective client bases.
Consumer & Community Banking
Consumer & Community Banking (“CCB”) serves consumers and businesses through personal service at bank branches and through ATMs, online, mobile and telephone banking. CCB is organized into Consumer & Business Banking, Mortgage Banking (including Mortgage Production, Mortgage Servicing and Real Estate Portfolios) and Card, Merchant Services & Auto (“Card”). Consumer & Business Banking offers deposit and investment products and services to consumers, and lending, deposit, and cash management and payment solutions to small businesses. Mortgage Banking includes mortgage origination and servicing activities, as well as portfolios comprised of residential mortgages and home equity loans, including the PCI portfolio acquired in the Washington Mutual transaction. Card issues credit cards to consumers and small businesses, provides payment services to corporate and public sector clients through its commercial card products, offers payment processing services to merchants, and provides auto and student loan services.
Corporate & Investment Bank
The Corporate & Investment Bank (“CIB”), comprised of Banking and Markets & Investor Services, offers a broad suite of investment banking, market-making, prime brokerage, and treasury and securities products and services to a global client base of corporations, investors, financial institutions, government and municipal entities. Within Banking, the CIB offers a full range of investment banking products and services in all major capital markets, including advising on corporate strategy and structure, capital-raising in equity and debt markets, as well as loan origination and syndication. Also included in Banking is Treasury Services, which includes transaction services, comprised primarily of cash management and liquidity solutions, and trade finance products. The Markets & Investor Services segment of the CIB is a global market-maker in cash securities and derivative instruments, and also offers sophisticated risk management solutions, prime
brokerage, and research. Markets & Investor Services also includes the Securities Services business, a leading global custodian which includes custody, fund accounting and administration, and securities lending products sold principally to asset managers, insurance companies and public and private investment funds.
Commercial Banking
Commercial Banking (“CB”) delivers extensive industry knowledge, local expertise and dedicated service to U.S. and multinational clients, including corporations, municipalities, financial institutions and non-profit entities with annual revenue generally ranging from
$20 million
to
$2 billion
. CB provides financing to real estate investors and owners. Partnering with the Firm’s other businesses, CB provides comprehensive financial solutions, including lending, treasury services, investment banking and asset management to meet its clients’ domestic and international financial needs.
Asset Management
Asset Management (“AM”), with client assets of
$2.4 trillion
, is a global leader in investment and wealth management. AM clients include institutions, high-net-worth individuals and retail investors in every major market throughout the world. AM offers investment management across all major asset classes including equities, fixed income, alternatives and money market funds. AM also offers multi-asset investment management, providing solutions for a broad range of clients’ investment needs. For Global Wealth Management clients, AM also provides retirement products and services, brokerage and banking services including trusts and estates, loans, mortgages and deposits. The majority of AM’s client assets are in actively managed portfolios.
Corporate
The Corporate segment comprises Private Equity, Treasury and Chief Investment Office (“CIO”), and Other Corporate, which includes corporate staff units and expense that is centrally managed. Treasury and CIO are predominantly responsible for measuring, monitoring, reporting and managing the Firm’s liquidity, funding and structural interest rate and foreign exchange risks, as well as executing the Firm’s capital plan. The major Other Corporate units include Real Estate, Enterprise Technology, Legal, Compliance, Finance, Human Resources, Internal Audit, Risk Management, Oversight & Control, Corporate Responsibility and various Other Corporate groups. Other centrally managed expense includes the Firm’s occupancy and pension-related expense that are subject to allocation to the businesses.
|
JPMorgan Chase & Co./2014 Annual Report
|
303
|
|
Notes to consolidated financial statements
Segment results
The following tables provide a summary of the Firm’s segment results as of or for the years ended December 31,
2014
,
2013
and
2012
on a managed basis.
Total net revenue (noninterest revenue and net interest income) for each of the segments is presented on a fully taxable-equivalent (“FTE”) basis. Accordingly, revenue from investments that receive tax credits and tax-exempt securities is presented in the managed results on a basis comparable to taxable investments and securities. This non-GAAP financial measure allows management to assess the comparability of revenue arising from both taxable and tax-
exempt sources. The corresponding income tax impact related to tax-exempt items is recorded within income tax expense/(benefit).
Business segment capital allocation changes
Effective January 1, 2013, the Firm refined the capital allocation framework to align it with the revised line of business structure that became effective in the fourth quarter of 2012. The change in equity levels for the lines of businesses was largely driven by the evolving regulatory requirements and higher capital targets the Firm had established under the Basel III Advanced Approach.
Segment results and reconciliation
|
As of or the year ended
December 31,
(in millions, except ratios)
|
Consumer & Community Banking
|
Corporate & Investment Bank
|
Commercial Banking
|
||||||||||||||||||||||||||
|
2014
|
2013
|
2012
|
2014
|
2013
|
2012
|
2014
|
2013
|
2012
|
|||||||||||||||||||||
|
Noninterest revenue
|
$
|
15,937
|
|
$
|
17,552
|
|
$
|
20,813
|
|
$
|
23,458
|
|
$
|
23,810
|
|
$
|
23,104
|
|
$
|
2,349
|
|
$
|
2,298
|
|
$
|
2,283
|
|
||
|
Net interest income
|
28,431
|
|
28,985
|
|
29,465
|
|
11,175
|
|
10,976
|
|
11,658
|
|
4,533
|
|
4,794
|
|
4,629
|
|
|||||||||||
|
Total net revenue
|
44,368
|
|
46,537
|
|
50,278
|
|
34,633
|
|
34,786
|
|
34,762
|
|
6,882
|
|
7,092
|
|
6,912
|
|
|||||||||||
|
Provision for credit losses
|
3,520
|
|
335
|
|
3,774
|
|
(161
|
)
|
(232
|
)
|
(479
|
)
|
(189
|
)
|
85
|
|
41
|
|
|||||||||||
|
Noninterest expense
|
25,609
|
|
27,842
|
|
28,827
|
|
23,273
|
|
21,744
|
|
21,850
|
|
2,695
|
|
2,610
|
|
2,389
|
|
|||||||||||
|
Income/(loss) before income tax expense/(benefit)
|
15,239
|
|
18,360
|
|
17,677
|
|
11,521
|
|
13,274
|
|
13,391
|
|
4,376
|
|
4,397
|
|
4,482
|
|
|||||||||||
|
Income tax expense/(benefit)
|
6,054
|
|
7,299
|
|
6,886
|
|
4,596
|
|
4,387
|
|
4,719
|
|
1,741
|
|
1,749
|
|
1,783
|
|
|||||||||||
|
Net income/(loss)
|
$
|
9,185
|
|
$
|
11,061
|
|
$
|
10,791
|
|
$
|
6,925
|
|
$
|
8,887
|
|
$
|
8,672
|
|
$
|
2,635
|
|
$
|
2,648
|
|
$
|
2,699
|
|
||
|
Average common equity
|
$
|
51,000
|
|
$
|
46,000
|
|
$
|
43,000
|
|
$
|
61,000
|
|
$
|
56,500
|
|
$
|
47,500
|
|
$
|
14,000
|
|
$
|
13,500
|
|
$
|
9,500
|
|
||
|
Total assets
|
455,634
|
|
452,929
|
|
467,282
|
|
861,819
|
|
843,577
|
|
876,107
|
|
195,267
|
|
190,782
|
|
181,502
|
|
|||||||||||
|
Return on common equity
|
18
|
%
|
23
|
%
|
25
|
%
|
10
|
%
|
15
|
%
|
18
|
%
|
18
|
%
|
19
|
%
|
28
|
%
|
|||||||||||
|
Overhead ratio
|
58
|
|
60
|
|
57
|
|
67
|
|
63
|
|
63
|
|
39
|
|
37
|
|
35
|
|
|||||||||||
|
(a)
|
Segment managed results reflect revenue on a FTE basis with the corresponding income tax impact recorded within income tax expense/(benefit). These adjustments are eliminated in reconciling items to arrive at the Firm’s reported U.S. GAAP results.
|
|
304
|
JPMorgan Chase & Co./2014 Annual Report
|
|
On at least an annual basis, the Firm assesses the level of capital required for each line of business as well as the assumptions and methodologies used to allocate capital to its lines of business and updates equity allocations to its lines of business as refinements are implemented.
Preferred stock dividend allocation reporting change
As part of its funds transfer pricing process, the Firm allocates substantially all of the cost of its outstanding preferred stock to its reportable business segments, while retaining the balance of the cost in Corporate. Prior to the fourth quarter of 2014, this cost was allocated to the Firm’s reportable business segments as interest expense, with an offset recorded as interest income in Corporate. Effective with the fourth quarter of 2014, this cost is no longer included in interest income and interest expense in the
segments, but rather is now included in net income applicable to common equity to be consistent with the presentation of firmwide results. As a result of this reporting change, net interest income and net income in the reportable business segments increases; however, there was no impact to the segments’ return on common equity (“ROE”). The Firm’s net interest income, net income, Consolidated balance sheets and consolidated results of operations were not impacted by this reporting change, as preferred stock dividends have been and continue to be distributed from retained earnings and, accordingly, were never reported as a component of the Firm’s consolidated net interest income or net income. Prior period segment amounts have been revised to conform with the current period presentation.
|
(table continued from previous page)
|
||||||||||||||||||||||||||||||||||||||
|
Asset Management
|
Corporate
|
Reconciling Items
(a)
|
Total
|
|||||||||||||||||||||||||||||||||||
|
2014
|
2013
|
2012
|
2014
|
2013
|
2012
|
2014
|
2013
|
2012
|
2014
|
2013
|
2012
|
|||||||||||||||||||||||||||
|
$
|
9,588
|
|
$
|
9,029
|
|
$
|
7,847
|
|
$
|
1,972
|
|
$
|
3,093
|
|
$
|
190
|
|
$
|
(2,733
|
)
|
$
|
(2,495
|
)
|
$
|
(2,116
|
)
|
$
|
50,571
|
|
$
|
53,287
|
|
$
|
52,121
|
|
|||
|
2,440
|
|
2,376
|
|
2,163
|
|
(1,960
|
)
|
(3,115
|
)
|
(2,262
|
)
|
(985
|
)
|
(697
|
)
|
(743
|
)
|
43,634
|
|
43,319
|
|
44,910
|
|
|||||||||||||||
|
12,028
|
|
11,405
|
|
10,010
|
|
12
|
|
(22
|
)
|
(2,072
|
)
|
(3,718
|
)
|
(3,192
|
)
|
(2,859
|
)
|
94,205
|
|
96,606
|
|
97,031
|
|
|||||||||||||||
|
4
|
|
65
|
|
86
|
|
(35
|
)
|
(28
|
)
|
(37
|
)
|
—
|
|
—
|
|
—
|
|
3,139
|
|
225
|
|
3,385
|
|
|||||||||||||||
|
8,538
|
|
8,016
|
|
7,104
|
|
1,159
|
|
10,255
|
|
4,559
|
|
—
|
|
—
|
|
—
|
|
61,274
|
|
70,467
|
|
64,729
|
|
|||||||||||||||
|
3,486
|
|
3,324
|
|
2,820
|
|
(1,112
|
)
|
(10,249
|
)
|
(6,594
|
)
|
(3,718
|
)
|
(3,192
|
)
|
(2,859
|
)
|
29,792
|
|
25,914
|
|
28,917
|
|
|||||||||||||||
|
1,333
|
|
1,241
|
|
1,078
|
|
(1,976
|
)
|
(3,493
|
)
|
(3,974
|
)
|
(3,718
|
)
|
(3,192
|
)
|
(2,859
|
)
|
8,030
|
|
7,991
|
|
7,633
|
|
|||||||||||||||
|
$
|
2,153
|
|
$
|
2,083
|
|
$
|
1,742
|
|
$
|
864
|
|
$
|
(6,756
|
)
|
$
|
(2,620
|
)
|
$
|
—
|
|
$
|
—
|
|
$
|
—
|
|
$
|
21,762
|
|
$
|
17,923
|
|
$
|
21,284
|
|
|||
|
$
|
9,000
|
|
$
|
9,000
|
|
$
|
7,000
|
|
$
|
72,400
|
|
$
|
71,409
|
|
$
|
77,352
|
|
$
|
—
|
|
$
|
—
|
|
$
|
—
|
|
$
|
207,400
|
|
$
|
196,409
|
|
$
|
184,352
|
|
|||
|
128,701
|
|
122,414
|
|
108,999
|
|
931,705
|
|
805,987
|
|
725,251
|
|
NA
|
|
NA
|
|
NA
|
|
2,573,126
|
|
2,415,689
|
|
2,359,141
|
|
|||||||||||||||
|
23
|
%
|
23
|
%
|
24
|
%
|
NM
|
|
NM
|
|
NM
|
|
NM
|
|
NM
|
|
NM
|
|
10
|
%
|
9
|
%
|
11
|
%
|
|||||||||||||||
|
71
|
|
70
|
|
71
|
|
NM
|
|
NM
|
|
NM
|
|
NM
|
|
NM
|
|
NM
|
|
65
|
|
73
|
|
67
|
|
|||||||||||||||
|
JPMorgan Chase & Co./2014 Annual Report
|
305
|
|
Notes to consolidated financial statements
|
Parent company – Statements of income and comprehensive income
|
||||||||||||
|
Year ended December 31,
(in millions)
|
2014
|
|
2013
|
|
2012
|
|
||||||
|
Income
|
||||||||||||
|
Dividends from subsidiaries and affiliates:
|
||||||||||||
|
Bank and bank holding company
|
$
|
—
|
|
$
|
1,175
|
|
$
|
4,828
|
|
|||
|
Nonbank
(a)
|
14,716
|
|
876
|
|
1,972
|
|
||||||
|
Interest income from subsidiaries
|
378
|
|
757
|
|
1,041
|
|
||||||
|
Other interest income
|
284
|
|
303
|
|
293
|
|
||||||
|
Other income from subsidiaries,
primarily fees:
|
||||||||||||
|
Bank and bank holding company
|
779
|
|
318
|
|
939
|
|
||||||
|
Nonbank
|
52
|
|
2,065
|
|
1,207
|
|
||||||
|
Other income/(loss)
|
508
|
|
(1,380
|
)
|
579
|
|
||||||
|
Total income
|
16,717
|
|
4,114
|
|
10,859
|
|
||||||
|
Expense
|
||||||||||||
|
Interest expense to subsidiaries and affiliates
(a)
|
169
|
|
309
|
|
836
|
|
||||||
|
Other interest expense
|
3,645
|
|
4,031
|
|
4,679
|
|
||||||
|
Other noninterest expense
|
827
|
|
9,597
|
|
2,399
|
|
||||||
|
Total expense
|
4,641
|
|
13,937
|
|
7,914
|
|
||||||
|
Income (loss) before income tax benefit and undistributed net income of subsidiaries
|
12,076
|
|
(9,823
|
)
|
2,945
|
|
||||||
|
Income tax benefit
|
1,430
|
|
4,301
|
|
1,665
|
|
||||||
|
Equity in undistributed net income of subsidiaries
|
8,256
|
|
23,445
|
|
16,674
|
|
||||||
|
Net income
|
$
|
21,762
|
|
$
|
17,923
|
|
$
|
21,284
|
|
|||
|
Other comprehensive income, net
|
990
|
|
(2,903
|
)
|
3,158
|
|
||||||
|
Comprehensive income
|
$
|
22,752
|
|
$
|
15,020
|
|
$
|
24,442
|
|
|||
|
Parent company – Balance sheets
|
||||||||
|
December 31, (in millions)
|
2014
|
|
2013
|
|
||||
|
Assets
|
||||||||
|
Cash and due from banks
|
$
|
211
|
|
$
|
264
|
|
||
|
Deposits with banking subsidiaries
|
95,884
|
|
64,843
|
|
||||
|
Trading assets
|
18,222
|
|
13,727
|
|
||||
|
Available-for-sale securities
|
3,321
|
|
15,228
|
|
||||
|
Loans
|
2,260
|
|
2,829
|
|
||||
|
Advances to, and receivables from, subsidiaries:
|
||||||||
|
Bank and bank holding company
|
33,810
|
|
21,693
|
|
||||
|
Nonbank
|
52,626
|
|
68,788
|
|
||||
|
Investments (at equity) in subsidiaries and affiliates:
|
||||||||
|
Bank and bank holding company
|
216,070
|
|
196,950
|
|
||||
|
Nonbank
(a)
|
41,173
|
|
50,996
|
|
||||
|
Other assets
|
18,645
|
|
18,877
|
|
||||
|
Total assets
|
$
|
482,222
|
|
$
|
454,195
|
|
||
|
Liabilities and stockholders’ equity
|
||||||||
|
Borrowings from, and payables to, subsidiaries and affiliates
(a)
|
$
|
17,442
|
|
$
|
14,328
|
|
||
|
Other borrowed funds, primarily commercial paper
|
49,586
|
|
55,454
|
|
||||
|
Other liabilities
|
11,918
|
|
11,367
|
|
||||
|
Long-term debt
(b)(c)
|
171,211
|
|
161,868
|
|
||||
|
Total liabilities
(c)
|
250,157
|
|
243,017
|
|
||||
|
Total stockholders’ equity
|
232,065
|
|
211,178
|
|
||||
|
Total liabilities and stockholders’ equity
|
$
|
482,222
|
|
$
|
454,195
|
|
||
|
Parent company – Statements of cash flows
|
||||||||||||
|
Year ended December 31,
(in millions)
|
2014
|
|
2013
|
|
2012
|
|
||||||
|
Operating activities
|
||||||||||||
|
Net income
|
$
|
21,762
|
|
$
|
17,923
|
|
$
|
21,284
|
|
|||
|
Less: Net income of subsidiaries and affiliates
(a)
|
22,972
|
|
25,496
|
|
23,474
|
|
||||||
|
Parent company net loss
|
(1,210
|
)
|
(7,573
|
)
|
(2,190
|
)
|
||||||
|
Cash dividends from subsidiaries and affiliates
(a)
|
14,714
|
|
1,917
|
|
6,798
|
|
||||||
|
Other operating adjustments
|
(1,698
|
)
|
3,180
|
|
2,376
|
|
||||||
|
Net cash provided by/(used in) operating activities
|
11,806
|
|
(2,476
|
)
|
6,984
|
|
||||||
|
Investing activities
|
||||||||||||
|
Net change in:
|
||||||||||||
|
Deposits with banking subsidiaries
|
(31,040
|
)
|
10,679
|
|
16,100
|
|
||||||
|
Available-for-sale securities:
|
||||||||||||
|
Proceeds from paydowns and maturities
|
12,076
|
|
61
|
|
621
|
|
||||||
|
Purchases
|
—
|
|
(12,009
|
)
|
(364
|
)
|
||||||
|
Other changes in loans, net
|
(319
|
)
|
(713
|
)
|
(350
|
)
|
||||||
|
Advances to and investments in subsidiaries and affiliates, net
|
3,306
|
|
14,469
|
|
9,497
|
|
||||||
|
All other investing activities, net
|
32
|
|
22
|
|
25
|
|
||||||
|
Net cash provided by/(used in) investing activities
|
(15,945
|
)
|
12,509
|
|
25,529
|
|
||||||
|
Financing activities
|
||||||||||||
|
Net change in:
|
||||||||||||
|
Borrowings from subsidiaries and affiliates
(a)
|
4,454
|
|
(2,715
|
)
|
(14,038
|
)
|
||||||
|
Other borrowed funds
|
(5,778
|
)
|
(7,297
|
)
|
3,736
|
|
||||||
|
Proceeds from the issuance of long-term debt
|
40,284
|
|
31,303
|
|
28,172
|
|
||||||
|
Payments of long-term debt
|
(31,050
|
)
|
(21,510
|
)
|
(44,240
|
)
|
||||||
|
Excess tax benefits related to stock-based compensation
|
407
|
|
137
|
|
255
|
|
||||||
|
Proceeds from issuance of preferred stock
|
8,847
|
|
3,873
|
|
1,234
|
|
||||||
|
Redemption of preferred stock
|
—
|
|
(1,800
|
)
|
—
|
|
||||||
|
Treasury stock and warrants repurchased
|
(4,760
|
)
|
(4,789
|
)
|
(1,653
|
)
|
||||||
|
Dividends paid
|
(6,990
|
)
|
(6,056
|
)
|
(5,194
|
)
|
||||||
|
All other financing activities, net
|
(1,328
|
)
|
(1,131
|
)
|
(701
|
)
|
||||||
|
Net cash provided by/(used in) financing activities
|
4,086
|
|
(9,985
|
)
|
(32,429
|
)
|
||||||
|
Net increase/(decrease) in cash and due from banks
|
(53
|
)
|
48
|
|
84
|
|
||||||
|
Cash and due from banks at the beginning of the year, primarily with bank subsidiaries
|
264
|
|
216
|
|
132
|
|
||||||
|
Cash and due from banks at the end of the year, primarily with bank subsidiaries
|
$
|
211
|
|
$
|
264
|
|
$
|
216
|
|
|||
|
Cash interest paid
|
$
|
3,921
|
|
$
|
4,409
|
|
$
|
5,690
|
|
|||
|
Cash income taxes paid, net
|
200
|
|
2,390
|
|
3,080
|
|
||||||
|
(a)
|
Affiliates include trusts that issued guaranteed capital debt securities (“issuer trusts”). The Parent received dividends of
$2 million
,
$5 million
and
$12 million
from the issuer trusts in
2014
,
2013
and
2012
, respectively. For further discussion on these issuer trusts, see Note 21.
|
|
(b)
|
At
December 31, 2014
, long-term debt that contractually matures in 2015 through 2019 totaled
$24.4 billion
,
$25.5 billion
,
$23.0 billion
,
$19.3 billion
and
$11.3 billion
, respectively.
|
|
(c)
|
For information regarding the Firm’s guarantees of its subsidiaries’ obligations, see Note 21 and Note 29.
|
|
306
|
JPMorgan Chase & Co./2014 Annual Report
|
|
Supplementary information
Selected quarterly financial data (unaudited)
|
(Table continued on next page)
|
|||||||||||||||||||||||||
|
As of or for the period ended
|
2014
|
2013
|
|||||||||||||||||||||||
|
(in millions, except per share, ratio, headcount data and where otherwise noted)
|
4th quarter
|
3rd quarter
|
2nd quarter
|
1st quarter
|
4th quarter
|
3rd quarter
|
2nd quarter
|
1st quarter
|
|||||||||||||||||
|
Selected income statement data
|
|||||||||||||||||||||||||
|
Total net revenue
|
$
|
22,512
|
|
$
|
24,246
|
|
$
|
24,454
|
|
$
|
22,993
|
|
$
|
23,156
|
|
$
|
23,117
|
|
$
|
25,211
|
|
$
|
25,122
|
|
|
|
Total noninterest expense
|
15,409
|
|
15,798
|
|
15,431
|
|
14,636
|
|
15,552
|
|
23,626
|
|
15,866
|
|
15,423
|
|
|||||||||
|
Pre-provision profit/(loss)
|
7,103
|
|
8,448
|
|
9,023
|
|
8,357
|
|
7,604
|
|
(509
|
)
|
9,345
|
|
9,699
|
|
|||||||||
|
Provision for credit losses
|
840
|
|
757
|
|
692
|
|
850
|
|
104
|
|
(543
|
)
|
47
|
|
617
|
|
|||||||||
|
Income before income tax expense
|
6,263
|
|
7,691
|
|
8,331
|
|
7,507
|
|
7,500
|
|
34
|
|
9,298
|
|
9,082
|
|
|||||||||
|
Income tax expense
|
1,332
|
|
2,119
|
|
2,346
|
|
2,233
|
|
2,222
|
|
414
|
|
2,802
|
|
2,553
|
|
|||||||||
|
Net income/(loss)
|
$
|
4,931
|
|
$
|
5,572
|
|
$
|
5,985
|
|
$
|
5,274
|
|
$
|
5,278
|
|
$
|
(380
|
)
|
$
|
6,496
|
|
$
|
6,529
|
|
|
|
Per common share data
|
|||||||||||||||||||||||||
|
Net income/(loss): Basic
|
$
|
1.20
|
|
$
|
1.37
|
|
$
|
1.47
|
|
$
|
1.29
|
|
$
|
1.31
|
|
$
|
(0.17
|
)
|
$
|
1.61
|
|
$
|
1.61
|
|
|
|
Diluted
|
1.19
|
|
1.36
|
|
1.46
|
|
1.28
|
|
1.30
|
|
(0.17
|
)
|
1.60
|
|
1.59
|
|
|||||||||
|
Average shares: Basic
|
3,730.9
|
|
3,755.4
|
|
3,780.6
|
|
3,787.2
|
|
3,762.1
|
|
3,767.0
|
|
3,782.4
|
|
3,818.2
|
|
|||||||||
|
Diluted
|
3,765.2
|
|
3,788.7
|
|
3,812.5
|
|
3,823.6
|
|
3,797.1
|
|
3,767.0
|
|
3,814.3
|
|
3,847.0
|
|
|||||||||
|
Market and per common share data
|
|||||||||||||||||||||||||
|
Market capitalization
|
$
|
232,472
|
|
$
|
225,188
|
|
$
|
216,725
|
|
$
|
229,770
|
|
$
|
219,657
|
|
$
|
194,312
|
|
$
|
198,966
|
|
$
|
179,863
|
|
|
|
Common shares at period-end
|
3,714.8
|
|
3,738.2
|
|
3,761.3
|
|
3,784.7
|
|
3,756.1
|
|
3,759.2
|
|
3,769.0
|
|
3,789.8
|
|
|||||||||
|
Share price
(a)
:
|
|||||||||||||||||||||||||
|
High
|
$
|
63.49
|
|
$
|
61.85
|
|
$
|
61.29
|
|
$
|
61.48
|
|
$
|
58.55
|
|
$
|
56.93
|
|
$
|
55.90
|
|
$
|
51.00
|
|
|
|
Low
|
54.26
|
|
54.96
|
|
52.97
|
|
54.20
|
|
50.25
|
|
50.06
|
|
46.05
|
|
44.20
|
|
|||||||||
|
Close
|
62.58
|
|
60.24
|
|
57.62
|
|
60.71
|
|
58.48
|
|
51.69
|
|
52.79
|
|
47.46
|
|
|||||||||
|
Book value per share
|
57.07
|
|
56.50
|
|
55.53
|
|
54.05
|
|
53.25
|
|
52.01
|
|
52.48
|
|
52.02
|
|
|||||||||
|
Tangible book value per share (“TBVPS”)
(b)
|
44.69
|
|
44.13
|
|
43.17
|
|
41.73
|
|
40.81
|
|
39.51
|
|
39.97
|
|
39.54
|
|
|||||||||
|
Cash dividends declared per share
|
0.40
|
|
0.40
|
|
0.40
|
|
0.38
|
|
0.38
|
|
0.38
|
|
0.38
|
|
0.30
|
|
|||||||||
|
Selected ratios and metrics
|
|||||||||||||||||||||||||
|
Return on common equity (“ROE”)
|
9
|
%
|
10
|
%
|
11
|
%
|
10
|
%
|
10
|
%
|
(1
|
)%
|
13
|
%
|
13
|
%
|
|||||||||
|
Return on tangible common equity (“ROTCE”)
(b)
|
11
|
|
13
|
|
14
|
|
13
|
|
14
|
|
(2
|
)
|
17
|
|
17
|
|
|||||||||
|
Return on assets (“ROA”)
|
0.78
|
|
0.90
|
|
0.99
|
|
0.89
|
|
0.87
|
|
(0.06
|
)
|
1.09
|
|
1.14
|
|
|||||||||
|
Overhead ratio
|
68
|
|
65
|
|
63
|
|
64
|
|
67
|
|
102
|
|
63
|
|
61
|
|
|||||||||
|
Loans-to-deposits ratio
|
56
|
|
56
|
|
57
|
|
57
|
|
57
|
|
57
|
|
60
|
|
61
|
|
|||||||||
|
High quality liquid assets (“HQLA”)(in billions)
(c)
|
$
|
600
|
|
$
|
572
|
|
$
|
576
|
|
$
|
538
|
|
$
|
522
|
|
$
|
538
|
|
$
|
454
|
|
$
|
413
|
|
|
|
Common equity tier 1 (“CET1”) capital ratio
(d)
|
10.2
|
%
|
10.2
|
%
|
9.8
|
%
|
10.9
|
%
|
10.7
|
%
|
10.5
|
%
|
10.4
|
%
|
10.2
|
%
|
|||||||||
|
Tier 1 capital ratio
(d)
|
11.6
|
|
11.5
|
|
11.1
|
|
12.1
|
|
11.9
|
|
11.7
|
|
11.6
|
|
11.6
|
|
|||||||||
|
Total capital ratio
(d)
|
13.1
|
|
12.8
|
|
12.5
|
|
14.5
|
|
14.3
|
|
14.3
|
|
14.1
|
|
14.1
|
|
|||||||||
|
Tier 1 leverage ratio
|
7.6
|
|
7.6
|
|
7.6
|
|
7.4
|
|
7.1
|
|
6.9
|
|
7.0
|
|
7.3
|
|
|||||||||
|
Selected balance sheet data (period-end)
|
|||||||||||||||||||||||||
|
Trading assets
|
$
|
398,988
|
|
$
|
410,657
|
|
$
|
392,543
|
|
$
|
375,204
|
|
$
|
374,664
|
|
$
|
383,348
|
|
$
|
401,470
|
|
$
|
430,991
|
|
|
|
Securities
(e)
|
348,004
|
|
366,358
|
|
361,918
|
|
351,850
|
|
354,003
|
|
356,556
|
|
354,725
|
|
365,744
|
|
|||||||||
|
Loans
|
757,336
|
|
743,257
|
|
746,983
|
|
730,971
|
|
738,418
|
|
728,679
|
|
725,586
|
|
728,886
|
|
|||||||||
|
Total assets
|
2,573,126
|
|
2,527,005
|
|
2,520,336
|
|
2,476,986
|
|
2,415,689
|
|
2,463,309
|
|
2,439,494
|
|
2,389,349
|
|
|||||||||
|
Deposits
|
1,363,427
|
|
1,334,534
|
|
1,319,751
|
|
1,282,705
|
|
1,287,765
|
|
1,281,102
|
|
1,202,950
|
|
1,202,507
|
|
|||||||||
|
Long-term debt
(f)
|
276,836
|
|
268,721
|
|
269,929
|
|
274,512
|
|
267,889
|
|
263,372
|
|
266,212
|
|
268,361
|
|
|||||||||
|
Common stockholders’ equity
|
212,002
|
|
211,214
|
|
208,851
|
|
204,572
|
|
200,020
|
|
195,512
|
|
197,781
|
|
197,128
|
|
|||||||||
|
Total stockholders’ equity
|
232,065
|
|
231,277
|
|
227,314
|
|
219,655
|
|
211,178
|
|
206,670
|
|
209,239
|
|
207,086
|
|
|||||||||
|
Headcount
|
241,359
|
|
242,388
|
|
245,192
|
|
246,994
|
|
251,196
|
|
255,041
|
|
254,063
|
|
255,898
|
|
|||||||||
|
JPMorgan Chase & Co./2014 Annual Report
|
307
|
|
Supplementary information
|
(Table continued from previous page)
|
|||||||||||||||||||||||||
|
As of or for the period ended
|
2014
|
2013
|
|||||||||||||||||||||||
|
(in millions, except ratio data)
|
4th quarter
|
3rd quarter
|
2nd quarter
|
1st quarter
|
4th quarter
|
3rd quarter
|
2nd quarter
|
1st quarter
|
|||||||||||||||||
|
Credit quality metrics
|
|||||||||||||||||||||||||
|
Allowance for credit losses
|
$
|
14,807
|
|
$
|
15,526
|
|
$
|
15,974
|
|
$
|
16,485
|
|
$
|
16,969
|
|
$
|
18,248
|
|
$
|
20,137
|
|
$
|
21,496
|
|
|
|
Allowance for loan losses to total retained loans
|
1.90
|
%
|
2.02
|
%
|
2.08
|
%
|
2.20
|
%
|
2.25
|
%
|
2.43
|
%
|
2.69
|
%
|
2.88
|
%
|
|||||||||
|
Allowance for loan losses to retained loans excluding purchased credit-impaired loans
(g)
|
1.55
|
|
1.63
|
|
1.69
|
|
1.75
|
|
1.80
|
|
1.89
|
|
2.06
|
|
2.27
|
|
|||||||||
|
Nonperforming assets
|
$
|
7,967
|
|
$
|
8,390
|
|
$
|
9,017
|
|
$
|
9,473
|
|
$
|
9,706
|
|
$
|
10,380
|
|
$
|
11,041
|
|
$
|
11,739
|
|
|
|
Net charge-offs
|
1,218
|
|
1,114
|
|
1,158
|
|
1,269
|
|
1,328
|
|
1,346
|
|
1,403
|
|
1,725
|
|
|||||||||
|
Net charge-off rate
|
0.65
|
%
|
0.60
|
%
|
0.64
|
%
|
0.71
|
%
|
0.73
|
%
|
0.74
|
%
|
0.78
|
%
|
0.97
|
%
|
|||||||||
|
(a)
|
Share prices shown for JPMorgan Chase’s common stock are from the New York Stock Exchange. JPMorgan Chase’s common stock is also listed and traded on the London Stock Exchange and the Tokyo Stock Exchange.
|
|
(b)
|
TBVPS and ROTCE are non-GAAP financial measures. TBVPS represents the Firm’s tangible common equity divided by common shares at period-end. ROTCE measures the Firm’s annualized earnings as a percentage of tangible common equity. For further discussion of these measures, see Explanation and Reconciliation of the Firm’s Use of Non-GAAP Financial Measures on
pages 77–78
.
|
|
(c)
|
HQLA represents the Firm’s estimate of the amount of assets that qualify for inclusion in the liquidity coverage ratio under the final U.S. rule (“U.S. LCR”) as of December 31, 2014, and under the Basel III liquidity coverage ratio (“Basel III LCR”) for prior periods. For additional information, see HQLA on
page 157
.
|
|
(d)
|
Basel III Transitional rules became effective on January 1, 2014; December 31, 2013 data is based on Basel I rules. As of December 31, 2014, September 30, 2014, and June 30, 2014, the ratios presented are calculated under the Basel III Advanced Transitional Approach. As of March 31, 2014, the ratios presented are calculated under the Basel III Standardized Transitional Approach. CET1 capital under Basel III replaced Tier 1 common capital under Basel I. Prior to Basel III becoming effective on January 1, 2014, Tier 1 common capital under Basel I was a non-GAAP financial measure. See Regulatory capital on
pages 146–153
for additional information on Basel III and non-GAAP financial measures of regulatory capital.
|
|
(e)
|
Included held-to-maturity securities of
$49.3 billion
, $48.8 billion, $47.8 billion, $47.3 billion,
$24.0 billion
and $4.5 billion at December 31, 2014, September 30, 2014, June 30, 2014, March 31, 2014, December 31, 2013 and September 30, 2013, respectively. Held-to-maturity balances for the other periods were not material.
|
|
(f)
|
I
ncluded unsecured long-term debt of $207.5 billion, $204.7 billion, $205.6 billion, $206.1 billion, $199.4 billion, $199.2 billion, $199.1 billion and $206.1 billion, respectively, for the periods presented.
|
|
(g)
|
Excludes the impact of residential real estate PCI loans. For further discussion, see Allowance for credit losses on
pages 128–130
.
|
|
308
|
JPMorgan Chase & Co./2014 Annual Report
|
|
Glossary of Terms
Active foreclosures:
Loans referred to foreclosure where formal foreclosure proceedings are ongoing. Includes both judicial and non-judicial states.
Active online customers:
Users of all internet browsers and mobile platforms who have logged in within the past 90 days.
Active mobile customers:
Users of all mobile platforms, which include: SMS, mobile smartphone and tablet, who have logged in within the past 90 days.
Allowance for loan losses to total loans:
Represents period-end allowance for loan losses divided by retained loans.
Alternative assets
- The following types of assets constitute alternative investments - hedge funds, currency, real estate, private equity and other investment funds designed to focus on nontraditional strategies.
Assets under management:
Represent assets actively managed by AM on behalf of its Private Banking, Institutional and Retail clients. Includes “Committed capital not Called,” on which AM earns fees.
Beneficial interests issued by consolidated VIEs:
Represents the interest of third-party holders of debt, equity securities, or other obligations, issued by VIEs that JPMorgan Chase consolidates.
Benefit obligation:
Refers to the projected benefit obligation for pension plans and the accumulated postretirement benefit obligation for OPEB plans.
Central counterparty (“CCP”):
A CCP is a clearing house that interposes itself between counterparties to contracts traded in one or more financial markets, becoming the buyer to every seller and the seller to every buyer and thereby ensuring the future performance of open contracts. A CCP becomes counterparty to trades with market participants through novation, an open offer system, or another legally binding arrangement.
Chase Liquid
SM
cards:
Refers to a prepaid, reloadable card product.
Client advisors:
Investment product specialists, including private client advisors, financial advisors, financial advisor associates, senior financial advisors, independent financial advisors and financial advisor associate trainees, who advise clients on investment options, including annuities, mutual funds, stock trading services, etc., sold by the Firm or by third-party vendors through retail branches, Chase Private Client locations and other channels.
Client assets:
Represent assets under management as well as custody, brokerage, administration and deposit accounts.
Client deposits and other third party liabilities:
Deposits, as well as deposits that are swept to on-balance sheet liabilities (e.g., commercial paper, federal funds purchased and securities loaned or sold under repurchase agreements) as part of client cash management programs.
Client investment managed accounts:
Assets actively managed by Chase Wealth Management on behalf of clients. The percentage of managed accounts is calculated by dividing managed account assets by total client investment assets.
Credit cycle:
A period of time over which credit quality improves, deteriorates and then improves again (or vice versa). The duration of a credit cycle can vary from a couple of years to several years.
Credit derivatives:
Financial instruments whose value is derived from the credit risk associated with the debt of a third party issuer (the reference entity) which allow one
party (the protection purchaser) to transfer that risk to another party (the protection seller). Upon the occurrence of a credit event by the reference entity, which may include, among other events, the bankruptcy or failure to pay its obligations, or certain restructurings of the debt of the reference entity, neither party has recourse to the reference entity. The protection purchaser has recourse to the protection seller for the difference between the face value of the CDS contract and the fair value at the time of settling the credit derivative contract. The determination as to whether a credit event has occurred is generally made by the relevant International Swaps and Derivatives Association (“ISDA”) Determinations Committee.
CUSIP number:
A CUSIP (i.e., Committee on Uniform Securities Identification Procedures) number consists of nine characters (including letters and numbers) that uniquely identify a company or issuer and the type of security and is assigned by the American Bankers Association and operated by Standard & Poor’s. This system facilitates the clearing and settlement process of securities. A similar system is used to identify non-U.S. securities (CUSIP International Numbering System).
Deposit margin/deposit spread:
Represents net interest income expressed as a percentage of average deposits.
Distributed denial-of-service attack:
The use of a large number of remote computer systems to electronically send a high volume of traffic to a target website to create a service outage at the target. This is a form of cyberattack.
Exchange-traded derivatives:
Derivative contracts that are executed on an exchange and settled via a central clearing house.
FICO score:
A measure of consumer credit risk provided by credit bureaus, typically produced from statistical models by Fair Isaac Corporation utilizing data collected by the credit bureaus.
|
JPMorgan Chase & Co./2014 Annual Report
|
309
|
|
Glossary of Terms
Forward points:
Represents the interest rate differential between two currencies, which is either added to or subtracted from the current exchange rate (i.e., “spot rate”) to determine the forward exchange rate.
Group of Seven (“G7”) nations:
Countries in the G7 are Canada, France, Germany, Italy, Japan, the U.K. and the U.S.
G7 government bonds:
Bonds issued by the government of one of the G7 nations.
Headcount-related expense:
Includes salary and benefits (excluding performance-based incentives), and other noncompensation costs related to employees.
Home equity - senior lien:
Represents loans and commitments where JPMorgan Chase holds the first security interest on the property.
Home equity - junior lien:
Represents loans and commitments where JPMorgan Chase holds a security interest that is subordinate in rank to other liens.
Impaired loan:
Impaired loans are loans measured at amortized cost, for which it is probable that the Firm will be unable to collect all amounts due, including principal and interest, according to the contractual terms of the agreement. Impaired loans include the following:
|
•
|
All wholesale nonaccrual loans
|
|
•
|
All TDRs (both wholesale and consumer), including ones that have returned to accrual status
|
Interchange income:
A fee paid to a credit card issuer in the clearing and settlement of a sales or cash advance transaction.
Investment-grade:
An indication of credit quality based on JPMorgan Chase’s internal risk assessment system. “Investment grade” generally represents a risk profile similar to a rating of a “BBB-”/“Baa3” or better, as defined by independent rating agencies.
LLC:
Limited Liability Company.
Loan-to-value (“LTV”) ratio:
For residential real estate loans, the relationship, expressed as a percentage, between the principal amount of a loan and the appraised value of the collateral (i.e., residential real estate) securing the loan.
Origination date LTV ratio
The LTV ratio at the origination date of the loan. Origination date LTV ratios are calculated based on the actual appraised values of collateral (i.e., loan-level data) at the origination date.
Current estimated LTV ratio
An estimate of the LTV as of a certain date. The current estimated LTV ratios are calculated using estimated collateral values derived from a nationally recognized home
price index measured at the metropolitan statistical area (“MSA”) level. These MSA-level home price indices comprise actual data to the extent available and forecasted data where actual data is not available. As a result, the estimated collateral values used to calculate these ratios do not represent actual appraised loan-level collateral values; as such, the resulting LTV ratios are necessarily imprecise and should therefore be viewed as estimates.
Combined LTV ratio
The LTV ratio considering all available lien positions, as well as unused lines, related to the property. Combined LTV ratios are used for junior lien home equity products.
Managed basis:
A non-GAAP presentation of financial results that includes reclassifications to present revenue on a fully taxable-equivalent basis. Management uses this non- GAAP financial measure at the segment level, because it believes this provides information to enable investors to understand the underlying operational performance and trends of the particular business segment and facilitates a comparison of the business segment with the performance of competitors.
Master netting agreement:
An agreement between two counterparties who have multiple contracts with each other that provides for the net settlement of all contracts, as well as cash collateral, through a single payment, in a single currency, in the event of default on or termination of any one contract.
Mortgage origination channels:
Retail - Borrowers who buy or refinance a home through direct contact with a mortgage banker employed by the Firm using a branch office, the Internet or by phone. Borrowers are frequently referred to a mortgage banker by a banker in a Chase branch, real estate brokers, home builders or other third parties.
Correspondent - Banks, thrifts, other mortgage banks and other financial institutions that sell closed loans to the Firm.
Mortgage product types:
Alt-A
Alt-A loans are generally higher in credit quality than subprime loans but have characteristics that would disqualify the borrower from a traditional prime loan. Alt-A lending characteristics may include one or more of the following: (i) limited documentation; (ii) a high combined loan-to-value (“CLTV”) ratio; (iii) loans secured by non-owner occupied properties; or (iv) a debt-to-income ratio above normal limits. A substantial proportion of the Firm’s Alt-A loans are those where a borrower does not provide complete documentation of his or her assets or the amount or source of his or her income.
|
310
|
JPMorgan Chase & Co./2014 Annual Report
|
|
Glossary of Terms
Option ARMs
The option ARM real estate loan product is an adjustable-rate mortgage loan that provides the borrower with the option each month to make a fully amortizing, interest-only or minimum payment. The minimum payment on an option ARM loan is based on the interest rate charged during the introductory period. This introductory rate is usually significantly below the fully indexed rate. The fully indexed rate is calculated using an index rate plus a margin. Once the introductory period ends, the contractual interest rate charged on the loan increases to the fully indexed rate and adjusts monthly to reflect movements in the index. The minimum payment is typically insufficient to cover interest accrued in the prior month, and any unpaid interest is deferred and added to the principal balance of the loan. Option ARM loans are subject to payment recast, which converts the loan to a variable-rate fully amortizing loan upon meeting specified loan balance and anniversary date triggers.
Prime
Prime mortgage loans are made to borrowers with good credit records and a monthly income at least three to four times greater than their monthly housing expense (mortgage payments plus taxes and other debt payments). These borrowers provide full documentation and generally have reliable payment histories.
Subprime
Subprime loans are loans to customers with one or more high risk characteristics, including but not limited to: (i) unreliable or poor payment histories; (ii) a high LTV ratio of greater than 80% (without borrower-paid mortgage insurance); (iii) a high debt-to-income ratio; (iv) an occupancy type for the loan is other than the borrower’s primary residence; or (v) a history of delinquencies or late payments on the loan.
Multi-asset:
Any fund or account that allocates assets under management to more than one asset class.
N/A:
Data is not applicable or available for the period presented.
Net charge-off/(recovery) rate:
Represents net charge-offs/(recoveries) (annualized) divided by average retained loans for the reporting period.
Net production revenue:
Includes net gains or losses on originations and sales of mortgage loans, other production-related fees and losses related to the repurchase of previously-sold loans.
Net mortgage servicing revenue
includes the following components:
Operating revenue predominantly represents the return on Mortgage Servicing’s MSR asset and includes:
– Actual gross income earned from servicing third-party mortgage loans, such as contractually specified servicing fees and ancillary income; and
– The change in the fair value of the MSR asset due to the collection or realization of expected cash flows.
Risk management represents the components of
Mortgage Servicing’s MSR asset that are subject to ongoing risk management activities, together with derivatives and other instruments used in those risk management activities.
Net yield on interest-earning assets:
The average rate for interest-earning assets less the average rate paid for all sources of funds.
NM:
Not meaningful.
Nonaccrual loans:
Loans for which interest income is not recognized on an accrual basis. Loans (other than credit card loans and certain consumer loans insured by U.S. government agencies) are placed on nonaccrual status when full payment of principal and interest is not expected or when principal and interest has been in default for a period of 90 days or more unless the loan is both well-secured and in the process of collection. Collateral-dependent loans are typically maintained on nonaccrual status.
Nonperforming assets:
Nonperforming assets include nonaccrual loans, nonperforming derivatives and certain assets acquired in loan satisfaction, predominantly real estate owned and other commercial and personal property.
Over-the-counter (“OTC”) derivatives:
Derivative contracts that are negotiated, executed and settled bilaterally between two derivative counterparties, where one or both counterparties is a derivatives dealer.
Over-the-counter cleared (“OTC-cleared”) derivatives:
Derivative contracts that are negotiated and executed bilaterally, but subsequently settled via a central clearing house, such that each derivative counterparty is only exposed to the default of that clearing house.
Overhead ratio:
Noninterest expense as a percentage of total net revenue.
Participating securities:
Represents unvested stock-based compensation awards containing nonforfeitable rights to dividends or dividend equivalents (collectively, “dividends”), which are included in the earnings per share calculation using the two-class method. JPMorgan Chase grants restricted stock and RSUs to certain employees under its
|
JPMorgan Chase & Co./2014 Annual Report
|
311
|
|
Glossary of Terms
stock-based compensation programs, which entitle the recipients to receive nonforfeitable dividends during the vesting period on a basis equivalent to the dividends paid to holders of common stock. These unvested awards meet the definition of participating securities. Under the two-class method, all earnings (distributed and undistributed) are allocated to each class of common stock and participating securities, based on their respective rights to receive dividends.
Personal bankers:
Retail branch office personnel who acquire, retain and expand new and existing customer relationships by assessing customer needs and recommending and selling appropriate banking products and services.
Portfolio activity:
Describes changes to the risk profile of existing lending-related exposures and their impact on the allowance for credit losses from changes in customer profiles and inputs used to estimate the allowances.
Pre-provision profit/(loss):
Represents total net revenue less noninterest expense. The Firm believes that this financial measure is useful in assessing the ability of a lending institution to generate income in excess of its provision for credit losses.
Pretax margin:
Represents income before income tax expense divided by total net revenue, which is, in management’s view, a comprehensive measure of pretax performance derived by measuring earnings after all costs are taken into consideration. It is one basis upon which management evaluates the performance of AM against the performance of their respective competitors.
Principal transactions revenue:
Principal transactions revenue includes realized and unrealized gains and losses recorded on derivatives, other financial instruments, private equity investments, and physical commodities used in market making and client-driven activities. In addition, Principal transactions revenue also includes certain realized and unrealized gains and losses related to hedge accounting and specified risk management activities including: (a) certain derivatives designated in qualifying hedge accounting relationships (primarily fair value hedges of commodity and foreign exchange risk), (b) certain derivatives used for specified risk management purposes, primarily to mitigate credit risk, foreign exchange risk and commodity risk, and (c) other derivatives.
Purchased credit-impaired (“PCI”) loans:
Represents loans that were acquired in the Washington Mutual transaction and deemed to be credit-impaired on the acquisition date in accordance with the guidance of the Financial Accounting Standards Board (“FASB”). The guidance allows purchasers to aggregate credit-impaired loans acquired in the same fiscal quarter into one or more pools, provided that the loans have common risk characteristics (e.g., product type, LTV ratios, FICO scores, past due status, geographic location). A pool is then accounted for as a single asset with
a single composite interest rate and an aggregate expectation of cash flows.
Real assets:
Real assets include investments in productive assets such as agriculture, energy rights, mining and timber properties and exclude raw land to be developed for real estate purposes.
Real estate investment trust (“REIT”):
A special purpose investment vehicle that provides investors with the ability to participate directly in the ownership or financing of real-estate related assets by pooling their capital to purchase and manage income property (i.e., equity REIT) and/or mortgage loans (i.e., mortgage REIT). REITs can be publicly-or privately-held and they also qualify for certain favorable tax considerations.
Receivables from customers:
Primarily represents margin loans to prime and retail brokerage customers which are included in accrued interest and accounts receivable on the Consolidated balance sheets.
Reported basis:
Financial statements prepared under U.S. GAAP, which excludes the impact of taxable-equivalent adjustments.
Retained loans:
Loans that are held-for-investment (i.e. excludes loans held-for-sale and loans at fair value).
Revenue wallet:
Proportion of fee revenues based on estimates of investment banking fees generated across the industry (i.e. the revenue wallet) from investment banking transactions in M&A, equity and debt underwriting, and loan syndications. Source: Dealogic, a third party provider of investment banking competitive analysis and volume-based league tables for the above noted industry products.
Risk-weighted assets (“RWA”):
Risk-weighted assets consist of on- and off-balance sheet assets that are assigned to one of several broad risk categories and weighted by factors representing their risk and potential for default. On-balance sheet assets are risk-weighted based on the perceived credit risk associated with the obligor or counterparty, the nature of any collateral, and the guarantor, if any. Off-balance sheet assets such as lending-related commitments, guarantees, derivatives and other applicable off-balance sheet positions are risk-weighted by multiplying the contractual amount by the appropriate credit conversion factor to determine the on-balance sheet credit equivalent amount, which is then risk-weighted based on the same factors used for on-balance sheet assets. Risk-weighted assets also incorporate a measure for market risk related to applicable trading assets-debt and equity instruments, and foreign exchange and commodity derivatives. The resulting risk-weighted values for each of the risk categories are then aggregated to determine total risk-weighted assets.
Sales specialists:
Retail branch office and field personnel, including relationship managers and loan officers, who specialize in marketing and sales of various business
|
312
|
JPMorgan Chase & Co./2014 Annual Report
|
|
Glossary of Terms
banking products (i.e., business loans, letters of credit, deposit accounts, Chase Paymentech, etc.) and mortgage products to existing and new clients.
Seed capital:
Initial JPMorgan capital invested in products, such as mutual funds, with the intention of ensuring the fund is of sufficient size to represent a viable offering to clients, enabling pricing of its shares, and allowing the manager to develop a track record. After these goals are achieved, the intent is to remove the Firm’s capital from the investment.
Short sale:
A short sale is a sale of real estate in which proceeds from selling the underlying property are less than the amount owed the Firm under the terms of the related mortgage and the related lien is released upon receipt of such proceeds.
Structured notes:
Structured notes are predominantly financial instruments containing embedded derivatives. Where present, the embedded derivative is the primary driver of risk.
Suspended foreclosures:
Loans referred to foreclosure where formal foreclosure proceedings have started but are currently on hold, which could be due to bankruptcy or loss mitigation. Includes both judicial and non-judicial states.
Taxable-equivalent basis:
In presenting managed results, the total net revenue for each of the business segments and the Firm is presented on a tax-equivalent basis. Accordingly, revenue from investments that receive tax credits and tax-exempt securities is presented in the managed results on a basis comparable to taxable investments and securities; the corresponding income tax impact related to tax-exempt items is recorded within income tax expense.
Trade-date and settlement-date:
For financial instruments, the trade-date is the date that an order to purchase, sell or otherwise acquire an instrument is executed in the market. The trade-date may differ from the settlement-date, which is the date on which the actual transfer of a financial instrument between two parties is executed. The amount of time that passes between the trade-date and the settlement-date differs depending on the financial instrument. For repurchases under the common equity repurchase program, except where the trade-date is specified, the amounts disclosed are presented on a settlement-date basis. In the Capital Management section on
pages 146–155
, and where otherwise specified, repurchases under the common equity repurchase program are presented on a trade-date basis because the trade-date is used to calculate the Firm’s regulatory capital.
Troubled debt restructuring (“TDR”):
A TDR is deemed to occur when the Firm modifies the original terms of a loan agreement by granting a concession to a borrower that is experiencing financial difficulty.
Unaudited:
Financial statements and information that have not been subjected to auditing procedures sufficient to permit an independent certified public accountant to express an opinion.
U.S. GAAP:
Accounting principles generally accepted in the U.S.
U.S. government-sponsored enterprise obligations:
Obligations of agencies originally established or chartered by the U.S. government to serve public purposes as specified by the U.S. Congress; these obligations are not explicitly guaranteed as to the timely payment of principal and interest by the full faith and credit of the U.S. government.
U.S. Treasury:
U.S. Department of the Treasury.
Value-at-risk (“VaR”):
A measure of the dollar amount of potential loss from adverse market moves in an ordinary market environment.
Warehouse loans:
Consist of prime mortgages originated with the intent to sell that are accounted for at fair value and classified as trading assets.
Washington Mutual transaction:
On September 25, 2008, JPMorgan Chase acquired certain of the assets of the banking operations of Washington Mutual Bank (“Washington Mutual”) from the FDIC.
|
JPMorgan Chase & Co./2014 Annual Report
|
313
|
|
Distribution of assets, liabilities and stockholders’ equity; interest rates and interest differentials
Consolidated average balance sheet, interest and rates
Provided below is a summary of JPMorgan Chase's consolidated average balances, interest rates and interest differentials on a taxable-equivalent basis for the years
2012
through
2014
. Income computed on a taxable-equivalent basis is the income reported in the Consolidated statements of income, adjusted to present interest income
and average rates earned on assets exempt from income taxes (primarily federal taxes) on a basis comparable with other taxable investments. The incremental tax rate used for calculating the taxable-equivalent adjustment was approximately
38%
in
2014
,
2013
and
2012
. A substantial portion of JPMorgan Chase’s securities are taxable.
|
(Table continued on next page)
|
2014
|
||||||||||
|
Year ended December 31,
(Taxable-equivalent interest and rates; in millions, except rates)
|
Average
balance
|
Interest
(e)
|
Average
rate
|
||||||||
|
Assets
|
|||||||||||
|
Deposits with banks
|
$
|
358,072
|
|
$
|
1,157
|
|
0.32
|
%
|
|||
|
Federal funds sold and securities purchased under resale agreements
|
230,489
|
|
1,642
|
|
0.71
|
|
|||||
|
Securities borrowed
|
116,540
|
|
(501
|
)
|
(f)
|
(0.43
|
)
|
||||
|
Trading assets
|
210,609
|
|
7,386
|
|
3.51
|
|
|||||
|
Taxable securities
|
318,970
|
|
7,617
|
|
2.39
|
|
|||||
|
Non-taxable securities
(a)
|
34,359
|
|
2,158
|
|
6.28
|
|
|||||
|
Total securities
|
353,329
|
|
9,775
|
|
2.77
|
|
(h)
|
||||
|
Loans
|
739,175
|
|
32,394
|
|
(g)
|
4.38
|
|
||||
|
Other assets
(b)
|
40,879
|
|
663
|
|
1.62
|
|
|||||
|
Total interest-earning assets
|
2,049,093
|
|
52,516
|
|
2.56
|
|
|||||
|
Allowance for loan losses
|
(15,418
|
)
|
|||||||||
|
Cash and due from banks
|
25,650
|
|
|||||||||
|
Trading assets – equity instruments
|
116,650
|
|
|||||||||
|
Trading assets – derivative receivables
|
67,123
|
|
|||||||||
|
Goodwill
|
48,029
|
|
|||||||||
|
Mortgage servicing rights
|
8,387
|
|
|||||||||
|
Other intangible assets:
|
|||||||||||
|
Purchased credit card relationships
|
62
|
|
|||||||||
|
Other intangibles
|
1,316
|
|
|||||||||
|
Other assets
|
146,841
|
|
|||||||||
|
Total assets
|
$
|
2,447,733
|
|
||||||||
|
Liabilities
|
|||||||||||
|
Interest-bearing deposits
|
$
|
868,838
|
|
$
|
1,633
|
|
0.19
|
%
|
|||
|
Federal funds purchased and securities loaned or sold under repurchase agreements
|
208,560
|
|
604
|
|
0.29
|
|
|||||
|
Commercial paper
|
59,916
|
|
134
|
|
0.22
|
|
|||||
|
Trading liabilities – debt, short-term and other liabilities
(c)
|
220,137
|
|
712
|
|
0.32
|
|
|||||
|
Beneficial interests issued by consolidated VIEs
|
48,017
|
|
405
|
|
0.84
|
|
|||||
|
Long-term debt
|
270,269
|
|
4,409
|
|
1.63
|
|
|||||
|
Total interest-bearing liabilities
|
1,675,737
|
|
7,897
|
|
0.47
|
|
|||||
|
Noninterest-bearing deposits
|
395,463
|
|
|||||||||
|
Trading liabilities – equity instruments
|
16,246
|
|
|||||||||
|
Trading liabilities – derivative payables
|
54,758
|
|
|||||||||
|
All other liabilities, including the allowance for lending-related commitments
|
81,111
|
|
|||||||||
|
Total liabilities
|
2,223,315
|
|
|||||||||
|
Stockholders’ equity
|
|||||||||||
|
Preferred stock
|
17,018
|
|
|||||||||
|
Common stockholders’ equity
|
207,400
|
|
|||||||||
|
Total stockholders’ equity
|
224,418
|
|
(d)
|
||||||||
|
Total liabilities and stockholders’ equity
|
$
|
2,447,733
|
|
||||||||
|
Interest rate spread
|
2.09
|
%
|
|||||||||
|
Net interest income and net yield on interest-earning assets
|
$
|
44,619
|
|
2.18
|
|
||||||
|
(a)
|
Represents securities which are tax exempt for U.S. Federal Income Tax purposes.
|
|
(b)
|
Includes margin loans.
|
|
(c)
|
Includes brokerage customer payables.
|
|
(d)
|
The ratio of average stockholders’ equity to average assets was
9.2%
for
2014
,
8.7%
for 2013, and
8.5%
for
2012
. The return on average stockholders’ equity, based on net income, was
9.7%
for 2014,
8.6%
for
2013
, and
11.1%
for
2012
.
|
|
(e)
|
Interest includes the effect of related hedging derivatives. Taxable-equivalent amounts are used where applicable.
|
|
(f)
|
Negative interest income and yield for the years ended December 31, 2014, 2013 and 2012, is the result of increased client-driven demand for certain securities combined with the impact of low interest rates; the offset of this stock borrow activity is reflected as lower net interest expense reported within short-term and other liabilities.
|
|
(g)
|
Fees and commissions on loans included in loan interest amounted to
$1.1 billion
in
2014
,
$1.3 billion
in
2013
, and
$1.3 billion
in
2012
.
|
|
(h)
|
The annualized rate for securities based on amortized cost was
2.82%
in
2014
,
2.37%
in
2013
, and
2.35%
in
2012
, and does not give effect to changes in fair value that are reflected in accumulated other comprehensive income/(loss).
|
|
(i)
|
Prior period amounts and have been reclassified to conform with the current period presentation.
|
|
314
|
||
Within the Consolidated average balance sheets, interest and rates summary, the principal amounts of nonaccrual loans have been included in the average loan balances used to determine the average interest rate earned on loans. For additional information on nonaccrual loans, including interest accrued, see Note 14.
|
(Table continued from previous page)
|
|||||||||||||||||||||||
|
2013
|
2012
|
||||||||||||||||||||||
|
Average
balance
|
Interest
(e)
|
Average
rate
|
Average
balance
|
Interest
(e)
|
Average
rate
|
||||||||||||||||||
|
$
|
268,968
|
|
$
|
918
|
|
0.34
|
%
|
$
|
118,463
|
|
$
|
555
|
|
0.47
|
%
|
||||||||
|
231,567
|
|
1,940
|
|
0.84
|
|
239,703
|
|
2,442
|
|
1.02
|
|
||||||||||||
|
118,300
|
|
(127
|
)
|
(f)
|
(0.11
|
)
|
131,446
|
|
(3
|
)
|
(f)
|
—
|
|
||||||||||
|
227,769
|
|
8,191
|
|
(i)
|
3.60
|
|
(i)
|
234,224
|
|
9,175
|
|
(i)
|
3.92
|
|
(i)
|
||||||||
|
333,285
|
|
6,916
|
|
2.07
|
|
345,238
|
|
7,231
|
|
2.09
|
|
||||||||||||
|
23,558
|
|
1,369
|
|
5.81
|
|
17,992
|
|
1,091
|
|
6.06
|
|
||||||||||||
|
356,843
|
|
8,285
|
|
2.32
|
|
(h)
|
363,230
|
|
8,322
|
|
2.29
|
|
(h)
|
||||||||||
|
726,450
|
|
33,621
|
|
(g)
|
4.63
|
|
722,384
|
|
35,946
|
|
(g)
|
4.98
|
|
||||||||||
|
40,334
|
|
538
|
|
1.33
|
|
32,967
|
|
259
|
|
0.79
|
|
||||||||||||
|
1,970,231
|
|
53,366
|
|
(i)
|
2.71
|
|
(i)
|
1,842,417
|
|
56,696
|
|
(i)
|
3.08
|
|
(i)
|
||||||||
|
(19,819
|
)
|
(24,906
|
)
|
||||||||||||||||||||
|
35,919
|
|
51,410
|
|
||||||||||||||||||||
|
112,680
|
|
115,113
|
|
||||||||||||||||||||
|
72,629
|
|
85,744
|
|
||||||||||||||||||||
|
48,102
|
|
48,176
|
|
||||||||||||||||||||
|
8,840
|
|
7,133
|
|
||||||||||||||||||||
|
214
|
|
470
|
|
||||||||||||||||||||
|
1,736
|
|
2,363
|
|
||||||||||||||||||||
|
149,572
|
|
144,061
|
|
||||||||||||||||||||
|
$
|
2,380,104
|
|
$
|
2,271,981
|
|
||||||||||||||||||
|
$
|
822,781
|
|
$
|
2,067
|
|
0.25
|
%
|
$
|
751,098
|
|
$
|
2,655
|
|
0.35
|
%
|
||||||||
|
238,551
|
|
582
|
|
0.24
|
|
248,561
|
|
535
|
|
0.22
|
|
||||||||||||
|
53,717
|
|
112
|
|
0.21
|
|
50,780
|
|
91
|
|
0.18
|
|
||||||||||||
|
202,894
|
|
1,104
|
|
(i)
|
0.54
|
|
(i)
|
193,459
|
|
1,052
|
|
(i)
|
0.54
|
|
(i)
|
||||||||
|
54,832
|
|
478
|
|
0.87
|
|
60,234
|
|
648
|
|
1.08
|
|
||||||||||||
|
264,083
|
|
5,007
|
|
1.90
|
|
245,662
|
|
6,062
|
|
2.47
|
|
||||||||||||
|
1,636,858
|
|
9,350
|
|
(i)
|
0.57
|
|
(i)
|
1,549,794
|
|
11,043
|
|
(i)
|
0.71
|
|
(i)
|
||||||||
|
366,361
|
|
354,785
|
|
||||||||||||||||||||
|
14,218
|
|
14,172
|
|
||||||||||||||||||||
|
64,553
|
|
76,162
|
|
||||||||||||||||||||
|
90,745
|
|
84,480
|
|
||||||||||||||||||||
|
2,172,735
|
|
2,079,393
|
|
||||||||||||||||||||
|
10,960
|
|
8,236
|
|
||||||||||||||||||||
|
196,409
|
|
184,352
|
|
||||||||||||||||||||
|
207,369
|
|
(d)
|
192,588
|
|
(d)
|
||||||||||||||||||
|
$
|
2,380,104
|
|
$
|
2,271,981
|
|
||||||||||||||||||
|
2.14
|
%
|
2.37
|
%
|
||||||||||||||||||||
|
$
|
44,016
|
|
2.23
|
|
$
|
45,653
|
|
2.48
|
|
||||||||||||||
|
315
|
||
Interest rates and interest differential analysis of net interest income – U.S. and non-U.S.
Presented below is a summary of interest rates and interest differentials segregated between U.S. and non-U.S. operations for the years
2012
through
2014
. The segregation of U.S. and non-U.S. components is based on
the location of the office recording the transaction. Intracompany funding generally comprises dollar-denominated deposits originated in various locations that are centrally managed by JPMorgan Chase’s Treasury unit.
|
(Table continued on next page)
|
||||||||||
|
2014
|
||||||||||
|
Year ended December 31,
(Taxable-equivalent interest and rates; in millions, except rates)
|
Average balance
|
Interest
|
Average rate
|
|||||||
|
Interest-earning assets
|
||||||||||
|
Deposits with banks:
|
||||||||||
|
U.S.
|
$
|
328,145
|
|
$
|
825
|
|
0.25
|
%
|
||
|
Non-U.S.
|
29,927
|
|
332
|
|
1.11
|
|
||||
|
Federal funds sold and securities purchased under resale agreements:
|
||||||||||
|
U.S.
|
125,812
|
|
719
|
|
0.57
|
|
||||
|
Non-U.S.
|
104,677
|
|
923
|
|
0.88
|
|
||||
|
Securities borrowed:
|
||||||||||
|
U.S.
|
77,228
|
|
(573
|
)
|
(b)
|
(0.74
|
)
|
|||
|
Non-U.S.
|
39,312
|
|
72
|
|
0.18
|
|
||||
|
Trading assets – debt instruments:
|
||||||||||
|
U.S.
|
109,678
|
|
4,045
|
|
3.69
|
|
||||
|
Non-U.S.
|
100,931
|
|
3,341
|
|
3.31
|
|
||||
|
Securities:
|
||||||||||
|
U.S.
|
193,856
|
|
6,586
|
|
3.40
|
|
||||
|
Non-U.S.
|
159,473
|
|
3,189
|
|
2.00
|
|
||||
|
Loans:
|
||||||||||
|
U.S.
|
635,846
|
|
30,165
|
|
4.74
|
|
||||
|
Non-U.S.
|
103,329
|
|
2,229
|
|
2.16
|
|
||||
|
Other assets, predominantly U.S.
|
40,879
|
|
663
|
|
1.62
|
|
||||
|
Total interest-earning assets
|
2,049,093
|
|
52,516
|
|
2.56
|
|
||||
|
Interest-bearing liabilities
|
||||||||||
|
Interest-bearing deposits:
|
||||||||||
|
U.S.
|
620,708
|
|
813
|
|
0.13
|
|
||||
|
Non-U.S.
|
248,130
|
|
820
|
|
0.33
|
|
||||
|
Federal funds purchased and securities loaned or sold under repurchase agreements:
|
||||||||||
|
U.S.
|
146,025
|
|
130
|
|
(c)
|
0.09
|
|
(c)
|
||
|
Non-U.S.
|
62,535
|
|
474
|
|
0.76
|
|
||||
|
Trading liabilities - debt, short-term and other liabilities:
|
||||||||||
|
U.S.
|
194,771
|
|
(284
|
)
|
(b)
|
(0.15
|
)
|
|||
|
Non-U.S.
|
85,282
|
|
1,130
|
|
1.33
|
|
||||
|
Beneficial interests issued by consolidated VIEs, predominantly U.S.
|
48,017
|
|
405
|
|
0.84
|
|
||||
|
Long-term debt:
|
||||||||||
|
U.S.
|
257,181
|
|
4,366
|
|
1.70
|
|
||||
|
Non-U.S.
|
13,088
|
|
43
|
|
0.33
|
|
||||
|
Intracompany funding:
|
||||||||||
|
U.S.
|
(122,467
|
)
|
(176
|
)
|
—
|
|
||||
|
Non-U.S.
|
122,467
|
|
176
|
|
—
|
|
||||
|
Total interest-bearing liabilities
|
1,675,737
|
|
7,897
|
|
0.47
|
|
||||
|
Noninterest-bearing liabilities
(a)
|
373,356
|
|
||||||||
|
Total investable funds
|
$
|
2,049,093
|
|
$
|
7,897
|
|
0.39
|
%
|
||
|
Net interest income and net yield:
|
$
|
44,619
|
|
2.18
|
%
|
|||||
|
U.S.
|
37,018
|
|
2.46
|
|
||||||
|
Non-U.S.
|
7,601
|
|
1.39
|
|
||||||
|
Percentage of total assets and liabilities attributable to non-U.S. operations:
|
||||||||||
|
Assets
|
28.9
|
|
||||||||
|
Liabilities
|
22.6
|
|
||||||||
|
(a)
|
Represents the amount of noninterest-bearing liabilities funding interest-earning assets.
|
|
(b)
|
Negative interest income and yield, for the years ended December 31, 2014, 2013 and 2012 is a result of increased client-driven demand for certain securities combined with the impact of low interest rates; the offset of this stock borrow activity is reflected as lower net interest expense reported within trading liabilities - debt, short-term and other liabilities.
|
|
(c)
|
Reflects a benefit from the favorable market environments for dollar-roll financings.
|
|
(d)
|
Prior period amounts have been reclassified to conform with the current period presentation.
|
|
316
|
||
U.S. net interest income was
$37.0 billion
in
2014
, a increase of
$1.5 billion
from the prior year. Net interest income from non-U.S. operations was
$7.6 billion
for
2014
, a decrease of
$902 million
from
$8.5 billion
in
2013
.
For further information, see the “Net interest income” discussion in Consolidated Results of Operations on
pages 68–71
.
|
(Table continued from previous page)
|
||||||||||||||||||||
|
2013
|
2012
|
|||||||||||||||||||
|
Average balance
|
Interest
|
Average rate
|
Average balance
|
Interest
|
Average rate
|
|||||||||||||||
|
$
|
233,850
|
|
$
|
572
|
|
0.24
|
%
|
$
|
79,992
|
|
$
|
168
|
|
0.21
|
%
|
|||||
|
35,118
|
|
346
|
|
0.99
|
|
38,471
|
|
387
|
|
1.01
|
|
|||||||||
|
129,600
|
|
793
|
|
0.61
|
|
137,874
|
|
872
|
|
0.63
|
|
|||||||||
|
101,967
|
|
1,147
|
|
1.13
|
|
101,829
|
|
1,570
|
|
1.54
|
|
|||||||||
|
69,377
|
|
(376
|
)
|
(b)
|
(0.54
|
)
|
70,084
|
|
(407
|
)
|
(b)
|
(0.58
|
)
|
|||||||
|
48,923
|
|
249
|
|
0.51
|
|
61,362
|
|
404
|
|
0.66
|
|
|||||||||
|
|
|
|||||||||||||||||||
|
120,985
|
|
4,301
|
|
(d)
|
3.56
|
|
(d)
|
119,854
|
|
4,562
|
|
(d)
|
3.81
|
|
(d)
|
|||||
|
106,784
|
|
3,890
|
|
(d)
|
3.64
|
|
(d)
|
114,370
|
|
4,613
|
|
(d)
|
4.03
|
|
(d)
|
|||||
|
170,473
|
|
4,795
|
|
2.81
|
|
161,727
|
|
3,991
|
|
2.47
|
|
|||||||||
|
186,370
|
|
3,490
|
|
1.87
|
|
201,503
|
|
4,331
|
|
2.15
|
|
|||||||||
|
617,043
|
|
31,235
|
|
5.06
|
|
620,615
|
|
33,167
|
|
5.34
|
|
|||||||||
|
109,407
|
|
2,386
|
|
2.18
|
|
101,769
|
|
2,779
|
|
2.73
|
|
|||||||||
|
40,334
|
|
538
|
|
1.33
|
|
32,967
|
|
259
|
|
0.79
|
|
|||||||||
|
1,970,231
|
|
53,366
|
|
(d)
|
2.71
|
|
(d)
|
1,842,417
|
|
56,696
|
|
(d)
|
3.08
|
|
(d)
|
|||||
|
|
|
|||||||||||||||||||
|
|
|
|||||||||||||||||||
|
582,282
|
|
1,067
|
|
0.18
|
|
512,589
|
|
1,345
|
|
0.26
|
|
|||||||||
|
240,499
|
|
1,000
|
|
0.42
|
|
238,509
|
|
1,310
|
|
0.55
|
|
|||||||||
|
161,256
|
|
103
|
|
(c)
|
0.06
|
|
(c)
|
181,460
|
|
4
|
|
(c)
|
—
|
|
(c)
|
|||||
|
77,295
|
|
479
|
|
0.62
|
|
67,101
|
|
531
|
|
0.79
|
|
|||||||||
|
|
|
|||||||||||||||||||
|
176,870
|
|
5
|
|
(b)(d)
|
—
|
|
(d)
|
176,755
|
|
(150
|
)
|
(b)(d)
|
(0.08
|
)
|
(d)
|
|||||
|
79,741
|
|
1,211
|
|
(d)
|
1.52
|
|
(d)
|
67,484
|
|
1,293
|
|
(d)
|
1.92
|
|
(d)
|
|||||
|
54,832
|
|
478
|
|
0.87
|
|
60,234
|
|
648
|
|
1.08
|
|
|||||||||
|
250,957
|
|
4,949
|
|
1.97
|
|
230,101
|
|
5,998
|
|
2.61
|
|
|||||||||
|
13,126
|
|
58
|
|
0.45
|
|
15,561
|
|
64
|
|
0.41
|
|
|||||||||
|
|
|
|||||||||||||||||||
|
(181,109
|
)
|
(339
|
)
|
—
|
|
(253,906
|
)
|
(551
|
)
|
—
|
|
|||||||||
|
181,109
|
|
339
|
|
—
|
|
253,906
|
|
551
|
|
—
|
|
|||||||||
|
1,636,858
|
|
9,350
|
|
(d)
|
0.57
|
|
(d)
|
1,549,794
|
|
11,043
|
|
(d)
|
0.71
|
|
(d)
|
|||||
|
333,373
|
|
|
|
292,623
|
|
|
|
|||||||||||||
|
$
|
1,970,231
|
|
$
|
9,350
|
|
(d)
|
0.47
|
%
|
(d)
|
$
|
1,842,417
|
|
$
|
11,043
|
|
(d)
|
0.60
|
%
|
(d)
|
|
|
44,016
|
|
2.23
|
%
|
45,653
|
|
2.48
|
%
|
|||||||||||||
|
35,492
|
|
2.59
|
|
35,353
|
|
2.91
|
|
|||||||||||||
|
8,524
|
|
1.42
|
|
10,300
|
|
1.65
|
|
|||||||||||||
|
32.6
|
|
36.2
|
|
|||||||||||||||||
|
23.5
|
|
23.4
|
|
|||||||||||||||||
|
317
|
||
Changes in net interest income, volume and rate analysis
The table below presents an analysis of the effect on net interest income of volume and rate changes for the periods
2014
versus
2013
and
2013
versus
2012
. In this analysis, when the change cannot be isolated to either volume or rate, it has been allocated to volume.
|
2014 versus 2013
|
2013 versus 2012
|
|||||||||||||||||||||||
|
Increase/(decrease) due to change in:
|
Increase/(decrease) due to change in:
|
|||||||||||||||||||||||
|
Year ended December 31,
(On a taxable-equivalent basis: in millions)
|
Volume
|
Rate
|
Net
change
|
Volume
|
Rate
|
Net
change
|
||||||||||||||||||
|
Interest-earning assets
|
||||||||||||||||||||||||
|
Deposits with banks:
|
||||||||||||||||||||||||
|
U.S.
|
$
|
230
|
|
$
|
23
|
|
$
|
253
|
|
$
|
380
|
|
$
|
24
|
|
$
|
404
|
|
||||||
|
Non-U.S.
|
(56
|
)
|
42
|
|
(14
|
)
|
(33
|
)
|
(8
|
)
|
(41
|
)
|
||||||||||||
|
Federal funds sold and securities purchased under resale agreements:
|
|
|
|
|||||||||||||||||||||
|
U.S.
|
(22
|
)
|
(52
|
)
|
(74
|
)
|
(51
|
)
|
(28
|
)
|
(79
|
)
|
||||||||||||
|
Non-U.S.
|
31
|
|
(255
|
)
|
(224
|
)
|
(6
|
)
|
(417
|
)
|
(423
|
)
|
||||||||||||
|
Securities borrowed:
|
|
|
|
|||||||||||||||||||||
|
U.S.
|
(58
|
)
|
(139
|
)
|
(197
|
)
|
3
|
|
28
|
|
31
|
|
||||||||||||
|
Non-U.S.
|
(16
|
)
|
(161
|
)
|
(177
|
)
|
(63
|
)
|
(92
|
)
|
(155
|
)
|
||||||||||||
|
Trading assets – debt instruments:
|
|
|
|
|||||||||||||||||||||
|
U.S.
|
(413
|
)
|
157
|
|
(256
|
)
|
34
|
|
(a)
|
(295
|
)
|
(a)
|
(261
|
)
|
(a)
|
|||||||||
|
Non-U.S.
|
(197
|
)
|
(352
|
)
|
(549
|
)
|
(273
|
)
|
(a)
|
(450
|
)
|
(a)
|
(723
|
)
|
(a)
|
|||||||||
|
Securities:
|
|
|
|
|||||||||||||||||||||
|
U.S.
|
785
|
|
1,006
|
|
1,791
|
|
254
|
|
550
|
|
804
|
|
||||||||||||
|
Non-U.S.
|
(543
|
)
|
242
|
|
(301
|
)
|
(277
|
)
|
(564
|
)
|
(841
|
)
|
||||||||||||
|
Loans:
|
|
|
|
|||||||||||||||||||||
|
U.S.
|
905
|
|
(1,975
|
)
|
(1,070
|
)
|
(194
|
)
|
(1,738
|
)
|
(1,932
|
)
|
||||||||||||
|
Non-U.S.
|
(135
|
)
|
(22
|
)
|
(157
|
)
|
167
|
|
(560
|
)
|
(393
|
)
|
||||||||||||
|
Other assets, predominantly U.S.
|
8
|
|
117
|
|
125
|
|
101
|
|
178
|
|
279
|
|
||||||||||||
|
Change in interest income
|
519
|
|
(1,369
|
)
|
(850
|
)
|
42
|
|
(a)
|
(3,372
|
)
|
(a)
|
(3,330
|
)
|
(a)
|
|||||||||
|
Interest-bearing liabilities
|
||||||||||||||||||||||||
|
Interest-bearing deposits:
|
||||||||||||||||||||||||
|
U.S.
|
37
|
|
(291
|
)
|
(254
|
)
|
132
|
|
(410
|
)
|
(278
|
)
|
||||||||||||
|
Non-U.S.
|
36
|
|
(216
|
)
|
(180
|
)
|
—
|
|
(310
|
)
|
(310
|
)
|
||||||||||||
|
Federal funds purchased and securities loaned or sold under repurchase agreements:
|
|
|
|
|||||||||||||||||||||
|
U.S.
|
(21
|
)
|
48
|
|
27
|
|
(10
|
)
|
109
|
|
99
|
|
||||||||||||
|
Non-U.S.
|
(113
|
)
|
108
|
|
(5
|
)
|
62
|
|
(114
|
)
|
(52
|
)
|
||||||||||||
|
Trading liabilities - debt, short-term and other liabilities
|
|
|
|
|||||||||||||||||||||
|
U.S.
|
(27
|
)
|
(262
|
)
|
(289
|
)
|
(5
|
)
|
(a)
|
160
|
|
(a)
|
155
|
|
(a)
|
|||||||||
|
Non-U.S.
|
71
|
|
(152
|
)
|
(81
|
)
|
185
|
|
(a)
|
(267
|
)
|
(a)
|
(82
|
)
|
(a)
|
|||||||||
|
Beneficial interests issued by consolidated VIEs, predominantly U.S.
|
(57
|
)
|
(16
|
)
|
(73
|
)
|
(44
|
)
|
(126
|
)
|
(170
|
)
|
||||||||||||
|
Long-term debt:
|
|
|
|
|
|
|
||||||||||||||||||
|
U.S.
|
95
|
|
(678
|
)
|
(583
|
)
|
424
|
|
(1,473
|
)
|
(1,049
|
)
|
||||||||||||
|
Non-U.S.
|
1
|
|
(16
|
)
|
(15
|
)
|
(12
|
)
|
6
|
|
(6
|
)
|
||||||||||||
|
Intercompany funding:
|
|
|
|
|||||||||||||||||||||
|
U.S.
|
72
|
|
91
|
|
163
|
|
136
|
|
76
|
|
212
|
|
||||||||||||
|
Non-U.S.
|
(72
|
)
|
(91
|
)
|
(163
|
)
|
(136
|
)
|
(76
|
)
|
(212
|
)
|
||||||||||||
|
Change in interest expense
|
22
|
|
(1,475
|
)
|
(1,453
|
)
|
732
|
|
(a)
|
(2,425
|
)
|
(a)
|
(1,693
|
)
|
(a)
|
|||||||||
|
Change in net interest income
|
$
|
497
|
|
$
|
106
|
|
$
|
603
|
|
$
|
(690
|
)
|
(a)
|
$
|
(947
|
)
|
(a)
|
$
|
(1,637
|
)
|
||||
(a) Prior period amounts have been reclassified to conform with the current period presentation.
|
318
|
||
Securities portfolio
For information regarding the securities portfolio as of
December 31, 2014
and
2013
, and for the years ended
December 31, 2014
and
2013
, see Note 12. For the available–for–sale securities portfolio, at
December 31, 2012
, the fair value and amortized cost of U.S. Treasury and government agency obligations was
$110.5 billion
and
$105.7 billion
, respectively; the fair value and amortized cost of all other available–for–sale securities was
$260.6 billion
and
$254.2 billion
, respectively; and the total fair value and amortized cost of the total available–for–sale securities portfolio was
$371.1 billion
and
$359.9 billion
respectively.
At
December 31, 2012
, the fair value and amortized cost of U.S. Treasury and government agency obligations in the held-to-maturity securities portfolio was
$8 million
and
$7 million
, respectively. There were no other held-to-maturity securities at
December 31, 2012
.
|
319
|
||
Loan portfolio
The table below presents loans by portfolio segment and loan class that are presented in Credit Risk Management on
page 112
,
pages 113–119
and
page 120
, and in Note 14, at the periods indicated.
|
December 31, (in millions)
|
2014
|
2013
|
2012
|
2011
|
2010
|
||||||||||
|
U.S. consumer, excluding credit card loans
|
|||||||||||||||
|
Home equity
|
$
|
69,837
|
|
$
|
76,790
|
|
$
|
88,356
|
|
$
|
100,497
|
|
$
|
112,844
|
|
|
Mortgage
|
139,973
|
|
129,008
|
|
123,277
|
|
128,709
|
|
134,284
|
|
|||||
|
Auto
|
54,536
|
|
52,757
|
|
49,913
|
|
47,426
|
|
48,367
|
|
|||||
|
Other
|
31,028
|
|
30,508
|
|
31,074
|
|
31,795
|
|
32,123
|
|
|||||
|
Total U.S. consumer, excluding credit card loans
|
295,374
|
|
289,063
|
|
292,620
|
|
308,427
|
|
327,618
|
|
|||||
|
Credit card Loans
|
|||||||||||||||
|
U.S. credit card loans
|
129,067
|
|
125,308
|
|
125,277
|
|
129,587
|
|
134,781
|
|
|||||
|
Non-U.S. credit card loans
|
1,981
|
|
2,483
|
|
2,716
|
|
2,690
|
|
2,895
|
|
|||||
|
Total credit card loans
|
131,048
|
|
127,791
|
|
127,993
|
|
132,277
|
|
137,676
|
|
|||||
|
Total consumer loans
|
426,422
|
|
416,854
|
|
420,613
|
|
440,704
|
|
465,294
|
|
|||||
|
U.S. wholesale loans
|
|||||||||||||||
|
Commercial and industrial
|
78,664
|
|
79,436
|
|
77,900
|
|
65,958
|
|
50,912
|
|
|||||
|
Real estate
|
77,022
|
|
67,815
|
|
59,369
|
|
53,230
|
|
51,734
|
|
|||||
|
Financial institutions
|
13,735
|
|
11,087
|
|
10,708
|
|
8,489
|
|
12,120
|
|
|||||
|
Government agencies
|
7,574
|
|
8,316
|
|
7,962
|
|
7,236
|
|
6,408
|
|
|||||
|
Other
|
49,846
|
|
48,158
|
|
50,948
|
|
52,126
|
|
38,298
|
|
|||||
|
Total U.S. wholesale loans
|
226,841
|
|
214,812
|
|
206,887
|
|
187,039
|
|
159,472
|
|
|||||
|
Non-U.S. wholesale loans
|
|||||||||||||||
|
Commercial and industrial
|
34,782
|
|
36,447
|
|
36,674
|
|
31,108
|
|
19,053
|
|
|||||
|
Real estate
|
2,224
|
|
1,621
|
|
1,757
|
|
1,748
|
|
1,973
|
|
|||||
|
Financial institutions
|
21,099
|
|
22,813
|
|
26,564
|
|
30,262
|
|
20,043
|
|
|||||
|
Government agencies
|
1,122
|
|
2,146
|
|
1,586
|
|
583
|
|
870
|
|
|||||
|
Other
|
44,846
|
|
43,725
|
|
39,715
|
|
32,276
|
|
26,222
|
|
|||||
|
Total non-U.S. wholesale loans
|
104,073
|
|
106,752
|
|
106,296
|
|
95,977
|
|
68,161
|
|
|||||
|
Total wholesale loans
|
|||||||||||||||
|
Commercial and industrial
|
113,446
|
|
115,883
|
|
114,574
|
|
97,066
|
|
69,965
|
|
|||||
|
Real estate
|
79,246
|
|
69,436
|
|
61,126
|
|
54,978
|
|
53,707
|
|
|||||
|
Financial institutions
|
34,834
|
|
33,900
|
|
37,272
|
|
38,751
|
|
32,163
|
|
|||||
|
Government agencies
|
8,696
|
|
10,462
|
|
9,548
|
|
7,819
|
|
7,278
|
|
|||||
|
Other
|
94,692
|
|
91,883
|
|
90,663
|
|
84,402
|
|
64,520
|
|
|||||
|
Total wholesale loans
|
330,914
|
|
321,564
|
|
313,183
|
|
283,016
|
|
227,633
|
|
|||||
|
Total loans
(a)
|
$
|
757,336
|
|
$
|
738,418
|
|
$
|
733,796
|
|
$
|
723,720
|
|
$
|
692,927
|
|
|
Memo:
|
|||||||||||||||
|
Loans held-for-sale
|
$
|
7,217
|
|
$
|
12,230
|
|
$
|
4,406
|
|
$
|
2,626
|
|
$
|
5,453
|
|
|
Loans at fair value
|
2,611
|
|
2,011
|
|
2,555
|
|
2,097
|
|
1,976
|
|
|||||
|
Total loans held-for-sale and loans at fair value
|
$
|
9,828
|
|
$
|
14,241
|
|
$
|
6,961
|
|
$
|
4,723
|
|
$
|
7,429
|
|
|
(a)
|
Loans (other than purchased credit-impaired loans and those for which the fair value option have been elected) are presented net of unearned income, unamortized discounts and premiums, and net deferred loan costs of
$1.3 billion
,
$1.9 billion
,
$2.5 billion
,
$2.7 billion
and
$1.9 billion
at
December 31, 2014
,
2013
,
2012
,
2011
and
2010
, respectively.
|
|
320
|
||
Maturities and sensitivity to changes in interest rates
The table below sets forth, at
December 31, 2014
, wholesale loan maturity and distribution between fixed and floating interest rates based on the stated terms of the loan agreements. The table below also presents loans by loan class that are presented in Wholesale credit portfolio on
pages 120–127
and Note 14. The table does not include the impact of derivative instruments.
|
December 31, 2014 (in millions)
|
Within
1 year
(a)
|
1-5
years
|
After 5
years
|
Total
|
||||||||
|
U.S.
|
||||||||||||
|
Commercial and industrial
|
$
|
13,106
|
|
$
|
52,053
|
|
$
|
13,505
|
|
$
|
78,664
|
|
|
Real estate
|
5,238
|
|
18,523
|
|
53,261
|
|
77,022
|
|
||||
|
Financial institutions
|
7,015
|
|
6,229
|
|
491
|
|
13,735
|
|
||||
|
Government agencies
|
970
|
|
2,411
|
|
4,193
|
|
7,574
|
|
||||
|
Other
|
20,897
|
|
27,272
|
|
1,677
|
|
49,846
|
|
||||
|
Total U.S.
|
47,226
|
|
106,488
|
|
73,127
|
|
226,841
|
|
||||
|
Non-U.S.
|
||||||||||||
|
Commercial and industrial
|
12,329
|
|
16,644
|
|
5,809
|
|
34,782
|
|
||||
|
Real estate
|
781
|
|
1,324
|
|
119
|
|
2,224
|
|
||||
|
Financial institutions
|
16,805
|
|
3,947
|
|
347
|
|
21,099
|
|
||||
|
Government agencies
|
29
|
|
320
|
|
773
|
|
1,122
|
|
||||
|
Other
|
35,571
|
|
8,707
|
|
568
|
|
44,846
|
|
||||
|
Total non-U.S.
|
65,515
|
|
30,942
|
|
7,616
|
|
104,073
|
|
||||
|
Total wholesale loans
|
$
|
112,741
|
|
$
|
137,430
|
|
$
|
80,743
|
|
$
|
330,914
|
|
|
Loans at fixed interest rates
|
$
|
10,387
|
|
$
|
54,847
|
|
||||||
|
Loans at variable interest rates
|
127,043
|
|
25,896
|
|
||||||||
|
Total wholesale loans
|
$
|
137,430
|
|
$
|
80,743
|
|
||||||
|
(a)
|
Includes demand loans and overdrafts.
|
Risk elements
The following tables set forth nonperforming assets, contractually past-due assets, and accruing restructured loans by portfolio segment and loan class that are presented in Credit Risk Management on
page 112
,
pages 113–114
and
page 120
, at the periods indicated.
|
December 31, (in millions)
|
2014
|
2013
|
2012
|
2011
|
2010
|
||||||||||
|
Nonperforming assets
|
|||||||||||||||
|
U.S. nonaccrual loans:
|
|||||||||||||||
|
Consumer, excluding credit card loans
|
$
|
6,509
|
|
$
|
7,496
|
|
$
|
9,174
|
|
$
|
7,411
|
|
$
|
8,833
|
|
|
Credit card loans
|
—
|
|
—
|
|
1
|
|
1
|
|
2
|
|
|||||
|
Total U.S. nonaccrual consumer loans
|
6,509
|
|
7,496
|
|
9,175
|
|
7,412
|
|
8,835
|
|
|||||
|
Wholesale:
|
|||||||||||||||
|
Commercial and industrial
|
184
|
|
317
|
|
702
|
|
936
|
|
1,745
|
|
|||||
|
Real estate
|
237
|
|
338
|
|
520
|
|
886
|
|
2,390
|
|
|||||
|
Financial institutions
|
12
|
|
19
|
|
60
|
|
76
|
|
111
|
|
|||||
|
Government agencies
|
—
|
|
1
|
|
—
|
|
—
|
|
—
|
|
|||||
|
Other
|
59
|
|
97
|
|
153
|
|
234
|
|
267
|
|
|||||
|
Total U.S. wholesale nonaccrual loans
|
492
|
|
772
|
|
1,435
|
|
2,132
|
|
4,513
|
|
|||||
|
Total U.S. nonaccrual loans
|
7,001
|
|
8,268
|
|
10,610
|
|
9,544
|
|
13,348
|
|
|||||
|
Non-U.S. nonaccrual loans:
|
|||||||||||||||
|
Consumer, excluding credit card loans
|
—
|
|
—
|
|
—
|
|
—
|
|
—
|
|
|||||
|
Credit card loans
|
—
|
|
—
|
|
—
|
|
—
|
|
—
|
|
|||||
|
Total non-U.S. nonaccrual consumer loans
|
—
|
|
—
|
|
—
|
|
—
|
|
—
|
|
|||||
|
Wholesale:
|
|||||||||||||||
|
Commercial and industrial
|
21
|
|
116
|
|
131
|
|
79
|
|
234
|
|
|||||
|
Real estate
|
23
|
|
88
|
|
89
|
|
—
|
|
585
|
|
|||||
|
Financial institutions
|
7
|
|
8
|
|
—
|
|
—
|
|
30
|
|
|||||
|
Government agencies
|
—
|
|
—
|
|
5
|
|
16
|
|
22
|
|
|||||
|
Other
|
81
|
|
60
|
|
57
|
|
354
|
|
622
|
|
|||||
|
Total non-U.S. wholesale nonaccrual loans
|
132
|
|
272
|
|
282
|
|
449
|
|
1,493
|
|
|||||
|
Total non-U.S. nonaccrual loans
|
132
|
|
272
|
|
282
|
|
449
|
|
1,493
|
|
|||||
|
Total nonaccrual loans
|
7,133
|
|
8,540
|
|
10,892
|
|
9,993
|
|
14,841
|
|
|||||
|
Derivative receivables
|
275
|
|
415
|
|
239
|
|
297
|
|
159
|
|
|||||
|
Assets acquired in loan satisfactions
|
559
|
|
751
|
|
775
|
|
1,025
|
|
1,682
|
|
|||||
|
Nonperforming assets
|
$
|
7,967
|
|
$
|
9,706
|
|
$
|
11,906
|
|
$
|
11,315
|
|
$
|
16,682
|
|
|
Memo:
|
|||||||||||||||
|
Loans held-for-sale
|
$
|
95
|
|
$
|
26
|
|
$
|
18
|
|
$
|
110
|
|
$
|
341
|
|
|
Loans at fair value
(a)
|
21
|
|
197
|
|
265
|
|
73
|
|
155
|
|
|||||
|
Total loans held-for-sale and loans at fair value
|
$
|
116
|
|
$
|
223
|
|
$
|
283
|
|
$
|
183
|
|
$
|
496
|
|
|
(a)
|
In 2013 certain loans that resulted from restructurings that were previously classified as performing were reclassified as nonperforming loans. Prior periods were revised to conform with the current presentation.
|
|
321
|
||
|
December 31, (in millions)
|
2014
|
2013
|
2012
|
2011
|
2010
|
||||||||||
|
Contractually past-due loans
(a)
|
|||||||||||||||
|
U.S. loans:
|
|||||||||||||||
|
Consumer, excluding credit card loans
|
$
|
367
|
|
$
|
428
|
|
$
|
525
|
|
$
|
551
|
|
$
|
625
|
|
|
Credit card loans
|
893
|
|
997
|
|
1,268
|
|
1,867
|
|
3,015
|
|
|||||
|
Total U.S. consumer loans
|
1,260
|
|
1,425
|
|
1,793
|
|
2,418
|
|
3,640
|
|
|||||
|
Wholesale:
|
|||||||||||||||
|
Commercial and industrial
|
14
|
|
14
|
|
19
|
|
—
|
|
7
|
|
|||||
|
Real estate
|
33
|
|
14
|
|
69
|
|
84
|
|
109
|
|
|||||
|
Financial institutions
|
—
|
|
—
|
|
6
|
|
2
|
|
2
|
|
|||||
|
Government agencies
|
—
|
|
—
|
|
—
|
|
—
|
|
—
|
|
|||||
|
Other
|
26
|
|
16
|
|
30
|
|
6
|
|
171
|
|
|||||
|
Total U.S. wholesale loans
|
73
|
|
44
|
|
124
|
|
92
|
|
289
|
|
|||||
|
Total U.S. loans
|
1,333
|
|
1,469
|
|
1,917
|
|
2,510
|
|
3,929
|
|
|||||
|
Non-U.S. loans:
|
|||||||||||||||
|
Consumer, excluding credit card loans
|
—
|
|
—
|
|
—
|
|
—
|
|
—
|
|
|||||
|
Credit card loans
|
2
|
|
25
|
|
34
|
|
36
|
|
38
|
|
|||||
|
Total non-U.S. consumer loans
|
2
|
|
25
|
|
34
|
|
36
|
|
38
|
|
|||||
|
Wholesale:
|
|
|
|
|
|
||||||||||
|
Commercial and industrial
|
—
|
|
—
|
|
—
|
|
—
|
|
—
|
|
|||||
|
Real estate
|
—
|
|
—
|
|
—
|
|
—
|
|
—
|
|
|||||
|
Financial institutions
|
—
|
|
6
|
|
—
|
|
—
|
|
—
|
|
|||||
|
Government agencies
|
—
|
|
—
|
|
—
|
|
—
|
|
—
|
|
|||||
|
Other
|
3
|
|
—
|
|
14
|
|
8
|
|
70
|
|
|||||
|
Total non-U.S. wholesale loans
|
3
|
|
6
|
|
14
|
|
8
|
|
70
|
|
|||||
|
Total non-U.S. loans
|
5
|
|
31
|
|
48
|
|
44
|
|
108
|
|
|||||
|
Total contractually past due loans
|
$
|
1,338
|
|
$
|
1,500
|
|
$
|
1,965
|
|
$
|
2,554
|
|
$
|
4,037
|
|
|
(a)
|
Represents accruing loans past-due 90 days or more as to principal and interest, which are not characterized as nonaccrual loans.
|
|
December 31, (in millions)
|
2014
|
2013
|
2012
|
2011
|
2010
|
||||||||||
|
Accruing restructured loans
(a)
|
|||||||||||||||
|
U.S.:
|
|||||||||||||||
|
Consumer, excluding credit card loans
|
$
|
7,814
|
|
$
|
9,173
|
|
$
|
9,033
|
|
$
|
7,310
|
|
$
|
4,256
|
|
|
Credit card loans
(b)
|
2,029
|
|
3,115
|
|
4,762
|
|
7,214
|
|
10,005
|
|
|||||
|
Total U.S. consumer loans
|
9,843
|
|
12,288
|
|
13,795
|
|
14,524
|
|
14,261
|
|
|||||
|
Wholesale:
|
|||||||||||||||
|
Commercial and industrial
|
10
|
|
—
|
|
29
|
|
68
|
|
—
|
|
|||||
|
Real estate
|
31
|
|
27
|
|
7
|
|
48
|
|
76
|
|
|||||
|
Financial institutions
|
—
|
|
—
|
|
—
|
|
2
|
|
—
|
|
|||||
|
Other
|
1
|
|
3
|
|
—
|
|
6
|
|
—
|
|
|||||
|
Total U.S. wholesale loans
|
42
|
|
30
|
|
36
|
|
124
|
|
76
|
|
|||||
|
Total U.S.
|
9,885
|
|
12,318
|
|
13,831
|
|
14,648
|
|
14,337
|
|
|||||
|
Non-U.S.:
|
|||||||||||||||
|
Consumer, excluding credit card loans
|
—
|
|
—
|
|
—
|
|
—
|
|
—
|
|
|||||
|
Credit card loans
(b)
|
—
|
|
—
|
|
—
|
|
—
|
|
—
|
|
|||||
|
Total non-U.S. consumer loans
|
—
|
|
—
|
|
—
|
|
—
|
|
—
|
|
|||||
|
Wholesale:
|
|||||||||||||||
|
Commercial and industrial
|
—
|
|
—
|
|
24
|
|
48
|
|
49
|
|
|||||
|
Real estate
|
—
|
|
—
|
|
—
|
|
—
|
|
—
|
|
|||||
|
Other
|
—
|
|
—
|
|
—
|
|
—
|
|
—
|
|
|||||
|
Total non-U.S. wholesale loans
|
—
|
|
—
|
|
24
|
|
48
|
|
49
|
|
|||||
|
Total non-U.S.
|
—
|
|
—
|
|
24
|
|
48
|
|
49
|
|
|||||
|
Total accruing restructured notes
|
$
|
9,885
|
|
$
|
12,318
|
|
$
|
13,855
|
|
$
|
14,696
|
|
$
|
14,386
|
|
|
(a)
|
Represents performing loans modified in troubled debt restructurings in which an economic concession was granted by the Firm and the borrower has demonstrated its ability to repay the loans according to the terms of the restructuring. As defined in U.S. GAAP, concessions include the reduction of interest rates or the deferral of interest or principal payments, resulting from deterioration in the borrowers’ financial condition. Excludes nonaccrual assets and contractually past-due assets, which are included in the sections above.
|
|
(b)
|
Includes credit card loans that have been modified in a troubled debt restructuring.
|
For a discussion of nonaccrual loans, past-due loan accounting policies, and accruing restructured loans see Credit Risk Management on
pages 110–111
, and Note 14.
|
322
|
||
Impact of nonaccrual loans and accruing restructured loans on interest income
The negative impact on interest income from nonaccrual loans represents the difference between the amount of interest income that would have been recorded on such nonaccrual loans according to their original contractual terms had they been performing and the amount of interest that actually was recognized on a cash basis. The negative impact on interest income from accruing restructured loans represents the difference between the amount of interest income that would have been recorded on such loans according to their original contractual terms and the amount of interest that actually was recognized under the modified terms. The following table sets forth this data for the years specified. The change in foregone interest income from
2012
through
2014
was primarily driven by the change in the levels of nonaccrual loans.
|
Year ended December 31, (in millions)
|
2014
|
2013
|
2012
|
||||||
|
Nonaccrual loans
|
|||||||||
|
U.S.:
|
|||||||||
|
Consumer, excluding credit card:
|
|||||||||
|
Gross amount of interest that would have been recorded at the original terms
|
$
|
563
|
|
$
|
719
|
|
$
|
804
|
|
|
Interest that was recognized in income
|
(268
|
)
|
(298
|
)
|
(302
|
)
|
|||
|
Total U.S. consumer, excluding credit card
|
295
|
|
421
|
|
502
|
|
|||
|
Credit card:
|
|||||||||
|
Gross amount of interest that would have been recorded at the original terms
|
—
|
|
—
|
|
—
|
|
|||
|
Interest that was recognized in income
|
—
|
|
—
|
|
—
|
|
|||
|
Total U.S. credit card
|
—
|
|
—
|
|
—
|
|
|||
|
Total U.S. consumer
|
295
|
|
421
|
|
502
|
|
|||
|
Wholesale:
|
|||||||||
|
Gross amount of interest that would have been recorded at the original terms
|
28
|
|
29
|
|
54
|
|
|||
|
Interest that was recognized in income
|
(9
|
)
|
(9
|
)
|
(4
|
)
|
|||
|
Total U.S. wholesale
|
19
|
|
20
|
|
50
|
|
|||
|
Negative impact - U.S.
|
314
|
|
441
|
|
552
|
|
|||
|
Non-U.S.:
|
|||||||||
|
Consumer, excluding credit card:
|
|||||||||
|
Gross amount of interest that would have been recorded at the original terms
|
—
|
|
—
|
|
—
|
|
|||
|
Interest that was recognized in income
|
—
|
|
—
|
|
—
|
|
|||
|
Total non-U.S. consumer, excluding credit card
|
—
|
|
—
|
|
—
|
|
|||
|
Credit card:
|
|||||||||
|
Gross amount of interest that would have been recorded at the original terms
|
—
|
|
—
|
|
—
|
|
|||
|
Interest that was recognized in income
|
—
|
|
—
|
|
—
|
|
|||
|
Total non-U.S. credit card
|
—
|
|
—
|
|
—
|
|
|||
|
Total non-U.S. consumer
|
—
|
|
—
|
|
—
|
|
|||
|
Wholesale:
(a)
|
|||||||||
|
Gross amount of interest that would have been recorded at the original terms
|
7
|
|
36
|
|
14
|
|
|||
|
Interest that was recognized in income
|
—
|
|
—
|
|
—
|
|
|||
|
Total non-U.S. wholesale
|
7
|
|
36
|
|
14
|
|
|||
|
Negative impact — non-U.S.
|
7
|
|
36
|
|
14
|
|
|||
|
Total negative impact on interest income
|
$
|
321
|
|
$
|
477
|
|
$
|
566
|
|
|
(a)
|
During 2013, certain loans that resulted from restructurings that were previously classified as performing were reclassified as nonperforming loans. The gross amount of interest that would have been recorded at the original terms has been adjusted accordingly. Prior periods were revised to conform with the current presentation.
|
|
323
|
||
|
Year ended December 31, (in millions)
|
2014
|
2013
|
2012
|
||||||
|
Accruing restructured loans
|
|||||||||
|
U.S.:
|
|||||||||
|
Consumer, excluding credit card:
|
|||||||||
|
Gross amount of interest that would have been recorded at the original terms
|
$
|
629
|
|
$
|
758
|
|
$
|
729
|
|
|
Interest that was recognized in income
|
(339
|
)
|
(395
|
)
|
(417
|
)
|
|||
|
Total U.S. consumer, excluding credit card
|
290
|
|
363
|
|
312
|
|
|||
|
Credit card:
|
|||||||||
|
Gross amount of interest that would have been recorded at the original terms
|
377
|
|
602
|
|
805
|
|
|||
|
Interest that was recognized in income
|
(123
|
)
|
(198
|
)
|
(308
|
)
|
|||
|
Total U.S. credit card
|
254
|
|
404
|
|
497
|
|
|||
|
Total U.S. consumer
|
544
|
|
767
|
|
809
|
|
|||
|
Wholesale:
(a)
|
|||||||||
|
Gross amount of interest that would have been recorded at the original terms
|
—
|
|
1
|
|
1
|
|
|||
|
Interest that was recognized in income
|
—
|
|
(1
|
)
|
(2
|
)
|
|||
|
Total U.S. wholesale
|
—
|
|
—
|
|
(1
|
)
|
|||
|
Negative impact — U.S.
|
544
|
|
767
|
|
808
|
|
|||
|
Non-U.S.:
|
|||||||||
|
Consumer, excluding credit card:
|
|||||||||
|
Gross amount of interest that would have been recorded at the original terms
|
—
|
|
—
|
|
—
|
|
|||
|
Interest that was recognized in income
|
—
|
|
—
|
|
—
|
|
|||
|
Total non-U.S. consumer, excluding credit card
|
—
|
|
—
|
|
—
|
|
|||
|
Credit card:
|
|||||||||
|
Gross amount of interest that would have been recorded at the original terms
|
—
|
|
—
|
|
—
|
|
|||
|
Interest that was recognized in income
|
—
|
|
—
|
|
—
|
|
|||
|
Total non-U.S. credit card
|
—
|
|
—
|
|
—
|
|
|||
|
Total non-U.S. consumer
|
—
|
|
—
|
|
—
|
|
|||
|
Wholesale:
(a)
|
|||||||||
|
Gross amount of interest that would have been recorded at the original terms
|
—
|
|
—
|
|
1
|
|
|||
|
Interest that was recognized in income
|
—
|
|
—
|
|
(1
|
)
|
|||
|
Total non-U.S. wholesale
|
—
|
|
—
|
|
—
|
|
|||
|
Negative impact — non-U.S.
|
—
|
|
—
|
|
—
|
|
|||
|
Total negative impact on interest income
|
$
|
544
|
|
$
|
767
|
|
$
|
808
|
|
|
(a)
|
Predominantly real estate-related.
|
|
324
|
||
Cross-border outstandings
Cross-border disclosure is based on the Federal Financial Institutions Examination Council’s (“FFIEC”) guidelines governing the determination of cross-border risk.
The reporting of country exposure under the FFIEC bank regulatory requirements provides information on the distribution, by country and sector, of claims on, and liabilities to, foreign residents held by U.S. banks and bank holding companies and is used by the regulatory agencies to determine the presence of credit and related risks,
including transfer and country risk. Country location under the FFIEC bank regulatory reporting is based on where the entity or counterparty is legally established.
JPMorgan Chase
’s total cross-border exposure tends to fluctuate greatly, and the amount of exposure at year-end tends to be a function of timing rather than representing a consistent trend. For a further discussion of
JPMorgan Chase
’s country risk exposure, see Country Risk Management on
pages 137–138
.
The following table lists all countries in which
JPMorgan Chase
’s cross-border outstandings exceed 0.75% of consolidated assets as of the dates specified.
|
Cross-border outstandings exceeding 0.75% of total assets
(a)(b)
|
||||||||||||||||||||||
|
(in millions)
|
December 31,
|
Governments
|
Banks
|
Other
(c)
|
Net local
country
assets
|
Total cross-border outstandings
(d)
|
Commitments
(e)
|
Total exposure
|
||||||||||||||
|
Cayman Islands
|
2014
|
$
|
2
|
|
$
|
199
|
|
$
|
67,810
|
|
$
|
115
|
|
$
|
68,126
|
|
$
|
25,886
|
|
$
|
94,012
|
|
|
2013
|
9
|
|
232
|
|
70,006
|
|
—
|
|
70,247
|
|
21,928
|
|
92,175
|
|
||||||||
|
2012
|
234
|
|
35
|
|
68,588
|
|
—
|
|
68,857
|
|
2,645
|
|
71,502
|
|
||||||||
|
France
|
2014
|
$
|
13,544
|
|
$
|
8,670
|
|
$
|
23,254
|
|
$
|
2,222
|
|
$
|
47,690
|
|
$
|
188,703
|
|
$
|
236,393
|
|
|
2013
|
10,512
|
|
12,448
|
|
38,415
|
|
2,486
|
|
63,861
|
|
235,173
|
|
299,034
|
|
||||||||
|
2012
|
10,706
|
|
18,979
|
|
26,796
|
|
1,714
|
|
58,195
|
|
91,632
|
|
149,827
|
|
||||||||
|
Japan
|
2014
|
$
|
522
|
|
$
|
11,211
|
|
$
|
3,922
|
|
$
|
24,257
|
|
$
|
39,912
|
|
$
|
67,480
|
|
$
|
107,392
|
|
|
2013
|
957
|
|
16,286
|
|
12,972
|
|
30,811
|
|
61,026
|
|
60,310
|
|
121,336
|
|
||||||||
|
2012
|
2,016
|
|
30,616
|
|
7,708
|
|
23,680
|
|
64,020
|
|
57,023
|
|
121,043
|
|
||||||||
|
Germany
|
2014
|
$
|
22,772
|
|
$
|
4,524
|
|
$
|
8,522
|
|
$
|
—
|
|
$
|
35,818
|
|
$
|
173,121
|
|
$
|
208,939
|
|
|
2013
|
25,514
|
|
4,078
|
|
7,057
|
|
—
|
|
36,649
|
|
214,375
|
|
251,024
|
|
||||||||
|
2012
|
11,376
|
|
21,944
|
|
11,674
|
|
321
|
|
45,315
|
|
92,597
|
|
137,912
|
|
||||||||
|
Netherlands
|
2014
|
$
|
1,551
|
|
$
|
3,157
|
|
$
|
24,792
|
|
$
|
—
|
|
$
|
29,500
|
|
$
|
86,039
|
|
$
|
115,539
|
|
|
2013
|
1,024
|
|
4,349
|
|
32,765
|
|
—
|
|
38,138
|
|
97,797
|
|
135,935
|
|
||||||||
|
2012
|
48
|
|
5,947
|
|
36,625
|
|
—
|
|
42,620
|
|
41,481
|
|
84,101
|
|
||||||||
|
Italy
|
2014
|
$
|
14,297
|
|
$
|
5,293
|
|
$
|
5,221
|
|
$
|
550
|
|
$
|
25,361
|
|
$
|
128,269
|
|
$
|
153,630
|
|
|
2013
|
10,302
|
|
4,440
|
|
5,643
|
|
1,524
|
|
21,909
|
|
135,711
|
|
157,620
|
|
||||||||
|
2012
|
9,939
|
|
3,703
|
|
2,786
|
|
1,254
|
|
17,682
|
|
73,190
|
|
90,872
|
|
||||||||
|
Brazil
|
2014
|
$
|
2,650
|
|
$
|
2,874
|
|
$
|
5,258
|
|
$
|
7,804
|
|
$
|
18,586
|
|
$
|
10,644
|
|
$
|
29,230
|
|
|
2013
|
2,332
|
|
3,521
|
|
4,899
|
|
4,384
|
|
15,136
|
|
10,148
|
|
25,284
|
|
||||||||
|
2012
|
4,951
|
|
4,373
|
|
6,456
|
|
9,463
|
|
25,243
|
|
8,841
|
|
34,084
|
|
||||||||
|
Ireland
|
2014
|
$
|
131
|
|
$
|
4,007
|
|
$
|
13,613
|
|
$
|
—
|
|
$
|
17,751
|
|
$
|
12,734
|
|
$
|
30,485
|
|
|
2013
|
99
|
|
4,175
|
|
13,878
|
|
—
|
|
18,152
|
|
11,709
|
|
29,861
|
|
||||||||
|
2012
|
97
|
|
2,818
|
|
12,598
|
|
—
|
|
15,513
|
|
8,912
|
|
24,425
|
|
||||||||
|
Spain
|
2014
|
$
|
1,887
|
|
$
|
6,290
|
|
$
|
4,458
|
|
$
|
79
|
|
$
|
12,714
|
|
$
|
71,501
|
|
$
|
84,215
|
|
|
2013
|
2,549
|
|
9,332
|
|
9,543
|
|
217
|
|
21,641
|
|
80,137
|
|
101,778
|
|
||||||||
|
2012
|
1,204
|
|
8,458
|
|
6,643
|
|
129
|
|
16,434
|
|
46,299
|
|
62,733
|
|
||||||||
|
Switzerland
|
2014
|
$
|
28
|
|
$
|
1,417
|
|
$
|
3,291
|
|
$
|
660
|
|
$
|
5,396
|
|
$
|
71,900
|
|
$
|
77,296
|
|
|
2013
|
73
|
|
1,419
|
|
4,657
|
|
11,587
|
|
17,736
|
|
88,530
|
|
106,266
|
|
||||||||
|
2012
|
103
|
|
4,196
|
|
3,638
|
|
13,874
|
|
21,811
|
|
32,408
|
|
54,219
|
|
||||||||
|
(a)
|
Prior periods were revised to conform with the current presentation.
|
|
(b)
|
Excluded from the table is
$915.5 billion
at December 31, 2012, substantially all of which represent notional amounts related to credit protection sold on indices representing baskets of exposures from multiple European countries, which had previously been reported within the U.K. Effective with the fourth quarter of
2013
, these exposures are reported within individual countries as required by revised regulatory guidance.
|
|
(c)
|
Consists primarily of commercial and industrial.
|
|
(d)
|
Outstandings includes loans and accrued interest receivable, interest-bearing deposits with banks, acceptances, resale agreements, other monetary assets, cross-border trading debt and equity instruments, fair value of foreign exchange and derivative contracts, and local country assets, net of local country liabilities. The amounts associated with foreign exchange and derivative contracts are presented after taking into account the impact of legally enforceable master netting agreements.
|
|
(e)
|
Commitments include outstanding letters of credit, undrawn commitments to extend credit, and the gross notional value of credit derivatives where
JPMorgan Chase
is a protection seller.
|
|
325
|
||
Summary of loan and lending-related commitments loss experience
The tables below summarize the changes in the allowance for loan losses and the allowance for lending-related commitments during the periods indicated. For a further discussion, see Allowance for credit losses on
pages 128–130
, and Note 15.
|
Allowance for loan losses
|
|||||||||||||||
|
Year ended December 31, (in millions)
|
2014
|
2013
|
2012
|
2011
|
2010
|
||||||||||
|
Balance at beginning of year
|
$
|
16,264
|
|
$
|
21,936
|
|
$
|
27,609
|
|
$
|
32,266
|
|
$
|
31,602
|
|
|
U.S. charge-offs
|
|||||||||||||||
|
U.S. consumer, excluding credit card
|
2,132
|
|
2,754
|
|
4,805
|
|
5,419
|
|
8,383
|
|
|||||
|
U.S. credit card
|
3,682
|
|
4,358
|
|
5,624
|
|
8,017
|
|
15,247
|
|
|||||
|
Total U.S. consumer charge-offs
|
5,814
|
|
7,112
|
|
10,429
|
|
13,436
|
|
23,630
|
|
|||||
|
U.S. wholesale:
|
|||||||||||||||
|
Commercial and industrial
|
44
|
|
150
|
|
131
|
|
197
|
|
467
|
|
|||||
|
Real estate
|
14
|
|
51
|
|
114
|
|
221
|
|
698
|
|
|||||
|
Financial institutions
|
14
|
|
1
|
|
8
|
|
102
|
|
146
|
|
|||||
|
Government agencies
|
25
|
|
1
|
|
—
|
|
—
|
|
3
|
|
|||||
|
Other
|
22
|
|
9
|
|
56
|
|
149
|
|
102
|
|
|||||
|
Total U.S. wholesale charge-offs
|
119
|
|
212
|
|
309
|
|
669
|
|
1,416
|
|
|||||
|
Total U.S. charge-offs
|
5,933
|
|
7,324
|
|
10,738
|
|
14,105
|
|
25,046
|
|
|||||
|
Non-U.S. charge-offs
|
|||||||||||||||
|
Non-U.S. consumer, excluding credit card
|
—
|
|
—
|
|
—
|
|
—
|
|
—
|
|
|||||
|
Non-U.S. credit card
|
149
|
|
114
|
|
131
|
|
151
|
|
163
|
|
|||||
|
Total non-U.S. consumer charge-offs
|
149
|
|
114
|
|
131
|
|
151
|
|
163
|
|
|||||
|
Non-U.S. wholesale:
|
|||||||||||||||
|
Commercial and industrial
|
27
|
|
5
|
|
8
|
|
1
|
|
23
|
|
|||||
|
Real estate
|
4
|
|
11
|
|
6
|
|
142
|
|
239
|
|
|||||
|
Financial institutions
|
—
|
|
—
|
|
—
|
|
6
|
|
—
|
|
|||||
|
Government agencies
|
—
|
|
—
|
|
4
|
|
—
|
|
—
|
|
|||||
|
Other
|
1
|
|
13
|
|
19
|
|
98
|
|
311
|
|
|||||
|
Total non-U.S. wholesale charge-offs
|
32
|
|
29
|
|
37
|
|
247
|
|
573
|
|
|||||
|
Total non-U.S. charge-offs
|
181
|
|
143
|
|
168
|
|
398
|
|
736
|
|
|||||
|
Total charge-offs
|
6,114
|
|
7,467
|
|
10,906
|
|
14,503
|
|
25,782
|
|
|||||
|
U.S. recoveries
|
|||||||||||||||
|
U.S. consumer, excluding credit card
|
(814
|
)
|
(847
|
)
|
(508
|
)
|
(547
|
)
|
(474
|
)
|
|||||
|
U.S. credit card
|
(383
|
)
|
(568
|
)
|
(782
|
)
|
(1,211
|
)
|
(1,345
|
)
|
|||||
|
Total U.S. consumer recoveries
|
(1,197
|
)
|
(1,415
|
)
|
(1,290
|
)
|
(1,758
|
)
|
(1,819
|
)
|
|||||
|
U.S. wholesale:
|
|||||||||||||||
|
Commercial and industrial
|
(49
|
)
|
(27
|
)
|
(335
|
)
|
(60
|
)
|
(86
|
)
|
|||||
|
Real estate
|
(27
|
)
|
(56
|
)
|
(64
|
)
|
(93
|
)
|
(75
|
)
|
|||||
|
Financial institutions
|
(12
|
)
|
(90
|
)
|
(37
|
)
|
(207
|
)
|
(74
|
)
|
|||||
|
Government agencies
|
—
|
|
—
|
|
(2
|
)
|
—
|
|
(1
|
)
|
|||||
|
Other
|
(36
|
)
|
(6
|
)
|
(21
|
)
|
(36
|
)
|
(25
|
)
|
|||||
|
Total U.S. Wholesale recoveries
|
(124
|
)
|
(179
|
)
|
(459
|
)
|
(396
|
)
|
(261
|
)
|
|||||
|
Total U.S. recoveries
|
(1,321
|
)
|
(1,594
|
)
|
(1,749
|
)
|
(2,154
|
)
|
(2,080
|
)
|
|||||
|
Non-U.S. recoveries
|
|||||||||||||||
|
Non-U.S. consumer, excluding credit card
|
—
|
|
—
|
|
—
|
|
—
|
|
—
|
|
|||||
|
Non-U.S. credit card
|
(19
|
)
|
(25
|
)
|
(29
|
)
|
(32
|
)
|
(28
|
)
|
|||||
|
Total non-U.S. consumer recoveries
|
(19
|
)
|
(25
|
)
|
(29
|
)
|
(32
|
)
|
(28
|
)
|
|||||
|
Non-U.S. wholesale:
|
|||||||||||||||
|
Commercial and industrial
|
—
|
|
(29
|
)
|
(16
|
)
|
(14
|
)
|
(1
|
)
|
|||||
|
Real estate
|
—
|
|
—
|
|
(2
|
)
|
(14
|
)
|
—
|
|
|||||
|
Financial institutions
|
(14
|
)
|
(10
|
)
|
(7
|
)
|
(38
|
)
|
—
|
|
|||||
|
Government agencies
|
—
|
|
—
|
|
—
|
|
—
|
|
—
|
|
|||||
|
Other
|
(1
|
)
|
(7
|
)
|
(40
|
)
|
(14
|
)
|
—
|
|
|||||
|
Total non-U.S. wholesale recoveries
|
(15
|
)
|
(46
|
)
|
(65
|
)
|
(80
|
)
|
(1
|
)
|
|||||
|
Total non-U.S. recoveries
|
(34
|
)
|
(71
|
)
|
(94
|
)
|
(112
|
)
|
(29
|
)
|
|||||
|
Total recoveries
|
(1,355
|
)
|
(1,665
|
)
|
(1,843
|
)
|
(2,266
|
)
|
(2,109
|
)
|
|||||
|
Net charge-offs
|
4,759
|
|
5,802
|
|
9,063
|
|
12,237
|
|
23,673
|
|
|||||
|
Write-offs of PCI loans
(a)
|
533
|
|
53
|
|
—
|
|
—
|
|
—
|
|
|||||
|
Provision for loan losses
|
3,224
|
|
188
|
|
3,387
|
|
7,612
|
|
16,822
|
|
|||||
|
Change in accounting principles
(b)
|
—
|
|
—
|
|
—
|
|
—
|
|
7,494
|
|
|||||
|
Other
|
(11
|
)
|
(5
|
)
|
3
|
|
(32
|
)
|
21
|
|
|||||
|
Balance at year-end
|
$
|
14,185
|
|
$
|
16,264
|
|
$
|
21,936
|
|
$
|
27,609
|
|
$
|
32,266
|
|
|
(a)
|
Write-offs of PCI loans are recorded against the allowance for loan losses when actual losses for a pool exceed estimated losses that were recorded as purchase accounting adjustments at the time of acquisition. A write-off of a PCI loan is recognized when the underlying loan is removed from a pool (e.g., upon liquidation). During the fourth quarter of 2014, the Firm recorded a $291 million adjustment to reduce the PCI allowance and the recorded investment in the Firm’s PCI loan portfolio, primarily reflecting the cumulative effect of interest forgiveness modifications. This adjustment had no impact to the Firm’s Consolidated statements of income.
|
|
(b)
|
Effective January 1, 2010, the Firm adopted accounting guidance related to variable interest entities (“VIEs”). Upon adoption of the guidance, the Firm consolidated its Firm-sponsored credit card securitization trusts, its Firm-administered multi-seller conduits and certain other consumer loan securitization entities, primarily mortgage-related. As a result,
$7.4 billion
,
$14 million
and
$127 million
, respectively, of allowance for loan losses were recorded on-balance sheet with the consolidation of these entities.
|
|
326
|
||
Allowance for lending-related commitments
|
Year ended December 31, (in millions)
|
2014
|
2013
|
2012
|
2011
|
2010
|
||||||||||
|
Balance at beginning of year
|
$
|
705
|
|
$
|
668
|
|
$
|
673
|
|
$
|
717
|
|
$
|
939
|
|
|
Provision for lending-related commitments
|
(85
|
)
|
37
|
|
(2
|
)
|
(38
|
)
|
(183
|
)
|
|||||
|
Net charge-offs
|
—
|
|
—
|
|
—
|
|
—
|
|
—
|
|
|||||
|
Change in accounting principles
(a)
|
—
|
|
—
|
|
—
|
|
—
|
|
(18
|
)
|
|||||
|
Other
|
2
|
|
—
|
|
(3
|
)
|
(6
|
)
|
(21
|
)
|
|||||
|
Balance at year-end
|
$
|
622
|
|
$
|
705
|
|
$
|
668
|
|
$
|
673
|
|
$
|
717
|
|
|
(a)
|
Relates to the adoption of the new accounting guidance related to VIEs.
|
|
Loan loss analysis
|
|||||||||||||||
|
As of or for the year ended December 31,
(in millions, except ratios)
|
2014
|
2013
|
2012
|
2011
|
2010
|
||||||||||
|
Balances
|
|||||||||||||||
|
Loans – average
|
$
|
739,175
|
|
$
|
726,450
|
|
$
|
722,384
|
|
$
|
693,523
|
|
$
|
703,540
|
|
|
Loans – year-end
|
757,336
|
|
738,418
|
|
733,796
|
|
723,720
|
|
692,927
|
|
|||||
|
Net charge-offs
(a)
|
4,759
|
|
5,802
|
|
9,063
|
|
12,237
|
|
23,673
|
|
|||||
|
Allowance for loan losses:
|
|||||||||||||||
|
U.S.
|
$
|
13,472
|
|
$
|
15,382
|
|
$
|
20,946
|
|
$
|
26,621
|
|
$
|
31,111
|
|
|
Non-U.S.
|
713
|
|
882
|
|
990
|
|
988
|
|
1,155
|
|
|||||
|
Total allowance for loan losses
|
$
|
14,185
|
|
$
|
16,264
|
|
$
|
21,936
|
|
$
|
27,609
|
|
$
|
32,266
|
|
|
Nonaccrual loans
|
$
|
7,133
|
|
$
|
8,540
|
|
$
|
10,892
|
|
$
|
9,993
|
|
$
|
14,841
|
|
|
Ratios
|
|||||||||||||||
|
Net charge-offs to:
|
|||||||||||||||
|
Loans retained – average
|
0.65
|
%
|
0.81
|
%
|
1.26
|
%
|
1.78
|
%
|
3.39
|
%
|
|||||
|
Allowance for loan losses
|
33.55
|
|
35.67
|
|
41.32
|
|
44.32
|
|
73.37
|
|
|||||
|
Allowance for loan losses to:
|
|||||||||||||||
|
Loans retained – year-end
(b)
|
1.90
|
|
2.25
|
|
3.02
|
|
3.84
|
|
4.71
|
|
|||||
|
Nonaccrual loans retained
|
202
|
|
196
|
|
207
|
|
281
|
|
225
|
|
|||||
|
(a)
|
There were no net charge-offs/(recoveries) on lending-related commitments in
2014
,
2013
,
2012
,
2011
or
2010
.
|
|
(b)
|
The allowance for loan losses as a percentage of retained loans declined from
2010
to
2014
, due to an improvement in credit quality of the consumer and wholesale credit portfolios. For a more detailed discussion of the
2012
through
2014
provision for credit losses, see Provision for credit losses on
page 130
.
|
|
327
|
||
Deposits
The following table provides a summary of the average balances and average interest rates of JPMorgan Chase’s various deposits for the years indicated.
|
Year ended December 31,
|
Average balances
|
Average interest rates
|
||||||||||||||||||
|
(in millions, except interest rates)
|
2014
|
|
2013
|
|
2012
|
|
2014
|
|
2013
|
|
2012
|
|
||||||||
|
U.S. offices
|
|
|
|
|
|
|
||||||||||||||
|
Noninterest-bearing
|
$
|
376,947
|
|
$
|
346,765
|
|
$
|
338,652
|
|
—
|
%
|
—
|
%
|
—
|
%
|
|||||
|
Interest-bearing
|
||||||||||||||||||||
|
Demand
|
75,553
|
|
63,045
|
|
43,124
|
|
0.10
|
|
0.09
|
|
0.08
|
|
||||||||
|
Savings
|
459,186
|
|
429,289
|
|
383,777
|
|
0.10
|
|
0.13
|
|
0.18
|
|
||||||||
|
Time
|
86,007
|
|
89,948
|
|
85,688
|
|
0.35
|
|
0.51
|
|
0.74
|
|
||||||||
|
Total interest-bearing deposits
|
620,746
|
|
582,282
|
|
512,589
|
|
0.13
|
|
0.18
|
|
0.26
|
|
||||||||
|
Total deposits in U.S. offices
|
997,693
|
|
929,047
|
|
851,241
|
|
0.08
|
|
0.11
|
|
0.16
|
|
||||||||
|
Non-U.S. offices
|
||||||||||||||||||||
|
Noninterest-bearing
|
18,516
|
|
19,596
|
|
16,133
|
|
—
|
|
—
|
|
—
|
|
||||||||
|
Interest-bearing
|
||||||||||||||||||||
|
Demand
|
208,364
|
|
196,300
|
|
184,366
|
|
0.22
|
|
0.22
|
|
0.35
|
|
||||||||
|
Savings
|
2,179
|
|
1,374
|
|
846
|
|
0.13
|
|
0.11
|
|
0.23
|
|
||||||||
|
Time
|
37,549
|
|
42,825
|
|
53,297
|
|
0.97
|
|
1.32
|
|
1.23
|
|
||||||||
|
Total interest-bearing deposits
|
248,092
|
|
240,499
|
|
238,509
|
|
0.33
|
|
0.42
|
|
0.55
|
|
||||||||
|
Total deposits in non-U.S. offices
|
266,608
|
|
260,095
|
|
254,642
|
|
0.31
|
|
0.38
|
|
0.51
|
|
||||||||
|
Total deposits
|
$
|
1,264,301
|
|
$
|
1,189,142
|
|
$
|
1,105,883
|
|
0.13
|
%
|
0.17
|
%
|
0.24
|
%
|
|||||
At December 31, 2014, other U.S. time deposits in denominations of $100,000 or more totaled
$45.7 billion
, substantially all of which mature in three months or less. In addition, the table below presents the maturities for U.S. time certificates of deposit in denominations of $100,000 or more.
|
By remaining maturity at
December 31, 2014 (in millions)
|
Three months
or less
|
Over three months
but within six months
|
Over six months
but within 12 months
|
Over 12 months
|
Total
|
||||||||||||||
|
U.S. time certificates of deposit ($100,000 or more)
|
$
|
12,460
|
|
$
|
4,865
|
|
$
|
2,442
|
|
$
|
6,163
|
|
$
|
25,930
|
|
||||
|
328
|
||
Short-term and other borrowed funds
The following table provides a summary of JPMorgan Chase’s short-term and other borrowed funds for the years indicated.
|
As of or for the year ended December 31, (in millions, except rates)
|
2014
|
2013
|
2012
|
|||||||||
|
Federal funds purchased and securities loaned or sold under repurchase agreements:
|
||||||||||||
|
Balance at year-end
|
$
|
192,101
|
|
$
|
181,163
|
|
$
|
240,103
|
|
|||
|
Average daily balance during the year
|
208,560
|
|
238,551
|
|
248,561
|
|
||||||
|
Maximum month-end balance
|
228,162
|
|
272,718
|
|
268,931
|
|
||||||
|
Weighted-average rate at December 31
|
0.27
|
%
|
0.31
|
%
|
0.23
|
%
|
||||||
|
Weighted-average rate during the year
|
0.29
|
|
0.24
|
|
0.22
|
|
||||||
|
Commercial paper:
|
||||||||||||
|
Balance at year-end
|
$
|
66,344
|
|
$
|
57,848
|
|
$
|
55,367
|
|
|||
|
Average daily balance during the year
|
59,916
|
|
53,717
|
|
50,780
|
|
||||||
|
Maximum month-end balance
|
66,344
|
|
58,835
|
|
62,875
|
|
||||||
|
Weighted-average rate at December 31
|
0.22
|
%
|
0.22
|
%
|
0.21
|
%
|
||||||
|
Weighted-average rate during the year
|
0.22
|
|
0.21
|
|
0.18
|
|
||||||
|
Other borrowed funds:
(a)
|
||||||||||||
|
Balance at year-end
|
$
|
96,455
|
|
$
|
92,774
|
|
$
|
79,258
|
|
|||
|
Average daily balance during the year
|
100,189
|
|
93,937
|
|
79,003
|
|
||||||
|
Maximum month-end balance
|
107,950
|
|
103,526
|
|
87,815
|
|
||||||
|
Weighted-average rate at December 31
|
1.73
|
%
|
2.49
|
%
|
1.83
|
%
|
||||||
|
Weighted-average rate during the year
|
1.89
|
|
2.27
|
|
2.49
|
|
||||||
|
Short-term beneficial interests
:
(b)
|
||||||||||||
|
Commercial paper and other borrowed funds:
|
||||||||||||
|
Balance at year-end
|
$
|
16,953
|
|
$
|
17,786
|
|
$
|
28,219
|
|
|||
|
Average daily balance during the year
|
14,073
|
|
22,245
|
|
25,653
|
|
||||||
|
Maximum month-end balance
|
17,026
|
|
28,559
|
|
30,043
|
|
||||||
|
Weighted-average rate at December 31
|
0.23
|
%
|
0.29
|
%
|
0.18
|
%
|
||||||
|
Weighted-average rate during the year
|
0.30
|
|
0.26
|
|
0.16
|
|
||||||
|
(a)
|
Includes interest-bearing securities sold but not yet purchased.
|
|
(b)
|
Included on the Consolidated balance sheets in beneficial interests issued by consolidated variable interest entities.
|
Federal funds purchased represent overnight funds. Securities loaned or sold under repurchase agreements generally mature between one day and three months. Commercial paper generally is issued in amounts not less than $100,000, and with maturities of 270 days or less. Other borrowed funds consist of demand notes, term federal funds purchased, and various other borrowings that generally have maturities of one year or less.
|
329
|
||
Signatures
Pursuant to the requirements of Section 13 or 15(d) of the Securities Exchange Act of 1934, the registrant has duly caused this report to be signed on behalf of the undersigned, thereunto duly authorized.
|
|
JPMorgan Chase & Co.
(Registrant)
|
|
|
By: /s/ JAMES DIMON
|
|
|
(James Dimon
Chairman and Chief Executive Officer)
|
|
February 24, 2015
|
|
Pursuant to the requirements of the Securities Exchange Act of 1934, this report has been signed below by the following persons on behalf of the registrant and in the capacity and on the date indicated. JPMorgan Chase & Co. does not exercise the power of attorney to sign on behalf of any Director.
|
|
Capacity
|
Date
|
||
|
/s/ JAMES DIMON
|
Director, Chairman and Chief Executive Officer
(Principal Executive Officer)
|
|
||
|
(James Dimon)
|
|
|||
|
/s/ LINDA B. BAMMANN
|
Director
|
|||
|
(Linda B. Bammann)
|
||||
|
/s/ JAMES A. BELL
|
Director
|
|||
|
(James A. Bell)
|
||||
|
/s/ CRANDALL C. BOWLES
|
Director
|
|||
|
(Crandall C. Bowles)
|
|
|
||
|
/s/ STEPHEN B. BURKE
|
Director
|
|
||
|
(Stephen B. Burke)
|
|
|
||
|
/s/ JAMES S. CROWN
|
Director
|
February 24, 2015
|
||
|
(James S. Crown)
|
|
|||
|
/s/ TIMOTHY P. FLYNN
|
Director
|
|||
|
(Timothy P. Flynn)
|
|
|||
|
/s/ LABAN P. JACKSON, JR.
|
Director
|
|||
|
(Laban P. Jackson, Jr.)
|
|
|||
|
/s/ MICHAEL A. NEAL
|
Director
|
|||
|
(Michael A. Neal)
|
||||
|
/s/ LEE R. RAYMOND
|
Director
|
|||
|
(Lee R. Raymond)
|
|
|||
|
/s/ WILLIAM C. WELDON
|
Director
|
|||
|
(William C. Weldon)
|
||||
|
/s/ MARIANNE LAKE
|
Executive Vice President and Chief Financial Officer
(Principal Financial Officer)
|
|||
|
(Marianne Lake)
|
||||
|
/s/ MARK W. O’DONOVAN
|
Managing Director and Corporate Controller
(Principal Accounting Officer)
|
|||
|
(Mark W. O’Donovan)
|
||||
|
330
|
||
TABLE OF CONTENTS
Part IItem 1B: Unresolved Sec Staff CommentsItem 2: PropertiesItem 3: Legal ProceedingsItem 4: Mine Safety DisclosuresPart IIItem 5: Market For Registrant S Common Equity, Related Stockholder Matters and Issuer Purchases Of Equity SecuritiesItem 6: Selected Financial DataItem 7: Management S Discussion and Analysis Of Financial Condition and Results Of OperationsItem 7A: Quantitative and Qualitative Disclosures About Market RiskItem 8: Financial Statements and Supplementary DataItem 9: Changes in and Disagreements with Accountants on Accounting and Financial DisclosureItem 9A: Controls and ProceduresItem 9B: Other InformationPart IIIItem 10: Directors, Executive Officers and Corporate GovernanceItem 11: Executive Compensationsee Item 10Item 11: Executive CompensationItem 12: Security Ownership Of Certain Beneficial Owners and Management and Related Stockholder MattersItem 13: Certain Relationships and Related Transactions, and Director IndependenceItem 14: Principal Accounting Fees and ServicesPart IVItem 15: Exhibits, Financial Statement SchedulesNote 1 Basis Of PresentationNote 2 Business Changes and DevelopmentsNote 3 Fair Value MeasurementNote 4 Fair Value OptionNote 5 Credit Risk ConcentrationsNote 6 Derivative InstrumentsNote 7 Noninterest RevenueNote 8 Interest Income and Interest ExpenseNote 9 Pension and Other Postretirement Employee Benefit PlansNote 10 Employee Stock-based IncentivesNote 11 Noninterest ExpenseNote 12 SecuritiesNote 13 Securities Financing ActivitiesNote 14 LoansNote 15 Allowance For Credit LossesNote 16 Variable Interest EntitiesNote 17 Goodwill and Other Intangible AssetsNote 18 Premises and EquipmentNote 19 DepositsNote 20 Accounts Payable and Other LiabilitiesNote 21 Long-term DebtNote 22 Preferred StockNote 23 Common StockNote 24 Earnings Per ShareNote 25 Accumulated Other Comprehensive Income/(loss)Note 26 Income TaxesNote 27 Restrictions on Cash and Intercompany Funds TransfersNote 28 Regulatory CapitalNote 29 Off Balance Sheet Lending-related Financial Instruments, Guarantees, and Other CommitmentsNote 30 Commitments, Pledged Assets and CollateralNote 31 LitigationNote 32 International OperationsNote 33 Business SegmentsNote 34 Parent Company