JPMORGAN CHASE & CO
10-Ks and 10-Qs
|
|
|
|
|
|
|
|
|
|
|
|
|
|
|
|
|
|
|
|
|
|
|
|
|
|
|
|
|
|
|
|
|
|
|
|
|
|
|
|
|
|
|
|
|
|
|
|
|
|
UNITED STATES
SECURITIES AND EXCHANGE COMMISSION
Washington, D.C. 20549
FORM 10-Q
Quarterly report pursuant to Section 13 or 15(d) of
The Securities Exchange Act of 1934
|
For the quarterly period ended
|
Commission file
|
|
June 30, 2013
|
number 1-5805
|
JPMorgan Chase & Co.
(Exact name of registrant as specified in its charter)
|
Delaware
|
13-2624428
|
|
(State or other jurisdiction of
incorporation or organization)
|
(I.R.S. employer
identification no.)
|
|
270 Park Avenue, New York, New York
|
10017
|
|
(Address of principal executive offices)
|
(Zip Code)
|
Registrant’s telephone number, including area code: (212) 270-6000
Indicate by check mark whether the registrant (1) has filed all reports
required to be filed by Section 13 or 15(d) of the Securities Exchange Act of
1934 during the preceding 12 months (or for such shorter period that the
registrant was required to file such reports), and (2) has been subject to such
filing requirements for the past 90 days.
T
Yes
o
No
Indicate by check mark whether the registrant has submitted electronically and posted on its corporate Web site, if any, every Interactive Data File required to be submitted and posted pursuant to Rule 405 of Regulation S-T (§232.405 of this chapter) during the preceding 12 months (or for such shorter period that the registrant was required to submit and post such files).
T
Yes
o
No
Indicate by check mark whether the registrant is a large accelerated filer, an accelerated filer, a non-accelerated filer, or a smaller reporting company. See the definitions of “large accelerated filer,” “accelerated filer” and “smaller reporting company” in Rule 12b-2 of the Exchange Act.
Large accelerated filer
T
Accelerated filer
o
Non-accelerated filer
(Do not check if a smaller reporting company)
o
Smaller reporting company
o
Indicate by check mark whether the registrant is a shell company (as defined in Rule 12b-2 of the Exchange Act).
o
Yes
T
No
Number of shares of common stock outstanding as of
July 31, 2013
:
3,764,198,009
FORM 10-Q
TABLE OF CONTENTS
|
Part I - Financial information
|
Page
|
||
|
Item 1
|
|||
|
Consolidated statements of income (unaudited) for the three and six months ended
June 30, 2013 and 2012
|
108
|
||
|
Consolidated statements of comprehensive income (unaudited) for the
three and six months ended June 30, 2013 and 2012
|
109
|
||
|
Consolidated balance sheets (unaudited) at June 30, 2013, and December 31, 2012
|
110
|
||
|
Consolidated statements of changes in stockholders’ equity (unaudited) for the six months ended June 30, 2013 and 2012
|
111
|
||
|
Consolidated statements of cash flows (unaudited) for the for the six months ended June 30, 2013 and 2012
|
112
|
||
|
113
|
|||
|
Report of Independent Registered Public Accounting Firm
|
209
|
||
|
Consolidated Average Balance Sheets, Interest and Rates (unaudited) for the three and six months ended June 30, 2013 and 2012
|
210
|
||
|
212
|
|||
|
Item 2
|
Management’s Discussion and Analysis of Financial Condition and Results of Operations:
|
||
|
3
|
|||
|
4
|
|||
|
6
|
|||
|
12
|
|||
|
Explanation and Reconciliation of the Firm’s Use of Non-GAAP Financial Measures
|
15
|
||
|
17
|
|||
|
52
|
|||
|
53
|
|||
|
55
|
|||
|
60
|
|||
|
65
|
|||
|
103
|
|||
|
104
|
|||
|
106
|
|||
|
107
|
|||
|
Item 3
|
217
|
||
|
Item 4
|
217
|
||
|
Part II - Other information
|
|||
|
Item 1
|
218
|
||
|
Item 1A
|
218
|
||
|
Item 2
|
218
|
||
|
Item 3
|
219
|
||
|
Item 4
|
Mine Safety Disclosure
|
219
|
|
|
Item 5
|
219
|
||
|
Item 6
|
220
|
||
2
JPMorgan Chase & Co.
Consolidated financial highlights
|
(unaudited)
As of or for the period ended,
|
Six months ended June 30,
|
|||||||||||||||||||||
|
(in millions, except per share, ratio and headcount data)
|
2Q13
|
1Q13
|
4Q12
|
3Q12
|
2Q12
|
2013
|
2012
|
|||||||||||||||
|
Selected income statement data
|
||||||||||||||||||||||
|
Total net revenue
|
$
|
25,211
|
|
$
|
25,122
|
|
$
|
23,653
|
|
$
|
25,146
|
|
$
|
22,180
|
|
$
|
50,333
|
|
$
|
48,232
|
|
|
|
Total noninterest expense
|
15,866
|
|
15,423
|
|
16,047
|
|
15,371
|
|
14,966
|
|
31,289
|
|
33,311
|
|
||||||||
|
Pre-provision profit
|
9,345
|
|
9,699
|
|
7,606
|
|
9,775
|
|
7,214
|
|
19,044
|
|
14,921
|
|
||||||||
|
Provision for credit losses
|
47
|
|
617
|
|
656
|
|
1,789
|
|
214
|
|
664
|
|
940
|
|
||||||||
|
Income before income tax expense
|
9,298
|
|
9,082
|
|
6,950
|
|
7,986
|
|
7,000
|
|
18,380
|
|
13,981
|
|
||||||||
|
Income tax expense
|
2,802
|
|
2,553
|
|
1,258
|
|
2,278
|
|
2,040
|
|
5,355
|
|
4,097
|
|
||||||||
|
Net income
|
$
|
6,496
|
|
$
|
6,529
|
|
$
|
5,692
|
|
$
|
5,708
|
|
$
|
4,960
|
|
$
|
13,025
|
|
$
|
9,884
|
|
|
|
Per common share data
|
||||||||||||||||||||||
|
Net income per share: Basic
|
$
|
1.61
|
|
$
|
1.61
|
|
$
|
1.40
|
|
$
|
1.41
|
|
$
|
1.22
|
|
$
|
3.22
|
|
$
|
2.41
|
|
|
|
Diluted
|
1.60
|
|
1.59
|
|
1.39
|
|
1.40
|
|
1.21
|
|
3.19
|
|
2.41
|
|
||||||||
|
Cash dividends declared per share
(a)
|
0.38
|
|
0.30
|
|
0.30
|
|
0.30
|
|
0.30
|
|
0.68
|
|
0.60
|
|
||||||||
|
Book value per share
|
52.48
|
|
52.02
|
|
51.27
|
|
50.17
|
|
48.40
|
|
52.48
|
|
48.40
|
|
||||||||
|
Tangible book value per share
(b)
|
39.97
|
|
39.54
|
|
38.75
|
|
37.53
|
|
35.71
|
|
39.97
|
|
35.71
|
|
||||||||
|
Common shares outstanding
|
||||||||||||||||||||||
|
Average: Basic
|
3,782.4
|
|
3,818.2
|
|
3,806.7
|
|
3,803.3
|
|
3,808.9
|
|
3,800.3
|
|
3,813.9
|
|
||||||||
|
Diluted
|
3,814.3
|
|
3,847.0
|
|
3,820.9
|
|
3,813.9
|
|
3,820.5
|
|
3,830.6
|
|
3,827.0
|
|
||||||||
|
Common shares at period-end
|
3,769.0
|
|
3,789.8
|
|
3,804.0
|
|
3,799.6
|
|
3,796.8
|
|
3,769.0
|
|
3,796.8
|
|
||||||||
|
Share price
(c)
|
||||||||||||||||||||||
|
High
|
$
|
55.90
|
|
$
|
51.00
|
|
$
|
44.54
|
|
$
|
42.09
|
|
$
|
46.35
|
|
$
|
55.90
|
|
$
|
46.49
|
|
|
|
Low
|
46.05
|
|
44.20
|
|
38.83
|
|
33.10
|
|
30.83
|
|
44.20
|
|
30.83
|
|
||||||||
|
Close
|
52.79
|
|
47.46
|
|
43.97
|
|
40.48
|
|
35.73
|
|
52.79
|
|
35.73
|
|
||||||||
|
Market capitalization
|
198,966
|
|
179,863
|
|
167,260
|
|
153,806
|
|
135,661
|
|
198,966
|
|
135,661
|
|
||||||||
|
Selected ratios
|
||||||||||||||||||||||
|
Return on common equity (“ROE”)
|
13
|
%
|
13
|
%
|
11
|
%
|
12
|
%
|
11
|
%
|
13
|
%
|
11
|
%
|
||||||||
|
Return on tangible common equity (“ROTCE”)
(b)
|
17
|
|
17
|
|
15
|
|
16
|
|
15
|
|
17
|
|
15
|
|
||||||||
|
Return on assets (“ROA”)
|
1.09
|
|
1.14
|
|
0.98
|
|
1.01
|
|
0.88
|
|
1.11
|
|
0.88
|
|
||||||||
|
Return on risk-weighted assets
(d)(e)
|
1.85
|
|
1.88
|
|
1.76
|
|
1.74
|
|
1.52
|
|
1.86
|
|
1.55
|
|
||||||||
|
Overhead ratio
|
63
|
|
61
|
|
68
|
|
61
|
|
67
|
|
62
|
|
69
|
|
||||||||
|
Deposits-to-loans ratio
|
166
|
|
165
|
|
163
|
|
158
|
|
153
|
|
166
|
|
153
|
|
||||||||
|
Tier 1 capital ratio
(e)
|
11.6
|
|
11.6
|
|
12.6
|
|
11.9
|
|
11.3
|
|
11.6
|
|
11.3
|
|
||||||||
|
Total capital ratio
(e)
|
14.1
|
|
14.1
|
|
15.3
|
|
14.7
|
|
14.0
|
|
14.1
|
|
14.0
|
|
||||||||
|
Tier 1 leverage ratio
|
7.0
|
|
7.3
|
|
7.1
|
|
7.1
|
|
6.7
|
|
7.0
|
|
6.7
|
|
||||||||
|
Tier 1 common capital ratio
(e)(f)
|
10.4
|
|
10.2
|
|
11.0
|
|
10.4
|
|
9.9
|
|
10.4
|
|
9.9
|
|
||||||||
|
Selected balance sheet data (period-end)
|
||||||||||||||||||||||
|
Trading assets
|
$
|
401,470
|
|
$
|
430,991
|
|
$
|
450,028
|
|
$
|
447,053
|
|
$
|
417,324
|
|
$
|
401,470
|
|
$
|
417,324
|
|
|
|
Securities
|
354,725
|
|
365,744
|
|
371,152
|
|
365,901
|
|
354,595
|
|
354,725
|
|
354,595
|
|
||||||||
|
Loans
|
725,586
|
|
728,886
|
|
733,796
|
|
721,947
|
|
727,571
|
|
725,586
|
|
727,571
|
|
||||||||
|
Total assets
|
2,439,494
|
|
2,389,349
|
|
2,359,141
|
|
2,321,284
|
|
2,290,146
|
|
2,439,494
|
|
2,290,146
|
|
||||||||
|
Deposits
|
1,202,950
|
|
1,202,507
|
|
1,193,593
|
|
1,139,611
|
|
1,115,886
|
|
1,202,950
|
|
1,115,886
|
|
||||||||
|
Long-term debt
|
266,212
|
|
268,361
|
|
249,024
|
|
241,140
|
|
239,539
|
|
266,212
|
|
239,539
|
|
||||||||
|
Common stockholders’ equity
|
197,781
|
|
197,128
|
|
195,011
|
|
190,635
|
|
183,772
|
|
197,781
|
|
183,772
|
|
||||||||
|
Total stockholders’ equity
|
209,239
|
|
207,086
|
|
204,069
|
|
199,693
|
|
191,572
|
|
209,239
|
|
191,572
|
|
||||||||
|
Headcount
(g)
|
254,063
|
|
255,898
|
|
258,753
|
|
259,144
|
|
260,398
|
|
254,063
|
|
260,398
|
|
||||||||
|
Credit quality metrics
|
||||||||||||||||||||||
|
Allowance for credit losses
|
$
|
20,137
|
|
$
|
21,496
|
|
$
|
22,604
|
|
$
|
23,576
|
|
$
|
24,555
|
|
$
|
20,137
|
|
$
|
24,555
|
|
|
|
Allowance for loan losses to total retained loans
|
2.69
|
%
|
2.88
|
%
|
3.02
|
%
|
3.18
|
%
|
3.29
|
%
|
2.69
|
%
|
3.29
|
%
|
||||||||
|
Allowance for loan losses to retained loans excluding purchased credit-impaired loans
(h)
|
2.06
|
|
2.27
|
|
2.43
|
|
2.61
|
|
2.74
|
|
2.06
|
|
2.74
|
|
||||||||
|
Nonperforming assets
|
$
|
10,896
|
|
$
|
11,584
|
|
$
|
11,734
|
|
$
|
12,481
|
|
$
|
11,397
|
|
$
|
10,896
|
|
$
|
11,397
|
|
|
|
Net charge-offs
|
1,403
|
|
1,725
|
|
1,628
|
|
2,770
|
|
2,278
|
|
3,128
|
|
4,665
|
|
||||||||
|
Net charge-off rate
|
0.78
|
%
|
0.97
|
%
|
0.90
|
%
|
1.53
|
%
|
1.27
|
%
|
0.88
|
%
|
1.31
|
%
|
||||||||
|
(a)
|
On May 21, 2013, the Board of Directors of JPMorgan Chase increased the Firm’s quarterly stock dividend from $0.30 to $0.38 per share.
|
|
(b)
|
Tangible book value per share and ROTCE are non-GAAP financial measures. Tangible book value per share represents the Firm’s tangible common equity divided by period-end common shares. ROTCE measures the Firm’s annualized earnings as a percentage of tangible common equity. For further discussion of these measures, see Explanation and Reconciliation of the Firm’s Use of Non-GAAP Financial Measures on pages
15–16
of this Form 10-Q.
|
|
(c)
|
Share price shown for JPMorgan Chase’s common stock is from the New York Stock Exchange. JPMorgan Chase’s common stock is also listed and traded on the London Stock Exchange and the Tokyo Stock Exchange.
|
|
(d)
|
Return on Basel I risk-weighted assets is the annualized earnings of the Firm divided by its average risk-weighted assets (
“
RWA
”
).
|
|
(e)
|
Basel 2.5 rules became effective for the Firm on January 1, 2013. The implementation of these rules in the first quarter of 2013 resulted in an increase of approximately $150 billion in risk-weighted assets compared with the Basel I rules. The implementation of these rules also resulted in decreases of the Firm’s Tier 1 capital, Total capital and Tier 1 common capital ratios by 140 basis points, 160 basis points and 120 basis points, respectively, at March 31, 2013. For further discussion of Basel 2.5, see Regulatory capital on pages
60–63
of this Form 10-Q.
|
|
(f)
|
Basel I Tier 1 common capital ratio (“Tier 1 common ratio”) is Tier 1 common capital (“Tier 1 common”) divided by risk-weighted assets. The Firm uses Tier 1 common capital along with the other capital measures to assess and monitor its capital position. For further discussion of the Tier 1 common ratio, see Regulatory capital on pages
60–63
of this Form 10-Q.
|
|
(g)
|
Effective January 1, 2013, interns are excluded from the firmwide and business segment headcount metrics. Prior periods were revised to conform with this presentation.
|
|
(h)
|
Excludes the impact of residential real estate purchased credit-impaired (“PCI”) loans. For further discussion, see Allowance for credit losses on pages
92–94
of this Form 10-Q.
|
3
|
INTRODUCTION
|
||||
This section of the Form 10-Q provides management’s discussion and analysis (“MD&A”) of the financial condition and results of operations of JPMorgan Chase & Co. (“JPMorgan Chase” or the “Firm”). See the Glossary of terms on pages
212–214
for definitions of terms used throughout this Form 10-Q.
The MD&A included in this Form 10-Q contains statements that are forward-looking within the meaning of the Private Securities Litigation Reform Act of 1995. These statements are based on the current beliefs and expectations of JPMorgan Chase’s management and are subject to significant risks and uncertainties. Actual results may differ from those set forth in the forward-looking statements. For a discussion of those risks and uncertainties and the factors that could cause JPMorgan Chase’s actual results to differ materially from those risks and uncertainties, see Forward-looking Statements on page
107
and Part II, Item 1A: Risk Factors, on page
218
of this Form 10-Q; and Part I, Item 1A, Risk Factors, on pages 8–21 of JPMorgan Chase’s Annual Report on Form 10-K for the year ended December 31, 2012, filed with the U.S. Securities and Exchange Commission (“2012 Annual Report” or “2012 Form 10-K”), to which reference is hereby made.
JPMorgan Chase & Co.
, a financial holding company incorporated under Delaware law in 1968, is a leading global financial services firm and one of the largest banking institutions in the United States of America (“U.S.”), with operations worldwide. The Firm had
$2.4 trillion
in assets and
$209.2 billion
in stockholders’ equity as of June 30, 2013. The Firm is a leader in investment banking, financial services for consumers and small businesses, commercial banking, financial transaction processing, asset management and private equity. Under the J.P. Morgan and Chase brands, the Firm serves millions of customers in the U.S. and many of the world’s most prominent corporate, institutional and government clients.
JPMorgan Chase
’s principal bank subsidiaries are JPMorgan Chase Bank, National Association (“
JPMorgan Chase Bank, N.A.
”), a national bank with U.S. branches in
23
states, and Chase Bank USA, National Association (“Chase Bank USA, N.A.”), a national bank that is the Firm’s credit card–issuing bank.
JPMorgan Chase
’s principal nonbank subsidiary is J.P. Morgan Securities LLC (“JPMorgan Securities”), the Firm’s U.S. investment banking firm. The bank and nonbank subsidiaries of
JPMorgan Chase
operate nationally as well as through overseas branches and subsidiaries, representative offices and subsidiary foreign banks. One of the Firm’s principal operating subsidiaries in the United Kingdom (“U.K.”) is J.P. Morgan Securities plc (formerly J.P. Morgan Securities Ltd.), a subsidiary of JPMorgan Chase Bank, N.A.
JPMorgan Chase’s activities are organized, for management reporting purposes, into
four
major reportable business segments, as well as a Corporate/Private Equity segment. The Firm’s consumer business is the Consumer & Community Banking segment. The Corporate & Investment Bank, Commercial Banking, and Asset Management segments comprise the Firm’s wholesale businesses. A description of the Firm’s business segments, and the products and services they provide to their respective client bases, follows.
Consumer & Community Banking
Consumer & Community Banking (“CCB”) serves consumers and businesses through personal service at bank branches and through ATMs, online, mobile and telephone banking. CCB is organized into Consumer & Business Banking, Mortgage Banking (including Mortgage Production, Mortgage Servicing and Real Estate Portfolios) and Card, Merchant Services & Auto (“Card”). Consumer & Business Banking offers deposit and investment products and services to consumers, and lending, deposit, and cash management and payment solutions to small businesses. Mortgage Banking includes mortgage origination and servicing activities, as well as portfolios comprised of residential mortgages and home equity loans, including the purchased credit-impaired (“PCI”) portfolio acquired in the Washington Mutual transaction. Card issues credit cards to consumers and small businesses, provides payment services to corporate and public sector clients through its commercial card products, offers payment processing services to merchants, and provides auto and student loan services.
Corporate & Investment Bank
The Corpora
te & Investment Bank (“CIB”) comprised of Banking and Markets & Investor Services, off
ers a broad suite of investment banking, market-making, prime brokerage, and treasury and securities products and services to a global client base of corporations, investors, financial institutions, government and municipal entities. Within Banking, the CIB offers a full range of investment banking products and services in all major capital markets, including advising on corporate strategy and structure, capital-raising in equity and debt markets, as well as loan origination and syndication. Also included in Banking is Treasury Services, which includes transaction services, comprised primarily of cash management and liquidity solutions, and trade finance products. The Markets & Investor Services segment of the CIB is a global market-maker in cash securities and derivative instruments, and also offers sophisticated risk management solutions, prime brokerage, and research. Markets & Investor Services also includes the Securities Services business, a leading global custodian which includes custody, fund accounting and administration, and securities lending products sold principally to asset managers, insurance companies and public and private investment funds
.
4
Commercial Banking
Commercial Banking (“CB”) delivers extensive industry knowledge, local expertise and dedicated service to U.S. and U.S. multinational clients, including corporations, municipalities, financial institutions and nonprofit entities with annual revenue generally ranging from $20 million to
$2 billion
. CB provides financing to real estate investors and owners. Partnering with the Firm’s other businesses, CB provides comprehensive financial solutions, including lending, treasury services, investment banking and asset management to meet its clients’ domestic and international financial needs.
Asset Management
Asset Management (“AM”), with client assets of
$2.2 trillion
as of June 30, 2013, is a global leader in investment and wealth management. AM clients include institutions, high-net-worth individuals and retail investors in every major market throughout the world. AM offers investment management across all major asset classes including equities, fixed income, alternatives and money market funds. AM also offers multi-asset investment management, providing solutions to a broad range of clients’ investment needs. For individual investors, AM also provides retirement products and services, brokerage and banking services, including trust and estate, loans, mortgages and deposits. The majority of AM’s client assets are in actively managed portfolios.
In addition to the four major reportable business segments outlined above, the following is a description of the Corporate/Private Equity segment.
Corporate/Private Equity
The Corporate/Private Equity segment comprises Private Equity, Treasury and Chief Investment Office (“CIO”), and Other Corporate, which includes corporate staff units and expense that is centrally managed. Treasury and CIO are predominantly responsible for measuring, monitoring, reporting and managing the Firm’s liquidity, funding, capital and structural interest rate and foreign exchange risks. The major corporate staff units include Central Technology and Operations, Internal Audit, Executive, Finance, Human Resources, Legal, Compliance, Global Real Estate, Operational Control, Risk Management, and Corporate Responsibility & Public Policy. Other centrally managed expense includes the Firm’s occupancy and pension-related expense that are subject to allocation to the businesses.
5
|
EXECUTIVE OVERVIEW
|
||||
This executive overview of the MD&A highlights selected information and may not contain all of the information that is important to readers of this Form 10-Q. For a complete description of trends and uncertainties, as well as the risks and critical accounting estimates affecting the Firm and its various lines of business, this Form 10-Q should be read in its entirety.
Economic environment
The U.S. economy continued to grow at a modest pace in the second quarter 0f 2013 amid a contraction in government spending and slower consumer spending. The U.S. unemployment rate held steady a
t 7.6% in the second quarter accompanied by slow growth of the labor force. Inflation, already below the Federal Reserve’s 2% long-run target, eased further to 1%.
In the housing market, prices continued to increase and new home sales rose to the highest level in five years during the second quarter. The increase in household wealth from rising home prices and stock markets, coupled with still-low interest rates, both of which support consumer borrowing, have counterbalanced the increase in Social Security payroll taxes following passage of the American Taxpayer Relief Act of 2012 on December 31, 2012. The Federal budget deficit continued to decline in parallel with the ongoing economic recovery; after peaking at 10.5% of GDP in early 2010, it was down to 4.4% over the last twelve months.
Against the backdrop of the improving labor market, the Federal Reserve indicated it could begin tapering its quantitative easing program if the job market improved further and inflation increased. Following Federal Reserve Chairman Ben Bernanke’s remarks during the quarter that such tapering could begin in 2013, longer-term bond yields rose sharply. U.S. and international stock market indices declined at first and later recovered to new highs amid less conviction about near-term tapering.
In Europe, both the Bank of England and the European Central Bank held benchmark rates steady and indicated that policy was likely to remain accommodative for a considerable time given tight credit conditions, little growth, and elevated unemployment. Although the economies of Spain and Italy contracted further in the second quarter, several of the economies in northern Europe expanded at a moderate pace.
Asian economies have slowed in response to the economic situation in Europe. India announced the slowest GDP growth since 2003 and China’s government reduced its GDP growth target for the next decade to 7.5%
. In Japan, the Bank of Japan announced an asset purchase program aimed at boosting its inflation rate. Subsequent to this announcement, Japanese stocks and currency have experienced increased volatility given uncertainty about the impact of new policies.
Across Latin America, growth remained slow, but accelerated moderately in the second quarter.
|
Financial performance of JPMorgan Chase
|
|||||||||||||||||||||
|
Three months ended June 30,
|
Six months ended June 30,
|
||||||||||||||||||||
|
(in millions, except per share data and ratios)
|
2013
|
2012
|
Change
|
2013
|
2012
|
Change
|
|||||||||||||||
|
Selected income statement data
|
|||||||||||||||||||||
|
Total net revenue
|
$
|
25,211
|
|
$
|
22,180
|
|
14
|
%
|
$
|
50,333
|
|
$
|
48,232
|
|
4
|
%
|
|||||
|
Total noninterest expense
|
15,866
|
|
14,966
|
|
6
|
|
31,289
|
|
33,311
|
|
(6
|
)
|
|||||||||
|
Pre-provision profit
|
9,345
|
|
7,214
|
|
30
|
|
19,044
|
|
14,921
|
|
28
|
|
|||||||||
|
Provision for credit losses
|
47
|
|
214
|
|
(78
|
)
|
664
|
|
940
|
|
(29
|
)
|
|||||||||
|
Net income
|
6,496
|
|
4,960
|
|
31
|
|
13,025
|
|
9,884
|
|
32
|
|
|||||||||
|
Diluted earnings per share
|
1.60
|
|
1.21
|
|
32
|
%
|
3.19
|
|
2.41
|
|
32
|
%
|
|||||||||
|
Return on common equity
|
13
|
%
|
11
|
%
|
13
|
%
|
11
|
%
|
|||||||||||||
|
Capital ratios
|
|||||||||||||||||||||
|
Tier 1 capital
|
11.6
|
|
11.3
|
|
|||||||||||||||||
|
Tier 1 common
(a)
|
10.4
|
|
9.9
|
|
|||||||||||||||||
|
(a)
|
Basel I Tier 1 common capital ratio (“Tier 1 common ratio”) is Tier 1 common capital (“Tier 1 common”) divided by risk-weighted assets. The Firm uses Tier 1 common capital along with the other capital measures to assess and monitor its capital position. For further discussion of the Tier 1 common ratio, see Regulatory capital on pages
60–63
of this Form 10-Q.
|
Business Overview
JPMorgan Chase reported second-quarter 2013 net income of $6.5 billion, or $1.60 per share, on net revenue of $25.2 billion. Net income increased by $1.5 billion, or 31%, compared with net income of $5.0 billion, or $1.21 per share, in the second quarter of 2012. Return on equity for the quarter was 13%, compared with 11% for the prior-year quarter. Results in the second quarter of 2013
included the following significant items: $950 million pretax benefit ($0.15 per share after-tax increase in earnings) from a reduction in the allowance for loan losses in Real Estate Portfolios; $550 million pretax benefit ($0.09 per share after-tax increase in earnings) from a reduction in the allowance for loan losses in Card Services; and approximately $600 million pretax expense ($0.09 per
6
share after-tax decrease in earnings) for additional litigation reserves in Corporate. The tax rate used for each of the above significant items is 38%; for additional information, see the discussion at the end of this section on page
9
.
The increase in net income from the second quarter of 2012 was driven by higher net revenue and lower provision for credit losses, partially offset by higher noninterest expense. The increase in net revenue compared with the prior year was due to higher principal transactions revenue, investment banking fees, and higher asset management, administration and commission revenue, partially offset by lower securities gains and lower mortgage fees and related income. The increase in principal transactions revenue reflected: the absence of $4.4 billion of losses on CIO’s synthetic credit portfolio, which was recorded in the second quarter of the prior year, partially offset this year by a lower gain from debit valuation adjustments (“DVA”) on structured notes and derivative liabilities of
$355 million
resulting from the widening of the Firm’s credit spreads, compared with a DVA gain of
$755 million
in the prior year. Net interest income decreased compared with the prior year, reflecting the impact of lower loan yields due to competitive pressures and loan portfolio run-off and the impact of low interest rates on investment securities yield and reinvestment opportunities, partially offset by lower long-term debt costs primarily due to a change in funding mix, and lower deposit costs.
Results in the second quarter of 2013 reflected lower estimated losses due to improved delinquency trends in the residential real estate and credit card portfolios, as well as the impact of improved home prices on the residential real estate portfolio. The provision for credit losses was $47 million, down $167 million, or 78%, from the prior year. The total consumer provision for credit losses was a benefit of $29 million in the 2013 second quarter, compared with a provision of $171 million in the prior year. The current-quarter consumer provision included a $1.5 billion reduction in the allowance for loan losses, down from a $2.1 billion reduction in the prior year. Consumer net charge-offs were $1.5 billion, compared with $2.3 billion in the prior year, resulting in net charge-off rates of 1.66% and 2.51%, respectively, excluding in each year the PCI portfolio. The decrease in consumer net charge-offs was primarily due to favorable delinquency trends. A favorable credit environment and stable credit trends also prevailed across the Firm’s wholesale loan portfolios as the Firm continued to experience low levels of criticized exposure, nonaccrual loans and net charge-offs. The wholesale provision for credit losses was $76 million, compared with $43 million in the prior year. Wholesale net recoveries were $67 million, compared with net charge-offs of $9 million in the prior year, resulting in a net recovery rate of 0.09% and a net charge-off rate of 0.01%, respectively. The Firm’s allowance for loan losses to end-of-period loans retained was 2.06%, compared with 2.74% in the prior year,
excluding in each year the PCI portfolio. The Firm’s nonperforming assets totaled $10.9 billion at June 30, 2013, down from $11.6 billion in the prior quarter and down from $11.4 billion in the prior year.
Noninterest expense was $15.9 billion, up $900 million, or 6%, compared with the prior year, driven by higher compensation expense on higher revenue and higher litigation expense, partially offset by lower mortgage servicing expense. The current quarter included $678 million of expense for additional litigation reserves, compared with $323 million in the prior year.
The Firm’s results reflected strong performance across its businesses. CCB average deposits were up 10%. Mortgage originations were $49.0 billion, up 12% compared with the prior year. Credit Card sales volume was a record $105.2 billion, up 10% from the prior year. CIB reported strong performance across products and maintained its #1 ranking for Global Investment Banking fees. CIB assets under custody were $18.9 trillion, up 7% compared with the prior year, while average client deposits and other third party liabilities were up 6% compared with the prior year. AM reported positive net long-term product flows for the seventeenth consecutive quarter, total client assets of $2.2 trillion and record loan balances of $86.0 billion.
Net income for the first six months of 2013 was $13.0 billion, or $3.19 per share, compared with $9.9 billion, or $2.41 per share, in the first half of 2012. The increase was driven by an increase in net revenue, a decrease in noninterest expense and a decrease in provision for credit losses. The increase in net revenue for the first six months of the year was driven by higher principal transactions revenue, reflecting the absence of $5.8 billion of losses from the CIO’s synthetic credit portfolio and a $545 million recovery on a Bear Stearns-related subordinated loan in the first half of 2012, higher asset management, administration and commissions, and higher investment banking fees. Largely offsetting these items were lower net interest income, the absence of the $1.1 billion benefit from the Washington Mutual bankruptcy settlement, lower mortgage fees and related income, and lower securities gains. The lower provision for credit losses reflected an improved credit environment. The decrease in noninterest expense was driven by lower litigation expense.
The Firm strengthened its balance sheet, ending the second quarter with Basel I Tier 1 common capital of $147 billion and a Tier 1 common ratio of 10.4%, including the impact of Basel 2.5 rules that became effective at the beginning of this year. The Firm estimated that its Basel III Tier 1 common ratio was approximately 9.3% at June 30, 2013, including the estimated impact of final Basel III rules issued in July 2013. (The Basel I and III Tier 1 common ratios are non- GAAP financial measures, which the Firm uses along with the other capital measures to assess and monitor its capital position. For further discussion of the Tier 1
7
common capital ratios, see Regulatory capital on pages
60–63
of this Form 10-Q.)
JPMorgan Chase continued to support clients, consumers, companies, and communities around the globe. The Firm provided credit and raised capital of $1.0 trillion for commercial and consumer clients in the first six months of 2013. This included nearly $9 billion of credit provided for U.S. small businesses and $294 billion of credit provided for corporations. This also included more than $552 billion of capital for clients and more than $35 billion of credit provided to, and capital raised for, nonprofit and government entities, including states, municipalities, hospitals and universities.
Consumer & Community Banking
net income decreased due to lower net revenue and higher noninterest expense, partially offset by lower provision for credit losses. Net revenue decreased, driven by lower noninterest revenue and net interest income. Noninterest revenue decreased, driven by lower mortgage fees and related income, partially offset by higher merchant servicing revenue, auto lease income and net interchange income. Net interest income decreased, driven by lower deposit margins and lower loan balances due to portfolio runoff, largely offset by higher deposit balances. The provision for credit losses was a benefit of $19 million, compared with a provision for credit losses of $179 million in the prior year. The current-quarter provision reflected a $1.5 billion reduction in the allowance for loan losses and total net charge-offs of $1.5 billion. The prior-year provision reflected a $2.1 billion reduction in the allowance for loan losses and total net charge-offs of $2.3 billion. Noninterest expense increased in the second quarter of 2013 compared with the prior year, driven by continued investments in the business, offset by lower mortgage servicing expense and lower remediation expense, inclusive of a current-quarter charge, related to an exited non-core product. Return on equity for the second quarter of 2013 was 27% on $46.0 billion of average allocated capital.
Corporate & Investment Bank
net income increased compared with the prior year, reflecting higher net revenue, partially offset by higher noninterest expense. Net revenue for the second quarter of 2013 included a $355 million DVA gain on structured notes and derivative liabilities resulting from the widening of the Firm’s credit spreads, compared with a DVA gain of $755 million in the prior year. The increase in net revenue also reflected higher investment banking fees and higher Markets revenue from credit-related and equities products. Noninterest expense increased from the prior year, primarily driven by higher compensation expense on increased revenue. Return on equity for the second quarter of 2013 was 20%, or 19% excluding DVA (a non-GAAP financial measure), on $56.5 billion of average allocated capital.
Commercial Banking
net income decreased compared with the prior year, reflecting a higher provision for credit losses and an increase in noninterest expense, partially offset by higher net revenue. Net revenue was slightly higher compared with the prior year, driven by higher loan and liability balances, deposit-related fees, credit card revenue, and investment banking fees, partially offset by lower purchase discounts recognized on loan repayments, spread compression on liability products and lower community development investment-related revenue. Noninterest expense increased compared with the prior year, reflecting higher headcount-related expense and increased operating expense for Commercial Card. Return on equity for the second quarter of 2013 was 18% on $13.5 billion of average allocated capital.
Asset Management
net income increased compared with the prior year, reflecting higher net revenue, largely offset by higher noninterest expense. Noninterest revenue increased due to the effect of higher market levels, net client inflows, and higher performance fees. Net interest income increased due to higher loan and deposit balances, partially offset by narrower deposit and loan spreads. Noninterest expense increased from the prior year, primarily due to higher performance-based compensation and headcount-related expense. Return on equity for the second quarter of 2013 was 22% on $9.0 billion of average allocated capital.
Corporate/Private Equity
net income was a loss of $552 million, compared with a loss of $1.8 billion in the prior year.
Private Equity reported net income of $212 million, compared with net income of $197 million in the prior year. Net revenue was $410 million, same as prior year.
Treasury and CIO reported a net loss of $429 million, compared with a net loss of $2.1 billion in the prior year. Net revenue was a loss of $648 million, compared with a loss of $3.4 billion in the prior year. The prior-year loss reflected $4.4 billion of principal transactions losses from the synthetic credit portfolio that had been held by CIO, partially offset by net securities gains of $1.0 billion. Net revenue in the current quarter included net securities gains of $123 million from sales of available-for-sale investment securities and a modest loss related to the redemption of trust preferred securities. Current-quarter net interest income was a loss of $558 million due to low interest rates and limited reinvestment opportunities.
Other Corporate reported a net loss of $335 million, compared with net income of $119 million in the prior year. Noninterest revenue included $545 million in the prior year related to the gain on the recovery of a Bear Stearns-related subordinated loan. The current quarter included approximately $600 million of expense for additional litigation reserves, compared with $335 million of expense for additional litigation reserves in the prior year.
8
Note: The Firm uses a single U.S.-based, blended marginal tax rate of 38% (“the marginal rate”) to report the estimated after-tax effects of each significant item affecting net income. This rate represents the weighted-average marginal tax rate for the U.S. consolidated tax group. The Firm uses this single marginal rate to reflect the tax effects of all significant items because (a) it simplifies the presentation and analysis for management and investors; (b) it has proved to be a reasonable estimate of the marginal tax effects; and (c) often there is uncertainty at the time a significant item is disclosed regarding its ultimate tax outcome.
2013 Business outlook
The following forward-looking statements are based on the current beliefs and expectations of JPMorgan Chase’s management and are subject to significant risks and uncertainties. These risks and uncertainties could cause the Firm’s actual results to differ materially from those set forth in such forward-looking statements. See Forward-Looking Statements on page
107
and Risk Factors on page
218
of this Form 10-Q.
JPMorgan Chase’s outlook for the remainder of 2013 should be viewed against the backdrop of the global and U.S. economies, financial markets activity, the geopolitical environment, the competitive environment, client activity levels, and regulatory and legislative developments in the U.S. and other countries where the Firm does business. Each of these linked factors will affect the performance of the Firm and its lines of business.
The Firm expects that net interest income for the third quarter of 2013 will be up modestly from the second quarter, and that net interest margin will be relatively stable for the second half of 2013.
In Mortgage Banking within CCB, management expects to continue to incur elevated default- and foreclosure-related costs, including additional costs associated with the Firm’s mortgage servicing processes, particularly its loan modification and foreclosure procedures. The Firm also expects there will be continued elevated levels of repurchases of mortgages previously sold, predominantly to U.S. government-sponsored entities (“GSEs”). However, based on current trends and estimates, management believes that the existing mortgage repurchase liability is sufficient to cover such losses.
Primary mortgage interest rates increased during the second quarter of 2013; if such rates remain at or above current levels, management estimates that the mortgage loan origination market in the U.S., including refinance and purchase, could be reduced by 30% to 40% during the second half of 2013, compared with the first half of the year. Management expects such a market environment to have a negative impact on refinancing volumes and margins, and, accordingly, the profitability of Mortgage Production within Mortgage Banking will likely be challenged.
For Real Estate Portfolios within Mortgage Banking, total net charge-offs for the third quarter are expected to be less than $250 million. If net charge-offs and delinquencies continue to trend down, the related allowance for loan losses for non credit impaired loans could be reduced over time. Additionally with continued, sustained improvement in home prices and delinquencies, the allowance for loan losses for purchased credit impaired loans could also be reduced over time.
In the Card Services business within Card, Merchant Services & Auto, the Firm expe
cts that, if current credit trends in the credit card portfolio, including lower delinquency rates and lower balances of restructured loans, continue to improve, the related allowance for loan losses has the potential to be reduced during the second half of 2013. Management expects loan balances in Card Services could increase modestly during the second half of 2013, primarily driven by increased credit card sales volume and lower portfolio run-off.
CCB’s results will continue to be affected by U.S. economic conditions, including housing prices and the unemployment rate. Management continues to closely monitor the portfolios in these businesses.
In Private Equity, within the Corporate/Private Equity segment, earnings will likely continue to be volatile and influenced by capital markets activity, market levels, the performance of the broader economy and investment-specific factors.
For Treasury and CIO, within the Corporate/Private Equity segment, management currently believes that it may generate a quarterly net loss of approximately $300 million for the remainder of 2013, although that amount may vary each quarter driven by the implied yield curve and management decisions related to the positioning of the investment securities portfolio.
For Other Corporate, within the Corporate/Private Equity segment, management expects quarterly net income, excluding material litigation expense and significant items, if any, to be approximately $100 million, but this amount is also likely to vary each quarter.
Regulatory developments
JPMorgan Chase is subject to regulation under state and federal laws in the U.S., as well as the applicable laws of each of the various other jurisdictions outside the U.S. in which the Firm does business. The Firm is currently experiencing an unprecedented increase in regulation and supervision, and such changes could have a significant impact on how the Firm conducts business. In July 2013, the Board of Governors of the Federal Reserve System (the “Federal Reserve”), the Office of the Comptroller of the Currency (the “OCC”), and the Federal Deposit Insurance Corporation (the “FDIC”) approved the final rules for implementing Basel III in the U.S. The final rules narrowed the definition of capital, increased capital requirements for
9
certain exposures, set higher capital ratio requirements and minimum floors with respect the capital ratio requirements, and included a supplementary leverage ratio. The supplementary leverage ratio is defined as Tier I capital under Basel III divided by the Firm’s total leverage exposure, which is calculated by taking the Firm’s total average on-balance sheet assets, less amounts permitted to be deducted for Tier I capital, and adding certain off-balance sheet exposures, such as undrawn commitments and certain derivatives exposures. Following approval of the final Basel III rules, the U.S. banking agencies issued proposed rulemaking relating to the supplementary leverage ratio that would require U.S. bank holding companies, including JPMorgan Chase, to have a supplementary leverage ratio of at least 5%, and insured depositary institutions (“IDI”), including JPMorgan Chase Bank, N.A. and Chase Bank USA, N.A., to have a supplementary leverage ratio of at least 6%. The Firm estimates, based on its current understanding of the proposed rules, that if the rules were in effect at June 30, 2013, JPMorgan Chase’s leverage ratio at such date would have been approximately 4.7%. Management’s current objective is for the Firm to comply with the minimum supplementary leverage ratio by the beginning of 2015. This objective is based upon management’s current understanding of the proposed rules. The actual timeframe for the Firm to meet the minimum supplementary leverage ratio could depend on changes to the proposed rules and any further guidance from regulators.
For further information about the supplementary leverage ratio, as well as additional information regarding Basel III, see Regulatory capital on pages
60–63
of this Form 10-Q.
On July 31, 2013, the U.S. District Court for the District of Columbia ruled that the Federal Reserve exceeded its authority in the manner it set a cap on debit card transaction interchange fees and established network exclusivity prohibitions in its regulation implementing the Durbin Amendment provisions of the Dodd-Frank Act. While the court’s ruling introduces uncertainty about the amount of interchange fees large banks may earn on debit card transactions in the future, and about how debit card transactions will be routed over payment networks in the future, the court said that the Federal Reserve’s current regulations would remain in effect for an as yet undetermined period of time to provide the Federal Reserve an opportunity to promulgate interim debit interchange standards or new regulations. The Federal Reserve has not yet announced whether it intends to appeal the decision. The Firm is assessing the decision, but it is too early for the Firm to determine the extent or timing of any potential negative effects the decision could have on the Firm, as any such effects (and the timing thereof) will depend on numerous factors, including whether the Federal Reserve challenges the decision, the success of any such challenge, and the substance of any new regulations that may be promulgated.
Rule making under the Dodd-Frank Wall Street Reform and Consumer Protection Act (the “Dodd-Frank Act”), as well as other federal banking laws, by the Federal Reserve, the OCC, and the FDIC, as well as by the Commodities Futures Trading Commission, the Securities Exchange Commission, and the Bureau of Consumer Financial Protection will be continuing. The Firm continues to work diligently in assessing and understanding the implications of the regulatory changes it is facing, and is devoting substantial resources to implementing all the new regulations while, at the same time, best meeting the needs and expectations of its clients.
The Firm is also experiencing heightened scrutiny by its regulators of its compliance with new and existing regulations, and with respect to its controls and operational processes. As previously disclosed, the Firm is subject to several Consent Orders with the Federal Reserve and the OCC, including those related to the Firm’s and certain of its bank subsidiaries’ Bank Secrecy Act/Anti-Money Laundering (“BSA/AML”) policies and procedures, and with regard to the risk management, model governance, and other control functions related to CIO and certain other trading activities at the Firm. The Firm expects that its banking supervisors will in the future continue to take more formal enforcement actions against the Firm (including Consent Orders related to certain non-mortgage consumer collections practices and certain sales of an ancillary identity theft protection product) rather than issuing informal supervisory actions or criticisms.
In addition, in the ordinary course of its business, the Firm is subject to governmental and regulatory examinations, information-gathering requests, investigations and proceedings (both formal and informal), certain of which may result in adverse judgments, settlements, fines, penalties, restitution, disgorgement, injunctions, or other relief. In addition, certain affiliates and subsidiaries of the Firm are banks, registered broker-dealers, futures commission merchants, investment advisers or other regulated entities and, in those capacities, are subject to regulation by various U.S., state and foreign securities, banking, commodities futures, consumer protection and other regulators. In connection with formal and informal inquiries by these regulators, the Firm and such affiliates and subsidiaries receive numerous requests, subpoenas and orders seeking documents, testimony and other information in connection with various aspects of their regulated activities. For example, the Firm is responding to and cooperating with the following examinations, inquiries and/or investigations:
|
▪
|
Examination requests from several states relating to unclaimed property and the Firm’s compliance with escheatment laws.
|
|
•
|
Requests for information from the U.S. Attorney’s
Office for the District of Connecticut, subpoenas and requests from the SEC Division of Enforcement, and a request from the Office of the Special Inspector General for the Troubled Asset Relief Program to conduct a review of
|
10
certain activities, all of which relate to, among other matters, communications with counterparties in connection with certain mortgage-backed securities transactions.
|
▪
|
A request from the SEC Division of Enforcement seeking information and documents relating to, among other matters, the Firm’s employment of certain former employees in Hong Kong and its business relationships with certain clients.
|
|
▪
|
A request for information from the New York State Department of Financial Services relating to forbearance practices for loans serviced by the Firm that are secured by residential property in Superstorm Sandy FEMA-designated counties in New York State.
|
|
▪
|
A request from the New York Attorney General’s Office seeking documents and information relating to, among other things, the use of services and data provided by consumer credit screening companies and the Firm’s compliance with the Fair Credit Reporting Act, the Equal Credit Opportunity Act and other laws.
|
|
▪
|
A request from the U.S. Department of Labor for documents and information relating to the Firm’s foreign exchange practices pursuant to the Employee Retirement Income Security Act of 1974.
|
While the effect of the changes in law and the heightened scrutiny of its regulators are likely to result in additional costs, the Firm cannot, given the current status of regulatory and supervisory developments, quantify the possible effects on its business and operations of all the significant changes that are currently underway. For further discussion of regulatory developments, see Supervision and regulation on pages 1–8 and Risk factors on pages 8–21 of JPMorgan Chase’s 2012 Form 10-K.
Business events
Issuance of preferred stock
On February 5, 2013 the Firm issued
$900 million
of noncumulative preferred stock. On April 23, 2013 the Firm issued
$1.5 billion
of noncumulative preferred stock. For additional information on the Firm’s preferred stock, see Note 22 on page 300 of the Firm’s 2012 Annual Report.
Redemption of outstanding trust preferred securities
On May 8, 2013, the Firm redeemed approximately
$5.0 billion
, or
100%
of the liquidation amount, of the following eight series of trust preferred securities: JPMorgan Chase Capital X, XI, XII, XIV, XVI, XIX, XXIV, and BANK ONE Capital VI. For a further discussion of trust preferred securities, see Note 21 on pages 297–299 of JPMorgan Chase’s 2012 Annual Report.
Increase in common stock dividend
On May 21, 2013, the Board of Directors increased the Firm’s quarterly common stock dividend from $0.30 per share to $0.38 per share, effective with the dividend paid on July 31, 2013, to shareholders of record on July 5, 2013.
One Equity Partners
As announced on June 14, 2013, One Equity Partners (“OEP”) will raise its next fund from an external group of limited partners and then become independent from JPMorgan Chase. Until it becomes independent from the Firm, OEP will continue to make direct investments for JPMorgan Chase, and thereafter will continue to manage the then-existing group of portfolio companies for JPMorgan Chase to maximize value for the Firm.
Subsequent events
On July 26, 2013, the Firm announced that it is pursuing strategic alternatives for its physical commodities businesses, including its remaining holdings of commodities assets and its physical trading operations. The Firm will explore a full range of options over time, including, but not limited to: a sale, spin off or strategic partnership. During the process, the Firm will continue to run its physical commodities business as a going concern. The Firm remains fully committed to its traditional banking activities in the commodity markets, including financial derivatives and the vaulting and trading of precious metals.
On July 29, 2013, the Firm issued
$1.5 billion
of noncumulative preferred stock. On August 1, 2013, the Firm announced that it would redeem all of its outstanding
8.625%
noncumulative preferred stock, Series J on September 1, 2013. For additional information on the Firm’s preferred stock, see Note 22 on page 300 of the Firm’s 2012 Annual Report.
11
|
CONSOLIDATED RESULTS OF OPERATIONS
|
||||
The following section provides a comparative discussion of JPMorgan Chase’s Consolidated Results of Operations on a reported basis for the three and six months ended
June 30, 2013 and 2012
. Factors that relate primarily to a single business segment are discussed in more detail within that
business segment. For a discussion of the Critical Accounting Estimates Used by the Firm that affect the Consolidated Results of Operations, see pages
104–106
of this Form 10-Q and pages 178–182 of JPMorgan Chase’s 2012 Annual Report.
|
Revenue
|
|||||||||||||||||||||
|
Three months ended June 30,
|
Six months ended June 30,
|
||||||||||||||||||||
|
(in millions)
|
2013
|
2012
|
Change
|
2013
|
|
2012
|
|
Change
|
|
||||||||||||
|
Investment banking fees
|
$
|
1,717
|
|
$
|
1,257
|
|
37
|
%
|
$
|
3,162
|
|
$
|
2,638
|
|
20
|
%
|
|||||
|
Principal transactions
|
3,760
|
|
(427
|
)
|
NM
|
|
7,521
|
|
2,295
|
|
228
|
|
|||||||||
|
Lending- and deposit-related fees
|
1,489
|
|
1,546
|
|
(4
|
)
|
2,957
|
|
3,063
|
|
(3
|
)
|
|||||||||
|
Asset management, administration and commissions
|
3,865
|
|
3,461
|
|
12
|
|
7,464
|
|
6,853
|
|
9
|
|
|||||||||
|
Securities gains
|
124
|
|
1,014
|
|
(88
|
)
|
633
|
|
1,550
|
|
(59
|
)
|
|||||||||
|
Mortgage fees and related income
|
1,823
|
|
2,265
|
|
(20
|
)
|
3,275
|
|
4,275
|
|
(23
|
)
|
|||||||||
|
Card income
|
1,503
|
|
1,412
|
|
6
|
|
2,922
|
|
2,728
|
|
7
|
|
|||||||||
|
Other income
(a)
|
226
|
|
506
|
|
(55
|
)
|
762
|
|
2,018
|
|
(62
|
)
|
|||||||||
|
Noninterest revenue
|
14,507
|
|
11,034
|
|
31
|
|
28,696
|
|
25,420
|
|
13
|
|
|||||||||
|
Net interest income
|
10,704
|
|
11,146
|
|
(4
|
)
|
21,637
|
|
22,812
|
|
(5
|
)
|
|||||||||
|
Total net revenue
|
$
|
25,211
|
|
$
|
22,180
|
|
14
|
%
|
$
|
50,333
|
|
$
|
48,232
|
|
4
|
%
|
|||||
|
(a)
|
Included operating lease income of
$363 million
and
$328 million
for the three months ended June 30, 2013 and 2012, respectively, and
$712 million
and
$651 million
for the six months ended June 30, 2013 and 2012, respectively.
|
Total net revenue for the three months ended June 30, 2013, was
$25.2 billion
, an increase of
$3.0 billion
, or
14%
, compared with the three months ended June 30, 2012. For the six months ended June 30, 2013, total net revenue was
$50.3 billion
, an increase of
$2.1 billion
, or
4%
, from the same period of the prior year. In both periods, higher principal transactions revenue, investment banking fees, and asset management, administration and commissions revenue were offset partially by lower securities gains, mortgage fees and related income, net interest income and other income.
Investment banking fees for both the three and six months ended June 30, 2013, increased compared with the prior year, due to higher debt and equity underwriting fees. Despite weaker credit markets towards the end of the second quarter of 2013, the Firm’s debt underwriting fees in the first half of 2013 were close to historical records, driven in part by record industry-wide high-yield bond issuance. In equity capital markets, the Firm ranked #1 in wallet share for the first half of 2013, according to Dealogic. For additional information on investment banking fees, which are primarily recorded in CIB, see CIB segment results pages
34–40
and Note 6 on pages
143–144
of this Form 10-Q.
Principal transactions revenue increased significantly for both the three and six months ended June 30, 2013, compared with the prior year. The prior year periods included
$4.4 billion
and
$5.8 billion
, respectively, of losses on the synthetic credit portfolio that had been held by CIO. The current year periods reflected solid client revenue in fixed income and equity markets, partially offset by lower
private equity gains in the six months of 2013, and the absence of a
$545 million
gain recognized in the second quarter of 2012 in Other Corporate, representing the recovery on a Bear Stearns-related subordinated loan. The three and six month periods of 2013 included a DVA gain on structured notes and derivative liabilities of
$355 million
and
$481 million
, respectively, compared with a DVA gain of
$755 million
and a DVA loss of
$152 million
for the three and six month periods of 2012, respectively, as a result of changes in
the Firm’s credit spreads. For additional information on principal transactions revenue, see CIB and Corporate/Private Equity segment results on pages
34–40
and
49–51
, respectively, and Note 6 on pages
143–144
of this Form 10-Q.
Lending- and deposit-related fees decreased modestly compared with both the three and six months ended June 30, 2012. The decrease was predominantly due to lower deposit-related fees in CCB, resulting from reductions in certain product and transaction fees. For additional information on lending- and deposit-related fees, which are mostly recorded in CCB, CIB and CB, see the segment results for CCB on pages
19–33
, CIB on pages
34–40
and CB on pages
41–44
of this Form 10-Q.
Asset management, administration and commissions revenue increased compared with both the three and six months ended June 30, 2012. The increase was driven by higher investment management fees in AM, due to the effect of higher market levels, net client inflows and higher performance fees, as well as increased investment sales revenue in CCB. For additional information on these fees and commissions, see the segment discussions for CCB on
12
pages
19–33
, AM on pages
45–48
, and Note 6 on pages
143–144
of this Form 10-Q.
Securities gains decreased compared with both prior-year periods, reflecting the results of repositioning the CIO available-for-sale (“AFS”) portfolio. For additional information on securities gains, which are predominantly recorded in the Firm’s Corporate/Private Equity segment, see the Corporate/Private Equity segment discussion on pages
49–51
, and Note 11 on pages
147–150
of this Form 10-Q.
Mortgage fees and related income decreased compared with both prior-year periods. The decrease resulted from lower mortgage production revenue and mortgage servicing revenue. The decrease in mortgage production revenue reflected lower revenue margins due to tightening of primary/secondary spreads, as well as pricing pressure due to increased capacity in the market, partially offset by higher volumes. The decrease in mortgage servicing revenue was predominantly due to lower mortgage servicing rights (“MSR”) risk management results. For additional information on mortgage fees and related income, which is recorded predominantly in CCB, see CCB’s Mortgage Production and Mortgage Servicing discussion on pages
25–28
, and Note 16 on pages
184–187
of this
Form 10-Q.
Card income increased compared with the three and six months ended June 30, 2012. The increase was driven by higher net interchange income on credit and debit cards, and higher merchant servicing revenue, both due to growth
in business volume. For additional information on credit card income, see the CCB segment results on pages
19–33
of this Form 10-Q.
Other income decreased compared with the three and six months ended June 30, 2012. The three months ended June 30, 2013, included a modest loss recorded on the redemption of trust preferred securities. The six months ended June 30, 2012 reflected a
$1.1 billion
benefit from the Washington Mutual bankruptcy settlement. The decrease compared with the three and six months ended June 30, 2012 was offset partially by higher revenue from client-driven activity in CIB.
Net interest income decreased compared with the three and six months ended June 30, 2012. The decrease primarily reflects the impact of lower loan yields due to competitive pressures and loan portfolio run-off, the impact of low interest rates on investment securities yield and reinvestment opportunities, partially offset by lower long-term debt costs, primarily due to a change in funding mix, and lower deposit costs. The Firm’s average interest-earning assets were
$2.0 trillion
for the three months ended June 30, 2013, and the net interest yield on those assets, on a fully taxable-equivalent (“FTE”) basis, was
2.20%
, a decrease of
27
basis points from the prior year. For the six months ended June 30, 2013, the Firm’s average interest-earning assets were
$1.9 trillion
, and the net interest yield on those assets, on a FTE basis, was
2.28%
, a decrease of
26
basis points from the prior year.
|
Provision for credit losses
|
|||||||||||||||||||||
|
Three months ended June 30,
|
Six months ended June 30,
|
||||||||||||||||||||
|
(in millions)
|
2013
|
2012
|
Change
|
2013
|
2012
|
Change
|
|||||||||||||||
|
Consumer, excluding credit card
|
$
|
(493
|
)
|
$
|
(424
|
)
|
(16
|
)%
|
$
|
(530
|
)
|
$
|
(423
|
)
|
(25
|
)%
|
|||||
|
Credit card
|
464
|
|
595
|
|
(22
|
)
|
1,046
|
|
1,231
|
|
(15
|
)
|
|||||||||
|
Total consumer
|
(29
|
)
|
171
|
|
NM
|
|
516
|
|
808
|
|
(36
|
)
|
|||||||||
|
Wholesale
|
76
|
|
43
|
|
77
|
|
148
|
|
132
|
|
12
|
|
|||||||||
|
Total provision for credit losses
|
$
|
47
|
|
$
|
214
|
|
(78
|
)%
|
$
|
664
|
|
$
|
940
|
|
(29
|
)%
|
|||||
The provision for credit losses decreased from both the three and six months ended 2012, due to a decline in the provision for total consumer credit losses, partially offset by an increase in the provision for wholesale credit losses. The decline in the total consumer credit losses provision was due to lower net charge-offs offset partially by a smaller reduction in the allowance for loan losses compared with the prior-year periods, reflecting lower estimated losses due to improved delinquency trends in the residential real
estate and credit card portfolios, as well as the impact of improved home prices on the residential real estate portfolio. The wholesale credit losses provision in the current periods reflected stable credit trends. For a more detailed discussion of the credit portfolio and the allowance for credit losses, see the segment discussions for CCB on pages
19–33
, CIB on pages
34–40
and CB on pages
41–44
, and the Allowance for credit losses section on pages
92–94
of this Form 10-Q.
13
|
Noninterest expense
|
|||||||||||||||||||||
|
Three months ended June 30,
|
Six months ended June 30,
|
||||||||||||||||||||
|
(in millions)
|
2013
|
2012
|
Change
|
2013
|
2012
|
Change
|
|||||||||||||||
|
Compensation expense
|
$
|
8,019
|
|
$
|
7,427
|
|
8
|
%
|
$
|
16,433
|
|
$
|
16,040
|
|
2
|
%
|
|||||
|
Noncompensation expense:
|
|||||||||||||||||||||
|
Occupancy
|
904
|
|
1,080
|
|
(16
|
)
|
1,805
|
|
2,041
|
|
(12
|
)
|
|||||||||
|
Technology, communications and equipment
|
1,361
|
|
1,282
|
|
6
|
|
2,693
|
|
2,553
|
|
5
|
|
|||||||||
|
Professional and outside services
|
1,901
|
|
1,857
|
|
2
|
|
3,635
|
|
3,652
|
|
—
|
|
|||||||||
|
Marketing
|
578
|
|
642
|
|
(10
|
)
|
1,167
|
|
1,322
|
|
(12
|
)
|
|||||||||
|
Other expense
(a)(b)
|
2,951
|
|
2,487
|
|
19
|
|
5,252
|
|
7,319
|
|
(28
|
)
|
|||||||||
|
Amortization of intangibles
|
152
|
|
191
|
|
(20
|
)
|
304
|
|
384
|
|
(21
|
)
|
|||||||||
|
Total noncompensation expense
|
7,847
|
|
7,539
|
|
4
|
|
14,856
|
|
17,271
|
|
(14
|
)
|
|||||||||
|
Total noninterest expense
|
$
|
15,866
|
|
$
|
14,966
|
|
6
|
%
|
$
|
31,289
|
|
$
|
33,311
|
|
(6
|
)%
|
|||||
|
(a)
|
Included litigation expense of
$678 million
and
$323 million
for the three months ended June 30, 2013 and 2012, respectively, and
$1.0 billion
and
$3.0 billion
for the six months ended June 30, 2013 and 2012, respectively.
|
|
(b)
|
Included FDIC-related expense of
$392 million
and
$413 million
for the three months ended June 30, 2013 and 2012, respectively, and
$771 million
and
$814 million
for the six months ended June 30, 2013 and 2012, respectively.
|
Total noninterest expense for the three months ended June 30, 2013, was
$15.9 billion
, up by
$900 million
, or
6%
, compared with the prior year. The increase was due to higher compensation and other expense offset partially by lower occupancy expense. For the six months ended June 30, 2013, total noninterest expense was
$31.3 billion
, down by
$2.0 billion
, or
6%
, compared with the prior year. The decrease was due to lower litigation expense in Corporate/Private Equity.
Compensation expense increased compared with the three and six months ended June 30, 2012, predominantly due to higher performance-based compensation across the businesses, and the impact of investments in the businesses, including front office sales and support staff.
Noncompensation expense increased in the three months ended June 30, 2013, compared with the prior year, due to higher other expense, in particular, litigation expense in Corporate/Private Equity, partially offset by lower
occupancy expense, reflecting the recognition of charges in 2012 related to vacating excess space. For the six months ended June 30, 2013, noncompensation expense decreased due to lower other expense, in particular, litigation expense, as well as lower occupancy expense, which reflected the aforementioned charges in 2012. The decline in litigation expense resulted from the $2.5 billion expense in Corporate/Private Equity recorded in the first quarter of 2012 for additional litigation reserves, predominantly for mortgage-related matters, partially offset by higher litigation expense in CIB in the current year. In addition to the above factors, there were other items contributing to the variances in both periods. The impact of business growth and investments in the businesses was offset partially by lower mortgage servicing and foreclosure-related expense, as well as marketing expense, in CCB. For a further discussion of litigation expense, see Note 23 on pages
198–206
of this Form 10-Q.
|
Income tax expense
|
|||||||||||||||
|
(in millions, except rate)
|
Three months ended June 30,
|
Six months ended June 30,
|
|||||||||||||
|
2013
|
2012
|
2013
|
2012
|
||||||||||||
|
Income before income tax expense
|
$
|
9,298
|
|
$
|
7,000
|
|
$
|
18,380
|
|
$
|
13,981
|
|
|||
|
Income tax expense
|
2,802
|
|
2,040
|
|
5,355
|
|
4,097
|
|
|||||||
|
Effective tax rate
|
30.1
|
%
|
29.1
|
%
|
29.1
|
%
|
29.3
|
%
|
|||||||
The increase in the effective tax rate during the three months ended June 30, 2013, compared with the prior year, was predominantly the result of higher reported pretax income in combination with changes in the mix of income and expense subject to U.S. federal and state and local taxes. The decrease in the effective tax rate during the six months ended June 30, 2013, compared with the prior year, was largely attributable to tax benefits recognized in the first quarter of 2013 associated with prior year tax
adjustments and the settlement of tax audits. This was partially offset by the impact of higher reported pretax income in combination with changes in the mix of income and expense subject to U.S. federal and state and local taxes. The prior year included deferred tax benefits associated with state and local income taxes. For additional information on income taxes, see Critical Accounting Estimates Used by the Firm on pages
104–106
of this Form 10-Q.
14
|
EXPLANATION AND RECONCILIATION OF THE FIRM’S USE OF NON-GAAP FINANCIAL MEASURES
|
The Firm prepares its consolidated financial statements using accounting principles generally accepted in the U.S. (“U.S. GAAP”); these financial statements appear on pages
108
–
112
of this Form 10-Q. That presentation, which is referred to as “reported” basis, provides the reader with an understanding of the Firm’s results that can be tracked consistently from year to year and enables a comparison of the Firm’s performance with other companies’ U.S. GAAP financial statements.
In addition to analyzing the Firm’s results on a reported basis, management reviews the Firm’s results and the results of the lines of business on a “managed” basis, which is a non-GAAP financial measure. The Firm’s definition of managed basis starts with the reported U.S. GAAP results and includes certain reclassifications to present total net revenue for the Firm (and each of the business segments) on a FTE basis. Accordingly, revenue from investments that receive tax credits and tax-exempt securities is presented in the managed results on a basis comparable to taxable
investments and securities. This non-GAAP financial measure allows management to assess the comparability of revenue arising from both taxable and tax-exempt sources. The corresponding income tax impact related to tax-exempt items is recorded within income tax expense. These adjustments have no impact on net income as reported by the Firm as a whole or by the lines of business.
Management also uses certain non-GAAP financial measures at the business-segment level, because it believes these other non-GAAP financial measures provide information to investors about the underlying operational performance and trends of the particular business segment and, therefore, facilitate a comparison of the business segment with the performance of its competitors. Non-GAAP financial measures used by the Firm may not be comparable to similarly named non-GAAP financial measures used by other companies.
The following summary table provides a reconciliation from the Firm’s reported U.S. GAAP results to managed basis.
|
Three months ended June 30,
|
|||||||||||||||||||||||
|
2013
|
2012
|
||||||||||||||||||||||
|
(in millions, except ratios)
|
Reported
results
|
Fully taxable-equivalent adjustments
(a)
|
Managed
basis
|
Reported
results
|
Fully taxable-equivalent adjustments
(a)
|
Managed
basis
|
|||||||||||||||||
|
Other income
|
$
|
226
|
|
$
|
582
|
|
$
|
808
|
|
$
|
506
|
|
$
|
517
|
|
$
|
1,023
|
|
|||||
|
Total noninterest revenue
|
14,507
|
|
582
|
|
15,089
|
|
11,034
|
|
517
|
|
11,551
|
|
|||||||||||
|
Net interest income
|
10,704
|
|
165
|
|
10,869
|
|
11,146
|
|
195
|
|
11,341
|
|
|||||||||||
|
Total net revenue
|
25,211
|
|
747
|
|
25,958
|
|
22,180
|
|
712
|
|
22,892
|
|
|||||||||||
|
Pre-provision profit
|
9,345
|
|
747
|
|
10,092
|
|
7,214
|
|
712
|
|
7,926
|
|
|||||||||||
|
Income before income tax expense
|
9,298
|
|
747
|
|
10,045
|
|
7,000
|
|
712
|
|
7,712
|
|
|||||||||||
|
Income tax expense
|
$
|
2,802
|
|
$
|
747
|
|
$
|
3,549
|
|
$
|
2,040
|
|
$
|
712
|
|
$
|
2,752
|
|
|||||
|
Overhead ratio
|
63
|
%
|
NM
|
|
61
|
%
|
67
|
%
|
NM
|
|
65
|
%
|
|||||||||||
|
Six months ended June 30,
|
|||||||||||||||||||||||
|
2013
|
2012
|
||||||||||||||||||||||
|
(in millions, except ratios)
|
Reported
results
|
Fully taxable-equivalent adjustments
(a)
|
Managed
basis
|
Reported
results
|
Fully taxable-equivalent adjustments
(a)
|
Managed
basis
|
|||||||||||||||||
|
Other income
|
$
|
762
|
|
$
|
1,146
|
|
$
|
1,908
|
|
$
|
2,018
|
|
$
|
1,051
|
|
$
|
3,069
|
|
|||||
|
Total noninterest revenue
|
28,696
|
|
1,146
|
|
29,842
|
|
25,420
|
|
1,051
|
|
26,471
|
|
|||||||||||
|
Net interest income
|
21,637
|
|
327
|
|
21,964
|
|
22,812
|
|
366
|
|
23,178
|
|
|||||||||||
|
Total net revenue
|
50,333
|
|
1,473
|
|
51,806
|
|
48,232
|
|
1,417
|
|
49,649
|
|
|||||||||||
|
Pre-provision profit
|
19,044
|
|
1,473
|
|
20,517
|
|
14,921
|
|
1,417
|
|
16,338
|
|
|||||||||||
|
Income before income tax expense
|
18,380
|
|
1,473
|
|
19,853
|
|
13,981
|
|
1,417
|
|
15,398
|
|
|||||||||||
|
Income tax expense
|
$
|
5,355
|
|
$
|
1,473
|
|
$
|
6,828
|
|
$
|
4,097
|
|
$
|
1,417
|
|
$
|
5,514
|
|
|||||
|
Overhead ratio
|
62
|
%
|
NM
|
|
60
|
%
|
69
|
%
|
NM
|
|
67
|
%
|
|||||||||||
|
(a)
|
Predominantly recognized in CIB and CB business segments and Corporate/Private Equity.
|
Tangible common equity (“TCE”), ROTCE, tangible book value per share (“TBVS”), and Tier 1 common under Basel I and III rules are each non-GAAP financial measures. TCE represents the Firm’s common stockholders’ equity (i.e., total stockholders’ equity less preferred stock) less goodwill and identifiable intangible assets (other than MSRs), net of related deferred tax liabilities. ROTCE measures the Firm’s
earnings as a percentage of average TCE. TBVS represents the Firm’s tangible common equity divided by period-end common shares. Tier 1 common under Basel I and III rules are used by management, along with other capital measures, to assess and monitor the Firm’s capital position. TCE, ROTCE, and TBVS are meaningful to the Firm, as well as analysts and investors, in assessing the Firm’s use of equity.
15
For additional information on Tier 1 common under Basel I and III, see Regulatory capital on pages
60–63
of this Form10-Q. All of the aforementioned measures are useful
to the Firm, as well as analysts and investors, in facilitating comparisons of the Firm with competitors.
|
Average tangible common equity
|
||||||||||||||||
|
Three months ended June 30,
|
Six months ended June 30,
|
|||||||||||||||
|
(in millions, except per share and ratio data)
|
2013
|
2012
|
2013
|
2012
|
||||||||||||
|
Common stockholders’ equity
|
$
|
197,283
|
|
$
|
181,021
|
|
$
|
196,016
|
|
$
|
179,366
|
|
||||
|
Less: Goodwill
|
48,078
|
|
48,157
|
|
48,123
|
|
48,188
|
|
||||||||
|
Less: Certain identifiable intangible assets
|
2,026
|
|
2,923
|
|
2,093
|
|
3,029
|
|
||||||||
|
Add: Deferred tax liabilities
(a)
|
2,869
|
|
2,734
|
|
2,849
|
|
2,729
|
|
||||||||
|
Tangible common equity
|
$
|
150,048
|
|
$
|
132,675
|
|
$
|
148,649
|
|
$
|
130,878
|
|
||||
|
Return on tangible common equity (“ROTCE”)
|
17
|
%
|
15
|
%
|
17
|
%
|
15
|
%
|
||||||||
|
Tangible book value per share
|
$
|
39.97
|
|
$
|
35.71
|
|
$
|
39.97
|
|
$
|
35.71
|
|
||||
|
(a)
|
Represents deferred tax liabilities related to tax-deductible goodwill and to identifiable intangibles created in nontaxable transactions, which are netted against goodwill and other intangibles when calculating TCE.
|
Core net interest income
In addition to reviewing JPMorgan Chase’s net interest income on a managed basis, management also reviews core net interest income to assess the performance of its core lending, investing (including asset-liability management) and deposit-raising activities (which excludes the impact of CIB’s market-based activities). The core data presented below are non-GAAP financial measures due to the
exclusion of CIB’s market-based net interest income and related assets. Management believes this exclusion provides investors and analysts a more meaningful measure by which to analyze the non-market-related business trends of the Firm and provides a comparable measure to other financial institutions that are primarily focused on core lending, investing and deposit-raising activities.
|
Core net interest income data
(a)
|
|||||||||||||||||||
|
Three months ended June 30,
|
Six months ended June 30,
|
||||||||||||||||||
|
(in millions, except rates)
|
2013
|
2012
|
Change
|
2013
|
2012
|
Change
|
|||||||||||||
|
Net interest income – managed basis
(b)(c)
|
$
|
10,869
|
|
$
|
11,341
|
|
(4
|
)%
|
$
|
21,964
|
|
$
|
23,178
|
|
(5
|
)%
|
|||
|
Less: Market-based net interest income
|
1,345
|
|
1,345
|
|
—
|
|
2,777
|
|
2,914
|
|
(5
|
)
|
|||||||
|
Core net interest income
(b)
|
$
|
9,524
|
|
$
|
9,996
|
|
(5
|
)
|
$
|
19,187
|
|
$
|
20,264
|
|
(5
|
)
|
|||
|
Average interest-earning assets
|
$
|
1,980,466
|
|
$
|
1,843,627
|
|
7
|
|
$
|
1,938,508
|
|
$
|
1,832,570
|
|
6
|
|
|||
|
Less: Average market-based earning assets
|
512,631
|
|
505,282
|
|
1
|
|
510,796
|
|
498,016
|
|
3
|
|
|||||||
|
Core average interest-earning assets
|
$
|
1,467,835
|
|
$
|
1,338,345
|
|
10
|
%
|
$
|
1,427,712
|
|
$
|
1,334,554
|
|
7
|
%
|
|||
|
Net interest yield on interest-earning assets – managed basis
|
2.20
|
%
|
2.47
|
%
|
2.28
|
%
|
2.54
|
%
|
|||||||||||
|
Net interest yield on market-based
activities
|
1.05
|
|
1.07
|
|
1.10
|
|
1.18
|
|
|||||||||||
|
Core net interest yield on core average interest-earning assets
|
2.60
|
%
|
3.00
|
%
|
2.71
|
%
|
3.05
|
%
|
|||||||||||
|
(a)
|
Includes core lending, investing and deposit-raising activities on a managed basis across the Firm’s business segments and Corporate/Private Equity; excludes the market-based activities within the CIB.
|
|
(b)
|
Interest includes the effect of related hedging derivatives. Taxable-equivalent amounts are used where applicable.
|
|
(c)
|
For a reconciliation of net interest income on a reported and managed basis, see reconciliation from the Firm’s reported U.S. GAAP results to managed basis on page
15
of this Form 10-Q.
|
Quarterly and year-to-date results
Core net interest income decreased by
$472 million
to
$9.5 billion
and by
$1.1 billion
to
$19.2 billion
for the three and
six months ended
June 30, 2013
, respectively, compared with the prior year periods. Core average interest-earning assets increased by
$129.5 billion
to
$1,467.8 billion
and by
$93.2 billion
to
$1,427.7 billion
for the three and
six months ended
June 30, 2013
, respectively, compared with the prior year periods. The decline in core net interest income primarily reflected the impact of lower loan yields due to competitive pressures and loan portfolio run-off and the impact of low interest rates on investment securities yield and reinvestment opportunities. The decline was partially offset by lower long-term debt costs, primarily due to a change in funding mix, and lower deposit costs. The increase in average interest-earning assets was primarily driven by higher
deposits with banks. The core net interest yield decreased by
40
basis points to
2.60
% and by
34
basis points to
2.71%
for the three and six months ended June 30, 2013, respectively, primarily driven by a significant increase in deposits with banks, lower loan and investment securities yields, partially offset by lower long-term debt costs and deposit rates.
Other financial measures
The Firm also discloses the allowance for loan losses to total retained loans, excluding residential real estate purchased credit-impaired loans. For a further discussion of this credit metric, see Allowance for credit losses on pages
92–94
of this Form 10-Q.
16
|
BUSINESS SEGMENT RESULTS
|
||||
The Firm is managed on a line of business basis. The business segment financial results presented reflect the current organization of JPMorgan Chase. There are four major reportable business segments – Consumer & Community Banking, Corporate & Investment Bank, Commercial Banking and Asset Management. In addition, there is a Corporate/Private Equity segment.
The business segments are determined based on the products and services provided, or the type of customer served, and they reflect the manner in which financial information is currently evaluated by management. Results of these lines of business are presented on a managed basis. For a definition of managed basis, see Explanation and Reconciliation of the Firm’s use of non-GAAP financial measures, on pages
15–16
of this Form 10-Q.
Description of business segment reporting methodology
Results of the business segments are intended to reflect each segment as if it were essentially a stand-alone business. The management reporting process that derives business segment results allocates income and expense using market-based methodologies.
For a further discussion of those methodologies, see Business Segment Results – Description of business segment reporting methodology on pages 78–79 of JPMorgan Chase’s 2012 Annual Report. The Firm continues to assess the assumptions, methodologies and reporting classifications used for segment reporting, and further refinements may be implemented in future periods.
Business segment capital allocation changes
Each business segment is allocated capital by taking into consideration stand-alone peer comparisons, regulatory capital requirements (as estimated under Basel III) and economic risk measures. The amount of capital assigned to each business is referred to as equity. Effective January 1, 2013, the Firm further refined the capital allocation framework to align it with the line of business structure described above, which had become effective in the fourth quarter of 2012. The increase in equity levels for the lines of businesses is largely driven by regulatory guidance on Basel III requirements, principally for CIB and CIO, and by anticipated business growth. For further information about these capital changes, see Line of business equity on pages
63–64
of this Form 10-Q.
17
Segment Results – Managed Basis
The following table summarizes the business segment results for the periods indicated.
|
Three months ended June 30,
|
Total net revenue
(a)
|
Total Noninterest expense
(a)
|
Pre-provision profit/(loss)
(a)
|
|||||||||||||||||||||||
|
(in millions)
|
2013
|
2012
|
Change
|
|
2013
|
2012
|
Change
|
2013
|
2012
|
Change
|
||||||||||||||||
|
Consumer & Community Banking
|
$
|
12,015
|
|
$
|
12,450
|
|
(3
|
)%
|
$
|
6,864
|
|
$
|
6,837
|
|
—
|
%
|
$
|
5,151
|
|
$
|
5,613
|
|
(8
|
)%
|
||
|
Corporate & Investment Bank
|
9,876
|
|
8,986
|
|
10
|
|
5,742
|
|
5,293
|
|
8
|
|
4,134
|
|
3,693
|
|
12
|
|
||||||||
|
Commercial Banking
|
1,728
|
|
1,691
|
|
2
|
|
652
|
|
591
|
|
10
|
|
1,076
|
|
1,100
|
|
(2
|
)
|
||||||||
|
Asset Management
|
2,725
|
|
2,364
|
|
15
|
|
1,892
|
|
1,701
|
|
11
|
|
833
|
|
663
|
|
26
|
|
||||||||
|
Corporate/Private Equity
|
(386
|
)
|
(2,599
|
)
|
85
|
|
716
|
|
544
|
|
32
|
|
(1,102
|
)
|
(3,143
|
)
|
65
|
|
||||||||
|
Total
|
$
|
25,958
|
|
$
|
22,892
|
|
13
|
%
|
$
|
15,866
|
|
$
|
14,966
|
|
6
|
%
|
$
|
10,092
|
|
$
|
7,926
|
|
27
|
%
|
||
|
Three months ended June 30,
|
Provision for credit losses
|
Net income/(loss)
(a)
|
Return on common equity
|
|||||||||||||||||||
|
(in millions, except ratios)
|
2013
|
2012
|
Change
|
2013
|
2012
|
Change
|
2013
|
2012
|
||||||||||||||
|
Consumer & Community Banking
|
$
|
(19
|
)
|
$
|
179
|
|
NM
|
|
$
|
3,089
|
|
$
|
3,282
|
|
(6
|
)%
|
27
|
%
|
31
|
%
|
||
|
Corporate & Investment Bank
|
(6
|
)
|
29
|
|
NM
|
|
2,838
|
|
2,376
|
|
19
|
|
20
|
|
20
|
|
||||||
|
Commercial Banking
|
44
|
|
(17
|
)
|
NM
|
|
621
|
|
673
|
|
(8
|
)
|
18
|
|
28
|
|
||||||
|
Asset Management
|
23
|
|
34
|
|
(32
|
)%
|
500
|
|
391
|
|
28
|
|
22
|
|
22
|
|
||||||
|
Corporate/Private Equity
|
5
|
|
(11
|
)
|
NM
|
|
(552
|
)
|
(1,762
|
)
|
69
|
|
NM
|
|
NM
|
|
||||||
|
Total
|
$
|
47
|
|
$
|
214
|
|
(78
|
)%
|
$
|
6,496
|
|
$
|
4,960
|
|
31
|
%
|
13
|
%
|
11
|
%
|
||
|
Six months ended June 30,
|
Total net revenue
(a)
|
Total Noninterest expense
(a)
|
Pre-provision profit/(loss)
(a)
|
|||||||||||||||||||||||
|
(in millions)
|
2013
|
2012
|
Change
|
|
2013
|
2012
|
Change
|
2013
|
2012
|
Change
|
||||||||||||||||
|
Consumer & Community Banking
|
$
|
23,630
|
|
$
|
24,802
|
|
(5
|
)%
|
$
|
13,654
|
|
$
|
13,882
|
|
(2
|
)%
|
$
|
9,976
|
|
$
|
10,920
|
|
(9
|
)%
|
||
|
Corporate & Investment Bank
|
20,016
|
|
18,324
|
|
9
|
|
11,853
|
|
11,504
|
|
3
|
|
8,163
|
|
6,820
|
|
20
|
|
||||||||
|
Commercial Banking
|
3,401
|
|
3,348
|
|
2
|
|
1,296
|
|
1,189
|
|
9
|
|
2,105
|
|
2,159
|
|
(3
|
)
|
||||||||
|
Asset Management
|
5,378
|
|
4,734
|
|
14
|
|
3,768
|
|
3,430
|
|
10
|
|
1,610
|
|
1,304
|
|
23
|
|
||||||||
|
Corporate/Private Equity
|
(619
|
)
|
(1,559
|
)
|
60
|
|
718
|
|
3,306
|
|
(78
|
)
|
(1,337
|
)
|
(4,865
|
)
|
73
|
|
||||||||
|
Total
|
$
|
51,806
|
|
$
|
49,649
|
|
4
|
%
|
$
|
31,289
|
|
$
|
33,311
|
|
(6
|
)%
|
$
|
20,517
|
|
$
|
16,338
|
|
26
|
%
|
||
|
Six months ended June 30,
|
Provision for credit losses
|
Net income/(loss)
(a)
|
Return on common equity
|
|||||||||||||||||||
|
(in millions, except ratios)
|
2013
|
2012
|
Change
|
2013
|
2012
|
Change
|
2013
|
2012
|
||||||||||||||
|
Consumer & Community Banking
|
$
|
530
|
|
$
|
821
|
|
(35
|
)%
|
$
|
5,675
|
|
$
|
6,207
|
|
(9
|
)%
|
25
|
%
|
29
|
%
|
||
|
Corporate & Investment Bank
|
5
|
|
26
|
|
(81
|
)
|
5,448
|
|
4,409
|
|
24
|
|
19
|
|
19
|
|
||||||
|
Commercial Banking
|
83
|
|
60
|
|
38
|
|
1,217
|
|
1,264
|
|
(4
|
)
|
18
|
|
27
|
|
||||||
|
Asset Management
|
44
|
|
53
|
|
(17
|
)
|
987
|
|
777
|
|
27
|
|
22
|
|
22
|
|
||||||
|
Corporate/Private Equity
|
2
|
|
(20
|
)
|
NM
|
|
(302
|
)
|
(2,773
|
)
|
89
|
|
NM
|
|
NM
|
|
||||||
|
Total
|
$
|
664
|
|
$
|
940
|
|
(29
|
)%
|
$
|
13,025
|
|
$
|
9,884
|
|
32
|
%
|
13
|
%
|
11
|
%
|
||
|
(a)
|
For the 2012 periods, certain income statement line items were revised to reflect the transfer of certain functions and staff from Corporate/Private Equity to CCB, effective January 1, 2013.
|
18
|
CONSUMER & COMMUNITY BANKING
|
||||
For a discussion of the business profile on CCB, see pages 80–91 of JPMorgan Chase’s 2012 Annual Report and the Introduction on page
4
of this Form 10-Q.
|
Selected income statement data
(a)
|
|||||||||||||||||||||
|
|
Three months ended June 30,
|
Six months ended June 30,
|
|||||||||||||||||||
|
(in millions, except ratios)
|
2013
|
2012
|
Change
|
2013
|
2012
|
Change
|
|||||||||||||||
|
Revenue
|
|||||||||||||||||||||
|
Lending- and deposit-related fees
|
$
|
727
|
|
$
|
782
|
|
(7
|
)%
|
$
|
1,450
|
|
$
|
1,535
|
|
(6
|
)%
|
|||||
|
Asset management, administration and commissions
|
561
|
|
540
|
|
4
|
|
1,094
|
|
1,075
|
|
2
|
|
|||||||||
|
Mortgage fees and related income
|
1,819
|
|
2,265
|
|
(20
|
)
|
3,269
|
|
4,273
|
|
(23
|
)
|
|||||||||
|
Card income
|
1,445
|
|
1,359
|
|
6
|
|
2,807
|
|
2,622
|
|
7
|
|
|||||||||
|
All other income
|
369
|
|
343
|
|
8
|
|
707
|
|
770
|
|
(8
|
)
|
|||||||||
|
Noninterest revenue
|
4,921
|
|
5,289
|
|
(7
|
)
|
9,327
|
|
10,275
|
|
(9
|
)
|
|||||||||
|
Net interest income
|
7,094
|
|
7,161
|
|
(1
|
)
|
14,303
|
|
14,527
|
|
(2
|
)
|
|||||||||
|
Total net revenue
|
12,015
|
|
12,450
|
|
(3
|
)
|
23,630
|
|
24,802
|
|
(5
|
)
|
|||||||||
|
Provision for credit losses
|
(19
|
)
|
179
|
|
NM
|
|
530
|
|
821
|
|
(35
|
)
|
|||||||||
|
Noninterest expense
|
|||||||||||||||||||||
|
Compensation expense
|
2,966
|
|
2,917
|
|
2
|
|
5,972
|
|
5,833
|
|
2
|
|
|||||||||
|
Noncompensation expense
|
3,789
|
|
3,776
|
|
—
|
|
7,465
|
|
7,758
|
|
(4
|
)
|
|||||||||
|
Amortization of intangibles
|
109
|
|
144
|
|
(24
|
)
|
217
|
|
291
|
|
(25
|
)
|
|||||||||
|
Total noninterest expense
|
6,864
|
|
6,837
|
|
—
|
|
13,654
|
|
13,882
|
|
(2
|
)
|
|||||||||
|
Income before income tax expense
|
5,170
|
|
5,434
|
|
(5
|
)
|
9,446
|
|
10,099
|
|
(6
|
)
|
|||||||||
|
Income tax expense
|
2,081
|
|
2,152
|
|
(3
|
)
|
3,771
|
|
3,892
|
|
(3
|
)
|
|||||||||
|
Net income
|
$
|
3,089
|
|
$
|
3,282
|
|
(6
|
)%
|
$
|
5,675
|
|
$
|
6,207
|
|
(9
|
)%
|
|||||
|
Financial ratios
|
|||||||||||||||||||||
|
Return on common equity
|
27
|
%
|
31
|
%
|
25
|
%
|
29
|
%
|
|||||||||||||
|
Overhead ratio
|
57
|
|
55
|
|
58
|
|
56
|
|
|||||||||||||
|
(a)
|
For the 2012 periods, certain income statement line items (predominantly net interest income, compensation and noncompensation expense) were revised to reflect the transfer of certain technology and operations, as well as real estate-related functions and staff, from Corporate/Private Equity to CCB, effective January 1, 2013.
|
Quarterly results
Consumer & Community Banking net income was
$3.1 billion
, a decrease of
$193 million
, or
6%
, compared with the prior year, due to lower net revenue and higher noninterest expense, partially offset by lower provision for credit losses.
Net revenue was
$12.0 billion
, a decrease of
$435 million
, or
3%
, compared with the prior year. Net interest income was
$7.1 billion
, down
$67 million
, or
1%
, driven by lower deposit margins and lower loan balances due to portfolio runoff, largely offset by higher deposit balances. Noninterest revenue was
$4.9 billion
, a decrease of
$368 million
, or
7%
, driven by lower mortgage fees and related income, partially offset by higher merchant servicing revenue, auto lease income and net interchange income.
The provision for credit losses was a benefit of
$19 million
, compared with a provision for credit losses of
$179 million
in the prior year. The current-quarter provision reflected a
$1.5 billion
reduction in the allowance for loan losses and total net charge-offs of
$1.5 billion
. The prior-year provision reflected a
$2.1 billion
reduction in the allowance for loan losses and total net charge-offs of
$2.3 billion
. For
more information, including net charge-off amounts and rates, see Consumer Credit Portfolio on pages
74–83
of this Form 10-Q.
Noninterest expense was
$6.9 billion
, an increase of
$27 million
from the prior year, driven by continued investments in the business, offset by lower mortgage servicing expense and lower remediation expense, inclusive of a current-quarter charge, related to an exited non-core product.
Year-to-date results
Consumer & Community Banking net income was
$5.7 billion
, a decrease of
$532 million
, or
9%
, compared with the prior year, due to lower net revenue, partially offset by lower provision for credit losses and noninterest expense.
Net revenue was
$23.6 billion
, a decrease of
$1.2 billion
, or
5%
, compared with the prior year. Net interest income was
$14.3 billion
, down
$224 million
, or
2%
, driven by lower deposit margins and lower loan balances due to portfolio runoff, largely offset by higher deposit balances. Noninterest revenue was
$9.3 billion
, a decrease of
19
$948 million
, or
9%
, driven by lower mortgage fees and related income.
The provision for credit losses was
$530 million
compared with
$821 million
in the prior year. The current-year provision reflected a
$2.7 billion
reduction in the allowance for loan losses and total net charge-offs of
$3.2 billion
. The prior-year provision reflected a
$3.9 billion
reduction in the allowance for loan losses and total net charge-offs of
$4.7 billion
. For more information, including net charge-off
amounts and rates, see Consumer Credit Portfolio on pages
74–83
of this Form 10-Q.
Noninterest expense was
$13.7 billion
, a decrease of
$228 million
, or
2%
, compared with the prior year driven by lower mortgage servicing expense and lower remediation expense, inclusive of a current-period charge, related to an exited non-core product, largely offset by continued investments in the business.
|
Selected metrics
|
|||||||||||||||||||||
|
As of or for the three
months ended June 30,
|
As of or for the six
months ended June 30,
|
||||||||||||||||||||
|
(in millions, except headcount)
|
2013
|
2012
|
Change
|
2013
|
2012
|
Change
|
|||||||||||||||
|
Selected balance sheet data (period-end)
(a)
|
|||||||||||||||||||||
|
Total assets
|
$
|
460,642
|
|
$
|
466,650
|
|
(1
|
)%
|
$
|
460,642
|
|
$
|
466,650
|
|
(1
|
)%
|
|||||
|
Loans:
|
|||||||||||||||||||||
|
Loans retained
|
392,067
|
|
408,066
|
|
(4
|
)
|
392,067
|
|
408,066
|
|
(4
|
)
|
|||||||||
|
Loans held-for-sale and loans at fair value
(b)
|
15,274
|
|
14,366
|
|
6
|
|
15,274
|
|
14,366
|
|
6
|
|
|||||||||
|
Total loans
|
407,341
|
|
422,432
|
|
(4
|
)
|
407,341
|
|
422,432
|
|
(4
|
)
|
|||||||||
|
Deposits
|
456,814
|
|
415,564
|
|
10
|
|
456,814
|
|
415,564
|
|
10
|
|
|||||||||
|
Equity
|
46,000
|
|
43,000
|
|
7
|
|
46,000
|
|
43,000
|
|
7
|
|
|||||||||
|
Selected balance sheet data (average)
(a)
|
|||||||||||||||||||||
|
Total assets
|
$
|
457,644
|
|
$
|
469,296
|
|
(2
|
)
|
$
|
460,569
|
|
$
|
472,079
|
|
(2
|
)
|
|||||
|
Loans:
|
|||||||||||||||||||||
|
Loans retained
|
392,935
|
|
410,774
|
|
(4
|
)
|
395,014
|
|
414,396
|
|
(5
|
)
|
|||||||||
|
Loans held-for-sale and loans at fair value
(b)
|
18,199
|
|
18,476
|
|
(1
|
)
|
19,682
|
|
17,459
|
|
13
|
|
|||||||||
|
Total loans
|
411,134
|
|
429,250
|
|
(4
|
)
|
414,696
|
|
431,855
|
|
(4
|
)
|
|||||||||
|
Deposits
|
453,586
|
|
411,292
|
|
10
|
|
447,494
|
|
406,453
|
|
10
|
|
|||||||||
|
Equity
|
46,000
|
|
43,000
|
|
7
|
|
46,000
|
|
43,000
|
|
7
|
|
|||||||||
|
Headcount
(a)
|
157,886
|
|
167,480
|
|
(6
|
)%
|
157,886
|
|
167,480
|
|
(6
|
)%
|
|||||||||
|
(a)
|
For the 2012 periods, certain balance sheet line items (predominantly total assets) as well as headcount were revised to reflect the transfer of certain technology and operations, as well as real estate-related functions and staff, from Corporate/Private Equity to CCB, effective January 1, 2013.
|
|
(b)
|
Predominantly consists of prime mortgages originated with the intent to sell that are accounted for at fair value and classified as trading assets on the Consolidated Balance Sheets.
|
20
|
Selected metrics
|
|||||||||||||||||||||
|
As of or for the three months ended June 30,
|
As of or for the six months ended June 30,
|
||||||||||||||||||||
|
(in millions, except ratios and where otherwise noted)
|
2013
|
2012
|
Change
|
2013
|
2012
|
Change
|
|||||||||||||||
|
Credit data and quality statistics
|
|||||||||||||||||||||
|
Net charge-offs
|
$
|
1,481
|
|
$
|
2,280
|
|
(35
|
)%
|
$
|
3,180
|
|
$
|
4,672
|
|
(32
|
)%
|
|||||
|
Nonaccrual loans:
|
|||||||||||||||||||||
|
Nonaccrual loans retained
|
8,540
|
|
8,016
|
|
7
|
|
8,540
|
|
8,016
|
|
7
|
|
|||||||||
|
Nonaccrual loans held-for-sale and loans at fair value
|
41
|
|
98
|
|
(58
|
)
|
41
|
|
98
|
|
(58
|
)
|
|||||||||
|
Total nonaccrual loans
(a)(b)(c)(d)
|
8,581
|
|
8,114
|
|
6
|
|
8,581
|
|
8,114
|
|
6
|
|
|||||||||
|
Nonperforming assets
(a)(b)(c)(d)
|
9,212
|
|
8,864
|
|
4
|
|
9,212
|
|
8,864
|
|
4
|
|
|||||||||
|
Allowance for loan losses
|
15,095
|
|
19,405
|
|
(22
|
)
|
15,095
|
|
19,405
|
|
(22
|
)
|
|||||||||
|
Net charge-off rate
(e)
|
1.51
|
%
|
2.23
|
%
|
1.62
|
%
|
2.27
|
%
|
|||||||||||||
|
Net charge-off rate,
excluding PCI loans
(e)
|
1.77
|
|
2.64
|
|
1.90
|
|
2.68
|
|
|||||||||||||
|
Allowance for loan losses to period-end loans retained
|
3.85
|
|
4.76
|
|
3.85
|
|
4.76
|
|
|||||||||||||
|
Allowance for loan losses to period-end loans retained,
excluding PCI loans
(f)
|
2.80
|
|
3.96
|
|
2.80
|
|
3.96
|
|
|||||||||||||
|
Allowance for loan losses to nonaccrual loans retained, excluding credit card
(a)(d)(f)
|
58
|
|
102
|
|
58
|
|
102
|
|
|||||||||||||
|
Nonaccrual loans to total period-end loans, excluding credit card
(d)
|
3.03
|
|
2.72
|
|
3.03
|
|
2.72
|
|
|||||||||||||
|
Nonaccrual loans to total period-end loans, excluding credit card and PCI loans
(a)(d)
|
3.79
|
|
3.45
|
|
3.79
|
|
3.45
|
|
|||||||||||||
|
Business metrics
|
|||||||||||||||||||||
|
Number of:
|
|||||||||||||||||||||
|
Branches
|
5,657
|
|
5,563
|
|
2
|
|
5,657
|
|
5,563
|
|
2
|
|
|||||||||
|
ATMs
|
19,075
|
|
18,132
|
|
5
|
|
19,075
|
|
18,132
|
|
5
|
|
|||||||||
|
Active online customers (in thousands)
|
32,245
|
|
30,361
|
|
6
|
|
32,245
|
|
30,361
|
|
6
|
|
|||||||||
|
Active mobile customers (in thousands)
|
14,013
|
|
10,646
|
|
32
|
%
|
14,013
|
|
10,646
|
|
32
|
%
|
|||||||||
|
(a)
|
Excludes PCI loans. Because the Firm is recognizing interest income on each pool of PCI loans, they are all considered to be performing.
|
|
(b)
|
Certain mortgage loans originated with the intent to sell are classified as trading assets on the Consolidated Balance Sheets.
|
|
(c)
|
At June 30, 2013 and 2012 nonperforming assets excluded: (1) mortgage loans insured by U.S. government agencies of $10.1 billion and $11.9 billion, respectively, that are 90 or more days past due; (2) real estate owned insured by U.S. government agencies of $1.8 billion and $1.3 billion, respectively; and (3) student loans insured by U.S. government agencies under the Federal Family Education Loan Program (“FFELP”) of $488 million and $547 million, respectively, that are 90 or more days past due. These amounts were excluded as reimbursement of insured amounts is proceeding normally.
|
|
(d)
|
Nonaccrual loans included $1.9 billion of Chapter 7 loans at June 30, 2013.
|
|
(e)
|
Loans held-for-sale and loans accounted for at fair value were excluded when calculating the net charge-off rate.
|
|
(f)
|
The allowance for loan losses for PCI loans was $5.7 billion at both June 30, 2013 and 2012; this amount was also excluded from the applicable ratios.
|
21
Consumer & Business Banking
|
Selected financial statement data
(a)
|
|||||||||||||||||||||
|
|
As of or for the three months ended June 30,
|
As of or for the six months ended June 30,
|
|||||||||||||||||||
|
(in millions, except ratios)
|
2013
|
2012
|
Change
|
2013
|
2012
|
Change
|
|||||||||||||||
|
Revenue
|
|||||||||||||||||||||
|
Lending- and deposit-related fees
|
$
|
717
|
|
$
|
770
|
|
(7
|
)%
|
$
|
1,428
|
|
$
|
1,512
|
|
(6
|
)%
|
|||||
|
Asset management, administration and commissions
|
454
|
|
415
|
|
9
|
|
880
|
|
827
|
|
6
|
|
|||||||||
|
Card income
|
378
|
|
344
|
|
10
|
|
727
|
|
659
|
|
10
|
|
|||||||||
|
All other income
|
124
|
|
126
|
|
(2
|
)
|
243
|
|
253
|
|
(4
|
)
|
|||||||||
|
Noninterest revenue
|
1,673
|
|
1,655
|
|
1
|
|
3,278
|
|
3,251
|
|
1
|
|
|||||||||
|
Net interest income
|
2,614
|
|
2,661
|
|
(2
|
)
|
5,186
|
|
5,314
|
|
(2
|
)
|
|||||||||
|
Total net revenue
|
4,287
|
|
4,316
|
|
(1
|
)
|
8,464
|
|
8,565
|
|
(1
|
)
|
|||||||||
|
Provision for credit losses
|
74
|
|
(2
|
)
|
NM
|
|
135
|
|
94
|
|
44
|
|
|||||||||
|
Noninterest expense
|
3,042
|
|
2,757
|
|
10
|
|
6,083
|
|
5,630
|
|
8
|
|
|||||||||
|
Income before income tax expense
|
1,171
|
|
1,561
|
|
(25
|
)
|
2,246
|
|
2,841
|
|
(21
|
)
|
|||||||||
|
Net income
|
$
|
698
|
|
$
|
931
|
|
(25
|
)
|
$
|
1,339
|
|
$
|
1,694
|
|
(21
|
)
|
|||||
|
Return on common equity
|
25
|
%
|
42
|
%
|
25
|
%
|
38
|
%
|
|||||||||||||
|
Overhead ratio
|
71
|
|
64
|
|
72
|
|
66
|
|
|||||||||||||
|
Overhead ratio, excluding core deposit intangibles
(b)
|
70
|
|
63
|
|
71
|
|
65
|
|
|||||||||||||
|
Equity (period-end and average)
|
$
|
11,000
|
|
$
|
9,000
|
|
22
|
%
|
$
|
11,000
|
|
$
|
9,000
|
|
22
|
%
|
|||||
|
(a)
|
For the 2012 periods, certain income statement line items were revised to reflect the transfer of certain functions and staff from Corporate/Private Equity to CCB, effective January 1, 2013.
|
|
(b)
|
Consumer & Business Banking (“CBB”) uses the overhead ratio (excluding the amortization of core deposit intangibles (“CDI”)), a non-GAAP financial measure, to evaluate the underlying expense trends of the business. Including CDI amortization expense in the overhead ratio calculation would result in a higher overhead ratio in the earlier years and a lower overhead ratio in later years; this method would therefore result in an improving overhead ratio over time, all things remaining equal. This non-GAAP ratio excluded CBB’s CDI amortization expense related to prior business combination transactions of $41 million and $50 million for the three months ended June 30, 2013 and 2012, respectively, and $82 million and $101 million for the six months ended June 30, 2013 and 2012, respectively.
|
Quarterly results
Consumer & Business Banking
net income was
$698 million
, a decrease of
$233 million
, or
25%
, compared with the prior year, due to higher noninterest expense, a small benefit in the prior-year provision for credit losses and lower net revenue.
Net revenue was
$4.3 billion
, down
1%
compared with the prior year. Net interest income was
$2.6 billion
, down
2%
compared with the prior year, driven by lower deposit margins, predominantly offset by higher deposit balances. Noninterest revenue was
$1.7 billion
, an increase of
1%
, driven by higher debit card revenue and investment sales revenue, predominantly offset by lower deposit-related fees.
The provision for credit losses and net charge-offs were both
$74 million
, compared with a benefit of
$2 million
and net charge-offs of
$98 million
in the prior year.
Noninterest expense was
$3.0 billion
, up
10%
from the prior year, primarily driven by investments in the business and certain adjustments in the prior year.
Year-to-date results
Consumer & Business Banking
net income was
$1.3 billion
, a decrease of
$355 million
, or
21%
, compared with the prior year, due to higher noninterest expense, lower net revenue and a higher provision for credit losses.
Net revenue was
$8.5 billion
, down
1%
compared with the prior year. Net interest income was
$5.2 billion
, down
2%
compared with the prior year, driven by lower deposit margins, predominantly offset by the impact of higher deposit balances. Noninterest revenue was
$3.3 billion
, an increase of
1%
, driven by higher debit card revenue and investment sales revenue, largely offset by lower deposit-related fees.
The provision for credit losses and net charge-offs were both
$135 million
, compared with a provision for credit losses of
$94 million
and net charge-offs of
$194 million
in the prior year.
Noninterest expense was
$6.1 billion
, up
8%
from the prior year, primarily driven by investments in the business and certain adjustments in the prior year.
22
|
Selected metrics
|
|||||||||||||||||||||
|
|
As of or for the three
months ended June 30,
|
As of or for the six
months ended June 30,
|
|||||||||||||||||||
|
(in millions, except ratios and where otherwise noted)
|
2013
|
2012
|
Change
|
2013
|
2012
|
Change
|
|||||||||||||||
|
Business metrics
|
|||||||||||||||||||||
|
Business banking origination volume
|
$
|
1,317
|
|
$
|
1,787
|
|
(26
|
)%
|
$
|
2,551
|
|
$
|
3,327
|
|
(23
|
)%
|
|||||
|
Period-end loans
|
18,950
|
|
18,218
|
|
4
|
|
18,950
|
|
18,218
|
|
4
|
|
|||||||||
|
Period-end deposits:
(a)
|
|||||||||||||||||||||
|
Checking
|
179,801
|
|
156,482
|
|
15
|
|
179,801
|
|
156,482
|
|
15
|
|
|||||||||
|
Savings
|
228,879
|
|
203,910
|
|
12
|
|
228,879
|
|
203,910
|
|
12
|
|
|||||||||
|
Time and other
|
29,255
|
|
34,406
|
|
(15
|
)
|
29,255
|
|
34,406
|
|
(15
|
)
|
|||||||||
|
Total period-end deposits
|
437,935
|
|
394,798
|
|
11
|
|
437,935
|
|
394,798
|
|
11
|
|
|||||||||
|
Average loans
|
18,758
|
|
17,934
|
|
5
|
|
18,734
|
|
17,800
|
|
5
|
|
|||||||||
|
Average deposits:
(a)
|
|||||||||||||||||||||
|
Checking
|
175,496
|
|
151,770
|
|
16
|
|
172,115
|
|
149,632
|
|
15
|
|
|||||||||
|
Savings
|
227,453
|
|
202,685
|
|
12
|
|
224,440
|
|
199,942
|
|
12
|
|
|||||||||
|
Time and other
|
29,840
|
|
35,099
|
|
(15
|
)
|
30,432
|
|
35,609
|
|
(15
|
)
|
|||||||||
|
Total average deposits
|
432,789
|
|
389,554
|
|
11
|
|
426,987
|
|
385,183
|
|
11
|
|
|||||||||
|
Deposit margin
|
2.31
|
%
|
2.62
|
%
|
2.34
|
%
|
2.65
|
%
|
|||||||||||||
|
Average assets
(a)
|
$
|
37,250
|
|
$
|
33,763
|
|
10
|
|
$
|
36,779
|
|
$
|
34,030
|
|
8
|
|
|||||
|
Credit data and quality statistics
|
|||||||||||||||||||||
|
Net charge-offs
|
$
|
74
|
|
$
|
98
|
|
(24
|
)
|
$
|
135
|
|
$
|
194
|
|
(30
|
)
|
|||||
|
Net charge-off rate
|
1.58
|
%
|
2.20
|
%
|
1.45
|
%
|
2.19
|
%
|
|||||||||||||
|
Allowance for loan losses
|
$
|
697
|
|
$
|
698
|
|
—
|
|
$
|
697
|
|
$
|
698
|
|
—
|
|
|||||
|
Nonperforming assets
|
461
|
|
597
|
|
(23
|
)
|
461
|
|
597
|
|
(23
|
)
|
|||||||||
|
Retail branch business metrics
|
|||||||||||||||||||||
|
Investment sales volume
|
$
|
9,463
|
|
$
|
6,171
|
|
53
|
|
$
|
18,683
|
|
$
|
12,769
|
|
46
|
|
|||||
|
Client investment assets
|
171,925
|
|
147,641
|
|
16
|
|
171,925
|
|
147,641
|
|
16
|
|
|||||||||
|
% managed accounts
|
33
|
%
|
26
|
%
|
33
|
%
|
26
|
%
|
|||||||||||||
|
Number of:
|
|||||||||||||||||||||
|
Chase Private Client locations
|
1,691
|
|
738
|
|
129
|
|
1,691
|
|
738
|
|
129
|
|
|||||||||
|
Personal bankers
|
22,825
|
|
24,052
|
|
(5
|
)
|
22,825
|
|
24,052
|
|
(5
|
)
|
|||||||||
|
Sales specialists
|
6,326
|
|
6,179
|
|
2
|
|
6,326
|
|
6,179
|
|
2
|
|
|||||||||
|
Client advisors
|
3,024
|
|
3,075
|
|
(2
|
)
|
3,024
|
|
3,075
|
|
(2
|
)
|
|||||||||
|
Chase Private Clients
|
165,331
|
|
50,649
|
|
226
|
|
165,331
|
|
50,649
|
|
226
|
|
|||||||||
|
Accounts (in thousands)
(b)
|
28,937
|
|
27,406
|
|
6
|
%
|
28,937
|
|
27,406
|
|
6
|
%
|
|||||||||
|
(a)
|
For the 2012 periods, certain balance sheet line items were revised to reflect the transfer of certain functions and staff from Corporate/Private Equity to CCB, effective January 1, 2013.
|
|
(b)
|
Includes checking accounts and Chase Liquid
SM
cards.
|
23
Mortgage Banking
|
Selected financial statement data
|
|||||||||||||||||||||
|
As of or for the three months ended June 30,
|
As of or for the six months ended June 30,
|
||||||||||||||||||||
|
(in millions, except ratios)
|
2013
|
2012
|
Change
|
2013
|
2012
|
Change
|
|||||||||||||||
|
Revenue
|
|||||||||||||||||||||
|
Mortgage fees and related income
|
$
|
1,819
|
|
$
|
2,265
|
|
(20
|
)%
|
$
|
3,269
|
|
$
|
4,273
|
|
(23
|
)%
|
|||||
|
All other income
|
101
|
|
123
|
|
(18
|
)
|
194
|
|
254
|
|
(24
|
)
|
|||||||||
|
Noninterest revenue
|
1,920
|
|
2,388
|
|
(20
|
)
|
3,463
|
|
4,527
|
|
(24
|
)
|
|||||||||
|
Net interest income
|
1,138
|
|
1,221
|
|
(7
|
)
|
2,313
|
|
2,471
|
|
(6
|
)
|
|||||||||
|
Total net revenue
|
3,058
|
|
3,609
|
|
(15
|
)
|
5,776
|
|
6,998
|
|
(17
|
)
|
|||||||||
|
Provision for credit losses
|
(657
|
)
|
(553
|
)
|
(19
|
)
|
(855
|
)
|
(745
|
)
|
(15
|
)
|
|||||||||
|
Noninterest expense
|
1,834
|
|
1,984
|
|
(8
|
)
|
3,640
|
|
4,127
|
|
(12
|
)
|
|||||||||
|
Income before income tax expense
|
1,881
|
|
2,178
|
|
(14
|
)
|
2,991
|
|
3,616
|
|
(17
|
)
|
|||||||||
|
Net income
|
$
|
1,142
|
|
$
|
1,321
|
|
(14
|
)
|
$
|
1,815
|
|
$
|
2,300
|
|
(21
|
)
|
|||||
|
Return on common equity
|
23
|
%
|
30
|
%
|
19
|
%
|
26
|
%
|
|||||||||||||
|
Overhead ratio
|
60
|
|
55
|
|
63
|
|
59
|
|
|||||||||||||
|
Equity (period-end and average)
|
$
|
19,500
|
|
$
|
17,500
|
|
11
|
%
|
$
|
19,500
|
|
$
|
17,500
|
|
11
|
%
|
|||||
Quarterly results
Mortgage Banking
net income was
$1.1 billion
, a decrease of
$179 million
, or
14%
, compared with prior year, driven by lower net revenue, partially offset by lower noninterest expense and lower provision for credit losses.
Net revenue was
$3.1 billion
, a decrease of
$551 million
compared with the prior year. Net interest income was
$1.1 billion
, a decrease of
$83 million
, or
7%
, driven by lower loan balances due to portfolio runoff. Noninterest revenue was
$1.9 billion
, a decrease of
$468 million
, driven by lower mortgage fees and related income.
The provision for credit losses was a benefit of
$657 million
, compared with a benefit of
$553 million
in the prior year. The current quarter reflected a
$950 million
reduction in the allowance for loan losses due to lower estimated losses reflecting continued home price improvement and favorable delinquency trends across all products, compared with a reduction of
$1.25 billion
in the prior year.
Noninterest expense was
$1.8 billion
, a decrease of
$150 million
from with the prior year, due to lower servicing expenses, including lower costs associated with the Independent Foreclosure Review, partially offset by higher headcount-related expense as Mortgage Production built origination capacity.
Year-to-date results
Mortgage Banking
net income was
$1.8 billion
, a decrease of
$485 million
, or
21%
, compared with prior year, driven by lower net revenue, partially offset by lower noninterest expense and lower provision for credit losses.
Net revenue was
$5.8 billion
, a decrease of
$1.2 billion
compared with the prior year. Net interest income was
$2.3 billion
, a decrease of
$158 million
, or
6%
, driven by lower loan balances due to portfolio runoff. Noninterest revenue was
$3.5 billion
, a decrease of
$1.1 billion
, driven by lower mortgage fees and related income.
The provision for credit losses was a benefit of
$855 million
, compared with a benefit of
$745 million
in the prior year. The current year reflected a
$1.6 billion
reduction in the allowance for loan losses due to lower estimated losses reflecting continued home price improvement and favorable delinquency trends across all products, compared with a reduction of
$2.25 billion
in the prior year.
Noninterest expense was
$3.6 billion
, a decrease of
$487 million
from the prior year, due to lower servicing expenses, including lower costs associated with the Independent Foreclosure Review, partially offset by higher headcount-related expense as Mortgage Production built origination capacity.
24
|
Functional results
|
|||||||||||||||||||||
|
|
Three months ended June 30,
|
Six months ended June 30,
|
|||||||||||||||||||
|
(in millions, except ratios)
|
2013
|
2012
|
Change
|
2013
|
2012
|
Change
|
|||||||||||||||
|
Mortgage Production
|
|||||||||||||||||||||
|
Production revenue
|
$
|
1,064
|
|
$
|
1,362
|
|
(22
|
)%
|
$
|
2,059
|
|
$
|
2,794
|
|
(26
|
)%
|
|||||
|
Production-related net interest & other income
|
222
|
|
199
|
|
12
|
|
445
|
|
386
|
|
15
|
|
|||||||||
|
Production-related revenue, excluding repurchase losses
|
1,286
|
|
1,561
|
|
(18
|
)
|
2,504
|
|
3,180
|
|
(21
|
)
|
|||||||||
|
Production expense
(a)
|
720
|
|
620
|
|
16
|
|
1,430
|
|
1,193
|
|
20
|
|
|||||||||
|
Income, excluding repurchase losses
|
566
|
|
941
|
|
(40
|
)
|
1,074
|
|
1,987
|
|
(46
|
)
|
|||||||||
|
Repurchase losses
|
16
|
|
(10
|
)
|
NM
|
|
(65
|
)
|
(312
|
)
|
79
|
|
|||||||||
|
Income before income tax expense
|
582
|
|
931
|
|
(37
|
)
|
1,009
|
|
1,675
|
|
(40
|
)
|
|||||||||
|
Mortgage Servicing
|
|||||||||||||||||||||
|
Loan servicing revenue
|
945
|
|
1,004
|
|
(6
|
)
|
1,881
|
|
2,043
|
|
(8
|
)
|
|||||||||
|
Servicing-related net interest & other income
|
110
|
|
108
|
|
2
|
|
210
|
|
220
|
|
(5
|
)
|
|||||||||
|
Servicing-related revenue
|
1,055
|
|
1,112
|
|
(5
|
)
|
2,091
|
|
2,263
|
|
(8
|
)
|
|||||||||
|
Changes in MSR asset fair value due to collection/realization of expected cash flows
|
(285
|
)
|
(327
|
)
|
13
|
|
(543
|
)
|
(678
|
)
|
20
|
|
|||||||||
|
Default servicing expense
|
475
|
|
705
|
|
(33
|
)
|
972
|
|
1,595
|
|
(39
|
)
|
|||||||||
|
Core servicing expense
|
240
|
|
248
|
|
(3
|
)
|
480
|
|
509
|
|
(6
|
)
|
|||||||||
|
Income/(loss), excluding MSR risk management
|
55
|
|
(168
|
)
|
NM
|
|
96
|
|
(519
|
)
|
NM
|
|
|||||||||
|
MSR risk management, including related net interest income/(expense)
|
78
|
|
233
|
|
(67
|
)
|
(64
|
)
|
424
|
|
NM
|
|
|||||||||
|
Income/(loss) before income tax expense/(benefit)
|
133
|
|
65
|
|
105
|
|
32
|
|
(95
|
)
|
NM
|
|
|||||||||
|
Real Estate Portfolios
|
|||||||||||||||||||||
|
Noninterest revenue
|
(34
|
)
|
13
|
|
NM
|
|
(51
|
)
|
21
|
|
NM
|
|
|||||||||
|
Net interest income
|
942
|
|
1,027
|
|
(8
|
)
|
1,904
|
|
2,100
|
|
(9
|
)
|
|||||||||
|
Total net revenue
|
908
|
|
1,040
|
|
(13
|
)
|
1,853
|
|
2,121
|
|
(13
|
)
|
|||||||||
|
Provision for credit losses
|
(662
|
)
|
(554
|
)
|
(19
|
)
|
(864
|
)
|
(746
|
)
|
(16
|
)
|
|||||||||
|
Noninterest expense
|
404
|
|
412
|
|
(2
|
)
|
767
|
|
831
|
|
(8
|
)
|
|||||||||
|
Income before income tax expense
|
1,166
|
|
1,182
|
|
(1
|
)
|
1,950
|
|
2,036
|
|
(4
|
)
|
|||||||||
|
Mortgage Banking income before income tax expense
|
$
|
1,881
|
|
$
|
2,178
|
|
(14
|
)
|
$
|
2,991
|
|
$
|
3,616
|
|
(17
|
)
|
|||||
|
Mortgage Banking net income
|
$
|
1,142
|
|
$
|
1,321
|
|
(14
|
)%
|
$
|
1,815
|
|
$
|
2,300
|
|
(21
|
)%
|
|||||
|
Overhead ratios
|
|||||||||||||||||||||
|
Mortgage Production
|
55
|
%
|
40
|
%
|
58
|
%
|
42
|
%
|
|||||||||||||
|
Mortgage Servicing
|
84
|
|
94
|
|
98
|
|
105
|
|
|||||||||||||
|
Real Estate Portfolios
|
44
|
|
40
|
|
41
|
|
39
|
|
|||||||||||||
|
(a)
|
Includes provision for credit losses associated with Mortgage Production.
|
25
|
Selected income statement data
|
|||||||||||||||||||||
|
|
Three months ended June 30,
|
Six months ended June 30,
|
|||||||||||||||||||
|
(in millions)
|
2013
|
2012
|
Change
|
2013
|
2012
|
Change
|
|||||||||||||||
|
Supplemental mortgage fees and related income details
|
|||||||||||||||||||||
|
Net production revenue:
|
|||||||||||||||||||||
|
Production revenue
|
$
|
1,064
|
|
$
|
1,362
|
|
(22
|
)%
|
$
|
2,059
|
|
$
|
2,794
|
|
(26
|
)%
|
|||||
|
Repurchase losses
|
16
|
|
(10
|
)
|
NM
|
|
(65
|
)
|
(312
|
)
|
79
|
|
|||||||||
|
Net production revenue
|
1,080
|
|
1,352
|
|
(20
|
)
|
1,994
|
|
2,482
|
|
(20
|
)
|
|||||||||
|
Net mortgage servicing revenue:
|
|
|
|
|
|||||||||||||||||
|
Operating revenue:
|
|
|
|
|
|||||||||||||||||
|
Loan servicing revenue
|
945
|
|
1,004
|
|
(6
|
)
|
1,881
|
|
2,043
|
|
(8
|
)
|
|||||||||
|
Changes in MSR asset fair value due to collection/realization of expected cash flows
|
(285
|
)
|
(327
|
)
|
13
|
|
(543
|
)
|
(678
|
)
|
20
|
|
|||||||||
|
Total operating revenue
|
660
|
|
677
|
|
(3
|
)
|
1,338
|
|
1,365
|
|
(2
|
)
|
|||||||||
|
Risk management:
|
|
|
|
||||||||||||||||||
|
Changes in MSR asset fair value due to market interest rates and other
(a)
|
1,072
|
|
(1,193
|
)
|
NM
|
|
1,618
|
|
(549
|
)
|
NM
|
|
|||||||||
|
Other changes in MSR asset fair value due to other inputs and assumptions in model
(b)
|
(36
|
)
|
76
|
|
NM
|
|
(273
|
)
|
28
|
|
NM
|
|
|||||||||
|
Changes in derivative fair value and other
|
(957
|
)
|
1,353
|
|
NM
|
|
(1,408
|
)
|
947
|
|
NM
|
|
|||||||||
|
Total risk management
|
79
|
|
236
|
|
(67
|
)
|
(63
|
)
|
426
|
|
NM
|
|
|||||||||
|
Total net mortgage servicing revenue
|
739
|
|
913
|
|
(19
|
)
|
1,275
|
|
1,791
|
|
(29
|
)
|
|||||||||
|
Mortgage fees and related income
|
$
|
1,819
|
|
$
|
2,265
|
|
(20
|
)%
|
$
|
3,269
|
|
$
|
4,273
|
|
(23
|
)%
|
|||||
|
(a)
|
Represents both the impact of changes in estimated future prepayments due to changes in market interest rates, and the difference between actual and expected prepayments.
|
|
(b)
|
Represents the aggregate impact of changes in model inputs and assumptions such as projected cash flows (e.g., cost to service), discount rates and changes in prepayments other than those attributable to changes in market interest rates (e.g., changes in prepayments due to changes in home prices).
|
Quarterly results
Mortgage Production
pretax income was
$582 million
, a decrease of
$349 million
from the prior year, reflecting lower revenue margins and higher expense, partially offset by higher volumes and lower repurchase losses. Mortgage production-related revenue, excluding repurchase losses, was
$1.3 billion
, a decrease of
$275 million
, or
18%
, from the prior year, reflecting lower revenue margins. Production expense was
$720 million
, an increase of
$100 million
from the prior year, driven by higher headcount-related expense as the business built origination capacity. Repurchase losses for the current quarter reflected a benefit of
$16 million
, compared with losses of
$10 million
in the prior year. The current quarter reflected a $185 million reduction in the repurchase liability and lower realized repurchase losses compared with prior year. For further information, see Mortgage repurchase liability on pages
55–59
of this Form 10-Q.
Mortgage Servicing
pretax income was
$133 million
, an increase of
$68 million
from the prior year. Mortgage servicing revenue, including changes to the MSR asset fair value, was $770 million, a decrease of $15 million, or 2%, from the prior year. MSR risk management income, including related net interest expense, was
$78 million
, compared with
$233 million
in the prior year, driven by the net impact of various changes in model inputs and assumptions. See Note 16 on pages
184–187
of this Form 10-Q for further information regarding changes in value of the MSR asset and related hedges. Servicing expense was
$715 million, a decrease of $238 million from the prior year, reflecting lower servicing headcount and lower costs associated with the Independent Foreclosure Review.
Real Estate Portfolios
pretax income was
$1.2 billion
, down
$16 million
from the prior year. Net revenue was
$908 million
, a decrease of
$132 million
, or
13%
, from the prior year. The decrease was largely driven by a decline in net interest income, resulting from lower loan balances due to portfolio runoff. The provision for credit losses was a benefit of
$662 million
, compared with a benefit of
$554 million
in the prior year. The current-quarter provision reflected a $950 million reduction in the allowance for loan losses due to lower estimated losses reflecting continued home price improvement and favorable delinquency trends, compared with a reduction of $1.25 billion in the prior year. Current-quarter net charge-offs totaled
$288 million
, compared with
$696 million
in the prior year. See Consumer Credit Portfolio on pages
74–83
of this Form 10-Q for the net charge-off amounts and rates. Noninterest expense was
$404 million
, a decrease of
$8 million
, or
2%
, compared with the prior year.
Year-to-date results
Mortgage Production
pretax income was
$1.0 billion
, a decrease of
$666 million
from the prior year, reflecting lower revenue margins and higher expense, partially offset by higher volumes and lower repurchase losses. Mortgage production-related revenue, excluding repurchase losses, was
$2.5 billion
, a decrease of
$676 million
, or
21%
, from the prior year, reflecting lower revenue margins, partially
26
offset by higher volumes. Production expense was
$1.4 billion
, an increase of
$237 million
from the prior year, driven by higher headcount-related expense as the business built origination capacity. Repurchase losses were
$65 million
, compared with
$312 million
in the prior year. The current year reflected a $285 million reduction in the repurchase liability and lower realized repurchase losses compared with prior year. For further information, see Mortgage repurchase liability on pages
55–59
of this Form 10-Q.
Mortgage Servicing
pretax income was
$32 million
, an increase of
$127 million
from the prior year. Mortgage servicing revenue, including changes to the MSR asset fair value was $1.5 billion, a decrease of $37 million, or 2%, from the prior year. MSR risk management, including related net interest expense, was a loss of
$64 million
, compared with income of
$424 million
in the prior year, driven by the net impact of various changes in model inputs and assumptions. See Note 16 on pages
184–187
of this Form 10-Q for further information regarding changes in value of the MSR asset and related hedges. Servicing expense was $1.5 billion, a decrease of $652 million from the prior year, reflecting lower costs associated with the Independent Foreclosure Review, lower servicing headcount and the impact of approximately $150 million for foreclosure-related matters in the prior year.
Real Estate Portfolios
pretax income was
$2.0 billion
, down
$86 million
from the prior year. Net revenue was
$1.9 billion
, a decrease of
$268 million
, or
13%
, from the prior year. The decrease was largely driven by a decline in net interest income, resulting from lower loan balances due to portfolio runoff. The provision for credit losses was a benefit of
$864 million
, compared with a benefit of
$746 million
in the prior year. The current-year provision reflected a $1.6 billion reduction in the allowance for loan losses due to lower estimated losses reflecting continued home price improvement and favorable delinquency trends, compared with a reduction of $2.25 billion in the prior year. Current-year net charge-offs totaled
$736 million
,
compared with
$1.5 billion
in the prior year. See Consumer Credit Portfolio on pages
74–83
of this Form 10-Q for the net charge-off amounts and rates. Noninterest expense was
$767 million
, a decrease of
$64 million
, or
8%
, compared with the prior year, primarily driven by lower foreclosed asset expense due to lower foreclosure inventory.
PCI Loans
Included within Real Estate Portfolios are PCI loans that the Firm acquired in the Washington Mutual transaction. For PCI loans, the excess of the undiscounted gross cash flows expected to be collected over the carrying value of the loans (the “accretable yield”) is accreted into interest income at a level rate of return over the expected life of the loans.
The net spread between the PCI loans and the related liabilities are expected to be relatively constant over time, except for any basis risk or other residual interest rate risk that remains and for certain changes in the accretable yield percentage (e.g., from extended loan liquidation periods and from prepayments). As of June 30, 2013, the remaining weighted-average life of the PCI loan portfolio is expected to be 8 years. The loan balances are expected to decline more rapidly over the next three to four years as the most troubled loans are liquidated, and more slowly thereafter as the remaining troubled borrowers have limited refinancing opportunities. Similarly, default and servicing expense are expected to be higher in the earlier years and decline over time as liquidations slow down.
To date the impact of the PCI loans on Real Estate Portfolios’ net income has been negative. This is largely due to the provision for loan losses recognized subsequent to their acquisition, and the higher level of default and servicing expense associated with the portfolio. Over time, the Firm expects that this portfolio will contribute positively to net income.
For further information, see Note 14, PCI loans, on pages
168–169
of this Form 10-Q.
27
|
Mortgage Production and Mortgage Servicing
|
|||||||||||||||||||||
|
Selected metrics
|
|||||||||||||||||||||
|
|
As of or for the three
months ended June 30,
|
As of or for the six
months ended June 30,
|
|||||||||||||||||||
|
(in millions, except ratios)
|
2013
|
2012
|
Change
|
2013
|
2012
|
Change
|
|||||||||||||||
|
Selected balance sheet data
|
|||||||||||||||||||||
|
Period-end loans:
|
|||||||||||||||||||||
|
Prime mortgage, including option ARMs
(a)
|
$
|
15,567
|
|
$
|
17,454
|
|
(11
|
)%
|
$
|
15,567
|
|
$
|
17,454
|
|
(11
|
)%
|
|||||
|
Loans held-for-sale and loans at fair value
(b)
|
15,274
|
|
14,254
|
|
7
|
|
15,274
|
|
14,254
|
|
7
|
|
|||||||||
|
Average loans:
|
|||||||||||||||||||||
|
Prime mortgage, including option ARMs
(a)
|
16,933
|
|
17,478
|
|
(3
|
)
|
17,242
|
|
17,358
|
|
(1
|
)
|
|||||||||
|
Loans held-for-sale and loans at fair value
(b)
|
18,199
|
|
17,694
|
|
3
|
|
19,682
|
|
16,658
|
|
18
|
|
|||||||||
|
Average assets
|
59,880
|
|
60,534
|
|
(1
|
)
|
62,037
|
|
59,698
|
|
4
|
|
|||||||||
|
Repurchase liability (period-end)
|
2,245
|
|
2,997
|
|
(25
|
)
|
2,245
|
|
2,997
|
|
(25
|
)
|
|||||||||
|
Credit data and quality statistics
|
|||||||||||||||||||||
|
Net charge-offs:
|
|||||||||||||||||||||
|
Prime mortgage, including option ARMs
|
5
|
|
1
|
|
400
|
|
9
|
|
1
|
|
NM
|
|
|||||||||
|
Net charge-off rate:
|
|||||||||||||||||||||
|
Prime mortgage, including option ARMs
|
0.12
|
%
|
0.02
|
%
|
0.11
|
%
|
0.01
|
%
|
|||||||||||||
|
30+ day delinquency rate
(c)
|
3.46
|
|
3.00
|
|
3.46
|
|
3.00
|
|
|||||||||||||
|
Nonperforming assets
(d)
|
$
|
707
|
|
$
|
708
|
|
—
|
%
|
$
|
707
|
|
$
|
708
|
|
—
|
%
|
|||||
|
(a)
|
Predominantly represents prime mortgage loans repurchased from Government National Mortgage Association (“Ginnie Mae”) pools, which are insured by U.S. government agencies. See further discussion of loans repurchased from Ginnie Mae pools in Mortgage repurchase liability on pages
55–59
and Note 21 on pages
193–197
of this Form
|
10-Q.
|
(b)
|
Predominantly consists of prime mortgages originated with the intent to sell that are accounted for at fair value and classified as trading assets on the Consolidated Balance Sheets.
|
|
(c)
|
At June 30, 2013 and 2012, excluded mortgage loans insured by U.S. government agencies of $11.2 billion and $13.0 billion, respectively, that are 30 or more days past due. These amounts were excluded as reimbursement of insured amounts is proceeding normally. For further discussion, see Note 13 on pages
153–175
of this Form 10-Q which summarizes loan delinquency information.
|
|
(d)
|
At June 30, 2013 and 2012, nonperforming assets excluded: (1) mortgage loans insured by U.S. government agencies of $10.1 billion and $11.9 billion, respectively, that are 90 or more days past due; and (2) real estate owned insured by U.S. government agencies of $1.8 billion and $1.3 billion, respectively. These amounts were excluded as reimbursement of insured amounts is proceeding normally. For further discussion, see Note 13 on pages
153–175
of this Form 10-Q which summarizes loan delinquency information.
|
|
Selected metrics
|
|||||||||||||||||||||
|
|
As of or for the three
months ended June 30,
|
As of or for the six
months ended June 30,
|
|||||||||||||||||||
|
(in billions, except ratios)
|
2013
|
2012
|
Change
|
2013
|
2012
|
Change
|
|||||||||||||||
|
Business metrics
|
|||||||||||||||||||||
|
Mortgage origination volume by channel
|
|||||||||||||||||||||
|
Retail
|
$
|
23.3
|
|
$
|
26.1
|
|
(11
|
)%
|
$
|
49.5
|
|
49.5
|
|
—
|
%
|
||||||
|
Wholesale
(a)
|
0.1
|
|
0.2
|
|
(50
|
)
|
0.2
|
|
0.2
|
|
—
|
|
|||||||||
|
Correspondent
(a)
|
25.6
|
|
17.6
|
|
45
|
|
52.0
|
|
32.6
|
|
60
|
|
|||||||||
|
Total mortgage origination volume
(b)
|
$
|
49.0
|
|
$
|
43.9
|
|
12
|
|
$
|
101.7
|
|
$
|
82.3
|
|
24
|
|
|||||
|
Mortgage application volume by channel
|
|||||||||||||||||||||
|
Retail
|
$
|
36.8
|
|
$
|
43.1
|
|
(15
|
)
|
$
|
71.5
|
|
$
|
83.1
|
|
(14
|
)
|
|||||
|
Wholesale
(a)
|
—
|
|
0.1
|
|
NM
|
|
0.2
|
|
0.3
|
|
(33
|
)
|
|||||||||
|
Correspondent
(a)
|
28.2
|
|
23.7
|
|
19
|
|
53.8
|
|
43.4
|
|
24
|
|
|||||||||
|
Total mortgage application volume
|
$
|
65.0
|
|
$
|
66.9
|
|
(3
|
)
|
$
|
125.5
|
|
$
|
126.8
|
|
(1
|
)
|
|||||
|
Third-party mortgage loans serviced (period-end)
|
$
|
832.0
|
|
$
|
860.0
|
|
(3
|
)
|
$
|
832.0
|
|
$
|
860.0
|
|
(3
|
)
|
|||||
|
Third-party mortgage loans serviced (average)
|
840.6
|
|
866.7
|
|
(3
|
)
|
847.4
|
|
879.6
|
|
(4
|
)
|
|||||||||
|
MSR carrying value (period-end)
|
9.3
|
|
7.1
|
|
31
|
%
|
9.3
|
|
7.1
|
|
31
|
%
|
|||||||||
|
Ratio of MSR carrying value (period-end) to third-party mortgage loans serviced (period-end)
|
1.12
|
%
|
0.83
|
%
|
1.12
|
%
|
0.83
|
%
|
|||||||||||||
|
Ratio of annualized loan servicing-related revenue to third-party mortgage loans serviced (average)
|
0.41
|
|
0.47
|
|
0.42
|
|
0.47
|
|
|||||||||||||
|
MSR revenue multiple
(c)
|
2.73x
|
|
1.77x
|
|
2.67x
|
|
1.77x
|
|
|||||||||||||
|
(a)
|
Includes rural housing loans sourced through brokers and correspondents, which are underwritten and closed with pre-funding loan approval from the U.S. Department of Agriculture Rural Development, which acts as the guarantor in the transaction.
|
|
(b)
|
Firmwide mortgage origination volume was $52.0 billion and $46.0 billion for the three months ended June 30, 2013 and 2012, respectively, and $107.1 billion and $86.5 billion for the six months ended June 30, 2013 and 2012, respectively.
|
|
(c)
|
Represents the ratio of MSR carrying value (period-end) to third-party mortgage loans serviced (period-end) divided by the ratio of annualized loan servicing-related revenue to third-party mortgage loans serviced (average).
|
28
|
Real Estate Portfolios
|
|||||||||||||||||||||
|
Selected metrics
|
|||||||||||||||||||||
|
|
As of or for the three
months ended June 30,
|
As of or for the six
months ended June 30,
|
|||||||||||||||||||
|
(in millions)
|
2013
|
2012
|
Change
|
2013
|
2012
|
Change
|
|||||||||||||||
|
Loans, excluding PCI
|
|||||||||||||||||||||
|
Period-end loans owned:
|
|||||||||||||||||||||
|
Home equity
|
$
|
62,326
|
|
$
|
72,833
|
|
(14
|
)%
|
$
|
62,326
|
|
$
|
72,833
|
|
(14
|
)%
|
|||||
|
Prime mortgage, including option ARMs
|
44,003
|
|
42,037
|
|
5
|
|
44,003
|
|
42,037
|
|
5
|
|
|||||||||
|
Subprime mortgage
|
7,703
|
|
8,945
|
|
(14
|
)
|
7,703
|
|
8,945
|
|
(14
|
)
|
|||||||||
|
Other
|
589
|
|
675
|
|
(13
|
)
|
589
|
|
675
|
|
(13
|
)
|
|||||||||
|
Total period-end loans owned
|
$
|
114,621
|
|
$
|
124,490
|
|
(8
|
)
|
$
|
114,621
|
|
$
|
124,490
|
|
(8
|
)
|
|||||
|
Average loans owned:
|
|||||||||||||||||||||
|
Home equity
|
$
|
63,593
|
|
$
|
74,069
|
|
(14
|
)
|
$
|
64,856
|
|
$
|
75,334
|
|
(14
|
)
|
|||||
|
Prime mortgage, including option ARMs
|
43,007
|
|
42,543
|
|
1
|
|
42,411
|
|
43,122
|
|
(2
|
)
|
|||||||||
|
Subprime mortgage
|
7,840
|
|
9,123
|
|
(14
|
)
|
7,989
|
|
9,304
|
|
(14
|
)
|
|||||||||
|
Other
|
597
|
|
684
|
|
(13
|
)
|
608
|
|
696
|
|
(13
|
)
|
|||||||||
|
Total average loans owned
|
$
|
115,037
|
|
$
|
126,419
|
|
(9
|
)
|
$
|
115,864
|
|
$
|
128,456
|
|
(10
|
)
|
|||||
|
PCI loans
|
|||||||||||||||||||||
|
Period-end loans owned:
|
|||||||||||||||||||||
|
Home equity
|
$
|
19,992
|
|
$
|
21,867
|
|
(9
|
)
|
$
|
19,992
|
|
$
|
21,867
|
|
(9
|
)
|
|||||
|
Prime mortgage
|
12,976
|
|
14,395
|
|
(10
|
)
|
12,976
|
|
14,395
|
|
(10
|
)
|
|||||||||
|
Subprime mortgage
|
4,448
|
|
4,784
|
|
(7
|
)
|
4,448
|
|
4,784
|
|
(7
|
)
|
|||||||||
|
Option ARMs
|
19,320
|
|
21,565
|
|
(10
|
)
|
19,320
|
|
21,565
|
|
(10
|
)
|
|||||||||
|
Total period-end loans owned
|
$
|
56,736
|
|
$
|
62,611
|
|
(9
|
)
|
$
|
56,736
|
|
$
|
62,611
|
|
(9
|
)
|
|||||
|
Average loans owned:
|
|||||||||||||||||||||
|
Home equity
|
$
|
20,245
|
|
$
|
22,076
|
|
(8
|
)
|
$
|
20,494
|
|
$
|
22,282
|
|
(8
|
)
|
|||||
|
Prime mortgage
|
13,152
|
|
14,590
|
|
(10
|
)
|
13,337
|
|
14,783
|
|
(10
|
)
|
|||||||||
|
Subprime mortgage
|
4,488
|
|
4,824
|
|
(7
|
)
|
4,538
|
|
4,869
|
|
(7
|
)
|
|||||||||
|
Option ARMs
|
19,618
|
|
21,823
|
|
(10
|
)
|
19,920
|
|
22,109
|
|
(10
|
)
|
|||||||||
|
Total average loans owned
|
$
|
57,503
|
|
$
|
63,313
|
|
(9
|
)
|
$
|
58,289
|
|
$
|
64,043
|
|
(9
|
)
|
|||||
|
Total Real Estate Portfolios
|
|||||||||||||||||||||
|
Period-end loans owned:
|
|||||||||||||||||||||
|
Home equity
|
$
|
82,318
|
|
$
|
94,700
|
|
(13
|
)
|
$
|
82,318
|
|
$
|
94,700
|
|
(13
|
)
|
|||||
|
Prime mortgage, including option ARMs
|
76,299
|
|
77,997
|
|
(2
|
)
|
76,299
|
|
77,997
|
|
(2
|
)
|
|||||||||
|
Subprime mortgage
|
12,151
|
|
13,729
|
|
(11
|
)
|
12,151
|
|
13,729
|
|
(11
|
)
|
|||||||||
|
Other
|
589
|
|
675
|
|
(13
|
)
|
589
|
|
675
|
|
(13
|
)
|
|||||||||
|
Total period-end loans owned
|
$
|
171,357
|
|
$
|
187,101
|
|
(8
|
)
|
$
|
171,357
|
|
$
|
187,101
|
|
(8
|
)
|
|||||
|
Average loans owned:
|
|||||||||||||||||||||
|
Home equity
|
$
|
83,838
|
|
$
|
96,145
|
|
(13
|
)
|
$
|
85,350
|
|
$
|
97,616
|
|
(13
|
)
|
|||||
|
Prime mortgage, including option ARMs
|
75,777
|
|
78,956
|
|
(4
|
)
|
75,668
|
|
80,014
|
|
(5
|
)
|
|||||||||
|
Subprime mortgage
|
12,328
|
|
13,947
|
|
(12
|
)
|
12,527
|
|
14,173
|
|
(12
|
)
|
|||||||||
|
Other
|
597
|
|
684
|
|
(13
|
)
|
608
|
|
696
|
|
(13
|
)
|
|||||||||
|
Total average loans owned
|
$
|
172,540
|
|
$
|
189,732
|
|
(9
|
)
|
$
|
174,153
|
|
$
|
192,499
|
|
(10
|
)
|
|||||
|
Average assets
|
$
|
163,593
|
|
$
|
177,698
|
|
(8
|
)
|
$
|
164,975
|
|
$
|
179,976
|
|
(8
|
)
|
|||||
|
Home equity origination volume
|
499
|
|
360
|
|
39
|
%
|
901
|
|
672
|
|
34
|
%
|
|||||||||
29
|
Credit data and quality statistics
|
|||||||||||||||||||||
|
As of or for the three
months ended June 30,
|
As of or for the six
months ended June 30,
|
||||||||||||||||||||
|
(in millions, except ratios)
|
2013
|
2012
|
Change
|
2013
|
2012
|
Change
|
|||||||||||||||
|
Net charge-offs, excluding PCI loans
|
|||||||||||||||||||||
|
Home equity
|
$
|
236
|
|
$
|
466
|
|
(49
|
)%
|
$
|
569
|
|
$
|
1,008
|
|
(44
|
)%
|
|||||
|
Prime mortgage, including option ARMs
|
16
|
|
114
|
|
(86
|
)
|
60
|
|
245
|
|
(76
|
)
|
|||||||||
|
Subprime mortgage
|
33
|
|
112
|
|
(71
|
)
|
100
|
|
242
|
|
(59
|
)
|
|||||||||
|
Other
|
3
|
|
4
|
|
(25
|
)
|
7
|
|
9
|
|
(22
|
)
|
|||||||||
|
Total net charge-offs, excluding PCI loans
|
$
|
288
|
|
$
|
696
|
|
(59
|
)
|
$
|
736
|
|
$
|
1,504
|
|
(51
|
)
|
|||||
|
Net charge-off rate, excluding PCI loans:
|
|||||||||||||||||||||
|
Home equity
|
1.49
|
%
|
2.53
|
%
|
1.77
|
%
|
2.69
|
%
|
|||||||||||||
|
Prime mortgage, including option ARMs
|
0.15
|
|
1.08
|
|
0.29
|
|
1.14
|
|
|||||||||||||
|
Subprime mortgage
|
1.69
|
|
4.94
|
|
2.52
|
|
5.23
|
|
|||||||||||||
|
Other
|
2.02
|
|
2.35
|
|
2.32
|
|
2.60
|
|
|||||||||||||
|
Total net charge-off rate, excluding PCI loans
|
1.00
|
|
2.21
|
|
1.28
|
|
2.35
|
|
|||||||||||||
|
Net charge-off rate – reported:
|
|||||||||||||||||||||
|
Home equity
|
1.13
|
%
|
1.95
|
%
|
1.34
|
%
|
2.08
|
%
|
|||||||||||||
|
Prime mortgage, including option ARMs
|
0.08
|
|
0.58
|
|
0.16
|
|
0.62
|
|
|||||||||||||
|
Subprime mortgage
|
1.07
|
|
3.23
|
|
1.61
|
|
3.43
|
|
|||||||||||||
|
Other
|
2.02
|
|
2.35
|
|
2.32
|
|
2.60
|
|
|||||||||||||
|
Total net charge-off rate – reported
|
0.67
|
|
1.48
|
|
0.85
|
|
1.57
|
|
|||||||||||||
|
30+ day delinquency rate, excluding PCI loans
(a)
|
4.17
|
%
|
5.16
|
%
|
4.17
|
%
|
5.16
|
%
|
|||||||||||||
|
Allowance for loan losses, excluding PCI loans
|
$
|
3,268
|
|
$
|
6,468
|
|
(49
|
)
|
$
|
3,268
|
|
$
|
6,468
|
|
(49
|
)
|
|||||
|
Allowance for PCI loans
|
5,711
|
|
5,711
|
|
—
|
|
5,711
|
|
5,711
|
|
—
|
|
|||||||||
|
Allowance for loan losses
|
$
|
8,979
|
|
$
|
12,179
|
|
(26
|
)
|
$
|
8,979
|
|
$
|
12,179
|
|
(26
|
)
|
|||||
|
Nonperforming assets
(b)(c)
|
7,801
|
|
7,340
|
|
6
|
%
|
7,801
|
|
7,340
|
|
6
|
%
|
|||||||||
|
Allowance for loan losses to period-end loans retained
|
5.24
|
%
|
6.51
|
%
|
5.24
|
%
|
6.51
|
%
|
|||||||||||||
|
Allowance for loan losses to period-end loans retained, excluding PCI loans
|
2.85
|
|
5.20
|
|
2.85
|
|
5.20
|
|
|||||||||||||
|
(a)
|
The 30+ day delinquency rate for PCI loans was 17.92% and 21.38% at June 30, 2013 and 2012, respectively.
|
|
(b)
|
Excludes PCI loans. Because the Firm is recognizing interest income on each pool of PCI loans, they are all considered to be performing.
|
|
(c)
|
Beginning September 30, 2012, nonperforming assets included Chapter 7 loans.
|
30
Card, Merchant Services & Auto
|
Selected financial statement data
|
|||||||||||||||||||||
|
As of or for the three months ended June 30,
|
As of or for the six months ended June 30,
|
||||||||||||||||||||
|
(in millions, except ratios)
|
2013
|
2012
|
Change
|
2013
|
2012
|
Change
|
|||||||||||||||
|
Revenue
|
|||||||||||||||||||||
|
Card income
|
$
|
1,067
|
|
$
|
1,015
|
|
5
|
%
|
$
|
2,080
|
|
$
|
1,963
|
|
6
|
%
|
|||||
|
All other income
|
261
|
|
231
|
|
13
|
|
506
|
|
534
|
|
(5
|
)
|
|||||||||
|
Noninterest revenue
|
1,328
|
|
1,246
|
|
7
|
|
2,586
|
|
2,497
|
|
4
|
|
|||||||||
|
Net interest income
|
3,342
|
|
3,279
|
|
2
|
|
6,804
|
|
6,742
|
|
1
|
|
|||||||||
|
Total net revenue
|
4,670
|
|
4,525
|
|
3
|
|
9,390
|
|
9,239
|
|
2
|
|
|||||||||
|
Provision for credit losses
|
564
|
|
734
|
|
(23
|
)
|
1,250
|
|
1,472
|
|
(15
|
)
|
|||||||||
|
Noninterest expense
|
1,988
|
|
2,096
|
|
(5
|
)
|
3,931
|
|
4,125
|
|
(5
|
)
|
|||||||||
|
Income before income tax expense
|
2,118
|
|
1,695
|
|
25
|
|
4,209
|
|
3,642
|
|
16
|
|
|||||||||
|
Net income
|
$
|
1,249
|
|
$
|
1,030
|
|
21
|
|
$
|
2,521
|
|
$
|
2,213
|
|
14
|
|
|||||
|
Return on common equity
|
32
|
%
|
25
|
%
|
33
|
%
|
27
|
%
|
|||||||||||||
|
Overhead ratio
|
43
|
|
46
|
|
42
|
|
45
|
|
|||||||||||||
|
Equity (period-end and average)
|
$
|
15,500
|
|
$
|
16,500
|
|
(6
|
)%
|
$
|
15,500
|
|
$
|
16,500
|
|
(6
|
)%
|
|||||
Quarterly results
Card, Merchant Services & Auto
net income was
$1.2 billion
, an increase of
$219 million
, or
21%
, compared with the prior year, driven by lower provision for credit losses, higher net revenue and lower noninterest expense.
Net revenue was
$4.7 billion
, up
$145 million
, or
3%
, compared with the prior year. Net interest income was
$3.3 billion
, up
$63 million
compared with the prior year. The impact of lower revenue reversals associated with lower net charge-offs in Credit Card was largely offset by lower average credit card loan balances and spread compression in Auto. Noninterest revenue was
$1.3 billion
, up
$82 million
compared with the prior year, primarily driven by higher merchant servicing revenue, auto lease income and net interchange income.
The provision for credit losses was
$564 million
, compared with
$734 million
in the prior year. The current-quarter provision reflected lower net charge-offs and a $550 million reduction in the allowance for loan losses due to lower estimated losses reflecting improved delinquency trends. The prior-year provision included a $751 million reduction in the allowance for loan losses. The Credit Card net charge-off rate
1
was
3.31%
, down from 4.32% in the prior year; and the 30+ day delinquency rate
1
was
1.69%
, down from 2.13% in the prior year. The Auto net charge-off rate was
0.18%
, up from
0.17%
in the prior year.
Noninterest expense was
$2.0 billion
, a decrease of
$108 million
, or
5%
, from the prior year, primarily driven by lower remediation expense, inclusive of a current-quarter charge, related to an exited non-core product.
Year-to-date results
Card, Merchant Services & Auto
net income was
$2.5 billion
, an increase of
$308 million
, or
14%
, compared with the prior year, driven by lower provision for credit losses, lower noninterest expense and higher net revenue.
Net revenue was
$9.4 billion
, up
$151 million
, or
2%
, compared with the prior year. Net interest income was
$6.8 billion
, up
$62 million
compared with the prior year. The impact of lower revenue reversals associated with lower net charge-offs in Credit Card was largely offset by lower average credit card loan balances and spread compression in Auto. Noninterest revenue was
$2.6 billion
, up
$89 million
compared with the prior year, primarily driven by higher net interchange income, merchant servicing revenue and auto lease income, partially offset by a gain on an investment security in the prior year.
The provision for credit losses was
$1.3 billion
, compared with
$1.5 billion
in the prior year. The current-year provision reflected lower net charge-offs and a $1.1 billion reduction in the allowance for loan losses due to lower estimated losses reflecting improved delinquency trends. The prior-year provision included a $1.5 billion reduction in the allowance for loan losses. The Credit Card net charge-off rate
1
was
3.43%
, down from 4.34% in the prior year. The Auto net charge-off rate was
0.25%
, up from
0.23%
in the prior year.
Noninterest expense was
$3.9 billion
, a decrease of
$194 million
, or
5%
, from the prior year, primarily driven by lower remediation expense, inclusive of a current-period charge, related to an exited non-core product.
1
The net charge-off and 30+ day delinquency rates presented for credit card loans, which include loans held-for-sale, are non-GAAP financial measures. Management uses this as an additional measure to assess the performance of the portfolio.
31
|
Selected metrics
|
|||||||||||||||||||||
|
As of or for the three
months ended June 30,
|
As of or for the six
months ended June 30,
|
||||||||||||||||||||
|
(in millions, except ratios and where otherwise noted)
|
2013
|
2012
|
Change
|
2013
|
2012
|
Change
|
|||||||||||||||
|
Selected balance sheet data (period-end)
|
|||||||||||||||||||||
|
Loans:
|
|||||||||||||||||||||
|
Credit Card
|
$
|
124,288
|
|
$
|
124,705
|
|
—
|
%
|
$
|
124,288
|
|
$
|
124,705
|
|
—
|
%
|
|||||
|
Auto
|
50,865
|
|
48,468
|
|
5
|
|
50,865
|
|
48,468
|
|
5
|
|
|||||||||
|
Student
|
11,040
|
|
12,232
|
|
(10
|
)
|
11,040
|
|
12,232
|
|
(10
|
)
|
|||||||||
|
Total loans
|
$
|
186,193
|
|
$
|
185,405
|
|
—
|
|
$
|
186,193
|
|
$
|
185,405
|
|
—
|
|
|||||
|
Selected balance sheet
data (average)
|
|||||||||||||||||||||
|
Total assets
|
$
|
196,921
|
|
$
|
197,301
|
|
—
|
|
$
|
196,778
|
|
$
|
198,375
|
|
(1
|
)
|
|||||
|
Loans:
|
|||||||||||||||||||||
|
Credit Card
|
122,855
|
|
125,195
|
|
(2
|
)
|
123,208
|
|
126,405
|
|
(3
|
)
|
|||||||||
|
Auto
|
50,677
|
|
48,273
|
|
5
|
|
50,362
|
|
47,989
|
|
5
|
|
|||||||||
|
Student
|
11,172
|
|
12,944
|
|
(14
|
)
|
11,315
|
|
13,146
|
|
(14
|
)
|
|||||||||
|
Total loans
|
$
|
184,704
|
|
$
|
186,412
|
|
(1
|
)
|
$
|
184,885
|
|
$
|
187,540
|
|
(1
|
)
|
|||||
|
Business metrics
|
|||||||||||||||||||||
|
Credit Card, excluding Commercial Card
|
|||||||||||||||||||||
|
Sales volume (in billions)
|
$
|
105.2
|
|
$
|
96.0
|
|
10
|
|
$
|
199.9
|
|
$
|
182.9
|
|
9
|
|
|||||
|
New accounts opened
|
1.5
|
|
1.6
|
|
(6
|
)
|
3.2
|
|
3.3
|
|
(3
|
)
|
|||||||||
|
Open accounts
|
64.8
|
|
63.7
|
|
2
|
|
64.8
|
|
63.7
|
|
2
|
|
|||||||||
|
Accounts with sales activity
|
30.0
|
|
29.3
|
|
2
|
|
30.0
|
|
29.3
|
|
2
|
|
|||||||||
|
% of accounts acquired online
|
53
|
%
|
49
|
%
|
52
|
%
|
48
|
%
|
|||||||||||||
|
Merchant Services (Chase Paymentech Solutions)
|
|||||||||||||||||||||
|
Merchant processing volume (in billions)
|
$
|
185.0
|
|
$
|
160.2
|
|
15
|
|
$
|
360.8
|
|
$
|
313.0
|
|
15
|
|
|||||
|
Total transactions (in billions)
|
8.8
|
|
7.1
|
|
24
|
|
17.1
|
|
13.9
|
|
23
|
|
|||||||||
|
Auto & Student
|
|||||||||||||||||||||
|
Origination volume (in billions)
|
|||||||||||||||||||||
|
Auto
|
$
|
6.8
|
|
$
|
5.8
|
|
17
|
|
$
|
13.3
|
|
$
|
11.6
|
|
15
|
|
|||||
|
Student
|
—
|
|
—
|
|
—
|
%
|
0.1
|
|
0.1
|
|
—
|
%
|
|||||||||
32
|
Selected metrics
|
||||||||||||||||||||||
|
As of or for the three
months ended June 30,
|
As of or for the six
months ended June 30,
|
|||||||||||||||||||||
|
(in millions, except ratios)
|
2013
|
2012
|
Change
|
2013
|
2012
|
Change
|
||||||||||||||||
|
Credit data and quality statistics
|
||||||||||||||||||||||
|
Net charge-offs:
|
||||||||||||||||||||||
|
Credit Card
|
$
|
1,014
|
|
$
|
1,345
|
|
(25
|
)%
|
$
|
2,096
|
|
$
|
2,731
|
|
(23
|
)%
|
||||||
|
Auto
|
23
|
|
21
|
|
10
|
|
63
|
|
54
|
|
17
|
|
||||||||||
|
Student
|
77
|
|
119
|
|
(35
|
)
|
141
|
|
188
|
|
(25
|
)
|
||||||||||
|
Total net charge-offs
|
$
|
1,114
|
|
$
|
1,485
|
|
(25
|
)
|
$
|
2,300
|
|
$
|
2,973
|
|
(23
|
)
|
||||||
|
Net charge-off rate:
|
||||||||||||||||||||||
|
Credit Card
(a)
|
3.31
|
%
|
4.35
|
%
|
3.43
|
%
|
4.37
|
%
|
||||||||||||||
|
Auto
|
0.18
|
|
0.17
|
|
0.25
|
|
0.23
|
|
||||||||||||||
|
Student
|
2.76
|
|
3.70
|
|
2.51
|
|
2.88
|
|
||||||||||||||
|
Total net charge-off rate
|
2.42
|
|
3.22
|
|
2.51
|
|
3.20
|
|
||||||||||||||
|
Delinquency rates
|
||||||||||||||||||||||
|
30+ day delinquency rate:
|
||||||||||||||||||||||
|
Credit Card
(b)
|
1.69
|
|
2.14
|
|
1.69
|
|
2.14
|
|
||||||||||||||
|
Auto
|
0.95
|
|
0.90
|
|
0.95
|
|
0.90
|
|
||||||||||||||
|
Student
(c)
|
2.23
|
|
1.95
|
|
2.23
|
|
1.95
|
|
||||||||||||||
|
Total 30+ day delinquency rate
|
1.52
|
|
1.80
|
|
1.52
|
|
1.80
|
|
||||||||||||||
|
90+ day delinquency rate – Credit Card
(b)
|
0.82
|
|
1.04
|
|
0.82
|
|
1.04
|
|
||||||||||||||
|
Nonperforming assets
(d)(e)
|
$
|
243
|
|
$
|
219
|
|
11
|
|
$
|
243
|
|
$
|
219
|
|
11
|
|
||||||
|
Allowance for loan losses:
|
||||||||||||||||||||||
|
Credit Card
|
$
|
4,445
|
|
$
|
5,499
|
|
(19
|
)
|
$
|
4,445
|
|
$
|
5,499
|
|
(19
|
)
|
||||||
|
Auto & Student
|
954
|
|
1,009
|
|
(5
|
)
|
$
|
954
|
|
$
|
1,009
|
|
(5
|
)
|
||||||||
|
Total allowance for loan losses
|
$
|
5,399
|
|
$
|
6,508
|
|
(17
|
)%
|
$
|
5,399
|
|
$
|
6,508
|
|
(17
|
)%
|
||||||
|
Allowance for loan losses to period-end loans:
|
||||||||||||||||||||||
|
Credit Card
(b)
|
3.58
|
%
|
4.41
|
%
|
3.58
|
%
|
4.41
|
%
|
||||||||||||||
|
Auto & Student
|
1.54
|
|
1.66
|
|
1.54
|
|
1.66
|
|
||||||||||||||
|
Total allowance for loan losses to period-end loans
|
2.90
|
|
3.51
|
|
2.90
|
|
3.51
|
|
||||||||||||||
|
(a)
|
Average credit card loans included loans held-for-sale of $782 million for the three months ended June 30, 2012 and $801 million for the six months ended June 30, 2012. These amounts are excluded when calculating the net charge-off rate. There were no loans held-for-sale for the three and six months ended June 30, 2013.
|
|
(b)
|
Period-end credit card loans included loans held-for-sale of $112 million at June 30, 2012. This amount is excluded when calculating delinquency rates and the allowance for loan losses to period-end loans. No allowance for loan losses was recorded for these loans. There were no loans held-for-sale at June 30, 2013.
|
|
(c)
|
Excluded student loans insured by U.S. government agencies under the FFELP of $812 million and $931 million at June 30, 2013 and 2012, respectively, that are 30 or more days past due. These amounts are excluded as reimbursement of insured amounts is proceeding normally.
|
|
(d)
|
Nonperforming assets excluded student loans insured by U.S. government agencies under the FFELP of $488 million and $547 million at June 30, 2013 and 2012, respectively, that are 90 or more days past due. These amounts are excluded as reimbursement of insured amounts is proceeding normally.
|
|
(e)
|
Beginning September 30, 2012, nonperforming assets included Chapter 7 loans.
|
|
Card Services supplemental information
|
|||||||||||||||||||||
|
Three months ended June 30,
|
Six months ended June 30,
|
||||||||||||||||||||
|
(in millions, except ratios)
|
2013
|
2012
|
Change
|
2013
|
2012
|
Change
|
|||||||||||||||
|
Revenue
|
|||||||||||||||||||||
|
Noninterest revenue
|
$
|
994
|
|
$
|
953
|
|
4
|
%
|
$
|
1,932
|
|
$
|
1,902
|
|
2
|
%
|
|||||
|
Net interest income
|
2,863
|
|
2,755
|
|
4
|
|
5,833
|
|
5,683
|
|
3
|
|
|||||||||
|
Total net revenue
|
3,857
|
|
3,708
|
|
4
|
|
7,765
|
|
7,585
|
|
2
|
|
|||||||||
|
Provision for credit losses
|
464
|
|
595
|
|
(22
|
)
|
1,046
|
|
1,231
|
|
(15
|
)
|
|||||||||
|
Noninterest expense
|
1,537
|
|
1,703
|
|
(10
|
)
|
3,038
|
|
3,339
|
|
(9
|
)
|
|||||||||
|
Income before income tax expense
|
1,856
|
|
1,410
|
|
32
|
|
3,681
|
|
3,015
|
|
22
|
|
|||||||||
|
Net income
|
$
|
1,093
|
|
$
|
860
|
|
27
|
%
|
$
|
2,206
|
|
$
|
1,839
|
|
20
|
%
|
|||||
|
Percentage of average loans:
|
|||||||||||||||||||||
|
Noninterest revenue
|
3.25
|
%
|
3.06
|
%
|
3.16
|
%
|
3.03
|
%
|
|||||||||||||
|
Net interest income
|
9.35
|
|
8.85
|
|
9.55
|
|
9.04
|
|
|||||||||||||
|
Total net revenue
|
12.59
|
|
11.91
|
|
12.71
|
|
12.07
|
|
|||||||||||||
33
|
CORPORATE & INVESTMENT BANK
|
||||
For a discussion of the business profile on CIB, see pages 92–95 of JPMorgan Chase’s 2012 Annual Report and the Introduction on page
4
of this Form 10-Q.
CIB provides several non-GAAP financial measures which exclude the impact of DVA on: net revenue, net income, compensation ratio, and return on equity. The ratio for the allowance for loan losses to end-of-period loans is calculated excluding the impact of trade finance and consolidated Firm-administered multi-seller conduits, to provide a more meaningful assessment of CIB’s allowance coverage ratio. These measures are used by management to assess the underlying performance of the business and for comparability with peers.
|
Selected income statement data
|
|||||||||||||||||||||
|
Three months ended June 30,
|
Six months ended June 30,
|
||||||||||||||||||||
|
(in millions)
|
2013
|
2012
|
Change
|
2013
|
2012
|
Change
|
|||||||||||||||
|
Revenue
|
|||||||||||||||||||||
|
Investment banking fees
|
$
|
1,717
|
|
$
|
1,245
|
|
38
|
%
|
$
|
3,150
|
|
$
|
2,620
|
|
20
|
%
|
|||||
|
Principal transactions
(a)
|
3,288
|
|
3,070
|
|
7
|
|
7,249
|
|
6,281
|
|
15
|
|
|||||||||
|
Lending- and deposit-related fees
|
486
|
|
488
|
|
—
|
|
959
|
|
963
|
|
—
|
|
|||||||||
|
Asset management, administration and commissions
|
1,289
|
|
1,207
|
|
7
|
|
2,456
|
|
2,426
|
|
1
|
|
|||||||||
|
All other income
|
391
|
|
251
|
|
56
|
|
714
|
|
459
|
|
56
|
|
|||||||||
|
Noninterest revenue
|
7,171
|
|
6,261
|
|
15
|
|
14,528
|
|
12,749
|
|
14
|
|
|||||||||
|
Net interest income
|
2,705
|
|
2,725
|
|
(1
|
)
|
5,488
|
|
5,575
|
|
(2
|
)
|
|||||||||
|
Total net revenue
(b)
|
9,876
|
|
8,986
|
|
10
|
|
20,016
|
|
18,324
|
|
9
|
|
|||||||||
|
Provision for credit losses
|
(6
|
)
|
29
|
|
NM
|
|
5
|
|
26
|
|
(81
|
)
|
|||||||||
|
Noninterest expense
|
|||||||||||||||||||||
|
Compensation expense
|
2,988
|
|
2,718
|
|
10
|
|
6,364
|
|
6,341
|
|
—
|
|
|||||||||
|
Noncompensation expense
|
2,754
|
|
2,575
|
|
7
|
|
5,489
|
|
5,163
|
|
6
|
|
|||||||||
|
Total noninterest expense
|
5,742
|
|
5,293
|
|
8
|
|
11,853
|
|
11,504
|
|
3
|
|
|||||||||
|
Income before income tax expense
|
4,140
|
|
3,664
|
|
13
|
|
8,158
|
|
6,794
|
|
20
|
|
|||||||||
|
Income tax expense
|
1,302
|
|
1,288
|
|
1
|
|
2,710
|
|
2,385
|
|
14
|
|
|||||||||
|
Net income
|
$
|
2,838
|
|
$
|
2,376
|
|
19
|
%
|
$
|
5,448
|
|
$
|
4,409
|
|
24
|
%
|
|||||
|
(a)
|
Includes DVA on structured notes and derivative liabilities measured at fair value. DVA gains/(losses) were
$355 million
and
$755 million
for the three months ended June 30, 2013 and 2012, and
$481 million
and
$(152) million
for the six months ended June 30, 2013 and 2012, respectively.
|
|
(b)
|
Included tax-equivalent adjustments, predominantly due to income tax credits related to affordable housing and alternative energy investments, as well as tax-exempt income from municipal bond investments of $550 million and $494 million for the three months ended June 30, 2013 and 2012, and $1.1 million and $1.0 billion for the six months ended June 30, 2013 and 2012, respectively.
|
34
|
Selected income statement data
|
|||||||||||||||||||||
|
Three months ended June 30,
|
Six months ended June 30,
|
||||||||||||||||||||
|
(in millions, except ratios)
|
2013
|
2012
|
Change
|
2013
|
2012
|
Change
|
|||||||||||||||
|
Financial ratios
|
|||||||||||||||||||||
|
Return on common equity
(a)
|
20
|
%
|
20
|
%
|
19
|
%
|
19
|
%
|
|||||||||||||
|
Overhead ratio
|
58
|
|
59
|
|
59
|
|
63
|
|
|||||||||||||
|
Compensation expense as a percentage of total net revenue
(b)
|
30
|
|
30
|
|
32
|
|
35
|
|
|||||||||||||
|
Revenue by business
|
|||||||||||||||||||||
|
Advisory
|
$
|
304
|
|
$
|
356
|
|
(15
|
)%
|
$
|
559
|
|
$
|
637
|
|
(12
|
)%
|
|||||
|
Equity underwriting
|
457
|
|
250
|
|
83
|
|
730
|
|
526
|
|
39
|
|
|||||||||
|
Debt underwriting
|
956
|
|
639
|
|
50
|
|
1,861
|
|
1,457
|
|
28
|
|
|||||||||
|
Total investment banking fees
|
1,717
|
|
1,245
|
|
38
|
|
3,150
|
|
2,620
|
|
20
|
|
|||||||||
|
Treasury Services
|
1,051
|
|
1,074
|
|
(2
|
)
|
2,095
|
|
2,126
|
|
(1
|
)
|
|||||||||
|
Lending
|
373
|
|
370
|
|
1
|
|
871
|
|
592
|
|
47
|
|
|||||||||
|
Total Banking
|
3,141
|
|
2,689
|
|
17
|
|
6,116
|
|
5,338
|
|
15
|
|
|||||||||
|
Fixed Income Markets
(c)
|
4,078
|
|
3,493
|
|
17
|
|
8,830
|
|
8,509
|
|
4
|
|
|||||||||
|
Equity Markets
|
1,296
|
|
1,043
|
|
24
|
|
2,636
|
|
2,467
|
|
7
|
|
|||||||||
|
Securities Services
|
1,087
|
|
1,078
|
|
1
|
|
2,061
|
|
2,040
|
|
1
|
|
|||||||||
|
Credit Adjustments & Other
(d)(e)
|
274
|
|
683
|
|
(60
|
)
|
373
|
|
(30
|
)
|
NM
|
|
|||||||||
|
Total Markets & Investor Services
|
6,735
|
|
6,297
|
|
7
|
|
13,900
|
|
12,986
|
|
7
|
|
|||||||||
|
Total net revenue
|
$
|
9,876
|
|
$
|
8,986
|
|
10
|
%
|
$
|
20,016
|
|
$
|
18,324
|
|
9
|
%
|
|||||
|
(a)
|
Return on equity excluding DVA, a non-GAAP financial measure, was 19% and 16% for the three months ended June 30, 2013 and 2012, and 18% and 19% for the six months ended June 30, 2013 and 2012, respectively.
|
|
(b)
|
Compensation expense as a percentage of total net revenue excluding DVA, a non-GAAP financial measure, was 31% and 33% for the three months ended June 30, 2013 and 2012, and 33% and 34% for the six months ended June 30, 2013 and 2012, respectively.
|
|
(c)
|
Includes results of the synthetic credit portfolio that was transferred from CIO effective July 2, 2012.
|
|
(d)
|
Primarily includes credit portfolio credit valuation adjustments (“CVA”) net of associated hedging activities; DVA on structured notes and derivative liabilities; and nonperforming derivative receivable results.
|
|
(e)
|
Includes DVA on structured notes and derivative liabilities measured at fair value. DVA gains/(losses) were $355 million and $755 million for the three months ended June 30, 2013 and 2012, and $481 million and $(152) million for the six months ended June 30, 2013 and 2012, respectively.
|
Quarterly results
Net income was $2.8 billion, up 19% compared with the prior year. These results primarily reflected higher net revenue, partially offset by higher noninterest expense. Net revenue was $9.9 billion, compared with $9.0 billion in the prior year. Net revenue included a $355 million gain from DVA on structured notes and derivative liabilities resulting from the widening of the Firm’s credit spreads; the prior year included a gain from DVA of $755 million. Excluding the impact of DVA, net income was $2.6 billion, up 37% from the prior year, and net revenue was $9.5 billion, up 16% from the prior year.
Banking revenue was $3.1 billion, compared with $2.7 billion in the prior year. Investment banking fees were $1.7 billion (up 38%), driven by higher debt underwriting fees of $956 million (up 50%) despite weaker credit markets towards the end of the second quarter, and equity underwriting fees of $457 million (up 83%), reflecting higher industry-wide issuance as well as a #1 ranking in equity capital markets wallet share for the quarter, according to Dealogic. These were partially offset by lower advisory fees of $304 million (down 15%) reflecting lower industry-wide M&A completed deal volumes for the second quarter compared with the prior year. Treasury Services revenue was $1.1 billion, down 2% compared with the prior year, driven by lower trade finance spreads, predominantly
in Asia. Lending revenue was $373 million, primarily reflecting net interest income on retained loans and fees on lending-related commitments, compared with $370 million in the prior year.
Markets & Investor Services revenue was $6.7 billion, up 7% from the prior year. Fixed Income and Equity Markets combined revenue was $5.4 billion, up 18% from the prior year. Fixed Income markets revenue of $4.1 billion was up 17% from the prior year, reflecting solid client revenue as well as improved credit-related products performance, benefiting from reduced Eurozone uncertainty and a stronger U.S. housing market compared with the prior year. Equity markets revenue of $1.3 billion was up 24% from the prior year, driven by strong performance in equity derivatives and cash equities. Securities Services revenue was $1.1 billion, up 1% from the prior year. Growth in asset-based custody fees was consistent with growth in assets under custody of $18.9 trillion, which were up 7% from the prior year; this was predominantly offset by lower revenue in agent lending, due to lower balances and spreads, as well as securities clearance, due primarily to lower volumes. Credit Adjustments & Other revenue was $274 million, compared with $683 million in the prior year; both periods were predominantly driven by the impact of DVA.
35
The provision for credit losses was a benefit of $6 million, compared with a provision for credit losses of $29 million in the prior year. Net recoveries were $82 million compared with net recoveries of $10 million in the prior year. The ratio of the allowance for loan losses to period-end loans retained was 1.21%, compared with 1.31% in the prior year. Excluding the impact of the consolidation of Firm-administered multi-seller conduits and trade finance loans, the ratio of the allowance for loan losses to period-end loans retained was 2.35%, compared with 2.75% in the prior year.
Noninterest expense was $5.7 billion, up 8% from the prior year, primarily driven by higher compensation expense on increased revenue. The compensation ratio for the current quarter was 31%, excluding the impact of DVA.
Return on equity was 20% (19% excluding DVA) on $56.5 billion of average allocated capital.
Year-to-date results
Net income was $5.5 billion, up 24% compared with the prior year. These results reflected higher net revenue partially offset by higher noninterest expense. Net revenue was $20.0 billion, compared with $18.3 billion in the prior year. Net revenue included a $481 million gain from DVA on structured notes and derivative liabilities resulting from the widening of the Firm’s credit spreads; the prior year included a loss from DVA of $152 million. Excluding the impact of DVA, net income
was
$5.2 billion, up 14% from the prior year and net revenue was $19.5 billion, up 6% from the prior year.
Banking revenue was $6.1 billion, compared with $5.3 billion in the prior year. Investment banking fees were $3.2 billion (up 20%), driven by higher debt underwriting fees of $1.9 billion (up 28%) and equity underwriting fees of $730 million (up 39%), partially offset by lower advisory fees of $559 million (down 12%). Debt underwriting fees in the first half of 2013 were close to historical records, driven in part by record industry-wide high-yield bond issuance. Equity underwriting results were driven by higher industry-wide issuance, as well as a #1 ranking in equity capital markets wallet share for the first half of 2013, according to Dealogic. Advisory fees were lower compared with the prior
year, as industry-wide completed M&A volume remained flat, but the number of deals completed declined from the prior year period, according to Dealogic. Treasury Services revenue was $2.1 billion, down 1% compared with the prior year driven by lower trade finance spreads. Lending revenue was $871 million, compared with $592 million in the prior year; the current period primarily reflected net interest income on retained loans and fees on lending-related commitments, as well as gains on securities received from restructured loans.
Markets & Investor Services revenue was $13.9 billion, up 7% from the prior year. Fixed Income and Equity Markets combined revenue was $11.5 billion, up 4% from the prior year, reflecting solid client revenue and stronger results in credit-related and equity products, partially offset by lower results in rates-related products. Securities Services revenue was $2.1 billion, up 1% from the prior year. Growth in asset-based custody fees was consistent with growth in assets under custody of $18.9 trillion, which were up 7% compared with the prior year; this was predominantly offset by lower revenue in agent lending, due to lower balances and spreads, as well as securities clearance, due primarily to lower volumes. Credit Adjustments & Other revenue was $373 million, compared with a loss of $30 million in the prior year; both periods were primarily driven by the impact of DVA.
The provision for credit losses was $5 million, compared with $26 million in the prior year. CIB continues to experience stable trends in the credit portfolio with low levels of nonaccrual loans and charge-offs. Net recoveries were $63 million compared with net recoveries of $45 million in the prior year.
Noninterest expense was $11.9 billion, up 3% from the prior year, driven by higher noncompensation expense primarily related to litigation expense. The compensation ratio, excluding the impact of DVA, was 33% and 34% for the six months ended June 30, 2013 and 2012, respectively.
Return on equity was 19% (18% excluding DVA) on $56.5 billion of average allocated capital.
36
|
Selected metrics
|
|||||||||||||||||||||
|
|
As of or for the three
months ended June 30,
|
As of or for the six
months ended June 30,
|
|||||||||||||||||||
|
(in millions, except headcount)
|
2013
|
2012
|
Change
|
2013
|
2012
|
Change
|
|||||||||||||||
|
Selected balance sheet data (period-end)
|
|||||||||||||||||||||
|
Assets
|
$
|
873,527
|
|
$
|
897,413
|
|
(3
|
)%
|
$
|
873,527
|
|
$
|
897,413
|
|
(3
|
)%
|
|||||
|
Loans:
|
|||||||||||||||||||||
|
Loans retained
(a)
|
106,248
|
|
114,620
|
|
(7
|
)
|
106,248
|
|
114,620
|
|
(7
|
)
|
|||||||||
|
Loans held-for-sale and loans at fair value
|
4,564
|
|
2,375
|
|
92
|
|
4,564
|
|
2,375
|
|
92
|
|
|||||||||
|
Total loans
|
110,812
|
|
116,995
|
|
(5
|
)
|
110,812
|
|
116,995
|
|
(5
|
)
|
|||||||||
|
Equity
|
56,500
|
|
47,500
|
|
19
|
|
56,500
|
|
47,500
|
|
19
|
|
|||||||||
|
Selected balance sheet data (average)
|
|||||||||||||||||||||
|
Assets
|
$
|
878,801
|
|
$
|
859,026
|
|
2
|
|
$
|
874,657
|
|
$
|
856,578
|
|
2
|
|
|||||
|
Trading assets-debt and equity instruments
|
336,118
|
|
305,972
|
|
10
|
|
339,203
|
|
310,574
|
|
9
|
|
|||||||||
|
Trading assets-derivative receivables
|
72,036
|
|
74,960
|
|
(4
|
)
|
71,576
|
|
75,590
|
|
(5
|
)
|
|||||||||
|
Loans:
|
|
|
|||||||||||||||||||
|
Loans retained
(a)
|
107,654
|
|
112,952
|
|
(5
|
)
|
107,226
|
|
110,050
|
|
(3
|
)
|
|||||||||
|
Loans held-for-sale and loans at fair value
|
5,950
|
|
3,256
|
|
83
|
|
5,604
|
|
3,063
|
|
83
|
|
|||||||||
|
Total loans
|
113,604
|
|
116,208
|
|
(2
|
)
|
112,830
|
|
113,113
|
|
—
|
|
|||||||||
|
Equity
|
56,500
|
|
47,500
|
|
19
|
|
56,500
|
|
47,500
|
|
19
|
|
|||||||||
|
Headcount
|
51,771
|
|
52,336
|
|
(1
|
)%
|
51,771
|
|
52,336
|
|
(1
|
)%
|
|||||||||
|
(a)
|
Loans retained includes credit portfolio loans, trade finance loans, other held-for-investment loans and overdrafts.
|
37
|
Selected metrics
|
|||||||||||||||||||||
|
|
As of or for the three
months ended June 30,
|
As of or for the six
months ended June 30,
|
|||||||||||||||||||
|
(in millions, except ratios and where otherwise noted)
|
2013
|
2012
|
Change
|
2013
|
2012
|
Change
|
|||||||||||||||
|
Credit data and quality statistics
|
|||||||||||||||||||||
|
Net charge-offs/(recoveries)
|
$
|
(82
|
)
|
$
|
(10
|
)
|
NM
|
|
$
|
(63
|
)
|
$
|
(45
|
)
|
(40
|
)%
|
|||||
|
Nonperforming assets:
|
|||||||||||||||||||||
|
Nonaccrual loans:
|
|||||||||||||||||||||
|
Nonaccrual loans retained
(a)(b)
|
227
|
|
661
|
|
(66
|
)%
|
227
|
|
661
|
|
(66
|
)
|
|||||||||
|
Nonaccrual loans
held-for-sale and loans at fair value
|
148
|
|
158
|
|
(6
|
)
|
148
|
|
158
|
|
(6
|
)
|
|||||||||
|
Total nonaccrual loans
|
375
|
|
819
|
|
(54
|
)
|
375
|
|
819
|
|
(54
|
)
|
|||||||||
|
Derivative receivables
|
448
|
|
451
|
|
(1
|
)
|
448
|
|
451
|
|
(1
|
)
|
|||||||||
|
Assets acquired in loan satisfactions
|
46
|
|
68
|
|
(32
|
)
|
46
|
|
68
|
|
(32
|
)
|
|||||||||
|
Total nonperforming assets
|
869
|
|
1,338
|
|
(35
|
)
|
869
|
|
1,338
|
|
(35
|
)
|
|||||||||
|
Allowance for credit losses:
|
|||||||||||||||||||||
|
Allowance for loan losses
|
1,287
|
|
1,498
|
|
(14
|
)
|
1,287
|
|
1,498
|
|
(14
|
)
|
|||||||||
|
Allowance for lending-related commitments
|
556
|
|
542
|
|
3
|
|
556
|
|
542
|
|
3
|
|
|||||||||
|
Total allowance for credit losses
|
1,843
|
|
2,040
|
|
(10
|
)
|
1,843
|
|
2,040
|
|
(10
|
)
|
|||||||||
|
Net charge-off/(recovery) rate
(a)
|
(0.31
|
)%
|
(0.04
|
)%
|
(0.12
|
)%
|
(0.08
|
)%
|
|||||||||||||
|
Allowance for loan losses to period-end loans retained
(a)
|
1.21
|
|
1.31
|
|
1.21
|
|
1.31
|
|
|||||||||||||
|
Allowance for loan losses to period-end loans retained, excluding trade finance and conduits
(c)
|
2.35
|
|
2.75
|
|
2.35
|
|
2.75
|
|
|||||||||||||
|
Allowance for loan losses to nonaccrual loans retained
(a)(b)
|
567
|
|
227
|
|
567
|
|
227
|
|
|||||||||||||
|
Nonaccrual loans to total period-end loans
|
0.34
|
|
0.70
|
|
0.34
|
|
0.70
|
|
|||||||||||||
|
Business metrics
|
|||||||||||||||||||||
|
Assets under custody (“AUC”) by asset class (period-end) in billions:
|
|||||||||||||||||||||
|
Fixed Income
|
$
|
11,421
|
|
$
|
11,302
|
|
1
|
|
$
|
11,421
|
|
$
|
11,302
|
|
1
|
|
|||||
|
Equity
|
5,961
|
|
5,025
|
|
19
|
|
5,961
|
|
5,025
|
|
19
|
|
|||||||||
|
Other
(d)
|
1,547
|
|
1,338
|
|
16
|
|
1,547
|
|
1,338
|
|
16
|
|
|||||||||
|
Total AUC
|
$
|
18,929
|
|
$
|
17,665
|
|
7
|
|
$
|
18,929
|
|
$
|
17,665
|
|
7
|
|
|||||
|
Client deposits and other third party liabilities (average)
|
$
|
369,108
|
|
$
|
348,102
|
|
6
|
|
$
|
363,218
|
|
$
|
352,533
|
|
3
|
|
|||||
|
Trade finance loans (period-end)
|
36,375
|
|
35,291
|
|
3
|
%
|
36,375
|
|
35,291
|
|
3
|
%
|
|||||||||
|
(a)
|
Loans retained includes credit portfolio loans, trade finance loans, other held-for-investment loans and overdrafts.
|
|
(b)
|
Allowance for loan losses of $70 million and $202 million were held against these nonaccrual loans at June 30, 2013 and 2012, respectively.
|
|
(c)
|
Management uses allowance for loan losses to period-end loans retained, excluding trade finance and conduits, a non-GAAP financial measure, to provide a more meaningful assessment of CIB’s allowance coverage ratio.
|
|
(d)
|
Consists of mutual funds, unit investment trusts, currencies, annuities, insurance contracts, options and other contracts.
|
38
|
Market shares and rankings
(a)
|
||||||||||||
|
Six months ended
June 30, 2013
|
Full-year 2012
|
|||||||||||
|
Market Share
|
Rankings
|
Market Share
|
Rankings
|
|||||||||
|
Global investment banking fees
(b)
|
8.9
|
%
|
#1
|
7.5
|
%
|
#1
|
|
|||||
|
Debt, equity and equity-related
|
||||||||||||
|
Global
|
7.4
|
|
1
|
7.2
|
|
1
|
|
|||||
|
U.S.
|
11.7
|
|
1
|
11.5
|
|
1
|
|
|||||
|
Syndicated loans
|
||||||||||||
|
Global
|
10.0
|
|
1
|
9.6
|
|
1
|
|
|||||
|
U.S.
|
17.3
|
|
1
|
17.6
|
|
1
|
|
|||||
|
Long-term debt
(c)
|
||||||||||||
|
Global
|
7.4
|
|
1
|
7.1
|
|
1
|
|
|||||
|
U.S.
|
11.9
|
|
1
|
11.6
|
|
1
|
|
|||||
|
Equity and equity-related
|
||||||||||||
|
Global
(d)
|
7.5
|
|
2
|
7.8
|
|
4
|
|
|||||
|
U.S.
|
11.6
|
|
3
|
10.4
|
|
5
|
|
|||||
|
Announced M&A
(e)
|
||||||||||||
|
Global
|
24.3
|
|
2
|
19.8
|
|
2
|
|
|||||
|
U.S.
|
37.6
|
|
1
|
24.3
|
|
2
|
|
|||||
|
(a)
|
Source: Dealogic. Global Investment Banking fees reflects the ranking of fees and market share. The remaining rankings reflects transaction volume and market share. Global announced M&A is based on transaction value at announcement; because of joint M&A assignments, M&A market share of all participants will add up to more than 100%. All other transaction volume-based rankings are based on proceeds, with full credit to each book manager/equal if joint.
|
|
(b)
|
Global investment banking fees rankings exclude money market, short-term debt and shelf deals.
|
|
(c)
|
Long-term debt rankings include investment-grade, high-yield, supranationals, sovereigns, agencies, covered bonds, asset-backed securities (“ABS”) and mortgage-backed securities; and exclude money market, short-term debt, and U.S. municipal securities.
|
|
(d)
|
Global equity and equity-related ranking includes rights offerings and Chinese A-Shares.
|
|
(e)
|
Announced M&A reflects the removal of any withdrawn transactions. U.S. announced M&A represents any U.S. involvement ranking.
|
39
|
International metrics
|
|||||||||||||||||||||
|
As of or for the three
months ended June 30,
|
As of or for the six
months ended June 30,
|
||||||||||||||||||||
|
(in millions)
|
2013
|
2012
|
Change
|
2013
|
2012
|
Change
|
|||||||||||||||
|
Total net revenue
(a)
|
|||||||||||||||||||||
|
Europe/Middle East/Africa
|
$
|
2,955
|
|
$
|
2,885
|
|
2
|
%
|
$
|
6,338
|
|
$
|
5,935
|
|
7
|
%
|
|||||
|
Asia/Pacific
|
1,403
|
|
1,020
|
|
38
|
|
2,568
|
|
2,130
|
|
21
|
|
|||||||||
|
Latin America/Caribbean
|
397
|
|
375
|
|
6
|
|
797
|
|
795
|
|
—
|
|
|||||||||
|
Total international net revenue
|
4,755
|
|
4,280
|
|
11
|
|
9,703
|
|
8,860
|
|
10
|
|
|||||||||
|
North America
|
5,121
|
|
4,706
|
|
9
|
|
10,313
|
|
9,464
|
|
9
|
|
|||||||||
|
Total net revenue
|
$
|
9,876
|
|
$
|
8,986
|
|
10
|
|
$
|
20,016
|
|
$
|
18,324
|
|
9
|
|
|||||
|
Loans (period-end)
(a)
|
|||||||||||||||||||||
|
Europe/Middle East/Africa
|
$
|
32,685
|
|
$
|
33,041
|
|
(1
|
)
|
$
|
32,685
|
|
$
|
33,041
|
|
(1
|
)
|
|||||
|
Asia/Pacific
|
26,616
|
|
27,058
|
|
(2
|
)
|
26,616
|
|
27,058
|
|
(2
|
)
|
|||||||||
|
Latin America/Caribbean
|
10,434
|
|
9,982
|
|
5
|
|
10,434
|
|
9,982
|
|
5
|
|
|||||||||
|
Total international loans
|
69,735
|
|
70,081
|
|
—
|
|
69,735
|
|
70,081
|
|
—
|
|
|||||||||
|
North America
|
36,513
|
|
44,539
|
|
(18
|
)
|
36,513
|
|
44,539
|
|
(18
|
)
|
|||||||||
|
Total loans
|
$
|
106,248
|
|
$
|
114,620
|
|
(7
|
)
|
$
|
106,248
|
|
$
|
114,620
|
|
(7
|
)
|
|||||
|
Client deposits and other third-party liabilities (average)
(a)
|
|||||||||||||||||||||
|
Europe/Middle East/Africa
|
$
|
139,801
|
|
$
|
127,173
|
|
10
|
|
$
|
137,085
|
|
$
|
127,484
|
|
8
|
|
|||||
|
Asia/Pacific
|
51,666
|
|
50,331
|
|
3
|
|
51,830
|
|
50,264
|
|
3
|
|
|||||||||
|
Latin America/Caribbean
|
15,012
|
|
10,453
|
|
44
|
|
13,604
|
|
11,153
|
|
22
|
|
|||||||||
|
Total international
|
$
|
206,479
|
|
$
|
187,957
|
|
10
|
|
$
|
202,519
|
|
$
|
188,901
|
|
7
|
|
|||||
|
North America
|
162,629
|
|
160,145
|
|
2
|
|
160,699
|
|
163,632
|
|
(2
|
)
|
|||||||||
|
Total client deposits and other third-party liabilities
|
$
|
369,108
|
|
$
|
348,102
|
|
6
|
|
$
|
363,218
|
|
$
|
352,533
|
|
3
|
|
|||||
|
AUC (period-end) (in billions)
(a)
|
|||||||||||||||||||||
|
North America
|
$
|
10,672
|
|
$
|
10,048
|
|
6
|
|
$
|
10,672
|
|
$
|
10,048
|
|
6
|
|
|||||
|
All other regions
|
8,257
|
|
7,617
|
|
8
|
|
8,257
|
|
7,617
|
|
8
|
|
|||||||||
|
Total AUC
|
$
|
18,929
|
|
$
|
17,665
|
|
7
|
%
|
$
|
18,929
|
|
$
|
17,665
|
|
7
|
%
|
|||||
|
(a)
|
Total net revenue is based predominantly on the domicile of the client or location of the trading desk, as applicable. Loans outstanding (excluding loans held-for-sale and loans carried at fair value), client deposits and other third-party liabilities, and AUC are based predominantly on the domicile of the client.
|
40
|
COMMERCIAL BANKING
|
||||
For a discussion of the business profile of CB, see pages 96–98 of JPMorgan Chase’s 2012 Annual Report and the Introduction on page
5
of this Form 10-Q.
|
Selected income statement data
|
|||||||||||||||||||||
|
Three months ended June 30,
|
Six months ended June 30,
|
||||||||||||||||||||
|
(in millions, except ratios)
|
2013
|
2012
|
Change
|
2013
|
2012
|
Change
|
|||||||||||||||
|
Revenue
|
|||||||||||||||||||||
|
Lending- and deposit-related fees
|
$
|
265
|
|
$
|
264
|
|
—
|
%
|
$
|
524
|
|
$
|
540
|
|
(3
|
)%
|
|||||
|
Asset management, administration and commissions
|
30
|
|
34
|
|
(12
|
)
|
62
|
|
70
|
|
(11
|
)
|
|||||||||
|
All other income
(a)
|
256
|
|
264
|
|
(3
|
)
|
500
|
|
509
|
|
(2
|
)
|
|||||||||
|
Noninterest revenue
|
551
|
|
562
|
|
(2
|
)
|
1,086
|
|
1,119
|
|
(3
|
)
|
|||||||||
|
Net interest income
|
1,177
|
|
1,129
|
|
4
|
|
2,315
|
|
2,229
|
|
4
|
|
|||||||||
|
Total net revenue
(b)
|
1,728
|
|
1,691
|
|
2
|
|
3,401
|
|
3,348
|
|
2
|
|
|||||||||
|
Provision for credit losses
|
44
|
|
(17
|
)
|
NM
|
|
83
|
|
60
|
|
38
|
|
|||||||||
|
Noninterest expense
|
|||||||||||||||||||||
|
Compensation expense
(c)
|
286
|
|
245
|
|
17
|
|
575
|
|
501
|
|
15
|
|
|||||||||
|
Noncompensation expense
(c)
|
361
|
|
339
|
|
6
|
|
709
|
|
674
|
|
5
|
|
|||||||||
|
Amortization of intangibles
|
5
|
|
7
|
|
(29
|
)
|
12
|
|
14
|
|
(14
|
)
|
|||||||||
|
Total noninterest expense
|
652
|
|
591
|
|
10
|
|
1,296
|
|
1,189
|
|
9
|
|
|||||||||
|
Income before income tax expense
|
1,032
|
|
1,117
|
|
(8
|
)
|
2,022
|
|
2,099
|
|
(4
|
)
|
|||||||||
|
Income tax expense
|
411
|
|
444
|
|
(7
|
)
|
805
|
|
835
|
|
(4
|
)
|
|||||||||
|
Net income
|
$
|
621
|
|
$
|
673
|
|
(8
|
)
|
$
|
1,217
|
|
$
|
1,264
|
|
(4
|
)
|
|||||
|
Revenue by product
|
|||||||||||||||||||||
|
Lending
|
$
|
971
|
|
$
|
920
|
|
6
|
|
$
|
1,895
|
|
$
|
1,812
|
|
5
|
|
|||||
|
Treasury services
|
607
|
|
603
|
|
1
|
|
1,212
|
|
1,205
|
|
1
|
|
|||||||||
|
Investment banking
|
132
|
|
129
|
|
2
|
|
250
|
|
249
|
|
—
|
|
|||||||||
|
Other
(d)
|
18
|
|
39
|
|
(54
|
)
|
44
|
|
82
|
|
(46
|
)
|
|||||||||
|
Total Commercial Banking net revenue
|
$
|
1,728
|
|
$
|
1,691
|
|
2
|
|
$
|
3,401
|
|
$
|
3,348
|
|
2
|
|
|||||
|
Investment banking revenue, gross
(e)
|
$
|
385
|
|
$
|
384
|
|
—
|
|
$
|
726
|
|
$
|
723
|
|
—
|
|
|||||
|
Revenue by client segment
|
|||||||||||||||||||||
|
Middle Market Banking
(f)
|
$
|
777
|
|
$
|
740
|
|
5
|
|
$
|
1,530
|
|
$
|
1,471
|
|
4
|
|
|||||
|
Corporate Client Banking
(f)
|
444
|
|
436
|
|
2
|
|
877
|
|
867
|
|
1
|
|
|||||||||
|
Commercial Term Lending
|
315
|
|
291
|
|
8
|
|
606
|
|
584
|
|
4
|
|
|||||||||
|
Real Estate Banking
|
113
|
|
114
|
|
(1
|
)
|
225
|
|
219
|
|
3
|
|
|||||||||
|
Other
|
79
|
|
110
|
|
(28
|
)
|
163
|
|
207
|
|
(21
|
)
|
|||||||||
|
Total Commercial Banking net revenue
|
$
|
1,728
|
|
$
|
1,691
|
|
2
|
%
|
$
|
3,401
|
|
$
|
3,348
|
|
2
|
%
|
|||||
|
Financial ratios
|
|||||||||||||||||||||
|
Return on common equity
|
18
|
%
|
28
|
%
|
18
|
%
|
27
|
%
|
|||||||||||||
|
Overhead ratio
|
38
|
|
35
|
|
38
|
|
36
|
|
|||||||||||||
|
(a)
|
Includes revenue from investment banking products and commercial card transactions.
|
|
(b)
|
Total net revenue included tax-equivalent adjustments from income tax credits related to equity investments in designated community development entities that provide loans to qualified businesses in low-income communities, as well as tax-exempt income from municipal bond activity of
$90 million
and
$99 million
for the three months ended June 30, 2013 and 2012, respectively, and
$183 million
and
$193 million
for the six months ended June 30, 2013 and 2012, respectively.
|
|
(c)
|
Effective July 1, 2012, certain Treasury Services product sales staff supporting CB were transferred from CIB to CB. As a result, compensation expense for these sales staff is now reflected in CB’s compensation expense rather than as an allocation from CIB in noncompensation expense. CB’s and CIB’s previously reported headcount, compensation expense and noncompensation expense have been revised to reflect this transfer.
|
|
(d)
|
Other revenue in the fourth quarter of 2012 included a $49 million year-to-date reclassification of tax equivalent revenue to Corporate/Private Equity.
|
|
(e)
|
Represents the total revenue related to investment banking products sold to CB clients.
|
|
(f)
|
Effective January 1, 2013, the financial results of financial institution clients were transferred to Corporate Client Banking from Middle Market Banking. Prior periods were revised to conform with this presentation.
|
41
Quarterly results
Net income was $621 million, a decrease of $52 million, or 8% compared with the prior year, reflecting a higher provision for credit losses and an increase in noninterest expense, partially offset by higher net revenue.
Net revenue was $1.7 billion, an increase of $37 million, or 2%, compared with the prior year. Net interest income was $1.2 billion, an increase of $48 million, or 4%, driven by higher loan and liability balances, partially offset by lower purchase discounts recognized on loan repayments and spread compression on liability products. Noninterest revenue was $551 million, a decrease of $11 million, or 2% compared with the prior year, driven by lower community development investment-related revenue, partially offset by increased deposit-related fees, credit card revenue, and investment banking fees.
Revenue from Middle Market Banking was $777 million, an increase of $37 million, or 5%, from the prior year. Revenue from Corporate Client Banking was $444 million, an increase of $8 million, or 2%, compared with the prior year. Revenue from Commercial Term Lending was $315 million, an increase of $24 million, or 8%, compared with the prior year. Revenue from Real Estate Banking was $113 million, flat compared with the prior year.
The provision for credit losses was $44 million, compared with a benefit of $17 million in the prior year. Net charge-offs were $9 million (0.03% net charge-off rate), compared with net recoveries of $9 million (0.03% net recovery rate) in the prior year. The allowance for loan losses to period-end loans retained was 2.06%, down from 2.20% in the prior year. Nonaccrual loans were $513 million, down $404 million, or 44%, from the prior year mainly due to repayments.
Noninterest expense was $652 million, up 10% compared with the prior year, reflecting higher headcount-related expense and increased operating expense for Commercial Card.
Year-to-date results
Net income was $1.2 billion, a decrease of $47 million, or 4%, compared with the prior year. The decrease reflected higher noninterest expense and provision for credit losses, partially offset by an increase in net revenue.
Net revenue was $3.4 billion, an increase of $53 million, or 2%, compared with the prior year. Net interest income was $2.3 billion, an increase of $86 million, or 4%, driven by growth in loan balances, partially offset by lower purchase discounts recognized on loan repayments. Noninterest revenue was $1.1 billion, down $33 million, or 3%, driven by lower community development investment-related revenue and lower lending-related fees.
On a client segment basis, revenue from Middle Market Banking was $1.5 billion, an increase of $59 million, or 4%, from the prior year. Revenue from Corporate Client Banking was $877 million, up $10 million, or 1%, compared with the prior year. Revenue from Commercial Term Lending was $606 million, an increase of $22 million, or 4%, compared with the prior year. Revenue from Real Estate Banking was $225 million, an increase of $6 million, or 3%.
The provision for credit losses was $83 million, compared with $60 million in the prior year. Net charge-offs were $2 million compared with $3 million in the prior year. The allowance for loan losses to period-end loans retained was 2.06%, down from 2.20% in the prior year. Nonaccrual loans were $513 million, down $404 million, or 44%, from the prior year due to commercial real estate repayments, charge-offs and loan sales.
Noninterest expense was $1.3 billion, an increase of $107 million, or 9%, from the prior year, reflecting higher headcount-related expense and increased operating expense for Commercial Card.
42
|
Selected metrics
|
|||||||||||||||||||||
|
As of or for the three
months ended June 30,
|
As of or for the six
months ended June 30,
|
||||||||||||||||||||
|
(in millions, except headcount and ratios)
|
2013
|
2012
|
Change
|
2013
|
2012
|
Change
|
|||||||||||||||
|
Selected balance sheet data (period-end)
|
|||||||||||||||||||||
|
Total assets
|
$
|
184,124
|
|
$
|
163,698
|
|
12
|
%
|
$
|
184,124
|
|
$
|
163,698
|
|
12
|
%
|
|||||
|
Loans:
|
|||||||||||||||||||||
|
Loans retained
(a)
|
130,487
|
|
119,946
|
|
9
|
|
130,487
|
|
119,946
|
|
9
|
|
|||||||||
|
Loans held-for-sale and loans at fair value
|
430
|
|
547
|
|
(21
|
)
|
430
|
|
547
|
|
(21
|
)
|
|||||||||
|
Total loans
|
$
|
130,917
|
|
$
|
120,493
|
|
9
|
|
$
|
130,917
|
|
$
|
120,493
|
|
9
|
|
|||||
|
Equity
|
13,500
|
|
9,500
|
|
42
|
|
13,500
|
|
9,500
|
|
42
|
|
|||||||||
|
Period-end loans by client segment
|
|||||||||||||||||||||
|
Middle Market Banking
(b)
|
$
|
52,053
|
|
$
|
47,472
|
|
10
|
|
$
|
52,053
|
|
$
|
47,472
|
|
10
|
|
|||||
|
Corporate Client Banking
(b)
|
19,933
|
|
19,005
|
|
5
|
|
19,933
|
|
19,005
|
|
5
|
|
|||||||||
|
Commercial Term Lending
|
45,865
|
|
40,972
|
|
12
|
|
45,865
|
|
40,972
|
|
12
|
|
|||||||||
|
Real Estate Banking
|
9,395
|
|
8,819
|
|
7
|
|
9,395
|
|
8,819
|
|
7
|
|
|||||||||
|
Other
|
3,671
|
|
4,225
|
|
(13
|
)
|
3,671
|
|
4,225
|
|
(13
|
)
|
|||||||||
|
Total Commercial Banking loans
|
$
|
130,917
|
|
$
|
120,493
|
|
9
|
|
$
|
130,917
|
|
$
|
120,493
|
|
9
|
|
|||||
|
Selected balance sheet data (average)
|
|||||||||||||||||||||
|
Total assets
|
$
|
184,951
|
|
$
|
163,423
|
|
13
|
|
$
|
183,792
|
|
$
|
162,249
|
|
13
|
|
|||||
|
Loans:
|
|||||||||||||||||||||
|
Loans retained
(a)
|
130,338
|
|
117,835
|
|
11
|
|
129,419
|
|
115,357
|
|
12
|
|
|||||||||
|
Loans held-for-sale and loans at fair value
|
1,251
|
|
599
|
|
109
|
|
1,027
|
|
740
|
|
39
|
|
|||||||||
|
Total loans
|
$
|
131,589
|
|
$
|
118,434
|
|
11
|
|
$
|
130,446
|
|
$
|
116,097
|
|
12
|
|
|||||
|
Client deposits and other third-party liabilities
|
195,232
|
|
193,280
|
|
1
|
|
195,598
|
|
196,729
|
|
(1
|
)
|
|||||||||
|
Equity
|
13,500
|
|
9,500
|
|
42
|
|
13,500
|
|
9,500
|
|
42
|
|
|||||||||
|
Average loans by client segment
|
|||||||||||||||||||||
|
Middle Market Banking
(b)
|
$
|
52,205
|
|
$
|
46,679
|
|
12
|
|
$
|
52,110
|
|
$
|
45,755
|
|
14
|
|
|||||
|
Corporate Client Banking
(b)
|
21,344
|
|
18,789
|
|
14
|
|
21,203
|
|
18,260
|
|
16
|
|
|||||||||
|
Commercial Term Lending
|
45,087
|
|
40,060
|
|
13
|
|
44,469
|
|
39,454
|
|
13
|
|
|||||||||
|
Real Estate Banking
|
9,277
|
|
8,808
|
|
5
|
|
8,979
|
|
8,575
|
|
5
|
|
|||||||||
|
Other
|
3,676
|
|
4,098
|
|
(10
|
)
|
3,685
|
|
4,053
|
|
(9
|
)
|
|||||||||
|
Total Commercial Banking loans
|
$
|
131,589
|
|
$
|
118,434
|
|
11
|
|
$
|
130,446
|
|
$
|
116,097
|
|
12
|
|
|||||
|
Headcount
(c)(d)
|
6,660
|
|
6,042
|
|
10
|
%
|
6,660
|
|
6,042
|
|
10
|
%
|
|||||||||
|
(a)
|
Effective January 1, 2013, whole loan financing agreements, previously reported as other assets, were reclassified as loans. For the three months ended June 30, 2013, the impact on period-end loans was $2.1 billion, and the impact on average loans was $1.8 billion.
|
|
(b)
|
Effective January 1, 2013, the financial results of financial institution clients were transferred to Corporate Client Banking from Middle Market Banking. Prior periods were revised to conform with this presentation.
|
|
(c)
|
Effective July 1, 2012, certain Treasury Services product sales staff supporting CB were transferred from CIB to CB. For further discussion of this transfer, see footnote (c) on page 41 of this Form 10-Q.
|
|
(d)
|
Effective January 1, 2013, headcount includes transfers from other business segments largely related to operations, technology and other support staff.
|
43
|
Selected metrics
|
|||||||||||||||||||||
|
As of or for the three
months ended June 30,
|
As of or for the six
months ended June 30,
|
||||||||||||||||||||
|
(in millions, except ratios)
|
2013
|
2012
|
Change
|
2013
|
2012
|
Change
|
|||||||||||||||
|
Credit data and quality statistics
|
|||||||||||||||||||||
|
Net charge-offs/(recoveries)
|
$
|
9
|
|
$
|
(9
|
)
|
NM
|
|
$
|
2
|
|
$
|
3
|
|
(33
|
)%
|
|||||
|
Nonperforming assets
|
|||||||||||||||||||||
|
Nonaccrual loans:
|
|||||||||||||||||||||
|
Nonaccrual loans retained
(a)
|
505
|
|
881
|
|
(43
|
)%
|
505
|
|
881
|
|
(43
|
)
|
|||||||||
|
Nonaccrual loans held-for-sale and loans at fair value
|
8
|
|
36
|
|
(78
|
)
|
8
|
|
36
|
|
(78
|
)
|
|||||||||
|
Total nonaccrual loans
|
513
|
|
917
|
|
(44
|
)
|
513
|
|
917
|
|
(44
|
)
|
|||||||||
|
Assets acquired in loan satisfactions
|
30
|
|
36
|
|
(17
|
)
|
30
|
|
36
|
|
(17
|
)
|
|||||||||
|
Total nonperforming assets
|
543
|
|
953
|
|
(43
|
)
|
543
|
|
953
|
|
(43
|
)
|
|||||||||
|
Allowance for credit losses:
|
|||||||||||||||||||||
|
Allowance for loan losses
|
2,691
|
|
2,638
|
|
2
|
|
2,691
|
|
2,638
|
|
2
|
|
|||||||||
|
Allowance for lending-related commitments
|
183
|
|
209
|
|
(12
|
)
|
183
|
|
209
|
|
(12
|
)
|
|||||||||
|
Total allowance for credit losses
|
2,874
|
|
2,847
|
|
1
|
%
|
2,874
|
|
2,847
|
|
1
|
%
|
|||||||||
|
Net charge-off/(recovery) rate
(b)
|
0.03
|
%
|
(0.03
|
)%
|
—
|
%
|
0.01
|
%
|
|||||||||||||
|
Allowance for loan losses to period-end loans
retained
|
2.06
|
|
2.20
|
|
2.06
|
|
2.20
|
|
|||||||||||||
|
Allowance for loan losses to nonaccrual loans retained
(a)
|
533
|
|
299
|
|
533
|
|
299
|
|
|||||||||||||
|
Nonaccrual loans to total period-end loans
|
0.39
|
|
0.76
|
|
0.39
|
|
0.76
|
|
|||||||||||||
|
(a)
|
Allowance for loan losses of
$79 million
and
$143 million
was held against nonaccrual loans retained at June 30, 2013 and 2012, respectively.
|
|
(b)
|
Loans held-for-sale and loans at fair value were excluded when calculating the net charge-off/(recovery) rate.
|
44
|
ASSET MANAGEMENT
|
||||
For a discussion of the business profile of AM, see pages 99–101 of JPMorgan Chase’s 2012 Annual Report and the Introduction on page
5
of this Form 10-Q.
|
Selected income statement data
|
|||||||||||||||||||||
|
Three months ended June 30,
|
Six months ended June 30,
|
||||||||||||||||||||
|
(in millions, except ratios)
|
2013
|
2012
|
Change
|
2013
|
2012
|
Change
|
|||||||||||||||
|
Revenue
|
|||||||||||||||||||||
|
Asset management, administration and commissions
|
$
|
2,018
|
|
$
|
1,701
|
|
19
|
%
|
$
|
3,901
|
|
$
|
3,322
|
|
17
|
%
|
|||||
|
All other income
|
138
|
|
151
|
|
(9
|
)
|
349
|
|
417
|
|
(16
|
)
|
|||||||||
|
Noninterest revenue
|
2,156
|
|
1,852
|
|
16
|
|
4,250
|
|
3,739
|
|
14
|
|
|||||||||
|
Net interest income
|
569
|
|
512
|
|
11
|
|
1,128
|
|
995
|
|
13
|
|
|||||||||
|
Total net revenue
|
2,725
|
|
2,364
|
|
15
|
|
5,378
|
|
4,734
|
|
14
|
|
|||||||||
|
Provision for credit losses
|
23
|
|
34
|
|
(32
|
)
|
44
|
|
53
|
|
(17
|
)
|
|||||||||
|
Noninterest expense
|
|||||||||||||||||||||
|
Compensation expense
|
1,155
|
|
1,024
|
|
13
|
|
2,325
|
|
2,144
|
|
8
|
|
|||||||||
|
Noncompensation expense
|
716
|
|
655
|
|
9
|
|
1,400
|
|
1,241
|
|
13
|
|
|||||||||
|
Amortization of intangibles
|
21
|
|
22
|
|
(5
|
)
|
43
|
|
45
|
|
(4
|
)
|
|||||||||
|
Total noninterest expense
|
1,892
|
|
1,701
|
|
11
|
|
3,768
|
|
3,430
|
|
10
|
|
|||||||||
|
Income before income tax expense
|
810
|
|
629
|
|
29
|
|
1,566
|
|
1,251
|
|
25
|
|
|||||||||
|
Income tax expense
|
310
|
|
238
|
|
30
|
|
579
|
|
474
|
|
22
|
|
|||||||||
|
Net income
|
$
|
500
|
|
$
|
391
|
|
28
|
|
$
|
987
|
|
$
|
777
|
|
27
|
|
|||||
|
Revenue by client segment
|
|||||||||||||||||||||
|
Private Banking
|
$
|
1,483
|
|
$
|
1,341
|
|
11
|
|
$
|
2,929
|
|
$
|
2,620
|
|
12
|
|
|||||
|
Institutional
|
588
|
|
537
|
|
9
|
|
1,177
|
|
1,094
|
|
8
|
|
|||||||||
|
Retail
|
654
|
|
486
|
|
35
|
|
1,272
|
|
1,020
|
|
25
|
|
|||||||||
|
Total net revenue
|
$
|
2,725
|
|
$
|
2,364
|
|
15
|
%
|
$
|
5,378
|
|
$
|
4,734
|
|
14
|
%
|
|||||
|
Financial ratios
|
|||||||||||||||||||||
|
Return on common equity
|
22
|
%
|
22
|
%
|
22
|
%
|
22
|
%
|
|||||||||||||
|
Overhead ratio
|
69
|
|
72
|
|
70
|
|
72
|
|
|||||||||||||
|
Pretax margin ratio
|
30
|
|
27
|
|
29
|
|
26
|
|
|||||||||||||
Quarterly results
Net income was $500 million, an increase of $109 million, or 28%, from the prior year, reflecting higher net revenue, largely offset by higher noninterest expense.
Net revenue was $2.7 billion, an increase of $361 million, or 15%, from the prior year. Noninterest revenue was $2.2 billion, up $304 million, or 16%, from the prior year, due to the effect of higher market levels, net client inflows, and higher performance fees. Net interest income was $569 million, up $57 million, or 11%, from the prior year, due to higher loan and deposit balances, partially offset by narrower deposit and loan spreads.
Revenue from Private Banking was $1.5 billion, up 11% compared with the prior year. Revenue from Retail was $654 million, up 35%. Revenue from Institutional was $588 million, up 9%.
The provision for credit losses was $23 million, compared with $34 million in the prior year.
Noninterest expense was $1.9 billion, an increase of $191 million, or 11%, from the prior year, primarily due
to higher performance-based compensation and higher headcount-related expense driven by continued front office expansion efforts.
Year-to-date results
Net income was $987 million, an increase of $210 million, or 27%, from the prior year, reflecting higher net revenue, largely offset by higher noninterest expense.
Net revenue was $5.4 billion, an increase of $644 million, or 14%, from the prior year. Noninterest revenue was $4.3 billion, up $511 million, or 14%, from the prior year, due to net client inflows, the effect of higher market levels, and higher performance fees. Net interest income was $1.1 billion, up $133 million, or 13%, from the prior year, due to higher loan and deposit balances, partially offset by narrower deposit and loan spreads.
Revenue from Private Banking was $2.9 billion, up 12% from the prior year. Revenue from Retail was $1.3 billion, up 25%. Revenue from Institutional was $1.2 billion, up 8%.
The provision for credit losses was $44 million, compared with $53 million in the prior year.
45
Noninterest expense was $3.8 billion, an increase of $338 million, or 10%, from the prior year, primarily due to higher headcount-related expense driven by continued front
office expansion efforts and performance-based compensation.
|
Selected metrics
|
As of or for the three
months ended June 30,
|
As of or for the six
months ended June 30,
|
|||||||||||||||||||
|
(in millions, except headcount, ranking data and where otherwise noted)
|
2013
|
2012
|
Change
|
2013
|
2012
|
Change
|
|||||||||||||||
|
Number of:
|
|||||||||||||||||||||
|
Client advisors
|
2,804
|
|
2,739
|
|
2
|
%
|
2,804
|
|
2,739
|
|
2
|
%
|
|||||||||
|
% of customer assets in 4 & 5 Star Funds
(a)
|
52
|
%
|
43
|
%
|
52
|
%
|
43
|
%
|
|||||||||||||
|
% of AUM in 1
st
and 2
nd
quartiles:
(b)
|
|||||||||||||||||||||
|
1 year
|
73
|
|
65
|
|
73
|
|
65
|
|
|||||||||||||
|
3 years
|
77
|
|
72
|
|
77
|
|
72
|
|
|||||||||||||
|
5 years
|
76
|
|
74
|
|
76
|
|
74
|
|
|||||||||||||
|
Selected balance sheet data (period-end)
|
|||||||||||||||||||||
|
Total assets
|
$
|
115,157
|
|
$
|
98,704
|
|
17
|
|
$
|
115,157
|
|
$
|
98,704
|
|
17
|
|
|||||
|
Loans
(c)
|
86,043
|
|
70,470
|
|
22
|
|
86,043
|
|
70,470
|
|
22
|
|
|||||||||
|
Deposits
|
137,289
|
|
128,251
|
|
7
|
|
137,289
|
|
128,251
|
|
7
|
|
|||||||||
|
Equity
|
9,000
|
|
7,000
|
|
29
|
|
9,000
|
|
7,000
|
|
29
|
|
|||||||||
|
Selected balance sheet data (average)
|
|||||||||||||||||||||
|
Total assets
|
$
|
111,431
|
|
$
|
96,670
|
|
15
|
|
$
|
109,681
|
|
$
|
93,126
|
|
18
|
|
|||||
|
Loans
|
83,621
|
|
67,093
|
|
25
|
|
81,821
|
|
63,202
|
|
29
|
|
|||||||||
|
Deposits
|
136,577
|
|
128,087
|
|
7
|
|
138,001
|
|
127,811
|
|
8
|
|
|||||||||
|
Equity
|
9,000
|
|
7,000
|
|
29
|
|
9,000
|
|
7,000
|
|
29
|
|
|||||||||
|
Headcount
|
19,026
|
|
17,660
|
|
8
|
%
|
19,026
|
|
17,660
|
|
8
|
%
|
|||||||||
|
(a)
|
Derived from Morningstar for the U.S., the U.K., Luxembourg, France, Hong Kong and Taiwan; and Nomura for Japan.
|
|
(b)
|
Quartile ranking sourced from: Lipper for the U.S. and Taiwan; Morningstar for the U.K., Luxembourg, France and Hong Kong; and Nomura for Japan.
|
|
(c)
|
Included
$14.8 billion
and
$6.7 billion
of prime mortgage loans reported in the Consumer, excluding credit card, loan portfolio at June 30, 2013 and 2012, respectively. Excluded $4.8 billion and $9.9 billion of prime mortgage loans reported in the CIO portfolio within the Corporate/Private Equity segment at June 30, 2013 and 2012, respectively.
|
|
Selected metrics
|
As of or for the three
months ended June 30,
|
As of or for the six
months ended June 30,
|
|||||||||||||||||||
|
(in millions, except ratios and where otherwise noted)
|
2013
|
2012
|
Change
|
2013
|
2012
|
Change
|
|||||||||||||||
|
Credit data and quality statistics
|
|||||||||||||||||||||
|
Net charge-offs
|
$
|
4
|
|
$
|
28
|
|
(86
|
)%
|
$
|
27
|
|
$
|
55
|
|
(51
|
)%
|
|||||
|
Nonaccrual loans
|
244
|
|
256
|
|
(5
|
)
|
244
|
|
256
|
|
(5
|
)
|
|||||||||
|
Allowance for credit losses:
|
|||||||||||||||||||||
|
Allowance for loan losses
|
270
|
|
220
|
|
23
|
|
270
|
|
220
|
|
23
|
|
|||||||||
|
Allowance for lending-related commitments
|
6
|
|
6
|
|
—
|
|
6
|
|
6
|
|
—
|
|
|||||||||
|
Total allowance for credit losses
|
276
|
|
226
|
|
22
|
|
276
|
|
226
|
|
22
|
|
|||||||||
|
Net charge-off rate
|
0.02
|
%
|
0.17
|
%
|
0.07
|
%
|
0.18
|
%
|
|||||||||||||
|
Allowance for loan losses to period-end loans
|
0.31
|
|
0.31
|
|
0.31
|
|
0.31
|
|
|||||||||||||
|
Allowance for loan losses to nonaccrual loans
|
111
|
|
86
|
|
111
|
|
86
|
|
|||||||||||||
|
Nonaccrual loans to period-end loans
|
0.28
|
|
0.36
|
|
0.28
|
|
0.36
|
|
|||||||||||||
|
AM firmwide disclosures
(a)
|
|||||||||||||||||||||
|
Total net revenue
|
$
|
3,226
|
|
$
|
2,726
|
|
18
|
|
$
|
6,338
|
|
$
|
5,436
|
|
17
|
|
|||||
|
Client assets (in billions)
(b)
|
2,323
|
|
2,098
|
|
11
|
|
2,323
|
|
2,098
|
|
11
|
|
|||||||||
|
Number of client advisors
|
5,828
|
|
5,814
|
|
—
|
%
|
5,828
|
|
5,814
|
|
—
|
%
|
|||||||||
|
(a)
|
Includes Chase Wealth Management (“CWM”), which is a unit of Consumer & Business Banking. The firmwide metrics are presented in order to capture AM’s partnership with CWM. Management reviews firmwide metrics in assessing the financial performance of AM’s client asset management business.
|
|
(b)
|
Excludes CWM client assets that are managed by AM.
|
46
Client assets
Client assets were $2.2 trillion, an increase of $189 billion, or 10%, compared with the prior year. Assets under management were $1.5 trillion, an increase of $123 billion, or 9%, from the prior year, due to net inflows to long-term products and the effect of higher market levels, partially
offset by net outflows from liquidity products. Custody, brokerage, administration and deposit balances were $687 billion, up $66 billion, or 11%, from the prior year, due to the effect of higher market levels and custody inflows.
|
Client assets
|
June 30,
|
|||||||||
|
(in billions)
|
2013
|
2012
|
Change
|
|||||||
|
Assets by asset class
|
||||||||||
|
Liquidity
|
$
|
431
|
|
$
|
452
|
|
(5
|
)%
|
||
|
Fixed income
|
325
|
|
309
|
|
5
|
|
||||
|
Equity
|
316
|
|
250
|
|
26
|
|
||||
|
Multi-asset and alternatives
|
398
|
|
336
|
|
18
|
|
||||
|
Total assets under management
|
1,470
|
|
1,347
|
|
9
|
|
||||
|
Custody/brokerage/administration/deposits
|
687
|
|
621
|
|
11
|
|
||||
|
Total client assets
|
$
|
2,157
|
|
$
|
1,968
|
|
10
|
|
||
|
Alternative client assets
(a)
|
147
|
|
144
|
|
2
|
|
||||
|
Assets by client segment
|
||||||||||
|
Private Banking
|
$
|
340
|
|
$
|
297
|
|
14
|
|
||
|
Institutional
|
723
|
|
702
|
|
3
|
|
||||
|
Retail
|
407
|
|
348
|
|
17
|
|
||||
|
Total assets under management
|
$
|
1,470
|
|
$
|
1,347
|
|
9
|
|
||
|
Private Banking
|
$
|
910
|
|
$
|
816
|
|
12
|
|
||
|
Institutional
|
723
|
|
702
|
|
3
|
|
||||
|
Retail
|
524
|
|
450
|
|
16
|
|
||||
|
Total client assets
|
$
|
2,157
|
|
$
|
1,968
|
|
10
|
|
||
|
Mutual fund assets by asset class
|
||||||||||
|
Liquidity
|
$
|
379
|
|
$
|
408
|
|
(7
|
)
|
||
|
Fixed income
|
139
|
|
119
|
|
17
|
|
||||
|
Equity
|
164
|
|
124
|
|
32
|
|
||||
|
Multi-asset and alternatives
|
60
|
|
43
|
|
40
|
|
||||
|
Total mutual fund assets
|
$
|
742
|
|
$
|
694
|
|
7
|
%
|
||
(a) Represents assets under management, as well as client balances in brokerage accounts.
|
Three months ended
June 30,
|
Six months ended
June 30,
|
||||||||||||||
|
(in billions)
|
2013
|
2012
|
2013
|
2012
|
|||||||||||
|
Assets under management rollforward
|
|||||||||||||||
|
Beginning balance
|
$
|
1,483
|
|
$
|
1,382
|
|
$
|
1,426
|
|
$
|
1,336
|
|
|||
|
Net asset flows:
|
|||||||||||||||
|
Liquidity
|
(22
|
)
|
(24
|
)
|
(24
|
)
|
(48
|
)
|
|||||||
|
Fixed income
|
4
|
|
6
|
|
6
|
|
15
|
|
|||||||
|
Equity
|
7
|
|
3
|
|
22
|
|
3
|
|
|||||||
|
Multi-asset and alternatives
|
14
|
|
4
|
|
27
|
|
11
|
|
|||||||
|
Market/performance/other impacts
|
(16
|
)
|
(24
|
)
|
13
|
|
30
|
|
|||||||
|
Ending balance, June 30
|
$
|
1,470
|
|
$
|
1,347
|
|
$
|
1,470
|
|
$
|
1,347
|
|
|||
|
Client assets rollforward
|
|||||||||||||||
|
Beginning balance
|
$
|
2,171
|
|
$
|
2,013
|
|
$
|
2,095
|
|
$
|
1,921
|
|
|||
|
Net asset flows
|
(4
|
)
|
(6
|
)
|
16
|
|
2
|
|
|||||||
|
Market/performance/other impacts
|
(10
|
)
|
(39
|
)
|
46
|
|
45
|
|
|||||||
|
Ending balance, June 30
|
$
|
2,157
|
|
$
|
1,968
|
|
$
|
2,157
|
|
$
|
1,968
|
|
|||
47
|
International metrics
|
As of or for the three
months ended June 30,
|
As of or for the six
months ended June 30,
|
|||||||||||||||||||
|
(in billions, except where otherwise noted)
|
2013
|
2012
|
Change
|
2013
|
2012
|
Change
|
|||||||||||||||
|
Total net revenue
(in millions)
(a)
|
|||||||||||||||||||||
|
Europe/Middle East/Africa
|
$
|
435
|
|
$
|
379
|
|
15
|
%
|
$
|
872
|
|
$
|
784
|
|
11
|
%
|
|||||
|
Asia/Pacific
|
291
|
|
230
|
|
27
|
|
568
|
|
466
|
|
22
|
|
|||||||||
|
Latin America/Caribbean
|
230
|
|
166
|
|
39
|
|
436
|
|
341
|
|
28
|
|
|||||||||
|
North America
|
1,769
|
|
1,589
|
|
11
|
|
3,502
|
|
3,143
|
|
11
|
|
|||||||||
|
Total net revenue
|
$
|
2,725
|
|
$
|
2,364
|
|
15
|
|
$
|
5,378
|
|
$
|
4,734
|
|
14
|
|
|||||
|
Assets under management
|
|||||||||||||||||||||
|
Europe/Middle East/Africa
|
$
|
261
|
|
$
|
261
|
|
—
|
|
$
|
261
|
|
$
|
261
|
|
—
|
|
|||||
|
Asia/Pacific
|
124
|
|
103
|
|
20
|
|
124
|
|
103
|
|
20
|
|
|||||||||
|
Latin America/Caribbean
|
40
|
|
41
|
|
(2
|
)
|
40
|
|
41
|
|
(2
|
)
|
|||||||||
|
North America
|
1,045
|
|
942
|
|
11
|
|
1,045
|
|
942
|
|
11
|
|
|||||||||
|
Total assets under management
|
$
|
1,470
|
|
$
|
1,347
|
|
9
|
|
$
|
1,470
|
|
$
|
1,347
|
|
9
|
|
|||||
|
Client assets
|
|||||||||||||||||||||
|
Europe/Middle East/Africa
|
$
|
317
|
|
$
|
315
|
|
1
|
|
$
|
317
|
|
$
|
315
|
|
1
|
|
|||||
|
Asia/Pacific
|
171
|
|
144
|
|
19
|
|
171
|
|
144
|
|
19
|
|
|||||||||
|
Latin America/Caribbean
|
105
|
|
101
|
|
4
|
|
105
|
|
101
|
|
4
|
|
|||||||||
|
North America
|
1,564
|
|
1,408
|
|
11
|
|
1,564
|
|
1,408
|
|
11
|
|
|||||||||
|
Total client assets
|
$
|
2,157
|
|
$
|
1,968
|
|
10
|
%
|
$
|
2,157
|
|
$
|
1,968
|
|
10
|
%
|
|||||
(a) Regional revenue is based on the domicile of the client.
48
|
CORPORATE/PRIVATE EQUITY
|
||||
For a discussion of Corporate/Private Equity, see pages 102–104 of JPMorgan Chase’s 2012 Annual Report and the Introduction on page
5
of this Form 10-Q.
|
Selected income statement data
(a)
|
|||||||||||||||||||||
|
As of or for the three
months ended June 30,
|
As of or for the six
months ended June 30,
|
||||||||||||||||||||
|
(in millions, except headcount)
|
2013
|
|
2012
|
|
Change
|
|
2013
|
|
2012
|
|
Change
|
|
|||||||||
|
Revenue
|
|||||||||||||||||||||
|
Principal transactions
|
$
|
393
|
|
$
|
(3,576
|
)
|
NM
|
|
$
|
131
|
|
$
|
(4,123
|
)
|
NM
|
|
|||||
|
Securities gains
|
124
|
|
1,013
|
|
(88
|
)%
|
633
|
|
1,462
|
|
(57
|
)%
|
|||||||||
|
All other income
|
(227
|
)
|
150
|
|
NM
|
|
(113
|
)
|
1,250
|
|
NM
|
|
|||||||||
|
Noninterest revenue
|
290
|
|
(2,413
|
)
|
NM
|
|
651
|
|
(1,411
|
)
|
NM
|
|
|||||||||
|
Net interest income
|
(676
|
)
|
(186
|
)
|
(263
|
)
|
(1,270
|
)
|
(148
|
)
|
NM
|
|
|||||||||
|
Total net revenue
(b)
|
(386
|
)
|
(2,599
|
)
|
85
|
|
(619
|
)
|
(1,559
|
)
|
60
|
|
|||||||||
|
Provision for credit losses
|
5
|
|
(11
|
)
|
NM
|
|
2
|
|
(20
|
)
|
NM
|
|
|||||||||
|
Noninterest expense
|
|||||||||||||||||||||
|
Compensation expense
|
624
|
|
523
|
|
19
|
|
1,197
|
|
1,221
|
|
(2
|
)
|
|||||||||
|
Noncompensation expense
(c)
|
1,345
|
|
1,169
|
|
15
|
|
1,987
|
|
4,360
|
|
(54
|
)
|
|||||||||
|
Subtotal
|
1,969
|
|
1,692
|
|
16
|
|
3,184
|
|
5,581
|
|
(43
|
)
|
|||||||||
|
Net expense allocated to other businesses
|
(1,253
|
)
|
(1,148
|
)
|
(9
|
)
|
(2,466
|
)
|
(2,275
|
)
|
(8
|
)
|
|||||||||
|
Total noninterest expense
|
716
|
|
544
|
|
32
|
|
718
|
|
3,306
|
|
(78
|
)
|
|||||||||
|
Income/(loss) before income tax expense/(benefit)
|
(1,107
|
)
|
(3,132
|
)
|
65
|
|
(1,339
|
)
|
(4,845
|
)
|
72
|
|
|||||||||
|
Income tax expense/(benefit)
|
(555
|
)
|
(1,370
|
)
|
59
|
|
(1,037
|
)
|
(2,072
|
)
|
50
|
|
|||||||||
|
Net income/(loss)
|
$
|
(552
|
)
|
$
|
(1,762
|
)
|
69
|
|
$
|
(302
|
)
|
$
|
(2,773
|
)
|
89
|
|
|||||
|
Total net revenue
|
|||||||||||||||||||||
|
Private equity
|
$
|
410
|
|
$
|
410
|
|
—
|
|
$
|
134
|
|
$
|
664
|
|
(80
|
)
|
|||||
|
Treasury and CIO
|
(648
|
)
|
(3,434
|
)
|
81
|
|
(535
|
)
|
(3,667
|
)
|
85
|
|
|||||||||
|
Other Corporate
(a)
|
(148
|
)
|
425
|
|
NM
|
|
(218
|
)
|
1,444
|
|
NM
|
|
|||||||||
|
Total net revenue
|
$
|
(386
|
)
|
$
|
(2,599
|
)
|
85
|
|
$
|
(619
|
)
|
$
|
(1,559
|
)
|
60
|
|
|||||
|
Net income/(loss)
|
|||||||||||||||||||||
|
Private equity
|
$
|
212
|
|
$
|
197
|
|
8
|
|
$
|
30
|
|
$
|
331
|
|
(91
|
)
|
|||||
|
Treasury and CIO
|
(429
|
)
|
(2,078
|
)
|
79
|
|
(405
|
)
|
(2,305
|
)
|
82
|
|
|||||||||
|
Other Corporate
(a)
|
(335
|
)
|
119
|
|
NM
|
|
73
|
|
(799
|
)
|
NM
|
|
|||||||||
|
Total net income/(loss)
|
$
|
(552
|
)
|
$
|
(1,762
|
)
|
69
|
|
$
|
(302
|
)
|
$
|
(2,773
|
)
|
89
|
|
|||||
|
Total assets (period-end)
(a)
|
$
|
806,044
|
|
$
|
663,681
|
|
21
|
|
$
|
806,044
|
|
$
|
663,681
|
|
21
|
|
|||||
|
Headcount
(a)
|
18,720
|
|
16,880
|
|
11
|
%
|
18,720
|
|
16,880
|
|
11
|
%
|
|||||||||
|
(a)
|
For the 2012 periods, certain income statement (including net expense allocated to other businesses) and balance sheet line items, as well as headcount were revised to reflect the transfer of certain functions and staff from Corporate/Private Equity to CCB, effective January 1, 2013. For further information on this transfer, see footnote (a) on page 19 of this Form 10-Q.
|
|
(b)
|
Included tax-equivalent adjustments, predominantly due to tax-exempt income from municipal bond investments of
$105 million
and $
118 million
for the three months ended June 30, 2013 and 2012, respectively, and
$208 million
and
$217 million
for the six months ended June 30, 2013 and 2012, respectively.
|
|
(c)
|
Included litigation expense of
$603 million
and
$332 million
for the three months ended June 30, 2013 and 2012, respectively, and
$595 million
and
$2.8 billion
for the six months ended June 30, 2013 and 2012.
|
49
Quarterly results
Net income was a loss of $552 million, compared with a loss of $1.8 billion in the prior year.
Private Equity reported net income of $212 million, compared with net income of $197 million in the prior year. Net revenue was $410 million, same as prior year.
Treasury and CIO reported a net loss of $429 million, compared with a net loss of $2.1 billion in the prior year. Net revenue was a loss of $648 million, compared with a loss of $3.4 billion in the prior year. The prior-year loss reflected
$4.4 billion
of principal transactions losses from the synthetic credit portfolio that had been held by CIO, partially offset by securities gains of $1.0 billion. Net revenue in the current quarter included net securities gains of $123 million from sales of available-for-sale investment securities and a modest loss related to the redemption of trust preferred securities. Current-quarter net interest income was a loss of $558 million due to low interest rates and limited reinvestment opportunities as well as the impact of repositioning into Liquidity Coverage Ratio ("LCR") eligible securities and cash.
Other Corporate reported a net loss of $335 million, compared with net income of $119 million in the prior year. Noninterest revenue included
$545 million
in the prior year related to the gain on the recovery of a Bear Stearns-related subordinated loan. The current quarter included approximately $600 million of expense for additional litigation reserves, compared with $335 million of expense for additional litigation reserves in the prior year.
Year-to-date results
Net Income was a loss of $302 million, compared with a loss of $2.8 billion in the prior year.
Private Equity reported net income of $30 million, compared with net income of $331 million in the prior year. Net revenue of $134 million was down from $664 million in the prior year, primarily due to lower net valuation gains on public and private investments.
Treasury and CIO reported a net loss of $405 million, compared with a net loss of $2.3 billion in the prior year. Net revenue was a loss of $535 million, compared with a loss of $3.7 billion in the prior year. The prior-year loss reflected
$5.8 billion
of principal transactions losses from the synthetic credit portfolio that had been held by CIO, partially offset by securities gains of $1.5 billion. Current year net revenue included net securities gains of $626 million from sales of available-for-sale investment securities and a modest loss related to the redemption of trust preferred securities. Net interest income was a loss of $1.0 billion due to low interest rates and limited reinvestment opportunities.
Other Corporate reported net income of $73 million, compare with a net loss of $799 million in the prior year. Noninterest revenue of $1.7 billion in prior year was driven by a
$1.1 billion
benefit from the Washington Mutual bankruptcy settlement and a $545 million gain on the recovery of a Bear Stearns-related subordinated loan. The current year included approximately $600 million of expense for additional litigation reserves, compared with $2.8 billion of expense for additional litigation reserves in the prior year.
Treasury and
CIO
overview
Treasury and CIO are predominantly responsible for measuring, monitoring, reporting and managing the Firm’s liquidity, funding, capital and structural interest rate and foreign exchange risks. The risks managed by Treasury and CIO arise from the activities undertaken by the Firm’s four major reportable business segments to serve their respective client bases, which generate both on- and off-balance sheet assets and liabilities. For further discussion of Treasury and CIO, see page 103 of the Firm’s 2012 Annual Report.
CIO achieves the Firm
’
s asset-liability management objectives generally by investing in high-quality securities that are managed for the longer-term as part of the Firm
’
s AFS investment portfolio. CIO also uses derivatives, as well as securities that are not classified within the AFS portfolio, to meet the Firm
’
s asset-liability management objectives. For further information on derivatives, see Note 5 on pages
131–142
of this Form 10-Q. For further information about securities not classified within the AFS portfolio, see Note 3 on pages
114–127
of this Form 10-Q. The Treasury and CIO AFS portfolio consists of U.S. and non-U.S. government securities, agency and non-agency mortgage-backed securities, other asset-backed securities and corporate and municipal debt securities. At June 30, 2013, the total Treasury and CIO AFS portfolio was
$349.0 billion
; the average credit rating of the securities comprising the Treasury and CIO AFS portfolio was AA+ (based upon external ratings where available and where not available, based primarily upon internal ratings that correspond to ratings as defined by S&P and Moody’s). See Note 11 on pages
147–150
of this Form 10-Q for further information on the details of the Firm’s AFS portfolio.
For further information on liquidity and funding risk, see Liq
uidity Risk Management on pages
66–72
of this Form 10-Q. For information on interest rate, foreign exchange and other risks, CIO VaR and the Firm’s nontrading interest rate-sensitive revenue at risk, see Market Risk Management on pages
95–99
of this Form 10-Q.
50
|
Selected income statement and balance sheet data
|
|||||||||||||||||||||
|
As of or for the three
months ended June 30,
|
As of or for the six
months ended June 30,
|
||||||||||||||||||||
|
(in millions)
|
2013
|
|
2012
|
|
Change
|
|
2013
|
|
2012
|
|
Change
|
|
|||||||||
|
Securities gains
|
$
|
123
|
|
$
|
1,013
|
|
(88
|
)%
|
$
|
626
|
|
$
|
1,466
|
|
(57
|
)%
|
|||||
|
Investment securities portfolio (average)
|
355,920
|
|
359,130
|
|
(1
|
)
|
360,753
|
|
360,366
|
|
—
|
|
|||||||||
|
Investment securities portfolio (period-end)
|
349,044
|
|
348,610
|
|
—
|
|
349,044
|
|
348,610
|
|
—
|
|
|||||||||
|
Mortgage loans (average)
|
5,556
|
|
11,012
|
|
(50
|
)
|
6,033
|
|
11,824
|
|
(49
|
)
|
|||||||||
|
Mortgage loans (period-end)
|
4,955
|
|
10,332
|
|
(52
|
)%
|
4,955
|
|
10,332
|
|
(52
|
)%
|
|||||||||
|
Private Equity Portfolio
|
|||||||||||||||||||||
|
Selected income statement and balance sheet data
|
|||||||||||||||||||||
|
Three months ended June 30,
|
Six months ended June 30,
|
||||||||||||||||||||
|
(in millions)
|
2013
|
|
2012
|
|
Change
|
|
2013
|
|
2012
|
|
Change
|
|
|||||||||
|
Private equity gains/(losses)
|
|||||||||||||||||||||
|
Realized gains/(losses)
|
$
|
40
|
|
$
|
(116
|
)
|
NM
|
|
$
|
88
|
|
$
|
(50
|
)
|
NM
|
|
|||||
|
Unrealized gains/(losses)
(a)
|
375
|
|
589
|
|
(36
|
)%
|
48
|
|
768
|
|
(94
|
)%
|
|||||||||
|
Total direct investments
|
415
|
|
473
|
|
(12
|
)
|
136
|
|
718
|
|
(81
|
)
|
|||||||||
|
Third-party fund investments
|
24
|
|
(9
|
)
|
NM
|
|
44
|
|
74
|
|
(41
|
)
|
|||||||||
|
Total private equity gains/(losses)
(b)
|
$
|
439
|
|
$
|
464
|
|
(5
|
)%
|
$
|
180
|
|
$
|
792
|
|
(77
|
)%
|
|||||
|
(a)
|
Unrealized gains/(losses) contain reversals of unrealized gains and losses that were recognized in prior periods and have now been realized.
|
|
(b)
|
Included in principal transactions revenue in the Consolidated Statements of Income.
|
|
Private equity portfolio information
(a)
|
||||||||||
|
Direct investments
|
||||||||||
|
(in millions)
|
June 30, 2013
|
December 31, 2012
|
Change
|
|
||||||
|
Publicly-held securities
|
||||||||||
|
Carrying value
|
$
|
550
|
|
$
|
578
|
|
(5
|
)%
|
||
|
Cost
|
346
|
|
350
|
|
(1
|
)
|
||||
|
Quoted public value
|
550
|
|
578
|
|
(5
|
)
|
||||
|
Privately-held direct securities
|
||||||||||
|
Carrying value
|
5,448
|
|
5,379
|
|
1
|
|
||||
|
Cost
|
6,831
|
|
6,584
|
|
4
|
|
||||
|
Third-party fund investments
(b)
|
||||||||||
|
Carrying value
|
1,958
|
|
2,117
|
|
(8
|
)
|
||||
|
Cost
|
1,968
|
|
1,963
|
|
—
|
|
||||
|
Total private equity portfolio
|
||||||||||
|
Carrying value
|
$
|
7,956
|
|
$
|
8,074
|
|
(1
|
)
|
||
|
Cost
|
$
|
9,145
|
|
$
|
8,897
|
|
3
|
%
|
||
|
(a)
|
For more information on the Firm’s policies regarding the valuation of the private equity portfolio, see Note 3 on pages
114–127
of this Form 10-Q.
|
|
(b)
|
Unfunded commitments to third-party private equity funds were
$251 million
and
$370 million
at June 30, 2013, and
December 31, 2012
, respectively.
|
51
|
INTERNATIONAL OPERATIONS
|
||||
During the three and six months ended June 30, 2013, managed revenue derived from clients, customers and counterparties domiciled outside of North America was approximately
$6.6 billion
and
$13.6 billion
, respectively. Of those amounts, approximately
63%
and
66%
, respectively, were derived from Europe/Middle East/Africa (“EMEA”); approximately
27%
and
25%
, respectively, from Asia/Pacific; and approximately
10%
and
9%
, respectively, from Latin America/Caribbean.
During the three and six months ended June 30, 2012, managed revenue derived from clients, customers and counterparties domiciled outside of North America was approximately
$2.0 billion
and
$7.5 billion
, respectively. Of those amounts, approximately
4%
and
47%
, respectively, were derived from EMEA; approximately
69%
and
38%
, respectively, from Asia/Pacific; and approximately
27%
and
15%
, respectively, from Latin America/Caribbean. For
additional information regarding international operations, see Note 32 on page 326 of JPMorgan Chase’s 2012 Annual Report.
International wholesale activities
The Firm is committed to further expanding its wholesale product capabilities outside of the United States as part of a comprehensive and coordinated international business strategy to address the needs of the Firm’s clients located in these regions.
Set forth below are certain key metrics related to the Firm’s wholesale international operations, including, for each of EMEA, Asia/Pacific and Latin America/Caribbean, the number of countries in each such region in which they operate, front-office headcount, number of clients, revenue and selected balance-sheet data.
|
EMEA
|
Asia/Pacific
|
Latin America/Caribbean
|
|||||||||||||||||||||||||||||||||||||||
|
(in millions, except headcount and where otherwise noted)
|
Three months ended June 30,
|
Six months ended
June 30,
|
Three months ended June 30,
|
Six months ended June 30,
|
Three months ended June 30,
|
Six months ended
June 30,
|
|||||||||||||||||||||||||||||||||||
|
2013
|
2012
|
2013
|
2012
|
2013
|
2012
|
2013
|
2012
|
2013
|
2012
|
2013
|
2012
|
||||||||||||||||||||||||||||||
|
Revenue
(a)
|
$
|
4,093
|
|
$
|
74
|
|
$
|
8,931
|
|
$
|
3,461
|
|
$
|
1,779
|
|
$
|
1,358
|
|
$
|
3,288
|
|
$
|
2,876
|
|
$
|
637
|
|
$
|
549
|
|
$
|
1,253
|
|
$
|
1,155
|
|
|||||
|
Countries of operation
(b)
|
33
|
|
33
|
|
33
|
|
33
|
|
17
|
|
16
|
|
17
|
|
16
|
|
9
|
|
9
|
|
9
|
|
9
|
|
|||||||||||||||||
|
Total headcount
(c)
|
15,346
|
|
15,745
|
|
15,346
|
|
15,745
|
|
21,179
|
|
20,327
|
|
21,179
|
|
20,327
|
|
1,457
|
|
1,367
|
|
1,457
|
|
1,367
|
|
|||||||||||||||||
|
Front-office headcount
|
5,801
|
|
5,804
|
|
5,801
|
|
5,804
|
|
4,237
|
|
4,169
|
|
4,237
|
|
4,169
|
|
591
|
|
562
|
|
591
|
|
562
|
|
|||||||||||||||||
|
Significant clients
(d)
|
1,037
|
|
957
|
|
1,037
|
|
957
|
|
520
|
|
499
|
|
520
|
|
499
|
|
179
|
|
150
|
|
179
|
|
150
|
|
|||||||||||||||||
|
Deposits (average)
(e)
|
$
|
188,123
|
|
$
|
165,879
|
|
$
|
182,848
|
|
$
|
166,722
|
|
$
|
55,585
|
|
$
|
59,507
|
|
$
|
56,012
|
|
$
|
60,539
|
|
$
|
5,279
|
|
$
|
4,608
|
|
$
|
5,312
|
|
$
|
4,693
|
|
|||||
|
Loans (period-end)
(f)
|
44,599
|
|
41,391
|
|
44,599
|
|
41,391
|
|
29,819
|
|
30,969
|
|
29,819
|
|
30,969
|
|
30,154
|
|
28,513
|
|
30,154
|
|
28,513
|
|
|||||||||||||||||
|
Assets under management
(in billions)
|
261
|
|
261
|
|
261
|
|
261
|
|
124
|
|
103
|
|
124
|
|
103
|
|
40
|
|
41
|
|
40
|
|
41
|
|
|||||||||||||||||
|
Client assets
(in billions)
|
317
|
|
315
|
|
317
|
|
315
|
|
171
|
|
144
|
|
171
|
|
144
|
|
105
|
|
101
|
|
105
|
|
101
|
|
|||||||||||||||||
|
Assets under custody (in billions)
|
6,515
|
|
5,925
|
|
6,515
|
|
5,925
|
|
1,513
|
|
1,434
|
|
1,513
|
|
1,434
|
|
229
|
|
258
|
|
229
|
|
258
|
|
|||||||||||||||||
Note: International wholesale operations is comprised of CIB, AM, CB, Treasury and CIO.
|
(a)
|
Revenue is based predominantly on the domicile of the client, the location from which the client relationship is managed, or the location of the trading desk.
|
|
(b)
|
Countries of operation represents locations where the Firm has a physical presence with employees actively engaged in “client facing” activities.
|
|
(c)
|
Total headcount includes all employees, including those in service centers, located in the region. Effective January 1, 2013, interns are excluded from the firmwide and business segment headcount metrics. Prior periods were revised to conform with this presentation.
|
|
(d)
|
Significant clients are defined as companies with over
$1 million
in revenue over a trailing 12-month period in the region (excludes private banking clients).
|
|
(e)
|
Deposits are based on the location from which the client relationship is managed.
|
|
(f)
|
Loans outstanding are based predominantly on the domicile of the borrower and exclude loans held-for-sale and loans carried at fair value.
|
52
|
BALANCE SHEET ANALYSIS
|
||||
|
Selected Consolidated Balance Sheets data
|
|||||||||
|
(in millions)
|
June 30, 2013
|
December 31, 2012
|
Change
|
||||||
|
Assets
|
|||||||||
|
Cash and due from banks
|
$
|
29,214
|
|
$
|
53,723
|
|
(46
|
)%
|
|
|
Deposits with banks
|
311,318
|
|
121,814
|
|
156
|
|
|||
|
Federal funds sold and securities purchased under resale agreements
|
252,507
|
|
296,296
|
|
(15
|
)
|
|||
|
Securities borrowed
|
117,158
|
|
119,017
|
|
(2
|
)
|
|||
|
Trading assets:
|
|||||||||
|
Debt and equity instruments
|
327,719
|
|
375,045
|
|
(13
|
)
|
|||
|
Derivative receivables
|
73,751
|
|
74,983
|
|
(2
|
)
|
|||
|
Securities
|
354,725
|
|
371,152
|
|
(4
|
)
|
|||
|
Loans
|
725,586
|
|
733,796
|
|
(1
|
)
|
|||
|
Allowance for loan losses
|
(19,384
|
)
|
(21,936
|
)
|
(12
|
)
|
|||
|
Loans, net of allowance for loan losses
|
706,202
|
|
711,860
|
|
(1
|
)
|
|||
|
Accrued interest and accounts receivable
|
81,562
|
|
60,933
|
|
34
|
|
|||
|
Premises and equipment
|
14,574
|
|
14,519
|
|
—
|
|
|||
|
Goodwill
|
48,057
|
|
48,175
|
|
—
|
|
|||
|
Mortgage servicing rights
|
9,335
|
|
7,614
|
|
23
|
|
|||
|
Other intangible assets
|
1,951
|
|
2,235
|
|
(13
|
)
|
|||
|
Other assets
|
111,421
|
|
101,775
|
|
9
|
|
|||
|
Total assets
|
$
|
2,439,494
|
|
$
|
2,359,141
|
|
3
|
|
|
|
Liabilities
|
|||||||||
|
Deposits
|
$
|
1,202,950
|
|
$
|
1,193,593
|
|
1
|
|
|
|
Federal funds purchased and securities loaned or sold under repurchase agreements
|
258,962
|
|
240,103
|
|
8
|
|
|||
|
Commercial paper
|
56,631
|
|
55,367
|
|
2
|
|
|||
|
Other borrowed funds
|
30,385
|
|
26,636
|
|
14
|
|
|||
|
Trading liabilities:
|
|
|
|||||||
|
Debt and equity instruments
|
84,208
|
|
61,262
|
|
37
|
|
|||
|
Derivative payables
|
64,385
|
|
70,656
|
|
(9
|
)
|
|||
|
Accounts payable and other liabilities
|
211,432
|
|
195,240
|
|
8
|
|
|||
|
Beneficial interests issued by consolidated VIEs
|
55,090
|
|
63,191
|
|
(13
|
)
|
|||
|
Long-term debt
|
266,212
|
|
249,024
|
|
7
|
|
|||
|
Total liabilities
|
2,230,255
|
|
2,155,072
|
|
3
|
|
|||
|
Stockholders’ equity
|
209,239
|
|
204,069
|
|
3
|
|
|||
|
Total liabilities and stockholders’ equity
|
$
|
2,439,494
|
|
$
|
2,359,141
|
|
3
|
%
|
|
Consolidated Balance Sheets overview
For a description of each of the significant line item captions on the Consolidated Balance Sheets, see pages 106–108 of JPMorgan Chase’s 2012 Annual Report.
JPMorgan Chase’s total assets increased by $80.4 billion or
3%
, and total liabilities increased $75.2 billion or
3%
from December 31, 2012. The increase in total assets was due to higher deposits with banks and higher accrued interest and
accounts receivable. These items were partially offset by lower trading assets - debt and equity instruments, federal funds sold and securities purchased under resale agreements, and cash and due from banks. The increase in total liabilities was related to higher trading liabilities - debt and equity instruments, federal funds purchased and securities loaned or sold under repurchase agreements, long-term debt, and accounts payable and other liabilities. Stockholders’ equity also increased.
The following is a discussion of the significant changes in the specific line item captions on the Consolidated Balance Sheets from December 31, 2012.
Cash and due from banks and deposits with banks
The net increase reflected the placement of the Firm’s excess funds with various central banks, primarily Federal Reserve Banks. For additional information, refer to the Liquidity Risk Management discussion on pages
66–72
of this Form 10-Q.
Federal funds sold and securities purchased under resale agreements; and securities borrowed
The decrease in securities purchased under resale agreements and securities borrowed was due primarily to a shift in the deployment of the Firm’s excess cash by Treasury.
Trading assets and liabilities
–
debt and equity instruments
The decrease in trading assets was driven by client-driven market-making activity in CIB, which resulted in lower levels of debt securities, equity securities and physical commodities. For additional information, refer to Note 3 on pages
114–127
of this Form 10-Q.
The increase in trading liabilities was driven by client-driven market-making activity in CIB, which resulted in higher levels of short debt and equity securities.
Trading assets and liabilities
–
derivative receivables and payables
Derivative receivables decreased primarily due to reductions in interest rate derivative receivables driven by an increase in interest rates. The decreases were partially offset by an increase in equity derivative receivables driven by a rise in equity markets.
Derivative payables decreased primarily due to reductions in interest rate derivative payables driven by the increase in interest rates. The decreases were partially offset by an increase in equity derivative payables primarily driven by a rise in equity markets.
For additional information, refer to Derivative contracts on page
90
, and Notes 3 and 5 on pages
114–127
and
131–142
, respectively, of this Form 10-Q.
53
Securities
The decrease was largely due to repositioning of the AFS securities portfolio, which resulted in lower levels of corporate debt, non-U.S. government securities and non-U.S. residential mortgage-backed securities (“MBS”); the decrease was partially offset by higher levels of U.S. Treasury and government agency obligations, U.S. government agency-issued MBS and obligations of U.S. states and municipalities. For additional information related to securities, refer to the discussion in the Corporate/Private Equity segment on pages
49–51
, and Notes 3 and 11 on pages
114–127
and
147–150
, respectively, of this Form 10-Q.
Loans and allowance for loan losses
Loan balances decreased as a result of lower credit card loans due to seasonality and higher repayment rates, and lower consumer excluding credit card loans, predominantly due to mortgage-related paydowns, portfolio run-off and net charge-offs.
The allowance for loan losses decreased as a result of a
$2.7 billion
reduction, reflecting lower estimated losses due to improved delinquency trends in the residential real estate and credit card portfolios, as well as the impact of improved home prices on the residential real estate portfolio.
For a more detailed discussion of the loan portfolio and the allowance for loan losses, refer to Credit Risk Management on pages
73–94
, and Notes 3, 4, 13 and 14 on pages
114–127
,
128–130
,
153–175
and
176
, respectively, of this Form 10-Q.
Accrued interest and accounts receivable
The increase was due to higher brokerage receivables and margin loan balances driven by client activity, primarily in CIB, and the timing of merchant receivables payments related to CCB’s Card Services business.
Mortgage servicing rights
The increase was due to changes in market interest rates and originations. This increase was partially offset by dispositions, collections/realization of expected cash flows and changes in valuation due to inputs and assumptions. For additional information on MSRs, see Note 16 on pages
184–187
of this Form 10-Q.
Deposits
The increase was due to growth in consumer deposits, partially offset by a decrease in deposit balances in the wholesale businesses. Consumer deposit balances increased from the effect of continued strong growth in business volumes. The decrease in wholesale client balances reflected the normalization of deposit levels from year-end seasonal inflows, particularly in CB and AM. For more information on deposits, refer to the CCB and AM segment discussions on pages
19–33
and
45–48
, respectively; the Liquidity Risk Management discussion on pages
66–72
; and Notes 3 and 17 on pages
114–127
and
188
, respectively, of
this Form 10-Q. For more information on wholesale client deposits, refer to the CB and CIB segment discussions on pages
41–44
and
34–40
, respectively, of this Form 10-Q.
Federal funds purchased and securities loaned or sold under repurchase agreements
The increase was predominantly due to higher secured financing of the Firm’s assets and higher client financing activity. For additional information on the Firm’s Liquidity Risk Management, see pages
66–72
of this Form 10-Q.
Commercial paper and other borrowed funds
Commercial paper increased due to higher issuances, partially offset by a decline in liability balances related to the Firm’s client cash management program. Other borrowed funds increased due to higher unsecured and secured short-term borrowings. For additional information on the Firm’s Liquidity Risk Management and other borrowed funds, see pages
66–72
of this Form 10-Q.
Accounts payable and other liabilities
The increase was predominantly due to higher CIB brokerage payables, and the timing of merchant payables payments related to CCB’s Card Services business.
Beneficial interests issued by consolidated VIEs
The decrease was primarily due to maturities and unwinds of municipal bond vehicles; and a reduction in outstanding conduit commercial paper held by third parties, offset partially by net issuances of credit card interests. For additional information on Firm-sponsored VIEs and loan securitization trusts, see Note 15 on pages
177–184
of this Form 10-Q.
The increase was primarily due to net issuances of long-term borrowings. For additional information on the Firm’s long-term debt activities, see the Liquidity Risk Management discussion on pages
66–72
of this
Form 10-Q.
Stockholders’ equity
The increase was predominantly due to net income and issuances of preferred stock. The increase was partially offset by a net decrease in AOCI, repurchases of common stock and the declaration of cash dividends on common and preferred stock. The net decrease in AOCI was primarily related to the decline in fair value of U.S. government agency issued MBS and obligations of U.S. states and municipalities due to market changes, as well as net realized gains.
54
|
OFF-BALANCE SHEET ARRANGEMENTS
|
||||
JPMorgan Chase
is involved with several types of off–balance sheet arrangements, including through nonconsolidated special-purpose entities (“SPEs”), which are a type of variable interest entity (“VIE”), and through lending-related financial instruments (e.g., commitments and guarantees). For further discussion, see Off–Balance Sheet Arrangements and Contractual Cash Obligations on pages 109–115 of
JPMorgan Chase
’s
2012
Annual Report
.
Special-purpose entities
The most common type of VIE is an SPE. SPEs are commonly used in securitization transactions in order to isolate certain assets and distribute the cash flows from those assets to investors. SPEs are an important part of the financial markets, including the mortgage- and asset-b
a
cked securities and commercial paper markets, as they provide market liquidity by facilitating investors’ access to specific portfolios of assets and risks. The Firm holds capital, as deemed appropriate, against all SPE-related transactions and related exposures, such as derivative transactions and lending-related commitments and guarantees. For further information on the types of SPEs, see Note 15 on pages
177–184
of
this Form 10-Q
, and Note 1 on pages 193–194 and Note 16 on pages 280–291 of
JPMorgan Chase
’s
2012
Annual Report
.
Implications of a credit rating downgrade to JPMorgan Chase Bank, N.A.
For certain liquidity commitments to SPEs, JPMorgan Chase Bank, N.A., could be required to provide funding if its short-term credit rating were downgraded below specific levels, primarily “P-1,” “A-1” and “F1” for Moody’s, Standard & Poor’s and Fitch, respectively. These liquidity commitments support the issuance of asset-backed commercial paper by both Firm-administered consolidated and third-party-sponsored nonconsolidated SPEs. In the event of a short-term credit rating downgrade, JPMorgan Chase Bank, N.A., absent other solutions, would be required to provide funding to the SPE, if the commercial paper could not be reissued as it matured. The aggregate amounts of commercial paper outstanding, issued by both Firm-administered and third-party-sponsored SPEs, that are held by third parties as of
June 30, 2013
, and
December 31, 2012
, was $
15.6 billion
and
$18.1 billion
, respectively. The aggregate amounts of commercial paper outstanding could increase in future periods should clients of the Firm-administered consolidated or third-party-sponsored nonconsolidated SPEs draw down on certain unfunded lending-related commitments. These unfunded lending-related commitments were
$12.2 billion
and
$10.9 billion
at
June 30, 2013
, and
December 31, 2012
, respectively. The Firm could facilitate the refinancing of some of the clients’ assets in order to reduce the funding obligation.
Off–balance sheet lending-related financial instruments, guarantees, and other commitments
JPMorgan Chase
provides lending-related financial instruments (e.g., commitments and guarantees) to meet the financing needs of its customers. The contractual amount of these financial instruments represents the maximum possible credit risk to the Firm should the counterparty draw upon the commitment or the Firm be required to fulfill its obligation under the guarantee, and should the counterparty subsequently fail to perform according to the terms of the contract. Most of these commitments and guarantees expire without being drawn or a default occurring. As a result, the total contractual amount of these instruments is not, in the Firm’s view, representative of its actual future credit exposure or funding requirements. For further discussion of lending-related commitments and guarantees and the Firm’s related accounting policies, see Lending-related commitments on page
89
, and Note 21 (including a table that presents, as of
June 30, 2013
, the amounts, by contractual maturity, of off-balance sheet lending-related financial instruments, guarantees and other commitments) on pages
193–197
of
this Form 10-Q
. For a discussion of loan repurchase liabilities, see Mortgage repurchase liability on pages
55–59
and Note 21 on pages
193–197
of
this Form 10-Q
.
Mortgage repurchase liability
In connection with the Firm’s mortgage loan sale and securitization activities with Fannie Mae and Freddie Mac (the “GSEs”) and other mortgage loan sale and private-label securitization transactions, the Firm has made representations and warranties that the loans sold meet certain requirements. The Firm may be, and has been, required to repurchase loans and/or indemnify the GSEs and other investors for losses due to material breaches of these representations and warranties. To the extent that repurchase demands that are received relate to loans that the Firm purchased from third parties that remain viable, the Firm typically will have the right to seek a recovery of related repurchase losses from the third party. For additional information regarding loans sold to the GSEs, see Mortgage repurchase liability on pages 111–115 of
JPMorgan Chase
’s
2012
Annual Report
.
The Firm also sells loans in securitization transactions with Ginnie Mae; these loans are typically insured or guaranteed by another government agency. The Firm, in its role as servicer, may repurchase certain delinquent loans from loan pools, including those that have been sold back to Ginnie Mae subsequent to modification, as permitted by Ginnie Mae guidelines. However, the Firm is typically not required to repurchase such loans other than for modification or foreclosure purposes (i.e., these repurchases typically do not result from repurchase demands due to breaches of representations and warranties). Because principal amounts due under the terms of these repurchased loans continue to
55
be insured and the reimbursement of insured amounts continues to proceed normally, the Firm has not recorded any mortgage repurchase liability related to these loans. However, the United States Attorney’s Office for the Southern District of New York is conducting an investigation concerning the Firm’s compliance with the requirements of the Federal Housing Administration’s Direct Endorsement Program. The Firm is cooperating in that investigation.
From 2005 to 2008, the Firm and certain acquired entities made certain loan level representations and warranties in connection with approximately
$450 billion
of residential mortgage loans that were sold or deposited into private-label securitizations. While the terms of the securitization transactions vary, they generally differ from loan sales to the GSEs in that, among other things: (i) in order to direct the trustee to investigate potential claims, the security holders must make a formal request for the trustee to do so, and typically, this requires agreement of the holders of a specified percentage of the outstanding securities; (ii) generally, the mortgage loans are not required to meet all GSE eligibility criteria; and (iii) in many cases, the party demanding repurchase is required to demonstrate that a loan-level breach of a representation or warranty has materially and adversely affected the value of the loan. Of the
$450 billion
originally sold or deposited (including
$165 billion
by Washington Mutual, as to which the Firm maintains that certain of the repurchase obligations remain with the FDIC receivership), approximately
$202 billion
of principal has been repaid (including
$74 billion
related to Washington Mutual). In addition, approximately
$125 billion
of the principal amount of such loans has been liquidated (including
$45 billion
related to Washington Mutual), with an average loss severity of
60%
. Accordingly, the remaining outstanding principal balance of these loans (including Washington Mutual) was, as of
June 30, 2013
, approximately
$123 billion
, of which
$32 billion
was 60 days or more past due. The remaining outstanding principal balance of loans related to Washington Mutual was approximately
$46 billion
, of which
$11 billion
was 60 days or more past due. For additional information regarding loans sold to private investors, see Mortgage repurchase liability on pages 111–115 of
JPMorgan Chase
’s
2012
Annual Report
.
There have been generalized allegations, as well as specific demands, that the Firm repurchase loans sold or deposited into private-label securitizations (including claims from insurers that have guaranteed certain obligations of the securitization trusts). Although the Firm encourages parties to use the contractual repurchase process established in the governing agreements, these private-label repurchase claims have generally manifested themselves through threatened or pending litigation. Accordingly, the liability related to repurchase demands associated with all of the private-label securitizations described above is separately evaluated by the Firm in establishing its litigation reserves. For additional information regarding litigation, see Note 23 on pages
198–206
of
this Form 10-Q
, and Note 31 on pages 316–325 of
JPMorgan Chase
’s
2012
Annual Report
.
Estimated mortgage repurchase liability
The Firm has recognized a mortgage repurchase liability of
$2.5 billion
and
$2.8 billion
, as of
June 30, 2013
, and
December 31, 2012
, respectively. The Firm’s mortgage repurchase liability is intended to cover losses associated with all loans previously sold in connection with loan sale and securitization transactions with the GSEs, regardless of when those losses occur or how they are ultimately resolved (e.g., repurchase, make-whole payment). While uncertainties continue to exist with respect to both GSE behavior and the economic environment, the Firm believes that the model inputs and assumptions that it uses to estimate its mortgage repurchase liability have become increasingly seasoned and stable. Based on these model inputs, which take into account all available information, and also considering projections regarding future uncertainty, including the GSEs’ behavior, the Firm has become increasingly confident in its ability to estimate reliably its mortgage repurchase liability. For these reasons, the Firm believes that its mortgage repurchase liability at
June 30, 2013
, is sufficient to cover probable future repurchase losses arising from loan sale and securitization transactions with the GSEs. For additional information about the process that the Firm uses to estimate its mortgage repurchase liability and the factors it considers in connection with that process, see Mortgage repurchase liability on pages 111–115 of
JPMorgan Chase
’s
2012
Annual Report
.
56
The following table provides information about outstanding repurchase demands and unresolved mortgage insurance rescission notices, excluding those related to Washington Mutual and those asserted in or arising in connection with pending repurchase litigation, by counterparty type, at each of the past five quarter-end dates. The table includes repurchase demands received from the GSEs as well as repurchase demands associated with private label securitizations that have been presented to the Firm by trustees who assert authority to present such claims under the terms of the underlying sale or securitization agreement.
All mortgage repurchase demands associated with private-label securitizations (however asserted) are evaluated separately by the Firm in establishing its litigation reserves; they are not considered in the Firm’s mortgage repurchase liability. Accordingly, as noted above, the Firm’s mortgage repurchase liability is intended to cover losses associated with all loans previously sold in connection with loan sale and securitization transactions with the GSEs.
|
Outstanding repurchase demands and unresolved mortgage insurance rescission notices by counterparty type
|
||||||||||||||||||||
|
(in millions)
|
Jun 30,
2013 |
Mar 31,
2013 |
Dec 31,
2012 |
Sep 30,
2012 |
Jun 30,
2012 |
|||||||||||||||
|
GSEs
|
$
|
970
|
|
$
|
1,022
|
|
$
|
1,166
|
|
$
|
1,533
|
|
$
|
1,646
|
|
|||||
|
Mortgage insurers
|
852
|
|
924
|
|
1,014
|
|
1,036
|
|
1,004
|
|
||||||||||
|
Other
|
1,072
|
|
992
|
|
887
|
|
(b)
|
1,697
|
|
981
|
|
|||||||||
|
Overlapping population
(a)
|
(51
|
)
|
(64
|
)
|
(86
|
)
|
(150
|
)
|
(125
|
)
|
||||||||||
|
Total
|
$
|
2,843
|
|
$
|
2,874
|
|
$
|
2,981
|
|
$
|
4,116
|
|
$
|
3,506
|
|
|||||
|
(a)
|
Because the GSEs and others may make repurchase demands based on mortgage insurance rescission notices that remain unresolved, certain loans may be subject to both an unresolved mortgage insurance rescission notice and an outstanding repurchase demand.
|
|
(b)
|
The decrease from September 30, 2012 predominantly relates to repurchase demands from private-label securitizations that had been presented in this table as of September 30, 2012 but that subsequently became subject to repurchase litigation in the fourth quarter of 2012; private-label securitization repurchase demands asserted or arising in connection with pending repurchase litigation are excluded from this table.
|
The following tables provide information about repurchase demands and mortgage insurance rescission notices received, excluding those related to Washington Mutual and those asserted in or arising in connection with pending repurchase litigation, by loan origination vintage, for the past five quarters. The Firm expects repurchase demands to remain at elevated levels or to increase if there is a significant increase in private-label repurchase demands outside of pending repurchase litigation. Additionally, repurchase demands from the GSEs continue to fluctuate from period to period, as reflected in the table immediately below. The Firm considers probable future repurchase demands, including this potential volatility, in estimating its mortgage repurchase liability.
|
Quarterly mortgage repurchase demands received by loan origination vintage
(a)
|
||||||||||||||||||||
|
(in millions)
|
Jun 30,
2013 |
Mar 31,
2013 |
Dec 31,
2012 |
Sep 30,
2012 |
Jun 30,
2012 |
|||||||||||||||
|
Pre-2005
|
$
|
53
|
|
$
|
45
|
|
$
|
42
|
|
$
|
33
|
|
$
|
28
|
|
|||||
|
2005
|
116
|
|
217
|
|
(b)
|
42
|
|
103
|
|
65
|
|
|||||||||
|
2006
|
258
|
|
287
|
|
292
|
|
963
|
|
506
|
|
||||||||||
|
2007
|
546
|
|
419
|
|
241
|
|
371
|
|
420
|
|
||||||||||
|
2008
|
113
|
|
151
|
|
114
|
|
196
|
|
311
|
|
||||||||||
|
Post-2008
|
60
|
|
62
|
|
87
|
|
124
|
|
191
|
|
||||||||||
|
Total repurchase demands received
|
$
|
1,146
|
|
$
|
1,181
|
|
$
|
818
|
|
$
|
1,790
|
|
$
|
1,521
|
|
|||||
|
(a)
|
All mortgage repurchase demands associated with private-label securitizations are separately evaluated by the Firm in establishing its litigation reserves.
|
|
(b)
|
The increase from December 31, 2012, predominantly relates to repurchase demands from private-label securitizations received in the first quarter of 2013 that have not been asserted in, or in connection with, pending repurchase litigation.
|
57
|
Quarterly mortgage insurance rescission notices received by loan origination vintage
(a)
|
||||||||||||||||||||
|
(in millions)
|
Jun 30,
2013 |
Mar 31,
2013 |
Dec 31,
2012 |
Sep 30,
2012 |
Jun 30,
2012 |
|||||||||||||||
|
Pre-2005
|
$
|
14
|
|
$
|
12
|
|
$
|
6
|
|
$
|
6
|
|
$
|
9
|
|
|||||
|
2005
|
18
|
|
13
|
|
18
|
|
14
|
|
13
|
|
||||||||||
|
2006
|
25
|
|
15
|
|
35
|
|
46
|
|
26
|
|
||||||||||
|
2007
|
68
|
|
52
|
|
83
|
|
139
|
|
121
|
|
||||||||||
|
2008
|
22
|
|
20
|
|
26
|
|
37
|
|
51
|
|
||||||||||
|
Post-2008
|
6
|
|
8
|
|
7
|
|
8
|
|
6
|
|
||||||||||
|
Total mortgage insurance rescissions received
|
$
|
153
|
|
$
|
120
|
|
$
|
175
|
|
$
|
250
|
|
$
|
226
|
|
|||||
|
(a)
|
Mortgage insurance rescissions typically result in a repurchase demand from the GSEs. This table includes mortgage insurance rescission notices for which the GSEs also have issued a repurchase demand.
|
Since the beginning of 2011, the Firm’s cumulative cure rate (excluding loans originated by Washington Mutual) is approximately
60%
. A significant portion of repurchase demands currently relate to loans with a longer pay history, which historically have had higher cure rates. Repurchases that have resulted from mortgage insurance rescissions are reflected in the Firm’s overall cure rate. While the actual cure rate may vary from quarter to quarter, the Firm expects that the cumulative cure rate will remain in the
55-65%
range for the foreseeable future.
The Firm has not observed a direct relationship between the type of defect that allegedly causes the breach of representations and warranties and the severity of the realized loss. Therefore, the loss severity assumption is estimated using the Firm’s historical experience and projections regarding changes in home prices. Actual principal loss severities on finalized repurchases and “make-whole” settlements to date (excluding loans originated by Washington Mutual) currently average approximately
50%
, but may vary from quarter to quarter based on the characteristics of the underlying loans and changes in home prices.
When a loan was originated by a third-party originator, the Firm typically has the right to seek a recovery of related repurchase losses from the third-party originator. Estimated and actual third-party recovery rates may vary from quarter to quarter based upon the underlying mix of third-party originators (e.g., active, inactive, out-of-business originators) from which recoveries are being sought.
Substantially all of the estimates and assumptions underlying the Firm’s established methodology for computing its recorded mortgage repurchase liability — including the amount of probable future demands from the GSEs (based on both historical experience and the Firm’s expectations about the GSEs’ future behavior), the ability of the Firm to cure identified defects, the severity of loss upon repurchase or foreclosure and recoveries from third parties — require application of a significant level of management judgment. While the Firm uses the best information available to it in estimating its mortgage repurchase liability, this estimate is inherently uncertain and imprecise.
58
The following table summarizes the change in the mortgage repurchase liability for each of the periods presented.
|
Summary of changes in mortgage repurchase liability
(a)
|
|||||||||||||||
|
Three months ended
June 30, |
Six months ended June 30,
|
||||||||||||||
|
(in millions)
|
2013
|
2012
|
2013
|
2012
|
|||||||||||
|
Repurchase liability at beginning of period
|
$
|
2,674
|
|
$
|
3,516
|
|
$
|
2,811
|
|
$
|
3,557
|
|
|||
|
Net realized losses
(b)
|
(191
|
)
|
(259
|
)
|
(403
|
)
|
(623
|
)
|
|||||||
|
Provision for repurchase losses
(c)
|
(7
|
)
|
36
|
|
68
|
|
359
|
|
|||||||
|
Repurchase liability at end of period
|
$
|
2,476
|
|
$
|
3,293
|
|
$
|
2,476
|
|
$
|
3,293
|
|
|||
|
(a)
|
All mortgage repurchase demands associated with private-label securitizations are separately evaluated by the Firm in establishing its litigation reserves.
|
|
(b)
|
Realized repurchase losses are presented net of third-party recoveries and include principal losses and accrued interest on repurchased loans, “make-whole” settlements, settlements with claimants, and certain related expense. Make-whole settlements were
$133 million
and
$107 million
for the
three months ended
June 30, 2013
and
2012
, respectively and
$254 million
and
$293 million
for the
six months ended
June 30, 2013
and
2012
, respectively.
|
|
(c)
|
Included
$6 million
and
$28 million
of provision related to new loan sales for the
three months ended
June 30, 2013
and
2012
, respectively and
$14 million
and
$55 million
for the
six months ended
June 30, 2013
and
2012
, respectively.
|
The following table summarizes the total unpaid principal balance of certain repurchases during the periods indicated.
|
Unpaid principal balance of mortgage loan repurchases
(a)
|
|||||||||||||||
|
Three months ended June 30,
|
Six months ended June 30,
|
||||||||||||||
|
(in millions)
|
2013
|
2012
|
2013
|
2012
|
|||||||||||
|
Ginnie Mae
(b)
|
$
|
1,372
|
|
$
|
1,619
|
|
$
|
3,523
|
|
$
|
3,126
|
|
|||
|
GSEs
(c)
|
216
|
|
302
|
|
461
|
|
621
|
|
|||||||
|
Other
(c)(d)
|
14
|
|
47
|
|
40
|
|
107
|
|
|||||||
|
Total
|
$
|
1,602
|
|
$
|
1,968
|
|
$
|
4,024
|
|
$
|
3,854
|
|
|||
|
(a)
|
This table includes: (i) repurchases of mortgage loans due to breaches of representations and warranties, and (ii) loans repurchased from Ginnie Mae loan pools as described in (b) below. This table does not include mortgage insurance rescissions; while the rescission of mortgage insurance typically results in a repurchase demand from the GSEs, the mortgage insurers themselves do not present repurchase demands to the Firm. This table also excludes mortgage loan repurchases associated with repurchase demands asserted in or in connection with pending repurchase litigation.
|
|
(b)
|
In substantially all cases, these repurchases represent either voluntary repurchases of certain delinquent loans from loan pools as permitted by Ginnie Mae guidelines or required repurchases of loans for modification or foreclosure purposes (i.e., these repurchases typically do not result from repurchase demands due to breaches of representations and warranties). The Firm typically repurchases these loans as it continues to service them and/or manage the foreclosure process in accordance with applicable policies and requirements of Ginnie Mae, the Federal Housing Administration (“FHA”), Rural Housing Services (“RHS”) and/or the U.S. Department of Veterans Affairs (“VA”).
|
|
(c)
|
Nonaccrual loans held-for-investment included
$424 million
and
$487 million
at
June 30, 2013
and
2012
, respectively, of loans repurchased as a result of breaches of representations and warranties.
|
|
(d)
|
Represents loans repurchased from parties other than the GSEs, excluding those repurchased in connection with pending repurchase litigation.
|
For additional information regarding the mortgage repurchase liability, see Note 21 on pages
193–197
of
this Form 10-Q
, and Note 29 on pages 308–315 of
JPMorgan Chase
’s
2012
Annual Report
.
The Firm also faces a variety of exposures resulting from repurchase demands and litigation arising out of its various roles as issuer and/or sponsor of mortgage-backed securities (“MBS”) offerings in private-label securitizations. For further information, see Note 23, Litigation on pages
198–206
of
this Form 10-Q
.
59
|
CAPITAL MANAGEMENT
|
||||
The following discussion of JPMorgan Chase’s capital management highlights developments since December 31, 2012, and should be read in conjunction with Capital Management on pages 116–122 of JPMorgan Chase’s 2012 Annual Report.
The Firm’s capital management objectives are to hold capital sufficient to:
|
•
|
Cover all material risks underlying the Firm’s business activities;
|
|
•
|
Maintain “well-capitalized” status under regulatory requirements;
|
|
•
|
Maintain debt ratings that enable the Firm to optimize its funding mix and liquidity sources while minimizing costs;
|
|
•
|
Retain flexibility to take advantage of future investment opportunities; and
|
|
•
|
Build and invest in businesses, even in a highly stressed environment.
|
These objectives are achieved through ongoing monitoring of the Firm’s capital position, regular stress testing, and a capital governance framework.
Capital governance
The Firm’s senior management recognizes the importance of a capital management function that supports strategic decision-making. For a more detailed discussion of the Firm’s capital governance and processes, see pages 116–117 of JPMorgan Chase’s 2012 Annual Report.
Comprehensive Capital Analysis and Review
On January 7, 2013, the Firm submitted its capital plan to the Federal Reserve under the Federal Reserve’s 2013 CCAR process. On March 14, 2013, the Federal Reserve informed the Firm that it did not object to the Firm’s 2013 capital plan, but asked the Firm to submit an additional capital plan, as described more fully below. On May 21, 2013, the Board of Directors increased the second-quarter common stock dividend to $0.38 per share from $0.30 per share. The Board of Directors also authorized the Firm to repurchase up to $6 billion of common equity commencing with the second quarter of this year through the end of the first quarter of 2014. For additional information on dividends and common equity repurchases, see Capital actions on page 64 of this Form 10-Q.
As noted above, the Federal Reserve asked the Firm to submit by the end of the third quarter of 2013 an additional capital plan addressing the weaknesses it identified in the Firm’s CCAR capital planning processes.
The Firm intends to fully address the Federal Reserve’s requirements. Following its review of the additional capital plan, the Federal Reserve could require the Firm to modify its capital distributions.
Regulatory capital
The Federal Reserve establishes capital requirements, including well-capitalized standards, for the consolidated financial holding company. The OCC establishes similar capital requirements and standards for the Firm’s national banks, including JPMorgan Chase Bank, N.A. and Chase Bank USA, N.A.
In connection with the U.S. Government’s Supervisory Capital Assessment Program in 2009 (“SCAP”), U.S. banking regulators developed an additional measure of capital, Tier 1 common, which is defined as Tier 1 capital less elements of Tier 1 capital not in the form of common equity, such as perpetual preferred stock, noncontrolling interests in subsidiaries and trust preferred securities. The Federal Reserve employs a minimum 5% Tier 1 common ratio standard for CCAR purposes, in addition to the other minimum capital requirements.
Basel I and Basel 2.5
The minimum risk-based capital requirements adopted by the U.S. federal banking agencies follow the Capital Accord (“Basel I”) of the Basel Committee on Banking Supervision (“Basel Committee”). In June 2012, U.S. federal banking agencies published the final rule that specifies revised market risk regulatory capital requirements (“Basel 2.5”). While the Firm is still subject to the capital requirements of Basel I, Basel 2.5 rules also became effective for the Firm on January 1, 2013. The Basel 2.5 final rule revised the scope of positions subject to the market risk capital requirements and introduced new market risk measures, which resulted in additional capital requirements for covered positions as defined. The implementation of Basel 2.5 in the first quarter of 2013 resulted in an increase of approximately $150 billion in risk-weighted assets compared with the Basel I rules at March 31, 2013. The implementation of these rules also resulted in decreases of the Firm’s Tier 1 capital, Total capital and Tier 1 common capital ratios by 140 basis points, 160 basis points and 120 basis points, respectively, at March 31, 2013.
The following table presents the risk-based capital ratios for
JPMorgan Chase
at June 30, 2013, and December 31, 2012, under Basel I (and, for June 30, 2013, Basel 2.5). As of June 30, 2013, and December 31, 2012, JPMorgan Chase and all of its banking subsidiaries were well-capitalized and each met all capital requirements to which it was subject.
|
Risk-based capital ratios
|
|||||
|
June 30,
2013
|
December 31,
2012
|
||||
|
Capital ratios
|
|||||
|
Tier 1 capital
|
11.6
|
%
|
12.6
|
%
|
|
|
Total capital
|
14.1
|
|
15.3
|
|
|
|
Tier 1 leverage
|
7.0
|
|
7.1
|
|
|
|
Tier 1 common
(a)
|
10.4
|
|
11.0
|
|
|
|
(a)
|
The Tier 1 common ratio is Tier 1 common capital divided by RWA.
|
60
At June 30, 2013, and December 31, 2012, JPMorgan Chase maintained Tier 1 and Total capital ratios in excess of the well-capitalized standards established by the Federal Reserve, as indicated in the above tables. In addition, at June 30, 2013, and December 31, 2012, the Firm’s Tier 1 common ratio was significantly above the 5% CCAR standard. For more information, see Note 28 on pages 306–308 of the Firm’s 2012 Annual Report.
The following table presents a reconciliation of total stockholders’ equity to Tier 1 common, Tier 1 capital and Total qualifying capital; the components of risk-weighted assets; and total adjusted average assets.
|
Risk-based capital components and assets
|
|||||||
|
(in millions)
|
June 30,
2013
|
December 31, 2012
|
|||||
|
Total stockholders’ equity
|
$
|
209,239
|
|
$
|
204,069
|
|
|
|
Less: Preferred stock
|
11,458
|
|
9,058
|
|
|||
|
Common stockholders’ equity
|
197,781
|
|
195,011
|
|
|||
|
Effect of certain items in accumulated other comprehensive income/(loss) excluded from Tier 1 common
|
(282
|
)
|
(4,198
|
)
|
|||
|
Less: Goodwill
(a)
|
45,414
|
|
45,663
|
|
|||
|
Other intangible assets
(a)
|
2,220
|
|
2,311
|
|
|||
|
Fair value DVA on structured notes and derivative liabilities related to the Firm’s credit quality
|
1,869
|
|
1,577
|
|
|||
|
Investments in certain subsidiaries and other
|
1,039
|
|
920
|
|
|||
|
Tier 1 common
|
146,957
|
|
140,342
|
|
|||
|
Preferred stock
|
11,458
|
|
9,058
|
|
|||
|
Qualifying hybrid securities and noncontrolling interests
(b)
|
5,618
|
|
10,608
|
|
|||
|
Other
|
(6
|
)
|
(6
|
)
|
|||
|
Total Tier 1 capital
|
164,027
|
|
160,002
|
|
|||
|
Long-term debt and other instruments qualifying as Tier 2
|
17,406
|
|
18,061
|
|
|||
|
Qualifying allowance for credit losses
|
17,723
|
|
15,995
|
|
|||
|
Other
|
(8
|
)
|
(22
|
)
|
|||
|
Total Tier 2 capital
|
35,121
|
|
34,034
|
|
|||
|
Total qualifying capital
|
$
|
199,148
|
|
$
|
194,036
|
|
|
|
Credit risk risk-weighted assets
|
$
|
1,217,094
|
|
$
|
1,156,102
|
|
|
|
Market risk risk-weighted assets
(c)
|
$
|
192,987
|
|
114,276
|
|
||
|
Total risk-weighted assets
(c)
|
$
|
1,410,081
|
|
$
|
1,270,378
|
|
|
|
Total adjusted average assets
|
$
|
2,333,416
|
|
$
|
2,243,242
|
|
|
|
(a)
|
Goodwill and other intangible assets are net of any associated deferred tax liabilities.
|
|
(b)
|
Primarily includes trust preferred securities of certain business trusts. Under the Basel III final rule approved by U.S. federal banking agencies in July 2013, trust preferred securities will be phased out from inclusion as Tier 1 capital, but included as Tier 2 capital, beginning in 2014 through the end of 2015 and phased out from inclusion as Tier 2 capital beginning in 2016 through the end of 2021.
|
|
(c)
|
Reflects the implementation of Basel 2.5 in the first quarter of 2013, which resulted in an increase of approximately $150 billion in risk-weighted assets compared with the Basel I rules at March 31, 2013. The implementation of these rules also resulted in decreases of the Firm’s Tier 1 capital, Total capital and Tier 1 common capital ratios by 140 basis points, 160 basis points and 120 basis points, respectively, at March 31, 2013.
|
Capital rollforward
The following table presents the changes in Tier 1 common, Tier 1 capital and Tier 2 capital for the six months ended June 30, 2013.
|
Six months ended June 30, (in millions)
|
2013
|
||
|
Tier 1 common at December 31, 2012
|
$
|
140,342
|
|
|
Net income
|
13,025
|
|
|
|
Dividends declared
|
(3,032
|
)
|
|
|
Net issuance of treasury stock
|
(2,069
|
)
|
|
|
Changes in capital surplus
|
(1,188
|
)
|
|
|
Effect of certain items in accumulated other comprehensive income/(loss) excluded from Tier 1 common
|
(51
|
)
|
|
|
Qualifying non-controlling minority interests in consolidated subsidiaries
|
(49
|
)
|
|
|
DVA on structured notes and derivative liabilities
|
(292
|
)
|
|
|
Goodwill and other nonqualifying intangibles (net of deferred tax liabilities)
|
340
|
|
|
|
Other
|
(69
|
)
|
|
|
Increase in Tier 1 common
|
6,615
|
|
|
|
Tier 1 common at June 30, 2013
|
$
|
146,957
|
|
|
Tier 1 capital at December 31, 2012
|
$
|
160,002
|
|
|
Change in Tier 1 common
|
6,615
|
|
|
|
Issuance of noncumulative perpetual preferred stock
|
2,400
|
|
|
|
Redemption of trust preferred securities
|
(4,940
|
)
|
|
|
Other
|
(50
|
)
|
|
|
Increase in Tier 1 capital
|
4,025
|
|
|
|
Tier 1 capital at June 30, 2013
|
$
|
164,027
|
|
|
Tier 2 capital at December 31, 2012
|
$
|
34,034
|
|
|
Change in long-term debt and other instruments qualifying as Tier 2
|
(655
|
)
|
|
|
Change in qualifying allowance for credit losses
|
1,728
|
|
|
|
Other
|
14
|
|
|
|
Increase in Tier 2 capital
|
1,087
|
|
|
|
Tier 2 capital at June 30, 2013
|
$
|
35,121
|
|
|
Qualifying capital at June 30, 2013
|
$
|
199,148
|
|
Risk-weighted assets
The following table presents the changes in credit risk RWA and market risk RWA for the six months ending June 30, 2013.
|
Changes in RWA components
|
|||
|
Six months ended June 30, (in millions)
|
2013
|
||
|
Credit risk RWA at December 31, 2012
|
$
|
1,156,102
|
|
|
Increase in credit risk RWA
|
60,992
|
|
|
|
Credit risk RWA at June 30, 2013
|
$
|
1,217,094
|
|
|
|
|||
|
Market risk RWA at December 31, 2012
|
$
|
114,276
|
|
|
Increase in market risk RWA
|
78,711
|
|
|
|
Market risk RWA at June 30, 2013
|
$
|
192,987
|
|
|
Total RWA at June 30, 2013
|
$
|
1,410,081
|
|
The increase in credit risk RWA is predominantly attributable to the implementation of Basel 2.5 in the first quarter of 2013; positions previously captured under market risk RWA under Basel I are, as a result of the implementation of Basel 2.5, now included as non-covered positions and calculated under credit risk RWA. The increase in credit risk RWA is also due to growth in other assets,
61
including higher margin loans and receivables from unsettled activity. The increase in market risk RWA was also predominantly attributable to the implementation of Basel 2.5 in the first quarter of 2013. This increase was partially offset by a decrease in market risk RWA predominantly attributable to lower levels of risk, including reduced risk in the synthetic credit portfolio and a reduction in fixed income positions.
Additional information regarding the Firm’s capital ratios and the federal regulatory capital standards to which the Firm is subject is presented at Note 20 on pages
191–192
of this Form 10-Q. For further information on the Firm’s Basel 2.5 measures and additional market risk disclosures, see the Firm’s consolidated Basel 2.5 Market Risk Pillar 3 Reports which are available on the Firm’s website (http://investor.shareholder.com/jpmorganchase/basel.cfm) within 45 days after the end of the quarter.
Basel II
In 2004, the Basel Committee published a revision to the Capital Accord (“Basel II”). The goal of the Basel II framework is to provide more risk-sensitive regulatory capital calculations and promote enhanced risk management practices among large, internationally active banking organizations. U.S. banking regulators published a final Basel II rule in December 2007, which requires JPMorgan Chase to implement Basel II at the holding company level, as well as at certain of its key U.S. bank subsidiaries.
Prior to full implementation of the Basel II framework, JPMorgan Chase is required to complete a qualification period of at least four consecutive quarters during which it needs to demonstrate that it meets the requirements of the rule to the satisfaction of its U.S. banking regulators. JPMorgan Chase is currently in the qualification period and expects to be in compliance with all relevant Basel II rules within the established timelines. In addition, the Firm has adopted, and will continue to adopt, based on various established timelines, Basel II rules in certain non-U.S. jurisdictions, as required.
Basel III
In June 2012, U.S. federal banking agencies published a Notice for Proposed Rulemaking (“NPR”) for implementing further revisions to the Capital Accord in the U.S. (such further revisions are commonly referred to as “Basel III”). In July 2013, U.S. federal banking agencies approved a final rule for implementing Basel III in the U.S. Basel III revised Basel II by, among other things, narrowing the definition of capital, and increasing capital requirements for specific exposures. Basel III also includes higher capital ratio requirements and provides that the Tier 1 common capital requirement will be increased to 7%, comprised of a minimum ratio of 4.5% plus a 2.5% capital conservation buffer. Implementation of the 7% Tier 1 common capital requirement is required by January 1, 2019.
In addition, global systemically important banks (“GSIBs”) will be required to maintain Tier 1 common requirements
above the 7% minimum in amounts ranging from an additional 1% to an additional 2.5%. In November 2012, the Financial Stability Board (“FSB”) indicated that it would require the Firm, as well as three other banks, to hold the additional 2.5% of Tier 1 common; the requirement will be phased in beginning in 2016. The Basel Committee also stated that certain GSIBs could be required to hold as much as 3.5% of Tier 1 common if they were to take actions that further increase their systemic importance. Currently, no GSIB (including the Firm) is required to hold more than the additional 2.5% of Tier 1 common.
In addition, pursuant to the requirements of the Dodd-Frank Act, U.S. federal banking agencies have implemented a floor under the Basel III capital calculations for advanced approach banking organizations, such as the Firm. The floor references the General Risk-Based Capital rules, which are the Basel I rules in 2014 and the Basel III Standardized rules from 2015 forward.
The following table presents a comparison of the Firm’s Tier 1 common under Basel I rules to its estimated Tier 1 common under Basel III rules, along with the Firm’s estimated risk-weighted assets. Tier 1 common under Basel III includes additional adjustments and deductions not included in Basel I Tier 1 common, such as the inclusion of accumulated other comprehensive income (“AOCI”) related to AFS securities and defined benefit pension and other postretirement employee benefit (“OPEB”) plans.
The Firm estimates that its Tier 1 common ratio under Basel III rules would be
9.3%
as of June 30, 2013. The Tier 1 common ratio under both Basel I and Basel III are non-GAAP financial measures. However, such measures are used by bank regulators, investors and analysts as a key measure to assess the Firm’s capital position and to compare the Firm’s capital to that of other financial services companies.
|
June 30, 2013
(in millions, except ratio)
|
|||
|
Tier 1 common under Basel I rules
|
$
|
146,957
|
|
|
Adjustments related to AOCI for AFS securities and defined benefit pension and OPEB plans
|
514
|
|
|
|
All other adjustments
|
554
|
|
|
|
Estimated Tier 1 common under Basel III rules
|
$
|
148,025
|
|
|
Estimated risk-weighted assets under Basel III rules
(a)
|
$
|
1,587,399
|
|
|
Estimated Tier 1 common ratio under Basel III rules
(b)
|
9.3
|
%
|
|
|
(a)
|
Key differences in the calculation of risk-weighted assets between Basel I and Basel III include: (1) Basel III credit risk RWA is based on risk-sensitive approaches which largely rely on the use of internal credit models and parameters, whereas Basel I RWA is based on fixed supervisory risk-weightings which vary only by counterparty type and asset class; and (2) Basel III includes RWA for operational risk,
|
whereas Basel I does not. Effective January 1, 2013, market risk
RWA requirements under Basel 2.5 are consistent across Basel I and Basel III.
|
(b)
|
The Tier 1 common ratio is Tier 1 common divided by RWA.
|
The Firm’s estimate of its Tier 1 common ratio under Basel III reflects its current understanding of the Basel III rules based on the recently published final rule and on the application of such rules to its businesses as currently conducted. The actual impact on the Firm’s capital ratios
62
upon implementation of Basel III rules may differ from the Firm’s current estimates. The actual impact could depend on changes the Firm may make to its businesses in the future as a result of implementing the Basel III rules, regulatory approval of certain of the Firm’s internal risk models, and any further implementation guidance from the regulators.
The Basel III final rule also included a requirement for advanced approach banking organizations, including the Firm, to calculate a supplementary leverage ratio. The supplementary leverage ratio, a non-GAAP financial measure, is Tier 1 capital under Basel III divided by the Firm’s total leverage exposure. Total leverage exposure is calculated by taking the Firm’s total average on-balance sheet assets, less amounts permitted to be deducted for Tier 1 capital, and adding certain off-balance sheet exposures, such as undrawn commitments and derivatives future exposure.
Following approval of the final Basel III rules, the U.S. banking agencies issued proposed rulemaking relating to the supplementary leverage ratio that would require U.S. bank holding companies, including JPMorgan Chase, to have a supplementary leverage ratio of at least 5% and insured depositary institutions, including JPMorgan Chase Bank, N.A. and Chase Bank USA, N.A., to have a supplementary leverage ratio of at least 6%.
The Basel III capital requirements are subject to prolonged transition periods. In July 2013, as part of the approval of the Basel III final rule, U.S. federal banking agencies announced a January 1, 2014, Basel III effective date for advanced approach banking organizations, including the Firm. The additional capital requirements for GSIBs will be phased in starting January 1, 2016, with full implementation on January 1, 2019. The Firm and its IDI subsidiaries are not required to meet the minimum supplementary leverage ratio until January 1, 2018. Management’s current objective is for the Firm to reach, by the end of 2013, an estimated Basel III Tier I common ratio of 9.5%.
Broker-dealer regulatory capital
JPMorgan Chase’s principal U.S. broker-dealer subsidiaries are J.P. Morgan Securities LLC (“JPMorgan Securities”) and J.P. Morgan Clearing Corp. (“JPMorgan Clearing”). JPMorgan Clearing is a subsidiary of JPMorgan Securities and provides clearing and settlement services. JPMorgan Securities and JPMorgan Clearing are each subject to Rule 15c3-1 under the Securities Exchange Act of 1934 (the “Net Capital Rule”). JPMorgan Securities and JPMorgan Clearing are also each registered as futures commission merchants and subject to Rule 1.17 of the Commodity Futures Trading Commission (“CFTC”).
JPMorgan Securities and JPMorgan Clearing have elected to compute their minimum net capital requirements in accordance with the “Alternative Net Capital Requirements” of the Net Capital Rule. At June 30, 2013, JPMorgan Securities’ net capital, as defined by the Net Capital Rule,
was
$13.8 billion
, exceeding the minimum requirement by
$12.0 billion
, and JPMorgan Clearing’s net capital was
$6.7 billion
, exceeding the minimum requirement by
$5.0 billion
.
In addition to its minimum net capital requirement, JPMorgan Securities is required to hold tentative net capital in excess of $1.0 billion and is also required to notify the SEC in the event that tentative net capital is less than $5.0 billion, in accordance with the market and credit risk standards of Appendix E of the Net Capital Rule. As of June 30, 2013, JPMorgan Securities had tentative net capital in excess of the minimum and notification requirements.
J.P. Morgan Securities plc (formerly J.P. Morgan Securities Ltd.) is a wholly-owned subsidiary of JPMorgan Chase Bank, N.A. and is the Firm’s principal operating subsidiary in the U.K. It has authority to engage in banking, investment banking and broker-dealer activities. J.P. Morgan Securities plc is jointly regulated by the U.K. Prudential Regulation Authority (“PRA”) and Financial Conduct Authority (“FCA”) (together, formerly the U.K. Financial Services Authority). At June 30, 2013, J.P. Morgan Securities plc had total capital of $22.1 billion, or a Pillar 1 Total capital ratio of 16.4%, which exceeded the 8% well-capitalized standard applicable to it under Basel 2.5.
Economic risk capital
Economic risk capital is another of the disciplines the Firm uses to assess the capital required to support its businesses. Economic risk capital is a measure of the capital needed to cover JPMorgan Chase’s business activities in the event of unexpected losses. The Firm measures economic risk capital using internal risk-assessment methodologies and models based primarily on four risk factors: credit, market, operational and private equity risk. The methodologies and models used to measure economic risk capital consider factors, assumptions and inputs that differ from those required to be used for regulatory capital requirements, and therefore provide a complementary measure to regulatory capital. As economic risk capital is a component of capital for advanced approach banking organizations under Basel III, the Firm is currently in the process of enhancing its economic risk capital framework to address the newly finalized Basel III requirements.
Line of business equity
Equity for a line of business represents the amount the Firm believes the business would require if it were operating independently, considering capital levels for similarly rated peers, regulatory capital requirements (as estimated under Basel III) and economic risk measures. Capital is also allocated to each line of business for, among other things, goodwill and other intangibles associated with acquisitions effected by the line of business. ROE is measured and internal targets for expected returns are established as key measures of a business segment’s performance.
63
|
Line of business equity
|
||||||||
|
(in billions)
|
June 30,
2013 |
December 31,
2012 |
||||||
|
Consumer & Community Banking
|
$
|
46.0
|
|
$
|
43.0
|
|
||
|
Corporate & Investment Bank
|
56.5
|
|
47.5
|
|
||||
|
Commercial Banking
|
13.5
|
|
9.5
|
|
||||
|
Asset Management
|
9.0
|
|
7.0
|
|
||||
|
Corporate/Private Equity
|
72.8
|
|
88.0
|
|
||||
|
Total common stockholders’ equity
|
$
|
197.8
|
|
$
|
195.0
|
|
||
|
Line of business equity
|
Quarterly Averages
|
|||||||||||
|
(in billions)
|
2Q13
|
|
4Q12
|
|
2Q12
|
|||||||
|
Consumer & Community Banking
|
$
|
46.0
|
|
$
|
43.0
|
|
$
|
43.0
|
|
|||
|
Corporate & Investment Bank
|
56.5
|
|
47.5
|
|
47.5
|
|
||||||
|
Commercial Banking
|
13.5
|
|
9.5
|
|
9.5
|
|
||||||
|
Asset Management
|
9.0
|
|
7.0
|
|
7.0
|
|
||||||
|
Corporate/Private Equity
|
72.3
|
|
85.0
|
|
74.0
|
|
||||||
|
Total common stockholders’ equity
|
$
|
197.3
|
|
$
|
192.0
|
|
$
|
181.0
|
|
|||
Effective January 1, 2013, the Firm further refined the capital allocation framework to align it with the revised line of business structure that became effective in the fourth quarter of 2012. The increase in equity levels for the lines of businesses is largely driven by regulatory guidance on Basel III requirements, principally for CIB and CIO, and by anticipated business growth.
Capital actions
Dividends
On May 21, 2013, the Board of Directors increased the Firm’s quarterly common stock dividend from $0.30 to $0.38 per share, effective with the dividend paid on July 31, 2013, to shareholders of record on July 5, 2013. The Firm’s common stock dividend policy reflects JPMorgan Chase’s earnings outlook, desired dividend payout ratio, capital objectives, and alternative investment opportunities. The Firm’s current expectation is to return to a payout ratio of approximately 30% of normalized earnings over time.
For information regarding dividend restrictions, see Note 22 and Note 27 on pages 300 and 306, respectively, of
JPMorgan Chase
’s
2012
Annual Report
.
Preferred stock
On February 5, 2013 the Firm issued
$900 million
of noncumulative preferred stock. On each of April 23, 2013, and July 29, 2013, the Firm issued
$1.5 billion
of noncumulative preferred stock. On August 1, 2013, the Firm announced that it would redeem all of its outstanding
8.625%
noncumulative preferred stock, Series J on September 1, 2013. For additional information on the Firm’s preferred stock, see Note 22 on page 300 of the Firm’s 2012 Annual Report.
Redemption of outstanding trust preferred securities
On May 8, 2013, the Firm redeemed approximately
$5.0 billion
, or
100%
of the liquidation amount, of the following eight series of trust preferred securities: JPMorgan Chase Capital X, XI, XII, XIV, XVI, XIX, XXIV, and BANK ONE Capital VI. For a further discussion of trust preferred securities, see Note 21 on pages 297–299 of JPMorgan Chase’s 2012 Annual Report.
Common equity repurchases
On
March 13, 2012
, the Board of Directors authorized a
$15.0 billion
common equity (i.e., common stock and warrants) repurchase program. The following table shows the Firm’s repurchases of common equity for the three and six months ended June 30, 2013 and 2012. As of
June 30, 2013
,
$9.6 billion
(on a trade-date basis) of authorized repurchase capacity remained under the program.
|
Three months ended June 30,
|
Six months ended June 30,
|
|||||||||||||||
|
(in millions)
|
2013
|
2012
|
2013
|
2012
|
||||||||||||
|
Total shares of common stock repurchased
|
24
|
|
27
|
|
78
|
|
31
|
|
||||||||
|
Aggregate common stock repurchases
|
$
|
1,201
|
|
$
|
1,139
|
|
$
|
3,801
|
|
$
|
1,329
|
|
||||
|
Total warrants repurchased
|
—
|
|
18
|
|
—
|
|
18
|
|
||||||||
|
Aggregate warrant repurchases
|
$
|
—
|
|
$
|
238
|
|
$
|
—
|
|
$
|
238
|
|
||||
Pursuant to CCAR, the Firm is authorized to repurchase up to
$6 billion
of common equity between April 1, 2013 and March 31, 2014. Such repurchases are being done pursuant to the
$15.0 billion
common equity repurchase program.
The Firm may, from time to time, enter into written trading plans under Rule 10b5-1 of the Securities Exchange Act of 1934 to facilitate repurchases in accordance with the repurchase program. A Rule 10b5-1 repurchase plan allows the Firm to repurchase its equity during periods when it would not otherwise be repurchasing common equity — for example, during internal trading “black-out periods.”
All purchases under a Rule 10b5-1 plan must be made according to a predefined plan established when the Firm
is not aware of material nonpublic information. For additional information regarding repurchases of the Firm’s equity securities, see Part II, Item 2, Unregistered Sales of Equity Securities and Use of Proceeds, on pages
218–219
of
this Form 10-Q
.
64
|
RISK MANAGEMENT
|
||||
Risk is an inherent part of JPMorgan Chase’s business activities. The Firm’s risk management framework and governance structure are intended to provide comprehensive controls and ongoing management of the major risks inherent in its business activities. The Firm employs a holistic approach to risk management intended to ensure the broad spectrum of risk types are considered in managing its business activities. The Firm’s risk management framework is intended to create a culture of risk awareness and personal responsibility throughout the Firm where collaboration, discussion, escalation and sharing of information are encouraged.
The Firm’s overall risk appetite is established in the context of the Firm’s capital, earnings power, and diversified business model. The Firm employs a formalized risk
appetite framework to integrate the Firm’s objectives with return targets, risk controls and capital management. The Risk Policy Committee of the Firm’s Board of Directors approves the risk appetite policy on behalf of the Board of Directors. The Firm’s Chief Executive Officer (“CEO”), Chief Financial Officer (“CFO”), Chief Risk Officer (“CRO”) and Chief Operating Officer (“COO”) are responsible for setting and approving the Firm’s risk appetite parameters. The lines of business CEOs, CFOs and CROs are responsible for setting the risk appetite parameters for their respective lines of business, subject to approval by the Firm’s CEO, CFO, CRO and COO. The Firmwide Risk Committee, which is co-chaired by the Firm’s CEO and CRO, is responsible for reviewing risk appetite results at the LOB and firmwide levels.
The following provides an index of key risk management disclosures. For further information on these disclosures, refer to the page references noted below in both this Form 10-Q and JPMorgan Chase’s 2012 Annual Report.
|
Risk disclosure
|
Form 10-Q page reference
|
Annual Report page reference
|
|
Risk Management
|
65
|
123-126
|
|
Risk governance
|
123-125
|
|
|
Model risk
|
125-126
|
|
|
Liquidity Risk Management
|
66–72
|
127-133
|
|
Funding
|
66–70
|
127-130
|
|
HQLA
|
70
|
|
|
Contingency funding plan
|
130
|
|
|
Credit ratings
|
70–71
|
131
|
|
Credit Risk Management
|
134-159
|
|
|
Credit Portfolio
|
73
|
136-137
|
|
Consumer Credit Portfolio
|
74–83
|
138-149
|
|
Wholesale Credit Portfolio
|
84–91
|
150-159
|
|
Community Reinvestment Act Exposure
|
92
|
159
|
|
Allowance For Credit Losses
|
92–94
|
159-162
|
|
Market Risk Management
|
95–99
|
163-169
|
|
Risk identification and classification
|
163
|
|
|
Value-at-risk
|
95–98
|
163-167
|
|
Economic-value stress testing
|
98
|
167-168
|
|
Nontrading interest rate-sensitive revenue-at-risk
|
99
|
168-169
|
|
Risk monitoring and control: Limits
|
169
|
|
|
Country Risk Management
|
100–102
|
170-173
|
|
Selected European exposure
|
100–102
|
172-173
|
|
Principal Risk Management
|
103
|
174
|
|
Operational Risk Management
|
103
|
175-176
|
|
Cybersecurity
|
103
|
176
|
|
Legal, Fiduciary and Reputation Risk Management
|
103
|
177
|
65
|
LIQUIDITY RISK MANAGEMENT
|
||||
Liquidity risk management is intended to ensure that the Firm has the appropriate amount, composition and tenor of funding and liquidity in support of its assets. The primary objectives of effective liquidity management are to ensure that the Firm’s core businesses are able to operate in support of client needs and meet contractual and contingent obligations through normal economic cycles as well as during market stress events and to maintain debt ratings that enable the Firm to optimize its funding mix and liquidity sources while minimizing costs. The following discussion of JPMorgan Chase’s Liquidity Risk Management framework highlights developments since December 31, 2012, and should be read in conjunction with pages 127–133 of JPMorgan Chase’s 2012 Annual Report.
Management considers the Firm’s liquidity position to be strong as of June 30, 2013, and believes that the Firm’s unsecured and secured funding capacity is sufficient to meet its on- and off-balance sheet obligations.
LCR and NSFR
In December 2010, the Basel Committee introduced two new measures of liquidity risk: Liquidity Coverage Ratio (“LCR”), which is intended to measure the amount of “high-quality liquid assets” (“HQLA”) held by the Firm during an acute stress event, in relation to the estimated net cash outflows within a 30-day period; and the net stable funding ratio (“NSFR”) which is intended to measure the “available” amount of stable funding relative to the “required” amount of stable funding over a 1-year horizon. The standards require that the LCR be no lower than 100% and the NSFR be greater than 100%. For further discussion, see HQLA discussion on page
70
of this Form 10-Q.
In January 2013, the Basel Committee introduced certain amendments to the formulation of the LCR, and a revised timetable to phase-in the standard. The LCR will continue to become effective on January 1, 2015, but the minimum requirement will begin at 60%, increasing in equal annual increments to reach 100% on January 1, 2019. During the second quarter of 2013, the Firm accelerated compliance with the proposed Basel III LCR and became compliant, based on its current understanding of the proposed rules. The LCR may fluctuate from period to period due to normal flows from client activity.
Funding
Sources of funds
The Firm funds its global balance sheet through diverse sources of funding including a stable deposit franchise as well as secured and unsecured funding in the capital markets. The Firm’s loan portfolio, aggregating approximately $706.2 billion, net of allowance, at June 30, 2013 is funded with a portion of the Firm’s deposits (aggregating approximately $1,203.0 billion at June 30, 2013), and through securitizations and, with respect to a portion of the Firm’s real estate-related loans, with secured borrowings from the Federal Home Loan Banks. Deposits in excess of the amount utilized to fund loans are primarily invested in the Firm’s available-for-sale securities portfolio or deployed in cash or other short-term liquid investments based on their interest rate and liquidity risk characteristics. Capital markets secured financing assets and trading assets are primarily funded by the Firm’s capital market secured financing liabilities, trading liabilities and a portion of the Firm's long-term debt and equity.
In addition to funding capital markets assets, components of the Firm's debt and equity are used to fund certain loans, and other financial and non-financial assets, or may be invested in the Firm's available for sale securities portfolio. See the discussion below for additional disclosures relating to Deposits, Short-term funding, and Long-term funding and issuance.
Deposits
A key strength of the Firm is its diversified deposit franchise, through each of its lines of business, which provides a stable source of funding and limits reliance on the wholesale funding markets. As of June 30, 2013, the Firm’s deposits-to-loans ratio was
166%
, compared with 163% at December 31, 2012.
As of June 30, 2013, total deposits for the Firm were
$1,203.0 billion
, compared with
$1,193.6 billion
at December 31, 2012 (
54%
and
55%
of total liabilities at June 30, 2013, and December 31, 2012, respectively). The increase in deposits was predominantly due to growth in consumer deposits. For further information, see Balance Sheet Analysis on pages
53–54
of this Form 10-Q.
66
The Firm typically experiences higher customer deposit inflows at period-ends. Therefore, the Firm believes average deposit balances are more representative of deposit trends. The table below summarizes, by line of business, the deposit balance as of June 30, 2013, and December 31, 2012, respectively, as well as average deposits for the three and six months ended June 30, 2013 and 2012, respectively.
|
Deposits
|
Three months ended June 30,
|
Six months ended June 30,
|
||||||||||||||||||
|
June 30,
|
December 31,
|
Average
|
Average
|
|||||||||||||||||
|
(in millions)
|
2013
|
2012
|
2013
|
2012
|
2013
|
2012
|
||||||||||||||
|
Consumer & Community Banking
|
$
|
456,814
|
|
$
|
438,517
|
|
$
|
453,586
|
|
$
|
411,292
|
|
$
|
447,494
|
|
$
|
406,453
|
|
||
|
Corporate & Investment Bank
|
383,720
|
|
385,560
|
|
370,189
|
|
346,079
|
|
363,369
|
|
348,612
|
|
||||||||
|
Commercial Banking
|
189,310
|
|
198,383
|
|
181,844
|
|
179,078
|
|
182,020
|
|
181,883
|
|
||||||||
|
Asset Management
|
137,289
|
|
144,579
|
|
136,577
|
|
128,087
|
|
138,001
|
|
127,811
|
|
||||||||
|
Corporate/Private Equity
|
35,817
|
|
26,554
|
|
31,437
|
|
28,710
|
|
27,907
|
|
31,105
|
|
||||||||
|
Total Firm
|
$
|
1,202,950
|
|
$
|
1,193,593
|
|
$
|
1,173,633
|
|
$
|
1,093,246
|
|
$
|
1,158,791
|
|
$
|
1,095,864
|
|
||
A significant portion of the Firm’s deposits are consumer deposits (
38%
and 37% at June 30, 2013, and December 31, 2012, respectively), which are considered particularly stable as they are less sensitive to interest rate changes or market volatility. Additionally, the majority of the Firm’s institutional deposits are also considered to be stable sources of funding since they are generated from customers that maintain operating service relationships with the Firm. For further discussions of deposit and liability balance trends, see the discussion of the results for the Firm’s business segments and the Balance Sheet Analysis on pages
17–51
and
53–54
, respectively, of this Form 10-Q.
The following table summarizes short-term and long-term funding, excluding deposits, as of June 30, 2013, and December 31, 2012, and average balances for the three and six months ended June 30, 2013 and 2012, respectively. For additional information, see the Balance Sheet Analysis on pages
53–54
and Note 12 on pages
151–152
of this Form 10-Q.
|
June 30,
2013
|
December 31, 2012
|
Three months ended
June 30,
|
Six months ended
June 30,
|
|||||||||||||||||
|
Sources of funds (excluding deposits)
|
Average
|
Average
|
||||||||||||||||||
|
(in millions)
|
2013
|
2012
|
2013
|
2012
|
||||||||||||||||
|
Commercial paper:
|
||||||||||||||||||||
|
Wholesale funding
|
$
|
19,505
|
|
$
|
15,589
|
|
$
|
19,352
|
|
$
|
13,569
|
|
$
|
18,426
|
|
$
|
10,692
|
|
||
|
Client cash management
|
37,126
|
|
39,778
|
|
35,039
|
|
35,222
|
|
35,315
|
|
37,883
|
|
||||||||
|
Total commercial paper
|
$
|
56,631
|
|
$
|
55,367
|
|
$
|
54,391
|
|
$
|
48,791
|
|
$
|
53,741
|
|
$
|
48,575
|
|
||
|
Other borrowed funds
|
$
|
30,385
|
|
$
|
26,636
|
|
$
|
33,618
|
|
$
|
26,310
|
|
$
|
30,600
|
|
$
|
25,839
|
|
||
|
Securities loaned or sold under agreements to repurchase:
|
||||||||||||||||||||
|
Securities sold under agreements to repurchase
|
$
|
230,430
|
|
$
|
212,278
|
|
$
|
231,358
|
|
$
|
220,881
|
|
$
|
225,355
|
|
$
|
215,936
|
|
||
|
Securities loaned
|
24,389
|
|
23,125
|
|
28,346
|
|
19,872
|
|
27,591
|
|
17,355
|
|
||||||||
|
Total securities loaned or sold under agreements to repurchase
(a)(b)(c)
|
$
|
254,819
|
|
$
|
235,403
|
|
$
|
259,704
|
|
$
|
240,753
|
|
$
|
252,946
|
|
$
|
233,291
|
|
||
|
Total senior notes
|
$
|
136,601
|
|
$
|
130,297
|
|
$
|
140,573
|
|
$
|
148,074
|
|
$
|
138,119
|
|
$
|
148,766
|
|
||
|
Trust preferred securities
|
5,471
|
|
10,399
|
|
7,472
|
|
20,499
|
|
8,922
|
|
20,668
|
|
||||||||
|
Subordinated debt
|
28,229
|
|
29,731
|
|
27,426
|
|
29,599
|
|
26,956
|
|
29,801
|
|
||||||||
|
Structured notes
|
28,816
|
|
30,194
|
|
29,666
|
|
31,505
|
|
29,959
|
|
32,338
|
|
||||||||
|
Total long-term unsecured funding
|
$
|
199,117
|
|
$
|
200,621
|
|
|
$
|
205,137
|
|
$
|
229,677
|
|
$
|
203,956
|
|
$
|
231,573
|
|
|
|
Credit card securitization
|
$
|
28,597
|
|
$
|
30,123
|
|
$
|
28,447
|
|
$
|
28,274
|
|
$
|
28,391
|
|
$
|
30,368
|
|
||
|
Other securitizations
(d)
|
3,460
|
|
3,680
|
|
3,563
|
|
4,047
|
|
3,614
|
|
4,100
|
|
||||||||
|
FHLB advances
|
60,887
|
|
42,045
|
|
59,463
|
|
13,760
|
|
52,438
|
|
14,102
|
|
||||||||
|
Other long-term secured funding
(e)
|
6,208
|
|
6,358
|
|
6,196
|
|
7,057
|
|
6,212
|
|
7,196
|
|
||||||||
|
Total long-term secured funding
|
$
|
99,152
|
|
$
|
82,206
|
|
$
|
97,669
|
|
$
|
53,138
|
|
$
|
90,655
|
|
$
|
55,766
|
|
||
|
Preferred stock
(f
)
|
$
|
11,458
|
|
$
|
9,058
|
|
$
|
11,095
|
|
$
|
7,800
|
|
$
|
10,355
|
|
$
|
7,800
|
|
||
|
Common stockholders’ equity
(f)
|
$
|
197,781
|
|
$
|
195,011
|
|
$
|
197,283
|
|
$
|
181,021
|
|
$
|
196,016
|
|
$
|
179,366
|
|
||
|
(a)
|
Excludes federal funds purchased.
|
|
(b)
|
Excluded long-term structured repurchase agreements of $3.2 billion and $3.3 billion as of June 30, 2013, and December 31, 2012, respectively, and average balance of $3.3 billion and $7.2 billion for the three months ended June 30, 2013 and 2012, and $3.3 billion and $6.8 billion for the six months ended June 30, 2013 and 2012, respectively.
|
67
|
(c)
|
Excluded long-term securities loaned of $452 million and $457 million as of June 30, 2013, and December 31, 2012, respectively, and average balance of $453 million for the three months ended June 30, 2013, and $454 million for the six months ended June 30, 2013, respectively. There were no average balances of long-term securities loaned for the three and six months ended June 30, 2012.
|
|
(d)
|
Other securitizations includes securitizations of residential mortgages, auto loans and student loans. The Firm’s wholesale businesses also securitize loans for client-driven transactions; those client-driven loan securitizations are not considered to be a source of funding for the Firm and are not included in the table.
|
|
(e)
|
Includes long-term structured notes which are secured.
|
|
(f)
|
For additional information on preferred stock and common stockholders’ equity see Capital Management on pages
60–64
and Consolidated Statements of Changes in Stockholders’ Equity on page
111
of this Form 10-Q; Note 22 on page 300 and Note 23 on pages 300-301 of JPMorgan Chase’s 2012 Annual Report.
|
Short-term funding
A significant portion of the total commercial paper liabilities, approximately
66%
as of June 30, 2013, as shown in the table above, were originated from deposits that customers choose to sweep into commercial paper liabilities as a cash management program offered by CIB and are not sourced from wholesale funding markets.
The Firm’s sources of short-term secured funding primarily consist of securities loaned or sold under agreements to repurchase. Securities loaned or sold under agreements to repurchase are secured predominantly by high-quality securities collateral, including government-issued debt, agency debt and agency MBS, and constitute a significant portion of the federal funds purchased and securities
loaned or sold under purchase agreements. The amounts of securities loaned or sold under agreements to repurchase at June 30, 2013, increased predominantly due to higher secured financing of the Firm’s assets and higher client financing activity. The balances associated with securities loaned or sold under agreements to repurchase fluctuate over time due to customers’ investment and financing activities; the Firm’s demand for financing; the ongoing management of the mix of the Firm’s liabilities, including its secured and unsecured financing (for both the investment and market-making portfolios); and other market and portfolio factors.
68
Long-term funding and issuance
Long-term funding provides additional sources of stable funding and liquidity for the Firm. The majority of the Firm’s long-term unsecured funding is issued by the parent holding company to provide maximum flexibility in support of both bank and nonbank subsidiary funding.
The following table summarizes long-term unsecured issuance and maturities or redemptions, for the three and six months ended
June 30, 2013 and 2012
, respectively. For additional information, see Note 21 on pages
297–299
of JPMorgan Chase’s 2012 Annual Report.
|
Long-term unsecured funding
|
Three months ended June 30,
|
Six months ended June 30,
|
||||||||||||
|
(in millions)
|
2013
|
2012
|
2013
|
2012
|
||||||||||
|
Issuance
|
||||||||||||||
|
Senior notes issued in the U.S. market
|
$
|
5,434
|
|
$
|
—
|
|
$
|
18,832
|
|
$
|
6,234
|
|
||
|
Senior notes issued in non-U.S. markets
|
5,419
|
|
—
|
|
6,774
|
|
2,050
|
|
||||||
|
Total senior notes
|
10,853
|
|
—
|
|
25,606
|
|
8,284
|
|
||||||
|
Subordinated debt
|
1,989
|
|
—
|
|
1,989
|
|
—
|
|
||||||
|
Structured notes
|
4,619
|
|
2,457
|
|
9,664
|
|
8,422
|
|
||||||
|
Total long-term unsecured funding – issuance
|
$
|
17,461
|
|
$
|
2,457
|
|
$
|
37,259
|
|
$
|
16,706
|
|
||
|
Maturities/redemptions
|
||||||||||||||
|
Total senior notes
|
$
|
9,506
|
|
$
|
17,678
|
|
$
|
13,513
|
|
$
|
21,779
|
|
||
|
Trust preferred securities
|
5,052
|
|
452
|
|
5,052
|
|
452
|
|
||||||
|
Subordinated debt
|
—
|
|
—
|
|
2,417
|
|
1,000
|
|
||||||
|
Structured notes
|
4,668
|
|
3,970
|
|
9,478
|
|
10,024
|
|
||||||
|
Total long-term unsecured funding – maturities/redemptions
|
$
|
19,226
|
|
$
|
22,100
|
|
$
|
30,460
|
|
$
|
33,255
|
|
||
On May 8, 2013, the Firm redeemed approximately $5.0 billion, or 100% of the liquidation amount, of trust preferred
securities pursuant to the optional redemption provisions set forth in the documents governing those trust preferred
securities.
The Firm announced on August 1, 2013 that it would redeem all of its outstanding 8.625% Non-Cumulative Preferred Stock, Series J on September 1, 2013.
During July 2013 and through
August 7, 2013
, the Firm issued $1.0 billion of senior notes in the U.S. market.
The Firm raises secured long-term funding through securitization of consumer credit card loans, residential mortgages, auto loans and student loans as well as through advances from the FHLBs, all of which increase funding and investor diversity.
The following table summarizes the securitization issuance and FHLB advances and their respective maturities or redemption for the three and six months ended June 30, 2013 and 2012, respectively.
|
Three months ended June 30,
|
Six months ended June 30,
|
||||||||||||||||||||||||||
|
Long-term secured funding
|
Issuance
|
Maturities/Redemption
|
Issuance
|
Maturities/Redemption
|
|||||||||||||||||||||||
|
(in millions)
|
2013
|
2012
|
2013
|
2012
|
2013
|
2012
|
2013
|
2012
|
|||||||||||||||||||
|
Credit card securitization
|
$
|
2,860
|
|
$
|
3,850
|
|
$
|
2,147
|
|
$
|
8,549
|
|
$
|
4,760
|
|
$
|
3,850
|
|
$
|
6,265
|
|
$
|
8,603
|
|
|||
|
Other securitizations
(a)
|
—
|
|
—
|
|
119
|
|
127
|
|
—
|
|
—
|
|
220
|
|
231
|
|
|||||||||||
|
FHLB advances
|
4,850
|
|
6,100
|
|
2
|
|
1
|
|
19,550
|
|
6,100
|
|
706
|
|
4,512
|
|
|||||||||||
|
Other long-term secured funding
|
69
|
|
122
|
|
23
|
|
544
|
|
195
|
|
372
|
|
116
|
|
1,273
|
|
|||||||||||
|
Total long-term secured funding
|
$
|
7,779
|
|
$
|
10,072
|
|
$
|
2,291
|
|
$
|
9,221
|
|
$
|
24,505
|
|
$
|
10,322
|
|
$
|
7,307
|
|
$
|
14,619
|
|
|||
|
(a)
|
Other securitizations includes securitizations of residential mortgages, auto loans and student loans.
|
69
In addition, in July 2013, the Firm securitized $900 million of consumer credit card loans.
The Firm’s wholesale businesses also securitize loans for client-driven transactions; those client-driven loan securitizations are not considered to be a source of funding for the Firm and are not included in the table above. For further description of the client-driven loan securitizations, see Note 15 on pages
177–184
of this Form 10-Q.
Parent holding company and subsidiary funding
The parent holding company acts as an important source of funding to its subsidiaries. The Firm’s liquidity management is intended to ensure that liquidity at the parent holding company is maintained at levels sufficient to fund the operations of the parent holding company and its subsidiaries for an extended period of time in a stress environment where access to normal funding sources is disrupted.
To effectively monitor the adequacy of liquidity and funding at the parent holding company, the Firm targets pre-funding of the parent holding company to ensure that both contractual and non-contractual obligations can be met for at least 18 months assuming no access to wholesale funding markets. However, due to conservative liquidity management actions taken by the Firm, the current pre-funding of such obligations is greater than target. For further discussion on liquidity at the parent holding company see Liquidity Risk Management on pages 127–133 of JPMorgan Chase’s 2012 Annual Report.
High Quality Liquid Assets
High Quality Liquid Assets (“HQLA”) is the estimated amount of assets the Firm believes will qualify for inclusion in the Basel III LCR based on the Firm’s current understanding of the rules. HQLA primarily consists of cash and certain unencumbered high quality, liquid assets as defined in the rule.
As of June 30, 2013, HQLA was estimated to be approximately $454 billion, compared with $341 billion as of December 31, 2012. The increase in HQLA was due to higher cash balances driven by increased secured borrowings, trading liabilities and long term debt issuance as well as a reduction in trading assets, securities purchased under resale agreements and investment securities. HQLA may fluctuate from period to period due to normal flows from client activity.
The following table presents the estimated HQLA broken out by HQLA-eligible cash and HQLA-eligible securities as of June 30, 2013.
|
(in billions)
|
June 30, 2013
|
||
|
HQLA
|
|||
|
Eligible cash
|
$
|
279
|
|
|
Eligible securities
|
175
|
|
|
|
Total HQLA
|
$
|
454
|
|
Additional available liquidity resources
In addition to HQLA, as of June 30, 2013, the Firm has approximately $278 billion unencumbered marketable securities, such as equity securities and fixed income debt securities available to raise liquidity, if required. Furthermore, the Firm maintains borrowing capacity at various FHLBs, the Federal Reserve Bank discount window and various other central banks as a result of collateral pledged by the Firm to such banks. Although available, the Firm does not view the borrowing capacity at the Federal Reserve Bank discount window and the various other central banks as a primary source of liquidity. As of June 30, 2013, the Firm's borrowing capacity at various FHLBs and the Federal Reserve Bank discount window was approximately $94 billion, excluding
the
benefit from securities pledged which have been included above in HQLA eligible securities and other unencumbered securities.
Credit
ratings
The cost and availability of financing are influenced by credit ratings. Reductions in these ratings could have an adverse effect on the Firm’s access to liquidity sources, increase the cost of funds, trigger additional collateral or funding requirements and decrease the number of investors and counterparties willing to lend to the Firm. Additionally, the Firm’s funding requirements for VIEs and other third-party commitments may be adversely affected by a decline in credit ratings. For additional information on the impact of a credit ratings downgrade on the funding requirements for VIEs, and on derivatives and collateral agreements, see Special-purpose entities on page
55
, and Credit risk, liquidity risk and credit-related contingent features in Note 5 on pages
131–142
, of this Form 10-Q.
Critical factors in maintaining high credit ratings include a stable and diverse earnings stream, strong capital ratios, strong credit quality and risk management controls, diverse funding sources, and disciplined liquidity monitoring procedures.
70
The credit ratings of the parent holding company and certain of the Firm’s significant operating subsidiaries as of June 30, 2013, were as follows.
|
JPMorgan Chase & Co.
|
JPMorgan Chase Bank, N.A.
Chase Bank USA, N.A.
|
J.P. Morgan Securities LLC
|
|||||||||
|
June 30, 2013
|
Long-term issuer
|
Short-term issuer
|
Outlook
|
Long-term issuer
|
Short-term issuer
|
Outlook
|
Long-term issuer
|
Short-term issuer
|
Outlook
|
||
|
Moody’s Investor Services
|
A2
|
P-1
|
Negative
|
Aa3
|
P-1
|
Stable
|
A1
|
P-1
|
Stable
|
||
|
Standard & Poor’s
|
A
|
A-1
|
Negative
|
A+
|
A-1
|
Stable
|
A+
|
A-1
|
Stable
|
||
|
Fitch Ratings
|
A+
|
F1
|
Stable
|
A+
|
F1
|
Stable
|
A+
|
F1
|
Stable
|
||
On June 11, 2013, S&P announced a reassessment of its government support assumptions reflected in the holding company ratings of eight systemically important financial institutions (“SIFIs”), including the Firm. As a result of this reassessment, the outlook for the parent company was revised to negative from stable; the outlook for the Firm’s operating subsidiaries remained unchanged at stable. Moody's is undertaking a similar reassessment as a result of which Moody's outlook on the Firm's parent company ratings remains negative.
Downgrades of the Firm’s long-term ratings by one notch or two notches could result in a downgrade of the Firm’s short-term ratings. If this were to occur, the Firm believes its cost of funds could increase and access to certain funding markets could be reduced. The nature and magnitude of the impact of further ratings downgrades depends on numerous contractual and behavioral factors (which the Firm believes are incorporated in the its liquidity risk and stress testing metrics). The Firm believes it maintains sufficient liquidity to withstand a potential decrease in funding capacity due to further ratings downgrades.
JPMorgan Chase’s unsecured debt does not contain requirements that would call for an acceleration of payments, maturities or changes in the structure of the existing debt, provide any limitations on future borrowings or require additional collateral, based on unfavorable changes in the Firm’s credit ratings, financial ratios, earnings, or stock price.
Rating agencies continue to evaluate various ratings factors, such as regulatory reforms, rating uplift assumptions surrounding government support, and economic uncertainty and sovereign creditworthiness, and their potential impact on ratings of financial institutions. Although the Firm closely monitors and endeavors to manage factors influencing its credit ratings, there is no assurance that its credit ratings will not be changed in the future.
Cash flows
As of June 30, 2013 and 2012, cash and due from banks was
$29.2 billion
and
$44.9 billion
, respectively. These balances decreased by
$24.5 billion
and
$14.7 billion
from December 31, 2012 and 2011, respectively. The following discussion highlights the major activities and transactions that affected JPMorgan Chase’s cash flows during the six months ended June 30, 2013 and 2012.
Cash flows from operating activities
JPMorgan Chase’s operating assets and liabilities support the Firm’s capital markets and lending activities, including the origination or purchase of loans initially designated as held-for-sale. Operating assets and liabilities can vary significantly in the normal course of business due to the amount and timing of cash flows, which are affected by client-driven and risk management activities, and market conditions. Management believes cash flows from operations, available cash balances and the Firm’s ability to generate cash through short- and long-term borrowings are sufficient to fund the Firm’s operating liquidity needs.
For the six months ended June 30, 2013, net cash provided by operating activities was
$88.5 billion
.
This resulted from a decrease in trading assets - debt and equity instruments driven by client-driven market-making activity in CIB; a decline in trading assets - derivative receivables due to reductions in interest rate derivative receivables, partly offset by an increase in equity derivative receivables; and an increase in accounts payable and other liabilities predominantly due to higher CIB brokerage payables, and the timing of merchant payables payments related to CCB’s Card business. Net cash generated from operating activities was higher than net income, partially as a result of adjustments for noncash items such as deferred tax expense and depreciation and amortization. Cash proceeds received from sales and paydowns of loans originated and purchased with an initial intent to sell was higher than the cash used to acquire such loans, and also reflected higher levels of activities over the prior-year period. Additionally, trading liabilities - debt and equity instruments increased which was partly offset by a decrease in trading liabilities - derivative payables primarily due to reductions in interest rate derivative payables. Partially offsetting these cash proceeds was an increase in accounts receivables due to higher brokerage receivables and margin loan balances driven by client activity, primarily in CIB, and the timing of
71
merchant receivables payments related to CCB’s Card business.
For the six months ended June 30, 2012, net cash provided by operating activities was $46.2 billion. This resulted from a decrease in trading assets–debt and equity instruments driven by lower levels of equity and corporate debt securities, and physical commodities, partially offset by an increase in U.S. government securities; and a decrease in derivative receivables, primarily due to foreign exchange and credit products, partially offset by increased equity derivative balances. Net cash generated from operating activities was higher than net income, partially as a result of adjustments for noncash items such as depreciation and amortization, stock-based compensation and the provision for credit losses. Additionally, cash proceeds received from sales and paydowns of loans was higher than the cash used to acquire such loans originated and purchased with an initial intent to sell. Partially offsetting these cash proceeds was an increase in accrued interest and accounts receivables predominantly due to higher receivables from securities transactions pending settlement, and an increase in CIB customer margin receivables due to changes in client activity.
Cash flows from investing activities
The Firm’s investing activities predominantly include loans originated to be held for investment, the AFS securities portfolio and other short-term interest-earning assets. For the six months ended June 30, 2013, net cash of
$142.2 billion
was used in investing activities. This resulted from a significant increase in deposits with banks reflecting the placement of the Firm’s excess funds with various central banks, primarily Federal Reserve banks. Partially offsetting this cash outflow were a decline in securities purchased under resale agreements due primarily to a shift in deployment of the Firm’s excess cash by Treasury; a decrease in loan balances as a result of cash proceeds from sales and securitizations, lower credit card loans due to seasonality and higher repayment rates, and lower consumer excluding credit card loans, predominantly due to mortgage-related paydowns and portfolio run-off; and proceeds from maturities and sales that were higher than the cash used to acquire new AFS securities.
For the six months ended June 30, 2012, net cash of $66.0 billion was used in investing activities. This resulted from a significant increase in deposits with banks reflecting
the placement of the Firm’s excess funds with various central banks, including Federal Reserve Banks; an increase in securities purchased under resale agreements due to the deployment of excess cash by Treasury; and an increase in loans due to a higher level of wholesale loans driven by increased client activity across all regions and most businesses. Partially offsetting these cash outflows were a decrease in securities, largely due to paydowns and maturities, as well as repositioning of the AFS portfolio; and a decline in the level of consumer, excluding credit card, loans due to paydowns and portfolio run-off, and credit card loans due to seasonality and higher repayment rates.
Cash flows from financing activities
The Firm’s financing activities predominantly include taking customer deposits, and issuing long-term debt as well as preferred and common stock. For the six months ended June 30, 2013, net cash provided by financing activities was
$30.1 billion
. This was driven by net issuances of long-term borrowings; an increase in securities loaned or sold under repurchase agreements predominantly due to higher secured financing of the Firm’s assets and higher client financing activity; and proceeds from the issuance of preferred stock. Partially offsetting these cash inflows were repurchases of common stock and payments of dividends on common and preferred stock.
For the six months ended June 30, 2012, net cash provided by financing activities was $4.9 billion. This was driven by securities loaned or sold under repurchase agreements predominantly in CIB, reflecting higher client financing activity and a change in the mix of liabilities. Partially offsetting these cash proceeds were a decrease in deposits, predominantly due to a decline in client balances in the wholesale businesses, particularly in CIB and CB, partially offset by an overall growth in retail deposits; net redemptions and maturities of long-term borrowings; and payments of cash dividends on common and preferred stock and repurchases of common stock and warrants.
72
|
CREDIT PORTFOLIO
|
||||
The following tables present
JPMorgan Chase
’s credit portfolio as of
June 30, 2013
, and
December 31, 2012
. Total credit exposure was
$1.9 trillion
at
June 30, 2013
, an increase of
$2.8 billion
from
December 31, 2012
, reflecting an increase in the wholesale portfolio of
$9.5 billion
, largely offset by a decrease in the consumer portfolio of
$6.7 billion
. For further information on the changes in the credit portfolio, see Consumer Credit Portfolio on pages
74–83
, and Wholesale Credit Portfolio on pages
84–91
, of
this Form 10-Q
.
In the following tables, reported loans include loans retained (i.e., held-for-investment); loans held-for-sale (which are carried at the lower of cost or fair value, with valuation changes recorded in noninterest revenue); and certain loans accounted for at fair value. In addition, the Firm records certain loans accounted for at fair value in trading assets. For further information regarding these loans see Note 3 on pages
114–127
of
this Form 10-Q
. For additional information on the Firm’s loans and derivative receivables, including the Firm’s accounting policies, see Note 13 and Note 5 on pages
153–175
and
131–142
, respectively, of
this Form 10-Q
.
For further discussion of the Firm’s Credit Risk Management framework, see pages 134–135 of
JPMorgan Chase
’s
2012
Annual Report
.
For further information regarding the credit risk inherent in the Firm’s investment securities portfolio, see Note 11 on pages
147–150
of
this Form 10-Q
and Note 12 on pages 244–248 of
JPMorgan Chase
’s
2012
Annual Report
.
|
Total credit portfolio
|
|||||||||||||
|
Credit exposure
|
Nonperforming
(b)(c)(d)
|
||||||||||||
|
(in millions)
|
Jun 30,
2013 |
Dec 31,
2012 |
Jun 30,
2013 |
Dec 31,
2012 |
|||||||||
|
Loans retained
|
$
|
719,884
|
|
$
|
726,835
|
|
$
|
9,578
|
|
$
|
10,609
|
|
|
|
Loans held-for-sale
|
3,779
|
|
4,406
|
|
60
|
|
18
|
|
|||||
|
Loans at fair value
|
1,923
|
|
2,555
|
|
96
|
|
93
|
|
|||||
|
Total loans – reported
|
725,586
|
|
733,796
|
|
9,734
|
|
10,720
|
|
|||||
|
Derivative receivables
|
73,751
|
|
74,983
|
|
448
|
|
239
|
|
|||||
|
Receivables from customers and other
|
23,852
|
|
23,761
|
|
—
|
|
—
|
|
|||||
|
Total credit-related assets
|
823,189
|
|
832,540
|
|
10,182
|
|
10,959
|
|
|||||
|
Assets acquired in loan satisfactions
|
|||||||||||||
|
Real estate owned
|
NA
|
|
NA
|
|
678
|
|
738
|
|
|||||
|
Other
|
NA
|
|
NA
|
|
36
|
|
37
|
|
|||||
|
Total
assets acquired in loan satisfactions
|
NA
|
|
NA
|
|
714
|
|
775
|
|
|||||
|
Total assets
|
823,189
|
|
832,540
|
|
10,896
|
|
11,734
|
|
|||||
|
Lending-related commitments
|
1,040,134
|
|
1,027,988
|
|
283
|
|
355
|
|
|||||
|
Total credit portfolio
|
$
|
1,863,323
|
|
$
|
1,860,528
|
|
$
|
11,179
|
|
$
|
12,089
|
|
|
|
Credit portfolio management derivatives notional, net
(a)
|
$
|
(24,812
|
)
|
$
|
(27,447
|
)
|
$
|
(10
|
)
|
$
|
(25
|
)
|
|
|
Liquid securities and other cash collateral held against derivatives
|
(13,276
|
)
|
(15,201
|
)
|
NA
|
|
NA
|
|
|||||
|
(in millions,
except ratios)
|
Three months
ended June 30, |
Six months
ended June 30, |
|||||||||||
|
2013
|
2012
|
2013
|
2012
|
||||||||||
|
Net charge-offs
|
$
|
1,403
|
|
$
|
2,278
|
|
$
|
3,128
|
|
$
|
4,665
|
|
|
|
Average retained loans
|
|||||||||||||
|
Loans – reported
|
720,290
|
|
719,878
|
|
719,684
|
|
715,047
|
|
|||||
|
Loans – reported, excluding residential real estate PCI loans
|
662,776
|
|
656,547
|
|
661,382
|
|
650,985
|
|
|||||
|
Net charge-off rates
|
|||||||||||||
|
Loans – reported
|
0.78
|
%
|
1.27
|
%
|
0.88
|
%
|
1.31
|
%
|
|||||
|
Loans – reported, excluding PCI
|
0.85
|
|
1.40
|
|
0.95
|
|
1.44
|
|
|||||
|
(a)
|
Represents the net notional amount of protection purchased and sold through credit derivatives used to manage both performing and nonperforming wholesale credit exposures; these derivatives do not qualify for hedge accounting under U.S. GAAP. Excludes the synthetic credit portfolio. For additional information, see Credit derivatives on pages
90–91
and Note 5 on pages
131–142
of
this Form 10-Q
.
|
|
(b)
|
Nonperforming includes nonaccrual loans, nonperforming derivatives, commitments that are risk rated as nonaccrual, real estate owned and other commercial and personal property owned. Excludes PCI loans. Because the Firm is recognizing interest income on each pool of PCI loans, they are all considered to be performing.
|
|
(c)
|
At
June 30, 2013
, and
December 31, 2012
, nonperforming assets excluded: (1) mortgage loans insured by U.S. government agencies of
$10.1 billion
and
$10.6 billion
, respectively, that are 90 or more days past due; (2) real estate owned insured by U.S. government agencies of
$1.8 billion
and
$1.6 billion
, respectively; and (3) student loans insured by U.S. government agencies under the FFELP of
$488 million
and
$525 million
, respectively, that are 90 or more days past due. These amounts were excluded from nonaccrual loans as reimbursement of insured amounts is proceeding normally. In addition, the Firm’s policy is generally to exempt credit card loans from being placed on nonaccrual status as permitted by regulatory guidance issued by the Federal Financial Institutions Examination Council (“FFIEC”).
|
|
(d)
|
At
June 30, 2013
, and
December 31, 2012
, total nonaccrual loans represented
1.34%
and
1.46%
, respectively, of total loans.
|
73
|
CONSUMER CREDIT PORTFOLIO
|
||||
JPMorgan Chase
’s consumer portfolio consists primarily of residential real estate loans, credit card loans, auto loans, business banking loans, and student loans. The Firm’s primary focus is on serving the prime segment of the consumer credit market. For further information on consumer loans, see Note 13 on pages
153–175
of
this Form 10-Q
.
A substantial portion of the consumer loans acquired in the Washington Mutual transaction were identified as PCI based on an analysis of high-risk characteristics, including product type, loan-to-value (“LTV”) ratios, FICO risk scores and delinquency status. These PCI loans are accounted for on a pool basis, and the pools are considered to be performing. For further information on PCI loans see Note 13 on pages
153–175
of
this Form 10-Q
.
The credit performance of the consumer portfolio continues to improve as the economy continues to slowly expand and home prices improved in the first half of the year. Early-stage residential real estate delinquencies (30–89 days delinquent), excluding government guaranteed loans, decreased during the first half of the year and late-stage delinquencies (150+ days delinquent) continued to decline but remain elevated. The elevated level of the late-stage delinquent loans is due, in part, to loss mitigation activities currently being undertaken and to elongated foreclosure processing timelines. Losses related to these loans continue to be recognized in accordance with the Firm’s standard charge-off practices, but some delinquent loans that would otherwise have been foreclosed upon remain in the mortgage and home equity loan portfolios.
74
The following table presents consumer credit-related information with respect to the credit portfolio held by CCB as well as for prime mortgage loans reported in the Asset Management and the Corporate/Private Equity segments for the dates indicated. For further information about the Firm’s nonaccrual and charge-off accounting policies, see Note 13 on pages
153–175
of
this Form 10-Q
.
|
Consumer credit portfolio
|
Three months ended June 30,
|
Six months ended June 30,
|
|||||||||||||||||||||||||||||||||||
|
(in millions, except ratios)
|
Credit exposure
|
Nonaccrual
loans
(g)(h)
|
Net charge-offs
|
Average annual net charge-off rate
(i)
|
Net charge-offs
|
Average annual net charge-off rate
(i)
|
|||||||||||||||||||||||||||||||
|
Jun 30,
2013 |
Dec 31,
2012 |
Jun 30,
2013 |
Dec 31,
2012 |
2013
|
2012
|
2013
|
2012
|
2013
|
2012
|
2013
|
2012
|
||||||||||||||||||||||||||
|
Consumer, excluding credit card
|
|||||||||||||||||||||||||||||||||||||
|
Loans, excluding PCI loans and loans held-for-sale
|
|||||||||||||||||||||||||||||||||||||
|
Home equity – senior lien
|
$
|
18,277
|
|
$
|
19,385
|
|
$
|
927
|
|
$
|
931
|
|
$
|
32
|
|
$
|
55
|
|
0.69
|
%
|
1.05
|
%
|
$
|
75
|
|
$
|
111
|
|
0.80
|
%
|
1.04
|
%
|
|||||
|
Home equity – junior lien
|
44,049
|
|
48,000
|
|
2,059
|
|
2,277
|
|
204
|
|
411
|
|
1.82
|
|
3.12
|
|
494
|
|
897
|
|
2.17
|
|
3.35
|
|
|||||||||||||
|
Prime mortgage, including option ARMs
|
79,179
|
|
76,256
|
|
3,330
|
|
3,445
|
|
22
|
|
118
|
|
0.11
|
|
0.62
|
|
72
|
|
252
|
|
0.19
|
|
0.66
|
|
|||||||||||||
|
Subprime mortgage
|
7,703
|
|
8,255
|
|
1,594
|
|
1,807
|
|
33
|
|
112
|
|
1.69
|
|
4.94
|
|
100
|
|
242
|
|
2.52
|
|
5.23
|
|
|||||||||||||
|
Auto
(a)
|
50,865
|
|
49,913
|
|
126
|
|
163
|
|
23
|
|
21
|
|
0.18
|
|
0.17
|
|
63
|
|
54
|
|
0.25
|
|
0.23
|
|
|||||||||||||
|
Business banking
|
18,730
|
|
18,883
|
|
454
|
|
481
|
|
74
|
|
98
|
|
1.59
|
|
2.20
|
|
135
|
|
194
|
|
1.46
|
|
2.19
|
|
|||||||||||||
|
Student and other
|
11,849
|
|
12,191
|
|
86
|
|
70
|
|
68
|
|
109
|
|
2.30
|
|
3.22
|
|
125
|
|
170
|
|
2.11
|
|
2.47
|
|
|||||||||||||
|
Total loans, excluding PCI loans and loans held-for-sale
|
230,652
|
|
232,883
|
|
8,576
|
|
9,174
|
|
456
|
|
924
|
|
0.79
|
|
1.55
|
|
1,064
|
|
1,920
|
|
0.92
|
|
1.61
|
|
|||||||||||||
|
Loans – PCI
(b)
|
|||||||||||||||||||||||||||||||||||||
|
Home equity
|
19,992
|
|
20,971
|
|
NA
|
|
NA
|
|
NA
|
|
NA
|
|
NA
|
|
NA
|
|
NA
|
|
NA
|
|
NA
|
|
NA
|
|
|||||||||||||
|
Prime mortgage
|
12,976
|
|
13,674
|
|
NA
|
|
NA
|
|
NA
|
|
NA
|
|
NA
|
|
NA
|
|
NA
|
|
NA
|
|
NA
|
|
NA
|
|
|||||||||||||
|
Subprime mortgage
|
4,448
|
|
4,626
|
|
NA
|
|
NA
|
|
NA
|
|
NA
|
|
NA
|
|
NA
|
|
NA
|
|
NA
|
|
NA
|
|
NA
|
|
|||||||||||||
|
Option ARMs
|
19,320
|
|
20,466
|
|
NA
|
|
NA
|
|
NA
|
|
NA
|
|
NA
|
|
NA
|
|
NA
|
|
NA
|
|
NA
|
|
NA
|
|
|||||||||||||
|
Total loans – PCI
|
56,736
|
|
59,737
|
|
NA
|
|
NA
|
|
NA
|
|
NA
|
|
NA
|
|
NA
|
|
NA
|
|
NA
|
|
NA
|
|
NA
|
|
|||||||||||||
|
Total loans – retained
|
287,388
|
|
292,620
|
|
8,576
|
|
9,174
|
|
456
|
|
924
|
|
0.63
|
|
1.23
|
|
1,064
|
|
1,920
|
|
0.74
|
|
1.27
|
|
|||||||||||||
|
Loans held-for-sale
(c)
|
708
|
|
—
|
|
—
|
|
—
|
|
—
|
|
—
|
|
—
|
|
—
|
|
—
|
|
—
|
|
—
|
|
—
|
|
|||||||||||||
|
Total consumer, excluding credit card loans
|
288,096
|
|
292,620
|
|
8,576
|
|
9,174
|
|
456
|
|
924
|
|
0.63
|
|
1.23
|
|
1,064
|
|
1,920
|
|
0.74
|
|
1.27
|
|
|||||||||||||
|
Lending-related commitments
|
|||||||||||||||||||||||||||||||||||||
|
Home equity – senior lien
(d)
|
14,222
|
|
15,180
|
|
|||||||||||||||||||||||||||||||||
|
Home equity – junior lien
(d)
|
19,765
|
|
21,796
|
|
|||||||||||||||||||||||||||||||||
|
Prime mortgage
|
7,701
|
|
4,107
|
|
|||||||||||||||||||||||||||||||||
|
Subprime mortgage
|
—
|
|
—
|
|
|||||||||||||||||||||||||||||||||
|
Auto
|
8,596
|
|
7,185
|
|
|||||||||||||||||||||||||||||||||
|
Business banking
|
11,293
|
|
11,092
|
|
|||||||||||||||||||||||||||||||||
|
Student and other
|
726
|
|
796
|
|
|||||||||||||||||||||||||||||||||
|
Total lending-related commitments
|
62,303
|
|
60,156
|
|
|||||||||||||||||||||||||||||||||
|
Receivables from customers
(e)
|
129
|
|
113
|
|
|||||||||||||||||||||||||||||||||
|
Total consumer exposure, excluding credit card
|
350,528
|
|
352,889
|
|
|||||||||||||||||||||||||||||||||
|
Credit card
|
|||||||||||||||||||||||||||||||||||||
|
Total credit card loans
(f)
|
124,288
|
|
127,993
|
|
1
|
|
1
|
|
1,014
|
|
1,345
|
|
3.31
|
|
4.35
|
|
2,096
|
|
2,731
|
|
3.43
|
|
4.37
|
|
|||||||||||||
|
Lending-related commitments
(d)
|
532,359
|
|
533,018
|
|
|||||||||||||||||||||||||||||||||
|
Total credit card exposure
|
656,647
|
|
661,011
|
|
|||||||||||||||||||||||||||||||||
|
Total consumer credit portfolio
|
$
|
1,007,175
|
|
$
|
1,013,900
|
|
$
|
8,577
|
|
$
|
9,175
|
|
$
|
1,470
|
|
$
|
2,269
|
|
1.43
|
%
|
2.14
|
%
|
$
|
3,160
|
|
$
|
4,651
|
|
1.54
|
%
|
2.17
|
%
|
|||||
|
Memo: Total consumer credit portfolio, excluding PCI
|
$
|
950,439
|
|
$
|
954,163
|
|
$
|
8,577
|
|
$
|
9,175
|
|
$
|
1,470
|
|
$
|
2,269
|
|
1.66
|
%
|
2.51
|
%
|
$
|
3,160
|
|
$
|
4,651
|
|
1.79
|
%
|
2.55
|
%
|
|||||
|
(a)
|
At
June 30, 2013
, and
December 31, 2012
, excluded operating lease-related assets of
$5.1 billion
and
$4.7 billion
, respectively.
|
|
(b)
|
Charge-offs are not recorded on PCI loans until actual losses exceed estimated losses that were recorded as purchase accounting adjustments at the time of acquisition. To date, no charge-offs have been recorded for these loans.
|
|
(c)
|
Represents prime mortgage loans held-for-sale.
|
|
(d)
|
Credit card and home equity lending-related commitments represent the total available lines of credit for these products. The Firm has not experienced, and does not anticipate, that all available lines of credit would be used at the same time. For credit card and home equity commitments (if certain conditions are met), the Firm can reduce or cancel these lines of credit by providing the borrower notice or, in some cases, without notice as permitted by law.
|
|
(e)
|
Receivables from customers primarily represent margin loans to retail brokerage customers, which are included in accrued interest and accounts receivable on the Consolidated Balance Sheets.
|
|
(f)
|
Includes accrued interest and fees net of an allowance for the uncollectible portion of accrued interest and fee income.
|
|
(g)
|
At
June 30, 2013
, and
December 31, 2012
, nonaccrual loans excluded: (1) mortgage loans insured by U.S. government agencies of
$10.1 billion
and
$10.6 billion
, respectively, that are 90 or more days past due; and (2) student loans insured by U.S. government agencies under the FFELP of
$488 million
and
$525 million
, respectively, that are 90 or more days past due. These amounts were excluded from nonaccrual loans as reimbursement of insured amounts is proceeding normally. In addition, the Firm’s policy is generally to exempt credit card loans from being placed on nonaccrual status as permitted by regulatory guidance.
|
|
(h)
|
Excludes PCI loans. Because the Firm is recognizing interest income on each pool of PCI loans, they are all considered to be performing.
|
|
(i)
|
Average consumer loans held-for-sale were
$8 million
and
$782 million
for the
three months ended
June 30, 2013
and 2012, respectively, and
$4 million
and
$802 million
for the
six months ended
June 30, 2013
and 2012, respectively. These amounts were excluded when calculating net charge-off rates.
|
75
Consumer, excluding credit card
Portfolio analysis
Consumer loan balances declined during the
six months ended
June 30, 2013
, due to paydowns and the charge-off or liquidation of delinquent loans, partially offset by new prime mortgage and auto loan originations. Credit performance has improved across most portfolios but residential real estate charge-offs and delinquent loans remain above normal historical levels.
The following discussion relates to the specific loan and lending-related categories. PCI loans are generally excluded from individual loan product discussions and are addressed separately below. For further information about the Firm’s consumer portfolio, including information about delinquencies, loan modifications and other credit quality indicators, see Note 13 on pages
153–175
of this Form
10-Q.
Home equity:
The home equity portfolio at
June 30, 2013
, was
$62.3 billion
, compared with
$67.4 billion
at
December 31, 2012
. The decrease in this portfolio primarily reflected loan paydowns and charge-offs. Early-stage delinquencies showed improvement from
December 31, 2012
, while late stage-delinquencies were flat due, in part, to loss mitigation activities currently being undertaken and to elongated foreclosure processing timelines. Both senior and junior lien nonaccrual loans decreased from
December 31, 2012
. Net charge-offs for both senior and junior lien home equity loans declined when compared with the same period of the prior year, as a result of improvement in delinquencies and home prices.
Approximately
20%
of the Firm’s home equity portfolio consists of home equity loans (“HELOANs”) and the remainder consists of home equity lines of credit (“HELOCs”). HELOANs are generally fixed-rate, closed-end, amortizing loans, with terms ranging from 3–30 years. Approximately half of the HELOANs are senior liens and the remainder are junior liens. In general, HELOCs originated by the Firm are revolving loans for a 10-year period, after which time the HELOC recasts into a fully-amortizing variable-rate loan with a 20-year amortization period. At the time of origination, the borrower typically selects one of two minimum payment options that will generally remain in effect during the revolving period: a monthly payment of 1% of the outstanding balance, or interest-only payments based on a variable index (typically prime). HELOCs originated by Washington Mutual were generally revolving loans for a 10-year period, after which time the HELOC converts to an interest-only loan with a balloon payment at the end of the loan’s term.
Of the approximately
$54 billion
unpaid principal balance of non-PCI HELOCs outstanding at
June 30, 2013
, approximately
$39 billion
are fully amortizing, currently possess an ability to refinance, are interest-only balloon loans, or are expected to paydown or charge-off prior to recasting. The remaining
$15 billion
represents borrowers who do not currently possess the ability to refinance, and
are expected to experience a recast in future periods. These recasts will primarily occur from 2015 through 2017, at which time the borrower must begin to make fully-amortizing payments. The Firm has considered this payment recast risk in its allowance for loan losses based upon the estimated amount of payment shock (i.e., the excess of the fully-amortizing payment over the interest-only payment in effect prior to recast) expected to occur at the payment recast date, along with corresponding estimated probability of default and loss severity assumptions. Certain factors, such as future developments in both unemployment and home prices, could have a significant impact on the expected and/or actual performance of these loans.
The Firm manages the risk of HELOCs during their revolving period by closing or reducing the undrawn line to the extent permitted by law when borrowers are exhibiting a material deterioration in their credit risk profile or when the collateral does not support the loan amount. The Firm will continue to evaluate both the near-term and longer-term repricing and recast risks inherent in its HELOC portfolio to ensure that changes in the Firm’s estimate of incurred losses are appropriately considered in the allowance for credit losses and that the Firm’s account management practices are appropriate given the portfolio’s risk profile.
At
June 30, 2013
, the Firm estimated that its home equity portfolio contained approximately
$2.7 billion
of current junior lien loans where the borrower has a first mortgage loan that is either delinquent or has been modified (“high-risk seconds”)
,
compared with
$3.1 billion
at
December 31, 2012
. Such loans are considered to pose a higher risk of default than that of junior lien loans for which the senior lien is neither delinquent nor modified. The Firm estimates the balance of its total exposure to high-risk seconds on a quarterly basis using internal data, loan level credit bureau data, which typically provides the delinquency status of the senior lien, as well as information from a database maintained by one of the bank regulatory agencies. The estimated balance of these high-risk seconds may vary from quarter-to-quarter for reasons such as the movement of related senior liens into and out of the 30+ days past due delinquency bucket.
|
Current high risk junior liens
|
|||||||||
|
(in billions)
|
Jun 30,
2013 |
Dec 31,
2012 |
|||||||
|
Junior liens subordinate to:
|
|||||||||
|
Modified current senior lien
|
$
|
1.0
|
|
$
|
1.1
|
|
|||
|
Senior lien 30 – 89 days delinquent
|
0.8
|
|
0.9
|
|
|||||
|
Senior lien 90 days or more delinquent
(a)
|
0.9
|
|
1.1
|
|
|||||
|
Total current high risk junior liens
|
$
|
2.7
|
|
$
|
3.1
|
|
|||
|
(a)
|
Junior liens subordinate to senior liens that are 90 days or more past due are classified as nonaccrual loans. At both
June 30, 2013
, and
December 31, 2012
, excluded approximately
$100 million
of junior liens that are performing but not current, which were also placed on nonaccrual in accordance with the regulatory guidance.
|
76
Of the estimated
$2.7 billion
of high-risk junior liens at
June 30, 2013
, the Firm owns approximately
5%
and services approximately
30%
of the related senior lien loans to the same borrowers. The performance of the Firm’s junior lien loans is generally consistent regardless of whether the Firm owns, services or does not own or service the senior lien. The increased probability of default associated with these higher-risk junior lien loans was considered in estimating the allowance for loan losses.
Mortgage:
Mortgage loans at
June 30, 2013
, including prime, subprime and loans held-for-sale, were
$87.6 billion
, compared with
$84.5 billion
at
December 31, 2012
. The mortgage portfolio increased during the quarter as retained prime mortgage originations outpaced paydowns and the charge-off or liquidation of delinquent loans. Net charge-offs decreased from the same period of the prior year, reflecting continued home price improvement and favorable delinquency trends. However, delinquency levels remain elevated compared with historical levels.
Prime mortgages, including option adjustable-rate mortgages (“ARMs”) and loans held-for-sale, were
$79.9 billion
at
June 30, 2013
, compared with
$76.3 billion
at
December 31, 2012
. These loans increased as prime mortgage retained originations exceeded charge-off or liquidation of delinquent loans, paydowns, and portfolio run-off of option ARM loans. Excluding loans insured by U.S. government agencies, both early-stage and late-stage delinquencies showed improvement during the
six months ended
June 30, 2013
. Nonaccrual loans improved compared with the prior year but remain elevated as a result of ongoing foreclosure processing delays. Net charge-offs continued to improve, as a result of improvement in delinquencies and home prices.
At
June 30, 2013
and
December 31, 2012
, the Firm’s prime mortgage portfolio included $15.0 billion and $16.0 billion, respectively, of interest-only loans with balloon payments due at the end of the term, which represented 19% and 21% of the prime mortgage portfolio, respectively. These loans are typically originated as higher-balance loans to higher-income borrowers. The decrease in this portfolio was primarily due to voluntary prepayments, as borrowers are generally refinancing into lower rate products. To date, losses on this portfolio generally have been consistent with the broader prime mortgage portfolio and the Firm’s expectations. The Firm continues to monitor the risks associated with these loans.
Option ARM loans, which are included in the prime mortgage portfolio, were
$6.0 billion
and
$6.5 billion
and represented
8%
and
9%
of the prime mortgage portfolio at
June 30, 2013
, and
December 31, 2012
, respectively. The decrease in option ARM loans resulted from portfolio run-off. As of
June 30, 2013
, approximately
5%
of option ARM borrowers were delinquent,
1%
were making interest-only or negatively amortizing payments, and
94%
were making amortizing payments (such payments are not necessarily fully amortizing). Approximately
84%
of borrowers within
the portfolio are subject to risk of payment shock due to future payment recast, as only a limited number of these loans have been modified. The cumulative amount of unpaid interest added to the unpaid principal balance due to negative amortization of option ARMs was not material at either
June 30, 2013
, or
December 31, 2012
. The Firm estimates the following balances of option ARM loans will undergo a payment recast that results in a payment increase:
$301 million
in
2013
,
$513 million
in
2014
and
$646 million
in
2015
. Default rates generally increase when payment recast results in a payment increase. However, as the Firm’s option ARM loans, other than those held in the PCI portfolio, are primarily loans with lower LTV ratios and higher borrower FICO scores, it is possible that many of these borrowers will be able to refinance into a lower rate product, which would reduce this payment recast risk. Accordingly, the Firm expects substantially lower losses on this portfolio when compared with the PCI option ARM portfolio. To date, losses realized on option ARM loans that have undergone payment recast have been immaterial and consistent with the Firm’s expectations. The option ARM portfolio was acquired by the Firm as part of the Washington Mutual transaction.
Subprime mortgages at
June 30, 2013
, were
$7.7 billion
, compared with
$8.3 billion
at
December 31, 2012
. The decrease was due to portfolio run-off and the charge-off or liquidation of delinquent loans. Early-stage and late-stage delinquencies as well as nonaccrual loans have improved from
December 31, 2012
, but remain at elevated levels. Net charge-offs decreased from the prior year.
Auto:
Auto loans at
June 30, 2013
, were
$50.9 billion
, compared with
$49.9 billion
at
December 31, 2012
. Loan balances increased due to new originations, partially offset by paydowns and payoffs. Delinquent and nonaccrual loans improved compared with
December 31, 2012
. Net charge-offs increased from the prior year, but loss levels are considered low as a result of favorable trends in both loss frequency and loss severity, mainly due to enhanced underwriting standards and a strong used car market. The auto loan portfolio reflected a high concentration of prime-quality credits.
Business banking:
Business banking loans at
June 30, 2013
, decreased to
$18.7 billion
from
$18.9 billion
at
December 31, 2012
, as new originations were lower than paydowns and charge-offs. Nonaccrual loans improved compared with
December 31, 2012
, and net charge-offs declined from the prior year due to favorable trends in the credit environment.
Student and other:
Student and other loans at
June 30, 2013
, were
$11.8 billion
, compared with
$12.2 billion
at
December 31, 2012
. The decrease was primarily due to paydowns and charge-offs of student loans. Other loans primarily include other secured and unsecured consumer loans. Nonaccrual loans increased from
December 31, 2012
, while net charge-offs decreased from the prior year.
77
Purchased credit-impaired loans:
PCI loans at
June 30, 2013
, were
$56.7 billion
, compared with
$59.7 billion
at
December 31, 2012
. This portfolio represents loans acquired in the Washington Mutual transaction, which were recorded at fair value at the time of acquisition. PCI HELOCs originated by Washington Mutual were generally revolving loans for a 10-year period, after which time the HELOC converts to an interest-only loan with a balloon payment at the end of the loan’s term. Substantially all undrawn HELOCs within the revolving period have been blocked.
During the
six months ended
June 30, 2013
, no change in impairment was recognized in connection with the Firm’s review of the PCI portfolios’ expected cash flows. At both
June 30, 2013
, and
December 31, 2012
, the allowance for loan losses for the home equity, prime mortgage, option ARM and subprime mortgage PCI portfolios was
$1.9 billion
,
$1.9 billion
,
$1.5 billion
and
$380 million
, respectively.
As of
June 30, 2013
, approximately 24% of the Option ARM PCI loans were delinquent. Approximately 67% of the loans in the portfolio that are not delinquent have been modified into fixed-rate, fully amortizing loans and 33% are making amortizing payments, although such payments are not necessarily fully amortizing. This latter group of loans are subject to the risk of payment shock due to future payment recast.
Default rates generally increase on option ARM loans when payment recast results in a payment increase. The expected increase in default rates is considered in the Firm’s quarterly estimates of expected cash flows for the PCI portfolio. The cumulative amount of unpaid interest added to the unpaid principal balance of the option ARM PCI pool was
$812 million
and
$879 million
at
June 30, 2013
, and
December 31, 2012
, respectively. The Firm estimates the following balances of option ARM PCI loans will undergo a payment recast that results in a payment increase:
$77 million
in
2013
,
$392 million
in
2014
, and
$788 million
in
2015
.
The following table provides a summary of lifetime principal loss estimates included in either the nonaccretable difference or the allowance for loan losses. Lifetime principal
loss estimates were relatively unchanged from
December 31, 2012
, to
June 30, 2013
. Principal charge-offs will not be recorded on these pools until the nonaccretable difference has been fully depleted.
|
Summary of lifetime principal loss estimates
|
|||||||||||||||
|
Lifetime loss
estimates
(a)
|
LTD liquidation
losses
(b)
|
||||||||||||||
|
(in billions)
|
Jun 30,
2013 |
Dec 31,
2012 |
Jun 30,
2013 |
Dec 31,
2012 |
|||||||||||
|
Home equity
|
$
|
14.8
|
|
$
|
14.9
|
|
$
|
11.8
|
|
$
|
11.5
|
|
|||
|
Prime mortgage
|
4.1
|
|
4.2
|
|
3.1
|
|
2.9
|
|
|||||||
|
Subprime mortgage
|
3.6
|
|
3.6
|
|
2.4
|
|
2.2
|
|
|||||||
|
Option ARMs
|
11.3
|
|
11.3
|
|
8.3
|
|
8.0
|
|
|||||||
|
Total
|
$
|
33.8
|
|
$
|
34.0
|
|
$
|
25.6
|
|
$
|
24.6
|
|
|||
|
(a)
|
Includes the original nonaccretable difference established in purchase accounting of
$30.5 billion
for principal losses only plus additional principal losses recognized subsequent to acquisition through the provision and allowance for loan losses. The remaining nonaccretable difference for principal losses only was
$4.9 billion
and
$5.8 billion
at
June 30, 2013
, and
December 31, 2012
, respectively.
|
|
(b)
|
Life-to-date (“LTD”) liquidation losses represent both realization of loss upon loan resolution and any principal forgiven upon modification.
|
Geographic composition of residential real estate loans
At both
June 30, 2013
, and
December 31, 2012
, California had the greatest concentration of residential real estate loans with
24%
of the total retained residential real estate loan portfolio, excluding mortgage loans insured by U.S. government agencies and PCI loans. Of the total retained residential real estate loan portfolio, excluding mortgage loans insured by U.S. government agencies and PCI loans,
$74.4 billion
, or
55%
, were concentrated in California, New York, Arizona, Florida and Michigan at
June 30, 2013
, compared with
$74.1 billion
, or
54%
, at
December 31, 2012
. The unpaid principal balance of PCI loans concentrated in these five states represented
72%
of total PCI loans at both
June 30, 2013
, and
December 31, 2012
.
Current estimated LTVs of residential real estate loans
The current estimated average LTV ratio for residential real estate loans retained, excluding mortgage loans insured by U.S. government agencies and PCI loans, was
76%
at
June 30, 2013
, compared with
81%
at
December 31, 2012
. Excluding mortgage loans insured by U.S. government agencies and PCI loans,
14%
of the retained portfolio had a current estimated LTV ratio greater than 100%, and
4%
of the retained portfolio had a current estimated LTV ratio greater than 125% at
June 30, 2013
, compared with
20%
and
8%
, respectively, at
December 31, 2012
. Although home prices have begun to recover, the decline in home prices from 2007 has had a significant impact on the collateral values underlying the Firm’s residential real estate loan portfolio. In general, the delinquency rate for loans with high LTV ratios is greater than the delinquency rate for loans in which the borrower has equity in the collateral. While a large portion of the loans with current estimated LTV ratios greater than 100% continue to pay and are current, the continued willingness and ability of these borrowers to pay remains a risk.
78
The following table presents the current estimated LTV ratios, as well as the ratios of the carrying value of the underlying loans to the current estimated collateral value, with respect to the Firm’s PCI loans. Because such loans were initially measured at fair value, the ratios of the carrying value to the current estimated collateral value will be lower than the current estimated LTV ratios, which are based on the unpaid principal balances. The estimated collateral values used to calculate these ratios do not represent actual appraised loan-level collateral values; as such, the resulting ratios are necessarily imprecise and should therefore be viewed as estimates.
|
LTV ratios and ratios of carrying values to current estimated collateral values – PCI loans
|
||||||||||||||||||||||||
|
June 30, 2013
|
December 31, 2012
|
|||||||||||||||||||||||
|
(in millions,
except ratios)
|
Unpaid principal balance
|
Current estimated
LTV ratio
(a)
|
Net carrying value
(c)
|
Ratio of net
carrying value
to current estimated
collateral value
(c)
|
Unpaid principal
balance
|
Current estimated
LTV ratio
(a)
|
Net carrying value
(c)
|
Ratio of net
carrying value
to current estimated
collateral value
(c)
|
||||||||||||||||
|
Home equity
|
$
|
21,092
|
|
101
|
%
|
(b)
|
$
|
18,084
|
|
86
|
%
|
$
|
22,343
|
|
111
|
%
|
(b)
|
$
|
19,063
|
|
95
|
%
|
||
|
Prime mortgage
|
13,004
|
|
94
|
|
11,047
|
|
79
|
|
13,884
|
|
104
|
|
11,745
|
|
88
|
|
||||||||
|
Subprime mortgage
|
5,966
|
|
99
|
|
4,068
|
|
68
|
|
6,326
|
|
107
|
|
4,246
|
|
72
|
|
||||||||
|
Option ARMs
|
21,109
|
|
92
|
|
17,826
|
|
77
|
|
22,591
|
|
101
|
|
18,972
|
|
85
|
|
||||||||
|
(a)
|
Represents the aggregate unpaid principal balance of loans divided by the estimated current property value. Current property values are estimated at least quarterly based on home valuation models that utilize nationally recognized home price index valuation estimates; such models incorporate actual data to the extent available and forecasted data where actual data is not available.
|
|
(b)
|
Represents current estimated combined LTV for junior home equity liens, which considers all available lien positions related to the property. All other products are presented without consideration of subordinate liens on the property.
|
|
(c)
|
Net carrying value includes the effect of fair value adjustments that were applied to the consumer PCI portfolio at the date of acquisition and is also net of the allowance for loan losses of
$1.9 billion
for home equity,
$1.9 billion
for prime mortgage,
$1.5 billion
for option ARMs, and
$380 million
for subprime mortgage at both
June 30, 2013
, and
December 31, 2012
.
|
The current estimated average LTV ratios were
98%
and
114%
for California and Florida PCI loans, respectively, at
June 30, 2013
, compared with
110%
and
125%
, respectively, at
December 31, 2012
. Average LTV ratios have declined consistent with recent improvement in home prices. Although prices have improved, home prices in California and Florida are still lower than at the peak of the housing market, which continues to negatively contribute to current estimated average LTV ratios and the ratio of net carrying value to current estimated collateral value for loans in the PCI portfolio. Of the PCI portfolio,
40%
had a current estimated LTV ratio greater than 100%, and
14%
had a current LTV ratio of greater than 125% at
June 30, 2013
, compared with
55%
and
24%
, respectively, at
December 31, 2012
.
While the current estimated collateral value is greater than the net carrying value of PCI loans, the ultimate performance of this portfolio is highly dependent on borrowers’ behavior and ongoing ability and willingness to continue to make payments on homes with negative equity, as well as on the cost of alternative housing. For further information on the geographic composition and current estimated LTVs of residential real estate – non-PCI and PCI loans, see Note 13 on pages
153–175
of
this Form 10-Q
.
Loan modification activities – residential real estate loans
For both the Firm’s on–balance sheet loans and loans serviced for others, nearly
1.5 million
mortgage modifications have been offered to borrowers and approximately
684,000
have been approved since the beginning of 2009. Of these, approximately
673,000
have achieved permanent modification as of
June 30, 2013
. Of the remaining modifications offered,
12%
are in a trial period or still being reviewed for a modification, while
88%
have dropped out of the modification program or otherwise were deemed not eligible for final modification.
The Firm is participating in the U.S. Treasury’s Making Home Affordable (“MHA”) programs and is continuing to offer its other loss-mitigation programs to financially distressed borrowers who do not qualify for the U.S. Treasury’s programs. The MHA programs include the Home Affordable Modification Program (“HAMP”) and the Second Lien Modification Program (“2MP”). The Firm’s other loss-mitigation programs for troubled borrowers who do not qualify for HAMP include the traditional modification programs offered by the GSEs and other governmental agencies, as well as the Firm’s proprietary modification programs, which include concessions similar to those offered under HAMP and 2MP but with expanded eligibility criteria. In addition, the Firm has offered specific targeted modification programs to higher risk borrowers, many of whom were current on their mortgages prior to modification. For further information about how loans are modified, see Note 13, Loan modifications, on pages
160–167
of
this Form 10-Q
.
Loan modifications under HAMP and under one of the Firm’s proprietary modification programs, which is largely modeled after HAMP, require at least three payments to be made under the new terms during a trial modification period, and must be successfully re-underwritten with income verification before the loan can be permanently modified. In the case of specific targeted modification programs, re-underwriting the loan or a trial modification period is generally not required, unless the targeted loan is delinquent at the time of modification. When the Firm modifies home equity lines of credit, future lending
79
commitments related to the modified loans are canceled as part of the terms of the modification.
The primary indicator used by management to monitor the success of the modification programs is the rate at which the modified loans redefault. Modification redefault rates are affected by a number of factors, including the type of loan modified, the borrower’s overall ability and willingness to repay the modified loan and macroeconomic factors. Reduction in payment size for a borrower continues to be the most significant driver in improving redefault rates.
The performance of modified loans generally differs by product type and also on whether the underlying loan is in the PCI portfolio, due both to differences in credit quality and in the types of modifications provided. Performance metrics for modifications to the residential real estate portfolio, excluding PCI loans, that have been seasoned more than six months show weighted average redefault rates of
19%
for senior lien home equity,
18%
for junior lien home equity,
14%
for prime mortgages including option ARMs, and
24%
for subprime mortgages. The cumulative performance metrics for modifications to the PCI residential real estate portfolio seasoned more than six months show weighted average redefault rates of
19%
for home equity,
16%
for prime mortgages,
13%
for option ARMs and
28%
for subprime mortgages. The favorable performance of the option ARM modifications is the result of a targeted proactive program which fixes the borrower’s payment at the current level. The cumulative redefault rates reflect the performance of modifications completed under both HAMP and the Firm’s proprietary modification programs from October 1, 2009, through
June 30, 2013
.
The following table presents information as of
June 30, 2013
, and
December 31, 2012
, relating to modified on–balance sheet residential real estate loans for which concessions have been granted to borrowers experiencing financial difficulty. Modifications of PCI loans continue to be accounted for and reported as PCI loans, and the impact of the modification is incorporated into the Firm’s quarterly assessment of estimated future cash flows. Modifications of consumer loans other than PCI loans are generally accounted for and reported as troubled debt restructurings (“TDRs”). For further information on TDRs for the
three and six months ended
June 30, 2013
and
2012
, see Note 13 on pages
153–175
of
this Form 10-Q
.
|
Modified residential real estate loans
|
|||||||||||||
|
June 30, 2013
|
December 31, 2012
|
||||||||||||
|
(in millions)
|
On–balance
sheet loans
|
Nonaccrual on–balance sheet
loans
(d)
|
On–balance
sheet loans
|
Nonaccrual on–balance sheet
loans
(d)
|
|||||||||
|
Modified residential real estate loans, excluding PCI loans
(a)(b)
|
|||||||||||||
|
Home equity – senior lien
|
$
|
1,160
|
|
$
|
648
|
|
$
|
1,092
|
|
$
|
607
|
|
|
|
Home equity –
junior lien
|
1,315
|
|
683
|
|
1,223
|
|
599
|
|
|||||
|
Prime mortgage, including option ARMs
|
7,303
|
|
2,084
|
|
7,118
|
|
1,888
|
|
|||||
|
Subprime mortgage
|
3,825
|
|
1,242
|
|
3,812
|
|
1,308
|
|
|||||
|
Total modified residential real estate loans, excluding PCI loans
|
$
|
13,603
|
|
$
|
4,657
|
|
$
|
13,245
|
|
$
|
4,402
|
|
|
|
Modified PCI loans
(c)
|
|||||||||||||
|
Home equity
|
$
|
2,554
|
|
NA
|
|
$
|
2,302
|
|
NA
|
|
|||
|
Prime mortgage
|
7,247
|
|
NA
|
|
7,228
|
|
NA
|
|
|||||
|
Subprime mortgage
|
4,382
|
|
NA
|
|
4,430
|
|
NA
|
|
|||||
|
Option ARMs
|
13,815
|
|
NA
|
|
14,031
|
|
NA
|
|
|||||
|
Total modified PCI loans
|
$
|
27,998
|
|
NA
|
|
$
|
27,991
|
|
NA
|
|
|||
|
(a)
|
Amounts represent the carrying value of modified residential real estate loans.
|
|
(b)
|
At
June 30, 2013
, and
December 31, 2012
,
$6.9 billion
and
$7.5 billion
, respectively, of loans modified subsequent to repurchase from Ginnie Mae in accordance with the standards of the appropriate government agency (i.e., FHA, VA, RHS) are not included in the table above. When such loans perform subsequent to modification in accordance with Ginnie Mae guidelines, they are generally sold back into Ginnie Mae loan pools. Modified loans that do not re-perform become subject to foreclosure. For additional information about sales of loans in securitization transactions with Ginnie Mae, see Note 15 on pages
177–184
of
this Form 10-Q
.
|
|
(c)
|
Amounts represent the unpaid principal balance of modified PCI loans.
|
|
(d)
|
As of
June 30, 2013
, and
December 31, 2012
, nonaccrual loans included
$3.2 billion
and
$2.9 billion
, respectively, of TDRs for which the borrowers were less than 90 days past due. For additional information about loans modified in a TDR that are on nonaccrual status, see Note 13 on pages
153–175
of
this Form 10-Q
.
|
80
Nonperforming assets
The following table presents information as of
June 30, 2013
, and
December 31, 2012
, about consumer, excluding credit card, nonperforming assets.
|
Nonperforming assets
(a)
|
|||||||
|
(in millions)
|
Jun 30,
2013 |
Dec 31,
2012 |
|||||
|
Nonaccrual loans
(b)
|
|||||||
|
Home equity – senior lien
|
$
|
927
|
|
$
|
931
|
|
|
|
Home equity – junior lien
|
2,059
|
|
2,277
|
|
|||
|
Prime mortgage, including option ARMs
|
3,330
|
|
3,445
|
|
|||
|
Subprime mortgage
|
1,594
|
|
1,807
|
|
|||
|
Auto
|
126
|
|
163
|
|
|||
|
Business banking
|
454
|
|
481
|
|
|||
|
Student and other
|
86
|
|
70
|
|
|||
|
Total nonaccrual loans
|
8,576
|
|
9,174
|
|
|||
|
Assets acquired in loan satisfactions
|
|||||||
|
Real estate owned
|
598
|
|
647
|
|
|||
|
Other
|
36
|
|
37
|
|
|||
|
Total assets acquired in loan satisfactions
|
634
|
|
684
|
|
|||
|
Total nonperforming assets
|
$
|
9,210
|
|
$
|
9,858
|
|
|
|
(a)
|
At
June 30, 2013
, and
December 31, 2012
, nonperforming assets excluded: (1) mortgage loans insured by U.S. government agencies of
$10.1 billion
and
$10.6 billion
, respectively, that are 90 or more days past due; (2) real estate owned insured by U.S. government agencies of
$1.8 billion
and
$1.6 billion
, respectively; and (3) student loans insured by U.S. government agencies under the FFELP of
$488 million
and
$525 million
, respectively, that are 90 or more days past due. These amounts were excluded as reimbursement of insured amounts is proceeding normally.
|
|
(b)
|
Excludes PCI loans that were acquired as part of the Washington Mutual transaction, which are accounted for on a pool basis. Since each pool is accounted for as a single asset with a single composite interest rate and an aggregate expectation of cash flows, the past-due status of the pools, or that of individual loans within the pools, is not meaningful. Because the Firm is recognizing interest income on each pool of loans, they are all considered to be performing.
|
Nonaccrual loans:
Total consumer, excluding credit card, nonaccrual loans were
$8.6 billion
at
June 30, 2013
, compared with
$9.2 billion
at
December 31, 2012
.
The following table presents changes in the consumer, excluding credit card, nonaccrual loans for the
six months ended
June 30, 2013
and
2012
.
|
Nonaccrual loans
|
||||||||
|
Six months ended June 30,
|
||||||||
|
(in millions)
|
2013
|
2012
|
||||||
|
Beginning balance
|
$
|
9,174
|
|
$
|
7,411
|
|
||
|
Additions
|
3,942
|
|
6,496
|
|
(b)
|
|||
|
Reductions:
|
||||||||
|
Principal payments and other
(a)
|
689
|
|
700
|
|
||||
|
Charge-offs
|
1,012
|
|
1,456
|
|
||||
|
Returned to performing status
|
2,250
|
|
2,567
|
|
||||
|
Foreclosures and other liquidations
|
589
|
|
1,115
|
|
||||
|
Total reductions
|
4,540
|
|
5,838
|
|
||||
|
Net additions/(reductions)
|
(598
|
)
|
658
|
|
||||
|
Ending balance
|
$
|
8,576
|
|
$
|
8,069
|
|
||
|
(a)
|
Other reductions includes loan sales.
|
|
(b)
|
Includes
$1.6 billion
as a result of reporting performing junior lien home equity loans that are subordinate to senior liens that are 90 days or more past due as nonaccrual loans based on regulatory guidance at March 31, 2012.
|
Nonaccrual loans in the residential real estate portfolio totaled
$7.9 billion
at
June 30, 2013
, of which
39%
were greater than 150 days past due, compared with nonaccrual residential real estate loans of
$8.5 billion
at
December 31, 2012
, of which
42%
were greater than 150 days past due. In the aggregate, the unpaid principal balance of residential real estate loans greater than 150 days past due was charged down by approximately
52%
to estimated net realizable value of the collateral at both
June 30, 2013
, and
December 31, 2012
, respectively. The elongated foreclosure processing timelines are expected to continue to result in elevated levels of nonaccrual loans in the residential real estate portfolios.
Real estate owned (“REO”):
REO assets are managed for prompt sale and disposition at the best possible economic value. REO assets are those individual properties where the Firm receives the property in satisfaction of a debt (e.g., by taking legal title or physical possession). The Firm generally recognizes REO assets at the completion of the foreclosure process or upon execution of a deed in lieu of foreclosure with the borrower. REO assets, excluding those insured by U.S. government agencies, decreased by
$49 million
from
$647 million
at
December 31, 2012
, to
$598 million
at
June 30, 2013
.
Mortgage servicing-related matters
The financial crisis resulted in unprecedented levels of delinquencies and defaults of 1-4 family residential real estate loans. Such loans required varying degrees of loss mitigation activities. It is the Firm’s goal that foreclosure in these situations be a last resort, and accordingly, the Firm has made, and continues to make, significant efforts to help borrowers stay in their homes. Since the third quarter of 2010, the Firm has prevented two foreclosures for every foreclosure completed; foreclosure-prevention methods include loan modification, short sales and other means.
The Firm has a well-defined foreclosure prevention process when a borrower fails to pay on his or her loan. The Firm attempts to contact the borrower multiple times and in various ways in an effort to pursue home retention or other options other than foreclosure. In addition, if the Firm is unable to contact a borrower, the Firm completes various reviews of the borrower’s facts and circumstances before a foreclosure sale is completed. The delinquency period for the average borrower at the time of foreclosure over the last year has been approximately
27
months.
The high volume of delinquent and defaulted mortgages experienced by the Firm placed a significant amount of stress on the Firm’s servicing operations. The Firm has entered into a global settlement with certain federal and state agencies and Consent Orders with its banking regulators with respect to various mortgage servicing, loss mitigation and foreclosure process-related matters as further discussed below. The GSEs also impose compensatory fees on its mortgage servicers, including the Firm, if such servicers are unable to comply with the foreclosure timetables mandated by the GSEs. The Firm has
81
incurred, and is continuing to incur, compensatory fees, which are reported in default servicing expense. To address its underlying mortgage servicing, loss mitigation and foreclosure process issues, the Firm has made significant changes to its mortgage operations, which will enable it to continue working towards complying with the Consent Orders and the global settlement and enhance its ability to comply with the foreclosure timetables mandated by the GSEs.
On April 22, 2013, the OCC issued guidance regarding the obligation of servicers to track loans scheduled for foreclosure sale within 60 days and to confirm certain information prior to proceeding with the scheduled sale. The Firm is reviewing its practices in response to this guidance.
Global settlement with federal and state agencies:
On February 9, 2012, the Firm announced that it had agreed to a settlement in principle (the “global settlement”) with a number of federal and state government agencies, including the U.S. Department of Justice, the U.S. Department of Housing and Urban Development, the Consumer Financial Protection Bureau and the State Attorneys General, relating to the servicing and origination of mortgages. The global settlement, which became effective on April 5, 2012, required the Firm to, among other things: (i) make cash payments of approximately
$1.1 billion
, a portion of which was set aside for payments to borrowers (“Cash Settlement Payment”); (ii) provide approximately
$500 million
of refinancing relief to certain “underwater” borrowers whose loans are owned and serviced by the Firm (“Refi Program”); and (iii) provide approximately
$3.7 billion
of additional relief for certain borrowers, including reductions of principal on first and second liens, payments to assist with short sales, deficiency balance waivers on past foreclosures and short sales, and forbearance assistance for unemployed homeowners (“Consumer Relief Program”).
The Cash Settlement Payment was made on April 13, 2012 and the Firm began to provide relief to borrowers under the Refi Program and the Consumer Relief Program in the first quarter of 2012. All refinancings required under the Refi Program were completed as of December 31, 2012, and the obligations under the Consumer Relief Program were completed in the first half of 2013. Satisfaction of the Consumer Relief Program and the Refi Program requirements under the global settlement is subject to certification by the Office of Mortgage Settlement Oversight (“OMSO”).
The global settlement also requires the Firm to adhere to certain enhanced mortgage servicing standards. The servicing standards include, among other items, the following enhancements to the Firm’s servicing of loans: a pre-foreclosure notice to all borrowers, which will include account information, holder status, and loss mitigation steps taken; enhancements to payment application and collections processes; strengthening procedures for filings in bankruptcy proceedings; deploying specific restrictions
on the “dual track” of foreclosure and loss mitigation; standardizing the process for appeal of loss mitigation denials; and implementing certain restrictions on fees, including the waiver of certain fees while a borrower’s loss mitigation application is being evaluated. All of the prescribed servicing standards were implemented within the required timeframes and compliance with the standards is subject to both continuous internal review and review by the OMSO. The Firm’s performance under the National Mortgage Settlement is detailed in the OMSO Report which was published on June 19, 2013 and filed with the D.C. District Court. Compliance with the servicing standards continues to be tested and the results will continue to be reported quarterly to the OMSO through the expiration of the settlement. The Firm expects to file its next quarterly report concerning its compliance with the global settlement with the OMSO in August 2013.
Consent Orders:
During the second quarter of 2011, the Firm entered into Consent Orders (“Orders”) with banking regulators relating to its residential mortgage servicing, foreclosure and loss-mitigation activities. In the Orders, the regulators have mandated significant changes to the Firm’s servicing and default business and outlined requirements to implement these changes. The Firm submitted comprehensive action plans to the regulators, which set
forth the steps necessary to ensure the Firm’s residential mortgage servicing, foreclosure and loss-mitigation activities are conducted in accordance with the requirements of the Orders. The plans were approved and the Firm has implemented a number of corrective actions and made significant progress with respect to the following:
|
•
|
Established an independent Compliance Committee which meets regularly and monitors progress against the Orders.
|
|
•
|
Launched a new Customer Assistance Specialist organization for borrowers to facilitate the single point of contact initiative and ensure effective coordination and communication related to foreclosure, loss-mitigation and loan modification.
|
|
•
|
Enhanced its approach to oversight over third-party vendors for foreclosure or other related functions.
|
|
•
|
Standardized the processes for maintaining appropriate controls and oversight of the Firm’s activities with respect to the Mortgage Electronic Registration system (“MERS”) and compliance with MERSCORP’s membership rules, terms and conditions.
|
|
•
|
Strengthened its compliance program so as to ensure mortgage-servicing and foreclosure operations, including loss-mitigation and loan modification, comply with all applicable legal requirements.
|
|
•
|
Enhanced management information systems for loan modification, loss-mitigation and foreclosure activities.
|
|
•
|
Developed a comprehensive assessment of risks in servicing operations including, but not limited to, operational, transaction, legal and reputational risks.
|
82
|
•
|
Made technological enhancements to automate and streamline processes for the Firm’s document management, training, skills assessment and payment processing initiatives.
|
|
•
|
Deployed an internal validation process to monitor progress under the comprehensive action plans.
|
In addition, pursuant to the Orders, the Firm is required to enhance oversight of its mortgage servicing activities, including oversight by compliance, management and audit personnel and, accordingly, has made and continues to make changes in its organization structure, control oversight and customer service practices.
Pursuant to the Orders, the Firm had retained an independent consultant to conduct a review of its residential foreclosure actions during the period from January 1, 2009, through December 31, 2010 (including foreclosure actions brought in respect of loans being serviced), and to remediate any errors or deficiencies identified by the independent consultant. On January 7, 2013, the Firm announced that it and a number of other financial institutions had entered into a settlement agreement with the OCC and the Federal Reserve providing for the termination of such Independent Foreclosure Review programs. On February 28, 2013, the Firm entered into an Amended Consent Order with the regulators reflecting the settlement of the Independent Foreclosure Review. As a result of this settlement, the independent consultant is no longer conducting a look-back review of residential foreclosure actions. The Firm has made total cash payments of approximately
$760 million
into a settlement fund for distribution to qualified borrowers. The Firm has also committed an additional
$1.2 billion
to foreclosure prevention actions, which will be fulfilled through credits given to the Firm for modifications, short sales and other specified types of borrower relief. Foreclosure prevention actions that earn credit under the Independent Foreclosure Review settlement are in addition to actions taken by the Firm to earn credit under the Consumer Relief Program of the global settlement. The estimated impact of the foreclosure prevention actions required under the Independent Foreclosure Review settlement has been considered in the Firm’s allowance for loan losses. The Firm recognized a pretax charge of approximately
$700 million
in the fourth quarter of 2012 related to the Independent Foreclosure Review settlement. For additional information on Mortgage servicing-related matters, see pages 146–148 of
JPMorgan Chase
’s
2012
Annual Report
.
Credit Card
Total credit card loans were
$124.3 billion
at
June 30, 2013
, a decrease of
$3.7 billion
from
December 31, 2012
, due to seasonality and higher repayment rates.
The 30+ day delinquency rate decreased to
1.69%
at
June 30, 2013
, from
2.10%
at
December 31, 2012
. For the
three months ended
June 30, 2013
and
2012
, the net charge-off rates were
3.31%
and
4.35%
, respectively. For the
six months ended
June 30, 2013
and
2012
, the net charge-off rates were
3.43%
and
4.37%
, respectively. Charge-offs have improved compared with a year ago as a result of continued improvement in delinquent loans. The credit card portfolio continues to reflect a well-seasoned, largely rewards-based portfolio that has good U.S. geographic diversification. The greatest geographic concentration of credit card loans is in California, which represented
13%
of total retained loans at both
June 30, 2013
, and
December 31, 2012
. Loan concentration for the top five states of California, New York, Texas, Florida and Illinois consisted of
$51.1 billion
in receivables, or
41%
of the retained loan portfolio, at
June 30, 2013
, compared with
$52.3 billion
, or
41%
, at
December 31, 2012
.
Modifications of credit card loans
At
June 30, 2013
, and
December 31, 2012
, the Firm had
$3.9 billion
and
$4.8 billion
, respectively, of credit card loans outstanding that have been modified in TDRs. These balances included both credit card loans with modified payment terms and credit card loans that reverted back to their pre-modification payment terms because the cardholder did not comply with the modified payment terms. The decrease in modified credit card loans outstanding from
December 31, 2012
, was attributable to a reduction in new modifications as well as ongoing payments and charge-offs on previously modified credit card loans.
Consistent with the Firm’s policy, all credit card loans typically remain on accrual status until charged-off. However, the Firm establishes an allowance, which is offset against loans and charged to interest income, for the estimated uncollectible portion of accrued interest and fee income.
For additional information about loan modification programs to borrowers, see Consumer Credit Portfolio
on pages
74–83
and Note 13 on pages
153–175
of this
Form 10-Q.
83
|
WHOLESALE CREDIT PORTFOLIO
|
||||
As of
June 30, 2013
, wholesale exposure (CIB, CB, and AM) continued to experience a favorable credit environment and stable credit trend with low levels of criticized exposure, nonaccrual loans and charge-offs. Wholesale exposure increased by
$9.5 billion
from
December 31, 2012
, primarily driven by an increase of
$10.7 billion
in lending-related commitments due to increased client activity in the CIB and CB. This increase was partially offset by a
$1.2 billion
decrease in derivative receivables. Derivative receivables decreased primarily due to reductions in interest rate derivative receivables driven by an increase in interest rates. Decreases were partially offset by an increase in equity derivative receivables driven by a rise in equity markets.
|
Wholesale credit portfolio
|
|||||||||||||
|
Credit exposure
|
Nonperforming
(d)
|
||||||||||||
|
(in millions)
|
Jun 30,
2013 |
Dec 31,
2012 |
Jun 30,
2013 |
Dec 31,
2012 |
|||||||||
|
Loans retained
|
$
|
308,208
|
|
$
|
306,222
|
|
$
|
1,001
|
|
$
|
1,434
|
|
|
|
Loans held-for-sale
|
3,071
|
|
4,406
|
|
60
|
|
18
|
|
|||||
|
Loans at fair value
|
1,923
|
|
2,555
|
|
96
|
|
93
|
|
|||||
|
Loans – reported
|
313,202
|
|
313,183
|
|
1,157
|
|
1,545
|
|
|||||
|
Derivative receivables
|
73,751
|
|
74,983
|
|
448
|
|
239
|
|
|||||
|
Receivables from customers and other
(a)
|
23,723
|
|
23,648
|
|
—
|
|
—
|
|
|||||
|
Total wholesale credit-related assets
|
410,676
|
|
411,814
|
|
1,605
|
|
1,784
|
|
|||||
|
Lending-related commitments
(b)
|
445,472
|
|
434,814
|
|
283
|
|
355
|
|
|||||
|
Total wholesale credit exposure
|
$
|
856,148
|
|
$
|
846,628
|
|
$
|
1,888
|
|
$
|
2,139
|
|
|
|
Credit portfolio management derivatives notional, net
(c)
|
$
|
(24,812
|
)
|
$
|
(27,447
|
)
|
$
|
(10
|
)
|
$
|
(25
|
)
|
|
|
Liquid securities and other cash collateral held against derivatives
|
(13,276
|
)
|
(15,201
|
)
|
NA
|
|
NA
|
|
|||||
|
(a)
|
Predominantly includes receivables from customers, which represent margin loans to prime and retail brokerage customers; these are classified in accrued interest and accounts receivable on the Consolidated Balance Sheets.
|
|
(b)
|
Includes amounts for certain non-legally binding lines of credit that the Firm can reduce or cancel by providing the borrower notice or, in some cases, without notice as permitted by law. For further information on lending-related financial instruments please see Note 21 on pages
193–197
of
this Form 10-Q
and Note 29 on pages 308–315 of
JPMorgan Chase
’s
2012
Annual Report
.
|
|
(c)
|
Represents the net notional amount of protection purchased and sold through credit derivatives used to manage both performing and nonperforming wholesale credit exposures; these derivatives do not qualify for hedge accounting under U.S. GAAP. Excludes the synthetic credit portfolio. For additional information, see Credit derivatives on pages
90–91
, and Note 5 on pages
131–142
of
this Form 10-Q
.
|
|
(d)
|
Excludes assets acquired in loan satisfactions. For additional information on assets acquired in loan satisfactions, see page
88
of
this Form 10-Q
.
|
84
The following tables present summaries of the maturity and ratings profiles of the wholesale credit portfolio as of
June 30, 2013
, and
December 31, 2012
. The ratings scale is based on the Firm’s internal risk ratings, which generally correspond to the ratings as defined by S&P and Moody’s.
|
Wholesale credit exposure – maturity and ratings profile
|
|||||||||||||||||||||||||||
|
Maturity profile
(e)
|
Ratings profile
|
||||||||||||||||||||||||||
|
June 30, 2013
|
Due in 1 year or less
|
Due after 1 year through 5 years
|
Due after 5 years
|
Total
|
Investment-grade
|
Noninvestment-grade
|
Total
|
Total % of IG
|
|||||||||||||||||||
|
(in millions, except ratios)
|
AAA/Aaa to BBB-/Baa3
|
BB+/Ba1 & below
|
|||||||||||||||||||||||||
|
Loans retained
|
$
|
119,747
|
|
$
|
115,367
|
|
$
|
73,094
|
|
$
|
308,208
|
|
$
|
225,420
|
|
$
|
82,788
|
|
$
|
308,208
|
|
73
|
%
|
||||
|
Derivative receivables
|
73,751
|
|
73,751
|
|
|||||||||||||||||||||||
|
Less: Liquid securities and other cash collateral held against derivatives
|
(13,276
|
)
|
(13,276
|
)
|
|||||||||||||||||||||||
|
Total derivative receivables, net of all collateral
|
4,860
|
|
26,134
|
|
29,481
|
|
60,475
|
|
53,945
|
|
6,530
|
|
60,475
|
|
89
|
|
|||||||||||
|
Lending-related commitments
|
173,001
|
|
264,291
|
|
8,180
|
|
445,472
|
|
357,460
|
|
88,012
|
|
445,472
|
|
80
|
|
|||||||||||
|
Subtotal
|
297,608
|
|
405,792
|
|
110,755
|
|
814,155
|
|
636,825
|
|
177,330
|
|
814,155
|
|
78
|
|
|||||||||||
|
Loans held-for-sale and loans at fair value
(a)
|
4,994
|
|
4,994
|
|
|||||||||||||||||||||||
|
Receivables from customers and other
|
23,723
|
|
23,723
|
|
|||||||||||||||||||||||
|
Total exposure – net of liquid securities and other cash collateral held against derivatives
|
$
|
842,872
|
|
$
|
842,872
|
|
|||||||||||||||||||||
|
Credit portfolio management derivatives net notional:
|
|||||||||||||||||||||||||||
|
By counterparty ratings profile
(b)(c)
|
$
|
(1,061
|
)
|
$
|
(13,999
|
)
|
$
|
(9,752
|
)
|
$
|
(24,812
|
)
|
$
|
(24,892
|
)
|
$
|
80
|
|
$
|
(24,812
|
)
|
100
|
%
|
||||
|
By reference entity ratings profile
(b)(d)
|
NA
|
|
NA
|
|
NA
|
|
NA
|
|
$
|
(22,535
|
)
|
$
|
(2,277
|
)
|
$
|
(24,812
|
)
|
91
|
%
|
||||||||
|
Maturity profile
(e)
|
Ratings profile
|
||||||||||||||||||||||||||
|
December 31, 2012
|
Due in 1 year or less
|
Due after 1 year through 5 years
|
Due after 5 years
|
Total
|
Investment-grade
|
Noninvestment-grade
|
Total
|
Total % of IG
|
|||||||||||||||||||
|
(in millions, except ratios)
|
AAA/Aaa to BBB-/Baa3
|
BB+/Ba1 & below
|
|||||||||||||||||||||||||
|
Loans retained
|
$
|
115,227
|
|
$
|
117,673
|
|
$
|
73,322
|
|
$
|
306,222
|
|
$
|
214,446
|
|
$
|
91,776
|
|
$
|
306,222
|
|
70
|
%
|
||||
|
Derivative receivables
|
74,983
|
|
74,983
|
|
|||||||||||||||||||||||
|
Less: Liquid securities and other cash collateral held against derivatives
|
(15,201
|
)
|
(15,201
|
)
|
|||||||||||||||||||||||
|
Total derivative receivables, net of all collateral
|
11,793
|
|
25,055
|
|
22,934
|
|
59,782
|
|
50,069
|
|
9,713
|
|
59,782
|
|
84
|
|
|||||||||||
|
Lending-related commitments
|
164,327
|
|
261,261
|
|
9,226
|
|
434,814
|
|
347,316
|
|
87,498
|
|
434,814
|
|
80
|
|
|||||||||||
|
Subtotal
|
291,347
|
|
403,989
|
|
105,482
|
|
800,818
|
|
611,831
|
|
188,987
|
|
800,818
|
|
76
|
|
|||||||||||
|
Loans held-for-sale and loans at fair value
(a)
|
6,961
|
|
6,961
|
|
|||||||||||||||||||||||
|
Receivables from customers and other
|
23,648
|
|
23,648
|
|
|||||||||||||||||||||||
|
Total exposure – net of liquid securities and other cash collateral held against derivatives
|
$
|
831,427
|
|
$
|
831,427
|
|
|||||||||||||||||||||
|
Credit portfolio management derivatives net notional:
|
|||||||||||||||||||||||||||
|
By counterparty ratings profile
(b)(c)
|
$
|
(1,579
|
)
|
$
|
(16,475
|
)
|
$
|
(9,393
|
)
|
$
|
(27,447
|
)
|
$
|
(27,507
|
)
|
$
|
60
|
|
$
|
(27,447
|
)
|
100
|
%
|
||||
|
By reference entity ratings profile
(b)(d)
|
NA
|
|
NA
|
|
NA
|
|
NA
|
|
$
|
(24,622
|
)
|
$
|
(2,825
|
)
|
$
|
(27,447
|
)
|
90
|
%
|
||||||||
|
(a)
|
Represents loans held-for-sale primarily related to syndicated loans and loans transferred from the retained portfolio, and loans at fair value.
|
|
(b)
|
These derivatives do not qualify for hedge accounting under U.S. GAAP. Excludes the synthetic credit portfolio.
|
|
(c)
|
The notional amounts are presented on a net basis by each derivative counterparty and the ratings profile shown is based on the ratings of those counterparties. The counterparties to these positions are predominately investment-grade banks and finance companies.
|
|
(d)
|
The notional amounts are presented on a net basis by underlying reference entity and the ratings profile shown is based on the ratings of the reference entity on which protection has been purchased.
|
|
(e)
|
The maturity profiles of retained loans and lending-related commitments are based on the remaining contractual maturity. The maturity profiles of derivative receivables are based on the maturity profile of average exposure. For further discussion of average exposure, see Derivative receivables on pages 156–159 of
JPMorgan Chase
’s
2012
Annual Report
.
|
Wholesale credit exposure – selected industry exposures
The Firm focuses on the management and diversification of its industry exposures, paying particular attention to industries with actual or potential credit concerns. Exposures deemed criticized align with the U.S. banking regulators’ definition of criticized exposures, which consist
of the special mention, substandard and doubtful categories. The total criticized component of the portfolio, excluding loans held-for-sale and loans at fair value, decreased by
12%
to
$13.8 billion
at
June 30, 2013
, from
$15.6 billion
at
December 31, 2012
, primarily due to repayments and sales.
85
Below are summaries of the top 25 industry exposures as of
June 30, 2013
, and
December 31, 2012
.
|
Selected metrics
|
|||||||||||||||||||||||||||
|
30 days or more past due and accruing
loans |
Year-to-date net charge-offs/
(recoveries)
|
Credit portfolio management credit derivative hedges
(f)
|
Liquid securities
and other cash collateral held against derivative
receivables |
||||||||||||||||||||||||
|
Noninvestment-grade
(e)
|
|||||||||||||||||||||||||||
|
As of or for the six months ended
|
Credit exposure
(d)
|
Investment- grade
|
Noncriticized
|
Criticized performing
|
Criticized nonperforming
|
||||||||||||||||||||||
|
June 30, 2013
|
|||||||||||||||||||||||||||
|
(in millions)
|
|||||||||||||||||||||||||||
|
Top 25 industries
(a)
|
|||||||||||||||||||||||||||
|
Real Estate
|
$
|
81,776
|
|
$
|
57,601
|
|
$
|
20,501
|
|
$
|
3,220
|
|
$
|
454
|
|
$
|
109
|
|
$
|
3
|
|
$
|
(40
|
)
|
$
|
(152
|
)
|
|
Banks & Finance Cos
|
72,919
|
|
61,778
|
|
10,646
|
|
481
|
|
14
|
|
51
|
|
(13
|
)
|
(2,780
|
)
|
(4,524
|
)
|
|||||||||
|
Healthcare
|
47,331
|
|
39,902
|
|
7,044
|
|
382
|
|
3
|
|
17
|
|
—
|
|
(214
|
)
|
(267
|
)
|
|||||||||
|
Oil & Gas
|
44,445
|
|
32,727
|
|
11,307
|
|
400
|
|
11
|
|
2
|
|
13
|
|
(165
|
)
|
(108
|
)
|
|||||||||
|
State & Municipal Govt
(b)
|
36,938
|
|
36,312
|
|
461
|
|
51
|
|
114
|
|
2
|
|
—
|
|
(160
|
)
|
(231
|
)
|
|||||||||
|
Asset Managers
|
36,374
|
|
29,014
|
|
7,151
|
|
209
|
|
—
|
|
11
|
|
(7
|
)
|
—
|
|
(3,599
|
)
|
|||||||||
|
Consumer Products
|
30,691
|
|
19,641
|
|
10,382
|
|
657
|
|
11
|
|
5
|
|
2
|
|
(410
|
)
|
(22
|
)
|
|||||||||
|
Utilities
|
28,676
|
|
24,713
|
|
3,462
|
|
492
|
|
9
|
|
4
|
|
32
|
|
(445
|
)
|
(320
|
)
|
|||||||||
|
Retail & Consumer Services
|
25,864
|
|
16,116
|
|
9,015
|
|
695
|
|
38
|
|
4
|
|
1
|
|
(137
|
)
|
(1
|
)
|
|||||||||
|
Securities Firms & Exchanges
|
19,792
|
|
18,553
|
|
1,212
|
|
24
|
|
3
|
|
—
|
|
(67
|
)
|
(207
|
)
|
(173
|
)
|
|||||||||
|
Transportation
|
19,776
|
|
15,320
|
|
4,237
|
|
181
|
|
38
|
|
1
|
|
9
|
|
(70
|
)
|
(1
|
)
|
|||||||||
|
Central Govt
|
19,772
|
|
19,397
|
|
319
|
|
56
|
|
—
|
|
—
|
|
—
|
|
(10,309
|
)
|
(1,399
|
)
|
|||||||||
|
Machinery & Equipment Mfg
|
19,240
|
|
11,086
|
|
7,557
|
|
588
|
|
9
|
|
3
|
|
(12
|
)
|
(84
|
)
|
(8
|
)
|
|||||||||
|
Technology
|
19,217
|
|
13,395
|
|
5,208
|
|
594
|
|
20
|
|
6
|
|
—
|
|
(447
|
)
|
(5
|
)
|
|||||||||
|
Metals/Mining
|
17,551
|
|
9,102
|
|
7,804
|
|
611
|
|
34
|
|
53
|
|
—
|
|
(220
|
)
|
(96
|
)
|
|||||||||
|
Business Services
|
15,810
|
|
9,566
|
|
5,958
|
|
259
|
|
27
|
|
2
|
|
5
|
|
—
|
|
—
|
|
|||||||||
|
Insurance
|
14,086
|
|
10,806
|
|
2,928
|
|
78
|
|
274
|
|
—
|
|
(2
|
)
|
(131
|
)
|
(1,397
|
)
|
|||||||||
|
Building Materials/Construction
|
12,778
|
|
5,734
|
|
6,272
|
|
759
|
|
13
|
|
60
|
|
—
|
|
(88
|
)
|
(5
|
)
|
|||||||||
|
Media
|
12,702
|
|
7,393
|
|
4,853
|
|
308
|
|
148
|
|
22
|
|
14
|
|
(128
|
)
|
(6
|
)
|
|||||||||
|
Telecom Services
|
12,021
|
|
8,645
|
|
2,869
|
|
483
|
|
24
|
|
4
|
|
—
|
|
(135
|
)
|
—
|
|
|||||||||
|
Automotive
|
11,596
|
|
6,694
|
|
4,717
|
|
184
|
|
1
|
|
3
|
|
(3
|
)
|
(487
|
)
|
—
|
|
|||||||||
|
Chemicals/Plastics
|
11,267
|
|
6,766
|
|
4,251
|
|
232
|
|
18
|
|
1
|
|
1
|
|
(40
|
)
|
(77
|
)
|
|||||||||
|
Leisure
|
6,948
|
|
2,993
|
|
3,228
|
|
569
|
|
158
|
|
6
|
|
—
|
|
(25
|
)
|
(17
|
)
|
|||||||||
|
Agriculture/Paper Mfg
|
6,602
|
|
3,908
|
|
2,642
|
|
48
|
|
4
|
|
9
|
|
3
|
|
—
|
|
—
|
|
|||||||||
|
Aerospace/Defense
|
6,599
|
|
5,308
|
|
1,266
|
|
24
|
|
1
|
|
—
|
|
—
|
|
(141
|
)
|
(1
|
)
|
|||||||||
|
All other
(c)
|
196,660
|
|
175,500
|
|
20,397
|
|
457
|
|
306
|
|
822
|
|
(11
|
)
|
(7,949
|
)
|
(867
|
)
|
|||||||||
|
Subtotal
|
$
|
827,431
|
|
$
|
647,970
|
|
$
|
165,687
|
|
$
|
12,042
|
|
$
|
1,732
|
|
$
|
1,197
|
|
$
|
(32
|
)
|
$
|
(24,812
|
)
|
$
|
(13,276
|
)
|
|
Loans held-for-sale and loans at fair value
|
4,994
|
|
|||||||||||||||||||||||||
|
Receivables from customers and other
|
23,723
|
|
|||||||||||||||||||||||||
|
Total
|
$
|
856,148
|
|
||||||||||||||||||||||||
86
|
Selected metrics
|
|||||||||||||||||||||||||||
|
30 days or more past due and accruing loans
|
Full year net charge-offs/
(recoveries)
|
Credit portfolio management credit derivative hedges
(f)
|
Liquid securities
and other cash collateral held against derivative
receivables |
||||||||||||||||||||||||
|
Noninvestment-grade
(e)
|
|||||||||||||||||||||||||||
|
As of or for the year ended
|
Credit
exposure
(d)
|
Investment-
grade
|
Noncriticized
|
Criticized performing
|
Criticized nonperforming
|
||||||||||||||||||||||
|
December 31, 2012
|
|||||||||||||||||||||||||||
|
(in millions)
|
|||||||||||||||||||||||||||
|
Top 25 industries
(a)
|
|||||||||||||||||||||||||||
|
Real Estate
|
$
|
76,198
|
|
$
|
50,103
|
|
$
|
21,503
|
|
$
|
4,067
|
|
$
|
525
|
|
$
|
391
|
|
$
|
54
|
|
$
|
(41
|
)
|
$
|
(509
|
)
|
|
Banks & Finance Cos
|
73,318
|
|
55,805
|
|
16,928
|
|
578
|
|
7
|
|
20
|
|
(34
|
)
|
(3,524
|
)
|
(6,027
|
)
|
|||||||||
|
Healthcare
|
48,487
|
|
41,146
|
|
6,761
|
|
569
|
|
11
|
|
38
|
|
9
|
|
(238
|
)
|
(459
|
)
|
|||||||||
|
Oil & Gas
|
42,563
|
|
31,258
|
|
11,012
|
|
270
|
|
23
|
|
9
|
|
—
|
|
(155
|
)
|
(101
|
)
|
|||||||||
|
State & Municipal Govt
(b)
|
41,821
|
|
40,562
|
|
1,093
|
|
52
|
|
114
|
|
28
|
|
2
|
|
(186
|
)
|
(221
|
)
|
|||||||||
|
Asset Managers
|
31,474
|
|
26,283
|
|
4,987
|
|
204
|
|
—
|
|
46
|
|
—
|
|
—
|
|
(2,714
|
)
|
|||||||||
|
Consumer Products
|
32,778
|
|
21,428
|
|
10,473
|
|
868
|
|
9
|
|
2
|
|
(16
|
)
|
(275
|
)
|
(12
|
)
|
|||||||||
|
Utilities
|
29,533
|
|
24,917
|
|
4,257
|
|
175
|
|
184
|
|
2
|
|
15
|
|
(315
|
)
|
(368
|
)
|
|||||||||
|
Retail & Consumer Services
|
25,597
|
|
16,100
|
|
8,763
|
|
700
|
|
34
|
|
20
|
|
(11
|
)
|
(37
|
)
|
(1
|
)
|
|||||||||
|
Securities Firms & Exchanges
|
5,756
|
|
4,096
|
|
1,612
|
|
46
|
|
2
|
|
—
|
|
—
|
|
(171
|
)
|
(183
|
)
|
|||||||||
|
Transportation
|
19,827
|
|
15,128
|
|
4,353
|
|
283
|
|
63
|
|
5
|
|
2
|
|
(82
|
)
|
(1
|
)
|
|||||||||
|
Central Govt
|
21,223
|
|
20,678
|
|
484
|
|
61
|
|
—
|
|
—
|
|
—
|
|
(11,620
|
)
|
(1,154
|
)
|
|||||||||
|
Machinery & Equipment Mfg
|
18,504
|
|
10,228
|
|
7,827
|
|
444
|
|
5
|
|
—
|
|
2
|
|
(23
|
)
|
—
|
|
|||||||||
|
Technology
|
18,488
|
|
12,089
|
|
5,683
|
|
696
|
|
20
|
|
—
|
|
1
|
|
(226
|
)
|
—
|
|
|||||||||
|
Metals/Mining
|
20,958
|
|
12,912
|
|
7,608
|
|
406
|
|
32
|
|
8
|
|
(1
|
)
|
(409
|
)
|
(126
|
)
|
|||||||||
|
Business Services
|
13,577
|
|
7,172
|
|
6,132
|
|
232
|
|
41
|
|
9
|
|
23
|
|
(10
|
)
|
—
|
|
|||||||||
|
Insurance
|
14,446
|
|
12,156
|
|
2,119
|
|
171
|
|
—
|
|
2
|
|
(2
|
)
|
(143
|
)
|
(1,729
|
)
|
|||||||||
|
Building Materials/Construction
|
12,377
|
|
5,690
|
|
5,892
|
|
791
|
|
4
|
|
8
|
|
1
|
|
(114
|
)
|
(11
|
)
|
|||||||||
|
Media
|
16,007
|
|
7,473
|
|
7,754
|
|
517
|
|
263
|
|
2
|
|
(218
|
)
|
(93
|
)
|
(8
|
)
|
|||||||||
|
Telecom Services
|
12,239
|
|
7,792
|
|
3,244
|
|
1,200
|
|
3
|
|
5
|
|
1
|
|
(229
|
)
|
—
|
|
|||||||||
|
Automotive
|
11,511
|
|
6,447
|
|
4,963
|
|
101
|
|
—
|
|
—
|
|
—
|
|
(530
|
)
|
—
|
|
|||||||||
|
Chemicals/Plastics
|
11,591
|
|
7,234
|
|
4,172
|
|
169
|
|
16
|
|
18
|
|
2
|
|
(55
|
)
|
(74
|
)
|
|||||||||
|
Leisure
|
7,748
|
|
3,160
|
|
3,724
|
|
551
|
|
313
|
|
—
|
|
(13
|
)
|
(63
|
)
|
(24
|
)
|
|||||||||
|
Agriculture/Paper Mfg
|
7,729
|
|
5,029
|
|
2,657
|
|
42
|
|
1
|
|
5
|
|
—
|
|
—
|
|
—
|
|
|||||||||
|
Aerospace/Defense
|
6,702
|
|
5,518
|
|
1,150
|
|
33
|
|
1
|
|
—
|
|
—
|
|
(141
|
)
|
—
|
|
|||||||||
|
All other
(c)
|
195,567
|
|
174,264
|
|
20,562
|
|
384
|
|
357
|
|
1,478
|
|
5
|
|
(8,767
|
)
|
(1,479
|
)
|
|||||||||
|
Subtotal
|
$
|
816,019
|
|
$
|
624,668
|
|
$
|
175,713
|
|
$
|
13,610
|
|
$
|
2,028
|
|
$
|
2,096
|
|
$
|
(178
|
)
|
$
|
(27,447
|
)
|
$
|
(15,201
|
)
|
|
Loans held-for-sale and loans at fair value
|
6,961
|
|
|||||||||||||||||||||||||
|
Receivables from customers and other
|
23,648
|
|
|||||||||||||||||||||||||
|
Total
|
$
|
846,628
|
|
||||||||||||||||||||||||
|
(a)
|
The industry rankings presented in the table as of
December 31, 2012
, are based on the industry rankings of the corresponding exposures at
June 30, 2013
, not actual rankings of such exposures at
December 31, 2012
.
|
|
(b)
|
In addition to the credit risk exposure to states and municipal governments (both U.S. and non-U.S.) noted above, the Firm held at
June 30, 2013
, and
December 31, 2012
,
$12.5 billion
and
$18.2 billion
, respectively, of trading securities and
$24.5 billion
and
$21.7 billion
, respectively, of AFS securities issued by U.S. state and municipal governments. For further information, see Note 3 and Note 11 on pages
114–127
and
147–150
, respectively, of
this Form 10-Q
.
|
|
(c)
|
All other includes: individuals, private education and civic organizations; SPEs; and holding companies, representing approximately
61%
,
24%
and
7%
, respectively, at June 30, 2013, and
57%
,
28%
and
7%
, respectively, at December 31, 2012. For further information on all other see pages 151–154 of JPMorgan Chase’s 2012 Annual Report.
|
|
(d)
|
Credit exposure is net of risk participations and excludes the benefit of “Credit portfolio management derivatives net notional” held against derivative receivables or loans and “Liquid securities and other cash collateral held against derivative receivables”.
|
|
(e)
|
Exposures deemed criticized correspond to special mention, substandard and doubtful categories as defined by U.S. bank regulatory agencies.
|
|
(f)
|
Represents the net notional amounts of protection purchased and sold through credit derivatives used to manage the credit exposures; these derivatives do not qualify for hedge accounting under U.S. GAAP. The all other category includes purchased credit protection on certain credit indices. Credit portfolio management derivatives excludes the synthetic credit portfolio.
|
87
The following tables present the geographic distribution of wholesale credit exposure including nonperforming assets and past due loans as of
June 30, 2013
, and
December 31, 2012
. The geographic distribution of the wholesale portfolio in the table below is determined based predominantly on the domicile (legal residence) of the borrower. For further information on Country Risk Management, see pages
100–102
of
this Form 10-Q
.
|
Credit exposure
|
Nonperforming
|
Assets acquired in loan satisfactions
|
30 days or more past due and accruing loans
|
||||||||||||||||||||||||||||
|
June 30, 2013
|
Loans
|
Lending-related commitments
|
Derivative receivables
|
Total credit exposure
|
Nonaccrual
loans
(a)
|
Derivatives
|
Lending-related commitments
|
Total non- performing credit exposure
|
|||||||||||||||||||||||
|
(in millions)
|
|||||||||||||||||||||||||||||||
|
Europe/Middle East/Africa
|
$
|
44,599
|
|
$
|
74,445
|
|
$
|
36,475
|
|
$
|
155,519
|
|
$
|
12
|
|
$
|
4
|
|
$
|
11
|
|
$
|
27
|
|
$
|
4
|
|
$
|
8
|
|
|
|
Asia/Pacific
|
29,819
|
|
24,635
|
|
10,540
|
|
64,994
|
|
39
|
|
—
|
|
1
|
|
40
|
|
—
|
|
10
|
|
|||||||||||
|
Latin America/Caribbean
|
30,154
|
|
28,465
|
|
7,390
|
|
66,009
|
|
79
|
|
2
|
|
4
|
|
85
|
|
—
|
|
137
|
|
|||||||||||
|
Canada and Other North America
|
2,525
|
|
8,210
|
|
1,273
|
|
12,008
|
|
—
|
|
—
|
|
—
|
|
—
|
|
—
|
|
5
|
|
|||||||||||
|
Total non-U.S.
|
107,097
|
|
135,755
|
|
55,678
|
|
298,530
|
|
130
|
|
6
|
|
16
|
|
152
|
|
4
|
|
160
|
|
|||||||||||
|
Total U.S.
|
201,111
|
|
309,717
|
|
18,073
|
|
528,901
|
|
871
|
|
442
|
|
267
|
|
1,580
|
|
75
|
|
1,037
|
|
|||||||||||
|
Loans held-for-sale and loans at fair value
|
4,994
|
|
—
|
|
—
|
|
4,994
|
|
156
|
|
NA
|
|
—
|
|
156
|
|
NA
|
|
—
|
|
|||||||||||
|
Receivables from customers and other
|
—
|
|
—
|
|
—
|
|
23,723
|
|
—
|
|
NA
|
|
NA
|
|
—
|
|
NA
|
|
—
|
|
|||||||||||
|
Total
|
$
|
313,202
|
|
$
|
445,472
|
|
$
|
73,751
|
|
$
|
856,148
|
|
$
|
1,157
|
|
$
|
448
|
|
$
|
283
|
|
$
|
1,888
|
|
$
|
79
|
|
$
|
1,197
|
|
|
|
Credit exposure
|
Nonperforming
|
Assets acquired in loan satisfactions
|
30 days or more past due and accruing loans
|
||||||||||||||||||||||||||||
|
December 31, 2012
|
Loans
|
Lending-related commitments
|
Derivative receivables
|
Total credit exposure
|
Nonaccrual
loans
(a)
|
Derivatives
|
Lending-related commitments
|
Total non- performing credit exposure
|
|||||||||||||||||||||||
|
(in millions)
|
|||||||||||||||||||||||||||||||
|
Europe/Middle East/Africa
|
$
|
40,760
|
|
$
|
75,706
|
|
$
|
35,561
|
|
$
|
152,027
|
|
$
|
13
|
|
$
|
8
|
|
$
|
15
|
|
$
|
36
|
|
$
|
9
|
|
$
|
131
|
|
|
|
Asia/Pacific
|
30,287
|
|
22,919
|
|
10,557
|
|
63,763
|
|
13
|
|
—
|
|
—
|
|
13
|
|
—
|
|
18
|
|
|||||||||||
|
Latin America/Caribbean
|
30,322
|
|
26,438
|
|
4,889
|
|
61,649
|
|
67
|
|
—
|
|
4
|
|
71
|
|
—
|
|
640
|
|
|||||||||||
|
Canada and Other North America
|
2,987
|
|
7,653
|
|
1,418
|
|
12,058
|
|
—
|
|
—
|
|
—
|
|
—
|
|
—
|
|
14
|
|
|||||||||||
|
Total non-U.S.
|
104,356
|
|
132,716
|
|
52,425
|
|
289,497
|
|
93
|
|
8
|
|
19
|
|
120
|
|
9
|
|
803
|
|
|||||||||||
|
Total U.S.
|
201,866
|
|
302,098
|
|
22,558
|
|
526,522
|
|
1,341
|
|
231
|
|
336
|
|
1,908
|
|
82
|
|
1,293
|
|
|||||||||||
|
Loans held-for-sale and loans at fair value
|
6,961
|
|
—
|
|
—
|
|
6,961
|
|
111
|
|
NA
|
|
—
|
|
111
|
|
NA
|
|
—
|
|
|||||||||||
|
Receivables from customers and other
|
—
|
|
—
|
|
—
|
|
23,648
|
|
—
|
|
NA
|
|
NA
|
|
—
|
|
NA
|
|
—
|
|
|||||||||||
|
Total
|
$
|
313,183
|
|
$
|
434,814
|
|
$
|
74,983
|
|
$
|
846,628
|
|
$
|
1,545
|
|
$
|
239
|
|
$
|
355
|
|
$
|
2,139
|
|
$
|
91
|
|
$
|
2,096
|
|
|
|
(a)
|
At
June 30, 2013
, and
December 31, 2012
, the Firm held an allowance for loan losses of
$211 million
and
$310 million
, respectively, related to nonaccrual retained loans resulting in allowance coverage ratios of
21%
and
22%
, respectively. Wholesale nonaccrual loans represented
0.37%
and
0.49%
of total wholesale loans at
June 30, 2013
, and
December 31, 2012
, respectively.
|
88
Loans
In the normal course of its wholesale business, the Firm provides loans to a variety of customers, ranging from large corporate and institutional clients to high-net-worth individuals. For further discussion on loans, including information on credit quality indicators, see Note 13 on pages
153–175
of
this Form 10-Q
.
The Firm actively manages its wholesale credit exposure. One way of managing credit risk is through secondary market sales of loans and lending-related commitments. During the
six months ended
June 30, 2013
and
2012
, the Firm sold
$8.3 billion
and
$2.0 billion
, respectively, of loans and lending-related commitments.
The following table presents the change in the nonaccrual loan portfolio for the
six months ended
June 30, 2013
and
2012
. Nonaccrual wholesale loans decreased by
$388 million
from
December 31, 2012
, largely reflecting paydowns.
|
Wholesale nonaccrual loan activity
|
|||||||
|
Six months ended June 30,
|
|||||||
|
(in millions)
|
2013
|
2012
|
|||||
|
Beginning balance
|
$
|
1,545
|
|
$
|
2,581
|
|
|
|
Additions
|
725
|
|
938
|
|
|||
|
Reductions:
|
|
|
|||||
|
Paydowns and other
|
623
|
|
948
|
|
|||
|
Gross charge-offs
|
116
|
|
159
|
|
|||
|
Returned to performing status
|
134
|
|
105
|
|
|||
|
Sales
|
240
|
|
309
|
|
|||
|
Total reductions
|
1,113
|
|
1,521
|
|
|||
|
Net reductions
|
(388
|
)
|
(583
|
)
|
|||
|
Ending balance
|
$
|
1,157
|
|
$
|
1,998
|
|
|
The following table presents net charge-offs/recoveries, which are defined as gross charge-offs less recoveries, for the
three and six months ended
June 30, 2013
and
2012
. The amounts in the table below do not include gains or losses from sales of nonaccrual loans.
|
Wholesale net charge-offs
|
|||||||||||||
|
(in millions, except ratios)
|
Three months
ended June 30, |
Six months
ended June 30, |
|||||||||||
|
2013
|
2012
|
2013
|
2012
|
||||||||||
|
Loans - reported
|
|||||||||||||
|
Average loans retained
|
$
|
308,277
|
|
$
|
292,942
|
|
$
|
306,110
|
|
$
|
284,853
|
|
|
|
Gross charge-offs
|
50
|
|
73
|
|
116
|
|
165
|
|
|||||
|
Gross recoveries
|
(117
|
)
|
(64
|
)
|
(148
|
)
|
(151
|
)
|
|||||
|
Net charge-offs/(recoveries)
|
(67
|
)
|
9
|
|
(32
|
)
|
14
|
|
|||||
|
Net charge-off/(recovery) rate
|
(0.09
|
)%
|
0.01
|
%
|
(0.02
|
)%
|
0.01
|
%
|
|||||
Receivables from customers
Receivables from customers primarily represent margin loans to prime and retail brokerage clients that are collateralized through a pledge of assets maintained in clients’ brokerage accounts that are subject to daily minimum collateral requirements. In the event that the collateral value decreases, a maintenance margin call is made to the client to provide additional collateral into the account. If additional collateral is not provided by the client, the client’s position may be liquidated by the Firm to meet the minimum collateral requirements.
Lending-related commitments
JPMorgan Chase
uses lending-related financial instruments, such as commitments (including Revolving Credit Facilities) and guarantees, to meet the financing needs of its customers. The contractual amounts of these financial instruments represent the maximum possible credit risk should the counterparties draw down on these commitments or the Firm fulfills its obligations under these guarantees, and the counterparties subsequently fails to perform according to the terms of these contracts.
In the Firm’s view, the total contractual amount of these wholesale lending-related commitments is not representative of the Firm’s actual future credit exposure or funding requirements. In determining the amount of credit risk exposure the Firm has to wholesale lending-related commitments, which is used as the basis for allocating credit risk capital to these commitments, the Firm has established a “loan-equivalent” amount for each commitment; this amount represents the portion of the unused commitment or other contingent exposure that is expected, based on average portfolio historical experience, to become drawn upon in an event of a default by an obligor. The loan-equivalent amount of the Firm’s lending-related commitments was
$222.4 billion
and
$223.7 billion
as of
June 30, 2013
, and
December 31, 2012
, respectively.
89
Derivative contracts
In the normal course of business, the Firm uses derivative instruments predominantly for market-making activities. Derivatives enable customers and the Firm to manage exposures to fluctuations in interest rates, currencies and other markets. The Firm also uses derivative instruments to manage its own credit exposure. For further discussion of derivative contracts, see Note 5 on pages
131–142
of
this Form 10-Q
.
The following table summarizes the net derivative receivables for the periods presented.
|
Derivative receivables
|
||||||
|
(in millions)
|
Derivative receivables
|
|||||
|
Jun 30,
2013 |
Dec 31,
2012 |
|||||
|
Interest rate
|
$
|
31,697
|
|
$
|
39,205
|
|
|
Credit derivatives
|
2,364
|
|
1,735
|
|
||
|
Foreign exchange
|
14,317
|
|
14,142
|
|
||
|
Equity
|
13,569
|
|
9,266
|
|
||
|
Commodity
|
11,804
|
|
10,635
|
|
||
|
Total, net of cash collateral
|
73,751
|
|
74,983
|
|
||
|
Liquid securities and other cash collateral held against derivative receivables
|
(13,276
|
)
|
(15,201
|
)
|
||
|
Total, net of collateral
|
$
|
60,475
|
|
$
|
59,782
|
|
Derivative receivables reported on the Consolidated Balance Sheets were
$73.8 billion
and
$75.0 billion
at
June 30, 2013
, and
December 31, 2012
, respectively. These amounts represent the fair value of the derivative contracts, including CVA, after giving effect to legally enforceable
master netting agreements and cash collateral held by the Firm. However, in management’s view, the appropriate measure of current credit risk should also take into consideration additional liquid securities (primarily U.S. government and agency securities and other G7 government bonds) and other cash collateral held by the Firm aggregating
$13.3 billion
and
$15.2 billion
at
June 30, 2013
, and
December 31, 2012
, respectively, that may be used as security when the fair value of the client’s exposure is in the Firm’s favor.
In addition to the collateral described in the preceding paragraph the Firm also holds additional collateral (primarily cash; G7 government securities; other liquid government-agency and guaranteed securities; and corporate debt and equity securities) delivered by clients at the initiation of transactions, as well as collateral related to contracts that have a non-daily call frequency and collateral that the Firm has agreed to return but has not yet settled as of the reporting date. Though this collateral does not reduce the balances and is not included in the table above, it is available as security against potential exposure that could arise should the fair value of the client’s derivative transactions move in the Firm’s favor. As of
June 30, 2013
, and
December 31, 2012
, the Firm held
$29.8 billion
and
$29.0 billion
, respectively, of this additional collateral. The derivative receivables fair value, net of all collateral, also does not include other credit enhancements, such as letters of credit. For additional information on the Firm’s use of collateral agreements, see Note 5 on pages
131–142
of
this Form 10-Q
.
The following table summarizes the ratings profile, by derivative counterparty, of the Firm’s derivative receivables, including credit derivatives, net of other liquid securities collateral, for the dates indicated.
|
Ratings profile of derivative receivables
|
|||||||||||
|
Rating equivalent
|
June 30, 2013
|
December 31, 2012
|
|||||||||
|
(in millions, except ratios)
|
Exposure net of all collateral
|
% of exposure net of all collateral
|
Exposure net of all collateral
|
% of exposure net of all collateral
|
|||||||
|
AAA/Aaa to AA-/Aa3
|
$
|
21,935
|
|
36
|
%
|
$
|
19,964
|
|
34
|
%
|
|
|
A+/A1 to A-/A3
|
14,635
|
|
24
|
|
12,039
|
|
20
|
|
|||
|
BBB+/Baa1 to BBB-/Baa3
|
17,375
|
|
29
|
|
18,066
|
|
30
|
|
|||
|
BB+/Ba1 to B-/B3
|
5,502
|
|
9
|
|
8,434
|
|
14
|
|
|||
|
CCC+/Caa1 and below
|
1,028
|
|
2
|
|
1,279
|
|
2
|
|
|||
|
Total
|
$
|
60,475
|
|
100
|
%
|
$
|
59,782
|
|
100
|
%
|
|
As noted above, the Firm uses collateral agreements to mitigate counterparty credit risk. The percentage of the Firm’s derivatives transactions subject to collateral agreements – excluding foreign exchange spot trades, which are not typically covered by collateral agreements due to their short maturity – was
87%
as of
June 30, 2013
, largely unchanged compared with
88%
as of
December 31, 2012
.
Credit derivatives
Credit derivatives are financial instruments whose value is derived from the credit risk associated with the debt of a third-party issuer (the reference entity) and which allow one party (the protection purchaser) to transfer that risk to another party (the protection seller) when the reference entity suffers a credit event. If no credit event has occurred, the protection seller makes no payments to the protection purchaser.
90
For a more detailed description of credit derivatives, see Credit derivatives in Note 5 on pages
141–142
of
this Form 10-Q
; and on pages 158–159 and Note 6 on pages 218–227 of
JPMorgan Chase
’s
2012
Annual Report
.
The Firm uses credit derivatives for two primary purposes: first, in its capacity as a market-maker; and second, as an end-user, to manage the Firm’s own credit risk associated with various exposures.
Credit portfolio management activities
Included in end-user activities are credit derivatives used to mitigate the credit risk associated with traditional lending activities (loans and unfunded commitments) and derivatives counterparty exposure in the Firm’s wholesale businesses (collectively, “Credit portfolio management” activities). Information on Credit portfolio management activities is provided in the table below. For further information on derivatives used in Credit portfolio management activities, see Credit derivatives in Note 5 on pages
141–142
of
this Form 10-Q
, and on pages 158–159 and Note 6 on pages 218–227 of
JPMorgan Chase
’s
2012
Annual Report
.
In addition, the Firm uses credit derivatives as an end-user to manage other exposures, including credit risk arising from certain AFS securities and from certain securities held in the Firm’s market-making businesses. These credit derivatives, as well as the synthetic credit portfolio, are not included in Credit portfolio management activities; for further information on these credit derivatives as well as credit derivatives used in the Firm’s capacity as a market-maker in credit derivatives, see Credit derivatives in Note 5 on pages
141–142
of
this Form 10-Q
.
|
Credit derivatives used in Credit portfolio management activities
|
|||||||
|
Notional amount of protection
purchased and sold
(a)
|
|||||||
|
(in millions)
|
Jun 30, 2013
|
Dec 31,
2012 |
|||||
|
Credit derivatives used to manage:
|
|||||||
|
Loans and lending-related commitments
|
$
|
2,436
|
|
$
|
2,166
|
|
|
|
Derivative receivables
|
22,448
|
|
25,347
|
|
|||
|
Total net protection purchased
|
24,884
|
|
27,513
|
|
|||
|
Total net protection sold
|
72
|
|
66
|
|
|||
|
Credit portfolio management derivatives notional, net
|
$
|
24,812
|
|
$
|
27,447
|
|
|
|
(a)
|
Amounts are presented net, considering the Firm’s net protection purchased or sold with respect to each underlying reference entity or index.
|
The credit derivatives used in Credit portfolio management activities do not qualify for hedge accounting under U.S. GAAP; these derivatives are reported at fair value, with gains and losses recognized in principal transactions revenue. In contrast, the loans and lending-related commitments being risk-managed are accounted for on an accrual basis. This asymmetry in accounting treatment, between loans and lending-related commitments and the credit derivatives used in Credit portfolio management activities, causes earnings volatility that is not representative, in the Firm’s view, of the true changes in value of the Firm’s overall credit exposure.
In addition, the effectiveness of the Firm’s credit default swap (“CDS”) protection as a hedge of the Firm’s exposures may vary depending on a number of factors, including the named reference entity (i.e., the Firm may experience losses on specific exposures that are different than the named reference entities in the purchased CDS), the contractual terms of the CDS (which may have a defined credit event that does not align with an actual loss realized by the Firm), and the maturity of the Firm’s CDS protection (which in some cases may be shorter than the Firm’s exposures). However, the Firm generally seeks to purchase credit protection with a maturity date that is the same or similar to the maturity date of the exposure for which the protection was purchased, and remaining differences in maturity are actively monitored and managed by the Firm.
Credit Portfolio hedges
The following table sets out the fair value of the Firm’s credit derivatives used in Credit portfolio management activities, the fair value related to the CVA (which reflects the credit quality of derivatives counterparty exposure), as well as certain other hedges used in the risk management of CVA. These results can vary from period to period due to market conditions that affect specific positions in the portfolio.
|
Net gains and losses on credit portfolio hedges
|
||||||||||||||
|
Three months
ended June 30, |
Six months
ended June 30, |
|||||||||||||
|
(in millions)
|
2013
|
2012
|
2013
|
2012
|
||||||||||
|
Hedges of loans and lending-related commitments
|
$
|
(7
|
)
|
$
|
(9
|
)
|
$
|
(39
|
)
|
$
|
(84
|
)
|
||
|
CVA and hedges of CVA
|
(65
|
)
|
(81
|
)
|
(102
|
)
|
95
|
|
||||||
|
Net gains/(losses)
|
$
|
(72
|
)
|
$
|
(90
|
)
|
$
|
(141
|
)
|
$
|
11
|
|
||
91
|
COMMUNITY REINVESTMENT ACT EXPOSURE
|
||||
The Community Reinvestment Act (“CRA”) encourages banks to meet the credit needs of borrowers in all segments of their communities, including neighborhoods with low or moderate incomes. The Firm is a national leader in community development by providing loans, investments and community development services in communities across the United States.
At
June 30, 2013
, and
December 31, 2012
, the Firm’s CRA loan portfolio was approximately
$15 billion
and
$16 billion
, respectively. At
June 30, 2013
, and
December 31, 2012
,
61%
and
62%
, respectively, of the
CRA portfolio were residential mortgage loans;
19%
and
18%
, respectively, were business banking loans;
13%
, for both periods, were commercial real estate loans; and
7%
, for both periods, were other loans. CRA nonaccrual loans were
4%
of the Firm’s total nonaccrual loans for both periods. As a percentage of the Firm’s net charge-offs, net charge-offs in the CRA portfolio were
1%
and
2%
, respectively, for the
three months ended
June 30, 2013
and
2012
, and
2%
and
3%
, respectively, for the
six months ended
June 30, 2013
and
2012
.
|
ALLOWANCE FOR CREDIT LOSSES
|
||||
JPMorgan Chase
’s allowance for loan losses covers the consumer, including credit card, portfolio segments (primarily scored); and wholesale (risk-rated) portfolio. The allowance represents management’s estimate of probable credit losses inherent in the Firm’s loan portfolio. Management also determines an allowance for wholesale and certain consumer, excluding credit card, lending-related commitments.
For a further discussion of the components of the allowance for credit losses, including adjustments to statistical loss calculations, see Critical Accounting Estimates Used by the Firm on pages
104–106
of
this Form 10-Q
and Note 15 on pages 276–279 of
JPMorgan Chase
’s
2012
Annual Report
.
At least quarterly, the allowance for credit losses is reviewed by the CRO, the CFO and the Controller of the Firm, and discussed with the Risk Policy and Audit Committees of the Board of Directors of the Firm. As of
June 30, 2013
,
JPMorgan Chase
deemed the allowance for credit losses to be appropriate (i.e., sufficient to absorb probable credit losses inherent in the portfolio).
The allowance for credit losses was
$20.1 billion
at
June 30, 2013
, a decrease of
$2.5 billion
from
$22.6 billion
at
December 31, 2012
. The decrease in the allowance for loan losses was due to a
$2.7 billion
reduction, reflecting lower estimated losses due to improved delinquency trends in the residential real estate and credit card portfolios, as well as the impact of improved home prices on the residential real estate portfolio.
However, relatively high unemployment, uncertainties regarding the ultimate success of loan modifications, and the risk attributes of certain loans within the portfolio (e.g., loans with high LTV ratios, junior lien loans that are subordinate to a delinquent or modified senior lien, HELOCs with future payment recast) continued to contribute to uncertainty regarding the performance of the residential real estate portfolio; these uncertainties were considered in estimating the allowance for loan losses.
The consumer, excluding credit card, allowance for loan losses decreased
$1.6 billion
from
December 31, 2012
, due
to a reduction in the allowance for the non-PCI residential real estate portfolio. This decrease was largely due to lower estimated losses in the statistical loss calculation of the formula-based allowance, reflecting improved delinquency trends as well as the impact of improved home prices. The adjustment to the base statistical calculation also declined during the second quarter of
2013
, reflecting both the improving trend in home prices and the continuing economic expansion. For additional information about delinquencies and nonaccrual loans in the consumer, excluding credit card, loan portfolio, see Consumer Credit Portfolio on pages
74–83
and Note 13 on pages
153–175
of
this Form 10-Q
.
The credit card allowance for loan losses decreased by
$1.1 billion
from
December 31, 2012
. The decrease included reductions in both the asset-specific and formula-based allowance. The reduction in the asset-specific allowance, which relates to loans restructured in TDRs, largely reflects the changing profile of the TDR portfolio. The volume of new TDRs, which have higher loss rates due to expected redefaults, continues to decrease, and the loss rate on existing TDRs is also decreasing over time as previously restructured loans season and continue to perform. The reduction in the formula-based allowance was primarily driven by the continuing trend of improving delinquencies and bankruptcies, which resulted in a lower level of estimated losses based on the Firm’s statistical loss calculation, and by lower levels of credit card outstandings. For additional information about delinquencies in the credit card loan portfolio, see Consumer Credit Portfolio on pages
74–83
and Note 13 on pages
153–175
of
this Form 10-Q
.
The wholesale allowance was relatively unchanged reflecting stable credit trends.
The allowance for lending-related commitments for both the consumer, excluding credit card, and wholesale portfolios, which is reported in other liabilities, was
$753 million
and
$668 million
at
June 30, 2013
, and
December 31, 2012
, respectively.
92
The credit ratios in the following table are based on retained loan balances, which exclude loans held-for-sale and loans accounted for at fair value.
|
Summary of changes in the allowance for credit losses
|
||||||||||||||||||||||||||
|
2013
|
2012
|
|||||||||||||||||||||||||
|
Six months ended June 30,
|
Consumer, excluding
credit card
|
Credit card
|
Wholesale
|
Total
|
Consumer, excluding
credit card
|
Credit card
|
Wholesale
|
Total
|
||||||||||||||||||
|
(in millions, except ratios)
|
||||||||||||||||||||||||||
|
Allowance for loan losses
|
||||||||||||||||||||||||||
|
Beginning balance at January 1,
|
$
|
12,292
|
|
$
|
5,501
|
|
$
|
4,143
|
|
$
|
21,936
|
|
$
|
16,294
|
|
$
|
6,999
|
|
$
|
4,316
|
|
$
|
27,609
|
|
||
|
Gross charge-offs
|
1,295
|
|
2,414
|
|
116
|
|
3,825
|
|
2,188
|
|
3,210
|
|
165
|
|
5,563
|
|
||||||||||
|
Gross recoveries
|
(231
|
)
|
(318
|
)
|
(148
|
)
|
(697
|
)
|
(268
|
)
|
(479
|
)
|
(151
|
)
|
(898
|
)
|
||||||||||
|
Net charge-offs/(recoveries)
|
1,064
|
|
2,096
|
|
(32
|
)
|
3,128
|
|
1,920
|
|
2,731
|
|
14
|
|
4,665
|
|
||||||||||
|
Provision for loan losses
|
(531
|
)
|
1,046
|
|
64
|
|
579
|
|
(423
|
)
|
1,231
|
|
38
|
|
846
|
|
||||||||||
|
Other
|
(6
|
)
|
(6
|
)
|
9
|
|
(3
|
)
|
(8
|
)
|
—
|
|
9
|
|
1
|
|
||||||||||
|
Ending balance at June 30,
|
$
|
10,691
|
|
$
|
4,445
|
|
$
|
4,248
|
|
$
|
19,384
|
|
$
|
13,943
|
|
$
|
5,499
|
|
$
|
4,349
|
|
$
|
23,791
|
|
||
|
Impairment methodology
|
||||||||||||||||||||||||||
|
Asset-specific
(a)
|
$
|
713
|
|
$
|
1,227
|
|
$
|
228
|
|
$
|
2,168
|
|
$
|
1,004
|
|
$
|
1,977
|
|
$
|
407
|
|
$
|
3,388
|
|
||
|
Formula-based
|
4,267
|
|
3,218
|
|
4,020
|
|
11,505
|
|
7,228
|
|
3,522
|
|
3,942
|
|
14,692
|
|
||||||||||
|
PCI
|
5,711
|
|
—
|
|
—
|
|
5,711
|
|
5,711
|
|
—
|
|
—
|
|
5,711
|
|
||||||||||
|
Total allowance for loan losses
|
$
|
10,691
|
|
$
|
4,445
|
|
$
|
4,248
|
|
$
|
19,384
|
|
$
|
13,943
|
|
$
|
5,499
|
|
$
|
4,349
|
|
$
|
23,791
|
|
||
|
Allowance for lending-related commitments
|
||||||||||||||||||||||||||
|
Beginning balance at January 1,
|
$
|
7
|
|
$
|
—
|
|
$
|
661
|
|
$
|
668
|
|
$
|
7
|
|
$
|
—
|
|
$
|
666
|
|
$
|
673
|
|
||
|
Provision for lending-related commitments
|
1
|
|
—
|
|
84
|
|
85
|
|
—
|
|
—
|
|
94
|
|
94
|
|
||||||||||
|
Other
|
—
|
|
—
|
|
—
|
|
—
|
|
—
|
|
—
|
|
(3
|
)
|
(3
|
)
|
||||||||||
|
Ending balance at June 30,
|
$
|
8
|
|
$
|
—
|
|
$
|
745
|
|
$
|
753
|
|
$
|
7
|
|
$
|
—
|
|
$
|
757
|
|
$
|
764
|
|
||
|
Impairment methodology
|
||||||||||||||||||||||||||
|
Asset-specific
|
$
|
—
|
|
$
|
—
|
|
$
|
79
|
|
$
|
79
|
|
$
|
—
|
|
$
|
—
|
|
$
|
181
|
|
$
|
181
|
|
||
|
Formula-based
|
8
|
|
—
|
|
666
|
|
674
|
|
7
|
|
—
|
|
576
|
|
583
|
|
||||||||||
|
Total allowance for lending-related commitments
|
$
|
8
|
|
$
|
—
|
|
$
|
745
|
|
$
|
753
|
|
$
|
7
|
|
$
|
—
|
|
$
|
757
|
|
$
|
764
|
|
||
|
Total allowance for credit losses
|
$
|
10,699
|
|
$
|
4,445
|
|
$
|
4,993
|
|
$
|
20,137
|
|
$
|
13,950
|
|
$
|
5,499
|
|
$
|
5,106
|
|
$
|
24,555
|
|
||
|
Memo:
|
||||||||||||||||||||||||||
|
Retained loans, end of period
|
$
|
287,388
|
|
$
|
124,288
|
|
$
|
308,208
|
|
$
|
719,884
|
|
$
|
300,046
|
|
$
|
124,593
|
|
$
|
298,888
|
|
$
|
723,527
|
|
||
|
Retained loans, average
|
290,366
|
|
123,208
|
|
306,110
|
|
719,684
|
|
304,590
|
|
125,604
|
|
284,853
|
|
715,047
|
|
||||||||||
|
PCI loans, end of period
|
56,736
|
|
—
|
|
12
|
|
56,748
|
|
62,611
|
|
—
|
|
15
|
|
62,626
|
|
||||||||||
|
Credit ratios
|
||||||||||||||||||||||||||
|
Allowance for loan losses to retained loans
|
3.72
|
%
|
3.58
|
%
|
1.38
|
%
|
2.69
|
%
|
4.65
|
%
|
4.41
|
%
|
1.46
|
%
|
3.29
|
%
|
||||||||||
|
Allowance for loan losses to retained nonaccrual loans
(b)(c)
|
125
|
|
NM
|
|
424
|
|
202
|
|
173
|
|
NM
|
|
241
|
|
241
|
|
||||||||||
|
Allowance for loan losses to retained nonaccrual loans excluding credit card
(b)
|
125
|
|
NM
|
|
424
|
|
156
|
|
173
|
|
NM
|
|
241
|
|
185
|
|
||||||||||
|
Net charge-off/(recovery) rates
(d)
|
0.74
|
|
3.43
|
|
(0.02
|
)
|
0.88
|
|
1.27
|
|
4.37
|
|
0.01
|
|
1.31
|
|
||||||||||
|
Credit ratios, excluding residential real estate PCI loans
|
||||||||||||||||||||||||||
|
Allowance for loan losses to
retained loans |
2.16
|
|
3.58
|
|
1.38
|
|
2.06
|
|
3.47
|
|
4.41
|
|
1.46
|
|
2.74
|
|
||||||||||
|
Allowance for loan losses to
retained nonaccrual loans (b)(c) |
58
|
|
NM
|
|
424
|
|
143
|
|
102
|
|
NM
|
|
241
|
|
183
|
|
||||||||||
|
Allowance for loan losses to
retained nonaccrual loans excluding credit card (b) |
58
|
|
NM
|
|
424
|
|
96
|
|
102
|
|
NM
|
|
241
|
|
127
|
|
||||||||||
|
Net charge-off/(recovery) rates
|
0.92
|
%
|
3.43
|
%
|
(0.02
|
)%
|
0.95
|
%
|
1.61
|
%
|
4.37
|
%
|
0.01
|
%
|
1.44
|
%
|
||||||||||
|
(a)
|
Includes risk-rated loans that have been placed on nonaccrual status and loans that have been modified in a TDR.
|
|
(b)
|
The Firm’s policy is generally to exempt credit card loans from being placed on nonaccrual status as permitted by regulatory guidance.
|
|
(c)
|
Nonaccrual loans included $1.9 billion of Chapter 7 loans at June 30, 2013. Excluding these Chapter 7 loans, the total allowance to total retained nonaccrual loans ratio at June 30, 2013, would have been 253%, and the total allowance to total retained nonaccrual loans excluding PCI loans ratio would have been 178%. For further information, see Consumer Credit Portfolio on pages 138-149 of
JPMorgan Chase
’s
2012
Annual Report
.
|
|
(d)
|
Charge-offs are not recorded on PCI loans until actual losses exceed estimated losses recorded as purchase accounting adjustments at the time of acquisition.
|
93
Provision for credit losses
For the
three and six months ended
June 30, 2013
, the provision for credit losses was
$47 million
and
$664 million
, respectively, down
78%
and
29%
, respectively, from the prior year periods. The provision for the
three and six months ended
June 30, 2013
, included a
$1.5 billion
and
$2.7 billion
reduction in the allowance for loan losses
,
reflecting lower estimated losses due to improved delinquency trends in the residential real estate and credit card portfolios, as well as the impact of improved home prices on the residential real estate portfolio.
The decline in the total consumer provision was due to lower net charge-offs offset partially by a smaller reduction
in the allowance for loan losses compared with the prior-year periods, reflecting lower estimated losses due to improved delinquency trends in the residential real estate and credit card portfolios, as well as the impact of improved home prices on the residential real estate portfolio.
For the
three and six months ended
June 30, 2013
, the wholesale provision for credit losses was
$76 million
and
$148 million
, respectively, compared with
$43 million
and
$132 million
, respectively, in the prior-year periods. The wholesale provision for credit losses in the current periods reflected stable credit trends.
|
Three months ended June 30,
|
Six months ended June 30,
|
||||||||||||||||||||||||||||||||||||||||
|
Provision for loan losses
|
Provision for lending-related commitments
|
Total provision for credit losses
|
Provision for loan losses
|
Provision for lending-related commitments
|
Total provision for credit losses
|
||||||||||||||||||||||||||||||||||||
|
(in millions)
|
2013
|
|
2012
|
|
2013
|
|
2012
|
|
2013
|
|
2012
|
|
2013
|
|
2012
|
|
2013
|
|
2012
|
|
2013
|
|
2012
|
|
|||||||||||||||||
|
Consumer, excluding credit card
|
$
|
(494
|
)
|
$
|
(425
|
)
|
$
|
1
|
|
$
|
1
|
|
$
|
(493
|
)
|
$
|
(424
|
)
|
$
|
(531
|
)
|
$
|
(423
|
)
|
$
|
1
|
|
$
|
—
|
|
$
|
(530
|
)
|
$
|
(423
|
)
|
|||||
|
Credit card
|
464
|
|
595
|
|
—
|
|
—
|
|
464
|
|
595
|
|
1,046
|
|
1,231
|
|
—
|
|
—
|
|
1,046
|
|
1,231
|
|
|||||||||||||||||
|
Total consumer
|
(30
|
)
|
170
|
|
1
|
|
1
|
|
(29
|
)
|
171
|
|
515
|
|
808
|
|
1
|
|
—
|
|
516
|
|
808
|
|
|||||||||||||||||
|
Wholesale
|
40
|
|
30
|
|
36
|
|
13
|
|
76
|
|
43
|
|
64
|
|
38
|
|
84
|
|
94
|
|
148
|
|
132
|
|
|||||||||||||||||
|
Total provision for credit losses
|
$
|
10
|
|
$
|
200
|
|
$
|
37
|
|
$
|
14
|
|
$
|
47
|
|
$
|
214
|
|
$
|
579
|
|
$
|
846
|
|
$
|
85
|
|
$
|
94
|
|
$
|
664
|
|
$
|
940
|
|
|||||
94
|
MARKET RISK MANAGEMENT
|
||||
Market risk is the exposure to an adverse change in the market value of portfolios and financial instruments caused by a change in their market prices. For a discussion of the Firm’s market risk management organization, major market risk drivers and classification of risks, see Market Risk Management on pages 163–169 of JPMorgan Chase’s 2012 Annual Report. For a discussion of the Firm’s risk monitoring and control and market risk limits, see Limits on page 169 of JPMorgan Chase’s 2012 Annual Report.
Market risk management
Market Risk is an independent risk management function that works in close partnership with the lines of business, including Corporate/Private Equity, to identify and monitor market risks throughout the Firm and to define market risk policies and procedures. The market risk function reports to the Firm’s Chief Risk Officer.
Market Risk seeks to control risk, facilitate efficient risk/return decisions, reduce volatility in operating performance and provide transparency into the Firm’s market risk profile for senior management, the Board of Directors and regulators. Market Risk is responsible for the following functions:
|
•
|
Establishment of a market risk policy framework
|
|
•
|
Independent measurement, monitoring and control of line of business and firmwide market risk
|
|
•
|
Definition, approval and monitoring of limits
|
|
•
|
Performance of stress testing and qualitative risk assessments
|
Risk identification and classification
Each line of business is responsible for the management of the market risks within its units. The independent risk management group responsible for overseeing each line of business ensures that all material market risks are appropriately identified, measured, monitored and managed in accordance with the risk policy framework set out by Market Risk. The Firm’s market risks arise primarily from the activities in CIB, Mortgage Production and Mortgage Servicing in CCB, and CIO in Corporate/Private Equity. For further discussion of the Firm’s risk identification and classification, see Market Risk Management on pages 163–169 of JPMorgan Chase’s 2012 Annual Report.
Risk measurement
Tools used to measure risk
Because no single measure can reflect all aspects of market risk, the Firm uses various metrics, both statistical and nonstatistical, including:
|
•
|
Value-at-risk (“VaR”)
|
|
•
|
Economic-value stress testing
|
|
•
|
Nonstatistical risk measures
|
|
•
|
Loss advisories
|
|
•
|
Profit and loss drawdowns
|
|
•
|
Risk identification for large exposures (“RIFLEs”)
|
|
•
|
Nontrading interest rate-sensitive revenue-at-risk stress testing
|
Value-at-risk
JPMorgan Chase utilizes VaR, a statistical risk measure, to estimate the potential loss from adverse market moves in a normal market environment consistent with the day-to-day risk decisions made by the lines of business.
VaR is calculated assuming a one-day holding period and an expected tail-loss methodology, which approximates a 95% confidence level. This means that, assuming current changes in market values are consistent with the historical changes used in the simulation, the Firm would expect to incur losses greater than that predicted by VaR estimates not more than five times in every 100 trading days. For risk management purposes, the Firm believes the use of a 95% confidence level with a one-day holding period provides a stable measure of VaR that closely aligns to the day-to-day risk management decisions made by the lines of business and provides information to respond to risk events on a daily basis.
VaR is not used to estimate the impact of stressed market conditions or to manage any impact from potential stress events. The Firm uses economic-value stress testing and other techniques to capture and manage market risk arising under stressed scenarios, as described further below.
Because VaR is based on historical data, it is an imperfect measure of market risk exposure and potential losses. For example, differences between current and historical market price volatility may result in fewer or greater VaR exceptions than the number indicated by the historical simulation. The VaR measurement also does not provide an estimate of the extent to which losses may occur from stress events not reflected in the historical look-back period. In addition, based on their reliance on available historical data, limited time horizons, and other factors, VaR measures are inherently limited in their ability to measure certain risks and to predict losses, particularly those associated with market illiquidity and sudden or severe shifts in market conditions. As VaR cannot be used to determine future losses in the Firm’s market risk positions, the Firm considers other metrics in addition to VaR to monitor and manage its market risk positions.
Separately, the Firm calculates a daily aggregated VaR in accordance with regulatory rules (“Regulatory VaR”), which is used to derive the Firm’s regulatory VaR-based capital requirements under the Basel 2.5 Market Risk Rule. For additional information on Regulatory VaR and the other components of market risk regulatory capital (e.g. VaR-based Measure, Stressed VaR-based Measure and the respective backtesting) for the Firm, see JPMorgan Chase’s “Regulatory Capital Disclosures - Market Risk Pillar 3 Report” which can be found on the Firm’s website at http://investor.shareholder.com/jpmorganchase/basel.cfm, and see Capital management on pages
60–64
of this Form
10-Q.
95
The table below shows the results of the Firm’s VaR measure using a 95% confidence level.
|
Total VaR
|
Three months ended June 30,
|
Six months ended June 30,
|
|||||||||||||||||||||||||||||||||||||||||
|
|
2013
|
2012
|
At June 30,
|
Average
|
|||||||||||||||||||||||||||||||||||||||
|
(in millions)
|
Avg.
|
Min
|
Max
|
Avg.
|
Min
|
Max
|
2013
|
2012
|
2013
|
2012
|
|||||||||||||||||||||||||||||||||
|
CIB trading VaR by risk type
|
|||||||||||||||||||||||||||||||||||||||||||
|
Fixed income
|
$
|
35
|
|
$
|
23
|
|
$
|
49
|
|
$
|
66
|
|
$
|
53
|
|
$
|
79
|
|
$
|
44
|
|
$
|
65
|
|
$
|
45
|
|
$
|
63
|
|
|||||||||||||
|
Foreign exchange
|
7
|
|
5
|
|
11
|
|
10
|
|
6
|
|
17
|
|
5
|
|
9
|
|
7
|
|
11
|
|
|||||||||||||||||||||||
|
Equities
|
14
|
|
10
|
|
21
|
|
20
|
|
12
|
|
31
|
|
18
|
|
17
|
|
14
|
|
19
|
|
|||||||||||||||||||||||
|
Commodities and other
|
13
|
|
11
|
|
17
|
|
13
|
|
11
|
|
16
|
|
12
|
|
12
|
|
14
|
|
17
|
|
|||||||||||||||||||||||
|
Diversification benefit to CIB trading VaR
|
(33
|
)
|
(a)
|
NM
|
|
(b)
|
NM
|
|
(b)
|
(44
|
)
|
(a)
|
NM
|
|
(b)
|
NM
|
|
(b)
|
(32
|
)
|
(a)
|
(39
|
)
|
(a)
|
(34
|
)
|
(a)
|
(46
|
)
|
(a)
|
|||||||||||||
|
CIB trading VaR
|
36
|
|
21
|
|
49
|
|
65
|
|
50
|
|
80
|
|
47
|
|
64
|
|
46
|
|
64
|
|
|||||||||||||||||||||||
|
Credit portfolio VaR
|
13
|
|
11
|
|
16
|
|
25
|
|
21
|
|
31
|
|
13
|
|
23
|
|
14
|
|
29
|
|
|||||||||||||||||||||||
|
Diversification benefit to CIB trading and credit portfolio VaR
|
(9
|
)
|
(a)
|
NM
|
|
(b)
|
NM
|
|
(b)
|
(15
|
)
|
(a)
|
NM
|
|
(b)
|
NM
|
|
(b)
|
(8
|
)
|
(a)
|
(13
|
)
|
(a)
|
(9
|
)
|
(a)
|
(15
|
)
|
(a)
|
|||||||||||||
|
Total CIB trading and credit portfolio VaR
|
40
|
|
(d)
|
25
|
|
54
|
|
75
|
|
58
|
|
87
|
|
52
|
|
(d)
|
74
|
|
51
|
|
78
|
|
|||||||||||||||||||||
|
Other VaR
|
|||||||||||||||||||||||||||||||||||||||||||
|
Mortgage Production and Mortgage Servicing VaR
|
15
|
|
8
|
|
21
|
|
15
|
|
10
|
|
26
|
|
13
|
|
18
|
|
17
|
|
13
|
|
|||||||||||||||||||||||
|
Chief Investment Office (“CIO”) VaR
|
5
|
|
4
|
|
7
|
|
177
|
|
(c)
|
143
|
|
196
|
|
5
|
|
180
|
|
8
|
|
153
|
|
(c)
|
|||||||||||||||||||||
|
Diversification benefit to total other VaR
|
(5
|
)
|
(a)
|
NM
|
|
(b)
|
NM
|
|
(b)
|
(10
|
)
|
(a)
|
NM
|
|
(b)
|
NM
|
|
(b)
|
(5
|
)
|
(a)
|
(15
|
)
|
(a)
|
(7
|
)
|
(a)
|
(7
|
)
|
(a)
|
|||||||||||||
|
Total other VaR
|
15
|
|
9
|
|
22
|
|
182
|
|
145
|
|
204
|
|
13
|
|
183
|
|
18
|
|
159
|
|
|||||||||||||||||||||||
|
Diversification benefit to total CIB and other VaR
|
(10
|
)
|
(a)
|
NM
|
|
(b)
|
NM
|
|
(b)
|
(56
|
)
|
(a)
|
NM
|
|
(b)
|
NM
|
|
(b)
|
(9
|
)
|
(a)
|
(81
|
)
|
(a)
|
(10
|
)
|
(a)
|
(51
|
)
|
(a)
|
|||||||||||||
|
Total VaR
|
$
|
45
|
|
$
|
29
|
|
$
|
61
|
|
$
|
201
|
|
$
|
160
|
|
$
|
254
|
|
$
|
56
|
|
$
|
176
|
|
$
|
59
|
|
$
|
186
|
|
|||||||||||||
|
(a)
|
Average portfolio VaR and period-end portfolio VaR were less than the sum of the VaR of the components described above, which is due to portfolio diversification. The diversification effect reflects the fact that the risks were not perfectly correlated.
|
|
(b)
|
Designated as not meaningful (“NM”), because the minimum and maximum may occur on different days for different risk components, and hence it is not meaningful to compute a portfolio-diversification effect.
|
|
(c)
|
Reference is made to the CIO synthetic credit portfolio on pages 69–70 of JPMorgan Chase’s 2012 Annual Report regarding the Firm’s restatement of its 2012 first quarter financial statements. The CIO VaR amount has not been recalculated for the first quarter of 2012 to reflect the restatement.
|
|
(d)
|
Effective in the fourth quarter of 2012, CIB’s VaR includes the VaR of the former reportable business segments, Investment Bank and Treasury & Securities Services (“TSS”), which were combined to form the CIB business segment as a result of the reorganization of the Firm’s business segments. TSS VaR was not material and was previously classified within Other VaR. Prior period VaR disclosures were not revised as a result of the business segment reorganization.
|
VaR measurement
CIB trading VaR includes substantially all market-making and client-driven activities as well as certain risk management activities in CIB, including credit spread sensitivity to CVA. For certain products, specific risk parameters are not captured in VaR due to the lack of inherent liquidity and availability of appropriate historical data. The Firm uses proxies to estimate the VaR for these and other products when daily time series are not available. It is likely that using an actual price-based time series for these products, if available, would affect the VaR results presented. The Firm uses alternative methods to capture and measure those risk parameters that are not otherwise captured in VaR, including economic-value stress testing, nonstatistical measures and risk identification for large exposures as described further below.
Credit portfolio VaR includes the derivative CVA, hedges of the CVA and hedges of the retained portfolio, which are reported in principal transactions revenue. Credit portfolio VaR does not include the retained loan portfolio, which is not reported at fair value.
Other VaR includes certain positions employed as part of the Firm’s risk management function within CIO and in the Mortgage Production and Mortgage Servicing businesses. CIO VaR includes positions, primarily in securities and derivatives, which are measured at fair value through earnings. Mortgage Production and Mortgage Servicing VaR includes the Firm’s mortgage pipeline and warehouse loans, MSRs and all related hedges.
96
As noted above, CIB, Credit portfolio and other VaR does not include the retained loan portfolio, which is not reported at fair value; however, it does include hedges of those positions, which are reported at fair value. It also does not include DVA on structured notes and derivative liabilities to reflect the credit quality of the Firm; principal investments; and investment securities managed by CIO that are classified as available for sale. These positions are primarily managed through the Firm’s nontrading interest rate-sensitive revenue-at-risk and other cash flow-monitoring processes, rather than by using a VaR measure. Principal investing activities (including mezzanine financing, tax-oriented investments, etc.) and private equity positions are managed using stress and scenario analyses and are not included in VaR. See the DVA sensitivity table on page
99
of this Form 10-Q for further details. For a discussion of Corporate/Private Equity, see pages
49–51
of this Form 10-Q.
The Firm’s VaR model calculations are continuously evaluated and enhanced in response to changes in the composition of the Firm’s portfolios, changes in market conditions, improvements in the Firm’s modeling techniques and other factors. Such changes will also affect historical comparisons of VaR results. Model changes go through a review and approval process by the Model Review Group prior to implementation into the operating environment. For further information, see Model risk on pages 125–126 of JPMorgan Chase’s 2012 Annual Report.
As presented in the table above, average Total VaR decreased for the three and six months ended June 30, 2013, when compared with the respective 2012 periods. These decreases were primarily driven by reduced risk in the synthetic credit portfolio and lower market volatility.
Average total CIB trading and Credit portfolio VaR for the three and six months ended June 30, 2013, decreased compared with the respective 2012 periods. These decreases were primarily driven by lower market volatility across multiple asset classes.
During the third quarter of 2012, the Firm applied a new VaR model to calculate VaR for CIO’s synthetic credit portfolio that had been transferred to the CIB on July 2, 2012. (For further information, see Market Risk Management on page 166 of JPMorgan Chase’s 2012 Annual Report.) In the first quarter of 2013, in order to achieve consistency among like products within CIB and in conjunction with the implementation of Basel 2.5 requirements, the Firm moved CIO’s synthetic credit portfolio to an existing VaR model within the CIB. This change had an insignificant impact to the average fixed income VaR and average total CIB trading and credit portfolio VaR, and it had no impact to the average total VaR compared with the model used in the third and fourth quarters of 2012. When compared with the model used prior to the model change in the third quarter of 2012, this
VaR model resulted in a reduction of approximately $8 million to average fixed income VaR, average total CIB trading and credit portfolio VaR, and average total VaR, for the three months ended June 30, 2013. For the six months ended June 30, 2013, this VaR model resulted in a reduction of $10 million to average fixed income VaR, $9 million to average total CIB trading and credit portfolio VaR, and $8 million to average total VaR.
Average CIO VaR for the three and six months ended June 30, 2013, decreased from the comparable 2012 period, predominantly reflecting the reduction in and transfer of risk from CIO’s synthetic credit portfolio to the CIB on July 2, 2012. CIO’s retained portfolio was effectively closed out during the three months ended September 30, 2012.
Average Mortgage Production and Mortgage Servicing VaR for the three months ended June 30, 2013, did not significantly change from the comparable 2012 period. For the six months ended June 30, 2013, average Mortgage Production and Mortgage Servicing VaR increased from the comparable 2012 period, primarily driven by a reduction in diversification benefit across these businesses.
The Firm’s average Total VaR diversification benefit was $10 million or 18% of the sum for the three months ended June 30, 2013, compared with $56 million or 22% of the sum for the comparable 2012 period. The Firm’s average Total VaR diversification benefit was $10 million or 14% of the sum for the six months ended June 30, 2013, compared with $51 million or 22% of the sum for the comparable 2012 period. In general, over the course of the year, VaR exposure can vary significantly as positions change, market volatility fluctuates and diversification benefits change.
VaR back-testing
The Firm conducts daily back-testing of VaR against its market risk-related revenue.
The following histogram illustrates the daily market risk-related gains and losses for positions included in the Firm’s VaR calculation for the
six months ended
June 30, 2013
. This market risk-related revenue is defined as the change in value of: principal transactions revenue for CIB and CIO; trading-related net interest income for CIB, CIO and Mortgage Production and Mortgage Servicing in CCB; CIB brokerage commissions, underwriting fees or other revenue; revenue from syndicated lending facilities that the Firm intends to distribute; and mortgage fees and related income for the Firm’s mortgage pipeline and warehouse loans, MSRs, and all related hedges. Daily firmwide market risk-related revenue excludes gains and losses from DVA.
The chart shows that for
six months ended
June 30, 2013
, the Firm posted market risk-related gains on each of the 128 days in this period with two days exceeding $200 million; there were no loss days in the
six months ended
June 30, 2013
.
97
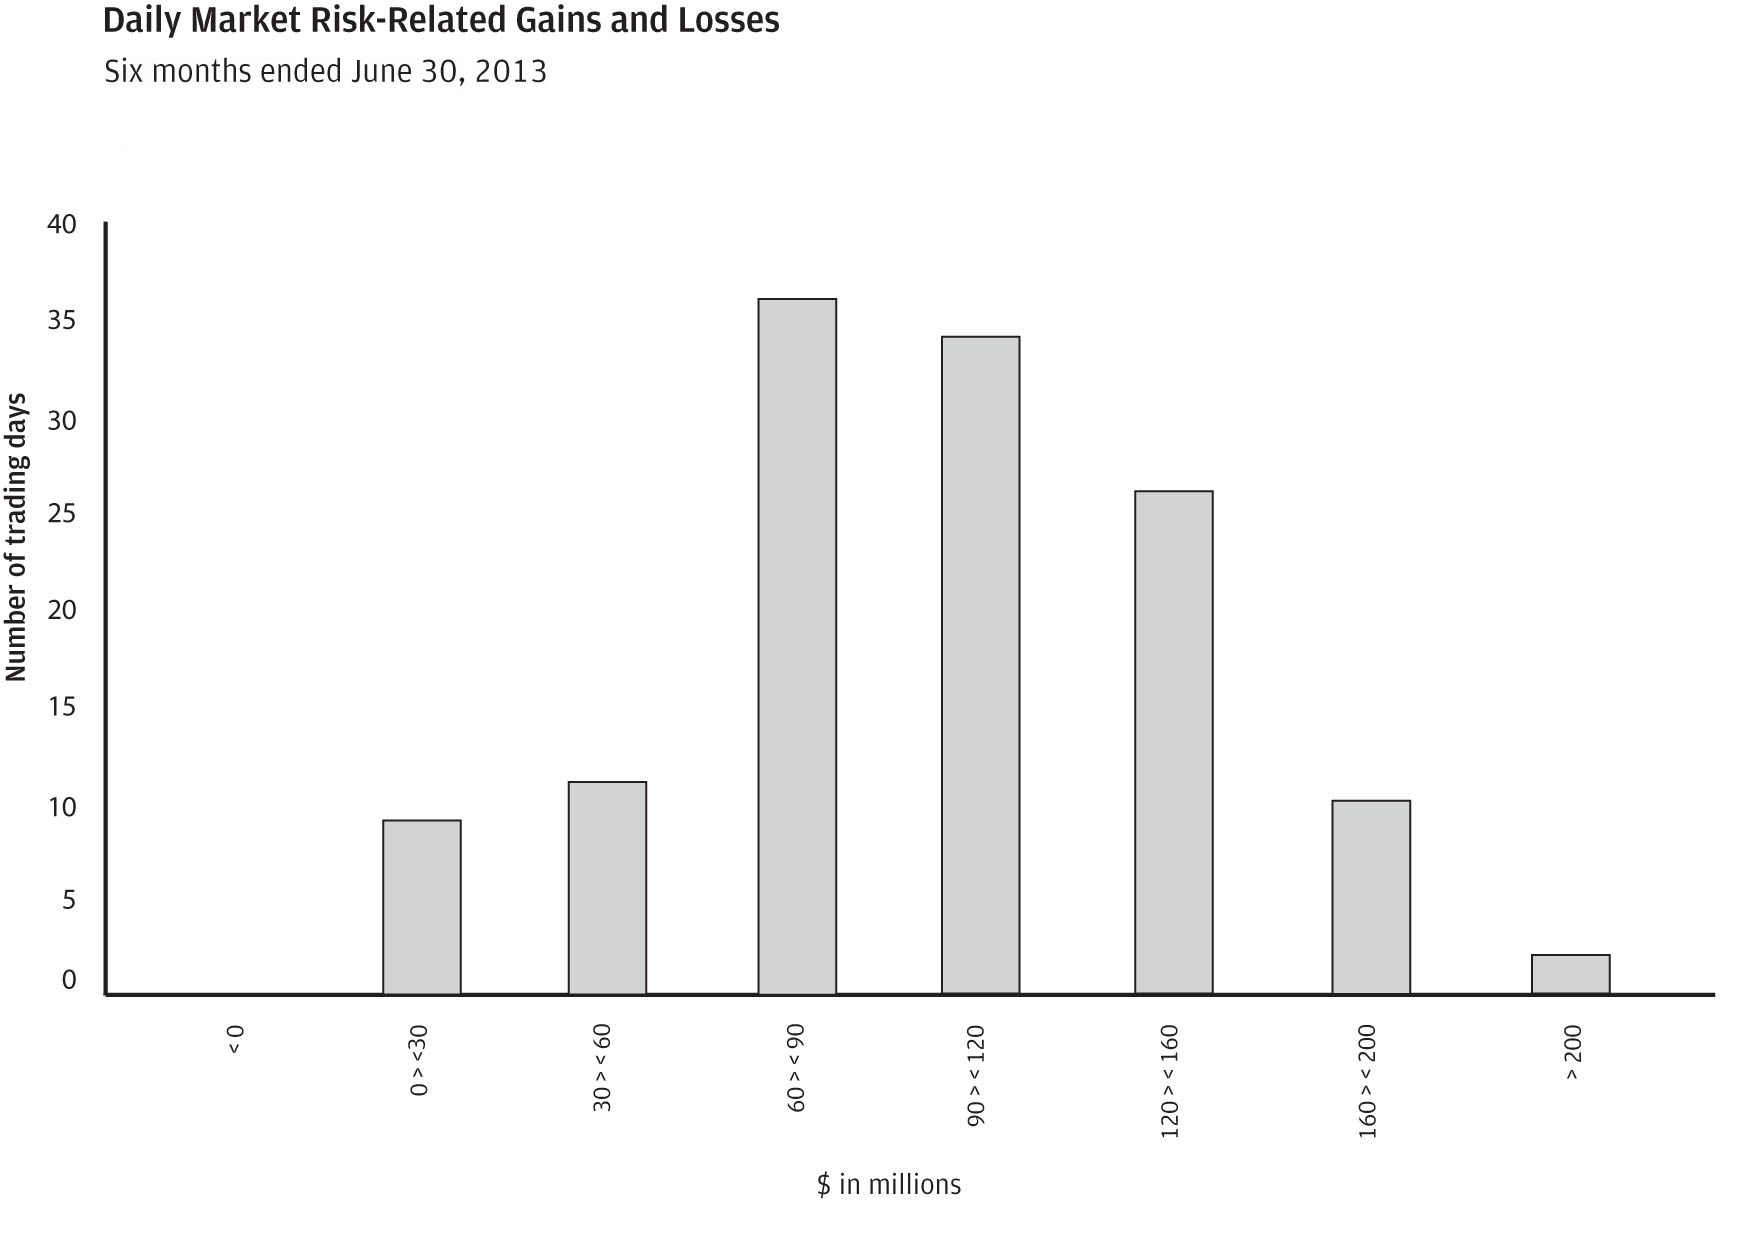
Other risk measures
Economic-value stress testing
Along with VaR, stress testing is an important tool in measuring and controlling risk. While VaR reflects the risk of loss due to adverse changes in markets using recent historical market behavior as an indicator of losses, stress testing is intended to capture the Firm’s exposure to unlikely but plausible events in abnormal markets. The Firm runs weekly stress tests on market-related risks across the lines of business using multiple scenarios that assume significant changes in risk factors such as credit spreads, equity prices, interest rates, currency rates or commodity prices. The framework uses a grid-based approach, which calculates multiple magnitudes of stress for both market rallies and market sell-offs for each risk factor. Stress-test results, trends and explanations based on current market risk positions are reported to the Firm’s senior management and to the lines of business to allow them to better understand the sensitivity of positions to certain defined events and manage their risks with more transparency.
Stress scenarios are defined and reviewed by Market Risk, and significant changes are reviewed by the relevant Risk Committees, (For further details see Risk Governance, on pages 123–125 of JPMorgan Chase’s 2012 Annual Report).
While most of these scenarios estimate losses based on significant market moves, such as an equity market collapse or credit crisis, the Firm also develops scenarios to quantify risk coming from specific portfolios or concentrations of risks, which attempt to capture certain idiosyncratic market movements. Scenarios may be redefined on an ongoing basis to reflect current market conditions. Ad hoc scenarios are run in response to specific market events or concerns. Furthermore, the Firm’s stress testing framework is utilized in calculating results under scenarios mandated by the Federal Reserve’s Comprehensive Capital Analysis and Review (“CCAR”) and ICAAP (“Internal Capital Adequacy Assessment Process”) processes.
Nonstatistical risk measures
Nonstatistical risk measures include sensitivities to variables used to value positions, such as credit spread sensitivities, interest rate basis point values and market values. These measures provide granular information on the Firm’s market risk exposure. They are aggregated by line-of-business and by risk type, and are used for tactical control and monitoring limits.
98
Loss advisories and profit and loss drawdowns
Loss advisories and profit and loss drawdowns are tools used to highlight trading losses above certain levels of risk tolerance. Profit and loss drawdowns are defined as the decline in net profit and loss since the year-to-date peak revenue level.
Risk identification for large exposures
Individuals who manage risk positions consider potential material losses that could arise from specific, unusual events, such as a potential change in tax legislation, or a particular combination of unusual market moves. This information allows the Firm to monitor further earnings vulnerability not adequately covered by standard risk measures.
Nontrading interest rate-sensitive revenue-at-risk (i.e., “earnings-at-risk”)
Interest rate risk represents one of the Firm’s significant market risks. Interest rate risk arises not only from trading activities but also from the Firm’s traditional banking activities, which include extension of loans and credit facilities, taking deposits and issuing debt. The Firm's Asset-Liability Committee ("ALCO") establishes the Firm’s interest rate risk policies and sets risk guidelines applied to nontrading positions. Treasury and CIO, working in partnership with the lines of business, calculates the Firm’s nontrading interest rate risk profile weekly and reviews it with senior management. For further discussion on interest rate exposure, see Nontrading interest rate-sensitive revenue-at-risk (i.e., “earnings-at-risk”) on pages 168–169 of JPMorgan Chase’s 2012 Annual Report.
The Firm conducts simulations of changes in nontrading interest rate-sensitive revenue under a variety of interest rate scenarios. Earnings-at-risk scenarios estimate the potential change in this revenue, and the corresponding impact to the Firm’s pretax net interest income, over the following 12 months, utilizing multiple assumptions as described below. These scenarios highlight exposures to various interest rate-sensitive factors, such as the rates themselves (e.g., the prime lending rate), pricing strategies on deposits, optionality and changes in product mix. The scenarios include forecasted balance sheet changes, such as asset sales and securitizations, as well as prepayment and reinvestment behavior. Mortgage prepayment assumptions are based on current interest rates compared with underlying contractual rates, the time since origination, and other factors which are updated periodically based on historical experience and forward market expectations. The amount and pricing assumptions of deposits and other products that have no stated maturity are based on historical performance, the competitive environment, customer behavior, and product mix.
Immediate changes in interest rates present a limited view of risk, and so a number of alternative scenarios are also reviewed. These scenarios include the implied forward curve, nonparallel rate shifts and severe interest rate shocks on selected key rates. These scenarios are intended
to provide a comprehensive view of JPMorgan Chase’s earnings-at-risk over a wide range of outcomes.
|
JPMorgan Chase’s 12-month pretax net interest income sensitivity profiles.
|
||||||||||||
|
(Excludes the impact of trading activities and MSRs)
|
||||||||||||
|
Immediate change in rates
|
||||||||||||
|
(in millions)
|
+200bps
|
+100bps
|
-100bps
|
-200bps
|
||||||||
|
June 30, 2013
|
$
|
3,704
|
|
$
|
2,073
|
|
NM
|
(a)
|
NM
|
(a)
|
||
|
December 31, 2012
|
3,886
|
|
2,145
|
|
NM
|
(a)
|
NM
|
(a)
|
||||
|
(a)
|
Downward 100- and 200-basis-points parallel shocks result in a federal funds target rate of zero and negative three- and six-month treasury rates. The earnings-at-risk results of such a low-probability scenario are not meaningful.
|
The change in earnings-at-risk from December 31, 2012, resulted from repositioning the AFS securities portfolio, partially offset by higher expected deposit balances. The Firm's benefit to rising rates is largely a result of reinvesting at higher yields and assets re-pricing at a faster pace than deposits.
Additionally, another interest rate scenario used by the Firm — involving a steeper yield curve with long-term rates rising by 100 basis points and short-term rates staying at current levels — results in a 12-month pretax net interest income benefit of $890 million. The increase in net interest income under this scenario is due to reinvestment of maturing assets at the higher long-term rates, with funding costs remaining unchanged.
Debit valuation adjustment sensitivity
The following table provides information about the gross sensitivity of DVA on structured notes and derivative liabilities to a one-basis-point increase in JPMorgan Chase’s credit spreads. This sensitivity represents the impact from a one-basis-point parallel shift in JPMorgan Chase’s entire credit curve. However, the sensitivity at a single point in time multiplied by the change in credit spread at a single maturity point may not be representative of the actual DVA gain or loss realized within a period. Actual results reflect the movement in credit spreads across various maturities, which typically do not move in a parallel fashion, and are the product of a constantly changing exposure profile, among other factors.
|
Debit valuation adjustment sensitivity
|
|||||||||
|
(in millions)
|
One basis-point increase in
JPMorgan Chase’s credit spread
|
||||||||
|
June 30, 2013
|
$
|
35
|
|
||||||
|
December 31, 2012
|
34
|
|
|||||||
99
|
COUNTRY RISK MANAGEMENT
|
||||
For a discussion of the Firm’s Country Risk Management organization, and country risk identification, measurement, monitoring and control, see pages 170–173 of
JPMorgan Chase
’s
2012
Annual Report
.
The Firm is exposed to country risk primarily through its wholesale lending, investing, and market-making activities, whether cross-border or locally funded. Country exposure includes activity with both government and private-sector entities in a country. Under the Firm’s internal country risk management approach, country exposure is reported based on the country where the majority of the assets of the obligor, counterparty, issuer or guarantor are located or where the majority of its revenue is derived, which may be different than the domicile (legal residence) of the obligor, counterparty, issuer or guarantor. Country exposures are generally measured by considering the Firm’s risk to an immediate default of the counterparty or obligor, with zero recovery. Assumptions are sometimes required in determining the measurement and allocation of country exposure, particularly in the case of certain tranched credit derivatives. Different measurement approaches or assumptions would affect the amount of reported country exposure.
The Firm’s internal country risk reporting differs from the reporting provided under FFIEC bank regulatory requirements as there are significant differences in reporting methodology, including with respect to the treatment of collateral received and the benefit of credit derivative protection. For further information on the FFIEC’s reporting methodology, see Cross-border outstandings on page 347 of
JPMorgan Chase
’s
2012
Form 10-K
.
The following table presents the Firm’s top 20 exposures by country (excluding the U.S.). The selection of countries is based solely on the Firm’s largest total exposures by country, based on the Firm’s internal country risk management approach, and does not represent the Firm’s view of any actual or potentially adverse credit conditions.
|
Top 20 country exposures
|
|||||||||||||
|
June 30, 2013
|
|||||||||||||
|
(in billions)
|
Lending
(a)
|
Trading and investing
(b)(c)
|
Other
(d)
|
Total exposure
|
|||||||||
|
United Kingdom
|
$
|
23.8
|
|
$
|
46.1
|
|
$
|
2.0
|
|
$
|
71.9
|
|
|
|
Germany
|
35.6
|
|
27.3
|
|
—
|
|
62.9
|
|
|||||
|
France
|
13.5
|
|
23.4
|
|
—
|
|
36.9
|
|
|||||
|
Netherlands
|
4.8
|
|
26.3
|
|
2.4
|
|
33.5
|
|
|||||
|
Australia
|
5.2
|
|
14.8
|
|
—
|
|
20.0
|
|
|||||
|
Canada
|
11.3
|
|
5.3
|
|
0.5
|
|
17.1
|
|
|||||
|
China
|
11.1
|
|
5.5
|
|
0.3
|
|
16.9
|
|
|||||
|
Brazil
|
5.2
|
|
11.1
|
|
—
|
|
16.3
|
|
|||||
|
India
|
7.3
|
|
6.5
|
|
0.1
|
|
13.9
|
|
|||||
|
Korea
|
6.1
|
|
4.9
|
|
0.1
|
|
11.1
|
|
|||||
|
Switzerland
|
7.8
|
|
1.8
|
|
0.7
|
|
10.3
|
|
|||||
|
Japan
|
4.0
|
|
5.9
|
|
—
|
|
9.9
|
|
|||||
|
Hong Kong
|
3.4
|
|
3.4
|
|
0.7
|
|
7.5
|
|
|||||
|
Russia
|
5.8
|
|
1.4
|
|
—
|
|
7.2
|
|
|||||
|
Mexico
|
2.6
|
|
4.1
|
|
—
|
|
6.7
|
|
|||||
|
Singapore
|
3.5
|
|
1.9
|
|
0.7
|
|
6.1
|
|
|||||
|
Italy
|
2.3
|
|
3.5
|
|
—
|
|
5.8
|
|
|||||
|
Sweden
|
1.9
|
|
3.7
|
|
0.1
|
|
5.7
|
|
|||||
|
Spain
|
3.1
|
|
2.1
|
|
—
|
|
5.2
|
|
|||||
|
Malaysia
|
2.3
|
|
0.8
|
|
1.3
|
|
4.4
|
|
|||||
|
(a)
|
Lending includes loans and accrued interest receivable, net of the allowance for loan losses, deposits with banks, acceptances, other monetary assets, issued letters of credit net of participations, and undrawn commitments to extend credit. Excludes intra-day and operating exposures, such as from settlement and clearing activities.
|
|
(b)
|
Includes market-making inventory, securities held in AFS accounts and hedging.
|
|
(c)
|
Includes single-name and index and tranched credit derivatives for which one or more of the underlying reference entities is in a country listed in the above table.
|
|
(d)
|
Includes capital invested in local entities and physical commodity inventory.
|
Selected European exposure
The Firm has monitored its exposures in Spain, Italy, Ireland, Portugal and Greece closely since the Eurozone debt crisis began and believes its exposure to these five countries is modest relative to the Firm’s aggregate exposures. The Firm continues to conduct business and support client activity in these countries and, therefore, the Firm’s aggregate net exposures and sector distribution may vary over time. In addition, the net exposures may be affected by changes in market conditions, including the effects of interest rates and credit spreads on market valuations.
100
The following table presents the Firm’s direct exposure at
June 30, 2013
, to Spain, Italy, Ireland Portugal and Greece, as measured under the Firm’s internal country risk management approach. For individual exposures, corporate clients represent approximately
86%
of the Firm’s non-sovereign exposure in these five countries, and substantially all of the remaining
14%
of the non-sovereign exposure is to the banking sector.
|
June 30, 2013
|
Lending net of Allowance
(a)
|
AFS securities
(b)
|
Trading
(c)
|
Derivative collateral
(d)
|
Portfolio hedging
(e)
|
Total exposure
|
||||||||||||
|
(in billions)
|
||||||||||||||||||
|
Spain
|
||||||||||||||||||
|
Sovereign
|
$
|
—
|
|
$
|
0.4
|
|
$
|
(0.3
|
)
|
$
|
—
|
|
$
|
(0.1
|
)
|
$
|
—
|
|
|
Non-sovereign
|
3.1
|
|
—
|
|
4.4
|
|
(2.0
|
)
|
(0.3
|
)
|
5.2
|
|
||||||
|
Total Spain exposure
|
$
|
3.1
|
|
$
|
0.4
|
|
$
|
4.1
|
|
$
|
(2.0
|
)
|
$
|
(0.4
|
)
|
$
|
5.2
|
|
|
Italy
|
||||||||||||||||||
|
Sovereign
|
$
|
—
|
|
$
|
—
|
|
$
|
8.3
|
|
$
|
(1.2
|
)
|
$
|
(4.0
|
)
|
$
|
3.1
|
|
|
Non-sovereign
|
2.3
|
|
—
|
|
2.1
|
|
(1.2
|
)
|
(0.5
|
)
|
2.7
|
|
||||||
|
Total Italy exposure
|
$
|
2.3
|
|
$
|
—
|
|
$
|
10.4
|
|
$
|
(2.4
|
)
|
$
|
(4.5
|
)
|
$
|
5.8
|
|
|
Ireland
|
||||||||||||||||||
|
Sovereign
|
$
|
—
|
|
$
|
—
|
|
$
|
—
|
|
$
|
—
|
|
$
|
(0.1
|
)
|
$
|
(0.1
|
)
|
|
Non-sovereign
|
0.3
|
|
—
|
|
1.9
|
|
(0.2
|
)
|
—
|
|
2.0
|
|
||||||
|
Total Ireland exposure
|
$
|
0.3
|
|
$
|
—
|
|
$
|
1.9
|
|
$
|
(0.2
|
)
|
$
|
(0.1
|
)
|
$
|
1.9
|
|
|
Portugal
|
||||||||||||||||||
|
Sovereign
|
$
|
—
|
|
$
|
—
|
|
$
|
—
|
|
$
|
—
|
|
$
|
—
|
|
$
|
—
|
|
|
Non-sovereign
|
0.5
|
|
—
|
|
0.8
|
|
(0.3
|
)
|
(0.1
|
)
|
0.9
|
|
||||||
|
Total Portugal exposure
|
$
|
0.5
|
|
$
|
—
|
|
$
|
0.8
|
|
$
|
(0.3
|
)
|
$
|
(0.1
|
)
|
$
|
0.9
|
|
|
Greece
|
||||||||||||||||||
|
Sovereign
|
$
|
—
|
|
$
|
—
|
|
$
|
0.1
|
|
$
|
—
|
|
$
|
—
|
|
$
|
0.1
|
|
|
Non-sovereign
|
0.1
|
|
—
|
|
0.8
|
|
(0.8
|
)
|
—
|
|
0.1
|
|
||||||
|
Total Greece exposure
|
$
|
0.1
|
|
$
|
—
|
|
$
|
0.9
|
|
$
|
(0.8
|
)
|
$
|
—
|
|
$
|
0.2
|
|
|
Total exposure
|
$
|
6.3
|
|
$
|
0.4
|
|
$
|
18.1
|
|
$
|
(5.7
|
)
|
$
|
(5.1
|
)
|
$
|
14.0
|
|
|
(a)
|
Lending includes loans and accrued interest receivable, deposits with banks, acceptances, other monetary assets, issued letters of credit net of participations, and undrawn commitments to extend credit. Excludes intra-day and operating exposures, such as from settlement and clearing activities. Amounts are presented net of the allowance for credit losses of
$104 million
(Spain),
$62 million
(Italy),
$2 million
(Ireland),
$22 million
(Portugal), and
$13 million
(Greece) specifically attributable to these countries. Included
$2.3 billion
of unfunded lending exposure at
June 30, 2013
. These exposures consist typically of committed, but unused corporate credit agreements, with market-based lending terms and covenants.
|
|
(b)
|
The table above reflects AFS securities measured at fair value.
|
|
(c)
|
Primarily included:
$16.3 billion
of counterparty exposure on derivative and securities financings,
$1.7 billion
of issuer exposure on debt and equity securities. Net protection from credit derivatives is de minimus, primarily as a result of maturities in the synthetic credit portfolio during the second quarter of 2013. Securities financings of approximately
$20.2 billion
were collateralized with approximately
$22.4 billion
of cash and marketable securities as of
June 30, 2013
.
|
|
(d)
|
Includes cash and marketable securities pledged to the Firm, of which approximately
96%
of the collateral was cash at
June 30, 2013
.
|
|
(e)
|
Reflects net protection purchased through the Firm’s Credit portfolio management activities, which are managed separately from its market-making activities. Predominantly includes single-name CDS and also includes index credit derivatives and short bond positions.
|
101
Effect of credit derivatives on selected European exposures
Country exposures in the Selected European exposure table above have been reduced by purchasing protection through single name, index, and tranched credit derivatives. The following table presents the effect of purchased and sold credit derivatives on the trading and portfolio hedging activities in the Selected European exposure table.
|
June 30, 2013
|
Trading
|
Portfolio hedging
|
||||||||||||||||||||||
|
(in billions)
|
Purchased
|
Sold
|
Net
|
Purchased
|
Sold
|
Net
|
||||||||||||||||||
|
Spain
|
$
|
(111.1
|
)
|
$
|
111.2
|
|
$
|
0.1
|
|
$
|
(2.5
|
)
|
$
|
2.1
|
|
$
|
(0.4
|
)
|
||||||
|
Italy
|
(161.1
|
)
|
161.1
|
|
—
|
|
(15.8
|
)
|
11.5
|
|
(4.3
|
)
|
||||||||||||
|
Ireland
|
(7.3
|
)
|
7.3
|
|
—
|
|
—
|
|
—
|
|
—
|
|
||||||||||||
|
Portugal
|
(38.2
|
)
|
38.3
|
|
0.1
|
|
(1.0
|
)
|
0.9
|
|
(0.1
|
)
|
||||||||||||
|
Greece
|
(9.4
|
)
|
9.4
|
|
—
|
|
(0.1
|
)
|
0.1
|
|
—
|
|
||||||||||||
|
Total
|
$
|
(327.1
|
)
|
$
|
327.3
|
|
$
|
0.2
|
|
$
|
(19.4
|
)
|
$
|
14.6
|
|
$
|
(4.8
|
)
|
||||||
See pages 170–173 of
JPMorgan Chase
’s
2012
Annual Report
for information regarding the measurement of credit derivatives under the Firm’s internal country risk management approach.
The credit derivatives reflected in the “Trading” column include those from the Firm’s market-making activities; net protection from credit derivatives was de minimus at
June 30, 2013
, primarily as a result of maturities in the synthetic credit portfolio managed by CIB beginning in July 2012.
The credit derivatives reflected in the “Portfolio hedging” column are predominantly single-name CDS used in the Firm’s Credit portfolio management activities, which are intended to mitigate the credit risk associated with traditional lending activities and derivative counterparty exposure. The effectiveness of the Firm’s CDS protection as a hedge of the firm’s exposures may vary depending upon a number of factors, including the maturity of the Firm’s CDS protection, the named reference entity, and the contractual terms of the CDS. For further information about credit derivatives see Credit derivatives on pages
90–91
, and Note 5 on pages
141–142
of
this Form 10-Q
; and on pages 158–159, and Note 6 on pages 218–227 of
JPMorgan Chase
’s
2012
Annual Report
.
The Firm’s net presentation of purchased and sold credit derivatives reflects the manner in which this exposure is managed, and reflects, in the Firm’s view, the substantial mitigation of market and counterparty credit risk in its credit derivative activities. Market risk is substantially mitigated because market-making activities, and to a lesser extent, hedging activities, often result in selling and purchasing protection related to the same underlying reference entity. For example, for each of the five named countries, as of
June 30, 2013
, the protection sold by the Firm was more than
93%
offset by protection purchased on the identical reference entity.
In addition, counterparty credit risk has been substantially mitigated by the master netting and collateral agreements in place for these credit derivatives. As of
June 30, 2013
,
99%
of the purchased protection presented in the table above is purchased under contracts that require posting of cash collateral;
91%
is purchased from investment-grade counterparties domiciled outside of the selected European countries; and
71%
of the protection purchased offsets protection sold on the identical reference entity, with the identical counterparty subject to a master netting agreement.
102
|
PRINCIPAL RISK MANAGEMENT
|
||||
Principal investments are predominantly privately-held assets and instruments typically representing an ownership or junior capital position, that have unique risks due to their illiquidity and junior capital status, as well as lack of observable valuation data. Such investing activities, including mezzanine financing, tax-oriented investments and private equity positions, are typically intended to be held over extended investment periods and, accordingly, the Firm has no expectation for short-term gain with respect to these investments. All investments are approved by investment committees that include executives who are not part of the investing businesses. An independent valuation function is responsible for reviewing the appropriateness of the carrying values of principal investments, including private equity, in accordance with relevant accounting, valuation and risk policies.
The Firm’s approach to managing principal risk is consistent with the Firm’s general risk governance structure. Targeted levels for total and annual investments are established in order to manage the overall size of the portfolios. Industry and geographic concentration limits are in place and intended to ensure diversification of the portfolios. The Firm also conducts stress testing on these portfolios using specific scenarios that estimate losses based on significant market moves.
The Firm’s merchant banking business is managed in Corporate/Private Equity (for detailed information, see Private Equity portfolio on page
51
of this Form 10-Q); other lines of business may also conduct some principal investing activities, including investing in private equity positions, which are captured within their respective financial results.
|
OPERATIONAL RISK MANAGEMENT
|
||||
For a discussion of JPMorgan Chase’s Operational Risk Management, see pages 175–176 of JPMorgan Chase’s 2012 Annual Report.
Cybersecurity
The Firm devotes significant resources to maintain and regularly update its systems and processes that are designed to protect the security of the Firm’s computer systems, software, networks and other technology assets against attempts by third parties to obtain unauthorized access to confidential information, destroy data, disrupt or degrade service, sabotage systems or cause other damage. The Firm and several other U.S. financial institutions continue to experience significant distributed denial-of-service attacks from technically sophisticated and well-resourced third parties which are intended to disrupt consumer online banking services. The Firm has also experienced other attempts to breach the security of its systems and data. These cyberattacks have not, to date, resulted in any material disruption of the Firm’s operations
or material harm to the Firm’s customers, and have not had a material adverse effect on the Firm’s results of operations.
Third parties with which the Firm does business or that facilitate the Firm’s business activities (e.g., vendors, exchanges, clearing houses, central depositories, and financial intermediaries) could also be sources of cybersecurity risk to the Firm, including with respect to breakdowns or failures of their systems, misconduct by the employees of such parties, or cyberattacks which could affect their ability to deliver a product or service to the Firm or result in lost or compromised information of the Firm or its clients.
The Firm is working with appropriate government agencies and other businesses, including our own third-party service providers, to continue to enhance defenses and improve resiliency to cybersecurity threats.
|
LEGAL, FIDUCIARY AND REPUTATION RISK MANAGEMENT
|
||||
For a discussion of the Firm’s Legal, Fiduciary and Reputation Risk Management, see page 177 of JPMorgan Chase’s 2012 Annual Report.
|
SUPERVISION AND REGULATION
|
||||
For further information on Supervision and Regulation, see Regulatory developments on pages
9–11
of this Form 10-Q, and the Supervision and regulation section on pages 1–8 of
JPMorgan Chase
’s
2012
Form 10-K
.
Dividends
At
June 30, 2013
,
JPMorgan Chase
’s banking subsidiaries could pay, in the aggregate,
$29.2 billion
in dividends to their respective bank holding companies without the prior approval of their relevant banking regulators.
103
|
CRITICAL ACCOUNTING ESTIMATES USED BY THE FIRM
|
||||
JPMorgan Chase
’s accounting policies and use of estimates are integral to understanding its reported results. The Firm’s most complex accounting estimates require management’s judgment to ascertain the appropriate carrying value of assets and liabilities. The Firm has established detailed policies and control procedures intended to ensure that estimation methods, including any judgments made as part of such methods, are well-controlled, independently reviewed and applied consistently from period to period. The methods used and judgments made reflect, among other factors, the nature of the assets or liabilities and the related business and risk management strategies, which may vary across the Firm’s businesses and portfolios. In addition, the policies and procedures are intended to ensure that the process for changing methodologies occurs in an appropriate manner. The Firm believes its estimates for determining the carrying value of its assets and liabilities are appropriate. The following is a brief description of the Firm’s critical accounting estimates involving significant judgment.
Allowance for credit losses
JPMorgan Chase
’s allowance for credit losses covers the retained consumer and wholesale loan portfolios, as well as the Firm’s consumer and wholesale lending-related commitments. The allowance for loan losses is intended to adjust the value of the Firm’s loan assets to reflect probable credit losses inherent in the loan portfolio as of the balance sheet date. Similarly, the allowance for lending-related commitments is established to cover probable credit losses inherent in the lending-related commitments portfolio as of the balance sheet date. For further discussion of the methodologies used in establishing the Firm’s allowance for credit losses, see Allowance for credit losses on pages 159–162 and Note 15 on pages 276–279 of
JPMorgan Chase
’s
2012
Annual Report
; for amounts recorded as of
June 30, 2013
and
2012
, see Allowance for credit losses on pages
92–94
and Note 14 on page
176
of
this Form 10-Q
.
As noted in the discussion on pages 178–180 of
JPMorgan Chase
’s
2012
Annual Report
, the Firm’s allowance for credit losses is sensitive to numerous factors, depending on the portfolio. Changes in economic conditions or in the Firm’s assumptions could affect the Firm’s estimate of probable credit losses inherent in the portfolio at the balance sheet date. The purpose of the sensitivity analysis presented below is to provide an indication of the isolated impacts of hypothetical alternative assumptions on modeled loss estimates. The changes in the inputs are not intended to imply management’s expectation of future deterioration of those risk factors, nor are they intended to estimate changes in the overall allowance for loan losses. Actual changes in the allowance for loan losses may be influenced by other inputs and factors, and also would be influenced by the judgment management applies to its modeled loss estimates to reflect the uncertainty and imprecision of
these modeled loss estimates based on then current circumstances and conditions.
Deterioration in the following inputs would have the following effects on the Firm’s modeled loss estimates as of
June 30, 2013
, without consideration of any offsetting or correlated effects of other inputs in the Firm’s allowance for loan losses:
|
•
|
For PCI loans, a combined
5%
decline in housing prices and a
1%
increase in unemployment from current levels could imply an increase to modeled credit loss estimates of approximately
$1.4 billion
.
|
|
•
|
For the residential real estate portfolio, excluding PCI loans, a combined
5%
decline in housing prices and a
1%
increase in unemployment from current levels could imply an increase to modeled annual loss estimates of approximately
$200 million
.
|
|
•
|
A
50
basis point deterioration in forecasted credit card loss rates could imply an increase to modeled annualized credit card loan loss estimates of approximately
$600 million
.
|
|
•
|
A one-notch downgrade in the Firm’s internal risk ratings for its entire wholesale loan portfolio could imply an increase in the Firm’s modeled loss estimates of approximately
$2.3 billion
.
|
Management considers a variety of factors and inputs in estimating the allowance for credit losses. Changes in the above factors and inputs, as well as other factors and inputs considered by management, may not occur at the same rate and may not be consistent across all geographies or product types, and changes in factors may be directionally inconsistent, such that improvement in one factor may offset deterioration in other factors. In addition, it is difficult to predict how changes in specific economic conditions or assumptions would affect borrower behavior or other factors considered by management in estimating the allowance for credit losses. Given the process the Firm follows in evaluating the risk factors related to its loans, including risk ratings, home price assumptions, and credit card loss estimates, management believes that its current estimate of the allowance for credit loss is appropriate.
Fair value of financial instruments, MSRs and commodities inventory
JPMorgan Chase carries a portion of its assets and liabilities at fair value. The majority of such assets and liabilities are measured at fair value on a recurring basis. Certain assets and liabilities are measured at fair value on a nonrecurring basis, including certain mortgage, home equity and other loans, where the carrying value is based on the fair value of the underlying collateral.
104
Assets measured at fair value
The following table includes the Firm’s assets measured at fair value and the portion of such assets that are classified within level 3 of the valuation hierarchy. For further information, see Note 3 on pages
114–127
of this
Form 10-Q.
|
June 30, 2013
(in billions, except ratio data)
|
Total assets at fair value
|
Total level 3 assets
|
||||||
|
Trading debt and equity instruments
|
$
|
327.7
|
|
$
|
24.4
|
|
||
|
Derivative receivables
|
73.8
|
|
17.4
|
|
||||
|
Trading assets
|
401.5
|
|
41.8
|
|
||||
|
AFS securities
|
354.7
|
|
1.9
|
|
(a)
|
|||
|
Loans
|
1.9
|
|
1.8
|
|
||||
|
MSRs
|
9.3
|
|
9.3
|
|
||||
|
Private equity investments
|
7.7
|
|
7.1
|
|
||||
|
Other
|
38.6
|
|
3.8
|
|
||||
|
Total assets measured
at fair value on a recurring basis
|
813.7
|
|
65.7
|
|
||||
|
Total assets measured at fair value on a nonrecurring basis
|
1.6
|
|
1.5
|
|
||||
|
Total assets measured
at fair value
|
$
|
815.3
|
|
$
|
67.2
|
|
||
|
Total Firm assets
|
$
|
2,439.5
|
|
|||||
|
Level 3 assets as a percentage of total Firm assets
|
2.8
|
%
|
(a)
|
|||||
|
Level 3 assets as a percentage of total Firm assets at fair value
|
8.2
|
%
|
(a)
|
|||||
|
(a)
|
Reflects
$27.3 billion
of collateralized loan obligations (“CLOs”) transferred from level 3 to level 2 during the three months ended March 31, 2013. For further discussion of the transfers, see Note 3 on pages
114–127
of this Form 10-Q.
|
Valuation
Fair value is defined as the price that would be received to sell an asset or paid to transfer a liability in an orderly transaction between market participants at the measurement date. The Firm has established well-documented processes for determining fair value; for further details see Note 3 on pages
114–127
of this Form 10-Q. Fair value is based on quoted market prices, where available. If listed prices or quotes are not available for an instrument or a similar instrument, fair value is generally based on models that consider relevant transaction characteristics (such as maturity) and use as inputs market-based or independently sourced parameters.
Estimating fair value requires the application of judgment. The type and level of judgment required is largely dependent on the amount of observable market information available to the Firm. For instruments valued using internally developed models that use significant unobservable inputs and are therefore classified within level 3 of the valuation hierarchy, judgments used to estimate fair value are more significant than those required when estimating the fair value of instruments classified within levels 1 and 2.
In arriving at an estimate of fair value for an instrument within level 3, management must first determine the appropriate model to use. Second, due to the lack of observability of significant inputs, management must assess all relevant empirical data in deriving valuation inputs —
including, for example, transaction details, yield curves, interest rates, prepayment rates, default rates, volatilities, correlations, equity or debt prices, valuations of comparable instruments, foreign exchange rates and credit curves. Finally, management judgment must be applied to assess the appropriate level of valuation adjustments to reflect counterparty credit quality, the Firm’s credit-worthiness, liquidity considerations, unobservable parameters, and for certain portfolios that meet specified criteria, the size of the net open risk position. The judgments made are typically affected by the type of product and its specific contractual terms, and the level of liquidity for the product or within the market as a whole. For further discussion of the valuation of level 3 instruments, including unobservable inputs used, see Note 3 on pages
114–127
of this Form 10-Q.
Imprecision in estimating unobservable market inputs or other factors can affect the amount of gain or loss recorded for a particular position. Furthermore, while the Firm believes its valuation methods are appropriate and consistent with those of other market participants, the methods and assumptions used reflect management judgment and may vary across the Firm’s businesses and portfolios.
The Firm uses various methodologies and assumptions in the determination of fair value. The use of different methodologies or assumptions to those used by the Firm could result in a different estimate of fair value at the reporting date. For a detailed discussion of the Firm’s valuation process and hierarchy, and its determination of fair value for individual financial instruments, see Note 3 on pages
114–127
of this Form 10-Q.
Goodwill impairment
Management applies significant judgment when testing goodwill for impairment. For a description of the significant valuation judgments associated with goodwill impairment, see Goodwill impairment on page 181 of JPMorgan Chase’s 2012 Annual Report.
During the
six months ended
June 30, 2013
, the Firm updated the discounted cash flow valuation of its mortgage lending business in CCB, which continues to have an elevated risk for goodwill impairment due to its exposure to U.S. consumer credit risk and the effects of economic, regulatory and legislative changes. The assumptions used in the valuation of this business include: (a) estimates of future cash flows for the business (which are dependent on outstanding loan balances, net interest margin, operating expense, credit losses and the amount of capital necessary given the risk of business activities to meet regulatory capital requirements), and (b) the cost of equity used to discount those cash flows to a present value. Each of these factors requires significant judgment and the assumptions used are based on management’s current best estimate and most current projections, including the anticipated effects of regulatory and legislative changes, derived from the Firm’s business forecasting process reviewed with senior
105
management. These projections are consistent with the short-term assumptions discussed in the Business outlook on page
9
of this Form 10-Q, and, in the longer term, incorporate a set of macroeconomic assumptions and the Firm’s best estimates of long-term growth and returns of its businesses. Where possible, the Firm uses third-party and peer data to benchmark its assumptions and estimates.
As of
June 30, 2013
, the estimated fair value of the Firm’s mortgage lending business within CCB did not exceed its carrying value; however, the implied fair value of the goodwill allocated to the mortgage lending business exceeded its carrying value. For its other businesses, the Firm reviewed current conditions (including the estimated effects of regulatory and legislative changes and current estimated market cost of equity) and prior projections of business performance. Based upon the updated valuation of its mortgage lending business and reviews of its other businesses, the Firm concluded that goodwill allocated to all of its reporting units was not impaired at
June 30, 2013
.
Deterioration in economic market conditions, increased estimates of the effects of recent regulatory or legislative changes, or additional regulatory or legislative changes may result in declines in projected business performance beyond management’s current expectations. For example, in the Firm’s mortgage lending business, such declines could result from increases in costs to resolve foreclosure-
related matters or from deterioration in economic conditions that result in increased credit losses or lower mortgage origination volume. In addition, the earnings or estimated cost of equity of the Firm’s capital markets businesses could also be affected by regulatory or legislative changes. Declines in business performance, increases in equity capital requirements, or increases in the estimated cost of equity, could cause the estimated fair values of the Firm’s reporting units or their associated goodwill to decline, which could result in a material impairment charge to earnings in a future period related to some portion of the associated goodwill.
For additional information on goodwill, see Note 16 on pages
184–187
of this Form 10-Q.
Income taxes
For a description of the significant assumptions, judgments and interpretations associated with the accounting for income taxes, see Income taxes on page 182 of JPMorgan Chase’s 2012 Annual Report.
Litigation reserves
For a description of the significant estimates and judgments associated with establishing litigation reserves, see Note 23 on pages
198–206
of
this Form 10-Q
, and Note 31 on pages 316–325 of
JPMorgan Chase
’s
2012
Annual Report
.
|
ACCOUNTING AND REPORTING DEVELOPMENTS
|
||||
Inclusion of the Fed funds effective swap rate
In July 2013, the FASB issued guidance that amends the acceptable U.S. benchmark interest rates for hedge accounting involving interest rate risk. In addition to interest rates on direct U.S. Treasury obligations and the LIBOR swap rate, the guidance also permits the Overnight Index Swap Rate (“OIS”) to be designated as a benchmark interest rate for hedge accounting purposes. The amendments are effective prospectively for qualifying new or redesignated hedging relationships entered into on or after July 17, 2013.
Investment companies
In June 2013, the FASB issued guidance that clarifies the characteristics of an investment company and requires new disclosures for investment companies. Under the guidance, a company regulated under the Investment Company Act of 1940 is considered an investment company for accounting purposes. All other companies must meet all of the fundamental characteristics described in the guidance and consider other typical characteristics to qualify as an investment company. An investment company will be required to provide additional disclosures, including the fact that the company is an investment company, information about changes, if any, in a company’s status as an investment company, and information about financial support provided or contractually required to be provided by an investment company to any of its investees. The guidance will become effective in the first quarter of 2014.
The Firm is currently evaluating this guidance to determine any potential effect on its consolidated financial statements.
Presentation of other comprehensive income
In February 2013, the FASB issued guidance that requires enhanced disclosures of any reclassifications out of accumulated other comprehensive income. The guidance was effective in the first quarter of 2013. The application of this guidance had no impact on the Firm’s Consolidated Balance Sheets or results of operations. For further information, see Note 19 on pages
189–190
of this Form 10-Q.
In December 2011, the FASB issued guidance that requires enhanced disclosures about certain financial assets and liabilities that are subject to enforceable master netting agreements or similar agreements, or that have otherwise been offset on the balance sheet under certain specific conditions that permit net presentation. In January 2013, the FASB clarified that the scope of this guidance is limited to derivatives, repurchase and reverse repurchase agreements, and securities borrowing and lending transactions. The Firm adopted the new guidance, effective January 1, 2013. The application of this guidance had no impact on the Firm’s Consolidated Balance Sheets or results of operations. For further information, see Notes 1, 5, and 12 on pages
113
,
131–142
, and
151–152
, respectively, of this Form 10-Q.
106
|
FORWARD-LOOKING STATEMENTS
|
||||
From time to time, the Firm has made and will make forward-looking statements. These statements can be identified by the fact that they do not relate strictly to historical or current facts. Forward-looking statements often use words such as “anticipate,” “target,” “expect,” “estimate,” “intend,” “plan,” “goal,” “believe,” or other words of similar meaning. Forward-looking statements provide JPMorgan Chase’s current expectations or forecasts of future events, circumstances, results or aspirations. JPMorgan Chase’s disclosures in this Form 10-Q contain forward-looking statements within the meaning of the Private Securities Litigation Reform Act of 1995. The Firm also may make forward-looking statements in its other documents filed or furnished with the Securities and Exchange Commission. In addition, the Firm’s senior management may make forward-looking statements orally to analysts, investors, representatives of the media and others.
All forward-looking statements are, by their nature, subject to risks and uncertainties, many of which are beyond the Firm’s control. JPMorgan Chase’s actual future results may differ materially from those set forth in its forward-looking statements. While there is no assurance that any list of risks and uncertainties or risk factors is complete, below are certain factors which could cause actual results to differ from those in the forward-looking statements:
|
•
|
Local, regional and international business, economic and political conditions and geopolitical events;
|
|
•
|
Changes in laws and regulatory requirements, including as a result of recent financial services legislation;
|
|
•
|
Changes in trade, monetary and fiscal policies and laws;
|
|
•
|
Securities and capital markets behavior, including changes in market liquidity and volatility;
|
|
•
|
Changes in investor sentiment or consumer spending or savings behavior;
|
|
•
|
Ability of the Firm to manage effectively its capital and liquidity, including approval of its capital plans by banking regulators;
|
|
•
|
Changes in credit ratings assigned to the Firm or its subsidiaries;
|
|
•
|
Damage to the Firm’s reputation;
|
|
•
|
Ability of the Firm to deal effectively with an economic slowdown or other economic or market disruption;
|
|
•
|
Technology changes instituted by the Firm, its counterparties or competitors;
|
|
•
|
Mergers and acquisitions, including the Firm’s ability to integrate acquisitions;
|
|
•
|
Ability of the Firm to develop new products and services, and the extent to which products or services previously sold by the Firm (including but not limited to mortgages and asset-backed securities) require the Firm to incur liabilities or absorb losses not contemplated at their initiation or origination;
|
|
•
|
Ability of the Firm to address enhanced regulatory requirements affecting its mortgage business;
|
|
•
|
Acceptance of the Firm’s new and existing products and services by the marketplace and the ability of the Firm to increase market share;
|
|
•
|
Ability of the Firm to attract and retain employees;
|
|
•
|
Ability of the Firm to control expense;
|
|
•
|
Competitive pressures;
|
|
•
|
Changes in the credit quality of the Firm’s customers and counterparties;
|
|
•
|
Adequacy of the Firm’s risk management framework, disclosure controls and procedures and internal control over financial reporting;
|
|
•
|
Adverse judicial or regulatory proceedings;
|
|
•
|
Changes in applicable accounting policies;
|
|
•
|
Ability of the Firm to determine accurate values of certain assets and liabilities;
|
|
•
|
Occurrence of natural or man-made disasters or calamities or conflicts, including any effect of any such disasters, calamities or conflicts on the Firm’s power generation facilities and the Firm’s other physical commodity-related activities;
|
|
•
|
Ability of the Firm to maintain the security of its financial, accounting, technology, data processing and other operating systems and facilities;
|
|
•
|
The other risks and uncertainties detailed in Part I, Item 1A: Risk Factors in the Firm’s Annual Report on Form 10-K for the year ended December 31, 2012.
|
Any forward-looking statements made by or on behalf of the Firm speak only as of the date they are made, and JPMorgan Chase does not undertake to update forward-looking statements to reflect the impact of circumstances or events that arise after the date the forward-looking statements were made. The reader should, however, consult any further disclosures of a forward-looking nature the Firm may make in any subsequent Annual Reports on Form 10-K, Quarterly Reports on Form 10-Q, or Current Reports on Form 8-K.
107
JPMorgan Chase & Co.
|
Three months ended
June 30,
|
Six months ended
June 30,
|
|||||||||||||||
|
(in millions, except per share data)
|
2013
|
2012
|
2013
|
2012
|
||||||||||||
|
Revenue
|
||||||||||||||||
|
Investment banking fees
|
$
|
1,717
|
|
$
|
1,257
|
|
$
|
3,162
|
|
$
|
2,638
|
|
||||
|
Principal transactions
|
3,760
|
|
(427
|
)
|
7,521
|
|
2,295
|
|
||||||||
|
Lending- and deposit-related fees
|
1,489
|
|
1,546
|
|
2,957
|
|
3,063
|
|
||||||||
|
Asset management, administration and commissions
|
3,865
|
|
3,461
|
|
7,464
|
|
6,853
|
|
||||||||
|
Securities gains
(a)
|
124
|
|
1,014
|
|
633
|
|
1,550
|
|
||||||||
|
Mortgage fees and related income
|
1,823
|
|
2,265
|
|
3,275
|
|
4,275
|
|
||||||||
|
Credit card income
|
1,503
|
|
1,412
|
|
2,922
|
|
2,728
|
|
||||||||
|
Other income
|
226
|
|
506
|
|
762
|
|
2,018
|
|
||||||||
|
Noninterest revenue
|
14,507
|
|
11,034
|
|
28,696
|
|
25,420
|
|
||||||||
|
Interest income
|
13,145
|
|
14,099
|
|
26,572
|
|
28,800
|
|
||||||||
|
Interest expense
|
2,441
|
|
2,953
|
|
4,935
|
|
5,988
|
|
||||||||
|
Net interest income
|
10,704
|
|
11,146
|
|
21,637
|
|
22,812
|
|
||||||||
|
Total net revenue
|
25,211
|
|
22,180
|
|
50,333
|
|
48,232
|
|
||||||||
|
Provision for credit losses
|
47
|
|
214
|
|
664
|
|
940
|
|
||||||||
|
Noninterest expense
|
||||||||||||||||
|
Compensation expense
|
8,019
|
|
7,427
|
|
16,433
|
|
16,040
|
|
||||||||
|
Occupancy expense
|
904
|
|
1,080
|
|
1,805
|
|
2,041
|
|
||||||||
|
Technology, communications and equipment expense
|
1,361
|
|
1,282
|
|
2,693
|
|
2,553
|
|
||||||||
|
Professional and outside services
|
1,901
|
|
1,857
|
|
3,635
|
|
3,652
|
|
||||||||
|
Marketing
|
578
|
|
642
|
|
1,167
|
|
1,322
|
|
||||||||
|
Other expense
|
2,951
|
|
2,487
|
|
5,252
|
|
7,319
|
|
||||||||
|
Amortization of intangibles
|
152
|
|
191
|
|
304
|
|
384
|
|
||||||||
|
Total noninterest expense
|
15,866
|
|
14,966
|
|
31,289
|
|
33,311
|
|
||||||||
|
Income before income tax expense
|
9,298
|
|
7,000
|
|
18,380
|
|
13,981
|
|
||||||||
|
Income tax expense
|
2,802
|
|
2,040
|
|
5,355
|
|
4,097
|
|
||||||||
|
Net income
|
$
|
6,496
|
|
$
|
4,960
|
|
$
|
13,025
|
|
$
|
9,884
|
|
||||
|
Net income applicable to common stockholders
|
$
|
6,101
|
|
$
|
4,634
|
|
$
|
12,232
|
|
$
|
9,210
|
|
||||
|
Net income per common share data
|
||||||||||||||||
|
Basic earnings per share
|
$
|
1.61
|
|
$
|
1.22
|
|
$
|
3.22
|
|
$
|
2.41
|
|
||||
|
Diluted earnings per share
|
1.60
|
|
1.21
|
|
3.19
|
|
2.41
|
|
||||||||
|
Weighted-average basic shares
|
3,782.4
|
|
3,808.9
|
|
3,800.3
|
|
3,813.9
|
|
||||||||
|
Weighted-average diluted shares
|
3,814.3
|
|
3,820.5
|
|
3,830.6
|
|
3,827.0
|
|
||||||||
|
Cash dividends declared per common share
|
$
|
0.38
|
|
$
|
0.30
|
|
$
|
0.68
|
|
$
|
0.60
|
|
||||
(a)
The following other-than-temporary impairment losses are included in securities gains for the periods presented.
|
Three months ended June 30,
|
Six months ended June 30,
|
|||||||||||||||
|
(in millions)
|
2013
|
2012
|
2013
|
2012
|
||||||||||||
|
Debt securities the Firm does not intend to sell that have credit losses
|
||||||||||||||||
|
Total other-than-temporary impairment losses
|
$
|
—
|
|
$
|
(103
|
)
|
$
|
—
|
|
$
|
(113
|
)
|
||||
|
Losses recorded in/(reclassified from) other comprehensive income
|
—
|
|
84
|
|
—
|
|
87
|
|
||||||||
|
Total credit losses recognized in income
|
—
|
|
(19
|
)
|
—
|
|
(26
|
)
|
||||||||
|
Securities the Firm intends to sell
|
(6
|
)
|
(37
|
)
|
(6
|
)
|
(37
|
)
|
||||||||
|
Total other-than-temporary impairment losses recognized in income
|
$
|
(6
|
)
|
$
|
(56
|
)
|
$
|
(6
|
)
|
$
|
(63
|
)
|
||||
The Notes to Consolidated Financial Statements (unaudited) are an integral part of these statements.
108
JPMorgan Chase & Co.
Consolidated statements of comprehensive income (unaudited)
|
Three months ended June 30,
|
Six months ended June 30,
|
|||||||||||||||
|
(in millions)
|
2013
|
2012
|
2013
|
2012
|
||||||||||||
|
Net income
|
$
|
6,496
|
|
$
|
4,960
|
|
$
|
13,025
|
|
$
|
9,884
|
|
||||
|
Other comprehensive income/(loss), after-tax
|
||||||||||||||||
|
Unrealized gains/(losses) on AFS securities
|
(3,091
|
)
|
(325
|
)
|
(3,731
|
)
|
1,249
|
|
||||||||
|
Translation adjustments, net of hedges
|
(38
|
)
|
(189
|
)
|
(51
|
)
|
(62
|
)
|
||||||||
|
Cash flow hedges
|
(290
|
)
|
73
|
|
(352
|
)
|
38
|
|
||||||||
|
Defined benefit pension and OPEB plans
|
64
|
|
68
|
|
168
|
|
103
|
|
||||||||
|
Total other comprehensive income/(loss), after-tax
|
(3,355
|
)
|
(373
|
)
|
(3,966
|
)
|
1,328
|
|
||||||||
|
Comprehensive income
|
$
|
3,141
|
|
$
|
4,587
|
|
$
|
9,059
|
|
$
|
11,212
|
|
||||
The Notes to
Consolidated Financial Statements (unaudited) are an integral part of these statements.
109
JPMorgan Chase & Co.
Consolidated balance sheets (unaudited)
|
(in millions, except share data)
|
Jun 30, 2013
|
Dec 31, 2012
|
|||||
|
Assets
|
|||||||
|
Cash and due from banks
|
$
|
29,214
|
|
$
|
53,723
|
|
|
|
Deposits with banks
|
311,318
|
|
121,814
|
|
|||
|
Federal funds sold and securities purchased under resale agreements (included
$25,306
and $24,258 at fair value)
|
252,507
|
|
296,296
|
|
|||
|
Securities borrowed (included
$5,295
and $10,177 at fair value)
|
117,158
|
|
119,017
|
|
|||
|
Trading assets (included assets pledged of
$121,085
and $108,784)
|
401,470
|
|
450,028
|
|
|||
|
Securities (included
$354,719
and $371,145 at fair value and assets pledged of
$72,724
and $71,167)
|
354,725
|
|
371,152
|
|
|||
|
Loans (included
$1,923
and $2,555 at fair value)
|
725,586
|
|
733,796
|
|
|||
|
Allowance for loan losses
|
(19,384
|
)
|
(21,936
|
)
|
|||
|
Loans, net of allowance for loan losses
|
706,202
|
|
711,860
|
|
|||
|
Accrued interest and accounts receivable
|
81,562
|
|
60,933
|
|
|||
|
Premises and equipment
|
14,574
|
|
14,519
|
|
|||
|
Goodwill
|
48,057
|
|
48,175
|
|
|||
|
Mortgage servicing rights
|
9,335
|
|
7,614
|
|
|||
|
Other intangible assets
|
1,951
|
|
2,235
|
|
|||
|
Other assets (included
$15,661
and $16,458 at fair value and assets pledged of
$1,826
and $1,127)
|
111,421
|
|
101,775
|
|
|||
|
Total assets
(a)
|
$
|
2,439,494
|
|
$
|
2,359,141
|
|
|
|
Liabilities
|
|||||||
|
Deposits (included
$5,838
and $5,733 at fair value)
|
$
|
1,202,950
|
|
$
|
1,193,593
|
|
|
|
Federal funds purchased and securities loaned or sold under repurchase agreements (included
$4,661
and $4,388 at fair value)
|
258,962
|
|
240,103
|
|
|||
|
Commercial paper
|
56,631
|
|
55,367
|
|
|||
|
Other borrowed funds (included
$12,572
and $11,591 at fair value)
|
30,385
|
|
26,636
|
|
|||
|
Trading liabilities
|
148,593
|
|
131,918
|
|
|||
|
Accounts payable and other liabilities (included
$32
and $36 at fair value)
|
211,432
|
|
195,240
|
|
|||
|
Beneficial interests issued by consolidated variable interest entities (included
$1,043
and $1,170 at fair value)
|
55,090
|
|
63,191
|
|
|||
|
Long-term debt (included
$29,220
and $30,788 at fair value)
|
266,212
|
|
249,024
|
|
|||
|
Total liabilities
(a)
|
2,230,255
|
|
2,155,072
|
|
|||
|
Commitments and contingencies (see Notes 21 and 23 of this Form 10-Q)
|
|||||||
|
Stockholders’ equity
|
|||||||
|
Preferred stock ($1 par value; authorized 200,000,000 shares; issued
1,145,750
and 905,750 shares)
|
11,458
|
|
9,058
|
|
|||
|
Common stock ($1 par value; authorized 9,000,000,000 shares; issued
4,104,933,895
shares)
|
4,105
|
|
4,105
|
|
|||
|
Capital surplus
|
93,416
|
|
94,604
|
|
|||
|
Retained earnings
|
114,216
|
|
104,223
|
|
|||
|
Accumulated other comprehensive income/(loss)
|
136
|
|
4,102
|
|
|||
|
Shares held in RSU Trust, at cost (
476,731
and 479,126 shares)
|
(21
|
)
|
(21
|
)
|
|||
|
Treasury stock, at cost (
335,916,201
and 300,981,690 shares)
|
(14,071
|
)
|
(12,002
|
)
|
|||
|
Total stockholders’ equity
|
209,239
|
|
204,069
|
|
|||
|
Total liabilities and stockholders’ equity
|
$
|
2,439,494
|
|
$
|
2,359,141
|
|
|
|
(a)
|
The following table presents information on assets and liabilities related to VIEs that are consolidated by the Firm at
June 30, 2013
, and
December 31, 2012
. The difference between total VIE assets and liabilities represents the Firm’s interests in those entities, which were eliminated in consolidation.
|
|
(in millions)
|
Jun 30, 2013
|
Dec 31, 2012
|
|||||
|
Assets
|
|||||||
|
Trading assets
|
$
|
9,232
|
|
$
|
11,966
|
|
|
|
Loans
|
72,342
|
|
82,723
|
|
|||
|
All other assets
|
2,224
|
|
2,090
|
|
|||
|
Total assets
|
$
|
83,798
|
|
$
|
96,779
|
|
|
|
Liabilities
|
|||||||
|
Beneficial interests issued by consolidated variable interest entities
|
$
|
55,090
|
|
$
|
63,191
|
|
|
|
All other liabilities
|
1,105
|
|
1,244
|
|
|||
|
Total liabilities
|
$
|
56,195
|
|
$
|
64,435
|
|
|
The assets of the consolidated VIEs are used to settle the liabilities of those entities. The holders of the beneficial interests do not have recourse to the general credit of JPMorgan Chase. At both
June 30, 2013
, and
December 31, 2012
, the Firm provided limited program-wide credit enhancement of
$3.1 billion
related to its Firm-administered multi-seller conduits, which are eliminated in consolidation. For further discussion, see Note 15 on pages
177–184
of this Form 10-Q.
The Notes to Consolidated Financial Statements (unaudited) are an integral part of these statements.
110
JPMorgan Chase & Co.
Consolidated statements of changes in stockholders’ equity (unaudited)
|
Six months ended June 30,
|
||||||||
|
(in millions, except per share data)
|
2013
|
2012
|
||||||
|
Preferred stock
|
||||||||
|
Balance at January 1
|
$
|
9,058
|
|
$
|
7,800
|
|
||
|
Issuance of preferred stock
|
2,400
|
|
—
|
|
||||
|
Balance at June 30
|
11,458
|
|
7,800
|
|
||||
|
Common stock
|
||||||||
|
Balance at January 1 and June 30
|
4,105
|
|
4,105
|
|
||||
|
Capital surplus
|
||||||||
|
Balance at January 1
|
94,604
|
|
95,602
|
|
||||
|
Shares issued and commitments to issue common stock for employee stock-based compensation awards, and related tax effects
|
(1,164
|
)
|
(1,163
|
)
|
||||
|
Other
|
(24
|
)
|
(238
|
)
|
||||
|
Balance at June 30
|
93,416
|
|
94,201
|
|
||||
|
Retained earnings
|
||||||||
|
Balance at January 1
|
104,223
|
|
88,315
|
|
||||
|
Net income
|
13,025
|
|
9,884
|
|
||||
|
Dividends declared:
|
||||||||
|
Preferred stock
|
(386
|
)
|
(315
|
)
|
||||
|
Common stock ($
0.68
and $0.60 per share)
|
(2,646
|
)
|
(2,366
|
)
|
||||
|
Balance at June 30
|
114,216
|
|
95,518
|
|
||||
|
Accumulated other comprehensive income
|
||||||||
|
Balance at January 1
|
4,102
|
|
944
|
|
||||
|
Other comprehensive income/(loss)
|
(3,966
|
)
|
1,328
|
|
||||
|
Balance at June 30
|
136
|
|
2,272
|
|
||||
|
Shares held in RSU Trust, at cost
|
||||||||
|
Balance at January 1 and June 30
|
(21
|
)
|
(38
|
)
|
||||
|
Treasury stock, at cost
|
||||||||
|
Balance at January 1
|
(12,002
|
)
|
(13,155
|
)
|
||||
|
Purchase of treasury stock
|
(3,750
|
)
|
(1,415
|
)
|
||||
|
Reissuance from treasury stock
|
1,681
|
|
2,284
|
|
||||
|
Balance at June 30
|
(14,071
|
)
|
(12,286
|
)
|
||||
|
Total stockholders
’
equity
|
$
|
209,239
|
|
$
|
191,572
|
|
||
The Notes to Consolidated Financial Statements (unaudited) are an integral part of these statements.
111
JPMorgan Chase & Co.
|
Six months ended June 30,
|
|||||||
|
(in millions)
|
2013
|
|
2012
|
|
|||
|
Operating activities
|
|||||||
|
Net income
|
$
|
13,025
|
|
$
|
9,884
|
|
|
|
Adjustments to reconcile net income to net cash provided by/(used in) operating activities:
|
|||||||
|
Provision for credit losses
|
664
|
|
940
|
|
|||
|
Depreciation and amortization
|
2,105
|
|
2,065
|
|
|||
|
Amortization of intangibles
|
304
|
|
384
|
|
|||
|
Deferred tax expense
|
2,167
|
|
1,470
|
|
|||
|
Investment securities gains
|
(633
|
)
|
(1,550
|
)
|
|||
|
Stock-based compensation
|
1,227
|
|
1,441
|
|
|||
|
Originations and purchases of loans held-for-sale
|
(44,974
|
)
|
(14,867
|
)
|
|||
|
Proceeds from sales, securitizations and paydowns of loans held-for-sale
|
46,924
|
|
17,026
|
|
|||
|
Net change in:
|
|||||||
|
Trading assets
|
68,142
|
|
28,987
|
|
|||
|
Securities borrowed
|
1,877
|
|
4,267
|
|
|||
|
Accrued interest and accounts receivable
|
(19,483
|
)
|
(5,972
|
)
|
|||
|
Other assets
|
(7,250
|
)
|
(3,412
|
)
|
|||
|
Trading liabilities
|
8,194
|
|
8,662
|
|
|||
|
Accounts payable and other liabilities
|
19,768
|
|
2,768
|
|
|||
|
Other operating adjustments
|
(3,573
|
)
|
(5,844
|
)
|
|||
|
Net cash provided by operating activities
|
88,484
|
|
46,249
|
|
|||
|
Investing activities
|
|||||||
|
Net change in:
|
|||||||
|
Deposits with banks
|
(189,630
|
)
|
(45,149
|
)
|
|||
|
Federal funds sold and securities purchased under resale agreements
|
43,431
|
|
(19,701
|
)
|
|||
|
Held-to-maturity securities:
|
|||||||
|
Proceeds
|
1
|
|
2
|
|
|||
|
Available-for-sale securities:
|
|||||||
|
Proceeds from maturities
|
52,646
|
|
63,411
|
|
|||
|
Proceeds from sales
|
38,053
|
|
55,389
|
|
|||
|
Purchases
|
(87,180
|
)
|
(105,166
|
)
|
|||
|
Proceeds from sales and securitizations of loans held-for-investment
|
6,087
|
|
3,696
|
|
|||
|
Other changes in loans, net
|
(3,785
|
)
|
(17,192
|
)
|
|||
|
Net cash (used in)/received from business acquisitions or dispositions
|
(45
|
)
|
90
|
|
|||
|
All other investing activities, net
|
(1,823
|
)
|
(1,342
|
)
|
|||
|
Net cash used in investing activities
|
(142,245
|
)
|
(65,962
|
)
|
|||
|
Financing activities
|
|||||||
|
Net change in:
|
|||||||
|
Deposits
|
(6,299
|
)
|
(11,165
|
)
|
|||
|
Federal funds purchased and securities loaned or sold under repurchase agreements
|
18,904
|
|
48,098
|
|
|||
|
Commercial paper and other borrowed funds
|
4,927
|
|
(1,088
|
)
|
|||
|
Beneficial interests issued by consolidated variable interest entities
|
(6,230
|
)
|
(5,698
|
)
|
|||
|
Proceeds from long-term borrowings and trust preferred securities
|
62,016
|
|
27,242
|
|
|||
|
Payments of long-term borrowings and trust preferred securities
|
(38,111
|
)
|
(48,222
|
)
|
|||
|
Excess tax benefits related to stock-based compensation
|
88
|
|
283
|
|
|||
|
Proceeds from issuance of preferred stock
|
2,376
|
|
—
|
|
|||
|
Treasury stock and warrants repurchased
|
(3,750
|
)
|
(1,653
|
)
|
|||
|
Dividends paid
|
(2,727
|
)
|
(2,493
|
)
|
|||
|
All other financing activities, net
|
(1,086
|
)
|
(437
|
)
|
|||
|
Net cash provided by financing activities
|
30,108
|
|
4,867
|
|
|||
|
Effect of exchange rate changes on cash and due from banks
|
(856
|
)
|
110
|
|
|||
|
Net decrease in cash and due from banks
|
(24,509
|
)
|
(14,736
|
)
|
|||
|
Cash and due from banks at the beginning of the period
|
53,723
|
|
59,602
|
|
|||
|
Cash and due from banks at the end of the period
|
$
|
29,214
|
|
$
|
44,866
|
|
|
|
Cash interest paid
|
$
|
4,735
|
|
$
|
5,805
|
|
|
|
Cash income taxes paid, net
|
2,684
|
|
844
|
|
|||
The Notes to Consolidated Financial Statements (unaudited) are an integral part of these statements.
112
|
See Glossary of Terms on pages 212–214 of this Form 10-Q for definitions of terms used throughout the Notes to Consolidated Financial Statements.
|
NOTES TO CONSOLIDATED FINANCIAL STATEMENTS (unaudited)
JPMorgan Chase & Co. (“
JPMorgan Chase
” or the “Firm”), a financial holding company incorporated under Delaware law in 1968, is a leading global financial services firm and one of the largest banking institutions in the United States of America (“U.S.”), with operations worldwide. The Firm is a leader in investment banking, financial services for consumers and small business, commercial banking, financial transaction processing, asset management and private equity. For a discussion of the Firm’s business segments, see Note 24 on pages
207–208
of this Form
10-Q.
The accounting and financial reporting policies of
JPMorgan Chase
and its subsidiaries conform to accounting principles generally accepted in the U.S. (“U.S. GAAP”). Additionally, where applicable, the policies conform to the accounting and reporting guidelines prescribed by regulatory authorities.
The unaudited consolidated financial statements prepared in conformity with U.S. GAAP require management to make estimates and assumptions that affect the reported amounts of assets, liabilities, revenue and expense, and the disclosures of contingent assets and liabilities. Actual results could be different from these estimates. In the opinion of management, all normal, recurring adjustments have been included for a fair statement of this interim financial information.
These unaudited consolidated financial statements should be read in conjunction with the audited consolidated financial statements, and related notes thereto, included in JPMorgan Chase’s Annual Report on Form 10-K for the year ended December 31, 2012, as filed with the U.S. Securities and Exchange Commission (the “2012 Annual Report”).
Certain amounts reported in prior periods have been reclassified to conform with the current presentation.
Offsetting assets and liabilities
U.S. GAAP permits entities to present derivative receivables and derivative payables with the same counterparty and the related cash collateral receivables and payables on a net basis on the balance sheet when a legally enforceable master netting agreement exists. U.S. GAAP also permits securities sold and purchased under repurchase agreements to be presented net when specified conditions are met, including the existence of a legally enforceable master netting agreement. The Firm has elected to net such balances when the specified conditions are met.
The Firm uses master netting agreements to mitigate counterparty credit risk in certain transactions, including derivatives transactions, repurchase and reverse repurchase agreements, and securities borrow and loan agreements. A master netting agreement is a single
contract with a counterparty that permits multiple transactions governed by that contract to be terminated and settled through a single payment in a single currency in the event of a default (e.g., bankruptcy, failure to make a required payment or securities transfer or deliver collateral or margin when due after expiration of any grace period). Upon the exercise of termination rights by the non-defaulting party, (i) all transactions are terminated, (ii) all transactions are valued and the positive value or “in the money” transactions are netted against the negative value or “out of the money” transactions and (iii) the only remaining payment obligation is of one of the parties to pay the netted termination amount. Upon exercise of repurchase agreement and securities loan default rights (i) all securities loan transactions are terminated and accelerated, (ii) all values of securities or cash held or to be delivered are calculated, and all such sums are netted against each other and (iii) the only remaining payment obligation is of one of the parties to pay the netted termination amount.
Typical master netting agreements for these types of transactions also often contain a collateral/margin agreement that provides for a security interest in or title transfer of securities or cash collateral/margin to the party that has the right to demand margin (the “demanding party”). The collateral/margin agreement typically requires a party to transfer collateral/margin to the demanding party with a value equal to the amount of the margin deficit on a net basis across all transactions governed by the master netting agreement, less any threshold. The collateral/margin agreement grants to the demanding party, upon default by the counterparty, the right to set-off any amounts payable by the counterparty against any posted collateral or the cash equivalent of any posted collateral/margin. It also grants to the demanding party the right to liquidate collateral/margin and to apply the proceeds to an amount payable by the counterparty.
For further discussion on the Firm’s derivative instruments, see Note 5 on pages
131–142
of this Form 10-Q. For further discussion on the Firm’s repurchase and reverse repurchase agreements, and securities borrowing and lending agreements, see Note 12 on pages
151–152
of this Form 10‑Q.
113
Business events
Issuance of preferred stock
On February 5, 2013, the Firm issued
$900 million
of noncumulative preferred stock. On April 23, 2013, the Firm issued
$1.5 billion
of noncumulative preferred stock. For additional information on the Firm’s preferred stock, see Note 22 on page 300 of the Firm’s 2012 Annual Report.
Redemption of outstanding trust preferred securities
On May 8, 2013, the Firm redeemed approximately
$5.0 billion
, or
100%
of the liquidation amount, of the following eight series of trust preferred securities: JPMorgan Chase Capital X, XI, XII, XIV, XVI, XIX, XXIV, and BANK ONE Capital VI. For a further discussion of trust preferred securities, see Note 21 on pages 297–299 of JPMorgan Chase’s 2012 Annual Report.
Increase in common stock dividend
On May 21, 2013, the Board of Directors increased the Firm’s quarterly common stock dividend from
$0.30
per share to
$0.38
per share, effective with the dividend paid on July 31, 2013, to shareholders of record on July 5, 2013.
One Equity Partners
As announced on June 14, 2013, One Equity Partners (“OEP”) will raise its next fund from an external group of limited partners and then become independent from JPMorgan Chase. Until it becomes independent from the Firm, OEP will continue to make direct investments for JPMorgan Chase, and thereafter will continue to manage the then-existing group of portfolio companies for JPMorgan Chase to maximize value for the Firm.
Subsequent events
On July 26, 2013, the Firm announced that it is pursuing strategic alternatives for its physical commodities businesses, including its remaining holdings of commodities assets and its physical trading operations. The Firm will explore a full range of options over time, including, but not limited to: a sale, spin off or strategic partnership. During the process, the Firm will continue to run its physical commodities business as a going concern. The Firm remains fully committed to its traditional banking activities in the commodity markets, including financial derivatives and the vaulting and trading of precious metals.
On July 29, 2013, the Firm issued
$1.5 billion
of noncumulative preferred stock. On August 1, 2013, the Firm announced that it would redeem all of its outstanding
8.625%
noncumulative preferred stock, Series J on September 1, 2013. For additional information on the Firm’s preferred stock, see Note 22 on page 300 of the Firm’s 2012 Annual Report.
114
The following table presents the asset and liabilities reported at fair value as of
June 30, 2013
, and
December 31, 2012
, by major product category and fair value hierarchy.
|
Assets and liabilities measured at fair value on a recurring basis
|
|||||||||||||||||
|
Fair value hierarchy
|
Netting adjustments
|
||||||||||||||||
|
June 30, 2013
(in millions)
|
Level 1
|
Level 2
|
Level 3
|
Total fair value
|
|||||||||||||
|
Federal funds sold and securities purchased under resale agreements
|
$
|
—
|
|
$
|
25,306
|
|
$
|
—
|
|
$
|
—
|
|
$
|
25,306
|
|
||
|
Securities borrowed
|
—
|
|
5,295
|
|
—
|
|
—
|
|
5,295
|
|
|||||||
|
Trading assets:
|
|||||||||||||||||
|
Debt instruments:
|
|||||||||||||||||
|
Mortgage-backed securities:
|
|||||||||||||||||
|
U.S. government agencies
(a)
|
—
|
|
29,100
|
|
901
|
|
—
|
|
30,001
|
|
|||||||
|
Residential – nonagency
|
—
|
|
1,783
|
|
615
|
|
—
|
|
2,398
|
|
|||||||
|
Commercial – nonagency
|
—
|
|
1,271
|
|
1,271
|
|
—
|
|
2,542
|
|
|||||||
|
Total mortgage-backed securities
|
—
|
|
32,154
|
|
2,787
|
|
—
|
|
34,941
|
|
|||||||
|
U.S. Treasury and government agencies
(a)
|
25,932
|
|
11,528
|
|
—
|
|
—
|
|
37,460
|
|
|||||||
|
Obligations of U.S. states and municipalities
|
—
|
|
11,266
|
|
1,221
|
|
—
|
|
12,487
|
|
|||||||
|
Certificates of deposit, bankers’ acceptances and commercial paper
|
—
|
|
2,471
|
|
—
|
|
—
|
|
2,471
|
|
|||||||
|
Non-U.S. government debt securities
|
28,603
|
|
29,784
|
|
136
|
|
—
|
|
58,523
|
|
|||||||
|
Corporate debt securities
|
—
|
|
26,160
|
|
5,735
|
|
—
|
|
31,895
|
|
|||||||
|
Loans
(b)
|
—
|
|
27,686
|
|
10,940
|
|
—
|
|
38,626
|
|
|||||||
|
Asset-backed securities
|
—
|
|
3,886
|
|
1,428
|
|
—
|
|
5,314
|
|
|||||||
|
Total debt instruments
|
54,535
|
|
144,935
|
|
22,247
|
|
—
|
|
221,717
|
|
|||||||
|
Equity securities
|
86,358
|
|
1,547
|
|
1,039
|
|
—
|
|
88,944
|
|
|||||||
|
Physical commodities
(c)
|
7,016
|
|
4,909
|
|
16
|
|
—
|
|
11,941
|
|
|||||||
|
Other
|
—
|
|
4,012
|
|
1,105
|
|
—
|
|
5,117
|
|
|||||||
|
Total debt and equity instruments
(d)
|
147,909
|
|
155,403
|
|
24,407
|
|
—
|
|
327,719
|
|
|||||||
|
Derivative receivables:
|
|||||||||||||||||
|
Interest rate
|
2,875
|
|
963,223
|
|
5,114
|
|
(939,515
|
)
|
31,697
|
|
|||||||
|
Credit
|
—
|
|
89,247
|
|
4,414
|
|
(91,297
|
)
|
2,364
|
|
|||||||
|
Foreign exchange
|
966
|
|
174,239
|
|
2,052
|
|
(162,940
|
)
|
14,317
|
|
|||||||
|
Equity
|
—
|
|
46,990
|
|
5,069
|
|
(38,490
|
)
|
13,569
|
|
|||||||
|
Commodity
|
541
|
|
53,802
|
|
780
|
|
(43,319
|
)
|
11,804
|
|
|||||||
|
Total derivative receivables
(e)
|
4,382
|
|
1,327,501
|
|
17,429
|
|
(1,275,561
|
)
|
73,751
|
|
|||||||
|
Total trading assets
|
152,291
|
|
1,482,904
|
|
41,836
|
|
(1,275,561
|
)
|
401,470
|
|
|||||||
|
Available-for-sale securities:
|
|||||||||||||||||
|
Mortgage-backed securities:
|
|||||||||||||||||
|
U.S. government agencies
(a)
|
—
|
|
101,314
|
|
—
|
|
—
|
|
101,314
|
|
|||||||
|
Residential – nonagency
|
—
|
|
65,179
|
|
385
|
|
—
|
|
65,564
|
|
|||||||
|
Commercial – nonagency
|
—
|
|
12,732
|
|
252
|
|
—
|
|
12,984
|
|
|||||||
|
Total mortgage-backed securities
|
—
|
|
179,225
|
|
637
|
|
—
|
|
179,862
|
|
|||||||
|
U.S. Treasury and government agencies
(a)
|
22,115
|
|
783
|
|
—
|
|
—
|
|
22,898
|
|
|||||||
|
Obligations of U.S. states and municipalities
|
71
|
|
24,275
|
|
187
|
|
—
|
|
24,533
|
|
|||||||
|
Certificates of deposit
|
—
|
|
1,588
|
|
—
|
|
—
|
|
1,588
|
|
|||||||
|
Non-U.S. government debt securities
|
28,637
|
|
27,337
|
|
—
|
|
—
|
|
55,974
|
|
|||||||
|
Corporate debt securities
|
—
|
|
28,239
|
|
—
|
|
—
|
|
28,239
|
|
|||||||
|
Asset-backed securities:
|
|||||||||||||||||
|
Collateralized loan obligations
|
—
|
|
26,330
|
|
988
|
|
—
|
|
27,318
|
|
|||||||
|
Other
|
—
|
|
11,560
|
|
137
|
|
—
|
|
11,697
|
|
|||||||
|
Equity securities
|
2,610
|
|
—
|
|
—
|
|
—
|
|
2,610
|
|
|||||||
|
Total available-for-sale securities
|
53,433
|
|
299,337
|
|
1,949
|
|
—
|
|
354,719
|
|
|||||||
|
Loans
|
—
|
|
80
|
|
1,843
|
|
—
|
|
1,923
|
|
|||||||
|
Mortgage servicing rights
|
—
|
|
—
|
|
9,335
|
|
—
|
|
9,335
|
|
|||||||
|
Other assets:
|
|||||||||||||||||
|
Private equity investments
(f)
|
550
|
|
—
|
|
7,105
|
|
—
|
|
7,655
|
|
|||||||
|
All other
|
3,894
|
|
432
|
|
3,680
|
|
—
|
|
8,006
|
|
|||||||
|
Total other assets
|
4,444
|
|
432
|
|
10,785
|
|
—
|
|
15,661
|
|
|||||||
|
Total assets measured at fair value on a recurring basis
|
$
|
210,168
|
|
$
|
1,813,354
|
|
(g)
|
$
|
65,748
|
|
(g)
|
$
|
(1,275,561
|
)
|
$
|
813,709
|
|
|
Deposits
|
$
|
—
|
|
$
|
3,648
|
|
$
|
2,190
|
|
$
|
—
|
|
$
|
5,838
|
|
||
|
Federal funds purchased and securities loaned or sold under repurchase agreements
|
—
|
|
4,661
|
|
—
|
|
—
|
|
4,661
|
|
|||||||
|
Other borrowed funds
|
—
|
|
9,899
|
|
2,673
|
|
—
|
|
12,572
|
|
|||||||
|
Trading liabilities:
|
|
|
|||||||||||||||
|
Debt and equity instruments
(d)
|
62,868
|
|
21,236
|
|
104
|
|
—
|
|
84,208
|
|
|||||||
|
Derivative payables:
|
|
|
|||||||||||||||
|
Interest rate
|
2,266
|
|
932,906
|
|
3,013
|
|
(919,769
|
)
|
18,416
|
|
|||||||
|
Credit
|
—
|
|
88,150
|
|
3,493
|
|
(89,032
|
)
|
2,611
|
|
|||||||
|
Foreign exchange
|
932
|
|
188,858
|
|
3,270
|
|
(176,350
|
)
|
16,710
|
|
|||||||
|
Equity
|
—
|
|
46,044
|
|
7,360
|
|
(38,676
|
)
|
14,728
|
|
|||||||
|
Commodity
|
625
|
|
54,493
|
|
709
|
|
(43,907
|
)
|
11,920
|
|
|||||||
|
Total derivative payables
(e)
|
3,823
|
|
1,310,451
|
|
17,845
|
|
(1,267,734
|
)
|
64,385
|
|
|||||||
|
Total trading liabilities
|
66,691
|
|
1,331,687
|
|
17,949
|
|
(1,267,734
|
)
|
148,593
|
|
|||||||
|
Accounts payable and other liabilities
|
—
|
|
—
|
|
32
|
|
—
|
|
32
|
|
|||||||
|
Beneficial interests issued by consolidated VIEs
|
—
|
|
180
|
|
863
|
|
—
|
|
1,043
|
|
|||||||
|
Long-term debt
|
—
|
|
20,018
|
|
9,202
|
|
—
|
|
29,220
|
|
|||||||
|
Total liabilities measured at fair value on a recurring basis
|
$
|
66,691
|
|
$
|
1,370,093
|
|
$
|
32,909
|
|
$
|
(1,267,734
|
)
|
$
|
201,959
|
|
||
115
|
Fair value hierarchy
|
Netting adjustments
|
||||||||||||||||
|
December 31, 2012 (in millions)
|
Level 1
|
Level 2
|
Level 3
|
Total fair value
|
|||||||||||||
|
Federal funds sold and securities purchased under resale agreements
|
$
|
—
|
|
$
|
24,258
|
|
$
|
—
|
|
$
|
—
|
|
$
|
24,258
|
|
||
|
Securities borrowed
|
—
|
|
10,177
|
|
—
|
|
—
|
|
10,177
|
|
|||||||
|
Trading assets:
|
|||||||||||||||||
|
Debt instruments:
|
|||||||||||||||||
|
Mortgage-backed securities:
|
|||||||||||||||||
|
U.S. government agencies
(a)
|
—
|
|
36,240
|
|
498
|
|
—
|
|
36,738
|
|
|||||||
|
Residential – nonagency
|
—
|
|
1,509
|
|
663
|
|
—
|
|
2,172
|
|
|||||||
|
Commercial – nonagency
|
—
|
|
1,565
|
|
1,207
|
|
—
|
|
2,772
|
|
|||||||
|
Total mortgage-backed securities
|
—
|
|
39,314
|
|
2,368
|
|
—
|
|
41,682
|
|
|||||||
|
U.S. Treasury and government agencies
(a)(h)
|
15,170
|
|
7,255
|
|
—
|
|
—
|
|
22,425
|
|
|||||||
|
Obligations of U.S. states and municipalities
|
—
|
|
16,726
|
|
1,436
|
|
—
|
|
18,162
|
|
|||||||
|
Certificates of deposit, bankers’ acceptances and commercial paper
|
—
|
|
4,759
|
|
—
|
|
—
|
|
4,759
|
|
|||||||
|
Non-U.S. government debt securities
(h)
|
26,095
|
|
44,028
|
|
67
|
|
—
|
|
70,190
|
|
|||||||
|
Corporate debt securities
(h)
|
—
|
|
31,882
|
|
5,308
|
|
—
|
|
37,190
|
|
|||||||
|
Loans
(b)
|
—
|
|
30,754
|
|
10,787
|
|
—
|
|
41,541
|
|
|||||||
|
Asset-backed securities
|
—
|
|
4,182
|
|
3,696
|
|
—
|
|
7,878
|
|
|||||||
|
Total debt instruments
|
41,265
|
|
178,900
|
|
23,662
|
|
—
|
|
243,827
|
|
|||||||
|
Equity securities
|
106,898
|
|
2,687
|
|
1,114
|
|
—
|
|
110,699
|
|
|||||||
|
Physical commodities
(c)
|
10,107
|
|
6,066
|
|
—
|
|
—
|
|
16,173
|
|
|||||||
|
Other
|
—
|
|
3,483
|
|
863
|
|
—
|
|
4,346
|
|
|||||||
|
Total debt and equity instruments
(d)
|
158,270
|
|
191,136
|
|
25,639
|
|
—
|
|
375,045
|
|
|||||||
|
Derivative receivables:
|
|||||||||||||||||
|
Interest rate
(h)
|
476
|
|
1,295,474
|
|
6,617
|
|
(1,263,362
|
)
|
39,205
|
|
|||||||
|
Credit
|
—
|
|
93,821
|
|
6,489
|
|
(98,575
|
)
|
1,735
|
|
|||||||
|
Foreign exchange
(h)
|
450
|
|
171,439
|
|
3,051
|
|
(160,798
|
)
|
14,142
|
|
|||||||
|
Equity
(h)
|
—
|
|
37,741
|
|
4,921
|
|
(33,396
|
)
|
9,266
|
|
|||||||
|
Commodity
(h)
|
316
|
|
42,331
|
|
1,155
|
|
(33,167
|
)
|
10,635
|
|
|||||||
|
Total derivative receivables
(e)
|
1,242
|
|
1,640,806
|
|
22,233
|
|
(1,589,298
|
)
|
74,983
|
|
|||||||
|
Total trading assets
|
159,512
|
|
1,831,942
|
|
47,872
|
|
(1,589,298
|
)
|
450,028
|
|
|||||||
|
Available-for-sale securities:
|
|||||||||||||||||
|
Mortgage-backed securities:
|
|||||||||||||||||
|
U.S. government agencies
(a)
|
—
|
|
98,388
|
|
—
|
|
—
|
|
98,388
|
|
|||||||
|
Residential – nonagency
|
—
|
|
74,189
|
|
450
|
|
—
|
|
74,639
|
|
|||||||
|
Commercial – nonagency
|
—
|
|
12,948
|
|
255
|
|
—
|
|
13,203
|
|
|||||||
|
Total mortgage-backed securities
|
—
|
|
185,525
|
|
705
|
|
—
|
|
186,230
|
|
|||||||
|
U.S. Treasury and government agencies
(a)(h)
|
11,089
|
|
1,041
|
|
—
|
|
—
|
|
12,130
|
|
|||||||
|
Obligations of U.S. states and municipalities
|
35
|
|
21,489
|
|
187
|
|
—
|
|
21,711
|
|
|||||||
|
Certificates of deposit
|
—
|
|
2,783
|
|
—
|
|
—
|
|
2,783
|
|
|||||||
|
Non-U.S. government debt securities
(h)
|
29,556
|
|
36,488
|
|
—
|
|
—
|
|
66,044
|
|
|||||||
|
Corporate debt securities
|
—
|
|
38,609
|
|
—
|
|
—
|
|
38,609
|
|
|||||||
|
Asset-backed securities:
|
|||||||||||||||||
|
Collateralized loan obligations
|
—
|
|
—
|
|
27,896
|
|
—
|
|
27,896
|
|
|||||||
|
Other
|
—
|
|
12,843
|
|
128
|
|
—
|
|
12,971
|
|
|||||||
|
Equity securities
|
2,733
|
|
38
|
|
—
|
|
—
|
|
2,771
|
|
|||||||
|
Total available-for-sale securities
|
43,413
|
|
298,816
|
|
28,916
|
|
—
|
|
371,145
|
|
|||||||
|
Loans
|
—
|
|
273
|
|
2,282
|
|
—
|
|
2,555
|
|
|||||||
|
Mortgage servicing rights
|
—
|
|
—
|
|
7,614
|
|
—
|
|
7,614
|
|
|||||||
|
Other assets:
|
|||||||||||||||||
|
Private equity investments
(f)
|
578
|
|
—
|
|
7,181
|
|
—
|
|
7,759
|
|
|||||||
|
All other
|
4,188
|
|
253
|
|
4,258
|
|
—
|
|
8,699
|
|
|||||||
|
Total other assets
|
4,766
|
|
253
|
|
11,439
|
|
—
|
|
16,458
|
|
|||||||
|
Total assets measured at fair value on a recurring basis
|
$
|
207,691
|
|
$
|
2,165,719
|
|
(g)
|
$
|
98,123
|
|
(g)
|
$
|
(1,589,298
|
)
|
$
|
882,235
|
|
|
Deposits
|
$
|
—
|
|
$
|
3,750
|
|
$
|
1,983
|
|
$
|
—
|
|
$
|
5,733
|
|
||
|
Federal funds purchased and securities loaned or sold under repurchase agreements
|
—
|
|
4,388
|
|
—
|
|
—
|
|
4,388
|
|
|||||||
|
Other borrowed funds
|
—
|
|
9,972
|
|
1,619
|
|
—
|
|
11,591
|
|
|||||||
|
Trading liabilities:
|
|||||||||||||||||
|
Debt and equity instruments
(d)(h)
|
47,469
|
|
13,588
|
|
205
|
|
—
|
|
61,262
|
|
|||||||
|
Derivative payables:
|
|||||||||||||||||
|
Interest rate
(h)
|
490
|
|
1,256,934
|
|
3,295
|
|
(1,235,813
|
)
|
24,906
|
|
|||||||
|
Credit
|
—
|
|
95,411
|
|
4,616
|
|
(97,523
|
)
|
2,504
|
|
|||||||
|
Foreign exchange
(h)
|
428
|
|
183,308
|
|
4,801
|
|
(169,936
|
)
|
18,601
|
|
|||||||
|
Equity
(h)
|
—
|
|
37,807
|
|
6,727
|
|
(32,715
|
)
|
11,819
|
|
|||||||
|
Commodity
(h)
|
176
|
|
46,565
|
|
901
|
|
(34,816
|
)
|
12,826
|
|
|||||||
|
Total derivative payables
(e)
|
1,094
|
|
1,620,025
|
|
20,340
|
|
(1,570,803
|
)
|
70,656
|
|
|||||||
|
Total trading liabilities
|
48,563
|
|
1,633,613
|
|
20,545
|
|
(1,570,803
|
)
|
131,918
|
|
|||||||
|
Accounts payable and other liabilities
|
—
|
|
—
|
|
36
|
|
—
|
|
36
|
|
|||||||
|
Beneficial interests issued by consolidated VIEs
|
—
|
|
245
|
|
925
|
|
—
|
|
1,170
|
|
|||||||
|
Long-term debt
|
—
|
|
22,312
|
|
8,476
|
|
—
|
|
30,788
|
|
|||||||
|
Total liabilities measured at fair value on a recurring basis
|
$
|
48,563
|
|
$
|
1,674,280
|
|
$
|
33,584
|
|
$
|
(1,570,803
|
)
|
$
|
185,624
|
|
||
|
(a)
|
At
June 30, 2013
, and December 31, 2012, included total U.S. government-sponsored enterprise obligations of
$113.8 billion
and
$119.4 billion
, respectively, which were predominantly mortgage-related.
|
|
(b)
|
At
June 30, 2013
, and December 31, 2012, included within trading loans were
$21.4 billion
and
$26.4 billion
, respectively, of residential first-lien mortgages, and
$1.9 billion
and
$2.2 billion
, respectively, of commercial first-lien mortgages. Residential mortgage loans include conforming mortgage loans originated with the intent to sell to U.S. government agencies of
$13.5 billion
and
$17.4 billion
, respectively, and reverse mortgages of
$3.5 billion
and
$4.0 billion
, respectively.
|
|
(c)
|
Physical commodities inventories are generally accounted for at the lower of cost or market. “Market” is a term defined in U.S. GAAP as not exceeding fair value less costs to sell (“transaction costs”). Transaction costs for the Firm’s physical commodities inventories are either not applicable or immaterial to the value of the inventory. Therefore, market
|
116
approximates fair value for the Firm’s physical commodities inventories. When fair value hedging has been applied (or when market is below cost), the carrying value of physical commodities approximates fair value, because under fair value hedge accounting, the cost basis is adjusted for changes in fair value. For a further discussion of the Firm’s hedge accounting relationships, see Note 5 on pages
131–142
of this Form 10-Q. To provide consistent fair value disclosure information, all physical commodities inventories have been included in each period presented.
|
(d)
|
Balances reflect the reduction of securities owned (long positions) by the amount of securities sold but not yet purchased (short positions) when the long and short positions have identical Committee on Uniform Security Identification Procedures numbers (“CUSIPs”).
|
|
(e)
|
As permitted under U.S. GAAP, the Firm has elected to net derivative receivables and derivative payables and the related cash collateral received and paid when a legally enforceable master netting agreement exists. For purposes of the tables above, the Firm does not reduce derivative receivables and derivative payables balances for this netting adjustment, either within or across the levels of the fair value hierarchy, as such netting is not relevant to a presentation based on the transparency of inputs to the valuation of an asset or liability. Therefore, the balances reported in the fair value hierarchy table are gross of any counterparty netting adjustments. However, if the Firm were to net such balances within level 3, the reduction in the level 3 derivative receivables and payables balances would be
$7.0 billion
and
$7.4 billion
at
June 30, 2013
, and December 31, 2012, respectively; this is exclusive of the netting benefit associated with cash collateral, which would further reduce the level 3 balances.
|
|
(f)
|
Private equity instruments represent investments within the Corporate/Private Equity line of business. The cost basis of the private equity investment portfolio totaled
$8.6 billion
and
$8.4 billion
at
June 30, 2013
, and December 31, 2012, respectively.
|
|
(g)
|
Includes investments in hedge funds, private equity funds, real estate and other funds that do not have readily determinable fair values. The Firm uses net asset value per share when measuring the fair value of these investments. At
June 30, 2013
, and December 31, 2012, the fair values of these investments were
$3.9 billion
and
$4.9 billion
, respectively, of which
$1.0 billion
and
$1.1 billion
, respectively were classified in level 2, and
$2.9 billion
and
$3.8 billion
, respectively, in level 3.
|
|
(h)
|
The prior period amounts have been revised. This revision had no impact on the Firm’s Consolidated Balance Sheets or its results of operations.
|
Transfers between levels for instruments carried at fair value on a recurring basis
For the three and six months ended
June 30, 2013
and 2012, there were no significant transfers between levels 1 and 2, and from level 2 into level 3.
During the three months ended March 31, 2013, certain highly rated CLOs, including
$27.3 billion
held in the AFS securities portfolio and
$1.3 billion
held in the trading portfolio, were transferred from Level 3 to Level 2, based on increased liquidity and price transparency.
For the six months ended June 30, 2012, transfers from level 3 into level 2 included
$1.2 billion
of derivative payables based on increased observability of certain structured equity derivatives and
$1.3 billion
of long-term debt due to increased observability of certain equity structured notes.
All transfers are assumed to occur at the beginning of the quarterly reporting period in which they occur.
Level 3 valuations
The Firm has established well-documented processes for determining fair value, including for instruments where fair value is estimated using significant unobservable inputs (level 3). For further information on the Firm’s valuation process and a detailed discussion of the determination of fair value for individual financial instruments, see Note 3 on pages 196–214 of JPMorgan Chase’s 2012 Annual Report.
Estimating fair value requires the application of judgment. The type and level of judgment required is largely dependent on the amount of observable market information available to the Firm. For instruments valued using internally developed models that use significant unobservable inputs and are therefore classified within level 3 of the fair value hierarchy, judgments used to estimate fair value are more significant than those required when estimating the fair value of instruments classified within levels 1 and 2.
In arriving at an estimate of fair value for an instrument within level 3, management must first determine the appropriate model to use. Second, due to the lack of observability of significant inputs, management must assess all relevant empirical data in deriving valuation inputs — including, but not limited to, transaction details, yield curves, interest rates, prepayment speed, default rates,
volatilities, correlations, equity or debt prices, valuations of comparable instruments, foreign exchange rates and credit curves. Finally, management judgment must be applied to assess the appropriate level of valuation adjustments to reflect counterparty credit quality, the Firm’s creditworthiness, constraints on liquidity and unobservable parameters, where relevant. The judgments made are typically affected by the type of product and its specific contractual terms, and the level of liquidity for the product or within the market as a whole.
The following table presents the Firm’s primary level 3 financial instruments, the valuation techniques used to measure the fair value of those financial instruments, the significant unobservable inputs, the range of values for those inputs and, for certain instruments, the weighted averages of such inputs. While the determination to classify an instrument within level 3 is based on the significance of the unobservable inputs to the overall fair value measurement, level 3 financial instruments typically include observable components (that is, components that are actively quoted and can be validated to external sources) in addition to the unobservable components. The level 1 and/or level 2 inputs are not included in the table. In addition, the Firm manages the risk of the observable components of level 3 financial instruments using securities and derivative positions that are classified within levels 1 or 2 of the fair value hierarchy.
The range of values presented in the table is representative of the highest and lowest level input used to value the significant groups of instruments within a product/instrument classification. The input range does not reflect the level of input uncertainty, instead it is driven by the different underlying characteristics of the various instruments within the classification. For example, two option contracts may have similar levels of market risk exposure and valuation uncertainty, but may have significantly different implied volatility levels because the option contracts have different underlyings, tenors, or strike prices.
Where provided, the weighted averages of the input values presented in the table are calculated based on the fair value of the instruments that the input is being used to value. In the Firm’s view, the input range and the weighted average value do not reflect the degree of input uncertainty or an assessment of the reasonableness of the Firm’s estimates
117
and assumptions. Rather, they reflect the characteristics of the various instruments held by the Firm and the relative distribution of instruments within the range of characteristics. The input range and weighted average values will therefore vary from period to period and parameter to parameter based on the characteristics of the instruments held by the Firm at each balance sheet date.
For the Firm’s derivatives and structured notes positions classified within level 3, the equity and interest rate
correlation inputs used in estimating fair value were concentrated at the upper end of the range presented, while the credit correlation inputs were distributed across the range presented and the foreign exchange correlation inputs were concentrated at the lower end of the range presented. In addition, the equity and interest rate volatility inputs used in estimating fair value were concentrated at the upper end of the range presented, while commodities volatilities were concentrated at the lower end of the range.
|
Level 3 inputs
(a)
|
|||||||||||
|
June 30, 2013 (in millions, except for ratios and basis points)
|
|||||||||||
|
Product/Instrument
|
Fair value
|
Principal valuation technique
|
Unobservable inputs
|
Range of input values
|
Weighted average
|
||||||
|
Residential mortgage-backed securities and loans
|
$
|
9,678
|
|
Discounted cash flows
|
Yield
|
2
|
%
|
-
|
24%
|
7%
|
|
|
Prepayment speed
|
0
|
%
|
-
|
28%
|
7%
|
||||||
|
Conditional default rate
|
0
|
%
|
-
|
100%
|
12%
|
||||||
|
Loss severity
|
0
|
%
|
-
|
76%
|
11%
|
||||||
|
Commercial mortgage-backed securities and loans
(b)
|
2,006
|
|
Discounted cash flows
|
Yield
|
2
|
%
|
-
|
25%
|
6%
|
||
|
Conditional default rate
|
0
|
%
|
-
|
16%
|
1%
|
||||||
|
Loss severity
|
0
|
%
|
-
|
40%
|
11%
|
||||||
|
Corporate debt securities, obligations of U.S. states and municipalities, and other
|
13,644
|
|
Discounted cash flows
|
Credit spread
|
115 bps
|
|
-
|
187 bps
|
139 bps
|
||
|
Yield
|
1
|
%
|
-
|
35%
|
10%
|
||||||
|
5,156
|
|
Market comparables
|
Price
|
3
|
|
-
|
135
|
93
|
|||
|
Net interest rate derivatives
|
2,101
|
|
Option pricing
|
Interest rate correlation
|
(75
|
)%
|
-
|
95%
|
|||
|
Interest rate spread volatility
|
0
|
%
|
-
|
60%
|
|||||||
|
Net credit derivatives
(b)
|
921
|
|
Discounted cash flows
|
Credit correlation
|
40
|
%
|
-
|
90%
|
|||
|
Net foreign exchange derivatives
|
(1,218
|
)
|
Option pricing
|
Foreign exchange correlation
|
40
|
%
|
-
|
75%
|
|||
|
Net equity derivatives
|
(2,291
|
)
|
Option pricing
|
Equity volatility
|
15
|
%
|
-
|
50%
|
|||
|
Net commodity derivatives
|
71
|
|
Option pricing
|
Commodity volatility
|
24
|
%
|
-
|
40%
|
|||
|
Collateralized loan obligations
|
988
|
|
Discounted cash flows
|
Credit spread
|
140 bps
|
|
-
|
700 bps
|
245 bps
|
||
|
Prepayment speed
|
15
|
%
|
-
|
20%
|
19%
|
||||||
|
Conditional default rate
|
2%
|
2%
|
|||||||||
|
Loss severity
|
40%
|
40%
|
|||||||||
|
407
|
|
Market comparables
|
Price
|
0
|
|
-
|
128
|
84
|
|||
|
Mortgage servicing rights (“MSRs”)
|
9,335
|
|
Discounted cash flows
|
Refer to Note 16 on pages 184–187 of this Form 10-Q.
|
|||||||
|
Private equity direct investments
|
5,307
|
|
Market comparables
|
EBITDA multiple
|
3.7x
|
|
-
|
13.2x
|
8.3x
|
||
|
Liquidity adjustment
|
0
|
%
|
-
|
30%
|
12%
|
||||||
|
Private equity fund investments
(c)
|
1,798
|
|
Net asset value
|
Net asset value
(e)
|
|||||||
|
Long-term debt, other borrowed funds, and deposits
(d)
|
12,880
|
|
Option pricing
|
Interest rate correlation
|
(75
|
)%
|
-
|
95%
|
|||
|
Foreign exchange correlation
|
0
|
%
|
-
|
75%
|
|||||||
|
Equity correlation
|
(55
|
)%
|
-
|
85%
|
|||||||
|
1,185
|
|
Discounted cash flows
|
Credit correlation
|
40
|
%
|
-
|
86%
|
||||
|
(a)
|
The categories presented in the table have been aggregated based upon the product type, which may differ from their classification on the Consolidated Balance Sheets.
|
|
(b)
|
The unobservable inputs and associated input ranges for approximately
$1.0 billion
of credit derivative receivables and
$910 million
of credit derivative payables with underlying mortgage risk have been included in the inputs and ranges provided for commercial mortgage-backed securities and loans.
|
|
(c)
|
As of
June 30, 2013
,
$731 million
of private equity fund exposure was carried at a discount to net asset value per share.
|
|
(d)
|
Long-term debt, other borrowed funds and deposits include structured notes issued by the Firm that are predominantly financial instruments containing embedded derivatives. The estimation of the fair value of structured notes is predominantly based on the derivative features embedded within the instruments. The significant unobservable inputs are broadly consistent with those presented for derivative receivables.
|
|
(e)
|
The range has not been disclosed due to the wide range of possible values given the diverse nature of the underlying investments.
|
118
Changes in and ranges of unobservable inputs
For a discussion of the impact on fair value of changes in unobservable inputs and the relationships between unobservable inputs as well as a description of attributes of the underlying instruments and external market factors that affect the range of inputs used in the valuation of the Firm’s positions see Note 3 on pages 196–214 of JPMorgan Chase’s 2012 Annual Report.
Changes in level 3 recurring fair value measurements
The following tables include a rollforward of the Consolidated Balance Sheets amounts (including changes in fair value) for financial instruments classified by the Firm within level 3 of the fair value hierarchy for the three and six months ended
June 30, 2013
and 2012. When a determination is made to classify a financial instrument within level 3, the determination is based on the
significance of the unobservable parameters to the overall fair value measurement. However, level 3 financial instruments typically include, in addition to the unobservable or level 3 components, observable components (that is, components that are actively quoted and can be validated to external sources); accordingly, the gains and losses in the table below include changes in fair value due in part to observable factors that are part of the valuation methodology. Also, the Firm risk-manages the observable components of level 3 financial instruments using securities and derivative positions that are classified within level 1 or 2 of the fair value hierarchy; as these level 1 and level 2 risk management instruments are not included below, the gains or losses in the following tables do not reflect the effect of the Firm’s risk management activities related to such level 3 instruments.
119
|
Fair value measurements using significant unobservable inputs
|
|||||||||||||||||||||||||||||||
|
Three months ended
June 30, 2013
(in millions)
|
Fair value at April 1, 2013
|
Total realized/unrealized gains/(losses)
|
Transfers into and/or out of level 3
(h)
|
Fair value at
June 30, 2013
|
Change in unrealized gains/(losses) related to financial instruments held at June 30, 2013
|
||||||||||||||||||||||||||
|
Purchases
(g)
|
Sales
|
Settlements
|
|||||||||||||||||||||||||||||
|
Assets:
|
|||||||||||||||||||||||||||||||
|
Trading assets:
|
|||||||||||||||||||||||||||||||
|
Debt instruments:
|
|||||||||||||||||||||||||||||||
|
Mortgage-backed securities:
|
|||||||||||||||||||||||||||||||
|
U.S. government agencies
|
$
|
819
|
|
$
|
106
|
|
$
|
2
|
|
$
|
—
|
|
$
|
(26
|
)
|
$
|
—
|
|
$
|
901
|
|
$
|
114
|
|
|||||||
|
Residential – nonagency
|
633
|
|
203
|
|
135
|
|
(336
|
)
|
(20
|
)
|
—
|
|
615
|
|
135
|
|
|||||||||||||||
|
Commercial – nonagency
|
1,151
|
|
(39
|
)
|
302
|
|
(113
|
)
|
(30
|
)
|
—
|
|
1,271
|
|
(49
|
)
|
|||||||||||||||
|
Total mortgage-backed securities
|
2,603
|
|
270
|
|
439
|
|
(449
|
)
|
(76
|
)
|
—
|
|
2,787
|
|
200
|
|
|||||||||||||||
|
Obligations of U.S. states and municipalities
|
1,432
|
|
(23
|
)
|
52
|
|
(37
|
)
|
(203
|
)
|
—
|
|
1,221
|
|
(22
|
)
|
|||||||||||||||
|
Non-U.S. government debt securities
|
85
|
|
9
|
|
333
|
|
(397
|
)
|
(4
|
)
|
110
|
|
136
|
|
11
|
|
|||||||||||||||
|
Corporate debt securities
|
4,852
|
|
(41
|
)
|
2,251
|
|
(955
|
)
|
(822
|
)
|
450
|
|
5,735
|
|
28
|
|
|||||||||||||||
|
Loans
|
10,032
|
|
41
|
|
3,782
|
|
(2,265
|
)
|
(688
|
)
|
38
|
|
10,940
|
|
21
|
|
|||||||||||||||
|
Asset-backed securities
|
1,579
|
|
95
|
|
444
|
|
(557
|
)
|
(12
|
)
|
(121
|
)
|
1,428
|
|
56
|
|
|||||||||||||||
|
Total debt instruments
|
20,583
|
|
351
|
|
7,301
|
|
(4,660
|
)
|
(1,805
|
)
|
477
|
|
22,247
|
|
294
|
|
|||||||||||||||
|
Equity securities
|
1,172
|
|
(10
|
)
|
111
|
|
(57
|
)
|
(56
|
)
|
(121
|
)
|
1,039
|
|
(8
|
)
|
|||||||||||||||
|
Physical commodities
|
—
|
|
—
|
|
—
|
|
—
|
|
—
|
|
16
|
|
|
16
|
|
|
—
|
|
|||||||||||||
|
Other
|
948
|
|
43
|
|
54
|
|
(18
|
)
|
(52
|
)
|
130
|
|
1,105
|
|
38
|
|
|||||||||||||||
|
Total trading assets – debt and equity instruments
|
22,703
|
|
384
|
|
(c)
|
7,466
|
|
(4,735
|
)
|
(1,913
|
)
|
502
|
|
24,407
|
|
324
|
|
(c)
|
|||||||||||||
|
Net derivative receivables:
(a)
|
|||||||||||||||||||||||||||||||
|
Interest rate
|
2,791
|
|
125
|
|
46
|
|
(63
|
)
|
(989
|
)
|
191
|
|
2,101
|
|
156
|
|
|||||||||||||||
|
Credit
|
1,317
|
|
(335
|
)
|
3
|
|
(1
|
)
|
(76
|
)
|
13
|
|
921
|
|
(360
|
)
|
|||||||||||||||
|
Foreign exchange
|
(1,516
|
)
|
161
|
|
8
|
|
—
|
|
137
|
|
(8
|
)
|
(1,218
|
)
|
71
|
|
|||||||||||||||
|
Equity
|
(1,000
|
)
|
(350
|
)
|
1,024
|
|
(1,100
|
)
|
(588
|
)
|
(277
|
)
|
(2,291
|
)
|
654
|
|
|||||||||||||||
|
Commodity
|
182
|
|
295
|
|
—
|
|
—
|
|
(412
|
)
|
6
|
|
71
|
|
63
|
|
|||||||||||||||
|
Total net derivative receivables
|
1,774
|
|
(104
|
)
|
(c)
|
1,081
|
|
(1,164
|
)
|
(1,928
|
)
|
(75
|
)
|
(416
|
)
|
584
|
|
(c)
|
|||||||||||||
|
Available-for-sale securities:
|
|||||||||||||||||||||||||||||||
|
Asset-backed securities
|
1,130
|
|
—
|
|
—
|
|
—
|
|
(5
|
)
|
—
|
|
1,125
|
|
—
|
|
|||||||||||||||
|
Other
|
837
|
|
—
|
|
7
|
|
—
|
|
(20
|
)
|
—
|
|
824
|
|
—
|
|
|||||||||||||||
|
Total available-for-sale securities
|
1,967
|
|
—
|
|
(d)
|
7
|
|
—
|
|
(25
|
)
|
—
|
|
1,949
|
|
—
|
|
(d)
|
|||||||||||||
|
Loans
|
2,064
|
|
6
|
|
(c)
|
103
|
|
(7
|
)
|
(323
|
)
|
—
|
|
1,843
|
|
9
|
|
(c)
|
|||||||||||||
|
Mortgage servicing rights
|
7,949
|
|
1,038
|
|
(e)
|
655
|
|
(19
|
)
|
(288
|
)
|
—
|
|
9,335
|
|
1,038
|
|
(e)
|
|||||||||||||
|
Other assets:
|
|||||||||||||||||||||||||||||||
|
Private equity investments
|
6,831
|
|
434
|
|
(c)
|
122
|
|
(7
|
)
|
(275
|
)
|
—
|
|
7,105
|
|
206
|
|
(c)
|
|||||||||||||
|
All other
|
3,985
|
|
1
|
|
(f)
|
83
|
|
(292
|
)
|
(97
|
)
|
—
|
|
3,680
|
|
(11
|
)
|
(f)
|
|||||||||||||
|
Fair value measurements using significant unobservable inputs
|
|||||||||||||||||||||||||||||||
|
Three months ended
June 30, 2013
(in millions)
|
Fair value at April 1, 2013
|
Total realized/unrealized (gains)/losses
|
Transfers into and/or out of level 3
(h)
|
Fair value at
June 30, 2013
|
Change in unrealized (gains)/losses related to financial instruments held at June 30, 2013
|
||||||||||||||||||||||||||
|
Purchases
(g)
|
Sales
|
Issuances
|
Settlements
|
||||||||||||||||||||||||||||
|
Liabilities:
(b)
|
|||||||||||||||||||||||||||||||
|
Deposits
|
$
|
2,015
|
|
$
|
(110
|
)
|
(c)
|
$
|
—
|
|
$
|
—
|
|
$
|
316
|
|
$
|
(44
|
)
|
$
|
13
|
|
$
|
2,190
|
|
$
|
(110
|
)
|
(c)
|
||
|
Other borrowed funds
|
2,137
|
|
(243
|
)
|
(c)
|
—
|
|
—
|
|
2,389
|
|
(1,695
|
)
|
85
|
|
2,673
|
|
33
|
|
(c)
|
|||||||||||
|
Trading liabilities – debt and equity instruments
|
251
|
|
(60
|
)
|
(c)
|
(374
|
)
|
454
|
|
—
|
|
(21
|
)
|
(146
|
)
|
104
|
|
(48
|
)
|
(c)
|
|||||||||||
|
Accounts payable and other liabilities
|
33
|
|
—
|
|
—
|
|
—
|
|
—
|
|
(1
|
)
|
—
|
|
32
|
|
—
|
|
|||||||||||||
|
Beneficial interests issued by consolidated VIEs
|
818
|
|
59
|
|
(c)
|
—
|
|
—
|
|
30
|
|
(44
|
)
|
—
|
|
863
|
|
54
|
|
(c)
|
|||||||||||
|
Long-term debt
|
9,084
|
|
(430
|
)
|
(c)
|
—
|
|
—
|
|
1,878
|
|
(1,246
|
)
|
(84
|
)
|
9,202
|
|
(292
|
)
|
(c)
|
|||||||||||
120
|
Fair value measurements using significant unobservable inputs
|
|||||||||||||||||||||||||||||||
|
Three months ended
June 30, 2012
(in millions)
|
Fair value at April 1, 2012
|
Total realized/unrealized gains/(losses)
|
Transfers into and/or out of level 3
(h)
|
Fair value at
June 30, 2012
|
Change in unrealized gains/(losses) related to financial instruments held at June 30, 2012
|
||||||||||||||||||||||||||
|
Purchases
(g)
|
Sales
|
Settlements
|
|||||||||||||||||||||||||||||
|
Assets:
|
|||||||||||||||||||||||||||||||
|
Trading assets:
|
|||||||||||||||||||||||||||||||
|
Debt instruments:
|
|||||||||||||||||||||||||||||||
|
Mortgage-backed securities:
|
|||||||||||||||||||||||||||||||
|
U.S. government agencies
|
$
|
79
|
|
$
|
(9
|
)
|
$
|
—
|
|
$
|
—
|
|
$
|
—
|
|
$
|
—
|
|
$
|
70
|
|
$
|
(4
|
)
|
|||||||
|
Residential – nonagency
|
699
|
|
19
|
|
87
|
|
(95
|
)
|
(39
|
)
|
—
|
|
671
|
|
3
|
|
|||||||||||||||
|
Commercial – nonagency
|
1,451
|
|
30
|
|
18
|
|
(89
|
)
|
(44
|
)
|
(9
|
)
|
1,357
|
|
21
|
|
|||||||||||||||
|
Total mortgage-backed securities
|
2,229
|
|
40
|
|
105
|
|
(184
|
)
|
(83
|
)
|
(9
|
)
|
2,098
|
|
20
|
|
|||||||||||||||
|
Obligations of U.S. states and municipalities
|
1,747
|
|
6
|
|
9
|
|
(303
|
)
|
—
|
|
—
|
|
1,459
|
|
—
|
|
|||||||||||||||
|
Non-U.S. government debt securities
|
81
|
|
(5
|
)
|
138
|
|
(129
|
)
|
(15
|
)
|
—
|
|
70
|
|
—
|
|
|||||||||||||||
|
Corporate debt securities
|
5,463
|
|
(53
|
)
|
1,620
|
|
(1,436
|
)
|
(238
|
)
|
(122
|
)
|
5,234
|
|
92
|
|
|||||||||||||||
|
Loans
|
11,144
|
|
139
|
|
1,312
|
|
(619
|
)
|
(985
|
)
|
(76
|
)
|
10,915
|
|
36
|
|
|||||||||||||||
|
Asset-backed securities
|
7,434
|
|
(218
|
)
|
454
|
|
(673
|
)
|
(187
|
)
|
(1
|
)
|
6,809
|
|
(235
|
)
|
|||||||||||||||
|
Total debt instruments
|
28,098
|
|
(91
|
)
|
3,638
|
|
(3,344
|
)
|
(1,508
|
)
|
(208
|
)
|
26,585
|
|
(87
|
)
|
|||||||||||||||
|
Equity securities
|
1,248
|
|
(70
|
)
|
90
|
|
(30
|
)
|
—
|
|
(2
|
)
|
1,236
|
|
(32
|
)
|
|||||||||||||||
|
Other
|
993
|
|
1
|
|
15
|
|
(4
|
)
|
(50
|
)
|
—
|
|
955
|
|
1
|
|
|||||||||||||||
|
Total trading assets – debt and equity instruments
|
30,339
|
|
(160
|
)
|
(c)
|
3,743
|
|
(3,378
|
)
|
(1,558
|
)
|
(210
|
)
|
28,776
|
|
(118
|
)
|
(c)
|
|||||||||||||
|
Net derivative receivables:
(a)
|
|||||||||||||||||||||||||||||||
|
Interest rate
|
3,238
|
|
2,027
|
|
191
|
|
(30
|
)
|
(1,711
|
)
|
(23
|
)
|
3,692
|
|
845
|
|
|||||||||||||||
|
Credit
|
4,808
|
|
168
|
|
26
|
|
(25
|
)
|
(530
|
)
|
1
|
|
4,448
|
|
249
|
|
|||||||||||||||
|
Foreign exchange
|
(1,060
|
)
|
(632
|
)
|
26
|
|
(20
|
)
|
201
|
|
(3
|
)
|
(1,488
|
)
|
(594
|
)
|
|||||||||||||||
|
Equity
|
(2,829
|
)
|
885
|
|
520
|
|
(695
|
)
|
108
|
|
28
|
|
(1,983
|
)
|
479
|
|
|||||||||||||||
|
Commodity
|
(600
|
)
|
(86
|
)
|
(14
|
)
|
71
|
|
622
|
|
24
|
|
17
|
|
(31
|
)
|
|||||||||||||||
|
Total net derivative receivables
|
3,557
|
|
2,362
|
|
(c)
|
749
|
|
(699
|
)
|
(1,310
|
)
|
27
|
|
4,686
|
|
948
|
|
(c)
|
|||||||||||||
|
Available-for-sale securities:
|
|||||||||||||||||||||||||||||||
|
Asset-backed securities
|
25,448
|
|
(339
|
)
|
1,849
|
|
(649
|
)
|
(617
|
)
|
—
|
|
25,692
|
|
(354
|
)
|
|||||||||||||||
|
Other
|
469
|
|
24
|
|
233
|
|
(93
|
)
|
(11
|
)
|
—
|
|
622
|
|
2
|
|
|||||||||||||||
|
Total available-for-sale securities
|
25,917
|
|
(315
|
)
|
(d)
|
2,082
|
|
(742
|
)
|
(628
|
)
|
—
|
|
26,314
|
|
(352
|
)
|
(d)
|
|||||||||||||
|
Loans
|
1,766
|
|
546
|
|
(c)
|
580
|
|
—
|
|
(372
|
)
|
—
|
|
2,520
|
|
536
|
|
(c)
|
|||||||||||||
|
Mortgage servicing rights
|
8,039
|
|
(1,119
|
)
|
(e)
|
526
|
|
—
|
|
(328
|
)
|
—
|
|
7,118
|
|
(1,119
|
)
|
(e)
|
|||||||||||||
|
Other assets:
|
|||||||||||||||||||||||||||||||
|
Private equity investments
|
6,739
|
|
35
|
|
(c)
|
348
|
|
(6
|
)
|
(368
|
)
|
(46
|
)
|
6,702
|
|
305
|
|
(c)
|
|||||||||||||
|
All other
|
4,397
|
|
(59
|
)
|
(f)
|
276
|
|
(73
|
)
|
(93
|
)
|
—
|
|
4,448
|
|
(52
|
)
|
(f)
|
|||||||||||||
|
Fair value measurements using significant unobservable inputs
|
|||||||||||||||||||||||||||||||
|
Three months ended
June 30, 2012
(in millions)
|
Fair value at April 1, 2012
|
Total realized/unrealized (gains)/losses
|
Transfers into and/or out of level 3
(h)
|
Fair value at
June 30, 2012
|
Change in unrealized (gains)/losses related to financial instruments held at June 30, 2012
|
||||||||||||||||||||||||||
|
Purchases
(g)
|
Sales
|
Issuances
|
Settlements
|
||||||||||||||||||||||||||||
|
Liabilities:
(b)
|
|||||||||||||||||||||||||||||||
|
Deposits
|
$
|
1,651
|
|
$
|
35
|
|
(c)
|
$
|
—
|
|
$
|
—
|
|
$
|
357
|
|
$
|
(96
|
)
|
$
|
(71
|
)
|
$
|
1,876
|
|
$
|
34
|
|
(c)
|
||
|
Other borrowed funds
|
1,233
|
|
(205
|
)
|
(c)
|
—
|
|
—
|
|
425
|
|
(333
|
)
|
(13
|
)
|
1,107
|
|
(161
|
)
|
(c)
|
|||||||||||
|
Trading liabilities – debt and equity instruments
|
273
|
|
(2
|
)
|
(c)
|
(695
|
)
|
806
|
|
—
|
|
(17
|
)
|
(5
|
)
|
360
|
|
(3
|
)
|
(c)
|
|||||||||||
|
Accounts payable and other liabilities
|
46
|
|
—
|
|
—
|
|
—
|
|
—
|
|
(4
|
)
|
—
|
|
42
|
|
—
|
|
|||||||||||||
|
Beneficial interests issued by consolidated VIEs
|
841
|
|
2
|
|
(c)
|
—
|
|
—
|
|
18
|
|
(116
|
)
|
—
|
|
745
|
|
3
|
|
(c)
|
|||||||||||
|
Long-term debt
|
9,553
|
|
(191
|
)
|
(c)
|
—
|
|
—
|
|
750
|
|
(779
|
)
|
(477
|
)
|
8,856
|
|
(133
|
)
|
(c)
|
|||||||||||
121
|
Fair value measurements using significant unobservable inputs
|
|||||||||||||||||||||||||||||||
|
Six months ended
June 30, 2013
(in millions)
|
Fair value at January 1, 2013
|
Total realized/unrealized gains/(losses)
|
Transfers into and/or out of level 3
(h)
|
Fair value at
June 30, 2013
|
Change in unrealized gains/(losses) related to financial instruments held at June 30, 2013
|
||||||||||||||||||||||||||
|
Purchases
(g)
|
Sales
|
Settlements
|
|||||||||||||||||||||||||||||
|
Assets:
|
|||||||||||||||||||||||||||||||
|
Trading assets:
|
|||||||||||||||||||||||||||||||
|
Debt instruments:
|
|||||||||||||||||||||||||||||||
|
Mortgage-backed securities:
|
|||||||||||||||||||||||||||||||
|
U.S. government agencies
|
$
|
498
|
|
$
|
140
|
|
$
|
393
|
|
$
|
(79
|
)
|
$
|
(51
|
)
|
$
|
—
|
|
$
|
901
|
|
$
|
153
|
|
|||||||
|
Residential – nonagency
|
663
|
|
312
|
|
434
|
|
(740
|
)
|
(49
|
)
|
(5
|
)
|
615
|
|
177
|
|
|||||||||||||||
|
Commercial – nonagency
|
1,207
|
|
(125
|
)
|
439
|
|
(178
|
)
|
(72
|
)
|
—
|
|
1,271
|
|
(142
|
)
|
|||||||||||||||
|
Total mortgage-backed securities
|
2,368
|
|
327
|
|
1,266
|
|
(997
|
)
|
(172
|
)
|
(5
|
)
|
2,787
|
|
188
|
|
|||||||||||||||
|
Obligations of U.S. states and municipalities
|
1,436
|
|
18
|
|
53
|
|
(83
|
)
|
(203
|
)
|
—
|
|
1,221
|
|
17
|
|
|||||||||||||||
|
Non-U.S. government debt securities
|
67
|
|
11
|
|
634
|
|
(682
|
)
|
(4
|
)
|
110
|
|
136
|
|
11
|
|
|||||||||||||||
|
Corporate debt securities
|
5,308
|
|
(124
|
)
|
5,178
|
|
(3,518
|
)
|
(1,447
|
)
|
338
|
|
5,735
|
|
30
|
|
|||||||||||||||
|
Loans
|
10,787
|
|
(131
|
)
|
5,408
|
|
(3,750
|
)
|
(1,391
|
)
|
17
|
|
10,940
|
|
(229
|
)
|
|||||||||||||||
|
Asset-backed securities
|
3,696
|
|
159
|
|
1,040
|
|
(1,534
|
)
|
(147
|
)
|
(1,786
|
)
|
1,428
|
|
74
|
|
|||||||||||||||
|
Total debt instruments
|
23,662
|
|
260
|
|
13,579
|
|
(10,564
|
)
|
(3,364
|
)
|
(1,326
|
)
|
22,247
|
|
91
|
|
|||||||||||||||
|
Equity securities
|
1,114
|
|
(9
|
)
|
204
|
|
(148
|
)
|
(65
|
)
|
(57
|
)
|
1,039
|
|
(28
|
)
|
|||||||||||||||
|
Physical commodities
|
—
|
|
—
|
|
—
|
|
—
|
|
—
|
|
16
|
|
16
|
|
—
|
|
|||||||||||||||
|
Other
|
863
|
|
87
|
|
126
|
|
(20
|
)
|
(81
|
)
|
130
|
|
1,105
|
|
139
|
|
|||||||||||||||
|
Total trading assets – debt and equity instruments
|
25,639
|
|
338
|
|
(c)
|
13,909
|
|
(10,732
|
)
|
(3,510
|
)
|
(1,237
|
)
|
24,407
|
|
202
|
|
(c)
|
|||||||||||||
|
Net derivative receivables
(a)
:
|
|||||||||||||||||||||||||||||||
|
Interest rate
|
3,322
|
|
431
|
|
115
|
|
(125
|
)
|
(1,847
|
)
|
205
|
|
2,101
|
|
45
|
|
|||||||||||||||
|
Credit
|
1,873
|
|
(824
|
)
|
50
|
|
(1
|
)
|
(189
|
)
|
12
|
|
921
|
|
(836
|
)
|
|||||||||||||||
|
Foreign exchange
|
(1,750
|
)
|
45
|
|
(7
|
)
|
(3
|
)
|
513
|
|
(16
|
)
|
(1,218
|
)
|
(5
|
)
|
|||||||||||||||
|
Equity
|
(1,806
|
)
|
513
|
|
1,221
|
|
(1,306
|
)
|
(810
|
)
|
(103
|
)
|
(2,291
|
)
|
604
|
|
|||||||||||||||
|
Commodity
|
254
|
|
653
|
|
11
|
|
(3
|
)
|
(854
|
)
|
10
|
|
71
|
|
240
|
|
|||||||||||||||
|
Total net derivative receivables
|
1,893
|
|
818
|
|
(c)
|
1,390
|
|
(1,438
|
)
|
(3,187
|
)
|
108
|
|
(416
|
)
|
48
|
|
(c)
|
|||||||||||||
|
Available-for-sale securities:
|
|||||||||||||||||||||||||||||||
|
Asset-backed securities
|
28,024
|
|
5
|
|
400
|
|
—
|
|
(44
|
)
|
(27,260
|
)
|
1,125
|
|
5
|
|
|||||||||||||||
|
Other
|
892
|
|
(9
|
)
|
7
|
|
(13
|
)
|
(53
|
)
|
—
|
|
824
|
|
3
|
|
|||||||||||||||
|
Total available-for-sale securities
|
28,916
|
|
(4
|
)
|
(d)
|
407
|
|
(13
|
)
|
(97
|
)
|
(27,260
|
)
|
1,949
|
|
8
|
|
(d)
|
|||||||||||||
|
Loans
|
2,282
|
|
(29
|
)
|
(c)
|
328
|
|
(56
|
)
|
(682
|
)
|
—
|
|
1,843
|
|
(43
|
)
|
(c)
|
|||||||||||||
|
Mortgage servicing rights
|
7,614
|
|
1,347
|
|
(e)
|
1,339
|
|
(418
|
)
|
(547
|
)
|
—
|
|
9,335
|
|
1,347
|
|
(e)
|
|||||||||||||
|
Other assets:
|
|||||||||||||||||||||||||||||||
|
Private equity investments
|
7,181
|
|
165
|
|
(c)
|
203
|
|
(103
|
)
|
(341
|
)
|
—
|
|
7,105
|
|
(188
|
)
|
(c)
|
|||||||||||||
|
All other
|
4,258
|
|
(25
|
)
|
(f)
|
135
|
|
(295
|
)
|
(393
|
)
|
—
|
|
3,680
|
|
(41
|
)
|
(f)
|
|||||||||||||
|
Fair value measurements using significant unobservable inputs
|
|||||||||||||||||||||||||||||||
|
Six months ended
June 30, 2013
(in millions)
|
Fair value at January 1, 2013
|
Total realized/unrealized (gains)/losses
|
Transfers into and/or out of level 3
(h)
|
Fair value at
June 30, 2013
|
Change in unrealized (gains)/losses related to financial instruments held at June 30, 2013
|
||||||||||||||||||||||||||
|
Purchases
(g)
|
Sales
|
Issuances
|
Settlements
|
||||||||||||||||||||||||||||
|
Liabilities:
(b)
|
|||||||||||||||||||||||||||||||
|
Deposits
|
$
|
1,983
|
|
$
|
(105
|
)
|
(c)
|
$
|
—
|
|
$
|
—
|
|
$
|
612
|
|
$
|
(157
|
)
|
$
|
(143
|
)
|
$
|
2,190
|
|
$
|
(97
|
)
|
(c)
|
||
|
Other borrowed funds
|
1,619
|
|
(269
|
)
|
(c)
|
—
|
|
—
|
|
4,151
|
|
(2,919
|
)
|
91
|
|
2,673
|
|
74
|
|
(c)
|
|||||||||||
|
Trading liabilities – debt and equity instruments
|
205
|
|
(68
|
)
|
(c)
|
(1,859
|
)
|
2,006
|
|
—
|
|
(34
|
)
|
(146
|
)
|
104
|
|
(78
|
)
|
(c)
|
|||||||||||
|
Accounts payable and other liabilities
|
36
|
|
1
|
|
(f)
|
—
|
|
—
|
|
—
|
|
(5
|
)
|
—
|
|
32
|
|
1
|
|
(f)
|
|||||||||||
|
Beneficial interests issued by consolidated VIEs
|
925
|
|
25
|
|
(c)
|
—
|
|
—
|
|
51
|
|
(138
|
)
|
—
|
|
863
|
|
26
|
|
(c)
|
|||||||||||
|
Long-term debt
|
8,476
|
|
(905
|
)
|
(c)
|
—
|
|
—
|
|
3,733
|
|
(1,603
|
)
|
(499
|
)
|
9,202
|
|
(321
|
)
|
(c)
|
|||||||||||
122
|
Fair value measurements using significant unobservable inputs
|
|||||||||||||||||||||||||||||||
|
Six months ended
June 30, 2012
(in millions)
|
Fair value at January 1, 2012
|
Total realized/unrealized gains/(losses)
|
Transfers into and/or out of level 3
(h)
|
Fair value at
June 30, 2012
|
Change in unrealized gains/(losses) related to financial instruments held at June 30, 2012
|
||||||||||||||||||||||||||
|
Purchases
(g)
|
Sales
|
Settlements
|
|||||||||||||||||||||||||||||
|
Assets:
|
|||||||||||||||||||||||||||||||
|
Trading assets:
|
|||||||||||||||||||||||||||||||
|
Debt instruments:
|
|||||||||||||||||||||||||||||||
|
Mortgage-backed securities:
|
|||||||||||||||||||||||||||||||
|
U.S. government agencies
|
$
|
86
|
|
$
|
(21
|
)
|
$
|
5
|
|
$
|
—
|
|
$
|
—
|
|
$
|
—
|
|
$
|
70
|
|
$
|
(8
|
)
|
|||||||
|
Residential – nonagency
|
796
|
|
51
|
|
179
|
|
(258
|
)
|
(75
|
)
|
(22
|
)
|
671
|
|
27
|
|
|||||||||||||||
|
Commercial – nonagency
|
1,758
|
|
(47
|
)
|
130
|
|
(329
|
)
|
(55
|
)
|
(100
|
)
|
1,357
|
|
(55
|
)
|
|||||||||||||||
|
Total mortgage-backed securities
|
2,640
|
|
(17
|
)
|
314
|
|
(587
|
)
|
(130
|
)
|
(122
|
)
|
2,098
|
|
(36
|
)
|
|||||||||||||||
|
Obligations of U.S. states and municipalities
|
1,619
|
|
(1
|
)
|
329
|
|
(484
|
)
|
(4
|
)
|
—
|
|
1,459
|
|
—
|
|
|||||||||||||||
|
Non-U.S. government debt securities
|
104
|
|
3
|
|
343
|
|
(360
|
)
|
(20
|
)
|
—
|
|
70
|
|
4
|
|
|||||||||||||||
|
Corporate debt securities
|
6,373
|
|
205
|
|
3,936
|
|
(2,705
|
)
|
(2,205
|
)
|
(370
|
)
|
5,234
|
|
187
|
|
|||||||||||||||
|
Loans
|
12,209
|
|
295
|
|
2,213
|
|
(1,292
|
)
|
(1,930
|
)
|
(580
|
)
|
10,915
|
|
189
|
|
|||||||||||||||
|
Asset-backed securities
|
7,965
|
|
12
|
|
1,278
|
|
(1,934
|
)
|
(513
|
)
|
1
|
|
6,809
|
|
(52
|
)
|
|||||||||||||||
|
Total debt instruments
|
30,910
|
|
497
|
|
8,413
|
|
(7,362
|
)
|
(4,802
|
)
|
(1,071
|
)
|
26,585
|
|
292
|
|
|||||||||||||||
|
Equity securities
|
1,177
|
|
(77
|
)
|
112
|
|
(57
|
)
|
(13
|
)
|
94
|
|
1,236
|
|
(54
|
)
|
|||||||||||||||
|
Other
|
880
|
|
154
|
|
50
|
|
(48
|
)
|
(81
|
)
|
—
|
|
955
|
|
158
|
|
|||||||||||||||
|
Total trading assets – debt and equity instruments
|
32,967
|
|
574
|
|
(c)
|
8,575
|
|
(7,467
|
)
|
(4,896
|
)
|
(977
|
)
|
28,776
|
|
396
|
|
(c)
|
|||||||||||||
|
Net derivative receivables
(a)
:
|
|||||||||||||||||||||||||||||||
|
Interest rate
|
3,561
|
|
3,355
|
|
300
|
|
(98
|
)
|
(3,055
|
)
|
(371
|
)
|
3,692
|
|
828
|
|
|||||||||||||||
|
Credit
|
7,732
|
|
(2,186
|
)
|
104
|
|
(43
|
)
|
(1,160
|
)
|
1
|
|
4,448
|
|
(1,880
|
)
|
|||||||||||||||
|
Foreign exchange
|
(1,263
|
)
|
(505
|
)
|
45
|
|
(178
|
)
|
419
|
|
(6
|
)
|
(1,488
|
)
|
(505
|
)
|
|||||||||||||||
|
Equity
|
(3,105
|
)
|
165
|
|
853
|
|
(1,078
|
)
|
99
|
|
1,083
|
|
(1,983
|
)
|
(405
|
)
|
|||||||||||||||
|
Commodity
|
(687
|
)
|
(80
|
)
|
39
|
|
65
|
|
645
|
|
35
|
|
17
|
|
(124
|
)
|
|||||||||||||||
|
Total net derivative receivables
|
6,238
|
|
749
|
|
(c)
|
1,341
|
|
(1,332
|
)
|
(3,052
|
)
|
742
|
|
4,686
|
|
(2,086
|
)
|
(c)
|
|||||||||||||
|
Available-for-sale securities:
|
|||||||||||||||||||||||||||||||
|
Asset-backed securities
|
24,958
|
|
(336
|
)
|
3,170
|
|
(1,147
|
)
|
(1,069
|
)
|
116
|
|
25,692
|
|
(355
|
)
|
|||||||||||||||
|
Other
|
528
|
|
32
|
|
261
|
|
(113
|
)
|
(86
|
)
|
—
|
|
622
|
|
7
|
|
|||||||||||||||
|
Total available-for-sale securities
|
25,486
|
|
(304
|
)
|
(d)
|
3,431
|
|
(1,260
|
)
|
(1,155
|
)
|
116
|
|
26,314
|
|
(348
|
)
|
(d)
|
|||||||||||||
|
Loans
|
1,647
|
|
576
|
|
(c)
|
707
|
|
—
|
|
(491
|
)
|
81
|
|
2,520
|
|
563
|
|
(c)
|
|||||||||||||
|
Mortgage servicing rights
|
7,223
|
|
(523
|
)
|
(e)
|
1,099
|
|
—
|
|
(681
|
)
|
—
|
|
7,118
|
|
(523
|
)
|
(e)
|
|||||||||||||
|
Other assets:
|
|||||||||||||||||||||||||||||||
|
Private equity investments
|
6,751
|
|
287
|
|
(c)
|
459
|
|
(242
|
)
|
(507
|
)
|
(46
|
)
|
6,702
|
|
436
|
|
(c)
|
|||||||||||||
|
All other
|
4,374
|
|
(223
|
)
|
(f)
|
632
|
|
(92
|
)
|
(243
|
)
|
—
|
|
4,448
|
|
(218
|
)
|
(f)
|
|||||||||||||
|
Fair value measurements using significant unobservable inputs
|
|||||||||||||||||||||||||||||||
|
Six months ended
June 30, 2012
(in millions)
|
Fair value at January 1, 2012
|
Total realized/unrealized (gains)/losses
|
Transfers into and/or out of level 3
(h)
|
Fair value at
June 30, 2012
|
Change in unrealized (gains)/losses related to financial instruments held at June 30, 2012
|
||||||||||||||||||||||||||
|
Purchases
(g)
|
Sales
|
Issuances
|
Settlements
|
||||||||||||||||||||||||||||
|
Liabilities:
(b)
|
|||||||||||||||||||||||||||||||
|
Deposits
|
$
|
1,418
|
|
$
|
166
|
|
(c)
|
$
|
—
|
|
$
|
—
|
|
$
|
708
|
|
$
|
(232
|
)
|
$
|
(184
|
)
|
$
|
1,876
|
|
$
|
155
|
|
(c)
|
||
|
Other borrowed funds
|
1,507
|
|
(9
|
)
|
(c)
|
—
|
|
—
|
|
809
|
|
(1,178
|
)
|
(22
|
)
|
1,107
|
|
(38
|
)
|
(c)
|
|||||||||||
|
Trading liabilities – debt and equity instruments
|
211
|
|
(17
|
)
|
(c)
|
(1,400
|
)
|
1,599
|
|
—
|
|
(28
|
)
|
(5
|
)
|
360
|
|
(3
|
)
|
(c)
|
|||||||||||
|
Accounts payable and other liabilities
|
51
|
|
—
|
|
—
|
|
—
|
|
—
|
|
(9
|
)
|
—
|
|
42
|
|
—
|
|
|||||||||||||
|
Beneficial interests issued by consolidated VIEs
|
791
|
|
47
|
|
(c)
|
—
|
|
—
|
|
54
|
|
(147
|
)
|
—
|
|
745
|
|
12
|
|
(c)
|
|||||||||||
|
Long-term debt
|
10,310
|
|
(52
|
)
|
(c)
|
—
|
|
—
|
|
1,874
|
|
(2,166
|
)
|
(1,110
|
)
|
8,856
|
|
20
|
|
(c)
|
|||||||||||
|
(a)
|
All level 3 derivatives are presented on a net basis, irrespective of the underlying counterparty.
|
|
(b)
|
Level 3 liabilities as a percentage of total Firm liabilities accounted for at fair value (including liabilities measured at fair value on a nonrecurring basis) were
16%
and
18%
at June 30, 2013, and December 31, 2012, respectively.
|
|
(c)
|
Predominantly reported in principal transactions revenue, except for changes in fair value for Consumer & Community Banking (“CCB”) mortgage loans and lending-related commitments originated with the intent to sell, which are reported in mortgage fees and related income.
|
123
|
(d)
|
Realized gains/(losses) on available-for-sale (“AFS”) securities, as well as other-than-temporary impairment losses that are recorded in earnings, are reported in securities gains. Unrealized gains/(losses) are reported in OCI. Realized gains/(losses) and foreign exchange remeasurement adjustments recorded in income on AFS securities were
$3 million
and
$(260) million
for the three months ended June 30, 2013 and 2012, and
$(15) million
and
$(164) million
for the six months ended June 30, 2013 and 2012, respectively. Unrealized gains/(losses) recorded on AFS securities in OCI were
$(3) million
and
$(55) million
for the three months ended June 30, 2013 and 2012, and
$11 million
and
$(140) million
for the six months ended June 30, 2013 and 2012, respectively.
|
|
(e)
|
Changes in fair value for CCB mortgage servicing rights are reported in mortgage fees and related income.
|
|
(f)
|
Predominantly reported in other income.
|
|
(g)
|
Loan originations are included in purchases.
|
|
(h)
|
All transfers into and/or out of level 3 are assumed to occur at the beginning of the quarterly reporting period in which they occur.
|
Level 3 analysis
Consolidated Balance Sheets changes
Level 3 assets (including assets measured at fair value on a nonrecurring basis) were
2.8%
of total Firm assets at June 30, 2013. The following describes significant changes to level 3 assets since December 31, 2012, for those items measured at fair value on a recurring basis. For further information on changes impacting items measured at fair value on a nonrecurring basis, see Assets and liabilities measured at fair value on a nonrecurring basis on page
125
of this Form 10-Q.
Three months ended June 30, 2013
Level 3 assets were
$65.7 billion
at June 30, 2013, reflecting a decrease of
$728 million
from March 31, 2013, due to the following:
|
•
|
$3.5 billion
decrease in derivative receivables largely driven by a
$1.1 billion
decrease in interest rate derivatives due to the increase in interest rates and a
$1.0 billion
decrease in equity derivatives due to settlements;
|
|
•
|
$1.7 billion
increase in trading assets - debt and equity instruments, largely driven by net purchases of trading loans and corporate debt securities;
|
|
•
|
$1.4 billion
increase in MSRs. For further discussion of the change, refer to Note 16 on pages
184–187
of this Form 10-Q.
|
Six months ended June 30, 2013
Level 3 assets decreased by
$32.4 billion
in the first six months of 2013, due to the following:
|
•
|
$26.9 billion
decrease in asset-backed AFS securities and a
$2.3 billion
decrease in asset-backed trading securities largely driven by transfers of highly rated CLOs from level 3 into level 2 during the first quarter of 2013, based on increased liquidity and price transparency;
|
|
•
|
$4.8 billion
decrease in derivative receivables largely driven by a
$2.1 billion
decrease from the impact of tightening reference entity credit spreads and risk reductions in credit derivatives, a
$1.5 billion
decrease in interest rate derivatives due to the increase in interest rates,
and
$1.0 billion
decrease in foreign exchange derivatives due to market movements;
|
|
•
|
$1.7 billion
increase in MSRs. For further discussion of the change, refer to Note 16 on pages
184–187
of this Form 10-Q.
|
Gains and losses
The following describes significant components of total realized/unrealized gains/(losses) for instruments measured at fair value on a recurring basis for the periods indicated. For further information on these instruments, see Changes in level 3 recurring fair value measurements rollforward tables on pages 120–123 of this Form 10-Q.
Three months ended June 30, 2013
|
•
|
$1.0 billion
of gains on MSRs. For further discussion of the change, refer to Note 16 on pages
184–187
of this Form 10-Q.
|
Three months ended June 30, 2012
|
•
|
$2.4 billion
of net gains on derivatives, largely related to gains in interest rate lock commitments due to increased volumes and declining interest rates; and
|
|
•
|
$1.1 billion
of losses on MSRs. For further discussion of the change, refer to Note 16 on pages
184–187
of this Form 10-Q.
|
Six months ended June 30, 2013
|
•
|
$1.3 billion
of gains on MSRs. For further discussion of the change, refer to Note 16 on pages
184–187
of this Form 10-Q.
|
|
•
|
$905 million
of gains on long-term debt, due to market movements.
|
Six months ended June 30, 2012
|
•
|
$749 million
of net gains on derivatives, driven by
$3.4 billion
of gains predominantly on interest rate lock commitments due to increased volumes and declining interest rates, partially offset by
$2.2 billion
of losses on credit derivatives largely as a result of tightening of reference entity credit spreads.
|
Credit adjustments
When determining the fair value of an instrument, it may be necessary to record adjustments to the Firm’s estimates of fair value in order to reflect the counterparty credit quality and Firm’s own creditworthiness:
|
•
|
Credit valuation adjustments (“CVA”) are taken to reflect the credit quality of a counterparty in the valuation of derivatives. CVA adjustments are necessary when the market price (or parameter) is not indicative of the credit quality of the counterparty. As few classes of derivative contracts are listed on an exchange, derivative positions are predominantly valued using models that use as their basis observable market parameters. An adjustment
|
124
therefore may be necessary to reflect the credit quality of each derivative counterparty to arrive at fair value.
The Firm estimates derivatives CVA using a scenario analysis to estimate the expected credit exposure across all of the Firm’s positions with each counterparty, and then estimates losses as a result of a counterparty credit event. The key inputs to this methodology are (i) the expected positive exposure to each counterparty based on a simulation that assumes the current population of existing derivatives with each counterparty remains unchanged and considers contractual factors designed to mitigate the Firm’s credit exposure, such as collateral and legal rights of offset, (ii) the probability of a default event occurring for each counterparty, as derived from observed or estimated credit default swap (“CDS”) spreads, and (iii) estimated recovery rates implied by CDS, adjusted to consider the differences in recovery rates as a derivative creditor relative to those reflected in CDS spreads, which generally reflect senior unsecured creditor risk.
|
•
|
Debit valuation adjustments (“DVA”) are taken to reflect the credit quality of the Firm in the valuation of liabilities measured at fair value. The DVA calculation methodology is generally consistent with the CVA methodology described above and incorporates JPMorgan Chase’s credit spread as observed through the CDS market to estimate the probability of default and loss given default as a result of a systemic event affecting the Firm. Structured notes DVA is estimated using the current fair value of the structured note as the exposure amount, and is otherwise consistent with the derivative DVA methodology.
|
The following table provides the credit adjustments, excluding the effect of any hedging activity, reflected within the Consolidated Balance Sheets as of the dates indicated.
|
(in millions)
|
Jun 30, 2013
|
Dec 31, 2012
|
|||||
|
Derivative receivables balance (net of derivatives CVA)
|
$
|
73,751
|
|
$
|
74,983
|
|
|
|
Derivatives CVA
(a)
|
(3,357
|
)
|
(4,238
|
)
|
|||
|
Derivative payables balance (net of derivatives DVA)
|
64,385
|
|
70,656
|
|
|||
|
Derivatives DVA
|
(929
|
)
|
(830
|
)
|
|||
|
Structured notes balance (net of structured notes DVA)
(b)(c)(d)
|
47,630
|
|
48,112
|
|
|||
|
Structured notes DVA
|
(2,094
|
)
|
(1,712
|
)
|
|||
|
(a)
|
Derivatives CVA, gross of hedges, includes results managed by the credit portfolio and other lines of business within the Corporate & Investment Bank (“CIB”).
|
|
(b)
|
Structured notes are predominantly financial instruments containing embedded derivatives. At June 30, 2013, and December 31, 2012, included within the balances above are $
871 million
and $
1.1 billion
, respectively, of plain vanilla financial instruments with fixed or floating rate coupons that are not indexed to an underlying that have been elected under the fair value option. For further information on fair value option see Note 4 on pages of 214–216 of JPMorgan Chase’s 2012 Annual Report.
|
|
(c)
|
Structured notes are recorded within long-term debt, other borrowed funds or deposits on the Consolidated Balance Sheets, depending upon their tenor and legal form.
|
|
(d)
|
Structured notes are measured at fair value based on the Firm’s election under the fair value option. For further information on these elections, see Note 4 on pages
128–130
of this Form 10-Q.
|
The following table provides the impact of credit adjustments on earnings in the respective periods, excluding the effect of any hedging activity.
|
Three months ended
June 30, |
Six months ended
June 30, |
||||||||||||||
|
(in millions)
|
2013
|
2012
|
2013
|
2012
|
|||||||||||
|
Credit adjustments:
|
|||||||||||||||
|
Derivative CVA
(a)
|
$
|
549
|
|
$
|
(410
|
)
|
$
|
881
|
|
$
|
1,051
|
|
|||
|
Derivative DVA
|
104
|
|
340
|
|
99
|
|
(99
|
)
|
|||||||
|
Structured note DVA
(b)
|
251
|
|
415
|
|
382
|
|
(53
|
)
|
|||||||
|
(a)
|
Derivatives CVA, gross of hedges, includes results managed by the credit portfolio and other lines of business within the CIB.
|
|
(b)
|
Structured notes are measured at fair value based on the Firm’s election under the fair value option. For further information on these elections, see Note 4 on pages
128–130
of this Form 10-Q.
|
Assets and liabilities measured at fair value on a nonrecurring basis
At
June 30, 2013
, assets measured at fair value on a nonrecurring basis were
$1.6 billion
and predominantly consisted of loans that had fair value adjustments in the first six months of 2013. At
December 31, 2012
, assets measured at fair value on a nonrecurring basis were
$5.1 billion
, comprised predominantly of loans that had fair value adjustments in the twelve months of 2012. At
June 30, 2013
,
$95 million
and
$1.5 billion
of these assets were classified in levels 2 and 3 of the fair value hierarchy, respectively. At
December 31, 2012
,
$667 million
and
$4.4 billion
of these assets were classified in levels 2 and 3 of the fair value hierarchy, respectively. Liabilities measured at fair value on a nonrecurring basis were not significant at
June 30, 2013
, and
December 31, 2012
. For the three and
six months ended
June 30, 2013
and 2012, there were no significant transfers between levels 1, 2, and 3.
Of the
$1.6 billion
of assets measured at fair value on a nonrecurring basis,
$1.2 billion
related to residential real estate loans measured at the net realizable value of the underlying collateral (i.e., collateral-dependent loans and other loans charged off in accordance with regulatory guidance). These amounts are classified as level 3, as they are valued using a broker’s price opinion and discounted based upon the Firm’s experience with actual liquidation values. These discounts to the broker price opinions ranged from
18%
to
59%
, with a weighted average of
29%
.
The total change in the recorded value of assets and liabilities for which a fair value adjustment has been included in the Consolidated Statements of Income for the three months ended
June 30, 2013
and 2012, related to financial instruments held at those dates, was a reduction of
$293 million
and
$514 million
, respectively; and for the six months ended June 30, 2013 and 2012, were losses of
$521 million
and
$881 million
, these reductions in recorded value were predominantly associated with loans.
For information about the measurement of impaired collateral-dependent loans, and other loans where the carrying value is based on the fair value of the underlying collateral (e.g., residential mortgage loans charged off in accordance with regulatory guidance), see Note 14 on pages 250–275 of JPMorgan Chase’s 2012 Annual Report.
125
Additional disclosures about the fair value of financial instruments that are not carried on the Consolidated Balance Sheets at fair value
The following table presents the carrying values and estimated fair values at
June 30, 2013
, and
December 31, 2012
, of financial assets and liabilities, excluding financial instruments which are carried at fair value on a recurring basis, and information is provided on their classification within the fair value hierarchy. For additional information regarding the financial instruments within the scope of this disclosure, and the methods and significant assumptions used to estimate their fair value, see Note 3 on pages 196–214 of JPMorgan Chase’s 2012 Annual Report.
|
June 30, 2013
|
December 31, 2012
|
||||||||||||||||||||||||||||||
|
Estimated fair value hierarchy
|
Estimated fair value hierarchy
|
||||||||||||||||||||||||||||||
|
(in billions)
|
Carrying
value
|
Level 1
|
Level 2
|
Level 3
|
Total estimated
fair value
|
Carrying
value
|
Level 1
|
Level 2
|
Level 3
|
Total estimated
fair value
|
|||||||||||||||||||||
|
Financial assets
|
|||||||||||||||||||||||||||||||
|
Cash and due from banks
|
$
|
29.2
|
|
$
|
29.2
|
|
$
|
—
|
|
$
|
—
|
|
$
|
29.2
|
|
$
|
53.7
|
|
$
|
53.7
|
|
$
|
—
|
|
$
|
—
|
|
$
|
53.7
|
|
|
|
Deposits with banks
|
311.3
|
|
303.9
|
|
7.4
|
|
—
|
|
311.3
|
|
121.8
|
|
114.1
|
|
7.7
|
|
—
|
|
121.8
|
|
|||||||||||
|
Accrued interest and accounts receivable
|
81.6
|
|
—
|
|
81.3
|
|
0.3
|
|
81.6
|
|
60.9
|
|
—
|
|
60.3
|
|
0.6
|
|
60.9
|
|
|||||||||||
|
Federal funds sold and securities purchased under resale agreements
|
227.2
|
|
—
|
|
227.2
|
|
—
|
|
227.2
|
|
272.0
|
|
—
|
|
272.0
|
|
—
|
|
272.0
|
|
|||||||||||
|
Securities borrowed
|
111.9
|
|
—
|
|
111.9
|
|
—
|
|
111.9
|
|
108.8
|
|
—
|
|
108.8
|
|
—
|
|
108.8
|
|
|||||||||||
|
Loans, net of allowance for loan losses
(a)
|
704.3
|
|
—
|
|
19.5
|
|
686.8
|
|
706.3
|
|
709.3
|
|
—
|
|
26.4
|
|
685.4
|
|
711.8
|
|
|||||||||||
|
Other
|
57.2
|
|
—
|
|
53.1
|
|
4.7
|
|
57.8
|
|
49.7
|
|
—
|
|
42.7
|
|
7.4
|
|
50.1
|
|
|||||||||||
|
Financial liabilities
|
|||||||||||||||||||||||||||||||
|
Deposits
|
$
|
1,197.1
|
|
$
|
—
|
|
$
|
1,196.2
|
|
$
|
1.2
|
|
$
|
1,197.4
|
|
$
|
1,187.9
|
|
$
|
—
|
|
$
|
1,187.2
|
|
$
|
1.2
|
|
$
|
1,188.4
|
|
|
|
Federal funds purchased and securities loaned or sold under repurchase agreements
|
254.3
|
|
—
|
|
254.3
|
|
—
|
|
254.3
|
|
235.7
|
|
—
|
|
235.7
|
|
—
|
|
235.7
|
|
|||||||||||
|
Commercial paper
|
56.6
|
|
—
|
|
56.6
|
|
—
|
|
56.6
|
|
55.4
|
|
—
|
|
55.4
|
|
—
|
|
55.4
|
|
|||||||||||
|
Other borrowed funds
|
17.8
|
|
—
|
|
17.8
|
|
—
|
|
17.8
|
|
15.0
|
|
—
|
|
15.0
|
|
—
|
|
15.0
|
|
|||||||||||
|
Accounts payable and other liabilities
|
178.0
|
|
—
|
|
176.4
|
|
1.7
|
|
178.1
|
|
156.5
|
|
—
|
|
153.8
|
|
2.5
|
|
156.3
|
|
|||||||||||
|
Beneficial interests issued by consolidated VIEs
|
54.0
|
|
—
|
|
49.9
|
|
4.0
|
|
53.9
|
|
62.0
|
|
—
|
|
57.7
|
|
4.4
|
|
62.1
|
|
|||||||||||
|
Long-term debt and junior subordinated deferrable interest debentures
|
237.0
|
|
—
|
|
238.2
|
|
5.5
|
|
243.7
|
|
218.2
|
|
—
|
|
220.0
|
|
5.4
|
|
225.4
|
|
|||||||||||
|
(a)
|
Fair value is typically estimated using a discounted cash flow model that incorporates the characteristics of the underlying loans (including principal, contractual interest rate and contractual fees) and other key inputs, including expected lifetime credit losses, interest rates, prepayment rates, and primary origination or secondary market spreads. For certain loans, the fair value is measured based on the value of the underlying collateral. The difference between the estimated fair value and carrying value of a financial asset or liability is the result of the different methodologies used to determine fair value as compared with carrying value. For example, credit losses are estimated for a financial asset’s remaining life in a fair value calculation but are estimated for a loss emergence period in the allowance for loan loss calculation; future loan income (interest and fees) is incorporated in a fair value calculation but is generally not considered in the allowance for loan losses. For a further discussion of the Firm’s methodologies for estimating the fair value of loans and lending-related commitments, see pages 196
–214 of JPMorgan Chase’s 2012 Annual Report and pages
114–127
of this Note.
|
126
The majority of the Firm’s lending-related commitments are not carried at fair value on a recurring basis on the Consolidated Balance Sheets, nor are they actively traded. The carrying value and estimated fair value of the Firm’s wholesale lending-related commitments were as follows for the periods indicated.
|
June 30, 2013
|
December 31, 2012
|
||||||||||||||||||||||||||||||
|
Estimated fair value hierarchy
|
Estimated fair value hierarchy
|
||||||||||||||||||||||||||||||
|
(in billions)
|
Carrying value
(a)
|
Level 1
|
Level 2
|
Level 3
|
Total estimated fair value
|
Carrying value
(a)
|
Level 1
|
Level 2
|
Level 3
|
Total estimated fair value
|
|||||||||||||||||||||
|
Wholesale lending-related commitments
|
$
|
0.7
|
|
$
|
—
|
|
$
|
—
|
|
$
|
1.4
|
|
$
|
1.4
|
|
$
|
0.7
|
|
$
|
—
|
|
$
|
—
|
|
$
|
1.9
|
|
$
|
1.9
|
|
|
|
(a)
|
Represents the allowance for wholesale lending-related commitments. Excludes the current carrying values of the guarantee liability and the offsetting asset, each of which are recognized at fair value at the inception of guarantees.
|
The Firm does not estimate the fair value of consumer lending-related commitments. In many cases, the Firm can reduce or cancel these commitments by providing the borrower notice or, in some cases, without notice as permitted by law. For a further discussion of the valuation of lending-related commitments, see page 198 of JPMorgan Chase’s 2012 Annual Report.
Trading assets and liabilities – average balances
Average trading assets and liabilities were as follows for the periods indicated.
|
Three months ended June 30,
|
Six months ended June 30,
|
|||||||||||||||
|
(in millions)
|
2013
|
2012
|
2013
|
2012
|
||||||||||||
|
Trading assets – debt and equity instruments
(a)
|
$
|
357,285
|
|
$
|
346,708
|
|
$
|
363,952
|
|
$
|
351,021
|
|
||||
|
Trading assets – derivative receivables
|
75,310
|
|
89,345
|
|
75,115
|
|
89,896
|
|
||||||||
|
Trading liabilities – debt and equity instruments
(a)(b)
|
75,671
|
|
69,763
|
|
73,103
|
|
69,374
|
|
||||||||
|
Trading liabilities – derivative payables
|
66,246
|
|
78,704
|
|
67,458
|
|
77,387
|
|
||||||||
|
(a)
|
Balances reflect the reduction of securities owned (long positions) by the amount of securities sold, but not yet purchased (short positions) when the long and short positions have identical CUSIP numbers.
|
|
(b)
|
Primarily represent securities sold, not yet purchased.
|
127
For a discussion of the primary financial instruments for which the fair value option was previously elected, including the basis for those elections and the determination of instrument-specific credit risk, where relevant, see Note 4 on pages 214–216 of JPMorgan Chase’s 2012 Annual Report.
Changes in fair value under the fair value option election
The following table presents the changes in fair value included in the Consolidated Statements of Income for the three and six months ended
June 30, 2013
and 2012, for items for which the fair value option was elected. The profit and loss information presented below only includes the financial instruments that were elected to be measured at fair value; related risk management instruments, which are required to be measured at fair value, are not included in the table.
|
Three months ended June 30,
|
|||||||||||||||||||||
|
2013
|
2012
|
||||||||||||||||||||
|
(in millions)
|
Principal transactions
|
Other income
|
Total changes in fair value recorded
|
Principal transactions
|
Other income
|
Total changes in fair value recorded
|
|||||||||||||||
|
Federal funds sold and securities purchased under resale agreements
|
$
|
(287
|
)
|
$
|
—
|
|
$
|
(287
|
)
|
$
|
221
|
|
$
|
—
|
|
$
|
221
|
|
|||
|
Securities borrowed
|
(8
|
)
|
—
|
|
(8
|
)
|
—
|
|
—
|
|
—
|
|
|||||||||
|
Trading assets:
|
|||||||||||||||||||||
|
Debt and equity instruments, excluding loans
|
(14
|
)
|
4
|
|
(c)
|
(10
|
)
|
(26
|
)
|
—
|
|
(26
|
)
|
||||||||
|
Loans reported as trading assets:
|
|||||||||||||||||||||
|
Changes in instrument-specific credit risk
|
211
|
|
26
|
|
(c)
|
237
|
|
333
|
|
11
|
|
(c)
|
344
|
|
|||||||
|
Other changes in fair value
|
(94
|
)
|
253
|
|
(c)
|
159
|
|
78
|
|
1,782
|
|
(c)
|
1,860
|
|
|||||||
|
Loans:
|
|||||||||||||||||||||
|
Changes in instrument-specific credit risk
|
(1
|
)
|
—
|
|
(1
|
)
|
(14
|
)
|
—
|
|
(14
|
)
|
|||||||||
|
Other changes in fair value
|
21
|
|
—
|
|
21
|
|
550
|
|
—
|
|
550
|
|
|||||||||
|
Other assets
|
22
|
|
(20
|
)
|
(d)
|
2
|
|
—
|
|
(69
|
)
|
(d)
|
(69
|
)
|
|||||||
|
Deposits
(a)
|
219
|
|
—
|
|
219
|
|
(1
|
)
|
—
|
|
(1
|
)
|
|||||||||
|
Federal funds purchased and securities loaned or sold under repurchase agreements
|
41
|
|
—
|
|
41
|
|
(29
|
)
|
—
|
|
(29
|
)
|
|||||||||
|
Other borrowed funds
(a)
|
734
|
|
—
|
|
734
|
|
1,322
|
|
—
|
|
1,322
|
|
|||||||||
|
Trading liabilities
|
(14
|
)
|
—
|
|
(14
|
)
|
3
|
|
—
|
|
3
|
|
|||||||||
|
Beneficial interests issued by consolidated VIEs
|
(69
|
)
|
—
|
|
(69
|
)
|
(24
|
)
|
—
|
|
(24
|
)
|
|||||||||
|
Other liabilities
|
—
|
|
—
|
|
—
|
|
—
|
|
—
|
|
—
|
|
|||||||||
|
Long-term debt:
|
|||||||||||||||||||||
|
Changes in instrument-specific credit risk
(a)
|
159
|
|
—
|
|
159
|
|
(85
|
)
|
—
|
|
(85
|
)
|
|||||||||
|
Other changes in fair value
(b)
|
1,000
|
|
—
|
|
1,000
|
|
313
|
|
—
|
|
313
|
|
|||||||||
128
|
Six months ended June 30,
|
|||||||||||||||||||||
|
2013
|
2012
|
||||||||||||||||||||
|
(in millions)
|
Principal transactions
|
Other income
|
Total changes in fair value recorded
|
Principal transactions
|
Other income
|
Total changes in fair value recorded
|
|||||||||||||||
|
Federal funds sold and securities purchased under resale agreements
|
$
|
(358
|
)
|
$
|
—
|
|
$
|
(358
|
)
|
$
|
173
|
|
$
|
—
|
|
$
|
173
|
|
|||
|
Securities borrowed
|
18
|
|
—
|
|
18
|
|
14
|
|
—
|
|
14
|
|
|||||||||
|
Trading assets:
|
|
|
|
|
|||||||||||||||||
|
Debt and equity instruments, excluding loans
|
242
|
|
7
|
|
(c)
|
249
|
|
338
|
|
3
|
|
(c)
|
341
|
|
|||||||
|
Loans reported as trading assets:
|
|
|
|
|
|||||||||||||||||
|
Changes in instrument-specific credit risk
|
539
|
|
38
|
|
(c)
|
577
|
|
809
|
|
29
|
|
(c)
|
838
|
|
|||||||
|
Other changes in fair value
|
(78
|
)
|
1,205
|
|
(c)
|
1,127
|
|
(174
|
)
|
3,359
|
|
(c)
|
3,185
|
|
|||||||
|
Loans:
|
|
|
|
|
|||||||||||||||||
|
Changes in instrument-specific credit risk
|
(6
|
)
|
—
|
|
(6
|
)
|
(14
|
)
|
—
|
|
(14
|
)
|
|||||||||
|
Other changes in fair value
|
21
|
|
—
|
|
21
|
|
575
|
|
—
|
|
575
|
|
|||||||||
|
Other assets
|
21
|
|
(89
|
)
|
(d)
|
(68
|
)
|
—
|
|
(263
|
)
|
(d)
|
(263
|
)
|
|||||||
|
Deposits
(a)
|
297
|
|
—
|
|
297
|
|
(161
|
)
|
—
|
|
(161
|
)
|
|||||||||
|
Federal funds purchased and securities loaned or sold under repurchase agreements
|
45
|
|
—
|
|
45
|
|
(27
|
)
|
—
|
|
(27
|
)
|
|||||||||
|
Other borrowed funds
(a)
|
380
|
|
—
|
|
380
|
|
847
|
|
—
|
|
847
|
|
|||||||||
|
Trading liabilities
|
(32
|
)
|
—
|
|
(32
|
)
|
12
|
|
—
|
|
12
|
|
|||||||||
|
Beneficial interests issued by consolidated VIEs
|
(97
|
)
|
—
|
|
(97
|
)
|
(30
|
)
|
—
|
|
(30
|
)
|
|||||||||
|
Other liabilities
|
—
|
|
(1
|
)
|
(d)
|
(1
|
)
|
—
|
|
—
|
|
—
|
|
||||||||
|
Long-term debt:
|
|
|
|
|
|||||||||||||||||
|
Changes in instrument-specific credit risk
(a)
|
192
|
|
—
|
|
192
|
|
(504
|
)
|
—
|
|
(504
|
)
|
|||||||||
|
Other changes in fair value
(b)
|
969
|
|
—
|
|
969
|
|
(392
|
)
|
—
|
|
(392
|
)
|
|||||||||
|
(a)
|
Total changes in instrument-specific credit risk related to structured notes were
$251 million
and
$415 million
for the three months ended
June 30, 2013
and 2012, and
$382 million
and
$(53) million
for the
six months ended
June 30, 2013
and 2012, respectively. These totals include adjustments for structured notes classified within deposits and other borrowed funds, as well as long-term debt.
|
|
(b)
|
Structured notes are predominantly financial instruments containing embedded derivatives. Where present, the embedded derivative is the primary driver of risk. Although the risk associated with the structured notes is actively managed, the gains/(losses) reported in this table do not include the income statement impact of the risk management instruments used to manage such risk.
|
|
(c)
|
Reported in mortgage fees and related income.
|
|
(d)
|
Reported in other income.
|
129
Difference between aggregate fair value and aggregate remaining contractual principal balance outstanding
The following table reflects the difference between the aggregate fair value and the aggregate remaining contractual principal balance outstanding as of
June 30, 2013
, and
December 31, 2012
, for loans, long-term debt and long-term beneficial interests for which the fair value option has been elected.
|
June 30, 2013
|
December 31, 2012
|
||||||||||||||||||||
|
(in millions)
|
Contractual principal outstanding
|
Fair value
|
Fair value over/(under) contractual principal outstanding
|
Contractual principal outstanding
|
Fair value
|
Fair value over/(under) contractual principal outstanding
|
|||||||||||||||
|
Loans
(a)
|
|||||||||||||||||||||
|
Nonaccrual loans
|
|||||||||||||||||||||
|
Loans reported as trading assets
|
$
|
5,293
|
|
$
|
1,407
|
|
$
|
(3,886
|
)
|
$
|
4,217
|
|
$
|
960
|
|
$
|
(3,257
|
)
|
|||
|
Loans
|
163
|
|
88
|
|
(75
|
)
|
116
|
|
64
|
|
(52
|
)
|
|||||||||
|
Subtotal
|
5,456
|
|
1,495
|
|
(3,961
|
)
|
4,333
|
|
1,024
|
|
(3,309
|
)
|
|||||||||
|
All other performing loans
|
|||||||||||||||||||||
|
Loans reported as trading assets
|
40,924
|
|
37,219
|
|
(3,705
|
)
|
44,084
|
|
40,581
|
|
(3,503
|
)
|
|||||||||
|
Loans
|
1,579
|
|
1,486
|
|
(93
|
)
|
2,211
|
|
2,099
|
|
(112
|
)
|
|||||||||
|
Total loans
|
$
|
47,959
|
|
$
|
40,200
|
|
$
|
(7,759
|
)
|
$
|
50,628
|
|
$
|
43,704
|
|
$
|
(6,924
|
)
|
|||
|
Long-term debt
|
|||||||||||||||||||||
|
Principal-protected debt
|
$
|
16,516
|
|
(c)
|
$
|
16,127
|
|
$
|
(389
|
)
|
$
|
16,541
|
|
(c)
|
$
|
16,391
|
|
$
|
(150
|
)
|
|
|
Nonprincipal-protected debt
(b)
|
NA
|
|
13,093
|
|
NA
|
|
NA
|
|
14,397
|
|
NA
|
|
|||||||||
|
Total long-term debt
|
NA
|
|
$
|
29,220
|
|
NA
|
|
NA
|
|
$
|
30,788
|
|
NA
|
|
|||||||
|
Long-term beneficial interests
|
|||||||||||||||||||||
|
Nonprincipal-protected debt
(b)
|
NA
|
|
$
|
1,043
|
|
NA
|
|
NA
|
|
$
|
1,170
|
|
NA
|
|
|||||||
|
Total long-term beneficial interests
|
NA
|
|
$
|
1,043
|
|
NA
|
|
NA
|
|
$
|
1,170
|
|
NA
|
|
|||||||
|
(a)
|
There were no performing loans which were ninety days or more past due as of
June 30, 2013
, and
December 31, 2012
.
|
|
(b)
|
Remaining contractual principal is not applicable to nonprincipal-protected notes. Unlike principal-protected structured notes, for which the Firm is obligated to return a stated amount of principal at the maturity of the note, nonprincipal-protected structured notes do not obligate the Firm to return a stated amount of principal at maturity, but to return an amount based on the performance of an underlying variable or derivative feature embedded in the note.
|
|
(c)
|
Where the Firm issues principal-protected zero-coupon or discount notes, the balance reflected as the remaining contractual principal is the final principal payment at maturity.
|
At
June 30, 2013
, and
December 31, 2012
, the contractual amount of letters of credit for which the fair value option was elected was
$4.6 billion
and
$4.5 billion
, respectively, with a corresponding fair value of
$(108) million
and
$(75) million
, respectively. For further information regarding off-balance sheet lending-related financial instruments, see Note 29 on pages 308–315 of JPMorgan Chase’s 2012 Annual Report, and Note 21 on pages
193–197
of this Form 10-Q.
Structured note products by balance sheet classification and risk component
The table below presents the fair value of the structured notes issued by the Firm, by balance sheet classification and the primary risk to which the structured notes’ embedded derivative relates.
|
June 30, 2013
|
December 31, 2012
|
||||||||||||||||||||||||
|
(in millions)
|
Long-term debt
|
Other borrowed funds
|
Deposits
|
Total
|
Long-term debt
|
Other borrowed funds
|
Deposits
|
Total
|
|||||||||||||||||
|
Risk exposure
|
|||||||||||||||||||||||||
|
Interest rate
|
$
|
8,948
|
|
$
|
397
|
|
$
|
1,000
|
|
$
|
10,345
|
|
$
|
8,669
|
|
$
|
1,143
|
|
$
|
559
|
|
$
|
10,371
|
|
|
|
Credit
|
5,006
|
|
123
|
|
—
|
|
5,129
|
|
6,166
|
|
—
|
|
—
|
|
6,166
|
|
|||||||||
|
Foreign exchange
|
2,675
|
|
206
|
|
27
|
|
2,908
|
|
2,819
|
|
—
|
|
29
|
|
2,848
|
|
|||||||||
|
Equity
|
11,173
|
|
11,289
|
|
3,293
|
|
25,755
|
|
11,580
|
|
9,809
|
|
2,972
|
|
24,361
|
|
|||||||||
|
Commodity
|
1,269
|
|
315
|
|
1,038
|
|
2,622
|
|
1,379
|
|
332
|
|
1,555
|
|
3,266
|
|
|||||||||
|
Total structured notes
|
$
|
29,071
|
|
$
|
12,330
|
|
$
|
5,358
|
|
$
|
46,759
|
|
$
|
30,613
|
|
$
|
11,284
|
|
$
|
5,115
|
|
$
|
47,012
|
|
|
130
JPMorgan Chase makes markets in derivatives for customers and also uses derivatives to hedge or manage its own risk exposures. For a further discussion of the Firm’s use of and accounting policies regarding derivative instruments, see Note 6 on pages 218–227 of JPMorgan Chase’s 2012
Annual Report
.
The Firm’s disclosures are based on the accounting treatment and purpose of these derivatives. A limited number of the Firm’s derivatives are designated in hedge
accounting relationships and are disclosed according to the type of hedge (fair value hedge, cash flow hedge, or net investment hedge). Derivatives not designated in hedge accounting relationships include certain derivatives that are used to manage certain risks associated with specified assets or liabilities (“specified risk management” positions) as well as derivatives used in the Firm’s market-making businesses or for other purposes.
The following table outlines the Firm’s primary uses of derivatives and the related hedge accounting designation or disclosure category.
|
Type of Derivative
|
Use of Derivative
|
Designation and disclosure
|
Affected
segment or unit
|
10-Q page reference
|
|
Manage specifically identified risk exposures in qualifying hedge accounting relationships:
|
||||
|
◦ Interest rate
|
Hedge fixed rate assets and liabilities
|
Fair value hedge
|
Corporate/PE
|
137-138
|
|
◦ Interest rate
|
Hedge floating rate assets and liabilities
|
Cash flow hedge
|
Corporate/PE
|
139
|
|
◦
Foreign exchange
|
Hedge foreign currency-denominated assets and liabilities
|
Fair value hedge
|
Corporate/PE
|
137-138
|
|
◦
Foreign exchange
|
Hedge forecasted revenue and expense
|
Cash flow hedge
|
Corporate/PE
|
139
|
|
◦
Foreign exchange
|
Hedge the value of the Firm’s investments in non-U.S. subsidiaries
|
Net investment hedge
|
Corporate/PE
|
140
|
|
◦
Commodity
|
Hedge commodity inventory
|
Fair value hedge
|
CIB
|
137-138
|
|
Manage specifically identified risk exposures not designated in qualifying hedge accounting relationships:
|
||||
|
◦
Interest rate
|
Manage the risk of the mortgage pipeline, warehouse loans and MSRs
|
Specified risk management
|
CCB
|
140
|
|
◦
Credit
|
Manage the credit risk of wholesale lending exposures
|
Specified risk management
|
CIB
|
140
|
|
◦
Credit
(a)
|
Manage the credit risk of certain AFS securities
|
Specified risk management
|
Corporate/PE
|
140
|
|
◦
Commodity
|
Manage the risk of certain commodities-related contracts and investments
|
Specified risk management
|
CIB
|
140
|
|
◦
Interest rate and foreign exchange
|
Manage the risk of certain other specified assets and liabilities
|
Specified risk management
|
Corporate/PE
|
140
|
|
Market-making derivatives and other activities:
|
||||
|
◦ Various
|
Market-making and related risk management
|
Market-making and other
|
CIB
|
140
|
|
◦ Various
(b)
|
Other derivatives, including the synthetic credit portfolio
|
Market-making and other
|
CIB, Corporate/PE
|
140
|
|
(a)
|
Includes a limited number of single-name credit derivatives used to mitigate the credit risk arising from specified AFS securities.
|
|
(b)
|
The synthetic credit portfolio is a portfolio of index credit derivatives, including short and long positions, that was held by CIO. On July 2, 2012, CIO transferred the synthetic credit portfolio, other than a portion that aggregated to a notional amount of approximately $
12 billion
, to CIB. The positions making up the portion of the synthetic credit portfolio retained by CIO on July 2, 2012, were effectively closed out during the third quarter of 2012. The results of the synthetic credit portfolio, including the portion transferred to CIB, have been included in the gains and losses on derivatives related to market-making activities and other derivatives category on page
140
of this Note.
|
131
Notional amount of derivative contracts
The following table summarizes the notional amount of derivative contracts outstanding as of June 30, 2013, and
December 31, 2012
.
|
Notional amounts
(c)
|
||||||
|
(in billions)
|
June 30,
2013
|
December 31, 2012
|
||||
|
Interest rate contracts
|
||||||
|
Swaps
(a)
|
$
|
34,836
|
|
$
|
33,129
|
|
|
Futures and forwards
|
12,888
|
|
11,824
|
|
||
|
Written options
|
4,081
|
|
3,866
|
|
||
|
Purchased options
|
4,195
|
|
3,911
|
|
||
|
Total interest rate contracts
|
56,000
|
|
52,730
|
|
||
|
Credit derivatives
(b)
|
6,291
|
|
5,981
|
|
||
|
Foreign exchange contracts
|
|
|
||||
|
Cross-currency swaps
(a)
|
3,390
|
|
3,409
|
|
||
|
Spot, futures and forwards
|
4,277
|
|
4,033
|
|
||
|
Written options
|
791
|
|
651
|
|
||
|
Purchased options
|
781
|
|
661
|
|
||
|
Total foreign exchange contracts
|
9,239
|
|
8,754
|
|
||
|
Equity contracts
|
||||||
|
Swaps
|
184
|
|
163
|
|
||
|
Futures and forwards
|
60
|
|
49
|
|
||
|
Written options
|
487
|
|
442
|
|
||
|
Purchased options
|
433
|
|
403
|
|
||
|
Total equity contracts
|
1,164
|
|
1,057
|
|
||
|
Commodity contracts
|
|
|
||||
|
Swaps
(a)
|
275
|
|
312
|
|
||
|
Spot, futures and forwards
|
109
|
|
190
|
|
||
|
Written options
(a)
|
232
|
|
262
|
|
||
|
Purchased options
|
234
|
|
260
|
|
||
|
Total commodity contracts
|
850
|
|
1,024
|
|
||
|
Total derivative notional amounts
|
$
|
73,544
|
|
$
|
69,546
|
|
|
(a)
|
The prior period amounts have been revised. This revision had no impact on the Firm’s Consolidated Balance Sheets or its results of operations.
|
|
(b)
|
Primarily consists of credit default swaps. For more information on volumes and types of credit derivative contracts, see the Credit derivatives discussion on pages
141–142
of this Note.
|
|
(c)
|
Represents the sum of gross long and gross short third-party notional derivative contracts.
|
While the notional amounts disclosed above give an indication of the volume of the Firm’s derivatives activity, the notional amounts significantly exceed, in the Firm’s view, the possible losses that could arise from such transactions. For most derivative transactions, the notional amount is not exchanged; it is used simply as a reference to calculate payments.
132
Impact of derivatives on the Consolidated Balance Sheets
The following table summarizes information on derivative receivables and payables (before and after netting adjustments) that are reflected on the Firm’s Consolidated Balance Sheets as of June 30, 2013, and
December 31, 2012
, by accounting designation (e.g., whether the derivatives were designated in qualifying hedge accounting relationships or not) and contract type.
|
Derivative receivables and payables
(a)
|
|||||||||||||||||||||||||
|
Gross derivative receivables
|
Gross derivative payables
|
||||||||||||||||||||||||
|
June 30, 2013
(in millions)
|
Not designated as hedges
|
Designated as hedges
|
Total derivative receivables
|
Net derivative receivables
(c)
|
Not designated as hedges
|
Designated
as hedges
|
Total derivative payables
|
Net derivative payables
(c)
|
|||||||||||||||||
|
Trading assets and liabilities
|
|||||||||||||||||||||||||
|
Interest rate
|
$
|
967,026
|
|
$
|
4,186
|
|
$
|
971,212
|
|
$
|
31,697
|
|
$
|
933,868
|
|
$
|
4,317
|
|
$
|
938,185
|
|
$
|
18,416
|
|
|
|
Credit
|
93,661
|
|
—
|
|
93,661
|
|
2,364
|
|
91,643
|
|
—
|
|
91,643
|
|
2,611
|
|
|||||||||
|
Foreign exchange
|
174,697
|
|
2,560
|
|
177,257
|
|
14,317
|
|
192,625
|
|
435
|
|
193,060
|
|
16,710
|
|
|||||||||
|
Equity
|
52,059
|
|
—
|
|
52,059
|
|
13,569
|
|
53,404
|
|
—
|
|
53,404
|
|
14,728
|
|
|||||||||
|
Commodity
|
52,741
|
|
2,382
|
|
55,123
|
|
11,804
|
|
55,807
|
|
20
|
|
55,827
|
|
11,920
|
|
|||||||||
|
Total fair value of trading assets and liabilities
|
$
|
1,340,184
|
|
$
|
9,128
|
|
$
|
1,349,312
|
|
$
|
73,751
|
|
$
|
1,327,347
|
|
$
|
4,772
|
|
$
|
1,332,119
|
|
$
|
64,385
|
|
|
|
Gross derivative receivables
|
Gross derivative payables
|
||||||||||||||||||||||||
|
December 31, 2012
(in millions)
|
Not designated as hedges
|
Designated as hedges
|
Total derivative receivables
|
Net derivative receivables
(c)
|
Not designated as hedges
|
Total derivative payables
|
Net derivative payables
(c)
|
||||||||||||||||||
|
Trading assets and liabilities
|
|||||||||||||||||||||||||
|
Interest rate
(b)
|
$
|
1,296,503
|
|
$
|
6,064
|
|
$
|
1,302,567
|
|
$
|
39,205
|
|
$
|
1,257,599
|
|
$
|
3,120
|
|
$
|
1,260,719
|
|
$
|
24,906
|
|
|
|
Credit
|
100,310
|
|
—
|
|
100,310
|
|
1,735
|
|
100,027
|
|
—
|
|
100,027
|
|
2,504
|
|
|||||||||
|
Foreign exchange
(b)
|
173,363
|
|
1,577
|
|
174,940
|
|
14,142
|
|
186,404
|
|
2,133
|
|
188,537
|
|
18,601
|
|
|||||||||
|
Equity
(b)
|
42,662
|
|
—
|
|
42,662
|
|
9,266
|
|
44,534
|
|
—
|
|
44,534
|
|
11,819
|
|
|||||||||
|
Commodity
(b)
|
43,216
|
|
586
|
|
43,802
|
|
10,635
|
|
46,998
|
|
644
|
|
47,642
|
|
12,826
|
|
|||||||||
|
Total fair value of trading assets and liabilities
|
$
|
1,656,054
|
|
$
|
8,227
|
|
$
|
1,664,281
|
|
$
|
74,983
|
|
$
|
1,635,562
|
|
$
|
5,897
|
|
$
|
1,641,459
|
|
$
|
70,656
|
|
|
|
(a)
|
Balances exclude structured notes for which the fair value option has been elected. See Note 4 on pages
128–130
of
this Form 10-Q
for further information.
|
|
(b)
|
The prior period amounts have been revised. This revision had no impact on the Firm’s Consolidated Balance Sheets or its results of operations.
|
|
(c)
|
As permitted under U.S. GAAP, the Firm has elected to net derivative receivables and derivative payables and the related cash collateral receivables and payables when a legally enforceable master netting agreement exists.
|
133
The following table presents, as of June 30, 2013, and December 31, 2012, the gross and net derivative receivables for which netting is permissible under U.S. GAAP by contract and settlement type. Derivative receivables have been netted with respect to those receivables as to which the netting requirements have been met, including obtaining a legal opinion with respect to the enforceability of the netting (“U.S. GAAP nettable derivative receivables”); where such a legal opinion has either not been sought or obtained, the receivables are not netted, and are shown separately in the table below (“Derivative receivables not nettable under U.S. GAAP”).
|
June 30, 2013
|
December 31, 2012
|
|||||||||||||||||||||
|
(in millions)
|
Gross derivative receivables
|
Amounts netted on the Consolidated balance sheets
|
Net derivative receivables
|
Gross derivative receivables
|
Amounts netted on the Consolidated balance sheets
|
Net derivative receivables
|
||||||||||||||||
|
U.S. GAAP nettable derivative receivables
|
||||||||||||||||||||||
|
Interest rate contracts:
|
||||||||||||||||||||||
|
Over–the–counter (“OTC”)
(a)
|
$
|
592,762
|
|
$
|
(568,551
|
)
|
$
|
24,211
|
|
$
|
794,517
|
|
$
|
(771,684
|
)
|
$
|
22,833
|
|
||||
|
OTC–cleared
|
370,991
|
|
(370,964
|
)
|
27
|
|
491,947
|
|
(491,678
|
)
|
269
|
|
||||||||||
|
Exchange traded
(b)
|
—
|
|
—
|
|
—
|
|
—
|
|
—
|
|
—
|
|
||||||||||
|
Total interest rate contracts
|
963,753
|
|
(939,515
|
)
|
24,238
|
|
1,286,464
|
|
(1,263,362
|
)
|
23,102
|
|
||||||||||
|
Credit contracts:
|
|
|
||||||||||||||||||||
|
OTC
|
82,980
|
|
(81,113
|
)
|
1,867
|
|
90,744
|
|
(90,104
|
)
|
640
|
|
||||||||||
|
OTC–cleared
|
10,185
|
|
(10,184
|
)
|
1
|
|
8,471
|
|
(8,471
|
)
|
—
|
|
||||||||||
|
Total credit contracts
|
93,165
|
|
(91,297
|
)
|
1,868
|
|
99,215
|
|
(98,575
|
)
|
640
|
|
||||||||||
|
Foreign exchange contracts:
|
||||||||||||||||||||||
|
OTC
(a)
|
171,703
|
|
(162,852
|
)
|
8,851
|
|
168,740
|
|
(160,775
|
)
|
7,965
|
|
||||||||||
|
OTC–cleared
|
88
|
|
(88
|
)
|
—
|
|
23
|
|
(23
|
)
|
—
|
|
||||||||||
|
Exchange traded
(b)
|
—
|
|
—
|
|
—
|
|
—
|
|
—
|
|
—
|
|
||||||||||
|
Total foreign exchange contracts
|
171,791
|
|
(162,940
|
)
|
8,851
|
|
168,763
|
|
(160,798
|
)
|
7,965
|
|
||||||||||
|
Equity contracts:
|
||||||||||||||||||||||
|
OTC
|
31,838
|
|
(28,006
|
)
|
3,832
|
|
26,008
|
|
(24,628
|
)
|
1,380
|
|
||||||||||
|
OTC–cleared
|
—
|
|
—
|
|
—
|
|
—
|
|
—
|
|
—
|
|
||||||||||
|
Exchange traded
(b)
|
18,483
|
|
(10,484
|
)
|
7,999
|
|
12,841
|
|
(8,768
|
)
|
4,073
|
|
||||||||||
|
Total equity contracts
|
50,321
|
|
(38,490
|
)
|
11,831
|
|
38,849
|
|
(33,396
|
)
|
5,453
|
|
||||||||||
|
Commodity contracts:
|
||||||||||||||||||||||
|
OTC
(a)
|
27,765
|
|
(19,514
|
)
|
8,251
|
|
26,881
|
|
(20,760
|
)
|
6,121
|
|
||||||||||
|
OTC–cleared
|
—
|
|
—
|
|
—
|
|
—
|
|
—
|
|
—
|
|
||||||||||
|
Exchange traded
(b)
|
25,381
|
|
(23,805
|
)
|
1,576
|
|
15,108
|
|
(12,407
|
)
|
2,701
|
|
||||||||||
|
Total commodity contracts
|
53,146
|
|
(43,319
|
)
|
9,827
|
|
41,989
|
|
(33,167
|
)
|
8,822
|
|
||||||||||
|
U.S. GAAP nettable derivative receivables
|
$
|
1,332,176
|
|
$
|
(1,275,561
|
)
|
(c)
|
$
|
56,615
|
|
$
|
1,635,280
|
|
$
|
(1,589,298
|
)
|
(c)
|
$
|
45,982
|
|
||
|
Derivative receivables not nettable under U.S. GAAP
|
17,136
|
|
17,136
|
|
29,001
|
|
29,001
|
|
||||||||||||||
|
Total derivative receivables recognized on the Consolidated Balance Sheets
|
$
|
1,349,312
|
|
$
|
73,751
|
|
$
|
1,664,281
|
|
$
|
74,983
|
|
||||||||||
|
(a)
|
The prior period amounts have been revised. This revision had no impact on the Firm’s Consolidated Balance Sheets or its results of operations.
|
|
(b)
|
Exchange traded derivative amounts that relate to futures contracts are settled daily.
|
|
(c)
|
Included cash collateral netted of
$64.6 billion
and
$79.2 billion
at June 30, 2013, and December 31, 2012, respectively.
|
134
The following table presents, as of June 30, 2013, and December 31, 2012, the gross and net derivative payables for which netting is permissible under U.S. GAAP by contract and settlement type. Derivative payables have been netted with respect to those payables as to which the netting requirements have been met, including obtaining a legal opinion with respect to the enforceability of the netting (“U.S. GAAP nettable derivative payables”); where such a legal opinion has either not been sought or obtained, the payables are not netted, and are shown separately in the table below (“Derivative payables not nettable under U.S. GAAP”).
|
June 30, 2013
|
December 31, 2012
|
|||||||||||||||||||||
|
(in millions)
|
Gross derivative payables
|
Amounts netted on the Consolidated balance sheets
|
Net derivative payables
|
Gross derivative payables
|
Amounts netted on the Consolidated balance sheets
|
Net derivative payables
|
||||||||||||||||
|
U.S. GAAP nettable derivative payables
|
||||||||||||||||||||||
|
Interest rate contracts:
|
||||||||||||||||||||||
|
OTC
(a)
|
$
|
576,955
|
|
$
|
(560,519
|
)
|
$
|
16,436
|
|
$
|
774,769
|
|
$
|
(754,050
|
)
|
$
|
20,719
|
|
||||
|
OTC–cleared
|
359,270
|
|
(359,250
|
)
|
20
|
|
482,018
|
|
(481,763
|
)
|
255
|
|
||||||||||
|
Exchange traded
(b)
|
—
|
|
—
|
|
—
|
|
—
|
|
—
|
|
—
|
|
||||||||||
|
Total interest rate contracts
|
936,225
|
|
(919,769
|
)
|
16,456
|
|
1,256,787
|
|
(1,235,813
|
)
|
|
20,974
|
|
|||||||||
|
Credit contracts:
|
||||||||||||||||||||||
|
OTC
|
80,148
|
|
(78,490
|
)
|
1,658
|
|
89,170
|
|
(88,151
|
)
|
1,019
|
|
||||||||||
|
OTC–cleared
|
10,543
|
|
(10,542
|
)
|
1
|
|
9,372
|
|
(9,372
|
)
|
—
|
|
||||||||||
|
Total credit contracts
|
90,691
|
|
(89,032
|
)
|
1,659
|
|
98,542
|
|
(97,523
|
)
|
|
1,019
|
|
|||||||||
|
Foreign exchange contracts:
|
||||||||||||||||||||||
|
OTC
(a)
|
188,344
|
|
(176,231
|
)
|
12,113
|
|
181,166
|
|
(169,913
|
)
|
11,253
|
|
||||||||||
|
OTC–cleared
|
125
|
|
(119
|
)
|
6
|
|
29
|
|
(23
|
)
|
6
|
|
||||||||||
|
Exchange traded
(b)
|
—
|
|
—
|
|
—
|
|
—
|
|
—
|
|
—
|
|
||||||||||
|
Total foreign exchange contracts
|
188,469
|
|
(176,350
|
)
|
12,119
|
|
181,195
|
|
(169,936
|
)
|
|
11,259
|
|
|||||||||
|
Equity contracts:
|
||||||||||||||||||||||
|
OTC
|
33,123
|
|
(28,192
|
)
|
4,931
|
|
28,320
|
|
(23,948
|
)
|
4,372
|
|
||||||||||
|
OTC–cleared
|
—
|
|
—
|
|
—
|
|
—
|
|
—
|
|
—
|
|
||||||||||
|
Exchange traded
(b)
|
17,392
|
|
(10,484
|
)
|
6,908
|
|
12,000
|
|
(8,767
|
)
|
3,233
|
|
||||||||||
|
Total equity contracts
|
50,515
|
|
(38,676
|
)
|
11,839
|
|
40,320
|
|
(32,715
|
)
|
|
7,605
|
|
|||||||||
|
Commodity contracts:
|
||||||||||||||||||||||
|
OTC
(a)
|
28,616
|
|
(20,102
|
)
|
8,514
|
|
28,761
|
|
(22,409
|
)
|
6,352
|
|
||||||||||
|
OTC–cleared
|
—
|
|
—
|
|
—
|
|
—
|
|
—
|
|
—
|
|
||||||||||
|
Exchange traded
(b)
|
25,341
|
|
(23,805
|
)
|
1,536
|
|
14,488
|
|
(12,407
|
)
|
2,081
|
|
||||||||||
|
Total commodity contracts
|
53,957
|
|
(43,907
|
)
|
10,050
|
|
43,249
|
|
(34,816
|
)
|
|
8,433
|
|
|||||||||
|
U.S. GAAP nettable derivative payables
|
$
|
1,319,857
|
|
$
|
(1,267,734
|
)
|
(c)
|
$
|
52,123
|
|
$
|
1,620,093
|
|
$
|
(1,570,803
|
)
|
(c)
|
$
|
49,290
|
|
||
|
Derivative payables not nettable under U.S. GAAP
|
12,262
|
|
12,262
|
|
21,366
|
|
21,366
|
|
||||||||||||||
|
Total derivative payables recognized on the Consolidated Balance Sheets
|
$
|
1,332,119
|
|
$
|
64,385
|
|
$
|
1,641,459
|
|
$
|
70,656
|
|
||||||||||
|
(a)
|
The prior period amounts have been revised. This revision had no impact on the Firm’s Consolidated Balance Sheets or its results of operations.
|
|
(b)
|
Exchange traded derivative balances that relate to futures contracts are settled daily.
|
|
(c)
|
Included cash collateral netted of
$56.8 billion
and
$60.7 billion
related to OTC and OTC-cleared derivatives at June 30, 2013, and December 31, 2012, respectively.
|
135
In addition to the cash collateral received and transferred that is presented on a net basis with net derivative receivables and payables, the Firm receives and transfers additional collateral (financial instruments and cash). These amounts mitigate counterparty credit risk associated with the Firm’s derivative instruments but are not eligible for net presentation, because (a) the collateral is non-cash
financial instruments (generally U.S. government and agency securities and other G7 government bonds), (b) the amount of collateral held or transferred exceeds the fair value exposure, at the individual counterparty level, as of the date presented, or (c) the collateral relates to derivative receivables or payables not nettable under U.S. GAAP.
The following tables present information regarding certain non-cash financial instrument collateral received and transferred as of June 30, 2013, and December 31, 2012, that is not eligible for net presentation under U.S. GAAP. The collateral included in these tables relates only to the U.S. GAAP nettable derivative instruments and excludes additional collateral that exceeds the fair value exposure and excludes all collateral related to derivative instruments not nettable under U.S. GAAP.
|
Derivative receivable collateral
|
|||||||||||||||||||||
|
June 30, 2013
|
December 31, 2012
|
||||||||||||||||||||
|
(in millions)
|
Net derivative receivables
|
Collateral not nettable on the Consolidated balance sheets
|
Net exposure
|
Net derivative receivables
|
Collateral not nettable on the Consolidated balance sheets
|
Net exposure
|
|||||||||||||||
|
U.S. GAAP nettable derivative receivables
|
$
|
56,615
|
|
$
|
(9,833
|
)
|
(a)
|
$
|
46,782
|
|
$
|
45,982
|
|
$
|
(11,350
|
)
|
(a)
|
$
|
34,632
|
|
|
|
Derivative payable collateral
(b)
|
|||||||||||||||||||||
|
June 30, 2013
|
December 31, 2012
|
||||||||||||||||||||
|
(in millions)
|
Net derivative payables
|
Collateral not nettable on the Consolidated balance sheets
|
Net amount
(c)
|
Net derivative payables
|
Collateral not nettable on the Consolidated balance sheets
|
Net amount
(c)
|
|||||||||||||||
|
U.S. GAAP nettable derivative payables
|
$
|
52,123
|
|
$
|
(8,740
|
)
|
(a)
|
$
|
43,383
|
|
$
|
49,290
|
|
$
|
(20,109
|
)
|
(a)
|
$
|
29,181
|
|
|
|
(a)
|
Represents liquid security collateral as well as cash collateral held at third party custodians. For some counterparties, the collateral amounts of financial instruments may exceed the derivative receivables and derivative payables balances. Where this is the case, the total amount reported is limited to the net derivative receivables and net derivative payables balances with that counterparty.
|
|
(b)
|
Derivative payable collateral relates only to OTC and OTC-cleared derivative instruments. Amounts exclude collateral transferred related to exchange-traded derivative instruments.
|
|
(c)
|
Net amount represents exposure of counterparties to the Firm.
|
Liquidity risk and credit-related contingent features
For a more detailed discussion of liquidity risk and credit-related contingent features related to the Firm’s derivative contracts, see Note 6 on pages 218–227 of JPMorgan Chase’s 2012 Annual Report.
The following table shows the aggregate fair value of net derivative payables related to OTC and OTC-cleared derivatives that contain contingent collateral or termination features that may be triggered upon a ratings downgrade, and the associated collateral the Firm has posted in the normal course of business, at June 30, 2013, and
December 31, 2012
.
|
OTC and OTC-cleared derivative payables containing downgrade triggers
|
||||||
|
(in millions)
|
June 30,
2013
|
December 31, 2012
|
||||
|
Aggregate fair value of net derivative payables
|
$
|
29,786
|
|
$
|
40,844
|
|
|
Collateral posted
|
24,085
|
|
34,414
|
|
||
136
The following table shows the impact of a single-notch and two-notch downgrade of the long-term issuer ratings of JPMorgan Chase & Co. and its subsidiaries, predominantly JPMorgan Chase Bank, National Association (“JPMorgan Chase Bank, N.A.”), at June 30, 2013, and December 31, 2012, related to OTC and OTC-cleared derivative contracts with contingent collateral or termination features that may be triggered upon a ratings downgrade. Derivatives contracts generally require additional collateral to be posted or terminations to be triggered when the predefined threshold rating is breached. A downgrade by a single rating agency that does not result in a rating lower than a preexisting corresponding rating provided by another major rating agency will generally not result in additional collateral, except in certain instances in which additional initial margin may be required upon a ratings downgrade, or termination payment requirements. The liquidity impact in the table is calculated based upon a downgrade below the lowest current rating of the rating agencies referred to in the derivative contract.
|
Liquidity impact of downgrade triggers on OTC and
OTC-cleared derivatives
|
|||||||||||||
|
June 30, 2013
|
December 31, 2012
|
||||||||||||
|
(in millions)
|
Single-notch downgrade
|
Two-notch downgrade
|
Single-notch downgrade
|
Two-notch downgrade
|
|||||||||
|
Amount of additional collateral to be posted upon downgrade
(a)
|
$
|
1,004
|
|
$
|
3,395
|
|
$
|
1,234
|
|
$
|
4,090
|
|
|
|
Amount required to settle contracts with termination triggers upon downgrade
(b)
|
727
|
|
1,110
|
|
857
|
|
1,270
|
|
|||||
|
(a)
|
Includes the additional collateral to be posted for initial margin. Prior period amounts have been revised to conform with the current presentation.
|
|
(b)
|
Amounts represent fair value of derivative payables, and do not reflect collateral posted.
|
Impact of derivatives on the Consolidated Statements of Income
The following tables provide information related to gains and losses recorded on derivatives based on their hedge accounting designation or purpose.
Fair value hedge gains and losses
The following tables present derivative instruments, by contract type, used in fair value hedge accounting relationships, as well as pretax gains/(losses) recorded on such derivatives and the related hedged items for the three and six months ended June 30, 2013 and 2012, respectively. The Firm includes gains/(losses) on the hedging derivative and the related hedged item in the same line item in the Consolidated Statements of Income, primarily principal transactions revenue and net interest income. For additional information regarding amounts recorded in principal transactions revenue, see Note 6 on pages
143–144
of this Form 10-Q.
|
Gains/(losses) recorded in income
|
Income statement impact due to:
|
|||||||||||||||
|
Three months ended June 30, 2013
(in millions)
|
Derivatives
|
Hedged items
|
Total income statement impact
|
Hedge ineffectiveness
(d)
|
|
Excluded components
(e)
|
|
|||||||||
|
Contract type
|
||||||||||||||||
|
Interest rate
(a)
|
$
|
(2,107
|
)
|
$
|
2,434
|
|
$
|
327
|
|
$
|
(60
|
)
|
$
|
387
|
|
|
|
Foreign exchange
(b)
|
280
|
|
(368
|
)
|
(88
|
)
|
—
|
|
(88
|
)
|
||||||
|
Commodity
(c)
|
1,201
|
|
(1,087
|
)
|
114
|
|
6
|
|
108
|
|
||||||
|
Total
|
$
|
(626
|
)
|
$
|
979
|
|
$
|
353
|
|
$
|
(54
|
)
|
$
|
407
|
|
|
|
Gains/(losses) recorded in income
|
Income statement impact due to:
|
|||||||||||||||
|
Three months ended June 30, 2012 (in millions)
|
Derivatives
|
|
Hedged items
|
|
Total income statement impact
|
Hedge ineffectiveness
(d)
|
|
Excluded components
(e)
|
|
|||||||
|
Contract type
|
||||||||||||||||
|
Interest rate
(a)
|
$
|
(55
|
)
|
$
|
249
|
|
$
|
194
|
|
$
|
7
|
|
$
|
187
|
|
|
|
Foreign exchange
(b)
|
4,436
|
|
(4,521
|
)
|
(85
|
)
|
—
|
|
(85
|
)
|
||||||
|
Commodity
(c)
|
1,396
|
|
(1,193
|
)
|
203
|
|
26
|
|
177
|
|
||||||
|
Total
|
$
|
5,777
|
|
$
|
(5,465
|
)
|
$
|
312
|
|
$
|
33
|
|
$
|
279
|
|
|
137
|
Gains/(losses) recorded in income
|
Income statement impact due to:
|
|||||||||||||||
|
Six months ended June 30, 2013
(in millions)
|
Derivatives
|
Hedged items
|
Total income statement impact
|
Hedge ineffectiveness
(d)
|
|
Excluded components
(e)
|
|
|||||||||
|
Contract type
|
||||||||||||||||
|
Interest rate
(a)
|
$
|
(2,606
|
)
|
$
|
3,309
|
|
$
|
703
|
|
$
|
(100
|
)
|
$
|
803
|
|
|
|
Foreign exchange
(b)
|
4,033
|
|
(4,120
|
)
|
(87
|
)
|
—
|
|
(87
|
)
|
||||||
|
Commodity
(c)
|
1,952
|
|
(1,812
|
)
|
140
|
|
(12
|
)
|
152
|
|
||||||
|
Total
|
$
|
3,379
|
|
$
|
(2,623
|
)
|
$
|
756
|
|
$
|
(112
|
)
|
$
|
868
|
|
|
|
Gains/(losses) recorded in income
|
Income statement impact due to:
|
|||||||||||||||
|
Six months ended June 30, 2012 (in millions)
|
Derivatives
|
|
Hedged items
|
|
Total income statement impact
|
Hedge ineffectiveness
(d)
|
|
Excluded components
(e)
|
|
|||||||
|
Contract type
|
||||||||||||||||
|
Interest rate
(a)
|
$
|
(613
|
)
|
$
|
890
|
|
$
|
277
|
|
$
|
35
|
|
$
|
242
|
|
|
|
Foreign exchange
(b)
|
1,476
|
|
(1,571
|
)
|
(95
|
)
|
—
|
|
(95
|
)
|
||||||
|
Commodity
(c)
|
(780
|
)
|
501
|
|
(279
|
)
|
53
|
|
(332
|
)
|
||||||
|
Total
|
$
|
83
|
|
$
|
(180
|
)
|
$
|
(97
|
)
|
$
|
88
|
|
$
|
(185
|
)
|
|
|
(a)
|
Primarily consists of hedges of the benchmark (e.g., London Interbank Offered Rate (“LIBOR”)) interest rate risk of fixed-rate long-term debt and AFS securities. Gains and losses were recorded in net interest income. The current presentation excludes accrued interest. Prior period amounts have been revised to conform with the current presentation.
|
|
(b)
|
Primarily consists of hedges of the foreign currency risk of long-term debt and AFS securities for changes in spot foreign currency rates. Gains and losses related to the derivatives and the hedged items, due to changes in foreign currency rates, were recorded in principal transactions revenue and net interest income.
|
|
(c)
|
Consists of overall fair value hedges of physical commodities inventories that are generally carried at the lower of cost or market (market approximates fair value). Gains and losses were recorded in principal transactions revenue.
|
|
(d)
|
Hedge ineffectiveness is the amount by which the gain or loss on the designated derivative instrument does not exactly offset the gain or loss on the hedged item attributable to the hedged risk.
|
|
(e)
|
The assessment of hedge effectiveness excludes certain components of the changes in fair values of the derivatives and hedged items such as forward points on foreign exchange forward contracts and time values.
|
138
Cash flow hedge gains and losses
The following tables present derivative instruments, by contract type, used in cash flow hedge accounting relationships, and the pretax gains/(losses) recorded on such derivatives, for the three and six months ended June 30, 2013 and 2012. The Firm includes the gain/(loss) on the hedging derivative and the change in cash flows on the hedged item in the same line item in the Consolidated Statements of Income.
|
Gains/(losses) recorded in income and other comprehensive income/(loss)
(c)
|
|||||||||||||||
|
Three months ended June 30, 2013
(in millions)
|
Derivatives – effective portion reclassified from AOCI to income
|
Hedge ineffectiveness recorded directly in income
(d)
|
Total income statement impact
|
Derivatives – effective portion recorded in OCI
|
Total change
in OCI
for period
|
||||||||||
|
Contract type
|
|||||||||||||||
|
Interest rate
(a)
|
$
|
(14
|
)
|
$
|
—
|
|
$
|
(14
|
)
|
$
|
(500
|
)
|
$
|
(486
|
)
|
|
Foreign exchange
(b)
|
(20
|
)
|
—
|
|
(20
|
)
|
(12
|
)
|
8
|
|
|||||
|
Total
|
$
|
(34
|
)
|
$
|
—
|
|
$
|
(34
|
)
|
$
|
(512
|
)
|
$
|
(478
|
)
|
|
Gains/(losses) recorded in income and other comprehensive income/(loss)
(c)
|
|||||||||||||||
|
Three months ended June 30, 2012 (in millions)
|
Derivatives – effective portion reclassified from AOCI to income
|
Hedge ineffectiveness recorded directly in income
(d)
|
Total income statement impact
|
Derivatives – effective portion recorded in OCI
|
Total change
in OCI for period |
||||||||||
|
Contract type
|
|||||||||||||||
|
Interest rate
(a)
|
$
|
7
|
|
$
|
—
|
|
$
|
7
|
|
$
|
140
|
|
$
|
133
|
|
|
Foreign exchange
(b)
|
(2
|
)
|
—
|
|
(2
|
)
|
(12
|
)
|
(10
|
)
|
|||||
|
Total
|
$
|
5
|
|
$
|
—
|
|
$
|
5
|
|
$
|
128
|
|
$
|
123
|
|
|
Gains/(losses) recorded in income and other comprehensive income/(loss)
(c)
|
|||||||||||||||
|
Six months ended June 30, 2013
(in millions)
|
Derivatives – effective portion reclassified from AOCI to income
|
Hedge ineffectiveness recorded directly in income
(d)
|
Total income statement impact
|
Derivatives – effective portion recorded in OCI
|
Total change
in OCI
for period
|
||||||||||
|
Contract type
|
|||||||||||||||
|
Interest rate
(a)
|
$
|
(41
|
)
|
$
|
—
|
|
$
|
(41
|
)
|
$
|
(526
|
)
|
$
|
(485
|
)
|
|
Foreign exchange
(b)
|
(22
|
)
|
—
|
|
(22
|
)
|
(116
|
)
|
(94
|
)
|
|||||
|
Total
|
$
|
(63
|
)
|
$
|
—
|
|
$
|
(63
|
)
|
$
|
(642
|
)
|
$
|
(579
|
)
|
|
Gains/(losses) recorded in income and other comprehensive income/(loss)
(c)
|
|||||||||||||||
|
Six months ended June 30, 2012 (in millions)
|
Derivatives – effective portion reclassified from AOCI to income
|
Hedge ineffectiveness recorded directly in income
(d)
|
Total income statement impact
|
Derivatives – effective portion recorded in OCI
|
Total change
in OCI for period |
||||||||||
|
Contract type
|
|||||||||||||||
|
Interest rate
(a)
|
$
|
28
|
|
$
|
5
|
|
$
|
33
|
|
$
|
20
|
|
$
|
(8
|
)
|
|
Foreign exchange
(b)
|
(3
|
)
|
—
|
|
(3
|
)
|
67
|
|
70
|
|
|||||
|
Total
|
$
|
25
|
|
$
|
5
|
|
$
|
30
|
|
$
|
87
|
|
$
|
62
|
|
|
(a)
|
Primarily consists of benchmark interest rate hedges of LIBOR-indexed floating-rate assets and floating-rate liabilities. Gains and losses were recorded in net interest income.
|
|
(b)
|
Primarily consists of hedges of the foreign currency risk of non-U.S. dollar-denominated revenue and expense. The income statement classification of gains and losses follows the hedged item – primarily net interest income, noninterest revenue and compensation expense.
|
|
(c)
|
The Firm did not experience any forecasted transactions that failed to occur for the three and six months ended June 30, 2013 and 2012.
|
|
(d)
|
Hedge ineffectiveness is the amount by which the cumulative gain or loss on the designated derivative instrument exceeds the present value of the cumulative expected change in cash flows on the hedged item attributable to the hedged risk.
|
Over the next 12 months, the Firm expects that
$42 million
(after-tax) of net losses recorded in accumulated other comprehensive income (“AOCI”) at June 30, 2013, related to cash flow hedges will be recognized in income. The maximum length of time over which forecasted transactions are hedged is
10 years
, and such transactions primarily relate to core lending and borrowing activities.
139
Net investment hedge gains and losses
The following table presents hedging instruments, by contract type, that were used in net investment hedge accounting relationships, and the pretax gains/(losses) recorded on such instruments for the three and six months ended June 30, 2013 and 2012.
|
Gains/(losses) recorded in income and
other comprehensive income/(loss)
|
|||||||||||||||||
|
2013
|
2012
|
||||||||||||||||
|
Three months ended June 30,
(in millions)
|
Excluded components recorded directly
in income
(a)
|
Effective portion recorded in OCI
|
Excluded components
recorded directly
in income
(a)
|
Effective portion recorded in OCI
|
|||||||||||||
|
Foreign exchange derivatives
|
$
|
(85
|
)
|
$
|
571
|
|
$
|
(80
|
)
|
$
|
480
|
|
|||||
|
Gains/(losses) recorded in income and
other comprehensive income/(loss)
|
|||||||||||||||||
|
2013
|
2012
|
||||||||||||||||
|
Six months ended June 30,
(in millions)
|
Excluded components recorded directly
in income
(a)
|
Effective portion recorded in OCI
|
Excluded components
recorded directly
in income
(a)
|
Effective portion recorded in OCI
|
|||||||||||||
|
Foreign exchange derivatives
|
$
|
(162
|
)
|
$
|
991
|
|
$
|
(135
|
)
|
$
|
213
|
|
|||||
|
(a)
|
Certain components of hedging derivatives are permitted to be excluded from the assessment of hedge effectiveness, such as forward points on foreign exchange forward contracts. Amounts related to excluded components are recorded in current-period income. The Firm measures the ineffectiveness of net investment hedge accounting relationships based on changes in spot foreign currency rates, and therefore there was no ineffectiveness for net investment hedge accounting relationships during the three and six months ended June 30, 2013 and 2012.
|
Gains and losses on derivatives used for specified risk management purposes
The following table presents pretax gains/(losses) recorded on a limited number of derivatives, not designated in hedge accounting relationships, that are used to manage risks associated with certain specified assets and liabilities, including certain risks arising from the mortgage pipeline, warehouse loans, MSRs, wholesale lending exposures, AFS securities, foreign currency-denominated liabilities, and commodities-related contracts and investments.
|
Derivatives gains/(losses)
recorded in income
|
|||||||||||||
|
Three months ended June 30,
|
Six months ended June 30,
|
||||||||||||
|
(in millions)
|
2013
|
2012
|
2013
|
2012
|
|||||||||
|
Contract type
|
|||||||||||||
|
Interest rate
(a)
|
$
|
269
|
|
$
|
2,307
|
|
$
|
727
|
|
$
|
2,843
|
|
|
|
Credit
(b)
|
(8
|
)
|
(13
|
)
|
(39
|
)
|
(87
|
)
|
|||||
|
Foreign exchange
(c)
|
—
|
|
42
|
|
1
|
|
47
|
|
|||||
|
Commodity
(d)
|
40
|
|
13
|
|
74
|
|
3
|
|
|||||
|
Total
|
$
|
301
|
|
$
|
2,349
|
|
$
|
763
|
|
$
|
2,806
|
|
|
|
(a)
|
Primarily relates to interest rate derivatives used to hedge the interest rate risks associated with the mortgage pipeline, warehouse loans and MSRs. Gains and losses were recorded predominantly in mortgage fees and related income.
|
|
(b)
|
Relates to credit derivatives used to mitigate credit risk associated with lending exposures in the Firm’s wholesale businesses, and single-name credit derivatives used to mitigate credit risk arising from certain AFS securities. These derivatives do not include the synthetic credit portfolio or credit derivatives used to mitigate counterparty credit risk arising from derivative receivables, both of which are included in gains and losses on derivatives related to market-making activities and other derivatives. Gains and losses were recorded in principal transactions revenue.
|
|
(c)
|
Primarily relates to hedges of the foreign exchange risk of specified foreign currency-denominated liabilities. Gains and losses were recorded in principal transactions revenue and net interest income.
|
|
(d)
|
Primarily relates to commodity derivatives used to mitigate energy price risk associated with energy-related contracts and investments. Gains and losses were recorded in principal transactions revenue.
|
Gains and losses on derivatives related to market-making activities and other derivatives
The Firm makes markets in derivatives in order to meet the needs of customers and uses derivatives to manage certain risks associated with net open risk positions from the Firm’s market-making activities, including the counterparty credit risk arising from derivative receivables. These derivatives, as well as all other derivatives (including the synthetic credit portfolio) that are not included in the hedge accounting or specified risk management categories above, are included in this category. Gains and losses on these derivatives are recorded in principal transactions revenue. See Note 6 on pages
143–144
of this Form 10-Q for information on principal transactions revenue.
140
Credit derivatives
For a more detailed discussion of credit derivatives, see Note 6 on pages 218–227 of JPMorgan Chase’s 2012 Annual Report.
The Firm is both a purchaser and seller of protection in the credit derivatives market and uses these derivatives for two primary purposes. First, in its capacity as a market-maker, the Firm actively manages a portfolio of credit derivatives by purchasing and selling credit protection, predominantly on corporate debt obligations, to meet the needs of customers. Second, as an end-user, the Firm uses credit derivatives to manage credit risk associated with lending exposures (loans and unfunded commitments) and derivatives counterparty exposures in the Firm’s wholesale businesses, and to manage the credit risk arising from certain AFS securities and from certain financial instruments in the Firm’s market-making businesses. For more information on the synthetic credit portfolio, see footnote (b) to the table on page
131
of this Note.
The following tables present a summary of the notional amounts of credit derivatives and credit-related notes the Firm sold and purchased as of June 30, 2013, and
December 31, 2012. Upon a credit event, the Firm as a seller of protection would typically pay out only a percentage of the full notional amount as the amount actually required to be paid on the contracts takes into account the recovery value of the reference obligation at the time of settlement. The Firm manages the credit risk on contracts to sell protection by purchasing protection with identical or similar underlying reference entities. Other purchased protection referenced in the following tables includes credit derivatives bought on related, but not identical, reference positions (including indices, portfolio coverage and other reference points) as well as protection purchased through credit-related notes.
The Firm does not use notional amounts of credit derivatives as the primary measure of risk management for such derivatives, because the notional amount does not take into account the probability of the occurrence of a credit event, the recovery value of the reference obligation, or related cash instruments and economic hedges, each of which reduces, in the Firm’s view, the risks associated with such derivatives.
Total credit derivatives and credit-related notes
|
Maximum payout/Notional amount
|
|||||||||||||
|
June 30, 2013
(in millions)
|
Protection sold
|
Protection purchased with
identical underlyings
(b)
|
Net protection (sold)/purchased
(c)
|
Other protection purchased
(d)
|
|||||||||
|
Credit derivatives
|
|||||||||||||
|
Credit default swaps
|
$
|
(3,078,623
|
)
|
$
|
3,076,709
|
|
$
|
(1,914
|
)
|
$
|
8,653
|
|
|
|
Other credit derivatives
(a)
|
(77,146
|
)
|
20,660
|
|
(56,486
|
)
|
29,551
|
|
|||||
|
Total credit derivatives
|
(3,155,769
|
)
|
3,097,369
|
|
(58,400
|
)
|
38,204
|
|
|||||
|
Credit-related notes
|
(149
|
)
|
—
|
|
(149
|
)
|
2,276
|
|
|||||
|
Total
|
$
|
(3,155,918
|
)
|
$
|
3,097,369
|
|
$
|
(58,549
|
)
|
$
|
40,480
|
|
|
|
Maximum payout/Notional amount
|
|||||||||||||
|
December 31, 2012 (in millions)
|
Protection sold
|
Protection purchased with
identical underlyings
(b)
|
Net protection (sold)/purchased
(c)
|
Other protection purchased
(d)
|
|||||||||
|
Credit derivatives
|
|||||||||||||
|
Credit default swaps
|
$
|
(2,954,705
|
)
|
$
|
2,879,105
|
|
$
|
(75,600
|
)
|
$
|
42,460
|
|
|
|
Other credit derivatives
(a)
|
(66,244
|
)
|
5,649
|
|
(60,595
|
)
|
33,174
|
|
|||||
|
Total credit derivatives
|
(3,020,949
|
)
|
2,884,754
|
|
(136,195
|
)
|
75,634
|
|
|||||
|
Credit-related notes
|
(233
|
)
|
—
|
|
(233
|
)
|
3,255
|
|
|||||
|
Total
|
$
|
(3,021,182
|
)
|
$
|
2,884,754
|
|
$
|
(136,428
|
)
|
$
|
78,889
|
|
|
|
(a)
|
Primarily consists of total return swaps and CDS options.
|
|
(b)
|
Represents the total notional amount of protection purchased where the underlying reference instrument is identical to the reference instrument on protection sold; the notional amount of protection purchased for each individual identical underlying reference instrument may be greater or lower than the notional amount of protection sold.
|
|
(c)
|
Does not take into account the fair value of the reference obligation at the time of settlement, which would generally reduce the amount the seller of protection pays to the buyer of protection in determining settlement value.
|
|
(d)
|
Represents protection purchased by the Firm on referenced instruments (single-name, portfolio or index) where the Firm has not sold any protection on the identical reference instrument.
|
141
The following tables summarize the notional and fair value amounts of credit derivatives and credit-related notes as of June 30, 2013, and December 31, 2012, where
JPMorgan Chase
is the seller of protection. The maturity profile is based on the remaining contractual maturity of the credit derivative contracts. The ratings profile is based on the rating of the reference entity on which the credit derivative contract is based. The ratings and maturity profile of credit derivatives and credit-related notes where JPMorgan Chase is the purchaser of protection are comparable to the profile reflected below.
|
Protection sold – credit derivatives and credit-related notes ratings
(a)
/maturity profile
|
|||||||||||||||||||||
|
June 30, 2013
(in millions)
|
<1 year
|
1–5 years
|
>5 years
|
Total
notional amount
|
Fair value of receivables
(b)
|
Fair value of payables
(b)
|
Net fair value
|
||||||||||||||
|
Risk rating of reference entity
|
|||||||||||||||||||||
|
Investment-grade
|
$
|
(370,635
|
)
|
$
|
(1,753,481
|
)
|
$
|
(132,951
|
)
|
$
|
(2,257,067
|
)
|
$
|
20,698
|
|
$
|
(19,788
|
)
|
$
|
910
|
|
|
Noninvestment-grade
|
(194,013
|
)
|
(672,521
|
)
|
(32,317
|
)
|
(898,851
|
)
|
21,579
|
|
(27,524
|
)
|
(5,945
|
)
|
|||||||
|
Total
|
$
|
(564,648
|
)
|
$
|
(2,426,002
|
)
|
$
|
(165,268
|
)
|
$
|
(3,155,918
|
)
|
$
|
42,277
|
|
$
|
(47,312
|
)
|
$
|
(5,035
|
)
|
|
December 31, 2012 (in millions)
|
<1 year
|
1–5 years
|
>5 years
|
Total
notional amount
|
Fair value of receivables
(b)
|
Fair value of payables
(b)
|
Net fair value
|
||||||||||||||
|
Risk rating of reference entity
|
|||||||||||||||||||||
|
Investment-grade
|
$
|
(409,748
|
)
|
$
|
(1,383,644
|
)
|
$
|
(224,001
|
)
|
$
|
(2,017,393
|
)
|
$
|
16,690
|
|
$
|
(22,393
|
)
|
$
|
(5,703
|
)
|
|
Noninvestment-grade
|
(214,949
|
)
|
(722,115
|
)
|
(66,725
|
)
|
(1,003,789
|
)
|
22,355
|
|
(36,815
|
)
|
(14,460
|
)
|
|||||||
|
Total
|
$
|
(624,697
|
)
|
$
|
(2,105,759
|
)
|
$
|
(290,726
|
)
|
$
|
(3,021,182
|
)
|
$
|
39,045
|
|
$
|
(59,208
|
)
|
$
|
(20,163
|
)
|
|
(a)
|
The ratings scale is based on the Firm’s internal ratings, which generally correspond to ratings as defined by S&P and Moody’s.
|
|
(b)
|
Amounts are shown on a gross basis, before the benefit of legally enforceable master netting agreements and cash collateral received by the Firm.
|
142
For a discussion of the components of and accounting policies for the Firm’s noninterest revenue, see Note 7 on pages 228–229 of JPMorgan Chase’s 2012 Annual Report.
The following table presents the components of investment banking fees.
|
Three months ended June 30,
|
Six months ended
June 30,
|
||||||||||||||
|
(in millions)
|
2013
|
2012
|
2013
|
2012
|
|||||||||||
|
Underwriting
|
|||||||||||||||
|
Equity
|
$
|
457
|
|
$
|
250
|
|
$
|
730
|
|
$
|
526
|
|
|||
|
Debt
|
956
|
|
654
|
|
1,873
|
|
1,477
|
|
|||||||
|
Total underwriting
|
1,413
|
|
904
|
|
2,603
|
|
2,003
|
|
|||||||
|
Advisory
|
304
|
|
353
|
|
559
|
|
635
|
|
|||||||
|
Total investment banking fees
|
$
|
1,717
|
|
$
|
1,257
|
|
$
|
3,162
|
|
$
|
2,638
|
|
|||
Principal transactions revenue includes realized and unrealized gains and losses recorded on derivatives, other financial instruments and private equity investments.
Principal transactions revenue also includes certain realized and unrealized gains and losses related to hedge accounting and specified risk management activities disclosed separately in Note 5, including: (a) certain derivatives designated in qualifying hedge accounting relationships (primarily fair value hedges of commodity and foreign exchange risk), (b) certain derivatives used for specific risk management purposes, primarily to mitigate credit risk, foreign exchange risk and commodity risk, and (c) other derivatives, including the synthetic credit portfolio. See Note 5 on pages
131–142
of this Form 10-Q for information on the income statement classification of gains and losses on derivatives.
Principal transactions revenue also includes revenue associated with market-making and client-driven activities that involve physical commodities. The Firm, through its Global Commodities Group within CIB (“Commodities Group”) generally provides risk management, investment and financing solutions to clients globally both through financial derivatives transactions, as well as through physical commodities transactions. On the financial side, the Commodities Group engages in OTC derivatives transactions (e.g., swaps, forwards, options) and exchange-traded derivatives referencing various types of commodities (see below and Note 5 - Derivative instruments for further information). On the physical side, the Commodities Group engages in the purchase, sale, transport, and storage of power, gas, liquefied natural gas, coal, crude oil, refined products, precious and base metals among others. Realized gains and losses and unrealized losses arising from market-making and client-driven activities involving physical commodities inventories that are generally carried at the lower of cost or market (market approximates fair value), subject to any applicable fair value hedge accounting adjustments, are recorded in principal transactions revenue. Fees relating to storage and transportation are recorded in other income. These fees are generally
recognized over the arrangement period. Expenses relating to such activities are recorded in other expense (see Note 10 on page
146
of this Form 10-Q for further information).
The following table presents all realized and unrealized gains and losses recorded in principal transactions revenue by major underlying type of risk exposures.
|
Three months ended June 30,
|
Six months ended
June 30,
|
||||||||||||||
|
(in millions)
|
2013
|
2012
|
2013
|
2012
|
|||||||||||
|
Trading revenue by risk exposure
|
|||||||||||||||
|
Interest rate
|
$
|
564
|
|
$
|
1,228
|
|
$
|
1,153
|
|
$
|
2,573
|
|
|||
|
Credit
(a)
|
733
|
|
(3,583
|
)
|
1,878
|
|
(4,567
|
)
|
|||||||
|
Foreign exchange
|
554
|
|
245
|
|
1,043
|
|
793
|
|
|||||||
|
Equity
|
888
|
|
712
|
|
2,010
|
|
1,535
|
|
|||||||
|
Commodity
(b)
|
541
|
|
617
|
|
1,229
|
|
1,244
|
|
|||||||
|
Total trading revenue
|
3,280
|
|
(781
|
)
|
7,313
|
|
1,578
|
|
|||||||
|
Private equity gains/(losses)
(c)
|
480
|
|
354
|
|
208
|
|
717
|
|
|||||||
|
Principal transactions
(d)
|
$
|
3,760
|
|
$
|
(427
|
)
|
$
|
7,521
|
|
$
|
2,295
|
|
|||
|
(a)
|
Included
$4.4 billion
and
$5.8 billion
of losses incurred by CIO from the synthetic credit portfolio for the three and six months ended June 30, 2012. In June 2012, CIO identified a portion of the synthetic credit portfolio that aggregated a notional amount of approximately
$12 billion
; subsequent losses of
$240 million
are included in the 2012 amounts.
|
|
(b)
|
Includes realized gains and losses and unrealized losses on physical commodities inventories that are generally carried at the lower of cost or market (market approximates fair value), subject to any applicable fair value hedge accounting adjustments, and gains and losses on commodity derivatives and other financial instruments that are carried at fair value through income. Commodity derivatives are frequently used to manage the Firm’s risk exposure to its physical commodities inventories related to market-making and client-driven activities. Gains/(losses) related to commodity fair value hedges were
$114 million
and
$203 million
for the three months ended June 30, 2013 and 2012, respectively. Gains/(losses) related to commodity fair value hedges were
$140 million
and
$(279) million
for the six months ended June 30, 2013 and 2012, respectively.
|
|
(c)
|
Includes revenue on private equity investments held in the Private Equity business within Corporate/Private Equity, as well as those held in other business segments.
|
|
(d)
|
Principal transactions revenue includes DVA related to structured notes and derivative liabilities measured at fair value in CIB. DVA gains/(losses) were
$355 million
and
$755 million
for the three months ended June 30, 2013 and 2012, respectively, and
$481 million
and
$(152) million
for the six months ended June 30, 2013 and 2012, respectively.
|
143
The following table presents the components of asset management, administration and commissions.
|
Three months ended June 30,
|
Six months ended
June 30,
|
||||||||||||||
|
(in millions)
|
2013
|
2012
|
2013
|
2012
|
|||||||||||
|
Asset management
(a)
|
|||||||||||||||
|
Investment management fees
(b)
|
$
|
1,948
|
|
$
|
1,607
|
|
$
|
3,773
|
|
$
|
3,152
|
|
|||
|
All other asset management fees
(c)
|
139
|
|
68
|
|
263
|
|
131
|
|
|||||||
|
Total asset management fees
|
2,087
|
|
1,675
|
|
4,036
|
|
3,283
|
|
|||||||
|
Total administration fees
(d)
|
548
|
|
559
|
|
1,075
|
|
1,094
|
|
|||||||
|
Commission and other fees
|
|||||||||||||||
|
Brokerage commissions
|
625
|
|
585
|
|
1,205
|
|
1,240
|
|
|||||||
|
All other commissions and fees
|
605
|
|
642
|
|
1,148
|
|
1,236
|
|
|||||||
|
Total commissions and fees
|
1,230
|
|
1,227
|
|
2,353
|
|
2,476
|
|
|||||||
|
Total asset management, administration and commissions
|
$
|
3,865
|
|
$
|
3,461
|
|
$
|
7,464
|
|
$
|
6,853
|
|
|||
|
(a)
|
The Firm has contractual arrangements with third parties to provide certain services in connection with its asset management activities. Generally, amounts paid to third-party service providers are expensed, such that asset management fees are recorded gross of payments made to third parties.
|
|
(b)
|
Represents fees earned from managing assets on behalf of Firm clients, including investors in Firm-sponsored funds or owners of separately managed investment accounts.
|
|
(c)
|
Represents fees for services that are ancillary to investment management services, such as commissions earned on the sales or distribution of mutual funds to clients.
|
|
(d)
|
Predominantly, includes fees for custody, securities lending, funds services and securities clearance.
|
Other income
Included in other income is operating lease income of
$363 million
and
$328 million
for the three months ended June 30, 2013 and 2012, respectively, and
$712 million
and
$651 million
for the six months ended June 30, 2013 and 2012, respectively.
For a description of JPMorgan Chase’s accounting policies regarding interest income and interest expense, see Note 8 on page 230 of JPMorgan Chase’s 2012 Annual Report.
Details of interest income and interest expense were as follows.
|
Three months ended June 30,
|
Six months ended
June 30,
|
||||||||||||||
|
(in millions)
|
2013
|
2012
|
2013
|
2012
|
|||||||||||
|
Interest income
|
|||||||||||||||
|
Loans
|
$
|
8,341
|
|
$
|
8,902
|
|
$
|
16,854
|
|
$
|
18,004
|
|
|||
|
Securities
|
1,778
|
|
2,101
|
|
3,668
|
|
4,396
|
|
|||||||
|
Trading assets
|
2,197
|
|
2,265
|
|
4,470
|
|
4,659
|
|
|||||||
|
Federal funds sold and securities purchased under resale agreements
|
490
|
|
646
|
|
1,004
|
|
1,297
|
|
|||||||
|
Securities borrowed
|
(30
|
)
|
(c)
|
(12
|
)
|
(c)
|
(36
|
)
|
(c)
|
25
|
|
||||
|
Deposits with banks
|
222
|
|
136
|
|
385
|
|
288
|
|
|||||||
|
Other assets
(a)
|
147
|
|
61
|
|
227
|
|
131
|
|
|||||||
|
Total interest income
|
$
|
13,145
|
|
$
|
14,099
|
|
$
|
26,572
|
|
$
|
28,800
|
|
|||
|
Interest expense
|
|||||||||||||||
|
Interest-bearing deposits
|
$
|
539
|
|
$
|
737
|
|
$
|
1,084
|
|
$
|
1,459
|
|
|||
|
Short-term and other liabilities
(b)
|
515
|
|
513
|
|
1,035
|
|
922
|
|
|||||||
|
Long-term debt
|
1,261
|
|
1,538
|
|
2,556
|
|
3,260
|
|
|||||||
|
Beneficial interests issued by consolidated VIEs
|
126
|
|
165
|
|
260
|
|
347
|
|
|||||||
|
Total interest expense
|
$
|
2,441
|
|
$
|
2,953
|
|
$
|
4,935
|
|
$
|
5,988
|
|
|||
|
Net interest income
|
$
|
10,704
|
|
$
|
11,146
|
|
$
|
21,637
|
|
$
|
22,812
|
|
|||
|
Provision for credit losses
|
47
|
|
214
|
|
664
|
|
940
|
|
|||||||
|
Net interest income after provision for credit losses
|
$
|
10,657
|
|
$
|
10,932
|
|
$
|
20,973
|
|
$
|
21,872
|
|
|||
|
(a)
|
Largely margin loans.
|
|
(b)
|
Includes brokerage customer payables.
|
|
(c)
|
Negative interest income is a result of increased client-driven demand for certain securities combined with the impact of low interest rates; the offset of this matched book activity is reflected as lower net interest expense reported within short-term and other liabilities.
|
144
For a discussion of JPMorgan Chase’s pension and other postretirement employee benefit (“OPEB”) plans, see Note 9 on pages 231–240 of JPMorgan Chase’s 2012 Annual Report.
The following table presents the components of net periodic benefit costs reported in the Consolidated Statements of Income for the Firm’s U.S. and non-U.S. defined benefit pension, defined contribution and OPEB plans.
|
Pension plans
|
||||||||||||||||||||
|
U.S.
|
Non-U.S.
|
OPEB plans
|
||||||||||||||||||
|
Three months ended June 30, (in millions)
|
2013
|
|
2012
|
|
2013
|
|
2012
|
|
2013
|
|
2012
|
|
||||||||
|
Components of net periodic benefit cost
|
||||||||||||||||||||
|
Benefits earned during the period
|
$
|
79
|
|
$
|
68
|
|
$
|
8
|
|
$
|
9
|
|
$
|
—
|
|
$
|
—
|
|
||
|
Interest cost on benefit obligations
|
111
|
|
121
|
|
30
|
|
31
|
|
9
|
|
11
|
|
||||||||
|
Expected return on plan assets
|
(238
|
)
|
(223
|
)
|
(34
|
)
|
(34
|
)
|
(24
|
)
|
(23
|
)
|
||||||||
|
Amortization:
|
||||||||||||||||||||
|
Net (gain)/loss
|
67
|
|
73
|
|
12
|
|
8
|
|
—
|
|
(2
|
)
|
||||||||
|
Prior service cost/(credit)
|
(11
|
)
|
(10
|
)
|
—
|
|
—
|
|
—
|
|
—
|
|
||||||||
|
Net periodic defined benefit cost
|
8
|
|
29
|
|
16
|
|
14
|
|
(15
|
)
|
(14
|
)
|
||||||||
|
Other defined benefit pension plans
(a)
|
4
|
|
3
|
|
4
|
|
1
|
|
NA
|
|
NA
|
|
||||||||
|
Total defined benefit plans
|
12
|
|
32
|
|
20
|
|
15
|
|
(15
|
)
|
(14
|
)
|
||||||||
|
Total defined contribution plans
|
115
|
|
107
|
|
80
|
|
75
|
|
NA
|
|
NA
|
|
||||||||
|
Total pension and OPEB cost included in compensation expense
|
$
|
127
|
|
$
|
139
|
|
$
|
100
|
|
$
|
90
|
|
$
|
(15
|
)
|
$
|
(14
|
)
|
||
|
Pension plans
|
||||||||||||||||||||
|
U.S.
|
Non-U.S.
|
OPEB plans
|
||||||||||||||||||
|
Six months ended June 30, (in millions)
|
2013
|
|
2012
|
|
2013
|
|
2012
|
|
2013
|
|
2012
|
|
||||||||
|
Components of net periodic benefit cost
|
||||||||||||||||||||
|
Benefits earned during the period
|
$
|
157
|
|
$
|
136
|
|
$
|
17
|
|
$
|
19
|
|
$
|
—
|
|
$
|
—
|
|
||
|
Interest cost on benefit obligations
|
223
|
|
227
|
|
60
|
|
62
|
|
18
|
|
22
|
|
||||||||
|
Expected return on plan assets
|
(477
|
)
|
(418
|
)
|
(68
|
)
|
(67
|
)
|
(46
|
)
|
(45
|
)
|
||||||||
|
Amortization:
|
|
|
|
|
|
|
|
|
|
|
|
|
||||||||
|
Net (gain)/loss
|
135
|
|
145
|
|
24
|
|
17
|
|
1
|
|
—
|
|
||||||||
|
Prior service cost/(credit)
|
(21
|
)
|
(21
|
)
|
(1
|
)
|
—
|
|
—
|
|
—
|
|
||||||||
|
Net periodic defined benefit cost
|
17
|
|
69
|
|
32
|
|
31
|
|
(27
|
)
|
(23
|
)
|
||||||||
|
Other defined benefit pension plans
(a)
|
7
|
|
7
|
|
6
|
|
3
|
|
NA
|
|
NA
|
|
||||||||
|
Total defined benefit plans
|
24
|
|
76
|
|
38
|
|
34
|
|
(27
|
)
|
(23
|
)
|
||||||||
|
Total defined contribution plans
|
220
|
|
188
|
|
159
|
|
155
|
|
NA
|
|
NA
|
|
||||||||
|
Total pension and OPEB cost included in compensation expense
|
$
|
244
|
|
$
|
264
|
|
$
|
197
|
|
$
|
189
|
|
$
|
(27
|
)
|
$
|
(23
|
)
|
||
|
(a)
|
Includes various defined benefit pension plans which are individually immaterial.
|
The fair values of plan assets for the U.S. defined benefit pension and OPEB plans and for the material non-U.S. defined benefit pension plans were
$15.1 billion
and
$3.2 billion
, respectively, as of June 30, 2013, and
$14.6 billion
and
$3.3 billion
, respectively, as of December 31, 2012. See Note 19 on pages
189–190
of this Form 10-Q for further information on unrecognized amounts (i.e., net loss and prior service costs/(credit)) reflected in AOCI for the three and six month periods ended June 30, 2013 and 2012.
The Firm does
no
t anticipate any contribution to the U.S. defined benefit pension plan in 2013 at this time. For 2013, the cost associated with funding benefits under the Firm’s U.S. non-qualified defined benefit pension plans is expected to total
$39 million
. The
2013
contributions to the non-U.S. defined benefit pension and OPEB plans are expected to be
$39 million
and
$2 million
, respectively.
145
For a discussion of the accounting policies and other information relating to employee stock-based incentives, see Note 10 on pages 241–243 of JPMorgan Chase’s 2012 Annual Report.
The Firm recognized the following noncash compensation expense related to its various employee stock-based incentive plans in its Consolidated Statements of Income.
|
Three months ended June 30,
|
Six months ended June 30,
|
||||||||||||||
|
(in millions)
|
2013
|
2012
|
2013
|
2012
|
|||||||||||
|
Cost of prior grants of restricted stock units (“RSUs”) and stock appreciation rights (“SARs”) that are amortized over their applicable vesting periods
|
$
|
372
|
|
$
|
450
|
|
$
|
756
|
|
$
|
1,032
|
|
|||
|
Accrual of estimated costs of RSUs and SARs to be granted in future periods including those to full-career eligible employees
|
214
|
|
159
|
|
471
|
|
409
|
|
|||||||
|
Total noncash compensation expense related to employee stock-based incentive plans
|
$
|
586
|
|
$
|
609
|
|
$
|
1,227
|
|
$
|
1,441
|
|
|||
In the first quarter of 2013, in connection with its annual incentive grant for the 2012 performance year, the Firm granted
43 million
RSUs and
12 million
SARs with weighted-average grant date fair values of
$46.58
per RSU and
$9.56
per SAR.
The following table presents the components of noninterest expense.
|
Three months ended June 30,
|
Six months ended June 30,
|
||||||||||||||
|
(in millions)
|
2013
|
2012
|
2013
|
2012
|
|||||||||||
|
Compensation expense
|
$
|
8,019
|
|
$
|
7,427
|
|
$
|
16,433
|
|
$
|
16,040
|
|
|||
|
Noncompensation expense:
|
|||||||||||||||
|
Occupancy expense
|
904
|
|
1,080
|
|
1,805
|
|
2,041
|
|
|||||||
|
Technology, communications and equipment expense
|
1,361
|
|
1,282
|
|
2,693
|
|
2,553
|
|
|||||||
|
Professional and outside services
|
1,901
|
|
1,857
|
|
3,635
|
|
3,652
|
|
|||||||
|
Marketing
|
578
|
|
642
|
|
1,167
|
|
1,322
|
|
|||||||
|
Other expense
(a)(b)(c)
|
2,951
|
|
2,487
|
|
5,252
|
|
7,319
|
|
|||||||
|
Amortization of intangibles
|
152
|
|
191
|
|
304
|
|
384
|
|
|||||||
|
Total noncompensation expense
|
7,847
|
|
7,539
|
|
14,856
|
|
17,271
|
|
|||||||
|
Total noninterest expense
|
$
|
15,866
|
|
$
|
14,966
|
|
$
|
31,289
|
|
$
|
33,311
|
|
|||
|
(a)
|
Included litigation expense of
$678 million
and
$323 million
for the three months ended June 30, 2013 and 2012, respectively, and
$1.0 billion
and
$3.0 billion
for the six months ended June 30, 2013 and 2012, respectively.
|
|
(b)
|
Included FDIC-related expense of
$392 million
and
$413 million
for the three months ended June 30, 2013 and 2012, respectively, and
$771 million
and
$814 million
for the six months ended June 30, 2013 and 2012, respectively.
|
|
(c)
|
Includes certain expenses relating to the Commodities Group activities, including storage, transportation and tolling arrangements.
|
146
Securities are primarily classified as AFS or trading. Securities classified as trading are discussed in Note 3 on pages
114–127
of this Form 10-Q. Predominantly all of the AFS securities portfolio is held by CIO in connection with its asset-liability management objectives. At both June 30, 2013, and December 31, 2012, the average credit rating of the debt securities comprising the AFS portfolio was
AA+
(based upon external ratings where available and, where not available, based primarily upon internal ratings which correspond to ratings as defined by S&P and Moody’s). For additional information regarding AFS securities, see Note 12 on pages 244–248 of JPMorgan Chase’s 2012 Annual Report.
Realized gains and losses
The following table presents realized gains and losses and other-than-temporary impairment losses (“OTTI”) from AFS securities that were recognized in income.
|
Three months ended June 30,
|
Six months ended June 30,
|
||||||||||||
|
(in millions)
|
2013
|
|
2012
|
|
2013
|
|
2012
|
|
|||||
|
Realized gains
|
$
|
143
|
|
$
|
1,148
|
|
$
|
664
|
|
$
|
1,887
|
|
|
|
Realized losses
|
(13
|
)
|
(78
|
)
|
(25
|
)
|
(274
|
)
|
|||||
|
Net realized gains
(a)
|
130
|
|
1,070
|
|
639
|
|
1,613
|
|
|||||
|
Other-than-temporary impairment losses:
|
|||||||||||||
|
Credit-related
(b)
|
—
|
|
(19
|
)
|
—
|
|
(26
|
)
|
|||||
|
Securities the Firm intends to sell
(c)
|
(6
|
)
|
(37
|
)
|
(6
|
)
|
(37
|
)
|
|||||
|
Total OTTI losses recognized in income
|
(6
|
)
|
(56
|
)
|
(6
|
)
|
(63
|
)
|
|||||
|
Net securities gains
|
$
|
124
|
|
$
|
1,014
|
|
$
|
633
|
|
$
|
1,550
|
|
|
|
(a)
|
Proceeds from securities sold were within approximately
1%
and
3%
of amortized cost for the three and six months ended June 30, 2013, respectively and within
4%
of amortized cost for both the three and six months ended June 30, 2012.
|
|
(b)
|
Includes OTTI losses recognized in income on certain prime mortgage-backed securities for the three months ended June 30, 2012; and certain obligations of U.S. states and municipalities and prime mortgage-backed securities for the six months ended June 30, 2012.
|
|
(c)
|
Represents the excess of the amortized cost over the fair value of certain non-U.S. corporate debt securities and non-U.S. government debt securities for the three and six months ended June 30, 2013, and certain non-U.S. corporate debt securities for the three and six months ended for June 30, 2012, that the firm intends to sell.
|
The amortized costs and estimated fair values of AFS and held-to-maturity (“HTM”) securities were as follows for the dates indicated.
|
June 30, 2013
|
December 31, 2012
|
||||||||||||||||||||||||||
|
(in millions)
|
Amortized cost
|
Gross unrealized gains
|
Gross unrealized losses
|
Fair value
|
Amortized cost
|
Gross unrealized gains
|
Gross unrealized losses
|
Fair value
|
|||||||||||||||||||
|
Available-for-sale debt securities
|
|||||||||||||||||||||||||||
|
Mortgage-backed securities:
|
|||||||||||||||||||||||||||
|
U.S. government agencies
(a)
|
$
|
99,742
|
|
$
|
2,689
|
|
$
|
1,117
|
|
$
|
101,314
|
|
$
|
93,693
|
|
$
|
4,708
|
|
$
|
13
|
|
$
|
98,388
|
|
|||
|
Residential:
|
|||||||||||||||||||||||||||
|
Prime and Alt-A
|
1,927
|
|
49
|
|
32
|
|
|
1,944
|
|
1,853
|
|
83
|
|
3
|
|
1,933
|
|
||||||||||
|
Subprime
|
709
|
|
23
|
|
—
|
|
732
|
|
825
|
|
28
|
|
—
|
|
853
|
|
|||||||||||
|
Non-U.S.
|
61,597
|
|
1,299
|
|
8
|
|
62,888
|
|
70,358
|
|
1,524
|
|
29
|
|
71,853
|
|
|||||||||||
|
Commercial
|
12,404
|
|
620
|
|
40
|
|
12,984
|
|
12,268
|
|
948
|
|
13
|
|
13,203
|
|
|||||||||||
|
Total mortgage-backed securities
|
176,379
|
|
4,680
|
|
1,197
|
|
179,862
|
|
178,997
|
|
7,291
|
|
58
|
|
186,230
|
|
|||||||||||
|
U.S. Treasury and government agencies
(a)
|
22,804
|
|
302
|
|
208
|
|
22,898
|
|
12,022
|
|
116
|
|
8
|
|
12,130
|
|
|||||||||||
|
Obligations of U.S. states and municipalities
|
24,509
|
|
782
|
|
758
|
|
24,533
|
|
19,876
|
|
1,845
|
|
10
|
|
21,711
|
|
|||||||||||
|
Certificates of deposit
|
1,582
|
|
7
|
|
1
|
|
1,588
|
|
2,781
|
|
4
|
|
2
|
|
2,783
|
|
|||||||||||
|
Non-U.S. government debt securities
|
55,214
|
|
822
|
|
62
|
|
55,974
|
|
65,168
|
|
901
|
|
25
|
|
66,044
|
|
|||||||||||
|
Corporate debt securities
(b)
|
27,937
|
|
401
|
|
99
|
|
28,239
|
|
37,999
|
|
694
|
|
84
|
|
38,609
|
|
|||||||||||
|
Asset-backed securities:
|
|||||||||||||||||||||||||||
|
Collateralized loan obligations
|
27,039
|
|
326
|
|
47
|
|
27,318
|
|
27,483
|
|
465
|
|
52
|
|
27,896
|
|
|||||||||||
|
Other
|
11,503
|
|
197
|
|
3
|
|
11,697
|
|
12,816
|
|
166
|
|
11
|
|
12,971
|
|
|||||||||||
|
Total available-for-sale debt securities
|
346,967
|
|
7,517
|
|
2,375
|
|
352,109
|
|
357,142
|
|
11,482
|
|
250
|
|
368,374
|
|
|||||||||||
|
Available-for-sale equity securities
|
2,595
|
|
15
|
|
—
|
|
2,610
|
|
2,750
|
|
21
|
|
—
|
|
2,771
|
|
|||||||||||
|
Total available-for-sale securities
|
$
|
349,562
|
|
$
|
7,532
|
|
$
|
2,375
|
|
$
|
354,719
|
|
$
|
359,892
|
|
$
|
11,503
|
|
$
|
250
|
|
$
|
371,145
|
|
|||
|
Total held-to-maturity securities
|
$
|
6
|
|
$
|
—
|
|
$
|
—
|
|
$
|
6
|
|
$
|
7
|
|
$
|
1
|
|
$
|
—
|
|
$
|
8
|
|
|||
|
(a)
|
Included total U.S. government-sponsored enterprise obligations with fair values of
$90.0 billion
and
$84.0 billion
at June 30, 2013, and
December 31, 2012
, respectively.
|
|
(b)
|
Consists primarily of bank debt including sovereign government-guaranteed bank debt.
|
147
Securities impairment
The following tables present the fair value and gross unrealized losses for AFS securities by aging category at June 30, 2013, and December 31, 2012.
|
Securities with gross unrealized losses
|
|||||||||||||||||||
|
Less than 12 months
|
12 months or more
|
||||||||||||||||||
|
June 30, 2013
(in millions)
|
Fair value
|
Gross unrealized losses
|
Fair value
|
Gross unrealized losses
|
Total fair value
|
Total gross unrealized losses
|
|||||||||||||
|
Available-for-sale debt securities
|
|||||||||||||||||||
|
Mortgage-backed securities:
|
|||||||||||||||||||
|
U.S. government agencies
|
$
|
34,624
|
|
$
|
1,117
|
|
$
|
—
|
|
$
|
—
|
|
$
|
34,624
|
|
$
|
1,117
|
|
|
|
Residential:
|
|||||||||||||||||||
|
Prime and Alt-A
|
1,229
|
|
31
|
|
61
|
|
1
|
|
1,290
|
|
32
|
|
|||||||
|
Subprime
|
—
|
|
—
|
|
—
|
|
—
|
|
—
|
|
—
|
|
|||||||
|
Non-U.S.
|
154
|
|
1
|
|
249
|
|
7
|
|
403
|
|
8
|
|
|||||||
|
Commercial
|
1,776
|
|
40
|
|
—
|
|
—
|
|
1,776
|
|
40
|
|
|||||||
|
Total mortgage-backed securities
|
37,783
|
|
1,189
|
|
310
|
|
8
|
|
38,093
|
|
1,197
|
|
|||||||
|
U.S. Treasury and government agencies
|
14,128
|
|
208
|
|
—
|
|
—
|
|
14,128
|
|
208
|
|
|||||||
|
Obligations of U.S. states and municipalities
|
11,969
|
|
758
|
|
—
|
|
—
|
|
11,969
|
|
758
|
|
|||||||
|
Certificates of deposit
|
286
|
|
1
|
|
—
|
|
—
|
|
286
|
|
1
|
|
|||||||
|
Non-U.S. government debt securities
|
8,023
|
|
62
|
|
—
|
|
—
|
|
8,023
|
|
62
|
|
|||||||
|
Corporate debt securities
|
5,267
|
|
72
|
|
1,628
|
|
27
|
|
6,895
|
|
99
|
|
|||||||
|
Asset-backed securities:
|
|||||||||||||||||||
|
Collateralized loan obligations
|
6,820
|
|
34
|
|
906
|
|
13
|
|
7,726
|
|
47
|
|
|||||||
|
Other
|
1,320
|
|
2
|
|
142
|
|
1
|
|
1,462
|
|
3
|
|
|||||||
|
Total available-for-sale debt securities
|
85,596
|
|
2,326
|
|
2,986
|
|
49
|
|
88,582
|
|
2,375
|
|
|||||||
|
Available-for-sale equity securities
|
—
|
|
—
|
|
—
|
|
—
|
|
—
|
|
—
|
|
|||||||
|
Total securities with gross unrealized losses
|
$
|
85,596
|
|
$
|
2,326
|
|
$
|
2,986
|
|
$
|
49
|
|
$
|
88,582
|
|
$
|
2,375
|
|
|
|
Securities with gross unrealized losses
|
|||||||||||||||||||
|
Less than 12 months
|
12 months or more
|
||||||||||||||||||
|
December 31, 2012 (in millions)
|
Fair value
|
Gross unrealized losses
|
Fair value
|
Gross unrealized losses
|
Total fair value
|
Total gross unrealized losses
|
|||||||||||||
|
Available-for-sale debt securities
|
|||||||||||||||||||
|
Mortgage-backed securities:
|
|||||||||||||||||||
|
U.S. government agencies
|
$
|
2,440
|
|
$
|
13
|
|
$
|
—
|
|
$
|
—
|
|
$
|
2,440
|
|
$
|
13
|
|
|
|
Residential:
|
|||||||||||||||||||
|
Prime and Alt-A
|
218
|
|
2
|
|
76
|
|
1
|
|
294
|
|
3
|
|
|||||||
|
Subprime
|
—
|
|
—
|
|
—
|
|
—
|
|
—
|
|
—
|
|
|||||||
|
Non-U.S.
|
2,442
|
|
6
|
|
734
|
|
23
|
|
3,176
|
|
29
|
|
|||||||
|
Commercial
|
1,159
|
|
8
|
|
312
|
|
5
|
|
1,471
|
|
13
|
|
|||||||
|
Total mortgage-backed securities
|
6,259
|
|
29
|
|
1,122
|
|
29
|
|
7,381
|
|
58
|
|
|||||||
|
U.S. Treasury and government agencies
|
4,198
|
|
8
|
|
—
|
|
—
|
|
4,198
|
|
8
|
|
|||||||
|
Obligations of U.S. states and municipalities
|
907
|
|
10
|
|
—
|
|
—
|
|
907
|
|
10
|
|
|||||||
|
Certificates of deposit
|
741
|
|
2
|
|
—
|
|
—
|
|
741
|
|
2
|
|
|||||||
|
Non-U.S. government debt securities
|
14,527
|
|
21
|
|
1,927
|
|
4
|
|
16,454
|
|
25
|
|
|||||||
|
Corporate debt securities
|
2,651
|
|
10
|
|
5,641
|
|
74
|
|
8,292
|
|
84
|
|
|||||||
|
Asset-backed securities:
|
|||||||||||||||||||
|
Collateralized loan obligations
|
6,328
|
|
17
|
|
2,063
|
|
35
|
|
8,391
|
|
52
|
|
|||||||
|
Other
|
2,076
|
|
7
|
|
275
|
|
4
|
|
2,351
|
|
11
|
|
|||||||
|
Total available-for-sale debt securities
|
37,687
|
|
104
|
|
11,028
|
|
146
|
|
48,715
|
|
250
|
|
|||||||
|
Available-for-sale equity securities
|
—
|
|
—
|
|
—
|
|
—
|
|
—
|
|
—
|
|
|||||||
|
Total securities with gross unrealized losses
|
$
|
37,687
|
|
$
|
104
|
|
$
|
11,028
|
|
$
|
146
|
|
$
|
48,715
|
|
$
|
250
|
|
|
148
Other-than-temporary impairment
The following table presents OTTI losses that are included in the securities gains and losses table above.
|
Three months ended June 30,
|
Six months ended June 30,
|
||||||||||||
|
(in millions)
|
2013
|
|
2012
|
|
2013
|
|
2012
|
|
|||||
|
Debt securities the Firm does not intend to sell that have credit losses
|
|||||||||||||
|
Total OTTI
(a)
|
$
|
—
|
|
$
|
(103
|
)
|
$
|
—
|
|
$
|
(113
|
)
|
|
|
Losses recorded in/(reclassified from) AOCI
|
—
|
|
84
|
|
—
|
|
87
|
|
|||||
|
Total credit-related losses recognized in income
(b)(c)
|
—
|
|
(19
|
)
|
—
|
|
(26
|
)
|
|||||
|
Securities the Firm intends to sell
(d)
|
(6
|
)
|
(37
|
)
|
(6
|
)
|
(37
|
)
|
|||||
|
Total OTTI losses recognized in income
|
$
|
(6
|
)
|
$
|
(56
|
)
|
$
|
(6
|
)
|
$
|
(63
|
)
|
|
|
(a)
|
For initial OTTI, represents the excess of the amortized cost over the fair value of AFS debt securities. For subsequent impairments of the same security, represents additional declines in fair value subsequent to previously recorded OTTI.
|
|
(b)
|
Subsequent credit losses may be recorded on securities without a corresponding further decline in fair value if there has been a decline in expected cash flows.
|
|
(c)
|
Represents the credit loss component on certain prime mortgage-backed securities for the three months ended June 30, 2012; and certain obligations of U. S. states and municipalities and prime mortgage-backed securities for the six months ended June 30, 2012.
|
|
(d)
|
Represents the excess of the amortized cost over the fair value of certain non-U.S. corporate debt securities and non-U.S. government debt securities for the three and six months ended June 30, 2013, and certain non-U.S. corporate debt securities for the three and six months ended for June 30, 2012, that the firm intends to sell.
|
Changes in the credit loss component of credit-impaired debt securities
The following table presents a rollforward for the three and six months ended June 30, 2013 and 2012, of the credit loss component of OTTI losses that have been recognized in income related to debt securities that the Firm does not intend to sell.
|
Three months ended June 30,
|
Six months ended June 30,
|
||||||||||||
|
(in millions)
|
2013
|
|
2012
|
|
2013
|
|
2012
|
|
|||||
|
Balance, beginning of period
|
$
|
519
|
|
$
|
715
|
|
$
|
522
|
|
$
|
708
|
|
|
|
Additions:
|
|
|
|
|
|||||||||
|
Newly credit-impaired securities
|
—
|
|
14
|
|
—
|
|
20
|
|
|||||
|
Losses reclassified from other comprehensive income on previously credit-impaired securities
|
—
|
|
5
|
|
—
|
|
6
|
|
|||||
|
Reductions:
|
|||||||||||||
|
Sales of credit-impaired securities
|
—
|
|
—
|
|
(3
|
)
|
—
|
|
|||||
|
Balance, end of period
|
$
|
519
|
|
$
|
734
|
|
$
|
519
|
|
$
|
734
|
|
|
Gross unrealized losses
Gross unrealized losses have generally increased since
December 31, 2012
; however, losses on securities that have been in an unrealized loss position for 12 months or more have decreased. The Firm has recognized the unrealized losses on securities it intends to sell. As of June 30, 2013, the Firm does not intend to sell any securities with a loss position in AOCI, and it is not likely that the Firm will be required to sell these securities before recovery of their amortized cost basis. Except for the securities reported in the table above for which credit losses have been recognized in income, the Firm believes that the securities with an unrealized loss in AOCI are not other-than-temporarily impaired as of June 30, 2013.
149
Contractual maturities and yields
The following table presents the amortized cost and estimated fair value at June 30, 2013, of
JPMorgan Chase
’s AFS and HTM securities by contractual maturity.
|
By remaining maturity
June 30, 2013
(in millions)
|
Due in one
year or less
|
Due after one year through five years
|
Due after five years through 10 years
|
Due after
10 years
(c)
|
Total
|
||||||||||
|
Available-for-sale debt securities
|
|||||||||||||||
|
Mortgage-backed securities
(a)
|
|||||||||||||||
|
Amortized cost
|
$
|
293
|
|
$
|
14,218
|
|
$
|
9,652
|
|
$
|
152,216
|
|
$
|
176,379
|
|
|
Fair value
|
295
|
|
14,662
|
|
9,942
|
|
154,963
|
|
179,862
|
|
|||||
|
Average yield
(b)
|
2.08
|
%
|
2.08
|
%
|
3.09
|
%
|
3.17
|
%
|
3.07
|
%
|
|||||
|
U.S. Treasury and government agencies
(a)
|
|||||||||||||||
|
Amortized cost
|
$
|
7,432
|
|
$
|
12,497
|
|
$
|
1,931
|
|
$
|
944
|
|
$
|
22,804
|
|
|
Fair value
|
7,455
|
|
12,496
|
|
1,950
|
|
997
|
|
22,898
|
|
|||||
|
Average yield
(b)
|
0.65
|
%
|
0.41
|
%
|
0.83
|
%
|
0.78
|
%
|
0.54
|
%
|
|||||
|
Obligations of U.S. states and municipalities
|
|||||||||||||||
|
Amortized cost
|
$
|
32
|
|
$
|
466
|
|
$
|
1,335
|
|
$
|
22,676
|
|
$
|
24,509
|
|
|
Fair value
|
32
|
|
493
|
|
1,357
|
|
22,651
|
|
24,533
|
|
|||||
|
Average yield
(b)
|
2.95
|
%
|
5.27
|
%
|
4.02
|
%
|
5.91
|
%
|
5.79
|
%
|
|||||
|
Certificates of deposit
|
|||||||||||||||
|
Amortized cost
|
$
|
1,531
|
|
$
|
51
|
|
$
|
—
|
|
$
|
—
|
|
$
|
1,582
|
|
|
Fair value
|
1,535
|
|
53
|
|
—
|
|
—
|
|
1,588
|
|
|||||
|
Average yield
(b)
|
7.67
|
%
|
3.28
|
%
|
—
|
%
|
—
|
%
|
7.53
|
%
|
|||||
|
Non-U.S. government debt securities
|
|||||||||||||||
|
Amortized cost
|
$
|
11,112
|
|
$
|
16,429
|
|
$
|
25,469
|
|
$
|
2,204
|
|
$
|
55,214
|
|
|
Fair value
|
11,145
|
|
16,616
|
|
25,915
|
|
2,298
|
|
55,974
|
|
|||||
|
Average yield
(b)
|
1.90
|
%
|
2.32
|
%
|
1.20
|
%
|
1.67
|
%
|
1.69
|
%
|
|||||
|
Corporate debt securities
|
|||||||||||||||
|
Amortized cost
|
$
|
4,170
|
|
$
|
16,790
|
|
$
|
6,924
|
|
$
|
53
|
|
$
|
27,937
|
|
|
Fair value
|
4,173
|
|
17,042
|
|
6,969
|
|
55
|
|
28,239
|
|
|||||
|
Average yield
(b)
|
2.19
|
%
|
2.40
|
%
|
2.57
|
%
|
2.34
|
%
|
2.41
|
%
|
|||||
|
Asset-backed securities
|
|||||||||||||||
|
Amortized cost
|
$
|
—
|
|
$
|
2,756
|
|
$
|
14,009
|
|
$
|
21,777
|
|
$
|
38,542
|
|
|
Fair value
|
—
|
|
2,783
|
|
14,202
|
|
22,030
|
|
39,015
|
|
|||||
|
Average yield
(b)
|
—
|
%
|
1.86
|
%
|
1.76
|
%
|
1.90
|
%
|
1.85
|
%
|
|||||
|
Total available-for-sale debt securities
|
|||||||||||||||
|
Amortized cost
|
$
|
24,570
|
|
$
|
63,207
|
|
$
|
59,320
|
|
$
|
199,870
|
|
$
|
346,967
|
|
|
Fair value
|
24,635
|
|
64,145
|
|
60,335
|
|
202,994
|
|
352,109
|
|
|||||
|
Average yield
(b)
|
1.93
|
%
|
1.91
|
%
|
1.85
|
%
|
3.31
|
%
|
2.71
|
%
|
|||||
|
Available-for-sale equity securities
|
|||||||||||||||
|
Amortized cost
|
$
|
—
|
|
$
|
—
|
|
$
|
—
|
|
$
|
2,595
|
|
$
|
2,595
|
|
|
Fair value
|
—
|
|
—
|
|
—
|
|
2,610
|
|
2,610
|
|
|||||
|
Average yield
(b)
|
—
|
%
|
—
|
%
|
—
|
%
|
0.25
|
%
|
0.25
|
%
|
|||||
|
Total available-for-sale securities
|
|||||||||||||||
|
Amortized cost
|
$
|
24,570
|
|
$
|
63,207
|
|
$
|
59,320
|
|
$
|
202,465
|
|
$
|
349,562
|
|
|
Fair value
|
24,635
|
|
64,145
|
|
60,335
|
|
205,604
|
|
354,719
|
|
|||||
|
Average yield
(b)
|
1.93
|
%
|
1.91
|
%
|
1.85
|
%
|
3.27
|
%
|
2.69
|
%
|
|||||
|
Total held-to-maturity securities
|
|||||||||||||||
|
Amortized cost
|
$
|
—
|
|
$
|
5
|
|
$
|
1
|
|
$
|
—
|
|
$
|
6
|
|
|
Fair value
|
—
|
|
5
|
|
1
|
|
—
|
|
6
|
|
|||||
|
Average yield
(b)
|
—
|
%
|
6.84
|
%
|
6.64
|
%
|
—
|
%
|
6.81
|
%
|
|||||
|
(a)
|
U.S. government-sponsored enterprises were the only issuers whose securities exceeded
10%
of
JPMorgan Chase
’s total stockholders’ equity at June 30, 2013.
|
|
(b)
|
Average yield is computed using the effective yield of each security owned at the end of the period, weighted based on the amortized cost of each security. The effective yield considers the contractual coupon, amortization of premiums and accretion of discounts, and the effect of related hedging derivatives. Taxable-equivalent amounts are used where applicable. The effective yield excludes unscheduled principal prepayments; and accordingly, actual maturities of securities may differ from their contractual or expected maturities as certain securities may be prepaid.
|
|
(c)
|
Includes securities with no stated maturity. Substantially all of the Firm’s residential mortgage-backed securities and collateralized mortgage obligations are due in
10 years
or more, based on contractual maturity. The estimated duration, which reflects anticipated future prepayments based on a consensus of dealers in the market, is approximately
five years
for agency residential mortgage-backed securities,
two years
for agency residential collateralized mortgage obligations and
three years
for nonagency residential collateralized mortgage obligations.
|
150
For a discussion of accounting policies relating to securities financing activities, see Note 13 on page 249 of JPMorgan Chase’s 2012 Annual Report. For further information regarding securities borrowed and securities lending agreements for which the fair value option has been elected, see Note 4 on pages
128–130
of this Form 10-Q. For further information regarding assets pledged and collateral received in securities financing agreements, see Note 22 on page
197
of this Form 10-Q.
The following table presents as of
June 30, 2013
, and
December 31, 2012
the gross and net securities purchased under resale agreements and securities borrowed. Securities purchased under resale agreements have been presented on the Consolidated Balance Sheets net of securities sold under repurchase agreements where netting requirements have been met, including obtaining a legal opinion that supports, with sufficient confidence, the enforceability of the master netting agreement (“U.S. GAAP nettable securities purchased under resale agreements”); where such a legal opinion has either not been sought or obtained, the securities purchased under resale agreements are not netted, and are shown separately in the table below (“Securities purchased under resale agreements not nettable under U.S. GAAP”). Securities borrowed are presented on a gross basis on the Consolidated Balance Sheets.
|
June 30, 2013
|
December 31, 2012
|
||||||||||||||||||||
|
(in millions)
|
Gross asset balance
|
Amounts netted on the Consolidated Balance Sheets
|
Net asset balance
|
Gross asset balance
|
Amounts netted on the Consolidated Balance Sheets
|
Net asset balance
|
|||||||||||||||
|
Securities purchased under resale agreements
|
|||||||||||||||||||||
|
U.S. GAAP nettable securities purchased under resale agreements
|
$
|
359,377
|
|
$
|
(117,183
|
)
|
$
|
242,194
|
|
$
|
381,377
|
|
$
|
(96,947
|
)
|
$
|
284,430
|
|
|||
|
Securities purchased under resale agreements not nettable under U.S. GAAP
|
9,422
|
|
9,422
|
|
10,983
|
|
10,983
|
|
|||||||||||||
|
Total securities purchased under resale agreements
|
$
|
368,799
|
|
$
|
(117,183
|
)
|
$
|
251,616
|
|
(a)
|
$
|
392,360
|
|
$
|
(96,947
|
)
|
$
|
295,413
|
|
(a)
|
|
|
Securities borrowed
|
$
|
117,158
|
|
N/A
|
|
$
|
117,158
|
|
(b)(c)
|
$
|
119,017
|
|
N/A
|
|
$
|
119,017
|
|
(b)(c)
|
|||
|
(a)
|
At
June 30, 2013
, and
December 31, 2012
, included securities purchased under resale agreements of
$25.3 billion
and
$24.3 billion
, respectively, accounted for at fair value.
|
|
(b)
|
At
June 30, 2013
, and
December 31, 2012
, included securities borrowed of
$5.3 billion
and
$10.2 billion
, respectively, accounted for at fair value.
|
|
(c)
|
Included
$18.5 billion
and
$20.2 billion
at
June 30, 2013
, and
December 31, 2012
, respectively, of securities borrowed where a legal opinion has either not been sought or obtained to support, with sufficient confidence, the enforceability of the master netting agreement in bankruptcy. The prior period amounts have been revised with a corresponding impact in the table below. This revision had no impact on the Firm's Consolidated Balance Sheets or its results of operations.
|
The following table presents information as of
June 30, 2013
, and
December 31, 2012
regarding the U.S. GAAP nettable securities purchased under resale agreements and securities borrowed for which a legal opinion has been obtained to support, with sufficient confidence, the enforceability of the master netting agreement in bankruptcy. The below table excludes information related to resale agreements not nettable under U.S. GAAP and securities borrowed where such a legal opinion has either not been sought or obtained to support, with sufficient confidence, the enforceability of the master netting agreement in bankruptcy.
|
June 30, 2013
|
December 31, 2012
|
||||||||||||||||||||||||||
|
|
Amounts not nettable on the Consolidated Balance Sheets
(a)
|
|
Amounts not nettable on the Consolidated Balance Sheets
(a)
|
||||||||||||||||||||||||
|
(in millions)
|
Net asset balance
|
Financial instruments
(b)
|
Cash collateral
|
Net exposure
|
Net asset balance
|
Financial instruments
(b)
|
Cash collateral
|
Net exposure
|
|||||||||||||||||||
|
U.S. GAAP nettable securities purchased under resale agreements
|
$
|
242,194
|
|
$
|
(240,040
|
)
|
$
|
(767
|
)
|
$
|
1,387
|
|
$
|
284,430
|
|
$
|
(282,468
|
)
|
$
|
(998
|
)
|
$
|
964
|
|
|||
|
Securities borrowed
|
$
|
98,615
|
|
$
|
(95,978
|
)
|
$
|
(36
|
)
|
$
|
2,601
|
|
$
|
98,807
|
|
$
|
(94,858
|
)
|
$
|
—
|
|
$
|
3,949
|
|
|||
|
(a)
|
For some counterparties, the sum of the financial instruments and cash collateral not nettable on the Consolidated Balance Sheets may exceed the net asset balance. Where this is the case the total amounts reported in these two columns is limited to the balance of the net reverse repurchase agreement or securities borrowed asset with that counterparty. As a result a net exposure amount is reported even though the Firm, on a portfolio-wide basis for both its securities purchased under resale agreements and securities borrowed portfolios, has received securities collateral with a total fair value that is greater than the funds provided to counterparties.
|
|
(b)
|
Includes financial instrument collateral received and repurchase and securities loaned liabilities subject to an enforceable master netting agreement; these amounts are not presented net on the Consolidated Balance Sheets because other U.S. GAAP netting criteria are not met.
|
151
The following table presents as of
June 30, 2013
, and
December 31, 2012
the gross and net securities sold under repurchase agreements and securities loaned. Securities sold under repurchase agreements have been presented on the Consolidated Balance Sheets net of securities purchased under resale agreements where netting requirements have been met, including obtaining a legal opinion that supports, with sufficient confidence, the enforceability of the master netting agreement (“U.S. GAAP nettable securities sold under repurchase agreements”); where such a legal opinion has either not been sought or obtained, the securities sold under repurchase agreements are not netted, and are shown separately in the table below (“Securities sold under repurchase agreements not nettable under U.S. GAAP”). Securities loaned are presented on a gross basis on the Consolidated Balance Sheets.
|
June 30, 2013
|
December 31, 2012
|
||||||||||||||||||||
|
(in millions)
|
Gross liability balance
|
Amounts netted on the Consolidated Balance Sheets
|
Net liability balance
|
Gross liability balance
|
Amounts netted on the Consolidated Balance Sheets
|
Net liability balance
|
|||||||||||||||
|
Securities sold under repurchase agreements
|
|||||||||||||||||||||
|
U.S. GAAP nettable securities sold under repurchase agreements
|
$
|
340,910
|
|
$
|
(117,183
|
)
|
$
|
223,727
|
|
$
|
301,352
|
|
$
|
(96,947
|
)
|
$
|
204,405
|
|
|||
|
Securities sold under repurchase agreements not nettable under U.S. GAAP
(a)
|
9,912
|
|
9,912
|
|
11,155
|
|
11,155
|
|
|||||||||||||
|
Total securities sold under repurchase agreements
|
$
|
350,822
|
|
$
|
(117,183
|
)
|
$
|
233,639
|
|
(c)
|
$
|
312,507
|
|
$
|
(96,947
|
)
|
$
|
215,560
|
|
(c)
|
|
|
Securities loaned
(b)
|
$
|
31,999
|
|
N/A
|
|
$
|
31,999
|
|
(d)(e)
|
$
|
30,458
|
|
N/A
|
|
$
|
30,458
|
|
(d)(e)
|
|||
|
(a)
|
Includes repurchase agreements that are not subject to a master netting agreement but do provide enforceable rights to collateral.
|
|
(b)
|
Included securities-for-securities borrow vs. pledge transactions of
$7.2 billion
and
$6.9 billion
at
June 30, 2013
, and
December 31, 2012
, respectively, when acting as lender and as presented within other liabilities in the Consolidated Balance Sheets.
|
|
(c)
|
At
June 30, 2013
, and
December 31, 2012
, included securities sold under repurchase agreements of
$4.2 billion
and
$3.9 billion
, respectively, accounted for at fair value.
|
|
(d)
|
At
June 30, 2013
, and
December 31, 2012
included securities loaned of
$452 million
and
$457 million
, respectively, accounted for at fair value.
|
|
(e)
|
Included
$1.2 billion
and
$889 million
at
June 30, 2013
, and
December 31, 2012
, respectively of securities loaned where a legal opinion has not been either sought or obtained to support, with sufficient confidence, the enforceability of the master netting agreement in bankruptcy.
|
The following table presents information as of
June 30, 2013
, and
December 31, 2012
regarding the U.S. GAAP nettable securities sold under repurchase agreements and securities loaned for which a legal opinion has been obtained to support, with sufficient confidence, the enforceability of the master netting agreement in bankruptcy. The below table excludes information related to repurchase agreements not nettable under U.S. GAAP and securities loaned where a legal opinion has not been either sought or obtained to support, with sufficient confidence, the enforceability of the master netting agreement in bankruptcy.
|
June 30, 2013
|
December 31, 2012
|
||||||||||||||||||||||||||
|
|
Amounts not nettable on the Consolidated balance sheets
(a)
|
|
Amounts not nettable on the Consolidated balance sheets
(a)
|
||||||||||||||||||||||||
|
(in millions)
|
Net liability balance
|
Financial instruments
(b)
|
Cash collateral
|
Net amount
(c)
|
Net liability balance
|
Financial instruments
(b)
|
Cash collateral
|
Net amount
(c)
|
|||||||||||||||||||
|
U.S. GAAP nettable securities sold under repurchase agreements
|
$
|
223,727
|
|
$
|
(221,227
|
)
|
$
|
(409
|
)
|
$
|
2,091
|
|
$
|
204,405
|
|
$
|
(202,925
|
)
|
$
|
(162
|
)
|
$
|
1,318
|
|
|||
|
Securities loaned
|
$
|
30,831
|
|
$
|
(30,043
|
)
|
$
|
—
|
|
$
|
788
|
|
$
|
29,569
|
|
$
|
(28,465
|
)
|
$
|
—
|
|
$
|
1,104
|
|
|||
|
(a)
|
For some counterparties the sum of the financial instruments and cash collateral not nettable on the Consolidated Balance Sheets may exceed the net liability balance. Where this is the case the total amounts reported in these two columns is limited to the balance of the net repurchase agreement or securities loaned liability with that counterparty.
|
|
(b)
|
Includes financial instrument collateral transferred and reverse repurchase and securities borrowed assets subject to an enforceable master netting agreement; these amounts are not presented net on the Consolidated Balance Sheets because other U.S. GAAP netting criteria are not met.
|
|
(c)
|
Net amount represents exposure of counterparties to the Firm.
|
Transfers not qualifying for sale accounting
In addition, at
June 30, 2013
, and
December 31, 2012
, the Firm held
$11.0 billion
and
$9.6 billion
, respectively, of financial assets for which the rights have been transferred to third parties; however, the transfers did not qualify as a sale in accordance with U.S. GAAP. These transfers have been recognized as collateralized financing transactions. The transferred assets are recorded in trading assets, other
assets and loans, and the corresponding liabilities are recorded in other borrowed funds, accounts payable and other liabilities, and long-term debt, on the Consolidated Balance Sheets.
152
Loan accounting framework
The accounting for a loan depends on management’s strategy for the loan, and on whether the loan was credit-impaired at the date of acquisition. The Firm accounts for loans based on the following categories:
|
•
|
Originated or purchased loans held-for-investment (i.e., “retained”), other than purchased credit-impaired (“PCI”) loans
|
|
•
|
Loans held-for-sale
|
|
•
|
Loans at fair value
|
|
•
|
PCI loans held-for-investment
|
For a detailed discussion of loans, including accounting policies, see Note 14 on pages 250–275 of
JPMorgan Chase
’s
2012
Annual Report
. See Note 4 on pages
128–130
of
this Form 10-Q
for further information on the Firm’s elections of fair value accounting under the fair value option. See Note 3 on pages
114–127
of
this Form 10-Q
for further information on loans carried at fair value and classified as trading assets.
Loan portfolio
The Firm’s loan portfolio is divided into three portfolio segments, which are the same segments used by the Firm to determine the allowance for loan losses: Consumer, excluding credit card; Credit card; and Wholesale. Within each portfolio segment, the Firm monitors and assesses the credit risk in the following classes of loans, based on the risk characteristics of each loan class:
|
Consumer, excluding
credit card
(a)
|
Credit card
|
Wholesale
(c)
|
||
|
Residential real estate – excluding PCI
• Home equity – senior lien
• Home equity – junior lien
• Prime mortgage, including
option ARMs
• Subprime mortgage
Other consumer loans
• Auto
(b)
• Business banking
(b)
• Student and other
Residential real estate – PCI
• Home equity
• Prime mortgage
• Subprime mortgage
• Option ARMs
|
• Credit card loans
|
• Commercial and industrial
• Real estate
• Financial institutions
• Government agencies
• Other
|
||
|
(a)
|
Includes loans reported in CCB, and prime mortgage loans reported in the Asset Management (“AM”) business segment and in Corporate/Private Equity.
|
|
(b)
|
Includes certain business banking and auto dealer risk-rated loans that apply the wholesale methodology for determining the allowance for loan losses; these loans are managed by CCB, and therefore, for consistency in presentation, are included with the other consumer loan classes.
|
|
(c)
|
Includes loans reported in CIB, Commercial Banking (“CB”) and AM business segments and in Corporate/Private Equity.
|
153
The following tables summarize the Firm’s loan balances by portfolio segment.
|
June 30, 2013
|
Consumer, excluding credit card
|
Credit card
(a)
|
Wholesale
|
Total
|
|||||||||
|
(in millions)
|
|||||||||||||
|
Retained
|
$
|
287,388
|
|
$
|
124,288
|
|
$
|
308,208
|
|
$
|
719,884
|
|
(b)
|
|
Held-for-sale
|
708
|
|
—
|
|
3,071
|
|
3,779
|
|
|||||
|
At fair value
|
—
|
|
—
|
|
1,923
|
|
1,923
|
|
|||||
|
Total
|
$
|
288,096
|
|
$
|
124,288
|
|
$
|
313,202
|
|
$
|
725,586
|
|
|
|
December 31, 2012
|
Consumer, excluding credit card
|
Credit card
(a)
|
Wholesale
|
Total
|
|||||||||
|
(in millions)
|
|||||||||||||
|
Retained
|
$
|
292,620
|
|
$
|
127,993
|
|
$
|
306,222
|
|
$
|
726,835
|
|
(b)
|
|
Held-for-sale
|
—
|
|
—
|
|
4,406
|
|
4,406
|
|
|||||
|
At fair value
|
—
|
|
—
|
|
2,555
|
|
2,555
|
|
|||||
|
Total
|
$
|
292,620
|
|
$
|
127,993
|
|
$
|
313,183
|
|
$
|
733,796
|
|
|
|
(a)
|
Includes billed finance charges and fees net of an allowance for uncollectible amounts.
|
|
(b)
|
Loans (other than PCI loans and those for which the fair value option has been elected) are presented net of unearned income, unamortized discounts and premiums, and net deferred loan costs of
$2.3 billion
and
$2.5 billion
at
June 30, 2013
, and
December 31, 2012
, respectively.
|
The following tables provide information about the carrying value of retained loans purchased, sold and reclassified to held-for-sale during the periods indicated. These tables exclude loans recorded at fair value.
The
Firm manages its exposure to credit risk on an ongoing basis. Selling loans is one way that the Firm reduces its credit exposures.
|
2013
|
2012
|
|||||||||||||||||||||||||||
|
Three months ended
June 30, (in millions) |
Consumer, excluding credit card
|
Credit card
|
Wholesale
|
Total
|
Consumer, excluding credit card
|
Credit card
|
Wholesale
|
Total
|
||||||||||||||||||||
|
Purchases
|
$
|
1,590
|
|
$
|
328
|
|
$
|
191
|
|
$
|
2,109
|
|
$
|
1,854
|
|
$
|
—
|
|
$
|
253
|
|
$
|
2,107
|
|
||||
|
Sales
|
1,233
|
|
—
|
|
1,425
|
|
2,658
|
|
985
|
|
—
|
|
809
|
|
1,794
|
|
||||||||||||
|
Retained loans reclassified to held-for-sale
|
708
|
|
—
|
|
677
|
|
1,385
|
|
—
|
|
120
|
|
55
|
|
175
|
|
||||||||||||
|
2013
|
2012
|
|||||||||||||||||||||||||||
|
Six months ended
June 30, (in millions) |
Consumer, excluding credit card
|
Credit card
|
Wholesale
|
Total
|
Consumer, excluding credit card
|
Credit card
|
Wholesale
|
Total
|
||||||||||||||||||||
|
Purchases
|
$
|
4,215
|
|
$
|
328
|
|
$
|
286
|
|
$
|
4,829
|
|
$
|
3,613
|
|
$
|
—
|
|
$
|
574
|
|
$
|
4,187
|
|
||||
|
Sales
|
2,662
|
|
—
|
|
2,578
|
|
5,240
|
|
1,342
|
|
—
|
|
1,672
|
|
3,014
|
|
||||||||||||
|
Retained loans reclassified to held-for-sale
|
708
|
|
—
|
|
1,021
|
|
1,729
|
|
—
|
|
1,043
|
|
117
|
|
1,160
|
|
||||||||||||
The following table provides information about gains/(losses) on loan sales by portfolio segment.
|
Three months ended
June 30, |
Six months ended
June 30, |
||||||||||||
|
(in millions)
|
2013
|
2012
|
2013
|
2012
|
|||||||||
|
Net gains/(losses) on sales of loans (including lower of cost or fair value adjustments)
(a)
|
|||||||||||||
|
Consumer, excluding credit card
|
$
|
112
|
|
$
|
42
|
|
$
|
256
|
|
$
|
74
|
|
|
|
Credit card
|
—
|
|
6
|
|
—
|
|
(12
|
)
|
|||||
|
Wholesale
|
(14
|
)
|
36
|
|
(7
|
)
|
68
|
|
|||||
|
Total net gains/(losses) on sales of loans (including lower of cost or fair value adjustments)
|
$
|
98
|
|
$
|
84
|
|
$
|
249
|
|
$
|
130
|
|
|
|
(a)
|
Excludes sales related to loans accounted for at fair value.
|
154
Consumer, excluding credit card loan portfolio
Consumer loans, excluding credit card loans, consist primarily of residential mortgages, home equity loans and lines of credit, auto loans, business banking loans, and student and other loans, with a primary focus on serving the prime consumer credit market. The portfolio also includes home equity loans secured by junior liens and mortgage loans with interest-only payment options to predominantly prime borrowers, as well as certain payment-option loans originated by Washington Mutual that may result in negative amortization.
The table below provides information about retained consumer loans, excluding credit card, by class.
|
(in millions)
|
Jun 30,
2013 |
Dec 31,
2012 |
||||
|
Residential real estate – excluding PCI
|
||||||
|
Home equity:
|
||||||
|
Senior lien
|
$
|
18,277
|
|
$
|
19,385
|
|
|
Junior lien
|
44,049
|
|
48,000
|
|
||
|
Mortgages:
|
||||||
|
Prime, including option ARMs
|
79,179
|
|
76,256
|
|
||
|
Subprime
|
7,703
|
|
8,255
|
|
||
|
Other consumer loans
|
||||||
|
Auto
|
50,865
|
|
49,913
|
|
||
|
Business banking
|
18,730
|
|
18,883
|
|
||
|
Student and other
|
11,849
|
|
12,191
|
|
||
|
Residential real estate – PCI
|
||||||
|
Home equity
|
19,992
|
|
20,971
|
|
||
|
Prime mortgage
|
12,976
|
|
13,674
|
|
||
|
Subprime mortgage
|
4,448
|
|
4,626
|
|
||
|
Option ARMs
|
19,320
|
|
20,466
|
|
||
|
Total retained loans
|
$
|
287,388
|
|
$
|
292,620
|
|
Delinquency rates are a primary credit quality indicator for consumer loans, excluding credit card. Other indicators that are taken into consideration for consumer loans, excluding credit card, include:
|
•
|
For residential real estate loans, including both non-PCI and PCI portfolios, the current estimated LTV ratio, or the combined LTV ratio in the case of junior lien loans; the geographic distribution of the loan collateral; and the borrower’s current or “refreshed” FICO score.
|
|
•
|
For scored auto, scored business banking and student loans, the geographic distribution of the loans.
|
|
•
|
For risk-rated business banking and auto loans, the risk rating of the loan; the geographic considerations relevant to the loan; and whether the loan is considered to be criticized and/or nonaccrual.
|
|
•
|
For all business banking loans, the industry specific conditions relevant to the loans.
|
For further information on consumer credit quality indicators, see Note 14 on pages 250–275 of
JPMorgan Chase
’s
2012
Annual Report
.
Residential real estate – excluding PCI loans
The following table provides information by class for residential real estate – excluding retained PCI loans in the consumer, excluding credit card, portfolio segment.
The following factors should be considered in analyzing certain credit statistics applicable to the Firm’s residential real estate – excluding PCI loans portfolio: (i) junior lien home equity loans may be fully charged off when the loan becomes
180 days
past due, and the value of the collateral does not support the repayment of the loan, resulting in relatively high charge-off rates for this product class; and (ii) the lengthening of loss-mitigation timelines may result in higher delinquency rates for loans carried at the net realizable value of the collateral that remain on the Firm’s Consolidated Balance Sheets.
155
|
Residential real estate – excluding PCI loans
|
|||||||||||||||||||
|
Home equity
|
|||||||||||||||||||
|
(in millions, except ratios)
|
Senior lien
|
Junior lien
|
|||||||||||||||||
|
Jun 30,
2013 |
Dec 31,
2012 |
Jun 30,
2013 |
Dec 31,
2012 |
||||||||||||||||
|
Loan delinquency
(a)
|
|||||||||||||||||||
|
Current
|
$
|
17,636
|
|
$
|
18,688
|
|
$
|
43,144
|
|
$
|
46,805
|
|
|||||||
|
30–149 days past due
|
279
|
|
330
|
|
668
|
|
960
|
|
|||||||||||
|
150 or more days past due
|
362
|
|
367
|
|
237
|
|
235
|
|
|||||||||||
|
Total retained loans
|
$
|
18,277
|
|
$
|
19,385
|
|
$
|
44,049
|
|
$
|
48,000
|
|
|||||||
|
% of 30+ days past due to total retained loans
|
3.51
|
%
|
3.60
|
%
|
2.05
|
%
|
2.49
|
%
|
|||||||||||
|
90 or more days past due and still accruing
|
$
|
—
|
|
$
|
—
|
|
$
|
—
|
|
$
|
—
|
|
|||||||
|
90 or more days past due and government guarantee
d
(b)
|
—
|
|
—
|
|
—
|
|
—
|
|
|||||||||||
|
Nonaccrual loans
|
927
|
|
931
|
|
2,059
|
|
2,277
|
|
|||||||||||
|
Current estimated LTV ratios
(c)(d)(e)
|
|||||||||||||||||||
|
Greater than 125% and refreshed FICO scores:
|
|||||||||||||||||||
|
Equal to or greater than 660
|
$
|
88
|
|
$
|
197
|
|
$
|
2,416
|
|
$
|
4,561
|
|
|||||||
|
Less than 660
|
44
|
|
93
|
|
725
|
|
1,338
|
|
|||||||||||
|
101% to 125% and refreshed FICO scores:
|
|||||||||||||||||||
|
Equal to or greater than 660
|
321
|
|
491
|
|
5,891
|
|
7,089
|
|
|||||||||||
|
Less than 660
|
143
|
|
191
|
|
1,673
|
|
1,971
|
|
|||||||||||
|
80% to 100% and refreshed FICO scores:
|
|||||||||||||||||||
|
Equal to or greater than 660
|
1,161
|
|
1,502
|
|
8,810
|
|
9,604
|
|
|||||||||||
|
Less than 660
|
392
|
|
485
|
|
2,248
|
|
2,279
|
|
|||||||||||
|
Less than 80% and refreshed FICO scores:
|
|||||||||||||||||||
|
Equal to or greater than 660
|
13,729
|
|
13,988
|
|
19,136
|
|
18,252
|
|
|||||||||||
|
Less than 660
|
2,399
|
|
2,438
|
|
3,150
|
|
2,906
|
|
|||||||||||
|
U.S. government-guaranteed
|
—
|
|
—
|
|
—
|
|
—
|
|
|||||||||||
|
Total retained loans
|
$
|
18,277
|
|
$
|
19,385
|
|
$
|
44,049
|
|
$
|
48,000
|
|
|||||||
|
Geographic region
|
|||||||||||||||||||
|
California
|
$
|
2,577
|
|
$
|
2,786
|
|
$
|
10,065
|
|
$
|
10,969
|
|
|||||||
|
New York
|
2,865
|
|
2,847
|
|
9,021
|
|
9,753
|
|
|||||||||||
|
Illinois
|
1,313
|
|
1,358
|
|
3,009
|
|
3,265
|
|
|||||||||||
|
Florida
|
889
|
|
892
|
|
2,335
|
|
2,572
|
|
|||||||||||
|
Texas
|
2,252
|
|
2,508
|
|
1,325
|
|
1,503
|
|
|||||||||||
|
New Jersey
|
655
|
|
652
|
|
2,608
|
|
2,838
|
|
|||||||||||
|
Arizona
|
1,098
|
|
1,183
|
|
1,975
|
|
2,151
|
|
|||||||||||
|
Washington
|
601
|
|
651
|
|
1,502
|
|
1,629
|
|
|||||||||||
|
Michigan
|
852
|
|
910
|
|
1,061
|
|
1,169
|
|
|||||||||||
|
Ohio
|
1,394
|
|
1,514
|
|
989
|
|
1,091
|
|
|||||||||||
|
All other
(f)
|
3,781
|
|
4,084
|
|
10,159
|
|
11,060
|
|
|||||||||||
|
Total retained loans
|
$
|
18,277
|
|
$
|
19,385
|
|
$
|
44,049
|
|
$
|
48,000
|
|
|||||||
|
(a)
|
Individual delinquency classifications included mortgage loans insured by U.S. government agencies as follows: current included
$3.3 billion
and
$3.8 billion
;
30
–
149
days past due included
$2.1 billion
and
$2.3 billion
; and
150
or more days past due included
$8.4 billion
and
$9.5 billion
at
June 30, 2013
, and
December 31, 2012
, respectively.
|
|
(b)
|
These balances, which are
90 days
or more past due but insured by U.S. government agencies, are excluded from nonaccrual loans. In predominately all cases,
100%
of the principal balance of the loans is insured and interest is guaranteed at a specified reimbursement rate subject to meeting agreed-upon servicing guidelines. These amounts are excluded from nonaccrual loans because reimbursement of insured and guaranteed amounts is proceeding normally. At
June 30, 2013
, and
December 31, 2012
, these balances included
$6.1 billion
and
$6.8 billion
, respectively, of loans that are no longer accruing interest because interest has been curtailed by the U.S. government agencies although, in predominantly all cases,
100%
of the principal is still insured. For the remaining balance, interest is being accrued at the guaranteed reimbursement rate.
|
|
(c)
|
Represents the aggregate unpaid principal balance of loans divided by the estimated current property value. Current property values are estimated, at a minimum, quarterly, based on home valuation models using nationally recognized home price index valuation estimates incorporating actual data to the extent available and forecasted data where actual data is not available. These property values do not represent actual appraised loan level collateral values; as such, the resulting ratios are necessarily imprecise and should be viewed as estimates.
|
|
(d)
|
Junior lien represents combined LTV, which considers all available lien positions related to the property. All other products are presented without consideration of subordinate liens on the property.
|
|
(e)
|
Refreshed FICO scores represent each borrower’s most recent credit score, which is obtained by the Firm on at least a quarterly basis.
|
|
(f)
|
At
June 30, 2013
, and
December 31, 2012
, included mortgage loans insured by U.S. government agencies of
$13.8 billion
and
$15.6 billion
, respectively.
|
|
(g)
|
At
June 30, 2013
, and
December 31, 2012
, excluded mortgage loans insured by U.S. government agencies of
$10.5 billion
and
$11.8 billion
, respectively. These amounts were excluded as reimbursement of insured amounts is proceeding normally.
|
156
(table continued from previous page)
|
Mortgages
|
|||||||||||||||||||||||||||||
|
Prime, including option ARMs
|
Subprime
|
Total residential real estate – excluding PCI
|
|||||||||||||||||||||||||||
|
Jun 30,
2013 |
Dec 31,
2012 |
Jun 30,
2013 |
Dec 31,
2012 |
Jun 30,
2013 |
Dec 31,
2012 |
||||||||||||||||||||||||
|
$
|
66,203
|
|
$
|
61,439
|
|
$
|
6,396
|
|
$
|
6,673
|
|
$
|
133,379
|
|
$
|
133,605
|
|
||||||||||||
|
2,827
|
|
3,237
|
|
607
|
|
727
|
|
4,381
|
|
5,254
|
|
||||||||||||||||||
|
10,149
|
|
11,580
|
|
700
|
|
855
|
|
11,448
|
|
13,037
|
|
||||||||||||||||||
|
$
|
79,179
|
|
$
|
76,256
|
|
$
|
7,703
|
|
$
|
8,255
|
|
$
|
149,208
|
|
$
|
151,896
|
|
||||||||||||
|
3.19
|
%
|
(g)
|
3.97
|
%
|
(g)
|
16.97
|
%
|
19.16
|
%
|
3.60
|
%
|
(g)
|
4.28
|
%
|
(g)
|
||||||||||||||
|
$
|
—
|
|
$
|
—
|
|
$
|
—
|
|
$
|
—
|
|
$
|
—
|
|
$
|
—
|
|
||||||||||||
|
9,366
|
|
10,625
|
|
—
|
|
—
|
|
9,366
|
|
10,625
|
|
||||||||||||||||||
|
3,330
|
|
3,445
|
|
1,594
|
|
1,807
|
|
7,910
|
|
8,460
|
|
||||||||||||||||||
|
$
|
1,695
|
|
$
|
2,573
|
|
$
|
122
|
|
$
|
236
|
|
$
|
4,321
|
|
$
|
7,567
|
|
||||||||||||
|
565
|
|
991
|
|
381
|
|
653
|
|
1,715
|
|
3,075
|
|
||||||||||||||||||
|
2,640
|
|
3,697
|
|
364
|
|
457
|
|
9,216
|
|
11,734
|
|
||||||||||||||||||
|
1,066
|
|
1,376
|
|
824
|
|
985
|
|
3,706
|
|
4,523
|
|
||||||||||||||||||
|
5,894
|
|
7,070
|
|
682
|
|
726
|
|
16,547
|
|
18,902
|
|
||||||||||||||||||
|
1,910
|
|
2,117
|
|
1,268
|
|
1,346
|
|
5,818
|
|
6,227
|
|
||||||||||||||||||
|
46,521
|
|
38,281
|
|
1,875
|
|
1,793
|
|
81,261
|
|
72,314
|
|
||||||||||||||||||
|
5,073
|
|
4,549
|
|
2,187
|
|
2,059
|
|
12,809
|
|
11,952
|
|
||||||||||||||||||
|
13,815
|
|
15,602
|
|
—
|
|
—
|
|
13,815
|
|
15,602
|
|
||||||||||||||||||
|
$
|
79,179
|
|
$
|
76,256
|
|
$
|
7,703
|
|
$
|
8,255
|
|
$
|
149,208
|
|
$
|
151,896
|
|
||||||||||||
|
$
|
19,256
|
|
$
|
17,539
|
|
$
|
1,150
|
|
$
|
1,240
|
|
$
|
33,048
|
|
$
|
32,534
|
|
||||||||||||
|
12,344
|
|
11,190
|
|
1,022
|
|
1,081
|
|
25,252
|
|
24,871
|
|
||||||||||||||||||
|
4,546
|
|
3,999
|
|
304
|
|
323
|
|
9,172
|
|
8,945
|
|
||||||||||||||||||
|
4,433
|
|
4,372
|
|
967
|
|
1,031
|
|
8,624
|
|
8,867
|
|
||||||||||||||||||
|
3,138
|
|
2,927
|
|
239
|
|
257
|
|
6,954
|
|
7,195
|
|
||||||||||||||||||
|
2,376
|
|
2,131
|
|
376
|
|
399
|
|
6,015
|
|
6,020
|
|
||||||||||||||||||
|
1,211
|
|
1,162
|
|
155
|
|
165
|
|
4,439
|
|
4,661
|
|
||||||||||||||||||
|
1,770
|
|
1,741
|
|
163
|
|
177
|
|
4,036
|
|
4,198
|
|
||||||||||||||||||
|
898
|
|
866
|
|
190
|
|
203
|
|
3,001
|
|
3,148
|
|
||||||||||||||||||
|
416
|
|
405
|
|
177
|
|
191
|
|
2,976
|
|
3,201
|
|
||||||||||||||||||
|
28,791
|
|
29,924
|
|
2,960
|
|
3,188
|
|
45,691
|
|
48,256
|
|
||||||||||||||||||
|
$
|
79,179
|
|
$
|
76,256
|
|
$
|
7,703
|
|
$
|
8,255
|
|
$
|
149,208
|
|
$
|
151,896
|
|
||||||||||||
157
The following tables represent the Firm’s delinquency statistics for junior lien home equity loans and lines as of
June 30, 2013
, and
December 31, 2012
.
|
Delinquencies
|
Total 30+ day delinquency rate
|
||||||||||||||||||
|
June 30, 2013
|
30–89 days past due
|
90–149 days past due
|
150+ days
past due
|
Total loans
|
|||||||||||||||
|
(in millions, except ratios)
|
|||||||||||||||||||
|
HELOCs:
(a)
|
|||||||||||||||||||
|
Within the revolving period
(b)
|
$
|
358
|
|
$
|
124
|
|
$
|
176
|
|
$
|
35,739
|
|
1.84
|
%
|
|||||
|
Beyond the revolving period
|
51
|
|
13
|
|
38
|
|
3,828
|
|
2.66
|
|
|||||||||
|
HELOANs
|
89
|
|
33
|
|
23
|
|
4,482
|
|
3.24
|
|
|||||||||
|
Total
|
$
|
498
|
|
$
|
170
|
|
$
|
237
|
|
$
|
44,049
|
|
2.05
|
%
|
|||||
|
Delinquencies
|
Total 30+ day delinquency rate
|
||||||||||||||||||
|
December 31, 2012
|
30–89 days past due
|
90–149 days past due
|
150+ days
past due
|
Total loans
|
|||||||||||||||
|
(in millions, except ratios)
|
|||||||||||||||||||
|
HELOCs:
(a)
|
|||||||||||||||||||
|
Within the revolving period
(b)
|
$
|
514
|
|
$
|
196
|
|
$
|
185
|
|
$
|
40,794
|
|
2.19
|
%
|
|||||
|
Beyond the revolving period
|
48
|
|
19
|
|
27
|
|
2,127
|
|
4.42
|
|
|||||||||
|
HELOANs
|
125
|
|
58
|
|
23
|
|
5,079
|
|
4.06
|
|
|||||||||
|
Total
|
$
|
687
|
|
$
|
273
|
|
$
|
235
|
|
$
|
48,000
|
|
2.49
|
%
|
|||||
(a) These HELOCs are predominantly revolving loans for a
10
-year period, after which time the HELOC converts to a loan with a
20
-year amortization period, but also include HELOCs originated by Washington Mutual that require interest-only payments beyond the revolving period.
(b) The Firm manages the risk of HELOCs during their revolving period by closing or reducing the undrawn line to the extent permitted by law when borrowers are experiencing financial difficulty or when the collateral does not support the loan amount.
Home equity lines of credit (“HELOCs”) beyond the revolving period and home equity loans (“HELOANs”) have higher delinquency rates than do HELOCs within the revolving period. That is primarily because the fully-amortizing payment that is generally required for those products is higher than the minimum payment options
available for HELOCs within the revolving period. The higher delinquency rates associated with amortizing HELOCs and HELOANs are factored into the loss estimates produced by the Firm’s delinquency roll-rate methodology, which estimates defaults based on the current delinquency status of a portfolio.
158
Impaired loans
The Firm reports, in accordance with regulatory guidance, residential real estate loans that have been discharged under Chapter 7 bankruptcy and not reaffirmed by the borrower (“Chapter 7 loans”) as collateral-dependent nonaccrual TDRs, regardless of their delinquency status.
The table below sets forth information about the Firm’s residential real estate impaired loans, excluding PCI loans. These loans are considered to be impaired as they have been modified in a TDR. All impaired loans are evaluated for an asset-specific allowance as described in Note 14 on page
176
of
this Form 10-Q
.
|
Home equity
|
Mortgages
|
Total residential
real estate
– excluding PCI
|
||||||||||||||||||||||||||||||||
|
(in millions)
|
Senior lien
|
Junior lien
|
Prime, including
option ARMs
|
Subprime
|
||||||||||||||||||||||||||||||
|
Jun 30,
2013 |
Dec 31,
2012 |
Jun 30,
2013 |
Dec 31,
2012 |
Jun 30,
2013 |
Dec 31,
2012 |
Jun 30,
2013 |
Dec 31,
2012 |
Jun 30,
2013 |
Dec 31,
2012 |
|||||||||||||||||||||||||
|
Impaired loans
|
||||||||||||||||||||||||||||||||||
|
With an allowance
|
$
|
582
|
|
$
|
542
|
|
$
|
717
|
|
$
|
677
|
|
$
|
6,152
|
|
$
|
5,810
|
|
$
|
3,099
|
|
$
|
3,071
|
|
$
|
10,550
|
|
$
|
10,100
|
|
||||
|
Without an allowance
(a)
|
578
|
|
550
|
|
598
|
|
546
|
|
1,151
|
|
1,308
|
|
726
|
|
741
|
|
3,053
|
|
3,145
|
|
||||||||||||||
|
Total impaired loans
(b)
|
$
|
1,160
|
|
$
|
1,092
|
|
$
|
1,315
|
|
$
|
1,223
|
|
$
|
7,303
|
|
$
|
7,118
|
|
$
|
3,825
|
|
$
|
3,812
|
|
$
|
13,603
|
|
$
|
13,245
|
|
||||
|
Allowance for loan losses related to impaired loans
|
$
|
119
|
|
$
|
159
|
|
$
|
163
|
|
$
|
188
|
|
$
|
177
|
|
$
|
70
|
|
$
|
117
|
|
$
|
174
|
|
$
|
576
|
|
$
|
591
|
|
||||
|
Unpaid principal balance of impaired loans
(c)
|
1,532
|
|
1,408
|
|
2,584
|
|
2,352
|
|
9,374
|
|
9,095
|
|
5,748
|
|
5,700
|
|
19,238
|
|
18,555
|
|
||||||||||||||
|
Impaired loans on nonaccrual status
(d)
|
648
|
|
607
|
|
683
|
|
599
|
|
2,084
|
|
1,888
|
|
1,242
|
|
1,308
|
|
4,657
|
|
4,402
|
|
||||||||||||||
|
(a)
|
Represents collateral-dependent residential mortgage loans that are charged off to the fair value of the underlying collateral less cost to sell.
|
|
(b)
|
At
June 30, 2013
, and
December 31, 2012
,
$6.9 billion
and
$7.5 billion
, respectively, of loans modified subsequent to repurchase from Government National Mortgage Association (“Ginnie Mae”) in accordance with the standards of the appropriate government agency (i.e., Federal Housing Administration (“FHA”), U.S. Department of Veterans Affairs (“VA”), Rural Housing Services (“RHS”)) are not included in the table above. When such loans perform subsequent to modification in accordance with Ginnie Mae guidelines, they are generally sold back into Ginnie Mae loan pools. Modified loans that do not re-perform become subject to foreclosure.
|
|
(c)
|
Represents the contractual amount of principal owed at
June 30, 2013
, and
December 31, 2012
. The unpaid principal balance differs from the impaired loan balances due to various factors, including charge-offs, net deferred loan fees or costs; and unamortized discounts or premiums on purchased loans.
|
|
(d)
|
As of
June 30, 2013
, and
December 31, 2012
, nonaccrual loans included
$3.2 billion
and
$2.9 billion
, respectively, of TDRs for which the borrowers were less than
90 days
past due. For additional information about loans modified in a TDR that are on nonaccrual status refer to the Loan accounting framework in Note 14 on pages 250–253 of
JPMorgan Chase
’s
2012
Annual Report
.
|
159
The following tables present average impaired loans and the related interest income reported by the Firm.
|
Three months ended June 30,
|
Average impaired loans
|
Interest income on
impaired loans
(a)
|
Interest income on impaired
loans on a cash basis
(a)
|
|||||||||||||||||
|
(in millions)
|
2013
|
2012
|
2013
|
2012
|
2013
|
2012
|
||||||||||||||
|
Home equity
|
||||||||||||||||||||
|
Senior lien
|
$
|
1,158
|
|
$
|
390
|
|
$
|
14
|
|
$
|
3
|
|
$
|
10
|
|
$
|
—
|
|
||
|
Junior lien
|
1,296
|
|
734
|
|
21
|
|
7
|
|
14
|
|
1
|
|
||||||||
|
Mortgages
|
||||||||||||||||||||
|
Prime, including option ARMs
|
7,219
|
|
5,469
|
|
70
|
|
55
|
|
15
|
|
5
|
|
||||||||
|
Subprime
|
3,833
|
|
3,394
|
|
50
|
|
45
|
|
14
|
|
6
|
|
||||||||
|
Total residential real estate – excluding PCI
|
$
|
13,506
|
|
$
|
9,987
|
|
$
|
155
|
|
$
|
110
|
|
$
|
53
|
|
$
|
12
|
|
||
|
Six months ended June 30,
|
Average impaired loans
|
Interest income on
impaired loans (a) |
Interest income on impaired
loans on a cash basis (a) |
|||||||||||||||||
|
(in millions)
|
2013
|
2012
|
2013
|
2012
|
2013
|
2012
|
||||||||||||||
|
Home equity
|
||||||||||||||||||||
|
Senior lien
|
$
|
1,149
|
|
$
|
363
|
|
$
|
29
|
|
$
|
6
|
|
$
|
20
|
|
$
|
1
|
|
||
|
Junior lien
|
1,284
|
|
710
|
|
41
|
|
13
|
|
27
|
|
2
|
|
||||||||
|
Mortgages
|
||||||||||||||||||||
|
Prime, including option ARMs
|
7,203
|
|
5,209
|
|
139
|
|
104
|
|
29
|
|
10
|
|
||||||||
|
Subprime
|
3,830
|
|
3,305
|
|
100
|
|
87
|
|
29
|
|
10
|
|
||||||||
|
Total residential real estate – excluding PCI
|
$
|
13,466
|
|
$
|
9,587
|
|
$
|
309
|
|
$
|
210
|
|
$
|
105
|
|
$
|
23
|
|
||
|
(a)
|
Generally, interest income on loans modified in TDRs is recognized on a cash basis until such time as the borrower has made a minimum of
six
payments under the new terms.
|
Loan modifications
The global settlement, which became effective on April 5, 2012, required the Firm to, among other things, provide
$3.7 billion
of additional relief to certain borrowers under the Consumer Relief Program, including reductions of principal on first and second liens. For further information on the global settlement, see Mortgage Foreclosure-Related Investigations and Litigation in Note 23 on pages
204–205
of
this Form 10-Q
.
Modifications of residential real estate loans, excluding PCI loans, are generally accounted for and reported as TDRs. There are no additional commitments to lend to borrowers whose residential real estate loans, excluding PCI loans, have been modified in TDRs. For further information, see Note 14 on page 252 and pages 260–262 of
JPMorgan Chase
’s
2012
Annual Report
.
160
TDR activity rollforward
The following tables reconcile the beginning and ending balances of residential real estate loans, excluding PCI loans, modified in TDRs for the periods presented.
|
Three months ended
June 30, (in millions) |
Home equity
|
Mortgages
|
Total residential
real estate – excluding PCI
|
|||||||||||||||||||||||||||||||
|
Senior lien
|
Junior lien
|
Prime, including option ARMs
|
Subprime
|
|||||||||||||||||||||||||||||||
|
2013
|
2012
|
2013
|
2012
|
2013
|
2012
|
2013
|
2012
|
2013
|
2012
|
|||||||||||||||||||||||||
|
Beginning balance of TDRs
|
$
|
1,155
|
|
$
|
338
|
|
$
|
1,286
|
|
$
|
706
|
|
$
|
7,223
|
|
$
|
5,018
|
|
$
|
3,843
|
|
$
|
3,226
|
|
$
|
13,507
|
|
$
|
9,288
|
|
||||
|
New TDRs
|
39
|
|
231
|
|
94
|
|
93
|
|
318
|
|
1,209
|
|
89
|
|
362
|
|
540
|
|
1,895
|
|
||||||||||||||
|
Charge-offs post-modification
(a)
|
(8
|
)
|
(4
|
)
|
(24
|
)
|
(6
|
)
|
(14
|
)
|
(26
|
)
|
(27
|
)
|
(43
|
)
|
(73
|
)
|
(79
|
)
|
||||||||||||||
|
Foreclosures and other liquidations (e.g., short sales)
|
(5
|
)
|
—
|
|
(7
|
)
|
(2
|
)
|
(39
|
)
|
(28
|
)
|
(19
|
)
|
(23
|
)
|
(70
|
)
|
(53
|
)
|
||||||||||||||
|
Principal payments and other
|
(21
|
)
|
(5
|
)
|
(34
|
)
|
(29
|
)
|
(185
|
)
|
(81
|
)
|
(61
|
)
|
(38
|
)
|
(301
|
)
|
(153
|
)
|
||||||||||||||
|
Ending balance of TDRs
(b)
|
$
|
1,160
|
|
$
|
560
|
|
$
|
1,315
|
|
$
|
762
|
|
$
|
7,303
|
|
$
|
6,092
|
|
$
|
3,825
|
|
$
|
3,484
|
|
$
|
13,603
|
|
$
|
10,898
|
|
||||
|
Permanent modifications
(b)
|
$
|
1,117
|
|
$
|
527
|
|
$
|
1,309
|
|
$
|
756
|
|
$
|
7,035
|
|
$
|
5,808
|
|
$
|
3,676
|
|
$
|
3,333
|
|
$
|
13,137
|
|
$
|
10,424
|
|
||||
|
Trial modifications
|
$
|
43
|
|
$
|
33
|
|
$
|
6
|
|
$
|
6
|
|
$
|
268
|
|
$
|
284
|
|
$
|
149
|
|
$
|
151
|
|
$
|
466
|
|
$
|
474
|
|
||||
|
Six months ended
June 30, (in millions) |
Home equity
|
Mortgages
|
Total residential
real estate – excluding PCI
|
|||||||||||||||||||||||||||||||
|
Senior lien
|
Junior lien
|
Prime, including option ARMs
|
Subprime
|
|||||||||||||||||||||||||||||||
|
2013
|
2012
|
2013
|
2012
|
2013
|
2012
|
2013
|
2012
|
2013
|
2012
|
|||||||||||||||||||||||||
|
Beginning balance of TDRs
|
$
|
1,092
|
|
$
|
335
|
|
$
|
1,223
|
|
$
|
657
|
|
$
|
7,118
|
|
$
|
4,877
|
|
$
|
3,812
|
|
$
|
3,219
|
|
$
|
13,245
|
|
$
|
9,088
|
|
||||
|
New TDRs
|
140
|
|
243
|
|
229
|
|
189
|
|
628
|
|
1,490
|
|
217
|
|
484
|
|
1,214
|
|
2,406
|
|
||||||||||||||
|
Charge-offs post-modification
(a)
|
(18
|
)
|
(9
|
)
|
(57
|
)
|
(23
|
)
|
(33
|
)
|
(60
|
)
|
(65
|
)
|
(94
|
)
|
(173
|
)
|
(186
|
)
|
||||||||||||||
|
Foreclosures and other liquidations (e.g., short sales)
|
(9
|
)
|
—
|
|
(11
|
)
|
(5
|
)
|
(74
|
)
|
(57
|
)
|
(38
|
)
|
(60
|
)
|
(132
|
)
|
(122
|
)
|
||||||||||||||
|
Principal payments and other
|
(45
|
)
|
(9
|
)
|
(69
|
)
|
(56
|
)
|
(336
|
)
|
(158
|
)
|
(101
|
)
|
(65
|
)
|
(551
|
)
|
(288
|
)
|
||||||||||||||
|
Ending balance of TDRs
(b)
|
$
|
1,160
|
|
$
|
560
|
|
$
|
1,315
|
|
$
|
762
|
|
$
|
7,303
|
|
$
|
6,092
|
|
$
|
3,825
|
|
$
|
3,484
|
|
$
|
13,603
|
|
$
|
10,898
|
|
||||
|
Permanent modifications
(b)
|
$
|
1,117
|
|
$
|
527
|
|
$
|
1,309
|
|
$
|
756
|
|
$
|
7,035
|
|
$
|
5,808
|
|
$
|
3,676
|
|
$
|
3,333
|
|
$
|
13,137
|
|
$
|
10,424
|
|
||||
|
Trial modifications
|
$
|
43
|
|
$
|
33
|
|
$
|
6
|
|
$
|
6
|
|
$
|
268
|
|
$
|
284
|
|
$
|
149
|
|
$
|
151
|
|
$
|
466
|
|
$
|
474
|
|
||||
|
(a)
|
Includes charge-offs on unsuccessful trial modifications.
|
|
(b)
|
At
June 30, 2013
, included
$1.6 billion
of Chapter 7 loans consisting of
$470 million
of senior lien home equity loans,
$499 million
of junior lien home equity loans,
$430 million
of prime, including option ARMs, and
$223 million
of subprime mortgages. Certain of these individual loans were previously reported as nonaccrual loans (e.g., based upon the delinquency status of the loan).
|
161
Nature and extent of modifications
MHA, as well as the Firm’s proprietary modification programs, generally provide various concessions to financially troubled borrowers including, but not limited to, interest rate reductions, term or payment extensions and
deferral of principal and/or interest payments that would otherwise have been required under the terms of the original agreement.
The following tables provide information about how residential real estate loans, excluding PCI loans, were modified under the Firm’s loss mitigation programs during the periods presented. These tables exclude Chapter 7 loans where the sole concession granted is the discharge of debt. At
June 30, 2013
, there were approximately
38,900
of such Chapter 7 loans, consisting of approximately
9,400
senior lien home equity loans,
22,500
junior lien home equity loans,
3,500
prime mortgage, including option ARMs, and
3,500
subprime mortgages.
|
Three months ended
June 30, |
Home equity
|
Mortgages
|
Total residential
real estate -
excluding PCI
|
|||||||||||||||||||||
|
Senior lien
|
Junior lien
|
Prime, including option ARMs
|
Subprime
|
|||||||||||||||||||||
|
2013
|
2012
|
2013
|
2012
|
2013
|
2012
|
2013
|
2012
|
2013
|
2012
|
|||||||||||||||
|
Number of loans approved for a trial modification
(a)
|
562
|
|
468
|
|
172
|
|
173
|
|
856
|
|
941
|
|
1,123
|
|
1,140
|
|
2,713
|
|
2,722
|
|
||||
|
Number of loans permanently modified
|
405
|
|
2,467
|
|
1,353
|
|
2,048
|
|
1,137
|
|
3,754
|
|
1,458
|
|
4,654
|
|
4,353
|
|
12,923
|
|
||||
|
Concession granted:
(a)
(b)
|
||||||||||||||||||||||||
|
Interest rate reduction
|
70
|
%
|
90
|
%
|
85
|
%
|
85
|
%
|
73
|
%
|
88
|
%
|
72
|
%
|
67
|
%
|
76
|
%
|
80
|
%
|
||||
|
Term or payment extension
|
73
|
|
30
|
|
76
|
|
84
|
|
69
|
|
58
|
|
53
|
|
28
|
|
66
|
|
46
|
|
||||
|
Principal and/or interest deferred
|
11
|
|
3
|
|
25
|
|
16
|
|
29
|
|
11
|
|
12
|
|
5
|
|
20
|
|
8
|
|
||||
|
Principal forgiveness
|
37
|
|
1
|
|
33
|
|
12
|
|
39
|
|
9
|
|
46
|
|
37
|
|
39
|
|
18
|
|
||||
|
Other
(c)
|
—
|
|
—
|
|
—
|
|
—
|
|
24
|
|
40
|
|
13
|
|
7
|
|
11
|
|
14
|
|
||||
|
Six months ended
June 30, |
Home equity
|
Mortgages
|
Total residential
real estate -
excluding PCI
|
|||||||||||||||||||||
|
Senior lien
|
Junior lien
|
Prime, including option ARMs
|
Subprime
|
|||||||||||||||||||||
|
2013
|
2012
|
2013
|
2012
|
2013
|
2012
|
2013
|
2012
|
2013
|
2012
|
|||||||||||||||
|
Number of loans approved for a trial modification
(a)
|
1,062
|
|
839
|
|
368
|
|
421
|
|
1,832
|
|
1,913
|
|
2,612
|
|
2,332
|
|
5,874
|
|
5,505
|
|
||||
|
Number of loans permanently modified
|
950
|
|
2,697
|
|
2,669
|
|
3,864
|
|
2,613
|
|
4,704
|
|
3,147
|
|
5,844
|
|
9,379
|
|
17,109
|
|
||||
|
Concession granted:
(a)
(b)
|
||||||||||||||||||||||||
|
Interest rate reduction
|
72
|
%
|
88
|
%
|
88
|
%
|
90
|
%
|
74
|
%
|
86
|
%
|
71
|
%
|
70
|
%
|
77
|
%
|
82
|
%
|
||||
|
Term or payment extension
|
73
|
|
35
|
|
77
|
|
76
|
|
69
|
|
61
|
|
51
|
|
34
|
|
66
|
|
51
|
|
||||
|
Principal and/or interest deferred
|
10
|
|
4
|
|
24
|
|
18
|
|
28
|
|
17
|
|
11
|
|
6
|
|
19
|
|
11
|
|
||||
|
Principal forgiveness
|
38
|
|
3
|
|
36
|
|
10
|
|
40
|
|
12
|
|
52
|
|
36
|
|
43
|
|
18
|
|
||||
|
Other
(c)
|
—
|
|
—
|
|
—
|
|
—
|
|
24
|
|
33
|
|
15
|
|
6
|
|
12
|
|
11
|
|
||||
|
(a)
|
Prior period amounts have been revised to conform with the current presentation.
|
|
(b)
|
Represents concessions granted in permanent modifications as a percentage of the number of loans permanently modified. The sum of the percentages exceeds
100%
because predominantly all of the modifications include more than one type of concession. A significant portion of trial modifications include interest rate reductions and/or term or payment extensions.
|
|
(c)
|
Represents variable interest rate to fixed interest rate modifications.
|
162
Financial effects of modifications and redefaults
The following tables provide information about the financial effects of the various concessions granted in modifications of residential real estate loans, excluding PCI, under the Firm’s loss mitigation programs and about redefaults of certain loans modified in TDRs for the periods presented. Because the specific types and amounts of concessions offered to borrowers frequently change between the trial modification and the permanent modification, the following tables present only the financial effects of permanent modifications. These tables also exclude Chapter 7 loans where the sole concession granted is the discharge of debt.
|
Three months ended June 30,
(in millions, except weighted-average data and number of loans) |
Home equity
|
Mortgages
|
Total residential real estate – excluding PCI
|
|||||||||||||||||||||||||||||||
|
Senior lien
|
Junior lien
|
Prime, including option ARMs
|
Subprime
|
|||||||||||||||||||||||||||||||
|
2013
|
2012
|
2013
|
2012
|
2013
|
2012
|
2013
|
2012
|
2013
|
2012
|
|||||||||||||||||||||||||
|
Weighted-average interest rate of loans with interest rate reductions – before TDR
|
6.78
|
%
|
7.32
|
%
|
5.10
|
%
|
5.77
|
%
|
5.09
|
%
|
6.37
|
%
|
7.26
|
%
|
7.55
|
%
|
5.76
|
%
|
6.73
|
%
|
||||||||||||||
|
Weighted-average interest rate of loans with interest rate reductions – after TDR
|
3.34
|
|
4.91
|
|
2.28
|
|
2.07
|
|
2.78
|
|
4.22
|
|
3.50
|
|
4.56
|
|
2.94
|
|
4.25
|
|
||||||||||||||
|
Weighted-average remaining contractual term (in years) of loans with term or payment extensions – before TDR
|
17
|
|
19
|
|
19
|
|
21
|
|
25
|
|
25
|
|
24
|
|
24
|
|
24
|
|
24
|
|
||||||||||||||
|
Weighted-average remaining contractual term (in years) of loans with term or payment extensions – after TDR
|
31
|
|
30
|
|
34
|
|
32
|
|
37
|
|
35
|
|
35
|
|
32
|
|
36
|
|
33
|
|
||||||||||||||
|
Charge-offs recognized upon permanent modification
|
$
|
2
|
|
$
|
1
|
|
$
|
23
|
|
$
|
6
|
|
$
|
6
|
|
$
|
9
|
|
$
|
3
|
|
$
|
7
|
|
$
|
34
|
|
$
|
23
|
|
||||
|
Principal deferred
|
1
|
|
1
|
|
7
|
|
6
|
|
32
|
|
40
|
|
11
|
|
14
|
|
51
|
|
61
|
|
||||||||||||||
|
Principal forgiven
|
7
|
|
1
|
|
13
|
|
7
|
|
57
|
|
33
|
|
55
|
|
118
|
|
132
|
|
159
|
|
||||||||||||||
|
Number of loans that redefaulted within one year of permanent modification
(a)
|
95
|
|
84
|
|
248
|
|
356
|
|
189
|
|
232
|
|
317
|
|
437
|
|
849
|
|
1,109
|
|
||||||||||||||
|
Balance of loans that redefaulted within one year of permanent modification
(a)
|
$
|
7
|
|
$
|
6
|
|
$
|
6
|
|
$
|
12
|
|
$
|
54
|
|
$
|
72
|
|
$
|
31
|
|
$
|
47
|
|
$
|
98
|
|
$
|
137
|
|
||||
|
Six months ended June 30,
(in millions, except weighted-average data and number of loans) |
Home equity
|
Mortgages
|
Total residential real estate – excluding PCI
|
|||||||||||||||||||||||||||||||
|
Senior lien
|
Junior lien
|
Prime, including option ARMs
|
Subprime
|
|||||||||||||||||||||||||||||||
|
2013
|
2012
|
2013
|
2012
|
2013
|
2012
|
2013
|
2012
|
2013
|
2012
|
|||||||||||||||||||||||||
|
Weighted-average interest rate of loans with interest rate reductions – before TDR
|
6.53
|
%
|
7.30
|
%
|
5.14
|
%
|
5.72
|
%
|
5.37
|
%
|
6.28
|
%
|
7.48
|
%
|
7.75
|
%
|
5.99
|
%
|
6.70
|
%
|
||||||||||||||
|
Weighted-average interest rate of loans with interest rate reductions – after TDR
|
3.44
|
|
4.79
|
|
2.22
|
|
1.89
|
|
2.83
|
|
3.89
|
|
3.54
|
|
4.36
|
|
2.98
|
|
3.91
|
|
||||||||||||||
|
Weighted-average remaining contractual term (in years) of loans with term or payment extensions – before TDR
|
18
|
|
19
|
|
19
|
|
21
|
|
24
|
|
26
|
|
24
|
|
25
|
|
23
|
|
25
|
|
||||||||||||||
|
Weighted-average remaining contractual term (in years) of loans with term or payment extensions – after TDR
|
31
|
|
29
|
|
34
|
|
32
|
|
37
|
|
35
|
|
34
|
|
32
|
|
35
|
|
34
|
|
||||||||||||||
|
Charge-offs recognized upon permanent modification
|
$
|
4
|
|
$
|
2
|
|
$
|
42
|
|
$
|
12
|
|
$
|
11
|
|
$
|
23
|
|
$
|
6
|
|
$
|
12
|
|
$
|
63
|
|
$
|
49
|
|
||||
|
Principal deferred
|
3
|
|
2
|
|
14
|
|
12
|
|
67
|
|
75
|
|
21
|
|
24
|
|
105
|
|
113
|
|
||||||||||||||
|
Principal forgiven
|
17
|
|
3
|
|
29
|
|
11
|
|
130
|
|
53
|
|
139
|
|
149
|
|
315
|
|
216
|
|
||||||||||||||
|
Number of loans that redefaulted within one year of permanent modification
(a)
|
226
|
|
140
|
|
594
|
|
724
|
|
397
|
|
458
|
|
629
|
|
733
|
|
1,846
|
|
2,055
|
|
||||||||||||||
|
Balance of loans that redefaulted within one year of permanent modification
(a)
|
$
|
17
|
|
$
|
10
|
|
$
|
13
|
|
$
|
26
|
|
$
|
104
|
|
$
|
130
|
|
$
|
63
|
|
$
|
81
|
|
$
|
197
|
|
$
|
247
|
|
||||
|
(a)
|
Represents loans permanently modified in TDRs that experienced a payment default in the periods presented, and for which the payment default occurred within
one year
of the modification. The dollar amounts presented represent the balance of such loans at the end of the reporting period in which such loans defaulted. For residential real estate loans modified in TDRs, payment default is deemed to occur when the loan becomes
two
contractual payments past due. In the event that a modified loan redefaults, it is probable that the loan will ultimately be liquidated through foreclosure or another similar type of liquidation transaction. Redefaults of loans modified within the last
12 months
may not be representative of ultimate redefault levels.
|
163
Approximately
85%
of the trial modifications approved on or after July 1, 2010 (the approximate date on which substantial revisions were made to the HAMP program), that are seasoned more than six months have been successfully converted to permanent modifications.
The primary performance indicator for TDRs is the rate at which permanently modified loans redefault. At
June 30, 2013
, the cumulative redefault rates of residential real estate loans that have been modified under the Firm’s loss mitigation programs, excluding PCI loans, based upon permanent modifications that were completed after October 1, 2009, and that are seasoned more than six months are
19%
for senior lien home equity,
18%
for junior lien home equity,
14%
for prime mortgages including option ARMs, and
24%
for subprime mortgages.
Default rates of Chapter 7 loans vary significantly based on the delinquency status of the loan and overall economic conditions at the time of discharge. Default rates for Chapter 7 residential real estate loans that were less than
60 days
past due at the time of discharge have ranged between approximately
10%
and
40%
in recent years based on the economic conditions at the time of discharge. At
June 30, 2013
, Chapter 7 residential real estate loans included approximately
21%
of senior lien home equity,
13%
of junior lien home equity,
38%
of prime mortgages, including option ARMs, and
28%
of subprime mortgages that were
30 days
or more past due.
At
June 30, 2013
, the weighted-average estimated remaining lives of residential real estate loans, excluding PCI loans, permanently modified in TDRs were
6
years for senior lien home equity,
7
years for junior lien home equity,
10
years for prime mortgage, including option ARMs and
8
years for subprime mortgages. The estimated remaining lives of these loans reflect estimated prepayments, both voluntary and involuntary (i.e., foreclosures and other forced liquidations).
164
Other consumer loans
The table below provides information for other consumer retained loan classes, including auto, business banking and student loans.
|
(in millions, except ratios)
|
Auto
|
Business banking
|
Student and other
|
Total other consumer
|
|||||||||||||||||||||||||||
|
Jun 30,
2013 |
Dec 31,
2012 |
Jun 30,
2013 |
Dec 31,
2012 |
Jun 30,
2013 |
Dec 31,
2012 |
Jun 30,
2013 |
Dec 31,
2012 |
||||||||||||||||||||||||
|
Loan delinquency
(a)
|
|||||||||||||||||||||||||||||||
|
Current
|
$
|
50,381
|
|
$
|
49,290
|
|
$
|
18,308
|
|
$
|
18,482
|
|
$
|
10,781
|
|
$
|
11,038
|
|
$
|
79,470
|
|
$
|
78,810
|
|
|||||||
|
30–119 days past due
|
479
|
|
616
|
|
271
|
|
263
|
|
655
|
|
709
|
|
1,405
|
|
1,588
|
|
|||||||||||||||
|
120 or more days past due
|
5
|
|
7
|
|
151
|
|
138
|
|
413
|
|
444
|
|
569
|
|
589
|
|
|||||||||||||||
|
Total retained loans
|
$
|
50,865
|
|
$
|
49,913
|
|
$
|
18,730
|
|
$
|
18,883
|
|
$
|
11,849
|
|
$
|
12,191
|
|
$
|
81,444
|
|
$
|
80,987
|
|
|||||||
|
% of 30+ days past due to total retained loans
|
0.95
|
%
|
1.25
|
%
|
2.25
|
%
|
2.12
|
%
|
2.16
|
%
|
(d)
|
2.12
|
%
|
(d)
|
1.43
|
%
|
(d)
|
1.58
|
%
|
(d)
|
|||||||||||
|
90 or more days past due and still accruing
(b)
|
$
|
—
|
|
$
|
—
|
|
$
|
—
|
|
$
|
—
|
|
$
|
488
|
|
$
|
525
|
|
$
|
488
|
|
$
|
525
|
|
|||||||
|
Nonaccrual loans
|
126
|
|
163
|
|
454
|
|
481
|
|
86
|
|
70
|
|
666
|
|
714
|
|
|||||||||||||||
|
Geographic region
|
|||||||||||||||||||||||||||||||
|
California
|
$
|
5,251
|
|
$
|
4,962
|
|
$
|
2,118
|
|
$
|
1,983
|
|
$
|
1,113
|
|
$
|
1,108
|
|
$
|
8,482
|
|
$
|
8,053
|
|
|||||||
|
New York
|
3,833
|
|
3,742
|
|
2,947
|
|
2,981
|
|
1,229
|
|
1,202
|
|
8,009
|
|
7,925
|
|
|||||||||||||||
|
Illinois
|
2,771
|
|
2,738
|
|
1,370
|
|
1,404
|
|
742
|
|
748
|
|
4,883
|
|
4,890
|
|
|||||||||||||||
|
Florida
|
1,906
|
|
1,922
|
|
570
|
|
527
|
|
546
|
|
556
|
|
3,022
|
|
3,005
|
|
|||||||||||||||
|
Texas
|
4,835
|
|
4,739
|
|
2,641
|
|
2,749
|
|
877
|
|
891
|
|
8,353
|
|
8,379
|
|
|||||||||||||||
|
New Jersey
|
2,007
|
|
1,921
|
|
390
|
|
379
|
|
400
|
|
409
|
|
2,797
|
|
2,709
|
|
|||||||||||||||
|
Arizona
|
1,752
|
|
1,719
|
|
1,079
|
|
1,139
|
|
261
|
|
265
|
|
3,092
|
|
3,123
|
|
|||||||||||||||
|
Washington
|
892
|
|
824
|
|
218
|
|
202
|
|
222
|
|
287
|
|
1,332
|
|
1,313
|
|
|||||||||||||||
|
Michigan
|
2,037
|
|
2,091
|
|
1,347
|
|
1,368
|
|
529
|
|
548
|
|
3,913
|
|
4,007
|
|
|||||||||||||||
|
Ohio
|
2,331
|
|
2,462
|
|
1,391
|
|
1,443
|
|
736
|
|
770
|
|
4,458
|
|
4,675
|
|
|||||||||||||||
|
All other
|
23,250
|
|
22,793
|
|
4,659
|
|
4,708
|
|
5,194
|
|
5,407
|
|
33,103
|
|
32,908
|
|
|||||||||||||||
|
Total retained loans
|
$
|
50,865
|
|
$
|
49,913
|
|
$
|
18,730
|
|
$
|
18,883
|
|
$
|
11,849
|
|
$
|
12,191
|
|
$
|
81,444
|
|
$
|
80,987
|
|
|||||||
|
Loans by risk ratings
(c)
|
|||||||||||||||||||||||||||||||
|
Noncriticized
|
$
|
8,736
|
|
$
|
8,882
|
|
$
|
13,333
|
|
$
|
13,336
|
|
NA
|
|
NA
|
|
$
|
22,069
|
|
$
|
22,218
|
|
|||||||||
|
Criticized performing
|
77
|
|
130
|
|
698
|
|
713
|
|
NA
|
|
NA
|
|
775
|
|
843
|
|
|||||||||||||||
|
Criticized nonaccrual
|
3
|
|
4
|
|
365
|
|
386
|
|
NA
|
|
NA
|
|
368
|
|
390
|
|
|||||||||||||||
|
(a)
|
Individual delinquency classifications included loans insured by U.S. government agencies under the Federal Family Education Loan Program (“FFELP”) as follows: current included
$5.1 billion
and
$5.4 billion
;
30
-
119 days
past due included
$415 million
and
$466 million
; and
120
or more days past due included
$398 million
and
$428 million
at
June 30, 2013
, and
December 31, 2012
, respectively.
|
|
(b)
|
These amounts represent student loans, which are insured by U.S. government agencies under the FFELP. These amounts were accruing as reimbursement of insured amounts is proceeding normally.
|
|
(c)
|
For risk-rated business banking and auto loans, the primary credit quality indicator is the risk rating of the loan, including whether the loans are considered to be criticized and/or nonaccrual.
|
|
(d)
|
June 30, 2013
, and
December 31, 2012
, excluded loans
30 days
or more past due and still accruing, which are insured by U.S. government agencies under the FFELP, of
$812 million
and
$894 million
, respectively. These amounts were excluded as reimbursement of insured amounts is proceeding normally.
|
165
Other consumer impaired loans and loan modifications
The table below sets forth information about the Firm’s other consumer impaired loans, including risk-rated business banking and auto loans that have been placed on nonaccrual status, and loans that have been modified in TDRs.
|
(in millions)
|
Auto
|
Business banking
|
Total other consumer
(c)
|
|||||||||||||||||
|
Jun 30,
2013 |
Dec 31,
2012 |
Jun 30,
2013 |
Dec 31,
2012 |
Jun 30,
2013 |
Dec 31,
2012 |
|||||||||||||||
|
Impaired loans
|
||||||||||||||||||||
|
With an allowance
|
$
|
67
|
|
$
|
78
|
|
$
|
524
|
|
$
|
543
|
|
$
|
591
|
|
$
|
621
|
|
||
|
Without an allowance
(a)
|
57
|
|
72
|
|
—
|
|
—
|
|
57
|
|
72
|
|
||||||||
|
Total impaired loans
|
$
|
124
|
|
$
|
150
|
|
$
|
524
|
|
$
|
543
|
|
$
|
648
|
|
$
|
693
|
|
||
|
Allowance for loan losses related to impaired loans
|
$
|
12
|
|
$
|
12
|
|
$
|
125
|
|
$
|
126
|
|
$
|
137
|
|
$
|
138
|
|
||
|
Unpaid principal balance of impaired loans
(b)
|
225
|
|
259
|
|
610
|
|
624
|
|
835
|
|
883
|
|
||||||||
|
Impaired loans on nonaccrual status
|
90
|
|
109
|
|
373
|
|
394
|
|
463
|
|
503
|
|
||||||||
|
(a)
|
When discounted cash flows, collateral value or market price equals or exceeds the recorded investment in the loan, the loan does not require an allowance. This typically occurs when the impaired loans have been partially charged off and/or there have been interest payments received and applied to the loan balance.
|
|
(b)
|
Represents the contractual amount of principal owed at
June 30, 2013
, and
December 31, 2012
. The unpaid principal balance differs from the impaired loan balances due to various factors, including charge-offs; interest payments received and applied to the principal balance; net deferred loan fees or costs; and unamortized discounts or premiums on purchased loans.
|
|
(c)
|
There were no impaired student and other loans at
June 30, 2013
, and
December 31, 2012
.
|
The following table presents average impaired loans for the periods presented.
|
(in millions)
|
Average impaired loans
(b)
|
||||||||||||
|
Three months ended June 30,
|
Six months ended June 30,
|
||||||||||||
|
2013
|
2012
|
2013
|
2012
|
||||||||||
|
Auto
|
$
|
129
|
|
$
|
88
|
|
$
|
137
|
|
$
|
90
|
|
|
|
Business banking
|
528
|
|
646
|
|
536
|
|
667
|
|
|||||
|
Total other consumer
(a)
|
$
|
657
|
|
$
|
734
|
|
$
|
673
|
|
$
|
757
|
|
|
|
(a)
|
There were no impaired student and other loans for the
three or six months ended
June 30, 2013
and
2012
.
|
|
(b)
|
The related interest income on impaired loans, including those on a cash basis, was not material for the
three or six months ended
June 30, 2013
and
2012
.
|
Loan modifications
The following table provides information about the Firm’s other consumer loans modified in TDRs. All of these TDRs are reported as impaired loans in the tables above.
|
(in millions)
|
Auto
|
Business banking
|
Total other consumer
(c)
|
|||||||||||||||||
|
Jun 30,
2013 |
Dec 31,
2012 |
Jun 30,
2013 |
Dec 31,
2012 |
Jun 30,
2013 |
Dec 31,
2012 |
|||||||||||||||
|
Loans modified in troubled debt restructurings
(a)(b)
|
$
|
124
|
|
$
|
150
|
|
$
|
324
|
|
$
|
352
|
|
$
|
448
|
|
$
|
502
|
|
||
|
TDRs on nonaccrual status
|
90
|
|
109
|
|
173
|
|
203
|
|
263
|
|
312
|
|
||||||||
|
(a)
|
These modifications generally provided interest rate concessions to the borrower or deferral of principal repayments.
|
|
(b)
|
Additional commitments to lend to borrowers whose loans have been modified in TDRs as of
June 30, 2013
, and
December 31, 2012
, were immaterial.
|
|
(c)
|
There were no student and other loans modified in TDRs at
June 30, 2013
, and
December 31, 2012
.
|
166
TDR activity rollforward
The following tables reconcile the beginning and ending balances of other consumer loans modified in TDRs for the periods presented.
|
Three months ended June 30,
(in millions) |
Auto
|
Business banking
|
Total other consumer
|
|||||||||||||||||
|
2013
|
2012
|
2013
|
2012
|
2013
|
2012
|
|||||||||||||||
|
Beginning balance of TDRs
|
$
|
140
|
|
$
|
91
|
|
$
|
341
|
|
$
|
378
|
|
$
|
481
|
|
$
|
469
|
|
||
|
New TDRs
|
22
|
|
10
|
|
18
|
|
21
|
|
40
|
|
31
|
|
||||||||
|
Charge-offs post-modification
|
(2
|
)
|
(2
|
)
|
—
|
|
(2
|
)
|
(2
|
)
|
(4
|
)
|
||||||||
|
Foreclosures and other liquidations
|
—
|
|
—
|
|
—
|
|
—
|
|
—
|
|
—
|
|
||||||||
|
Principal payments and other
|
(36
|
)
|
(13
|
)
|
(35
|
)
|
(31
|
)
|
(71
|
)
|
(44
|
)
|
||||||||
|
E
nding balance of TDRs
(a)
|
$
|
124
|
|
$
|
86
|
|
$
|
324
|
|
$
|
366
|
|
$
|
448
|
|
$
|
452
|
|
||
|
Six months ended June 30,
(in millions) |
Auto
|
Business banking
|
Total other consumer
|
|||||||||||||||||
|
2013
|
2012
|
2013
|
2012
|
2013
|
2012
|
|||||||||||||||
|
Beginning balance of TDRs
|
$
|
150
|
|
$
|
88
|
|
$
|
352
|
|
$
|
415
|
|
$
|
502
|
|
$
|
503
|
|
||
|
New TDRs
|
42
|
|
27
|
|
40
|
|
34
|
|
82
|
|
61
|
|
||||||||
|
Charge-offs post-modification
|
(5
|
)
|
(4
|
)
|
(2
|
)
|
(5
|
)
|
(7
|
)
|
(9
|
)
|
||||||||
|
Foreclosures and other liquidations
|
—
|
|
—
|
|
—
|
|
—
|
|
—
|
|
—
|
|
||||||||
|
Principal payments and other
|
(63
|
)
|
(25
|
)
|
(66
|
)
|
(78
|
)
|
(129
|
)
|
(103
|
)
|
||||||||
|
E
nding balance of TDRs
(a)
|
$
|
124
|
|
$
|
86
|
|
$
|
324
|
|
$
|
366
|
|
$
|
448
|
|
$
|
452
|
|
||
|
(a)
|
At
June 30, 2013
, included
$57 million
of Chapter 7 auto loans. Certain of these loans were previously reported as nonaccrual loans (e.g., based upon the delinquency status of the loan).
|
Financial effects of modifications and redefaults
For auto loans, TDRs typically occur in connection with the bankruptcy of the borrower. In these cases, the loan is modified with a revised repayment plan that typically incorporates interest rate reductions and, to a lesser extent, principal forgiveness. Beginning September 30, 2012, Chapter 7 auto loans are also considered TDRs.
For business banking loans, concessions are dependent on individual borrower circumstances and can be of a short-term nature for borrowers who need temporary relief or longer term for borrowers experiencing more fundamental financial difficulties. Concessions are predominantly term or payment extensions, but also may include interest rate reductions.
The balance of business banking loans modified in TDRs that experienced a payment default, and for which the payment default occurred within one year of the modification, was
$11 million
and
$14 million
during the
three months ended
June 30, 2013
and
2012
, respectively, and
$23 million
and
$25 million
during the
six months ended
June 30, 2013
and
2012
, respectively. The balance of auto loans modified in TDRs that experienced a payment default, and for which the payment default occurred within
one year
of the modification, was
$15 million
and
$7 million
during the
three months ended
June 30, 2013
and
2012
, respectively, and
$28 million
and
$14 million
during the
six months ended
June 30, 2013
and
2012
, respectively. A payment default is deemed to occur as follows: (1) for scored auto and business banking loans, when the loan is
two
payments past due; and (2) for risk-rated business banking loans and auto loans, when the borrower has not made a loan payment by its scheduled due date after giving effect to the contractual grace period, if any.
The following table provides information about the financial effects of the various concessions granted in modifications of other consumer loans for the periods presented.
|
Three months ended June 30,
|
Six months ended June 30,
|
||||||||||||||||||
|
Auto
|
Business banking
|
Auto
|
Business banking
|
||||||||||||||||
|
2013
|
2012
|
2013
|
2012
|
2013
|
2012
|
2013
|
2012
|
||||||||||||
|
Weighted-average interest rate of loans with interest rate reductions – before TDR
|
13.46
|
%
|
12.55
|
%
|
7.58
|
%
|
8.24
|
%
|
13.19
|
%
|
10.99
|
%
|
7.94
|
%
|
8.14
|
%
|
|||
|
Weighted-average interest rate of loans with interest rate reductions – after TDR
|
4.82
|
|
5.10
|
|
6.16
|
|
6.03
|
|
4.94
|
|
4.71
|
|
5.84
|
|
6.07
|
|
|||
|
Weighted-average remaining contractual term (in years) of loans with term or payment extensions – before TDR
|
NM
|
|
NM
|
|
1.6
|
|
0.7
|
|
NM
|
|
NM
|
|
1.5
|
|
1.0
|
|
|||
|
Weighted-average remaining contractual term (in years) of loans with term or payment extensions – after TDR
|
NM
|
|
NM
|
|
3.8
|
|
1.9
|
|
NM
|
|
NM
|
|
3.1
|
|
2.5
|
|
|||
167
Purchased credit-impaired loans
For a detailed discussion of PCI loans, including the related accounting policies, see Note 14 on pages 250–275 of
JPMorgan Chase
’s
2012
Annual Report
.
Residential real estate – PCI loans
The table below sets forth information about the Firm’s consumer, excluding credit card, PCI loans.
|
(in millions, except ratios)
|
Home equity
|
Prime mortgage
|
Subprime mortgage
|
Option ARMs
|
Total PCI
|
|||||||||||||||||||||||||||||
|
Jun 30,
2013 |
Dec 31,
2012 |
Jun 30,
2013 |
Dec 31,
2012 |
Jun 30,
2013 |
Dec 31,
2012 |
Jun 30,
2013 |
Dec 31,
2012 |
Jun 30,
2013 |
Dec 31,
2012 |
|||||||||||||||||||||||||
|
Carrying value
(a)
|
$
|
19,992
|
|
$
|
20,971
|
|
$
|
12,976
|
|
$
|
13,674
|
|
$
|
4,448
|
|
$
|
4,626
|
|
$
|
19,320
|
|
$
|
20,466
|
|
$
|
56,736
|
|
$
|
59,737
|
|
||||
|
Related allowance for loan losses
(b)
|
1,908
|
|
1,908
|
|
1,929
|
|
1,929
|
|
380
|
|
380
|
|
1,494
|
|
1,494
|
|
5,711
|
|
5,711
|
|
||||||||||||||
|
Loan delinquency (based on unpaid principal balance)
|
||||||||||||||||||||||||||||||||||
|
Current
|
$
|
19,280
|
|
$
|
20,331
|
|
$
|
10,688
|
|
$
|
11,078
|
|
$
|
4,205
|
|
$
|
4,198
|
|
$
|
16,038
|
|
$
|
16,415
|
|
$
|
50,211
|
|
$
|
52,022
|
|
||||
|
30–149 days past due
|
639
|
|
803
|
|
643
|
|
740
|
|
592
|
|
698
|
|
1,039
|
|
1,314
|
|
2,913
|
|
3,555
|
|
||||||||||||||
|
150 or more days past due
|
1,173
|
|
1,209
|
|
1,673
|
|
2,066
|
|
1,169
|
|
1,430
|
|
4,032
|
|
4,862
|
|
8,047
|
|
9,567
|
|
||||||||||||||
|
Total loans
|
$
|
21,092
|
|
$
|
22,343
|
|
$
|
13,004
|
|
$
|
13,884
|
|
$
|
5,966
|
|
$
|
6,326
|
|
$
|
21,109
|
|
$
|
22,591
|
|
$
|
61,171
|
|
$
|
65,144
|
|
||||
|
% of 30+ days past due to total loans
|
8.59
|
%
|
9.01
|
%
|
17.81
|
%
|
20.21
|
%
|
29.52
|
%
|
33.64
|
%
|
24.02
|
%
|
27.34
|
%
|
17.92
|
%
|
20.14
|
%
|
||||||||||||||
|
Current estimated LTV ratios (based on unpaid principal balance)
(c)(d)
|
||||||||||||||||||||||||||||||||||
|
Greater than 125% and refreshed FICO scores:
|
||||||||||||||||||||||||||||||||||
|
Equal to or greater than 660
|
$
|
2,600
|
|
$
|
4,508
|
|
$
|
674
|
|
$
|
1,478
|
|
$
|
237
|
|
$
|
375
|
|
$
|
757
|
|
$
|
1,597
|
|
$
|
4,268
|
|
$
|
7,958
|
|
||||
|
Less than 660
|
1,399
|
|
2,344
|
|
745
|
|
1,449
|
|
841
|
|
1,300
|
|
1,397
|
|
2,729
|
|
4,382
|
|
7,822
|
|
||||||||||||||
|
101% to 125% and refreshed FICO scores:
|
||||||||||||||||||||||||||||||||||
|
Equal to or greater than 660
|
4,352
|
|
4,966
|
|
2,045
|
|
2,968
|
|
408
|
|
434
|
|
2,175
|
|
3,281
|
|
8,980
|
|
11,649
|
|
||||||||||||||
|
Less than 660
|
1,924
|
|
2,098
|
|
1,523
|
|
1,983
|
|
1,124
|
|
1,256
|
|
2,569
|
|
3,200
|
|
7,140
|
|
8,537
|
|
||||||||||||||
|
80% to 100% and refreshed FICO scores:
|
||||||||||||||||||||||||||||||||||
|
Equal to or greater than 660
|
4,183
|
|
3,531
|
|
2,728
|
|
1,872
|
|
496
|
|
416
|
|
3,906
|
|
3,794
|
|
11,313
|
|
9,613
|
|
||||||||||||||
|
Less than 660
|
1,621
|
|
1,305
|
|
1,719
|
|
1,378
|
|
1,236
|
|
1,182
|
|
3,152
|
|
2,974
|
|
7,728
|
|
6,839
|
|
||||||||||||||
|
Lower than 80% and refreshed FICO scores:
|
||||||||||||||||||||||||||||||||||
|
Equal to or greater than 660
|
3,602
|
|
2,524
|
|
1,903
|
|
1,356
|
|
375
|
|
255
|
|
4,020
|
|
2,624
|
|
9,900
|
|
6,759
|
|
||||||||||||||
|
Less than 660
|
1,411
|
|
1,067
|
|
1,667
|
|
1,400
|
|
1,249
|
|
1,108
|
|
3,133
|
|
2,392
|
|
7,460
|
|
5,967
|
|
||||||||||||||
|
Total unpaid principal balance
|
$
|
21,092
|
|
$
|
22,343
|
|
$
|
13,004
|
|
$
|
13,884
|
|
$
|
5,966
|
|
$
|
6,326
|
|
$
|
21,109
|
|
$
|
22,591
|
|
$
|
61,171
|
|
$
|
65,144
|
|
||||
|
Geographic region (based on unpaid principal balance)
|
||||||||||||||||||||||||||||||||||
|
California
|
$
|
12,717
|
|
$
|
13,493
|
|
$
|
7,380
|
|
$
|
7,877
|
|
$
|
1,373
|
|
$
|
1,444
|
|
$
|
11,176
|
|
$
|
11,889
|
|
$
|
32,646
|
|
$
|
34,703
|
|
||||
|
New York
|
1,020
|
|
1,067
|
|
877
|
|
927
|
|
622
|
|
649
|
|
1,318
|
|
1,404
|
|
3,837
|
|
4,047
|
|
||||||||||||||
|
Illinois
|
476
|
|
502
|
|
401
|
|
433
|
|
314
|
|
338
|
|
547
|
|
587
|
|
1,738
|
|
1,860
|
|
||||||||||||||
|
Florida
|
1,960
|
|
2,054
|
|
942
|
|
1,023
|
|
601
|
|
651
|
|
2,210
|
|
2,480
|
|
5,713
|
|
6,208
|
|
||||||||||||||
|
Texas
|
357
|
|
385
|
|
136
|
|
148
|
|
351
|
|
368
|
|
112
|
|
118
|
|
956
|
|
1,019
|
|
||||||||||||||
|
New Jersey
|
402
|
|
423
|
|
376
|
|
401
|
|
244
|
|
260
|
|
802
|
|
854
|
|
1,824
|
|
1,938
|
|
||||||||||||||
|
Arizona
|
384
|
|
408
|
|
202
|
|
215
|
|
100
|
|
105
|
|
290
|
|
305
|
|
976
|
|
1,033
|
|
||||||||||||||
|
Washington
|
1,144
|
|
1,215
|
|
293
|
|
328
|
|
124
|
|
142
|
|
508
|
|
563
|
|
2,069
|
|
2,248
|
|
||||||||||||||
|
Michigan
|
66
|
|
70
|
|
203
|
|
211
|
|
154
|
|
163
|
|
222
|
|
235
|
|
645
|
|
679
|
|
||||||||||||||
|
Ohio
|
25
|
|
27
|
|
66
|
|
71
|
|
93
|
|
100
|
|
84
|
|
89
|
|
268
|
|
287
|
|
||||||||||||||
|
All other
|
2,541
|
|
2,699
|
|
2,128
|
|
2,250
|
|
1,990
|
|
2,106
|
|
3,840
|
|
4,067
|
|
10,499
|
|
11,122
|
|
||||||||||||||
|
Total unpaid principal balance
|
$
|
21,092
|
|
$
|
22,343
|
|
$
|
13,004
|
|
$
|
13,884
|
|
$
|
5,966
|
|
$
|
6,326
|
|
$
|
21,109
|
|
$
|
22,591
|
|
$
|
61,171
|
|
$
|
65,144
|
|
||||
|
(a)
|
Carrying value includes the effect of fair value adjustments that were applied to the consumer PCI portfolio at the date of acquisition.
|
|
(b)
|
Management concluded as part of the Firm’s regular assessment of the PCI loan pools that it was probable that higher expected credit losses would result in a decrease in expected cash flows. As a result, an allowance for loan losses for impairment of these pools has been recognized.
|
|
(c)
|
Represents the aggregate unpaid principal balance of loans divided by the estimated current property value. Current property values are estimated, at a minimum, quarterly, based on home valuation models using nationally recognized home price index valuation estimates incorporating actual data to the extent available and forecasted data where actual data is not available. These property values do not represent actual appraised loan level collateral values; as such, the resulting ratios are necessarily imprecise and should be viewed as estimates. Current estimated combined LTV for junior lien home equity loans considers all available lien positions related to the property.
|
|
(d)
|
Refreshed FICO scores, which the Firm obtains at least quarterly, represent each borrower’s most recent credit score.
|
168
Approximately
21%
of the PCI home equity portfolio are senior lien loans; the remaining balance are junior lien HELOANs or HELOCs. The following tables set forth delinquency statistics for PCI junior lien home equity loans and lines of credit based on unpaid principal balance as of
June 30, 2013
, and
December 31, 2012
.
|
Delinquencies
|
|||||||||||||||||||
|
June 30, 2013
|
30–89 days past due
|
90–149 days past due
|
150+ days past due
|
Total loans
|
Total 30+ day delinquency rate
|
||||||||||||||
|
(in millions, except ratios)
|
|||||||||||||||||||
|
HELOCs:
(a)
|
|||||||||||||||||||
|
Within the revolving period
(b)
|
$
|
279
|
|
$
|
123
|
|
$
|
567
|
|
$
|
13,980
|
|
6.93
|
%
|
|||||
|
Beyond the revolving period
(c)
|
40
|
|
14
|
|
56
|
|
1,649
|
|
6.67
|
|
|||||||||
|
HELOANs
|
28
|
|
13
|
|
40
|
|
983
|
|
8.24
|
|
|||||||||
|
Total
|
$
|
347
|
|
$
|
150
|
|
$
|
663
|
|
$
|
16,612
|
|
6.98
|
%
|
|||||
|
Delinquencies
|
|||||||||||||||||||
|
December 31, 2012
|
30–89 days past due
|
90–149 days past due
|
150+ days past due
|
Total loans
|
Total 30+ day delinquency rate
|
||||||||||||||
|
(in millions, except ratios)
|
|||||||||||||||||||
|
HELOCs:
(a)
|
|||||||||||||||||||
|
Within the revolving period
(b)
|
$
|
361
|
|
$
|
175
|
|
$
|
591
|
|
$
|
15,915
|
|
7.08
|
%
|
|||||
|
Beyond the revolving period
(c)
|
30
|
|
13
|
|
20
|
|
666
|
|
9.46
|
|
|||||||||
|
HELOANs
|
37
|
|
18
|
|
44
|
|
1,085
|
|
9.12
|
|
|||||||||
|
Total
|
$
|
428
|
|
$
|
206
|
|
$
|
655
|
|
$
|
17,666
|
|
7.30
|
%
|
|||||
|
(a)
|
In general, these HELOCs are revolving loans for a
10
-year period, after which time the HELOC converts to an interest-only loan with a balloon payment at the end of the loan’s term.
|
|
(b)
|
Substantially all undrawn HELOCs within the revolving period have been closed.
|
|
(c)
|
Includes loans modified into fixed rate amortizing loans.
|
The table below sets forth the accretable yield activity for the Firm’s PCI consumer loans for the
three and six months ended
June 30, 2013
and
2012
, and represents the Firm’s estimate of gross interest income expected to be earned over the remaining life of the PCI loan portfolios. The table excludes the cost to fund the PCI portfolios, and therefore the accretable yield does not represent net interest income expected to be earned on these portfolios.
|
(in millions, except ratios)
|
Total PCI
|
||||||||||||
|
Three months ended June 30,
|
Six months ended June 30,
|
||||||||||||
|
2013
|
2012
|
2013
|
2012
|
||||||||||
|
Beginning balance
|
$
|
19,464
|
|
$
|
19,717
|
|
$
|
18,457
|
|
$
|
19,072
|
|
|
|
Accretion into interest income
|
(565
|
)
|
(638
|
)
|
(1,138
|
)
|
(1,296
|
)
|
|||||
|
Changes in interest rates on variable-rate loans
|
49
|
|
(33
|
)
|
(110
|
)
|
(173
|
)
|
|||||
|
Other changes in expected cash flows
(a)
|
(342
|
)
|
521
|
|
1,397
|
|
1,964
|
|
|||||
|
Balance at June 30
|
$
|
18,606
|
|
$
|
19,567
|
|
$
|
18,606
|
|
$
|
19,567
|
|
|
|
Accretable yield percentage
|
4.38
|
%
|
4.45
|
%
|
4.36
|
%
|
4.47
|
%
|
|||||
|
(a)
|
Other changes in expected cash flows may vary from period to period as the Firm continues to refine its cash flow model and periodically updates model assumptions. For the
three months ended
June 30, 2013
, other changes in expected cash flows were predominantly driven by changes in prepayment assumptions. For the
six months ended
June 30, 2013
, other changes in expected cash flows were due to refining the expected interest cash flows on HELOCs with balloon payments, partially offset by changes in prepayment assumptions. For the
three and six months ended
June 30, 2012
, other changes in expected cash flows were principally driven by the impact of modifications, but also related to changes in prepayment assumptions.
|
The factors that most significantly affect estimates of gross cash flows expected to be collected, and accordingly the accretable yield balance, include: (i) changes in the benchmark interest rate indices for variable-rate products such as option ARM and home equity loans; and (ii) changes in prepayment assumptions.
Since the date of acquisition, the decrease in the accretable yield percentage has been primarily related to a decrease in interest rates on variable-rate loans and, to a lesser extent, extended loan liquidation periods. Certain events, such as extended or shortened loan liquidation periods, affect the timing of expected cash flows and the accretable yield
percentage, but not the amount of cash expected to be received (i.e., the accretable yield balance). While extended loan liquidation periods reduce the accretable yield percentage (because the same accretable yield balance is recognized against a higher-than-expected loan balance over a longer-than-expected period of time), shortened loan liquidation periods would have the opposite effect.
169
Credit card loan portfolio
The Credit card portfolio segment includes credit card loans originated and purchased by the Firm. Delinquency rates are the primary credit quality indicator for credit card loans as they provide an early warning that borrowers may be experiencing difficulties (
30 days
past due); information on those borrowers that have been delinquent for a longer period of time (
90 days
past due) is also considered. In addition to delinquency rates, the geographic distribution of the loans provides insight as to the credit quality of the portfolio based on the regional economy.
While the borrower’s credit score is another general indicator of credit quality, because the borrower’s credit score tends to be a lagging indicator, the Firm does not view credit scores as a primary indicator of credit quality. However, the distribution of such scores provides a general indicator of credit quality trends within the portfolio. Refreshed FICO score information for a statistically significant random sample of the credit card portfolio is indicated in the table below; FICO is considered to be the industry benchmark for credit scores. For more information on credit quality indicators, see Note 14 on pages 250–275 of
JPMorgan Chase
’s
2012
Annual Report
.
The Firm generally originates new card accounts to prime consumer borrowers. However, certain cardholders’ FICO scores may decrease over time, depending on the performance of the cardholder and changes in credit score technology.
The table below sets forth information about the Firm’s credit card loans.
|
(in millions, except ratios)
|
Jun 30,
2013 |
Dec 31,
2012 |
||||
|
Loan delinquency
|
||||||
|
Current and less than 30 days past due
and still accruing |
$
|
122,190
|
|
$
|
125,309
|
|
|
30–89 days past due and still accruing
|
1,073
|
|
1,381
|
|
||
|
90 or more days past due and still accruing
|
1,024
|
|
1,302
|
|
||
|
Nonaccrual loans
|
1
|
|
1
|
|
||
|
Total retained credit card loans
|
$
|
124,288
|
|
$
|
127,993
|
|
|
Loan delinquency ratios
|
||||||
|
% of 30+ days past due to total retained loans
|
1.69
|
%
|
2.10
|
%
|
||
|
% of 90+ days past due to total retained loans
|
0.82
|
|
1.02
|
|
||
|
Credit card loans by geographic region
|
||||||
|
California
|
$
|
16,670
|
|
$
|
17,115
|
|
|
New York
|
10,146
|
|
10,379
|
|
||
|
Texas
|
10,084
|
|
10,209
|
|
||
|
Illinois
|
7,260
|
|
7,399
|
|
||
|
Florida
|
6,961
|
|
7,231
|
|
||
|
New Jersey
|
5,351
|
|
5,503
|
|
||
|
Ohio
|
4,808
|
|
4,956
|
|
||
|
Pennsylvania
|
4,377
|
|
4,549
|
|
||
|
Michigan
|
3,604
|
|
3,745
|
|
||
|
Virginia
|
3,080
|
|
3,193
|
|
||
|
All other
|
51,947
|
|
53,714
|
|
||
|
Total retained credit card loans
|
$
|
124,288
|
|
$
|
127,993
|
|
|
Percentage of portfolio based on carrying value with estimated refreshed FICO scores
(a)
|
||||||
|
Equal to or greater than 660
|
85.2
|
%
|
84.1
|
%
|
||
|
Less than 660
|
14.8
|
|
15.9
|
|
||
|
(a)
|
Refreshed FICO scores are estimated based on a statistically significant random sample of credit card accounts in the credit card portfolio for the periods shown. The Firm obtains refreshed FICO scores at least quarterly.
|
170
Credit card impaired loans and loan modifications
For a detailed discussion of impaired credit card loans, including credit card loan modifications, see Note 14 on pages 250–275 of
JPMorgan Chase
’s
2012
Annual Report
.
The table below sets forth information about the Firm’s impaired credit card loans. All of these loans are considered to be impaired as they have been modified in TDRs.
|
(in millions)
|
Jun 30,
2013 |
Dec 31,
2012 |
||||
|
Impaired credit card loans with an allowance
(a)(b)
|
||||||
|
Credit card loans with modified payment terms
(c)
|
$
|
3,407
|
|
$
|
4,189
|
|
|
Modified credit card loans that have reverted to pre-modification payment terms
(d)
|
450
|
|
573
|
|
||
|
Total impaired credit card loans
|
$
|
3,857
|
|
$
|
4,762
|
|
|
Allowance for loan losses related to impaired credit card loans
|
$
|
1,227
|
|
$
|
1,681
|
|
|
(a)
|
The carrying value and the unpaid principal balance are the same for credit card impaired loans.
|
|
(b)
|
There were no impaired loans without an allowance.
|
|
(c)
|
Represents credit card loans outstanding to borrowers enrolled in a credit card modification program as of the date presented.
|
|
(d)
|
Represents credit card loans that were modified in TDRs but that have subsequently reverted back to the loans’ pre-modification payment terms. At
June 30, 2013
, and
December 31, 2012
,
$264 million
and
$341 million
, respectively, of loans have reverted back to the pre-modification payment terms of the loans due to noncompliance with the terms of the modified loans. The remaining
$186 million
and
$232 million
at
June 30, 2013
, and
December 31, 2012
, respectively, of these loans are to borrowers who have successfully completed a short-term modification program. The Firm continues to report these loans as TDRs since the borrowers’ credit lines remain closed.
|
The following table presents average balances of impaired credit card loans and interest income recognized on those loans.
|
Three months
ended June 30, |
Six months
ended June 30, |
||||||||||||
|
(in millions)
|
2013
|
2012
|
2013
|
2012
|
|||||||||
|
Average impaired
credit card loans
|
$
|
4,070
|
|
$
|
6,196
|
|
$
|
4,294
|
|
$
|
6,520
|
|
|
|
Interest income on impaired credit card loans
|
52
|
|
80
|
|
110
|
|
169
|
|
|||||
Loan modifications
JPMorgan Chase may offer one of a number of loan modification programs to credit card borrowers who are experiencing financial difficulty. Most of the credit card loans have been modified under long-term programs for borrowers who are experiencing financial difficulties. Modifications under long-term programs involve placing the customer on a fixed payment plan, generally for
60 months
. The Firm may also offer short-term programs for borrowers who may be in need of temporary relief; however, none are currently being offered. Modifications under all short- and long-term programs typically include reducing the interest rate on the credit card. Substantially all modifications are considered to be TDRs.
If the cardholder does not comply with the modified payment terms, then the credit card loan agreement reverts back to its pre-modification payment terms. Assuming that the cardholder does not begin to perform in accordance with those payment terms, the loan continues to age and will ultimately be charged-off in accordance with the Firm’s standard charge-off policy. In addition, if a borrower successfully completes a short-term modification program, then the loan reverts back to its pre-modification payment terms. However, in most cases, the Firm does not reinstate the borrower’s line of credit.
The following table provides information regarding the nature and extent of modifications of credit card loans for the periods presented.
|
New enrollments
|
|||||||||||||
|
Three months
ended June 30, |
Six months
ended June 30, |
||||||||||||
|
(in millions)
|
2013
|
2012
|
2013
|
2012
|
|||||||||
|
Short-term programs
|
$
|
—
|
|
$
|
16
|
|
$
|
—
|
|
$
|
47
|
|
|
|
Long-term programs
|
288
|
|
408
|
|
627
|
|
888
|
|
|||||
|
Total new enrollments
|
$
|
288
|
|
$
|
424
|
|
$
|
627
|
|
$
|
935
|
|
|
Financial effects of modifications and redefaults
The following table provides information about the financial effects of the concessions granted on credit card loans modified in TDRs and redefaults for the periods presented.
|
(in millions, except weighted-average data)
|
Three months
ended June 30, |
Six months
ended June 30, |
|||||||||||
|
2013
|
2012
|
2013
|
2012
|
||||||||||
|
Weighted-average interest rate of loans – before TDR
|
15.38
|
%
|
15.25
|
%
|
15.44
|
%
|
15.91
|
%
|
|||||
|
Weighted-average interest rate of loans – after TDR
|
4.27
|
|
5.17
|
|
4.88
|
|
5.36
|
|
|||||
|
Loans that redefaulted within one year of modification
(a)
|
$
|
41
|
|
$
|
81
|
|
$
|
85
|
|
$
|
178
|
|
|
|
(a)
|
Represents loans modified in TDRs that experienced a payment default in the periods presented, and for which the payment default occurred within
one year
of the modification. The amounts presented represent the balance of such loans as of the end of the quarter in which they defaulted.
|
For credit card loans modified in TDRs, payment default is deemed to have occurred when the loans become
two
payments past due. A substantial portion of these loans is expected to be charged-off in accordance with the Firm’s standard charge-off policy. Based on historical experience, the estimated weighted-average default rate was expected to be
33.54%
for credit card loans modified as of
June 30, 2013
, and
38.23%
for credit card loans modified as of
December 31, 2012
.
171
Wholesale loan portfolio
Wholesale loans include loans made to a variety of customers, ranging from large corporate and institutional clients to high-net-worth individuals. The primary credit quality indicator for wholesale loans is the risk rating
assigned each loan. For further information on these risk ratings, see Notes 14 and 15 on pages 250–279 of
JPMorgan Chase
’s
2012
Annual Report
.
The table below provides information by class of receivable for the retained loans in the Wholesale portfolio segment.
|
Commercial
and industrial
|
Real estate
|
|||||||||||||||
|
(in millions, except ratios)
|
Jun 30,
2013 |
Dec 31,
2012 |
Jun 30,
2013 |
Dec 31,
2012 |
||||||||||||
|
Loans by risk ratings
|
||||||||||||||||
|
Investment-grade
|
$
|
64,602
|
|
$
|
61,870
|
|
$
|
46,400
|
|
$
|
41,796
|
|
||||
|
Noninvestment-grade:
|
||||||||||||||||
|
Noncriticized
|
42,775
|
|
44,651
|
|
13,847
|
|
14,567
|
|
||||||||
|
Criticized performing
|
2,662
|
|
2,636
|
|
3,138
|
|
3,857
|
|
||||||||
|
Criticized nonaccrual
|
321
|
|
708
|
|
451
|
|
520
|
|
||||||||
|
Total noninvestment-grade
|
45,758
|
|
47,995
|
|
17,436
|
|
18,944
|
|
||||||||
|
Total retained loans
|
$
|
110,360
|
|
$
|
109,865
|
|
$
|
63,836
|
|
$
|
60,740
|
|
||||
|
% of total criticized to total retained loans
|
2.70
|
%
|
3.04
|
%
|
5.62
|
%
|
7.21
|
%
|
||||||||
|
% of nonaccrual loans to total retained loans
|
0.29
|
|
0.64
|
|
0.71
|
|
0.86
|
|
||||||||
|
Loans by geographic distribution
(a)
|
||||||||||||||||
|
Total non-U.S.
|
$
|
36,300
|
|
$
|
35,494
|
|
$
|
1,458
|
|
$
|
1,533
|
|
||||
|
Total U.S.
|
74,060
|
|
74,371
|
|
62,378
|
|
59,207
|
|
||||||||
|
Total retained loans
|
$
|
110,360
|
|
$
|
109,865
|
|
$
|
63,836
|
|
$
|
60,740
|
|
||||
|
Loan delinquency
(b)
|
||||||||||||||||
|
Current and less than 30 days past due and still accruing
|
$
|
109,825
|
|
$
|
109,019
|
|
$
|
63,276
|
|
$
|
59,829
|
|
||||
|
30–89 days past due and still accruing
|
207
|
|
119
|
|
79
|
|
322
|
|
||||||||
|
90 or more days past due and still accruing
(c)
|
7
|
|
19
|
|
30
|
|
69
|
|
||||||||
|
Criticized nonaccrual
|
321
|
|
708
|
|
451
|
|
520
|
|
||||||||
|
Total retained loans
|
$
|
110,360
|
|
$
|
109,865
|
|
$
|
63,836
|
|
$
|
60,740
|
|
||||
|
(a)
|
The U.S. and non-U.S. distribution is determined based predominantly on the domicile of the borrower.
|
|
(b)
|
The credit quality of wholesale loans is assessed primarily through ongoing review and monitoring of an obligor’s ability to meet contractual obligations rather than relying on the past due status, which is generally a lagging indicator of credit quality. For a discussion of more significant risk factors, see Note 14 on page 271 of
JPMorgan Chase
’s
2012
Annual Report
.
|
|
(c)
|
Represents loans that are considered well-collateralized and therefore still accruing interest.
|
|
(d)
|
Other primarily includes loans to SPEs and loans to private banking clients. See Note 1 on pages 193–194 of
JPMorgan Chase
’s
2012
Annual Report
for additional information on SPEs.
|
The following table presents additional information on the real estate class of loans within the Wholesale portfolio segment for the periods indicated. For further information on real estate loans, see Note 14 on pages 250–275 of
JPMorgan Chase
’s
2012
Annual Report
.
|
(in millions, except ratios)
|
Multifamily
|
Commercial lessors
|
||||||||||||||
|
Jun 30,
2013 |
Dec 31,
2012 |
Jun 30,
2013 |
Dec 31,
2012 |
|||||||||||||
|
Real estate retained loans
|
$
|
40,823
|
|
$
|
38,030
|
|
$
|
15,022
|
|
$
|
14,668
|
|
||||
|
Criticized exposure
|
1,655
|
|
2,118
|
|
1,660
|
|
1,951
|
|
||||||||
|
% of criticized exposure to total real estate retained loans
|
4.05
|
%
|
5.57
|
%
|
11.05
|
%
|
13.30
|
%
|
||||||||
|
Criticized nonaccrual
|
$
|
232
|
|
$
|
249
|
|
$
|
182
|
|
$
|
207
|
|
||||
|
% of criticized nonaccrual to total real estate retained loans
|
0.57
|
%
|
0.65
|
%
|
1.21
|
%
|
1.41
|
%
|
||||||||
172
(table continued from previous page)
|
Financial
institutions
|
Government agencies
|
Other
(d)
|
Total
retained loans
|
||||||||||||||||||||||||||||
|
Jun 30,
2013 |
Dec 31,
2012 |
Jun 30,
2013 |
Dec 31,
2012 |
Jun 30,
2013 |
Dec 31,
2012 |
Jun 30,
2013 |
Dec 31,
2012 |
||||||||||||||||||||||||
|
$
|
30,698
|
|
$
|
22,064
|
|
$
|
8,470
|
|
$
|
9,183
|
|
$
|
75,250
|
|
$
|
79,533
|
|
$
|
225,420
|
|
$
|
214,446
|
|
||||||||
|
8,681
|
|
13,760
|
|
221
|
|
356
|
|
9,953
|
|
9,914
|
|
75,477
|
|
83,248
|
|
||||||||||||||||
|
314
|
|
395
|
|
3
|
|
5
|
|
193
|
|
201
|
|
6,310
|
|
7,094
|
|
||||||||||||||||
|
15
|
|
8
|
|
—
|
|
—
|
|
214
|
|
198
|
|
1,001
|
|
1,434
|
|
||||||||||||||||
|
9,010
|
|
14,163
|
|
224
|
|
361
|
|
10,360
|
|
10,313
|
|
82,788
|
|
91,776
|
|
||||||||||||||||
|
$
|
39,708
|
|
$
|
36,227
|
|
$
|
8,694
|
|
$
|
9,544
|
|
$
|
85,610
|
|
$
|
89,846
|
|
$
|
308,208
|
|
$
|
306,222
|
|
||||||||
|
0.83
|
%
|
1.11
|
%
|
0.03
|
%
|
0.05
|
%
|
0.48
|
%
|
0.44
|
%
|
2.37
|
%
|
2.78
|
%
|
||||||||||||||||
|
0.04
|
|
0.02
|
|
—
|
|
—
|
|
0.25
|
|
0.22
|
|
0.32
|
|
0.47
|
|
||||||||||||||||
|
$
|
27,680
|
|
$
|
26,326
|
|
$
|
1,186
|
|
$
|
1,582
|
|
$
|
40,473
|
|
$
|
39,421
|
|
$
|
107,097
|
|
$
|
104,356
|
|
||||||||
|
12,028
|
|
9,901
|
|
7,508
|
|
7,962
|
|
45,137
|
|
50,425
|
|
201,111
|
|
201,866
|
|
||||||||||||||||
|
$
|
39,708
|
|
$
|
36,227
|
|
$
|
8,694
|
|
$
|
9,544
|
|
$
|
85,610
|
|
$
|
89,846
|
|
$
|
308,208
|
|
$
|
306,222
|
|
||||||||
|
$
|
39,632
|
|
$
|
36,151
|
|
$
|
8,692
|
|
$
|
9,516
|
|
$
|
84,585
|
|
$
|
88,177
|
|
$
|
306,010
|
|
$
|
302,692
|
|
||||||||
|
55
|
|
62
|
|
2
|
|
28
|
|
761
|
|
1,427
|
|
1,104
|
|
1,958
|
|
||||||||||||||||
|
6
|
|
6
|
|
—
|
|
—
|
|
50
|
|
44
|
|
93
|
|
138
|
|
||||||||||||||||
|
15
|
|
8
|
|
—
|
|
—
|
|
214
|
|
198
|
|
1,001
|
|
1,434
|
|
||||||||||||||||
|
$
|
39,708
|
|
$
|
36,227
|
|
$
|
8,694
|
|
$
|
9,544
|
|
$
|
85,610
|
|
$
|
89,846
|
|
$
|
308,208
|
|
$
|
306,222
|
|
||||||||
(table continued from previous page)
|
Commercial construction and development
|
Other
|
Total real estate loans
|
|||||||||||||||||||||
|
Jun 30,
2013 |
Dec 31,
2012 |
Jun 30,
2013 |
Dec 31,
2012 |
Jun 30,
2013 |
Dec 31,
2012 |
||||||||||||||||||
|
$
|
3,202
|
|
$
|
2,989
|
|
$
|
4,789
|
|
$
|
5,053
|
|
$
|
63,836
|
|
$
|
60,740
|
|
||||||
|
92
|
|
119
|
|
182
|
|
189
|
|
3,589
|
|
4,377
|
|
||||||||||||
|
2.87
|
%
|
3.98
|
%
|
3.80
|
%
|
3.74
|
%
|
5.62
|
%
|
7.21
|
%
|
||||||||||||
|
$
|
7
|
|
$
|
21
|
|
$
|
30
|
|
$
|
43
|
|
$
|
451
|
|
$
|
520
|
|
||||||
|
0.22
|
%
|
0.70
|
%
|
0.63
|
%
|
0.85
|
%
|
0.71
|
%
|
0.86
|
%
|
||||||||||||
173
Wholesale impaired loans and loan modifications
Wholesale impaired loans are comprised of loans that have been placed on nonaccrual status and/or that have been modified in a troubled debt restructuring (“TDR”). All impaired loans are evaluated for an asset-specific allowance as described in Note 14 on page
176
of
this Form 10-Q
.
The table below sets forth information about the Firm’s wholesale impaired loans.
|
(in millions)
|
Commercial
and industrial
|
Real estate
|
Financial
institutions
|
Government
agencies
|
Other
|
Total
retained loans
|
|||||||||||||||||||||||||||||||||||
|
Jun 30,
2013 |
Dec 31,
2012 |
Jun 30,
2013 |
Dec 31,
2012 |
Jun 30,
2013 |
Dec 31,
2012 |
Jun 30,
2013 |
Dec 31,
2012 |
Jun 30,
2013 |
Dec 31,
2012 |
Jun 30,
2013 |
Dec 31,
2012 |
||||||||||||||||||||||||||||||
|
Impaired loans
|
|||||||||||||||||||||||||||||||||||||||||
|
With an allowance
|
$
|
285
|
|
$
|
588
|
|
$
|
334
|
|
$
|
375
|
|
$
|
13
|
|
$
|
6
|
|
$
|
—
|
|
$
|
—
|
|
$
|
179
|
|
$
|
122
|
|
$
|
811
|
|
$
|
1,091
|
|
|||||
|
Without an allowance
(a)
|
44
|
|
173
|
|
133
|
|
133
|
|
2
|
|
2
|
|
—
|
|
—
|
|
42
|
|
76
|
|
221
|
|
384
|
|
|||||||||||||||||
|
Total
impaired loans
|
$
|
329
|
|
$
|
761
|
|
$
|
467
|
|
$
|
508
|
|
$
|
15
|
|
$
|
8
|
|
$
|
—
|
|
$
|
—
|
|
$
|
221
|
|
$
|
198
|
|
$
|
1,032
|
|
$
|
1,475
|
|
|||||
|
Allowance for loan losses related to impaired loans
|
$
|
104
|
|
$
|
205
|
|
$
|
74
|
|
$
|
82
|
|
$
|
10
|
|
$
|
2
|
|
$
|
—
|
|
$
|
—
|
|
$
|
40
|
|
$
|
30
|
|
$
|
228
|
|
$
|
319
|
|
|||||
|
Unpaid principal balance of impaired loans
(b)
|
445
|
|
957
|
|
670
|
|
626
|
|
15
|
|
22
|
|
—
|
|
—
|
|
297
|
|
318
|
|
1,427
|
|
1,923
|
|
|||||||||||||||||
|
(a)
|
When the discounted cash flows, collateral value or market price equals or exceeds the recorded investment in the loan, the loan does not require an allowance. This typically occurs when the impaired loans have been partially charged-off and/or there have been interest payments received and applied to the loan balance.
|
|
(b)
|
Represents the contractual amount of principal owed at
June 30, 2013
, and
December 31, 2012
. The unpaid principal balance differs from the impaired loan balances due to various factors, including charge-offs; interest payments received and applied to the carrying value; net deferred loan fees or costs; and unamortized discount or premiums on purchased loans.
|
The following table presents the Firm’s average impaired loans for the periods indicated.
|
Three months
ended June 30, |
Six months
ended June 30, |
||||||||||||
|
(in millions)
|
2013
|
2012
|
2013
|
2012
|
|||||||||
|
Commercial and industrial
|
$
|
387
|
|
$
|
892
|
|
$
|
496
|
|
$
|
905
|
|
|
|
Real estate
|
518
|
|
850
|
|
526
|
|
865
|
|
|||||
|
Financial institutions
|
11
|
|
20
|
|
9
|
|
24
|
|
|||||
|
Government agencies
|
—
|
|
12
|
|
—
|
|
14
|
|
|||||
|
Other
|
226
|
|
299
|
|
225
|
|
347
|
|
|||||
|
Total
(a)
|
$
|
1,142
|
|
$
|
2,073
|
|
$
|
1,256
|
|
$
|
2,155
|
|
|
|
(a)
|
The related interest income on accruing impaired loans and interest income recognized on a cash basis were not material for the
three and six months ended
June 30, 2013
and
2012
.
|
174
Loan modifications
Certain loan modifications are considered to be TDRs as they provide various concessions to borrowers who are experiencing financial difficulty. All TDRs are reported as impaired loans in the tables above. For further information, see Note 14 on page 252 and pages 274–275 of
JPMorgan Chase
’s
2012
Annual Report
.
The following tables provide information about the Firm’s wholesale loans that have been modified in TDRs, including a reconciliation of the beginning and ending balances of such loans and information regarding the nature and extent of modifications during the periods presented.
|
Three months ended June 30,
(in millions) |
Commercial and industrial
|
Real estate
|
Other
(b)
|
Total
|
||||||||||||||||||||||||||||
|
2013
|
2012
|
2013
|
2012
|
2013
|
2012
|
2013
|
2012
|
|||||||||||||||||||||||||
|
Beginning balance of TDRs
|
$
|
254
|
|
$
|
419
|
|
$
|
124
|
|
$
|
148
|
|
$
|
43
|
|
$
|
97
|
|
$
|
421
|
|
$
|
664
|
|
||||||||
|
New TDRs
|
27
|
|
$
|
52
|
|
10
|
|
7
|
|
15
|
|
3
|
|
52
|
|
62
|
|
|||||||||||||||
|
Increases to existing TDRs
|
1
|
|
19
|
|
—
|
|
—
|
|
—
|
|
—
|
|
1
|
|
19
|
|
||||||||||||||||
|
Charge-offs post-modification
|
—
|
|
(6
|
)
|
—
|
|
—
|
|
—
|
|
(7
|
)
|
—
|
|
(13
|
)
|
||||||||||||||||
|
Sales and other
(a)
|
(173
|
)
|
(20
|
)
|
(23
|
)
|
(34
|
)
|
(24
|
)
|
(63
|
)
|
(220
|
)
|
(117
|
)
|
||||||||||||||||
|
Ending balance of TDRs
|
$
|
109
|
|
$
|
464
|
|
$
|
111
|
|
$
|
121
|
|
$
|
34
|
|
$
|
30
|
|
$
|
254
|
|
$
|
615
|
|
||||||||
|
Six months ended June 30,
(in millions) |
Commercial and industrial
|
Real estate
|
Other
(b)
|
Total
|
||||||||||||||||||||||||||||
|
2013
|
2012
|
2013
|
2012
|
2013
|
2012
|
2013
|
2012
|
|||||||||||||||||||||||||
|
Beginning balance of TDRs
|
$
|
575
|
|
$
|
531
|
|
$
|
99
|
|
$
|
176
|
|
$
|
22
|
|
$
|
43
|
|
$
|
696
|
|
$
|
750
|
|
||||||||
|
New TDRs
|
41
|
|
$
|
56
|
|
41
|
|
10
|
|
37
|
|
66
|
|
119
|
|
132
|
|
|||||||||||||||
|
Increases to existing TDRs
|
4
|
|
20
|
|
—
|
|
—
|
|
—
|
|
—
|
|
4
|
|
20
|
|
||||||||||||||||
|
Charge-offs post-modification
|
(1
|
)
|
(15
|
)
|
(3
|
)
|
(2
|
)
|
—
|
|
(7
|
)
|
(4
|
)
|
(24
|
)
|
||||||||||||||||
|
Sales and other
(a)
|
(510
|
)
|
(128
|
)
|
(26
|
)
|
(63
|
)
|
(25
|
)
|
(72
|
)
|
(561
|
)
|
(263
|
)
|
||||||||||||||||
|
Ending balance of TDRs
|
$
|
109
|
|
$
|
464
|
|
$
|
111
|
|
$
|
121
|
|
$
|
34
|
|
$
|
30
|
|
$
|
254
|
|
$
|
615
|
|
||||||||
|
TDRs on nonaccrual status
|
$
|
102
|
|
$
|
341
|
|
$
|
82
|
|
$
|
88
|
|
$
|
27
|
|
$
|
29
|
|
$
|
211
|
|
$
|
458
|
|
||||||||
|
Additional commitments to lend to borrowers whose loans have been modified in TDRs
|
22
|
|
201
|
|
—
|
|
—
|
|
1
|
|
—
|
|
23
|
|
201
|
|
||||||||||||||||
|
(a)
|
Sales and other are largely sales and paydowns, but also included performing loans restructured at market rates that were removed from the reported TDR balance of
zero
and
$17 million
during the
three months ended
June 30, 2013
and
2012
, respectively, and
zero
and
$40 million
during the
six months ended
June 30, 2013
and
2012
, respectively. Loans that have been removed continue to be evaluated along with other impaired loans to determine the asset-specific component of the allowance for loan losses (see Note 15 on pages 276–279 of
JPMorgan Chase
’s
2012
Annual Report
).
|
|
(b)
|
Includes loans to Financial institutions, Government agencies and Other.
|
Financial effects of modifications and redefaults
Wholesale loans modified as TDRs are typically term or payment extensions and, to a lesser extent, deferrals of principal and/or interest on commercial and industrial and real estate loans. For the
three months ended
June 30, 2013
and
2012
, the average term extension granted on wholesale loans with term or payment extensions was
0.9
years and
1.3
years, respectively. The weighted-average remaining term for all wholesale loans modified during these periods was
1.4
years and
2.8
years, respectively. Wholesale TDR loans that redefaulted within one year of the modification were
$1 million
and
$5 million
during the
three months ended
June 30, 2013
and
2012
, respectively.
For the
six months ended
June 30, 2013
and
2012
, the average term extension granted on wholesale loans with term or payment extensions was
2.1
years and
1.3
years, respectively. The weighted-average remaining term for all wholesale loans modified during these periods was
1.6
years and
3.6
years, respectively. Wholesale TDR loans that redefaulted within one year of the modification were
$1 million
and
$52 million
during the
six months ended
June 30, 2013
and
2012
, respectively. A payment default is deemed to occur when the borrower has not made a loan payment by its scheduled due date after giving effect to any contractual grace period.
175
For detailed discussion of the allowance for credit losses and the related accounting policies, see Note 15 on pages 276–279
JPMorgan Chase
’s
2012
Annual Report
.
Allowance for credit losses and loans and lending-related commitments by impairment methodology
The table below summarizes information about the allowance for loan losses, loans by impairment methodology, the allowance for lending-related commitments and lending-related commitments by impairment methodology.
|
2013
|
2012
|
||||||||||||||||||||||||||||
|
Six months ended June 30,
(in millions) |
Consumer, excluding credit card
|
Credit card
|
Wholesale
|
Total
|
Consumer, excluding credit card
|
Credit card
|
Wholesale
|
Total
|
|||||||||||||||||||||
|
Allowance for loan losses
|
|||||||||||||||||||||||||||||
|
Beginning balance at January 1,
|
$
|
12,292
|
|
$
|
5,501
|
|
$
|
4,143
|
|
$
|
21,936
|
|
$
|
16,294
|
|
$
|
6,999
|
|
$
|
4,316
|
|
$
|
27,609
|
|
|||||
|
Gross charge-offs
|
1,295
|
|
2,414
|
|
116
|
|
3,825
|
|
2,188
|
|
3,210
|
|
165
|
|
5,563
|
|
|||||||||||||
|
Gross recoveries
|
(231
|
)
|
(318
|
)
|
(148
|
)
|
(697
|
)
|
(268
|
)
|
(479
|
)
|
(151
|
)
|
(898
|
)
|
|||||||||||||
|
Net charge-offs/(recoveries)
|
1,064
|
|
2,096
|
|
(32
|
)
|
3,128
|
|
1,920
|
|
2,731
|
|
14
|
|
4,665
|
|
|||||||||||||
|
Provision for loan losses
|
(531
|
)
|
1,046
|
|
64
|
|
579
|
|
(423
|
)
|
1,231
|
|
38
|
|
846
|
|
|||||||||||||
|
Other
|
(6
|
)
|
(6
|
)
|
9
|
|
(3
|
)
|
(8
|
)
|
—
|
|
9
|
|
1
|
|
|||||||||||||
|
Ending balance at June 30,
|
$
|
10,691
|
|
$
|
4,445
|
|
$
|
4,248
|
|
$
|
19,384
|
|
$
|
13,943
|
|
$
|
5,499
|
|
$
|
4,349
|
|
$
|
23,791
|
|
|||||
|
Allowance for loan losses by impairment methodology
|
|||||||||||||||||||||||||||||
|
Asset-specific
(a)
|
$
|
713
|
|
$
|
1,227
|
|
(b)
|
$
|
228
|
|
$
|
2,168
|
|
$
|
1,004
|
|
$
|
1,977
|
|
(b)
|
$
|
407
|
|
$
|
3,388
|
|
|||
|
Formula-based
|
4,267
|
|
3,218
|
|
4,020
|
|
11,505
|
|
7,228
|
|
3,522
|
|
3,942
|
|
14,692
|
|
|||||||||||||
|
PCI
|
5,711
|
|
—
|
|
—
|
|
5,711
|
|
5,711
|
|
—
|
|
—
|
|
5,711
|
|
|||||||||||||
|
Total allowance for loan losses
|
$
|
10,691
|
|
$
|
4,445
|
|
$
|
4,248
|
|
$
|
19,384
|
|
$
|
13,943
|
|
$
|
5,499
|
|
$
|
4,349
|
|
$
|
23,791
|
|
|||||
|
Loans by impairment methodology
|
|||||||||||||||||||||||||||||
|
Asset-specific
|
$
|
14,251
|
|
$
|
3,857
|
|
$
|
1,032
|
|
$
|
19,140
|
|
$
|
11,614
|
|
$
|
5,794
|
|
$
|
1,946
|
|
$
|
19,354
|
|
|||||
|
Formula-based
|
216,401
|
|
120,431
|
|
307,164
|
|
643,996
|
|
225,821
|
|
118,799
|
|
296,927
|
|
641,547
|
|
|||||||||||||
|
PCI
|
56,736
|
|
—
|
|
12
|
|
56,748
|
|
62,611
|
|
—
|
|
15
|
|
62,626
|
|
|||||||||||||
|
Total retained loans
|
$
|
287,388
|
|
$
|
124,288
|
|
$
|
308,208
|
|
$
|
719,884
|
|
$
|
300,046
|
|
$
|
124,593
|
|
$
|
298,888
|
|
$
|
723,527
|
|
|||||
|
Impaired collateral-dependent loans
|
|||||||||||||||||||||||||||||
|
Net charge-offs
|
$
|
132
|
|
$
|
—
|
|
$
|
10
|
|
$
|
142
|
|
$
|
51
|
|
$
|
—
|
|
$
|
46
|
|
$
|
97
|
|
|||||
|
Loans measured at fair value of collateral less cost to sell
|
3,152
|
|
—
|
|
394
|
|
3,546
|
|
887
|
|
—
|
|
671
|
|
1,558
|
|
|||||||||||||
|
Allowance for lending-related commitments
|
|||||||||||||||||||||||||||||
|
Beginning balance at January 1,
|
$
|
7
|
|
$
|
—
|
|
$
|
661
|
|
$
|
668
|
|
$
|
7
|
|
$
|
—
|
|
$
|
666
|
|
$
|
673
|
|
|||||
|
Provision for lending-related commitments
|
1
|
|
—
|
|
84
|
|
85
|
|
—
|
|
—
|
|
94
|
|
94
|
|
|||||||||||||
|
Other
|
—
|
|
—
|
|
—
|
|
—
|
|
—
|
|
—
|
|
(3
|
)
|
(3
|
)
|
|||||||||||||
|
Ending balance at June 30,
|
$
|
8
|
|
$
|
—
|
|
$
|
745
|
|
$
|
753
|
|
$
|
7
|
|
$
|
—
|
|
$
|
757
|
|
$
|
764
|
|
|||||
|
Allowance for lending-related commitments by impairment methodology
|
|||||||||||||||||||||||||||||
|
Asset-specific
|
$
|
—
|
|
$
|
—
|
|
$
|
79
|
|
$
|
79
|
|
$
|
—
|
|
$
|
—
|
|
$
|
181
|
|
$
|
181
|
|
|||||
|
Formula-based
|
8
|
|
—
|
|
666
|
|
674
|
|
7
|
|
—
|
|
576
|
|
583
|
|
|||||||||||||
|
Total allowance for lending-related commitments
|
$
|
8
|
|
$
|
—
|
|
$
|
745
|
|
$
|
753
|
|
$
|
7
|
|
$
|
—
|
|
$
|
757
|
|
$
|
764
|
|
|||||
|
Lending-related commitments by impairment methodology
|
|||||||||||||||||||||||||||||
|
Asset-specific
|
$
|
—
|
|
$
|
—
|
|
$
|
283
|
|
$
|
283
|
|
$
|
—
|
|
$
|
—
|
|
$
|
565
|
|
$
|
565
|
|
|||||
|
Formula-based
|
62,303
|
|
532,359
|
|
445,189
|
|
1,039,851
|
|
62,438
|
|
534,267
|
|
419,076
|
|
1,015,781
|
|
|||||||||||||
|
Total lending-related commitments
|
$
|
62,303
|
|
$
|
532,359
|
|
$
|
445,472
|
|
$
|
1,040,134
|
|
$
|
62,438
|
|
$
|
534,267
|
|
$
|
419,641
|
|
$
|
1,016,346
|
|
|||||
|
(a)
|
Includes risk-rated loans that have been placed on nonaccrual status and loans that have been modified in a TDR.
|
|
(b)
|
The asset-specific credit card allowance for loan losses is related to loans that have been modified in a TDR; such allowance is calculated based on the loans’ original contractual interest rates and does not consider any incremental penalty rates.
|
176
For a further description of JPMorgan Chase’s accounting policies regarding consolidation of variable interest entities (“VIEs”), see Note 1 on pages 193–194 of JPMorgan Chase’s 2012 Annual Report.
The following table summarizes the most significant types of Firm-sponsored VIEs by business segment.
|
Line-of-Business
|
Transaction Type
|
Activity
|
Form 10-Q page reference
|
|
CCB
|
Credit card securitization trusts
|
Securitization of both originated and purchased credit card receivables
|
177
|
|
Mortgage securitization trusts
|
Securitization of both originated and purchased residential mortgages
|
177-179
|
|
|
Other securitization trusts
|
Securitization of originated automobile and student loans
|
177-179
|
|
|
CIB
|
Mortgage and other securitization trusts
|
Securitization of both originated and purchased residential and commercial mortgages, automobile and student loans
|
177-179
|
|
Multi-seller conduits
Investor intermediation activities:
|
Assist clients in accessing the financial markets in a cost-efficient manner and structures transactions to meet investor needs
|
179
|
|
|
Municipal bond vehicles
|
179-180
|
||
|
Credit-related note and asset swap vehicles
|
180
|
||
The Firm also invests in and provides financing and other services to VIEs sponsored by third parties, as described in Note 16 on page 288 of JPMorgan Chase’s 2012 Annual Report.
Significant Firm-sponsored variable interest entities
Credit card securitizations
For a more detailed discussion of JPMorgan Chase’s involvement with credit card securitizations, see Note 16 on page 281 of JPMorgan Chase’s 2012 Annual Report.
As a result of the Firm’s continuing involvement, the Firm is considered to be the primary beneficiary of its Firm-sponsored credit card securitization trusts. This includes the Firm’s primary card securitization trust, Chase Issuance Trust. See the table on page
181
of this Note for further information on consolidated VIE assets and liabilities.
Firm-sponsored mortgage and other securitization trusts
The Firm securitizes (or has securitized) originated and purchased residential mortgages, commercial mortgages and other consumer loans (including automobile and student loans) primarily in its CIB and CCB businesses. Depending on the particular transaction, as well as the respective business involved, the Firm may act as the servicer of the loans and/or retain certain beneficial interest in the securitization trusts.
For a detailed discussion of the Firm’s involvement with Firm-sponsored mortgage and other securitization trusts, as well as the accounting treatment relating to such trusts, see Note 16 on pages 281–284 of JPMorgan Chase’s 2012 Annual Report.
177
The following table presents the total unpaid principal amount of assets held in Firm-sponsored private-label securitization entities, including those in which the Firm has continuing involvement, and those that are consolidated by the Firm. Continuing involvement includes servicing the loans; holding senior interests or subordinated interests; recourse or guarantee arrangements; and derivative transactions. In certain instances, the Firm’s only continuing involvement is servicing the loans. See Securitization activity on page
182
of this Note for further information regarding the Firm’s cash flows with and interests retained in nonconsolidated VIEs, and Loans and excess mortgage servicing rights sold to agencies and other third-party-sponsored securitization entities on pages
182–183
of this Note for information on the Firm’s loan sales to U.S. government agencies.
|
Principal amount outstanding
|
JPMorgan Chase interest in securitized assets in nonconsolidated VIEs
(c)(d)(e)
|
||||||||||||||||||
|
June 30, 2013
(a)
(in billions)
|
Total assets held by securitization VIEs
|
Assets
held in consolidated securitization VIEs
|
Assets held in nonconsolidated securitization VIEs with continuing involvement
|
Trading assets
|
AFS securities
|
Total interests held by JPMorgan Chase
|
|||||||||||||
|
Securitization-related
|
|||||||||||||||||||
|
Residential mortgage:
|
|||||||||||||||||||
|
Prime and Alt-A
|
$
|
96.4
|
|
$
|
2.5
|
|
$
|
74.9
|
|
$
|
0.5
|
|
$
|
0.2
|
|
$
|
0.7
|
|
|
|
Subprime
|
33.7
|
|
1.1
|
|
30.3
|
|
0.1
|
|
—
|
|
0.1
|
|
|||||||
|
Option ARMs
|
24.5
|
|
0.2
|
|
24.2
|
|
—
|
|
—
|
|
—
|
|
|||||||
|
Commercial and other
(b)
|
129.2
|
|
—
|
|
92.1
|
|
1.2
|
|
2.6
|
|
3.8
|
|
|||||||
|
Total
|
$
|
283.8
|
|
$
|
3.8
|
|
$
|
221.5
|
|
$
|
1.8
|
|
$
|
2.8
|
|
$
|
4.6
|
|
|
|
Principal amount outstanding
|
JPMorgan Chase interest in securitized assets in nonconsolidated VIEs
(c)(d)(e)
|
||||||||||||||||||
|
December 31, 2012
(a)
(in billions)
|
Total assets held by securitization VIEs
|
Assets held in consolidated securitization VIEs
|
Assets held in nonconsolidated securitization VIEs with continuing involvement
|
Trading assets
|
AFS securities
|
Total interests held by JPMorgan Chase
|
|||||||||||||
|
Securitization-related
|
|||||||||||||||||||
|
Residential mortgage:
|
|||||||||||||||||||
|
Prime and Alt-A
|
$
|
107.2
|
|
$
|
2.5
|
|
$
|
80.6
|
|
$
|
0.3
|
|
$
|
—
|
|
$
|
0.3
|
|
|
|
Subprime
|
34.5
|
|
1.3
|
|
31.3
|
|
0.1
|
|
—
|
|
0.1
|
|
|||||||
|
Option ARMs
|
26.3
|
|
0.2
|
|
26.1
|
|
—
|
|
—
|
|
—
|
|
|||||||
|
Commercial and other
(b)
|
127.8
|
|
—
|
|
81.8
|
|
1.5
|
|
2.8
|
|
4.3
|
|
|||||||
|
Total
|
$
|
295.8
|
|
$
|
4.0
|
|
$
|
219.8
|
|
$
|
1.9
|
|
$
|
2.8
|
|
$
|
4.7
|
|
|
|
(a)
|
Excludes U.S. government agency securitizations. See Loans and excess mortgage servicing rights sold to agencies and other third-party-sponsored securitization entities on pages
182–183
of this Note for information on the Firm’s loan sales to U.S. government agencies.
|
|
(b)
|
Consists of securities backed by commercial loans (predominantly real estate) and non-mortgage-related consumer receivables purchased from third parties. The Firm generally does not retain a residual interest in its sponsored commercial mortgage securitization transactions.
|
|
(c)
|
The table above excludes the following: retained servicing (see Note 16 on pages
184–187
of this Form 10-Q for a discussion of MSRs); securities retained from loans sales to U.S. government agencies; interest rate and foreign exchange derivatives primarily used to manage interest rate and foreign exchange risks of securitization entities (See Note 5 on pages
131–142
of this Form 10-Q for further information on derivatives); senior and subordinated securities of
$276 million
and
$12 million
, respectively, at June 30, 2013, and
$131 million
and
$45 million
, respectively, at December 31, 2012, which the Firm purchased in connection with CIB’s secondary market-making activities.
|
|
(d)
|
Includes interests held in re-securitization transactions.
|
|
(e)
|
As of June 30, 2013, and December 31, 2012,
69%
and
74%
, respectively, of the Firm’s retained securitization interests, which are carried at fair value, were risk-rated “A” or better, on an S&P-equivalent basis. The retained interests in prime residential mortgages consisted of
$418 million
and
$170 million
of investment-grade and
$284 million
and
$171 million
of noninvestment-grade retained interests at June 30, 2013, and December 31, 2012, respectively. The retained interests in commercial and other securitizations trusts consisted of
$3.7 billion
and
$4.1 billion
of investment-grade and
$163 million
and
$164 million
of noninvestment-grade retained interests at June 30, 2013, and December 31, 2012, respectively.
|
178
Residential mortgages
For a more detailed description of the Firm’s involvement with residential mortgage securitizations, see Note 16 on page 283 of JPMorgan Chase’s 2012 Annual Report.
At June 30, 2013, and December 31, 2012, the Firm did not consolidate the assets of certain Firm-sponsored residential mortgage securitization VIEs, in which the Firm had continuing involvement, primarily due to the fact that the Firm did not hold an interest in these trusts that could potentially be significant to the trusts. See the table on page
181
of this Note for more information on the consolidated residential mortgage securitizations, and the table on the previous page of this Note for further information on interests held in nonconsolidated residential mortgage securitizations.
Commercial mortgages and other consumer securitizations
CIB originates and securitizes commercial mortgage loans, and engages in underwriting and trading activities involving the securities issued by securitization trusts. For a more detailed description of the Firm’s involvement with commercial mortgage and other consumer securitizations, see Note 16 on page 283 of JPMorgan Chase’s 2012 Annual Report. See the table on the previous page of this Note for more information on interests held in nonconsolidated securitizations.
Re-securitizations
For a more detailed description of JPMorgan Chase’s
participation in re-securitization transactions, see Note 16 on pages 283–284 of JPMorgan Chase’s 2012 Annual Report.
During the three and six months ended June 30, 2013, the Firm transferred
$2.9 billion
and
$7.1 billion
, respectively, of securities to agency VIEs. There were no securities transferred to private-label VIEs during the three and six months ended June 30, 2013. During the three and six months ended June 30, 2012, the Firm transferred
$3.1 billion
and
$6.0 billion
, respectively, of securities to agency VIEs, and
zero
and
$241 million
, respectively, of securities to private-label VIEs.
As of June 30, 2013, and December 31, 2012, the Firm did not consolidate any agency re-securitizations. As of June 30, 2013, and December 31, 2012, the Firm consolidated
$88 million
and
$76 million
, respectively, of assets, and
$3 million
and
$5 million
, respectively, of liabilities of private-label re-securitizations. See the table on page
181
of this Note for more information on the consolidated re-securitization transactions.
As of June 30, 2013, and December 31, 2012, total assets (including the notional amount of interest-only securities) of nonconsolidated Firm-sponsored private-label re-securitization entities in which the Firm has continuing involvement were
$3.8 billion
and
$4.6 billion
, respectively. At June 30, 2013, and December 31, 2012, the Firm held approximately
$2.4 billion
and
$2.0 billion
, respectively, of interests in nonconsolidated agency re-securitization entities, and
$5 million
and
$61 million
, respectively, of senior and subordinated interests in nonconsolidated private-label re-securitization entities. See the table on page
178
of this Note for further information on interests held in nonconsolidated securitizations.
Multi-seller conduits
For a more detailed description of JPMorgan Chase’s principal involvement with Firm-administered multi-seller conduits, see Note 16 on pages 284–285 of JPMorgan Chase’s 2012 Annual Report.
In the normal course of business, JPMorgan Chase makes markets in and invests in commercial paper, including commercial paper issued by the Firm-administered multi-seller conduits. The Firm held
$3.8 billion
and
$8.3 billion
of the commercial paper issued by the Firm-administered multi-seller conduits at June 30, 2013, and December 31, 2012, which was eliminated in consolidation. The Firm’s investments were not driven by market liquidity and the Firm is not obligated under any agreement to purchase the commercial paper issued by the Firm-administered multi-seller conduits.
Deal-specific liquidity facilities, program-wide liquidity and credit enhancement provided by the Firm have been eliminated in consolidation. The Firm provides lending-related commitments to certain clients of the Firm-administered multi-seller conduits. The unfunded portion of these commitments was
$12.1 billion
and
$10.8 billion
at June 30, 2013, and December 31, 2012, respectively, which are reported as off-balance sheet lending-related commitments. For more information on off-balance sheet lending-related commitments, see Note 21 on pages
193–197
of this Form 10-Q.
VIEs associated with investor intermediation activities
Municipal bond vehicles
For a more detailed description of JPMorgan Chase’s principal involvement with municipal bond vehicles, see Note 16 on pages 285–286 of JPMorgan Chase’s 2012 Annual Report.
179
The Firm’s exposure to nonconsolidated municipal bond VIEs at June 30, 2013, and December 31, 2012, including the ratings profile of the VIEs’ assets, was as follows.
|
(in billions)
|
Fair value of assets held by VIEs
|
Liquidity facilities
|
Excess/(deficit)
(a)
|
Maximum exposure
|
||||||||
|
Nonconsolidated municipal bond vehicles
|
||||||||||||
|
June 30, 2013
|
$
|
13.5
|
|
$
|
8.1
|
|
$
|
5.4
|
|
$
|
8.1
|
|
|
December 31, 2012
|
14.2
|
|
8.0
|
|
6.2
|
|
8.0
|
|
||||
|
Ratings profile of VIE assets
(b)
|
Fair value of assets held by VIEs
|
Wt. avg. expected life of assets (years)
|
||||||||||||||||||
|
Investment-grade
|
Noninvestment- grade
|
|||||||||||||||||||
|
(in billions, except where otherwise noted)
|
AAA to AAA-
|
AA+ to AA-
|
A+ to A-
|
BBB+ to BBB-
|
BB+ and below
|
|||||||||||||||
|
June 30, 2013
|
$
|
2.8
|
|
$
|
10.6
|
|
$
|
0.1
|
|
$
|
—
|
|
$
|
—
|
|
$
|
13.5
|
|
5.7
|
|
|
December 31, 2012
|
3.1
|
|
11.0
|
|
0.1
|
|
—
|
|
—
|
|
14.2
|
|
5.9
|
|||||||
|
(a)
|
Represents the excess/(deficit) of the fair values of municipal bond assets available to repay the liquidity facilities, if drawn.
|
|
(b)
|
The ratings scale is presented on an S&P-equivalent basis. Prior periods have been reclassified to conform with the current presentation.
|
Credit-related note and asset swap vehicles
For a more detailed description of JPMorgan Chase’s principal involvement with credit-related note and asset swap vehicles, see Note 16 on pages 286–288 of JPMorgan Chase’s 2012 Annual Report.
Exposure to nonconsolidated credit-related note and asset swap VIEs at June 30, 2013, and December 31, 2012, was as follows.
|
June 30, 2013
(in billions)
|
Net derivative receivables
|
Total
exposure
|
Par value of collateral held by VIEs
(a)
|
||||||
|
Credit-related notes
|
|||||||||
|
Static structure
|
$
|
—
|
|
$
|
—
|
|
$
|
5.0
|
|
|
Managed structure
|
0.2
|
|
0.2
|
|
4.7
|
|
|||
|
Total credit-related notes
|
0.2
|
|
0.2
|
|
9.7
|
|
|||
|
Asset swaps
|
0.4
|
|
0.4
|
|
7.6
|
|
|||
|
Total
|
$
|
0.6
|
|
$
|
0.6
|
|
$
|
17.3
|
|
|
December 31, 2012
(in billions)
|
Net derivative receivables
|
Total
exposure
|
Par value of collateral held by VIEs
(a)
|
||||||
|
Credit-related notes
|
|||||||||
|
Static structure
|
$
|
0.5
|
|
$
|
0.5
|
|
$
|
7.3
|
|
|
Managed structure
|
0.6
|
|
0.6
|
|
5.6
|
|
|||
|
Total credit-related notes
|
1.1
|
|
1.1
|
|
12.9
|
|
|||
|
Asset swaps
|
0.4
|
|
0.4
|
|
7.9
|
|
|||
|
Total
|
$
|
1.5
|
|
$
|
1.5
|
|
$
|
20.8
|
|
|
(a)
|
The Firm’s maximum exposure arises through the derivatives executed with the VIEs; the exposure varies over time with changes in the fair value of the derivatives. The Firm relies on the collateral held by the VIEs to pay any amounts due under the derivatives; the vehicles are structured at inception so that the par value of the collateral is expected to be sufficient to pay amounts due under the derivative contracts.
|
The Firm consolidated credit-related note vehicles with collateral fair values of
$410 million
and
$483 million
, at June 30, 2013, and December 31, 2012, respectively. These consolidated VIEs included some that were structured by the Firm where the Firm provides the credit derivative, and some that have been structured by third parties where the Firm is not the credit derivative provider. The Firm consolidated these vehicles, because it held positions in these entities that provided the Firm with control. The Firm did not consolidate any asset swap vehicles at June 30, 2013, and December 31, 2012.
VIEs sponsored by third parties
The Firm also invests in and provides financing and other services to VIEs sponsored by third parties, as described on page 288 of JPMorgan Chase’s 2012 Annual Report.
180
Consolidated VIE assets and liabilities
The following table presents information on assets and liabilities related to VIEs consolidated by the Firm as of June 30, 2013, and
December 31, 2012
.
|
Assets
|
Liabilities
|
|||||||||||||||||||||
|
June 30, 2013
(in billions)
(a)
|
Trading assets –
debt and equity instruments |
Loans
|
Other
(d)
|
Total
assets
(e)
|
Beneficial interests in
VIE assets
(f)
|
Other
(g)
|
Total
liabilities
|
|||||||||||||||
|
VIE program type
|
||||||||||||||||||||||
|
Firm-sponsored credit card trusts
|
$
|
—
|
|
$
|
49.2
|
|
$
|
1.0
|
|
$
|
50.2
|
|
$
|
28.6
|
|
$
|
—
|
|
$
|
28.6
|
|
|
|
Firm-administered multi-seller conduits
|
—
|
|
18.7
|
|
0.1
|
|
18.8
|
|
15.0
|
|
—
|
|
15.0
|
|
||||||||
|
Municipal bond vehicles
|
7.2
|
|
—
|
|
0.1
|
|
7.3
|
|
7.0
|
|
—
|
|
7.0
|
|
||||||||
|
Mortgage securitization entities
(b)
|
1.1
|
|
1.8
|
|
—
|
|
2.9
|
|
2.0
|
|
1.0
|
|
3.0
|
|
||||||||
|
Other
(c)
|
0.9
|
|
2.6
|
|
1.0
|
|
4.5
|
|
2.5
|
|
0.1
|
|
2.6
|
|
||||||||
|
Total
|
$
|
9.2
|
|
$
|
72.3
|
|
$
|
2.2
|
|
$
|
83.7
|
|
$
|
55.1
|
|
$
|
1.1
|
|
$
|
56.2
|
|
|
|
Assets
|
Liabilities
|
|||||||||||||||||||||
|
December 31, 2012 (in billions)
(a)
|
Trading assets –
debt and equity instruments |
Loans
|
Other
(d)
|
Total
assets
(e)
|
Beneficial interests in
VIE assets
(f)
|
Other
(g)
|
Total
liabilities
|
|||||||||||||||
|
VIE program type
|
||||||||||||||||||||||
|
Firm-sponsored credit card trusts
|
$
|
—
|
|
$
|
51.9
|
|
$
|
0.8
|
|
$
|
52.7
|
|
$
|
30.1
|
|
$
|
—
|
|
$
|
30.1
|
|
|
|
Firm-administered multi-seller conduits
|
—
|
|
25.4
|
|
0.1
|
|
25.5
|
|
17.2
|
|
—
|
|
17.2
|
|
||||||||
|
Municipal bond vehicles
|
9.8
|
|
—
|
|
0.1
|
|
9.9
|
|
11.0
|
|
—
|
|
11.0
|
|
||||||||
|
Mortgage securitization entities
(b)
|
1.4
|
|
2.0
|
|
—
|
|
3.4
|
|
2.3
|
|
1.1
|
|
3.4
|
|
||||||||
|
Other
(c)
|
0.8
|
|
3.4
|
|
1.1
|
|
5.3
|
|
2.6
|
|
0.1
|
|
2.7
|
|
||||||||
|
Total
|
$
|
12.0
|
|
$
|
82.7
|
|
$
|
2.1
|
|
$
|
96.8
|
|
$
|
63.2
|
|
$
|
1.2
|
|
$
|
64.4
|
|
|
|
(a)
|
Excludes intercompany transactions which were eliminated in consolidation.
|
|
(b)
|
Includes residential and commercial mortgage securitizations as well as re-securitizations.
|
|
(c)
|
Primarily comprises student loan securitization entities. The Firm consolidated
$2.6 billion
and
$3.3 billion
of student loan securitization entities as of June 30, 2013, and December 31, 2012, respectively.
|
|
(d)
|
Includes assets classified as cash, derivative receivables, AFS securities, and other assets within the Consolidated Balance Sheets.
|
|
(e)
|
The assets of the consolidated VIEs included in the program types above are used to settle the liabilities of those entities. The difference between total assets and total liabilities recognized for consolidated VIEs represents the Firm’s interest in the consolidated VIEs for each program type.
|
|
(f)
|
The interest-bearing beneficial interest liabilities issued by consolidated VIEs are classified in the line item on the Consolidated Balance Sheets titled, “Beneficial interests issued by consolidated variable interest entities.” The holders of these beneficial interests do not have recourse to the general credit of
JPMorgan Chase
. Included in beneficial interests in VIE assets are long-term beneficial interests of
$33.1 billion
and
$35.0 billion
at June 30, 2013, and December 31, 2012, respectively. The maturities of the long-term beneficial interests as of June 30, 2013, were as follows:
$9.4 billion
under one year,
$17.0 billion
between one and five years, and
$6.7 billion
over five years, all respectively.
|
|
(g)
|
Includes liabilities classified as accounts payable and other liabilities in the Consolidated Balance Sheets.
|
Supplemental information on loan securitizations
The Firm securitizes and sells a variety of loans, including residential mortgage, credit card, automobile, student and commercial (primarily related to real estate) loans, as well as debt securities. The primary purposes of these securitization transactions are to satisfy investor demand and to generate liquidity for the Firm.
181
Securitization activity
The following table provides information related to the Firm’s securitization activities for the three and six months ended June 30, 2013 and 2012, related to assets held in
JPMorgan Chase
-sponsored securitization entities that were not consolidated by the Firm, and where sale accounting was achieved based on the accounting rules in effect at the time of the securitization.
|
Three months ended June 30,
|
Six months ended June 30,
|
||||||||||||||||||||||||||
|
2013
|
2012
|
2013
|
2012
|
||||||||||||||||||||||||
|
(in millions, except rates)
(a)
|
Residential mortgage
(d)
|
Commercial and other
(f)
|
Residential mortgage
(d)(e)
|
Commercial and other
(f)
|
Residential mortgage
(d)
|
Commercial and other
(f)
|
Residential mortgage
(d)(e)
|
Commercial and other
(f)
|
|||||||||||||||||||
|
Principal securitized
|
$
|
443
|
|
$
|
3,078
|
|
$
|
—
|
|
$
|
2,063
|
|
$
|
1,059
|
|
$
|
5,284
|
|
(f)
|
$
|
—
|
|
$
|
2,063
|
|
||
|
All cash flows during the period:
|
|||||||||||||||||||||||||||
|
Proceeds from new securitizations
(b)
|
$
|
446
|
|
$
|
3,149
|
|
$
|
—
|
|
$
|
2,161
|
|
$
|
1,080
|
|
$
|
5,426
|
|
(f)
|
$
|
—
|
|
$
|
2,161
|
|
||
|
Servicing fees collected
|
158
|
|
2
|
|
171
|
|
1
|
|
285
|
|
3
|
|
351
|
|
2
|
|
|||||||||||
|
Purchases of previously transferred financial assets (or the underlying collateral)
(c)
|
19
|
|
—
|
|
52
|
|
—
|
|
271
|
|
—
|
|
111
|
|
—
|
|
|||||||||||
|
Cash flows received on interests
|
30
|
|
78
|
|
55
|
|
40
|
|
55
|
|
142
|
|
108
|
|
64
|
|
|||||||||||
|
(a)
|
Excludes re-securitization transactions.
|
|
(b)
|
For the three and six months ended June 30, 2013,
$446 million
and
$1.1 billion
, respectively, of proceeds from residential mortgage securitizations were received as securities classified in level 2 of the fair value hierarchy. For the three and six months June 30, 2013,
$3.1 billion
and
$5.2 billion
, respectively, of proceeds from commercial mortgage securitizations were received as securities classified in level 2 of the fair value hierarchy and
zero
and
$207 million
, respectively, of proceeds from commercial mortgage securitizations were received as cash. For the three and six months ended June 30, 2012,
$2.2 billion
and
$2.2 billion
, respectively, of commercial mortgage securitizations were received as securities classified in level 2 of the fair value hierarchy.
|
|
(c)
|
Includes cash paid by the Firm to reacquire assets from off–balance sheet, nonconsolidated entities – for example, loan repurchases due to representation and warranties and servicer clean-up calls.
|
|
(d)
|
Includes prime, Alt-A, subprime, and option ARMs. Excludes sales for which the Firm did not securitize the loan (including loans sold to Ginnie Mae, Fannie Mae and Freddie Mac).
|
|
(e)
|
There were no residential mortgage securitizations during the three months and six months ended June 30, 2012.
|
|
(f)
|
Includes commercial and student loan securitizations.
|
Loans and excess mortgage servicing rights sold to agencies and other third-party-sponsored securitization entities
In addition to the amounts reported in the securitization activity tables above, the Firm, in the normal course of business, sells originated and purchased mortgage loans and certain originated excess mortgage servicing rights on a nonrecourse basis, predominantly to Ginnie Mae, Fannie Mae and Freddie Mac (the “Agencies”). These loans and excess mortgage servicing rights are sold primarily for the purpose of securitization by the Agencies, which also provide credit enhancement of the loans and excess mortgage servicing rights through certain guarantee provisions. The Firm does not consolidate these securitization vehicles as it is not the primary beneficiary. For a limited number of loan sales, the Firm is obligated to share a portion of the credit risk associated with the sold loans with the purchaser. See Note 29 on pages 308–315 of the Firm’s 2012 Annual Report for additional information about the Firm’s loan sales- and securitization-related indemnifications. See Note 16 on pages
184–187
of this Form 10-Q for additional information about the impact of the Firm’s sale of certain excess mortgage servicing rights.
The following table summarizes the activities related to loans sold to U.S. agencies and third-party-sponsored securitization entities.
|
Three months ended
June 30,
|
Six months ended
June 30,
|
||||||||||||
|
(in millions)
|
2013
|
2012
|
2013
|
2012
|
|||||||||
|
Carrying value of loans sold
(a)
|
$
|
48,045
|
|
$
|
43,925
|
|
$
|
102,925
|
|
$
|
83,733
|
|
|
|
Proceeds received from loan sales as cash
|
295
|
|
23
|
|
461
|
|
41
|
|
|||||
|
Proceeds from loans sales as securities
(b)
|
47,223
|
|
43,436
|
|
101,392
|
|
82,691
|
|
|||||
|
Total proceeds received from loan sales
(c)
|
$
|
47,518
|
|
$
|
43,459
|
|
$
|
101,853
|
|
$
|
82,732
|
|
|
|
Gains on loan sales
(d)
|
112
|
|
56
|
|
250
|
|
91
|
|
|||||
|
(a)
|
Predominantly to U.S. government agencies.
|
|
(b)
|
Predominantly includes securities from U.S. government agencies that are generally sold shortly after receipt.
|
|
(c)
|
Excludes the value of MSRs retained upon the sale of loans. Gains on loans sales include the value of MSRs.
|
|
(d)
|
The carrying value of the loans accounted for at fair value approximated the proceeds received upon loan sale.
|
182
Options to repurchase delinquent loans
In addition to the Firm’s obligation to repurchase certain loans due to material breaches of representations and warranties as discussed in Note 21 on pages
193–197
of this Form 10-Q, the Firm also has the option to repurchase delinquent loans that it services for Ginnie Mae loan pools, as well as for other U.S. government agencies under certain arrangements. The Firm may elect to repurchase delinquent loans from Ginnie Mae loan pools as it continues to service them and/or manage the foreclosure process in accordance with the applicable requirements, and such loans continue to be insured or guaranteed. When the Firm’s repurchase option becomes exercisable, such loans must be reported on the Consolidated Balance Sheets as a loan with a corresponding liability. As of June 30, 2013, and December 31, 2012, the Firm had recorded on its Consolidated Balance Sheets
$14.6 billion
and
$15.6 billion
, respectively of loans that either had been repurchased or for which the Firm had an option to repurchase. Predominately all of these amounts relate to loans that have been repurchased from Ginnie Mae loan pools. Additionally, real estate owned resulting from voluntary repurchases of loans was
$1.8 billion
and
$1.6 billion
as of June 30, 2013, and December 31, 2012, respectively. Substantially all of these loans and real estate owned are insured or guaranteed by U.S. government agencies and reimbursement is proceeding normally. For additional information, refer to Note 13 on pages
153–175
of this Form 10-Q and Note 14 on pages 250–275 of JPMorgan Chase’s 2012 Annual Report.
JPMorgan Chase
’s interest in securitized assets held at fair value
The following table outlines the key economic assumptions used to determine the fair value, as of June 30, 2013, and December 31, 2012, of certain of the Firm’s retained interests in nonconsolidated VIEs (other than MSRs), that are valued using modeling techniques. The table also outlines the sensitivities of those fair values to immediate
10%
and
20%
adverse changes in assumptions used to determine fair value. For a discussion of MSRs, see Note 16 on pages
184–187
of this Form 10-Q.
|
Commercial and other
|
|||||||
|
(in millions, except rates and where otherwise noted)
(a)
|
June 30,
2013
|
December 31,
2012
|
|||||
|
JPMorgan Chase interests in securitized assets
|
$
|
1,217
|
|
$
|
1,488
|
|
|
|
Weighted-average life (in years)
|
6.1
|
|
6.1
|
|
|||
|
Weighted-average discount rate
(b)
|
4.8
|
%
|
4.1
|
%
|
|||
|
Impact of 10% adverse change
|
$
|
(35
|
)
|
$
|
(34
|
)
|
|
|
Impact of 20% adverse change
|
(64
|
)
|
(65
|
)
|
|||
|
(a)
|
The Firm’s interests in prime mortgage securitizations were
$702 million
and
$341 million
, as of June 30, 2013, and December 31, 2012, respectively. These include retained interests in Alt-A loans and re-securitization transactions. The Firm’s interests in subprime mortgage securitizations were
$65 million
and
$68 million
, as of June 30, 2013, and December 31, 2012, respectively.
|
|
(b)
|
Incorporates the Firm’s weighted-average loss assumption.
|
The sensitivity analysis in the preceding table is hypothetical. Changes in fair value based on a
10%
or
20%
variation in assumptions generally cannot be extrapolated easily, because the relationship of the change in the assumptions to the change in fair value may not be linear. Also, in the table, the effect that a change in a particular assumption may have on the fair value is calculated without changing any other assumption. In reality, changes in one factor may result in changes in another, which might counteract or magnify the sensitivities. The above sensitivities also do not reflect risk management practices the Firm may undertake to mitigate such risks.
183
Loan delinquencies and liquidation losses
The table below includes information about components of nonconsolidated securitized financial assets, in which the Firm has continuing involvement, and delinquencies as of June 30, 2013, and December 31, 2012, respectively; and liquidation losses for the three and six months ended June 30, 2013 and 2012, respectively.
|
Liquidation losses
|
|||||||||||||||||||||||||||
|
Securitized assets
|
90 days past due
|
Three months ended June 30,
|
Six months ended June 30,
|
||||||||||||||||||||||||
|
(in millions)
|
June 30, 2013
|
December 31, 2012
|
June 30, 2013
|
December 31, 2012
|
2013
|
2012
|
2013
|
2012
|
|||||||||||||||||||
|
Securitized loans
(a)
|
|||||||||||||||||||||||||||
|
Residential mortgage:
|
|||||||||||||||||||||||||||
|
Prime mortgage
(b)
|
$
|
74,919
|
|
$
|
80,572
|
|
$
|
11,972
|
|
$
|
16,270
|
|
$
|
1,007
|
|
$
|
2,125
|
|
$
|
2,245
|
|
$
|
3,824
|
|
|||
|
Subprime mortgage
|
30,271
|
|
31,264
|
|
8,915
|
|
10,570
|
|
756
|
|
320
|
|
1,539
|
|
1,121
|
|
|||||||||||
|
Option ARMs
|
24,253
|
|
26,095
|
|
5,384
|
|
6,595
|
|
303
|
|
634
|
|
714
|
|
1,250
|
|
|||||||||||
|
Commercial and other
|
92,075
|
|
81,834
|
|
2,820
|
|
4,077
|
|
184
|
|
292
|
|
330
|
|
521
|
|
|||||||||||
|
Total loans securitized
(c)
|
$
|
221,518
|
|
$
|
219,765
|
|
$
|
29,091
|
|
$
|
37,512
|
|
$
|
2,250
|
|
$
|
3,371
|
|
$
|
4,828
|
|
$
|
6,716
|
|
|||
|
(a)
|
Total assets held in securitization-related SPEs were
$283.8 billion
and
$295.8 billion
, respectively, at June 30, 2013, and December 31, 2012. The
$221.5 billion
and
$219.8 billion
, respectively, of loans securitized at June 30, 2013, and December 31, 2012, excluded:
$58.5 billion
and
$72.0 billion
, respectively, of securitized loans in which the Firm has no continuing involvement, and
$3.8 billion
and
$4.0 billion
, respectively, of loan securitizations consolidated on the Firm’s Consolidated Balance Sheets at June 30, 2013, and December 31, 2012.
|
|
(b)
|
Includes Alt-A loans.
|
|
(c)
|
Includes securitized loans that were previously recorded at fair value and classified as trading assets.
|
For a discussion of the accounting policies related to goodwill and other intangible assets, see Note 17 on pages 291–295 of JPMorgan Chase’s 2012 Annual Report.
Goodwill and other intangible assets consist of the following.
|
(in millions)
|
June 30, 2013
|
December 31, 2012
|
||||
|
Goodwill
|
$
|
48,057
|
|
$
|
48,175
|
|
|
Mortgage servicing rights
|
9,335
|
|
7,614
|
|
||
|
Other intangible assets:
|
||||||
|
Purchased credit card relationships
|
$
|
221
|
|
$
|
295
|
|
|
Other credit card-related intangibles
|
201
|
|
229
|
|
||
|
Core deposit intangibles
|
255
|
|
355
|
|
||
|
Other intangibles
|
1,274
|
|
1,356
|
|
||
|
Total other intangible assets
|
$
|
1,951
|
|
$
|
2,235
|
|
The following table presents goodwill attributed to the business segments.
|
(in millions)
|
June 30, 2013
|
December 31, 2012
|
||||
|
Consumer & Community Banking
|
$
|
30,971
|
|
$
|
31,048
|
|
|
Corporate & Investment Bank
|
6,869
|
|
6,895
|
|
||
|
Commercial Banking
|
2,862
|
|
2,863
|
|
||
|
Asset Management
|
6,978
|
|
6,992
|
|
||
|
Corporate/Private Equity
|
377
|
|
377
|
|
||
|
Total goodwill
|
$
|
48,057
|
|
$
|
48,175
|
|
The following table presents changes in the carrying amount of goodwill.
|
Three months ended
June 30, |
Six months ended
June 30, |
||||||||||||||
|
(in millions)
|
2013
|
2012
|
2013
|
2012
|
|||||||||||
|
Balance at beginning of period
(a)
|
$
|
48,067
|
|
$
|
48,208
|
|
$
|
48,175
|
|
$
|
48,188
|
|
|||
|
Changes during the period from:
|
|||||||||||||||
|
Business combinations
|
11
|
|
10
|
|
36
|
|
20
|
|
|||||||
|
Dispositions
|
(5
|
)
|
(4
|
)
|
(5
|
)
|
(4
|
)
|
|||||||
|
Other
(b)
|
(16
|
)
|
(83
|
)
|
(149
|
)
|
(73
|
)
|
|||||||
|
Balance at June 30,
(a)
|
$
|
48,057
|
|
$
|
48,131
|
|
$
|
48,057
|
|
$
|
48,131
|
|
|||
|
(a)
|
Reflects gross goodwill balances as the Firm has not recognized any impairment losses to date.
|
|
(b)
|
Includes foreign currency translation adjustments and other tax-related adjustments.
|
Goodwill was not impaired at
June 30, 2013
, or
December 31, 2012
, nor was any goodwill written off due to impairment during the three and six months ended June 30, 2013 and 2012.
The goodwill impairment test is based upon a comparison between the carrying value and fair value of a reporting unit. The Firm uses the reporting units’ allocated equity plus goodwill capital as a proxy for the carrying amounts of equity for the reporting units in the goodwill impairment testing. Reporting unit equity is determined on a basis similar to that used for the allocation of equity to the Firm’s lines of business, which primarily considers stand-alone peer comparisons and regulatory capital requirements (as estimated under Basel III), although economic risk capital is also considered. Proposed line of business equity levels are incorporated into the Firm’s annual budget process, which is reviewed by the Firm’s Board of Directors. Allocated
184
equity is further reviewed on a periodic basis and updated as needed. For a discussion of the primary method used to estimate the fair values of the reporting units, see Impairment testing on pages 291–292 of JPMorgan Chase’s 2012 Annual Report.
While no impairment of goodwill was recognized, the Firm’s mortgage lending business in CCB remains at an elevated risk for goodwill impairment due to its exposure to U.S. consumer credit risk and the effects of economic, regulatory and legislative changes. The valuation of this business is particularly dependent upon economic conditions (including new unemployment claims and home prices), regulatory and legislative changes (for example, those related to residential mortgage servicing, foreclosure and loss mitigation activities), and the amount of equity capital required. In addition, the earnings or estimated cost of equity of the Firm’s capital markets businesses could also be affected by regulatory or legislative changes. Declines in business performance, increases in allocated equity capital, or increases in the estimated cost of equity, could cause the
estimated fair values of the Firm’s reporting units or their associated goodwill to decline, which could result in a material impairment charge to earnings in a future period related to some portion of the associated goodwill.
Mortgage servicing rights
Mortgage servicing rights represent the fair value of expected future cash flows for performing servicing activities for others. The fair value considers estimated future servicing fees and ancillary revenue, offset by estimated costs to service the loans, and generally declines over time as net servicing cash flows are received, effectively amortizing the MSR asset against contractual servicing and ancillary fee income. MSRs are either purchased from third parties or recognized upon sale or securitization of mortgage loans if servicing is retained. For a further description of the MSR asset, interest rate risk management, and the valuation of MSRs, see Note 17 on pages 291–295 of JPMorgan Chase’s 2012 Annual Report and Note 3 on pages
114–127
of this Form 10-Q.
The following table summarizes MSR activity for the three and six months ended June 30, 2013 and 2012.
|
As of or for the three months ended June 30,
|
As of or for the six months ended June 30,
|
||||||||||||||
|
(in millions, except where otherwise noted)
|
2013
|
2012
|
2013
|
2012
|
|||||||||||
|
Fair value at beginning of period
|
$
|
7,949
|
|
$
|
8,039
|
|
$
|
7,614
|
|
$
|
7,223
|
|
|||
|
MSR activity:
|
|||||||||||||||
|
Originations of MSRs
|
652
|
|
524
|
|
1,342
|
|
1,096
|
|
|||||||
|
Purchase of MSRs
|
3
|
|
2
|
|
(3
|
)
|
3
|
|
|||||||
|
Disposition of MSRs
|
(19
|
)
|
—
|
|
(418
|
)
|
(g)
|
—
|
|
||||||
|
Net additions
|
636
|
|
526
|
|
921
|
|
1,099
|
|
|||||||
|
Changes due to collection/realization of expected cash flows
(a)
|
(288
|
)
|
(328
|
)
|
(547
|
)
|
(681
|
)
|
|||||||
|
Changes in valuation due to inputs and assumptions:
|
|||||||||||||||
|
Changes due to market interest rates and other
(b)
|
1,074
|
|
(1,195
|
)
|
1,620
|
|
(551
|
)
|
|||||||
|
Changes in valuation due to other inputs and assumptions:
|
|||||||||||||||
|
Projected cash flows (e.g., cost to service)
(c)
|
—
|
|
(77
|
)
|
290
|
|
(295
|
)
|
|||||||
|
Discount rates
|
—
|
|
—
|
|
(78
|
)
|
—
|
|
|||||||
|
Prepayment model changes and other
(d)
|
(36
|
)
|
153
|
|
(485
|
)
|
323
|
|
|||||||
|
Total changes in valuation due to other inputs and assumptions
|
(36
|
)
|
76
|
|
(273
|
)
|
28
|
|
|||||||
|
Total changes in valuation due to inputs and assumptions
(a)
|
1,038
|
|
(1,119
|
)
|
1,347
|
|
(523
|
)
|
|||||||
|
Fair value at June 30,
(e)
|
$
|
9,335
|
|
$
|
7,118
|
|
$
|
9,335
|
|
$
|
7,118
|
|
|||
|
Change in unrealized gains/(losses) included in income related to MSRs
held at June 30,
|
$
|
1,038
|
|
$
|
(1,119
|
)
|
$
|
1,347
|
|
$
|
(523
|
)
|
|||
|
Contractual service fees, late fees and other ancillary fees included in income
|
$
|
835
|
|
$
|
949
|
|
$
|
1,704
|
|
$
|
1,982
|
|
|||
|
Third-party mortgage loans serviced at June 30, (in billions)
|
$
|
839
|
|
$
|
868
|
|
$
|
839
|
|
$
|
868
|
|
|||
|
Servicer advances at June 30, (in billions)
(f)
|
$
|
10.1
|
|
$
|
10.2
|
|
$
|
10.1
|
|
$
|
10.2
|
|
|||
|
(a)
|
Included changes related to commercial real estate of
$(3) million
for the three months ended June 30, 2012, and
$(2) million
and
$(5) million
for the six months ended
June 30, 2013
and 2012, respectively.
|
|
(b)
|
Represents both the impact of changes in estimated future prepayments due to changes in market interest rates, and the difference between actual and expected prepayments.
|
|
(c)
|
For the six months ended June 30, 2013, the increase was driven by the inclusion in the MSR valuation model of servicing fees receivable on certain delinquent loans.
|
|
(d)
|
Represents changes in prepayments other than those attributable to changes in market interest rates. For the six months ended
June 30, 2013
, the decrease was driven by changes in the inputs and assumptions used to derive prepayment speeds, primarily increases in home prices.
|
|
(e)
|
Included
$21 million
and
$26 million
related to commercial real estate at
June 30, 2013
and 2012, respectively.
|
|
(f)
|
Represents amounts the Firm pays as the servicer (e.g., scheduled principal and interest to a trust, taxes and insurance), which will generally be reimbursed within a short period of time after the advance from future cash flows from the trust or the underlying loans. The Firm’s credit risk associated
|
185
with these advances is minimal because reimbursement of the advances is typically senior to all cash payments to investors. In addition, the Firm maintains the right to stop payment to investors if the collateral is insufficient to cover the advance.
|
(g)
|
Includes excess mortgage servicing rights transferred to an agency-sponsored trust in exchange for stripped mortgage backed securities (“SMBS”). A portion of the SMBS was acquired by third parties at the transaction date; the Firm acquired and has retained the remaining balance of those SMBS as trading securities.
|
The following table presents the components of mortgage fees and related income (including the impact of MSR risk management activities) for the three and six months ended June 30, 2013 and 2012.
|
Three months ended
June 30, |
Six months ended
June 30, |
||||||||||||||
|
(in millions)
|
2013
|
2012
|
2013
|
2012
|
|||||||||||
|
Mortgage fees and related income
|
|||||||||||||||
|
Net production revenue:
|
|||||||||||||||
|
Production revenue
|
$
|
1,064
|
|
$
|
1,362
|
|
$
|
2,059
|
|
$
|
2,794
|
|
|||
|
Repurchase losses
|
16
|
|
(10
|
)
|
(65
|
)
|
(312
|
)
|
|||||||
|
Net production revenue
|
1,080
|
|
1,352
|
|
1,994
|
|
2,482
|
|
|||||||
|
Net mortgage servicing revenue
|
|
|
|
|
|||||||||||
|
Operating revenue:
|
|
|
|
|
|||||||||||
|
Loan servicing revenue
|
945
|
|
1,004
|
|
1,881
|
|
2,043
|
|
|||||||
|
Changes in MSR asset fair value due to collection/realization of expected cash flows
|
(285
|
)
|
(327
|
)
|
(543
|
)
|
(678
|
)
|
|||||||
|
Total operating revenue
|
660
|
|
677
|
|
1,338
|
|
1,365
|
|
|||||||
|
Risk management:
|
|
|
|
|
|||||||||||
|
Changes in MSR asset fair value due to market interest rates and other
(a)
|
1,072
|
|
(1,193
|
)
|
1,618
|
|
(549
|
)
|
|||||||
|
Other changes in MSR asset fair value due to other inputs and assumptions in model
(b)
|
(36
|
)
|
76
|
|
(273
|
)
|
28
|
|
|||||||
|
Change in derivative fair value and other
|
(957
|
)
|
1,353
|
|
(1,408
|
)
|
947
|
|
|||||||
|
Total risk management
|
79
|
|
236
|
|
(63
|
)
|
426
|
|
|||||||
|
Net mortgage servicing revenue
|
739
|
|
913
|
|
1,275
|
|
1,791
|
|
|||||||
|
All other
|
4
|
|
—
|
|
6
|
|
2
|
|
|||||||
|
Mortgage fees and related income
|
$
|
1,823
|
|
$
|
2,265
|
|
$
|
3,275
|
|
$
|
4,275
|
|
|||
|
(a)
|
Represents both the impact of changes in estimated future prepayments due to changes in market interest rates, and the difference between actual and expected prepayments.
|
|
(b)
|
Represents the aggregate impact of changes in model inputs and assumptions such as projected cash flows (e.g., cost to service), discount rates and changes in prepayments other than those attributable to changes in market interest rates (e.g., changes in prepayments due to changes in home prices). For the six months ended
June 30, 2013
, the decrease was driven by changes in the inputs and assumptions used to derive prepayment speeds, primarily increases in home prices.
|
The table below outlines the key economic assumptions used to determine the fair value of the Firm’s MSRs at
June 30, 2013
, and
December 31, 2012
, and outlines the sensitivities of those fair values to immediate adverse changes in those assumptions, as defined below.
|
(in millions, except rates)
|
June 30, 2013
|
December 31, 2012
|
|||||
|
Weighted-average prepayment speed assumption (“CPR”)
|
8.82
|
%
|
13.04
|
%
|
|||
|
Impact on fair value of 10% adverse change
|
$
|
(410
|
)
|
$
|
(517
|
)
|
|
|
Impact on fair value of 20% adverse change
|
(795
|
)
|
(1,009
|
)
|
|||
|
Weighted-average option adjusted spread
|
7.80
|
%
|
7.61
|
%
|
|||
|
Impact on fair value of 100 basis points adverse change
|
$
|
(386
|
)
|
$
|
(306
|
)
|
|
|
Impact on fair value of 200 basis points adverse change
|
(744
|
)
|
(591
|
)
|
|||
CPR: Constant prepayment rate.
The sensitivity analysis in the preceding table is hypothetical and should be used with caution. Changes in fair value based on variation in assumptions generally cannot be easily extrapolated, because the relationship of the change in the assumptions to the change in fair value are often highly interrelated and may not be linear. In this table, the effect that a change in a particular assumption may have on the fair value is calculated without changing any other assumption. In reality, changes in one factor may result in changes in another, which would either magnify or counteract the impact of the initial change.
Other intangible assets
The
$284 million
decrease in other intangible assets during the
six months ended
June 30, 2013
, was due to amortization.
186
The components of credit card relationships, core deposits and other intangible assets were as follows.
|
June 30, 2013
|
December 31, 2012
|
|||||||||||||||||||
|
(in millions)
|
Gross amount
(a)
|
Accumulated amortization
(a)
|
Net carrying value
|
Gross
amount
|
Accumulated amortization
|
Net carrying value
|
||||||||||||||
|
Purchased credit card relationships
|
$
|
3,540
|
|
$
|
3,319
|
|
$
|
221
|
|
$
|
3,775
|
|
$
|
3,480
|
|
$
|
295
|
|
||
|
Other credit card-related intangibles
|
541
|
|
340
|
|
201
|
|
850
|
|
621
|
|
229
|
|
||||||||
|
Core deposit intangibles
|
4,133
|
|
3,878
|
|
255
|
|
4,133
|
|
3,778
|
|
355
|
|
||||||||
|
Other intangibles
(b)
|
2,375
|
|
1,101
|
|
1,274
|
|
2,390
|
|
1,034
|
|
1,356
|
|
||||||||
|
(a)
|
The decrease in the gross amount and accumulated amortization from December 31, 2012, was due to the removal of fully amortized assets.
|
|
(b)
|
Includes intangible assets of approximately
$600 million
consisting primarily of asset management advisory contracts, which were determined to have an indefinite life and are not amortized.
|
Amortization expense
The following table presents amortization expense related to credit card relationships, core deposits and other intangible assets.
|
Three months ended
June 30, |
Six months ended
June 30, |
|||||||||||||
|
(in millions)
|
2013
|
2012
|
2013
|
2012
|
||||||||||
|
Purchased credit card relationships
|
$
|
52
|
|
$
|
67
|
|
$
|
105
|
|
$
|
136
|
|
||
|
Other credit card-related intangibles
|
15
|
|
27
|
|
29
|
|
54
|
|
||||||
|
Core deposit intangibles
|
50
|
|
61
|
|
100
|
|
122
|
|
||||||
|
Other intangibles
|
35
|
|
36
|
|
70
|
|
72
|
|
||||||
|
Total amortization expense
|
$
|
152
|
|
$
|
191
|
|
$
|
304
|
|
$
|
384
|
|
||
Future amortization expense
The following table presents estimated future amortization expense related to credit card relationships, core deposits and other intangible assets at
June 30, 2013
.
|
For the year (in millions)
|
Purchased credit card relationships
|
Other credit
card-related intangibles
|
Core deposit intangibles
|
Other
intangibles
|
Total
|
||||||||||
|
2013
(a)
|
$
|
196
|
|
$
|
57
|
|
$
|
196
|
|
$
|
135
|
|
$
|
584
|
|
|
2014
|
96
|
|
50
|
|
102
|
|
118
|
|
366
|
|
|||||
|
2015
|
12
|
|
40
|
|
26
|
|
98
|
|
176
|
|
|||||
|
2016
|
9
|
|
34
|
|
14
|
|
90
|
|
147
|
|
|||||
|
2017
|
5
|
|
29
|
|
13
|
|
90
|
|
137
|
|
|||||
|
(a)
|
Includes
$105 million
,
$29 million
,
$100 million
and
$70 million
of amortization expense related to purchased credit card relationships, other credit card-related intangibles, core deposit intangibles and other intangibles, respectively, recognized during the
six months ended
June 30, 2013
.
|
187
For further discussion on deposits, see Note 19 on page 296 of JPMorgan Chase’s 2012 Annual Report.
At June 30, 2013, and December 31, 2012, noninterest-bearing and interest-bearing deposits were as follows.
|
(in millions)
|
June 30, 2013
|
December 31, 2012
|
|||||
|
U.S. offices
|
|||||||
|
Noninterest-bearing
|
$
|
362,314
|
|
$
|
380,320
|
|
|
|
Interest-bearing:
|
|||||||
|
Demand
(a)
|
63,515
|
|
53,980
|
|
|||
|
Savings
(b)
|
424,722
|
|
407,710
|
|
|||
|
Time (included
$5,303
and $5,140 at fair value)
(c)
|
91,854
|
|
90,416
|
|
|||
|
Total interest-bearing deposits
|
580,091
|
|
552,106
|
|
|||
|
Total deposits in U.S. offices
|
942,405
|
|
932,426
|
|
|||
|
Non-U.S. offices
|
|||||||
|
Noninterest-bearing
|
19,515
|
|
17,845
|
|
|||
|
Interest-bearing:
|
|||||||
|
Demand
|
189,925
|
|
195,395
|
|
|||
|
Savings
|
1,293
|
|
1,004
|
|
|||
|
Time (included
$535
and $593 at fair value)
(c)
|
49,812
|
|
46,923
|
|
|||
|
Total interest-bearing deposits
|
241,030
|
|
243,322
|
|
|||
|
Total deposits in non-U.S. offices
|
260,545
|
|
261,167
|
|
|||
|
Total deposits
|
$
|
1,202,950
|
|
$
|
1,193,593
|
|
|
|
(a)
|
Includes Negotiable Order of Withdrawal (“NOW”) accounts, and certain trust accounts.
|
|
(b)
|
Includes Money Market Deposit Accounts (“MMDAs”).
|
|
(c)
|
Includes structured notes classified as deposits for which the fair value option has been elected. For further discussion, see Note 4 on pages 214–216 of JPMorgan Chase’s 2012
Annual Report
.
|
For a discussion of the computation of basic and diluted earnings per share (“EPS”), see Note 24 on page 301 of
JPMorgan Chase
’s
2012
Annual Report
. The following table presents the calculation of basic and diluted EPS for the
three and six months ended
June 30, 2013
and
2012
.
|
(in millions, except per share amounts)
|
Three months ended
June 30, |
Six months ended
June 30, |
|||||||||||
|
2013
|
2012
|
2013
|
2012
|
||||||||||
|
Basic earnings
per share
|
|||||||||||||
|
Net income
|
$
|
6,496
|
|
$
|
4,960
|
|
$
|
13,025
|
|
$
|
9,884
|
|
|
|
Less: Preferred stock dividends
|
204
|
|
158
|
|
386
|
|
315
|
|
|||||
|
Net income applicable to common equity
|
6,292
|
|
4,802
|
|
12,639
|
|
9,569
|
|
|||||
|
Less: Dividends and undistributed earnings allocated to participating securities
|
191
|
|
168
|
|
407
|
|
359
|
|
|||||
|
Net income applicable to common stockholders
|
$
|
6,101
|
|
$
|
4,634
|
|
$
|
12,232
|
|
$
|
9,210
|
|
|
|
Total weighted-average basic shares outstanding
|
3,782.4
|
|
3,808.9
|
|
3,800.3
|
|
3,813.9
|
|
|||||
|
Net income per share
|
$
|
1.61
|
|
$
|
1.22
|
|
$
|
3.22
|
|
$
|
2.41
|
|
|
|
Diluted earnings per share
|
|||||||||||||
|
Net income applicable to common stockholders
|
$
|
6,101
|
|
$
|
4,634
|
|
$
|
12,232
|
|
$
|
9,210
|
|
|
|
Total weighted-average basic shares outstanding
|
3,782.4
|
|
3,808.9
|
|
3,800.3
|
|
3,813.9
|
|
|||||
|
Add: Employee stock options, SARs and warrants
(a)
|
31.9
|
|
11.6
|
|
30.3
|
|
13.1
|
|
|||||
|
Total weighted-average diluted shares outstanding
(b)
|
3,814.3
|
|
3,820.5
|
|
3,830.6
|
|
3,827.0
|
|
|||||
|
Net income per share
|
$
|
1.60
|
|
$
|
1.21
|
|
$
|
3.19
|
|
$
|
2.41
|
|
|
|
(a)
|
Excluded from the computation of diluted EPS (due to the antidilutive effect) were options issued under employee benefit plans and the warrants originally issued in 2008 under the U.S. Treasury’s Capital Purchase Program to purchase shares of the Firm’s common stock. The aggregate number of shares issuable upon the exercise of such options and warrants was
8 million
and
159 million
for the
three months ended
June 30, 2013
and
2012
, respectively, and
11 million
and
164 million
for the
six months ended
June 30, 2013
and
2012
, respectively.
|
|
(b)
|
Participating securities were included in the calculation of diluted EPS using the two-class method, as this computation was more dilutive than the calculation using the treasury stock method.
|
188
AOCI includes the after-tax change in unrealized gains and losses on AFS securities, foreign currency translation adjustments (including the impact of related derivatives), cash flow hedging activities, and net loss and prior service costs/(credit) related to the Firm’s defined benefit pension and OPEB plans.
|
As of or for the three months ended
June 30, 2013
|
Unrealized gains/(losses) on AFS securities
(a)
|
Translation adjustments, net of hedges
|
Cash flow hedges
|
Defined benefit pension and OPEB plans
|
Accumulated other comprehensive income/(loss)
|
|||||||||||||||||||||||||
|
(in millions)
|
||||||||||||||||||||||||||||||
|
Balance at April 1, 2013
|
$
|
6,228
|
|
(b)
|
$
|
(108
|
)
|
$
|
58
|
|
$
|
(2,687
|
)
|
$
|
3,491
|
|
||||||||||||||
|
Net change
|
(3,091
|
)
|
(c)
|
(38
|
)
|
(290
|
)
|
64
|
|
(3,355
|
)
|
|||||||||||||||||||
|
Balance at June 30, 2013
|
$
|
3,137
|
|
(b)
|
$
|
(146
|
)
|
$
|
(232
|
)
|
$
|
(2,623
|
)
|
$
|
136
|
|
||||||||||||||
|
As of or for the three months ended
June 30, 2012
|
Unrealized gains/(losses) on AFS securities
(a)
|
Translation adjustments, net of hedges
|
Cash flow hedges
|
Defined benefit pension and OPEB plans
|
Accumulated other comprehensive income/(loss)
|
|||||||||||||||||||||||||
|
(in millions)
|
||||||||||||||||||||||||||||||
|
Balance at April 1, 2012
|
$
|
5,139
|
|
(b)
|
$
|
101
|
|
$
|
16
|
|
$
|
(2,611
|
)
|
$
|
2,645
|
|
||||||||||||||
|
Net change
|
(325
|
)
|
(d)
|
(189
|
)
|
73
|
|
68
|
|
(373
|
)
|
|||||||||||||||||||
|
Balance at June 30, 2012
|
$
|
4,814
|
|
(b)
|
$
|
(88
|
)
|
$
|
89
|
|
$
|
(2,543
|
)
|
$
|
2,272
|
|
||||||||||||||
|
As of or for the six months ended
June 30, 2013
|
Unrealized gains/(losses) on AFS securities
(a)
|
Translation adjustments, net of hedges
|
Cash flow hedges
|
Defined benefit pension and OPEB plans
|
Accumulated other comprehensive income/(loss)
|
|||||||||||||||||||||||||
|
(in millions)
|
||||||||||||||||||||||||||||||
|
Balance at January 1, 2013
|
$
|
6,868
|
|
(b)
|
$
|
(95
|
)
|
$
|
120
|
|
$
|
(2,791
|
)
|
$
|
4,102
|
|
||||||||||||||
|
Net change
|
(3,731
|
)
|
(c)
|
(51
|
)
|
(352
|
)
|
168
|
|
(3,966
|
)
|
|||||||||||||||||||
|
Balance at June 30, 2013
|
$
|
3,137
|
|
(b)
|
$
|
(146
|
)
|
$
|
(232
|
)
|
$
|
(2,623
|
)
|
$
|
136
|
|
||||||||||||||
|
As of or for the six months ended
June 30, 2012
|
Unrealized gains/(losses) on AFS securities
(a)
|
Translation adjustments, net of hedges
|
Cash flow hedges
|
Defined benefit pension and OPEB plans
|
Accumulated other comprehensive income/(loss)
|
|||||||||||||||||||||||||
|
(in millions)
|
||||||||||||||||||||||||||||||
|
Balance at January 1, 2012
|
$
|
3,565
|
|
(b)
|
$
|
(26
|
)
|
$
|
51
|
|
$
|
(2,646
|
)
|
$
|
944
|
|
||||||||||||||
|
Net change
|
1,249
|
|
(e)
|
(62
|
)
|
38
|
|
103
|
|
1,328
|
|
|||||||||||||||||||
|
Balance at June 30, 2012
|
$
|
4,814
|
|
(b)
|
$
|
(88
|
)
|
$
|
89
|
|
$
|
(2,543
|
)
|
$
|
2,272
|
|
||||||||||||||
|
(a)
|
Represents the after-tax difference between the fair value and amortized cost of securities accounted for as AFS.
|
|
(b)
|
Included after-tax unrealized losses not related to credit on debt securities for which credit losses have been recognized in income of
$(56) million
at January 1, 2012,
$(48) million
at April 1, 2012, and
$(101) million
at June 30, 2012. There were
no
such losses at January 1, 2013, April 1, 2013, and June 30, 2013.
|
|
(c)
|
The net change for the three and six months ended June 30, 2013, was primarily related to the decline in fair value of U.S. government agency issued MBS and obligations of U.S. states and municipalities due to market changes, as well as to net realized gains.
|
|
(d)
|
The net change for the three months ended June 30, 2012, was primarily due to realization of gains on sales of mortgage-backed securities, non-U.S. government debt and obligations of U.S., state and municipalities, partially offset by market value increases driven by the tightening of spreads.
|
|
(e)
|
The net change for the six months ended June 30, 2012, was due primarily to market value increases driven by the tightening of spreads across the portfolio, partially offset by sales of mortgage-backed securities and non-U.S. government debt.
|
189
The following table presents the pretax and after-tax changes in the components of other comprehensive income/(loss).
|
2013
|
2012
|
||||||||||||||||||||||
|
Three months ended June 30, (in millions)
|
Pretax
|
Tax effect
|
After-tax
|
Pretax
|
Tax effect
|
After-tax
|
|||||||||||||||||
|
Unrealized gains/(losses) on AFS securities:
|
|
|
|
|
|
|
|||||||||||||||||
|
Net unrealized gains/(losses) arising during the period
|
$
|
(4,947
|
)
|
$
|
1,931
|
|
$
|
(3,016
|
)
|
$
|
479
|
|
$
|
(186
|
)
|
$
|
293
|
|
|||||
|
Reclassification adjustment for realized (gains)/losses included in net income
(a)
|
(124
|
)
|
49
|
|
(75
|
)
|
(1,014
|
)
|
396
|
|
(618
|
)
|
|||||||||||
|
Net change
|
(5,071
|
)
|
1,980
|
|
(3,091
|
)
|
(535
|
)
|
210
|
|
(325
|
)
|
|||||||||||
|
Translation adjustments:
|
|
|
|
|
|
|
|||||||||||||||||
|
Translation
(b)
|
(607
|
)
|
223
|
|
(384
|
)
|
(765
|
)
|
282
|
|
(483
|
)
|
|||||||||||
|
Hedges
(b)
|
571
|
|
(225
|
)
|
346
|
|
480
|
|
(186
|
)
|
294
|
|
|||||||||||
|
Net change
|
(36
|
)
|
(2
|
)
|
(38
|
)
|
(285
|
)
|
96
|
|
(189
|
)
|
|||||||||||
|
Cash flow hedges:
|
|
|
|
|
|
|
|||||||||||||||||
|
Net unrealized gains/(losses) arising during the period
|
(512
|
)
|
201
|
|
(311
|
)
|
128
|
|
(51
|
)
|
77
|
|
|||||||||||
|
Reclassification adjustment for realized (gains)/losses included in net income
(c)
|
34
|
|
(13
|
)
|
21
|
|
(5
|
)
|
1
|
|
(4
|
)
|
|||||||||||
|
Net change
|
(478
|
)
|
188
|
|
(290
|
)
|
123
|
|
(50
|
)
|
73
|
|
|||||||||||
|
Defined benefit pension and OPEB plans:
|
|
|
|
|
|
|
|||||||||||||||||
|
Net gains/(losses) arising during the period
|
37
|
|
(15
|
)
|
22
|
|
32
|
|
(13
|
)
|
19
|
|
|||||||||||
|
Reclassification adjustments included in net income
(d)
:
|
|||||||||||||||||||||||
|
Amortization of net loss
|
79
|
|
(31
|
)
|
48
|
|
79
|
|
(32
|
)
|
47
|
|
|||||||||||
|
Prior service costs/(credits)
|
(11
|
)
|
5
|
|
(6
|
)
|
(10
|
)
|
4
|
|
(6
|
)
|
|||||||||||
|
Foreign exchange and other
|
(1
|
)
|
1
|
|
—
|
|
12
|
|
(4
|
)
|
8
|
|
|||||||||||
|
Net change
|
104
|
|
(40
|
)
|
64
|
|
113
|
|
(45
|
)
|
68
|
|
|||||||||||
|
Total other comprehensive income/(loss)
|
$
|
(5,481
|
)
|
$
|
2,126
|
|
$
|
(3,355
|
)
|
$
|
(584
|
)
|
$
|
211
|
|
$
|
(373
|
)
|
|||||
|
2013
|
2012
|
||||||||||||||||||||||
|
Six months ended June 30, (in millions)
|
Pretax
|
Tax effect
|
After-tax
|
Pretax
|
Tax effect
|
After-tax
|
|||||||||||||||||
|
Unrealized gains/(losses) on AFS securities:
|
|
|
|
|
|
|
|||||||||||||||||
|
Net unrealized gains/(losses) arising during the period
|
$
|
(5,462
|
)
|
$
|
2,116
|
|
$
|
(3,346
|
)
|
$
|
3,597
|
|
$
|
(1,403
|
)
|
$
|
2,194
|
|
|||||
|
Reclassification adjustment for realized (gains)/losses included in net income
(a)
|
(633
|
)
|
248
|
|
(385
|
)
|
(1,550
|
)
|
605
|
|
(945
|
)
|
|||||||||||
|
Net change
|
(6,095
|
)
|
2,364
|
|
(3,731
|
)
|
2,047
|
|
(798
|
)
|
1,249
|
|
|||||||||||
|
Translation adjustments:
|
|
|
|
|
|
||||||||||||||||||
|
Translation
(b)
|
(1,034
|
)
|
381
|
|
(653
|
)
|
(305
|
)
|
113
|
|
(192
|
)
|
|||||||||||
|
Hedges
(b)
|
991
|
|
(389
|
)
|
602
|
|
213
|
|
(83
|
)
|
130
|
|
|||||||||||
|
Net change
|
(43
|
)
|
(8
|
)
|
(51
|
)
|
(92
|
)
|
30
|
|
(62
|
)
|
|||||||||||
|
Cash flow hedges:
|
|
|
|
|
|
|
|||||||||||||||||
|
Net unrealized gains/(losses) arising during the period
|
(642
|
)
|
252
|
|
(390
|
)
|
87
|
|
(34
|
)
|
53
|
|
|||||||||||
|
Reclassification adjustment for realized (gains)/losses included in net income
(c)
|
63
|
|
(25
|
)
|
38
|
|
(25
|
)
|
10
|
|
(15
|
)
|
|||||||||||
|
Net change
|
(579
|
)
|
227
|
|
(352
|
)
|
62
|
|
(24
|
)
|
38
|
|
|||||||||||
|
Defined benefit pension and OPEB plans:
|
|
|
|
|
|
|
|||||||||||||||||
|
Net gains/(losses) arising during the period
|
85
|
|
(25
|
)
|
60
|
|
34
|
|
(13
|
)
|
21
|
|
|||||||||||
|
Reclassification adjustments included in net income
(d)
:
|
|
|
|
|
|
|
|||||||||||||||||
|
Amortization of net loss
|
160
|
|
(62
|
)
|
98
|
|
162
|
|
(64
|
)
|
98
|
|
|||||||||||
|
Prior service costs/(credits)
|
(22
|
)
|
9
|
|
(13
|
)
|
(21
|
)
|
8
|
|
(13
|
)
|
|||||||||||
|
Foreign exchange and other
|
36
|
|
(13
|
)
|
23
|
|
(6
|
)
|
3
|
|
(3
|
)
|
|||||||||||
|
Net change
|
259
|
|
(91
|
)
|
168
|
|
169
|
|
(66
|
)
|
103
|
|
|||||||||||
|
Total other comprehensive income/(loss)
|
$
|
(6,458
|
)
|
$
|
2,492
|
|
$
|
(3,966
|
)
|
$
|
2,186
|
|
$
|
(858
|
)
|
$
|
1,328
|
|
|||||
|
(a)
|
The pretax amount is reported in securities gains in the Consolidated Statements of Income.
|
|
(b)
|
Reclassifications of pretax realized gains/(losses) on translation adjustments and related hedges are reported in other income in the Consolidated Statements of Income. The amounts were not material for the three and six months ended June 30, 2013.
|
|
(c)
|
The pretax amount is reported in the same line as the hedged items, which are predominantly recorded in net interest income in the Consolidated Statements of Income.
|
|
(d)
|
The pretax amount is reported in compensation expense in the Consolidated Statements of Income.
|
190
The Federal Reserve establishes capital requirements, including well-capitalized standards, for the consolidated financial holding company. The OCC establishes similar capital requirements and standards for the Firm’s national banks, including
JPMorgan Chase Bank, N.A.
, and Chase Bank USA, N.A.
There are two categories of risk-based capital: Tier 1 capital and Tier 2 capital. Tier 1 capital consists of common stockholders’ equity, perpetual preferred stock, noncontrolling interests in subsidiaries and trust preferred securities, less goodwill and certain other adjustments. Tier 2 capital consists of preferred stock not qualifying as Tier 1 capital, subordinated long-term debt and other instruments qualifying as Tier 2 capital, and the aggregate allowance for credit losses up to a certain percentage of risk-weighted assets (“RWA”). Total capital is Tier 1 capital plus Tier 2 capital. RWA consist of on- and off-balance sheet assets that are assigned to one of several broad risk categories and weighted by factors representing their risk and potential for default. On-balance sheet assets are risk-weighted based on the perceived credit risk associated with the obligor or counterparty, the nature of any collateral, and the guarantor, if any. Off-balance sheet assets, such as lending-related commitments, guarantees, and derivatives, are risk-weighted by multiplying the contractual amount by the appropriate credit conversion factor to determine the on-balance sheet credit-equivalent amount, which is then risk-weighted based on the same factors used for on-balance sheet assets. RWA also incorporate a measure for the market risk related to applicable trading assets–debt and equity instruments, and foreign exchange and commodity derivatives. The resulting risk-weighted values for each of the risk categories are then aggregated to determine total RWA.
Under the risk-based capital guidelines of the Federal Reserve, JPMorgan Chase is required to maintain minimum ratios of Tier 1 and Total capital to RWA, as well as minimum leverage ratios (which are defined as Tier 1 capital divided by adjusted quarterly average assets). Failure to meet these minimum requirements could cause the Federal Reserve to take action. Banking subsidiaries also are subject to these capital requirements by their respective primary regulators. As of June 30, 2013, and December 31, 2012, JPMorgan Chase and all of its banking subsidiaries were well-capitalized and met all capital requirements to which each was subject.
The following table presents the regulatory capital, assets and risk-based capital ratios for JPMorgan Chase and its significant banking subsidiaries at June 30, 2013, and December 31, 2012. These amounts are determined in accordance with regulations issued by the Federal Reserve and/or OCC. The table reflects the Firm’s and JPMorgan Chase Bank, N.A.’s implementation of rules that provide for additional capital requirements for trading positions and securitizations (“Basel 2.5”). Basel 2.5 rules became effective for the Firm and JPMorgan Chase Bank, N.A. on January 1, 2013. The implementation of these rules in the first quarter of 2013 resulted in an increase of approximately
$150 billion
and
$140 billion
, respectively, in the Firm’s and JPMorgan Chase Bank, N.A.’s risk-weighted assets compared with the Basel I rules at March 31, 2013. The implementation of these rules also resulted in decreases of the Firm’s Tier 1 capital and Total capital ratios of
140
basis points and
160
basis points, respectively, at March 31, 2013, and decreases of JPMorgan Chase Bank, N.A.’s Tier 1 capital and Total capital ratios of
130
basis points and
150
basis points, respectively, at March 31, 2013. Implementation of Basel 2.5 in the first quarter of 2013 did not impact Chase Bank USA, N.A.’s RWA or Tier 1 capital and Total capital ratios.
191
|
JPMorgan Chase & Co.
(d)
|
JPMorgan Chase Bank, N.A.
(d)
|
Chase Bank USA, N.A.
(d)
|
Well-capitalized ratios
(e)
|
|
Minimum capital ratios
(e)
|
|
||||||||||||||||||||||||
|
(in millions, except ratios)
|
June 30, 2013
|
December 31, 2012
|
June 30, 2013
|
December 31, 2012
|
June 30, 2013
|
December 31, 2012
|
|
|
||||||||||||||||||||||
|
Regulatory capital
|
|
|
|
|
|
|
|
|
|
|
||||||||||||||||||||
|
Tier 1
(a)
|
$
|
164,027
|
|
$
|
160,002
|
|
$
|
120,912
|
|
$
|
111,827
|
|
$
|
11,142
|
|
$
|
9,648
|
|
|
|
|
|
||||||||
|
Total
|
199,148
|
|
194,036
|
|
155,502
|
|
146,870
|
|
14,582
|
|
13,131
|
|
|
|
|
|
||||||||||||||
|
Assets
|
|
|
|
|
|
|
|
|
|
|
||||||||||||||||||||
|
Risk-weighted
(b)
|
$
|
1,410,081
|
|
$
|
1,270,378
|
|
$
|
1,207,865
|
|
$
|
1,094,155
|
|
$
|
101,014
|
|
$
|
103,593
|
|
|
|
|
|
||||||||
|
Adjusted average
(c)
|
2,333,416
|
|
2,243,242
|
|
1,905,940
|
|
1,815,816
|
|
104,119
|
|
103,688
|
|
|
|
|
|
||||||||||||||
|
Capital ratios
|
|
|
|
|
|
|
|
|
|
|
||||||||||||||||||||
|
Tier 1
(a)
|
11.6
|
%
|
12.6
|
%
|
10.0
|
%
|
10.2
|
%
|
11.0
|
%
|
9.3
|
%
|
6.0
|
%
|
4.0
|
%
|
||||||||||||||
|
Total
|
14.1
|
|
15.3
|
|
12.9
|
|
13.4
|
|
14.4
|
|
12.7
|
|
10.0
|
|
|
8.0
|
|
|
||||||||||||
|
Tier 1 leverage
|
7.0
|
|
7.1
|
|
6.3
|
|
6.2
|
|
10.7
|
|
9.3
|
|
5.0
|
|
(f)
|
3.0
|
|
(g)
|
||||||||||||
|
(a)
|
At June 30, 2013, trust preferred securities included in Tier 1 capital were
$5.3 billion
and
$600 million
, for
JPMorgan Chase
and
JPMorgan Chase Bank, N.A.
, respectively. If these securities were excluded from the calculation at June 30, 2013, Tier 1 capital would be
$158.8 billion
and
$120.3 billion
, respectively, and the Tier 1 capital ratio would be
11.3%
and
10.0%
, respectively. At June 30, 2013, Chase Bank USA, N.A. had
no
trust preferred securities.
|
|
(b)
|
Included off–balance sheet RWA at June 30, 2013, of
$318.5 billion
,
$309.0 billion
and
$14 million
, and at December 31, 2012, of
$304.5 billion
,
$297.1 billion
and
$16 million
, for
JPMorgan Chase
,
JPMorgan Chase Bank, N.A.
and Chase Bank USA, N.A., respectively.
|
|
(c)
|
Adjusted average assets, for purposes of calculating the leverage ratio, include total quarterly average assets adjusted for unrealized gains/(losses) on securities, less deductions for disallowed goodwill and other intangible assets, investments in certain subsidiaries, and the total adjusted carrying value of nonfinancial equity investments that are subject to deductions from Tier 1 capital.
|
|
(d)
|
Asset and capital amounts for
JPMorgan Chase
’s banking subsidiaries reflect intercompany transactions; whereas the respective amounts for
JPMorgan Chase
reflect the elimination of intercompany transactions.
|
|
(e)
|
As defined by the regulations issued by the Federal Reserve, OCC and FDIC.
|
|
(f)
|
Represents requirements for banking subsidiaries pursuant to regulations issued under the FDIC Improvement Act. There is no Tier 1 leverage component in the definition of a well-capitalized bank holding company.
|
|
(g)
|
The minimum Tier 1 leverage ratio for bank holding companies and banks is
3%
or
4%
, depending on factors specified in regulations issued by the Federal Reserve and OCC.
|
|
Note:
|
Rating agencies allow measures of capital to be adjusted upward for deferred tax liabilities, which have resulted from both nontaxable business combinations and from tax-deductible goodwill. The Firm had deferred tax liabilities resulting from nontaxable business combinations totaling
$242 million
and
$291 million
at June 30, 2013, and December 31, 2012, respectively; and deferred tax liabilities resulting from tax-deductible goodwill of
$2.6 billion
and
$2.5 billion
at June 30, 2013, and December 31, 2012, respectively.
|
A reconciliation of the Firm’s Total stockholders’ equity to Tier 1 capital and Total qualifying capital is presented in the table below.
|
(in millions)
|
June 30,
2013
|
December 31, 2012
|
||||||
|
Tier 1 capital
|
|
|
||||||
|
Total stockholders’ equity
|
$
|
209,239
|
|
$
|
204,069
|
|
||
|
Effect of certain items in AOCI excluded from Tier 1 capital
|
(282
|
)
|
(4,198
|
)
|
||||
|
Qualifying hybrid securities and noncontrolling interests
(a)
|
5,618
|
|
10,608
|
|
||||
|
Less: Goodwill
(b)
|
45,414
|
|
45,663
|
|
||||
|
Other intangible assets
(b)
|
2,220
|
|
2,311
|
|
||||
|
Fair value DVA on structured notes and derivative liabilities related to the Firm’s credit quality
|
1,869
|
|
1,577
|
|
||||
|
Investments in certain subsidiaries and other
|
1,045
|
|
926
|
|
||||
|
Total Tier 1 capital
|
164,027
|
|
160,002
|
|
||||
|
Tier 2 capital
|
|
|
||||||
|
Long-term debt and other instruments qualifying as Tier 2
|
17,406
|
|
18,061
|
|
||||
|
Qualifying allowance for credit losses
|
17,723
|
|
15,995
|
|
||||
|
Other
|
(8
|
)
|
(22
|
)
|
||||
|
Total Tier 2 capital
|
35,121
|
|
34,034
|
|
||||
|
Total qualifying capital
|
$
|
199,148
|
|
$
|
194,036
|
|
||
|
(a)
|
Primarily includes trust preferred securities of certain business trusts.
|
|
(b)
|
Goodwill and other intangible assets are net of any associated deferred tax liabilities.
|
192
JPMorgan Chase
provides lending-related financial instruments (e.g., commitments and guarantees) to meet the financing needs of its customers. The contractual amount of these financial instruments represents the maximum possible credit risk to the Firm should the counterparty draw upon the commitment or the Firm be required to fulfill its obligation under the guarantee, and should the counterparty subsequently fail to perform according to the terms of the contract. Most of these commitments and guarantees expire without being drawn or a default occurring. As a result, the total contractual amount of these instruments is not, in the Firm’s view, representative of its actual future credit exposure or funding requirements. For further discussion of lending-related commitments and guarantees, and the Firm’s related accounting policies, see Note 29 on pages 308–315 of
JPMorgan Chase
’s
2012
Annual Report
.
To provide for the risk of loss inherent in consumer (excluding credit card) and wholesale contracts, an allowance for credit losses on lending-related commitments is maintained. See Note 14 on page
176
of
this Form 10-Q
for further discussion regarding the allowance for credit losses on lending-related commitments.
The following table summarizes the contractual amounts and carrying values of off-balance sheet lending-related financial instruments, guarantees and other commitments at
June 30, 2013
, and
December 31, 2012
. The amounts in the table below for lending-related commitments represent the total available credit, inclusive of certain non-legally binding lines of credit. The Firm has not experienced, and does not anticipate, that all available lines of credit for these products will be utilized at the same time. The Firm can reduce or cancel these non-legally binding lines of credit by providing the borrower notice or, in some cases, without notice as permitted by law. The Firm may reduce or close home equity lines of credit when there are significant decreases in the value of the underlying property, or
when there has been a demonstrable decline in the creditworthiness of the borrower. Also, the Firm typically closes credit card lines when the borrower is
60 days
or more past due.
193
|
Off–balance sheet lending-related financial instruments, guarantees and other commitments
|
|||||||||||||||||||||||||
|
Contractual amount
|
Carrying value
(g)
|
||||||||||||||||||||||||
|
Jun 30, 2013
|
Dec 31,
2012 |
Jun 30,
2013 |
Dec 31,
2012 |
||||||||||||||||||||||
|
By remaining maturity
(in millions)
|
Expires in 1 year or less
|
Expires after
1 year through 3 years |
Expires after
3 years through 5 years |
Expires after 5 years
|
Total
|
Total
|
|||||||||||||||||||
|
Lending-related
|
|||||||||||||||||||||||||
|
Consumer, excluding credit card:
|
|||||||||||||||||||||||||
|
Home equity – senior lien
|
$
|
2,501
|
|
$
|
4,609
|
|
$
|
4,764
|
|
$
|
2,348
|
|
$
|
14,222
|
|
$
|
15,180
|
|
$
|
—
|
|
$
|
—
|
|
|
|
Home equity – junior lien
|
4,128
|
|
7,366
|
|
5,815
|
|
2,456
|
|
19,765
|
|
21,796
|
|
—
|
|
—
|
|
|||||||||
|
Prime mortgage
|
7,701
|
|
—
|
|
—
|
|
—
|
|
7,701
|
|
4,107
|
|
—
|
|
—
|
|
|||||||||
|
Subprime mortgage
|
—
|
|
—
|
|
—
|
|
—
|
|
—
|
|
—
|
|
—
|
|
—
|
|
|||||||||
|
Auto
|
8,194
|
|
227
|
|
146
|
|
29
|
|
8,596
|
|
7,185
|
|
1
|
|
1
|
|
|||||||||
|
Business banking
|
10,225
|
|
595
|
|
98
|
|
375
|
|
11,293
|
|
11,092
|
|
7
|
|
6
|
|
|||||||||
|
Student and other
|
108
|
|
144
|
|
5
|
|
469
|
|
726
|
|
796
|
|
—
|
|
—
|
|
|||||||||
|
Total consumer, excluding credit card
|
32,857
|
|
12,941
|
|
10,828
|
|
5,677
|
|
62,303
|
|
60,156
|
|
8
|
|
7
|
|
|||||||||
|
Credit card
|
532,359
|
|
—
|
|
—
|
|
—
|
|
532,359
|
|
533,018
|
|
—
|
|
—
|
|
|||||||||
|
Total consumer
|
565,216
|
|
12,941
|
|
10,828
|
|
5,677
|
|
594,662
|
|
593,174
|
|
8
|
|
7
|
|
|||||||||
|
Wholesale:
|
|||||||||||||||||||||||||
|
Other unfunded commitments to extend credit
(a)(b)
|
61,810
|
|
83,940
|
|
99,091
|
|
6,284
|
|
251,125
|
|
243,225
|
|
455
|
|
377
|
|
|||||||||
|
Standby letters of credit and other financial guarantees
(a)(b)(c)
|
26,108
|
|
32,013
|
|
35,514
|
|
1,463
|
|
95,098
|
|
100,929
|
|
634
|
|
647
|
|
|||||||||
|
Unused advised lines of credit
|
80,776
|
|
11,740
|
|
822
|
|
372
|
|
93,710
|
|
85,087
|
|
—
|
|
—
|
|
|||||||||
|
Other letters of credit
(a)
|
4,308
|
|
1,112
|
|
58
|
|
61
|
|
5,539
|
|
5,573
|
|
2
|
|
2
|
|
|||||||||
|
Total wholesale
|
173,002
|
|
128,805
|
|
135,485
|
|
8,180
|
|
445,472
|
|
434,814
|
|
1,091
|
|
1,026
|
|
|||||||||
|
Total lending-related
|
$
|
738,218
|
|
$
|
141,746
|
|
$
|
146,313
|
|
$
|
13,857
|
|
$
|
1,040,134
|
|
$
|
1,027,988
|
|
$
|
1,099
|
|
$
|
1,033
|
|
|
|
Other guarantees and commitments
|
|||||||||||||||||||||||||
|
Securities lending indemnification agreements and guarantees
(d)
|
$
|
189,113
|
|
$
|
—
|
|
$
|
—
|
|
$
|
—
|
|
$
|
189,113
|
|
$
|
166,493
|
|
NA
|
|
NA
|
|
|||
|
Derivatives qualifying as guarantees
|
1,386
|
|
1,280
|
|
16,942
|
|
37,297
|
|
56,905
|
|
61,738
|
|
$
|
115
|
|
$
|
42
|
|
|||||||
|
Unsettled reverse repurchase and securities borrowing agreements
(e)
|
56,657
|
|
—
|
|
—
|
|
—
|
|
56,657
|
|
34,871
|
|
—
|
|
—
|
|
|||||||||
|
Loan sale and securitization-related indemnifications:
|
|||||||||||||||||||||||||
|
Mortgage repurchase liability
|
NA
|
|
NA
|
|
NA
|
|
NA
|
|
NA
|
|
NA
|
|
2,476
|
|
2,811
|
|
|||||||||
|
Loans sold with recourse
|
NA
|
|
NA
|
|
NA
|
|
NA
|
|
8,600
|
|
9,305
|
|
140
|
|
141
|
|
|||||||||
|
Other guarantees and commitments
(f)
|
554
|
|
327
|
|
1,472
|
|
4,248
|
|
6,601
|
|
6,780
|
|
(108
|
)
|
(75
|
)
|
|||||||||
|
(a)
|
At
June 30, 2013
, and
December 31, 2012
, reflects the contractual amount net of risk participations totaling
$406 million
and
$473 million
, respectively, for other unfunded commitments to extend credit;
$15.8 billion
and
$16.6 billion
, respectively, for standby letters of credit and other financial guarantees; and
$609 million
and
$690 million
, respectively, for other letters of credit. In regulatory filings with the Federal Reserve these commitments are shown gross of risk participations.
|
|
(b)
|
At
June 30, 2013
, and
December 31, 2012
, included credit enhancements and bond and commercial paper liquidity commitments to U.S. states and municipalities, hospitals and other nonprofit entities of
$39.9 billion
and
$44.5 billion
, respectively. These commitments also include liquidity facilities to nonconsolidated municipal bond VIEs; for further information, see Note 15 on pages
177–184
of
this Form 10-Q
.
|
|
(c)
|
At
June 30, 2013
, and
December 31, 2012
, included unissued standby letters of credit commitments of
$42.6 billion
and
$44.4 billion
, respectively.
|
|
(d)
|
At
June 30, 2013
, and
December 31, 2012
, collateral held by the Firm in support of securities lending indemnification agreements was
$189.9 billion
and
$165.1 billion
, respectively. Securities lending collateral comprises primarily cash and securities issued by governments that are members of the Organisation for Economic Co-operation and Development (“OECD”) and U.S. government agencies.
|
|
(e)
|
At
June 30, 2013
, and
December 31, 2012
, the amount of commitments related to forward-starting reverse repurchase agreements and securities borrowing agreements were
$11.1 billion
and
$13.2 billion
, respectively. Commitments related to unsettled reverse repurchase agreements and securities borrowing agreements with regular-way settlement periods were
$45.6 billion
and
$21.7 billion
, at
June 30, 2013
, and
December 31, 2012
, respectively.
|
|
(f)
|
At
June 30, 2013
, and
December 31, 2012
, included unfunded commitments of
$251 million
and
$370 million
, respectively, to third-party private equity funds; and
$1.5 billion
, for both periods, to other equity investments. These commitments included
$225 million
and
$333 million
, respectively, related to investments that are generally fair valued at net asset value as discussed in Note 3 on pages
114–127
of
this Form 10-Q
. In addition, at
June 30, 2013
, and
December 31, 2012
, included letters of credit hedged by derivative transactions and managed on a market risk basis of
$4.6 billion
and
$4.5 billion
, respectively.
|
|
(g)
|
For lending-related products, the carrying value represents the allowance for lending-related commitments and the guarantee liability; for derivative-related products, the carrying value represents the fair value.
|
194
Other unfunded commitments to extend credit
Other unfunded commitments to extend credit generally comprise commitments for working capital and general corporate purposes, extensions of credit to support commercial paper facilities and bond financings in the event that those obligations cannot be remarketed to new investors as well as committed liquidity facilities to clearing organizations.
Also included in other unfunded commitments to extend credit are commitments to noninvestment-grade counterparties in connection with leveraged and acquisition finance activities, which were
$10.1 billion
and
$8.8 billion
at
June 30, 2013
, and
December 31, 2012
, respectively. For further information, see Note 3 and Note 4 on pages
114–127
and
128–130
respectively, of
this Form 10-Q
.
In addition, the Firm acts as a clearing and custody bank in the U.S. tri-party repurchase transaction market. In its role as clearing and custody bank, the Firm is exposed to intra-day credit risk of the cash borrowers, usually broker-dealers; however, this exposure is secured by collateral and typically extinguished through the settlement process by the end of the day. For the
three months ended
June 30, 2013
, the tri-party repurchase daily balances averaged
$332 billion
.
Guarantees
The Firm considers the following off–balance sheet lending-related arrangements to be guarantees under U.S. GAAP: standby letters of credit and financial guarantees, securities lending indemnifications, certain indemnification agreements included within third-party contractual arrangements and certain derivative contracts. For a further discussion of the off–balance sheet lending-related arrangements the Firm considers to be guarantees, and the related accounting policies, see Note 29 on pages 308–315 of
JPMorgan Chase
’s
2012
Annual Report
. The recorded amounts of the liabilities related to guarantees and indemnifications at
June 30, 2013
, and
December 31, 2012
, excluding the allowance for credit losses on lending-related commitments, are discussed below.
Standby letters of credit and other financial guarantees
Standby letters of credit (“SBLC”) and other financial guarantees are conditional lending commitments issued by the Firm to guarantee the performance of a customer to a third party under certain arrangements, such as commercial paper facilities, bond financings, acquisition financings, trade and similar transactions. The carrying values of standby and other letters of credit were
$636 million
and
$649 million
at
June 30, 2013
, and
December 31, 2012
, respectively, which were classified in accounts payable and other liabilities on the Consolidated Balance Sheets; these carrying values included
$290 million
and
$284 million
, respectively, for the allowance for lending-related commitments, and
$346 million
and
$365 million
, respectively, for the guarantee liability and corresponding asset.
The following table summarizes the types of facilities under which standby letters of credit and other letters of credit arrangements are outstanding by the ratings profiles of the Firm’s customers, as of
June 30, 2013
, and
December 31, 2012
.
Standby letters of credit, other financial guarantees and other letters of credit
|
June 30, 2013
|
December 31, 2012
|
||||||||||||||||
|
(in millions)
|
Standby letters of
credit and other financial guarantees
|
Other letters
of credit
|
Standby letters of
credit and other financial guarantees
|
Other letters
of credit
|
|||||||||||||
|
Investment-grade
(a)
|
$
|
72,107
|
|
$
|
4,329
|
|
$
|
77,081
|
|
$
|
3,998
|
|
|||||
|
Noninvestment-grade
(a)
|
22,991
|
|
1,210
|
|
23,848
|
|
1,575
|
|
|||||||||
|
Total contractual amount
|
$
|
95,098
|
|
$
|
5,539
|
|
$
|
100,929
|
|
$
|
5,573
|
|
|||||
|
Allowance for lending-related commitments
|
$
|
288
|
|
$
|
2
|
|
$
|
282
|
|
$
|
2
|
|
|||||
|
Commitments with collateral
|
41,002
|
|
1,498
|
|
42,654
|
|
1,145
|
|
|||||||||
|
(a)
|
The ratings scale is based on the Firm’s internal ratings which generally correspond to ratings as defined by S&P and Moody’s.
|
195
Derivatives qualifying as guarantees
In addition to the contracts described above, the Firm transacts certain derivative contracts that have the characteristics of a guarantee under U.S. GAAP. For further information on these derivatives, see Note 29 on pages 308–315 of
JPMorgan Chase
’s
2012
Annual Report
. The total notional value of the derivatives that the Firm deems to be guarantees was
$56.9 billion
and
$61.7 billion
at
June 30, 2013
, and
December 31, 2012
, respectively. The notional amount generally represents the Firm’s maximum exposure to derivatives qualifying as guarantees. However, exposure to certain stable value contracts is contractually limited to a substantially lower percentage of the notional amount; the notional amount on these stable value contracts was
$26.7 billion
and
$26.5 billion
and the maximum exposure to loss was
$2.8 billion
at both
June 30, 2013
, and
December 31, 2012
. The fair values of the contracts reflect the probability of whether the Firm will be required to perform under the contract. The fair value related to derivatives that the Firm deems to be guarantees were derivative payables of
$170 million
and
$122 million
and derivative receivables of
$55 million
and
$80 million
at
June 30, 2013
, and
December 31, 2012
, respectively. The Firm reduces exposures to these contracts by entering into offsetting transactions, or by entering into contracts that hedge the market risk related to the derivative guarantees.
In addition to derivative contracts that meet the characteristics of a guarantee, the Firm is both a purchaser and seller of credit protection in the credit derivatives market. For a further discussion of credit derivatives, see Note 5 on pages
141–142
of
this Form 10-Q
.
Loan sales- and securitization-related indemnifications
Mortgage repurchase liability
In connection with the Firm’s loan sale and securitization activities with the GSEs and other loan sale and private-label securitization transactions, as described in Note 15 on pages
177–184
of
this Form 10-Q
, and Note 16 on pages 280–291 of
JPMorgan Chase
’s
2012
Annual Report
, the Firm has made representations and warranties that the loans sold meet certain requirements. The Firm may be, and has been, required to repurchase loans and/or indemnify the GSEs and other investors for losses due to material breaches of these representations and warranties. Generally, the maximum amount of future payments the Firm would be required to make for breaches of these representations and warranties would be equal to the unpaid principal balance of such loans that are deemed to have defects that were sold to purchasers (including securitization-related SPEs) plus, in certain circumstances, accrued interest on such loans and certain expense.
There have been generalized allegations, as well as specific demands, that the Firm repurchase loans sold or deposited into private-label securitizations (including claims from insurers that have guaranteed certain obligations of the securitization trusts). Although the Firm encourages parties to use the contractual repurchase process established in the governing agreements, these private-label repurchase
claims have generally manifested themselves through threatened or pending litigation. Accordingly, the liability related to repurchase demands associated with all of the private-label securitizations is separately evaluated by the Firm in establishing its litigation reserves. For additional information regarding litigation, see Note 23 on pages
198–206
of
this Form 10-Q
and Note 31 on pages 316–325 of
JPMorgan Chase
’s
2012
Annual Report
.
The Firm has recognized a mortgage repurchase liability of
$2.5 billion
and
$2.8 billion
, as
June 30, 2013
, and
December 31, 2012
, respectively. This repurchase liability is reported in accounts payable and other liabilities net of probable recoveries from third-party originators of
$403 million
and
$441 million
at
June 30, 2013
, and
December 31, 2012
, respectively. The Firm’s mortgage repurchase liability is intended to cover losses associated with all loans previously sold in connection with loan sale and securitization transactions with the GSEs, regardless of when those losses occur or how they are ultimately resolved (e.g., repurchase, make-whole payment).
Substantially all of the estimates and assumptions underlying the Firm’s established methodology for computing its recorded mortgage repurchase liability — including factors such as the amount of probable future demands from the GSEs (based on both historical experience and the Firm’s expectations about the GSEs future behavior), the ability of the Firm to cure identified defects, the severity of loss upon repurchase or foreclosure, and recoveries from third parties — require application of a significant level of management judgment.
While the Firm uses the best information available to it in estimating its mortgage repurchase liability, the estimation process is inherently uncertain and imprecise and, accordingly, losses in excess of the amounts accrued as of
June 30, 2013
, are reasonably possible. The Firm believes the estimate of the range of reasonably possible losses, in excess of its established repurchase liability, is from
$0
to approximately
$0.7 billion
at
June 30, 2013
. This estimated range of reasonably possible loss considers the Firm’s GSE-related exposure based on an assumed peak to trough decline in home prices of
32%
, which is an additional
6
percentage point decline in home prices beyond the Firm’s current assumptions derived from a nationally recognized home price index. Although the Firm does not consider a further decline in home prices of this magnitude likely to occur, such a decline could increase the levels of loan delinquencies, which may, in turn, increase the level of repurchase demands from the GSEs and potentially result in additional repurchases of loans at greater loss severities and thereby increase the Firm’s mortgage repurchase liability.
196
The following table summarizes the change in the mortgage repurchase liability for each of the periods presented.
|
Summary of changes in mortgage repurchase liability
(a)
|
|||||||||||||||
|
Three months
ended June 30, |
Six months ended June 30,
|
||||||||||||||
|
(in millions)
|
2013
|
2012
|
2013
|
2012
|
|||||||||||
|
Repurchase liability at beginning of period
|
$
|
2,674
|
|
$
|
3,516
|
|
$
|
2,811
|
|
$
|
3,557
|
|
|||
|
Net realized losses
(b)
|
(191
|
)
|
(259
|
)
|
(403
|
)
|
(623
|
)
|
|||||||
|
Provision for repurchase losses
(c)
|
(7
|
)
|
36
|
|
68
|
|
359
|
|
|||||||
|
Repurchase liability at end of period
|
$
|
2,476
|
|
$
|
3,293
|
|
$
|
2,476
|
|
$
|
3,293
|
|
|||
|
(a)
|
All mortgage repurchase demands associated with private-label securitizations are separately evaluated by the Firm in establishing its litigation reserves.
|
|
(b)
|
Realized repurchase losses are presented net of third-party recoveries and include principal losses and accrued interest on repurchased loans, “make-whole” settlements, settlements with claimants, and certain related expense. Make-whole settlements were
$133 million
and
$107 million
for the
three months ended
June 30, 2013
and
2012
, respectively and
$254 million
and
$293 million
for the
six months ended
June 30, 2013
and
2012
, respectively.
|
|
(c)
|
Included
$6 million
and
$28 million
of provision related to new loan sales for the
three months ended
June 30, 2013
and
2012
, respectively and
$14 million
and
$55 million
of provision related to new loan sales for the
six months ended
June 30, 2013
and
2012
, respectively.
|
Loans sold with recourse
The Firm provides servicing for mortgages and certain commercial lending products on both a recourse and nonrecourse basis. In nonrecourse servicing, the principal credit risk to the Firm is the cost of temporary servicing advances of funds (i.e., normal servicing advances). In recourse servicing, the servicer agrees to share credit risk with the owner of the mortgage loans, such as Fannie Mae or Freddie Mac or a private investor, insurer or guarantor. Losses on recourse servicing predominantly occur when foreclosure sales proceeds of the property underlying a defaulted loan are less than the sum of the outstanding principal balance, plus accrued interest on the loan and the cost of holding and disposing of the underlying property. The Firm’s securitizations are predominantly nonrecourse, thereby effectively transferring the risk of future credit losses to the purchaser of the mortgage-backed securities issued by the trust. At
June 30, 2013
, and
December 31, 2012
, the unpaid principal balance of loans sold with recourse totaled
$8.6 billion
and
$9.3 billion
, respectively. The carrying value of the related liability that the Firm has recorded, which is representative of the Firm’s view of the likelihood it will have to perform under its recourse obligations, was
$140 million
and
$141 million
at
June 30, 2013
, and
December 31, 2012
, respectively.
For a discussion of the Firm’s pledged assets and collateral, see Note 30 on pages 315–316 of JPMorgan Chase’s 2012 Annual Report.
Pledged assets
At June 30, 2013, assets were pledged to collateralize repurchase and other securities financing agreements, maintain potential borrowing capacity with central banks and for other purposes, including to secure borrowings and public deposits. Certain of these pledged assets may be sold or repledged by the secured parties and are identified as financial instruments owned (pledged to various parties) on the Consolidated Balance Sheets. In addition, at June 30, 2013, and December 31, 2012, the Firm had pledged
$292.8 billion
and
$291.7 billion
, respectively, of financial instruments it owns that may not be sold or repledged by the secured parties. Total assets pledged do not include assets of consolidated VIEs; these assets are used to settle the liabilities of those entities. See Note 15 on pages
177–184
of this Form 10-Q, and Note 16 on pages 280–291 of JPMorgan Chase’s 2012 Annual Report, for additional information on assets and liabilities of consolidated VIEs.
Collateral
At June 30, 2013, and December 31, 2012, the Firm had accepted assets as collateral that it could sell or repledge, deliver or otherwise use with a fair value of approximately
$723.7 billion
and
$757.1 billion
, respectively. This collateral was generally obtained under resale agreements, securities borrowing agreements, customer margin loans and derivative agreements. Of the collateral received, approximately
$598.6 billion
and
$545.0 billion
, respectively, were sold or repledged, generally as collateral under repurchase agreements, securities lending agreements or to cover short sales and to collateralize deposits and derivative agreements.
197
Contingencies
As of June 30, 2013, the Firm and its subsidiaries are defendants or putative defendants in numerous legal proceedings, including private, civil litigations and regulatory/government investigations. The litigations range from individual actions involving a single plaintiff to class action lawsuits with potentially millions of class members. Investigations involve both formal and informal proceedings, by both governmental agencies and self-regulatory organizations. These legal proceedings are at varying stages of adjudication, arbitration or investigation, and involve each of the Firm’s lines of business and geographies and a wide variety of claims (including common law tort and contract claims and statutory antitrust, securities and consumer protection claims), some of which present novel legal theories.
The Firm believes the estimate of the aggregate range of reasonably possible losses, in excess of reserves established, for its legal proceedings is from
$0
to approximately
$6.8 billion
at June 30, 2013. This estimated aggregate range of reasonably possible losses is based upon currently available information for those proceedings in which the Firm is involved, taking into account the Firm’s best estimate of such losses for those cases for which such estimate can be made. For certain cases, the Firm does not believe that an estimate can currently be made. The Firm’s estimate involves significant judgment, given the varying stages of the proceedings (including the fact that many are currently in preliminary stages), the existence in many such proceedings of multiple defendants (including the Firm) whose share of liability has yet to be determined, the numerous yet-unresolved issues in many of the proceedings (including issues regarding class certification and the scope of many of the claims) and the attendant uncertainty of the various potential outcomes of such proceedings. Accordingly, the Firm’s estimate will change from time to time, and actual losses may be more or less than the current estimate.
Set forth below are descriptions of the Firm’s material legal proceedings.
Auction-Rate Securities Investigations and Litigation.
Beginning in March 2008, several regulatory authorities initiated investigations of a number of industry participants, including the Firm, concerning possible state and federal securities law violations in connection with the sale of auction-rate securities (“ARS”). The market for many such securities had frozen and a significant number of auctions for those securities began to fail in February 2008.
The Firm, on behalf of itself and affiliates, agreed to a settlement in principle with the New York Attorney General’s Office which provided, among other things, that the Firm would offer to purchase at par certain ARS purchased from J.P. Morgan Securities LLC, Chase Investment Services Corp. and Bear, Stearns & Co. Inc. by individual investors, charities and small- to medium-sized businesses. The Firm also agreed to a substantively similar
settlement in principle with the Office of Financial Regulation for the State of Florida and the North American Securities Administrators Association (“NASAA”) Task Force, which agreed to recommend approval of the settlement to all remaining states, Puerto Rico and the U.S. Virgin Islands. The Firm has finalized the settlement agreements with the New York Attorney General’s Office and the Office of Financial Regulation for the State of Florida. The settlement agreements provide for the payment of penalties totaling
$25 million
to all states and territories. To date, final consent agreements have been reached with all but three of NASAA’s members.
Bear Stearns Hedge Fund Matters.
The Bear Stearns Companies LLC (formerly The Bear Stearns Companies Inc.)(“Bear Stearns”), certain current or former subsidiaries of Bear Stearns, including Bear Stearns Asset Management, Inc. (“BSAM”) and Bear, Stearns & Co. Inc., and certain individuals formerly employed by Bear Stearns are named defendants (collectively the “Bear Stearns defendants”) in multiple civil actions and arbitrations relating to alleged losses resulting from the failure of the Bear Stearns High Grade Structured Credit Strategies Master Fund, Ltd. (the “High Grade Fund”) and the Bear Stearns High Grade Structured Credit Strategies Enhanced Leverage Master Fund, Ltd. (the “Enhanced Leverage Fund”) (collectively the “Funds”). BSAM served as investment manager for both of the Funds, which were organized such that there were U.S. and Cayman Islands “feeder funds” that invested substantially all their assets, directly or indirectly, in the Funds. The Funds are in liquidation.
There are currently
two
civil actions pending in the United States District Court for the Southern District of New York relating to the Funds. The first pending action, brought by the Joint Voluntary Liquidators of the Cayman Islands feeder funds, alleges that the Bear Stearns defendants mismanaged the Funds. This action alleges net losses of approximately
$700 million
and seeks compensatory and punitive damages. The parties reached an agreement to resolve the litigation for
$257 million
. In June 2013, the Grand Court of the Cayman Islands approved the settlement and subsequently the U.S. District Court dismissed the action with leave to reinstate if settlement conditions are not met. The second action was brought by Bank of America and Banc of America Securities LLC (together “BofA”) alleging breach of contract, fraud and breach of fiduciary duty in connection with a
$4 billion
securitization in May 2007 known as a “CDO-squared,” for which BSAM served as collateral manager. This securitization was composed of certain collateralized debt obligation holdings that were purchased by BofA from the Funds. BofA currently seeks damages up to approximately
$540 million
. Motions for summary judgment are pending.
Bear Stearns Shareholder Litigation and Related Matters.
Various shareholders of Bear Stearns have commenced purported class actions against Bear Stearns and certain of its former officers and/or directors on behalf of all persons who purchased or otherwise acquired common stock of Bear Stearns between December 14, 2006, and March 14,
198
2008 (the “Class Period”). The actions alleged that the defendants issued materially false and misleading statements regarding Bear Stearns’ business and financial results and that, as a result of those false statements, Bear Stearns’ common stock traded at artificially inflated prices during the Class Period. In November 2012, the United States District Court for the Southern District of New York granted final approval of a
$275 million
settlement. Certain investors have elected not to participate in the class settlement, and some of them have proceeded separately with individual actions or arbitrations and others may do likewise.
Bear Stearns, former members of Bear Stearns’ Board of Directors and certain of Bear Stearns’ former executive officers have also been named as defendants in a shareholder derivative and class action suit which is pending in the United States District Court for the Southern District of New York. Plaintiffs assert claims for breach of fiduciary duty, violations of federal securities laws, waste of corporate assets and gross mismanagement, unjust enrichment, abuse of control, and indemnification and contribution in connection with the losses sustained by Bear Stearns as a result of its purchases of subprime loans and certain repurchases of its own common stock. Certain individual defendants are also alleged to have sold their holdings of Bear Stearns common stock while in possession of material nonpublic information. Plaintiffs seek compensatory damages in an unspecified amount. The District Court dismissed the action in January 2011, and plaintiffs have appealed.
CIO Investigations and Litigation
. The Firm is responding to a consolidated shareholder class action, a consolidated class action brought under the Employee Retirement Income Security Act (“ERISA”) and shareholder derivative actions that have been filed in New York state court and the United States District Court for the Southern District of New York, as well as shareholder demands and government investigations, relating to losses in the synthetic credit portfolio managed by the Firm’s Chief Investment Office (“CIO”). The Firm has received requests for documents and information in connection with governmental inquiries and investigations by Congress, the OCC, the Federal Reserve, the U.S. Department of Justice (the “DOJ”), the Securities and Exchange Commission (the “SEC”), the Commodity Futures Trading Commission (the “CFTC”), the UK Financial Services Authority (now known as the Financial Conduct Authority), the State of Massachusetts and other government agencies. The Firm is cooperating with these investigations.
Four
putative class actions alleging violations of Sections 10(b) and 20(a) of the Securities Exchange Act of 1934 and Rule 10b-5 thereunder were filed on behalf of purchasers of the Firm’s common stock. The cases were consolidated and lead plaintiffs were appointed pursuant to the Private Securities Litigation Reform Act. The consolidated second amended complaint defines the putative class as purchasers of the Firm’s common stock between February 24, 2010 and May 21, 2012, and alleges
that the Firm and certain current and former officers made false or misleading statements concerning CIO’s role, the Firm’s risk management practices and the Firm’s financial results, as well as in connection with the disclosure of losses in the synthetic credit portfolio in 2012. Defendants have filed a motion to dismiss.
Separately,
two
putative class actions were filed on behalf of participants who held the Firm’s common stock in the Firm’s retirement plans. These actions have been consolidated, and the consolidated third amended complaint alleges a class period of December 20, 2011 to July 12, 2012, and asserts claims under ERISA solely on behalf of participants in the Firm’s 401(k) Savings Plan for alleged breaches of fiduciary duties by the Firm, certain affiliates and certain current and former directors and officers. The complaint generally alleges that defendants breached the duty of prudence by allowing investment in the Firm’s common stock when they knew or should have known that such stock was unsuitable for the plan and that the Firm and certain current and former officers made false or misleading statements concerning the Firm’s financial condition. Defendants have filed a motion to dismiss.
Nine
shareholder derivative actions (some of which have been consolidated) have also been filed, purportedly on behalf of the Firm, against certain of the Firm’s current and former directors and officers for alleged breaches of their fiduciary duties. These actions generally allege that defendants failed to exercise adequate oversight over CIO and to manage the risk of CIO’s activities, which allegedly led to CIO’s losses. Defendants have filed or expect to file motions to dismiss and/or to stay all of these actions. In April 2013, the New York state court granted defendants’ motion to dismiss
one
of the shareholder derivative actions.
City of Milan Litigation and Criminal Investigation.
In January 2009, the City of Milan, Italy (the “City”) issued civil proceedings against (among others) JPMorgan Chase Bank, N.A. and J.P. Morgan Securities plc (together, “JPMorgan Chase”) in the District Court of Milan. The proceedings relate to (a) a bond issue by the City in June 2005 (the “Bond”), and (b) an associated swap transaction, which was subsequently restructured on a number of occasions between 2005 and 2007 (the “Swap”). The City seeks damages and/or other remedies against JPMorgan Chase (among others) on the grounds of alleged “fraudulent and deceitful acts” and alleged breach of advisory obligations in connection with the Swap and the Bond, together with related swap transactions with other counterparties. The Firm has entered into a settlement agreement with the City to resolve the City’s civil proceedings.
In March 2010, a criminal judge directed
four
current and former JPMorgan Chase personnel and JPMorgan Chase Bank, N.A. (as well as other individuals and
three
other banks) to go forward to a full trial that started in May 2010. As it relates to JPMorgan Chase individuals, two were acquitted and two were found guilty of aggravated fraud with sanctions of prison sentences, fines and a ban from dealing with Italian public bodies for
one year
. JPMorgan
199
Chase (along with other banks involved) was found liable for breaches of Italian administrative law, fined
€1 million
and ordered to forfeit profit from the transaction (for JPMorgan Chase, totaling
€24.7 million
). JPMorgan Chase and the individuals are appealing the verdict, and none of the sanctions will take effect until all appeal avenues have been exhausted.
Credit Default Swaps Investigations and Litigation
. In July 2013, the European Commission (the “EC”) filed a Statement of Objections against the Firm (including various subsidiaries) and other industry members in connection with its ongoing investigation into the credit default swaps (“CDS”) marketplace. The EC asserts that between 2006 and 2009, a number of investment banks acted collectively through the International Swaps and Derivatives Association (“ISDA”) and Markit to shut out exchanges by instructing Markit and ISDA to license their respective data and index benchmarks only for over-the-counter (“OTC”) trading and not for exchange trading, allegedly to protect the investment banks’ revenues from the OTC market. The Department of Justice (the “DOJ”) also has an ongoing investigation into the CDS marketplace, which was initiated in July 2009.
Separately,
four
putative class actions naming the Firm and brought on behalf of purchasers and sellers of CDS have been filed in various federal District Courts asserting federal antitrust law claims. Each of the complaints refers to the ongoing investigations by the EC and DOJ into the CDS market, and alleges that the defendant investment banks and dealers, including the Firm, as well as Markit and/or ISDA,
collectively prevented new entrants into the CDS market, in order to artificially inflate the defendants’ OTC
revenues.
Enron Litigation.
JPMorgan Chase and certain of its officers and directors are involved in
two
lawsuits seeking damages arising out of the Firm’s banking relationships with Enron Corp. and its subsidiaries (“Enron”). Motions to dismiss are pending in both of these lawsuits: an individual action by Enron investors and an action by an Enron counterparty. A number of actions and other proceedings against the Firm previously were resolved, including a class action lawsuit captioned Newby v. Enron Corp. and adversary proceedings brought by Enron’s bankruptcy estate.
FERC Matters.
In July 2013, J.P. Morgan Ventures Energy Corp. (“JMPVEC”) agreed to a settlement with the Federal Energy Regulatory Commission (the “FERC”) resolving its investigation relating to the Firm’s bidding practices in certain organized power markets. As part of this agreement, JPMVEC agreed to pay, without admitting or denying any violations, disgorgement, penalties and interest totaling
$410 million
, and to waive claims to certain payments from the California Independent System Operator that for the most part had not been taken into income. Pursuant to the settlement, the FERC has released JPMVEC, its affiliates and their employees from any claims in connection with activity that was subject to investigation.
This settlement did not have a material impact on the Firm’s results of operations for the second quarter of 2013.
Identity Theft Products.
The OCC and the Consumer Financial Protection Bureau (the “CFPB”) have separately advised Chase Bank USA, N.A, and JPMorgan Chase Bank, N.A. of their determinations to seek administrative orders with respect to the banks’ compliance with Section 5 of the Federal Trade Commission Act and Sections 1031 and 1036 of the Consumer Financial Protection Act, respectively, as well as management and oversight of third parties with respect to certain identity theft products previously offered by the banks. The Firm has reimbursed fees paid by certain customers of these products.
Interchange Litigation.
A group of merchants and retail associations have filed a series of putative class action complaints relating to interchange in several federal courts. The complaints allege, among other claims, that Visa and MasterCard, as well as certain other banks, conspired to set the price of credit and debit card interchange fees, enacted respective rules in violation of antitrust laws, and engaged in tying/bundling and exclusive dealing. All cases were consolidated in the United States District Court for the Eastern District of New York for pretrial proceedings.
In October 2012, Visa, Inc., its wholly-owned subsidiaries Visa U.S.A. Inc. and Visa International Service Association, MasterCard Incorporated, MasterCard International Incorporated and various United States financial institution defendants, including JPMorgan Chase & Co., JPMorgan Chase Bank, N.A., Chase Bank USA, N.A., Chase Paymentech Solutions, LLC and certain predecessor institutions, entered into a settlement agreement (the “Settlement Agreement”) to resolve the claims of the U.S. merchant and retail association plaintiffs (the “Class Plaintiffs”) in the multi-district litigation. In November 2012, the Court entered an order preliminarily approving the Settlement Agreement, which provides for, among other things, a cash payment of
$6.05 billion
to the Class Plaintiffs (of which the Firm’s share is approximately
20%
), and an amount equal to
ten
basis points of credit card interchange for a period of
eight
months to be measured from a date within
60 days
of the end of the opt-out period. The Settlement Agreement also provides for modifications to each credit card network’s rules, including those that prohibit surcharging credit card transactions. The rule modifications became effective in January 2013. In April 2013, Class Plaintiffs moved for final approval of the settlement. The time for merchants to opt out and/or object to the class settlement ended in late May 2013. A number of merchants that opted out have filed actions against Visa and MasterCard, and
two
such actions name the Firm and various of its affiliates as defendants. The hearing on final approval of the class settlement is scheduled for September 2013.
Investment Management Litigation.
The Firm is defending
three
pending cases that allege that investment portfolios managed by J.P. Morgan Investment Management Inc. were inappropriately invested in securities backed by residential real estate collateral. Plaintiffs claim that JPMorgan
200
Investment Management is liable for losses of more than
$1 billion
in market value of these securities. In the case filed by Assured Guaranty (U.K.) and the case filed by Ambac Assurance UK Limited in New York state court, discovery is proceeding on claims for breach of contract, breach of fiduciary duty and gross negligence. The third case, filed by CMMF LLP in New York state court, asserts claims under New York law for breach of fiduciary duty, negligence, breach of contract and negligent misrepresentation. Trial of the CMMF action was completed in February 2013, and the Court’s decision is pending.
Lehman Brothers Bankruptcy Proceedings.
In May 2010, Lehman Brothers Holdings Inc. (“LBHI”) and its Official Committee of Unsecured Creditors (the “Committee”) filed a complaint (and later an amended complaint) against JPMorgan Chase Bank, N.A. in the United States Bankruptcy Court for the Southern District of New York that asserts both federal bankruptcy law and state common law claims, and seeks, among other relief, to recover
$8.6 billion
in collateral that was transferred to JPMorgan Chase Bank, N.A. in the weeks preceding LBHI’s bankruptcy. The amended complaint also seeks unspecified damages on the grounds that JPMorgan Chase Bank, N.A.’s collateral requests hastened LBHI’s bankruptcy. The Firm moved to dismiss plaintiffs’ amended complaint in its entirety, and also moved to transfer the litigation from the Bankruptcy Court to the United States District Court for the Southern District of New York. In April 2012, the Bankruptcy Court issued a decision granting in part and denying in part the Firm’s motion to dismiss. The Court dismissed the counts of the amended complaint seeking avoidance of the allegedly constructively fraudulent and preferential transfers made to the Firm during the months of August and September 2008. The Court denied the Firm’s motion to dismiss as to the other claims, including claims that allege intentional misconduct. In September 2012, the District Court denied the transfer motion without prejudice to its renewal in the future, but stated that any trial would likely have to be conducted before the District Court.
The Firm also filed counterclaims against LBHI alleging that LBHI fraudulently induced the Firm to make large clearing advances to Lehman against inappropriate collateral, which left the Firm with more than
$25 billion
in claims (the “Clearing Claims”) against the estate of Lehman Brothers Inc. (“LBI”), LBHI’s broker-dealer subsidiary. These claims have been paid in full, subject to the outcome of the litigation. Discovery is ongoing.
LBHI and the Committee have filed an objection to the deficiency claims asserted by JPMorgan Chase Bank, N.A. against LBHI with respect to the Clearing Claims, principally on the grounds that the Firm had not conducted the sale of the securities collateral held for such claims in a commercially reasonable manner. The Firm responded to LBHI’s objection in November 2011. Discovery is ongoing.
LBHI and several of its subsidiaries that had been Chapter 11 debtors have filed a separate complaint and objection to derivatives claims asserted by the Firm alleging that the
amount of the derivatives claims had been overstated and challenging certain set-offs taken by JPMorgan Chase entities to recover on the claims. The Firm responded to this separate complaint and objection in February 2013. Discovery is ongoing.
LIBOR Investigations and Litigation.
JPMorgan Chase has received subpoenas and requests for documents and, in some cases, interviews, from federal and state agencies and entities, including the DOJ, CFTC, SEC and various state attorneys general, as well as the European Commission, UK Financial Services Authority (now known as the Financial Conduct Authority), Canadian Competition Bureau, Swiss Competition Commission and other regulatory authorities and banking associations around the world. The documents and information sought relate primarily to the process by which interest rates were submitted to the British Bankers Association (“BBA”) in connection with the setting of the BBA’s London Interbank Offered Rate (“LIBOR”) for various currencies, principally in 2007 and 2008. Some of the inquiries also relate to similar processes by which information on rates is submitted to European Banking Federation (“EBF”) in connection with the setting of the EBF’s Euro Interbank Offered Rates (“EURIBOR”) and to the Japanese Bankers’ Association for the setting of Tokyo Interbank Offered Rates (“TIBOR”) as well as to other processes for the setting of other reference rates in various parts of the world during similar time periods. The Firm is cooperating with these inquiries.
In addition, the Firm has been named as a defendant along with other banks in a series of individual and class actions filed in various federal and state courts
in which plaintiffs make varying allegations that in various periods, starting in 2000 or later, defendants either individually or collectively manipulated the U.S. dollar LIBOR, Yen LIBOR and/or Euroyen TIBOR rates by submitting rates that were artificially low or high. Plaintiffs allege that they transacted in loans, derivatives or other financial instruments whose values are impacted by changes in U.S. dollar LIBOR, Yen LIBOR, or Euroyen TIBOR and assert a variety of claims
including antitrust claims seeking treble damages.
The U.S. dollar LIBOR-related putative class actions have been consolidated for pre-trial purposes in the United States District Court for the Southern District of New York, where the Court has appointed interim lead counsel for
three
proposed classes: (i) direct purchasers over-the-counter of U.S. dollar LIBOR-based financial instruments; (ii) purchasers of U.S. dollar LIBOR-based financial instruments on an exchange (the “exchange plaintiffs”); and (iii) purchasers of debt securities that pay an interest rate linked to U.S. dollar LIBOR. In March 2013, the Court granted in part and denied in part the defendants’ motions to dismiss the claims asserted in these
three
putative class actions, as well as in
three
related individual actions brought by various Charles Schwab entities (the “Schwab plaintiffs”). The Court dismissed with prejudice the federal antitrust and Racketeer Influenced and Corrupt Organization Act claims asserted by these plaintiffs and the state antitrust law claims asserted by the Schwab plaintiffs,
201
as well as a New York unjust enrichment claim asserted by certain plaintiffs and certain claims under the Commodities Exchange Act (the “CEA”). The Court declined to dismiss certain other CEA claims and declined to exercise supplemental jurisdiction over certain state and common law claims. The plaintiffs in the
three
putative class actions have moved for leave to file amended complaints that seek to replead their federal antitrust claims. In addition, the exchange plaintiffs have moved for leave to amend their CEA claims and for permission to seek an interlocutory appeal of certain aspects of the Court’s decision. All of the other actions pending before this Court that were not the subject of the defendants’ motion to dismiss have been stayed.
In April 2013, the Schwab plaintiffs commenced a new U.S. dollar LIBOR action in California state court alleging federal securities law claims and various California state law claims. The defendants removed this action to federal court, and the Judicial Panel on Multidistrict Litigation subsequently entered an order conditionally transferring this action to the Southern District of New York. The Schwab plaintiffs have moved to have the case remanded to California state court. In addition to the Schwab plaintiffs’ new action, there are
six
individual U.S. dollar LIBOR actions that are pending in other courts and that assert, among other things, federal and state antitrust claims and state common law claims.
In August 2012, a shareholder derivative action was filed in New York state court, purportedly on behalf of the Firm, against certain of the Firm’s current and former directors and officers for alleged breaches of their fiduciary duties in connection with the alleged manipulation of LIBOR. In April 2013, the court granted defendants’ motion to dismiss the action. In June 2013, a second U.S. dollar LIBOR-related shareholder derivative action was filed in New York state court, purportedly on behalf of the Firm, against certain of the Firm’s current and former directors.
The Firm also has been named as a defendant in a purported class action filed in the United States District Court for the Southern District of New York which seeks to bring claims on behalf of plaintiffs who purchased or sold exchange-traded Euroyen futures and options contracts. Defendants moved to dismiss the plaintiff’s second amended complaint.
Madoff Litigation.
JPMorgan Chase & Co., JPMorgan Chase Bank, N.A., J.P. Morgan Securities LLC, and J.P. Morgan Securities plc have been named as defendants in a lawsuit brought by the trustee (the “Trustee”) for the liquidation of Bernard L. Madoff Investment Securities LLC (“Madoff”). The Trustee has served an amended complaint in which he has asserted
28
causes of action against JPMorgan Chase,
20
of which seek to avoid certain transfers (direct or indirect) made to JPMorgan Chase that are alleged to have been preferential or fraudulent under the federal Bankruptcy Code and the New York Debtor and Creditor Law. The remaining causes of action involve claims for, among other things, aiding and abetting fraud, aiding and abetting breach of fiduciary duty, conversion, contribution
and unjust enrichment in connection with Madoff’s Ponzi scheme. The complaint asserts common law claims that purport to seek approximately
$19 billion
in damages, together with bankruptcy law claims to recover approximately
$425 million
in transfers that JPMorgan Chase allegedly received directly or indirectly from Bernard Madoff’s brokerage firm. In October 2011, the United States District Court for the Southern District of New York granted JPMorgan Chase’s motion to dismiss the common law claims asserted by the Trustee, and returned the remaining claims to the Bankruptcy Court for further proceedings. The Trustee appealed this decision and in June 2013 the United States Court of Appeals for the Second Circuit affirmed the District Court’s decision.
Separately, J.P. Morgan Trust Company (Cayman) Limited, JPMorgan (Suisse) SA, J.P. Morgan Securities plc, Bear Stearns Alternative Assets International Ltd., J.P. Morgan Clearing Corp., J.P. Morgan Bank Luxembourg SA, and J.P. Morgan Markets Limited (formerly Bear Stearns International Limited) were named as defendants in lawsuits filed in Bankruptcy Court in New York arising out of the liquidation proceedings of Fairfield Sentry Limited and Fairfield Sigma Limited (together, “Fairfield”), so-called Madoff feeder funds. These actions are based on theories of mistake and restitution, among other theories, and seek to recover payments made to defendants by the funds totaling approximately
$155 million
. Pursuant to an agreement with the Trustee, the liquidators of Fairfield have voluntarily dismissed their action against J.P. Morgan Securities plc without prejudice to refiling. The other actions remain outstanding. In addition, a purported class action was brought by investors in certain feeder funds against JPMorgan Chase in the United States District Court for the Southern District of New York, as was a motion by separate potential class plaintiffs to add claims against JPMorgan Chase & Co., JPMorgan Chase Bank, N.A., J.P. Morgan Securities LLC and J.P. Morgan Securities plc to an already pending purported class action in the same court. The allegations in these complaints largely track those raised by the Trustee. The Court dismissed these complaints and plaintiffs have appealed. Oral argument on the appeal was held in April 2013 and the Firm is awaiting the Court’s decision.
The Firm is a defendant in
five
other Madoff-related actions pending in New York state court and one purported class action in federal District Court in New York. The allegations in all of these actions are essentially identical, and involve claims against the Firm for, among other things, aiding and abetting breach of fiduciary duty, conversion and unjust enrichment. The Firm has moved to dismiss both the state and federal actions.
The Firm is also responding to various governmental investigations relating to Madoff, including by the Department of Justice and other regulators.
MF Global.
JPMorgan Chase & Co. was named as
one
of several defendants in a number of putative class action lawsuits brought by former customers of MF Global in
202
federal District Courts in New York, Illinois and Montana. The lawsuits were consolidated before the United States District Court for the Southern District of New York. The actions alleged, among other things, that the Firm aided and abetted MF Global’s alleged misuse of customer money and breaches of fiduciary duty and was unjustly enriched by the transfer of certain customer segregated funds by MF Global.
In June 2012, the Securities Investor Protection Act (“SIPA”) Trustee issued a Report of the Trustee’s Investigation and Recommendations, and stated that he was considering potential claims against the Firm with respect to certain transfers identified in the Report.
In March 2013, the Firm entered into a settlement agreement with the customer class plaintiffs and the SIPA Trustee, pursuant to which the Firm has agreed to pay a total of
$107.5 million
to resolve all claims that have been or could be asserted by the customer class and the SIPA Trustee against the Firm and any of its affiliates or employees. In addition, under the proposed settlement, the Firm has agreed to release certain liens and set-off rights it had retained in certain MF Global proprietary funds that were previously remitted to the SIPA Trustee, and to remit certain additional MF Global proprietary funds that the Firm held to secure potential obligations under certain agreements with MF Global and its U.K. affiliate. The Firm will also be entitled to a
$60 million
general unsecured claim in the MF Global broker-dealer bankruptcy proceeding. The settlement was approved by both the Bankruptcy Court and the District Court in July 2013.
The Firm has also reached a settlement with the MF Global Chapter 11 debtors to resolve all claims that could potentially be asserted by those parties against the Firm in exchange for a portion of the proceeds, if any, that the Firm receives in connection with the aforementioned
$60 million
unsecured claim. This settlement is subject to approval by the Bankruptcy Court.
The Firm is also continuing to respond to inquiries from the CFTC concerning MF Global.
J.P. Morgan Securities LLC has been named as
one
of several defendants in a number of purported class actions filed by purchasers of MF Global’s publicly traded securities, including the securities issued pursuant to MF Global’s June 2010 secondary offering of common stock and February 2011 and August 2011 convertible note offerings. The actions have been consolidated before the United States District Court for the Southern District of New York. In August 2012, the lead plaintiffs filed an amended complaint which asserts violations of the Securities Act of 1933 against the underwriter defendants and alleges that the offering documents contained materially false and misleading statements and omissions regarding MF Global’s financial position, internal controls and risk management, as such topics relate to its exposure to European sovereign debt. Defendants have filed a motion to dismiss.
Mortgage-Backed Securities and Repurchase Litigation and Mortgage-Related Regulatory Investigations.
JPMorgan Chase and affiliates, Bear Stearns and affiliates and Washington Mutual affiliates have been named as defendants in a number of cases in their various roles as issuer, originator or underwriter in MBS offerings. These cases include purported class action suits, actions by individual purchasers of securities or by trustees for the benefit of purchasers of securities, an action by the New York State Attorney General and actions by monoline insurance companies that guaranteed payments of principal and interest for particular tranches of securities offerings. Although the allegations vary by lawsuit, these cases generally allege that the offering documents for securities issued by numerous securitization trusts contained material misrepresentations and omissions, including with regard to the underwriting standards pursuant to which the underlying mortgage loans were issued, or assert that various representations or warranties relating to the loans were breached at the time of origination. There are currently pending and tolled investor claims involving approximately
$166 billion
of such securities. In addition, and as described below, there are pending and threatened claims by monoline insurers and by and on behalf of trustees that involve some of these and other securitizations.
In the actions against the Firm as an MBS issuer (and, in some cases, also as an underwriter of its own MBS offerings),
three
purported class actions are pending against JPMorgan Chase and Bear Stearns, and/or certain of their affiliates and current and former employees, in the United States District Courts for the Eastern and Southern Districts of New York. Motions to dismiss have been largely denied in these cases, and they are in various stages of litigation.
In addition to class actions, the Firm is also a defendant in individual actions brought against certain affiliates of JPMorgan Chase, Bear Stearns and Washington Mutual as issuers (and, in some cases, as underwriters) of MBS. These actions involve claims by or to benefit various institutional investors and governmental agencies. These actions are pending in federal and state courts across the United States and are in various stages of litigation.
In actions against the Firm solely as an underwriter of other issuers’ MBS offerings, the Firm has contractual rights to indemnification from the issuers. However, those indemnity rights may prove effectively unenforceable where the issuers are now defunct, such as in a pending case where the Firm has been named involving affiliates of IndyMac Bancorp. The Firm may also be contractually obligated to indemnify underwriters in certain deals it issued.
EMC Mortgage LLC (formerly EMC Mortgage Corporation) (“EMC”), an indirect subsidiary of JPMorgan Chase & Co., and certain other JPMorgan Chase entities currently are defendants in
nine
pending actions commenced by bond insurers that guaranteed payments of principal and interest on certain classes of
19
different MBS offerings. These
203
actions are pending in federal and state courts in New York and are in various stages of litigation. Certain JPMorgan Chase entities, in their capacities as alleged successors in interest to Bear Stearns and EMC, have been named as defendants in a civil suit filed by the New York State Attorney General in New York state court in connection with Bear Stearns’ due diligence and quality control practices relating to MBS.
The Firm or its affiliates are defendants in actions brought by trustees or master servicers of various MBS trusts and others on behalf of the purchasers of securities issued by those trusts. The first action was commenced by Deutsche Bank National Trust Company, acting as trustee for various MBS trusts, against the Firm and the FDIC based on MBS issued by Washington Mutual Bank and its affiliates; that case is described in the Washington Mutual Litigations section below. The other actions are at various initial stages of litigation in the New York and Delaware state courts, including actions brought by MBS trustees, each specific to one or more MBS transactions, against EMC and/or JPMorgan Chase. These cases generally allege breaches of various representations and warranties regarding securitized loans and seek repurchase of those loans, as well as indemnification of attorneys’ fees and costs and other remedies.
There is no assurance that the Firm will not be named as a defendant in additional MBS-related litigation, and the Firm has entered into agreements with a number of entities that purchased such securities that toll applicable limitations periods with respect to their claims, and has settled, and in the future may settle, tolled claims. In addition, the Firm has received several demands by securitization trustees that threaten litigation, as well as demands by investors directing or threatening to direct trustees to investigate claims or bring litigation, based on purported obligations to repurchase loans out of securitization trusts and alleged servicing deficiencies. These include but are not limited to a demand from a law firm, as counsel to a group of purchasers of MBS that purport to have
25%
or more of the voting rights in as many as
191
different trusts sponsored by the Firm or its affiliates with an original principal balance of more than
$174 billion
(excluding
52
trusts sponsored by Washington Mutual, with an original principal balance of more than
$58 billion
), made to various trustees to investigate potential repurchase and servicing claims. Further, there have been repurchase and servicing claims made in litigation against trustees not affiliated with the Firm, but involving trusts that the Firm sponsored.
In April 2012, the New York state court granted the Firm’s motion to dismiss a shareholder complaint asserting claims against current and former members of the Firm’s Board of Directors based on alleged wrongful actions and inactions relating to originations and securitizations. In February 2013, the court’s order was affirmed on appeal, and the New York Court of Appeals thereafter denied plaintiff’s motion for leave to appeal. A second shareholder complaint has been filed in New York state court alleging that the Firm’s Board of Directors allowed the Firm to engage in
wrongful conduct regarding the sale of residential MBS and failed to implement adequate internal controls to prevent such wrongdoing. In June 2013,
two
shareholders filed a third derivative action in New York state court alleging breaches of fiduciary duties in connection with the issuance of MBS.
The Firm is responding to parallel investigations being conducted by the Civil and Criminal Divisions of the United States Attorney’s Office for the Eastern District of California relating to MBS offerings securitized and sold by the Firm and its subsidiaries. In May 2013, the Firm received a notice from Civil Division stating that it has preliminarily concluded that the Firm violated certain federal securities laws in connection with its subprime and Alt-A residential MBS offerings during 2005 to 2007.
In addition to the above-described matters, the Firm has also received, and responded to, a number of subpoenas and informal requests for information from other federal and state authorities concerning mortgage-related matters, including inquiries concerning a number of transactions involving the Firm and its affiliates’ origination and purchase of whole loans, underwriting, issuance and trading of MBS, treatment of early payment defaults, potential breaches of securitization representations and warranties, reserves and due diligence in connection with securitizations. The Firm continues to respond to other MBS-related regulatory inquiries.
Mortgage Foreclosure-Related Investigations and Litigation.
The Attorneys General of Massachusetts and New York have separately filed lawsuits against the Firm, other servicers and a mortgage recording company asserting claims for various alleged wrongdoings relating to mortgage assignments and use of the industry’s electronic mortgage registry. The court granted in part and denied in part the defendants’ motion to dismiss the Massachusetts action and the Firm has reached a settlement in the New York action.
The Firm is named as a defendant in
two
purported class action lawsuits relating to its mortgage foreclosure procedures. In one action, the Firm has moved to dismiss an amended complaint, and in the other action, plaintiff has moved for class certification.
Two
shareholder derivative actions have been filed in New York Supreme Court against the Firm’s Board of Directors alleging that the Board failed to exercise adequate oversight as to wrongful conduct by the Firm regarding mortgage servicing. These actions seek declaratory relief and damages. In July 2012, the Court granted defendants’ motion to dismiss the complaint in the first-filed action and gave plaintiff
45 days
in which to file an amended complaint. In October 2012, the Court entered a stipulated order consolidating the actions and staying all proceedings pending the plaintiffs’ decision whether to file a consolidated complaint after the Firm completes its response to a demand submitted by one of the plaintiffs under Section 220 of the Delaware General Corporation Law.
204
The United States Attorney’s Office for the Southern District of New York is conducting an investigation concerning the Firm’s compliance with the requirements of the Federal Housing Administration’s Direct Endorsement Program. The Firm is cooperating in that investigation.
Municipal Derivatives Litigation.
Purported class action lawsuits and individual actions were filed against JPMorgan Chase and Bear Stearns, as well as numerous other providers and brokers, alleging antitrust violations in the market for financial instruments related to municipal bond offerings referred to collectively as “municipal derivatives.” The municipal derivatives actions were consolidated and/or coordinated in the United States District Court for the Southern District of New York. The Court approved a settlement of the class action pursuant to which the Firm paid
$43 million
. Certain class members opted out of the settlement, including
27
plaintiffs named in individual actions already pending against JPMorgan.
In addition, civil actions have been commenced against the Firm relating to certain Jefferson County, Alabama (the “County”) warrant underwritings and swap transactions. The County filed for bankruptcy in November 2011. There are currently three civil actions pending in Alabama state court or the United States Bankruptcy Court for the Northern District of Alabama: (1) an action by the County against the Firm and several other defendants alleging that the Firm made payments to certain third parties in exchange for being chosen to underwrite more than
$3 billion
in warrants issued by the County and to act as the counterparty for certain swaps executed by the County and that, but for the concealment of these payments, the County would not have entered into the transactions; (2) an action on behalf of a purported class of sewer rate payers based on the same allegations as in the County’s action; and (3) an adversary proceeding
by
different representatives of a purported class of sewer ratepayers seeking to void
$1.6 billion
of warrants issued by the County as allegedly unlawful, which initially included the Firm as a defendant but more recently has dropped any claims against the Firm. All of these actions have been stayed.
Two
insurance companies that guaranteed the payment of principal and interest on warrants issued by the County have filed separate actions against the Firm in New York state court. Their complaints assert that the Firm fraudulently misled them into issuing insurance based upon substantially the same alleged conduct described above and other alleged non-disclosures. One insurer claims that it insured an aggregate principal amount of nearly
$1.2 billion
and seeks unspecified damages in excess of
$400 million
as well as unspecified punitive damages. The other insurer claims that it insured an aggregate principal amount of more than
$378 million
and seeks recovery of
$4 million
allegedly paid under the policies to date as well as any future payments and unspecified punitive damages. Both of these actions are also currently stayed.
In June 2013, the County filed a Chapter 9 Plan of Adjustment (“Plan of Adjustment”) under which the County
action and the insurance company actions referenced above would be dismissed with prejudice, and individuals seeking to assert claims on behalf of the County, including the sewer rate payers who previously filed actions described above, would be permanently enjoined from pursuing those claims. In August 2013, the Bankruptcy Court approved the County’s disclosure statement and authorized the County to solicit votes on its Plan of Adjustment. The confirmation hearing in respect of the Plan is scheduled for November 2013. If confirmed, the Plan of Adjustment sets forth various conditions to the occurrence of the effective date, including that the effective date occur before the end of 2013.
Option Adjustable Rate Mortgage Litigation.
The Firm has reached an agreement to settle
one
purported and
three
certified class actions, all pending in federal courts in California, which assert that several JPMorgan Chase entities violated the federal Truth in Lending Act and state unfair business practice statutes in failing to provide adequate disclosures in Option Adjustable Rate Mortgage (“ARM”) loans regarding the resetting of introductory interest rates and that negative amortization was certain to occur if a borrower made the minimum monthly payment.
Petters Bankruptcy and Related Matters.
JPMorgan Chase and certain of its affiliates, including One Equity Partners (“OEP”), have been named as defendants in several actions filed in connection with the receivership and bankruptcy proceedings pertaining to Thomas J. Petters and certain affiliated entities (collectively, “Petters”) and the Polaroid Corporation. The principal actions against JPMorgan Chase and its affiliates have been brought by a court-appointed receiver for Petters and the trustees in bankruptcy proceedings for
three
Petters entities. These actions generally seek to avoid, on fraudulent transfer and preference grounds, certain purported transfers in connection with (i) the 2005 acquisition by Petters of Polaroid, which at the time was majority-owned by OEP; (ii) two credit facilities that JPMorgan Chase and other financial institutions entered into with Polaroid; and (iii) a credit line and investment accounts held by Petters. The actions collectively seek recovery of approximately
$450 million
. Defendants have moved to dismiss the complaints in the actions filed by the Petters bankruptcy trustees.
Securities Lending Litigation.
JPMorgan Chase Bank, N.A. was named as a defendant in a putative class action pending in the United States District Court for the Southern District of New York brought by participants in the Firm’s securities lending business. The action relates to investments by ERISA clients of more than
$200 million
in Lehman Brothers medium-term notes. The Court denied the Firm’s motion to dismiss the third amended complaint, and scheduled a trial to begin February 2014.
Sworn Documents and Collection Litigation Practices
. The Firm has been responding to formal and informal inquiries from various state and federal regulators regarding practices involving credit card collections litigation (including with respect to sworn documents), the sale of
205
consumer credit card debt and securities backed by credit card receivables. The OCC has advised Chase Bank USA, JPMorgan Chase Bank, N.A. and JPMorgan Bank and Trust Company, N.A. (“Chase”) of its determination to seek an administrative order with respect to Chase’s past oversight of third parties, operational processes and control functions related to collections litigation practices, the execution and notarization of sworn documents and compliance with Servicemembers Civil Relief Act, and Chase’s sales of consumer credit card debt. The CFPB is conducting an investigation into Chase’s collection and sale of consumer credit card debt, including, but not limited to, its use of sworn documents in these processes.
In May 2013, the California Attorney General filed a civil action in California state court against JPMorgan Chase & Co., Chase Bank USA, N.A. and Chase BankCard Services, Inc. alleging violations of California law relating to the use of sworn documents in various stages of the debt collection process, including but not limited to verification of credit card collection complaints, default motions and judgment sales. The Firm has moved to dismiss the complaint.
Washington Mutual Litigations.
Proceedings related to Washington Mutual’s failure are pending before the United States District Court for the District of Columbia and include a lawsuit brought by Deutsche Bank National Trust Company, initially against the FDIC, asserting an estimated
$6 billion
to
$10 billion
in damages based upon alleged breach of various mortgage securitization agreements and alleged violation of certain representations and warranties given by certain Washington Mutual, Inc. (“WMI”) subsidiaries in connection with those securitization agreements. The case includes assertions that JPMorgan Chase may have assumed liabilities for alleged breaches of representations and warranties in the mortgage securitization agreements. The District Court denied as premature motions by the Firm and the FDIC that sought a ruling on whether the FDIC retained liability for Deutsche Bank’s claims. Discovery is underway.
In addition, JPMorgan Chase was sued in an action originally filed in state court in Texas (the “Texas Action”) by certain holders of WMI common stock and debt of WMI and Washington Mutual Bank who seek unspecified damages alleging that JPMorgan Chase acquired substantially all of the assets of Washington Mutual Bank from the FDIC at a price that was allegedly too low. The Texas Action was transferred to the United States District Court for the District of Columbia, which ultimately granted JPMorgan Chase’s and the FDIC’s motions to dismiss the complaint, but the United States Court of Appeals for the District of Columbia Circuit reversed the District Court’s dismissal and remanded the case for further proceedings. Plaintiffs, who sue now only as holders of Washington Mutual Bank debt following their voluntary dismissal of claims brought as holders of WMI common stock and debt, have filed an amended complaint alleging that JPMorgan Chase caused the closure of Washington Mutual Bank and damaged them by causing their bonds issued by Washington Mutual Bank, which had a total face value of
$38 million
, to lose
substantially all of their value. JPMorgan Chase and the FDIC moved to dismiss this action and the District Court dismissed the case except as to the plaintiffs’ claim that the Firm tortiously interfered with the plaintiffs’ bond contracts with Washington Mutual Bank prior to its closure. Discovery is underway.
* * *
In addition to the various legal proceedings discussed above, JPMorgan Chase and its subsidiaries are named as defendants or are otherwise involved in a substantial number of other legal proceedings. The Firm believes it has meritorious defenses to the claims asserted against it in its currently outstanding legal proceedings and it intends to defend itself vigorously in all such matters. Additional legal proceedings may be initiated from time to time in the future.
The Firm has established reserves for several hundred of its currently outstanding legal proceedings. The Firm accrues for potential liability arising from such proceedings when it is probable that such liability has been incurred and the amount of the loss can be reasonably estimated. The Firm evaluates its outstanding legal proceedings each quarter to assess its litigation reserves, and makes adjustments in such reserves, upwards or downwards, as appropriate, based on management’s best judgment after consultation with counsel. The Firm incurred litigation expense of
$678 million
and
$323 million
during the three months ended June 30, 2013 and 2012, respectively, and
$1.0 billion
and
$3.0 billion
during the six months ended June 30, 2013 and 2012, respectively. There is no assurance that the Firm’s litigation reserves will not need to be adjusted in the future.
In view of the inherent difficulty of predicting the outcome of legal proceedings, particularly where the claimants seek very large or indeterminate damages, or where the matters present novel legal theories, involve a large number of parties or are in early stages of discovery, the Firm cannot state with confidence what will be the eventual outcomes of the currently pending matters, the timing of their ultimate resolution or the eventual losses, fines, penalties or impact related to those matters. JPMorgan Chase believes, based upon its current knowledge, after consultation with counsel and after taking into account its current litigation reserves, that the legal proceedings currently pending against it should not have a material adverse effect on the Firm’s consolidated financial condition. The Firm notes, however, that in light of the uncertainties involved in such proceedings, there is no assurance the ultimate resolution of these matters will not significantly exceed the reserves it has currently accrued; as a result, the outcome of a particular matter may be material to JPMorgan Chase’s operating results for a particular period, depending on, among other factors, the size of the loss or liability imposed and the level of JPMorgan Chase’s income for that period.
206
The Firm is managed on a line of business basis. The business segment financial results presented reflect the current organization of JPMorgan Chase. There are
four
major reportable business segments – Consumer & Community Banking, Corporate & Investment Bank, Commercial Banking and Asset Management. In addition, there is a Corporate/Private Equity segment. The business segments are determined based on the products and services provided, or the type of customer served, and they reflect the manner in which financial information is currently evaluated by management. Results of these lines of business are presented on a managed basis. For a further discussion concerning
JPMorgan Chase
’s business segments, see Business Segment Results on pages
17–18
of this Form 10-Q, and pages 78–79 and Note 33 on pages 326–329 of JPMorgan Chase’s 2012 Annual Report.
Segment results
The following tables provide a summary of the Firm’s segment results for the three and six months ended June 30, 2013 and 2012, on a managed basis. Total net revenue (noninterest revenue and net interest income) for each of the segments is presented on a fully taxable-equivalent (“FTE”) basis. Accordingly, revenue from investments that receive tax credits and tax-exempt securities is presented in the managed results on a basis comparable to taxable investments and securities. This non-GAAP financial measure allows management to assess the comparability of revenue arising from both taxable and tax-exempt sources. The corresponding income tax impact related to tax-exempt items is recorded within income tax expense/(benefit).
Effective January 1, 2013, the Firm further refined the capital allocation framework to align it with the revised line of business structure that became effective in the fourth quarter of 2012. The increase in equity levels for the lines of businesses is largely driven by regulatory guidance on Basel III requirements, principally for CIB and CIO, and by anticipated business growth.
|
Segment results and reconciliation
(a)
|
|||||||||||||||||||||||||||
|
As of or for the three months ended June 30,
(in millions, except ratios)
|
Consumer & Community Banking
(b)
|
Corporate & Investment Bank
|
Commercial Banking
|
Asset Management
|
|||||||||||||||||||||||
|
2013
|
2012
|
2013
|
2012
|
2013
|
2012
|
2013
|
2012
|
||||||||||||||||||||
|
Noninterest revenue
|
$
|
4,921
|
|
$
|
5,289
|
|
$
|
7,171
|
|
$
|
6,261
|
|
$
|
551
|
|
$
|
562
|
|
$
|
2,156
|
|
$
|
1,852
|
|
|||
|
Net interest income
|
7,094
|
|
7,161
|
|
2,705
|
|
2,725
|
|
1,177
|
|
1,129
|
|
569
|
|
512
|
|
|||||||||||
|
Total net revenue
|
12,015
|
|
12,450
|
|
9,876
|
|
8,986
|
|
1,728
|
|
1,691
|
|
2,725
|
|
2,364
|
|
|||||||||||
|
Provision for credit losses
|
(19
|
)
|
179
|
|
(6
|
)
|
29
|
|
44
|
|
(17
|
)
|
23
|
|
34
|
|
|||||||||||
|
Noninterest expense
|
6,864
|
|
6,837
|
|
5,742
|
|
5,293
|
|
652
|
|
591
|
|
1,892
|
|
1,701
|
|
|||||||||||
|
Income/(loss) before
income tax expense/(benefit)
|
5,170
|
|
5,434
|
|
4,140
|
|
3,664
|
|
1,032
|
|
1,117
|
|
810
|
|
629
|
|
|||||||||||
|
Income tax expense/(benefit)
|
2,081
|
|
2,152
|
|
1,302
|
|
1,288
|
|
411
|
|
444
|
|
310
|
|
238
|
|
|||||||||||
|
Net income/(loss)
|
$
|
3,089
|
|
$
|
3,282
|
|
$
|
2,838
|
|
$
|
2,376
|
|
$
|
621
|
|
$
|
673
|
|
$
|
500
|
|
$
|
391
|
|
|||
|
Average common equity
|
$
|
46,000
|
|
$
|
43,000
|
|
$
|
56,500
|
|
$
|
47,500
|
|
$
|
13,500
|
|
$
|
9,500
|
|
$
|
9,000
|
|
$
|
7,000
|
|
|||
|
Total assets
|
460,642
|
|
466,650
|
|
873,527
|
|
897,413
|
|
184,124
|
|
163,698
|
|
115,157
|
|
98,704
|
|
|||||||||||
|
Return on common equity
|
27
|
%
|
31
|
%
|
20
|
%
|
20
|
%
|
18
|
%
|
28
|
%
|
22
|
%
|
22
|
%
|
|||||||||||
|
Overhead ratio
|
57
|
|
55
|
|
58
|
|
59
|
|
38
|
|
35
|
|
69
|
|
72
|
|
|||||||||||
|
As of or for the three months ended June 30,
(in millions, except ratios)
|
Corporate/Private Equity
(b)
|
Reconciling Items
(c)
|
Total
|
|||||||||||||||||
|
2013
|
2012
|
2013
|
2012
|
2013
|
2012
|
|||||||||||||||
|
Noninterest revenue
|
$
|
290
|
|
$
|
(2,413
|
)
|
$
|
(582
|
)
|
$
|
(517
|
)
|
$
|
14,507
|
|
$
|
11,034
|
|
||
|
Net interest income
|
(676
|
)
|
(186
|
)
|
(165
|
)
|
(195
|
)
|
10,704
|
|
11,146
|
|
||||||||
|
Total net revenue
|
(386
|
)
|
(2,599
|
)
|
(747
|
)
|
(712
|
)
|
25,211
|
|
22,180
|
|
||||||||
|
Provision for credit losses
|
5
|
|
(11
|
)
|
—
|
|
—
|
|
47
|
|
214
|
|
||||||||
|
Noninterest expense
|
716
|
|
544
|
|
—
|
|
—
|
|
15,866
|
|
14,966
|
|
||||||||
|
Income/(loss) before income tax expense/(benefit)
|
(1,107
|
)
|
(3,132
|
)
|
(747
|
)
|
(712
|
)
|
9,298
|
|
7,000
|
|
||||||||
|
Income tax expense/(benefit)
|
(555
|
)
|
(1,370
|
)
|
(747
|
)
|
(712
|
)
|
2,802
|
|
2,040
|
|
||||||||
|
Net income/(loss)
|
$
|
(552
|
)
|
$
|
(1,762
|
)
|
$
|
—
|
|
$
|
—
|
|
$
|
6,496
|
|
$
|
4,960
|
|
||
|
Average common equity
|
$
|
72,283
|
|
$
|
74,021
|
|
$
|
—
|
|
$
|
—
|
|
$
|
197,283
|
|
$
|
181,021
|
|
||
|
Total assets
|
806,044
|
|
663,681
|
|
NA
|
|
NA
|
|
2,439,494
|
|
2,290,146
|
|
||||||||
|
Return on average common equity
|
NM
|
|
NM
|
|
NM
|
|
NM
|
|
13
|
%
|
11
|
%
|
||||||||
|
Overhead ratio
|
NM
|
|
NM
|
|
NM
|
|
NM
|
|
63
|
|
67
|
|
||||||||
207
|
Segment results and reconciliation
(a)
|
|||||||||||||||||||||||||||
|
As of or for the six months ended June 30,
(in millions, except ratios)
|
Consumer & Community Banking
(b)
|
Corporate & Investment Bank
|
Commercial Banking
|
Asset Management
|
|||||||||||||||||||||||
|
2013
|
2012
|
2013
|
2012
|
2013
|
2012
|
2013
|
2012
|
||||||||||||||||||||
|
Noninterest revenue
|
$
|
9,327
|
|
$
|
10,275
|
|
$
|
14,528
|
|
$
|
12,749
|
|
$
|
1,086
|
|
$
|
1,119
|
|
$
|
4,250
|
|
$
|
3,739
|
|
|||
|
Net interest income
|
14,303
|
|
14,527
|
|
5,488
|
|
5,575
|
|
2,315
|
|
2,229
|
|
1,128
|
|
995
|
|
|||||||||||
|
Total net revenue
|
23,630
|
|
24,802
|
|
20,016
|
|
18,324
|
|
3,401
|
|
3,348
|
|
5,378
|
|
4,734
|
|
|||||||||||
|
Provision for credit losses
|
530
|
|
821
|
|
5
|
|
26
|
|
83
|
|
60
|
|
44
|
|
53
|
|
|||||||||||
|
Noninterest expense
|
13,654
|
|
13,882
|
|
11,853
|
|
11,504
|
|
1,296
|
|
1,189
|
|
3,768
|
|
3,430
|
|
|||||||||||
|
Income/(loss) before
income tax expense/(benefit)
|
9,446
|
|
10,099
|
|
8,158
|
|
6,794
|
|
2,022
|
|
2,099
|
|
1,566
|
|
1,251
|
|
|||||||||||
|
Income tax expense/(benefit)
|
3,771
|
|
3,892
|
|
2,710
|
|
2,385
|
|
805
|
|
835
|
|
579
|
|
474
|
|
|||||||||||
|
Net income/(loss)
|
$
|
5,675
|
|
$
|
6,207
|
|
$
|
5,448
|
|
$
|
4,409
|
|
$
|
1,217
|
|
$
|
1,264
|
|
$
|
987
|
|
$
|
777
|
|
|||
|
Average common equity
|
$
|
46,000
|
|
$
|
43,000
|
|
$
|
56,500
|
|
$
|
47,500
|
|
$
|
13,500
|
|
$
|
9,500
|
|
$
|
9,000
|
|
$
|
7,000
|
|
|||
|
Total assets
|
460,642
|
|
466,650
|
|
873,527
|
|
897,413
|
|
184,124
|
|
163,698
|
|
115,157
|
|
98,704
|
|
|||||||||||
|
Return on common equity
|
25
|
%
|
29
|
%
|
19
|
%
|
19
|
%
|
18
|
%
|
27
|
%
|
22
|
%
|
22
|
%
|
|||||||||||
|
Overhead ratio
|
58
|
|
56
|
|
59
|
|
63
|
|
38
|
|
36
|
|
70
|
|
72
|
|
|||||||||||
|
As of or for the six months ended June 30,
(in millions, except ratios)
|
Corporate/Private Equity
(b)
|
Reconciling Items
(c)
|
Total
|
|||||||||||||||||
|
2013
|
2012
|
2013
|
2012
|
2013
|
2012
|
|||||||||||||||
|
Noninterest revenue
|
$
|
651
|
|
$
|
(1,411
|
)
|
$
|
(1,146
|
)
|
$
|
(1,051
|
)
|
$
|
28,696
|
|
$
|
25,420
|
|
||
|
Net interest income
|
(1,270
|
)
|
(148
|
)
|
(327
|
)
|
(366
|
)
|
21,637
|
|
22,812
|
|
||||||||
|
Total net revenue
|
(619
|
)
|
(1,559
|
)
|
(1,473
|
)
|
(1,417
|
)
|
50,333
|
|
48,232
|
|
||||||||
|
Provision for credit losses
|
2
|
|
(20
|
)
|
—
|
|
—
|
|
664
|
|
940
|
|
||||||||
|
Noninterest expense
|
718
|
|
3,306
|
|
—
|
|
—
|
|
31,289
|
|
33,311
|
|
||||||||
|
Income/(loss) before income tax expense/(benefit)
|
(1,339
|
)
|
(4,845
|
)
|
(1,473
|
)
|
(1,417
|
)
|
18,380
|
|
13,981
|
|
||||||||
|
Income tax expense/(benefit)
|
(1,037
|
)
|
(2,072
|
)
|
(1,473
|
)
|
(1,417
|
)
|
5,355
|
|
4,097
|
|
||||||||
|
Net income/(loss)
|
$
|
(302
|
)
|
$
|
(2,773
|
)
|
$
|
—
|
|
$
|
—
|
|
$
|
13,025
|
|
$
|
9,884
|
|
||
|
Average common equity
|
$
|
71,016
|
|
$
|
72,366
|
|
$
|
—
|
|
$
|
—
|
|
$
|
196,016
|
|
$
|
179,366
|
|
||
|
Total assets
|
806,044
|
|
663,681
|
|
NA
|
|
NA
|
|
2,439,494
|
|
2,290,146
|
|
||||||||
|
Return on average common equity
|
NM
|
|
NM
|
|
NM
|
|
NM
|
|
13
|
%
|
11
|
%
|
||||||||
|
Overhead ratio
|
NM
|
|
NM
|
|
NM
|
|
NM
|
|
62
|
|
69
|
|
||||||||
|
(a)
|
Managed basis starts with the reported U.S. GAAP results and includes certain reclassifications as discussed below that do not have any impact on net income as reported by the lines of business or by the Firm as a whole.
|
|
(b)
|
For the 2012 periods, certain income statement and balance sheet line items were revised to reflect the transfer of certain functions and staff from Corporate/Private Equity to CCB, effective January 1, 2013.
|
|
(c)
|
Segment managed results reflect revenue on a FTE basis with the corresponding income tax impact recorded within income tax expense/(benefit). These FTE adjustments are eliminated in reconciling items to arrive at the Firm’s reported U.S. GAAP results.
|
208

Report of Independent Registered Public Accounting Firm
To the Board of Directors and Stockholders of
JPMorgan Chase & Co.:
We have reviewed the accompanying consolidated balance sheet of JPMorgan Chase & Co. and its subsidiaries (the “Firm”) as of
June 30, 2013
, and the related consolidated statements of income and comprehensive income, for the three-month and six-month periods ended
June 30, 2013
and
June 30, 2012
, and the consolidated statements of changes in stockholders’ equity and cash flows for the six-month periods ended
June 30, 2013
and
June 30, 2012
, included in the Firm’s Quarterly Report on Form 10-Q for the period ended
June 30, 2013
. These interim financial statements are the responsibility of the Firm’s management.
We conducted our review in accordance with the standards of the Public Company Accounting Oversight Board (United States). A review of interim financial information consists principally of applying analytical procedures and making inquiries of persons responsible for financial and accounting matters. It is substantially less in scope than an audit conducted in accordance with the standards of the Public Company Accounting Oversight Board (United States), the objective of which is the expression of an opinion regarding the financial statements taken as a whole. Accordingly, we do not express such an opinion.
Based on our review, we are not aware of any material modifications that should be made to the accompanying consolidated interim financial statements for them to be in conformity with accounting principles generally accepted in the United States of America.
We previously audited, in accordance with the standards of the Public Company Accounting Oversight Board (United States), the consolidated balance sheet as of December 31, 2012, and the related consolidated statements of income, comprehensive income, changes in stockholders’ equity, and cash flows for the year then ended (not presented herein), and in our report dated February 28, 2013, we expressed an unqualified opinion on those consolidated financial statements. In our opinion, the information set forth in the consolidated balance sheet information as of December 31, 2012, is fairly stated in all material respects in relation to the consolidated balance sheet from which it has been derived.

August 7, 2013
PricewaterhouseCoopers LLP, 300 Madison Avenue, New York, NY 10017
209
JPMorgan Chase & Co.
Consolidated average balance sheets, interest and rates
(Taxable-equivalent interest and rates; in millions, except rates)
|
Three months ended June 30, 2013
|
Three months ended June 30, 2012
|
||||||||||||||||||||
|
Average
balance
|
Interest
(e)
|
Rate
(annualized)
|
Average
balance
|
Interest
(e)
|
Rate
(annualized)
|
||||||||||||||||
|
Assets
|
|||||||||||||||||||||
|
Deposits with banks
|
$
|
265,821
|
|
$
|
222
|
|
0.34
|
%
|
$
|
111,441
|
|
$
|
136
|
|
0.49
|
%
|
|||||
|
Federal funds sold and securities purchased under resale agreements
|
231,972
|
|
490
|
|
0.85
|
|
242,184
|
|
646
|
|
1.07
|
|
|||||||||
|
Securities borrowed
(a)
|
115,194
|
|
(30
|
)
|
(0.11
|
)
|
129,390
|
|
(12
|
)
|
(0.04
|
)
|
|||||||||
|
Trading assets – debt instruments
|
240,952
|
|
2,218
|
|
3.69
|
|
235,990
|
|
2,324
|
|
3.96
|
|
|||||||||
|
Securities
|
359,108
|
|
1,882
|
|
2.10
|
|
(f)
|
366,130
|
|
2,201
|
|
2.42
|
|
(f)
|
|||||||
|
Loans
|
727,499
|
|
8,381
|
|
4.62
|
|
725,252
|
|
8,938
|
|
4.96
|
|
|||||||||
|
Other assets
(b)(c)
|
39,920
|
|
147
|
|
1.48
|
|
33,240
|
|
61
|
|
0.74
|
|
|||||||||
|
Total interest-earning assets
|
1,980,466
|
|
13,310
|
|
2.70
|
|
1,843,627
|
|
14,294
|
|
3.12
|
|
|||||||||
|
Allowance for loan losses
|
(20,775
|
)
|
(25,804
|
)
|
|||||||||||||||||
|
Cash and due from banks
|
39,700
|
|
45,529
|
|
|||||||||||||||||
|
Trading assets – equity instruments
|
116,333
|
|
110,718
|
|
|||||||||||||||||
|
Trading assets – derivative receivables
|
75,310
|
|
89,345
|
|
|||||||||||||||||
|
Goodwill
|
48,078
|
|
48,157
|
|
|||||||||||||||||
|
Other intangible assets:
|
|||||||||||||||||||||
|
Mortgage servicing rights
|
8,229
|
|
7,196
|
|
|||||||||||||||||
|
Purchased credit card relationships
|
239
|
|
499
|
|
|||||||||||||||||
|
Other intangibles
|
1,787
|
|
2,424
|
|
|||||||||||||||||
|
Other assets
|
150,603
|
|
144,605
|
|
|||||||||||||||||
|
Total assets
|
$
|
2,399,970
|
|
$
|
2,266,296
|
|
|||||||||||||||
|
Liabilities
|
|||||||||||||||||||||
|
Interest-bearing deposits
|
$
|
810,096
|
|
$
|
539
|
|
0.27
|
%
|
$
|
744,103
|
|
$
|
737
|
|
0.40
|
%
|
|||||
|
Federal funds purchased and securities loaned or sold under repurchase agreements
|
264,240
|
|
159
|
|
0.24
|
|
249,186
|
|
160
|
|
0.26
|
|
|||||||||
|
Commercial paper
|
54,391
|
|
29
|
|
0.21
|
|
48,791
|
|
21
|
|
0.18
|
|
|||||||||
|
Trading liabilities – debt, short-term and other liabilities
(d)
|
201,668
|
|
327
|
|
0.65
|
|
203,348
|
|
332
|
|
0.66
|
|
|||||||||
|
Beneficial interests issued by consolidated VIEs
|
56,742
|
|
126
|
|
0.89
|
|
60,046
|
|
165
|
|
1.10
|
|
|||||||||
|
Long-term debt
|
270,796
|
|
1,261
|
|
1.87
|
|
250,494
|
|
1,538
|
|
2.47
|
|
|||||||||
|
Total interest-bearing liabilities
|
1,657,933
|
|
2,441
|
|
0.59
|
|
1,555,968
|
|
2,953
|
|
0.76
|
|
|||||||||
|
Noninterest-bearing deposits
|
363,537
|
|
349,143
|
|
|||||||||||||||||
|
Trading liabilities – equity instruments
|
13,737
|
|
12,096
|
|
|||||||||||||||||
|
Trading liabilities – derivative payables
|
66,246
|
|
78,704
|
|
|||||||||||||||||
|
All other liabilities, including the allowance for lending-related commitments
|
90,139
|
|
81,564
|
|
|||||||||||||||||
|
Total liabilities
|
2,191,592
|
|
2,077,475
|
|
|||||||||||||||||
|
Stockholders’ equity
|
|||||||||||||||||||||
|
Preferred stock
|
11,095
|
|
7,800
|
|
|||||||||||||||||
|
Common stockholders’ equity
|
197,283
|
|
181,021
|
|
|||||||||||||||||
|
Total stockholders’ equity
|
208,378
|
|
188,821
|
|
|||||||||||||||||
|
Total liabilities and stockholders’ equity
|
$
|
2,399,970
|
|
$
|
2,266,296
|
|
|||||||||||||||
|
Interest rate spread
|
2.11
|
%
|
2.36
|
%
|
|||||||||||||||||
|
Net interest income and net yield on interest-earning assets
|
$
|
10,869
|
|
2.20
|
%
|
$
|
11,341
|
|
2.47
|
%
|
|||||||||||
|
(a)
|
Negative interest income and yield is a result of increased client-driven demand for certain securities combined with the impact of low interest rates; the offset of this matched book activity is reflected as lower net interest expense reported within trading liabilities - debt, short-term and other liabilities.
|
|
(b)
|
Includes margin loans.
|
|
(c)
|
Effective April 1, 2013, the net results previously recorded in net interest income for the Firm’s hedges of investments in non-U.S. subsidiaries have been reclassified to other income. The effect of this reclassification on the total interest-earning assets rate and net yield on interest-earning assets is not material; and therefore, prior period amounts have not been revised.
|
|
(d)
|
Includes brokerage customer payables.
|
|
(e)
|
Interest includes the effect of related hedging derivatives. Taxable-equivalent amounts are used where applicable.
|
|
(f)
|
For the three months ended June 30, 2013 and 2012, the annualized rates for AFS securities, based on amortized cost, were
2.16%
and
2.47%
, respectively; this does not give effect to changes in fair value that are reflected in accumulated other comprehensive income/(loss).
|
210
JPMorgan Chase & Co.
Consolidated average balance sheets, interest and rates
(Taxable-equivalent interest and rates; in millions, except rates)
|
Six months ended June 30, 2013
|
Six months ended June 30, 2012
|
||||||||||||||||||||
|
Average
balance
|
Interest
(e)
|
Rate
(annualized)
|
Average
balance
|
Interest
(e)
|
Rate
(annualized)
|
||||||||||||||||
|
Assets
|
|||||||||||||||||||||
|
Deposits with banks
|
$
|
211,705
|
|
$
|
385
|
|
0.37
|
%
|
$
|
111,129
|
|
$
|
288
|
|
0.52
|
%
|
|||||
|
Federal funds sold and securities purchased under resale agreements
|
231,699
|
|
1,004
|
|
0.87
|
|
236,314
|
|
1,297
|
|
1.10
|
|
|||||||||
|
Securities borrowed
(a)
|
117,751
|
|
(36
|
)
|
(0.06
|
)
|
131,235
|
|
25
|
|
0.04
|
|
|||||||||
|
Trading assets – debt instruments
|
245,700
|
|
4,515
|
|
3.71
|
|
232,193
|
|
4,765
|
|
4.13
|
|
|||||||||
|
Securities
|
363,864
|
|
3,869
|
|
2.14
|
|
(f)
|
367,702
|
|
4,583
|
|
2.51
|
|
(f)
|
|||||||
|
Loans
|
726,318
|
|
16,935
|
|
4.70
|
|
720,403
|
|
18,077
|
|
5.05
|
|
|||||||||
|
Other assets
(b)(c)
|
41,471
|
|
227
|
|
1.10
|
|
33,594
|
|
131
|
|
0.78
|
|
|||||||||
|
Total interest-earning assets
|
1,938,508
|
|
26,899
|
|
2.80
|
|
1,832,570
|
|
29,166
|
|
3.20
|
|
|||||||||
|
Allowance for loan losses
|
(21,315
|
)
|
(26,689
|
)
|
|||||||||||||||||
|
Cash and due from banks
|
43,246
|
|
45,506
|
|
|||||||||||||||||
|
Trading assets – equity instruments
|
118,252
|
|
118,828
|
|
|||||||||||||||||
|
Trading assets – derivative receivables
|
75,115
|
|
89,896
|
|
|||||||||||||||||
|
Goodwill
|
48,123
|
|
48,188
|
|
|||||||||||||||||
|
Other intangible assets:
|
|||||||||||||||||||||
|
Mortgage servicing rights
|
8,188
|
|
7,214
|
|
|||||||||||||||||
|
Purchased credit card relationships
|
253
|
|
534
|
|
|||||||||||||||||
|
Other intangibles
|
1,840
|
|
2,495
|
|
|||||||||||||||||
|
Other assets
|
149,005
|
|
144,044
|
|
|||||||||||||||||
|
Total assets
|
$
|
2,361,215
|
|
$
|
2,262,586
|
|
|||||||||||||||
|
Liabilities
|
|||||||||||||||||||||
|
Interest-bearing deposits
|
$
|
799,045
|
|
$
|
1,084
|
|
0.27
|
%
|
$
|
751,593
|
|
$
|
1,459
|
|
0.39
|
%
|
|||||
|
Federal funds purchased and securities loaned or sold under repurchase agreements
|
257,571
|
|
326
|
|
0.25
|
|
241,301
|
|
248
|
|
0.21
|
|
|||||||||
|
Commercial paper
|
53,741
|
|
55
|
|
0.21
|
|
48,575
|
|
40
|
|
0.16
|
|
|||||||||
|
Trading liabilities – debt, short-term and other liabilities
(d)
|
193,293
|
|
654
|
|
0.68
|
|
201,467
|
|
634
|
|
0.63
|
|
|||||||||
|
Beneficial interests issued by consolidated VIEs
|
58,531
|
|
260
|
|
0.90
|
|
62,703
|
|
347
|
|
1.11
|
|
|||||||||
|
Long-term debt
|
262,606
|
|
2,556
|
|
1.96
|
|
252,871
|
|
3,260
|
|
2.59
|
|
|||||||||
|
Total interest-bearing liabilities
|
1,624,787
|
|
4,935
|
|
0.61
|
|
1,558,510
|
|
5,988
|
|
0.77
|
|
|||||||||
|
Noninterest-bearing deposits
|
359,746
|
|
344,271
|
|
|||||||||||||||||
|
Trading liabilities – equity instruments
|
13,471
|
|
13,078
|
|
|||||||||||||||||
|
Trading liabilities – derivative payables
|
67,458
|
|
77,387
|
|
|||||||||||||||||
|
All other liabilities, including the allowance for lending-related commitments
|
89,382
|
|
82,174
|
|
|||||||||||||||||
|
Total liabilities
|
2,154,844
|
|
2,075,420
|
|
|||||||||||||||||
|
Stockholders’ equity
|
|||||||||||||||||||||
|
Preferred stock
|
10,355
|
|
7,800
|
|
|||||||||||||||||
|
Common stockholders’ equity
|
196,016
|
|
179,366
|
|
|||||||||||||||||
|
Total stockholders’ equity
|
206,371
|
|
187,166
|
|
|||||||||||||||||
|
Total liabilities and stockholders’ equity
|
$
|
2,361,215
|
|
$
|
2,262,586
|
|
|||||||||||||||
|
Interest rate spread
|
2.19
|
%
|
2.43
|
%
|
|||||||||||||||||
|
Net interest income and net yield on interest-earning assets
|
$
|
21,964
|
|
2.28
|
%
|
$
|
23,178
|
|
2.54
|
%
|
|||||||||||
|
(a)
|
Negative interest income and yield for the six months ended June 30, 2013, is a result of increased client-driven demand for certain securities combined with the impact of low interest rates; the offset of this matched book activity is reflected as lower net interest expense reported within trading liabilities - debt, short-term and other liabilities.
|
|
(b)
|
Includes margin loans.
|
|
(c)
|
Effective April 1, 2013, the net results previously recorded in net interest income for the Firm’s hedges of investments in non-U.S. subsidiaries have been reclassified to other income. The effect of this reclassification on the total interest-earning assets rate and net yield on interest-earning assets is not material; and therefore, prior period amounts have not been revised.
|
|
(d)
|
Includes brokerage customer payables.
|
|
(e)
|
Interest includes the effect of related hedging derivatives. Taxable-equivalent amounts are used where applicable.
|
|
(f)
|
For the six months ended June 30, 2013 and 2012, the annualized rates for AFS securities, based on amortized cost, were
2.20%
and
2.56%
, respectively; this does not give effect to changes in fair value that are reflected in accumulated other comprehensive income/(loss).
|
211
|
GLOSSARY OF TERMS
|
||||
Allowance for loan losses to total loans:
Represents period-end allowance for loan losses divided by retained loans.
Beneficial interests issued by consolidated VIEs:
Represents the interest of third-party holders of debt, equity securities, or other obligations, issued by VIEs that JPMorgan Chase consolidates.
Benefit obligation:
Refers to the projected benefit obligation for pension plans and the accumulated postretirement benefit obligation for OPEB plans.
Contractual credit card charge-off:
In accordance with the Federal Financial Institutions Examination Council policy, nonmodified credit card loans are charged off by the end of the month in which the account becomes 180 days past due, while modified credit card loans are charged off when the account becomes 120 days past due. In addition, all credit card loans must be charged off within 60 days from receiving notification about certain specified events (e.g., bankruptcy of the borrower).
Credit derivatives:
Financial instruments whose value is derived from the credit risk associated with the debt of a third party issuer (the reference entity) which allow one party (the protection purchaser) to transfer that risk to another party (the protection seller). Upon the occurrence of a credit event, which may include, among other events, the bankruptcy or failure to pay by, or certain restructurings of the debt of the reference entity, neither party has recourse to the reference entity. The protection purchaser has recourse to the protection seller for the difference between the face value of the CDS contract and the fair value at the time of settling the credit derivative contract. The determination as to whether a credit event has occurred is generally made by the relevant International Swaps and Derivatives Association (“ISDA”) Determinations Committee.
Credit cycle:
A period of time over which credit quality improves, deteriorates and then improves again (or vice versa). The duration of a credit cycle can vary from a couple of years to several years.
CUSIP number:
A CUSIP (i.e., Committee on Uniform Securities Identification Procedures) number consists of nine characters (including letters and numbers) that uniquely identify a company or issuer and the type of security and is assigned by the American Bankers Association and operated by Standard & Poor’s. This system facilitates the clearing and settlement process of securities. A similar system is used to identify non- U.S. securities (CUSIP International Numbering System).
Exchange traded derivatives:
Derivative contracts that are executed on an exchange and settled via a central clearing house.
FICO score:
A measure of consumer credit risk provided by credit bureaus, typically produced from statistical models
by Fair Isaac Corporation utilizing data collected by the credit bureaus.
Forward points:
Represents the interest rate differential between two currencies, which is either added to or subtracted from the current exchange rate (i.e., “spot rate”) to determine the forward exchange rate.
Group of Seven (“G7”) nations:
Countries in the G7 are Canada, France, Germany, Italy, Japan, the United Kingdom and the United States.
G7 government bonds:
Bonds issued by the government of one of countries in the G7 nations.
Headcount-related expense:
Includes salary and benefits (excluding performance-based incentives), and other noncompensation costs related to employees.
Home equity - senior lien:
Represents loans and commitments where JP Morgan Chase holds the first security interest on the property.
Home equity - junior lien:
Represents loans and commitments where JP Morgan Chase holds a security interest that is subordinate in rank to other liens.
Interchange income:
A fee paid to a credit card issuer in the clearing and settlement of a sales or cash advance transaction.
Investment-grade:
An indication of credit quality based on JPMorgan Chase’s internal risk assessment system. “Investment grade” generally represents a risk profile similar to a rating of a “BBB-”/“Baa3” or better, as defined by S&P and Moody’s.
LLC:
Limited Liability Company.
Loan-to-value (“LTV”) ratio:
For residential real estate loans, the relationship, expressed as a percentage, between the principal amount of a loan and the appraised value of the collateral (i.e., residential real estate) securing the loan.
Origination date LTV ratio
The LTV ratio at the origination date of the loan. Origination date LTV ratios are calculated based on the actual appraised values of collateral (i.e., loan-level data) at the origination date.
Current estimated LTV ratio
An estimate of the LTV as of a certain date. The current estimated LTV ratios are calculated using estimated collateral values derived from a nationally recognized home price index measured at the metropolitan statistical area (“MSA”) level. These MSA-level home price indices comprise actual data to the extent available and forecasted data where actual data is not available. As a result, the estimated collateral values used to calculate these ratios do not represent actual appraised loan-level collateral values; as such, the resulting LTV ratios are necessarily imprecise and should therefore be viewed as estimates.
212
Combined LTV ratio
The LTV ratio considering all lien positions related to the property. Combined LTV ratios are used for junior lien home equity products.
Managed basis:
A non-GAAP presentation of financial results that includes reclassifications to present revenue on a fully taxable-equivalent basis. Management uses this non- GAAP financial measure at the segment level, because it believes this provides information to enable investors to understand the underlying operational performance and trends of the particular business segment and facilitates a comparison of the business segment with the performance of competitors.
Master netting agreement:
An agreement between two counterparties who have multiple contracts with each other that provides for the net settlement of all contracts, as well as cash collateral, through a single payment, in a single currency, in the event of default on or termination of any one contract.
Mortgage product types:
Alt-A
Alt-A loans are generally higher in credit quality than subprime loans but have characteristics that would disqualify the borrower from a traditional prime loan. Alt-A lending characteristics may include one or more of the following: (i) limited documentation; (ii) a high combined loan-to-value (“CLTV”) ratio; (iii) loans secured by non-owner occupied properties; or (iv) a debt-to-income ratio above normal limits. A substantial proportion of the Firm’s Alt-A loans are those where a borrower does not provide complete documentation of his or her assets or the amount or source of his or her income.
Option ARMs
The option ARM real estate loan product is an adjustable-rate mortgage loan that provides the borrower with the option each month to make a fully amortizing, interest-only or minimum payment. The minimum payment on an option ARM loan is based on the interest rate charged during the introductory period. This introductory rate is usually significantly below the fully indexed rate. The fully indexed rate is calculated using an index rate plus a margin. Once the introductory period ends, the contractual interest rate charged on the loan increases to the fully indexed rate and adjusts monthly to reflect movements in the index. The minimum payment is typically insufficient to cover interest accrued in the prior month, and any unpaid interest is deferred and added to the principal balance of the loan. Option ARM loans are subject to payment recast, which converts the loan to a variable-rate fully amortizing loan upon meeting specified loan balance and anniversary date triggers.
Prime
Prime mortgage loans are made to borrowers with good credit records and a monthly income at least three to four times greater than their monthly housing expense (mortgage payments plus taxes and other debt payments).
These borrowers provide full documentation and generally have reliable payment histories.
Subprime
Subprime loans are loans to customers with one or more high risk characteristics, including but not limited to: (i) unreliable or poor payment histories; (ii) a high LTV ratio of greater than 80% (without borrower-paid mortgage insurance); (iii) a high debt-to-income ratio; (iv) an occupancy type for the loan is other than the borrower’s primary residence; or (v) a history of delinquencies or late payments on the loan.
NA:
Data is not applicable or available for the period
presented.
Net charge-off rate:
Represents net charge-offs (annualized) divided by average retained loans for the reporting period.
Net yield on interest-earning assets:
The average rate for interest-earning assets less the average rate paid for all sources of funds.
NM:
Not meaningful.
Over the counter derivatives (“OTC”):
Derivative contracts that are negotiated, executed and settled bilaterally between two derivative counterparties, where one or both counterparties is a derivatives dealer.
Over the counter cleared derivatives (“OTC cleared”):
Derivative contracts that are negotiated and executed bilaterally, but subsequently settled via a central clearing house, such that each derivative counterparty is only exposed to the default of that clearing house.
Overhead ratio:
Noninterest expense as a percentage of total net revenue.
Participating securities:
Represents unvested stock-based compensation awards containing nonforfeitable rights to dividends or dividend equivalents (collectively, “dividends”), which are included in the earnings per share calculation using the two-class method. JPMorgan Chase grants restricted stock and RSUs to certain employees under its stock-based compensation programs, which entitle the recipients to receive nonforfeitable dividends during the vesting period on a basis equivalent to the dividends paid to holders of common stock. These unvested awards meet the definition of participating securities. Under the two-class method, all earnings (distributed and undistributed) are allocated to each class of common stock and participating securities, based on their respective rights to receive dividends.
Portfolio activity:
Describes changes to the risk profile of existing lending-related exposures and their impact on the allowance for credit losses from changes in customer profiles and inputs used to estimate the allowances.
Pre-provision profit:
Represents total net revenue less noninterest expense. The Firm believes that this financial measure is useful in assessing the ability of a lending institution to generate income in excess of its provision for credit losses.
213
Principal transactions revenue:
Principal transactions revenue includes realized and unrealized gains and losses recorded on derivatives, other financial instruments, private equity investments, and physical commodities used in market making and client-driven activities. In addition, Principal transactions revenue also includes certain realized and unrealized gains and losses related to hedge accounting and specified risk management activities including: (a) certain derivatives designated in qualifying hedge accounting relationships (primarily fair value hedges of commodity and foreign exchange risk), (b) certain derivatives used for specified risk management purposes, primarily to mitigate credit risk, foreign exchange risk and commodity risk, and (c) other derivatives, including the synthetic credit portfolio.
Purchased credit-impaired (“PCI”) loans:
Represents loans that were acquired in the Washington Mutual transaction and deemed to be credit-impaired on the acquisition date in accordance with U.S. GAAP. The guidance allows purchasers to aggregate credit-impaired loans acquired in the same fiscal quarter into one or more pools, provided that the loans have common risk characteristics (e.g., product type, LTV ratios, FICO scores, past due status, geographic location). A pool is then accounted for as a single asset with a single composite interest rate and an aggregate expectation of cash flows.
Real assets:
Real assets include investments in productive assets such as agriculture, energy rights, mining and timber properties and exclude raw land to be developed for real estate purposes.
Receivables from customers:
Primarily represents margin loans to prime and retail brokerage customers which are included in accrued interest and accounts receivable on the Consolidated Balance Sheets for the wholesale lines of business.
Reported basis:
Financial statements prepared under U.S. GAAP, which excludes the impact of taxable-equivalent adjustments.
Retained loans:
Loans that are held-for-investment (i.e. excludes loans held-for-sale and loans at fair value).
Risk-weighted assets (“RWA”):
Risk-weighted assets consist of on- and off-balance sheet assets that are assigned to one of several broad risk categories and weighted by factors representing their risk and potential for default. On-balance sheet assets are risk-weighted based on the perceived credit risk associated with the obligor or counterparty, the nature of any collateral, and the guarantor, if any. Off-balance sheet assets such as lending-related commitments, guarantees, derivatives and other applicable off-balance sheet positions are risk-weighted by multiplying the contractual amount by the appropriate credit conversion factor to determine the on-balance sheet credit equivalent amount, which is then risk-weighted based on the same factors used for on-balance sheet assets. Risk-weighted assets also incorporate a measure for market risk related to applicable trading assets-debt and equity instruments, and foreign exchange and commodity derivatives. The resulting
risk-weighted values for each of the risk categories are then aggregated to determine total risk-weighted assets.
Short sale:
A short sale is a sale of real estate in which proceeds from selling the underlying property are less than the amount owed the Firm under the terms of the related mortgage and the related lien is released upon receipt of such proceeds.
Taxable-equivalent basis:
In presenting managed results, the total net revenue for each of the business segments and the Firm is presented on a tax-equivalent basis. Accordingly, revenue from investments that receive tax credits and tax-exempt securities is presented in the managed results on a basis comparable to taxable investments and securities; the corresponding income tax impact related to tax-exempt items is recorded within income tax expense.
Trade-date and settlement-date:
For financial instruments, the date that an order to purchase, sell or otherwise acquire an instrument is executed in the market. The trade-date may differ from the settlement-date, which is the date on which the actual transfer of a financial instrument between two parties is executed. The amount of time that passes between the trade-date and the settlement-date differs depending on the financial instrument. For repurchases under the common equity repurchase program, except where the trade-date is specified, the amounts disclosed are presented on a settlement-date basis. In the Capital Management section on pages
60–64
, of
this Form 10-Q
, and where otherwise specified, repurchases under the common equity repurchase program are presented on a trade-date
basis
because the trade-date is used to calculate the Firm’s regulatory capital.
Troubled debt restructuring (“TDR”)
: A TDR is deemed to occur when the Firm modifies the original terms of a loan agreement by granting a concession to a borrower that is experiencing financial difficulty.
Unaudited:
Financial statements and information that have not been subjected to auditing procedures sufficient to permit an independent certified public accountant to express an opinion.
U.S. GAAP:
Accounting principles generally accepted in the
United States of America.
U.S. government-sponsored enterprise obligations:
Obligations of agencies originally established or chartered by the U.S. government to serve public purposes as specified by the U.S. Congress; these obligations are not explicitly guaranteed as to the timely payment of principal and interest by the full faith and credit of the U.S. government.
U.S. Treasury:
U.S. Department of the Treasury.
Value-at-risk (“VaR”):
A measure of the dollar amount of potential loss from adverse market moves in an ordinary market environment.
Washington Mutual transaction:
On September 25, 2008, JPMorgan Chase acquired certain of the assets of the banking operations of Washington Mutual Bank (“Washington Mutual”) from the FDIC.
214
|
LINE OF BUSINESS METRICS
|
||||
CONSUMER & COMMUNITY BANKING (“CCB”)
Active online customers
- Users of all internet browsers and mobile platforms who have been active in the past 90 days.
Active mobile customers
- Users of all mobile platforms, which include: SMS, mobile smartphone and tablet, who have been active in the past 90 days.
Consumer & Business Banking (“CBB”)
Description of selected business metrics within CBB:
Client investment managed accounts
- Assets actively managed by Chase Wealth Management on behalf of clients. The percentage of managed accounts is calculated by dividing managed account assets by total client investment assets.
Client advisors
- Investment product specialists, including private client advisors, financial advisors, financial advisor associates, senior financial advisors, independent financial advisors and financial advisor associate trainees, who advise clients on investment options, including annuities, mutual funds, stock trading services, etc., sold by the Firm or by third-party vendors through retail branches, Chase Private Client locations and other channels.
Personal bankers
- Retail branch office personnel who acquire, retain and expand new and existing customer relationships by assessing customer needs and recommending and selling appropriate banking products and services.
Sales specialists
- Retail branch office and field personnel, including relationship managers and loan officers, who specialize in marketing and sales of various business banking products (i.e., business loans, letters of credit, deposit accounts, Chase Paymentech, etc.) and mortgage products to existing and new clients.
Deposit margin/deposit spread
- Represents net interest income expressed as a percentage of average deposits.
Chase Liquid
SM
cards
- Refers to a prepaid, reloadable card product.
Mortgage Banking
Mortgage Production and Mortgage Servicing revenue comprises the following:
Net production revenue
includes net gains or losses on originations and sales of prime and subprime mortgage loans, other production-related fees and losses related to the repurchase of previously-sold loans.
Net mortgage servicing revenue
includes the following components
:
a) Operating revenue predominantly represents the return on Mortgage Servicing’s MSR asset and includes:
|
•
|
Actual gross income earned from servicing third-party mortgage loans, such as contractually specified servicing fees and ancillary income; and
|
|
•
|
The change in the fair value of the MSR asset due to the collection or realization of expected cash flows.
|
b) Risk management represents the components of Mortgage Servicing’s MSR asset that are subject to ongoing risk management activities, together with derivatives and other instruments used in those risk management activities.
Mortgage origination channels comprise the following:
Retail
- Borrowers who buy or refinance a home through direct contact with a mortgage banker employed by the Firm using a branch office, the Internet or by phone. Borrowers are frequently referred to a mortgage banker by a banker in a Chase branch, real estate brokers, home builders or other third parties.
Wholesale
- Third-party mortgage brokers refer loan application packages to the Firm. The Firm then underwrites and funds the loan. Brokers are independent loan originators that specialize in counseling applicants on available home financing options, but do not provide funding for loans. Chase materially eliminated broker-originated loans in 2008, with the exception of a small number of loans guaranteed by the U.S. Department of Agriculture under its Section 502 Guaranteed Loan program that serves low-and-moderate income families in small rural communities.
Correspondent
- Banks, thrifts, other mortgage banks and other financial institutions that sell closed loans to the Firm.
Card, Merchant Services & Auto (“Card”)
Description of selected business metrics within Card:
Card Services
includes the Credit Card and Merchant Services businesses.
Merchant Services
is a business that primarily processes transactions for merchants.
Total transactions
- Number of transactions and authorizations processed for merchants.
Commercial Card
provides a wide range of payment services to corporate and public sector clients worldwide through the commercial card products. Services include procurement, corporate travel and entertainment, expense management services, and business-to-business payment solutions.
Sales volume
- Dollar amount of cardmember purchases, net of returns.
Open accounts
- Cardmember accounts with charging privileges.
Auto origination volume
- Dollar amount of auto loans and leases originated.
215
CORPORATE & INVESTMENT BANK (“CIB”)
Definition of selected CIB revenue:
Investment banking fees
include advisory, equity underwriting, bond underwriting and loan syndication fees.
Treasury Services
includes both transaction services and trade finance. Transaction services offers a broad range of products and services that enable clients to manage payments and receipts, as well as invest and manage funds. Products include U.S. dollar and multi-currency clearing, ACH, lockbox, disbursement and reconciliation services, check deposits, and currency-related services. Trade finance enables the management of cross-border trade for bank and corporate clients. Products include loans tied directly to goods crossing borders, export/import loans, commercial letters of credit, standby letters of credit, and supply chain finance.
Lending
includes net interest income, fees, gains or losses on loan sale activity, gains or losses on securities received as part of a loan restructuring, and the risk management results related to the credit portfolio (excluding trade finance).
Fixed Income Markets
primarily include revenue related to market-making across global fixed income markets, including foreign exchange, interest rate, credit and commodities markets. The results of the synthetic credit portfolio that was transferred from the Chief Investment Office effective July 2, 2012 are reported in this caption.
Equity Markets
primarily include revenue related to market-making across global equity products, including cash instruments, derivatives, convertibles and Prime Services.
Securities Services
includes primarily custody, fund accounting and administration, and securities lending products sold principally to asset managers, insurance companies and public and private investment funds. Also includes clearance, collateral management & depositary receipts business which provides broker-dealer clearing and custody services, including tri-party repo transactions, collateral management products, and depositary bank services for American and global depositary receipt programs.
Credit Adjustments & Other
primarily includes credit portfolio credit valuation adjustments (“CVA”) net of associated hedging activities; debit valuation adjustments (“DVA”) on structured notes and derivative liabilities; and nonperforming derivative receivable results.
Description
of certain business metrics:
Client deposits & other third-party liability balances
pertain to the Treasury Services and Securities Services businesses, and include deposits, as well as deposits that are swept to on-balance sheet liabilities (e.g., commercial paper, federal funds purchased and securities loaned or sold under repurchase agreements) as part of the Firm’s client cash management program.
Assets under custody (“AUC”)
represents activities associated with the safekeeping and servicing of assets on which Securities Services earns fees.
COMMERCIAL BANKING (“CB”)
CB Client Segments
:
Middle Market Banking
covers corporate, municipal, financial institution and nonprofit clients, with annual revenue generally ranging between $20 million and $500 million.
Corporate Client Banking
covers clients with annual revenue generally ranging between $500 million and $2 billion and focuses on clients that have broader investment banking needs.
Commercial Term Lending
primarily provides term financing to real estate investors/owners for multifamily properties as well as financing office, retail and industrial
properties.
Real Estate Banking
provides full-service banking to investors and developers of institutional-grade real estate properties.
Other
primarily includes lending and investment activity within the Community Development Banking and Chase Capital businesses.
CB Revenue:
Lending
includes a variety of financing alternatives, which are primarily provided on a basis secured by receivables, inventory, equipment, real estate or other assets. Products include term loans, revolving lines of credit, bridge financing, asset-based structures, leases, commercial card products and standby letters of credit.
Treasury services
includes revenue from a broad range of products and services (as defined by Treasury Services revenue in the CIB description of revenue) that enable CB clients to manage payments and receipts, as well as invest and manage funds.
Investment banking
includes revenue from a range of products providing CB clients with sophisticated capital-raising alternatives, as well as balance sheet and risk management tools through advisory, equity and bond underwriting, and loan syndications. Revenue from Fixed income and Equity market products (as defined by Fixed Income Markets and Equity Markets revenue in the CIB description of revenue) available to CB clients is also included. Investment banking revenue, gross, represents total revenue related to investment banking products sold to CB clients.
Other
product revenue primarily includes tax-equivalent adjustments generated from Community Development Banking activity and certain income derived from principal transactions.
216
Description of selected business metrics within CB:
Client deposits and other third-party liability balances
include deposits, as well as deposits that are swept to on-balance sheet liabilities (e.g., commercial paper, federal funds purchased and securities loaned or sold under repurchase agreements) as part of the Firm’s client cash management program.
ASSET MANAGEMENT (“AM”)
Assets under management
- Represent assets actively managed by AM on behalf of its Private Banking, Institutional and Retail clients. Includes “committed capital not called,” on which AM earns fees.
Client assets
- Represent assets under management, as well as custody, brokerage, administration and deposit accounts.
Multi-asset
- Any fund or account that allocates assets under management to more than one asset class (e.g., long-term fixed income, equity, cash, real assets, private equity or hedge funds).
Alternative assets
- The following types of assets constitute alternative investments - hedge funds, currency, real estate and private equity.
AM’s client segments comprise the following:
Private Banking
offers investment advice and wealth management services to high- and ultra-high-net-worth individuals, families, money managers, business owners and small corporations worldwide, including investment management, capital markets and risk management, tax and estate planning, banking, capital raising and specialty-wealth advisory services.
Institutional
brings comprehensive global investment services – including asset management, pension analytics, asset-liability management and active risk-budgeting strategies – to corporate and public institutions, endowments, foundations, nonprofit organizations and governments worldwide.
Retail
provides worldwide investment management services and retirement planning and administration, through financial intermediaries and direct distribution of a full range of investment products.
Pretax margin:
Represents income before income tax expense divided by total net revenue, which is, in management’s view, a comprehensive measure of pretax performance derived by measuring earnings after all costs are taken into consideration. It is, therefore, another basis that management uses to evaluate the performance of AM against the performance of their respective competitors.
For a discussion of the quantitative and qualitative disclosures about market risk, see the Market Risk Management section of Management’s discussion and analysis on pages
95–99
of
this Form 10-Q
and pages 163–169 of
JPMorgan Chase
’s
2012
Annual Report
.
As of the end of the period covered by this report, an evaluation was carried out under the supervision and with the participation of the Firm’s management, including its Chairman and Chief Executive Officer and its Chief Financial Officer, of the effectiveness of its disclosure controls and procedures (as defined in Rule 13a-15(e) under the Securities Exchange Act of 1934). Based on that evaluation, the Chairman and Chief Executive Officer and the Chief Financial Officer concluded that these disclosure controls and procedures were effective. See Exhibits 31.1 and 31.2 for the Certification statements issued by the Chairman and Chief Executive Officer and Chief Financial Officer.
The Firm is committed to maintaining high standards of internal control over financial reporting. Nevertheless, because of its inherent limitations, internal control over financial reporting may not prevent or detect misstatements. In addition, in a firm as large and complex as
JPMorgan Chase
, lapses or deficiencies in internal controls may occur from time to time, and there can be no assurance that any such deficiencies will not result in significant deficiencies or material weaknesses in internal controls in the future. For further information, see “Management’s report on internal control over financial reporting” on page 186 of
JPMorgan Chase
’s
2012
Annual Report
. There was no change in the Firm’s internal control over financial reporting (as defined in Rule 13a-15(f) under the Securities Exchange Act of 1934) that occurred during the
three months ended
June 30, 2013
, that has materially affected, or is reasonably likely to materially affect, the Firm’s internal control over financial reporting.
217
For information that updates the disclosures set forth under Part I, Item 3: Legal Proceedings, in the Firm’s
2012
Annual Report on Form 10-K
, see the discussion of the Firm’s material litigation in Note 23 on pages
198–206
of
this Form 10-Q
.
For a discussion of certain risk factors affecting the Firm,
see Part I, Item 1A: Risk Factors on pages 8–21 of
JPMorgan Chase
’s
Annual Report on Form 10-K
for the year ended
December 31, 2012
; and Forward-Looking Statements on page
107
of
this Form 10-Q
.
During the
three months ended
June 30, 2013
, there were no shares of common stock of
JPMorgan Chase & Co.
issued in transactions exempt from registration under the Securities Act of 1933, pursuant to Section 4(2) thereof.
Repurchases under the common equity repurchase program
On
March 13, 2012
, the Board of Directors authorized a
$15.0 billion
common equity (i.e., common stock and warrants) repurchase program. The Firm repurchased (on a trade-date basis) shares of common stock of
24 million
for
$1.2 billion
, and
27 million
for
$1.1 billion
, during the
three months ended
June 30, 2013
and
2012
, and
78 million
for
$3.8 billion
, and
31 million
for
$1.3 billion
, during the
six months ended
June 30, 2013
and
2012
, respectively. The Firm did not repurchase any warrants during the
six months ended
June 30, 2013
. The Firm repurchased
18 million
warrants for
$238 million
during both the
three and six months ended
June 30, 2012
. As of
June 30, 2013
,
$9.6 billion
(on a trade-date basis) of authorized repurchase capacity remained under the program.
Pursuant to CCAR, the Firm is authorized to repurchase up to
$6 billion
of common equity between April 1, 2013 and March 31, 2014. Such repurchases are being done pursuant to the
$15.0 billion
common equity repurchase program.
The Firm may, from time to time, enter into written trading plans under Rule 10b5-1 of the Securities Exchange Act of 1934 to facilitate repurchases in accordance with the repurchase program. A Rule 10b5-1 repurchase plan allows the Firm to repurchase its equity during periods when it would not otherwise be repurchasing common equity — for example, during internal trading “black-out periods.” All purchases under a Rule 10b5-1 plan must be made according to a predefined plan established when the Firm is not aware of material nonpublic information.
The authorization to repurchase common equity will be utilized at management’s discretion, and the timing of purchases and the exact amount of common equity that may be repurchased is subject to various factors, including market conditions; legal and regulatory considerations affecting the amount and timing of repurchase activity; the Firm’s capital position (taking into account goodwill and intangibles); internal capital generation; and alternative investment opportunities. The repurchase program does not include specific price targets or timetables; may be executed through open market purchases or privately negotiated transactions, or utilizing Rule 10b5-1 programs; and may be suspended at any time.
Shares repurchased, on a settlement-date basis, pursuant to the common equity repurchase program during the
six months ended
June 30, 2013
, were as follows.
|
Common stock
|
||||||||||||||||
|
Six months ended June 30, 2013
|
Total shares of common stock repurchased
|
Average price paid per share of common stock
(a)
|
Aggregate repurchases of common equity (in millions)
(a)
|
Dollar value
of remaining
authorized
repurchase
(in millions)
(b)
|
||||||||||||
|
First quarter
|
53,536,385
|
|
$
|
48.16
|
|
$
|
2,578
|
|
$
|
10,854
|
|
|||||
|
April
|
11,211,738
|
|
47.91
|
|
537
|
|
10,317
|
|
||||||||
|
May
|
4,719,606
|
|
49.37
|
|
233
|
|
10,084
|
|
||||||||
|
June
|
7,502,121
|
|
53.55
|
|
402
|
|
9,683
|
|
||||||||
|
Second quarter
|
23,433,465
|
|
50.01
|
|
1,172
|
|
9,683
|
|
||||||||
|
Year-to-date
|
76,969,850
|
|
$
|
48.72
|
|
$
|
3,750
|
|
$
|
9,683
|
|
|||||
|
(a)
|
Excludes commissions cost.
|
|
(b)
|
The amount authorized by the Board of Directors excludes commissions cost.
|
218
Repurchases under the stock-based incentive plans
Participants in the Firm’s stock-based incentive plans may have shares of common stock withheld to cover income taxes. Shares withheld to pay income taxes are repurchased pursuant to the terms of the applicable plan and not under the Firm’s repurchase program. Shares repurchased pursuant to these plans during the
six months ended
June 30, 2013
, were as follows.
|
Six months ended
June 30, 2013 |
Total shares of common stock
repurchased
|
|
Average price
paid per share of common stock
|
|
||
|
First quarter
|
—
|
|
$
|
—
|
|
|
|
April
|
402
|
|
47.61
|
|
||
|
May
|
—
|
|
—
|
|
||
|
June
|
387
|
|
52.73
|
|
||
|
Second quarter
|
789
|
|
50.12
|
|
||
|
Year-to-date
|
789
|
|
$
|
50.12
|
|
|
None.
Not applicable.
|
Item 5
|
Other Information
|
Pursuant to Section 219 of the Iran Threat Reduction and Syria Human Rights Act of 2012, which added Section 13(r) to the Securities Exchange Act of 1934, as amended (the “Exchange Act”), an issuer is required to disclose in its annual or quarterly reports, as applicable, whether it or any of its affiliates knowingly engaged in certain activities, transactions or dealings relating to Iran or with individuals or entities designated pursuant to certain Executive Orders. Disclosure is generally required even where the activities, transactions or dealings were conducted in compliance with applicable law.
Carlson Wagonlit Travel (“CWT”), a business travel management firm in which JPMorgan Chase has invested through its merchant banking activities, may be deemed to be an affiliate of the Firm, as that term is defined in Exchange Act Rule 12b-2. CWT has informed the Firm that, during the
three months ended
June 30, 2013
, it booked approximately 7 flights (of the approximately 15 million transactions it booked during the period) to Iran on Iran
Air for passengers, including employees of foreign governments and non-governmental organizations. All of such flights originated outside of the United States from countries that permit travel to Iran, and none of such passengers were persons designated under Executive Orders 13224 or 13382 at the time of travel or were employees of foreign governments that are targets of
U.S. sanctions. CWT and the Firm believe that this activity
is permissible pursuant to certain exemptions from
U.S. sanctions for travel-related transactions under
the International Emergency Economic Powers Act, as amended. CWT had approximately $6,000 in gross revenues attributable to these transactions. CWT has informed the Firm that it intends to continue to engage
in this activity so long as such activity is permitted under U.S. law.
219
|
15
|
Letter re: Unaudited Interim Financial Information
(a)
|
|
31.1
|
Certification
(a)
|
|
31.2
|
Certification
(a)
|
|
32
|
Certification Pursuant to Section 906 of the Sarbanes-Oxley Act of 2002
(b)
|
|
101.INS XBRL
|
Instance Document
(a)(c)
|
|
101.SCH XBRL
|
Taxonomy Extension Schema Document
(a)
|
|
101.CAL XBRL
|
Taxonomy Extension Calculation Linkbase Document
(a)
|
|
101.LAB XBRL
|
Taxonomy Extension Label Linkbase Document
(a)
|
|
101.PRE XBRL
|
Taxonomy Extension Presentation Linkbase Document
(a)
|
|
101.DEF XBRL
|
Taxonomy Extension Definition Linkbase Document
(a)
|
|
(a)
|
Filed herewith.
|
|
(b)
|
Furnished herewith. This exhibit shall not be deemed “filed” for purposes of Section 18 of the Securities Exchange Act of 1934, or otherwise subject to the liability of that Section. Such exhibit shall not be deemed incorporated into any filing under the Securities Act of 1933 or the Securities Exchange Act of 1934.
|
|
(c)
|
Pursuant to Rule 405 of Regulation S-T, includes the following financial information included in the Firm’s
Quarterly Report on Form 10-Q
for the
quarter ended
June 30, 2013
, formatted in XBRL (eXtensible Business Reporting Language) interactive data files: (i) the Consolidated statements of income (unaudited) for the
three and six months ended
June 30, 2013
and
2012
, (ii) the Consolidated statements of comprehensive income (unaudited) for the
three and six months ended
June 30, 2013
and
2012
, (iii) the Consolidated balance sheets (unaudited) as of
June 30, 2013
, and
December 31, 2012
, (iv) the Consolidated statements of changes in stockholders’ equity (unaudited) for the
six months ended
June 30, 2013
and
2012
, (v) the Consolidated statements of cash flows (unaudited) for the
six months ended
June 30, 2013
and
2012
, and (vi) the Notes to Consolidated Financial Statements (unaudited).
|
220
SIGNATURE
Pursuant to the requirements of the Securities Exchange Act of 1934, the registrant has duly caused this report to be signed on its behalf by the undersigned thereunto duly authorized.
|
JPMorgan Chase & Co.
|
|
(Registrant)
|
|
By:
|
/s/ Mark W. O’Donovan
|
|
Mark W. O’Donovan
|
|
|
Managing Director and Corporate Controller
|
|
|
(Principal Accounting Officer)
|
|
|
Date:
|
August 7, 2013
|
221
INDEX TO EXHIBITS
|
Exhibit No.
|
Description of Exhibit
|
|
|
15
|
Letter re: Unaudited Interim Financial Information
|
|
|
31.1
|
Certification
|
|
|
31.2
|
Certification
|
|
|
32
|
Certification Pursuant to Section 906 of the Sarbanes-Oxley Act of 2002†
|
|
|
101.INS
|
XBRL Instance Document
|
|
|
101.SCH
|
XBRL Taxonomy Extension Schema Document
|
|
|
101.CAL
|
XBRL Taxonomy Extension Calculation Linkbase Document
|
|
|
101.LAB
|
XBRL Taxonomy Extension Label Linkbase Document
|
|
|
101.PRE
|
XBRL Taxonomy Extension Presentation Linkbase Document
|
|
|
101.DEF
|
XBRL Taxonomy Extension Definition Linkbase Document
|
|
|
†
|
This exhibit shall not be deemed “filed” for purposes of Section 18 of the Securities Exchange Act
of 1934, or otherwise subject to the liability of that Section. Such exhibit shall not be deemed incorporated into any filing under the Securities Act of 1933 or the Securities Exchange Act of 1934.
|
|
222
TABLE OF CONTENTS
Note 1 Basis Of PresentationNote 2 Business Changes and DevelopmentsNote 3 Fair Value MeasurementNote 4 Fair Value OptionNote 5 Derivative InstrumentsNote 6 Noninterest RevenueNote 7 Interest Income and Interest ExpenseNote 8 Pension and Other Postretirement Employee Benefit PlansNote 9 Employee Stock-based IncentivesNote 10 Noninterest ExpenseNote 11 SecuritiesNote 12 Securities Financing ActivitiesNote 13 LoansNote 14 Allowance For Credit LossesNote 15 Variable Interest EntitiesNote 16 Goodwill and Other Intangible AssetsNote 17 DepositsNote 18 Earnings Per ShareNote 19 Accumulated Other Comprehensive Income/(loss)Note 20 Regulatory CapitalNote 21 Off Balance Sheet Lending-related Financial Instruments, Guarantees, and Other CommitmentsNote 22 Pledged Assets and CollateralNote 23 LitigationNote 24 Business SegmentsItem 3 Quantitative and Qualitative Disclosures About Market RiskItem 4 Controls and ProceduresPart II Other InformationItem 1 Legal ProceedingsItem 1A Risk FactorsItem 2 Unregistered Sales Of Equity Securities and Use Of ProceedsItem 3 Defaults Upon Senior SecuritiesItem 4 Mine Safety DisclosureItem 5 Other InformationItem 6 Exhibits