NORDSTROM INC
10-Ks and 10-Qs
|
|
|
|
|
|
|
|
|
|
|
|
|
|
|
|
|
|
|
|
|
|
|
|
|
|
|
|
|
|
|
|
|
|
|
|
|
|
|
|
|
|
|
|
|
|
|
|
|
|
UNITED STATES
SECURITIES AND EXCHANGE COMMISSION
Washington, D.C. 20549
FORM 10-K
(Mark One)
|
þ
|
ANNUAL REPORT PURSUANT TO SECTION 13 OR 15(d) OF THE SECURITIES EXCHANGE ACT OF 1934
|
For the fiscal year ended
February 2, 2013
or
|
¨
|
TRANSITION REPORT PURSUANT TO SECTION 13 OR 15(d) OF THE SECURITIES EXCHANGE ACT OF 1934
|
For the transition period from ___________ to___________
Commission file number 001-15059
NORDSTROM, INC.
(Exact name of registrant as specified in its charter)
|
Washington
|
|
91-0515058
|
|
(State or other jurisdiction of
incorporation or organization)
|
|
(I.R.S. Employer
Identification No.)
|
|
1617 Sixth Avenue, Seattle, Washington
|
|
98101
|
|
(Address of principal executive offices)
|
|
(Zip Code)
|
Registrant's telephone number, including area code
206-628-2111
Securities registered pursuant to Section 12(b) of the Act:
|
Title of each class
|
|
Name of each exchange on which registered
|
|
Common stock, without par value
|
|
New York Stock Exchange
|
Securities registered pursuant to Section 12(g) of the Act:
None
Indicate by check mark if the registrant is a well-known seasoned issuer, as defined in Rule 405 of the Securities Act. YES
þ
NO
¨
Indicate by check mark if the registrant is not required to file reports pursuant to Section 13 or Section 15(d) of the Act. YES
¨
NO
þ
Indicate by check mark whether the registrant (1) has filed all reports required to be filed by Section 13 or 15(d) of the Securities Exchange Act of 1934 during the preceding 12 months (or for such shorter period that the registrant was required to file such reports), and (2) has been subject to such filing requirements for the past 90 days. YES
þ
NO
¨
Indicate by check mark whether the registrant has submitted electronically and posted on its corporate Website, if any, every Interactive Data File required to be submitted and posted pursuant to Rule 405 of Regulation S-T during the preceding 12 months (or for such shorter period that the registrant was required to submit and post such files). YES
þ
NO
¨
Indicate by check mark if disclosure of delinquent filers pursuant to Item 405 of Regulation S-K is not contained herein, and will not be contained, to the best of registrant's knowledge, in definitive proxy or information statements incorporated by reference in Part III of this Form 10-K or any amendment to this Form 10-K.
¨
Indicate by check mark whether the registrant is a large accelerated filer, an accelerated filer, a non-accelerated filer, or a smaller reporting company. See the definitions of "large accelerated filer," "accelerated filer" and "smaller reporting company" in Rule 12b-2 of the Exchange Act.
|
Large accelerated filer
þ
|
Accelerated filer
¨
|
|
Non-accelerated filer
¨
(Do not check if a smaller reporting company)
|
Smaller reporting company
¨
|
Indicate by check mark whether the registrant is a shell company (as defined in Rule 12b-2 of the Act). YES
¨
NO
þ
As of
July 27, 2012
the aggregate market value of the Registrant's voting and non-voting stock held by non-affiliates of the Registrant was approximately
$9.0 billion
using the closing sales price on that day of
$54.40
. On
March 12, 2013
,
195,891,451
shares of common stock were outstanding.
DOCUMENTS INCORPORATED BY REFERENCE
Portions of the Proxy Statement for the
2013
Annual Meeting of Shareholders scheduled to be held on
May 14, 2013
are incorporated into Part III.
Nordstrom, Inc. and subsidiaries
1
[This page intentionally left blank.]
|
TABLE OF CONTENTS
|
||
|
|
|
Page
|
|
Item 1.
|
||
|
Item 1A.
|
||
|
Item 1B.
|
||
|
Item 2.
|
||
|
Item 3.
|
||
|
Item 4.
|
||
|
Item 5.
|
||
|
Item 6.
|
||
|
Item 7.
|
||
|
Item 7A.
|
||
|
Item 8.
|
||
|
Item 9.
|
||
|
Item 9A.
|
||
|
Item 9B.
|
||
|
Item 10.
|
||
|
Item 11.
|
||
|
Item 12.
|
||
|
Item 13.
|
||
|
Item 14.
|
||
|
Item 15.
|
||
Nordstrom, Inc. and subsidiaries
3
DESCRIPTION OF BUSINESS
Founded in
1901
as a retail shoe business in Seattle, Nordstrom later incorporated in the state of Washington in
1946
and went on to become one of the leading fashion specialty retailers based in the U.S. We operate
242
U.S. stores located in
31
states as of
March 18, 2013
, as well as a robust e-commerce business through nordstrom.com. The west and east coasts of the United States are the areas in which we have the largest presence. We have two reportable segments: Retail and Credit.
As of
March 18, 2013
, the
Retail
segment includes our
117
'Nordstrom' branded full-line stores and our online store at www.nordstrom.com, our
121
off-price 'Nordstrom Rack' stores,
one
clearance store that operates under the name 'Last Chance' and our other retail channels including our online private sale subsidiary 'HauteLook,' our
two
'Jeffrey' boutiques and
one
philanthropic 'treasure&bond' store. Through these multiple retail channels, we try to deliver the best customer experience possible. We offer a wide selection of high-quality brand name and private label merchandise focused on apparel, shoes, cosmetics and accessories. Our integrated Nordstrom full-line stores and online store allow us to provide our customers with a seamless shopping experience. Purchases within our stores are primarily fulfilled from that store's inventory, but may also be shipped to our customers from our fulfillment center in Cedar Rapids, Iowa, or from other Nordstrom full-line stores for inventory unavailable at the original store. Online purchases are primarily shipped to our customers from our Cedar Rapids fulfillment center, but may also be shipped from our Nordstrom full-line stores. Our customers also have the option to pick up online orders in our Nordstrom full-line stores if inventory is available at that location. These capabilities allow us to better serve customers across various channels and improve sales. The Nordstrom Rack stores purchase high-quality name brand merchandise directly from vendors and also serve as outlets for clearance merchandise from our Nordstrom stores. Our online private sale retailer, HauteLook, offers limited time sale events on fashion and lifestyle brands.
Our
Credit
segment includes our wholly owned federal savings bank, Nordstrom fsb, through which we provide a private label credit card, two Nordstrom VISA credit cards and a debit card. The credit and debit cards feature a shopping-based loyalty program designed to increase customer visits and spending. Although the primary purpose of our Credit business is to strengthen and build customer relationships, foster greater customer loyalty and drive more sales, we also generate revenues through finance charges and other fees on these cards and save on interchange fees that would be incurred by the Retail segment if our customers used third-party cards.
For more information about our business and our reportable segments, see Item 7: Management's Discussion and Analysis of Financial Condition and Results of Operations and Note 16: Segment Reporting in Item 8: Financial Statements and Supplementary Data.
FISCAL YEAR
We operate on a 52/53-week fiscal year ending on the Saturday closest to January 31st. References to
2012
relate to the 53-week fiscal year ended
February 2, 2013
. References to any other years included within this document are based on a 52-week fiscal year.
TRADEMARKS
We have
139
trademarks, each of which is the subject of one or more trademark registrations and/or trademark applications. Our most notable trademarks include Nordstrom, Nordstrom Rack, HauteLook, Halogen, Caslon, and BP. Each of our trademarks is renewable indefinitely, provided that it is still used in commerce at the time of the renewal.
RETURN POLICY
We have a liberal approach to returns at Nordstrom. We do not have a formal return policy at our Nordstrom full-line stores or online at www.nordstrom.com. If a customer is not satisfied with something they purchased, we evaluate the situation on a case-by-case basis with the ultimate objective of taking care of the customer. We also try to make returns and exchanges easy for our customers, whether in our stores or online, where we offer free shipping and free returns. Our Nordstrom Rack stores generally accept returns up to 30 days from the date of purchase with the original price tag and sales receipt. HauteLook generally accepts returns of apparel, footwear and accessories within
21
days from the date of shipment.
SEASONALITY
Due to our Anniversary Sale in July, the holidays in December and the half-yearly sales that occur in the second and fourth quarters, our sales are typically higher in the second and fourth quarters of the fiscal year than in the first and third quarters. In
2012
, our Anniversary Sale shifted to the last week of July and the first week of August to align with the historical timing of our sale event. This moved one week of event sales to the third quarter.
4
INVENTORY
We plan our merchandise purchases and receipts to coincide with expected sales trends. For instance, our merchandise purchases and receipts increase prior to our Anniversary Sale, which has historically extended over the last two weeks of July. As discussed above, in
2012
this shifted to the last week of July and the first week of August. We also purchase and receive a larger amount of merchandise in the fall as we prepare for the holiday shopping season (from late November through December). In 2012, we increased our investment in pack and hold inventory at Nordstrom Rack, which involves the acquisition of merchandise from some of our top brands in advance of the upcoming selling seasons in order to take advantage of strategic buying opportunities. This inventory is typically held for six months on average and has contributed to the growth in our Rack business. We pay for our merchandise purchases under the terms established with our vendors.
In order to offer merchandise that our customers want, we purchase merchandise from a wide variety of high-quality suppliers, including domestic and foreign businesses. We also have arrangements with agents and contract manufacturers to produce our private label merchandise. We expect our suppliers to meet our "Nordstrom Partnership Guidelines," which address our corporate social responsibility standards for matters such as legal and regulatory compliance, labor, health and safety and the environment, and are available on our website at www.nordstrom.com.
COMPETITIVE CONDITIONS
We operate in a highly competitive business environment. We compete with other national, regional and local retailers that may carry similar lines of merchandise, including department stores, specialty stores, off-price stores, boutiques and Internet businesses. Our specific competitors vary from market to market. We believe the keys to competing in our industry are customer service and creating a great customer experience in store and online, which includes compelling price and value, fashion newness, quality of products, selection, convenience, technology, product fulfillment, service and stores in top locations.
EMPLOYEES
During
2012
, we employed approximately
61,000
employees on a full- or part-time basis. Due to the seasonal nature of our business, employment increased to approximately
63,500
employees in July
2012
and
64,500
in December
2012
. Substantially all of our employees are non-union. We believe our relationship with our employees is good.
CAUTIONARY STATEMENT
Certain statements in this Annual Report on Form 10-K contain or may suggest "forward-looking" information (as defined in the Private Securities Litigation Reform Act of 1995) that involve risks and uncertainties, including, but not limited to, anticipated financial outlook for the fiscal year ending February 1, 2014, anticipated annual same-store sales rate, anticipated Return on Invested Capital and trends in our operations. Such statements are based upon the current beliefs and expectations of the company's management and are subject to significant risks and uncertainties. Actual future results may differ materially from historical results or current expectations depending upon factors including, but not limited to:
|
•
|
successful execution of our growth strategy, including expansion into new markets, technological investments and acquisitions, our ability to realize the anticipated benefits from such growth initiatives, and the timely completion of construction associated with newly planned stores, relocations and remodels, all of which may be impacted by the financial health of third parties,
|
|
•
|
our ability to manage the transformation of our business/financial model as we increase our investments in growth opportunities, including our online business and our ability to manage related organizational changes,
|
|
•
|
our ability to maintain relationships with our employees and to effectively attract, develop and retain our future leaders,
|
|
•
|
effective inventory management, disruptions in our supply chain and our ability to control costs,
|
|
•
|
the impact of any systems failures, cybersecurity and/or security breaches, including any security breach that results in the theft, transfer or unauthorized disclosure of customer, employee or company information or our compliance with information security and privacy laws and regulations in the event of such an incident,
|
|
•
|
successful execution of our information technology strategy,
|
|
•
|
efficient and proper allocation of our capital resources,
|
|
•
|
our ability to safeguard our reputation and maintain our vendor relationships,
|
|
•
|
the impact of economic and market conditions and the resultant impact on consumer spending patterns,
|
|
•
|
our ability to respond to the business environment, fashion trends and consumer preferences, including changing expectations of service and experience in stores and online,
|
|
•
|
the effectiveness of planned advertising, marketing and promotional campaigns in the highly competitive retail industry,
|
|
•
|
weather conditions, natural disasters, health hazards, national security or other market disruptions, or the prospects of these events and the impact on consumer spending patterns,
|
|
•
|
our compliance with applicable banking related laws and regulations impacting our ability to extend credit to our customers, employment laws and regulations, certain international laws and regulations, other laws and regulations applicable to us, including the outcome of claims and litigation and resolution of tax matters, and ethical standards,
|
|
•
|
impact of the current regulatory environment and financial system and health care reforms,
|
Nordstrom, Inc. and subsidiaries
5
|
•
|
compliance with debt covenants, availability and cost of credit, changes in interest rates, and trends in personal bankruptcies and bad debt write-offs, and
|
|
•
|
the timing and amounts of share repurchases by the company, if any, or any share issuances by the company, including issuances associated with option exercises or other matters.
|
These and other factors could affect our financial results and cause actual results to differ materially from any forward-looking information we may provide. We undertake no obligation to update or revise any forward-looking statements to reflect subsequent events, new information or future circumstances.
SEC FILINGS
We file annual, quarterly and current reports, proxy statements and other documents with the Securities and Exchange Commission ("SEC"). All material we file with the SEC is publicly available at the SEC's Public Reference Room at 100 F Street NE, Washington, DC 20549. You may obtain information on the operation of the Public Reference Room by calling the SEC at 1-800-SEC-0330. In addition, the SEC maintains a website at www.sec.gov that contains reports, proxy and information statements and other information regarding issuers that file electronically with the SEC.
WEBSITE ACCESS
Our website address is www.nordstrom.com. We make available free of charge on or through our website our annual and quarterly reports on Form 10-K and 10-Q (including related filings in eXtensible Business Reporting Language ("XBRL") format), current reports on Form 8-K, proxy statements, statements of changes in beneficial ownership of securities on Form 4 and amendments to those reports filed or furnished pursuant to Section 13(a) or 15(d) of the Securities Exchange Act of 1934 as soon as reasonably practicable after we electronically file the report with or furnish it to the SEC. Interested parties may also access a webcast of quarterly earnings conference calls and other financial events through our website.
CORPORATE GOVERNANCE
We have a long-standing commitment to upholding a high level of ethical standards. In addition, as required by the listing standards of the New York Stock Exchange ("NYSE") and the rules of the SEC, we have adopted Codes of Business Conduct and Ethics for our employees, officers and directors ("Codes of Ethics") and Corporate Governance Guidelines. We have posted on our website our Codes of Ethics, our Corporate Governance Guidelines and our Committee Charters for the Audit, Compensation, Corporate Governance and Nominating and Finance Committees. Any amendments and waivers to these will also be available on our website.
For printed versions of these items or any other inquiries, please use the following contact information:
Nordstrom Investor Relations
PO Box 2737
Seattle, Washington 98111
(206) 233-6564
invrelations@nordstrom.com
Our business faces many risks. We believe the risks described below outline the items of most concern to us.
RISKS DUE TO STRATEGIC AND OPERATIONAL FACTORS
Our strategic growth plans focus on both our stores and on e-commerce and failure to successfully execute our plans could negatively impact our current business and future profitability.
We plan to accelerate the number of new Nordstrom Rack store openings. New store openings both at the Rack and in our full-line stores involve certain risks, including the availability of suitable locations, constructing, furnishing and supplying a store in a timely and cost-effective manner and accurately assessing the demographic or retail environment for a particular location. In addition, sales at new, relocated or remodeled stores may not meet our projections, which could adversely affect our return on investment. We also intend to open stores in new and international markets, such as Canada, Puerto Rico and Manhattan, and expansion will require additional management attention and resources and may distract us from executing our core operations. In addition, competition from strong local competitors, compliance with foreign and local laws and regulatory requirements and potentially unfavorable tax consequences may cause our business to be adversely impacted.
6
We are also enhancing our customer shopping experience in our stores, online, and in mobile and social channels by pursuing a heightened focus on technology and e-commerce to fuel our growth. In addition, other growth opportunities may include acquisitions of, or investments in, other businesses, as well as new technologies or other investments to improve and integrate these experiences. If we target the wrong opportunities, fail to make the best investments or make an investment commitment significantly above or below our needs, it may result in the loss of our competitive position. If these technologies and investments do not perform as expected or are not seamlessly integrated, our profitability and growth could be adversely affected. In addition, if we do not maintain our current systems, we may see interruptions to our business and increased costs in order to bring our systems up to date.
As we execute our plans and continue to evolve and transform our strategy, we may not adequately manage the related organizational changes or appropriately monitor, report or communicate the changes in an effective manner, adversely impacting our current business and future profitability.
Improvements to our merchandise buying processes and systems could adversely affect our business if not successfully executed.
We are making investments to improve our merchandise planning, procurement and allocation capabilities through changes in personnel, processes and technology over a period of several years. If we encounter challenges associated with change management, the ability to hire and retain key personnel involved in these efforts, implementation of associated information technology or adoption of new processes, our ability to continue to successfully execute our strategy could be adversely affected. As a result, we may not derive the expected benefits to our sales and profitability, or we may incur increased costs relative to our current expectations.
If we do not effectively implement our strategic and business planning processes to attract, retain, train and develop future leaders, our business may suffer
.
We rely on the experience of our senior management, who have specific knowledge relating to us and our industry that is difficult to replace. If unexpected leadership turnover occurs without adequate succession plans, the loss of the services of any of these individuals, or any negative perceptions of our business as a result, could damage our reputation and our business.
We could expose our customers and our business to risk if we fail to take the appropriate measures to safeguard our information security and privacy environment from security breaches.
Our operations involve the collection, storage and transmission of customers' personal information, consumer preferences and credit card information, in addition to employee information and company financial and strategic data. Any measures we implement to prevent a security or cybersecurity threat may not be totally effective and may have the potential to harm relations with our customers or decrease activity on our websites by making them more difficult to use. In addition, the regulatory environment surrounding information security, cybersecurity and privacy is increasingly demanding, with new and constantly changing requirements. Security breaches and cyber incidents and their remediation, whether at our company, our third-party providers or our peer retailers, could expose us to a risk of loss or misappropriation of this information, litigation, potential liability, reputation damage and loss of customers' trust and business.
If we fail to appropriately manage our capital, we may negatively impact our operations and shareholder return.
We utilize capital to finance our operations, make capital expenditures and acquisitions, manage our debt levels and return value to our shareholders through dividends and share repurchases. If our access to capital is restricted or our cost of capital increases, our operations and financial condition could be adversely impacted. Further, if we do not properly allocate our capital to maximize returns, our operations, cash flows and returns to shareholders could be adversely affected.
Our customer and employee relationships could be negatively affected if we fail to maintain our corporate culture and reputation.
We have a well-recognized culture and reputation that consumers may associate with a high level of integrity, customer service and quality merchandise, and it is one of the reasons employees choose Nordstrom as a place of employment. Any significant damage to our reputation could negatively impact sales, diminish customer trust, reduce employee morale and productivity and lead to difficulties in recruiting and retaining qualified employees.
RISKS DUE TO ECONOMIC AND EXTERNAL MARKET FACTORS
A downturn in economic conditions could have a significant adverse effect on our business.
During economic downturns, fewer customers may shop for the high-quality items in our stores and on our website as they may be seen as discretionary and those who do shop may limit the amount of their purchases. This reduced demand may lead to lower sales, higher markdowns and increased marketing and promotional spending. Deterioration of economic conditions and consumer confidence may also adversely affect our credit customers' payment patterns and delinquency rates, increasing our bad debt expense.
Nordstrom, Inc. and subsidiaries
7
Our business could suffer if we do not appropriately assess and react to competitive market forces.
We compete with other national, regional, local and online retailers that may carry similar lines of merchandise, including department stores, specialty stores, off-price stores, boutiques and Internet businesses. Online retail shopping is rapidly evolving and we expect competition in the e-commerce market to intensify in the future as the Internet facilitates competitive entry and comparison shopping. We may lose market share to our competitors and our sales and profitability could suffer if we are unable to remain competitive in the key areas of price and value, fashion newness, quality of products, depth of selection, convenience, fulfillment, service and the shopping experience, including the online and store environment and location.
Our Credit segment faces competition from other retailers who also offer credit card products with associated loyalty programs, large banks and other credit card companies, some of which have substantial financial resources. If we do not effectively anticipate or respond to the competitive banking and credit card environment, we could lose market share to our competitors.
Our sales and customer relationships may be negatively impacted if we do not anticipate and respond to consumer preferences and fashion trends appropriately.
Our ability to predict or respond to constantly changing fashion trends, consumer preferences and spending patterns significantly impacts our sales and operating results. If we do not identify and respond to emerging trends in consumer spending and preferences quickly enough, we may harm our ability to retain our existing customers or attract new customers. If we purchase too much inventory, we may be forced to sell our merchandise at lower average margins, which could harm our business. Conversely, if we fail to purchase enough merchandise, we may lose opportunities for additional sales and damage our relationships with our customers.
The results of our Credit operations could be adversely affected by changes in market conditions.
Our credit card revenues and profitability are subject in large part to economic and market conditions that are beyond our control, including, but not limited to, interest rates, consumer credit availability, consumer debt levels, unemployment trends, laws and regulations and other factors. These economic and market conditions could impair our ability to assess the creditworthiness of our customers if the criteria and/or models we use to underwrite and manage our customers become less predictive of future losses. This could cause our losses to rise and have a negative impact on our results of operations.
Our business and operations could be materially and adversely affected by supply chain disruptions, severe weather patterns, natural disasters, widespread pandemics and other natural or man-made disruptions.
We derive a significant amount of our total sales from stores located on the west and east coasts of the United States, particularly in California, which increases our exposure to conditions in these regions. These disruptions could cause, among other things, a decrease in consumer spending that would negatively impact our sales; staffing shortages in our stores, distribution centers or corporate offices; interruptions in the flow of merchandise to our stores; disruptions in the operations of our merchandise vendors or property developers; increased costs; and a negative impact on our reputation and long-term growth plans.
RISKS DUE TO LEGAL AND REGULATORY FACTORS
We are subject to certain laws, litigation, regulatory matters and ethical standards, and our failure to comply with or adequately address developments as they arise could adversely affect our reputation and operations.
Our policies, procedures and practices and the technology we implement are designed to comply with federal, state, local and foreign laws, rules and regulations, including those imposed by the SEC and other regulatory agencies, the marketplace, the banking industry and foreign countries, as well as responsible business, social and environmental practices, all of which may change from time to time. Significant legislative changes, including those that relate to employment matters and health care reform, could impact our relationship with our workforce, which could increase our expenses and adversely affect our operations. In addition, if we fail to comply with applicable laws and regulations or implement responsible business, social and environmental practices, we could be subject to damage to our reputation, class action lawsuits, legal and settlement costs, civil and criminal liability, increased cost of regulatory compliance, restatements of our financial statements, disruption of our business and loss of customers. Any required changes to our employment practices could result in the loss of employees, reduced sales, increased employment costs, low employee morale and harm to our business and results of operations. In addition, political and economic factors could lead to unfavorable changes in federal and state tax laws, which may increase our tax liabilities. An increase in our tax liabilities could adversely affect our results of operations. We are also regularly involved in various litigation matters that arise in the ordinary course of business. Litigation or regulatory developments could adversely affect our business and financial condition.
8
Our business faces uncertainties as we implement newly enacted financial system reforms that could have an adverse affect on our operations.
The recession resulted in increased legislative and regulatory changes affecting the financial industry. The Credit Card Accountability Responsibility and Disclosure Act of 2009 included new rules and restrictions on credit card pricing, finance charges and fees, customer billing practices and payment application, which required us to make changes to our credit card practices and systems. We expect more regulations and interpretations of the new rules to emerge and, depending on the nature and extent of the full impact from these rules, the revenues and profitability of our Credit segment could be adversely affected.
In addition, the Dodd-Frank Wall Street Reform and Consumer Protection Act was enacted in July 2010. It significantly restructures regulatory oversight and other aspects of the financial industry, creates a new federal agency to supervise and enforce consumer lending laws and regulations and expands state authority over consumer lending. Numerous regulations will be issued in the near future to implement the requirements of this Act, which remain uncertain at this time. Depending on the nature and extent of these regulations, and the enforcement approach of regulators under the new law, there could be an adverse impact to our Credit segment.
None.
Nordstrom, Inc. and subsidiaries
9
The following table summarizes the number of retail stores owned or leased by us, and the percentage of total store square footage represented by each listed category as of
February 2, 2013
:
|
Number of stores
|
% of total store
square footage
|
|
||
|
Leased stores on leased land
|
143
|
34
|
%
|
|
|
Owned stores on leased land
|
61
|
43
|
%
|
|
|
Owned stores on owned land
|
35
|
22
|
%
|
|
|
Partly owned and partly leased store
|
1
|
1
|
%
|
|
|
Total
|
240
|
100
|
%
|
|
The following table summarizes our store opening activity during the last three years:
|
Fiscal year
|
2012
|
|
|
2011
|
|
|
2010
|
|
|
Number of stores, beginning of year
|
225
|
|
204
|
|
184
|
|
||
|
Stores opened
|
16
|
|
22
|
|
20
|
|
||
|
Stores closed
|
(1
|
)
|
(1
|
)
|
—
|
|
||
|
Number of stores, end of year
|
240
|
|
225
|
|
204
|
|
||
|
Nordstrom
|
117
|
|
117
|
|
115
|
|
||
|
Nordstrom Rack and Other
|
123
|
|
108
|
|
89
|
|
||
In
2012
, we opened
one
Nordstrom full-line store (Salt Lake City, Utah), opened
15
Nordstrom Rack stores (Orange, California; Boise, Idaho; Alpharetta, Georgia; Farmington, Connecticut; Temecula, California; Willow Grove, Pennsylvania; Manchester, Missouri; Vienna, Virginia; San Diego, California; Huntington Beach, California; Phoenix, Arizona; San Antonio, Texas; Huntington, New York; Warwick, Rhode Island; and Seattle, Washington) and relocated
three
Nordstrom Rack stores (Seattle, Washington; Long Island, New York; and White Plains, New York).
To date in
2013
, we have opened two Nordstrom Rack stores (Boston, Massachusetts and Upland, California). During the remainder of
2013
, we have announced the opening of 14 additional Nordstrom Rack stores (Ann Arbor, Michigan; Auburn Hills, Michigan; Birmingham, Alabama; Columbia, Maryland; Portland, Maine; Washington, D.C.; Atlanta, Georgia; Cleveland, Ohio; Columbus, Ohio; Concord, California; El Paso, Texas; Eugene, Oregon; Jacksonville, Florida; and Naples, Florida), the relocation of one Nordstrom full-line store (Glendale, California) and the relocation of two Nordstrom Rack stores (Culver City, California and Honolulu, Hawaii).
We also own six merchandise distribution centers (Portland, Oregon; Dubuque, Iowa; Ontario, California; Newark, California; Upper Marlboro, Maryland; and Gainesville, Florida) and we own one fulfillment center on leased land (Cedar Rapids, Iowa), all of which are utilized by our Retail segment. HauteLook, which is also included in our Retail segment, leases two administrative offices (in Los Angeles, California and New York, New York) and one fulfillment center (in Fontana, California). We lease an office building in Centennial, Colorado and one in Scottsdale, Arizona, both for use by our Credit segment. Our administrative offices in Seattle, Washington are a combination of leased and owned space. We also lease a data center in Centennial, Colorado.
10
The following table lists our retail store count and facility square footage by state as of
February 2, 2013
:
|
Retail stores by channel
|
Nordstrom Full-Line Stores
|
Nordstrom Rack and Other
1
|
Total
|
||||||||||||
|
State
|
Count
|
|
Square Footage
(000's)
|
|
Count
|
|
Square Footage
(000's)
|
|
Count
|
|
Square Footage
(000's)
|
|
|||
|
Alaska
|
1
|
|
97
|
|
—
|
|
—
|
|
1
|
|
97
|
|
|||
|
Arizona
|
2
|
|
384
|
|
6
|
|
228
|
|
8
|
|
612
|
|
|||
|
California
2
|
32
|
|
5,481
|
|
33
|
|
1,300
|
|
65
|
|
6,781
|
|
|||
|
Colorado
|
3
|
|
559
|
|
4
|
|
148
|
|
7
|
|
707
|
|
|||
|
Connecticut
|
1
|
|
189
|
|
1
|
|
36
|
|
2
|
|
225
|
|
|||
|
Delaware
|
1
|
|
127
|
|
—
|
|
—
|
|
1
|
|
127
|
|
|||
|
Florida
2
|
9
|
|
1,431
|
|
7
|
|
247
|
|
16
|
|
1,678
|
|
|||
|
Georgia
|
3
|
|
555
|
|
4
|
|
130
|
|
7
|
|
685
|
|
|||
|
Hawaii
|
1
|
|
211
|
|
1
|
|
34
|
|
2
|
|
245
|
|
|||
|
Idaho
|
—
|
|
—
|
|
1
|
|
37
|
|
1
|
|
37
|
|
|||
|
Illinois
|
4
|
|
947
|
|
7
|
|
280
|
|
11
|
|
1,227
|
|
|||
|
Indiana
|
1
|
|
134
|
|
1
|
|
35
|
|
2
|
|
169
|
|
|||
|
Kansas
|
1
|
|
219
|
|
1
|
|
35
|
|
2
|
|
254
|
|
|||
|
Maryland
|
4
|
|
765
|
|
3
|
|
115
|
|
7
|
|
880
|
|
|||
|
Massachusetts
|
4
|
|
595
|
|
3
|
|
121
|
|
7
|
|
716
|
|
|||
|
Michigan
|
3
|
|
552
|
|
2
|
|
80
|
|
5
|
|
632
|
|
|||
|
Minnesota
|
1
|
|
240
|
|
2
|
|
75
|
|
3
|
|
315
|
|
|||
|
Missouri
|
2
|
|
342
|
|
2
|
|
69
|
|
4
|
|
411
|
|
|||
|
Nevada
|
1
|
|
207
|
|
1
|
|
35
|
|
2
|
|
242
|
|
|||
|
New Jersey
|
5
|
|
991
|
|
2
|
|
70
|
|
7
|
|
1,061
|
|
|||
|
New York
|
2
|
|
460
|
|
6
|
|
162
|
|
8
|
|
622
|
|
|||
|
North Carolina
|
2
|
|
300
|
|
2
|
|
74
|
|
4
|
|
374
|
|
|||
|
Ohio
|
3
|
|
549
|
|
2
|
|
75
|
|
5
|
|
624
|
|
|||
|
Oregon
|
5
|
|
705
|
|
4
|
|
158
|
|
9
|
|
863
|
|
|||
|
Pennsylvania
|
2
|
|
381
|
|
2
|
|
85
|
|
4
|
|
466
|
|
|||
|
Rhode Island
|
1
|
|
206
|
|
1
|
|
38
|
|
2
|
|
244
|
|
|||
|
Tennessee
|
1
|
|
145
|
|
—
|
|
—
|
|
1
|
|
145
|
|
|||
|
Texas
|
7
|
|
1,284
|
|
10
|
|
348
|
|
17
|
|
1,632
|
|
|||
|
Utah
|
2
|
|
277
|
|
2
|
|
66
|
|
4
|
|
343
|
|
|||
|
Virginia
|
5
|
|
894
|
|
5
|
|
201
|
|
10
|
|
1,095
|
|
|||
|
Washington
2
|
8
|
|
1,463
|
|
7
|
|
277
|
|
15
|
|
1,740
|
|
|||
|
Washington D.C.
|
—
|
|
—
|
|
1
|
|
41
|
|
1
|
|
41
|
|
|||
|
Total (31 states)
|
117
|
|
20,690
|
|
123
|
|
4,600
|
|
240
|
|
25,290
|
|
|||
1
Other includes one Last Chance clearance store, two Jeffrey boutiques and one philanthropic treasure&bond store.
2
California, Washington and Florida had the highest square footage, with a combined 10,199 square feet, representing 40% of the total company square footage.
Nordstrom, Inc. and subsidiaries
11
We are subject from time to time to various claims and lawsuits arising in the ordinary course of business including lawsuits alleging violations of state and/or federal wage and hour and other employment laws, privacy and other consumer-based claims. Some of these lawsuits purport or may be determined to be class or collective actions and seek substantial damages or injunctive relief, or both, and some may remain unresolved for several years. We believe the recorded reserves in our consolidated financial statements are adequate in light of the probable and estimable liabilities. As of the date of this report, we do not believe any currently identified claim, proceeding or litigation, either alone or in the aggregate, will have a material impact on our results of operations, financial position or cash flows. Since these matters are subject to inherent uncertainties, our view of them may change in the future.
None.
12
MARKET, SHAREHOLDER AND DIVIDEND INFORMATION
Our common stock, without par value, is traded on the New York Stock Exchange under the symbol "JWN." The approximate number of holders of common stock as of
March 12, 2013
was
150,000
, based upon the number of registered and beneficial shareholders, as well as the number of employee shareholders in the Nordstrom 401(k) Plan and Profit Sharing Plan. On this date we had
195,891,451
shares of common stock outstanding.
The high and low prices of our common stock and dividends declared for each quarter of
2012
and
2011
are presented in the table below:
|
|
Common Stock Price
|
|
|
||||||||
|
|
2012
|
2011
|
Dividends per Share
|
||||||||
|
|
High
|
Low
|
High
|
Low
|
2012
|
2011
|
|||||
|
1st Quarter
|
$56.75
|
$48.00
|
$48.70
|
$40.03
|
$0.27
|
$0.23
|
|||||
|
2nd Quarter
|
$57.75
|
$46.27
|
$52.15
|
$41.88
|
$0.27
|
$0.23
|
|||||
|
3rd Quarter
|
$58.44
|
$51.50
|
$53.35
|
$37.28
|
$0.27
|
$0.23
|
|||||
|
4th Quarter
|
$58.40
|
$50.94
|
$51.75
|
$44.22
|
$0.27
|
$0.23
|
|||||
|
Full Year
|
$58.44
|
$46.27
|
$53.35
|
$37.28
|
$1.08
|
$0.92
|
|||||
SHARE REPURCHASES
Dollar and share amounts in millions, except per share amounts
Following is a summary of our fourth quarter share repurchases:
|
Total Number
of Shares
(or Units)
Purchased
|
|
Average
Price Paid
Per Share
(or Unit)
|
|
Total Number of
Shares (or Units)
Purchased as Part of
Publicly Announced
Plans or Programs
|
|
Maximum Number (or
Approximate Dollar Value)
of Shares (or Units) that May
Yet Be Purchased Under
the Plans or Programs
1
|
|
||||||
|
November 2012
(October 28, 2012 to November 24, 2012) |
0.6
|
|
|
$54.99
|
|
0.6
|
|
|
$583
|
|
|||
|
December 2012
(November 25, 2012 to December 29, 2012) |
2.3
|
|
|
$52.58
|
|
2.3
|
|
|
$463
|
|
|||
|
January 2013
(December 30, 2012 to February 2, 2013) |
1.3
|
|
|
$54.69
|
|
1.3
|
|
|
$393
|
|
|||
|
Total
|
4.2
|
|
|
$53.55
|
|
4.2
|
|
||||||
1
In
2012
, we completed the
$750
repurchase program authorized by our Board of Directors in
May 2011
. In
February 2012
, our Board of Directors authorized a program (the
"2012 Program"
), which allows for the repurchase of up to
$800
of our common stock through
February 1, 2014
. As of
February 2, 2013
, there was
$393
in remaining share repurchase capacity under the 2012 Program. During
2012
, we repurchased
14.0
shares for an aggregate purchase price of $
717
in accordance with the 2012 Program. Subsequent to year-end, in February 2013, our Board of Directors authorized a new program to repurchase up to $800 of our outstanding common stock, through March 1, 2015, in addition to the remaining amount available for repurchase under the 2012 program. The actual number and timing of future share repurchases, if any, will be subject to market and economic conditions and applicable Securities and Exchange Commission rules.
Nordstrom, Inc. and subsidiaries
13
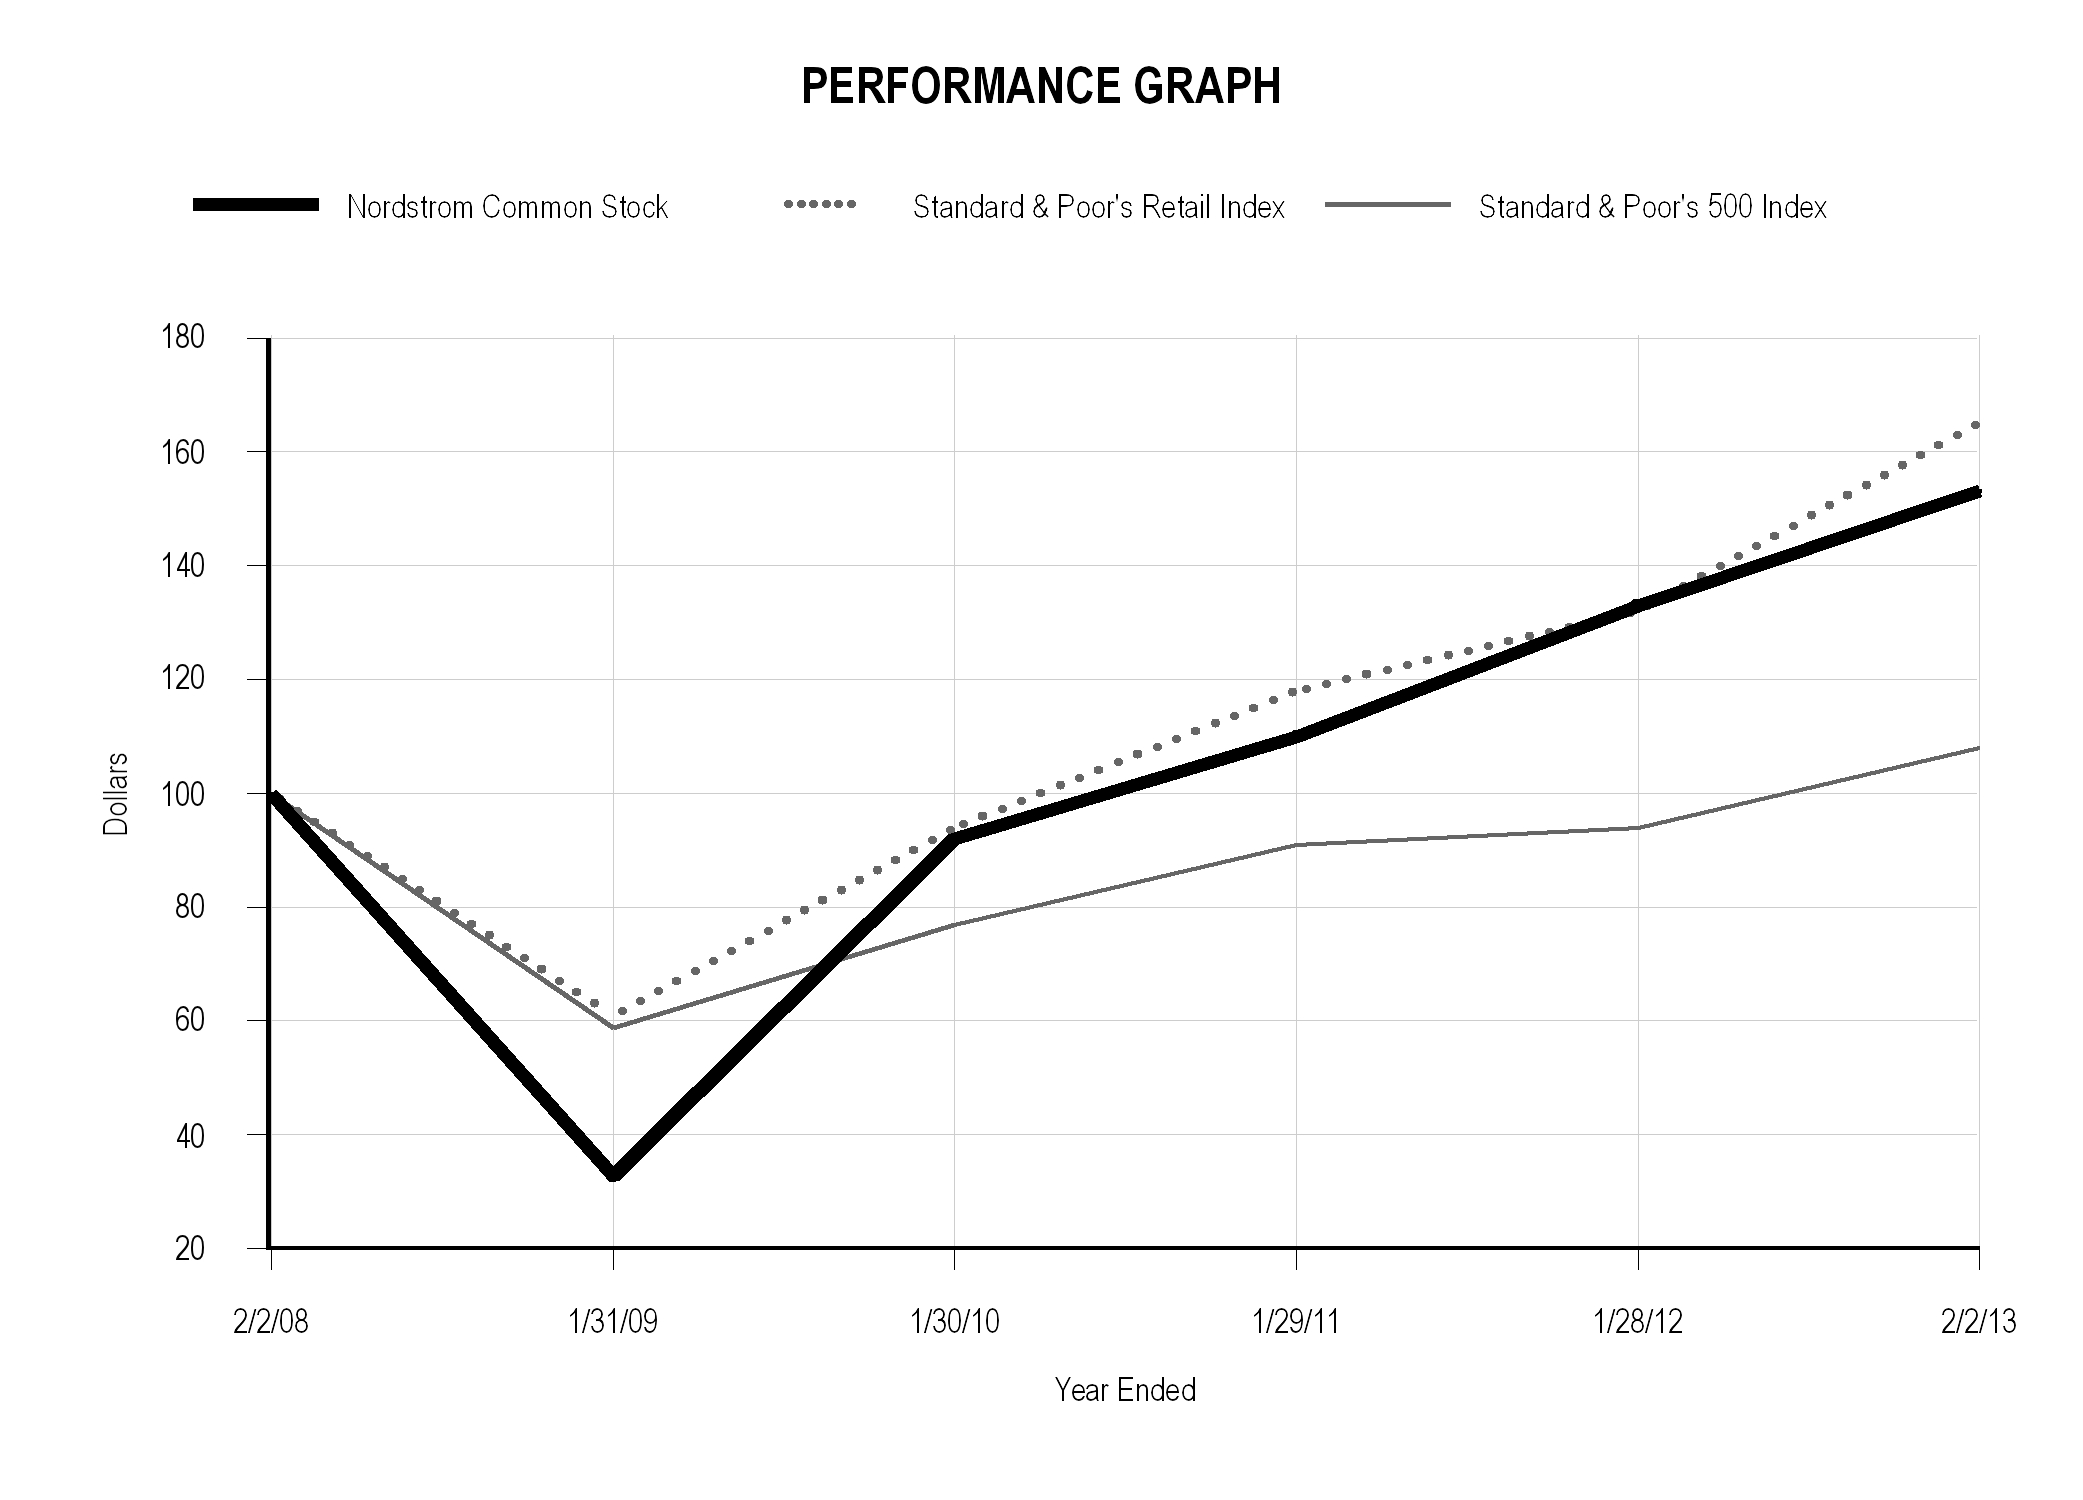
STOCK PRICE PERFORMANCE
The following graph compares for each of the last five fiscal years, ending
February 2, 2013
, the cumulative total return of Nordstrom common stock, Standard & Poor's Retail Index and Standard & Poor's 500 Index. The Retail Index is comprised of 33 retail companies, including Nordstrom, representing an industry group of the Standard & Poor's 500 Index. The cumulative total return of Nordstrom common stock assumes $100 invested on
February 2, 2008
in Nordstrom common stock and assumes reinvestment of dividends.
|
End of fiscal year
|
2007
|
|
2008
|
|
2009
|
|
2010
|
|
2011
|
|
2012
|
|
|||||
|
Nordstrom common stock
|
100
|
|
33
|
|
92
|
|
110
|
|
133
|
|
153
|
|
|||||
|
Standard & Poor's Retail Index
|
100
|
|
61
|
|
94
|
|
118
|
|
132
|
|
165
|
|
|||||
|
Standard & Poor's 500 Index
|
100
|
|
59
|
|
77
|
|
91
|
|
94
|
|
108
|
|
|||||
14
Dollars in millions except per square foot and per share amounts
The following selected financial data are derived from the audited consolidated financial statements and should be read in conjunction with Item 1A: Risk Factors, Item 7: Management's Discussion and Analysis of Financial Condition and Results of Operations and the consolidated financial statements and related notes included in Item 8: Financial Statements and Supplementary Data of this Annual Report on Form 10-K.
|
Fiscal year
|
2012
|
|
2011
|
|
2010
|
|
2009
|
|
2008
|
|
|||||||||
|
Earnings Results
|
|||||||||||||||||||
|
Net sales
|
|
$11,762
|
|
|
|
$10,497
|
|
|
|
$9,310
|
|
|
$8,258
|
|
|
$8,272
|
|
||
|
Credit card revenues
|
386
|
|
|
380
|
|
|
390
|
|
369
|
|
301
|
|
|||||||
|
Gross profit
1
|
4,330
|
|
|
3,905
|
|
|
3,413
|
|
2,930
|
|
2,855
|
|
|||||||
|
Selling, general and administrative ("SG&A") expenses:
|
|||||||||||||||||||
|
Retail
|
(3,166
|
)
|
|
(2,807
|
)
|
|
(2,412
|
)
|
(2,109
|
)
|
(2,103
|
)
|
|||||||
|
Credit
|
(205
|
)
|
|
(229
|
)
|
|
(273
|
)
|
(356
|
)
|
(274
|
)
|
|||||||
|
Earnings before interest and income taxes ("EBIT")
|
1,345
|
|
|
1,249
|
|
|
1,118
|
|
834
|
|
779
|
|
|||||||
|
Net earnings
|
735
|
|
|
683
|
|
|
613
|
|
441
|
|
401
|
|
|||||||
|
Balance Sheet and Cash Flow Data
|
|||||||||||||||||||
|
Cash and cash equivalents
|
|
$1,285
|
|
|
$1,877
|
|
|
$1,506
|
|
|
$795
|
|
|
$72
|
|
||||
|
Accounts receivable, net
|
2,129
|
|
|
2,033
|
|
2,026
|
|
2,035
|
|
1,942
|
|
||||||||
|
Merchandise inventories
|
1,360
|
|
|
1,148
|
|
977
|
|
898
|
|
900
|
|
||||||||
|
Current assets
|
5,081
|
|
|
5,560
|
|
4,824
|
|
4,054
|
|
3,217
|
|
||||||||
|
Land, buildings and equipment, net
|
2,579
|
|
|
2,469
|
|
2,318
|
|
2,242
|
|
2,221
|
|
||||||||
|
Total assets
|
8,089
|
|
|
8,491
|
|
7,462
|
|
6,579
|
|
5,661
|
|
||||||||
|
Current liabilities
|
2,226
|
|
|
2,575
|
|
1,879
|
|
2,014
|
|
1,601
|
|
||||||||
|
Long-term debt, including current portion
|
3,131
|
|
|
3,647
|
|
2,781
|
|
2,613
|
|
2,238
|
|
||||||||
|
Shareholders' equity
|
1,913
|
|
|
1,956
|
|
2,021
|
|
1,572
|
|
1,210
|
|
||||||||
|
Cash flow from operations
|
1,110
|
|
|
1,177
|
|
1,177
|
|
1,251
|
|
848
|
|
||||||||
|
Performance Metrics
|
|||||||||||||||||||
|
Same-store sales percentage change
2
|
7.3
|
%
|
7.2
|
%
|
8.1
|
%
|
(4.2
|
%)
|
(9.0
|
%)
|
|||||||||
|
Gross profit % of net sales
|
36.8
|
%
|
37.2
|
%
|
36.7
|
%
|
35.5
|
%
|
34.5
|
%
|
|||||||||
|
Retail SG&A % of net sales
|
26.9
|
%
|
26.7
|
%
|
25.9
|
%
|
25.5
|
%
|
25.4
|
%
|
|||||||||
|
Total SG&A % of net sales
|
28.7
|
%
|
28.9
|
%
|
28.8
|
%
|
29.8
|
%
|
28.7
|
%
|
|||||||||
|
EBIT % of net sales
|
11.4
|
%
|
11.9
|
%
|
12.0
|
%
|
10.1
|
%
|
9.4
|
%
|
|||||||||
|
Return on shareholders' equity
|
38.0
|
%
|
34.3
|
%
|
34.1
|
%
|
31.7
|
%
|
34.5
|
%
|
|||||||||
|
Return on assets
|
8.9
|
%
|
|
8.7
|
%
|
|
8.6
|
%
|
|
7.1
|
%
|
|
7.0
|
%
|
|||||
|
Return on invested capital ("ROIC")
3
|
13.9
|
%
|
|
13.3
|
%
|
|
13.6
|
%
|
|
12.1
|
%
|
|
11.6
|
%
|
|||||
|
Sales per square foot
4
|
|
$470
|
|
|
$431
|
|
|
$397
|
|
|
$368
|
|
|
$388
|
|
||||
|
Ending inventory per square foot
|
|
$53.77
|
|
|
$46.41
|
|
|
$40.96
|
|
|
$39.44
|
|
|
$41.14
|
|
||||
|
Inventory turnover rate
5
|
5.37
|
|
5.56
|
|
5.56
|
|
5.41
|
|
5.20
|
|
|||||||||
|
Per Share Information
|
|||||||||||||||||||
|
Earnings per diluted share
|
|
$3.56
|
|
|
|
$3.14
|
|
|
|
$2.75
|
|
|
$2.01
|
|
|
$1.83
|
|
||
|
Dividends declared per share
|
1.08
|
|
0.92
|
|
0.76
|
|
0.64
|
|
0.64
|
|
|||||||||
|
Book value per share
|
9.71
|
|
9.42
|
|
9.27
|
|
7.22
|
|
5.62
|
|
|||||||||
|
Store Information (at year-end)
|
|||||||||||||||||||
|
Nordstrom full-line stores
|
117
|
|
117
|
|
115
|
|
112
|
|
109
|
|
|||||||||
|
Nordstrom Rack and other stores
|
123
|
|
108
|
|
89
|
|
72
|
|
60
|
|
|||||||||
|
Total square footage
|
25,290,000
|
|
24,745,000
|
|
23,838,000
|
|
22,773,000
|
|
21,876,000
|
|
|||||||||
|
1
|
Gross profit is calculated as net sales less cost of sales and related buying and occupancy costs (for all segments).
|
|
2
|
Same-store sales include sales from stores that have been open at least one full year at the beginning of the year. Fiscal year 2012 includes an extra week (the 53
rd
week) as a result of our 4-5-4 retail reporting calendar. The 53
rd
week is not included in same-store sales calculations. We also include sales from our Nordstrom online store in same-store sales because of the integration of our Nordstrom full-line stores and online store.
|
|
3
|
See Return on Invested Capital ("ROIC") (Non-GAAP financial measure) on page 26 for additional information and reconciliation to the most directly comparable GAAP financial measure.
|
|
4
|
Sales per square foot is calculated as net sales divided by weighted-average square footage. Weighted-average square footage includes a percentage of year-end square footage for new stores equal to the percentage of the year during which they were open.
|
|
5
|
Inventory turnover rate is calculated as annual cost of sales and related buying and occupancy costs (for all segments) divided by 4-quarter average inventory.
|
Nordstrom, Inc. and subsidiaries
15
Dollar, share and square footage amounts in millions except percentages, per share and per square foot amounts
OVERVIEW
Nordstrom is a leading fashion specialty retailer offering high-quality apparel, shoes, cosmetics and accessories for women, men and children. We offer a wide selection of brand name and private label merchandise through our various channels: 'Nordstrom' branded full-line stores and online at www.nordstrom.com, 'Nordstrom Rack' off-price stores, 'Last Chance' clearance store, 'HauteLook' online private sale subsidiary, 'Jeffrey' boutiques and our 'treasure&bond' philanthropic store. Our stores are located in 31 states throughout the United States. In addition, we offer our customers a loyalty program along with a variety of payment products and services, including credit and debit cards.
Our 2012 results reflected the ongoing, consistent strength of our business. For the third consecutive year, we achieved double-digit growth in net sales and earnings per diluted share, added over one billion dollars in net sales and delivered same-store sales growth of over 7%. These accomplishments reflect the high level of execution across all channels and our ongoing investments in improving the customer experience as we seek to enhance the merchandise offering, increase relevance with existing and new customers, and aggressively grow our online capabilities.
E-commerce is our fastest-growing business. We continued to make investments to improve the experience online by expanding our merchandise selection, enhancing the website and mobile experience with improvements to search, navigation and checkout, and increasing the speed of fulfillment and delivery. These investments helped drive same-store sales growth of 37% in our Direct channel on top of last year's 29% growth.
We also continue to grow through new opportunities to increase our market share. We announced plans for our initial entry into Canada, beginning with four full-line stores and with the potential for a total of eight to 10 full-line stores and 15 to 20 Rack stores. In addition, we are again increasing the pace of expansion of our Rack stores with plans to grow to over 230 stores by the end of 2016. We also announced plans to open our first full-line store in Manhattan, which will increase our exposure within a premiere retail market.
Our strong financial position enables us to invest in our stores through expansion, remodels and other initiatives to improve the customer experience. During 2012, we opened one Nordstrom full-line store, 15 Nordstrom Rack stores and relocated three Nordstrom Rack stores. Increasingly, we are using technology as an enabler of service. As an example, we now have mobile point-of-sale devices at all of our full-line and Rack stores to increase the speed at checkout and drive incremental volume. Additionally, mobile devices in our full-line stores have virtually the same functionality as our cash registers, and we continue to make progress in creating a fully mobile store environment.
Our credit business also plays an important role in reaching new customers and strengthening existing customer relationships through our Fashion Rewards program, payment products and our ability to serve customers directly through our wholly owned credit services. The Fashion Rewards program contributes to our overall results, with members shopping more frequently and spending more on average than non-members. In 2012, net sales from our members increased 23% over the prior year. With the launch of our enhanced program in early 2012, we opened over one million new accounts, and ended the year with 3.3 million active members, a 27% increase over last year. Our overall credit card portfolio also remains healthy, with delinquency and write-off trends at pre-recession levels.
Our ongoing focus on the customer drives the investments we are making to take advantage of multiple growth opportunities. The opportunities include Canada, Rack, e-commerce, Manhattan and other new full-line stores and provide a platform to deliver sustainable, profitable growth. As our business and operating model evolves with our growth, we remain focused on our overall financial goals of achieving high single-digit total sales growth and mid-teens Return on Invested Capital ("ROIC"), as these measures correlate strongly with shareholder return.
RESULTS OF OPERATIONS
Our reportable segments are Retail and Credit. Our Retail segment includes our Nordstrom branded full-line stores and website, our Nordstrom Rack stores, our Last Chance clearance store and our other retail channels including HauteLook, our Jeffrey stores and our treasure&bond store. For purposes of discussion and analysis of our results of operations, we combine our Retail segment results with revenues and expenses in the "Corporate/Other" column of our segment reporting footnote (collectively, the "Retail Business"). We analyze our results of operations through earnings before interest and income taxes for our Retail Business and earnings before income taxes for Credit, while interest expense and income taxes are discussed on a total company basis.
Similar to many other retailers, Nordstrom follows the retail 4-5-4 reporting calendar, which included an extra week in the fourth quarter of 2012 (the "53rd week"). The analysis of our results of operations, liquidity and capital resources compares the 53 weeks in 2012 to the 52 weeks in 2011. However, the 53rd week is not included in same-store sales calculations. In 2012, the 53rd week contributed approximately $0.04 to earnings per diluted share.
16
Retail Business
Summary
The following table summarizes the results of our Retail Business for the past three fiscal years:
|
Fiscal year
|
2012
|
2011
|
2010
|
||||||||||||||||||
|
|
Amount
|
|
% of net
sales
|
|
Amount
|
|
% of net
sales
|
|
Amount
|
|
% of net
sales
|
|
|||||||||
|
Net sales
|
|
$11,762
|
|
100.0
|
%
|
|
$10,497
|
|
100.0
|
%
|
|
$9,310
|
|
100.0
|
%
|
||||||
|
Cost of sales and related buying and occupancy costs
|
(7,318
|
)
|
(62.2
|
%)
|
(6,517
|
)
|
(62.1
|
%)
|
(5,831
|
)
|
(62.6
|
%)
|
|||||||||
|
Gross profit
|
4,444
|
|
37.8
|
%
|
3,980
|
|
37.9
|
%
|
3,479
|
|
37.4
|
%
|
|||||||||
|
Selling, general and administrative expenses
|
(3,166
|
)
|
(26.9
|
%)
|
(2,807
|
)
|
(26.7
|
%)
|
(2,412
|
)
|
(25.9
|
%)
|
|||||||||
|
Earnings before interest and income taxes
|
|
$1,278
|
|
10.9
|
%
|
|
$1,173
|
|
11.2
|
%
|
|
$1,067
|
|
11.5
|
%
|
||||||
Retail Business Net Sales
|
Fiscal year
|
2012
|
|
2011
|
|
2010
|
|
|||||
|
Net sales by channel:
|
|||||||||||
|
Nordstrom full-line stores
|
|
$7,964
|
|
|
$7,513
|
|
|
|
$6,995
|
|
|
|
Direct
|
1,269
|
|
913
|
|
|
705
|
|
||||
|
Nordstrom
|
9,233
|
|
8,426
|
|
7,700
|
|
|||||
|
Nordstrom Rack
|
2,445
|
|
2,045
|
|
1,691
|
|
|||||
|
Other retail
1
|
271
|
|
185
|
|
29
|
|
|||||
|
Total Retail segment
|
11,949
|
|
10,656
|
|
9,420
|
|
|||||
|
Corporate/Other
|
(187
|
)
|
(159
|
)
|
(110
|
)
|
|||||
|
Total net sales
|
|
$11,762
|
|
|
$10,497
|
|
|
$9,310
|
|
||
|
Net sales increase
|
12.1
|
%
|
12.7
|
%
|
12.7
|
%
|
|||||
|
Same-store sales increase by channel:
|
|||||||||||
|
Nordstrom full-line stores
|
3.9
|
%
|
6.0
|
%
|
7.9
|
%
|
|||||
|
Direct
|
37.1
|
%
|
29.5
|
%
|
25.1
|
%
|
|||||
|
Nordstrom
|
7.5
|
%
|
8.2
|
%
|
9.3
|
%
|
|||||
|
Nordstrom Rack
|
7.4
|
%
|
3.7
|
%
|
0.7
|
%
|
|||||
|
Total
|
7.3
|
%
|
7.2
|
%
|
8.1
|
%
|
|||||
|
Sales per square foot
|
|
$470
|
|
|
$431
|
|
|
$397
|
|
||
|
4-wall sales per square foot
2
|
|
$417
|
|
|
$394
|
|
|
$372
|
|
||
|
Percentage of net sales by merchandise category:
|
|||||||||||
|
Women’s apparel
|
31
|
%
|
33
|
%
|
34
|
%
|
|||||
|
Shoes
|
23
|
%
|
23
|
%
|
23
|
%
|
|||||
|
Men’s apparel
|
16
|
%
|
15
|
%
|
15
|
%
|
|||||
|
Women’s accessories
|
13
|
%
|
12
|
%
|
12
|
%
|
|||||
|
Cosmetics
|
11
|
%
|
11
|
%
|
10
|
%
|
|||||
|
Kids’ apparel
|
3
|
%
|
3
|
%
|
3
|
%
|
|||||
|
Other
|
3
|
%
|
3
|
%
|
3
|
%
|
|||||
|
Total
|
100
|
%
|
100
|
%
|
100
|
%
|
|||||
1
Other retail includes our HauteLook online private sale subsidiary, our Jeffrey stores and our treasure&bond store.
2
4-wall sales per square foot is calculated as sales for Nordstrom full-line, Nordstrom Rack, Jeffrey and treasure&bond stores divided by their weighted-average square footage. Weighted-average square footage includes a percentage of period-end square footage for new stores equal to the percentage of the period during which they were open.
Nordstrom, Inc. and subsidiaries
17
NET SALES –
2012
VS
2011
Our total net sales increase of
12.1%
for
2012
was driven by the same-store sales increase of 7.3% and strong performances across all channels. Our sales productivity continued to improve, reaching a high of
$470
in sales per square foot in 2012 from increases in both our stores and online. During the year, we opened
one
Nordstrom full-line store,
15
Nordstrom Rack stores and relocated
three
Nordstrom Rack stores. These additions represented
1.5%
of our total net sales for
2012
, and increased our square footage by
2.2%
. The 53rd week contributed approximately $162 in additional net sales.
Nordstrom net sales for
2012
were
$9,233
, an
increase
of
9.6%
compared with
2011
, with same-store sales up
7.5%
. Our sales growth was due in large part to the ongoing, consistent strength of our business both in store and online. We enhanced our Fashion Rewards loyalty program and expanded our relationship with our customers. At the same time, we made investments to improve the in-store, online and mobile experience. Both the number of items sold and the average selling price increased in
2012
compared with
2011
. Category highlights included
Handbags
,
Men's Shoes
,
Men's Apparel
and
Cosmetics
. We also saw improvements in our Women's Apparel business in the second half of the year.
Full-line net sales for
2012
were
$7,964
, an increase of
6.0%
compared with
2011
, with same-store sales up
3.9%
. The top-performing geographic regions for full-line stores for
2012
were the
South
and
Midwest
. The Direct channel continued to show strong sales growth with net sales of
$1,269
, an
increase
of 39% compared with
2011
, with same-store sales up
37%
on a comparable 52-week basis. These increases significantly outpaced our overall performance and are reflective of how customers are responding to our ongoing e-commerce initiatives.
Nordstrom Rack net sales were
$2,445
, an
increase
of 20% compared with
2011
, while same-store sales increased
7.4%
for the year.
Men's Apparel
,
Shoes
and
Women's Apparel
were the strongest performing categories for the year. Both the number of items sold and the average selling price increased in
2012
compared with
2011
.
NET SALES –
2011
VS
2010
Net sales for
2011
increased
12.7%
compared with
2010
, while same-store sales increased
7.2%
. During
2011
, we opened
three
Nordstrom full-line stores,
18
Nordstrom Rack stores and one treasure&bond store, relocated
two
Nordstrom Rack stores and acquired HauteLook. These additions represented
4.0%
of our total net sales for
2011
, and increased our square footage by
3.8%
.
Nordstrom net sales for
2011
were
$8,426
, up
9.4%
compared with
2010
, with same-store sales up
8.2%
. Our sales growth was driven by our merchandising, inventory management and multi-channel initiatives as well as our efforts to build stronger relationships with customers and to improve the shopping experience across all channels. Both the average selling price and the number of items sold increased in
2011
compared with
2010
. Category highlights included
Designer
,
Handbags
and
Shoes
.
Full-line net sales for
2011
were
$7,513
, an increase of
7.4%
compared with
2010
, with same-store sales up
6.0%
. The top-performing geographic regions for full-line stores for
2011
were the
South
and
Midwest
. The Direct channel continued to show strong sales growth with net sales of
$913
, an
increase
of
30%
in
2011
compared with
2010
.
Nordstrom Rack net sales were
$2,045
, up
21%
compared with
2010
, while same-store sales increased
3.7%
for the year.
Shoes
,
Dresses
and
Accessories
were the strongest performing categories for the year. Both the average selling price and the number of items sold increased in
2011
compared with
2010
.
18
Retail Business Gross Profit
|
Fiscal year
|
2012
|
|
2011
|
|
2010
|
|
|||||
|
Gross profit
1
|
|
$4,444
|
|
|
$3,980
|
|
|
|
$3,479
|
|
|
|
Gross profit rate
|
37.8
|
%
|
37.9
|
%
|
|
37.4
|
%
|
||||
|
Ending inventory per square foot
|
|
$53.77
|
|
|
$46.41
|
|
|
$40.96
|
|
||
|
Inventory turnover rate
2
|
5.37
|
|
5.56
|
|
5.56
|
|
|||||
|
1
|
Retailers do not uniformly record the costs of buying and occupancy and supply chain operations (freight, purchasing, receiving, distribution, etc.) between gross profit and selling, general and administrative expense. As such, our gross profit and selling, general and administrative expenses and rates may not be comparable to other retailers' expenses and rates.
|
|
2
|
Inventory turnover rate is calculated as annual cost of sales and related buying and occupancy costs (for all segments) divided by 4-quarter average inventory.
|
GROSS PROFIT –
2012
VS
2011
Retail gross profit
increased
$464
in
2012
compared with
2011
due to our strong sales performance, partially offset by an increase in occupancy costs for our investments in new stores and remodeling of existing stores. Our gross profit rate decreased 13 basis points compared with
2011
primarily due to accelerated Rack growth, which carries a lower gross profit rate relative to our other channels, and overall occupancy costs that outpace sales in the early years following a store opening. With Rack's high sales productivity and return on invested capital, as well as the availability of what we believe are numerous quality locations, we plan to continue to grow our Rack channel.
Our inventory turnover rate decreased to 5.37 times in 2012, from 5.56 times in 2011. This was primarily due to our increased investment in pack and hold inventory at Nordstrom Rack, which involves the acquisition of merchandise from some of our top brands in advance of the upcoming selling seasons in order to take advantage of strategic buying opportunities. We hold this inventory in our warehouses for six months on average until the next selling season and it represents approximately 10% of our total inventory at the end of 2012 compared with 3% in 2011. On a per square foot basis, we ended the year with a
15.8%
increase
in our ending inventory on a
9.0%
increase
in sales compared with 2011. The increase in ending inventory per square foot relative to the increase in sales per square foot is primarily due to Rack's growth.
GROSS PROFIT –
2011
VS
2010
Retail gross profit
increased
$501
in
2011
compared with
2010
primarily due to higher sales and merchandise margin, partially offset by increases in occupancy costs for stores opened during both
2011
and
2010
. Our gross profit rate improved 54 basis points compared with
2010
primarily due to leveraging buying and occupancy costs on higher net sales. Our increase in ending inventory per square foot of
13.3%
on an 8.5% increase in sales per square foot is a result of our growth initiatives including expansion of our Rack business.
Retail Business Selling, General and Administrative Expenses
|
Fiscal year
|
2012
|
|
2011
|
|
2010
|
|
|||||
|
Selling, general and administrative expenses
|
|
$3,166
|
|
|
$2,807
|
|
|
$2,412
|
|
||
|
Selling, general and administrative rate
|
26.9
|
%
|
26.7
|
%
|
25.9
|
%
|
|||||
SELLING, GENERAL AND ADMINISTRATIVE EXPENSES –
2012
VS
2011
Our Retail selling, general and administrative expenses ("Retail SG&A")
increased
$359
in
2012
compared with
2011
. This increase reflects the investments we made to improve the customer experience across all channels and specifically in our e-commerce business as we expanded our capabilities and increased the speed of fulfillment and delivery. The increase also reflected higher sales volume and the opening of 16 stores in
2012
. Our Retail SG&A rate increased 18 basis points for
2012
compared with
2011
due to the increased investments, partially offset by leverage on increased sales.
SELLING, GENERAL AND ADMINISTRATIVE EXPENSES –
2011
VS
2010
Our Retail SG&A expenses
increased
$395
in
2011
compared with
2010
. This increase reflects initiatives to improve the shopping experience across all channels and specifically to grow our e-commerce business. The increase was also due in part to higher sales volume and the opening of 22 stores in
2011
. As a result, our Retail SG&A rate increased 84 basis points for
2011
compared with
2010
. We continued to leverage SG&A expense in our stores, with an improvement of approximately 35 basis points in
2011
, compared with
2010
.
Nordstrom, Inc. and subsidiaries
19
Credit Segment
The Nordstrom credit and debit card products are designed to strengthen customer relationships and grow retail sales by providing loyalty benefits, valuable services and payment products. We believe that owning all aspects of our credit business allows us to build deeper relationships with our customers by fully integrating our rewards program with our retail stores and providing better service, which in turn fosters greater customer loyalty. Our cardholders tend to visit our stores more frequently and spend more with us than non-cardholders, and we believe the Nordstrom Fashion Rewards
®
program helps drive sales in our Retail segment. Our Nordstrom private label credit and debit cards can be used only in our Nordstrom full-line and Rack stores and on our website ("inside volume"), while our Nordstrom VISA cards also may be used for purchases outside of Nordstrom ("outside volume"). Cardholders participate in the Nordstrom Fashion Rewards program through which customers accumulate points based on their level of spending. Upon reaching a certain threshold, customers receive Nordstrom Notes
®
, which can be redeemed for goods or services in our full-line stores, at Nordstrom Rack and online. Fashion Rewards customers receive a credit for complimentary alterations and a personal triple points day, in addition to early access to sales events. With increased spending, they can receive additional amounts of these benefits as well as access to exclusive fashion and shopping events.
The table below provides a detailed view of the operational results of our Credit segment, consistent with the segment disclosure provided in the Notes to Consolidated Financial Statements. In order to better reflect the economic contribution of our credit and debit card program, intercompany merchant fees are also included in the table below, which represents the estimated costs that would be incurred if our customers used third-party cards.
Interest expense is assigned to the Credit segment in proportion to the amount of estimated debt and equity needed to fund our credit card receivables. Based on our research, debt as a percentage of credit card receivables for other credit card companies ranges from 70% to 90%. As such, we believe a mix of 80% debt and 20% equity, as represented by the average credit card receivable investment metric below, is appropriate.
1
Assumes 80% of accounts receivable is funded with debt.
|
Fiscal year
|
2012
|
2011
|
2010
|
||||||||||||||||||
|
|
Amount
|
|
% of average credit card
receivables
|
|
Amount
|
|
% of average credit card
receivables
|
|
Amount
|
|
% of average credit card
receivables
|
|
|||||||||
|
Credit card revenues
|
|
$386
|
|
18.6
|
%
|
|
$380
|
|
18.6
|
%
|
|
$390
|
|
18.7
|
%
|
||||||
|
Interest expense
|
(26
|
)
|
(1.2
|
%)
|
(13
|
)
|
(0.7
|
%)
|
(21
|
)
|
(1.0
|
%)
|
|||||||||
|
Net credit card income
|
360
|
|
17.3
|
%
|
367
|
|
17.9
|
%
|
369
|
|
17.7
|
%
|
|||||||||
|
Cost of sales and related buying and occupancy costs – loyalty program
|
(114
|
)
|
(5.5
|
%)
|
(75
|
)
|
(3.7
|
%)
|
(66
|
)
|
(3.2
|
%)
|
|||||||||
|
Selling, general and administrative expenses
|
(205
|
)
|
(9.8
|
%)
|
(229
|
)
|
(11.2
|
%)
|
(273
|
)
|
(13.1
|
%)
|
|||||||||
|
Total expense
|
(319
|
)
|
(15.3
|
%)
|
(304
|
)
|
(14.9
|
%)
|
(339
|
)
|
(16.3
|
%)
|
|||||||||
|
Credit segment earnings before income taxes, as presented in segment disclosure
|
41
|
|
2.0
|
%
|
63
|
|
3.1
|
%
|
30
|
|
1.4
|
%
|
|||||||||
|
Intercompany merchant fees
|
89
|
|
4.3
|
%
|
71
|
|
3.5
|
%
|
58
|
|
2.8
|
%
|
|||||||||
|
Credit segment contribution, before income taxes
|
|
$130
|
|
6.3
|
%
|
|
$134
|
|
6.6
|
%
|
|
$88
|
|
4.2
|
%
|
||||||
|
Credit and debit card volume:
|
|||||||||||||||||||||
|
Outside
|
|
$4,305
|
|
|
$4,101
|
|
|
$3,838
|
|
||||||||||||
|
Inside
|
4,484
|
|
3,596
|
|
2,953
|
|
|||||||||||||||
|
Total volume
|
|
$8,789
|
|
|
$7,697
|
|
|
$6,791
|
|
||||||||||||
|
Average credit card receivables
|
|
$2,076
|
|
|
$2,047
|
|
|
$2,088
|
|
||||||||||||
|
Average credit card receivable investment
1
|
|
$415
|
|
|
$409
|
|
|
$418
|
|
||||||||||||
|
Credit segment contribution
2
|
19.4
|
%
|
20.0
|
%
|
12.8
|
%
|
|||||||||||||||
2
Net of tax, calculated as a percentage of our average credit card receivable investment.
20
Credit Card Revenues
|
Fiscal year
|
2012
|
|
2011
|
|
2010
|
|
|||||
|
Finance charge revenue
|
|
$254
|
|
|
$251
|
|
|
$266
|
|
||
|
Interchange — third party
|
84
|
|
82
|
|
76
|
|
|||||
|
Late fees and other revenue
|
48
|
|
47
|
|
48
|
|
|||||
|
Total credit card revenues
|
|
$386
|
|
|
$380
|
|
|
$390
|
|
||
Credit card revenues include finance charges, interchange fees, late fees and other revenue. Finance charges represent interest earned on unpaid balances while interchange fees are earned from the use of Nordstrom VISA credit cards at merchants outside of Nordstrom. Late fees are assessed when a credit card account becomes delinquent. We consider an account delinquent if the minimum payment is not received by the payment due date.
CREDIT CARD REVENUES –
2012
VS
2011
Credit card revenues
increased
$6
in
2012
compared with
2011
primarily due to an extra week (the 53
rd
week) of revenue in 2012 as a result of our 4-5-4 retail reporting calendar. The increase is also due to growth in total volume that was offset by continued improvements in customer payment rates. Our average credit card receivable balance in
2012
was
$2,076
, an
increase
of
$29
, or
1.4%
, from
2011
.
CREDIT CARD REVENUES –
2011
VS
2010
Credit card revenues
decreased
$10
in
2011
compared with
2010
primarily due to a decrease in finance charge revenue resulting from continued improvements in customer payment rates that drove lower finance charge yields and slightly lower receivables. Our average credit card receivable balance in
2011
was
$2,047
, a decrease of
$41
, or
1.9%
, from
2010
. These decreases were partially offset by an increase in interchange revenue due to increased use of our Nordstrom VISA credit cards at third parties.
Credit Segment Interest Expense
Interest expense
increased
to
$26
in
2012
from
$13
in
2011
and
$21
in
2010
primarily due to higher average interest rates applicable to the Credit segment.
Credit Segment Cost of Sales and Related Buying and Occupancy Costs
COST OF SALES AND RELATED BUYING AND OCCUPANCY COSTS –
2012
VS
2011
Cost of sales and related buying and occupancy costs, which include the estimated cost of Nordstrom Notes that we expect to issue and ultimately be redeemed and complimentary alterations under our Fashion Rewards program, increased to
$114
in
2012
compared with
$75
in
2011
. The increase was due to enhancements to our Fashion Rewards program and
increases
in Nordstrom credit and debit card volumes of
14.2%
. We provide the Fashion Rewards benefits to our members, as participation in the program enhances customer loyalty and drives incremental sales in our stores and online.
COST OF SALES AND RELATED BUYING AND OCCUPANCY COSTS –
2011
VS
2010
Cost of sales and related buying and occupancy costs
increased
to
$75
in
2011
compared with
$66
in
2010
. The increase was due to additional expenses related to the Fashion Rewards program as a result of a
13.3%
increase
in volume on Nordstrom credit and debit cards and increased utilization of program benefits.
Credit Segment Selling, General and Administrative Expenses
|
Fiscal year
|
2012
|
|
2011
|
|
2010
|
|
|||||
|
Operational and marketing expenses
|
|
$149
|
|
|
$128
|
|
|
$124
|
|
||
|
Bad debt provision
|
56
|
|
101
|
|
149
|
|
|||||
|
Total Credit selling, general and administrative expenses
|
|
$205
|
|
|
$229
|
|
|
$273
|
|
||
SELLING, GENERAL AND ADMINISTRATIVE EXPENSES –
2012
VS
2011
Total Credit SG&A
decreased
$24
in
2012
compared with
2011
, due to lower bad debt expense, partially offset by increases in operational and marketing expenses. The decrease in bad debt expense reflects continued improvement in our portfolio delinquencies and write-off results, which are further discussed below. The increase in operational and marketing expenses was primarily driven by enhancements in our Fashion Rewards benefits.
SELLING, GENERAL AND ADMINISTRATIVE EXPENSES –
2011
VS
2010
Total Credit SG&A
decreased
$44
in
2011
compared with 2010, due primarily to lower bad debt expense. The decrease in bad debt expense reflected continued improvement in our portfolio trends, the overall performance of our credit portfolio and economic trends.
Nordstrom, Inc. and subsidiaries
21
Allowance for Credit Losses and Credit Trends
The following table illustrates activity in the allowance for credit losses:
|
Fiscal year
|
2012
|
|
2011
|
|
2010
|
|
|||||
|
Allowance at beginning of year
|
|
$115
|
|
|
$145
|
|
|
$190
|
|
||
|
Bad debt provision
|
56
|
|
101
|
|
149
|
|
|||||
|
Write-offs
|
(111
|
)
|
(153
|
)
|
(211
|
)
|
|||||
|
Recoveries
|
25
|
|
22
|
|
17
|
|
|||||
|
Allowance at end of year
|
|
$85
|
|
|
$115
|
|
|
$145
|
|
||
|
Net write-offs as a percentage of average credit card receivables
|
4.1
|
%
|
6.3
|
%
|
9.2
|
%
|
|||||
|
30+ days delinquent as a percentage of ending credit card receivables
|
1.9
|
%
|
2.6
|
%
|
3.0
|
%
|
|||||
|
Allowance as a percentage of ending credit card receivables
|
4.0
|
%
|
5.5
|
%
|
6.9
|
%
|
|||||
CREDIT TRENDS
During
2012
, our delinquency and net write-off results continued the improvements that began in 2010. Net write-offs in
2012
were
$86
, a significant improvement over
2011
of $131 and 2010 of $194. As delinquencies improved in both
2012
and
2011
, and combined with the net write-off results, we reduced our allowance for credit losses by
$30
in both
2012
and
2011
.
CREDIT QUALITY
The quality of our credit card receivables at any time reflects, among other factors, general economic conditions, the creditworthiness of our cardholders and the success of our account management and collection activities. In general, credit quality tends to decline, and the risk of credit losses tends to increase, during periods of deteriorating economic conditions. Through our underwriting and risk management standards and practices, we seek to maintain a high-quality cardholder portfolio, thereby mitigating our exposure to credit losses. As of
February 2, 2013
,
78.3%
of our credit card receivables were from cardholders with FICO scores of 660 or above (generally considered "prime" according to industry standards) compared with
78.1%
as of
January 28, 2012
.
Intercompany Merchant Fees
Intercompany merchant fees represent the estimated costs that would be incurred if our customers used third-party cards in our Nordstrom stores and online. In 2012, these fees increased to $89 or 4.3% of average credit card receivables from $71 or 3.5% in 2011. This was primarily driven by the increased use of our credit and debit cards in store and online, as reflected by an increase in inside volume as a percent of total volume from 46.7% in 2011 to 51.0% in 2012.
Total Company Results
Interest Expense, Net
|
Fiscal year
|
2012
|
|
|
2011
|
|
|
2010
|
|
|||
|
Interest on long-term debt and short-term borrowings
|
|
$167
|
|
|
$139
|
|
|
$133
|
|
||
|
Less:
|
|||||||||||
|
Interest income
|
(2
|
)
|
(2
|
)
|
(1
|
)
|
|||||
|
Capitalized interest
|
(5
|
)
|
(7
|
)
|
(5
|
)
|
|||||
|
Interest expense, net
|
|
$160
|
|
|
$130
|
|
|
$127
|
|
||
INTEREST EXPENSE, NET –
2012
VS
2011
Interest expense, net
increased
$30
in
2012
compared with
2011
due to higher average interest rates and higher average debt balances.
INTEREST EXPENSE, NET –
2011
VS
2010
Interest expense, net
increased
$3
in
2011
compared with
2010
due to higher debt balances, partially offset by lower average interest rates.
22
Income Tax Expense
|
Fiscal year
|
2012
|
|
2011
|
|
2010
|
|
|||||
|
Income tax expense
|
|
$450
|
|
|
$436
|
|
|
$378
|
|
||
|
Effective tax rate
|
38.0
|
%
|
39.0
|
%
|
38.2
|
%
|
|||||
The following table illustrates the components of our effective tax rate for
2012
,
2011
and
2010
:
|
Fiscal year
|
2012
|
|
2011
|
|
2010
|
|
||
|
Statutory rate
|
35.0
|
%
|
35.0
|
%
|
35.0
|
%
|
||
|
State and local income taxes, net of federal income taxes
|
3.6
|
|
3.6
|
|
3.4
|
|
||
|
Non-taxable acquisition-related items
|
—
|
|
0.6
|
|
—
|
|
||
|
Other, net
|
(0.6
|
)
|
(0.2
|
)
|
(0.2
|
)
|
||
|
Effective tax rate
|
38.0
|
%
|
39.0
|
%
|
38.2
|
%
|
||
INCOME TAX EXPENSE
The
decrease
in the effective tax rate for
2012
compared with
2011
and the increase in 2011 compared with 2010 was primarily due to the impact of non-taxable HauteLook acquisition-related expenses in 2011, including a goodwill impairment.
Fourth Quarter Results
|
Quarter ended
|
February 2, 2013
|
|
January 28, 2012
|
|
|||
|
Net sales
|
|
$3,596
|
|
|
$3,169
|
|
|
|
Credit card revenues
|
106
|
|
97
|
|
|||
|
Gross profit
|
1,357
|
|
1,196
|
|
|||
|
Gross profit (% of net sales)
|
37.8
|
%
|
37.7
|
%
|
|||
|
Selling, general and administrative ("SG&A") expenses:
|
|
|
|
||||
|
Retail
|
(912
|
)
|
(818
|
)
|
|||
|
Retail SG&A (% of net sales)
|
25.4
|
%
|
25.8
|
%
|
|||
|
Credit
|
(53
|
)
|
(58
|
)
|
|||
|
Net earnings
|
284
|
|
236
|
|
|||
|
Earnings per diluted share
|
|
$1.40
|
|
|
$1.11
|
|
|
Nordstrom's fourth quarter performance was consistent with the strong trends the company experienced throughout
2012
. Net earnings for the fourth quarter of
2012
were $
284
, or $
1.40
per diluted share, compared with
$236
, or
$1.11
per diluted share, in
2011
. The 53
rd
week contributed approximately $0.04 to earnings per diluted share in
2012
.
Nordstrom, Inc. and subsidiaries
23
NET SALES
The total net sales increase for the fourth quarter of
13.5%
was driven by the same-store sales increase of 6.3% and the impact of the 53rd week, which contributed approximately $162 in additional net sales.
Nordstrom net sales for the fourth quarter of
2012
increased
$273
, or
10.5%
compared with the same period in
2011
, with an increase in same-store sales of
6.1%
. Both the number of items sold and the average selling price of our merchandise increased for the fourth quarter of
2012
, compared with the same period last year. Category highlights for the quarter were
Men's Apparel
,
Cosmetics
,
Kids' Apparel
and
Women's Apparel
.
Full-line net sales for the quarter increased
$147
, or
6.6%
compared with the same period in
2011
, with an increase in same-store sales of
2.2%
. The top-performing geographic regions for full-line stores for the quarter were the
South
and
Midwest
. Direct increased same-store sales 31% in the fourth quarter on top of last year's 35% increase for the same period. Direct sales growth continues to outpace the overall Company, reflecting ongoing initiatives to improve the customer experience online.
Nordstrom Rack net sales for the quarter
increased
$131
, or
23%
, primarily from opening 15 new Rack stores in 2012 and 18 in 2011, while same-store sales increased
7.1%
compared with the fourth quarter of
2011
. Both the average selling price of Nordstrom Rack merchandise and the number of items sold increased for the quarter, compared with the same period in the prior year.
Men's Apparel
and
Shoes
were the leading categories for Nordstrom Rack.
GROSS PROFIT
Our total company gross profit rate was flat compared with the same period in the prior year. Markdown improvements were offset by higher expenses associated with our enhanced Fashion Rewards program, which generated incremental sales and attracted new members. Our ending inventory per square foot increased 15.8% on an 11.1% increase in sales per square foot compared with the fourth quarter of
2011
. The increase in ending inventory per square foot relative to the increase in sales per square foot is primarily due to our increased investment in pack and hold inventory associated with Rack's growth.
SELLING, GENERAL & ADMINISTRATIVE EXPENSES
Selling, general and administrative expenses for our Retail Business
increased
$94
compared with last year's fourth quarter. The increase was primarily attributable to higher sales volume and the opening of 16 new stores since the fourth quarter of 2011. The increase also reflected our initiatives to improve the customer experience across all channels, including higher planned fulfillment expenses. Our Retail SG&A rate decreased 45 basis points, due to leverage on increased sales, partially offset by increases in fulfillment costs associated with improving the speed of delivery for shipped sales.
In the fourth quarter, selling, general and administrative expenses for our Credit segment were
$53
, down from
$58
in
2011
. The decrease was primarily driven by lower bad debt expense resulting from continued improvements in delinquencies and write-off results within our portfolio.
For further information on our quarterly results in
2012
and
2011
, refer to Note 17: Selected Quarterly Data in the Notes to Consolidated Financial Statements in Item 8: Financial Statements and Supplementary Data.
24
2013
Outlook
Our expectations for
2013
, which are shown in comparison to the 53-week fiscal 2012 where applicable, are as follows:
|
Total sales
|
4.5 to 6.5 percent increase
|
|
Same-store sales
1
|
3.5 to 5.5 percent increase
|
|
Credit card revenues
|
$0 to $5 increase
|
|
Gross profit rate
2
|
10 to 30 basis point decrease
|
|
Selling, general and administrative expenses:
|
|
|
Retail (% of net sales)
|
10 to 30 basis point decrease
|
|
Credit
|
$20 to $30 increase
|
|
Interest expense, net
|
$5 decrease
|
|
Effective tax rate
|
39.0 percent
|
|
Earnings per diluted share
3
|
$3.65 to $3.80
|
|
Diluted shares outstanding
3
|
Approximately 203
|
1
Beginning in 2013, HauteLook will be included in same-store sales. 2013 same-store sales are compared with the first 52 weeks of 2012.
2
Includes both our Retail gross profit and the cost of our loyalty program, which is recorded in our Credit segment, as a percentage of net sales.
3
This outlook does not include the impact of any future share repurchases.
To date in
2013
, we have opened two Nordstrom Rack stores. We plan to open more than 20 Nordstrom Rack stores (of which
16
have been formally announced) and relocate one Nordstrom full-line store and two Nordstrom Rack stores during 2013. The announced store openings will increase our retail square footage by approximately
2.2%
.
Included in our guidance are upfront infrastructure expenses for Canada, as well as organizational and incremental pre-opening expenses related to Rack's store expansion. In 2013, we expect these costs to be approximately $20 to $25.
We expect our gross profit rate to decrease approximately
10 to 30 basis point
s. The decrease is expected as a result of an increasing mix of Nordstrom Rack stores and continued growth in our Fashion Rewards program.
The decrease in our Retail SG&A rate relates to our expectation of leverage on higher sales.
For our Credit segment, we expect credit card revenues to remain relatively consistent with 2012 and Credit SG&A expenses to increase $20 to $30 when compared with 2012 results given the $30 reduction in the allowance for credit losses recognized in 2012, with none expected for 2013.
Nordstrom, Inc. and subsidiaries
25
Return on Invested Capital ("ROIC") (Non-GAAP financial measure)
We define ROIC as follows:
|
ROIC =
|
|
Net Operating Profit After Taxes
|
|
|
Average Invested Capital
|
|
For the 12 fiscal months ended
February 2, 2013
, our ROIC
increased
to
13.9%
compared with
13.3%
for the 12 fiscal months ended
January 28, 2012
. Our ROIC
increased
compared with the prior year primarily due to an increase in our earnings before interest and income tax expense.
We believe that ROIC is a useful financial measure for investors in evaluating our operating performance. When analyzed in conjunction with our net earnings and total assets and compared with return on assets (net earnings divided by average total assets), it provides investors with a useful tool to evaluate our ongoing operations and our management of assets from period to period. ROIC is one of our key financial metrics, and we also incorporate it into our executive incentive measures. We believe that overall performance as measured by ROIC correlates directly to shareholders' return over the long term. ROIC is not a measure of financial performance under GAAP, should not be considered a substitute for return on assets, net earnings or total assets as determined in accordance with GAAP and may not be comparable with similarly titled measures reported by other companies. The closest measure calculated using GAAP amounts is return on assets, which
increased
to
8.9%
from
8.7%
for the 12 fiscal months ended
February 2, 2013
, compared with the 12 fiscal months ended
January 28, 2012
. The following is a comparison of return on assets to ROIC:
|
|
12 Fiscal months ended
|
||||||||||||||||||
|
|
February 2, 2013
|
|
January 28, 2012
|
|
January 29, 2011
|
|
January 30, 2010
|
|
January 31, 2009
|
|
|||||||||
|
Net earnings
|
|
$735
|
|
|
$683
|
|
|
$613
|
|
|
$441
|
|
|
$401
|
|
||||
|
Add: income tax expense
|
450
|
|
436
|
|
378
|
|
255
|
|
247
|
|
|||||||||
|
Add: interest expense
|
162
|
|
132
|
|
128
|
|
138
|
|
131
|
|
|||||||||
|
Earnings before interest and income tax expense
|
1,347
|
|
1,251
|
|
1,119
|
|
834
|
|
779
|
|
|||||||||
|
Add: rent expense
|
105
|
|
78
|
|
62
|
|
43
|
|
37
|
|
|||||||||
|
Less: estimated depreciation on capitalized operating leases
1
|
(56
|
)
|
(42
|
)
|
(32
|
)
|
(23
|
)
|
(19
|
)
|
|||||||||
|
Net operating profit
|
1,396
|
|
1,287
|
|
1,149
|
|
854
|
|
797
|
|
|||||||||
|
Estimated income tax expense
2
|
(530
|
)
|
(501
|
)
|
(439
|
)
|
(313
|
)
|
(303
|
)
|
|||||||||
|
Net operating profit after tax
|
|
$866
|
|
|
$786
|
|
|
$710
|
|
|
$541
|
|
|
$494
|
|
||||
|
Average total assets
3
|
|
$8,274
|
|
|
$7,890
|
|
|
$7,091
|
|
|
$6,197
|
|
|
$5,768
|
|
||||
|
Less: average non-interest-bearing current liabilities
4
|
(2,262
|
)
|
(2,041
|
)
|
(1,796
|
)
|
(1,562
|
)
|
(1,447
|
)
|
|||||||||
|
Less: average deferred property incentives
3
|
(494
|
)
|
(504
|
)
|
(487
|
)
|
(462
|
)
|
(400
|
)
|
|||||||||
|
Add: average estimated asset base of capitalized operating leases
5
|
724
|
|
555
|
|
425
|
|
311
|
|
322
|
|
|||||||||
|
Average invested capital
|
|
$6,242
|
|
|
$5,900
|
|
|
$5,233
|
|
|
$4,484
|
|
|
$4,243
|
|
||||
|
Return on assets
|
8.9
|
%
|
8.7
|
%
|
8.6
|
%
|
7.1
|
%
|
7.0
|
%
|
|||||||||
|
ROIC
|
13.9
|
%
|
13.3
|
%
|
13.6
|
%
|
12.1
|
%
|
11.6
|
%
|
|||||||||
|
1
|
Capitalized operating leases is our best estimate of the asset base we would record for our leases that are classified as operating if they had met the criteria for a capital lease, or we purchased the property. Asset base is calculated as described in footnote 5 below.
|
|
2
|
Based upon our effective tax rate multiplied by the net operating profit for the 12 fiscal months ended
February 2, 2013
,
January 28, 2012
, January 29, 2011, January 30, 2010 and January 31, 2009.
|
|
3
|
Based upon the trailing 12-month average.
|
|
4
|
Based upon the trailing 12-month average for accounts payable, accrued salaries, wages and related benefits, and other current liabilities.
|
|
5
|
Based upon the trailing 12-month average of the monthly asset base, which is calculated as the trailing 12-months rent expense multiplied by eight. The multiple of eight times rent expense is a commonly used method of estimating the asset base we would record for our capitalized operating leases described in footnote 1.
|
26
LIQUIDITY AND CAPITAL RESOURCES
We maintain a level of liquidity sufficient to allow us to cover our seasonal cash needs and to maintain appropriate levels of short-term borrowings. We believe that our operating cash flows, available credit facilities and potential future borrowings are sufficient to finance our cash requirements for the next 12 months and beyond.
Over the long term, we manage our cash and capital structure to maximize shareholder return, maintain our financial position, manage refinancing risk and allow flexibility for strategic initiatives. We regularly assess our debt and leverage levels, capital expenditure requirements, debt service payments, dividend payouts, potential share repurchases and other future investments. We believe that as of
February 2, 2013
, our existing cash and cash equivalents on-hand of $1,285, operating cash flows of $1,110, available credit facilities of $900 and potential future borrowings will be sufficient to fund these scheduled future payments and potential long-term initiatives.
Operating Activities
Net cash
provided by
operating activities was
$1,110
in
2012
and
$1,177
in
2011
. The majority of our operating cash inflows are derived from sales. We also receive cash payments for property incentives from developers. Our operating cash outflows generally consist of payments to our merchandise vendors (net of vendor allowances), payments to our employees for wages, salaries and other employee benefits and payments to our landlords for rent. Operating cash outflows also include payments for income taxes and interest payments on our short-term and long-term borrowings.
Cash
provided by
operating activities
decreased
in
2012
compared with
2011
, with higher earnings offset by increased inventory purchases in conjunction with growth in sales and fewer property incentives received from developers.
In
2013
, we expect our operating cash flows to increase as a result of higher sales and earnings with less growth in inventory.
Investing Activities
Net cash
used in
investing activities was
$369
in
2012
and
$728
in
2011
. Our investing cash flows primarily consist of capital expenditures, changes in restricted cash accumulated for debt maturities and changes in credit card receivables associated with cardholder purchases outside of Nordstrom using our Nordstrom VISA credit cards.
CAPITAL EXPENDITURES
Our capital expenditures over the last three years totaled
$1,423
, with
$513
in
2012
,
$511
in
2011
and
$399
in
2010
. Capital expenditures included investments in new stores, relocations and remodels and information technology improvements.
Capital expenditures remained flat in
2012
compared with
2011
as increased spending on technology, e-commerce and remodels was offset by a decrease in new stores. The following table summarizes our store count and square footage activity:
|
|
Store count
|
Square footage
|
||||||||||||||||
|
Fiscal year
|
2012
|
|
2011
|
|
2010
|
|
2012
|
|
|
2011
|
|
|
2010
|
|
||||
|
Total, beginning of year
|
225
|
|
204
|
|
184
|
|
24.7
|
|
23.8
|
|
22.8
|
|
||||||
|
Store openings:
|
||||||||||||||||||
|
Nordstrom full-line stores
|
1
|
|
3
|
|
3
|
|
0.1
|
|
0.4
|
|
0.4
|
|
||||||
|
Nordstrom Rack and other stores
|
15
|
|
19
|
|
17
|
|
0.6
|
|
0.7
|
|
0.6
|
|
||||||
|
Closed stores
|
(1
|
)
|
(1
|
)
|
—
|
|
(0.1
|
)
|
(0.2
|
)
|
—
|
|
||||||
|
Total, end of year
|
240
|
|
225
|
|
204
|
|
25.3
|
|
24.7
|
|
23.8
|
|
||||||
We relocated
three
Nordstrom Rack stores in
2012
, compared with
two
Nordstrom Rack stores in
2011
. Our
2012
store openings and relocations increased our square footage by
2.2%
.
To date in
2013
, we have opened two Nordstrom Rack stores. We plan to open more than 20 Nordstrom Rack stores (of which
16
have been formally announced) and relocate one Nordstrom full-line store and two Nordstrom Rack stores during 2013. The announced store openings will increase our retail square footage by approximately
2.2%
.
Nordstrom, Inc. and subsidiaries
27
We received property incentives from our developers of
$58
in
2012
,
$78
in
2011
and
$95
in
2010
. These incentives are included in our cash provided by operations in our consolidated statements of cash flows. However, operationally we view these as an offset to our capital expenditures. Our capital expenditure percentages, net of property incentives, by category are summarized as follows:
|
Fiscal year
|
2012
|
|
2011
|
|
2010
|
|
||
|
Category and expenditure percentage:
|
||||||||
|
New store openings, relocations and remodels
|
54
|
%
|
62
|
%
|
67
|
%
|
||
|
Information technology
|
27
|
%
|
20
|
%
|
15
|
%
|
||
|
Other
|
19
|
%
|
18
|
%
|
18
|
%
|
||
|
Total
|
100
|
%
|
100
|
%
|
100
|
%
|
||
Other capital expenditures consist of ongoing improvements to our stores in the ordinary course of business and expenditures related to various growth initiatives.
We expect to significantly increase our capital expenditures, net of property incentives, over the next five years to approximately
$3,700
, compared with $1,900 over the previous five years. We plan to spend approximately
$750
to $790 in
2013
compared with $455 in 2012, with the increase due to new Rack and full-line stores, improvements to e-commerce delivery and fulfillment initiatives and our planned Manhattan store development. Over these next five years, we expect that approximately
55%
of our net capital expenditures will be for new store openings, relocations, remodels and other with an additional 20% for entry into Canada and Manhattan, and
25%
for e-commerce and information technology. We believe that we have the capacity for additional capital investments should opportunities arise.
CHANGE IN RESTRICTED CASH
In connection with the April 2012 maturity of our Series 2007-2 Class A & B Notes ("the Notes") totaling $500, we began making required monthly cash deposits of $100 into a restricted account in December 2011 until we accumulated $500 by April 2012 to retire the Notes. As of January 28, 2012, we had accumulated $200, which was recorded as cash paid into our restricted cash account and included in our consolidated balance sheet in prepaid expenses and other in 2011. During the first quarter of 2012, the net amount withdrawn from restricted cash of $200 was recorded as cash received from investing activities.
CHANGE IN CREDIT CARD RECEIVABLES ORIGINATED AT THIRD PARTIES
The Nordstrom VISA credit cards allow our customers to make purchases at merchants outside of our stores and accumulate points for our Nordstrom Fashion Rewards program. In
2012
, the change in credit card receivables from customers' third-party purchases using their Nordstrom VISA credit cards
increased
to
$42
, compared with
$7
in
2011
, as a result of increased volume partially offset by improved payment rates.
Financing Activities
Net cash
used in
financing activities was
$1,333
in
2012
compared with
$78
in
2011
. Our financing activities include our short-term and long-term borrowing activity, repurchases of common stock and payment of dividends.
SHORT-TERM AND LONG-TERM BORROWING ACTIVITY
We retired our $500 securitized Series 2007-2 Class A & B Notes upon maturity in April 2012 using accumulated restricted cash described in Investing Activities above. We had no short-term borrowings and no amounts outstanding on our revolving line of credit during the year.
During 2011, we issued $500 of senior unsecured notes at 4.00%, due October 2021. After deducting the original issue discount of $1, net proceeds from the offering were $499. Additionally, we issued $325 Series 2011-1 Class A Notes at 2.28%, due October 2016.
Also during 2011, we received proceeds of $72 from the sale of our interest rate swap agreements (collectively, the "swap") with a $650 notional amount maturing in 2018. Under the swap, we received a fixed rate of 6.25% and paid a variable rate based on one-month LIBOR plus a margin of 2.9%. As of February 2, 2013, the accumulated adjustment to our long-term debt was $
60
, which will be amortized as a reduction of interest expense over the remaining life of the related debt. See Note 1: Nature of Operations and Summary of Significant Accounting Policies in Item 8: Financial Statements and Supplementary Data for additional information related to our swap.
SHARE REPURCHASES
In
2012
, we completed the
$750
repurchase program authorized by our Board of Directors in
May 2011
. In
February 2012
, our Board of Directors authorized another program (the
"2012 Program"
), which allows for the repurchase of up to
$800
of our common stock through
February 1, 2014
. As of
February 2, 2013
, there was
$393
in remaining share repurchase capacity under the 2012 Program. During
2012
, we repurchased
14.0
shares of our common stock for an aggregate purchase price of
$717
. Subsequent to year-end, in February 2013, our Board of Directors authorized a new program to repurchase up to $800 of our outstanding common stock, through March 1, 2015, in addition to the remaining amount available for repurchase under the 2012 program. The actual number and timing of future share repurchases, if any, will be subject to market and economic conditions and applicable Securities and Exchange Commission rules.
28
DIVIDENDS
In
2012
, we paid dividends of
$220
, or
$1.08
per share, compared with
$197
, or
$0.92
per share, in
2011
. During the first quarter of
2012
, we increased our quarterly dividend from
$0.23
per share to
$0.27
per share. In determining the amount of dividends to pay, we analyze our dividend payout ratio and dividend yield, while taking into consideration our current and projected operating performance and liquidity. We target a
25% to 30%
dividend payout ratio, which is calculated as our dividend payments divided by net earnings.
In
February 2013
, we declared a quarterly dividend of
$0.30
per share, increased from
$0.27
per share in
2012
.
Free Cash Flow (Non-GAAP financial measure)
We define Free Cash Flow as:
Free Cash Flow = Net Cash Provided by Operating Activities – Capital Expenditures – Cash Dividends Paid +/– Change in Credit Card Receivables Originated at Third Parties +/– Change in Cash Book Overdrafts
Free Cash Flow is one of our key liquidity measures, and in conjunction with GAAP measures, provides us with a meaningful analysis of our cash flows. We believe that our ability to generate cash is best analyzed using this measure. Free Cash Flow is not a measure of liquidity under GAAP and should not be considered a substitute for operating cash flows as determined in accordance with GAAP. In addition, Free Cash Flow does have limitations:
|
•
|
Free Cash Flow does not necessarily represent funds available for discretionary use and is not necessarily a measure of our ability to fund our cash needs; and
|
|
•
|
Other companies in our industry may calculate Free Cash Flow differently than we do, limiting its usefulness as a comparative measure.
|
To compensate for these limitations, we analyze Free Cash Flow in conjunction with other GAAP financial and performance measures impacting liquidity, including operating cash flows. The closest GAAP measure calculated using GAAP amounts is net cash
provided by
operating activities, which was
$1,110
and $1,177 for the years ended
February 2, 2013
and
January 28, 2012
. The following is a reconciliation of our net cash provided by operating activities and Free Cash Flow:
|
Fiscal year
|
2012
|
|
2011
|
|
|||
|
Net cash provided by operating activities
|
|
$1,110
|
|
|
$1,177
|
|
|
|
Less: capital expenditures
|
(513
|
)
|
(511
|
)
|
|||
|
Less: cash dividends paid
|
(220
|
)
|
(197
|
)
|
|||
|
Less: change in credit card receivables originated at third parties
|
(42
|
)
|
(7
|
)
|
|||
|
Add (Less): change in cash book overdrafts
|
5
|
|
(30
|
)
|
|||
|
Free Cash Flow
|
|
$340
|
|
|
$432
|
|
|
|
Net cash used in investing activities
|
|
($369
|
)
|
|
($728
|
)
|
|
|
Net cash used in financing activities
|
|
($1,333
|
)
|
|
($78
|
)
|
|
Credit Capacity and Commitments
As of February 2, 2013, we had total short-term borrowing capacity available for general corporate purposes of $800. Of the total capacity, we had $600 under our commercial paper program, which is backed by our unsecured revolving credit facility ("revolver") that expires in June 2016, and $200 under our 2007-A Variable Funding Note ("2007-A VFN") that expires in January 2014.
Under the terms of our $600 revolver, we pay a variable rate of interest and a commitment fee based on our debt rating. The revolver is available for working capital, capital expenditures and general corporate purposes, including liquidity support for our commercial paper program. We have the option to increase the revolving commitment by up to $100, to a total of $700, provided that we obtain written consent from the lenders.
During
2012
, we had
no borrowings under our revolver
.
Our $600 commercial paper program allows us to use the proceeds to fund operating cash requirements. Under the terms of the commercial paper agreement, we pay a rate of interest based on, among other factors, the maturity of the issuance and market conditions. The issuance of commercial paper has the effect, while it is outstanding, of reducing borrowing capacity under our revolver by an amount equal to the principal amount of commercial paper.
During
2012
, we had
no issuances under our commercial paper program
.
Nordstrom, Inc. and subsidiaries
29
The 2007-A VFN has a capacity of $200 and is backed by all of the Nordstrom private label card receivables and a 90% interest in the co-branded Nordstrom VISA credit card receivables. Borrowings under the 2007-A VFN incur interest based upon one-month LIBOR plus 35 basis points. We pay a commitment fee for the facility based on the size of the commitment.
During
2012
, we had
no borrowings against this facility
.
Our wholly owned federal savings bank, Nordstrom fsb, also maintains a variable funding facility with a short-term credit capacity of $100. This facility is backed by the remaining 10% interest in the Nordstrom VISA credit card receivables and is available, if needed, to provide liquidity support to Nordstrom fsb. Borrowings under the facility incur interest at an agreed upon rate with investors in the facility.
During
2012
, Nordstrom fsb had
no borrowings against this facility
.
We have a registration statement on file with the Securities and Exchange Commission using a “shelf” registration process. Under this shelf registration process, we may offer and sell, from time to time, any combination of the securities described in a prospectus to the registration statement, including registered debt, provided we maintain Well-known Seasoned Issuer (WKSI) status.
We maintain trade and standby letters of credit to facilitate international payments. As of
February 2, 2013
, we have
$8
available under a trade letter of credit, with
$2
outstanding. We also hold a
$15
standby letter of credit, with
$1
outstanding under this facility at the end of the year.
Impact of Credit Ratings
Under the terms of our
$600
revolver, any borrowings we may enter into will accrue interest for Euro-Dollar Rate Loans at a floating rate tied to LIBOR and for Base Rate Loans at the highest of: (i) the Euro-Dollar rate plus 100 basis points, (ii) the federal funds rate plus 50 basis points and (iii) the prime rate.
The rate depends upon the type of borrowing incurred, plus in each case an applicable margin. This applicable margin varies depending upon the credit ratings assigned to our long-term unsecured debt. At the time of this report, our long-term unsecured debt ratings, outlook and resulting applicable margin were as follows:
|
Credit Ratings
|
Outlook
|
|
||
|
Moody's
|
Baa1
|
|
Stable
|
|
|
Standard & Poor's
|
A-
|
|
Stable
|
|
|
|
Base Interest
Rate
|
Applicable
Margin
|
|
|
|
Euro-Dollar Rate Loan
|
LIBOR
|
|
1.125
|
%
|
|
Base Rate Loan
|
various
|
|
0.125
|
%
|
Should the ratings assigned to our long-term unsecured debt improve, the applicable margin associated with any such borrowings may decrease, resulting in a slightly lower cost of capital under this facility. Should the ratings assigned to our long-term unsecured debt worsen, the applicable margin associated with our borrowings may increase, resulting in a slightly higher cost of capital under this facility.
The revolver requires that we maintain a leverage ratio, defined as Adjusted Debt to Earnings before Interest, Income Taxes, Depreciation, Amortization and Rent ("EBITDAR"), of less than four times (see the following additional discussion of Adjusted Debt to EBITDAR).
As of
February 2, 2013
and
January 28, 2012
, we were in compliance with this covenant. We will continue to monitor this covenant to ensure that we make any necessary adjustments to our plans, and we believe that we will remain in compliance with this covenant during 2013.
30
Adjusted Debt to EBITDAR (Non-GAAP financial measure)
Adjusted Debt to EBITDAR is one of our key financial metrics, and we believe that our debt levels are best analyzed using this measure. Our current goal is to manage debt levels to maintain an investment-grade credit rating as well as operate with an efficient capital structure for our size, growth plans and industry. Investment-grade credit ratings are important to maintaining access to a variety of short-term and long-term sources of funding, and we rely on these funding sources to continue to grow our business. We believe a higher ratio, among other factors, could result in rating agency downgrades. In contrast, we believe a lower ratio would result in a higher cost of capital and could negatively impact shareholder returns. As of
February 2, 2013
, our Adjusted Debt to EBITDAR was
2.1
compared with
2.4
as of
January 28, 2012
. The decrease was primarily the result of a reduction in debt and an increase in earnings before interest and income taxes for the 12 months ended
February 2, 2013
, compared with the 12 months ended
January 28, 2012
.
Adjusted Debt to EBITDAR is not a measure of financial performance under GAAP and should not be considered a substitute for debt to net earnings, net earnings or debt as determined in accordance with GAAP. In addition, Adjusted Debt to EBITDAR does have limitations:
|
•
|
Adjusted Debt is not exact, but rather our best estimate of the total company debt we would hold if we had purchased the property and issued debt associated with our operating leases;
|
|
•
|
EBITDAR does not reflect our cash expenditures, or future requirements for capital expenditures or contractual commitments, including leases, or the cash requirements necessary to pay interest and principal on our debt; and
|
|
•
|
Other companies in our industry may calculate Adjusted Debt to EBITDAR differently than we do, limiting its usefulness as a comparative measure.
|
To compensate for these limitations, we analyze Adjusted Debt to EBITDAR in conjunction with other GAAP financial and performance measures impacting liquidity, including operating cash flows, capital spending and net earnings. The closest measure calculated using GAAP amounts is debt to net earnings, which was
4.3
and
5.3
for
2012
and
2011
. The following is a comparison of debt to net earnings and Adjusted Debt to EBITDAR:
|
2012
1
|
|
2011
1
|
|
||||
|
Debt
|
|
$3,131
|
|
|
$3,647
|
|
|
|
Add: rent expense x 8
2
|
843
|
|
627
|
|
|||
|
Less: fair value hedge adjustment included in long-term debt
|
(60
|
)
|
(72
|
)
|
|||
|
Adjusted Debt
|
|
$3,914
|
|
|
$4,202
|
|
|
|
Net earnings
|
735
|
|
683
|
|
|||
|
Add: income tax expense
|
450
|
|
436
|
|
|||
|
Add: interest expense, net
|
160
|
|
130
|
|
|||
|
Earnings before interest and income taxes
|
1,345
|
|
1,249
|
|
|||
|
Add: depreciation and amortization expenses
|
429
|
|
371
|
|
|||
|
Add: rent expense
|
105
|
|
78
|
|
|||
|
Add: non-cash acquisition-related charges
|
10
|
|
21
|
|
|||
|
EBITDAR
|
|
$1,889
|
|
|
$1,719
|
|
|
|
Debt to Net Earnings
|
4.3
|
|
5.3
|
|
|||
|
Adjusted Debt to EBITDAR
|
2.1
|
|
2.4
|
|
|||
|
1
|
The components of Adjusted Debt are as of
February 2, 2013
and
January 28, 2012
, while the components of EBITDAR are for the 12 months ended
February 2, 2013
and
January 28, 2012
.
|
|
2
|
The multiple of eight times rent expense used to calculate Adjusted Debt is a commonly used method of estimating the debt we would record for our leases that are classified as operating if they had met the criteria for a capital lease, or we had purchased the property.
|
Nordstrom, Inc. and subsidiaries
31
Contractual Obligations
The following table summarizes our contractual obligations and the expected effect on our liquidity and cash flows as of
February 2, 2013
. We expect to fund these commitments primarily with operating cash flows generated in the normal course of business and credit available to us under existing and potential future facilities.
|
Total
|
|
|
Less than
1 year
|
|
1 – 3 years
|
|
3 – 5 years
|
|
More than
5 years
|
|
|||||||||
|
Long-term debt
|
|
$4,628
|
|
|
$173
|
|
|
$702
|
|
|
$606
|
|
|
$3,147
|
|
||||
|
Capital lease obligations
|
10
|
|
2
|
|
4
|
|
3
|
|
1
|
|
|||||||||
|
Operating leases
|
1,619
|
|
153
|
|
317
|
|
299
|
|
850
|
|
|||||||||
|
Purchase obligations
|
1,901
|
|
1,429
|
|
191
|
|
120
|
|
161
|
|
|||||||||
|
Other long-term liabilities
|
286
|
|
—
|
|
51
|
|
33
|
|
202
|
|
|||||||||
|
Total
|
|
$8,444
|
|
|
$1,757
|
|
|
$1,265
|
|
|
$1,061
|
|
|
$4,361
|
|
||||
Included in the required debt repayments disclosed above are estimated total interest payments of
$1,555
as of
February 2, 2013
, payable over the remaining life of the debt.
The capital and operating lease obligations in the table above do not include payments for operating expenses that are required by most of our lease agreements. Such expenses, which include common area charges, real estate taxes and other executory costs, totaled
$74
in
2012
,
$69
in
2011
and
$65
in
2010
. In addition, some of our leases require additional rental payments based on a percentage of our sales, referred to as "percentage rent." Percentage rent, which is also excluded from the obligations in the table above, was
$14
in
2012
,
$12
in
2011
and
$9
in
2010
.
Purchase obligations primarily consist of purchase orders for unreceived goods or services and capital expenditure commitments.
Other long-term liabilities consist of workers' compensation and general liability insurance reserves and postretirement benefits. The payment amounts presented above were estimated based on historical payment trends. Other long-term liabilities not requiring cash payments, such as deferred property incentives and deferred revenue, were excluded from the table above. Also excluded from the table above are unrecognized tax benefits of
$12
, as we are unable to reasonably estimate the timing of future cash payments, if any, for these liabilities.
Off-Balance Sheet Arrangements
We enter into commitments to extend credit to customers for use at third parties through our Nordstrom VISA credit cards. The unused credit card capacity available to our customers represents an off-balance sheet commitment. As of
February 2, 2013
, this unfunded commitment was
$15,807
.
We had no other material off-balance sheet arrangements, other than operating leases entered into in the normal course of business, during
2012
.
CRITICAL ACCOUNTING ESTIMATES
The preparation of our financial statements requires that we make estimates and judgments that affect the reported amounts of assets, liabilities, revenues and expenses, and disclosure of contingent assets and liabilities. We base our estimates on historical experience and other assumptions that we believe to be reasonable under the circumstances. Actual results may differ from these estimates. The following discussion highlights the estimates we believe are critical and should be read in conjunction with the Notes to Consolidated Financial Statements in Item 8: Financial Statements and Supplementary Data. Our management has discussed the development and selection of these critical accounting estimates with the Audit Committee of our Board of Directors and the Audit Committee has reviewed our disclosures that follow.
Allowance for Credit Losses
The allowance for credit losses reflects our best estimate of the losses inherent in our credit card receivables as of the balance sheet date, including uncollectible finance charges and fees. We estimate such credit losses based on several factors, including historical aging and delinquency trends, write-off experience, portfolio concentration and risk metrics and general economic conditions.
We believe the allowance for credit losses is adequate to cover anticipated losses in our credit card receivables under current conditions; however, significant deterioration in any of the factors mentioned above could materially change these expectations. During
2012
, our delinquency and net write-off results continued to improve. As a result, we reduced our allowance for credit losses by
$30
during
2012
, from
$115
to
$85
, and by
$30
during
2011
, from
$145
to
$115
. A
10%
change in our allowance for credit losses would have affected net earnings by
$5
for the fiscal year ended
February 2, 2013
.
32
Revenue Recognition
We recognize revenue from sales at our retail stores at the point of sale, net of an allowance for estimated sales returns. Revenue from sales to customers shipped directly from our stores, website and catalog, which includes shipping revenue when applicable, is recognized upon estimated receipt by the customer. We estimate customer merchandise returns based on historical return patterns and reduce sales and cost of sales accordingly.
Although we believe we have sufficient current and historical knowledge to record reasonable estimates of sales returns, there is a possibility that actual returns could differ from recorded amounts. In the past three years, we have made no material changes to our estimates included in the calculations of our sales return reserve. A
10%
change in the sales return reserve would have had a
$7
impact on our net earnings for the year ended
February 2, 2013
.
Inventory
Our merchandise inventories are generally stated at the lower of cost or market value using the retail inventory method. Under the retail method, the valuation of inventories and the resulting gross margins are determined by applying a calculated cost-to-retail ratio to the retail value of ending inventory. The value of our inventory on the balance sheet is then reduced by a charge to cost of sales for retail inventory markdowns taken on the selling floor. To determine if the retail value of our inventory should be marked down, we consider current and anticipated demand, customer preferences, age of the merchandise and fashion trends. Inherent in the retail inventory method are certain management judgments that may affect the ending inventory valuation as well as gross margin.
We reserve for obsolescence based on historical trends and specific identification. Our obsolescence reserve contains uncertainties as the calculations require management to make assumptions and to apply judgment regarding a number of factors, including market conditions, the selling environment, historical results and current inventory trends.
We do not believe that the assumptions used in these estimates will change significantly based on prior experience. In the past three years, we have made no material changes to our estimates included in the calculations of the obsolescence reserve. A
10%
change in the obsolescence reserve would have had
no
material impact on our net earnings for the year ended
February 2, 2013
.
Goodwill
We review our goodwill annually for impairment, or when circumstances indicate its carrying value may not be recoverable. We perform this evaluation at the reporting unit level, comprised of the principal business units within our Retail segment. To assess the fair value of our HauteLook goodwill, we utilize both an income approach and a market approach. To determine the fair value of goodwill related to nordstrom.com and Jeffrey, we utilize a market approach. We compare the fair value of the reporting unit to its carrying value to determine if there is potential goodwill impairment. If the fair value of the reporting unit is less than its carrying value, an impairment loss is recorded to the extent that the fair value of the goodwill within the reporting unit is less than the carrying value of the goodwill.
As part of our impairment testing, we utilize certain assumptions and apply judgment regarding a number of factors. Significant estimates in the market approach include identifying similar companies and acquisitions with comparable business factors such as size, growth, profitability, risk and return of investment and assessing comparable earnings or revenue multiples in estimating the fair value of the reporting unit. Assumptions in the income approach include future cash flows for the business, future growth rates and discount rates. Estimates of cash flows may differ from actual cash flows due to, among other things, economic conditions, changes to the business model or changes in operating performance. Based on the results of our
2012
review, we did not recognize an impairment loss for goodwill. Based on the results of our
2011
review, we recognized an impairment charge of
$25
related to our HauteLook goodwill. A
10%
change in the fair value of any of our reporting units would not have had an impact on our net earnings for the fiscal year ended
February 2, 2013
.
Income Taxes
We regularly evaluate the likelihood of realizing the benefit for income tax positions we have taken in various federal, state and foreign filings by considering all relevant facts, circumstances and information available to us. If we believe it is more likely than not that our position will be sustained, we recognize a benefit at the largest amount that we believe is cumulatively greater than 50% likely to be realized. Our unrecognized tax benefit was
$15
as of
February 2, 2013
and
$21
as of
January 28, 2012
.
Unrecognized tax benefits require significant management judgment regarding applicable statutes and their related interpretation, the status of various income tax audits and our particular facts and circumstances. Also, as audits are completed or statutes of limitations lapse, it may be necessary to record adjustments to our taxes payable, deferred taxes, tax reserves or income tax expense. Such adjustments did not materially impact our effective income tax rate in
2012
or
2011
.
Nordstrom, Inc. and subsidiaries
33
RECENT ACCOUNTING PRONOUNCEMENTS
See Note 1: Nature of Operations and Summary of Significant Accounting Policies in Item 8: Financial Statements and Supplementary Data to our consolidated financial statements for a discussion of recent accounting pronouncements. We do not expect any of these pronouncements to have a material effect on our results of operations, liquidity or capital resources.
Dollars in millions
INTEREST RATE RISK
We are exposed to interest rate risk primarily from changes in short-term interest rates. As of
February 2, 2013
, we had cash and cash equivalents of
$1,285
, which generate interest income at variable rates, and gross credit card receivables of
$2,142
, which generate finance charge income at a combination of fixed and variable rates. Interest rate fluctuations can affect our interest income, credit card revenues and interest expense. See Note 3: Accounts Receivable in Item 8: Financial Statements and Supplementary Data for additional information.
We use sensitivity analyses to measure and assess our interest rate risk exposure. For purposes of presenting the potential earnings effect of a reasonably possible hypothetical change in interest rates from our reporting date, we utilized two sensitivity scenarios: (i) linear growth of approximately 170 basis points over the year and (ii) linear decline of approximately 20 basis points over the year, due to the fact that current interest rates are at or near historically low levels. Other key parameters and assumptions in our sensitivity analyses include the average cash and cash equivalents balance, average credit card receivables balance and no new floating rate debt issuance. The first hypothetical scenario would result in an approximate $16 increase in future earnings, while the second hypothetical scenario would not have a material effect on future earnings.
For our long-term fixed-rate debt of
$3,131
, our exposure to interest rate risk is limited to the change in fair value of the debt. As of
February 2, 2013
, the fair value of our fixed-rate debt was
$3,665
. See Note 8: Debt and Credit Facilities and Note 9: Fair Value Measurements in Item 8: Financial Statements and Supplementary Data for additional information.
FOREIGN CURRENCY EXCHANGE RISK
The majority of our revenues, expenses and capital expenditures are transacted in U.S. dollars. However, we periodically enter into merchandise purchase orders denominated primarily in Euros. From time to time, we may use forward contracts to hedge against fluctuations in foreign currency prices. As of
February 2, 2013
, our outstanding forward contracts did not have a material impact on our consolidated financial statements.
During 2012, we announced plans to open four full-line stores in Canada beginning in 2014, and as a result we have incurred certain expenses denominated in Canadian dollars. As of February 2, 2013, activities associated with the future store openings have not had a material impact on our consolidated financial statements.
34
REPORT OF INDEPENDENT REGISTERED PUBLIC ACCOUNTING FIRM
To the Board of Directors and Shareholders of Nordstrom, Inc.
Seattle, Washington
We have audited the accompanying consolidated balance sheets of Nordstrom, Inc. and subsidiaries (the "Company") as of
February 2, 2013
and
January 28, 2012
, and the related consolidated statements of earnings, comprehensive earnings, shareholders' equity, and cash flows for each of the three years in the period ended
February 2, 2013
. These financial statements are the responsibility of the Company's management. Our responsibility is to express an opinion on the financial statements based on our audits.
We conducted our audits in accordance with the standards of the Public Company Accounting Oversight Board (United States). Those standards require that we plan and perform the audit to obtain reasonable assurance about whether the financial statements are free of material misstatement. An audit includes examining, on a test basis, evidence supporting the amounts and disclosures in the financial statements. An audit also includes assessing the accounting principles used and significant estimates made by management, as well as evaluating the overall financial statement presentation. We believe that our audits provide a reasonable basis for our opinion.
In our opinion, such consolidated financial statements present fairly, in all material respects, the financial position of Nordstrom, Inc. and subsidiaries as of
February 2, 2013
and
January 28, 2012
, and the results of their operations and their cash flows for each of the three years in the period ended
February 2, 2013
, in conformity with accounting principles generally accepted in the United States of America.
We have also audited, in accordance with the standards of the Public Company Accounting Oversight Board (United States), the Company's internal control over financial reporting as of
February 2, 2013
, based on the criteria established in
Internal Control – Integrated Framework
issued by the Committee of Sponsoring Organizations of the Treadway Commission and our report dated
March 18, 2013
expressed an unqualified opinion on the Company's internal control over financial reporting.
/s/ Deloitte & Touche LLP
Seattle, Washington
March 18, 2013
Nordstrom, Inc. and subsidiaries
35
Nordstrom, Inc.
In millions except per share amounts
|
Fiscal year
|
2012
|
|
|
2011
|
|
|
2010
|
|
|||
|
Net sales
|
|
$11,762
|
|
|
$10,497
|
|
|
$9,310
|
|
||
|
Credit card revenues
|
386
|
|
380
|
|
390
|
|
|||||
|
Total revenues
|
12,148
|
|
10,877
|
|
9,700
|
|
|||||
|
Cost of sales and related buying and occupancy costs
|
(7,432
|
)
|
(6,592
|
)
|
(5,897
|
)
|
|||||
|
Selling, general and administrative expenses:
|
|||||||||||
|
Retail
|
(3,166
|
)
|
(2,807
|
)
|
(2,412
|
)
|
|||||
|
Credit
|
(205
|
)
|
(229
|
)
|
(273
|
)
|
|||||
|
Earnings before interest and income taxes
|
1,345
|
|
1,249
|
|
1,118
|
|
|||||
|
Interest expense, net
|
(160
|
)
|
(130
|
)
|
(127
|
)
|
|||||
|
Earnings before income taxes
|
1,185
|
|
1,119
|
|
|
991
|
|
||||
|
Income tax expense
|
(450
|
)
|
(436
|
)
|
(378
|
)
|
|||||
|
Net earnings
|
|
$735
|
|
|
$683
|
|
|
$613
|
|
||
|
Earnings per share:
|
|||||||||||
|
Basic
|
|
$3.62
|
|
|
$3.20
|
|
|
$2.80
|
|
||
|
Diluted
|
|
$3.56
|
|
|
$3.14
|
|
|
|
$2.75
|
|
|
|
Weighted-average shares outstanding:
|
|||||||||||
|
Basic
|
203.0
|
|
213.5
|
|
218.8
|
|
|||||
|
Diluted
|
206.7
|
|
217.7
|
|
222.6
|
|
|||||
The accompanying Notes to Consolidated Financial Statements are an integral part of these financial statements.
Nordstrom, Inc.
Consolidated Statements of Comprehensive Earnings
In millions
|
Fiscal year
|
2012
|
|
2011
|
|
2010
|
|
|||||
|
Net earnings
|
|
$735
|
|
|
$683
|
|
|
$613
|
|
||
|
Postretirement plan adjustments, net of tax of $1, $10 and $7
|
(2
|
)
|
(16
|
)
|
(10
|
)
|
|||||
|
Comprehensive net earnings
|
|
$733
|
|
|
$667
|
|
|
$603
|
|
||
The accompanying Notes to Consolidated Financial Statements are an integral part of these financial statements.
36
Nordstrom, Inc.
In millions
|
February 2, 2013
|
|
January 28, 2012
|
|
||||
|
Assets
|
|||||||
|
Current assets:
|
|||||||
|
Cash and cash equivalents
|
|
$1,285
|
|
|
$1,877
|
|
|
|
Accounts receivable, net
|
2,129
|
|
2,033
|
|
|||
|
Merchandise inventories
|
1,360
|
|
1,148
|
|
|||
|
Current deferred tax assets, net
|
227
|
|
220
|
|
|||
|
Prepaid expenses and other
|
80
|
|
282
|
|
|||
|
Total current assets
|
5,081
|
|
5,560
|
|
|||
|
Land, buildings and equipment, net
|
2,579
|
|
2,469
|
|
|||
|
Goodwill
|
175
|
|
175
|
|
|||
|
Other assets
|
254
|
|
287
|
|
|||
|
Total assets
|
|
$8,089
|
|
|
$8,491
|
|
|
|
Liabilities and Shareholders' Equity
|
|||||||
|
Current liabilities:
|
|||||||
|
Accounts payable
|
|
$1,011
|
|
|
$917
|
|
|
|
Accrued salaries, wages and related benefits
|
404
|
|
388
|
|
|||
|
Other current liabilities
|
804
|
|
764
|
|
|||
|
Current portion of long-term debt
|
7
|
|
506
|
|
|||
|
Total current liabilities
|
2,226
|
|
2,575
|
|
|||
|
Long-term debt, net
|
3,124
|
|
3,141
|
|
|||
|
Deferred property incentives, net
|
485
|
|
500
|
|
|||
|
Other liabilities
|
341
|
|
319
|
|
|||
|
Commitments and contingencies
|
|
|
|||||
|
Shareholders' equity:
|
|||||||
|
Common stock, no par value: 1,000 shares authorized; 197.0 and 207.6 shares issued and outstanding
|
1,645
|
|
1,484
|
|
|||
|
Retained earnings
|
315
|
|
517
|
|
|||
|
Accumulated other comprehensive loss
|
(47
|
)
|
(45
|
)
|
|||
|
Total shareholders' equity
|
1,913
|
|
1,956
|
|
|||
|
Total liabilities and shareholders' equity
|
|
$8,089
|
|
|
$8,491
|
|
|
The accompanying Notes to Consolidated Financial Statements are an integral part of these financial statements.
Nordstrom, Inc. and subsidiaries
37
Nordstrom, Inc.
Consolidated Statements of Shareholders' Equity
In millions except per share amounts
|
Accumulated
|
|
||||||||||||||||||
|
|
Other
|
|
|
||||||||||||||||
|
Common Stock
|
Retained
|
|
Comprehensive
|
|
|||||||||||||||
|
|
Shares
|
|
Amount
|
|
Earnings
|
|
Loss
|
|
Total
|
|
|||||||||
|
Balance at January 30, 2010
|
217.7
|
|
|
$1,066
|
|
|
$525
|
|
|
($19
|
)
|
|
$1,572
|
|
|||||
|
Net earnings
|
—
|
|
—
|
|
613
|
|
—
|
|
613
|
|
|||||||||
|
Postretirement plan adjustments, net of tax
|
—
|
|
—
|
|
—
|
|
(10
|
)
|
(10
|
)
|
|||||||||
|
Dividends ($0.76 per share)
|
—
|
|
—
|
|
(167
|
)
|
—
|
|
(167
|
)
|
|||||||||
|
Issuance of common stock under stock compensation plans
|
2.5
|
|
65
|
|
—
|
|
—
|
|
65
|
|
|||||||||
|
Stock-based compensation
|
0.1
|
|
37
|
|
—
|
|
—
|
|
37
|
|
|||||||||
|
Repurchase of common stock
|
(2.3
|
)
|
—
|
|
(89
|
)
|
—
|
|
(89
|
)
|
|||||||||
|
Balance at January 29, 2011
|
218.0
|
|
|
$1,168
|
|
|
$882
|
|
|
($29
|
)
|
|
$2,021
|
|
|||||
|
Net earnings
|
—
|
|
—
|
|
683
|
|
—
|
|
683
|
|
|||||||||
|
Postretirement plan adjustments, net of tax
|
—
|
|
—
|
|
—
|
|
(16
|
)
|
(16
|
)
|
|||||||||
|
Dividends ($0.92 per share)
|
—
|
|
—
|
|
(197
|
)
|
—
|
|
(197
|
)
|
|||||||||
|
Issuance of common stock for HauteLook acquisition
|
3.5
|
|
148
|
|
—
|
|
—
|
|
148
|
|
|||||||||
|
Issuance of common stock under stock compensation plans
|
3.4
|
|
95
|
|
—
|
|
—
|
|
95
|
|
|||||||||
|
Stock-based compensation
|
1.2
|
|
73
|
|
—
|
|
—
|
|
73
|
|
|||||||||
|
Repurchase of common stock
|
(18.5
|
)
|
—
|
|
(851
|
)
|
—
|
|
(851
|
)
|
|||||||||
|
Balance at January 28, 2012
|
207.6
|
|
|
$1,484
|
|
|
$517
|
|
|
($45
|
)
|
|
$1,956
|
|
|||||
|
Net earnings
|
—
|
|
—
|
|
735
|
|
—
|
|
735
|
|
|||||||||
|
Postretirement plan adjustments, net of tax
|
—
|
|
—
|
|
—
|
|
(2
|
)
|
(2
|
)
|
|||||||||
|
Dividends ($1.08 per share)
|
—
|
|
—
|
|
(220
|
)
|
—
|
|
(220
|
)
|
|||||||||
|
Issuance of common stock under stock compensation plans
|
3.3
|
|
114
|
|
—
|
|
—
|
|
114
|
|
|||||||||
|
Stock-based compensation
|
0.1
|
|
47
|
|
—
|
|
—
|
|
47
|
|
|||||||||
|
Repurchase of common stock
|
(14.0
|
)
|
—
|
|
(717
|
)
|
—
|
|
(717
|
)
|
|||||||||
|
Balance at February 2, 2013
|
197.0
|
|
|
$1,645
|
|
|
$315
|
|
|
($47
|
)
|
|
$1,913
|
|
|||||
The accompanying Notes to Consolidated Financial Statements are an integral part of these financial statements.
38
Nordstrom, Inc.
In millions
|
Fiscal year
|
2012
|
|
2011
|
|
2010
|
|
|||||
|
Operating Activities
|
|||||||||||
|
Net earnings
|
|
$735
|
|
|
$683
|
|
|
$613
|
|
||
|
Adjustments to reconcile net earnings to net cash provided by operating activities:
|
|||||||||||
|
Depreciation and amortization expenses
|
429
|
|
371
|
|
327
|
|
|||||
|
Amortization of deferred property incentives and other, net
|
(63
|
)
|
(46
|
)
|
(54
|
)
|
|||||
|
Deferred income taxes, net
|
22
|
|
14
|
|
2
|
|
|||||
|
Stock-based compensation expense
|
53
|
|
50
|
|
42
|
|
|||||
|
Tax benefit from stock-based compensation
|
23
|
|
20
|
|
15
|
|
|||||
|
Excess tax benefit from stock-based compensation
|
(24
|
)
|
(22
|
)
|
(16
|
)
|
|||||
|
Provision for bad debt expense
|
56
|
|
101
|
|
149
|
|
|||||
|
Change in operating assets and liabilities:
|
|||||||||||
|
Accounts receivable
|
(113
|
)
|
(98
|
)
|
(74
|
)
|
|||||
|
Merchandise inventories
|
(170
|
)
|
(137
|
)
|
(80
|
)
|
|||||
|
Prepaid expenses and other assets
|
5
|
|
—
|
|
1
|
|
|||||
|
Accounts payable
|
48
|
|
54
|
|
72
|
|
|||||
|
Accrued salaries, wages and related benefits
|
13
|
|
6
|
|
37
|
|
|||||
|
Other current liabilities
|
36
|
|
95
|
|
42
|
|
|||||
|
Deferred property incentives
|
58
|
|
78
|
|
95
|
|
|||||
|
Other liabilities
|
2
|
|
8
|
|
6
|
|
|||||
|
Net cash provided by operating activities
|
1,110
|
|
1,177
|
|
|
1,177
|
|
||||
|
Investing Activities
|
|||||||||||
|
Capital expenditures
|
(513
|
)
|
(511
|
)
|
(399
|
)
|
|||||
|
Change in restricted cash
|
200
|
|
(200
|
)
|
—
|
|
|||||
|
Change in credit card receivables originated at third parties
|
(42
|
)
|
(7
|
)
|
(66
|
)
|
|||||
|
Other, net
|
(14
|
)
|
(10
|
)
|
3
|
|
|||||
|
Net cash used in investing activities
|
(369
|
)
|
(728
|
)
|
(462
|
)
|
|||||
|
Financing Activities
|
|||||||||||
|
Proceeds from long-term borrowings, net of discounts
|
—
|
|
824
|
|
498
|
|
|||||
|
Principal payments on long-term borrowings
|
(506
|
)
|
(6
|
)
|
(356
|
)
|
|||||
|
Proceeds from sale of interest rate swap
|
—
|
|
72
|
|
—
|
|
|||||
|
Increase (decrease) in cash book overdrafts
|
5
|
|
(30
|
)
|
37
|
|
|||||
|
Cash dividends paid
|
(220
|
)
|
(197
|
)
|
(167
|
)
|
|||||
|
Payments for repurchase of common stock
|
(725
|
)
|
(840
|
)
|
(84
|
)
|
|||||
|
Proceeds from issuances under stock compensation plans
|
91
|
|
76
|
|
48
|
|
|||||
|
Excess tax benefit from stock-based compensation
|
24
|
|
22
|
|
16
|
|
|||||
|
Other, net
|
(2
|
)
|
1
|
|
4
|
|
|||||
|
Net cash used in financing activities
|
(1,333
|
)
|
(78
|
)
|
(4
|
)
|
|||||
|
Net (decrease) increase in cash and cash equivalents
|
(592
|
)
|
371
|
|
711
|
|
|||||
|
Cash and cash equivalents at beginning of year
|
1,877
|
|
1,506
|
|
795
|
|
|||||
|
Cash and cash equivalents at end of year
|
|
$1,285
|
|
|
$1,877
|
|
|
$1,506
|
|
||
|
Supplemental Cash Flow Information
|
|||||||||||
|
Cash paid during the year for:
|
|||||||||||
|
Interest (net of capitalized interest)
|
|
$169
|
|
|
$124
|
|
|
$121
|
|
||
|
Income taxes paid, net of refunds
|
|
$429
|
|
|
$398
|
|
|
$381
|
|
||
|
Non-cash investing activity:
|
|||||||||||
|
Issuance of common stock for HauteLook acquisition
|
—
|
|
|
$148
|
|
—
|
|
||||
The accompanying Notes to Consolidated Financial Statements are an integral part of these financial statements.
Nordstrom, Inc. and subsidiaries
39
Nordstrom, Inc.
Notes to Consolidated Financial Statements
Dollar and share amounts in millions except per share, per option and unit amounts
The Company
Founded in
1901
as a shoe store in Seattle, Washington, today Nordstrom, Inc. is a leading fashion specialty retailer that offers customers a well-edited selection of high-quality fashion brands focused on apparel, shoes, cosmetics and accessories for men, women and children. This breadth of merchandise allows us to serve a wide range of customers who appreciate quality fashion and a superior shopping experience. We offer a wide selection of brand name and private label merchandise through multiple retail channels, including
117
'Nordstrom' branded full-line stores and our online store at www.nordstrom.com (collectively, "Nordstrom"),
119
off-price 'Nordstrom Rack' stores, our 'HauteLook' online private sale subsidiary,
two
'Jeffrey' boutiques,
one
philanthropic 'treasure&bond' store and
one
'Last Chance' clearance store. Our stores are located in
31
states throughout the U.S.
Through our Credit segment, we provide our customers with a variety of payment products and services, including a Nordstrom private label card,
two
Nordstrom VISA credit cards and a debit card for Nordstrom purchases. These products also allow our customers to participate in our loyalty program, which is designed to increase customer visits and spending. Although the primary purpose of our Credit segment is to foster greater customer loyalty and drive more sales, we also generate revenues through finance charges and other fees on these cards and, on a consolidated basis, we avoid costs that would be incurred if our customers used third-party cards.
Fiscal Year
We operate on a 52/53-week fiscal year ending on the Saturday closest to January 31st. References to
2012
relate to the 53-week fiscal year ended
February 2, 2013
. References to any other years included within this document are based on a 52-week fiscal year.
Principles of Consolidation
The consolidated financial statements include the balances of Nordstrom, Inc. and its subsidiaries. All intercompany transactions and balances are eliminated in consolidation.
Use of Estimates
The preparation of financial statements in conformity with accounting principles generally accepted in the United States of America requires management to make estimates and assumptions that affect the reported amounts of assets, liabilities, revenues and expenses, and disclosure of contingent assets and liabilities during the reporting period. Uncertainties regarding such estimates and assumptions are inherent in the preparation of financial statements and actual results may differ from these estimates and assumptions. Our most significant accounting judgments and estimates include the allowance for credit losses, revenue recognition, inventory, goodwill and income taxes.
Net Sales
We recognize revenue from sales at our retail stores at the point of sale, net of estimated returns and excluding sales taxes. Revenue from sales to customers shipped directly from our stores, website and catalog, which includes shipping revenue when applicable, is recognized upon estimated receipt by the customer. We estimate customer merchandise returns based on historical return patterns and reduce sales and cost of sales accordingly. Activity in the allowance for sales returns, net, for the past three fiscal years is as follows:
|
Fiscal year
|
2012
|
|
2011
|
|
2010
|
|
|||||
|
Allowance at beginning of year
|
|
$103
|
|
|
$85
|
|
|
$76
|
|
||
|
Additions
|
1,724
|
|
1,411
|
|
1,180
|
|
|||||
|
Returns, net
1
|
(1,711
|
)
|
(1,393
|
)
|
(1,171
|
)
|
|||||
|
Allowance at end of year
|
|
$116
|
|
|
$103
|
|
|
$85
|
|
||
1
Returns, net consist of actual returns offset by the value of the merchandise returned and the sales commission reversed. The increase in 2012 over 2011 is driven primarily by the growth of our online business.
Credit Card Revenues
Credit card revenues include finance charges, late fees and other revenue generated by our combined Nordstrom private label card and Nordstrom VISA credit card programs, and interchange fees generated by the use of Nordstrom VISA cards at third-party merchants. Finance charge and late fees are assessed according to the terms of the related cardholder agreements and recognized as revenue when earned.
Cost of Sales
Cost of sales includes the purchase cost of inventory sold (net of vendor allowances), in-bound freight and certain costs of loyalty program benefits related to our credit and debit cards.
40
Nordstrom, Inc.
Notes to Consolidated Financial Statements
Dollar and share amounts in millions except per share, per option and unit amounts
Loyalty Program
Customers who use our Nordstrom private label credit or debit card or our Nordstrom VISA credit cards can participate in the Nordstrom Fashion Rewards
®
program through which customers accumulate points based on their level of spending. Upon reaching a certain threshold, customers receive Nordstrom Notes
®
, which can be redeemed for goods or services in our Nordstrom full-line and Rack stores and on our website. Fashion Rewards customers receive a credit for complimentary alterations and a personal triple points day, in addition to early access to sales events. With increased spending, they can receive additional amounts of these benefits as well as access to exclusive fashion and shopping events.
We estimate the net cost of Nordstrom Notes that will be issued and redeemed, and record this cost as rewards points are accumulated. These costs, as well as complimentary alterations, are recorded in cost of sales given that we provide customers with products and services for these rewards. Other costs of the loyalty program, including shipping and fashion events, are recorded in selling, general and administrative expenses.
Buying and Occupancy Costs
Buying costs consist primarily of compensation and other costs incurred by our merchandising and product development groups. Occupancy costs include rent, depreciation, property taxes and facility operating costs of our retail, corporate center and distribution operations.
Rent
We recognize minimum rent expense, net of landlord reimbursements, on a straight-line basis over the minimum lease term from the time that we control the leased property. For leases that contain predetermined, fixed escalations of the minimum rent, we recognize the rent expense on a straight-line basis and record the difference between the rent expense and the rent payable as a deferred credit. Contingent rental payments, typically based on a percentage of sales, are recognized in rent expense when payment of the contingent rent is probable.
We receive incentives from landlords to construct stores in certain developments. These property incentives are recorded as a deferred credit and recognized as a reduction of rent expense on a straight-line basis over the lease term. At the end of
2012
and
2011
, the deferred credit balance was
$544
and
$556
.
Selling, General and Administrative Expenses
Selling, general and administrative expenses consist primarily of compensation and benefit costs (other than those included in buying and occupancy costs), advertising, shipping and handling costs, bad debt expense related to our credit card operations and other miscellaneous expenses.
Advertising
Advertising production costs for Internet, magazines, store events and other media are expensed the first time the advertisement is run. Total advertising expenses, net of vendor allowances, of
$161
,
$128
and
$114
in
2012
,
2011
and
2010
were included in selling, general and administrative expenses.
Vendor Allowances
We receive allowances from merchandise vendors for cosmetic selling expenses, purchase price adjustments, cooperative advertising programs and various other expenses. Allowances for cosmetic selling expenses are recorded in selling, general and administrative expenses as a reduction of the related costs when incurred. Purchase price adjustments are recorded as a reduction of cost of sales at the point they have been earned and the related merchandise has been sold. Allowances for cooperative advertising and promotion programs and other expenses are recorded in selling, general and administrative expenses as a reduction of the related costs when incurred. Any allowances in excess of actual costs incurred that are included in selling, general and administrative expenses are recorded as a reduction of cost of sales. Vendor allowances earned are as follows:
|
Fiscal year
|
2012
|
|
2011
|
|
2010
|
|
|||||
|
Cosmetic selling expenses
|
|
$137
|
|
|
$128
|
|
|
$118
|
|
||
|
Purchase price adjustments
|
125
|
|
108
|
|
96
|
|
|||||
|
Cooperative advertising and promotion
|
92
|
|
78
|
|
67
|
|
|||||
|
Other
|
3
|
|
2
|
|
2
|
|
|||||
|
Total vendor allowances
|
|
$357
|
|
|
$316
|
|
|
$283
|
|
||
Nordstrom, Inc. and subsidiaries
41
Nordstrom, Inc.
Notes to Consolidated Financial Statements
Dollar and share amounts in millions except per share, per option and unit amounts
Shipping and Handling Costs
Our shipping and handling costs include payments to third-party shippers and costs to hold, move and prepare merchandise for shipment. These costs do not include in-bound freight to our distribution centers, which we include in the cost of our inventory. Shipping and handling costs of
$240
,
$178
and
$133
in
2012
,
2011
and
2010
were included in selling, general and administrative expenses.
Stock-Based Compensation
We recognize stock-based compensation expense related to stock options at their estimated grant date fair value, recorded on a straight-line basis over the requisite service period. The total compensation expense is reduced by estimated forfeitures expected to occur over the vesting period of the award. We estimate the grant date fair value of stock options using the Binomial Lattice option valuation model. Stock-based compensation expense also includes amounts related to HauteLook stock compensation, performance share units and our Employee Stock Purchase Plan, based on their fair values as of the end of each reporting period.
New Store Opening Costs
Non-capital expenditures associated with opening new stores, including marketing expenses, relocation expenses and temporary occupancy costs, are charged to expense as incurred. These costs are included in both buying and occupancy costs and selling, general and administrative expenses according to their nature as disclosed above.
Gift Cards
We recognize revenue from the sale of gift cards when the gift card is redeemed by the customer, or we recognize breakage income when the likelihood of redemption, based on historical experience, is deemed to be remote. Based on an analysis of our program since its inception in 1999, we determined that balances remaining on cards issued beyond
five
years are unlikely to be redeemed and therefore may be recognized as income. Breakage income was
$10
,
$9
and
$9
in
2012
,
2011
and
2010
. To date, our breakage rate is approximately
3.0%
of the amount initially issued as gift cards. Gift card breakage income is included in selling, general and administrative expenses in our consolidated statement of earnings. We had outstanding gift card liabilities of
$231
and
$209
at the end of
2012
and
2011
, which are included in other current liabilities.
Income Taxes
We use the asset and liability method of accounting for income taxes. Using this method, deferred tax assets and liabilities are recorded based on differences between the financial reporting and tax basis of assets and liabilities. The deferred tax assets and liabilities are calculated using the enacted tax rates and laws that are expected to be in effect when the differences are expected to reverse. We routinely evaluate the likelihood of realizing the benefit of our deferred tax assets and may record a valuation allowance if, based on all available evidence, it is determined that some portion of the tax benefit will not be realized.
We regularly evaluate the likelihood of realizing the benefit for income tax positions that we have taken in various federal, state and foreign filings by considering all relevant facts, circumstances and information available. If we believe it is more likely than not that our position will be sustained, we recognize a benefit at the largest amount that we believe is
cumulatively greater than 50%
likely to be realized.
Interest and penalties related to income tax matters are classified as a component of income tax expense.
Comprehensive Net Earnings
Comprehensive net earnings include net earnings and other comprehensive earnings and losses. Other comprehensive losses in
2012
,
2011
and
2010
consisted of adjustments, net of tax, related to our postretirement benefit obligations. Accumulated other comprehensive losses at the end of
2012
and
2011
consisted of unrecognized losses on postretirement benefit obligations.
Cash Equivalents
Cash equivalents are short-term investments with a maturity of three months or less from the date of purchase and are carried at amortized cost, which approximates fair value. Our cash management system provides for the reimbursement of all major bank disbursement accounts on a daily basis. Accounts payable at the end of
2012
and
2011
included
$86
and
$81
of checks not yet presented for payment drawn in excess of our bank deposit balances.
42
Nordstrom, Inc.
Notes to Consolidated Financial Statements
Dollar and share amounts in millions except per share, per option and unit amounts
Accounts Receivable
Accounts receivable includes credit card receivables from our Nordstrom private label and VISA credit cards, as well as credit and debit card receivables due from third-party financial institutions. We record credit card receivables on our consolidated balance sheets at the outstanding balance, net of an allowance for credit losses. The allowance for credit losses reflects our best estimate of the losses inherent in our receivables as of the balance sheet date, including uncollectible finance charges and fees. We estimate such credit losses based on several factors, including historical aging and delinquency trends, write-off experience, concentration and risk metrics and general economic conditions. Credit card receivables constitute unsecured consumer loans, for which the risk of cardholder default and associated credit losses tend to increase as general economic conditions deteriorate.
We consider a credit card account delinquent if the minimum payment is not received by the payment due date. Our aging method is based on the number of completed billing cycles during which the customer has failed to make a minimum payment. Delinquent accounts, including accrued finance charges and fees, are written off when they are determined to be uncollectible, usually after they become
150 days
past due. Accounts are written off sooner in the event of customer bankruptcy or other circumstances that make further collection unlikely.
We recognize finance charges and fees on delinquent accounts until they become
120 days
past due, after which we place accounts on non-accrual status. Payments received for accounts on non-accrual status are applied to accrued finance charges, fees and principal balances consistent with other accounts, with subsequent finance charge income recognized only when actually received. Non-accrual accounts may return to accrual status when we receive
three
consecutive minimum payments or the equivalent lump sum.
Our Nordstrom private label credit card can be used only in our Nordstrom full-line and Rack stores and on our website, while our Nordstrom VISA cards allow our customers the option of using the cards for purchases of Nordstrom merchandise and services, as well as for purchases outside of Nordstrom. Cash flows from the use of both the private label and Nordstrom VISA credit cards for sales originating at our stores and our website are treated as an operating activity within the consolidated statements of cash flows, as they relate to sales at Nordstrom. Cash flows arising from the use of Nordstrom VISA cards outside of our stores are treated as an investing activity within the consolidated statements of cash flows, as they represent loans made to our customers for purchases at third parties.
Merchandise Inventories
Merchandise inventories are valued at the lower of cost or market, using the retail method (weighted-average cost). Under the retail method, the valuation of inventories and the resulting gross margins are determined by applying a calculated cost-to-retail ratio to the retail value of ending inventory. The value of our inventory on the balance sheet is then reduced by a charge to cost of sales for retail inventory markdowns taken on the selling floor. To determine if the retail value of our inventory should be marked down, we consider current and anticipated demand, customer preferences, age of the merchandise and fashion trends. We reserve for obsolescence based on historical trends and specific identification.
Land, Buildings and Equipment
Land is recorded at historical cost, while buildings and equipment are recorded at cost less accumulated depreciation. Capitalized software includes the costs of developing or obtaining internal-use software, including external direct costs of materials and services and internal payroll costs related to the software project.
We capitalize interest on construction in progress and software projects during the period in which expenditures have been made, activities are in progress to prepare the asset for its intended use and actual interest costs are being incurred.
Depreciation is computed using the straight-line method over the asset's estimated useful life, which is determined by asset category as follows:
|
Asset
|
Life (in years)
|
|
Buildings and improvements
|
5 – 40
|
|
Store fixtures and equipment
|
3 – 15
|
|
Leasehold improvements
|
Shorter of initial lease term or asset life
|
|
Capitalized software
|
3 – 7
|
Leasehold improvements made at the inception of the lease are amortized over the shorter of the initial lease term or the asset life. Leasehold improvements made during the lease term are amortized over the shorter of the asset life or the remaining lease term. Lease terms include the fixed, non-cancelable term of a lease, plus any renewal periods determined to be reasonably assured.
Nordstrom, Inc. and subsidiaries
43
Nordstrom, Inc.
Notes to Consolidated Financial Statements
Dollar and share amounts in millions except per share, per option and unit amounts
Goodwill, Intangible Assets and Long-Lived Assets
Goodwill represents the excess of acquisition cost over the fair value of the related net assets acquired, and is not subject to amortization. As of
February 2, 2013
, we had HauteLook goodwill of
$121
and nordstrom.com and Jeffrey goodwill of
$53
. We review our goodwill annually for impairment or when circumstances indicate its carrying value may not be recoverable. We review our HauteLook goodwill as of the first day of the fourth quarter and review our nordstrom.com and Jeffrey goodwill on the first day of the first quarter. We perform this evaluation at the reporting unit level, comprised of the principal business units within our Retail segment, through the application of a two-step fair value test. The first step compares the carrying value of the reporting unit to its estimated fair value, which is based on the expected present value of future cash flows, comparable public companies and acquisitions, or a combination of both. If fair value is lower than the carrying value, then a second step is performed to quantify the amount of the impairment. For nordstrom.com and Jeffrey, the fair values substantially exceeded carrying values and therefore we had
no
goodwill impairment in
2012
,
2011
or
2010
. In 2011, the year we acquired HauteLook, we recorded a goodwill impairment loss of
$25
. In
2012
, our testing indicated that the fair value of HauteLook substantially exceeded the carrying value, and therefore we did not record goodwill impairment for
2012
.
When facts and circumstances indicate that the carrying values of long-lived assets, including buildings, equipment and amortizable intangible assets, may be impaired, we perform an evaluation of recoverability by comparing the carrying values of the net assets to their related projected undiscounted future cash flows, in addition to other quantitative and qualitative analyses. Upon indication that the carrying values of long-lived assets will not be recoverable, we recognize an impairment loss. We estimate the fair value of the assets using the expected present value of future cash flows of the assets. Land, buildings and equipment are grouped at the lowest level at which there are identifiable cash flows when assessing impairment. Cash flows for our retail store assets are identified at the individual store level, while our intangible assets associated with HauteLook are identified at the HauteLook reporting unit level. We did not record an impairment loss for long-lived tangible or amortizable intangible assets in
2012
,
2011
or
2010
.
Self-Insurance
We retain a portion of the risk for certain losses related to employee health and welfare, workers' compensation and general liability claims. Liabilities associated with these losses include undiscounted estimates of both losses reported and losses incurred but not yet reported. We estimate our ultimate cost based on an actuarially based analysis of claims experience, regulatory changes and other relevant factors.
Derivatives
During 2011, we held interest rate swap agreements (collectively, the "swap"), which were intended to hedge our exposure to changes in the fair value of our fixed-rate senior notes due in 2018 from interest rate risk. The swap was designated as a fully effective fair value hedge. As such, the interest rate swap fair value was included in other assets or other liabilities on our consolidated balance sheet, with an offsetting adjustment to the carrying value of our long-term debt (included in other unsecured debt). In the fourth quarter of 2011, we sold our swap and received proceeds of
$72
. The accumulated adjustments to the associated debt of
$60
as of February 2, 2013 are being amortized as a reduction of interest expense over the remaining life of the debt. The cash flows from the sale of our swap are treated as a financing activity within our consolidated statement of cash flows. See Note 8: Debt and Credit Facilities for additional information related to our swap.
Recent Accounting Pronouncements
In December 2011, the Financial Accounting Standards Board ("FASB") issued Accounting Standards Update ("ASU') No. 2011-11,
Disclosures about Offsetting Assets and Liabilities
, which was subsequently modified in January 2013 by ASU No. 2013-01,
Clarifying the Scope of Disclosures about Offsetting Assets and Liabilities.
This ASU
has requirements that are disclosure-only in nature. It requires disclosures about offsetting and related arrangements for certain financial instruments and derivative instruments, including gross and net information and evaluation of the effect of netting arrangements on the statement of financial position. We do not expect the provisions of this ASU, which are effective for us beginning with the first quarter of 2013, to have a material impact on our consolidated financial statements.
44
Nordstrom, Inc.
Notes to Consolidated Financial Statements
Dollar and share amounts in millions except per share, per option and unit amounts
In 2011, we acquired
100%
of the outstanding equity of HauteLook, Inc., an online private sale retailer offering limited time sale events on fashion and lifestyle brands, for upfront consideration of
$180
in Nordstrom stock and an "earn-out" provision of up to
$90
that was ultimately settled in 2011 for
$30
of additional Nordstrom stock. The upfront consideration included
$27
related to amounts attributable to HauteLook employees that are subject to ongoing vesting requirements and are recorded as compensation expense as the related service is performed over the respective employee vesting periods of up to
four
years after the acquisition date.
On the acquisition date, we recorded intangible assets of
$62
and goodwill of
$146
, offset by other net liabilities of
$13
. We amortize the intangible assets over their estimated lives of
two
to
seven
years on a straight-line basis, which reasonably approximates the pattern of expected economic benefit. We recorded intangible amortization expense of
$19
for 2012 and
$16
for 2011.
The goodwill value of
$146
recorded at the time of the acquisition was the excess of the purchase price over the net assets recognized. We include this goodwill, which is not deductible for tax purposes, in our Retail segment. In 2011, we recognized a goodwill impairment charge of
$25
, reducing the HauteLook goodwill to
$121
due to a reorganization of HauteLook, changes in expected business results and market dynamics. Additionally, as part of the reorganization, we recorded income of
$12
related to the settlement of the earn-out liability. We recognized no goodwill impairment charge for fiscal 2012. See Note 9: Fair Value Measurements for additional information relating to the valuation of the goodwill impairment charge.
The components of accounts receivable are as follows:
|
February 2, 2013
|
|
January 28, 2012
|
|
||||
|
Credit card receivables:
|
|||||||
|
Nordstrom VISA credit card receivables
|
|
$1,348
|
|
|
$1,347
|
|
|
|
Nordstrom private label card receivables
|
794
|
|
727
|
|
|||
|
Total credit card receivables
|
2,142
|
|
2,074
|
|
|||
|
Allowance for credit losses
|
(85
|
)
|
(115
|
)
|
|||
|
Credit card receivables, net
|
2,057
|
|
1,959
|
|
|||
|
Other accounts receivable
1
|
72
|
|
74
|
|
|||
|
Accounts receivable, net
|
|
$2,129
|
|
|
$2,033
|
|
|
1
Other accounts receivable consist primarily of credit and debit card receivables due from third-party financial institutions.
Our credit card receivables are restricted under our securitization program. Our Series 2011-1 Class A Notes and the 2007-A Variable Funding Note are secured by
100%
of the Nordstrom private label credit card receivables and
90%
of the Nordstrom VISA credit card receivables, while the remaining
10%
of the Nordstrom VISA credit card receivables secure the variable funding credit facility held by our wholly owned federal savings bank, Nordstrom fsb. As of
February 2, 2013
and
January 28, 2012
, our restricted credit card receivables included more receivables than necessary to collateralize our outstanding secured debt and variable funding facilities, and as such can be utilized to increase the current usage of our securitization program. Our credit card securitization agreements set a maximum percentage of receivables that can be associated with various receivable categories, such as employee or foreign receivables, and as of
February 2, 2013
and
January 28, 2012
, these maximums were not exceeded.
Activity in the allowance for credit losses is as follows:
|
Fiscal year
|
2012
|
|
2011
|
|
2010
|
|
|||||
|
Allowance at beginning of year
|
|
$115
|
|
|
$145
|
|
|
$190
|
|
||
|
Bad debt provision
|
56
|
|
101
|
|
149
|
|
|||||
|
Write-offs
|
(111
|
)
|
(153
|
)
|
(211
|
)
|
|||||
|
Recoveries
|
25
|
|
22
|
|
17
|
|
|||||
|
Allowance at end of year
|
|
$85
|
|
|
$115
|
|
|
$145
|
|
||
For purposes of determining impairment and recording the associated allowance for credit losses, we evaluate our credit card receivables on a collective basis as they are composed of large groups of smaller-balance homogeneous loans and, therefore, are not individually evaluated for impairment.
Nordstrom, Inc. and subsidiaries
45
Nordstrom, Inc.
Notes to Consolidated Financial Statements
Dollar and share amounts in millions except per share, per option and unit amounts
Under certain circumstances, we may make modifications to payment terms for a customer experiencing financial difficulties in an effort to help the customer avoid bankruptcy and to maximize our recovery of the outstanding balance. These modifications, which meet the definition of troubled debt restructurings ("TDRs"), include reduced or waived fees and finance charges, and/or reduced minimum payments. Receivables classified as TDRs were
$53
, or
2.5%
of our total credit card receivables as of
February 2, 2013
and
$58
, or
2.8%
of our total credit card receivables as of
January 28, 2012
. As with other aged receivables in our portfolio, the allowance for credit losses related to receivables classified as TDRs is primarily based on our historical aging and delinquency trends and write-off experience, with qualitative consideration of factors affecting the credit quality of our portfolio, including amounts of and trends in TDRs.
Credit Quality
The primary indicators of the credit quality of our credit card receivables are aging and delinquency, particularly the levels of account balances delinquent
30
days or more as these are the accounts most likely to be written off. The following table illustrates the aging and delinquency status of our credit card receivables:
|
|
February 2, 2013
|
January 28, 2012
|
|||||||||||
|
|
Balance
|
|
% of total
|
|
Balance
|
|
% of total
|
|
|||||
|
Current
|
|
$2,018
|
|
94.2
|
%
|
|
$1,928
|
|
93.0
|
%
|
|||
|
1 – 29 days delinquent
|
84
|
|
3.9
|
%
|
92
|
|
4.4
|
%
|
|||||
|
30+ days delinquent:
|
|||||||||||||
|
30 – 59 days delinquent
|
15
|
|
0.7
|
%
|
20
|
|
1.0
|
%
|
|||||
|
60 – 89 days delinquent
|
10
|
|
0.5
|
%
|
13
|
|
0.6
|
%
|
|||||
|
90 days or more delinquent
|
15
|
|
0.7
|
%
|
21
|
|
1.0
|
%
|
|||||
|
Total 30+ days delinquent
|
40
|
|
1.9
|
%
|
54
|
|
2.6
|
%
|
|||||
|
Total credit card receivables
|
|
$2,142
|
|
100.0
|
%
|
|
$2,074
|
|
100.0
|
%
|
|||
|
Receivables not accruing finance charges
|
|
$11
|
|
|
|
$15
|
|
|
|||||
|
Receivables 90 days or more delinquent
and still accruing finance charges
|
|
$8
|
|
|
|
$11
|
|
|
|||||
We also evaluate credit quality using FICO credit scores. The following table illustrates the distribution of our credit card receivables across FICO score ranges:
|
|
February 2, 2013
|
January 28, 2012
|
|||||||||||
|
FICO Score Range
1
|
Balance
|
|
% of total
|
|
Balance
|
|
% of total
|
|
|||||
|
801+
|
|
$310
|
|
14.5
|
%
|
|
$307
|
|
14.8
|
%
|
|||
|
660 – 800
|
1,366
|
|
63.8
|
%
|
1,313
|
|
63.3
|
%
|
|||||
|
001 – 659
|
379
|
|
17.7
|
%
|
390
|
|
18.8
|
%
|
|||||
|
Other
2
|
87
|
|
4.0
|
%
|
64
|
|
3.1
|
%
|
|||||
|
Total credit card receivables
|
|
$2,142
|
|
100.0
|
%
|
|
$2,074
|
|
100.0
|
%
|
|||
1
Credit scores for our cardholders are updated at least every
60
days for active accounts and every
90
days for inactive accounts. Amounts listed in the table reflect the most recently obtained credit scores as of the dates indicated.
2
Other consists of amounts not yet posted to customers' accounts and receivables from customers for whom FICO scores are temporarily unavailable.
46
Nordstrom, Inc.
Notes to Consolidated Financial Statements
Dollar and share amounts in millions except per share, per option and unit amounts
Land, buildings and equipment consist of the following:
|
February 2, 2013
|
|
January 28, 2012
|
|
||||
|
Land and land improvements
|
|
$76
|
|
|
$76
|
|
|
|
Buildings and building improvements
|
975
|
|
960
|
|
|||
|
Leasehold improvements
|
2,209
|
|
2,062
|
|
|||
|
Store fixtures and equipment
|
2,679
|
|
2,528
|
|
|||
|
Capitalized software
|
518
|
|
461
|
|
|||
|
Construction in progress
|
186
|
|
173
|
|
|||
|
Land, buildings and equipment
|
6,643
|
|
6,260
|
|
|||
|
Less: accumulated depreciation and amortization
|
(4,064
|
)
|
(3,791
|
)
|
|||
|
Land, buildings and equipment, net
|
|
$2,579
|
|
|
$2,469
|
|
|
The total cost of buildings and equipment held under capital lease obligations was
$28
at the end of both
2012
and
2011
, with related accumulated amortization of
$24
in
2012
and
$23
in
2011
. Depreciation expense was
$410
in
2012
and
$355
in
2011
.
Our self-insurance reserves are summarized as follows:
|
February 2, 2013
|
|
January 28, 2012
|
|
||||
|
Workers' compensation
|
|
$63
|
|
|
$53
|
|
|
|
Employee health and welfare
|
23
|
|
19
|
|
|||
|
General liability
|
16
|
|
14
|
|
|||
|
Total
|
|
$102
|
|
|
$86
|
|
|
Our workers' compensation policies have a retention per claim of
$1
or less and
no policy limits
.
We are self-insured for the majority of our employee health and welfare coverage, and we do not use stop-loss coverage. Participants contribute to the cost of their coverage through both premiums and out-of-pocket expenses and are subject to certain plan limits and deductibles.
Our general liability policies, encompassing employment practices liability and commercial general liability, have a retention per claim of
$3
or less and a policy limit up to
$30
and
$150
, respectively.
We provide a 401(k) and profit sharing plan for our employees. Our Board of Directors establishes our profit sharing contribution each year. The 401(k) component is funded by voluntary employee contributions and our discretionary company contribution in an amount determined by our Board of Directors. Our expense related to the profit sharing component and the matching contributions of the 401(k) component totaled
$83
,
$88
and
$86
in
2012
,
2011
and
2010
.
We have an unfunded defined benefit Supplemental Executive Retirement Plan ("SERP"), which provides retirement benefits to certain officers and select employees. The SERP has different benefit levels depending on the participant's role in the company. At the end of
2012
, we had
59
participants in the plan, including
32
officers and select employees eligible for SERP benefits,
26
retirees and
1
beneficiary. This plan is non-qualified and does not have a minimum funding requirement.
Nordstrom, Inc. and subsidiaries
47
Nordstrom, Inc.
Notes to Consolidated Financial Statements
Dollar and share amounts in millions except per share, per option and unit amounts
Benefit Obligations and Funded Status
|
February 2, 2013
|
|
January 28, 2012
|
|
||||
|
Change in benefit obligation:
|
|||||||
|
Benefit obligation at beginning of year
|
|
$152
|
|
|
$122
|
|
|
|
Participant service cost
|
4
|
|
3
|
|
|||
|
Interest cost
|
7
|
|
7
|
|
|||
|
Benefits paid
|
(5
|
)
|
(5
|
)
|
|||
|
Actuarial loss
|
9
|
|
25
|
|
|||
|
Benefit obligation at end of year
|
167
|
|
152
|
|
|||
|
Change in plan assets:
|
|||||||
|
Fair value of plan assets at beginning of year
|
—
|
|
—
|
|
|||
|
Employer contribution
|
5
|
|
5
|
|
|||
|
Benefits paid
|
(5
|
)
|
(5
|
)
|
|||
|
Fair value of plan assets at end of year
|
—
|
|
—
|
|
|||
|
Underfunded status at end of year
|
|
($167
|
)
|
|
($152
|
)
|
|
The accumulated benefit obligation, which is the present value of benefits, assuming no future compensation changes, was
$158
and
$144
at the end of
2012
and
2011
.
Amounts recognized as liabilities in the consolidated balance sheets consist of the following:
|
February 2, 2013
|
|
January 28, 2012
|
|
||||
|
Current liabilities
|
|
$6
|
|
|
$6
|
|
|
|
Noncurrent liabilities
|
161
|
|
146
|
|
|||
|
Net amount recognized
|
|
$167
|
|
|
$152
|
|
|
Components of SERP Expense
The components of SERP expense recognized in the consolidated statements of earnings are as follows:
|
Fiscal year
|
2012
|
|
2011
|
|
2010
|
|
|||||
|
Participant service cost
|
|
$4
|
|
|
$3
|
|
|
$2
|
|
||
|
Interest cost
|
7
|
|
7
|
|
6
|
|
|||||
|
Amortization of net loss
|
7
|
|
4
|
|
2
|
|
|||||
|
Total SERP expense
|
|
$18
|
|
|
$14
|
|
|
$10
|
|
||
Amounts not yet reflected in SERP expense and included in accumulated other comprehensive loss (pre-tax) consist of the following:
|
February 2, 2013
|
|
January 28, 2012
|
|
||||
|
Accumulated loss
|
|
($60
|
)
|
|
($58
|
)
|
|
|
Prior service cost
|
(1
|
)
|
(1
|
)
|
|||
|
Total accumulated other comprehensive loss
|
|
($61
|
)
|
|
($59
|
)
|
|
In
2013
, we expect
$8
of costs currently in accumulated other comprehensive loss to be recognized as components of SERP expense.
48
Nordstrom, Inc.
Notes to Consolidated Financial Statements
Dollar and share amounts in millions except per share, per option and unit amounts
Assumptions
Weighted-average assumptions used to determine our benefit obligation and SERP expense are as follows:
|
Fiscal year
|
2012
|
|
2011
|
|
2010
|
|
||
|
Assumptions used to determine benefit obligation:
|
||||||||
|
Discount rate
|
4.30
|
%
|
4.50
|
%
|
5.60
|
%
|
||
|
Rate of compensation increase
|
3.00
|
%
|
3.00
|
%
|
3.00
|
%
|
||
|
Assumptions used to determine SERP expense:
|
||||||||
|
Discount rate
|
4.50
|
%
|
5.60
|
%
|
5.95
|
%
|
||
|
Rate of compensation increase
|
3.00
|
%
|
3.00
|
%
|
3.00
|
%
|
||
Future Benefit Payments and Contributions
As of
February 2, 2013
, the expected future benefit payments based upon the assumptions described above and including benefits attributable to estimated future employee service are as follows:
|
Fiscal year
|
|
||
|
2013
|
|
$6
|
|
|
2014
|
7
|
|
|
|
2015
|
8
|
|
|
|
2016
|
9
|
|
|
|
2017
|
9
|
|
|
|
2018 – 2022
|
53
|
|
|
In
2013
, we expect to make contributions and pay benefits of
$6
.
Nordstrom, Inc. and subsidiaries
49
Nordstrom, Inc.
Notes to Consolidated Financial Statements
Dollar and share amounts in millions except per share, per option and unit amounts
Debt
A summary of our long-term debt is as follows:
|
February 2, 2013
|
|
January 28, 2012
|
|
||||
|
Secured
|
|||||||
|
Series 2007-2 Class A Notes, one-month LIBOR plus 0.06% per year, due April 2012
|
—
|
|
|
$454
|
|
||
|
Series 2007-2 Class B Notes, one-month LIBOR plus 0.18% per year, due April 2012
|
—
|
|
46
|
|
|||
|
Series 2011-1 Class A Notes, 2.28%, due October 2016
|
|
$325
|
|
325
|
|
||
|
Mortgage payable, 7.68%, due April 2020
|
47
|
|
51
|
|
|||
|
Other
|
10
|
|
12
|
|
|||
|
|
382
|
|
888
|
|
|||
|
Unsecured
|
|||||||
|
Senior notes, 6.75%, due June 2014, net of unamortized discount
|
400
|
|
399
|
|
|||
|
Senior notes, 6.25%, due January 2018, net of unamortized discount
|
648
|
|
648
|
|
|||
|
Senior notes, 4.75%, due May 2020, net of unamortized discount
|
498
|
|
498
|
|
|||
|
Senior notes, 4.00%, due October 2021, net of unamortized discount
|
499
|
|
499
|
|
|||
|
Senior debentures, 6.95%, due March 2028
|
300
|
|
300
|
|
|||
|
Senior notes, 7.00%, due January 2038, net of unamortized discount
|
344
|
|
343
|
|
|||
|
Other
|
60
|
|
72
|
|
|||
|
|
2,749
|
|
2,759
|
|
|||
|
Total long-term debt
|
3,131
|
|
3,647
|
|
|||
|
Less: current portion
|
(7
|
)
|
(506
|
)
|
|||
|
Total due beyond one year
|
|
$3,124
|
|
|
$3,141
|
|
|
All of our Nordstrom private label card receivables and a
90%
interest in our Nordstrom VISA credit card receivables serve as collateral for various borrowings and credit facilities, including our Series 2011-1 Class A Notes and our Variable Funding Note facility ("2007-A VFN"). Upon maturity in April
2012
, we retired our Series 2007-2 Class A & B Notes ("the Notes") totaling
$500
, which had also been secured by our restricted receivables. The Notes were retired using cash that had been accumulated monthly into a restricted account beginning in December 2011. Prior to the retirement, the accumulated cash was included in our consolidated balance sheet in prepaid expenses and other.
Our mortgage payable is secured by an office building that had a net book value of
$70
at the end of
2012
. Other secured debt as of
February 2, 2013
consisted primarily of capital lease obligations.
During
2011
, we received proceeds of
$72
from the sale of our interest rate swap agreements (collectively, the "swap") with a
$650
notional amount maturing in
2018
. Under the swap, we received a fixed rate of
6.25%
and paid a variable rate based on
one-month LIBOR plus a margin of 2.9%
. As of
February 2, 2013
, the accumulated adjustment to our long-term debt was
$60
, which will be amortized as a reduction of interest expense over the remaining life of the related debt, and is included as part of other unsecured debt in the table above. See Note 1: Nature of Operations and Summary of Significant Accounting Policies for additional information related to our swap.
50
Nordstrom, Inc.
Notes to Consolidated Financial Statements
Dollar and share amounts in millions except per share, per option and unit amounts
Required principal payments on long-term debt, excluding capital lease obligations, are as follows:
|
Fiscal year
|
|
||
|
2013
|
|
$5
|
|
|
2014
|
406
|
|
|
|
2015
|
6
|
|
|
|
2016
|
331
|
|
|
|
2017
|
7
|
|
|
|
Thereafter
|
2,318
|
|
|
Interest Expense
The components of interest expense, net are as follows:
|
Fiscal year
|
2012
|
|
2011
|
|
2010
|
|
|||||
|
Interest on long-term debt and short-term borrowings
|
|
$167
|
|
|
$139
|
|
|
$133
|
|
||
|
Less:
|
|||||||||||
|
Interest income
|
(2
|
)
|
(2
|
)
|
(1
|
)
|
|||||
|
Capitalized interest
|
(5
|
)
|
(7
|
)
|
(5
|
)
|
|||||
|
Interest expense, net
|
|
$160
|
|
|
$130
|
|
|
$127
|
|
||
Credit Facilities
As of February 2, 2013, we had total short-term borrowing capacity available for general corporate purposes of $800. Of the total capacity, we had $600 under our commercial paper program, which is backed by our unsecured revolving credit facility ("revolver") that expires in June 2016, and $200 under our 2007-A Variable Funding Note ("2007-A VFN") that expires in January 2014.
Under the terms of our $600 revolver, we pay a variable rate of interest and a commitment fee based on our debt rating. The revolver is available for working capital, capital expenditures and general corporate purposes, including liquidity support for our commercial paper program. We have the option to increase the revolving commitment by up to $100, to a total of $700, provided that we obtain written consent from the lenders.
The revolver requires that we maintain a
leverage ratio, defined as Adjusted Debt to Earnings before Interest, Income Taxes, Depreciation, Amortization and Rent ("EBITDAR"), of less than four times.
As of February 2, 2013, we were in compliance with this covenant.
Our $600 commercial paper program allows us to use the proceeds to fund operating cash requirements. Under the terms of the commercial paper agreement, we pay a rate of interest based on, among other factors, the maturity of the issuance and market conditions. The issuance of commercial paper has the effect, while it is outstanding, of reducing borrowing capacity under our revolver by an amount equal to the principal amount of commercial paper.
During
2012
and
2011
, we had
no borrowings under our revolver
and
no issuances under our commercial paper program
.
The 2007-A VFN has a capacity of $200 and is backed by all of the Nordstrom private label card receivables and a 90% interest in the co-branded Nordstrom VISA credit card receivables. Borrowings under the 2007-A VFN incur interest based upon one-month LIBOR plus 35 basis points. We pay a commitment fee for the facility based on the size of the commitment.
During
2012
and
2011
, we had
no borrowings against this facility
.
Our wholly owned federal savings bank, Nordstrom fsb, also maintains a variable funding facility with a short-term credit capacity of $100. This facility is backed by the remaining 10% interest in the Nordstrom VISA credit card receivables and is available, if needed, to provide liquidity support to Nordstrom fsb. Borrowings under the facility incur interest at an agreed upon rate with investors in the facility.
During
2012
and 2011, Nordstrom fsb had no outstanding borrowings against this facility.
Nordstrom, Inc. and subsidiaries
51
Nordstrom, Inc.
Notes to Consolidated Financial Statements
Dollar and share amounts in millions except per share, per option and unit amounts
We disclose our financial assets that are measured at fair value in our consolidated balance sheets by level within the fair value hierarchy as defined by applicable accounting standards:
Level 1: Quoted market prices in active markets for identical assets or liabilities
Level 2: Other observable market-based inputs or unobservable inputs that are corroborated by market data
Level 3: Unobservable inputs that cannot be corroborated by market data that reflect the reporting entity's own
assumptions
We did not have any financial assets or liabilities that were measured at fair value on a recurring basis as of February 2, 2013 or January 28, 2012.
Financial instruments not measured at fair value on a recurring basis include cash and cash equivalents, accounts receivable and accounts payable and approximate fair value due to their short-term nature. We also estimate on a nonrecurring basis the fair value of our long-term debt, including current maturities and the remaining fair value adjustment from our previous effective fair value hedge, which was
$3,665
as of
February 2, 2013
, compared with a carrying value of
$3,131
, and as of
January 28, 2012
the fair value was
$4,152
, compared with a carrying value of
$3,647
. We estimated the fair value of long-term debt using quoted market prices of the same or similar issues, and as such this is considered a Level 2 fair value measurement.
We also measure certain non-financial assets at fair value on a nonrecurring basis, primarily goodwill and long-lived tangible and intangible assets, in connection with periodic evaluations for potential impairment. See Note 1: Nature of Operations and Summary of Significant Accounting Policies for additional information related to goodwill, intangible assets and long-lived assets. We recorded
no
impairment charges for these assets in
2012
. During the fourth quarter of
2011
, as part of our annual impairment analysis for goodwill related to HauteLook, we wrote down the carrying value of
$146
as of the acquisition date to its implied fair value of
$121
, resulting in an impairment charge of
$25
. The impairment charge was included in Retail selling, general and administrative expenses in the consolidated statement of earnings. We estimated the fair value of our HauteLook goodwill using an income approach and a market approach based on comparable public companies and acquisitions. These valuation approaches are based on Level 3 inputs in the fair value hierarchy.
We lease the land or the land and buildings at many of our stores. Additionally, we lease office facilities, warehouses and equipment. Most of these leases are classified as operating leases and they expire at various dates through
2080
. The majority of our fixed, non-cancelable lease terms are
15
to
30
years for Nordstrom full-line stores and
10
to
15
years for Nordstrom Rack stores. Many of our leases include options that allow us to extend the lease term beyond the initial commitment period, subject to terms agreed to at lease inception. Most of our leases also provide for payment of operating expenses, such as common area charges, real estate taxes and other executory costs, and some leases require additional payments based on sales, referred to as "percentage rent."
Future minimum lease payments as of
February 2, 2013
are as follows:
|
Fiscal year
|
Capital leases
|
|
Operating leases
|
|
|||
|
2013
|
|
$2
|
|
|
$153
|
|
|
|
2014
|
2
|
|
159
|
|
|||
|
2015
|
2
|
|
158
|
|
|||
|
2016
|
2
|
|
155
|
|
|||
|
2017
|
1
|
|
144
|
|
|||
|
Thereafter
|
1
|
|
850
|
|
|||
|
Total minimum lease payments
|
10
|
|
|
$1,619
|
|
||
|
Less: amount representing interest
|
(2
|
)
|
|||||
|
Present value of net minimum lease payments
|
|
$8
|
|
||||
52
Nordstrom, Inc.
Notes to Consolidated Financial Statements
Dollar and share amounts in millions except per share, per option and unit amounts
Rent expense for
2012
,
2011
and
2010
was as follows:
|
Fiscal year
|
2012
|
|
2011
|
|
2010
|
|
|||||
|
Minimum rent:
|
|||||||||||
|
Store locations
|
|
$124
|
|
|
$108
|
|
|
$94
|
|
||
|
Offices, warehouses and equipment
|
32
|
|
23
|
|
19
|
|
|||||
|
Percentage rent
|
14
|
|
12
|
|
9
|
|
|||||
|
Property incentives
|
(65
|
)
|
(65
|
)
|
(60
|
)
|
|||||
|
Total rent expense
|
|
$105
|
|
|
|
$78
|
|
|
|
$62
|
|
The rent expense above does not include common area charges, real estate taxes and other executory costs which were
$74
in
2012
,
$69
in
2011
and
$65
in
2010
.
Our estimated total purchase obligations, capital expenditure contractual commitments and inventory purchase orders were
$1,901
as of
February 2, 2013
. In connection with the purchase of foreign merchandise, we have outstanding trade letters of credit totaling
$2
as of
February 2, 2013
.
We are subject from time to time to various claims and lawsuits arising in the ordinary course of business, including lawsuits alleging violations of state and/or federal wage and hour and other employment laws, privacy and other consumer-based claims. Some of these lawsuits purport or may be determined to be class or collective actions and seek substantial damages or injunctive relief, or both, and some may remain unresolved for several years. We believe the recorded reserves in our consolidated financial statements are adequate in light of the probable and estimable liabilities. As of the date of this report, we do not believe any currently identified claim, proceeding or litigation, either alone or in the aggregate, will have a material impact on our results of operations, financial position or cash flows. Since these matters are subject to inherent uncertainties, our view of them may change in the future.
Share Repurchase Program
In February 2012, our Board of Directors authorized a program to repurchase up to
$800
of our outstanding common stock, through February 1, 2014, in addition to the remaining amount available for repurchase under the previously authorized programs. The following is a summary of the activity related to our share repurchase programs in
2010
,
2011
and
2012
:
|
Shares
|
|
Average price
per share
|
|
Amount
|
|
|||||
|
Capacity at January 30, 2010
|
—
|
|
||||||||
|
August 2010 authorization (ended January 28, 2012)
|
|
$500
|
|
|||||||
|
Shares repurchased
|
2.3
|
|
|
$39
|
|
(89
|
)
|
|||
|
Capacity at January 29, 2011
|
|
$411
|
|
|||||||
|
May 2011 authorization (ended February 2, 2013)
|
750
|
|
||||||||
|
Shares repurchased
|
18.5
|
|
|
$46
|
|
(851
|
)
|
|||
|
Capacity at January 28, 2012
|
|
$310
|
|
|||||||
|
February 2012 authorization (ends February 1, 2014)
|
800
|
|
||||||||
|
Shares repurchased
|
14.0
|
|
|
$51
|
|
(717
|
)
|
|||
|
Capacity at February 2, 2013
|
|
|
$393
|
|
||||||
Subsequent to year-end, in February 2013 our Board of Directors authorized a new program to repurchase up to $800 of our outstanding common stock, through March 1, 2015, in addition to the remaining amount available for repurchase under our February 2012 authorization.
The actual number and timing of future share repurchases, if any, will be subject to market and economic conditions and applicable Securities and Exchange Commission rules.
Dividends
We paid dividends of
$1.08
per share in
2012
,
$0.92
per share in
2011
and
$0.76
per share in
2010
. In
February 2013
, we declared a quarterly dividend of
$0.30
per share, increased from
$0.27
per share in
2012
.
Nordstrom, Inc. and subsidiaries
53
Nordstrom, Inc.
Notes to Consolidated Financial Statements
Dollar and share amounts in millions except per share, per option and unit amounts
We currently have three stock-based compensation plans: the 2010 Equity Incentive Plan ("2010 Plan"), our Employee Stock Purchase Plan ("ESPP") and the 2002 Nonemployee Director Stock Incentive Plan. Additionally, as part of our acquisition of HauteLook in 2011, we granted awards from shares available that were not allocated to a specific plan.
In 2010, our shareholders approved the adoption of the 2010 Plan, which replaced the 2004 Equity Incentive Plan ("2004 Plan"). The 2010 Plan authorizes the grant of stock options, performance share units, restricted stock units, stock appreciation rights and both restricted and unrestricted shares of common stock to employees. The aggregate number of shares to be issued under the 2010 Plan may not exceed
11.6
plus any shares currently outstanding under the 2004 Plan which are forfeited or which expire during the term of the 2010 Plan. No future grants will be made under the 2004 Plan. As of
February 2, 2013
, we have
54.4
shares authorized,
33.5
shares issued and outstanding and
6.8
shares remaining available for future grants under the 2010 Plan.
Under the ESPP, employees may make payroll deductions of up to
10%
of their base and bonus compensation. At the end of each
six
-month offering period, participants may apply their accumulated payroll deductions toward the purchase of shares of our common stock at
90%
of the fair market value on the last day of the offer period. As of
February 2, 2013
, we had
12.6
shares authorized and
3.8
shares available for issuance under the ESPP. We issued
0.3
shares under the ESPP during
2012
. At the end of both
2012
and
2011
, we had current liabilities of
$5
, for future purchases of shares under the ESPP.
The 2002 Nonemployee Director Stock Incentive Plan authorizes the grant of stock awards to our nonemployee directors. These awards may be deferred or issued in the form of restricted or unrestricted stock, non-qualified stock options or stock appreciation rights. As of
February 2, 2013
, we had
0.9
shares authorized and
0.6
shares available for issuance under this plan. In
2012
, we deferred shares with a total expense of less than
$1
.
The following table summarizes our stock-based compensation expense:
|
Fiscal year
|
2012
|
|
2011
|
|
2010
|
|
|||||
|
Stock options
|
|
$36
|
|
|
$32
|
|
|
$35
|
|
||
|
HauteLook stock compensation
|
9
|
|
9
|
|
—
|
|
|||||
|
Performance share units
|
3
|
|
4
|
|
3
|
|
|||||
|
Employee stock purchase plan
|
2
|
|
2
|
|
2
|
|
|||||
|
Other
|
3
|
|
3
|
|
2
|
|
|||||
|
Total stock-based compensation expense, before income tax benefit
|
53
|
|
50
|
|
42
|
|
|||||
|
Income tax benefit
|
(17
|
)
|
(17
|
)
|
(16
|
)
|
|||||
|
Total stock-based compensation expense, net of income tax benefit
|
|
$36
|
|
|
$33
|
|
|
$26
|
|
||
The stock-based compensation expense before income tax benefit was recorded in our consolidated statements of earnings as follows:
|
Fiscal year
|
2012
|
|
2011
|
|
2010
|
|
|||||
|
Cost of sales and related buying and occupancy costs
|
|
$14
|
|
|
$12
|
|
|
$13
|
|
||
|
Selling, general and administrative expenses
|
39
|
|
38
|
|
29
|
|
|||||
|
Total stock-based compensation expense, before income tax benefit
|
|
$53
|
|
|
$50
|
|
|
$42
|
|
||
The benefits of tax deductions in excess of the compensation cost recognized for stock-based awards are classified as financing cash inflows and are reflected as "Excess tax benefit from stock-based compensation" in the consolidated statements of cash flows.
54
Nordstrom, Inc.
Notes to Consolidated Financial Statements
Dollar and share amounts in millions except per share, per option and unit amounts
Stock Options
We used the following assumptions to estimate the fair value for stock options at grant date:
|
Fiscal year
|
2012
|
|
2011
|
|
2010
|
|
||
|
Risk-free interest rate:
Represents the yield on U.S. Treasury zero-coupon securities that mature over the 10-year life of the stock options.
|
0.3% – 2.0%
|
|
0.4% – 3.5%
|
|
0.5% – 4.0%
|
|
||
|
Weighted-average volatility:
Based on a combination of the historical volatility of our common stock and the implied volatility of exchange traded options for our common stock.
|
36.5
|
%
|
39.0
|
%
|
40.0
|
%
|
||
|
Weighted-average expected dividend yield:
Our forecasted dividend yield for the next 10 years.
|
2.1
|
%
|
2.0
|
%
|
1.3
|
%
|
||
|
Expected life in years:
Represents the estimated period of time until option exercise. The expected term of options granted was derived from the output of the Binomial Lattice option
valuation model and was based on our historical exercise behavior, taking into consideration the contractual term of the option and our employees' expected exercise and post-vesting employment termination behavior.
|
6.1
|
|
5.9
|
|
5.7
|
|
||
The weighted-average fair value per option at the grant date was
$15
,
$15
and
$13
in
2012
,
2011
and
2010
. In
2012
,
2011
and
2010
, stock option awards to employees were approved by the Compensation Committee of our Board of Directors and their exercise price was set at
$53
,
$45
and
$37
, the closing price of our common stock on
February 22, 2012
,
February 25, 2011
and
February 26, 2010
(the dates of grant). The awards are determined based upon a percentage of the recipients' base salary and the fair value of the stock options. In
2012
, we awarded stock options to
1,477
employees, compared with
1,331
and
1,259
employees in
2011
and 2010.
As of
February 2, 2013
, we have
13.5
options outstanding under the 2010 Plan. Options vest over
four
years, and expire
10
years after the date of grant. A summary of the stock option activity for
2012
is presented below:
|
Fiscal year
|
2012
|
||||||||||
|
|
Shares
|
Weighted-
average
exercise price
|
|
Weighted-average
remaining
contractual
life (years)
|
Aggregate
intrinsic
value
|
|
|||||
|
Outstanding, beginning of year
|
14.1
|
|
$32
|
|
|
|
|||||
|
Granted
|
2.9
|
53
|
|
||||||||
|
Exercised
|
(3.0)
|
25
|
|
||||||||
|
Cancelled
|
(0.5)
|
44
|
|
||||||||
|
Outstanding, end of year
|
13.5
|
|
$38
|
|
6
|
|
$237
|
|
|||
|
Options exercisable at end of year
|
6.7
|
|
$33
|
|
5
|
|
$148
|
|
|||
|
Options vested or expected to vest at end of year
|
12.6
|
|
$37
|
|
6
|
|
$226
|
|
|||
The total intrinsic value of options exercised during
2012
,
2011
and
2010
was
$90
,
$80
and
$51
. The total fair value of stock options vested during
2012
,
2011
and
2010
was
$32
,
$29
and
$27
. As of
February 2, 2013
, the total unrecognized stock-based compensation expense related to nonvested stock options was
$57
, which is expected to be recognized over a weighted-average period of
26
months.
Nordstrom, Inc. and subsidiaries
55
Nordstrom, Inc.
Notes to Consolidated Financial Statements
Dollar and share amounts in millions except per share, per option and unit amounts
HauteLook
As discussed in Note 2: HauteLook, consideration for our acquisition of HauteLook payable in Nordstrom stock includes ongoing vesting requirements for HauteLook's employees. These amounts are recorded as compensation expense as the related service is performed over the respective employee vesting periods of up to
four
years after the acquisition date.
A summary of the nonvested restricted stock award activity related to HauteLook for
2012
is as follows:
|
Fiscal year
|
2012
|
|||||
|
|
Shares
|
|
Weighted-
average grant-
date fair value
|
|
||
|
Outstanding, beginning of year
|
0.8
|
|
|
$42
|
|
|
|
Vested
|
(0.5
|
)
|
42
|
|
||
|
Outstanding, end of year
|
0.3
|
|
|
$42
|
|
|
The total fair value of restricted stock vested during
2012
was
$22
. As of
February 2, 2013
, the total unrecognized stock-based compensation expense related to HauteLook nonvested restricted stock awards was
$9
, which is expected to be recognized over a weighted-average period of
eight
months.
Performance Share Units
We grant performance share units to executive officers as one of the ways to align compensation with shareholder interests. Performance share units vest after a
three
-year period only when our total shareholder return (reflecting daily stock price appreciation and compounded reinvestment of dividends) is positive and outperforms companies in a defined group of competitors determined by the Compensation Committee of our Board of Directors. The percentage of units that are earned depends on our relative position at the end of the vesting period and can range from
0%
to
175%
of the number of units granted.
Performance share units are payable in either cash or stock as elected by the employee; therefore, they are classified as a liability award. The liability is remeasured, with a corresponding adjustment to earnings, at each fiscal quarter-end during the vesting period. The performance share unit liability is remeasured using the estimated percentage of units earned multiplied by the closing market price of our common stock on the current period-end date and is pro-rated based on the amount of time passed in the vesting period. The price used to issue stock or cash for the performance share units upon vesting is the closing market price of our common stock on the vest date.
Following is a summary of performance share unit activity:
|
Fiscal year
|
2012
|
|
|
|
Outstanding units, beginning of year
|
127,368
|
|
|
|
Granted
|
55,244
|
|
|
|
Vested but unearned
|
(15,987
|
)
|
|
|
Vested and earned
|
(47,961
|
)
|
|
|
Cancelled
|
(13,756
|
)
|
|
|
Outstanding units, end of year
|
104,908
|
|
|
|
Total fair value of performance share units earned
|
|
$3
|
|
|
Total fair value of performance share units settled or to be settled in cash
|
|
$2
|
|
As of
February 2, 2013
, our other liabilities included
$4
for performance share units. As of
February 2, 2013
, the remaining unrecognized stock-based compensation expense for unvested performance share units was
$1
, which is expected to be recognized over a weighted-average period of
12
months.
56
Nordstrom, Inc.
Notes to Consolidated Financial Statements
Dollar and share amounts in millions except per share, per option and unit amounts
Income tax expense consists of the following:
|
Fiscal year
|
2012
|
|
2011
|
|
2010
|
|
|||||
|
Current income taxes:
|
|||||||||||
|
Federal
|
|
$362
|
|
|
$359
|
|
|
$324
|
|
||
|
State and local
|
66
|
|
63
|
|
52
|
|
|||||
|
Total current income tax expense
|
428
|
|
422
|
|
376
|
|
|||||
|
Deferred income taxes:
|
|||||||||||
|
Federal
|
21
|
|
20
|
|
4
|
|
|||||
|
State and local
|
1
|
|
(6
|
)
|
(2
|
)
|
|||||
|
Total deferred income tax expense
|
22
|
|
14
|
|
2
|
|
|||||
|
Total income tax expense
|
|
$450
|
|
|
$436
|
|
|
$378
|
|
||
A reconciliation of the statutory federal income tax rate to the effective tax rate on earnings before income taxes is as follows:
|
Fiscal year
|
2012
|
|
2011
|
|
2010
|
|
||
|
Statutory rate
|
35.0
|
%
|
35.0
|
%
|
35.0
|
%
|
||
|
State and local income taxes, net of federal income taxes
|
3.6
|
|
3.6
|
|
3.4
|
|
||
|
Non-taxable acquisition-related items
|
—
|
|
0.6
|
|
—
|
|
||
|
Other, net
|
(0.6
|
)
|
(0.2
|
)
|
(0.2
|
)
|
||
|
Effective tax rate
|
38.0
|
%
|
39.0
|
%
|
38.2
|
%
|
||
In 2011, we acquired HauteLook in a tax-free merger transaction. The non-taxability of certain acquisition-related items, including goodwill impairment, resulted in an increase in our effective tax rate in 2011.
The major components of deferred tax assets and liabilities are as follows:
|
February 2, 2013
|
|
January 28, 2012
|
|
||||
|
Compensation and benefits accruals
|
|
$177
|
|
|
$167
|
|
|
|
Allowance for sales returns
|
51
|
|
45
|
|
|||
|
Accrued expenses
|
43
|
|
41
|
|
|||
|
Merchandise inventories
|
24
|
|
22
|
|
|||
|
Gift cards and gift certificates
|
18
|
|
17
|
|
|||
|
Loyalty reward certificates
|
22
|
|
17
|
|
|||
|
Allowance for credit losses
|
33
|
|
45
|
|
|||
|
Federal benefit of state taxes
|
7
|
|
6
|
|
|||
|
Gain on sale of interest rate swap
|
24
|
|
29
|
|
|||
|
Other
|
13
|
|
17
|
|
|||
|
Total deferred tax assets
|
412
|
|
406
|
|
|||
|
Land, buildings and equipment basis and depreciation differences
|
(90
|
)
|
(63
|
)
|
|||
|
Total deferred tax liabilities
|
(90
|
)
|
(63
|
)
|
|||
|
Net deferred tax assets
|
|
$322
|
|
|
$343
|
|
|
Nordstrom, Inc. and subsidiaries
57
Nordstrom, Inc.
Notes to Consolidated Financial Statements
Dollar and share amounts in millions except per share, per option and unit amounts
A reconciliation of the beginning and ending amount of unrecognized tax benefits for
2012
,
2011
and
2010
is as follows:
|
Fiscal year
|
2012
|
|
2011
|
|
2010
|
|
|||||
|
Unrecognized tax benefit at beginning of year
|
|
$21
|
|
|
$43
|
|
|
$43
|
|
||
|
Gross increase to tax positions in prior periods
|
1
|
|
14
|
|
3
|
|
|||||
|
Gross decrease to tax positions in prior periods
|
(7
|
)
|
(14
|
)
|
(3
|
)
|
|||||
|
Gross increase to tax positions in current period
|
1
|
|
2
|
|
3
|
|
|||||
|
Settlements
|
(1
|
)
|
(24
|
)
|
(3
|
)
|
|||||
|
Unrecognized tax benefit at end of year
|
|
$15
|
|
|
$21
|
|
|
$43
|
|
||
Settlement activity in 2011 includes amounts paid for a state tax matter and to close our 2008 IRS audit.
At the end of
2012
,
2011
and
2010
,
$7
,
$11
and
$21
of the ending gross unrecognized tax benefit related to items which, if recognized, would affect the effective tax rate.
Our income tax expense included a decrease to expense of
$1
in
2012
and
$4
in
2011
and an increase to expense of
$5
in
2010
for tax-related interest and penalties. At the end of
2012
,
2011
and
2010
, our liability for interest and penalties was
$7
,
$5
and
$11
.
We file income tax returns in the U.S. and a limited number of foreign jurisdictions. With few exceptions, we are no longer subject to federal, state and local, or non-U.S. income tax examinations for years before 2008. Unrecognized tax benefits related to federal, state and local tax positions may decrease by
$2
by
February 1, 2014
, due to the completion of examinations and the expiration of various statutes of limitations.
Earnings per basic share is computed using the weighted-average number of common shares outstanding during the year. Earnings per diluted share uses the weighted-average number of common shares outstanding during the year plus dilutive common stock equivalents, primarily stock options.
The computation of earnings per share is as follows:
|
Fiscal year
|
2012
|
|
2011
|
|
2010
|
|
|||||
|
Net earnings
|
|
$735
|
|
|
$683
|
|
|
$613
|
|
||
|
Basic shares
|
203.0
|
|
213.5
|
|
218.8
|
|
|||||
|
Dilutive effect of stock options and other
|
3.7
|
|
4.2
|
|
3.8
|
|
|||||
|
Diluted shares
|
206.7
|
|
217.7
|
|
222.6
|
|
|||||
|
Earnings per basic share
|
|
$3.62
|
|
|
$3.20
|
|
|
$2.80
|
|
||
|
Earnings per diluted share
|
|
$3.56
|
|
|
$3.14
|
|
|
$2.75
|
|
||
Options and other equity instruments totaling
4.2
shares in
2012
,
3.9
shares in
2011
and
6.1
shares in
2010
were excluded from earnings per diluted share because their impact was anti-dilutive.
58
Nordstrom, Inc.
Notes to Consolidated Financial Statements
Dollar and share amounts in millions except per share, per option and unit amounts
As of the end of
2012
, we have
two
reportable segments:
Retail
and
Credit
. Our
Retail
segment includes our "Nordstrom" operating segment, which is composed of our Nordstrom full-line stores and our online store at www.nordstrom.com. Through our multi-channel initiatives, we have integrated the operations, merchandising and technology of our Nordstrom full-line and online stores, consistent with our customers' expectations of a seamless shopping experience, regardless of channel. Our internal reporting to our president, who is our chief operating decision maker, is consistent with these multi-channel initiatives. We aggregate our Nordstrom Rack operating segment into the Retail reporting segment, based on similar economic and other qualitative characteristics. Additionally, we include HauteLook, Jeffrey and treasure&bond in the Retail reporting segment.
Through our
Credit
segment, we provide our customers with a variety of payment products and services, including a Nordstrom private label card,
two
Nordstrom VISA credit cards and a debit card for Nordstrom purchases. Our credit and debit card products also include a loyalty program that provides benefits to our cardholders based on their level of spending.
Amounts in the
Corporate/Other
column include unallocated corporate expenses and assets, inter-segment eliminations and other adjustments to segment results necessary for the presentation of consolidated financial results in accordance with generally accepted accounting principles.
In general, we use the same measurements to compute earnings before income taxes for reportable segments as we do for the consolidated company. However, redemptions of our Nordstrom Notes are included in net sales for our Retail segment. The sales amount in our Corporate/Other column includes an entry to eliminate these transactions from our consolidated net sales. There is no impact to consolidated earnings before income taxes for this adjustment. The related Nordstrom Notes expenses and other costs associated with the Fashion Rewards program are included in our Credit segment. In addition, our sales return reserve and other corporate adjustments are recorded in the Corporate/Other column. Other than as described above, the accounting policies of the operating segments are the same as those described in Note 1: Nature of Operations and Summary of Significant Accounting Policies.
Nordstrom, Inc. and subsidiaries
59
Nordstrom, Inc.
Notes to Consolidated Financial Statements
Dollar and share amounts in millions except per share, per option and unit amounts
The following table sets forth information for our reportable segments:
|
Retail
|
|
Credit
|
|
Corporate/Other
|
|
Total
|
|
||||||||
|
Fiscal year 2012
|
|||||||||||||||
|
Net sales
|
|
$11,949
|
|
—
|
|
|
($187
|
)
|
|
$11,762
|
|
||||
|
Credit card revenues
|
—
|
|
|
$386
|
|
—
|
|
386
|
|
||||||
|
Earnings (loss) before interest and income taxes
|
1,757
|
|
67
|
|
(479
|
)
|
1,345
|
|
|||||||
|
Interest expense, net
|
—
|
|
(26
|
)
|
(134
|
)
|
(160
|
)
|
|||||||
|
Earnings (loss) before income taxes
|
1,757
|
|
41
|
|
(613
|
)
|
1,185
|
|
|||||||
|
Capital expenditures
|
371
|
|
2
|
|
140
|
|
513
|
|
|||||||
|
Depreciation and amortization
|
357
|
|
2
|
|
70
|
|
429
|
|
|||||||
|
Goodwill
|
175
|
|
—
|
|
—
|
|
175
|
|
|||||||
|
Assets
1
|
3,922
|
|
2,201
|
|
1,966
|
|
8,089
|
|
|||||||
|
Fiscal year 2011
|
|||||||||||||||
|
Net sales
|
|
$10,656
|
|
—
|
|
|
($159
|
)
|
|
$10,497
|
|
||||
|
Credit card revenues
|
—
|
|
|
$380
|
|
—
|
|
380
|
|
||||||
|
Earnings (loss) before interest and income taxes
|
1,570
|
|
76
|
|
(397
|
)
|
1,249
|
|
|||||||
|
Interest expense, net
|
—
|
|
(13
|
)
|
(117
|
)
|
(130
|
)
|
|||||||
|
Earnings (loss) before income taxes
|
1,570
|
|
63
|
|
(514
|
)
|
1,119
|
|
|||||||
|
Capital expenditures
|
424
|
|
2
|
|
85
|
|
511
|
|
|||||||
|
Depreciation and amortization
|
313
|
|
2
|
|
56
|
|
371
|
|
|||||||
|
Goodwill
|
175
|
|
—
|
|
—
|
|
175
|
|
|||||||
|
Assets
1
|
3,642
|
|
2,135
|
|
2,714
|
|
8,491
|
|
|||||||
|
Fiscal year 2010
|
|||||||||||||||
|
Net sales
|
|
$9,420
|
|
—
|
|
|
($110
|
)
|
|
$9,310
|
|
||||
|
Credit card revenues
|
—
|
|
|
$390
|
|
—
|
|
390
|
|
||||||
|
Earnings (loss) before interest and income taxes
|
1,406
|
|
51
|
|
(339
|
)
|
1,118
|
|
|||||||
|
Interest expense, net
|
—
|
|
(21
|
)
|
(106
|
)
|
(127
|
)
|
|||||||
|
Earnings (loss) before income taxes
|
1,406
|
|
30
|
|
(445
|
)
|
991
|
|
|||||||
|
Capital expenditures
|
361
|
|
1
|
|
37
|
|
399
|
|
|||||||
|
Depreciation and amortization
|
295
|
|
2
|
|
30
|
|
327
|
|
|||||||
|
Goodwill
|
53
|
|
—
|
|
—
|
|
53
|
|
|||||||
|
Assets
1
|
3,234
|
|
2,060
|
|
2,168
|
|
7,462
|
|
|||||||
1
Assets in Corporate/Other include unallocated assets in corporate headquarters, consisting primarily of cash, land, buildings and equipment and deferred tax assets.
The following table summarizes net sales within our reportable segments:
|
Fiscal year
|
2012
|
|
2011
|
|
2010
|
|
|||||
|
Nordstrom full-line stores
|
|
$7,964
|
|
|
$7,513
|
|
|
|
$6,995
|
|
|
|
Direct
|
1,269
|
|
913
|
|
|
705
|
|
||||
|
Nordstrom
|
9,233
|
|
8,426
|
|
7,700
|
|
|||||
|
Nordstrom Rack
|
2,445
|
|
2,045
|
|
1,691
|
|
|||||
|
Other retail
1
|
271
|
|
185
|
|
29
|
|
|||||
|
Total Retail segment
|
11,949
|
|
10,656
|
|
9,420
|
|
|||||
|
Corporate/Other
|
(187
|
)
|
(159
|
)
|
(110
|
)
|
|||||
|
Total net sales
|
|
$11,762
|
|
|
$10,497
|
|
|
$9,310
|
|
||
1
Other retail includes our HauteLook online private sale subsidiary, our Jeffrey stores and our treasure&bond store.
60
Nordstrom, Inc.
Notes to Consolidated Financial Statements
Dollar and share amounts in millions except per share, per option and unit amounts
The following table summarizes net sales by merchandise category:
|
Fiscal year
|
2012
|
2011
|
2010
|
|||||||||||||||||
|
|
Net sales
|
|
% of total
|
|
Net sales
|
|
% of total
|
|
Net sales
|
|
% of total
|
|
||||||||
|
Women’s apparel
|
|
$3,684
|
|
31
|
%
|
|
$3,438
|
|
33
|
%
|
|
$3,184
|
|
34
|
%
|
|||||
|
Shoes
|
2,716
|
|
23
|
%
|
2,413
|
|
23
|
%
|
2,094
|
|
23
|
%
|
||||||||
|
Men’s apparel
|
1,866
|
|
16
|
%
|
1,612
|
|
15
|
%
|
1,415
|
|
15
|
%
|
||||||||
|
Women’s accessories
|
1,574
|
|
13
|
%
|
1,311
|
|
12
|
%
|
1,101
|
|
12
|
%
|
||||||||
|
Cosmetics
|
1,255
|
|
11
|
%
|
1,106
|
|
11
|
%
|
972
|
|
10
|
%
|
||||||||
|
Kids’ apparel
|
381
|
|
3
|
%
|
341
|
|
3
|
%
|
303
|
|
3
|
%
|
||||||||
|
Other
|
286
|
|
3
|
%
|
276
|
|
3
|
%
|
241
|
|
3
|
%
|
||||||||
|
Total net sales
|
|
$11,762
|
|
100
|
%
|
|
$10,497
|
|
100
|
%
|
|
$9,310
|
|
100
|
%
|
|||||
|
1st Quarter
|
|
2nd Quarter
|
|
3rd Quarter
|
|
4th Quarter
|
|
Total
|
|
||||||||||
|
Fiscal year 2012
|
|||||||||||||||||||
|
Net sales
|
|
$2,535
|
|
|
$2,918
|
|
|
$2,713
|
|
|
$3,596
|
|
|
$11,762
|
|
||||
|
Same-store sales percentage change
1
|
8.5
|
%
|
4.5
|
%
|
10.7
|
%
|
6.3
|
%
|
7.3
|
%
|
|||||||||
|
Credit card revenues
|
94
|
|
91
|
|
95
|
|
106
|
|
386
|
|
|||||||||
|
Gross profit
2
|
951
|
|
1,039
|
|
983
|
|
1,357
|
|
4,330
|
|
|||||||||
|
Selling, general and administrative expenses:
|
|||||||||||||||||||
|
Retail
|
721
|
|
778
|
|
755
|
|
912
|
|
3,166
|
|
|||||||||
|
Credit
|
44
|
|
62
|
|
46
|
|
53
|
|
205
|
|
|||||||||
|
Earnings before income taxes
|
240
|
|
250
|
|
239
|
|
456
|
|
1,185
|
|
|||||||||
|
Net earnings
|
149
|
|
156
|
|
146
|
|
284
|
|
735
|
|
|||||||||
|
Earnings per basic share
|
|
$0.72
|
|
|
$0.76
|
|
|
$0.73
|
|
|
$1.43
|
|
|
$3.62
|
|
||||
|
Earnings per diluted share
|
|
$0.70
|
|
|
$0.75
|
|
|
$0.71
|
|
|
$1.40
|
|
|
$3.56
|
|
||||
|
Fiscal year 2011
|
|||||||||||||||||||
|
Net sales
|
|
$2,229
|
|
|
$2,716
|
|
|
$2,383
|
|
|
$3,169
|
|
|
$10,497
|
|
||||
|
Same-store sales percentage change
1
|
6.5
|
%
|
7.3
|
%
|
7.9
|
%
|
7.1
|
%
|
7.2
|
%
|
|||||||||
|
Credit card revenues
|
94
|
|
94
|
|
95
|
|
97
|
|
380
|
|
|||||||||
|
Gross profit
2
|
844
|
|
993
|
|
872
|
|
1,196
|
|
3,905
|
|
|||||||||
|
Selling, general and administrative expenses:
|
|||||||||||||||||||
|
Retail
|
611
|
|
708
|
|
670
|
|
818
|
|
2,807
|
|
|||||||||
|
Credit
|
55
|
|
59
|
|
57
|
|
58
|
|
229
|
|
|||||||||
|
Earnings before income taxes
|
241
|
|
290
|
|
209
|
|
379
|
|
1,119
|
|
|||||||||
|
Net earnings
|
145
|
|
175
|
|
127
|
|
236
|
|
683
|
|
|||||||||
|
Earnings per basic share
|
|
$0.66
|
|
|
$0.81
|
|
|
$0.60
|
|
|
$1.13
|
|
|
$3.20
|
|
||||
|
Earnings per diluted share
|
|
$0.65
|
|
|
$0.80
|
|
|
$0.59
|
|
|
$1.11
|
|
|
$3.14
|
|
||||
1
Same-store sales include sales from stores that have been open at least one full year at the beginning of the year. Fiscal year 2012 includes an extra week (the 53
rd
week) in the fourth quarter as a result of our 4-5-4 retail reporting calendar. The 53
rd
week is not included in same-store sales calculations. We also include sales from our Nordstrom online store in same-store sales because of the integration of our Nordstrom full-line stores and online store.
2
Gross profit is calculated as net sales less cost of sales and related buying and occupancy costs (for all segments).
Nordstrom, Inc. and subsidiaries
61
None.
DISCLOSURE CONTROLS AND PROCEDURES
As of the end of the period covered by this Annual Report on Form 10-K, the Company performed an evaluation under the supervision and with the participation of management, including our President and Chief Financial Officer, of the design and effectiveness of our disclosure controls and procedures (as defined in rules 13a-15(e) or 15d-15(e) under the Securities Exchange Act of 1934 (the "Exchange Act")). Based upon that evaluation, our President and Chief Financial Officer concluded that, as of the end of the period covered by this Annual Report, our disclosure controls and procedures were effective in the timely and accurate recording, processing, summarizing and reporting of material financial and non-financial information within the time periods specified within the Commission's rules and forms. Our President and Chief Financial Officer also concluded that our disclosure controls and procedures were effective to ensure that information required to be disclosed in the reports that we file or submit under the Exchange Act is accumulated and communicated to our management, including our President and Chief Financial Officer, to allow timely decisions regarding required disclosure.
CHANGES IN INTERNAL CONTROL OVER FINANCIAL REPORTING
There have been no changes in our internal control over financial reporting (as defined in Rules 13a-15(f) or 15d-15(f) of the Exchange Act) during our most recently completed fiscal quarter that have materially affected, or are reasonably likely to materially affect, our internal control over financial reporting.
MANAGEMENT'S REPORT ON INTERNAL CONTROL OVER FINANCIAL REPORTING
Our management is responsible for establishing and maintaining adequate internal control over financial reporting, as is defined in the Securities Exchange Act of 1934. These internal controls are designed to provide reasonable assurance that the reported financial information is presented fairly, that disclosures are adequate and that the judgments inherent in the preparation of financial statements are reasonable. There are inherent limitations in the effectiveness of any system of internal control, including the possibility of human error and overriding of controls. Consequently, an effective internal control system can only provide reasonable, not absolute, assurance with respect to reporting financial information.
Management conducted an evaluation of the effectiveness of our internal control over financial reporting based on the framework and criteria established in
Internal Control – Integrated Framework,
issued by the Committee of Sponsoring Organizations of the Treadway Commission. Based on this evaluation, management concluded that the Company's internal control over financial reporting was effective as of February 2, 2013.
Deloitte & Touche LLP, an independent registered public accounting firm, is retained to audit Nordstrom's consolidated financial statements and the effectiveness of the Company's internal control over financial reporting. They have issued an attestation report on the Company's internal control over financial reporting as of February 2, 2013, which is included herein.
62
REPORT OF INDEPENDENT REGISTERED PUBLIC ACCOUNTING FIRM
To the Board of Directors and Shareholders of Nordstrom, Inc.
Seattle, Washington
We have audited the internal control over financial reporting of Nordstrom, Inc. and subsidiaries (the "Company") as of February 2, 2013, based on criteria established in
Internal Control – Integrated Framework,
issued by the Committee of Sponsoring Organizations of the Treadway Commission. The Company's management is responsible for maintaining effective internal control over financial reporting and for its assessment of the effectiveness of internal control over financial reporting, included in the accompanying
Management's Report on Internal Control Over Financial Reporting.
Our responsibility is to express an opinion on the Company's internal control over financial reporting based on our audit.
We conducted our audit in accordance with the standards of the Public Company Accounting Oversight Board (United States). Those standards require that we plan and perform the audit to obtain reasonable assurance about whether effective internal control over financial reporting was maintained in all material respects. Our audit included obtaining an understanding of internal control over financial reporting, assessing the risk that a material weakness exists, testing and evaluating the design and operating effectiveness of internal control based on the assessed risk, and performing such other procedures as we considered necessary in the circumstances. We believe that our audit provides a reasonable basis for our opinion.
A company's internal control over financial reporting is a process designed by, or under the supervision of, the company's principal executive and principal financial officers, or persons performing similar functions, and effected by the company's board of directors, management, and other personnel to provide reasonable assurance regarding the reliability of financial reporting and the preparation of financial statements for external purposes in accordance with generally accepted accounting principles. A company's internal control over financial reporting includes those policies and procedures that (1) pertain to the maintenance of records that, in reasonable detail, accurately and fairly reflect the transactions and dispositions of the assets of the company; (2) provide reasonable assurance that transactions are recorded as necessary to permit preparation of financial statements in accordance with generally accepted accounting principles, and that receipts and expenditures of the company are being made only in accordance with authorizations of management and directors of the company; and (3) provide reasonable assurance regarding prevention or timely detection of unauthorized acquisition, use, or disposition of the company's assets that could have a material effect on the financial statements.
Because of the inherent limitations of internal control over financial reporting, including the possibility of collusion or improper management override of controls, material misstatements due to error or fraud may not be prevented or detected on a timely basis. Also, projections of any evaluation of the effectiveness of the internal control over financial reporting to future periods are subject to the risk that the controls may become inadequate because of changes in conditions, or that the degree of compliance with the policies or procedures may deteriorate.
In our opinion, the Company maintained, in all material respects, effective internal control over financial reporting as of February 2, 2013, based on the criteria established in
Internal Control – Integrated Framework
issued by the Committee of Sponsoring Organizations of the Treadway Commission.
We have also audited, in accordance with the standards of the Public Company Accounting Oversight Board (United States), the consolidated financial statements as of and for the year ended February 2, 2013 of the Company and our report dated March 18, 2013 expressed an unqualified opinion on those financial statements.
/s/ Deloitte & Touche LLP
Seattle, Washington
March 18, 2013
Nordstrom, Inc. and subsidiaries
63
None.
The information required under this item is included in the following sections of our Proxy Statement for our
2013
Annual Meeting of Shareholders, which sections are incorporated by reference herein and will be filed within 120 days after the end of our fiscal year:
Executive Officers
Director Elections
Board Committees and Charters
Director Nominating Process
Website Access to Corporate Governance Documents
Section 16(a) Beneficial Ownership Reporting Compliance
Corporate Governance
The certifications of our President and Chief Financial Officer required pursuant to Sections 302 and 906 of the Sarbanes-Oxley Act of 2002 are included as exhibits to this Annual Report on Form 10-K and were included as exhibits to each of our quarterly reports on Form 10-Q. Our President certified to the New York Stock Exchange ("NYSE") on
May 21, 2012
pursuant to Section 303A.12(a) of the NYSE's listing standards, that he was not aware of any violation by the Company of the NYSE's corporate governance listing standards as of that date.
The information required under this item is included in the following sections of our Proxy Statement for our
2013
Annual Meeting of Shareholders, which sections are incorporated by reference herein and will be filed within 120 days after the end of our fiscal year:
Compensation of Executive Officers
Compensation Discussion and Analysis
Director Compensation
Compensation Committee Interlocks and Insider Participation
The information required under this item is included in the following sections of our Proxy Statement for our
2013
Annual Meeting of Shareholders, which sections are incorporated by reference herein and will be filed within 120 days after the end of our fiscal year:
Security Ownership of Certain Beneficial Owners and Management
Equity Compensation Plans
The information required under this item is included in the following sections of our Proxy Statement for our
2013
Annual Meeting of Shareholders, which sections are incorporated by reference herein and will be filed within 120 days after the end of our fiscal year:
Election of Directors
Certain Relationships and Related Transactions
The information required under this item is included in the following section of our Proxy Statement for our
2013
Annual Meeting of Shareholders, which section is incorporated by reference herein and will be filed within 120 days after the end of our fiscal year:
Ratification of the Appointment of Independent Registered Public Accounting Firm
64
The following information required under this item is filed as part of this report:
(a)1. FINANCIAL STATEMENTS
|
|
Page
|
|
|
Report of Independent Registered Public Accounting Firm
|
35
|
|
|
Consolidated Statements of Earnings
|
36
|
|
|
Consolidated Statements of Comprehensive Earnings
|
36
|
|
|
Consolidated Balance Sheets
|
37
|
|
|
Consolidated Statements of Shareholders' Equity
|
38
|
|
|
Consolidated Statements of Cash Flows
|
39
|
|
|
Management's Report on Internal Control Over Financial Reporting
|
62
|
|
|
Report of Independent Registered Public Accounting Firm
|
63
|
|
(a)3. EXHIBITS
Exhibits are incorporated herein by reference or are filed with this report as set forth in the Index to Exhibits on pages 68 through 74 hereof.
All other schedules and exhibits are omitted because they are not applicable, not required or because the information required has been given as part of this report.
Nordstrom, Inc. and subsidiaries
65
SIGNATURES
Pursuant to the requirements of Section 13 or 15(d) of the Securities Exchange Act of 1934, the registrant has duly caused this report to be signed on its behalf by the undersigned, thereunto duly authorized.
|
NORDSTROM, INC.
|
|||
|
(Registrant)
|
|||
|
|
/s/ Michael G. Koppel
|
||
|
|
Michael G. Koppel
|
||
|
Executive Vice President and Chief Financial Officer
|
|||
|
(Principal Financial Officer)
|
|||
Date:
March 18, 2013
Pursuant to the requirements of the Securities Exchange Act of 1934, this report has been signed below by the following persons on behalf of the registrant and in the capacities and on the date indicated.
|
Principal Financial Officer:
|
Principal Executive Officer:
|
||||
|
/s/
|
Michael G. Koppel
|
/s/
|
Blake W. Nordstrom
|
||
|
Michael G. Koppel
|
Blake W. Nordstrom
|
||||
|
Executive Vice President and Chief Financial Officer
|
President
|
||||
|
Principal Accounting Officer:
|
|||||
|
/s/
|
James A. Howell
|
||||
|
James A. Howell
|
|||||
|
Vice President, Finance
|
|||||
|
Directors:
|
|||||
|
/s/
|
Phyllis J. Campbell
|
/s/
|
Michelle M. Ebanks
|
||
|
Phyllis J. Campbell
|
Michelle M. Ebanks
|
||||
|
Director
|
Director
|
||||
|
/s/
|
Enrique Hernandez, Jr.
|
/s/
|
Robert G. Miller
|
||
|
Enrique Hernandez, Jr.
|
Robert G. Miller
|
||||
|
Chairman of the Board of Directors
|
Director
|
||||
|
/s/
|
Blake W. Nordstrom
|
/s/
|
Erik B. Nordstrom
|
||
|
Blake W. Nordstrom
|
Erik B. Nordstrom
|
||||
|
Director
|
Director
|
||||
|
/s/
|
Peter E. Nordstrom
|
/s/
|
Philip G. Satre
|
||
|
Peter E. Nordstrom
|
Philip G. Satre
|
||||
|
Director
|
Director
|
||||
|
/s/
|
B. Kevin Turner
|
/s/
|
Robert D. Walter
|
||
|
B. Kevin Turner
|
Robert D. Walter
|
||||
|
Director
|
Director
|
||||
|
/s/
|
Alison A. Winter
|
||||
|
Alison A. Winter
|
|||||
|
Director
|
|||||
|
Date:
|
March 18, 2013
|
||||
66
CONSENT OF INDEPENDENT REGISTERED PUBLIC ACCOUNTING FIRM
We consent to the incorporation by reference in Registration Statement Nos. 333-166961, 333-161803, 333-63403, 333-40064, 333-40066, 333-79791, 333-101110, 333-118756, 333-146049, 333-174336 and 333-173020 on Form S-8 and 333-173179 and 333-177175 on Form S-3 of our reports dated
March 18, 2013
, relating to the consolidated financial statements of Nordstrom, Inc. and subsidiaries, and the effectiveness of Nordstrom, Inc.'s internal control over financial reporting, appearing in the Annual Report on Form 10-K of Nordstrom, Inc. for the year ended
February 2, 2013
.
/s/ Deloitte & Touche LLP
Seattle, Washington
March 18, 2013
Nordstrom, Inc. and subsidiaries
67
|
|
Exhibit
|
|
Method of Filing
|
|
1.1
|
Underwriting Agreement dated October 5, 2011, by and among the Company and Merrill Lynch, Pierce, Fenner & Smith Incorporated and Wells Fargo Securities, LLC, as representatives of the several underwriters of the Notes
|
|
Incorporated by reference from the Registrant's Form 8-K filed on October 11, 2011, Exhibit 1.1
|
|
3.1
|
Articles of Incorporation as amended and restated on May 25, 2005
|
|
Incorporated by reference from the Registrant's Form 8-K filed on May 31, 2005, Exhibit 3.1
|
|
3.2
|
Bylaws, as amended and restated on November 19, 2008
|
|
Incorporated by reference from the Registrant's Form 8-K filed on November 24, 2008, Exhibit 3.1
|
|
4.1
|
Indenture between Registrant and Norwest Bank Colorado, N.A., as trustee, dated March 11, 1998
|
|
Incorporated by reference from Registration No. 333-47035, Exhibit 4.1
|
|
4.2
|
Series 2007-2 Note purchase agreement, dated as of April 25, 2007, by and between Nordstrom Credit Card Master Note Trust II and J.P. Morgan Securities Inc. and Greenwich Capital Markets, Inc., as representative of the initial purchasers
|
|
Incorporated by reference from the Registrant's Form 8-K filed on May 1, 2007, Exhibit 4.2
|
|
4.3
|
Amended and Restated Master Indenture, dated as of May 1, 2007, by and between Nordstrom Credit Card Master Note Trust II and Wells Fargo Bank, National Association, as indenture trustee
|
|
Incorporated by reference from the Registrant's Form 8-K filed on May 8, 2007, Exhibit 4.1
|
|
4.4
|
Series 2007-2 Indenture Supplement, dated as of May 1, 2007, by and between Nordstrom Credit Card Master Note Trust II and Wells Fargo Bank, National Association, as indenture trustee
|
|
Incorporated by reference from the Registrant's Form 8-K filed on May 8, 2007, Exhibit 4.3
|
|
4.5
|
Series 2011-1 Indenture Supplement, dated as of November 22, 2011, by and between Nordstrom Credit Card Master Note Trust II and Wells Fargo Bank, National Association, as indenture trustee
|
|
Incorporated by reference from the Registrant's Form 8-K filed on November 28, 2011, Exhibit 4.2
|
|
4.6
|
Note Purchase Agreement, dated as of November 13, 2009, by and between Nordstrom Credit Card Receivables II LLC, Nordstrom fsb, Nordstrom Credit, Inc., Falcon Asset Securitization Company, LLC and J.P. Morgan Chase Bank, N.A.
|
|
Incorporated by reference from the Registrant's Form 8-K filed on November 18, 2009, Exhibit 4.2
|
|
4.7
|
First Amendment to the Note Purchase Agreement dated November 13, 2009, by and between Nordstrom Credit Card Receivables II LLC, Nordstrom fsb, Nordstrom Credit, Inc., Falcon Asset Securitization Company, LLC and J.P. Morgan Chase Bank, N.A., dated January 20, 2010
|
|
Incorporated by reference from the Registrant's Form 8-K filed on January 21, 2010, Exhibit 4.1
|
|
4.8
|
Second Amendment to the Note Purchase Agreement dated November 13, 2009, by and between Nordstrom Credit Card Receivables II LLC, Nordstrom fsb, Nordstrom Credit, Inc., the conduit purchasers from time to time party thereto, the committed purchasers from time to time party thereto, the agents from time to time party thereto, and the administrative agent, dated January 11, 2011
|
|
Incorporated by reference from the Registrant's Form 8-K filed on January 13, 2011, Exhibit 4.1
|
|
4.9
|
Note Purchase Agreement, dated as of November 16, 2011, by and between Nordstrom Credit Card Receivables II LLC, Nordstrom fsb, Nordstrom Credit, Inc., RBS Securities Inc. and J.P. Morgan Securities LLC
|
|
Incorporated by reference from the Registrant's Form 8-K filed on November 28, 2011, Exhibit 4.1
|
|
4.10
|
Form of 6.25% Note due January 2018
|
|
Incorporated by reference from the Registrant's Form 8-K filed on December 3, 2007, Exhibit 4.1
|
|
4.11
|
Form of 6.75% Note due June 2014
|
|
Incorporated by reference from the Registrant's Form 8-K filed on May 26, 2009, Exhibit 4.1
|
|
4.12
|
Form of 4.75% Note due May 1, 2020
|
|
Incorporated by reference from the Registrant's Form 8-K filed on April 23, 2010, Exhibit 4.1
|
68
|
|
Exhibit
|
|
Method of Filing
|
|
4.13
|
Form of 4.00% Note due 2021
|
|
Incorporated by reference from the Registrant's Form 8-K filed on October 11, 2011, Exhibit 4.1
|
|
10.1*
|
Nordstrom 401(k) Plan & Profit Sharing, amended and restated on August 27, 2008
|
|
Incorporated by reference from the Registrant's Quarterly Report on Form 10-Q for the quarter ended November 1, 2008, Exhibit 10.1
|
|
10.2*
|
Amendment 2009-1 to the Nordstrom 401(k) Plan & Profit Sharing
|
|
Incorporated by reference from the Registrant's Form 8-K filed on March 3, 2009, Exhibit 10.5
|
|
10.3*
|
Amendment 2009-2 to the Nordstrom 401(k) Plan & Profit Sharing
|
|
Incorporated by reference from the Registrant's Form 10-Q for the quarter ended May 1, 2010, Exhibit 10.2
|
|
10.4*
|
Amendment 2009-3 to the Nordstrom 401(k) Plan & Profit Sharing
|
|
Incorporated by reference from the Registrant's Form 10-Q for the quarter ended May 1, 2010, Exhibit 10.3
|
|
10.5*
|
Amendment 2010-1 to the Nordstrom 401(k) Plan & Profit Sharing
|
|
Incorporated by reference from the Registrant's Form 10-Q for the quarter ended May 1, 2010, Exhibit 10.4
|
|
10.6*
|
Amendment 2010-2 to the Nordstrom 401(k) Plan & Profit Sharing
|
|
Incorporated by reference from the Registrant's Form 10-Q for the quarter ended May 1, 2010, Exhibit 10.5
|
|
10.7*
|
Amendment 2010-3 to the Nordstrom 401(k) Plan & Profit Sharing
|
|
Incorporated by reference from the Registrant's Form 10-Q for the quarter ended April 30, 2011, Exhibit 10.1
|
|
10.8*
|
Amendment 2011-1 to the Nordstrom 401(k) Plan & Profit Sharing
|
|
Incorporated by reference from the Registrant's Form 10-K for the year ended January 28, 2012, Exhibit 10.8
|
|
10.9*
|
Amendment 2012-1 to the Nordstrom 401(k) Plan & Profit Sharing
|
Incorporated by reference from the Registrant's Form 10-Q for the quarter ended April 28, 2012, Exhibit 10.3
|
|
|
10.10*
|
Amendment to the Participant Loan Program of the Nordstrom 401(k) Plan & Profit Sharing
|
|
Incorporated by reference from the Registrant's Form 10-K for the year ended January 28, 2012, Exhibit 10.9
|
|
10.11*
|
Nordstrom, Inc. Executive Management Group Bonus Plan
|
|
Incorporated by reference from the Registrant's definitive proxy statement filed with the Commission on April 15, 2004
|
|
10.12*
|
Nordstrom, Inc. Executive Management Bonus Plan
|
|
Incorporated by reference from the Registrant's Form 10-Q for the quarter ended May 2, 2009, Exhibit 10.6
|
|
10.13*
|
Amended and Restated Nordstrom, Inc. Executive Management Bonus Plan
|
Incorporated by reference from the Registrant's Form DEF 14A filed on March 30, 2012
|
|
|
10.14*
|
Nordstrom Executive Deferred Compensation Plan (2007)
|
|
Incorporated by reference from the Registrant's Form 8-K filed on November 19, 2007, Exhibit 10.40
|
|
10.15*
|
Amendment 2008-1 to the Nordstrom Executive Deferred Compensation Plan (2007)
|
|
Incorporated by reference from the Registrant's Form 8-K filed on November 24, 2008, Exhibit 10.2
|
|
10.16*
|
Amendment 2008-2 to the Nordstrom Executive Deferred Compensation Plan
|
|
Incorporated by reference from the Registrant's Form S-8 filed on September 9, 2009, Exhibit 10.4
|
|
10.17*
|
Amendment 2010-2 to the Nordstrom Executive Deferred Compensation Plan (2007 Restatement)
|
|
Incorporated by reference from the Registrant's Form 8-K filed on December 23, 2010, Exhibit 10.1
|
|
10.18*
|
Nordstrom, Inc. Employee Stock Purchase Plan, amended and restated on August 27, 2008
|
|
Incorporated by reference from the Registrant's Quarterly Report on Form 10-Q for the quarter ended November 1, 2008, Exhibit 10.2
|
|
10.19*
|
Nordstrom, Inc. Employee Stock Purchase Plan (2011 Restatement)
|
|
Incorporated by reference to Appendix A to the Registrant's Form DEF 14A filed on March 31, 2011
|
|
10.20*
|
1997 Nordstrom Stock Option Plan, amended and restated on February 16, 2000
|
|
Incorporated by reference from the Registrant's Quarterly Report on Form 10-Q for the quarter ended August 2, 2003, Exhibit 10.1
|
|
10.21*
|
Form of Notice of 2002 Stock Option Grant and Stock Option Agreement under the Nordstrom, Inc. 1997 Equity Incentive Plan
|
|
Incorporated by reference from the Registrant's Annual Report on Form 10-K for the year ended February 2, 2008, Exhibit 10.41
|
* This exhibit is a management contract, compensatory plan or arrangement
Nordstrom, Inc. and subsidiaries
69
|
|
Exhibit
|
|
Method of Filing
|
|
10.22*
|
Form of Notice of 2003 Stock Option Grant and Stock Option Agreement under the Nordstrom, Inc. 1997 Equity Incentive Plan
|
|
Incorporated by reference from the Registrant's Annual Report on Form 10-K for the year ended February 2, 2008, Exhibit 10.42
|
|
10.23*
|
Form of Notice of 2004 Stock Option Grant and Stock Option Agreement under the Nordstrom, Inc. 1997 Equity Incentive Plan
|
|
Incorporated by reference from the Registrant's Annual Report on Form 10-K for the year ended February 2, 2008, Exhibit 10.43
|
|
10.24*
|
2004 Equity Incentive Plan
|
|
Incorporated by reference from the Registrant's definitive proxy statement filed with the Commission on April 15, 2004
|
|
10.25*
|
Nordstrom, Inc. 2004 Equity Incentive Plan (2007 Amendment)
|
|
Incorporated by reference from the Registrant's Form 8-K filed on November 19, 2007, Exhibit 10.44
|
|
10.26*
|
Nordstrom, Inc. 2004 Equity Incentive Plan (2008 Amendment)
|
|
Incorporated by reference from the Registrant's Form 8-K filed on November 24, 2008, Exhibit 10.1
|
|
10.27*
|
Form of Notice of 2005 Stock Option Grant and Stock Option Agreement under the Nordstrom, Inc. 2004 Equity Incentive Plan
|
|
Incorporated by reference from the Registrant's Form 8-K filed on March 1, 2005, Exhibit 10.1
|
|
10.28*
|
Form of Notice of 2006 Stock Option Grant and Stock Option Agreement under the Nordstrom, Inc. 2004 Equity Incentive Plan
|
|
Incorporated by reference from the Registrant's Annual Report on Form 10-K for the year ended February 2, 2008, Exhibit 10.45
|
|
10.29*
|
2007 Stock Option Notice Award Agreement and Form of Notice
|
|
Incorporated by reference from the Registrant's Form 8-K filed on February 26, 2007, Exhibit 10.1
|
|
10.30*
|
2008 Stock Option Notice Award Agreement and Form of Notice
|
|
Incorporated by reference from the Registrant's Form 8-K filed on February 22, 2008, Exhibit 10.1
|
|
10.31*
|
2009 Nonqualified Stock Option Grant Agreement and Form of Notice
|
|
Incorporated by reference from the Registrant's Form 8-K filed on March 3, 2009, Exhibit 10.2
|
|
10.32*
|
2010 Stock Option Award Agreement
|
|
Incorporated by reference from the Registrant's Form 8-K filed on November 24, 2009, Exhibit 10.1
|
|
10.33*
|
Nordstrom, Inc. 2010 Equity Incentive Plan
|
|
Incorporated by reference to Appendix A to the Registrant's Form DEF 14A filed on April 8, 2010
|
|
10.34*
|
Form of 2011 Stock Option Award Agreement
|
|
Incorporated by reference from the Registrant's Form 8-K filed on November 19, 2010, Exhibit 10.1
|
|
10.35*
|
Form of 2012 Nonqualified Stock Option Grant Agreement
|
|
Incorporated by reference from the Registrant's Form 8-K filed on November 18, 2011, Exhibit 10.1
|
|
10.36*
|
Form of 2013 Nonqualified Stock Option Grant Agreement
|
Incorporated by reference from the Registrant's Form 8-K filed on November 14, 2012, Exhibit 10.1
|
|
|
10.37*
|
Nordstrom, Inc. Leadership Separation Plan (Effective March 1, 2005)
|
|
Incorporated by reference from the Registrant's Annual Report on Form 10-K for the year ended January 29, 2005, Exhibit 10.43
|
|
10.38*
|
Amendment 2006-1 to the Nordstrom, Inc. Leadership Separation Plan
|
|
Incorporated by reference from the Registrant's Annual Report on Form 10-K for the year ended February 2, 2008, Exhibit 10.56
|
|
10.39*
|
Amendment 2008-1, Nordstrom, Inc. Leadership Separation Plan
|
|
Incorporated by reference from the Registrant's Form 8-K filed on November 24, 2008, Exhibit 10.3
|
|
10.40*
|
Amendment 2011-1 to the Nordstrom Leadership Separation Plan
|
|
Incorporated by reference from the Registrant's Form 8-K filed on August 25, 2011, Exhibit 10.1
|
|
10.41*
|
2008 Performance Share Unit Agreement and Form of Notice
|
|
Incorporated by reference from the Registrant's Form 8-K filed on February 22, 2008, Exhibit 10.2
|
|
10.42*
|
2009 Performance Share Unit Award Agreement and Form of Notice
|
|
Incorporated by reference from the Registrant's Form 8-K filed on March 3, 2009, Exhibit 10.3
|
* This exhibit is a management contract, compensatory plan or arrangement
70
|
|
Exhibit
|
|
Method of Filing
|
|
10.43*
|
2010 Performance Share Unit Award Agreement
|
|
Incorporated by reference from the Registrant's Form 8-K filed on November 24, 2009, Exhibit 10.2
|
|
10.44*
|
Form of 2011 Performance Share Unit Award Agreement
|
|
Incorporated by reference from the Registrant's Form 8-K filed on November 19, 2010, Exhibit 10.2
|
|
10.45*
|
Form of 2012 Performance Share Unit Agreement
|
|
Incorporated by reference from the Registrant's Form 8-K filed on November 18, 2011, Exhibit 10.2
|
|
10.46*
|
Form of 2013 Performance Share Unit Award Agreement
|
Incorporated by reference from the Registrant's Form 8-K filed on November 14, 2012, Exhibit 10.2
|
|
|
10.47*
|
Nordstrom Supplemental Executive Retirement Plan (2008)
|
|
Incorporated by reference from the Registrant's Form 8-K filed on November 24, 2008, Exhibit 10.4
|
|
10.48*
|
Amendment 2009-1 to the Nordstrom Supplemental Executive Retirement Plan
|
|
Incorporated by reference from the Registrant's Form 8-K filed on March 3, 2009, Exhibit 10.4
|
|
10.49
|
Nordstrom Directors Deferred Compensation Plan (2002 Restatement)
|
|
Incorporated by reference from the Registrant's Annual Report on Form 10-K for the year ended January 31, 2004, Exhibit 10.55
|
|
10.50
|
Nordstrom Directors Deferred Compensation Plan (2007)
|
|
Incorporated by reference from the Registrant's Form 8-K filed on November 19, 2007, Exhibit 10.41
|
|
10.51
|
Amendment 2009-1 to the Nordstrom Directors Deferred Compensation Plan
|
|
Incorporated by reference from the Registrant's Form S-8 filed on September 9, 2009, Exhibit 10.5
|
|
10.52
|
2009 Form of Independent Director Indemnification Agreement
|
|
Incorporated by reference from the Registrant's Form 8-K filed on March 3, 2009, Exhibit 10.1
|
|
10.53
|
2010 Form of Independent Director Indemnification Agreement
|
|
Incorporated by reference from the Registrant's Annual Report on Form 10-K for the year ended January 29, 2011, Exhibit 10.78
|
|
10.54
|
The 2002 Nonemployee Director Stock Incentive Plan
|
|
Incorporated by reference from the Registrant's Quarterly Report on Form 10-Q for the quarter ended July 31, 2002, Exhibit 10.1
|
|
10.55
|
Nordstrom, Inc. 2002 Nonemployee Director Stock Incentive Plan (2007 Amendment)
|
|
Incorporated by reference from the Registrant's Form 8-K filed on November 19, 2007, Exhibit 10.39
|
|
10.56
|
Form of Restricted Stock Award under the 2002 Nonemployee Director Stock Incentive Plan
|
|
Incorporated by reference from the Registrant's Quarterly Report on Form 10-Q for the quarter ended November 3, 2007, Exhibit 10.1
|
|
10.57
|
Form of 2012 Restricted Stock Unit Agreement
|
|
Incorporated by reference from the Registrant's Form 8-K filed on November 18, 2011, Exhibit 10.3
|
|
10.58
|
Form of 2013 Restricted Stock Unit Award Agreement
|
Incorporated by reference from the Registrant's Form 8-K filed on November 14, 2012, Exhibit 10.3
|
|
|
10.59
|
Promissory Note dated April 18, 2002 between 1700 Seventh, L.P. and New York Life Insurance Company
|
|
Incorporated by reference from the Registrant's Quarterly Report on Form 10-Q for the quarter ended April 30, 2002, Exhibit 10.2
|
|
10.60
|
Promissory Note dated April 18, 2002 between 1700 Seventh, L.P. and Life Investors Insurance Company of America
|
|
Incorporated by reference from the Registrant's Quarterly Report on Form 10-Q for the quarter ended April 30, 2002, Exhibit 10.3
|
|
10.61
|
Guaranty Agreement dated April 18, 2002 between Registrant, New York Life Insurance Company and Life Investors Insurance Company of America
|
|
Incorporated by reference from the Registrant's Quarterly Report on Form 10-Q for the quarter ended April 30, 2002, Exhibit 10.4
|
|
10.62
|
Commitment of Nordstrom, Inc. to Nordstrom fsb dated June 17, 2004
|
|
Incorporated by reference from the Registrant's Quarterly Report on Form 10-Q for the quarter ended July 31, 2004, Exhibit 10.4
|
* This exhibit is a management contract, compensatory plan or arrangement
Nordstrom, Inc. and subsidiaries
71
|
|
Exhibit
|
|
Method of Filing
|
|
10.63
|
Nordstrom fsb Segregated Earmarked Deposit Agreement and Security Agreement by and between Nordstrom fsb and Nordstrom, Inc. dated July 1, 2004
|
|
Incorporated by reference from the Registrant's Quarterly Report on Form 10-Q for the quarter ended July 31, 2004, Exhibit 10.5
|
|
10.64
|
Merchant Agreement dated August 30, 1991 between Registrant and Nordstrom National Credit Bank
|
|
Incorporated by reference from the Registrant's Quarterly Report on Form 10-Q for the quarter ended July 31, 1991, Exhibit 10.1
|
|
10.65
|
First Amendment to Merchant Agreement and Operating Procedures dated August 30, 1991 between Registrant and Nordstrom National Credit Bank, dated March 1, 2000
|
|
Incorporated by reference from the Registrant's Annual Report on Form 10-K for the year ended February 2, 2008, Exhibit 10.32
|
|
10.66
|
Second Amendment to Merchant Agreement and Operating Procedures dated August 30, 1991 between Registrant and Nordstrom National Credit Bank, dated March 2, 2000
|
|
Incorporated by reference from the Registrant's Annual Report on Form 10-K for the year ended February 2, 2008, Exhibit 10.33
|
|
10.67
|
Third Amendment to Merchant Agreement and Operating Procedures dated August 30, 1991 between Registrant and Nordstrom National Credit Bank, dated October 1, 2001
|
|
Incorporated by reference from the Registrant's Annual Report on Form 10-K for the year ended February 2, 2008, Exhibit 10.34
|
|
10.68
|
Fourth Amendment to Merchant Agreement and Operating Procedures dated August 30, 1991 between Registrant and Nordstrom National Credit Bank, dated November 1, 2002
|
|
Incorporated by reference from the Registrant's Annual Report on Form 10-K for the year ended February 2, 2008, Exhibit 10.35
|
|
10.69
|
Fifth Amendment to Merchant Agreement and Operating Procedures dated August 30, 1991 between Registrant and Nordstrom National Credit Bank, dated November 1, 2005
|
|
Incorporated by reference from the Registrant's Annual Report on Form 10-K for the year ended February 2, 2008, Exhibit 10.36
|
|
10.70
|
Sixth Amendment to Merchant Agreement and Operating Procedures dated August 30, 1991 between Registrant and Nordstrom National Credit Bank, dated May 1, 2007
|
|
Incorporated by reference from the Registrant's Annual Report on Form 10-K for the year ended February 2, 2008, Exhibit 10.37
|
|
10.71
|
Revolving Credit Facility Agreement dated August 14, 2009, between Registrant and each of the initial lenders named therein as Lenders; Bank of America, N.A., as Agent; Wells Fargo Bank, N.A., as Syndication Agent; The Royal Bank of Scotland PLC and U.S. Bank National Association, as Co-Documentation Agents; and Banc of America Securities LLC and Wells Fargo Securities, LLC, as Joint Lead Arrangers and Co-Book Managers
|
|
Incorporated by reference from the Registrant's Form 10-Q for the quarter ended July 31, 2010, Exhibit 10.1
|
|
10.72
|
Revolving Credit Facility Agreement dated June 23, 2011, between Registrant and each of the initial lenders named therein as Lenders; Bank of America Merrill Lynch, as Administrative Agent; Wells Fargo Bank, N.A., as Syndication Agent; and RBS Citizens, N.A. and U.S. Bank, National Association, as Documentation Agents
|
|
Incorporated by reference from the Registrant's Form 8-K filed on June 23, 2011, Exhibit 10.1
|
|
10.73
|
Officers' Certificate pursuant to Section 1.2 of the Indenture, dated as of December 3, 2007, between Nordstrom, Inc. and Wells Fargo Bank, N.A., in connection with the issuance of $400M 6.75% Notes due 2014
|
|
Incorporated by reference from the Registrant's Form 10-Q for the quarter ended July 31, 2010, Exhibit 10.3
|
|
10.74
|
Officers' Certificate pursuant to Section 5(h) of the Underwriting Agreement, dated May 20, 2009, among Nordstrom, Inc. and several underwriters, in connection with the issuance and sale of $400M 6.75% Notes due 2014
|
|
Incorporated by reference from the Registrant's Form 10-Q for the quarter ended July 31, 2010, Exhibit 10.2
|
|
10.75
|
Performance Undertaking dated December 4, 2001 between Registrant and Bank One, N.A.
|
|
Incorporated by reference from the Registrant's Annual Report on Form 10-K for the year ended January 31, 2002, Exhibit 10.38
|
|
10.76
|
Servicing Agreement, dated as of May 1, 2007, by and between Nordstrom fsb, and Nordstrom Credit, Inc.
|
|
Incorporated by reference from the Registrant's Form 8-K filed on May 8, 2007, Exhibit 99.2
|
72
|
|
Exhibit
|
|
Method of Filing
|
|
10.77
|
Amended and Restated Transfer and Servicing Agreement, dated as of May 1, 2007, by and between Nordstrom Credit Card Receivables II LLC, as transferor, Nordstrom fsb, as servicer, Wells Fargo Bank, National Association, as indenture trustee, and Nordstrom Credit Card Master Note Trust II, as issuer
|
|
Incorporated by reference from the Registrant's Form 8-K filed on May 8, 2007, Exhibit 99.4
|
|
10.78
|
Second Amended and Restated Trust Agreement, dated as of May 1, 2007, by and between Nordstrom Credit Card Receivables II LLC, as transferor, and Wilmington Trust Company, as owner trustee
|
|
Incorporated by reference from the Registrant's Form 8-K filed on May 8, 2007, Exhibit 99.5
|
|
10.79
|
Amended and Restated Administration Agreement, dated as of May 1, 2007, by and between Nordstrom Credit Card Master Note Trust II, as issuer, and Nordstrom fsb, as administrator
|
|
Incorporated by reference from the Registrant's Form 8-K filed on May 8, 2007, Exhibit 99.6
|
|
10.80
|
Amended and Restated Receivables Purchase Agreement, dated as of May 1, 2007, by and between Nordstrom Credit, Inc., as seller and Nordstrom Credit Card Receivables II LLC, as purchaser
|
|
Incorporated by reference from the Registrant's Form 8-K filed on May 8, 2007, Exhibit 99.3
|
|
10.81
|
Participation Agreement, dated as of May 1, 2007, by and between Nordstrom fsb, as seller and Nordstrom Credit, Inc., as purchaser
|
|
Incorporated by reference from the Registrant's Form 8-K filed on May 8, 2007, Exhibit 99.1
|
|
10.82
|
Confirmation of transaction between The Royal Bank of Scotland plc and Nordstrom Inc., dated as of December 22, 2009
|
|
Incorporated by reference from the Registrant's Form 8-K filed on December 23, 2009, Exhibit 10.1
|
|
10.83
|
Confirmation of transaction between Wachovia Bank N.A. and Nordstrom Inc., dated as of December 22, 2009
|
|
Incorporated by reference from the Registrant's Form 8-K filed on December 23, 2009, Exhibit 10.2
|
|
10.84
|
Press release dated August 19, 2010 announcing that its Board of Directors authorized a $500 million share repurchase program
|
|
Incorporated by reference from the Registrant's Form 8-K filed on August 19, 2010, Exhibit 99.1
|
|
10.85
|
Press release dated May 12, 2011 announcing that its Board of Directors authorized a $750 million share repurchase program
|
|
Incorporated by reference from the Registrant's Form 8-K filed on May 12, 2011, Exhibit 99.3
|
|
10.86
|
Press release dated February 17, 2012 announcing that its Board of Directors authorized an $800 million share repurchase program
|
Incorporated by reference from the Registrant's Form 8-K filed on February 21, 2012, Exhibit 99.1
|
|
|
10.87
|
Press release dated February 27, 2013 announcing that its Board of Directors authorized an $800 million share repurchase program
|
Incorporated by reference from the Registrant's Form 8-K filed on February 28, 2013, Exhibit 99.1
|
|
Nordstrom, Inc. and subsidiaries
73
|
|
Exhibit
|
|
Method of Filing
|
|
21.1
|
Significant subsidiaries of the Registrant
|
|
Filed herewith electronically
|
|
23.1
|
Consent of Independent Registered Public Accounting Firm
|
|
Filed as page 67 of this report
|
|
31.1
|
Certification of President required by Section 302(a) of the Sarbanes-Oxley Act of 2002
|
|
Filed herewith electronically
|
|
31.2
|
Certification of Chief Financial Officer required by Section
302(a) of the Sarbanes-Oxley Act of 2002
|
|
Filed herewith electronically
|
|
32.1
|
Certification of President and Chief Financial Officer pursuant to 18 U.S.C. 1350, as adopted pursuant to Section 906 of the Sarbanes-Oxley Act of 2002
|
|
Furnished herewith electronically
|
|
101.INS
|
XBRL Instance Document
|
|
Filed herewith electronically
|
|
101.SCH
|
XBRL Taxonomy Extension Schema Document
|
|
Filed herewith electronically
|
|
101.CAL
|
XBRL Taxonomy Extension Calculation Linkbase Document
|
|
Filed herewith electronically
|
|
101.LAB
|
XBRL Taxonomy Extension Labels Linkbase Document
|
|
Filed herewith electronically
|
|
101.PRE
|
XBRL Taxonomy Extension Presentation Linkbase Document
|
|
Filed herewith electronically
|
|
101.DEF
|
XBRL Taxonomy Extension Definition Linkbase Document
|
|
Filed herewith electronically
|
74
TABLE OF CONTENTS
Part IItem 1. BusinessItem 1A. Risk FactorsItem 1B. Unresolved Staff CommentsItem 2. PropertiesItem 3. Legal ProceedingsItem 4. Mine Safety DisclosuresPart IIItem 5. Market For Registrant's Common Equity, Related Shareholder Matters and Issuer Purchases Of Equity SecuritiesItem 6. Selected Financial DataItem 7. Management's Discussion and Analysis Of Financial Condition and Results Of OperationsItem 7A. Quantitative and Qualitative Disclosures About Market RiskItem 8. Financial Statements and Supplementary DataNote 1: Nature Of Operations and Summary Of Significant Accounting PoliciesNote 2: HautelookNote 3: Accounts ReceivableNote 4: Land, Buildings and EquipmentNote 5: Self-insuranceNote 6: 401(k) and Profit SharingNote 7: Postretirement BenefitsNote 8: Debt and Credit FacilitiesNote 9: Fair Value MeasurementsNote 10: LeasesNote 11: Commitments and Contingent LiabilitiesNote 12: Shareholders' EquityNote 13: Stock-based CompensationNote 14: Income TaxesNote 15: Earnings Per ShareNote 16: Segment ReportingNote 17: Selected Quarterly Data (unaudited)Item 9. Changes in and Disagreements with Accountants on Accounting and Financial DisclosureItem 9A. Controls and ProceduresItem 9B. Other InformationPart IIIItem 10. Directors, Executive Officers and Corporate GovernanceItem 11. Executive CompensationItem 12. Security Ownership Of Certain Beneficial Owners and Management and Related Shareholder MattersItem 13. Certain Relationships and Related Transactions, and Director IndependenceItem 14. Principal Accounting Fees and ServicesPart IVItem 15. Exhibits and Financial Statement Schedules