JOINT CORP
10-Ks and 10-Qs
|
|
|
|
|
|
|
|
|
|
|
|
|
|
|
|
|
|
|
|
|
|
|
|
|
|
|
|
|
|
|
|
|
|
|
|
|
|
UNITED STATES
SECURITIES AND EXCHANGE COMMISSION
Washington, D.C. 20549
FORM 10-K
☒
ANNUAL REPORT PURSUANT TO SECTION 13 OR 15(d) OF THE SECURITIES EXCHANGE ACT OF 1934
For the fiscal year ended December 31, 2014
OR
☐
TRANSITION REPORT PURSUANT TO SECTION 13 OR 15(d) OF THE SECURITIES
EXCHANGE ACT OF 1934
For the transition period from _______ to ________
Commission File Number: 001-36724
The Joint Corp.
(Exact name of registrant as specified in its charter)
|
Delaware
|
90-0544160
|
|
(State or Other Jurisdiction of
|
(I.R.S. Employer
|
|
Incorporation)
|
Identification No.)
|
|
16767 N. Perimeter Drive, Suite 240, Scottsdale
Arizona
|
85260
|
|
(Address of Principal Executive Offices)
|
(Zip Code)
|
(480) 245-5960
(Registrant’s Telephone Number, Including Area Code)
Securities registered pursuant to Section 12(b) of the Act:
|
Title Of Each Class
|
Name Of Each Exchange On Which Registered
|
|
Common Stock, $0.001 Par Value Per Share
|
The NASDAQ Capital Market LLC
|
Securities Registered Pursuant to Section 12(g) of the Act:
None
Indicate by check mark if the registrant is a well-known seasoned issuer, as defined in Rule 405 of the Securities Act. Yes
☐
No
☑
Indicate by check mark if the registrant is not required to file reports pursuant to Section 13 or Section 15(d) of the Act. Yes
☐
No
☑
Indicate by check mark whether the registrant: (1) has filed all reports required to be filed by Section 13 or 15(d) of the Securities Exchange Act of 1934 during the preceding 12 months (or for such shorter period that the registrant was required to file such reports), and (2) has been subject to such filing requirements for the past 90 days. Yes
☑
No
☐
Indicate by check mark whether the registrant has submitted electronically and posted on its corporate Website, if any, every Interactive Data File required to be submitted and posted pursuant to Rule 405 of Regulation S-T during the preceding 12 months (or for such shorter period that the registrant was required to submit and post such files). Yes
☑
No
☐
Indicate by check mark if disclosure of delinquent filers pursuant to Item 405 of Regulation S-K is not contained herein, and will not be contained, to the best of Registrant’s knowledge, in definitive proxy or information statements incorporated by reference in Part III of this Form 10-K or any amendment of this Form 10-K.
☐
Indicate by check mark whether the registrant is a large accelerated filer, an accelerated filer, a non-accelerated filer, or a smaller reporting company. See the definitions of “large accelerated filer”, “accelerated filer” and “smaller reporting company” in Rule 12b-2 of the Exchange Act. (Check one):
|
Large accelerated filer
☐
|
Accelerated filer
☐
|
Non-accelerated filer
☐
|
Smaller reporting company
☑
|
Indicate by check mark whether the registrant is a shell company (as defined in Rule 12b-2 of the Act). Yes
☐
No
☑
As of June 30,
2014, the last business day of the registrant’s most recently completed second fiscal quarter, there was no established public market for the registrant’s common stock. The registrant’s common stock began trading on The NASDAQ Capital Market on November 11, 2014.
There were 9,621,581 shares of the registrant’s common stock issued and outstanding as of March 11, 2015.
Documents Incorporated by Reference
Portions of the registrant's Proxy Statement relating to its 2015 Annual Meeting of Stockholders, to be filed with the Securities and Exchange Commission (“SEC”) pursuant to Regulation 14A within 120 days after the registrant’s fiscal year ended December 31, 2014, are incorporated by reference in Part III of this Form 10-K.
TABLE OF CONTENTS
|
Page
Numbers
|
||
|
PART I
|
||
|
PART II
|
||
|
PART III
|
||
|
PART IV
|
||
Overview
As used in this Form 10-K,:
|
|
·
|
“we,” “us,” and “our” refer to The Joint Corp.
|
|
|
·
|
a “clinic” refers to a chiropractic clinic operating under our “Joint” brand, which may be (i) owned by a franchisee, (ii) owned by a professional corporation or limited liability company and managed by a franchisee; (iii) owned directly by us; or (iv) owned by a professional corporation or limited liability company and managed by us.
|
|
|
·
|
when we identify an “operator” of a clinic, a party that is “operating” a clinic, or a party by whom a clinic is “operated,” we are referring to the party that operates all aspects of the clinic in certain jurisdictions, and to the party that manages all aspects of the clinic other than the practice of chiropractic in certain other jurisdictions.
|
We are a rapidly growing franchisor and operator of chiropractic clinics that uses a private pay, non-insurance, cash-based model. We seek to be the leading provider of chiropractic care in the markets we serve and to become the most recognized brand in our industry through the rapid and focused expansion of chiropractic clinics in key markets throughout North America and abroad. Our mission is to improve the quality of life through routine chiropractic care. We strive to accomplish this by making quality care readily available and affordable. We have created a growing network of modern, consumer-friendly chiropractic clinics operated by franchisees and by us that employ only licensed chiropractors. We have priced our services below most competitors’ pricing for similar services and below most insurance co-payment levels (i.e., below the patient co-payment required for an insurance-covered service).
Since acquiring the predecessor to our company in March, 2010, we have grown our enterprise from eight to 246 franchised clinics in operation as of December 31, 2014, with an additional 268 franchise licenses granted across our network. In the year ended December 31, 2014, our franchised clinics registered 2,168,124 patient visits and generated revenues of $46,231,887. We collect a royalty of 7.0% of revenues from directly franchised clinics and 4.0% of revenues from those clinics franchised through regional developers. We also collect a national marketing fee of 1.0% of gross revenues of all franchised clinics. We receive a franchise sales fee of $29,000 for franchises we sell directly and a franchise fee of $14,500 for franchises sold through our network of regional developers.
As of December 31, 2014, all 246 Joint clinics were operated by franchisees. Of these, 53 franchises were awarded directly by us, and 193 franchises were awarded pursuant to our regional developer program. Our future growth strategy will increasingly focus on operating clinics owned by us, while continuing to strategically grow through the sale of additional franchises. We began to implement our growth strategy on December 31, 2014, when we reacquired six franchises from a franchisee.
We completed our initial public offering of 3,000,000 shares of common stock at an initial price to the public of $6.50 per share on November 14, 2014, whereupon we received aggregate net proceeds of approximately $17,065,000 after deducting underwriting discounts, commissions and other offering expenses. Our underwriters exercised their option to purchase 450,000 additional shares of common stock to cover over-allotments on November 18, 2014, pursuant to which we received aggregate net proceeds of approximately $2,710,000 after deducting underwriting discounts, commissions and expenses. Also, in conjunction with the IPO, we issued warrants to the underwriters for the purchase of 90,000 shares of common stock, which can be exercised between November 10, 2015 and November 10, 2018 at an exercise price of $8.125 per share.
For the years ended December 31, 2014 and 2013, we had net income (loss) after taxes of (3,031,220) and $155,635, respectively.
1
Over the past three years, our franchisees have achieved sustained increases in average monthly revenues and patient visits per clinic, which we believe demonstrates our ability to continue to increase revenues and to grow our brand equity. For the 14 clinics that opened in 2011, we increased sales throughout our system from $650,170 in 2011 to $2,823,895 in 2012, $4,223,254 in 2013 and $5,785,090 in 2014, and increased patient visits from 34,056 in 2011 to 142,045 in 2012, 197,452 in 2013 and 255,933 in 2014.
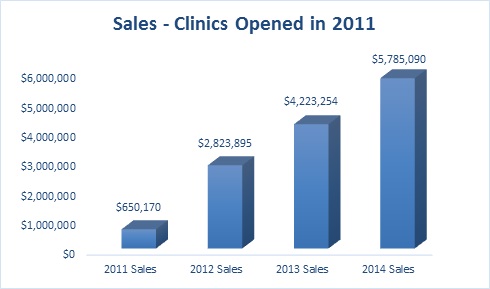
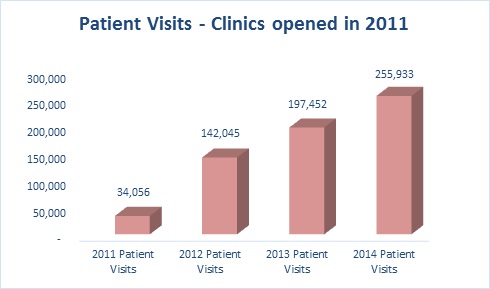
Note:
Patient visits include repeat visits and do not indicate total number of patients.
2
For the 53 clinics that opened in 2012, we increased sales from $2,140,814 in 2012 to $9,591,917 in 2013 and $14,424,269 in 2014, and increased patient visits from 116,752 in 2012 to 468,467 in 2013 and 644,606 in 2014.
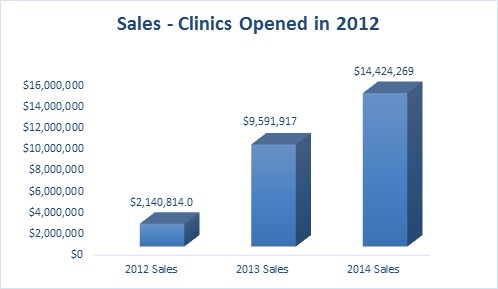
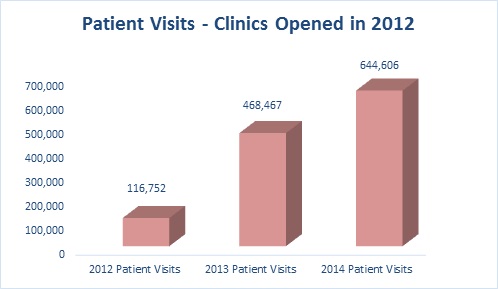
Note:
Patient visits include repeat visits and do not indicate total number of patients.
3
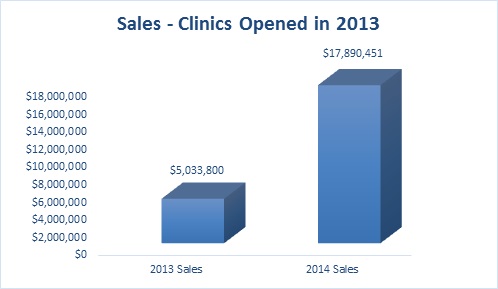
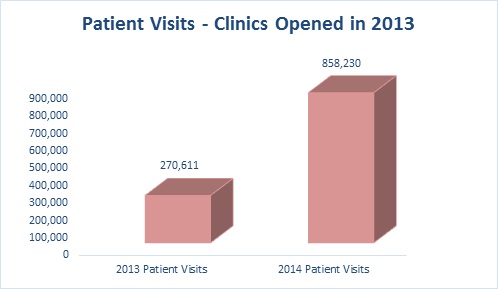
For the 98 clinics that opened in 2013 we increased sales from $5,033,800 in 2013 to $17,890,451 in 2014, and increased patient visits from 270,611 in 2013 to 858,230 in 2014.
Note:
Patient visits include repeat visits and do not indicate total number of patients.
As part of our branding strategy, we deliver convenient, appointment-free chiropractic adjustments in an inviting, consumer-oriented environment at prices that are between 56% and 70% lower than the average cost, according to
First Research,
for comparable procedures offered by traditional chiropractors. In support of our mission to offer affordable and convenient care and value for our patients, our clinics offer a variety of customizable membership and wellness treatment plans which offer additional value pricing even as compared with our single-visit pricing schedules. These flexible plans are designed to attract patients and encourage repeat visits and routine usage.
As of December 31, 2014, we had 246 franchised clinics in operation in 26 states.
Our clinics are located principally in and around retail shopping centers and have been selected to be visible, accessible and convenient. We offer a welcoming, consumer-friendly experience that attempts to redefine the chiropractic doctor/patient relationship. Many of our clinics are open seven days per week, longer hours than most of our competitors, and our patients do not need appointments. We operate a private pay, “cash” business, and we do not accept insurance reimbursement or provide Medicare covered services. We believe that our commitment to affordable pricing, convenient access and ready service delivery model will not only appeal to and attract existing consumers of chiropractic services but will also appeal to the growing market of consumers who seek alternative or non-invasive wellness care.
4
Services
Our clinics offer a variety of membership and wellness packages. As an added advantage, patients who purchase memberships may receive adjustments at any Joint clinic throughout our system at no additional cost.
Our clinics measure, on average, approximately 1,000 –1,200 square feet and contain a reception area and treatment space generally equipped with three treatment tables. A typical clinic is staffed by one receptionist/wellness coordinator and one or two chiropractic doctors.
Our patients arrive at our clinics without appointments at times convenient to their schedules. Once a patient has joined our system and is returning for treatment, they simply swipe their membership card at a card reader at the reception desk to announce their arrival. Typically, within five to seven minutes (the average throughout our system), the patient is escorted to our open adjustment area, where they are required to remove only their outerwear to receive their adjustment. The adjustment process, administered by a licensed chiropractor, takes approximately 12 – 15 minutes on average for a new patient and 7 minutes on average for a returning patient. Each patient’s records are digitally updated for ready retrieval in our proprietary data storage system by our chiropractors in compliance with all applicable medical records security and privacy regulations.
Our consumer-focused service model targets the non-acute treatment market, which we believe to be the largest segment of the $11 billion chiropractic services market. As our model does not focus on the treatment of severe, acute injury, we do not provide expensive and invasive diagnostic tools such as MRIs and X-rays but instead refer those who present with acute symptoms to alternate healthcare providers, including traditional chiropractors.
Franchisees
As of December 31, 2014, all of our clinics were operated by franchisees. We employ qualification criteria in the selection of franchisees including background checks and validating financial resources, work history and experience. We require franchisees to have a minimum net worth of $250,000. In addition, we make a determination as to the compatibility of franchisee candidates with our approach to chiropractic patient care, based on personal interviews. Once qualified, we require proposed franchisees to attend a three-day training program, and we provide additional field support in advance of a franchised clinic’s opening. We further provide ongoing training though our web portal, quarterly franchisee reviews and scheduled field visits by our operations support personnel. We work hard to ensure that each of our franchise locations meets the same quality and patient service standards in order to preserve the consistency and reliability of our brand and earn the trust of our patients.
We are committed to providing the tools that our franchisees need to succeed before, during and after a clinic opening, including guidance with site selection and development, training, operations and marketing support. As of December 31, 2014, a majority of our franchisees owned one clinic, while approximately 49% of franchisees owned multiple clinics across 26 states. We believe this diversified franchisee base demonstrates not only the appeal and the viability of our concept across numerous types of owners and operators, but also limits concentration risk by providing a distributed base of owners with capacity to grow with our brand. We identify potential franchisees through a variety of methods, including our website, digital search, advertising in chiropractic journals, the use of franchise brokers, referrals from existing franchisees as well as interest from our growing patient base.
While a number of our franchisees are chiropractors, the majority of our franchisees are independent business people. In states that regulate the corporate practice of chiropractic services, our non-chiropractor owned franchisees enter into a management agreement with a professional service organization that is typically a chiropractor-owned professional corporation. Under such management agreements, all aspects of professional chiropractic practice are under the exclusive control of the licensed chiropractor, while all non-chiropractic aspects of the operation of the clinic are managed by the franchisee as manager. Where such arrangements are in place, the chiropractors are employed by the chiropractor-owned and administered, professional corporation and not by the franchisee.
5
Franchise Disclosure.
The United States Federal Trade Commission and many states require a franchisor to provide a franchise disclosure document or “FDD” to all prospective franchisees. In addition, many states require a franchisor to register with a state franchise administrator before offering or selling a franchise in that state. We believe we have complied with all federal regulations regarding disclosure and with all state franchise registration requirements in the states in which we have sold, offered or are offering to sell franchises. Our FDD contains detailed information about our company’s organization and history and explains to prospective franchisees what their rights and responsibilities would be if they became our franchisee. The FDD also includes our financial statements, a copy of our standard franchise agreement and various other documents and agreements that are relevant to a prospective franchisee’s decision to purchase a franchise.
Regional Developers.
We have entered into 26 regional developer licenses with 16 regional developers in which we granted to regional developers the right to solicit potential franchisees in a defined territory. The fee for a regional developer license varies from territory to territory and generally depends on the number of franchises anticipated to be awarded within that territory. We reserve the right to approve franchisees and clinic sites identified by our regional developers. We receive 50.0% of our standard franchise fee for franchises awarded under regional developer licenses, and we remit a 3.0% royalty to our regional developers on the gross revenues of franchises opened under regional developer licenses.
Regional developers are typically seasoned entrepreneurs with significant investment capital. Due in part to their prior business experience, regional developers typically have developed networks of potential franchise buyers.
Our regional developer licenses grant an exclusive territory to our regional developers, require them to sell a minimum number of franchises within their defined territory and to cause the sold franchises to be opened within a specified time period. Regional developers are obligated also to provide training and support to franchisees. Regional developer licenses typically have a ten year term and are renewable upon payment of a renewal fee. We may terminate regional developer licenses if the regional developer fails to meet its material obligations under the license.
In some, but not all, of our regional developer licenses, we have negotiated repurchase rights wherein we have the option, commencing three years from the effective date of the license, to repurchase the regional developer license pursuant to a negotiated formula.
Franchise Agreements.
For each franchised clinic, we enter into a franchise agreement stipulating a standard set of terms and conditions. The initial term of a franchise agreement generally is 10 years, with one 10-year renewal option. The standard initial franchise fee for our clinics is $29,000. This initial fee is paid in full at the time the franchise agreement is signed. A franchise fee allows an owner to open a single clinic at a specific location. Our franchise agreements do not, however, typically create an exclusive territory for our franchisees outside of their specific location. Franchisees that renew their franchises after the initial term must pay us a renewal fee equal to 25.0% of our then-current initial franchise fee.
Under our standard franchise agreements, franchisees are also required to pay an ongoing royalty fee of 7.0% of gross revenues in order to use our registered trademarks and to benefit from corporate franchise support. Our franchisees currently contribute 1.0% of gross revenues to a regional and national advertising fund. We may, under certain circumstances, raise this fee to 2.0% of gross revenues.
Our franchise agreements set forth certain material duties and responsibilities of franchisees, including, but not limited to, the timetable for pre-opening actions such as permitting, the timetable for opening, initial and follow up training responsibilities, advertising standards and spends, restrictions on the use of our trademarks and services marks both during and after the term of the franchise, confidentiality and non-competition provisions, restrictions on transfer of the franchise, and dispute resolution provisions. Our franchise agreements also set forth our material duties and responsibilities, including but not limited to, our right to approve the site selected for each franchise, our right to set and make changes to the operating standards applicable to franchisees, such as plans and specifications for the franchised clinic, choice of equipment, signs, furnishings, software and computer systems, advertising materials, types of products and services offered, operating procedures (with the exception of the practice of chiropractic medicine) conditions and appearance of the franchised clinic, approved vendors and suppliers and insurance requirements. We also retain the right to approve all advertising by a franchisee. Our right to define and/or enforce certain of these standards may be limited by state laws which restrict our ability to control the activities of a licensed chiropractor.
6
If a franchisee fails to comply with the material provisions of our franchise agreement or our operating policies, or if a franchisee violates other specific provisions of our franchise agreement, including, but not limited to, operating in an unsafe manner, failure to comply with applicable laws, failure to submit financial reports, attempting to transfer the franchise, conviction of a crime, or materially degrading our brand or goodwill, we have the right, after specified notice and in certain cases, specified cure periods, to terminate the franchise and require the franchisee to cease using our brand and our operating systems. Upon termination of a franchise, we are entitled to receive, in addition to any damages to which we are entitled, a termination fee equal to one-half of our then-current franchise fee. We also have the right, but not the obligation, to purchase the assets of the franchise at fair market value. Upon termination of a franchise, the former franchisee will be bound by the confidentiality and non-competition provisions of the franchise agreement. We also have the right to terminate our franchise agreements for a number of additional reasons, including insolvency or bankruptcy, failure to operate franchised clinics according to our standards, understatement of sales, failure to properly insure, failure to pay fees, or material misrepresentations on an application for a franchise.
From time to time, we may enter into amendments to our standard franchise agreements as part of various limited incentive programs targeted to improve clinic growth, accelerate development in certain markets or assist underperforming clinics. These amendments may include lower royalty fees for a limited period.
If a franchisee is not a licensed chiropractor, we provide the franchisee with a standard form of management agreement that, depending on the laws of the state in which the franchisee is located, the franchisee may be required to enter into with a licensed chiropractic professional corporation or professional limited liability company. In such circumstances, the franchisee will provide management and administrative services in support of the professional corporation or limited liability company that will operate the clinic. Under this arrangement, the franchisee is prohibited from providing, supervising, directing or controlling the manner in which the licensed chiropractors who are employed by the professional corporation or limited liability company provide chiropractic services to their patients.
Franchisee Support
. From the time the initial franchise agreement is executed, we offer assistance and training in order to ensure that our franchisees begin their Joint franchise ownership in a manner that we believe will foster success.
Site Selection
. While franchisees are ultimately responsible for finding their own sites, we offer various levels of guidance and support during this process and specifically reserve the right to approve all sites. Standard specifications involve such factors as: (i) general location/neighborhood; (ii) traffic patterns; (iii) parking; (iv) size; (v) proximity to competing businesses (vi) co-tenants, (vii) traffic counts and patterns; and (vii) other qualitative demographic criteria. Once a franchisee completes a site submission package, which typically occurs at least 150 days prior to the execution of a lease, our real estate personnel will assess the prospective site and, if deemed appropriate, provide written approval to start negotiations for a lease of the site. Throughout this negotiation process, members of our real estate team support the franchisee.
Design and Construction
. Once a site is approved, our construction management personnel provide the franchisee with general construction and timeline guidance and a prototypical set of design plans to ensure that the franchised location fits our standards and specifications. Once a lease is signed, we may also help our franchisees in: (i) identifying and selecting qualified contractors; (ii) submitting plans for necessary permits; (iii) reviewing bids; and (iv) if engaged, helping to negotiate prices for design and construction. During the actual construction phase, our construction management personnel also will help the franchisee in ensuring that final punch list instructions are completed.
Training
. We have a mandatory training program for new franchisees and their managers, crafted to provide the technical and managerial skills necessary to prepare them for their duties. Our training program consists of 12 hours of classroom training and 14 hours of on-the-job training, covering areas including (i) our operating manual; (ii) computer software; (iii) accounting; (iv) vendor relations; (v) construction specifications; (vi) staffing; (vii) new patients; (viii) an overview of adjusting techniques for non-chiropractors; (ix) communications; (x) patient education; and (xi) marketing and advertising. We equip and support our franchisees with the necessary tools to represent the brand and empower each franchisee to run a successful business. In addition to the initial franchisee training, we offer on-going support materials on-line through our website and help desk, and conduct periodic educational webinars.
System Standards and Operations Support
. We have established stringent standards for franchise operations to protect and benefit the Joint brand and our franchisees. These standards are clearly and thoroughly detailed for franchisees through our operations manual, which is given to franchisees in training and amended periodically. Topics covered in our operations manual include, among other things: (i) pre-opening procedures; (ii) construction; (iii) operating guidelines; (iv) detailed daily operating procedures; (v) software; and (vi) marketing guidance. We periodically provide refresher training programs, seminars and regional meetings which we require our franchisees and/or their manager to attend and complete.
7
Our Industry
Chiropractic care is widely accepted among individuals with a variety of medical conditions, particularly back pain. Between approximately 6.0% and 9.0% of the United States population regularly uses chiropractic. According to the American Chiropractic Association, 80.0% of Americans experience back pain at least once in their lifetime. According to Global Industry Analysts, chiropractic represents one of the most popular and cost effective alternative treatments for musculoskeletal disorders and is being used by more than 50.0% of American patients suffering from persistent back pain. The National Center for Complementary & Alternative Medicine of the National Institutes of Health has stated that spinal manipulation appears to benefit some people with low-back pain and also may be helpful for headaches, neck pain, upper- and lower-extremity joint conditions and whiplash-associated disorders. The Mayo Clinic has recognized chiropractic as safe when performed by trained and licensed chiropractors, and the Cleveland Clinic has stated that chiropractors are established members of the mainstream medical team.
The chiropractic industry in the United States is large, growing and highly fragmented. According to a report issued by
First Research
in March 2014, expenditures for chiropractic services in the U.S. were $11.0 billion in 2013 and are expected to grow at approximately 3.0% annually between 2014 and 2018. In addition, according to
Chiropractic Economics
, in 2013, approximately 35.0% of total chiropractic expenditures were from out-of-pocket, or cash, payments by patients. The United States Bureau of Labor Statistics expects employment in chiropractic to grow faster than the average for all occupations. Some of the factors the Bureau of Labor Statistics identified as driving this growth are healthcare cost pressures and an aging population requiring more health care and technological advances, all of which are expected to increasingly shift services from inpatient facilities and hospitals to outpatient settings. We believe that the demand for chiropractic services will continue to grow as a result of several additional drivers, such as the increased awareness of the benefits of regular maintenance therapy coupled with an increasing awareness of the availability of our pricing at significant discount relative to the cost of traditional chiropractic adjustments and, in most cases, below the level of insurance co-payment amounts.
Today, most chiropractic services are provided by sole practitioners, generally in medical-office settings. The chiropractic industry differs from the broader healthcare services industry in that it is more heavily consumer-driven, market-responsive and price sensitive, in large measure, a result of many treatment options falling outside the bounds of traditional insurance reimbursable services and fee schedules. According to
First Research,
expenditures for chiropractic services in the United States in 2013, represented less than 1.0% of all healthcare expenditures,and the top 50 companies delivering chiropractic services in the United States generated less than 10.0% of all industry revenue. In addition, according to
Chiropractic Economics
, in 2013, 40.0% of all chiropractic expenditures were paid by insurance, with 17.1% of chiropractic costs financed by government programs, including Medicare and Medicaid. We believe these characteristics are evidence of an underserved market with potential consumer demand that is favorable for an efficient, low-cost, consumer-oriented provider.
Most chiropractic practices are set up to accept and to process insurance-based reimbursement. While chiropractors typically accept cash payment in addition to insurance, Medicare and Medicaid, they continue to incur overhead expenses associated with maintaining the capability to process third-party reimbursement. We believe that most chiropractors who operate utilizing this third-party reimbursement model would find it economically difficult to discount the prices they charge for their services to levels comparable with our pricing.
Accordingly, we believe these and certain other trends favor our business model. Among these are:
|
•
|
individuals are increasingly practicing active lifestyles, people are living longer, and require more medical, maintenance and preventative support;
|
|
•
|
individuals are displaying an increasing openness to alternative, non-pharmacological types of care;
|
|
•
|
utilization of more conveniently situated, local sited urgent-care or “mini-care” alternatives to primary care is increasing; and
|
|
•
|
popularity of health clubs, massage and other non-drug, non-invasive wellness maintenance providers is growing.
|
8
Our Competitive Strengths
We believe the following competitive strengths have contributed to our initial success and will position us for future growth:
Price and convenience.
We believe that our strongest competitive advantages are our price and convenience. We offer a much less expensive alternative to traditional providers of chiropractic services by focusing on non-acute care and by not participating in insurance or Medicare reimbursement. We can do this because our clinics are not burdened with the operating expenses required to perform certain diagnostic procedures and the administrative requirements and expense to process reimbursement claims. Our model allows us to pass these savings on to our patients. According to
Chiropractic Economics
, the average price for a chiropractic adjustment involving spinal manipulation in the United States is between $50 and $75. By comparison, our average price is $22, or between 56% and 70% lower than the average price.
Our service offerings, pricing and growing number of conveniently sited locations encourage consumer trial, repeat visits and sustainable patient relationships. According to a 2013 survey conducted by
Chiropractic Economics
, the average for repeat patient visits generally in the chiropractic industry is two times per month. We believe our pricing and service offering structure helps us to generate a higher usage. The following table sets forth our average price per adjustment as of December 31, 2014, for patients who pay by single adjustment plans, multiple adjustment packages, and multiple adjustment membership plans. Our price per adjustment averages approximately $22 across all three groups.
|
The Joint Service Offering
|
||||||||||||
|
|
Single Visit
|
Package(s)
|
Membership(s)
|
|||||||||
|
Price per adjustment
|
$ |
29
|
$ |
16 – $20
|
$ |
13 – $16
|
||||||
We attracted an average of between 540 and 948 new patients per year to our clinics between 2010 and 2014, as compared to the 2013 chiropractic industry average of 364 new patients per year.
We offer our patients the opportunity to visit our clinics without an appointment and receive prompt attention. Additionally, we offer extended hours of operation, including weekends, which is not typical among our competitors.
Retail, consumer-driven approach.
To support our consumer focused model, we utilize strong, recognizable brand and retail approaches to stimulate awareness and drive patients to our clinics. We intend to continue to drive awareness of our brand by locating clinics principally at retail centers and convenience points, prominent signage and by deploying consistent, proven and targeted marketing initiatives. We provide our patients with the flexibility to see a chiropractor when they want to because we do not schedule appointments. Most of our clinics offer patient care six or seven days per week at locations people can get to easily and regularly.
By limiting administrative burdens associated with insurance processing, our model helps chiropractors focus on patient service. We believe the time our chiropractors save by not having to attend to administrative duties related to insurance reimbursement allows more time to:
|
•
|
see more patients,
|
|
•
|
establish and reinforce chiropractor/patient relationships, and
|
|
•
|
educate patients on the benefits of chiropractic maintenance therapy.
|
Our approach has made us an attractive alternative for chiropractic doctors who desire to spend more time treating patients than they typically do in traditional practices, which are burdened with greater overhead, personnel, and administrative expense. We believe that our model will aid us in recruiting chiropractors who desire to focus their practice principally on patient care.
Proven track record of opening franchised clinics and growing revenue at the clinic level.
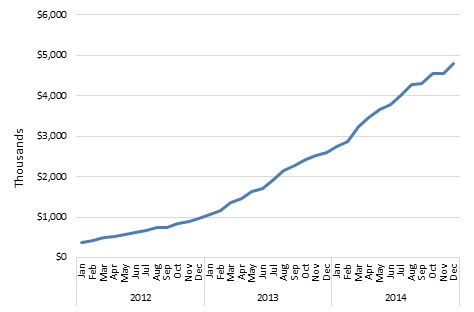
We have grown our franchised clinic revenue base every month since we acquired our predecessor in March 2010. Since January 2012 we have increased monthly sales from $369,296 to $4,793,234 in December 2014. During this period we increased the number of clinics in operation from 33 to 246.
9
Monthly Sales June 2012 – December 2014
Same store sales growth is a measure commonly used in the retail industry. It is important because it excludes sales growth from new locations, thus illustrating a retailer’s growth from existing units. Our same store sales growth measures the annual sales increase for each clinic that has been open for at least one year. Same store sales growth for our clinics that opened in 2011 (which we refer to as age class 2011) was 99.1% in 2012, 49.6% in 2013, and 36.9% through December 31, 2014.
Strong and proven management team.
Our strategic vision and results-oriented culture are directed by our senior management team led by Chief Executive Officer John B. Richards, who previously served as president of Starbucks North America when it expanded from 500 to 3,000 units. Mr. Richards was also Chief Executive Officer of Elizabeth Arden Red Door Salons. Our senior management team is also guided by David Orwasher, who has served as our Chief Operating Officer since January 2014 and who previously served as a vice president of Starbucks, working directly with Mr. Richards during the same significant growth period. John Leonesio, the founder of Massage Envy Spa, who grew that company from inception through the opening of over 300 franchises, serves as non-executive Chairman of our Board of Directors. Mr. Leonesio was our Chief Executive Officer from the commencement of our operations through the opening of 160 clinics across 22 states. Our senior management directs an additional team of dedicated leaders who are focused on executing our business plan and implementing our growth strategy. Messrs. Richards, Orwasher, and Leonesio have had collective responsibility for building, opening or franchising a total of over 7,000 retail units. We believe that our management team’s experience and demonstrated success in building, developing and rapidly scaling operating systems, both company and franchised, will be a key driver of our growth and will position us well for achieving our long-term strategy.
Our Growth Strategy
Our goal is not only to capture a significant share of the existing market but also to expand the market for chiropractic care. We intend to accomplish this through the rapid and focused geographic expansion of our affordable service offering by the introduction of company-owned clinics and the selected continuation of our franchising program. We propose to employ a variety of growth tactics including:
|
•
|
the development of company-owned clinics in clustered geographies;
|
|
•
|
the opportunistic acquisition of existing franchises;
|
|
•
|
the continued growth of system and clinic revenue and royalty income;
|
10
|
•
|
the sale of additional franchises;
|
|
•
|
conversion of existing chiropractic practices to our model;
|
|
•
|
acquiring regional developer licenses; and
|
|
•
|
improving operational margins and leveraging infrastructure.
|
Our analysis of data from over 300,000 patients from 173 clinics across 22 states suggests that the United States market alone can support at least 1,600 Joint clinics.
Development of company-owned clinics.
We will focus on the development of company-owned clinics as the principal strategy in our growth plan, and we intend to use a significant portion of the proceeds from our initial public offering to pursue this strategy. We will open or purchase company-owned clinics that meet our criteria for demographics, site attractiveness, proximity to other clinics and additional suitability factors.
We believe we can leverage the experience we have gained in supporting our demonstrated clinic growth and our senior management’s experience in rapidly and effectively growing other well-known high velocity specialty retail concepts to successfully develop and profitably operate company-owned clinics. Since commencing operations as a franchisor of chiropractic clinics, we have gained significant experience in identifying and implementing the business systems and practices that are required to profitably operate our clinics, validate our model and demonstrate proof of concept. We have developed simple, repeatable operating standards which, when applied in a disciplined approach, result in an attractive opportunity for success at the clinic level.
We believe that the direct control over company-owned and/or operated clinics will enable us to apply these operating standards even more effectively than in our franchised clinics. We intend to develop company-owned clinics in geographic clusters where we are able to increase efficiencies through a consolidated real estate penetration strategy, leverage cooperative advertisement and marketing and attain general corporate and administrative operating efficiencies. Our senior management has done this before, and we believe that their experience in this area readily translates to our business model.
We also believe that the development timeline for company-owned clinics can be shorter than the timeline for franchised clinics, which is generally between 9 and 12 months. While there may be material variances among franchisees in customer acquisition and compliance with operating standards, these variances can be reduced at company-owned clinics. In addition, we believe that our revenue from company-owned and operated clinics will exceed revenue that would be generated through royalty income from a franchise-only system.
While we cannot predict the availability for lease of desirable locations for company-owned clinics, nor the availability of suitable chiropractors to staff our clinics, we believe that the application of a centralized process, driven by development, management, human resources and recruiting professionals, will enable us to develop and operate company-owned clinics with greater consistency than if we relied solely on growth through franchising.
Acquiring existing franchises.
We believe that we can accelerate the development of, and revenue generation from, company-owned clinics through the selective acquisition of existing franchised clinics. Our management has developed a template for the acquisition of existing franchised clinics, their conversion to company-owned clinics and their integration into a company-owned clinic system. Before completing our initial public offering, we began to develop a pipeline of franchisees whose franchises may be available for purchase. Following the completion of the IPO, we have entered into several agreements to acquire existing franchises. We may devote a significant portion of the proceeds from our initial public offering to the purchase of such franchised clinics. The acquisition of existing franchises could accelerate the time required to open and stabilize company-owned clinics. From time to time we are approached by franchisees who wish to sell their clinics.
On December 31, 2014, we acquired substantially all the assets and certain liabilities of six franchises including four operating clinics in Los Angeles County for a purchase price of $900,000 which was paid in cash. We intend to operate four of the acquired franchises as company-owned clinics and to relocate two remaining franchises. See Note 11 in the Notes to our Consolidated Financial Statements for discussion of acquisitions subsequent to December 31, 2014.
11
Increasing revenues from existing franchises.
We have a history of increasing revenues from existing franchises. Our revenues from existing franchises have increased by an average of 27.30% for each of the past 14 calendar quarters through December 31, 2014. We believe that the experience we have gained in developing and refining management systems, operating standards, training materials and marketing and customer acquisition activities has contributed to our system’s revenue growth. Additionally, we believe that increasing awareness of our brand has contributed to revenue growth, particularly in markets where the number and density of our clinics has made cooperative and mass media advertising attractive. We believe that our ability to leverage aggregated and general media digital advertising and search will continue to grow as the number and density of our clinics increases.
Opening clinics in development.
In addition to our 246 opened franchised clinics, we have granted franchises either directly or through our regional developers for an additional 268 clinics that are in various stages of development. We will continue to support our franchisees and regional developers to open these clinics and to achieve sustainable performance as soon as possible.
Selling additional franchises.
We intend to continue to sell franchises. We believe that, to secure leadership in our industry and to maximize our opportunities and presence in identified markets, it is important to gain brand equity and consumer awareness as rapidly as possible, consistent with a disciplined approach to opening clinics. We believe that continued sales of franchises in selected markets complements our plan to open company-owned clinics, particularly in specialized or unique operating environments, and that a growth strategy that includes both franchised and company-owned clinics has advantages over either approach by itself. These advantages include:
|
•
|
increasing our availability to patients;
|
|
•
|
accelerating our speed to market and our competitive advantages;
|
|
•
|
enhancing our value to present franchisees who may realize benefits from clinic density and cooperative advertising;
|
|
•
|
enhancing our desirability to potential new franchisees;
|
|
•
|
presenting an exit strategy to franchisees, who may view us as a potential acquirer of their franchised clinics at such time as they may choose to sell; and
|
|
•
|
increasing brand awareness.
|
Reacquiring regional developer licenses.
We intend to selectively pursue the reacquisition of regional developer licenses. We negotiated repurchase rights in 15 of our 26 regional developer licenses. We have the option, beginning after the third year of regional developer licenses that include this option, to repurchase the license by generally paying $29,000 for each open franchise and $7,250 for each franchise that has not been opened. Before completing our initial public offering, we began to develop a pipeline of existing regional developer licensees whose licenses may be available for purchase. Following the completion of our IPO, we have entered into several agreements to repurchase regional developer licenses. We believe that by repurchasing regional developer licenses we can increase our profitability through capturing the regional developers’ royalty streams from franchises within their regions. In addition, to the extent that we acquire a given regional developer license, we will have fewer limitations on and less cost associated with, opening or acquiring clinics within that region.
On January 1, 2015, we completed the reacquisition and termination of the regional developer license for the Los Angeles County, California region in exchange for cash consideration of $507,500.
12
Continue to improve margins and leverage infrastructure.
We believe our corporate infrastructure is positioned to support a clinic base greater than our existing footprint. As we continue to grow, we expect to drive greater efficiencies across our operations and development and marketing organizations and further leverage our technology and existing support infrastructure. We believe we will be able control corporate costs over time to enhance margins as general and administrative expenses grow at a slower rate than our clinic base and revenues. We believe we can eventually introduce better and more visible professional marketing and patient acquisition practices that will promote brand recognition and drive revenue increases at a faster pace than marketing costs will increase. At the clinic level, we expect to drive margins and labor efficiencies through continued revenue growth as our clinic base matures and the average number of patient visits increases. In addition, we will consider introducing selected and complementary branded products such as nutraceuticals or dietary supplements and related additional services.
Regulatory Environment
HIPAA
In an effort to further combat healthcare fraud and protect patient confidentially, Congress included several anti-fraud measures in the Health Insurance Portability and Accountability Act of 1996 (HIPAA). HIPAA created a source of funding for fraud control to coordinate federal, state and local healthcare law enforcement programs, conduct investigations, provide guidance to the healthcare industry concerning fraudulent healthcare practices, and establish a national data bank to receive and report final adverse actions. HIPAA also criminalized certain forms of health fraud against all public and private payors. Additionally, HIPAA mandates the adoption of standards regarding the exchange of healthcare information in an effort to ensure the privacy and security of electronic patient information. Sanctions for failing to comply with HIPAA include criminal penalties and civil sanctions. In February 2009, the American Recovery and Reinvestment Act of 2009 (ARRA) was enacted. Title XIII of ARRA, the Health Information Technology for Economic and Clinical Health Act (HITECH), includes substantial Medicare and Medicaid incentives for providers to adopt electronic health records (“EHR”) and grants for the development of health information exchange (“HIE”) systems. Recognizing that HIE and EHR systems will not be implemented unless the public can be assured that the privacy and security of patient information in such systems is protected, HITECH also significantly expands the scope of the privacy and security requirements under HIPAA. Most notable are the new mandatory breach notification requirements and a heightened enforcement scheme that includes increased penalties, and which now apply to business associates as well as to covered entities. In addition to HIPAA, a number of states have adopted laws and/or regulations applicable in the use and disclosure of individually identifiable health information that can be more stringent than comparable provisions under HIPAA and HITECH.
We believe that our operations substantially comply with applicable standards for privacy and security of protected healthcare information. We cannot predict what negative effect, if any, HIPAA/HITECH or any applicable state law or regulation will have on our business.
State regulations on corporate practice of medicine.
With the exception of franchisees that are owned by chiropractors or franchisees that are owned by non-chiropractors in states that do not regulate the corporate practice of chiropractic, our chiropractic services are provided by legal entities organized under state laws as professional corporations, or PCs. Each PC employs or contracts with chiropractors in one or more offices. Each of the PCs is wholly owned by one or more licensed chiropractors, and we do not own any capital stock of any PC. We and our franchisees that are not owned by chiropractors enter into management services agreements with PCs to provide the PCs on an exclusive basis with all non-clinical services of the chiropractic practice. We believe we are in compliance with all applicable laws relating to the corporate practice of medicine or chiropractic.
Regulation relating to franchising
We are subject to the rules and regulations of the Federal Trade Commission and various state laws regulating the offer and sale of franchises. The Federal Trade Commission and various state laws require that we furnish an FDD containing certain information to prospective franchisees, and a number of states require registration of the FDD at least annually with state authorities. Included in the information required to be disclosed in our FDD is our business experience, material litigation, all fees due to us from franchisees, a franchisee’s estimated initial investment, restrictions on sources of products and services we impose on franchisees, development and operating obligations of franchisees, whether we provide financing to franchisees, our training and support obligations and other terms and conditions of our franchise agreement. We are operating under exemptions from registration in several states based on our qualifications for exemption as set forth in those states’ laws. Substantive state laws regulating the franchisor-franchisee relationship presently exist in many states. We believe that our FDD and franchising procedures comply in all material respects with both the Federal Trade Commission guidelines and all applicable state laws regulating franchising in those states in which we have offered franchises. We have not elected to sell franchises in certain states where the time and cost associated with registering our FDD in that state is not, in our judgment, justified by current demand for franchises in that state. As of December 31, 2014, we were registered to sell franchises in 26 states.
13
Other federal, state and local regulation
We are subject to varied federal regulations affecting the operation of our business. We are subject to the U.S. Fair Labor Standards Act, the U.S. Immigration Reform and Control Act of 1986, the Occupational Safety and Health Act and various other federal and state laws governing such matters as minimum wage requirements, overtime, fringe benefits, workplace safety and other working conditions and citizenship requirements. A significant number of our clinic service personnel are paid at rates related to the applicable minimum wage, and increases in the minimum wage could increase our labor costs. We are continuing to assess the impact of recently-adopted federal health care legislation on our health care benefit costs. Many of our smaller franchisees will qualify for exemption from the mandatory requirement to provide health insurance benefits because of their small number of employees. The imposition of any requirement that we or our franchisees provide health insurance benefits to our or their employees that are more extensive than the health insurance benefits that we currently provide to our employees or that franchisees may or may not provide, or the imposition of additional employer paid employment taxes on income earned by our employees, could have an adverse effect on our results of operations and financial position. Our distributors and suppliers also may be affected by higher minimum wage and benefit standards, which could result in higher costs for goods and services supplied to us.
We are also required to comply with the accessibility standards mandated by the U.S. Americans with Disabilities Act of 1990 and related federal and state statutes, which generally prohibits discrimination in accommodation or employment based on disability. We may in the future have to modify our clinics to provide service to or make reasonable accommodations for disabled persons. While these expenses could be material, our current expectation is that any such actions will not require us to expend substantial funds.
We are subject to extensive and varied state and local government regulation affecting the operation of our business, as are our franchisees, including regulations relating to public and occupational health and safety, sanitation, fire prevention and franchise operation. Each franchised clinic is subject to licensing and regulation by a number of governmental authorities, which include zoning, health, safety, sanitation, environmental, building and fire agencies in the jurisdiction in which the clinic is located. We require our franchisees to operate in accordance with standards and procedures designed to comply with applicable codes and regulations. However, ours or our franchisees’ inability to obtain or retain health or other licenses would adversely affect operations at the impacted clinic or clinics. Although we have not experienced, and do not anticipate, any significant difficulties, delays or failures in obtaining required licenses, permits or approvals, any such problem could delay or prevent the opening of, or adversely impact the viability of, a particular clinic. In addition, in order to develop and construct our clinics, we need to comply with applicable zoning and land use regulations. Federal and state regulations have not had a material effect on our operations to date, but more stringent and varied requirements of local governmental bodies with respect to zoning and land use could delay or even prevent construction and increase development costs of new clinics.
Competition
The chiropractic industry is highly fragmented. According to
First Research’s
March 2014 report, the top 50 providers of chiropractic services in the United States generate less than ten percent of industry revenue. Our competitors include the approximately 36,000 independent chiropractic offices currently open throughout the United States as well as certain multi-unit operators. We may also face competition from traditional medical practices, outpatient clinics, physical therapists, massage therapists and sellers of devices intended for home use to address back and joint discomfort. Our two largest multi-unit competitors are HealthSource Chiropractic, and ChiroOne, both insurance-based franchised models.
We have identified two competitors who are attempting to duplicate our cash-only, low cost, appointment-free model. Based on publicly available information, these competitors operate five clinics and one clinic respectively as franchises. We anticipate that other direct competitors will join our industry as our visibility, reputation and perceived advantages become more widely known.
14
We believe the principal areas of competition in our industry include price, convenience, quality and consistency of services provided, comfort and accessibility of clinics and reputation.
Employees
As of March 11, 2015, we had 40 employees on a full-time basis. None of our employees are members of unions or participate in other collective bargaining arrangements.
Facilities
We lease the property for our corporate headquarters and all of the properties on which we own and operate clinics.
Our corporate headquarters are located at 16767 North Perimeter Drive, Suite 240, Scottsdale, Arizona 85260. The term of our lease for this location expires on July 31, 2019. The primary functions performed at our corporate headquarters are financial, accounting, treasury, marketing, operations, human resources, information systems support and legal.
We are also obligated under non-cancellable leases for the clinics which we own and operate. Our clinics are on average 1200 square feet. Our clinic leases generally have an initial term of 5 years and include 1 to 2 options to renew for terms of 5 years. Our clinic leases generally require us to pay a proportionate share of real estate taxes, insurance, common area maintenance charges and other operating costs.
As of December 31, 2014, our franchisees operated 246 clinics across 26 states. All of our franchise locations are leased.
Intellectual Property
Trademarks, trade names and service marks
“The Joint… the Chiropractic Place” is our trademark, registered in February 2011, under registration number 3922558. We also registered the words, letters, and stylized form of service mark, “The Joint… the Chiropractic Place” in April 2013 under registration number 4323810.
Risks Related to Our Business
Our long-term success is highly dependent on our ability to open new, primarily company-owned clinics, and is subject to many unpredictable factors.
One of the key means of achieving our growth strategy will be through opening new, primarily company-owned clinics and operating those clinics on a profitable basis. We expect this to be the case for the foreseeable future. We have opened 246 franchised clinics since April 2010, but we have opened only one company-owned clinic, which we then sold to a franchisee. We currently manage 11 company-owned clinics, all of which were recently acquired from existing franchisees. We may not be able to open new company-owned clinics as quickly as planned. In the past, we have experienced delays in opening some franchised clinics, for various reasons, including the landlord’s failure to turn over the premises to our franchisee on a timely basis. Such delays could happen again in future clinic openings. Delays or failures in opening new, primarily company-owned clinics could materially and adversely affect our growth strategy and our business, financial condition and results of operations. As we operate more clinics, our rate of expansion relative to the size of our clinic base will eventually decline.
In addition, one of our biggest challenges is locating and securing an adequate supply of suitable new clinic sites in our target markets. Competition for those sites is intense, and other medical and retail concepts that compete for those sites may have unit economic models that permit them to bid more aggressively for those sites than we can. There is no guarantee that a sufficient number of suitable sites will be available in desirable areas or on terms that are acceptable to us in order to achieve our growth plan. Our ability to open new clinics also depends on other factors, including:
15
|
•
|
negotiating leases with acceptable terms;
|
|
•
|
identifying, hiring and training qualified employees in each local market;
|
|
•
|
timely delivery of leased premises to us from our landlords and punctual commencement of our build-out construction activities;
|
|
•
|
managing construction and development costs of new clinics, particularly in competitive markets;
|
|
•
|
obtaining construction materials and labor at acceptable costs, particularly in urban markets;
|
|
•
|
unforeseen engineering or environmental problems with leased premises;
|
|
•
|
generating sufficient funds from operations or obtaining acceptable financing to support our future development;
|
|
•
|
securing required governmental approvals, permits and licenses (including construction permits and operating licenses) in a timely manner and responding effectively to any changes in local, state or federal laws and regulations that adversely affect our costs or ability to open new clinics; and
|
|
•
|
avoiding the impact of inclement weather, natural disasters and other calamities.
|
Our progress in opening new, primarily company-owned clinics from quarter to quarter may occur at an uneven rate. If we do not open new clinics in the future according to our current plans, the delay could materially adversely affect our business, financial condition and results of operations.
We intend to develop new, primarily company-owned clinics in our existing markets, expand our footprint into adjacent markets and selectively enter into new markets. However, there are numerous factors involved in identifying and securing an appropriate site, including, but not limited to: identification and availability of suitable locations with the appropriate population demographics, psychographics, traffic patterns, local retail and business attractions and infrastructure that will drive high levels of customer traffic and sales per clinic; consumer acceptance of our chiropractic practice concept; financial conditions affecting developers and potential landlords, such as the effects of macro-economic conditions and the credit market, which could lead to these parties delaying or canceling development projects (or renovations of existing projects), in turn reducing the number of appropriate locations available; developers and potential landlords obtaining licenses or permits for development projects on a timely basis; anticipated commercial, residential and infrastructure development near our new clinics; and availability of acceptable lease arrangements.
We may not be able to successfully develop critical market presence for our brand in new geographical markets, as we may be unable to find and secure attractive locations, build name recognition or attract new customers. If we are unable to fully implement our development plan, our business, financial condition and results of operations could be materially adversely affected. See Note 11 to our consolidated financial statements for subsequent events.
New clinics, once opened, may not be profitable, and the increases in average clinic sales and comparable clinic sales that we have experienced in the past may not be indicative of future results.
Typically, our new clinics continue to increase sales for their first 36 months of operation. Our analysis of clinic growth leads us to believe that revenue growth will continue past 36 months. However, we cannot assure you that this will occur for future clinic openings. In new markets, the length of time before average sales for new clinics stabilize is less predictable and can be longer as a result of our limited knowledge of these markets and consumers’ limited awareness of our brand. New clinics may not be profitable and their sales performance may not follow historical patterns. In addition, our average clinic sales and comparable clinic sales may not increase at the rates achieved over the past several years. Our ability to operate new clinics, especially company-owned clinics, profitably and increase average clinic sales and comparable clinic sales will depend on many factors, some of which are beyond our control, including:
16
|
•
|
consumer awareness and understanding of our brand;
|
|
•
|
general economic conditions, which can affect clinic traffic, local rent and labor costs and prices we pay for the supplies we use;
|
|
•
|
changes in consumer preferences and discretionary spending;
|
|
•
|
competition, either from our competitors in the chiropractic industry or our own clinics;
|
|
•
|
temporary and permanent site characteristics of new clinics;
|
|
•
|
changes in government regulation; and
|
|
•
|
other unanticipated increases in costs, any of which could give rise to delays or cost overruns.
|
If our new clinics do not perform as planned, our business and future prospects could be harmed. In addition, if we are unable to achieve our expected average clinics sales, our business, financial condition and results of operations could be adversely affected.
Our failure to manage our growth effectively could harm our business and operating results.
Our growth plan includes a significant number of new clinics. Our existing clinic management systems, administrative staff, financial and management controls and information systems may be inadequate to support our planned expansion. Those demands on our infrastructure and resources may also adversely affect our ability to manage our existing clinics. Managing our growth effectively will require us to continue to enhance these systems, procedures and controls and to hire, train and retain managers and team members. We may not respond quickly enough to the changing demands that our expansion will impose on our management, clinic teams and existing infrastructure which could harm our business, financial condition and results of operations.
Our expansion into new markets may be more costly and difficult than we currently anticipate with the resulting risk of slower growth than we expect.
We plan to open clinics in markets where we have little or no operating experience. Clinics we open in new markets may take longer to reach expected sales and profit levels on a consistent basis and may have higher construction, occupancy, marketing or operating costs than clinics we open in existing markets, thereby affecting our overall profitability. New markets may have competitive conditions, consumer tastes and discretionary spending patterns that are more difficult to predict or satisfy than our existing markets. We may need to make greater investments than we originally planned in advertising and promotional activity in new markets to build brand awareness. We may find it more difficult in new markets to hire, motivate and keep qualified employees who share our vision and culture. We may also incur higher costs from entering new markets, particularly with company-owned clinics if, for example, we hire and assign regional managers to manage comparatively fewer clinics than in more developed markets. For these reasons, both our new franchised clinics and our new company-owned clinics may be less successful than our existing franchised clinics or may achieve target rates of patient visits at a slower rate. If we do not successfully execute our plans to enter new markets, our business, financial condition and results of operations could be materially adversely affected.
We will be subject to all of the risks associated with leasing space subject to long-term non-cancelable leases for clinics that we intend to operate.
We do not intend to own any of the real property where our company-owned clinics will operate. We expect the spaces for the company-owned clinics we intend to open in the future will be leased. We anticipate that our leases generally will have an initial term of five or ten years and generally can be extended only in five-year increments (at increased rates). We expect that all of our leases will require a fixed annual rent, although some may require the payment of additional rent if clinic sales exceed a negotiated amount. We expect that our leases will typically be net leases, which require us to pay all of the cost of insurance, taxes, maintenance and utilities, and that these leases will not be cancellable by us. If a future company-owned clinic is not profitable, resulting in its closure, we may nonetheless be committed to perform our obligations under the applicable lease including, among other things, paying the base rent for the balance of the lease term. In addition, we may fail to negotiate renewals as each of our leases expires, either on commercially acceptable terms or at all, which could cause us to pay increased occupancy costs or to close stores in desirable locations. These potential increases in occupancy costs and the cost of closing company-owned clinics could materially adversely affect our business, financial condition or results of operations.
17
We may not succeed in our plans to reacquire regional developer licenses or to purchase existing franchises, which could delay or prevent revenue increases we require to obtain profitability.
Our growth strategies include the selected re-acquisition of regional developer licenses and the purchase of existing franchised clinics. While we have the right to repurchase the regional developer license in several of our regional developer agreements, we cannot assure you that regional developers will cooperate with us should we choose to exercise such options. Similarly, we cannot assure you that regional developers whose licenses do not include repurchase options, or franchisees, none of whose franchise agreements contain repurchase options, will agree to sell their licenses or franchised clinics to us on terms we consider acceptable, or at all. Our failure to repurchase selected regional developer licenses or to purchase selected existing franchises on attractive terms could materially delay our growth plans, which could have the effect of delaying or preventing the increases in revenues we require to obtain profitability.
Our intended reliance on sources of revenue other than from franchise and regional developer licenses exposes us to risks including the loss of revenue and reduction of working capital.
From the commencement of our operations until the present, we have relied exclusively on the sale of franchises and regional developer licenses as sources of revenue until the franchises we have sold begin to generate royalty revenues. We intend to place less reliance in the future on these sources of revenue as we implement our strategy of developing and operating company-owned clinics. We will not realize revenues from company-owned clinics until the opening of those clinics, and we will be required to use our working capital, including the proceeds from our initial public offering, to operate our business and to develop company-owned clinics. If the opening of our company-owned clinics is delayed or if the cost of developing company-owned clinics exceeds our expectations, we may experience insufficient working capital to fully implement our development plans, and our business, financial condition and results of operations could be adversely affected.
Our potential need to raise additional capital to accomplish our objectives of expanding into new markets and opening company-owned clinics exposes us to risks including limiting our ability to develop or acquire clinics and limiting our financial flexibility.
We intend to use a portion of the proceeds from our initial public offering as consideration for future development and acquisitions of company-owned clinics and related businesses. If we do not have sufficient cash resources, our ability to develop and acquire clinics and related businesses could be limited unless we are able to obtain additional capital through future debt or equity financings. Using cash to finance development and acquisition of clinics and related businesses could limit our financial flexibility by reducing cash available for operating purposes. Using debt financing could result in lenders imposing financial covenants that limit our operations and financial flexibility. Using equity financing may result in dilution of ownership interests of our existing stockholders. We may also use common stock as consideration for the future acquisition of clinics and related businesses. If our common stock does not maintain a sufficient market value or if prospective acquisition candidates are unwilling to accept our common stock as part of the consideration for the sale of their clinics or businesses, we may be required to use more of our cash resources or greater debt financing to complete these acquisitions.
Changes in economic conditions and adverse weather and other unforeseen conditions could materially affect our ability to maintain or increase sales at our clinics or open new clinics.
Our services emphasize maintenance therapy, which is generally not a medical necessity, and should be viewed as discretionary medical expenditures. The United States in general or the specific markets in which we operate may suffer from depressed economic activity, recessionary economic cycles, higher fuel or energy costs, low consumer confidence, high levels of unemployment, reduced home values, increases in home foreclosures, investment losses, personal bankruptcies, reduced access to credit or other economic factors that may affect consumer discretionary spending. Traffic in our clinics could decline if consumers choose to reduce the amount they spend on non-critical medical procedures. Negative economic conditions might cause consumers to make long-term changes to their discretionary spending behavior, including reducing medical discretionary spending on a permanent basis. In addition, given our geographic concentrations in the West, Southwest and mid-Atlantic regions of the United States, economic conditions in those particular areas of the country could have a disproportionate impact on our overall results of operations, and regional occurrences such as local strikes, terrorist attacks, increases in energy prices, adverse weather conditions, tornadoes, earthquakes, hurricanes, floods, droughts, fires or other natural or man-made disasters could materially adversely affect our business, financial condition and results of operations. Adverse weather conditions may also impact customer traffic at our clinics. All of our clinics depend on visibility and walk-in traffic, and the effects of adverse weather may decrease visits to malls in which our clinics are located and negatively impact our revenues. If clinic sales decrease, our profitability could decline as we spread fixed costs across a lower level of sales. Reductions in staff levels, asset impairment charges and potential clinic closures could result from prolonged negative clinic sales, which could materially adversely affect our business, financial condition and results of operations.
18
Our dependence on the success of our franchisees exposes us to risks including the loss of royalty revenue and harm to our brand.
A substantial portion of our revenues comes from royalties generated by our franchised clinics. We anticipate that franchise royalties will represent a substantial part of our revenues in the future. As of December 31, 2014, we had 122 franchisees operating 246 clinics. Accordingly, we are reliant on the performance of our franchisees in successfully opening and operating their clinics and paying royalties to us on a timely basis. Our franchise system subjects us to a number of risks as described in the next four risk factors, any one of which could impact our ability to collect royalty payments from our franchisees, may harm the goodwill associated with our brand and may materially adversely affect our business and results of operations.
Our franchisees are independent operators over whom we have limited control.
Franchisees are independent operators, and their employees are not our employees. Accordingly, their actions are outside of our control. Although we have developed criteria to evaluate and screen prospective franchisees, we cannot be certain that our franchisees will have the business acumen or financial resources necessary to operate successful franchises in their approved locations, and state franchise laws may limit our ability to terminate or modify these franchise agreements. Moreover, despite our training, support and monitoring, franchisees may not successfully operate stores in a manner consistent with our standards and requirements, or may not hire and adequately train qualified managers and other store personnel. The failure of our franchisees to operate their franchises successfully and the actions taken by their employees could have a material adverse effect on our reputation, our brand and our ability to attract prospective franchisees, and on our business, financial condition and results of operations.
A recent decision by the United States National Labor Relations Board held that McDonald’s Corporation could be held jointly liable for labor and wage violations by its franchisees. If this decision is upheld it could result in us having responsibility for damages, reinstatement, back pay and penalties in connection with labor law violations by our franchisees over whom we have no control, and could have a material and adverse effect on our financial condition and results of operations.
We are subject to the risk that our franchise agreements may be terminated or not renewed.
Each franchise agreement is subject to termination by us as the franchisor in the event of a default, generally after expiration of applicable cure periods, although under certain circumstances a franchise agreement may be terminated by us upon notice without an opportunity to cure. The default provisions under the franchise agreements are drafted broadly and include, among other things, any failure to meet operating standards and actions that may threaten our intellectual property. In addition, each franchise agreement has an expiration date. Upon the expiration of the franchise agreement, we or the franchisee may, or may not, elect to renew the franchise agreement. If the franchise agreement is renewed, the franchisee will receive a new franchise agreement for an additional term. Such option, however, is contingent on the franchisee’s execution of the then-current form of franchise agreement (which may include increased royalty payments, advertising fees and other costs), and the payment of a renewal fee. If a franchisee is unable or unwilling to satisfy any of the foregoing conditions, we may elect to not renew the expiring franchise agreement, in which event the franchise agreement will terminate upon expiration of its term. The termination or non-renewal of a franchise agreement could result in the reduction of royalty payments we receive.
19
Our franchisees may not meet timetables for opening their clinics, which could reduce the royalties we receive.
Our franchise agreements specify a timetable for opening the clinic. Failure by our franchisees to open their clinics within the specified time limit would result in the reduction of royalty payments we receive and could result in the termination of the franchise agreement. Of our 268 franchise agreements for sold but unopened clinics as of December 31, 2014, franchisees under 160 franchise agreements have not met the opening timetable specified in their franchise agreement.
Our franchisees may elect bankruptcy protection and deprive us of income.
The bankruptcy of a franchisee could negatively impact our ability to collect payments due under such franchisee’s franchise agreement. In a franchisee bankruptcy, the bankruptcy trustee may reject the franchisee’s franchise agreement pursuant to Section 365 under the United States Bankruptcy Code, in which case we would no longer receive royalty payments from the franchisee.
Our regional developers are independent operators over whom we have limited control.
Our regional developers are independent operators. Accordingly, their actions are outside of our control. We depend upon our regional developers to sell a minimum number of franchises within their territory and to assist the purchasers of those franchises to develop and operate their clinics. The failure by regional developers to sell the specified minimum number of franchises within the time limits set forth in their regional developer license agreements would reduce the franchise fees we receive, delay the payment of royalties to us and result in a potential event of default under the regional developer license agreement. Of our total of 26 regional developer licenses as of December 31, 2014, regional developers under 11 regional developer licenses have not met their minimum franchise sales and/or opening requirements within the time periods specified in their regional developer license agreements.
We present EBITDA as a supplemental measure to help us describe our operating performance. EBITDA is a non-GAAP financial measure commonly used in our industry and should not be construed as an alternative to net income (loss) or as a better indicator of operating performance.
EBITDA consists of net income (loss), before interest, income taxes, depreciation and amortization. We present EBITDA as a supplemental measure to help us describe our operating performance. EBITDA is a non-GAAP financial measure commonly used in our industry and should not be construed as an alternative to net income (loss) (as determined in accordance with generally accepted accounting principles in the United States, or GAAP) or as a better indicator of operating performance. You should not consider EBITDA as a substitute for operating profit, as an indicator of our operating performance or as an alternative to cash flows from operating activities as a measure of liquidity. We may calculate EBITDA differently from other companies.
In addition, in the future we may incur expenses similar to those excluded when calculating EBITDA. Our presentation of these measures should not be construed as an inference that our future results will be unaffected by unusual or non-recurring items. Our computation of EBITDA may not be comparable to other similarly titled measures computed by other companies, because all companies do not calculate EBITDA in the same fashion.
Our management does not consider EBITDA in isolation or as an alternative to financial measures determined in accordance with GAAP. The principal limitation of EBITDA is that it excludes significant expenses and income that are required by GAAP to be recorded in our financial statements. Some of these limitations are: (i) EBITDA does not reflect our cash expenditures, or future requirements, for capital expenditures or contractual commitments; (ii) EBITDA does not reflect changes in, or cash requirements for, our working capital needs; (iii) EBITDA does not reflect the interest expense, or the cash requirements necessary to service interest or principal payments, on our debts, and although depreciation and amortization are non-cash charges, the assets being depreciated and amortized will often have to be replaced in the future; and (iv) EBITDA does not reflect any cash requirements for such replacements.
20
Our ability to operate effectively could be impaired if we fail to attract and retain our executive officers.
Our success depends, in part, upon the continuing contributions of our executive officers and key employees at the management level. Although we have employment agreements with certain of our key executive officers, there is no guarantee that they will not leave. The loss of the services of any of our executive officers or the failure to attract other executive officers could have a material adverse effect on our business or our business prospects. If we lose the services of any of our key employees at the operating or regional level, we may not be able to replace them with similarly qualified personnel, which could harm our business.
A lack of qualified employees will significantly hinder our growth plans and adversely affect our results of operations.
As we grow, our ability to increase productivity and profitability will be limited by our ability to employ, train and retain skilled personnel. There can be no assurance that we will be able to maintain an adequate skilled labor force necessary to operate efficiently, that our labor expenses will not increase as a result of a shortage in the supply of skilled personnel or that we will not have to curtail our planned internal growth as a result of labor shortages.
Our clinics and chiropractors compete for patients in a highly competitive environment that may make it more difficult to increase patient volumes and revenues.
The business of providing chiropractic services is highly competitive in each of the markets in which our clinics operate. The primary bases of such competition are quality of care and reputation, price of services, marketing and advertising strategy and implementation, convenience, traffic flow and visibility of office locations and hours of operation. Our clinics compete with all other chiropractors in their local market. Many of those chiropractors have established practices and reputations in their markets. Some of these competitors and potential competitors may have financial resources, affiliation models, reputations or management expertise that provide them with competitive advantages against us, which may make it difficult to compete against them. Our two largest multi-unit competitors are HealthSource Chiropractic, which currently operates 442 units, and ChiroOne, which operates 42 units. In addition, a number of other chiropractic franchises and chiropractic practices that are attempting to duplicate or follow our business model are currently operating in our markets and in other parts of the country and may enter our existing markets in the future.
Our success is dependent on the chiropractors who control the professional corporations, or PC owners, with whom we enter into management services agreements, and we may have difficulty locating qualified chiropractors to replace PC owners.
With the exception of franchisees that are owned by chiropractors, or franchisees that are owned by non-chiropractors in states that do not regulate the corporate practice of chiropractic, our chiropractic services are provided by legal entities organized under state laws as professional corporations, or PCs. Each PC employs or contracts with chiropractors in one or more offices. Each of the PCs is wholly owned by one or more licensed chiropractors, or medical professionals as state law may require, the PC owner, and we do not own any capital stock of any PC. We and our franchisees that are not owned by chiropractors enter into management services agreements with PCs to provide on an exclusive basis all non-clinical services of the chiropractic practice. The PC owner is critical to the success of a clinic because he or she has control of all clinical aspects of the practice of chiropractic and the provision of chiropractic services. Under our arrangements with the PC owners, the PC owners are prohibited from selling, transferring, pledging or assigning the stock of the PC to a third party without our consent. In addition, we can require the PC owner to sell his or her interest in the PC to any person designated by us that is permitted to hold an ownership interest in the PC. However, upon the departure of a PC owner, we may not be able to locate one or more suitably qualified licensed chiropractors to hold the ownership interest in the PC and maintain the success of the departing PC owner. Also, a court may decide not to enforce these transfer restrictions in a given situation.
Our management services agreements with our affiliated PCs could be challenged by a state or chiropractor under laws regulating the practice of chiropractic.
The laws of every state in which we operate contain restrictions on the practice of chiropractic and control over the provision of chiropractic services. The laws of many states where we operate permit a chiropractor to conduct a chiropractic practice only as an individual, a member of a partnership or an employee of a PC, limited liability company or limited liability partnership. These laws typically prohibit chiropractors from splitting fees with non-chiropractors and prohibit non-chiropractic entities, such as chiropractic management services organizations, from engaging in the practice of chiropractic and from employing chiropractors. The specific restrictions against the corporate practice of chiropractic, as well as the interpretation of those restrictions by state regulatory authorities, vary from state to state. However, the restrictions are generally designed to prohibit a non-chiropractic entity from controlling or directing clinical care decision-making, engaging chiropractors to practice chiropractic or sharing professional fees. The form of management agreement that we utilize ourselves, and that we recommend to our franchisees that are management service organizations, explicitly prohibits the management service organization from controlling or directing clinical care decisions. However, there can be no assurance that all of our franchisees that are management service organizations will strictly follow the provisions in our recommended form of management agreement. The laws of many states also prohibit chiropractic practitioners from paying any portion of fees received for chiropractic services in consideration for the referral of a patient. Any challenge to our contractual relationships with our affiliated PCs by chiropractors or regulatory authorities could result in a finding that could have a material adverse effect on our operations, such as voiding one or more management services agreements. Moreover, the laws and regulatory environment may change to restrict or limit the enforceability of our management services agreements. We could be prevented from affiliating with chiropractor-owned PCs or providing comprehensive business services to them in one or more states.
21
We and our affiliated chiropractor-owned PCs are subject to complex laws, rules and regulations, compliance with which may be costly and burdensome.
We, and the chiropractor-owned PCs we and our franchisees provide management services for, are subject to extensive federal, state and local laws, rules and regulations, including:
|
•
|
state regulations on the practice of chiropractic;
|
|
•
|
the Health Insurance Portability and Accountability Act of 1996, as amended, and its implementing regulations, or HIPAA, and other federal and state laws governing the collection, dissemination, use, security and confidentiality of patient-identifiable health and financial information;
|
|
•
|
federal and state laws and regulations which contain anti-kickback and fee-splitting provisions and restrictions on referrals;
|
|
•
|
the federal Fair Debt Collection Practices Act and similar state laws that restrict the methods that we and third party collection companies may use to contact and seek payment from patients regarding past due accounts;
|
|
•
|
state and federal labor laws, including wage and hour laws.
|
Many of the above laws, rules and regulations applicable to us and our affiliated PCs are ambiguous, have not been definitively interpreted by courts or regulatory authorities and vary from jurisdiction to jurisdiction. Accordingly, we may not be able to predict how these laws and regulations will be interpreted or applied by courts and regulatory authorities, and some of our activities could be challenged. In addition, we must consistently monitor changes in the laws and regulatory schemes that govern our operations. Although we have tried to structure our business and contractual relationships in compliance with these laws, rules and regulations in all material respects, if any aspect of our operations were found to violate applicable laws, rules or regulations, we could be subject to significant fines or other penalties, required to cease operations in a particular jurisdiction, prevented from commencing operations in a particular state or otherwise be required to revise the structure of our business or legal arrangements. Our efforts to comply with these laws, rules and regulations may impose significant costs and burdens, and failure to comply with these laws, rules and regulations may result in fines or other charges being imposed on us.
Our facilities are subject to extensive federal and state laws and regulations relating to the privacy and security of individually identifiable information.
HIPAA required the United States Department of Health and Human Service to adopt standards to protect the privacy and security of individually identifiable health-related information, or PHI. The department released final regulations containing privacy standards in December 2000 and published revisions to the final regulations in August 2002. The privacy regulations extensively regulate the use and disclosure of PHI. The regulations also provide patients with significant rights related to understanding and controlling how their health information is used or disclosed. The security regulations require healthcare providers to implement administrative, physical and technical practices to protect the security of individually identifiable health information that is maintained or transmitted electronically. The Health Information Technology for Economic and Clinical Health Act, or HITECH, which was signed into law in February of 2009, enhanced the privacy, security and enforcement provisions of HIPAA by, among other things, extending HIPAA’s privacy and security standards directly applicable to “business associates,” which, like us, are independent contractors or agents of covered entities (such as the chiropractic PCs and other healthcare providers) that create, receive, maintain, or transmit PHI in connection with providing a service for or on behalf of a covered entity. HITECH also established security breach notification requirements, created a mechanism for enforcement of HIPAA by state attorneys general, and increased penalties for HIPAA violations. Violations of HIPAA or HITECH could result in civil or criminal penalties. In addition to HIPAA, there are numerous federal and state laws and regulations addressing patient and consumer privacy concerns, including unauthorized access or theft of personal information. State statutes and regulations vary from state to state. Lawsuits, including class actions and action by state attorneys general, directed at companies that have experienced a privacy or security breach also can occur. We have established policies and procedures in an effort to ensure compliance with these privacy related requirements. However, if there is a breach, we may be subject to various penalties and damages and may be required to incur costs to mitigate the impact of the breach on affected individuals.
22
Our business model depends on proprietary and third party management information systems that we use to, among other things, track financial and operating performance of our clinics, and any failure to successfully design and maintain these systems or implement new systems could materially harm our operations.
We depend on integrated management information systems, some of which are provided by third parties, and standardized procedures for operational and financial information, as well as for patient records and our billing operations. We may experience unanticipated delays, complications, data breaches or expenses in implementing, integrating, and operating our systems. Our management information systems regularly require modifications, improvements or replacements that may require both substantial expenditures as well as interruptions in operations. Our ability to implement these systems is subject to the availability of skilled information technology specialists to assist us in creating, implementing and supporting these systems. Our failure to successfully design, implement and maintain all of our systems could have a material adverse effect on our business, financial condition and results of operations.
If we fail to properly maintain the integrity of our data or to strategically implement, upgrade or consolidate existing information systems, our reputation and business could be materially adversely affected.
We increasingly use electronic means to interact with our customers and collect, maintain and store individually identifiable information, including, but not limited to, personal financial information and health-related information. Despite the security measures we have in place to ensure compliance with applicable laws and rules, our facilities and systems, and those of our third-party service providers, may be vulnerable to security breaches, acts of cyber terrorism, vandalism or theft, computer viruses, misplaced or lost data, programming and/or human errors or other similar events. Additionally, the collection, maintenance, use, disclosure and disposal of individually identifiable data by our businesses are regulated at the federal and state levels as well as by certain financial industry groups, such as the Payment Card Industry organization. Federal, state and financial industry groups may also consider from time to time new privacy and security requirements that may apply to our businesses. Compliance with evolving privacy and security laws, requirements, and regulations may result in cost increases due to necessary systems changes, new limitations or constraints on our business models and the development of new administrative processes. They also may impose further restrictions on our collection, disclosure and use of individually identifiable information that are housed in one or more of our databases. Noncompliance with privacy laws, financial industry group requirements or a security breach involving the misappropriation, loss or other unauthorized disclosure of personal, sensitive and/or confidential information, whether by us or by one of our vendors, could have material adverse effects on our business, operations, reputation and financial condition, including decreased revenue; material fines and penalties; increased financial processing fees; compensatory, statutory, punitive or other damages; adverse actions against our licenses to do business; and injunctive relief whether by court or consent order.
23
We along with our affiliated PCs and their chiropractors may be subject to malpractice and other similar claims and may be unable to obtain or maintain adequate insurance against these claims.
The provision of chiropractic services by chiropractors entails an inherent risk of potential malpractice and other similar claims. While we do not have responsibility for compliance by affiliated PCs and their chiropractors with regulatory and other requirements directly applicable to chiropractors, claims, suits or complaints relating to services provided at the offices of our franchisees or affiliated PCs may be asserted against us. As we develop company-owned clinics, our exposure to malpractice claims will increase. We have experienced one malpractice claim since our founding in April, 2010, which we are vigorously defending and do not expect its outcome to have a material adverse effect on our business, financial condition or results of operations. The assertion or outcome of these claims could result in higher administrative and legal expenses, including settlement costs or litigation damages. Our current minimum professional liability insurance coverage required for our franchisees, affiliated PCs and company-owned clinics is $1 million per occurrence and $3 million in annual aggregate, with a self-insured retention of $0 per claim and $0 annual aggregate. In addition, we have a corporate entity policy with coverage of $1 million per occurrence and $3 million in annual aggregate. Our inability to obtain adequate insurance or an increase in the future cost of insurance to us and the chiropractors who provide chiropractic services or an increase in the amount we have to self-insure may have a material adverse effect on our business and financial results.
We could be party to litigation that could adversely affect us by distracting management, increasing our expenses or subjecting us to material money damages and other remedies.
In addition to potential malpractice claims, we are also subject to a variety of other claims arising in the ordinary course of our business, including personal injury claims, contract claims and claims alleging violations of federal and state law regarding workplace and employment matters, equal opportunity, harassment, discrimination and similar matters, and we could become subject to class action or other lawsuits related to these or different matters in the future. Regardless of whether any claims against us are valid, or whether we are ultimately held liable, claims may be expensive to defend and may divert time and money away from our operations and hurt our performance. A judgment in excess of our insurance coverage for any claims could materially and adversely affect our financial condition and results of operations. Any adverse publicity resulting from these allegations may also materially and adversely affect our reputation or prospects, which in turn could materially adversely affect our business, financial condition and results of operations.
We are subject to the risk that our current insurance may not provide adequate levels of coverage against claims.
Our current insurance policies may not be adequate to protect us from liabilities that we incur in our business. Additionally, in the future, our insurance premiums may increase, and we may not be able to obtain similar levels of insurance on reasonable terms, or at all. Any substantial inadequacy of, or inability to obtain insurance coverage could materially adversely affect our business, financial condition and results of operations.
Furthermore, there are types of losses we may incur that cannot be insured against or that we believe are not economically reasonable to insure. Such losses could have a material adverse effect on our business and results of operations. As a public company, we intend to enhance our existing directors’ and officers’ insurance. Failure to obtain and maintain adequate directors’ and officers’ insurance would likely adversely affect our ability to attract and retain qualified officers and directors.
Events or rumors relating to our brand names could significantly impact our business.
Recognition of our brand names, including “THE JOINT...THE CHIROPRACTIC PLACE”, and the association of those brands with quality, convenient and inexpensive chiropractic maintenance care are an integral part of our business. The occurrence of any events or rumors that cause patients to no longer associate the brands with quality, convenient and inexpensive chiropractic maintenance care may materially adversely affect the value of the brand names and demand for chiropractic services at our franchisees or their affiliated PCs.
24
Risks Related to Our Recent Initial Public Offering and Listing of Our Common Stock on the NASDAQ Capital Market
Our stock price could be volatile and could decline.
The price at which our common stock will trade could be extremely volatile and may fluctuate substantially due to the following factors, some of which are beyond our control:
|
•
|
variations in our operating results;
|
|
•
|
variations between our actual operating results and the expectations of securities analysts, investors and the financial community;
|
|
•
|
announcements of developments affecting our business or expansion plans by us or others; and
|
|
•
|
conditions and trends in the chiropractic industry.
|
As a result of these and other factors, investors in our common stock may not be able to resell their shares at or above the initial offering price.
In the past, securities class action litigation often has been instituted against companies following periods of volatility in the market price of their securities. This type of litigation, if directed at us, could result in substantial costs and a diversion of management’s attention and resources.
We have identified material weaknesses in our internal control over financial reporting, and our business and stock price may be adversely affected if we do not adequately address those weaknesses or if we have other material weaknesses or significant deficiencies in our internal control over financial reporting.
We did not adequately implement certain controls over our financial reporting cycle. These areas included properly segregated duties due to the size of our accounting department and inefficient accounting for and reporting of complex transactions. The existence of these or one or more other material weaknesses or significant deficiencies could result in errors in our financial statements, and substantial costs and resources may be required to rectify any internal control deficiencies. If we cannot produce reliable financial reports, investors could lose confidence in our reported financial information, the market price of our stock could decline significantly, we may be unable to obtain additional financing to operate and expand our business, and our business and financial condition could be harmed. We have added additional support personnel in our accounting department and in December 2014 retained a chief financial officer, which we believe will remediate these weaknesses.
Our officers and directors and their affiliates exercise significant control over us.
Our founders, executive officers and directors and their immediate family members beneficially own, in the aggregate, approximately
53.3%
of our outstanding common stock. These stockholders may have interests that are different from yours. As a result, these stockholders will be able to exercise significant control over all matters requiring stockholder approval, including the election of directors and approval of significant corporate transactions, which could delay or prevent someone from acquiring or merging with us.
Provisions of Delaware law could discourage a takeover that stockholders may consider favorable.
As a Delaware corporation, we have elected to be subject to the Delaware anti-takeover provisions contained in Section 203 of the Delaware General Corporation Law. Under Delaware law, a corporation may not engage in a business combination with any holder of 15% or more of its capital stock unless the holder has held the stock for three years or, among other things, the Board of Directors has approved the transaction. Our Board of Directors could rely on this provision to prevent or delay an acquisition of us. For a description of our capital stock, see “Description of Capital Stock.”
Future sales of our common stock may depress our stock price.
Sales of substantial amounts of our common stock in the public market by our officers, directors or significant shareholders may adversely affect the market price of our common stock. Shares issued upon the exercise of outstanding options and shares issuable upon the exercise of the warrants we issued to the underwriters in our recent initial public offering also may be sold in the public market. Such sales could create the perception to the public of difficulties or problems with our business. As a result, these sales might make it more difficult for us to sell securities in the future at a time and price that we deem necessary or appropriate.
25
As of
March 11, 2015, we had 9,621,581 shares
of common stock outstanding. After the lock-up agreements entered into by our directors, officers and certain shareholders in connection with our initial public offering expire one year after the date of the completion of our initial public offering (or, in limited circumstances after 180 days from such date), an additional
6,171,601
shares will be eligible for sale in the public market, of which
5,132,086
shares are currently held by founders, directors, executive officers and other affiliates, and are subject to volume limitations under Rule 144 of the Securities Act and certain other restrictions. The underwriters may also, in their sole discretion, permit our founders, officers, directors and current stockholders to sell shares prior to the expiration of the lockup agreements.
Financial forecasting by us and financial analysts that may publish estimates of our financial results will be difficult because of our limited operating history, and our actual results may differ from forecasts.
As a result of our limited operating history, it is difficult to accurately forecast our revenues, operating expenses and results, and operating data. The inability by us or the financial community to accurately forecast our operating results could cause our net losses in a given quarter to be greater than expected, which could cause a decline in the trading price of our common stock. We have a limited amount of meaningful historical financial data upon which to base planned operating expenses. We base our current and forecasted expense and cash expenditure levels on our operating plans and estimates of future revenues, which are dependent on the growth of the number of customers and the demand for our products. As a result, we may be unable to make accurate financial forecasts or to adjust our spending in a timely manner to compensate for any unexpected shortfalls in revenues. We believe that these difficulties in forecasting are even greater for financial analysts that may publish their own estimates of our financial results.
Our management may not use the proceeds of our initial public offering effectively.
Our management has broad discretion over the use of proceeds of our initial public offering. Accordingly, it is possible that our management may allocate the proceeds in ways that do not improve our operating results. In addition, these proceeds may not be invested to yield a favorable rate of return pending our use of the proceeds.
We do not intend to pay dividends. You will not receive funds without selling shares, and you may lose the entire amount of your investment.
We have never declared or paid any cash dividends on our capital stock and do not intend to pay dividends in the foreseeable future. We intend to invest our future earnings, if any, to fund our growth. We cannot assure you that you will receive a positive return on your investment when you subsequently sell your shares or that you will not lose the entire amount of your investment.
The requirements of being a public company, including compliance with the reporting requirements of the Exchange Act and the requirements of the Sarbanes-Oxley Act, may strain our resources, increase our costs and distract management, and we may be unable to comply with these requirements in a timely or cost-effective manner.
As a public company with listed equity securities, we need to comply with certain laws, regulations and requirements, including corporate governance provisions of the Sarbanes-Oxley Act of 2002, or the “Sarbanes-Oxley Act,” related regulations of the Securities and Exchange Commission, or “SEC,” and the requirements of The NASDAQ Capital Market. Complying with these statutes, regulations and requirements occupies a significant amount of time of our Board of Directors and management and results in significant costs and expenses. In addition to devoting resources to the operation of our business, we have been required to:
|
•
|
institute more comprehensive corporate governance and compliance functions;
|
|
•
|
design, establish, evaluate and maintain a system of internal control over financial reporting in compliance with the requirements of Section 404(a) of the Sarbanes-Oxley Act and the related rules and regulations of the SEC and the Public Company Accounting Oversight Board;
|
|
•
|
comply with rules promulgated by The NASDAQ Capital Market;
|
26
|
•
|
prepare and distribute periodic public reports in compliance with our obligations under the federal securities laws;
|
|
•
|
establish new internal policies, such as those relating to disclosure controls and procedures and insider trading;
|
|
•
|
to a greater degree than previously, involve and retain outside counsel and accountants in the above activities; and
|
|
•
|
establish an investor relations function.
|
We are an emerging growth company and our reliance on the reduced disclosure requirements applicable to emerging growth companies may make our common stock less attractive to investors.
We are an “emerging growth company,” as defined in the Jumpstart Our Business Startups Act of 2012, and we may take advantage of certain exemptions and relief from various reporting requirements that are applicable to other public companies but are not applicable to emerging growth companies. In particular, while we are an emerging growth company, we will not be required to comply with the auditor attestation requirements of Section 404(b) of the Sarbanes-Oxley Act, we will be subject to reduced disclosure obligations regarding executive compensation in our periodic reports and proxy statements, and we will not be required to hold non-binding advisory votes on executive compensation or shareholder approval of any golden parachute payments not previously approved.
We may remain an emerging growth company until as late as December 31, 2019 (the fiscal year-end following the fifth anniversary of the completion of this offering), though we may cease to be an emerging growth company earlier under certain circumstances, including (i) if the market value of our common stock that is held by non-affiliates exceeds $700 million as of any June 30, in which case we would cease to be an emerging growth company as of the following December 31 or (ii) if our gross revenues exceed $1 billion in any fiscal year. Investors may find our common stock less attractive if we rely on these exemptions and relief. If some investors find our common stock less attractive for this reason, there may be a less active trading market for our common stock, and our stock price may decline and/or become more volatile.
We will be obligated to develop and maintain proper and effective internal controls over financial reporting. We may not complete our analysis of our internal controls over financial reporting in a timely manner, or these internal controls may not be determined to be effective, which may adversely affect investor confidence in our company and, as a result, the value of our common stock.
Beginning with our second annual report on SEC Form 10-K after becoming a public company, we will be required, pursuant to Section 404(a) of the Sarbanes-Oxley Act, to furnish a report by management on, among other things, the effectiveness of our internal control over financial reporting. This assessment will need to include disclosure of any material weaknesses identified by our management in our internal control over financial reporting. We may not be able to complete evaluation, testing and any required remediation in a timely fashion. During the evaluation and testing process, if we identify one or more material weaknesses in our internal control over financial reporting, we will be unable to confirm that our internal controls are effective.
When we cease to be an emerging growth company, our auditors will be required to express an opinion on the effectiveness of our internal controls. If we are unable to confirm that our internal control over financial reporting is effective, or if our auditors are unable to express an opinion on the effectiveness of our internal controls, we could lose investor confidence in the accuracy and completeness of our financial reports, which would cause the price of our common stock to decline.
Claims for indemnification by our directors and officers may reduce our available funds to satisfy successful third-party claims against us and may reduce the amount of money available to us.
Our amended and restated certificate of incorporation and bylaws provide that we will indemnify our directors and officers, in each case to the fullest extent permitted by Delaware law. In addition, we have entered and expect to continue to enter into agreements to indemnify our directors, executive officers and other employees as determined by our Board of Directors. Under the terms of such indemnification agreements, we are required to indemnify each of our directors and officers, to the fullest extent permitted by the laws of the state of Delaware, if the basis of the indemnitee’s involvement was by reason of the fact that the indemnitee is or was a director or officer of the Company or any of its subsidiaries or was serving at the Company’s request in an official capacity for another entity. We must indemnify our officers and directors against all reasonable fees, expenses, charges and other costs of any type or nature whatsoever, including any and all expenses and obligations paid or incurred in connection with investigating, defending, being a witness in, participating in (including on appeal), or preparing to defend, be a witness or participate in any completed, actual, pending or threatened action, suit, claim or proceeding, whether civil, criminal, administrative or investigative, or establishing or enforcing a right to indemnification under the indemnification agreement. The indemnification agreements also require us, if so requested, to advance within 30 days of such request all reasonable fees, expenses, charges and other costs that such director or officer incurred, provided that such person will return any such advance if it is ultimately determined that such person is not entitled to indemnification by us. Any claims for indemnification by our directors and officers may reduce our available funds to satisfy successful third-party claims and may reduce the amount of money available to us.
27
Not applicable.
We lease the property for our corporate headquarters and all of the properties on which we own and operate clinics.
Our corporate headquarters are located at 16767 North Perimeter Drive, Suite 240, Scottsdale, Arizona 85260. The term of our lease for this location expires on July 31, 2019. The primary functions performed at our corporate headquarters are financial, accounting, treasury, marketing, operations, human resources, information systems support and legal.
We are also obligated under non-cancellable leases for the clinics which we own and operate. Our clinics are on average 1200 square feet. As of March 11, 2015, we owned and operated 11 clinics located in 2 states. Our clinic leases generally have an initial term of 5 years and include 1 to 2 options to renew for terms of 5 years. Our clinic leases generally require us to pay a proportionate share of real estate taxes, insurance, common area maintenance charges and other operating costs.
As of December 31, 2014, our franchisees operated 246 clinics across 26 states. All of our franchise locations are leased.
In the normal course of business, we are party to litigation from time to time. We maintain insurance to cover certain actions and believe that resolution of such litigation will not have a material adverse effect on the Company.
Not applicable.
Beginning November 11, 2014, our common stock is traded on the NASDAQ Capital Market under the symbol “JYNT.” The following table sets forth the high and low sales prices for our common stock for the calendar quarters or other periods indicated as reported by the NASDAQ Capital Market.
28
Company Stock Performance
|
Quarter (or other period)
|
High
|
Low
|
||||||
|
First quarter 2014
|
N/A | N/A | ||||||
|
Second quarter 2014
|
N/A | N/A | ||||||
|
Third quarter 2014
|
N/A | N/A | ||||||
|
November 11, 2014 – December 31, 2014
|
$ | 6.48 | $ | 6.00 | ||||
Holders
As of December 31, 2014, there were approximately 27 holders of record of our common stock and 9,621,581 shares of our common stock outstanding.
Dividends
Since our initial public offering, we have not declared nor paid dividends on our common stock and we do not expect to pay cash dividends on our common stock in the foreseeable future.
29
|
Year Ended
December 31,
|
||||||||||||
|
2014
|
2013
|
2012
|
||||||||||
|
(in thousands except per share data)
|
||||||||||||
|
Consolidated Statement of Operations Data:
|
||||||||||||
|
Total revenues
|
$ | 7,117 | $ | 5,958 | $ | 2,785 | ||||||
|
Cost of revenues
|
2,246 | 2,006 | 1,091 | |||||||||
|
Selling, general and administrative expense
|
6,497 | 3,512 | 3,042 | |||||||||
|
Income (loss) from operations
|
(1,627 | ) | 440 | (1,347 | ) | |||||||
|
Net income (loss)
|
(3,031 | ) | 156 | (736 | ) | |||||||
|
Basic earnings per share
|
(0.56 | ) | 0.03 | (0.14 | ) | |||||||
|
Diluted earnings per share
|
(0.56 | ) | 0.02 | (0.14 | ) | |||||||
|
Weighted average shares outstanding used in computing
|
||||||||||||
|
basic income (loss) per share
|
5,452 | 5,314 | 5,340 | |||||||||
|
Weighted average shares outstanding used in computing
|
||||||||||||
|
diluted income (loss) per share
|
5,452 | 6,670 | 5,340 | |||||||||
|
Non-GAAP Financial Data:
|
||||||||||||
|
Net income (loss)
|
(3,031 | ) | 156 | (736 | ) | |||||||
|
Interest expense
|
- | - | - | |||||||||
|
Depreciation and amoritzation expense
|
210 | 71 | 50 | |||||||||
|
Tax expense (benefit) penalties and interest
|
1,340 | 252 | (575 | ) | ||||||||
|
EBITDA
|
(1,481 | ) | 479 | (1,261 | ) | |||||||
|
December 31,
|
||||||||||||
|
2014
|
2013
|
2012
|
||||||||||
|
Consolidated Balance Sheet Data:
|
(in thousands)
|
|||||||||||
|
Cash and cash equivalents
|
$ | 20,797 | $ | 3,517 | $ | 3,566 | ||||||
|
Property and equipment
|
1,134 | 400 | 230 | |||||||||
|
Deferred franchise costs
|
3,243 | 3,223 | 3,208 | |||||||||
|
Goodwill and intangible assets
|
830 | - | - | |||||||||
|
Other assets
|
2,554 | 2,628 | 2,096 | |||||||||
|
Total assets
|
28,559 | 9,768 | 9,100 | |||||||||
|
Deferred revenue
|
9,960 | 10,008 | 9,949 | |||||||||
|
Other liabilities
|
2,971 | 981 | 288 | |||||||||
|
Total liabilities
|
12,932 | 10,989 | 10,237 | |||||||||
|
Stockholders' equity (deficit)
|
15,627 | (1,221 | ) | (1,136 | ) | |||||||
30
Forward-Looking Statements
The information in this Annual Report on Form 10-K, or this Form 10-K, including this discussion in Management’s Discussion and Analysis of Financial Condition and Results of Operations, or MD&A, contains forward-looking statements and information within the meaning of Section 27A of the Securities Act of 1933, as amended, and Section 21E of the Securities Exchange Act of 1934, as amended, or the Exchange Act, which are subject to the “safe harbor” created by those sections. All statements, other than statements of historical facts, included or incorporated in this Form 10-K could be deemed forward-looking statements, particularly statements about our plans, strategies and prospects under this MD&A and under the heading “Business.” In some cases, you can identify forward-looking statements by terminology such as “may,” “will,” “should,” “could,” “expects,” “plans,” “anticipates,” “believes,” “estimates,” “predicts,” “potential,” “continue,” “intend” or the negative of these terms or other comparable terminology. All forward-looking statements in this Form 10-K are made based on our current expectations, forecasts, estimates and assumptions, and involve risks, uncertainties and other factors that could cause results or events to differ materially from those expressed in the forward-looking statements. In evaluating these statements, you should specifically consider various factors, uncertainties and risks that could affect our future results or operations as described from time to time in our SEC reports., including those risks outlined under “Risk Factors” in Item 1A of this Form 10-K. These factors, uncertainties and risks may cause our actual results to differ materially from any forward-looking statement set forth in this Form 10-K. You should carefully consider the trends, risks and uncertainties described below and other information in this Form 10-K and subsequent reports filed with or furnished to the SEC before making any investment decision with respect to our securities. All forward-looking statements attributable to us or persons acting on our behalf are expressly qualified in their entirety by this cautionary statement. Some of the important factors that could cause our actual results to differ materially from those projected in any forward-looking statements include, but are not limited to, the following:
|
●
|
we may not be able to successfully implement our growth strategy if we or our franchisees are unable to locate and secure appropriate sites for clinic locations, obtain favorable lease terms, hire and retain suitable chiropractors and staff to serve our patients, and attract patients to our clinics;
|
|
|
●
|
we have limited experience operating company-owned clinics, and we may not be able to duplicate the success of some of our franchisees;
|
|
|
●
|
we may not be able to acquire operating clinics from existing franchisees or acquire operating clinics on attractive terms;
|
|
|
●
|
we may not be able to continue to sell franchises to qualified franchisees;
|
|
|
●
|
we may not be able to identify, recruit and train enough qualified chiropractors to staff our clinics;
|
|
|
●
|
new clinics may not be profitable, and we may not be able to maintain or improve revenues and franchise fees from existing franchised clinics;
|
|
|
●
|
the chiropractic industry is highly competitive, with many well-established competitors;
|
|
|
●
|
we may face negative publicity or damage to our reputation, which could arise from concerns expressed by opponents of chiropractic and by chiropractors operating under traditional service models;
|
|
|
●
|
legislation and regulations, as well as new medical procedures and techniques could reduce or eliminate our competitive advantages;
|
|
|
●
|
we will face increased costs as a result of being a public company; and
|
|
|
●
|
we have identified material weaknesses in our internal control over financial reporting, and our business and stock price may be adversely affected if we do not adequately address those weaknesses.
|
Additionally, there may be other risks that are otherwise described from time to time in the reports that we file with the Securities and Exchange Commission. Any forward-looking statements in this report should be considered in light of various important factors, including the risks and uncertainties listed above, as well as others.
The following discussion and analysis of the results of operations and financial condition of The Joint Corp. for the years ended December 31, 2014 and 2013 should be read in conjunction with the consolidated financial statements and the notes thereto, and other financial information contained elsewhere in this Form 10-K.
31
Overview
The Joint Corp. (“we,” “our” or “us”), a Delaware corporation, was formed on March 10, 2010 for the principal purpose of franchising chiropractic clinics, selling regional developer rights and supporting the operations of franchised chiropractic clinics at locations throughout the United States.
We seek to be the leading provider of chiropractic care in the markets we serve and to become the most recognized brand in our industry through the rapid and focused expansion of chiropractic clinics in key markets throughout North America and abroad.
Key Performance Measures.
We receive both weekly and monthly performance reports from our franchised clinics which include key performance indicators including gross clinic revenues, total royalty income, number of open clinics and patient office visits. We believe these indicators provide us with useful data with which to measure our performance and to measure our franchisees’ and clinics’ performance.
Key Clinic Development Trends.
As of December 31, 2014, 246 clinics were operated by franchisees. Of these, 53 franchises have been awarded directly by us while 193 franchises were awarded pursuant to our regional developer program in which we sold licenses to third parties to develop franchises in particular geographic areas.
Our future growth strategy will increasingly focus on acquiring and developing clinics that are directly owned and operated by us, while continuing to grow through the sale of additional franchises.
We expect to repurchase or to develop up to 50 clinics to be operated as company-owed clinics over twelve months beginning January 1, 2015. On December 31, 2014, we acquired six clinics from a franchisee.
We expect to open approximately 60 - 65 new franchised clinics over the twelve months beginning January 1, 2015. We generally expect a franchised clinic to open within 9 to 12 months from the date a franchise agreement is signed. This development timeline applies both to clinics franchised directly with us and for clinics franchised through a regional developer. In addition, our regional developers are required, under their respective regional developer agreements, to obtain franchises and open the minimum number of clinics prescribed in their regional developer agreement within a negotiated time period, which takes into account the number of clinics, as well as the size, geography and demographics pertaining to each relevant region. This negotiated time period may differ among regional developers.
We may encounter difficulty in finding suitable locations for our planned company-owned clinics, and our franchisees may encounter difficulty in finding and funding suitable locations for their franchised clinics. In addition, we and our franchisees may not be able to secure the services of chiropractors who share our vision and philosophy regarding the practice of chiropractic and are therefore appropriate candidates to provide services at a Joint clinic. Our ability to take full advantage of advertising and public awareness initiatives will depend on the speed with which we can develop either company-owned or franchised clinics in clusters with sufficient density to justify the use of mass media and other strategic media.
Recent Developments
On November 14, 2014, we closed on our initial public offering (“IPO”) of 3,000,000 shares of common stock at a price to the public of $6.50 per share. As a result of the IPO, we received aggregate net proceeds, after deducting underwriting discounts, commissions and other offering expenses, of approximately $17,065,000. On November 18, 2014, our underwriters exercised their option to purchase 450,000 additional shares of common stock to cover over-allotments, pursuant to which we received aggregate net proceeds of approximately $2,710,000, after deducting underwriting discounts, commissions and expenses.
Development of company-owned clinics will be our principal focus, and we will use a significant amount of the proceeds from our IPO to pursue this strategy. We believe we can leverage the experience we have gained in supporting our demonstrated franchisee growth and our senior management’s experience in rapidly and effectively growing other well-known high velocity specialty retail concepts to successfully develop and profitably operate company-owned clinics. Since commencing operations as a franchisor of chiropractic clinics, we have gained significant experience in identifying the business systems and practices that are required to profitably operate our clinics, validate our model and demonstrate proof of concept.
32
We believe our direct control over company-owned clinics will enable us to more effectively apply these business systems and practices than in our franchised clinics and to collect more revenue per clinic than would otherwise be available to us solely through the collection of royalty fees, franchise sales fees, and regional developer fees. We intend to develop company-owned clinics in geographic clusters where we are able to increase efficiencies through a consolidated real estate penetration strategy, leverage aggregated advertisement and marketing and attain general corporate and administrative operating efficiencies. We believe that our management’s experience in this area readily translates to our business model.
On December 31, 2014, we reacquired six franchised clinics, closed two clinics and retained the remaining four clinics as company-owned clinics. As part of our company-owned clinic strategy, we may seek to reacquire additional franchised clinics as circumstances permit. In addition, on January 1, 2015, we reacquired a regional developer license. As of March 11, 2015, we have closed on the acquisition of 11 clinics and 2 regional developer licenses inclusive of the clinics acquired on December 31, 2014.
Factors Affecting Our Performance
Our quarterly operating results may fluctuate significantly as a result of a variety of factors, including the timing of new clinic openings, markets in which they are contained and related expenses, general economic conditions, consumer confidence in the economy, consumer preferences, and competitive factors.
Significant Accounting Polices and Estimates
The preparation of consolidated financial statements requires us to make estimates and assumptions. These estimates and assumptions affect the reported amounts of assets and liabilities and disclosure of contingent assets and liabilities at the date of the consolidated financial statements, and the reported amounts of revenues and expenses during the reporting period. We base our accounting estimates on historical experience and other factors that we believe to be reasonable under the circumstances. Actual results could differ from those estimates. We have discussed the development and selection of significant accounting policies and estimates with our Audit Committee.
Revenues
Royalty Fees.
We collect royalties based upon the terms of our franchise disclosure document and our franchise agreements, currently equal to 7% of gross sales from open clinics.
Franchise Fees.
Our revenues from franchise fees are derived from the sale of franchises and are recognized when a franchised clinic is opened.
Regional Developer Fees.
During 2011, we established a regional developer program to engage independent contractors to assist in developing specified geographical regions. Under this program, regional developers pay a license fee of 25% of the then current franchise fee for each franchise they receive the right to develop within a specified geographical region. Each regional developer agreement establishes a minimum number of franchises that the regional developer must develop. Regional developers receive 50% of franchise fees collected upon the sale of franchises within their region, and a royalty of 3% of sales generated by franchised clinics in their region. Regional developer fees are non-refundable and are recognized as revenue when we have performed substantially all initial services required by the regional developer agreement, which generally is considered to be upon the opening of each franchised clinic.
IT Related Income and Software Fees.
We collect a monthly computer software fee of $275 per month for each open clinic for use of our proprietary chiropractic software, for related computer support and related internet service support. A combined software and supportive hardware package was made available to all clinics in April 2012. IT related revenue represents a flat fee paid by our franchisees to purchase computer equipment, operating software, pre-installed chiropractic system software, keycard scanner and credit card receipt printer and to have access to and support of our proprietary chiropractic software.
Advertising Fund Revenue.
We have established an advertising fund for national marketing and advertising of services offered by the clinics owned by the franchisees. As stipulated in our typical franchise agreement, a franchisee pays a monthly marketing fee of 1% of gross sales, which increased at our discretion to 2% in January 2015. We segregate the marketing funds collected and use the funds for specific purposes as outlined in our franchise disclosure document. As amounts are expended from the fund, we recognize advertising fund revenue and a related expense. Amounts collected in excess of marketing expenditures are included in restricted cash on our consolidated balance sheets.
33
Our franchise agreements typically require franchisees to spend between $1,800 - $2,500 monthly per clinic for local store marketing. We oversee this activity to monitor compliance. We may designate preferred vendors to support their efforts but franchisees are not required to use the preferred vendors.
Cost of Revenues
Cost of revenues is comprised of expenses associated with sales, opening and ongoing support in respect of our clinic operators and regional developers. Specifically, cost of revenues includes franchise sales commissions, regional developer royalties and commissions and payments to contracted sales professionals. These costs are recognized upon the opening and ongoing operations of the clinics. Also included in cost of revenues are the costs of computer hardware and software sold to each franchisee.
Selling, General and Administrative Costs
Selling, general and administrative costs include all corporate and administrative functions that support our franchised clinics and provide an infrastructure to facilitate our operations and future growth. Components of these costs include executive management, supervisory and staff salaries, bonuses and related taxes and employee benefits, marketing, travel, information systems, training, support center rent and related occupancy costs, and professional and consulting fees.
Results of Operations
Total Revenues
Components of revenues for the year ended December 31, 2014 as compared to the year ended December 31, 2013, are as follows:
|
Year Ended
|
||||||||||||||||
|
December 31,
|
||||||||||||||||
|
2014
|
2013
|
Change from
Prior Year
|
Percent Change
from Prior Year
|
|||||||||||||
|
Revenues:
|
||||||||||||||||
|
Royalty fees
|
$ | 3,194,286 | $ | 1,531,201 | $ | 1,663,085 | 108.6 | % | ||||||||
|
Franchise fees
|
1,933,500 | 2,536,333 | (602,833 | ) | (23.8 | )% | ||||||||||
|
Regional developer fees
|
478,500 | 742,875 | (264,375 | ) | (35.6 | )% | ||||||||||
|
IT related income and software fees
|
840,825 | 762,867 | 77,958 | 10.2 | % | |||||||||||
|
Advertising fund revenue
|
459,493 | 216,784 | 242,709 | 112.0 | % | |||||||||||
|
Other income
|
210,058 | 168,007 | 42,051 | 25.0 | % | |||||||||||
|
Total revenues
|
$ | 7,116,662 | $ | 5,958,067 | $ | 1,158,595 | 19.4 | % | ||||||||
The reasons for the significant changes in our components of total revenues are as follows:
|
|
·
|
Royalty fees have increased due to an opening of 73 new clinics during the year ended December 31, 2014, representing an increase of 41% over the total number of open clinics as of December 31, 2013. In addition, the combined increased clinic base generated significantly more sales upon which the royalty fee is calculated as clinics continue to mature.
|
|
|
·
|
Franchise fees are recognized when a clinic is opened. Franchise fees and regional developer fees have decreased due to a smaller number of clinic openings during the year ended December 31, 2014 as compared to the year ended December 31, 2013. For the year ended December 31, 2014 and December 31, 2013, 73 and 93 new clinics opened respectively.
|
34
|
|
·
|
IT related income and software fee, advertising fund revenue and other income increased due to an increase in our clinic base as described above
|
|
|
·
|
With the acquisition of clinics in early 2015, we will be recognizing management fees and service fees from these company-owned clinics.
|
Cost of Revenues
|
Year Ended December 31,
|
Change from
|
Percent Change
|
||||||||||||||
|
2014
|
2013
|
Prior Year
|
from Prior Year
|
|||||||||||||
|
Cost of Revenues
|
$ | 2,246,439 | $ | 2,006,196 | $ | 240,243 | 12.0 | % | ||||||||
For the year ended December 31, 2014 and 2013, the cost of revenues was 32% and 34%, respectively, as a percentage of total revenues. The total cost of revenues increased by $240,243 due primarily to an increase in regional developer royalties of $612,465, which is 121% higher than in the year ended December 31, 2013. This increase in cost of revenues was due primarily to an increase in the number of open clinics subject to regional developer royalties during the year ended December 31, 2014 as compared to the year ended December 31, 2013. This increased cost of revenues was partially offset by a decrease in regional developer commissions of $275,000 due to fewer clinic openings subject to regional developer commissions during the year ended December 31, 2014 as compared to the year ended December 31, 2013.
Selling and Marketing Expenses
|
Year Ended December 31,
|
Change from
|
Percent Change
|
||||||||||||||
|
2014
|
2013
|
Prior Year
|
from Prior Year
|
|||||||||||||
|
Selling and Marketing Expenses
|
$ | 1,188,016 | $ | 781,256 | $ | 406,760 | 52.1 | % | ||||||||
Selling and marketing expenses increased for the year ended December 31, 2014, as compared to the year ended December 31, 2013, due to travel expenses related to attending sales conventions, and costs associated with our initial public offering and hiring of additional sales and marketing personnel. This was partially offset by a decrease in direct selling expenses which is due to the development of a more focused marketing strategy launched in late 2014.
Depreciation and Amortization Expenses
|
Year Ended December 31,
|
Change from
|
Percent Change
|
||||||||||||||
|
2014
|
2013
|
Prior Year
|
from Prior Year
|
|||||||||||||
|
Depreciation and Amortization Expenses
|
$ | 210,123 | $ | 70,725 | $ | 139,398 | 197.1 | % | ||||||||
Depreciation and amortization expenses increased for the year ended December 31, 2014, as compared to the year ended December 31, 2013, due to the effects of fixed assets additions in 2014 for relocation and expansion of our corporate office, related tenant improvement expenses, software enhancements and website development expenses.
General and Administrative Expenses
|
Year Ended December 31,
|
Change from
|
Percent Change
|
||||||||||||||
|
2014
|
2013
|
Prior Year
|
from Prior Year
|
|||||||||||||
|
General and Administrative Expenses
|
$ | 5,098,793 | $ | 2,660,101 | $ | 2,438,692 | 91.7 | % | ||||||||
General and administrative expenses increased during the year ended December 31, 2014, compared to the year ended December 31, 2013, primarily due to the following:
|
|
·
|
An increase of approximately $1,672,000 of employment expense which includes salaries and wages, stock based compensation, executive relocation costs, health insurance expense and payroll taxes. This is due to increased infrastructure to support our growth and emergence as a public company, as well as the addition of new members of our senior management team, including Chief Marketing Officer, Chief Financial Officer, President and Chief Operating Officer and Chief Executive Officer;
|
|
|
·
|
An increase of approximately $617,000 in professional fees, primarily related to additional accounting and legal fees associated with our becoming a public company and franchise-related legal services; and
|
35
|
|
·
|
An increase of approximately $149,000 in other operating expenses.
|
|
Year Ended December 31,
|
Change from
|
Percent Change
|
||||||||||||||
|
2014
|
2013
|
Prior Year
|
from Prior Year
|
|||||||||||||
|
Income Tax Provision
|
$ | (1,340,436 | ) | $ | (252,154 | ) | $ | (1,088,282 | ) | 431.6 | % | |||||
Changes in our income tax expense related primarily to changes in pretax income during the year ended December 31, 2014, as compared to year ended December 31, 2013, and changes in the effective rate from 79.3% to 61.8%, respectively. The difference is due to a valuation allowance on our deferred tax assets, uncertain tax positions that were recorded during the prior period, the reduction in the state income tax rate, and the impact of certain permanent differences on taxable income.
Liquidity and Capital Resources
Sources of Liquidity
Since 2012, we have financed our business primarily through existing cash on hand and cash flows from operations until 2014 when we completed an initial public offering.
On November 14, 2014, we closed on our initial public offering (“IPO”) of 3,000,000 shares of common stock at a price to the public of $6.50 per share. As a result of the IPO, we received aggregate net proceeds, after deducting underwriting discounts, commissions and other offering expenses, of approximately $17,065,000. On November 18, 2014, our underwriters exercised their option to purchase 450,000 additional shares of common stock to cover over-allotments, pursuant to which we received aggregate net proceeds of approximately $2,710,000, after deducting underwriting discounts, commissions and expenses.
We intend to use a significant amount of the net proceeds from our initial public offering for the development of company-owned clinics. We may accomplish this by developing new clinics, by repurchasing existing franchises or by acquiring existing chiropractic practices. In addition, we may use proceeds from our IPO to repurchase existing regional developer licenses. Other than to pursue this growth strategy, we have not allocated a specific amount of our net proceeds from our initial public offering to any particular purpose. The net proceeds we actually expend for the development of company-owned clinics and the acquisition of additional franchises or regional developer licenses may vary significantly depending on a number of factors, including the timing of our identification and leasing of suitable sites for company-owned clinics and, in respect of the acquisition of franchises or regional developer licenses, our ability to enter into a binding acquisition agreement on favorable terms and the negotiated purchase price. In addition, the net proceeds we actually expend for general corporate purposes may vary significantly depending on a number of factors, including future revenue growth and our cash flows. As a result, we will retain broad discretion over the allocation of the net proceeds from our initial public offering. Pending use of the net proceeds from our initial public offering, we are holding the net proceeds in cash or investments in short-term, investment-grade securities.
On December 31, 2014, we completed our repurchase of six franchises in Los Angeles County, California and in a separate transaction, on January 1, 2015, we completed our reacquisition and termination of the regional developer rights for the Los Angeles County, California region. The total consideration for the December 31, 2014 transaction and the January 1, 2015 transaction was $1,407,500, which was funded from the proceeds of our recent IPO.
As of December 31, 2014, we had cash and short-term bank deposits of $20,796,783.
Analysis of Cash Flows
Net cash (used in) provided by operating activities decreased by $859,662 or 204%, to ($437,445) for the year ended December 31, 2014, compared to $422,217 for the year ended December 31, 2013. The decrease in cash provided by operating activities was attributable primarily to increased expenses caused by the addition of senior level and support staff and changes in net working capital and other adjustments.
36
Net cash used in investing activities was $2,060,126 and $231,059 during the years ended December 31, 2014, and 2013, respectively. For the year ended December 31, 2014, this includes the payment of $900,000 for the acquisition of six franchised clinics and advances of $507,500 for reacquisition and termination of regional developer rights which closed on January 1, 2015, investments in property and equipment of $659,305 primarily related to leasehold improvements and furniture for our corporate office space, proceeds of $2,500 received from the sale of property and equipment and payments received on notes receivable of $4,179. For the year ended December 31, 2013, this includes investments in property and equipment of $241,412 and payments received on notes receivable of $10,353.
Net cash provided by (used in) financing activities was $19,777,604 and $(240,000) during the years ended December 31, 2014 and 2013, respectively. For the year ended December 31, 2014, this includes proceeds of $22,425,000 from issuance of common stock in our initial public offering and $2,647,396 of offering costs paid. For the year ended December 31, 2013, this includes $240,000 for the purchase of treasury stock.
Recent Accounting Pronouncements
In May 2014, the FASB issued Accounting Standards Update No. 2014-09, Revenue from Contracts with Customers (ASU 2014-09), which supersedes nearly all existing revenue recognition guidance under U.S. GAAP. The core principle of ASU 2014-09 is to recognize revenues when promised goods or services are transferred to customers in an amount that reflects the consideration to which an entity expects to be entitled for those goods or services. ASU 2014-09 defines a five step process to achieve this core principle, and in doing so, more judgment and estimates may be required within the revenue recognition process than are required under existing U.S. GAAP. The standard is effective for annual periods beginning after December 15, 2016, and interim periods therein, using either of the following transition methods: (i) a full retrospective approach reflecting the application of the standard in each prior reporting period with the option to elect certain practical expedients, or (ii) a retrospective approach with the cumulative effect of initially adopting ASU 2014-09 recognized at the date of adoption (which includes additional footnote disclosures). We are currently evaluating the impact of our pending adoption of ASU 2014-09 on our consolidated financial statements.
In August 2014, the FASB issued ASU No. 2014-15, "Presentation of Financial Statements - Going Concern: Disclosures about an Entity’s Ability to Continue as a Going Concern." The new standard requires management to perform interim and annual assessments of an entity’s ability to continue as a going concern within one year of the date the financial statements are issued. An entity must provide certain disclosures if conditions or events raise substantial doubt about the entity’s ability to continue as a going concern. The new guidance is effective for annual periods ending after December 15, 2016, and interim periods thereafter. We are currently evaluating the impact of the adoption of ASU No. 2014-15 on our consolidated financial statements.
Contractual Obligations and Risk
The following table summarizes our contractual obligations at December 31, 2014 and the effect that such obligations are expected to have on our liquidity and cash flows in future periods:
|
2015
|
$ | 444,746 | ||
|
2016
|
465,404 | |||
|
2017
|
440,212 | |||
|
2018
|
293,812 | |||
|
2019
|
154,055 | |||
|
Thereafter
|
- | |||
| $ | 1,798,229 |
Off-Balance Sheet Arrangements
During the year ended December 31, 2014, we did not have any relationships with unconsolidated organizations or financial partnerships, such as structured finance or special purpose entities that would have been established for the purpose of facilitating off-balance sheet arrangements.
37
Not required for smaller reporting companies.
38
INDEX TO CONSOLIDATED FINANCIAL STATEMENTS
|
Page
|
|
|
The Joint Corp.
|
|
39
Report
of Independent Registered Public Accounting Firm
To the Board of Directors and Stockholders of
The Joint Corp. and Subsidiary
Scottsdale, Arizona
We have audited the accompanying consolidated balance sheets of The Joint Corp. and Subsidiary (the “Company”) as of December 31, 2014 and 2013 and the related consolidated statements of operations, stockholders’ equity (deficit), and cash flows for the years then ended. These financial statements are the responsibility of the Company’s management. Our responsibility is to express an opinion on these financial statements based on our audits.
We conducted our audits in accordance with the standards of the Public Company Accounting Oversight Board (United States). Those standards require that we plan and perform the audit to obtain reasonable assurance about whether the financial statements are free of material misstatement. The Company is not required to have, nor were we engaged to perform, an audit of its internal control over financial reporting. Our audits included consideration of internal control over financial reporting as a basis for designing audit procedures that are appropriate in the circumstances, but not for the purpose of expressing an opinion on the effectiveness of the Company’s internal control over financial reporting. Accordingly, we express no such opinion. An audit also includes examining, on a test basis, evidence supporting the amounts and disclosures in the financial statements, assessing the accounting principles used and significant estimates made by management, as well as evaluating the overall financial statement presentation. We believe that our audits provide a reasonable basis for our opinion.
In our opinion, the consolidated financial statements referred to above present fairly, in all material respects, the financial position of The Joint Corp. and Subsidiary as of December 31, 2014 and 2013, and the results of its operations and its cash flows for the years then ended, in conformity with accounting principles generally accepted in the United States of America.
/s/ EKS&H LLLP
Denver, Colorado
March 20, 2015
40
THE
JOINT CORP. AND SUBSIDIARY
CONSOLIDATED BALANCE SHEETS
|
December 31,
2014
|
December 31,
2013
|
|||||||
|
ASSETS
|
||||||||
|
Current assets:
|
||||||||
|
Cash and cash equivalents
|
$ | 20,796,783 | $ | 3,516,750 | ||||
|
Restricted cash
|
224,576 | 58,786 | ||||||
|
Accounts receivable, net
|
704,905 | 394,655 | ||||||
|
Income taxes receivable
|
395,814 | - | ||||||
|
Note receivable - current portion
|
27,528 | 25,929 | ||||||
|
Deferred franchise costs - current portion
|
668,700 | 939,750 | ||||||
|
Deferred tax asset - current portion
|
208,800 | 701,200 | ||||||
|
Prepaid expenses and other current assets
|
375,925 | 23,729 | ||||||
|
Total current assets
|
23,403,031 | 5,660,799 | ||||||
|
Property and equipment, net
|
1,134,452 | 400,267 | ||||||
|
Note receivable
|
31,741 | 59,269 | ||||||
|
Note receivable - related party, net of allowance
|
- | 21,750 | ||||||
|
Deferred franchise costs, net of current portion
|
2,574,450 | 2,283,000 | ||||||
|
Deferred tax asset - noncurrent
|
- | 1,265,700 | ||||||
|
Intangible assets
|
153,000 | - | ||||||
|
Goodwill
|
677,204 | - | ||||||
|
Deposits and other assets
|
585,150 | 77,650 | ||||||
|
Total assets
|
$ | 28,559,028 | $ | 9,768,435 | ||||
|
LIABILITIES AND STOCKHOLDERS' EQUITY (DEFICIT)
|
||||||||
|
Current liabilities:
|
||||||||
|
Accounts payable and accrued expenses
|
$ | 1,271,405 | $ | 226,757 | ||||
|
Co-op funds liability
|
186,604 | 54,133 | ||||||
|
Payroll liabilities
|
617,944 | 128,370 | ||||||
|
Advertising fund deferred revenue
|
- | 4,652 | ||||||
|
Income taxes payable
|
- | 419,297 | ||||||
|
Deferred rent - current portion
|
93,398 | - | ||||||
|
Deferred revenue - current portion
|
2,044,500 | 2,756,250 | ||||||
|
Other current liabilities
|
50,735 | - | ||||||
|
Total current liabilities
|
4,264,586 | 3,589,459 | ||||||
|
Deferred rent, net of current portion
|
451,766 | - | ||||||
|
Deferred revenue, net of current portion
|
7,915,918 | 7,252,084 | ||||||
|
Other liabilities
|
299,405 | 147,753 | ||||||
|
Total liabilities
|
12,931,675 | 10,989,296 | ||||||
|
Commitment and contingencies
|
||||||||
|
Stockholders' equity (deficit):
|
||||||||
|
Series A preferred stock, $0.001 par value; 50,000
shares authorized, 0 issued and outstanding, as of December 31, 2014, and 25,000 issued and outstanding as of December 31, 2013
|
- | 25 | ||||||
|
Common stock, $0.001 par value; 20,000,000 shares
authorized, 10,196,502 shares issued and 9,662,502 shares outstanding as of December 31, 2014 and 5,340,000 shares issued and 4,806,000 outstanding as of December 31, 2013
|
10,197 | 5,340 | ||||||
|
Additional paid-in capital
|
21,420,975 | 1,546,373 | ||||||
|
Treasury stock (534,000 shares, at cost)
|
(791,638 | ) | (791,638 | ) | ||||
|
Accumulated deficit
|
(5,012,181 | ) | (1,980,961 | ) | ||||
|
Total stockholders' equity (deficit)
|
15,627,353 | (1,220,861 | ) | |||||
|
Total liabilties and stockholders' equity (deficit)
|
$ | 28,559,028 | $ | 9,768,435 | ||||
The accompanying notes are an integral part of these consolidated financial statements.
41
THE
JOINT CORP. AND SUBSIDIARY
CONSOLIDATED STATEMENT OF OPERATIONS
|
Year Ended
December 31,
|
||||||||
|
2014
|
2013
|
|||||||
|
Revenues:
|
||||||||
|
Royalty fees
|
$ | 3,194,286 | $ | 1,531,201 | ||||
|
Franchise fees
|
1,933,500 | 2,536,333 | ||||||
|
Regional developer fees
|
478,500 | 742,875 | ||||||
|
IT related income and software fees
|
840,825 | 762,867 | ||||||
|
Advertising fund revenue
|
459,493 | 216,784 | ||||||
|
Other income
|
210,058 | 168,007 | ||||||
|
Total revenues
|
7,116,662 | 5,958,067 | ||||||
|
Cost of revenues:
|
||||||||
|
Franchise cost of revenues
|
2,081,382 | 1,781,477 | ||||||
|
IT cost of revenues
|
165,057 | 224,719 | ||||||
|
Total cost of revenues
|
2,246,439 | 2,006,196 | ||||||
|
Selling and marketing expenses
|
1,188,016 | 781,256 | ||||||
|
Depreciation and amortization
|
210,123 | 70,725 | ||||||
|
General and administrative expenses
|
5,098,793 | 2,660,101 | ||||||
|
Total selling, general and administrative expenses
|
6,496,932 | 3,512,082 | ||||||
|
Income (loss) from operations
|
(1,626,709 | ) | 439,789 | |||||
|
Other expense
|
(64,075 | ) | (32,000 | ) | ||||
|
Income (loss) before income tax provision
|
(1,690,784 | ) | 407,789 | |||||
|
Income tax provision
|
(1,340,436 | ) | (252,154 | ) | ||||
|
Net income (loss)
|
$ | (3,031,220 | ) | $ | 155,635 | |||
|
Earnings per share:
|
||||||||
|
Basic earnings (loss) per share
|
$ | (0.56 | ) | $ | 0.03 | |||
|
Diluted earnings (loss) per share
|
$ | (0.56 | ) | $ | 0.02 | |||
The accompanying notes are an integral part of these consolidated financial statements.
42
THE
JOINT CORP. AND SUBSIDIARY
CONSOLIDATED STATEMENTS OF CHANGES IN STOCKHOLDERS’ EQUITY (DEFICIT)
|
Additional
|
||||||||||||||||||||||||||||||||
|
Preferred Stock
|
Common Stock
|
Paid In
|
Treasury
|
Accumulated
|
||||||||||||||||||||||||||||
|
Shares
|
Amount
|
Shares
|
Amount
|
Capital
|
Stock
|
Deficit
|
Total
|
|||||||||||||||||||||||||
|
Balances, December 31, 2012
|
25,000 | $ | 25 | 5,340,000 | $ | 5,340 | $ | 994,735 | $ | - | $ | (2,136,596 | ) | $ | (1,136,496 | ) | ||||||||||||||||
|
Purchase of treasury stock
|
- | - | 551,638 | (791,638 | ) | - | (240,000 | ) | ||||||||||||||||||||||||
|
Net income
|
- | - | - | - | 155,635 | 155,635 | ||||||||||||||||||||||||||
|
Balances, December 31, 2013
|
25,000 | 25 | 5,340,000 | 5,340 | 1,546,373 | (791,638 | ) | (1,980,961 | ) | (1,220,861 | ) | |||||||||||||||||||||
|
Stock-based compensation expense
|
- | - | - | - | 101,830 | - | - | 101,830 | ||||||||||||||||||||||||
|
Issuance of common stock - IPO, net of offering costs of $2,761,325
|
- | - | 3,450,000 | 3,450 | 19,774,154 | - | - | 19,777,604 | ||||||||||||||||||||||||
|
Issuance of vested restricted stock
|
- | - | 71,502 | 72 | (72 | ) | - | - | - | |||||||||||||||||||||||
|
Conversion of preferred stock to common stock
|
(25,000 | ) | (25 | ) | 1,335,000 | 1,335 | (1,310 | ) | - | - | - | |||||||||||||||||||||
|
Net loss
|
- | - | - | - | - | - | (3,031,220 | ) | (3,031,220 | ) | ||||||||||||||||||||||
|
Balances, December 31, 2014
|
- | $ | - | 10,196,502 | $ | 10,197 | $ | 21,420,975 | $ | (791,638 | ) | $ | (5,012,181 | ) | $ | 15,627,353 | ||||||||||||||||
The accompanying notes are an integral part of these consolidated financial statements.
43
THE
JOINT CORP. AND SUBSIDIARY
CONSOLIDATED STATEMENTS OF CASH FLOWS
|
Year Ended
December 31,
|
||||||||
|
2014
|
2013
|
|||||||
|
Cash flows from operating activities:
|
||||||||
|
Net (loss) income
|
$ | (3,031,220 | ) | $ | 155,635 | |||
|
Adjustments to reconcile net (loss) income to net cash
provided by operating activities:
|
||||||||
|
Provision for bad debts
|
102,782 | - | ||||||
|
Depreciation and amortization
|
210,123 | 70,725 | ||||||
|
Loss on disposal of property and equipment
|
10,127 | - | ||||||
|
Deferred income taxes
|
1,758,100 | (552,300 | ) | |||||
|
Accrued interest on notes receivable
|
- | (5,551 | ) | |||||
|
Stock based compensation expense
|
101,830 | - | ||||||
|
Changes in operating assets and liabilties:
|
||||||||
|
Restricted cash
|
(165,790 | ) | 17,290 | |||||
|
Accounts receivable
|
(369,532 | ) | (287,757 | ) | ||||
|
Income taxes receivable
|
(395,814 | ) | - | |||||
|
Prepaid income taxes
|
- | 300,000 | ||||||
|
Prepaid expenses and other current assets
|
(352,196 | ) | 47,069 | |||||
|
Deferred franchise costs
|
(20,400 | ) | (14,850 | ) | ||||
|
Deposits and other assets
|
- | (60,686 | ) | |||||
|
Accounts payable and accrued expenses
|
1,044,648 | 125,394 | ||||||
|
Co-op funds liability
|
132,471 | 9,359 | ||||||
|
Payroll liabilities
|
489,574 | 58,046 | ||||||
|
Advertising fund deferred revenue
|
(4,652 | ) | (26,650 | ) | ||||
|
Other liabilities
|
(25,447 | ) | 108,029 | |||||
|
Deferred rent
|
545,164 | - | ||||||
|
Income taxes payable
|
(419,297 | ) | 419,297 | |||||
|
Deferred revenue
|
(47,916 | ) | 59,167 | |||||
|
Net cash (used in) provided by operating activities
|
(437,445 | ) | 422,217 | |||||
|
Cash flows from investing activities:
|
||||||||
|
Acquisition of business, net of cash acquired
|
(900,000 | ) | - | |||||
|
Advances for reacquisition and termination of regional developer rights
|
(507,500 | ) | - | |||||
|
Purchase of property and equipment
|
(659,305 | ) | (241,412 | ) | ||||
|
Proceeds from sale of equipment
|
2,500 | - | ||||||
|
Payments received on notes receivable
|
4,179 | 10,353 | ||||||
|
Net cash used in investing activities
|
(2,060,126 | ) | (231,059 | ) | ||||
|
Cash flows from financing activities:
|
||||||||
|
Proceeds from issuance of common stock - initial public offering
|
22,425,000 | - | ||||||
|
Offering costs paid
|
(2,647,396 | ) | - | |||||
|
Purchase of treasury stock
|
- | (240,000 | ) | |||||
|
Net cash provided by (used in) financing activities
|
19,777,604 | (240,000 | ) | |||||
|
Net increase (decrease) in cash
|
17,280,033 | (48,842 | ) | |||||
|
Cash at beginning of year
|
3,516,750 | 3,565,592 | ||||||
|
Cash at end of year
|
$ | 20,796,783 | $ | 3,516,750 | ||||
|
Supplemental cash flow disclosures:
|
||||||||
|
Cash paid for income taxes
|
$ | 420,250 | $ | - | ||||
|
Non-cash financing and investing activities:
|
||||||||
|
Warrants issued for services in connection with initial public offering
|
$ | 113,929 | $ | - | ||||
|
Conversion of preferred stock to common stock
|
$ | 25 | $ | - | ||||
The accompanying notes are an integral part of these consolidated financial statements.
44
THE
JOINT CORP. AND SUBSIDIARY
NOTES TO CONSOLIDATED FINANCIAL STATEMENTS
Nature of Operations
The Joint Corp. (“The Joint”), a Delaware corporation, was formed on March 10, 2010, for the purpose of franchising chiropractic clinics, selling regional developer rights and supporting the operations of franchised chiropractic clinics at locations throughout the United States of America. The franchising of chiropractic clinics is regulated by the Federal Trade Commission and various state authorities.
The Joint Corporate Unit No. 1, LLC (“Clinic”), an Arizona limited liability company, was formed on July 14, 2010, for the purpose of operating chiropractic clinics in the state of Arizona. It operated one company-owned clinic the assets of which were sold on July 1, 2012. All remaining account balances were consolidated with The Joint as of December 31, 2012.
We completed our initial public offering of 3,000,000 shares of common stock at a price to the public of $6.50 per share on November 14, 2014, whereupon we received aggregate net proceeds of approximately $17,065,000 after deducting underwriting discounts, commissions and other offering expenses. Our underwriters exercised their option to purchase 450,000 additional shares of common stock to cover over-allotments on November 18, 2014, pursuant to which we received aggregate net proceeds of approximately $2,710,000, after deducting underwriting discounts, commissions and expenses. Also, in conjunction with the IPO, we issued warrants to the underwriters for the purchase of 90,000 shares of common stock, which can be exercised between November 10, 2015 and November 10, 2018 at an exercise price of $8.125 per share.
The following table summarizes the number of clinics in operation for years ended December 31, 2014 and 2013.
|
Year Ended
December 31,
|
||||||||
|
2014
|
2013
|
|||||||
|
Clinics open at beginning of period
|
175 | 82 | ||||||
|
Clinics opened during the period
|
73 | 93 | ||||||
|
Clinics closed during the period
|
(2 | ) | - | |||||
|
Clinics in operation at the end of the period
|
246 | 175 | ||||||
|
Clinics sold but not yet operational
|
268 | 223 | ||||||
Principles of Consolidation
The accompanying consolidated financial statements include the accounts of The Joint Corp. and its wholly owned subsidiary, The Joint Corporate Unit No. 1, LLC (collectively, the “Company”).
All significant intercompany accounts and transactions between The Joint Corp. and its subsidiary have been eliminated in consolidation.
Cash and Cash Equivalents
We consider all highly liquid instruments purchased with an original maturity of three months or less to be cash. We continually monitor our positions with, and credit quality of, the financial institutions with which we invest. As of the balance sheet date and periodically throughout the year, we have maintained balances in various operating accounts in excess of federally insured limits. We have invested substantially all of the proceeds of our IPO in short-term bank deposits. We had no cash equivalents as of December 31, 2014 and 2013.
45
Restricted Cash
Restricted cash held by the Company relates to cash franchisees are required to contribute to our National Marketing Fund and cash franchisees provide to various voluntary regional Co-Op Marketing Funds. Cash contributed to the National Marketing Fund is to be used in accordance with the Franchise Disclosure Document with a focus on regional and national marketing and advertising.
Concentrations of Credit Risk
In certain circumstances, we grant credit to franchisees related to the collection of initial franchise fees, royalties, and other operating revenues. We periodically perform credit analysis and monitor the financial condition of the franchisees to reduce credit risk. As of December 31, 2014 and 2013, six and two franchisees, respectfully, represented 56% and 54% of outstanding accounts receivable. We did not have any franchisees that represented greater than 10% of our revenues during the years ended December 31, 2014 and 2013.
Accounts Receivable
Accounts receivable represent amounts due from franchisees for initial franchise fees, royalty fees and marketing and advertising expenses. We consider a reserve for doubtful accounts based on the creditworthiness of the franchisee. The provision for uncollectible amounts is continually reviewed and adjusted to maintain the allowance at a level considered adequate to cover future losses. The allowance is management’s best estimate of uncollectible amounts and is determined based on specific identification and historical performance we track on an ongoing basis. The losses ultimately could differ materially in the near term from the amounts estimated in determining the allowance. We determined that an allowance for doubtful accounts was not necessary at December 31, 2013. As of December 31, 2014, we had an allowance for doubtful accounts of $81,032.
Deferred Franchise Costs
Deferred franchise costs represent commissions that are paid in conjunction with the sale of a franchise and are expensed when the respective revenue is recognized, which is generally upon the opening of a clinic.
Property and Equipment
Property and equipment are stated at cost. Depreciation is computed using the straight-line method over the estimated useful lives of three to seven years. Leasehold improvements are amortized using the straight-line method over the shorter of the lease term or the estimated useful life of the assets.
Maintenance and repairs are charged to expense as incurred; major renewals and improvements are capitalized. When items of property or equipment are sold or retired, the related cost and accumulated depreciation are removed from the accounts and any gain or loss is included in other income.
Software Developed
We capitalize most software development costs. These capitalized costs are primarily related to proprietary software used by clinics for operations and the Company for management of operations. Costs incurred in the preliminary stages of development are expensed as incurred. Once an application has reached the development stage, internal and external costs, if direct and incremental, are capitalized as assets in progress until the software is substantially complete and ready for its intended use. Capitalization ceases upon completion of all substantial testing. We also capitalize costs related to specific upgrades and enhancements when it is probable the expenditures will result in additional functionality. Software developed is recorded as part of property and equipment. Maintenance and training costs are expensed as incurred. Internal use software is amortized on a straight line basis over its estimated useful life, generally 5 years.
46
Intangible Assets
Intangible assets consist primarily of re-acquired franchise rights, and customer relationships. We amortize the fair value of re-acquired franchise rights over the remaining contractual terms of the re-acquired franchise rights at the time of the acquisition, which was 7 years. The fair value of customer relationships is amortized over their estimated useful life of 2 years.
Goodwill
As of December 31, 2014, we had recorded goodwill of $677,204. Goodwill consists of the excess of the purchase price over the fair value of tangible and identifiable intangible net assets acquired in the acquisition of six franchises on December 31, 2014 (See Note 2). Under FASB ASC 350-10, goodwill and intangible assets deemed to have indefinite lives are no longer amortized but are subject to annual impairment tests, and tests between annual tests in certain circumstances, based on estimated fair value in accordance with FASB ASC 350-10, and written down when impaired.
Long-Lived Assets
We review our long-lived assets for impairment whenever events or changes in circumstances indicate that the carrying amount of the asset may not be recovered. We look primarily to undiscounted future cash flows in our assessment of whether or not long-lived assets have been impaired. No impairments of long-lived assets were recorded for the years ended December 31, 2014 and 2013.
Advertising Fund
We have established an advertising fund for national/regional marketing and advertising of services offered by the clinics owned by the franchisees. As stipulated in the typical franchise agreement, a franchisee, in addition to the monthly royalty fee, pays a monthly marketing fee of 1% of gross sales, which increased at our discretion to 2% in January 2015. We segregate the marketing funds collected and use the funds for specific purposes as outlined in the Franchise Disclosure Document. These funds are included in restricted cash on our consolidated balance sheet. As amounts are expended from the fund, we recognize advertising fund revenue and a related expense. Amounts collected in excess of marketing expenditures are included in restricted cash on our consolidated balance sheets.
Co-Op Marketing Funds
Some franchises have established regional Co-Ops for advertising within their local and regional markets. We maintain an agency relationship under which the marketing funds collected are segregated and used for the purposes specified by the Co-Ops officers. The marketing funds are included in restricted cash on our consolidated balance sheets.
Deferred Rent
The Company leases its office space and company-owned clinics under operating leases, which may include rent holidays and rent escalation clauses. The Company recognizes rent holiday periods and scheduled rent increases on a straight-line basis over the term of the lease. The Company records tenant improvement allowances as deferred rent liabilities and amortizes the allowance over the term of the lease, as a reduction to rent expense.
Revenue Recognition
We generate revenue through initial franchise fees, regional developer fees, transfer fees, royalties, IT related income, and computer software fees.
Initial Franchise Fees.
We require the entire non-refundable initial franchise fee to be paid upon execution of a franchise agreement, which has an initial term of ten years. Initial franchise fees are recognized as revenue when we have substantially completed our initial services under the franchise agreement, which typically occurs upon opening of the clinic. Our services under the franchise agreement include: training of franchisee and staff, site selection, construction/vendor management and ongoing operations support. We provide no financing to franchisees or offer guarantees on their behalf.
47
Regional Developer Fees.
During 2011, we established a regional developer program to engage independent contractors to assist in developing specified geographical regions. Under this program, regional developers pay a license fee of 25% of the then current franchise fee for each franchise they receive the right to develop within a specified geographical region. Each regional developer agreement establishes a minimum number of franchises that the regional developer must develop. Regional developers receive 50% of franchise fees collected upon the sale of franchises within their region and a royalty of 3% of sales generated by franchised clinics in their region. Regional developer fees are non-refundable and are recognized as revenue when we have performed substantially all initial services required by the regional developer agreement, which generally is considered to be upon the opening of each franchised clinic. Upon the execution of a regional developer agreement, we estimate the number of franchised clinics to be opened, which is typically consistent with the contracted minimum. When we anticipate that the number of franchised clinics to be opened will exceed the contracted minimum, the license fee on a per-clinic basis is determined by dividing the total fee collected from the regional developer by the number of clinics expected to be opened within the region. Certain regional developer agreements provide that no additional fee is required for franchises developed by the regional developer above the contracted minimum, while other regional developer agreements require a supplemental payment. We reassess the number of clinics expected to be opened as the regional developer performs under its regional developer agreement. When a material change to the original estimate becomes apparent, the fee per clinic is revised on a prospective basis, and the unrecognized fees are allocated among, and recognized as revenue upon the opening of, the remaining unopened franchised clinics within the region. The franchisor’s services under regional developer agreements include site selection, grand opening support for two clinics, sales support for identification of qualified franchisees, general operational support and marketing support to advertise for ownership opportunities. Several of our regional developer agreements grant us the option to repurchase the regional developer’s license.
Royalties.
We collect royalties, as stipulated in the franchise agreement, equal to 7% of gross sales, and a marketing and advertising fee currently of 1% of gross sales. Certain franchisees with franchise agreements acquired during the formation of the Company pay a monthly flat fee. Royalties are recognized as revenue when earned. Royalties are collected bi-monthly two working days after each sales period has ended.
IT Related Income and Software Fees.
We collect a monthly computer software fee for use of our proprietary chiropractic software, computer support, and internet services support, which was made available to all clinics in April 2012. These fees are recognized on a monthly basis as services are provided. IT related revenue represents a flat fee to purchase a clinic’s computer equipment, operating software, preinstalled chiropractic system software, key card scanner (patient identification card), credit card scanner and credit card receipt printer. These fees are recognized as revenue upon receipt of equipment by the franchisee.
Advertising Costs
We incur advertising costs in addition to those included in the advertising fund. Our policy is to expense all operating advertising costs as incurred. Advertising expenses for years ended December 31, 2014 and 2013 were $145,492 and $323,219, respectively.
Income Taxes
We account for income taxes in accordance with the Accounting Standards Codification that requires the recognition of deferred income taxes for differences between the basis of assets and liabilities for financial statement and income tax purposes. The differences relate principally to depreciation of property and equipment and treatment of revenue for franchise fees and regional developer fees collected. Deferred tax assets and liabilities represent the future tax consequence for those differences, which will either be taxable or deductible when the assets and liabilities are recovered or settled. Deferred taxes are also recognized for operating losses that are available to offset future taxable income. Valuation allowances are established when necessary to reduce deferred tax assets to the amount expected to be realized.
We account for uncertainty in income taxes by recognizing the tax benefit or expense from an uncertain tax position only if it is more likely than not that the tax position will be sustained upon examination by the taxing authorities, based on the technical merits of the position. We measure the tax benefits and expenses recognized in the consolidated financial statements from such a position based on the largest benefit that has a greater than 50% likelihood of being realized upon ultimate resolution.
48
For the year ended December 31, 2014 and, 2013, we recorded a liability for income taxes for operations and uncertain tax positions of approximately $122,000 and $148,000, respectively, of which $30,000 and $33,000 respectively, represent penalties and interest and recorded in the “other liabilities” section of the accompanying consolidated balance sheets. Interest and penalties associated with tax positions are recorded in the period assessed as general and administrative expenses. Our tax returns for tax years subject to examination by tax authorities include 2010 and 2011 through the current period for state and federal reporting purposes, respectively.
Earnings (Loss) per Common Share
Basic earnings (loss) per common share is computed by dividing the net earnings (loss) by the weighted-average number of common shares outstanding during the period. Diluted earnings (loss) per common share is computed by giving effect to all potentially dilutive common shares including preferred stock, restricted stock, and stock options.
|
Year Ended
December 31,
|
||||||||
|
2014
|
2013
|
|||||||
|
Net income (loss)
|
$ | (3,031,220 | ) | $ | 155,635 | |||
|
Weighted average common shares outstanding - basic
|
5,451,851 | 5,313,665 | ||||||
|
Effect of dilutive securities:
|
||||||||
|
Stock options
|
- | 21,732 | ||||||
|
Shares issuable on conversion of preferred stock
|
- | 1,335,000 | ||||||
|
Weighted average common shares outstanding - diluted
|
5,451,851 | 6,670,397 | ||||||
|
Basic earnings per share
|
$ | (0.56 | ) | $ | 0.03 | |||
|
Diluted earnings per share
|
$ | (0.56 | ) | $ | 0.02 | |||
The following table summarizes the potential shares of common stock that were excluded from diluted net loss per share, because the effect of including these potential shares was anti-dilutive:
|
Year Ended
December 31,
|
||||||||
|
2014
|
2013
|
|||||||
|
Unvested restricted stock
|
590,873 | - | ||||||
|
Stock options
|
312,995 | - | ||||||
|
Warrants
|
90,000 | - | ||||||
Stock-Based Compensation
We account for share based payments by recognizing compensation expense based upon the estimated fair value of the awards on the date of grant. We determined the estimated grant-date fair value of restricted shares using quoted market prices and the grant-date fair value of stock options using the Black-Scholes option pricing model and recognize compensation costs ratably over the period of service using the straight-line method.
Use of Estimates
The preparation of the consolidated financial statements in conformity with accounting principles generally accepted in the United States of America requires management to make estimates and assumptions that affect the amounts reported in the consolidated financial statements and accompanying notes. Actual results could differ from those estimates. Items subject to significant estimates and assumptions include the allowance for doubtful accounts, share-based compensation arrangements, fair value of stock options, useful lives and realizability of long-lived assets, classification of deferred revenue and deferred franchise costs and the related deferred tax assets and liabilities as long-term or current, uncertain tax positions and realizability of deferred tax assets.
49
Recent Accounting Pronouncements
In May 2014, the FASB issued Accounting Standards Update No. 2014-09, Revenue from Contracts with Customers (ASU 2014-09), which supersedes nearly all existing revenue recognition guidance under U.S. GAAP. The core principle of ASU 2014-09 is to recognize revenues when promised goods or services are transferred to customers in an amount that reflects the consideration to which an entity expects to be entitled for those goods or services. ASU 2014-09 defines a five step process to achieve this core principle, and in doing so, more judgment and estimates may be required within the revenue recognition process than are required under existing U.S. GAAP. The standard is effective for annual periods beginning after December 15, 2016, and interim periods therein, using either of the following transition methods: (i) a full retrospective approach reflecting the application of the standard in each prior reporting period with the option to elect certain practical expedients, or (ii) a retrospective approach with the cumulative effect of initially adopting ASU 2014-09 recognized at the date of adoption (which includes additional footnote disclosures). We are currently evaluating the impact of our pending adoption of ASU 2014-09 on our consolidated financial statements.
In August 2014, the FASB issued ASU No. 2014-15, "Presentation of Financial Statements - Going Concern: Disclosures about an Entity’s Ability to Continue as a Going Concern." The new standard requires management to perform interim and annual assessments of an entity’s ability to continue as a going concern within one year of the date the financial statements are issued. An entity must provide certain disclosures if conditions or events raise substantial doubt about the entity’s ability to continue as a going concern. The new guidance is effective for annual periods ending after December 15, 2016, and interim periods thereafter. We are currently evaluating the impact of the adoption of ASU No. 2014-15 on our consolidated financial statements.
Los Angeles County Acquisition of Franchise Units
On December 31, 2014, we acquired substantially all the assets and certain liabilities of six franchises held by The Joint RRC Corp. including four operating clinics in Los Angeles County for a purchase price of $900,000 which was paid in cash on December 31, 2014. We intend to operate four of the acquired franchises as company-owned clinics and to relocate two remaining franchises. As we acquired the clinics effective December 31, 2014, the Consolidated Statements of Comprehensive Operations do not include any post-acquisition results of operations.
The purchase price allocation for these acquisitions is preliminary and subject to further adjustment upon finalization of the opening balance sheet. The following summarizes the fair values of the assets acquired and liabilities assumed as of the acquisition date:
|
Property and equipment
|
$ | 297,630 | ||
|
Intangible assets
|
153,000 | |||
|
Goodwill
|
677,204 | |||
|
Total assets acquired
|
1,127,834 | |||
|
Unfavorable leases
|
(227,834 | ) | ||
|
Net assets acquired
|
$ | 900,000 |
Intangible assets consist of reacquired franchise rights of $81,000 and customer relationships of $72,000 and will be amortized over their estimated useful lives of seven years and two years, respectively.
Unfavorable leases consist of leases with rents that are in excess of market value. This liability will be amortized over the lives of the associated leases.
Goodwill recorded in connection with this acquisition was attributable to the workforce of the clinics and synergies expected to arise from cost savings opportunities. All of the recorded goodwill is tax-deductible.
The supplemental pro forma information set forth in the following table has been prepared for comparative purposes and does not purport to be indicative of what would have occurred had the acquisition been made on January 1, 2013, nor is it indicative of any future results. The pro forma information does not give effect to any potential revenue enhancements or operating efficiencies that could result from the acquisition.
50
|
Pro Forma for the Year Ended
|
||||||||
|
December 31,
2014
|
December 31,
2013
|
|||||||
|
Revenues, net
|
$ | 7,306,565 | $ | 5,879,654 | ||||
|
Net loss
|
$ | (3,927,259 | ) | $ | (374,932 | ) | ||
The pro forma amounts included in the table above reflect the application of our accounting policies and adjustment of the results of the clinics to reflect the additional depreciation and amortization that would have been charged assuming the fair value adjustments to property and equipment and intangible assets had been applied from January 1, 2013, together with the consequential tax impacts.
Effective July 2012, we sold the assets of our company-owned clinic, including the equipment and customer base, in exchange for a $90,000 promissory note. The note bears interest at 6% per annum for fifty-four months and requires monthly principal and interest payments over forty-two months, beginning August 2013 and maturing January 2017. The outstanding balance on the note as of December 31, 2014 and 2013 was $59,269 and $85,198, respectively and is uncollateralized.
Note Receivable — Related Party
Effective October 2012, a stockholder and former director of the Company transferred ownership in his clinic to a third party. In connection with this transaction we assessed a contractual transfer fee of $21,750 and accepted the promissory note as payment. The note has not been formalized with terms, including interest rate or payment schedules and, accordingly, is presented as a long-term note receivable in the accompanying consolidated balance sheets. Due to the uncertainty surrounding the collectability of the note, we reserved the note in full as of December 31, 2014.
Property and equipment consist of the following:
|
December 31,
|
December 31,
|
|||||||
|
2014
|
2013
|
|||||||
|
Office and computer equipment
|
$ | 209,575 | $ | 28,817 | ||||
|
Leasehold improvements
|
665,961 | - | ||||||
|
Software developed
|
564,560 | 379,415 | ||||||
| 1,440,096 | 408,232 | |||||||
|
Accumulated depreciation and amortization
|
(305,644 | ) | (117,047 | ) | ||||
| 1,134,452 | 291,185 | |||||||
|
Assets in progress
|
- | 109,082 | ||||||
| $ | 1,134,452 | $ | 400,267 | |||||
Depreciation and amortization expense was $210,123 and $70,725 for the years ended December 31, 2014 and 2013, respectively.
As of December 31, 2013, assets in progress include costs for signage, furniture and equipment related to our office relocation as well as software under development. These costs were transferred to the appropriate property and equipment category and commenced depreciation when the assets became ready for their intended use.
51
Our financial instruments include cash, restricted cash, accounts receivable, notes receivable, accounts payable and accrued expenses. The carrying amounts of our financial instruments approximate their fair value due to their short maturities.
We do not use derivative financial instruments to hedge exposures to cash-flow, market or foreign-currency risks.
Authoritative guidance defines fair value as the price that would be received to sell an asset or paid to transfer a liability (an exit price) in an orderly transaction between market participants at the measurement date. The guidance establishes a hierarchy for inputs used in measuring fair value that maximizes the use of observable inputs and minimizes the use of unobservable inputs by requiring that the most observable inputs be used when available. Observable inputs are inputs that market participants would use in pricing the asset or liability, developed based on market data obtained from sources independent of the Company. Unobservable inputs are inputs that reflect our assumptions of what market participants would use in pricing the asset or liability developed based on the best information available in the circumstances. The hierarchy is broken down into three levels based on reliability of the inputs as follows:
|
Level 1:
|
Observable inputs such as quoted prices in active markets;
|
|
Level 2:
|
Inputs, other than the quoted prices in active markets, that are observable either directly or indirectly; and
|
|
Level 3:
|
Unobservable inputs in which there is little or no market data, which require the reporting entity to develop its own assumptions.
|
As of December 31, 2014 and 2013, we do not have any financial instruments that are measured on a recurring basis as Level 1, 2 or 3.
Intangible assets consisted of the following:
|
December 31, 2014
|
||||
|
Reacquired franchise rights
|
$ | 81,000 | ||
|
Customer relationships
|
72,000 | |||
|
Total intangible assets
|
$ | 153,000 | ||
All intangible assets relate to the acquisition that occurred on December 31, 2014 and, accordingly, there is no amortization expense for the year ended December 31, 2014.
Estimated amortization expense for 2015 and subsequent years is as follows:
|
2015
|
$ | 47,571 | ||
|
2016
|
47,571 | |||
|
2017
|
11,571 | |||
|
2018
|
11,571 | |||
|
2019
|
11,571 | |||
|
Thereafter
|
23,143 | |||
|
Total
|
$ | 153,000 |
Income tax provision reported in the consolidated statements of operations is comprised of the following:
52
|
December 31,
|
||||||||
|
2014
|
2013
|
|||||||
|
Current provision:
|
||||||||
|
Federal
|
$ | (388,864 | ) | $ | 583,558 | |||
|
State, net of state tax credits
|
(28,800 | ) | 220,896 | |||||
| (417,664 | ) | 804,454 | ||||||
|
Deferred provision:
|
||||||||
|
Federal
|
1,403,100 | (482,350 | ) | |||||
|
State
|
355,000 | (69,950 | ) | |||||
| 1,758,100 | (552,300 | ) | ||||||
|
Total income tax provision
|
$ | 1,340,436 | $ | 252,154 | ||||
The following are the components of our net deferred taxes for federal and state income taxes:
|
December 31,
|
||||||||
|
2014
|
2013
|
|||||||
|
Current deferred tax asset:
|
||||||||
|
Deferred revenue
|
$ | 776,100 | $ | 1,064,000 | ||||
|
Deferred franchise costs
|
(253,900 | ) | (362,800 | ) | ||||
|
Allowance for doubtful accounts
|
30,800 | - | ||||||
|
Accrued expenses
|
197,300 | - | ||||||
|
Restricted stock compensation
|
(60,700 | ) | - | |||||
|
Deferred rent
|
35,500 | - | ||||||
|
Charitable contribution carryover
|
400 | - | ||||||
| 725,500 | 701,200 | |||||||
|
Less valuation allowance
|
(516,700 | ) | - | |||||
|
Net current deferred tax asset
|
$ | 208,800 | $ | 701,200 | ||||
|
Non-current deferred tax asset:
|
||||||||
|
Deferred revenue
|
$ | 2,223,200 | $ | 1,825,700 | ||||
|
Deferred franchise costs
|
(679,000 | ) | (469,100 | ) | ||||
|
Restricted stock compensation
|
(170,600 | ) | - | |||||
|
Deferred rent
|
171,500 | - | ||||||
|
Net operating loss carryforwards
|
38,200 | - | ||||||
|
Asset basis difference related to property and equipment
|
(45,400 | ) | (90,900 | ) | ||||
| 1,537,900 | 1,265,700 | |||||||
|
Less valuation allowance
|
(1,537,900 | ) | - | |||||
|
Net non-current deferred tax asset
|
$ | - | $ | 1,265,700 | ||||
At December 31, 2014, we had state net operating losses of approximately $965,000. These net operating losses are available to offset future taxable income and will begin to expire in 2019.
The following is a reconciliation of the statutory federal income tax rate applied to pre-tax accounting net income (loss), compared to the income tax provision in the consolidated statement of operations:
53
|
For the Years Ended December 31,
|
||||||||||||||||
|
2014
|
2013
|
|||||||||||||||
|
Amount
|
Percent
|
Amount
|
Percent
|
|||||||||||||
|
Expected federal tax expense
|
$ | (574,900 | ) | (34.0 | )% | $ | 138,633 | 34.0 | % | |||||||
|
State tax provision, net of federal benefit
|
(72,500 | ) | (4.3 | ) | 18,774 | 4.6 | ||||||||||
|
Effect of increase in valuation allowance
|
2,054,600 | 121.5 | - | - | ||||||||||||
|
Non-deductible expenses
|
23,900 | 1.4 | 19,831 | 4.9 | ||||||||||||
|
Uncertain tax positions
|
(20,900 | ) | (1.2 | ) | 85,157 | 20.9 | ||||||||||
|
Effect of reduced state rates for deferred
|
33,000 | 2.0 | - | - | ||||||||||||
|
Other, net
|
(102,764 | ) | (6.0 | ) | (10,241 | ) | (2.5 | ) | ||||||||
| $ | 1,340,436 | 79.3 | % | $ | 252,154 | 61.8 | % | |||||||||
Our state tax expense, penalties and interest stem from uncertain tax positions related to unresolved state apportionment of taxable income.
Changes in our income tax expense related primarily to changes in pretax income during the year ended December 31, 2014, as compared to year ended December 31, 2013, and changes in the effective rate from 79.3% to 61.8%, respectively. The difference is due to a valuation allowance on our deferred tax assets, uncertain tax positions that were recorded during the prior period, the reduction in the state income tax rate, and the impact of certain permanent differences on taxable income.
For the year ended December 31, 2014 and, 2013, we recorded a liability for income taxes for operations and uncertain tax positions of approximately $122,000 and $148,000, respectively, of which $30,000 and $33,000 respectively, represent penalties and interest and recorded in the “other liabilities” section of the accompanying consolidated balance sheets. Interest and penalties associated with tax positions are recorded in the period assessed as general and administrative expenses. Our tax returns for tax years subject to examination by tax authorities include 2010 and 2011 through the current period for state and federal reporting purposes, respectively.
The following table sets forth a reconciliation of the beginning and ending amount of uncertain tax benefits during the tax years ended December 31, 2014 and 2013:
|
2014
|
2013
|
|||||||
|
Uncertain tax benefit - January 1
|
$ | 114,500 | $ | 29,500 | ||||
|
Gross decreases - tax positions in prior period
|
(22,800 | ) | - | |||||
|
Gross increases - tax positions in current period
|
- | 85,000 | ||||||
|
Uncertain tax benefit - December 31
|
$ | 91,700 | $ | 114,500 | ||||
Operating Leases
We lease our corporate office space. Monthly payments under the lease were approximately $10,500 through June 2012 and approximately $6,700 through December 2013. The lease expired on December 31, 2013. On September 17, 2013, we entered into a new lease for corporate office space, with 66 monthly payments increasing from $10,500 to $22,000, beginning February 3, 2014, the date we took occupancy of the new office space. On December 31, 2014 we acquired four additional leases for clinic locations. These leases vary in length from 30 to 40 months and have monthly payments ranging from $2,609 to $5,909.
Total rent expense for the year ended December 31, 2014 and 2013 was $135,000 and $124,000, respectively.
Future minimum annual lease payments are approximately as follows:
|
2015
|
$ | 444,746 | ||
|
2016
|
465,404 | |||
|
2017
|
440,212 | |||
|
2018
|
293,812 | |||
|
2019
|
154,055 | |||
|
Thereafter
|
- | |||
| $ | 1,798,229 |
Litigation
In the normal course of business, we are party to litigation from time to time. We maintain insurance to cover certain actions and believe that resolution of such litigation will not have a material adverse effect on the Company.
54
We entered into consulting and legal agreements with certain common stockholders related to services performed for the development and ongoing support of the Company. Amounts incurred under these agreements were approximately $923,000 and $700,000 for the years ended December 31, 2014 and 2013, respectively. As of December 31, 2014 approximately $282,000 was recorded in accounts payable.
Initial Public Offering
We completed our initial public offering of 3,000,000 shares of common stock at a price to the public of $6.50 per share on November 14, 2014, whereupon we received aggregate net proceeds of approximately $17,065,000 after deducting underwriting discounts, commissions and other offering expenses. Our underwriters exercised their option to purchase 450,000 additional shares of common stock to cover over-allotments on November 18, 2014, pursuant to which we received aggregate net proceeds of approximately $2,710,000, after deducting underwriting discounts, commissions and expenses. Also, in conjunction with the IPO, we issued warrants to the underwriters for the purchase of 90,000 shares of common stock, which can be exercised between November 10, 2015 and November 10, 2018 at an exercise price of $8.125 per share.
Stock Options
In November 2012, we adopted the 2012 Stock Plan (“2012 Plan”). The Plan’s purpose is to attract and retain the best available personnel for positions of substantial responsibility, provide incentives and additional ownership opportunities for employees, directors, and consultants, and generally promote the success of our business. The Plan permits us to grant incentive stock options, non-statutory stock options, restricted stock, stock appreciation rights, performance units and performance shares to employees, directors, and consultants for a period of ten years.
On May 15, 2014, we adopted the 2014 Stock Plan (“2014 Plan”). The 2014 Plan is designed to supersede and replace the 2012 Plan, effective as of the adoption date and set aside 1,513,000 shares of our common stock that may be granted under the 2014 Plan.
On January 1, 2014, we granted stock options to employees to purchase 198,915 shares of the Company. These options vest over a period of four years from grant date with the exception of 100,125 options that were contingent on the initial public offering that took place on November 14, 2014. These options vest in 12 monthly installments of 4,171 shares the first year, 12 monthly installments of 2,503 shares the second year, and 12 monthly installments of 1,670 shares the third year.
On May 15, 2014, we granted stock options to an employee to purchase 72,100 shares of the Company. These options vest over 16 quarterly installments of 4,450 shares, beginning September 30, 2014.
On November 10, 2014, in conjunction with the initial public offering, 50,000 additional stock options were granted that vest one year after the grant date.
The estimated fair value of each option granted is calculated using the Black-Scholes option-pricing model. In order to calculate the fair value of the options, certain assumptions are made regarding the components of the model, including the estimated fair value of underlying common stock, risk-free interest rate, volatility, expected dividend yield and expected option life. Changes to the assumptions could cause significant adjustments to the valuation.
The fair value of our common stock prior to our IPO was estimated by the Board of Directors at or about the time of grant for each share-based award. At each grant, the board considered a number of factors in establishing a value for our common stock including our EBITDA, assessments of an amount our shareholders would accept in the private sale of the company, discussions with our investment bankers regarding pricing of the company’s common stock in an initial public offering and the probability of successfully completing an IPO. Although the methods for determining the fair value of our common stock are not complex, the board’s estimate of the fair value of our common stock did involve subjectivity, especially assessments of value in a private sale and estimates of value in the public stock market.
55
Since our stock was not publicly traded, expected volatilities were based on volatilities from publicly traded companies with business models similar to ours. Upon the completion of our IPO, our stock trading price became the basis of fair value of our common stock used in determining the value of share based awards. We will rely upon the volatilities from publicly traded companies with similar business models until our common stock has accumulated enough trading history for us to utilize our own historical volatility. The expected life of the options granted is based on the average of the vesting term and the contractual term of the option. The risk-free rate for periods within the expected life of the option is based on the U.S. Treasury 10-year yield curve in effect at the date of the grant.
We have computed the fair value of all options granted during the year ended December 31, 2014, using the following assumptions:
|
December 31,
|
||||||
|
2014
|
2013
|
|||||
|
Expected volatility
|
43% | - |
46%
|
-
|
||
|
Expected dividends
|
None
|
|
-
|
|||
|
Expected term (years)
|
5.5 | - |
7.5
|
-
|
||
|
Risk-free rate
|
0.07% | - |
2.05%
|
-
|
||
|
Forfeiture rate
|
20%
|
|
-
|
|||
The information below summarizes the stock options:
|
Number of
Shares
|
Weighted
Average
|
Weighted
Average
|
Weighted
Average
|
|||||||||||||
|
Outstanding at December 31, 2013
|
- | $ | - | $ | - | |||||||||||
|
Granted at market price
|
320,115 | 2.04 | ||||||||||||||
|
Exercised
|
- | - | ||||||||||||||
|
Cancelled
|
(7,120 | ) | 1.20 | |||||||||||||
|
Outstanding at December 31, 2014
|
312,995 | 2.04 | 0.92 | 9.2 | ||||||||||||
|
Exercisable at December 31, 2014
|
13,072 | $ | 1.20 | $ | 0.57 | 9.3 | ||||||||||
The intrinsic value of our stock options outstanding was $1,357,201 at December 31, 2014.
For the years ended December 31, 2014 and 2013, stock based compensation expense for stock options was $32,105, and $0, respectively. Unrecognized stock-based compensation expense for stock options for the year ended December 31, 2014 was $201,909, which is expected to be recognized ratably over the next 2.0 years.
Restricted Stock
On January 1, 2014, we granted restricted stock awards to an executive and a consultant to earn an aggregate of 567,375 shares of our stock. The restricted stock was granted in two tranches. The first tranche vests over a period of four years from the grant date. The second tranche began vesting upon completion of our initial public offering on November 14, 2014 over a three year period. The fair market value of the 567,375 shares of restricted stock was valued at $1.20 per share, determined by our Board of Directors, totaling approximately $679,000 to be recognized ratably as the stock is vested.
On December 16, 2014, we granted restricted stock to an executive to earn 95,000 shares of our common stock. These shares vest over a four year period from the grant date. The estimated fair market value of these shares was valued at $6.20 per share, based on our stock trading price, totaling approximately $589,000 to be recognized ratably as the stock is vested.
The information below summaries the restricted stock activity:
56
|
Restricted Share Awards
|
Shares
|
|||
|
Outstanding at December 31, 2013
|
- | |||
|
Restricted stock awards granted
|
662,375 | |||
|
Awards forfeited or exercised
|
- | |||
|
Outstanding at December 31, 2014
|
662,375 | |||
|
Remaining available to be issued
|
42,950 | |||
For the years ended December 31, 2014 and 2013, stock based compensation expense for restricted stock awards was $69,725, and $0, respectively. Unrecognized stock based compensation expense for restricted stock awards as of December 31, 2014 was $1,198,212 to be recognized ratably over 3.4 years.
Warrants
In conjunction with the IPO, we issued warrants to the underwriters for the purchase of 90,000 shares of common stock, which can be exercised between November 10, 2015 and November 10, 2018 at an exercise price of $8.125 per share.
For the year ended December 31, 2014, a net expense of $113,929 was recorded against proceeds under additional paid in capital, associated with these awards. The fair value of the warrants was determined using the Black-Scholes option valuation model. The warrants expire on November 10, 2018 and have a remaining contractual life of 3.9 years as of December 31, 2014.
We have computed the fair value of all warrants granted during the year ended December 31, 2014, using the following assumptions:
|
December 31,
|
|||||||
|
2014
|
2013
|
||||||
|
Volatility
|
33 % | - | |||||
|
Risk-free interest rate
|
0.78 % | - | |||||
|
Expected term (years)
|
4.0 | - | |||||
The information below summarizes the warrants:
| Number of Units |
Weighted
Average
|
Weighted Average Remaining Contractual Term
(in years)
|
Intrinsic Value | |||||||||||||
|
Outstanding at December 31, 2013
|
- | $ | - | |||||||||||||
|
Granted
|
90,000 | 8.13 | ||||||||||||||
|
Outstanding at December 31, 2014
|
90,000 | $ | 8.13 | 3.9 | $ | - | ||||||||||
|
Exercisable at December 31, 2014
|
- | $ | - | - | $ | - | ||||||||||
Preferred Stock
We have 50,000 shares authorized as preferred stock. The preferred stock is senior to common stock and each share has the same voting rights as the common stockholders. The liquidation preference is equal to the stated value of the stock plus any dividends declared but unpaid at the time of a liquidation event. The preferred shares are convertible to common stock at the option of the holder at a rate of one share of preferred stock for 53.4 shares of common stock. On November 14, 2014, the holders of our preferred stock converted all 25,000 outstanding shares of preferred stock to 1,335,000 shares of common stock.
57
Common Stock
On November 26, 2012, the Board declared a dividend of 29 shares of our common stock on each share of common stock outstanding as of December 1, 2012. The stock dividend was effective and payable automatically as of the effective date of the Certificate of Amendment to our Certificate of Incorporation which was January 9, 2013. The stock dividend has been accounted for as a stock split and retroactively reflected in these consolidated financial statements. On September 16, 2014, the Board declared a second stock dividend of .78 shares of common stock for each share of common stock outstanding as of September 15, 2014. The second stock dividend was effective and payable automatically as of the effective date of the Company’s Amended and Restated Certificate of Incorporation, which was September 17, 2014. This stock dividend has been accounted for as a stock split and retroactively reflected in these consolidated financial statements.
On January 9, 2013, a Certificate of Amendment of Certificate of Incorporation was filed with the Delaware Secretary of State. This amendment authorized us to increase the number of common stock shares from 150,000 to 4,000,000. A subsequent Certificate of Amendment of Certificate of Incorporation was filed on December 24, 2013, authorizing us to increase the number of common stock shares to 4,250,000. An Amended and Restated Certificate of Incorporation was filed on September 17, 2014, authorizing us to increase the number of common stock shares to 20,000,000.
Treasury Stock
In December 2013, we exercised our right of first refusal under the terms of a Stockholders Agreement dated March 10, 2010 to repurchase 534,000 shares of our common stock. The shares were purchased for $0.45 per share or $240,000 in cash along with the issuance of an option to repurchase the 534,000 shares. We had the right to call the option upon a 15% change in ownership. The repurchased shares were recorded as treasury stock, at cost in the amount of $791,638, and are available for general corporate purposes. The option is classified in equity as it is considered indexed to our stock and meets the criteria for classification in equity. The option was granted to the seller for a term of 8 years. The option contained the following exercise prices:
|
Year 1
|
$ | 0.56 | ||
|
Year 2
|
$ | 0.68 | ||
|
Year 3
|
$ | 0.84 | ||
|
Year 4
|
$ | 1.03 | ||
|
Year 5
|
$ | 1.28 | ||
|
Year 6
|
$ | 1.59 | ||
|
Year 7
|
$ | 1.97 | ||
|
Year 8
|
$ | 2.45 |
Consideration given in the form of the option was valued using a Binomial Lattice-Based model resulting in a fair value of $1.03 per share option for a total fair value of $551,638. The option was valued using the Binomial Lattice-Based valuation methodology because that model embodies all of the relevant assumptions that address the features underlying the instrument. Significant assumptions were as follows:
|
Market value of underlying common stock
|
$1.20
|
|
|
|
Term (years)
|
1 | – |
8
|
|
Strike price
|
$0.56 | – |
$2.45
|
|
Volatility
|
27.03% | – |
45.64%
|
|
Risk-free interest
|
0.13% | – |
2.45%
|
On January 1, 2015, we completed our reacquisition and termination of our regional developer rights for the Los Angeles County, California region in exchange for cash consideration of $507,500. This payment was made in advance and is reflected as part of other assets in our accompanying consolidated balance sheet at December 31, 2014.
On January 30, 2015, we entered into an agreement to repurchase four developed franchises and one undeveloped franchise from a franchisee. The total consideration for this transaction was approximately $750,000, subject to certain adjustments, which was funded from the proceeds of our recent initial public offering and was completed on March 3, 2015. We intend to continue to operate two of the clinics opened under the developed franchises as company-owned clinics. The franchisee closed the two clinics operated under the remaining developed franchises. We have terminated the undeveloped franchise and may relocate it.
58
On February 17, 2015, we entered into an agreement to repurchase two operating franchises from a franchisee and the equipment, leasehold improvements, inventory, supplies and other assets used in the operation of the repurchased franchises. The total consideration for this transaction was $935,000, subject to certain adjustments, which was funded from the proceeds of our recent initial public offering. We intend to operate the two franchises as company-owned clinics.
On March 6, 2015, we entered into an agreement for and completed its repurchase of nine franchises from a franchisee. The transaction involved the repurchase of two developed franchises and seven undeveloped franchises. We intend to operate the clinics opened under the two developed franchises as company-owned clinics and to terminate, re-locate or re-sell the seven undeveloped franchises. The total consideration for this transaction was approximately $300,000, subject to adjustment for certain adjustments and was funded from the proceeds of our recent initial public offering.
None.
Evaluation of Disclosure Controls and Procedures
Our management, with the participation of our Chief Executive Officer and Chief Financial Officer, has evaluated the effectiveness of our disclosure controls and procedures (as defined in Rules 13a-15(e) and 15d-15(e) under the Exchange Act), as of the end of the period covered by this Annual Report on Form 10-K. Based on such evaluation, our Chief Executive Officer and Chief Financial Officer have concluded that, as of such date, our disclosure controls and procedures were not effective.
We have yet to adequately implement certain controls over our financial reporting cycle. These areas include properly segregating duties due to the size of our accounting department and ineffective accounting for and reporting of complex transactions. The existence of these or one or more other material weaknesses or significant deficiencies could result in errors in our financial statements.
Management’s Annual Report on Internal Control over Financial Reporting
This Annual Report on Form 10-K does not include a report of management’s assessment regarding internal control over financial reporting or an attestation report of our registered public accounting firm due to a transition period established by the rules of the SEC for newly public companies. Further, after the initial transition period provided for newly public companies, for as long as we remain an “emerging growth company” as defined in the JOBS Act, we are exempt from the requirement that our registered public accounting firm provide an attestation report on the effectiveness of our internal control over financial reporting.
Changes in Internal Controls over Financial Reporting
In an effort to remediate deficiencies in our internal control structure, during the quarter ended December 31, 2014, we took steps to enhance our internal controls over financial reporting, including the hiring of a Chief Financial Officer. We anticipate that these, and other internal control changes to be enacted in 2015, will address our existing deficiencies.
We believe that a control system, no matter how well designed and operated, cannot provide absolute assurance that the objectives of the control system are met, and no evaluation of controls can provide absolute assurance that all control issues and instances of fraud, if any, within any company have been detected.
None.
59
The information required by this item will be included in our Proxy Statement to be filed pursuant to Regulation 14A within 120 days after our year ended December 31, 2014 in connection with our 2015 Annual Meeting of Stockholders, or the 2015 Proxy Statement, and is incorporated herein by reference.
Code of Business Conduct and Ethics
We have adopted a Code of Business Conduct and Ethics that applies to employees, officers and directors, including our executive management team, such as our Chief Executive Officer and Chief Financial Officer. This Code of Business Conduct and Ethics is posted on our website at
www.thejoint.com
. We intend to satisfy the requirements under Item 5.05 of Form 8-K regarding disclosure of amendments to, or waivers from, provisions of the Code of Business Conduct and Ethics by posting such information on our website.
The information required by this item will be included in the 2015 Proxy Statement and is incorporated herein by reference.
The information required by this Item will be included in the 2015 Proxy Statement and is incorporated herein by reference.
The information required by this item will be included in the 2015 Proxy Statement and is incorporated herein by reference.
The information required by this item will be included in the 2015 Proxy Statement and is incorporated herein by reference.
|
(a)
|
Documents filed as part of this report.
|
|
(1)
|
Financial Statements
. The consolidated financial statements listed on the index to Item 8 of this Annual Report on Form 10-K are filed as a part of this Annual Report.
|
|
(2)
|
Financial Statement Schedules.
All financial statement schedules have been omitted since the information is either not applicable or required or is included in the financial statements or notes thereof.
|
60
|
(3)
|
Exhibits.
Those exhibits marked with a (*) refer to exhibits filed or furnished herewith. The other exhibits are incorporated herein by reference, as indicated in the following list. Those exhibits marked with a (+) refer to management contracts or compensatory plans or arrangements. Portions o
f the exhibits marked with a (Ω) are the subject of a Confidential Treatment Request under 17 C.F.R. §§ 200.80(b)(4), 200.83 and 240.24b-2. Omitted material for which confidential treatment has been requested has been filed separately with the SEC.
|
Pursuant to the requirements of Section 13 or 15(d) of the Securities Exchange Act of 1934, the Registrant has duly caused this report to be signed on its behalf by the undersigned, thereunto duly authorized on March 20, 2015.
|
The Joint Corp.
|
||
|
By:
|
/s/ John B. Richards
|
|
|
John B. Richards
|
||
|
Chief Executive Officer
(Principal Executive Officer)
|
||
Pursuant to the requirements of the Securities Act of 1933, this registration statement has been signed by the following persons in the capacities and on the dates indicated.
|
Signature
|
Title
|
Date
|
||
|
/s/ John B. Richards
|
Chief Executive Officer and Director (Principal Executive Officer), and Director
|
March 20, 2015
|
||
|
John B. Richards
|
||||
|
/s/ Francis T. Joyce
|
Chief Financial Officer and Treasurer (Principal Financial Officer)
|
March 20, 2015
|
||
|
Francis T. Joyce
|
||||
|
/s/ John Leonesio
|
Non-Executive Chairman of the Board and Director
|
March 20, 2015
|
||
|
John Leonesio
|
||||
|
/s/ Craig P. Colmar
|
Director
|
March 20, 2015
|
||
|
Craig P. Colmar
|
||||
|
/s/ Steven P. Colmar
|
Director
|
March 20, 2015
|
||
|
Steven P. Colmar
|
||||
|
/s/ William Fields
|
Director
|
March 20, 2015
|
||
|
William Fields
|
|
/s/ Ron DaVella
|
Director
|
March 20, 2015
|
||
|
Ron DaVella
|
61
EXHIBIT INDEX
|
Exhibit
Number
|
Description of Document
|
|
| 23* |
Consent of EKS&H LLLP
|
|
|
31.1*
|
Certification of Principal Executive Officer pursuant to Rule 13a-14(a) or 15d-14(a) of the Securities Exchange Act of 1934, as adopted pursuant to Section 302 of the Sarbanes-Oxley Act of 2002
|
|
|
31.2*
|
Certification of Principal Financial Officer pursuant to Rule 13a-14(a) or 15d-14(a) of the Securities Exchange Act of 1934, as adopted pursuant to Section 302 of the Sarbanes-Oxley Act of 2002
|
|
|
32*
|
Certification by Principal Executive Officer and Principal Financial Officer pursuant to 18 U.S.C. Section 1350, as adopted pursuant to Section 906 of the Sarbanes-Oxley Act of 2002 (furnished herewith)
|
|
|
101.INS
|
XBRL Instance Document
|
|
|
101.SCH
|
XBRL Taxonomy Extension Schema Document (4)
|
|
|
101.CAL
|
XBRL Taxonomy Extension Calculation Linkbase Document (4)
|
|
|
101.DEF
|
XBRL Taxonomy Extension Definition Linkbase Document (4)
|
|
|
101.LAB
|
XBRL Taxonomy Extension Label Linkbase Document (4)
|
|
|
101.PRE
|
XBRL Taxonomy Extension Presentation Linkbase Document (4)
|
|
62
TABLE OF CONTENTS
Part IItem 1. BusinessItem 1A. Risk FactorsItem 1B. Unresolved Staff CommentsItem 2. PropertiesItem 3. Legal ProceedingsItem 4. Mine Safety DisclosuresPart IIItem 5. Market For Registrant S Common Equity, Related Stockholder Matters and Issuer Purchases Of Equity SecuritiesItem 6. Selected Financial DataItem 7. Management S Discussion and Analysis Of Financial Condition and Results Of Operations Forward-looking StatementsItem 7. Management S Discussion and Analysis Of Financial Condition and Results Of OperationsItem 7A. Quantitative and Qualitative Disclosures About Market RiskItem 8. Financial Statements and Supplementary DataNote 1: Nature Of Operations and Summary Of Significant Accounting PoliciesNote 2: AcquisitionsNote 3: Notes ReceivableNote 4: Property and EquipmentNote 5: Fair Value ConsiderationNote 6: IntangiblesNote 7: Income TaxesNote 8: Commitments and ContingenciesNote 9: Related Party TransactionsNote 10: EquityNote 11: Subsequent EventsItem 9. Changes in and Disagreements with Accountants on Accounting and Financial DisclosureItem 9A. Controls and ProceduresItem 9B. Other InformationPart IIIItem 10. Directors, Executive Officers and Corporate GovernanceItem 11. Executive CompensationItem 12. Security Ownership Of Certain Beneficial Owners Management and Related Stockholder MattersItem 13. Certain Relationships and Related Transactions, and Director IndependenceItem 14. Principal Accountant Fees and ServicesPart IVItem 15. Exhibits, Financial Statement Schedules