KADANT INC
10-Ks and 10-Qs
|
|
|
|
|
|
|
|
|
|
|
|
|
|
|
|
|
|
|
|
|
|
|
|
|
|
|
|
|
|
|
|
|
|
|
|
|
|
|
|
|
|
|
|
|
|
|
|
|
|
|
|
|
|
|
|
UNITED STATES
SECURITIES AND EXCHANGE COMMISSION
WASHINGTON, D.C. 20549
_________________
FORM 10-K
(mark one)
|
x
|
ANNUAL REPORT PURSUANT TO SECTION 13 OR 15(D) OF THE SECURITIES EXCHANGE ACT OF 1934
|
|
For the fiscal year ended December 31, 2016
|
|
OR
|
¨
|
TRANSITION REPORT PURSUANT TO SECTION 13 OR 15(D) OF THE SECURITIES EXCHANGE ACT OF 1934
|
Commission file number 1-11406
KADANT INC.
(Exact name of Registrant as specified in its charter)
|
Delaware
|
|
52-1762325
|
|
(State or other jurisdiction of incorporation or organization)
|
|
(I.R.S. Employer Identification No.)
|
|
One Technology Park Drive
|
|
|
|
Westford, Massachusetts
|
|
01886
|
|
(Address of principal executive offices)
|
|
(Zip Code)
|
Registrant's telephone number, including area code: (978) 776-2000
Securities registered pursuant to Section 12(b) of the Act:
|
Title of each class
|
|
Name of each exchange on which registered
|
|
Common Stock, $.01 par value
|
|
New York Stock Exchange
|
Securities registered pursuant to Section 12(g) of the Act: None
Indicate by check mark if the Registrant is a well-known seasoned issuer, as defined in Rule 405 of the Securities Act. Yes
¨
No
x
Indicate by check mark if the Registrant is not required to file reports pursuant to Section 13 or Section 15(d) of the Act. Yes
¨
No
x
Indicate by check mark whether the Registrant (1) has filed all reports required to be filed by Section 13 or 15(d) of the Securities Exchange Act of 1934 during the preceding 12 months (or for such shorter period that the Registrant was required to file such reports), and (2) has been subject to such filing requirements for the past 90 days. Yes
x
No
¨
Indicate by check mark whether the Registrant has submitted electronically and posted on its corporate Web site, if any, every Interactive Data File required to be submitted and posted pursuant to Rule 405 of Regulation S-T during the preceding 12 months (or for such shorter period that the Registrant was required to submit and post such files). Yes
x
No
¨
Indicate by check mark if disclosure of delinquent filers pursuant to Item 405 of Regulation S-K is not contained herein, and will not be contained, to the best of the Registrant's knowledge, in definitive proxy or information statements incorporated by reference in Part III of this Form 10-K or any amendment to this Form 10-K.
x
Indicate by check mark whether the Registrant is a large accelerated filer, an accelerated filer, a non-accelerated filer, or a smaller reporting company. See the definitions of "large accelerated filer", "accelerated filer", and "smaller reporting company" in Rule 12b-2 of the Exchange Act.
|
Large accelerated filer
¨
|
Accelerated filer
x
|
|
Non-accelerated filer
¨
(Do not check if a smaller reporting company)
|
Smaller reporting company
¨
|
Indicate by check mark whether the Registrant is a shell company (as defined in Rule 12b-2 of the Exchange Act). Yes
¨
No
x
The aggregate market value of the voting and non-voting common equity held by nonaffiliates of the Registrant as of
July 2,
2016
, was approximately $560,179,000.
As of
February 17, 2017
, the Registrant had 10,937,627 shares of common stock outstanding.
DOCUMENTS INCORPORATED BY REFERENCE
Portions of the Registrant's definitive Proxy Statement pursuant to Regulation 14A promulgated under the Securities Exchange Act of 1934, as amended, to be used in connection with the Registrant's 2017 Annual Meeting of Stockholders are incorporated by reference into Part III of this Form 10-K.
Kadant Inc.
Annual Report on Form 10-K
for the Fiscal Year Ended
December 31, 2016
Table of Contents
|
|
|
Page
|
|
PART I
|
||
|
|
|
|
|
Item 1.
|
||
|
Item 1A.
|
||
|
Item 1B.
|
||
|
Item 2.
|
||
|
Item 3.
|
||
|
Item 4.
|
||
|
|
||
|
PART II
|
||
|
|
|
|
|
Item 5.
|
||
|
Item 6.
|
||
|
Item 7.
|
||
|
Item 7A.
|
||
|
Item 8.
|
||
|
Item 9.
|
||
|
Item 9A.
|
||
|
Item 9B.
|
||
|
|
||
|
PART III
|
||
|
|
|
|
|
Item 10.
|
||
|
Item 11.
|
||
|
Item 12.
|
||
|
Item 13.
|
||
|
Item 14.
|
||
|
|
||
|
PART IV
|
||
|
|
|
|
|
Item 15.
|
||
|
Kadant Inc.
|
2016 Annual Report
|
|
Forward-Looking Statements
This Annual Report on Form 10-K and the documents that we incorporate by reference in this Report include forward-looking statements within the meaning of Section 21E of the Securities Exchange Act of 1934, as amended, and Section 27A of the Securities Act of 1933, as amended. These forward-looking statements are not statements of historical fact, and may include statements regarding possible or assumed future results of operations. Forward-looking statements are subject to risks and uncertainties and are based on the beliefs and assumptions of our management, using information currently available to our management. When we use words such as "believes," "expects," "anticipates," "intends," "plans," "estimates," "seeks," "should," "likely," "will," "would," "may," "continue," "could," or similar expressions, we are making forward-looking statements.
Forward-looking statements are not guarantees of performance. They involve risks, uncertainties, and assumptions. Our future results of operations may differ materially from those expressed in the forward-looking statements. Many of the important factors that will determine these results and values are beyond our ability to control or predict. You should not put undue reliance on any forward-looking statements. We undertake no obligation to publicly update any forward-looking statement, whether as a result of new information, future events, or otherwise. For a discussion of important factors that may cause our actual results to differ materially from those suggested by the forward-looking statements, you should read carefully the section captioned "Risk Factors" in Part I, Item 1A, of this Report.
The terms "we," "us," "our," "Registrant," or "Company" in this Report refer to Kadant Inc. and its consolidated subsidiaries.
Description of Our Business
We are a leading global supplier of equipment and critical components used in process industries worldwide. In addition, we manufacture granules made from papermaking by-products. We have a diverse and large customer base, including most of the world's major paper and oriented strand board (OSB) manufacturers, and our products, technologies and services play an integral role in enhancing process efficiency, optimizing energy utilization, and maximizing productivity in resource-intensive industries. We believe our large installed base provides us with a spare parts and consumables business that yields higher margins than our capital equipment business. In 2016*, approximately 62% of our revenue was from the sale of parts and consumables products.
Our continuing operations are comprised of two reportable operating segments, Papermaking Systems and Wood Processing Systems, and a separate product line, Fiber-based Products. Through our Papermaking Systems segment, we develop, manufacture, and market a range of equipment and products for the global papermaking, paper recycling, recycling and waste management, and other process industries. Through our Wood Processing Systems segment, we develop, manufacture, and market stranders and related equipment used in the production of OSB, and sell debarking and wood chipping equipment used in the forest products and the pulp and paper industries. Through this segment, we also provide refurbishment and repair of pulping equipment for the pulp and paper industry. Through our Fiber-based Products business, we manufacture and sell granules derived from pulp fiber for use as carriers for agricultural, home lawn and garden, and professional lawn, turf and ornamental applications, as well as for oil and grease absorption.
On April 4, 2016, we acquired all the outstanding shares of RT Holding GmbH, the parent corporation of a group of companies known as the PAALGROUP (PAAL), for approximately 49.7 million euros, net of cash acquired, or approximately $56.6 million. PAAL manufactures balers and related equipment used in the processing of recyclable and waste materials. This acquisition, which is included in our Papermaking Systems segment's Stock-Preparation product line, broadened our product portfolio and extended our presence deeper into recycling and waste management. PAAL, headquartered in Germany, also has operations in the United Kingdom, France, and Spain.
Papermaking Systems Segment
Our Papermaking Systems segment has a long and well-established history of developing, manufacturing, and marketing equipment for the global papermaking and paper recycling industries. Some of our businesses or their predecessor companies have been in operation for more than 100 years. Our customer base includes major global paper manufacturers and we believe we have one of the largest installed bases of equipment in the markets we serve within the pulp and paper industry. We manufacture our products in ten countries in Europe, North and South America, and Asia.
___________________________________
*
Unless otherwise noted, references to
2016
,
2015
, and
2014
in this Annual Report on Form 10-K are for the fiscal years ended
December 31, 2016
,
January 2, 2016
, and
January 3, 2015
, respectively.
1
|
Kadant Inc.
|
2016 Annual Report
|
|
Our Papermaking Systems segment consists of the following product lines: Stock-Preparation; Doctoring, Cleaning, & Filtration; and Fluid-Handling.
Stock-Preparation
We develop, manufacture, and market complete custom-engineered systems and equipment, as well as standard individual components, for baling, pulping, de-inking, screening, cleaning, and refining primarily recycled fiber for preparation for entry into the paper machine, and recausticizing and evaporation equipment and systems used in the production of virgin pulp. Our baling equipment is also used to compress a variety of other secondary materials to prepare them for transport or storage. Our principal stock-preparation products include:
|
–
|
Recycling and approach flow systems: Our equipment includes pulping, screening, cleaning, and de-inking systems that blend pulp mixtures and remove contaminants, such as ink, glue, metals, and other impurities, to prepare them for entry into the paper machine during the production of recycled paper.
|
|
|
–
|
Virgin pulping process equipment: Our equipment includes pulp washing, evaporator, recausticizing, and condensate treatment systems used to remove lignin, concentrate and recycle process chemicals, and remove condensate gases.
|
|
|
–
|
Balers and related equipment: Our equipment includes horizontal channel balers, vertical balers, conveyors, compactors, and bale wrapping machines used in the processing of recyclable and waste materials.
|
|
Doctoring, Cleaning, & Filtration
We develop, manufacture, and market a wide range of doctoring, cleaning, and filtration systems and related consumables that continuously clean rolls to keep paper machines running efficiently; doctor blades made of a variety of materials to perform functions including cleaning, creping, web removal, flaking, and the application of coatings; profiling systems that control moisture, web curl, and gloss during paper converting; and systems and equipment used to continuously clean paper machine fabrics and rolls, drain water from pulp mixtures, form the sheet or web, and filter the process water for reuse. Our principal doctoring, cleaning, and filtration products include:
|
–
|
Doctor systems and holders: Our doctor systems clean papermaking rolls to maintain the efficient operation of paper machines and other equipment by placing a blade against the roll at a constant and uniform pressure. A doctor system consists of the structure supporting the blade and the blade holder.
|
|
|
–
|
Profiling systems: We offer profiling systems that control moisture, web curl, and gloss during paper converting.
|
|
|
–
|
Doctor blades: We manufacture doctor and scraper blades made of a variety of materials including metal, bi-metal, or synthetic materials that perform a variety of functions including cleaning, creping, web removal, flaking, and applying coatings. A typical doctor blade has a life ranging from eight hours to two months, depending on the application.
|
|
|
–
|
Shower and fabric-conditioning systems: Our shower and fabric-conditioning systems assist in the removal of contaminants that collect on paper machine fabrics used to convey the paper web through the forming, pressing, and drying sections of the paper machine. A typical paper machine has between three and 12 fabrics. These fabrics can easily become contaminated with fiber, fillers, pitch, and dirt that can have a detrimental effect on paper machine performance and paper quality. Our shower and fabric-conditioning systems assist in the removal of these contaminants.
|
|
|
–
|
Formation systems: We supply structures that drain, purify, and recycle process water from the pulp mixture during paper sheet and web formation.
|
|
|
–
|
Water-filtration systems: We offer a variety of filtration systems and strainers that remove contaminants from process water before reuse and recover reusable fiber for recycling back into the pulp mixture.
|
|
Fluid-Handling
We develop, manufacture and market rotary joints, precision unions, steam and condensate systems, components, and controls used primarily in the dryer section of the papermaking process and during the production of corrugated packaging, metals, plastics, rubber, textiles, chemicals, and food. Our principal fluid-handling systems include:
2
|
Kadant Inc.
|
2016 Annual Report
|
|
|
–
|
Rotary joints: Our mechanical devices, used with rotating shafts, allow the transfer of pressurized fluid from a stationary source into and out of rotating machinery for heating, cooling, or the transfer of fluid power.
|
|
|
–
|
Syphons: Our devices, installed inside rotating cylinders, are used to remove fluids from the rotating cylinders through rotary joints or unions located on either end of the cylinder.
|
|
|
–
|
Turbulator® bars: Our steel or stainless steel axial bars, installed on the inside of cylinders, are used to induce turbulence in the condensate layer to improve the uniformity and rate of heat transfer through the cylinders.
|
|
|
–
|
Engineered steam and condensate systems: Our steam systems control the flow of steam from the boiler to the paper drying cylinders, collect condensed steam, and return it to the boiler to improve energy efficiency during the paper drying process. Our systems and equipment are also used to efficiently and effectively distribute steam in a wide variety of industrial processing applications.
|
|
Wood Processing Systems Segment
We develop, manufacture, and market stranders and related equipment used in the production of OSB. We also supply debarking and wood chipping equipment used in the forest products and the pulp and paper industries. Our principal wood-processing products and services include:
|
–
|
Stranders: Our disc and ring stranders cut batch-fed logs into strands for OSB production and are used to manage strands in real time using our patented conveying and feeding equipment.
|
|
|
–
|
Rotary Debarkers: Our rotary debarkers employ a combination of mechanical abrasion and log-to-log contact to efficiently remove bark from logs of all shapes and species.
|
|
|
–
|
Chippers: Our disc, drum, and veneer chippers are high-quality, robust chipper systems for waste-wood and whole-log applications found in pulp woodrooms, chip plants, sawmill, and planer mill sites.
|
|
|
–
|
Repair: Refurbishment and repair of pulping equipment used in the pulp and paper industry.
|
|
Fiber-based Products
We produce and sell biodegradable, absorbent granules derived from papermaking by-products for use primarily as carriers for agricultural, home lawn and garden, and professional lawn, turf and ornamental applications, as well as for oil and grease absorption.
Fiscal Year
Typically, our fiscal quarters and fiscal year consist of 13 and 52 weeks, respectively, ending on the Saturday closest to the end of the corresponding calendar quarter for our fiscal quarters and on the Saturday closest to December 31 for our fourth fiscal quarter and fiscal year. As a result of the difference between the fiscal and calendar periods, a 53rd week is added to our fiscal year every five or six years. In a 53-week fiscal year, our fourth fiscal quarter contains 14 weeks. Our fiscal years ended December 31, 2016 (fiscal 2016) and January 2, 2016 (fiscal 2015) both contained 52 weeks, and our fiscal year ended January 3, 2015 (fiscal 2014) contained 53 weeks. Each quarter of fiscal 2016, 2015, and 2014 contained 13 weeks, except the fourth quarter of 2014, which contained 14 weeks.
Research and Development
We develop a broad range of products for all facets of the markets we serve. We operate research and development facilities in the United States, Europe, and Canada, and focus our product innovations on process industry challenges and the need for improved fiber processing, heat transfer, roll and fabric cleaning, fluid handling, engineered wood processing, and secondary material handling. In addition to internal product development activities, our research centers allow customers to simulate their own operating conditions and applications to identify and quantify opportunities for improvement.
Our research and development expenses were $7.4 million, $6.7 million, and $6.2 million in
2016
,
2015
, and
2014
, respectively.
3
|
Kadant Inc.
|
2016 Annual Report
|
|
Raw Materials
The primary raw materials used in our Papermaking Systems segment are steel, stainless steel, ductile iron, brass, bronze, and aluminum which have generally been available through a number of suppliers. To date, we have not needed to maintain raw material inventories in excess of our current needs to ensure availability.
The primary raw materials used in our Wood Processing Systems segment are steel and stainless steel, which have generally been available through a number of suppliers.
The raw material used in the manufacture of our fiber-based granules is a by-product from the production of paper that we obtain from two paper mills. If the mills were unable or unwilling to supply us with sufficient fiber, we would be forced to find one or more alternative suppliers for this raw material.
Patents, Licenses, and Trademarks
We protect our intellectual property rights by applying for and obtaining patents when appropriate. We also rely on technical know-how, trade secrets, and trademarks to maintain our competitive position. We also enter into license agreements with others to grant and/or receive rights to patents and know-how. No particular patent, or related group of patents, is so important that its expiration or loss would significantly affect our operations.
Papermaking Systems Segment
We have numerous U.S. and foreign patents, including foreign counterparts to our U.S. patents, expiring on various dates ranging from 2017 to 2034. From time to time, we enter into licenses of products with other companies that serve the pulp, papermaking, converting, and paper recycling industries.
Wood Processing Systems Segment
We currently hold several U.S. and Canadian patents, expiring on various dates ranging from 2018 to 2032, related to wood processing and debarking equipment.
Fiber-based Products
We currently hold several U.S. patents, expiring on various dates ranging from 2018 to 2034, related to various aspects of the processing of fiber-based granules and the use of these materials in the agricultural, professional turf, home lawn and garden, general absorption, oil and grease absorption, and catbox filler markets.
Seasonal Influences
Papermaking Systems Segment
There are no material seasonal influences on this segment's sales of products and services.
Wood Processing Systems Segment
Our Wood Processing Systems segment is subject to seasonal variations, with demand for many of our products tending to be greater during the building season, which generally occurs in the second and third quarters in North America.
Fiber-based Products
Our Fiber-based Products business experiences fluctuations in sales, usually in the third and fourth quarters, when sales decline due to the seasonality of the agricultural and home lawn and garden markets.
Working Capital Requirements
There are no special inventory requirements or credit terms extended to customers that would have a material adverse effect on our working capital.
Dependency on a Single Customer
No single customer accounted for more than 10% of our consolidated revenues in any of the past three years. In addition, revenues in our Papermaking Systems segment were not dependent on any one customer. The two largest customers in our Wood Processing Systems segment accounted for 48%, 32%, and 32% of its revenues in 2016, 2015, and 2014, respectively. During
2016
,
2015
, and
2014
, approximately 60%, 50%, and 57%, respectively, of our sales were to customers outside the United States, principally in Europe and Asia.
4
|
Kadant Inc.
|
2016 Annual Report
|
|
Backlog
Our backlog of firm orders for the Papermaking Systems segment was $89.6 million and $94.9 million at year-end
2016
and
2015
, respectively. The total consolidated backlog of firm orders was $98.6 million and $102.6 million at year-end
2016
and
2015
, respectively. We anticipate that approximately 95% of the backlog at year-end
2016
will be shipped or completed during 2017. Some of these orders can be canceled by the customer upon payment of a cancellation fee.
Competition
We are a leading supplier of systems and equipment in each of our product lines within our Papermaking Systems segment and there are several global and numerous local competitors in each market. In our Wood Processing Systems segment, we compete with one primary global competitor in the OSB market for stranding equipment and several global and local competitors for our other products. Because of the diversity of our products, we face many different types of competitors and competition. We compete primarily on the basis of technical expertise, product innovation, and product performance. We believe the reputation that we have established for high-performance, high-reliability products supported by our in-depth process knowledge and application expertise provides us with a competitive advantage. In addition, a significant portion of our business is generated from our worldwide customer base. To maintain this base, we have emphasized our global presence, local support, and a problem-solving relationship with our customers. Our success primarily depends on the following factors:
|
–
|
Technical expertise and process knowledge;
|
|
|
–
|
Product innovation;
|
|
|
–
|
Product quality, reliability, and performance;
|
|
|
–
|
Operating efficiency of our products;
|
|
|
–
|
Customer service and support;
|
|
|
–
|
Relative price of our products; and
|
|
|
–
|
Total cost of ownership of our products.
|
|
Environmental Protection Regulations
We believe that our compliance with federal, state, and local environmental protection regulations will not have a material adverse effect on our capital expenditures, earnings, or competitive position.
Employees
As of year-end
2016
, we had approximately 2,000 employees worldwide.
Financial Information About Geographic Areas
Financial information concerning our segments, product lines, and geographic areas is summarized in Note 11 to the consolidated financial statements, which begin on page F-1 of this Report.
Available Information
We file annual, quarterly, and current reports, proxy statements, and other documents with the Securities and Exchange Commission (SEC) under the Exchange Act. The SEC maintains a website that contains reports, proxy and information statements, and other information regarding issuers, including us, that file electronically with the SEC. The public can obtain any documents that we file with the SEC at www.sec.gov. The public also may read and copy any materials that we file with the SEC at the SEC's Public Reference Room at 100 F Street, NE, Washington, D.C. 20549. The public may obtain information on the operation of the Public Reference Room by calling the SEC at 1-800-SEC-0330. In addition, we make available free of charge through our website at www.kadant.com our Annual Reports on Form 10-K, Quarterly Reports on Form 10-Q, Current Reports on Form 8-K, and, if applicable, amendments to these Reports filed with or furnished pursuant to Section 13(a) or 15(d) of the Exchange Act as soon as reasonably practicable after we electronically file these materials with, or furnish them to, the SEC. We are not including the information contained on our website as part of this Report nor are we incorporating the information on our website into this Report by reference.
5
|
Kadant Inc.
|
2016 Annual Report
|
|
Executive Officers of the Registrant
The following table summarizes certain information concerning our executive officers as of March 1,
2017
:
|
Name
|
Age
|
Present Title (Fiscal Year First Became Executive Officer)
|
||
|
Jonathan W. Painter
|
58
|
President and Chief Executive Officer (1997)
|
||
|
Eric T. Langevin
|
54
|
Executive Vice President and Chief Operating Officer (2006)
|
||
|
Jeffrey L. Powell
|
58
|
Executive Vice President (2009)
|
||
|
Michael J. McKenney
|
55
|
Senior Vice President and Chief Financial Officer (2002)
|
||
|
Sandra L. Lambert
|
61
|
Vice President, General Counsel, and Secretary (2001)
|
||
|
Deborah S. Selwood
|
48
|
Vice President and Chief Accounting Officer (2015)
|
||
Mr. Painter has been our chief executive officer and a director since January 2010 and our president since September 1, 2009. Between 1997 and September 2009, Mr. Painter served as an executive vice president and from March 2007 through September 2009 had supervisory responsibility for our Stock-Preparation and Fiber-based Products businesses. He served as president of our Composite Building Products business from 2001 until its sale in 2005. He also served as our treasurer and the treasurer of Thermo Electron Corporation (Thermo Electron) from 1994 until 1997. Prior to 1994, Mr. Painter held various managerial positions with us and Thermo Electron.
Mr. Langevin has been an executive vice president and our chief operating officer since January 2010. Prior to January 2010, Mr. Langevin had been a senior vice president since March 2007 and had supervisory responsibility for our Fluid-Handling and Doctoring, Cleaning, & Filtration businesses. He served as vice president, with responsibility for our Doctoring, Cleaning, & Filtration business, from 2006 to 2007. From 2001 to 2006, Mr. Langevin was president of Kadant Web Systems Inc. (now our Kadant Solutions division) and before that served as its senior vice president and vice president of operations. Prior to 2001, Mr. Langevin managed several product groups and departments within Kadant Web Systems after joining us in 1986 as a product development engineer.
Mr. Powell has been an executive vice president since March 2013 and has supervisory responsibility for our Stock-Preparation, Wood Processing, and Fiber-based Products businesses. From September 2009 to March 2013, he was a senior vice president. From January 2008 to September 2009, Mr. Powell was vice president, new ventures, with principal responsibility for acquisition-related activities. Prior to joining us, Mr. Powell was the chairman and chief executive officer of Castion Corporation from April 2003 through December 2007.
Mr. McKenney has been a senior vice president and our chief financial officer since June 2015. He served as our vice president, finance and chief accounting officer from 2002 to 2015 and as corporate controller from 1997 to 2007. Mr. McKenney was controller of Kadant AES, our division acquired from Albany International Inc., from 1993 to 1997. Prior to 1993, Mr. McKenney held various financial positions at Albany International.
Ms. Lambert has been a vice president and our general counsel since 2001, and our secretary since our incorporation in 1991. Prior to joining us, she was a vice president and the secretary of Thermo Electron from 1999 and 1990, respectively, to 2001 and before that was a member of Thermo Electron's legal department.
Ms. Selwood has been a vice president and our chief accounting officer since June 2015. She served as our corporate controller from 2007 to 2015 and as assistant controller from 2004 to 2007. Prior to 2004, Ms. Selwood held various financial positions at Arthur Andersen LLP and Genuity Inc.
6
|
Kadant Inc.
|
2016 Annual Report
|
|
Our business, results of operations and financial condition, and an investment in our securities, are subject to a number of risks. Among the risks that could materially negatively affect our results or cause our actual results to differ materially from those projected or indicated in any forward-looking statements are the following.
Adverse changes in global and local economic conditions may negatively affect our industry, business and results of operations.
We sell products worldwide to global process industries and a significant portion of our revenue is from customers based in North America, Europe and China. Uncertainties in global and regional economic outlooks have negatively affected, and may in the future negatively affect, demand for our customers' products and, as a consequence, our products and services, especially our capital equipment systems and products, and our operating results. Also, uncertainty regarding economic conditions has caused, and may in the future cause, liquidity and credit issues for many businesses, including our customers in the pulp and paper industry as well as other process industries, and may result in their inability to fund projects, capacity expansion plans, and to some extent, routine operations and capital expenditures. These conditions have resulted, and may in the future result, in a number of structural changes in process industries, including decreased spending, mill closures, consolidations, and bankruptcies, all of which negatively affect our business, revenue, and profitability. Financial and economic turmoil affecting the worldwide economy or the banking system and financial markets, in particular due to political or economic developments, could cause the expectations for our business to differ materially in the future.
Revenues from the sale of large capital equipment and systems projects are often difficult to predict accurately, especially in periods of economic uncertainty.
We manufacture capital equipment and systems used in process industries, including the paper industry. The demand for capital equipment is variable and depends on a number of factors, including consumer demand for end products, existing manufacturing capacity, the level of capital spending by our customers and economic conditions. As a consequence, our bookings and revenues for capital projects tend to be variable and difficult to predict. It is especially difficult to accurately forecast our operating results during periods of economic uncertainty. Paper and OSB companies curtail their capital and operating spending during periods of economic uncertainty and are cautious about resuming spending as market conditions improve. Levels of consumer spending on non-durable goods, demand for food and beverage packaging, and demand for new housing and remodeling are all factors that affect paper and OSB companies' demand for our products, and reductions in these demand levels can negatively impact our business. As paper and OSB companies consolidate operations in response to market weakness, they frequently reduce capacity, increase downtime, defer maintenance and upgrades, and postpone or even cancel capacity additions or expansion projects. Capacity growth and investment can be uneven and the larger paper producers have delayed, and may in the future delay, additional new capacity start-ups in reaction to softer market conditions. In general, as significant capacity additions come online and the economic growth rate slows, paper producers have deferred and could in the future defer further investments or the delivery of previously-ordered equipment until the market absorbs the new production. This has negatively affected our bookings and revenues in the past, particularly in China, and may negatively affect our operating results in the future.
Our sales of capital equipment in China tend to be more variable and are subject to a number of uncertainties.
Our bookings and revenues from China tend to be more variable than in other geographic regions, as the Chinese pulp and paper industry experiences periods of significant capacity expansion to meet demand followed by periods of reduced activity while overcapacity is absorbed. These cycles result in periods of significant bookings activity for our capital products and increased revenues followed by a significant decrease in bookings or potential delays in shipments and order placements by our customers as they attempt to balance supply and demand.
In addition, orders from customers in China, particularly for large stock-preparation systems that have been tailored to a customer's specific requirements, have credit risks higher than we generally incur elsewhere, and some orders are subject to the receipt of financing approvals from the Chinese government or can be impacted by the availability of credit and more restrictive monetary policies. For example, in the fourth quarter of 2015 we reversed a booking of $16 million due to uncertainty regarding financing for a project in China. We generally do not record bookings for signed contracts from customers in China for large stock-preparation systems until we receive the down payments for such contracts. The timing of the receipt of these orders and the down payments are uncertain and there is no assurance that we will be able to recognize revenue on these contracts. Delays in the receipt of payments and letters of credit affect when revenues can be recognized on these contracts, making it difficult to accurately forecast our future financial performance. We may experience a loss if a contract is canceled prior to the receipt of a down payment if we have commenced engineering or other work associated with the contract. We typically have inventory awaiting shipment to customers. We could incur a loss if contracts are canceled and we cannot re-sell the equipment. In addition, we may experience a loss if the contract is canceled, or the customer does not fulfill its obligations under the contract, prior to the receipt of a letter of credit or final payments covering the remaining balance of the contract, which could represent 80% or more of the total order.
7
|
Kadant Inc.
|
2016 Annual Report
|
|
A significant portion of our revenue in China is recognized upon shipment once we have secured final payment. In some cases, we will be unable to recognize any revenue on completed orders until after installation or acceptance of the equipment. Furthermore, customers in China often demand that deliveries of previously-ordered equipment be delayed to future periods for any number of reasons. As a result of these factors, our revenues recognized in China have varied, and will in the future vary, greatly from period to period and be difficult to predict.
Our results of operations may be adversely affected by currency fluctuations.
As a multinational corporation, we are exposed to fluctuations in currency exchange rates that impact our business in many ways. We are exposed to both translation as well as transaction risk associated with transactions denominated in currencies that differ from our subsidiaries' functional currencies. Although in general our subsidiaries' costs are denominated in the same currency as their revenues, changes in the relative values of currencies occur from time to time and can adversely affect our operating results. Some of the foreign currency translation risk is mitigated when foreign subsidiaries have revenue and expenses in the same foreign currency. Further, certain foreign subsidiaries may hold U.S. dollar assets or liabilities which, as the U.S. dollar strengthens versus the applicable functional currencies, will result in currency transaction gains on assets or losses on liabilities. While some foreign currency risks can be hedged using derivatives or other financial instruments, or may be insurable, such attempts to mitigate these risks may be costly and not always successful.
When we translate the local currency results of our foreign subsidiaries into U.S. dollars during a period in which the U.S. dollar is strengthening, our financial results will reflect decreases due to foreign currency translation. In addition, our consolidated financial results are adversely affected when foreign governments devalue their currencies. Our major foreign currency translation exposures involve the currencies in Europe, China, Brazil, Canada and Mexico. For example, China's central bank devalued the renminbi to boost the Chinese economy in 2016, which had a negative translation impact on our consolidated revenues and will continue to have a negative translation impact if this recurs. Foreign currency translation had a negative effect on our financial results in 2016 and 2015, and is expected to continue to adversely affect our operating results in 2017. We do not enter into derivatives or other financial instruments to hedge this type of foreign currency translation risk.
The inability of our customers to obtain financing for capital equipment projects may affect our ability to recognize revenue and income.
Approximately 38% of our revenue in 2016 was from the sale of capital equipment to be used in process industries. Large capital equipment projects require a significant investment and may require our customers to secure financing from external sources. Our financial performance will be negatively impacted if there are delays in customers securing financing or our customers become unable to secure such financing due to any number of factors, including a tightening of monetary policy. For example, in the fourth quarter of 2015 we reversed a booking of $16 million due to uncertainty regarding financing for a project in China, originally recorded in 2014. Financing has been a significant problem for customers in Russia and China, and has caused us to delay the booking of some pending orders, as well as the shipment of some orders currently in our backlog. The inability of our customers to obtain credit may affect our ability to recognize revenue and income, particularly on large capital equipment orders from new customers for which we may require letters of credit. We may also be unable to issue letters of credit to our customers, which are required in some cases to guarantee performance, during periods of economic uncertainty.
Our global operations subject us to economic risk as our results of operations may be adversely affected by changes in government regulations and policies, including restraints on international trade.
Operating globally subjects us to changes in government regulations and policies in multiple jurisdictions around the world, including those related to tariffs and trade barriers, taxation, exchange controls and political risks. Changes in government policies, political unrest, economic sanctions, trade embargoes, or other adverse trade regulations can negatively impact our business. We operate a manufacturing facility in Mexico and our business benefits from the North American Free Trade Agreement (NAFTA). If the United States were to withdraw from or materially modify NAFTA or to impose significant tariffs or taxes on goods imported into the United States, the cost of our products could materially increase or no longer be priced competitively, which in turn could have a material adverse effect on our business and results of operations. We operate significant manufacturing facilities in and derive significant revenue from China. Changes in the policies of the Chinese government, devaluation of the Chinese currency, political unrest, unstable economic conditions, or other developments in China or in U.S.-China relations that are adverse to trade, including enactment of protectionist legislation or trade or currency restrictions, could negatively impact our business and operating results. Policies of the Chinese government to target slower economic growth may negatively affect our business in China if customers are unable to expand capacity or obtain financing for expansion or improvement projects.
8
|
Kadant Inc.
|
2016 Annual Report
|
|
We manufacture equipment used in the production of OSB and our financial performance may be adversely affected by lower levels of residential construction activity.
We manufacture stranders and related equipment used in the production of OSB, an engineered wood panel product used primarily in home construction. Our customers produce OSB principally for new residential construction, home repair and remodeling activities. As such, the operating results for our Wood Processing Systems segment correlate to a significant degree to the level of this residential construction activity, primarily in North America and, to a lesser extent, in Europe. Residential construction activity is influenced by a number of factors, including the supply of and demand for new and existing homes, new housing starts, unemployment rates, interest rate levels, availability of mortgage financing, mortgage foreclosure rates, seasonal and unusual weather conditions, general economic conditions and consumer confidence. A significant increase in long-term interest rates, tightened lending standards, high unemployment rates and other factors that reduce the level of residential construction activity could have a material adverse effect on our financial performance.
The OSB market is highly concentrated and the market for building products is highly competitive. The loss of a significant customer or our customers' reductions in capital spending or OSB production could have a material adverse effect on our financial performance.
The OSB market is highly concentrated and there are a limited number of OSB manufacturers. The two largest customers in our Wood Processing Systems segment accounted for 48%, 32%, and 32% of its revenues in 2016, 2015, and 2014, respectively. The loss of one or more of these customers to a competitor could adversely affect our revenues and profitability. In addition, the market for building products is highly competitive. Products that compete with OSB include other wood panel products and substitutes for wood building products, such as nonfiber-based alternatives. For example, plastic, wood/plastic or composite materials may be used by builders as alternatives to OSB products. Changes in component prices, such as energy, chemicals, wood-based fibers, and nonfiber alternatives can change the competitive position of OSB relative to other available alternatives and could increase substitution. Our customers' OSB production can be adversely affected by lower-cost producers of other wood panel products and substitutes for wood building products. Lower demand for OSB products or a decline in the profitability of one or more of our customers could result in a reduction in spending on capital equipment or the shutdown or closure of an OSB mill, which could have a material adverse effect on our financial performance.
The development and increasing use of digital media has had, and will continue to have, an adverse impact on our Papermaking Systems segment.
Developments in digital media have adversely affected demand for newsprint and for printing and writing grades of paper, particularly in North America and Europe, a trend which is expected to continue. Approximately 11% of our revenue in 2016 was from customers producing newsprint and printing and writing grades of paper. Significant declines in the production of printing and writing paper grades have also led to a drop in the construction of recycled tissue mills, as those mills use printing and writing grades of waste paper as their fiber source. The increased use of digital media has had, and will continue to have, an adverse effect on demand for our products in those markets.
Price increases and shortages in raw materials and components could adversely impact our operating results.
We use a variety of raw materials and commodities to manufacture our products. Increases in the prices of such raw materials and commodities could adversely affect our operating results if we were unable to fully offset the effect of these increased costs through price increases, productivity improvements, or cost reduction programs.
We rely on suppliers to secure commodity and component products required for the manufacture of our products. A disruption in deliveries to or from suppliers or decreased availability of such components or commodities could have an adverse effect on our ability to meet our commitments to customers or increase our operating costs. We believe our sources of raw materials and component products will generally be sufficient for our needs in the foreseeable future. However, our operating results could be negatively impacted if supply is insufficient for our operations.
The raw material used in the manufacture of our fiber-based granules is obtained from two paper mills. Although we believe that our relationships with the mills are good, the mills may not continue to supply sufficient raw material. From time to time, we have experienced some difficulty in obtaining sufficient raw material to operate at optimal production levels. We continue to work with the mills to ensure a stable supply of raw material. To date, we have been able to meet all of our customer delivery requirements, but there can be no assurance that we will be able to meet future delivery requirements. If the mills were to be unable or unwilling to supply us with sufficient fiber, we would be forced to find one or more alternative suppliers for this raw material.
We are dependent upon certain suppliers for components and raw materials.
Some of our businesses depend on certain suppliers to provide raw materials or other critical components of our equipment. If we could not obtain sufficient supplies of these components or these sources of supply ceased to be available to
9
|
Kadant Inc.
|
2016 Annual Report
|
|
us, we could experience shortages in raw materials or be unable to meet our delivery commitments. Alternative sources of supply could be more expensive. Such events would have an adverse effect on our operating results.
Our business is subject to economic, currency, political, and other risks associated with international sales and operations.
We sell our products globally and operate multiple manufacturing operations worldwide, including operations in Canada, China, Europe, Mexico, and Brazil. International revenues and operations are subject to a number of risks, including the following:
|
–
|
agreements may be difficult to enforce and receivables difficult to collect through a foreign country's legal system;
|
|
|
–
|
foreign customers may have longer payment cycles;
|
|
|
–
|
foreign countries may impose additional withholding taxes or otherwise tax our foreign income, impose tariffs, adopt other restrictions on foreign trade, impose currency restrictions or enact other protectionist or anti-trade measures;
|
|
|
–
|
worsening economic conditions may result in worker unrest, labor actions, and potential work stoppages;
|
|
|
–
|
political unrest may disrupt commercial activities of ours or our customers;
|
|
|
–
|
it may be difficult to repatriate funds, due to unfavorable domestic and foreign tax consequences or other restrictions or limitations imposed by foreign governments; and
|
|
|
–
|
the protection of intellectual property in foreign countries may be more difficult to enforce.
|
|
We operate manufacturing facilities throughout the world, which subjects us to varying risks of disrupted production.
We operate businesses with significant manufacturing facilities throughout the world. Our manufacturing facilities and operations could be disrupted by natural disaster, failure of equipment and operating systems, labor strike, war, political unrest, terrorist activity, or economic upheaval. Some of these conditions are more likely to occur in certain geographic regions in which we operate. In addition, equipment and operating systems necessary for our manufacturing businesses may break down, perform poorly, or fail. Any such disruption could cause losses in efficiencies, delays in shipments of our products and the loss of sales and customers, and insurance proceeds may not adequately compensate us for our losses.
Implementing our acquisition strategy involves risks, and our failure to successfully implement this strategy could have a material adverse effect on our business.
As part of our capital allocation strategy, we aim to grow our business by selectively pursuing acquisitions to supplement our organic growth. Our strategy includes the acquisition of technologies and businesses that complement or augment our existing products and services or may involve entry into a new process industry. We are continuing to actively pursue additional acquisition opportunities, some of which may be material to our business and financial performance, and involve significant cash expenditures and the incurrence of significant debt. Although we have been successful with this strategy in the past, we may not be able to grow our business in the future through acquisitions for a number of reasons, including:
|
–
|
difficulties identifying and executing acquisitions;
|
|
|
–
|
competition with other prospective buyers resulting in our inability to complete an acquisition or in our paying a substantial premium over the fair value of the net assets of the acquired business;
|
|
|
–
|
inability to obtain regulatory approvals, including antitrust approvals;
|
|
|
–
|
difficulty in assimilating operations, technologies, products and the key employees of the acquired business;
|
|
|
–
|
inability to maintain existing customers or to sell the products and services of the acquired business to our existing customers;
|
|
|
–
|
inability to retain key management of the acquired business;
|
|
|
–
|
diversion of management's attention from other business concerns;
|
|
|
–
|
inability to improve the revenues and profitability or realize the cost savings and synergies expected of the acquisition;
|
|
|
–
|
assumption of significant liabilities, some of which may be unknown at the time;
|
|
|
–
|
potential future impairment of the value of goodwill and intangible assets acquired; and
|
|
|
–
|
identification of internal control deficiencies of the acquired business.
|
|
10
|
Kadant Inc.
|
2016 Annual Report
|
|
We are required to record transaction and acquisition-related costs in the period incurred. Once completed, acquisitions may involve significant integration costs. These acquisition-related costs could be significant in a reporting period and have an adverse effect on our results of operations.
Any acquisition we complete may be made at a substantial premium over the fair value of the net identifiable assets of the acquired business. We are required to assess the realizability of goodwill and indefinite-lived intangible assets annually, and whenever events or changes in circumstances indicate that goodwill and intangible assets, including definite-lived intangible assets, may be impaired. These events or circumstances would generally include operating losses or a significant decline in earnings associated with the acquired business or assets, and our ability to realize the value of goodwill and intangible assets will depend on the future cash flows of these businesses. We may incur impairment charges to write down the value of our goodwill and acquired intangible assets in the future if the assets are not deemed recoverable, which could have a material adverse effect on our operating results.
It may be difficult for us to implement our strategies for improving internal growth.
Some of the markets in which we compete are mature and have relatively low growth rates. We pursue a number of strategies to improve our internal growth, including:
|
–
|
strengthening our presence in selected geographic markets, including emerging markets and existing markets where we see opportunities;
|
|
|
–
|
focusing on parts and consumables sales;
|
|
|
–
|
using low-cost manufacturing bases, such as China and Mexico;
|
|
|
–
|
allocating research and development funding to products with higher growth prospects;
|
|
|
–
|
developing new applications for our technologies;
|
|
|
–
|
combining sales and marketing operations in appropriate markets to compete more effectively;
|
|
|
–
|
finding new markets for our products; and
|
|
|
–
|
continuing to develop cross-selling opportunities for our products and services to take advantage of our depth of product offerings.
|
|
We may not be able to successfully implement these strategies, and these strategies may not result in the expected growth of our business.
We are subject to intense competition in all our markets.
We believe that the principal competitive factors affecting the markets for our products include technical expertise and process knowledge, product innovation, product quality, and price. Our competitors include a number of large multinational corporations that may have substantially greater financial, marketing, and other resources than we do. As a result, they may be able to adapt more quickly to new or emerging technologies and changes in customer requirements, or to devote greater resources to the promotion and sale of their services and products. Competitors' technologies may prove to be superior to ours. Our current products, those under development, and our ability to develop new technologies may not be sufficient to enable us to compete effectively. Competition, especially in China, has increased as new companies enter the market and existing competitors expand their product lines and manufacturing operations.
Adverse changes to the soundness of our suppliers and customers could affect our business and results of operations.
All of our businesses are exposed to risk associated with the creditworthiness of our key suppliers and customers, including pulp and paper manufacturers and other industrial customers, many of which may be adversely affected by volatile conditions in the financial markets, worldwide economic downturns, and difficult economic conditions. These conditions could result in financial instability, bankruptcy, or other adverse effects at any of our suppliers or customers. The consequences of such adverse effects could include the interruption of production at the facilities of our suppliers, the reduction, delay or cancellation of customer orders, delays in or the inability of customers to obtain financing to purchase our products or pay amounts due, and bankruptcy of customers or other creditors. Any adverse changes to the soundness of our suppliers or customers may adversely affect our cash flows, profitability, or financial condition.
Changes in our tax provision or exposure to additional income tax liabilities could affect our profitability.
We derive a significant portion of our revenue and earnings from our international operations, and are subject to income and other taxes in the United States and numerous foreign jurisdictions. Changes in U.S. and foreign income tax laws and regulations, or their interpretation, could result in higher or lower income tax rates assessed or changes in the taxability of certain revenues or the deductibility of certain expenses, thereby affecting our income tax expense and profitability. A number of factors may cause our effective tax rate to fluctuate, including: changes in tax rates in various jurisdictions; unanticipated
11
|
Kadant Inc.
|
2016 Annual Report
|
|
changes in the amount of profit in jurisdictions with low statutory tax rates; the resolution of issues arising from tax audits with various tax authorities; changes in the valuation of our deferred tax assets and liabilities; adjustments to income taxes upon finalization of various tax returns; increases in expenses not deductible for tax purposes, including impairments of goodwill in connection with acquisitions; changes in available tax credits or our ability to utilize foreign tax credits; and changes in tax laws or the interpretation of such tax laws. Corporate tax reform has emerged as a priority in the United States and continues to be a priority in other jurisdictions. Changes to the tax laws and their interpretation in the United States or other jurisdictions could have significant effects on our effective tax rate and on our deferred tax assets and liabilities. Any of these factors could cause us to experience an effective tax rate significantly different from that of prior periods or current expectations, which could have an adverse effect on our results of operations or cash flows.
We may be required to reorganize our operations in response to changing conditions in the worldwide economy and the pulp and paper industry, and such actions may require significant expenditures and may not be successful.
We have undertaken various restructuring measures in the past in response to changing market conditions in the countries in which we operate and we may engage in additional cost reduction programs in the future. The costs of these programs may be significant and we may not recoup the costs of these programs. In connection with any future plant closures, delays or failures in the transition of production from existing facilities to our other facilities in other geographic regions could also adversely affect our results of operations. In addition, it is difficult to accurately forecast our financial performance in periods of economic uncertainty in a region or globally, and the efforts we have made or may make to align our cost structure may not be sufficient or able to keep pace with rapidly changing business conditions. Our profitability may decline if our restructuring efforts do not sufficiently reduce our future costs and position us to maintain or increase our sales.
Adverse changes to the soundness of financial institutions could affect us.
We have relationships with many financial institutions, including lenders under our credit facilities and insurance underwriters, and from time to time we execute transactions with counterparties in the financial industry, such as our interest rate swap arrangements and other hedging transactions. In addition, our subsidiaries in China often hold banker's acceptance drafts that are received from customers in the normal course of business. These drafts may be discounted or used to pay vendors prior to the scheduled maturity date or submitted to an acceptance bank for payment at the scheduled maturity date. These financial institutions or counterparties could be adversely affected by volatile conditions in the financial markets, economic downturns, and difficult economic conditions. These conditions could result in financial instability, bankruptcy, or other adverse effects at these financial institutions or counterparties. We may not be able to access credit facilities in the future, complete transactions as intended, or otherwise obtain the benefit of the arrangements we have entered into with such financial parties, which could adversely affect our business and results of operations.
Our debt may adversely affect our cash flow and may restrict our investment opportunities.
We amended and restated our unsecured revolving credit facility (2017 Credit Agreement) effective March 2, 2017, and extended the term for five years and increased the aggregate principal amount we could borrow up to $200 million. The 2017 Credit Agreement also includes an uncommitted unsecured incremental borrowing facility of up to an additional $100 million. We have borrowed amounts under the 2017 Credit Agreement and under other agreements to fund our operations and our acquisition strategy. We may also obtain additional long-term debt and working capital lines of credit to meet future financing needs, which would have the effect of increasing our total leverage. Our indebtedness could have negative consequences, including:
|
–
|
increasing our vulnerability to adverse economic and industry conditions;
|
|
|
–
|
limiting our ability to obtain additional financing;
|
|
|
–
|
limiting our ability to pay dividends on or to repurchase our capital stock;
|
|
|
–
|
limiting our ability to complete a merger or an acquisition;
|
|
|
–
|
limiting our ability to acquire new products and technologies through acquisitions or licensing agreements; and
|
|
|
–
|
limiting our flexibility in planning for, or reacting to, changes in our business and the industries in which we compete.
|
|
Our existing indebtedness bears interest at floating rates, and as a result, our interest payment obligations on our indebtedness will increase if interest rates increase. From time to time, we hedge a portion of our variable rate interest payment obligations through interest rate swap agreements. The counterparty to the swap agreements could demand an early termination of the swap agreements if we were to be in default under the 2017 Credit Agreement, or any agreement that amends or replaces the 2017 Credit Agreement in which the counterparty is a member, and we were unable to cure the default. If our swap
12
|
Kadant Inc.
|
2016 Annual Report
|
|
agreements were to be terminated prior to the applicable scheduled maturity date and if we were required to pay cash for the value of the swap, we could incur a loss, which could adversely affect our financial results.
Our ability to satisfy our obligations and to reduce our total debt depends on our future operating performance and on economic, financial, competitive, and other factors beyond our control. Our business may not generate sufficient cash flows to meet these obligations or to successfully execute our business strategy. The 2017 Credit Agreement includes certain financial covenants, and our failure to comply with these covenants could result in an event of default under the 2017 Credit Agreement, the swap agreement, and our other credit facilities, and would have significant negative consequences for our current operations and our future ability to fund our operations and grow our business. If we were unable to service our debt and fund our business, we could be forced to reduce or delay capital expenditures or research and development expenditures, seek additional financing or equity capital, restructure or refinance our debt, curtail or eliminate our cash dividend to stockholders, or sell assets.
Restrictions in our 2017 Credit Agreement may limit our activities.
Our 2017 Credit Agreement contains, and future debt instruments to which we may become subject may contain, restrictive covenants that limit our ability to engage in activities that could otherwise benefit us, including restrictions on our ability and the ability of our subsidiaries to:
|
–
|
incur additional indebtedness;
|
|
|
–
|
pay dividends on, redeem, or repurchase our capital stock;
|
|
|
–
|
make investments;
|
|
|
–
|
create liens;
|
|
|
–
|
sell assets;
|
|
|
–
|
enter into transactions with affiliates; and
|
|
|
–
|
consolidate, merge, or transfer all or substantially all of our assets and the assets of our subsidiaries.
|
|
We are also required to meet specified financial covenants under the terms of our 2017 Credit Agreement. Our ability to comply with these financial restrictions and covenants is dependent on our future performance, which is subject to prevailing economic conditions and other factors, including factors that are beyond our control such as currency exchange rates, interest rates, changes in technology, and changes in the level of competition. Our failure to comply with any of these restrictions or covenants may result in an event of default under our 2017 Credit Agreement and other loan obligations, which could permit acceleration of the debt under those instruments and require us to repay the debt before its scheduled due date. If an event of default were to occur, we might not have sufficient funds available to make the payments required under our indebtedness. In addition, our inability to borrow funds under the 2017 Credit Agreement would have significant consequences for our business, including reducing funds available for acquisitions and other investments in our business; and impacting our ability to pay dividends and meet other financial obligations.
Furthermore, our 2017 Credit Agreement requires that any amounts borrowed under the facility be repaid by the maturity date in 2022. If we are unable to roll over the amounts borrowed into a new credit facility and we do not have sufficient cash to repay our borrowings, we may default under the 2017 Credit Agreement. We may need to repatriate cash from our overseas operations to fund the repayment and we would be required to pay taxes on the repatriated amounts. Such repatriation would have an adverse effect on our effective tax rate and cash flows.
Our future success is substantially dependent on the continued service of our senior management and other key employees.
Our future success is substantially dependent on the continued service of our senior management and other key employees. The loss of the services of our senior management or other key employees could make it more difficult to successfully operate our business and achieve our business goals. We also may be unable to retain existing management, product development, sales, operational and other support personnel that are critical to our success, which could result in harm to key customer relationships, loss of key information, expertise, or know-how, and unanticipated recruitment and training costs.
We have not independently verified the results of third-party research or confirmed assumptions or judgments on which they may be based, and the forecasted and other forward-looking information contained therein is subject to inherent uncertainties.
We refer in this report and other documents that we file with the SEC to historical, forecasted and other forward-looking information published by sources such as Resource Information Systems Inc., Forest Economic Advisors, the U.S. Census Bureau, and various market news agencies that we believe to be reliable. However, we have not independently verified this information, and with respect to the forecasted and forward-looking information, have not independently confirmed the assumptions and judgments upon which such information is based. Forecasted and other forward-looking information is
13
|
Kadant Inc.
|
2016 Annual Report
|
|
necessarily based on assumptions regarding future occurrences, events, conditions and circumstances and subjective judgments relating to various matters, and is subject to inherent uncertainties. Actual results may differ materially from the results expressed or implied by, or based upon, such forecasted and forward-looking information.
Our inability to protect our intellectual property or defend ourselves against the intellectual property claims of others could have a material adverse effect on our business. In addition, litigation to enforce our intellectual property and contractual rights or defend ourselves could result in significant litigation or licensing expense.
We seek patent and trade secret protection for significant new technologies, products, and processes because of the length of time and expense associated with bringing new products through the development process and into the marketplace. We own numerous U.S. and foreign patents and we intend to file additional applications, as appropriate, for patents covering our products. Patents may not be issued for any pending or future patent applications owned by or licensed to us, and the claims allowed under any issued patents may not be sufficiently broad to protect our technology. Any issued patents owned by or licensed to us may be challenged, invalidated, or circumvented, and the rights under these patents may not provide us with competitive advantages. In addition, competitors may design around our technology or develop competing technologies. Intellectual property rights may also be unavailable or limited in some foreign countries, which could make it easier for competitors to capture increased market share. In addition, as our patents expire, we rely on trade secrets and proprietary know-how to protect our products. We cannot be sure the steps we have taken, or will take in the future, will be adequate to deter misappropriation of our proprietary information and intellectual property. Of particular concern are developing countries, such as China, where the laws, courts, and administrative agencies may not protect our intellectual property rights as fully as in the United States or Europe.
We seek to protect trade secrets and proprietary know-how, in part, through confidentiality and non-competition agreements with our collaborators, employees, and consultants. These agreements may be breached, we may not have adequate remedies for any breach, and our trade secrets may otherwise become known or be independently developed by our competitors, or our competitors may otherwise gain access to our intellectual property.
We could incur substantial costs to defend ourselves in suits brought against us, including for alleged infringement of third-party rights, or in suits in which we may assert our intellectual property or contractual rights against others. An unfavorable outcome of any such litigation could have a material adverse effect on our business and results of operations.
Failure of our information systems or breaches of data security and cybertheft could impact our business.
We operate a geographically dispersed business and rely on the electronic storage and transmission of proprietary and confidential information, including technical and financial information, among our operations, customers and suppliers. In addition, for some of our operations, we rely on information systems controlled by third parties. Despite our security measures, our information technology and infrastructure may be vulnerable to attacks by hackers or cyberthieves or breaches due to employee error, malfeasance or other disruptions. As part of our ongoing effort to upgrade our current information systems, we are implementing new enterprise resource planning software to manage certain of our business operations. As we implement and add functionality, problems could arise that we have not foreseen. System failures, network disruptions, and breaches of data security could limit our ability to conduct business as usual, including our ability to communicate and transact business with our customers and suppliers; result in the loss or misuse of this information, the loss of business or customers, or damage to our brand or reputation; or interrupt or delay reporting our financial results. Such system failures or unauthorized access could be caused by external theft or attack, misconduct by our employees, suppliers, or competitors, or natural disasters. In addition, the cost and operational consequences of implementing further data protection measures could be significant.
Our share price fluctuates and experiences price and volume volatility.
Stock markets in general and our common stock in particular experience significant price and volume volatility from time to time. The market price and trading volume of our common stock may continue to be subject to significant fluctuations due not only to general stock market conditions but also to a change in sentiment in the market regarding our operations, business prospects, or future funding. Given the nature of the markets in which we participate and the volatility of orders, we may not be able to reliably predict future revenues and profitability, and unexpected changes may cause us to adjust our operations. A large proportion of our costs are fixed, due in part to our significant selling, research and development, and manufacturing costs. Thus, small declines in revenues could disproportionately affect our operating results. Other factors that could affect our share price and quarterly operating results include:
|
–
|
failure of our products to pass contractually agreed upon acceptance tests, which would delay or prohibit recognition of revenues under applicable accounting guidelines;
|
|
|
–
|
changes in the assumptions used for revenue recognized under the percentage-of-completion method of accounting;
|
|
|
–
|
fluctuations in revenues due to customer-initiated delays in product shipments;
|
|
14
|
Kadant Inc.
|
2016 Annual Report
|
|
|
–
|
failure of a customer to comply with an order's contractual obligations or inability of a customer to provide financial assurances of performance;
|
|
|
–
|
adverse changes in demand for and market acceptance of our products;
|
|
|
–
|
competitive pressures resulting in lower sales prices for our products;
|
|
|
–
|
adverse changes in the process industries we serve;
|
|
|
–
|
delays or problems in our introduction of new products;
|
|
|
–
|
delays or problems in the manufacture of our products;
|
|
|
–
|
our competitors' announcements of new products, services, or technological innovations;
|
|
|
–
|
contractual liabilities incurred by us related to guarantees of our product performance;
|
|
|
–
|
increased costs of raw materials or supplies, including the cost of energy;
|
|
|
–
|
changes in the timing of product orders;
|
|
|
–
|
changes in the estimates and assumptions that affect the reported amounts of assets, liabilities, revenues, or expenses;
|
|
|
–
|
the impact of acquisition accounting, including the treatment of acquisition and restructuring costs as period costs;
|
|
|
–
|
fluctuations in our effective tax rate;
|
|
|
–
|
the operating and share price performance of companies that investors consider to be comparable to us; and
|
|
|
–
|
changes in global financial markets and global economies and general market conditions.
|
|
Anti-takeover provisions in our charter documents and under Delaware law could prevent or delay transactions that our shareholders may favor.
Provisions of our charter and bylaws may discourage, delay, or prevent a merger or acquisition that our shareholders may consider favorable, including transactions in which shareholders might otherwise receive a premium for their shares. For example, these provisions:
|
–
|
authorize the issuance of "blank check" preferred stock without any need for action by shareholders;
|
|
|
–
|
provide for a classified board of directors with staggered three-year terms;
|
|
|
–
|
require supermajority shareholder voting to effect various amendments to our charter and bylaws;
|
|
|
–
|
eliminate the ability of our shareholders to call special meetings of shareholders;
|
|
|
–
|
prohibit shareholder action by written consent; and
|
|
|
–
|
establish advance notice requirements for nominations for election to our board of directors or for proposing matters that can be acted on by shareholders at shareholder meetings.
|
|
Prior to July 2011, we had a shareholder rights plan, which may have had anti-takeover effects under certain circumstances. This shareholder rights plan expired by its terms in July 2011 and was not renewed by our board of directors. However, our board of directors could adopt a new shareholder rights plan in the future that could have anti-takeover effects and might discourage, delay, or prevent a merger or acquisition that our board of directors does not believe is in our best interests and those of our shareholders, including transactions in which shareholders might otherwise receive a premium for their shares.
Economic conditions and regulatory changes caused by the United Kingdom’s likely exit from the European Union could adversely affect our business.
The announcement in June 2016 that voters in the United Kingdom (U.K.) have approved an exit from the European Union (E.U.), referred to as Brexit, resulted in volatility in the global stock markets as well as currency exchange rate fluctuations. The announcement of Brexit and likely withdrawal of the U.K. from the E.U. may also create global economic uncertainty at various periods throughout the process, which may cause our customers to closely monitor their costs and reduce their spending budgets. This could adversely affect our business, financial condition, operating results, and cash flows. Our revenues to customers in the U.K. represented approximately 3% of total revenues in 2016.
15
|
Kadant Inc.
|
2016 Annual Report
|
|
Not applicable.
We believe that our facilities are in good condition and are suitable and adequate for our present operations. We do not anticipate significant difficulty in obtaining lease renewals or alternative space as needed. The location and general character of our principal properties as of year-end
2016
are as follows:
Papermaking Systems Segment
We own approximately 1,788,000 square feet and lease approximately 333,000 square feet, under leases expiring on various dates ranging from 2017 to 2023, of manufacturing, engineering, and office space. In addition, in China, we lease the land associated with our buildings under long-term leases, which expire on dates ranging from 2049 to 2061. Our principal engineering and manufacturing facilities are located in Vitry-le-Francois, France; Jining, China; Valinhos, Brazil; Three Rivers, Michigan, United States; Georgsmarienhutte, Germany; Auburn, Massachusetts, United States; Theodore, Alabama, United States; Weesp, The Netherlands; Alfreton, England; Wuxi, China; Guadalajara, Mexico; Bury, England; Mason, Ohio, United States; Huskvarna, Sweden; and Norrkoping, Sweden.
Wood Processing Systems Segment
We lease approximately 56,000 square feet of manufacturing and office space located in Surrey, British Columbia, Canada, under a lease expiring in 2023.
Fiber-based Products
We own approximately 31,000 square feet of manufacturing and office space located in Green Bay, Wisconsin, United States. We also lease approximately 58,000 square feet of manufacturing space located in Green Bay, Wisconsin, United States on a tenant-at-will basis.
Corporate
We lease approximately 15,000 square feet in Westford, Massachusetts, United States, for our corporate headquarters under a lease expiring in 2023.
Not applicable.
Not applicable.
16
|
Kadant Inc.
|
2016 Annual Report
|
|
Market Price of Common Stock
Our common stock trades on the New York Stock Exchange under the symbol "KAI". The closing market price on the New York Stock Exchange for our common stock on March 3, 2017 was $59.80 per share.
The following table sets forth the high and low sales prices of our common stock for
2016
and
2015
, as reported in the consolidated transaction reporting system.
|
|
2016
|
2015
|
||||||||||||||
|
Quarter
|
High
|
Low
|
High
|
Low
|
||||||||||||
|
First
|
$
|
45.99
|
|
$
|
33.38
|
|
$
|
55.20
|
|
$
|
39.53
|
|
||||
|
Second
|
53.16
|
|
44.24
|
|
56.29
|
|
44.67
|
|
||||||||
|
Third
|
56.57
|
|
50.59
|
|
47.95
|
|
37.72
|
|
||||||||
|
Fourth
|
64.75
|
|
49.20
|
|
44.37
|
|
38.99
|
|
||||||||
The following table sets forth the per share dividends declared on our common stock for
2016
and
2015
.
|
Quarter
|
2016
|
2015
|
||||||
|
First
|
$
|
0.19
|
|
$
|
0.17
|
|
||
|
Second
|
$
|
0.19
|
|
$
|
0.17
|
|
||
|
Third
|
$
|
0.19
|
|
$
|
0.17
|
|
||
|
Fourth
|
$
|
0.19
|
|
$
|
0.17
|
|
||
On March 8, 2017, our board of directors declared a quarterly cash dividend of $0.21 per share, payable on May 11, 2017, and we expect to pay comparable cash dividends in the future. Nonetheless, the payment of dividends in the future will be at the discretion of the board of directors and will depend upon our earnings, capital requirements, and financial condition, among other factors. The payment of cash dividends is subject to our compliance with the consolidated leverage ratio contained in our 2017 Credit Agreement.
Holders of Common Stock
As of
February 17, 2017
, we had approximately 2,897 holders of record of our common stock. This does not include holdings in street or nominee name.
Issuer Purchases of Equity Securities
We did not repurchase any shares of our common stock during the fourth quarter of
2016
.
17
|
Kadant Inc.
|
2016 Annual Report
|
|
Performance Graph
This performance graph compares the cumulative, five-year total shareholder return assuming an investment of $100 (and the reinvestment of dividends) in our common stock, the Russell 3000 Stock Index, Dow Jones U.S. Paper Total Stock Market (TSM) Index and the Dow Jones U.S. Industrial Machinery Paper TSM Index. This year, we are changing our peer group from the Dow Jones U.S. Paper TSM Index to the Dow Jones U.S. Industrial Machinery Paper TSM Index, and accordingly, are presenting both peer groups. Our common stock trades on the New York Stock Exchange under the ticker symbol "KAI." Because our fiscal year ends on a Saturday, the graph values are calculated using the last trading day prior to the end of our fiscal year.
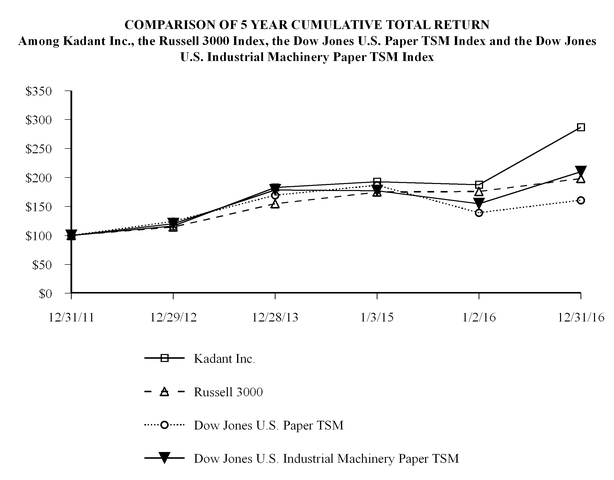
|
|
12/31/2011
|
12/29/2012
|
12/28/2013
|
1/3/2015
|
1/2/2016
|
12/31/2016
|
||||||
|
Kadant Inc.
|
100.00
|
116.14
|
182.70
|
192.76
|
187.43
|
287.02
|
||||||
|
Russell 3000
|
100.00
|
114.45
|
154.84
|
174.90
|
175.84
|
198.23
|
||||||
|
Dow Jones U.S. Paper TSM
|
100.00
|
124.15
|
169.54
|
186.50
|
139.34
|
160.91
|
||||||
|
Dow Jones U.S. Industrial Machinery Paper TSM
|
100.00
|
120.24
|
178.51
|
177.03
|
154.89
|
210.09
|
||||||
18
|
Kadant Inc.
|
2016 Annual Report
|
|
|
(In thousands, except per share amounts)
|
2016
|
2015
|
2014
|
2013
|
2012 (c)
|
|||||||||||||||
|
Statement of Income Data
(a)
|
||||||||||||||||||||
|
Revenues (b)
|
$
|
414,126
|
|
$
|
390,107
|
|
$
|
402,127
|
|
$
|
344,499
|
|
$
|
331,751
|
|
|||||
|
Operating Income
|
45,573
|
|
50,119
|
|
42,086
|
|
33,303
|
|
36,444
|
|
||||||||||
|
Amounts Attributable to Kadant
:
|
|
|
|
|
|
|
|
|
|
|
||||||||||
|
Income from Continuing Operations
|
32,074
|
|
34,315
|
|
28,682
|
|
23,481
|
|
30,880
|
|
||||||||||
|
Income (Loss) from Discontinued Operation
|
3
|
|
74
|
|
(23
|
)
|
(62
|
)
|
743
|
|
||||||||||
|
Net Income
|
$
|
32,077
|
|
$
|
34,389
|
|
$
|
28,659
|
|
$
|
23,419
|
|
$
|
31,623
|
|
|||||
|
Earnings per Share for Continuing Operations:
|
|
|
|
|
|
|
|
|
|
|
||||||||||
|
Basic
|
$
|
2.95
|
|
$
|
3.16
|
|
$
|
2.61
|
|
$
|
2.11
|
|
$
|
2.70
|
|
|||||
|
Diluted
|
$
|
2.88
|
|
$
|
3.09
|
|
$
|
2.56
|
|
$
|
2.07
|
|
$
|
2.66
|
|
|||||
|
Earnings per Share:
|
|
|
|
|
|
|
||||||||||||||
|
Basic
|
$
|
2.95
|
|
$
|
3.16
|
|
$
|
2.61
|
|
$
|
2.10
|
|
$
|
2.76
|
|
|||||
|
Diluted
|
$
|
2.88
|
|
$
|
3.10
|
|
$
|
2.56
|
|
$
|
2.07
|
|
$
|
2.73
|
|
|||||
|
Cash Dividends Declared per Common Share
|
$
|
0.76
|
|
$
|
0.68
|
|
$
|
0.60
|
|
$
|
0.50
|
|
$
|
—
|
|
|||||
|
Balance Sheet Data
|
|
|
|
|
|
|
|
|
|
|
||||||||||
|
Working Capital (d)
|
$
|
118,437
|
|
$
|
108,492
|
|
$
|
96,504
|
|
$
|
106,486
|
|
$
|
100,301
|
|
|||||
|
Total Assets
|
470,691
|
|
415,498
|
|
413,747
|
|
442,168
|
|
358,948
|
|
||||||||||
|
Long-Term Obligations (e)
|
65,768
|
|
26,000
|
|
25,250
|
|
38,010
|
|
6,250
|
|
||||||||||
|
Stockholders' Equity
|
284,279
|
|
267,945
|
|
265,459
|
|
270,421
|
|
249,967
|
|
||||||||||
______________________
|
(a)
|
Fiscal year 2016 and 2015 each contained 52 weeks, fiscal year 2014 contained 53 weeks, and fiscal years 2013 and 2012 each contained 52 weeks.
|
|
(b)
|
Includes incremental revenues of $40.8 million in 2016 and $29.6 million in 2014 from the acquisitions of PAAL in April 2016 and the Wood Processing Systems business in November 2013, respectively.
|
|
(c)
|
Includes a $4.6 million discrete tax benefit primarily due to the reversal of valuation allowances on certain deferred tax assets.
|
|
(d)
|
Includes net current deferred tax assets of $9.5 million, $10.1 million, and $8.4 million in 2014, 2013, and 2012, respectively. We adopted Accounting Standards Update (ASU) No. 2015-07 for year-end 2015, which required that deferred tax assets and liabilities be classified as non-current. Prior period amounts have not been restated.
|
|
(e)
|
Includes additional borrowings of $27.5 million and $24.3 million for the acquisitions of PAAL in April 2016 and the Wood Processing Systems business in November 2013, respectively.
|
Reference is made throughout this Management's Discussion and Analysis of Financial Condition and Results of Operations to Notes included in our consolidated financial statements beginning on page F-1 of this Report.
Overview
Company Overview
We are a leading global supplier of equipment and critical components used in process industries worldwide. In addition, we manufacture granules made from papermaking by-products. We have a diverse and large customer base, including most of the world's major paper and OSB manufacturers, and our products, technologies, and services play an integral role in enhancing process efficiency, optimizing energy utilization, and maximizing productivity in resource-intensive industries. We believe our large installed base provides us with a spare parts and consumables business that yields higher margins than our capital equipment business. In
2016
, approximately 62% of our revenue was from the sale of parts and consumables products.
Our continuing operations are comprised of two reportable operating segments: Papermaking Systems and Wood Processing Systems, and a separate product line, Fiber-based Products. Through our Papermaking Systems segment, we develop, manufacture, and market a range of equipment and products for the global papermaking, paper recycling, recycling and waste management, and other process industries. Through our Wood Processing Systems segment, we develop, manufacture, and market stranders and related equipment used in the production of OSB, and sell debarking and wood chipping equipment used in the forest products and the pulp and paper industries. Through this segment, we also provide refurbishment
19
|
Kadant Inc.
|
2016 Annual Report
|
|
and repair of pulping equipment for the pulp and paper industry. Through our Fiber-based Products business, we manufacture and sell granules derived from pulp fiber for use as carriers for agricultural, home lawn and garden, and professional lawn, turf and ornamental applications, as well as for oil and grease absorption.
2016 Acquisition
On April 4, 2016, we acquired all the outstanding shares of RT Holding GmbH, the parent corporation of a group of companies known as the PAALGROUP (PAAL), for approximately 49.7 million euros, net of cash acquired, or approximately $56.6 million. We paid additional post-closing consideration of $0.2 million to the sellers in the first quarter of 2017. PAAL manufactures balers and related equipment used in the processing of recyclable and waste materials. This acquisition, which is included in our Papermaking Systems segment's Stock-Preparation product line, broadened our product portfolio and extended our presence deeper into recycling and waste management. PAAL, headquartered in Germany, also has operations in the United Kingdom, France, and Spain.
International Sales
During
2016
and
2015
, approximately 60% and 50%, respectively, of our sales were to customers outside the United States, principally in Europe and Asia. The increase in the percentage of sales to customers outside the United States was primarily due to the acquisition of PAAL. We generally seek to charge our customers in the same currency in which our operating costs are incurred. However, our financial performance and competitive position can be affected by currency exchange rate fluctuations affecting the relationship between the U.S. dollar and foreign currencies. We seek to reduce our exposure to currency fluctuations through the use of forward currency exchange contracts. We may enter into forward contracts to hedge certain firm purchase and sale commitments denominated in currencies other than our subsidiaries' functional currencies.
Application of Critical Accounting Policies and Estimates
Management's discussion and analysis of financial condition and results of operations is based upon our consolidated financial statements, which have been prepared in accordance with accounting principles generally accepted in the United States. The preparation of these consolidated financial statements requires us to make estimates and assumptions that affect the reported amounts of assets and liabilities, disclosure of contingent assets and liabilities at the date of our consolidated financial statements, and the reported amounts of revenues and expenses during the reporting period. Our actual results may differ from these estimates under different assumptions or conditions.
Critical accounting policies are defined as those that entail significant judgments and uncertainties, and could potentially result in materially different results under different assumptions and conditions. We believe that our most critical accounting policies upon which our financial position depends, and which involve the most complex or subjective decisions or assessments, are those described below. For a discussion on the application of these and other accounting policies, see Note 1 to the consolidated financial statements.
Revenue Recognition and Accounts Receivable.
Most of our revenue is recognized under Accounting Standards Codification (ASC) 605, "Revenue Recognition" (ASC 605), when the following criteria are met: persuasive evidence of an arrangement exists, delivery has occurred or service has been rendered, the sales price is fixed or determinable, and collectability is reasonably assured. We also enter into arrangements with customers that have multiple deliverables, such as equipment and installation, and we recognize revenues and profits on certain long-term contracts using the percentage-of-completion and completed-contract methods of accounting.
|
•
|
Revenue Recognition Methods.
Under ASC 605, when the terms of sale include customer acceptance provisions, and compliance with those provisions cannot be demonstrated until customer acceptance, we recognize revenues upon such acceptance. The Company includes in revenues amounts invoiced for shipping and handling with the corresponding costs reflected in cost of revenues. Provisions for discounts, warranties, returns, and other adjustments are provided for in the period in which the related sales are recorded. Sales taxes, value-added taxes and certain excise taxes collected from customers and remitted to governmental authorities are accounted for on a net basis and are therefore excluded from revenue.
|
Most of our revenue is recognized in accordance with the accounting policies in the preceding paragraph. However, when a sale arrangement involves multiple elements, such as equipment and installation, we consider the guidance in ASC 605. Such transactions are evaluated to determine whether the deliverables in the arrangement represent separate units of accounting based on the following criteria: the delivered item has value to the customer on a stand-alone basis, and if the contract includes a general right of return relative to the delivered item, delivery or performance of the undelivered item is considered probable and substantially under our control. Revenue is allocated to each unit of accounting or element based on relative selling prices and is recognized as each element is delivered or completed. We determine relative selling prices by using either vendor-specific objective evidence
20
|
Kadant Inc.
|
2016 Annual Report
|
|
(VSOE) if that exists, or third-party evidence of selling price. When neither VSOE or third-party evidence of selling price exists for a deliverable, we use our best estimate of the selling price for that deliverable. In cases in which elements cannot be treated as separate units of accounting, the elements are combined into a single unit of accounting for revenue recognition purposes.
The complexity of all issues related to the assumptions, risks, and uncertainties inherent in the application of ASC 605 affects the amounts reported as revenues in our consolidated financial statements. Under ASC 605, we may not be able to reliably predict future revenues and profitability due to the difficulty of estimating when installation will be performed or when we will meet the contractually agreed upon performance tests, which can delay or prohibit recognition of revenues. The determination of when we install the equipment or fulfill the performance guarantees is largely dependent on our customers, their willingness to allow installation of the equipment or performance of the appropriate tests in a timely manner, and their cooperation in addressing possible problems that would impede achievement of the performance guarantee criteria. Unexpected changes in the timing related to the completion of installation or performance guarantees could cause our revenues and earnings to be significantly affected.
|
•
|
Percentage-of-Completion.
Revenues recorded under the percentage-of-completion method of accounting pursuant to ASC 605 were $23.3 million, $32.1 million, and $19.1 million in
2016
,
2015
, and
2014
, respectively. We determine the percentage of completion by comparing the actual costs incurred to date to an estimate of total costs to be incurred on each contract. If a loss is indicated on any contract in process, a provision is made currently for the entire loss. Our contracts generally provide for billing of customers upon the attainment of certain milestones specified in the contract. Revenues earned on contracts in process in excess of billings are classified as unbilled contract costs and fees, and amounts billed in excess of revenues earned are classified as billings in excess of contract costs and fees, which are included in other current liabilities. The estimation process under the percentage-of-completion method affects the amounts reported in our consolidated financial statements. A number of internal and external factors affect our percentage-of-completion and cost of sales estimates, including labor rate and efficiency variances, estimates of warranty costs, estimated future material prices from vendors, and customer specification and testing requirements. Although we make every effort to ensure the accuracy of our estimates in the application of this accounting policy, if our actual results were to differ from our estimates, or if we were to use different assumptions, it is possible that materially different amounts could be reported as revenues in our consolidated financial statements.
|
|
•
|
Completed-Contract Method.
For long-term contracts that do not meet the criteria under ASC 605-35 to be accounted for under the percentage-of-completion method, we recognize revenue, primarily in China, using the completed-contract method. When using the completed-contract method, we recognize revenue when the contract has been substantially completed, the product has been delivered, and, if applicable, the customer acceptance criteria have been met.
|
We exercise judgment in determining our allowance for doubtful accounts, which is based on our historical collection experience, current trends, credit policies, specific customer collection issues, and accounts receivable aging categories. In determining this allowance, we look at historical write-offs of our receivables. We also look at current trends in the credit quality of our customer base as well as changes in our credit policies. We perform ongoing credit evaluations of our customers and adjust credit limits based upon payment history and each customer's current creditworthiness. We continuously monitor collections and payments from our customers. In addition, in some instances we utilize letters of credit to mitigate credit exposure. While actual bad debts have historically been within our expectations and the provisions established, we cannot guarantee that we will continue to experience the same rate of bad debts that we have had in the past. A significant change in the liquidity or financial position of any of our customers could result in the uncollectibility of the related accounts receivable and could adversely affect our operating results and cash flows in that period.
Warranty Obligations.
We offer warranties of various durations to our customers depending upon the specific product and terms of the customer purchase agreement. We typically negotiate terms regarding warranty coverage and length of warranty depending on the products and their applications. Our standard mechanical warranties require us to repair or replace a defective product during the warranty period at no cost to the customer. We record an estimate for warranty-related costs at the time of sale based on our actual historical occurrence rates and repair costs, as well as knowledge of any specific warranty problems that indicate that projected warranty costs may vary from historical patterns. These estimates are revised for variances between actual and expected claims rates. While our warranty costs have historically been within our expectations and the provisions established, we may not continue to experience the same warranty return rates or repair costs that we have in the past.
A significant increase in warranty occurrence rates or costs to repair our products would lead to an increase in the warranty provision and could have a material adverse impact on our consolidated results for the period or periods in which such returns or additional costs occur.
Income Taxes.
We operate in numerous countries under many legal forms and, as a result, are subject to the jurisdiction of numerous domestic and non-U.S. tax authorities, as well as to tax agreements and treaties among these governments.
21
|
Kadant Inc.
|
2016 Annual Report
|
|
Determination of taxable income in any jurisdiction requires the interpretation of the related tax laws and regulations and the use of estimates and assumptions regarding significant future events, such as the amount, timing and character of deductions, permissible revenue recognition methods under the tax law and the sources and character of income and available tax credits. Changes in tax laws, regulations, agreements and treaties, currency-exchange restrictions or our level of operations or profitability in each taxing jurisdiction could have an impact upon the amount of current and deferred tax balances and our results of operations.
We estimate the degree to which our deferred tax assets on deductible temporary differences and tax loss or credit carryforwards will result in an income tax benefit based on the expected profitability by tax jurisdiction, and provide a valuation allowance for these deferred tax assets if it is more likely than not that they will not be realized in the future. If it were to become more likely than not that these deferred tax assets would be realized, we would reverse the related valuation allowance. Our tax valuation allowance was $10.9 million at year-end
2016
. Should our actual future taxable income by tax jurisdiction vary from our estimates, additional allowances or reversals thereof may be necessary. When assessing the need for a valuation allowance in a tax jurisdiction, we evaluate the weight of all available evidence to determine whether it is more likely than not that some portion or all of the deferred income tax assets will not be realized. As part of this evaluation, we consider our cumulative three-year history of earnings before income taxes, taxable income in prior carryback years, future reversals of existing taxable temporary differences, prudent and feasible tax planning strategies, and expected future results of operations. As of year-end
2016
, we continued to maintain a valuation allowance in the United States against certain of our state operating loss carryforwards due to the uncertainty of future profitability in these state jurisdictions in the United States As of year-end
2016
, we maintained valuation allowances in certain foreign jurisdictions because of the uncertainty of future profitability. In the ordinary course of business there is inherent uncertainty in quantifying our income tax positions. It is our policy to provide for uncertain tax positions and the related interest and penalties based upon our assessment of whether a tax benefit is more likely than not to be sustained upon examination by tax authorities. At year-end
2016
, we believe that we have appropriately accounted for any liability for unrecognized tax benefits. To the extent we prevail in matters for which a liability for an unrecognized tax benefit is established or are required to pay amounts in excess of the liability, our effective tax rate in a given financial statement period may be affected.
We reinvest certain earnings of our international subsidiaries indefinitely, and accordingly, we do not provide for U.S. income taxes that could result from the remittance of such foreign earnings. Through year-end
2016
, we have not provided for U.S. income taxes on approximately $182.2 million of unremitted foreign earnings. The U.S. tax cost has not been determined due to the fact that it is not practicable to estimate at this time. The related foreign tax withholding, which would be required if we were to remit these foreign earnings to the United States, would be approximately $4.0 million.
Valuation of Goodwill and Intangible Assets.
We evaluate the recoverability of goodwill and indefinite-lived intangible assets as of the end of each fiscal year, or more frequently if events or changes in circumstances, such as a significant decline in sales, earnings, or cash flows, or material adverse changes in the business climate, indicate that the carrying value of an asset might be impaired. Testing goodwill for impairment involves a two-step quantitative process. However, prior to performing the two-step quantitative goodwill impairment test, we have the option to first perform an assessment of qualitative factors to determine whether it is more likely than not that the fair value of a reporting unit is less than its carrying amount.
At year-end
2016
, we performed a qualitative goodwill impairment analysis. This impairment analysis included an assessment of certain qualitative factors including the results of prior fair value calculations, the movement of our share price and market capitalization, the reporting unit and overall financial performance, and macroeconomic and industry conditions. We considered the qualitative factors and weighed the evidence obtained, and determined that it was not more likely than not that the fair value of any of the reporting units was less than its carrying amount. Although we believe the factors considered in the impairment analysis are reasonable, significant changes in any one of the assumptions used could have produced a different result.
At year-end
2016
, we performed a quantitative impairment analysis on our indefinite-lived intangible asset and determined that the asset was not impaired.
Intangible assets subject to amortization are evaluated for impairment if events or changes in circumstances indicate that the carrying value of an asset might be impaired. No indicators of impairment were identified in
2016
.
We use assumptions and estimates in determining the fair value of assets acquired and liabilities assumed in a business combination. The determination of the fair value of intangible assets, which represent a significant portion of the purchase price in many of our acquisitions, requires the use of significant judgment regarding the fair value; and whether such intangibles are amortizable or non-amortizable and, if amortizable, the period and the method by which the intangible asset will be amortized. We estimate the fair value of acquisition-related intangible assets principally based on projections of cash flows that will arise from identifiable intangible assets of acquired businesses. The projected cash flows are discounted to determine the present value of the assets at the date of acquisition. Our judgments and assumptions regarding the determination of the fair value of an intangible asset or goodwill associated with an acquired business could change as future events impact such fair values. A prolonged economic downturn, weakness in demand for our products, especially capital equipment products, or contraction in capital spending by paper companies or OSB manufacturers in our key markets could negatively affect the revenue and profitability assumptions used in our assessment of goodwill and intangible assets, which could result in additional impairment
22
|
Kadant Inc.
|
2016 Annual Report
|
|
charges. Any future impairment loss could have a material adverse effect on our long-term assets and operating expenses in the period in which an impairment is determined to exist.
Inventories.
We value our inventory at the lower of the actual cost (on a first-in, first-out; or weighted average basis) or market value and include materials, labor, and manufacturing overhead. We regularly review inventory quantities on hand and compare these amounts to historical and forecasted usage of and demand for each particular product or product line. We record a charge to cost of revenues for excess and obsolete inventory to reduce the carrying value of the inventories to net realizable value. Inventory write-downs have historically been within our expectations and the provisions established. A significant decrease in demand for our products could result in an increase in the amount of excess inventory quantities on hand, resulting in a charge for the write-down of that inventory in that period. In addition, our estimates of future product usage or demand may prove to be inaccurate, resulting in an understated or overstated provision for excess and obsolete inventory. Therefore, although we make every effort to ensure the accuracy of our forecasts of future product usage and demand, any significant unanticipated changes in demand or technological developments could have a significant impact on the value of our inventory and our reported operating results.
Pension and Other Post-Retirement Benefits.
We sponsor a noncontributory defined benefit retirement plan for the benefit of eligible employees at our Kadant Solutions division and the corporate office. Our unfunded benefit obligation related to this plan was $3.0 million at year-end
2016
and the fair value of plan assets was $29.0 million. In addition, several of our U.S. and non-U.S. subsidiaries sponsor defined benefit pension and other post-retirement benefit plans with an aggregate unfunded benefit obligation of $6.8 million at year-end
2016
and a fair value of plan assets of $0.5 million.
The cost and obligations of these arrangements are calculated using many assumptions to estimate the benefits that the employee earns while working, the amount of which cannot be completely determined until the benefit payments cease. Major assumptions used in accounting for these employee benefit plans include the discount rate, expected return on plan assets and rate of increase in employee compensation levels. Assumptions are determined based on Company data and appropriate market indicators in consultation with third-party actuaries, and are evaluated each year as of the plans' measurement dates. The fair value of plan assets is determined based on quoted market prices and observable market inputs. The unrecognized actuarial loss before tax associated with these plans totaled $9.0 million at year-end
2016
, $0.5 million of which we expect to recognize in 2017. Should any of these assumptions change, they would have an effect on net periodic benefit costs and the unfunded benefit obligation. The projected benefit obligation and expense associated with these plans are sensitive to changes in the discount rate. For the noncontributory defined benefit pension plan at our Kadant Solutions division, a 50 basis point decrease in the
2016
discount rate would have resulted in an increase in net periodic benefit costs of $0.2 million and an increase in the projected benefit obligation of $2.5 million.
Industry and Business Outlook
Our products are primarily sold in global process industries and used to produce packaging, tissue, and engineered wood. In 2016, approximately 63% of our revenue was from the sale of products that support packaging, tissue, and other paper production, other than printing and writing and newsprint paper grades. Consumption of packaging, which is primarily comprised of containerboard and boxboard, is driven by many factors, including regional economic conditions, consumer spending on non-durable goods, demand for food and beverage packaging, greater urbanization in developing regions and existing manufacturing capacity. Consumption of tissue is fairly stable and in the developed world tends to grow with the population. For both tissue and packaging, growth rates in the developing world are expected to increase as per capita consumption of paper increases with rising standards of living. In 2016, 11% of our revenue was related to products that support printing and writing paper grades as well as newsprint, which have been negatively affected by the development and increased use of digital media. While we expect the decline in the use of printing and writing and newsprint paper grades to continue due to the use of digital media, we expect global packaging and tissue production to be stable or to increase. For balers and related equipment, demand is generally driven by rising standards of living and population growth, shortage and costs of landfilling, increasing recycling rates, and environmental regulation. In 2016, 9% of our revenue was from sales to OSB producers who manufacture engineered wood panels for the housing industry. The majority of OSB demand is in North America, as North American houses are more often constructed of wood compared to other parts of the world. Demand for OSB is tied to new home construction and remodeling. The remainder of our revenue was from sales to other process industries, which in general grow with the overall economy.
Our results of operations were negatively affected by foreign currency translation in 2016 compared to 2015, and we expect our results of operations to continue to be negatively affected in 2017. China's central bank devalued the renminbi to boost the Chinese economy in 2016, which had a negative translation impact on our consolidated revenues and operating results and will continue to have a negative translation impact if this recurs. When we translate the local currency results of our foreign subsidiaries into U.S. dollars during a period in which the U.S. dollar is strengthening, our financial results will reflect decreases due to foreign currency translation. The negative effect on our financial results will continue if the U.S. dollar continues to strengthen relative to the functional currencies of our foreign subsidiaries. Similarly, if the U.S. dollar weakens compared to the functional currencies of our foreign subsidiaries, our financial results will reflect increases due to foreign
23
|
Kadant Inc.
|
2016 Annual Report
|
|
currency translation. Further, certain foreign subsidiaries may hold U.S. dollar assets or liabilities which, as the U.S. dollar strengthens versus the applicable functional currencies, will result in currency transaction gains on assets and losses on liabilities. We have presented the material effects of foreign currency translation on our financial results under Results of Operations below.
Our bookings increased 7% to $403 million in 2016, including a $39 million, or 10%, increase from an acquisition offset in part by a $9 million, or 2%, decrease from the unfavorable effects of foreign currency translation. Our bookings in 2015 of $376 million included a $16 million booking reversal. Our revenue, bookings, and income tend to be variable as demand for our capital equipment is dependent on regional economic conditions and the level of capital spending by our customers, among other factors. Demand for our parts and consumables products tends to be more predictable. Bookings for our parts and consumables products were $258 million, or 64% of total bookings, in 2016, compared to $252 million, or 67%, in 2015.
The largest and most impactful regional market for our products in 2016 was North America, and we expect this will continue to be the case in 2017. Our bookings in North America were $195 million in 2016, down 8% compared to 2015. During 2016, demand for printing, writing, and newsprint grades all declined compared to 2015, while containerboard shipments saw a modest increase according to Resource Information Systems Inc. (RISI) reports. RISI reported that North American capacity expansion in the containerboard segment is expected to increase from the 1.0% rate recorded in 2016 to 1.9% in 2017, consistent with our increased project activity in North America in the latter half of 2016. U.S. housing starts in December 2016 were at a seasonally adjusted annual rate of 1.279 million, up 10.3% compared to December 2015, according to the U.S. Census Bureau. This growth is expected to have a positive impact on demand for U.S. lumber and structural wood panels, which includes OSB.
We saw steady business activity in Europe in 2016 compared to 2015. We expect the overall economy to remain stable in Europe in 2017. Our bookings in Europe were $114 million in 2016, up 39% compared to $82 million in 2015. This increase included $39 million from an acquisition. Excluding the acquisition and a negative foreign currency translation effect of $1 million, our bookings in Europe were down 8%. Our bookings in Asia were $65 million in 2016, up 39% compared to 2015, and include a $4 million decrease from the negative effects of foreign currency translation. Our bookings in Asia in 2015 included a $16 million booking reversal for a project in China. Weak demand and a relatively soft domestic economy affected most paper grades in China in 2016. That said, we saw a significant increase in project activity in containerboard grades during the fourth quarter of 2016.The most recent RISI forecasts of containerboard demand growth of approximately 2.5% per year for the next few years suggest new capital project activity may remain at moderate levels in China in 2017. Our bookings in the rest of the world decreased 15% to $29 million in 2016 compared to 2015 and continue to be negatively affected by the recession in Brazil.
We expect to achieve diluted earnings per share (EPS) from continuing operations of $3.13 to $3.23 in 2017 on revenue of $423 to $433 million. The 2017 guidance includes an unfavorable foreign currency translation effect of $7 million on revenue and $0.10 on diluted EPS compared to 2016. For the first quarter of 2017, we expect to achieve diluted EPS from continuing operations of $0.62 to $0.66 on revenue of $97 to $100 million.
Results of Operations
2016
Compared to
2015
The following table sets forth our consolidated statement of income expressed as a percentage of total revenues:
|
|
2016
|
2015
|
||||
|
Revenues
|
100
|
%
|
100
|
%
|
||
|
Costs and Operating Expenses:
|
|
|
|
|
||
|
Cost of revenues
|
54
|
|
54
|
|
||
|
Selling, general, and administrative expenses
|
33
|
|
31
|
|
||
|
Research and development expenses
|
2
|
|
2
|
|
||
|
Other income and restructuring costs
|
—
|
|
—
|
|
||
|
|
89
|
|
87
|
|
||
|
Operating Income
|
11
|
|
13
|
|
||
|
Interest Income (Expense), Net
|
—
|
|
—
|
|
||
|
Income from Continuing Operations Before Provision for Income Taxes
|
11
|
|
13
|
|
||
|
Provision for Income Taxes
|
3
|
|
4
|
|
||
|
Income from Continuing Operations
|
8
|
%
|
9
|
%
|
||
24
|
Kadant Inc.
|
2016 Annual Report
|
|
Revenues
Revenues for
2016
and
2015
are as follows:
|
(In thousands)
|
2016
|
2015
|
||||||
|
Revenues:
|
||||||||
|
Papermaking Systems
|
$
|
366,461
|
|
$
|
342,661
|
|
||
|
Wood Processing Systems
|
36,850
|
|
36,387
|
|
||||
|
Fiber-based Products
|
10,815
|
|
11,059
|
|
||||
|
|
$
|
414,126
|
|
$
|
390,107
|
|
||
Papermaking Systems Segment
. Revenues at our Papermaking Systems segment increased $23.8 million, or 7%, to $366.5 million in
2016
from $342.7 million in
2015
, including $40.8 million in revenues from the acquisition of PAAL in April 2016, offset in part by a $7.1 million decrease from the unfavorable effects of foreign currency translation. Excluding the acquisition and foreign currency translation effect, revenues in our Papermaking Systems segment decreased $9.9 million, or 3%, primarily due to decreased capital spending by our customers in China and decreased spending by our customers in North America due to general economic uncertainty. These decreases were offset in part by increased demand for both our capital and parts and consumables products at our European operations.
Wood Processing Systems Segment.
Revenues at our Wood Processing Systems segment increased $0.5 million, or 1%, to $36.9 million in
2016
from $36.4 million in
2015
, including a $1.3 million decrease from the unfavorable effects of foreign currency translation. Excluding the effects of foreign currency translation, revenues in our Wood Processing Systems segment increased $1.8 million, or 5%, primarily due to increased demand for our parts and consumables products.
Fiber-based Products.
Revenues decreased $0.3 million, or 2%, to $10.8 million in
2016
from $11.1 million in
2015
due to decreased demand for our biodegradable granular products.
Papermaking Systems Segment by Product Line.
The following table presents revenues for our Papermaking Systems segment by product line, the changes in revenues by product line between
2016
and
2015
, and the changes in revenues by product line between
2016
and
2015
excluding the effect of currency translation. The increase (decrease) in revenues excluding the effect of currency translation represents the increase (decrease) resulting from converting
2016
revenues in local currency into U.S. dollars at
2015
exchange rates, and then comparing this result to actual revenues in
2015
. The presentation of the changes in revenues by product line excluding the effect of currency translation is a non-GAAP measure. We believe this non-GAAP measure helps investors gain an understanding of our underlying operations, consistent with how management measures and forecasts our performance, especially when comparing such results to prior periods or forecasts. This non-GAAP measure should not be considered superior to or a substitute for the corresponding generally accepted accounting principles (GAAP) measure.
|
(In thousands)
|
2016
|
2015
|
Increase (Decrease)
|
Increase (Decrease)
Excluding
Effect of
Currency
Translation
|
||||||||||||
|
Papermaking Systems Product Lines:
|
||||||||||||||||
|
Stock-Preparation
|
$
|
171,378
|
|
$
|
148,341
|
|
$
|
23,037
|
|
$
|
24,631
|
|
||||
|
Doctoring, Cleaning, & Filtration
|
105,938
|
|
101,523
|
|
4,415
|
|
8,111
|
|
||||||||
|
Fluid-Handling
|
89,145
|
|
92,797
|
|
(3,652
|
)
|
(1,866
|
)
|
||||||||
|
|
$
|
366,461
|
|
$
|
342,661
|
|
$
|
23,800
|
|
$
|
30,876
|
|
||||
Revenues from our Stock-Preparation product line increased $23.0 million, or 16%, in
2016
compared to
2015
, including $40.8 million in revenues from the acquisition of PAAL, offset in part by a $1.6 million decrease due to the unfavorable effect of foreign currency translation. Excluding the acquisition and unfavorable effect of foreign currency translation, revenues from our Stock-Preparation product line decreased $16.2 million, or 11%, in
2016
compared to
2015
, due to decreased capital spending by our Chinese customers in the first nine months of
2016
and decreased spending by our North American customers due to general economic uncertainty. By comparison,
2015
included robust spending by our customers in North America and China for our stock-preparation products. Revenues from our Doctoring, Cleaning, & Filtration product line increased $4.4 million, or 4%, in
2016
compared to
2015
, including a $3.7 million decrease from the unfavorable effect of
25
|
Kadant Inc.
|
2016 Annual Report
|
|
foreign currency translation. Excluding the unfavorable effect of foreign currency translation, revenues from our Doctoring, Cleaning, & Filtration product line increased $8.1 million, or 8%, in
2016
compared to
2015
, primarily due to increased demand for our capital products at our Chinese and European operations. Revenues from our Fluid-Handling product line decreased $3.7 million, or 4%, in
2016
compared to
2015
, including a $1.8 million decrease from the unfavorable effect of foreign currency translation. Excluding the unfavorable effect of foreign currency translation, revenues from our Fluid-Handling product line decreased $1.9 million, or 2%, in
2016
compared to
2015
, primarily due to decreased demand for both our parts and consumables and capital products at our North American operations.
Gross Profit Margin
Gross profit margins for
2016
and
2015
are as follows:
|
Gross Profit Margin:
|
2016
|
2015
|
||||
|
Papermaking Systems
|
45.9
|
%
|
45.9
|
%
|
||
|
Wood Processing Systems
|
40.9
|
%
|
47.9
|
%
|
||
|
Fiber-based Products
|
46.4
|
%
|
49.5
|
%
|
||
|
|
45.5
|
%
|
46.2
|
%
|
||
Papermaking Systems Segment.
The gross profit margin at the Papermaking Systems segment was 45.9% in both
2016
and
2015
. Increases in 2016 primarily due to higher gross profit margins on our capital products were offset by decreases due to the inclusion of lower gross margins from the acquisition of PAAL and a decrease in the proportion of higher-margin parts and consumables revenues.
Wood Processing Systems Segment.
The gross profit margin at the Wood Processing Systems segment decreased to 40.9% in
2016
from 47.9% in
2015
primarily due to lower gross profit margins on our capital products due to targeted pricing and on our parts and consumables products due to product mix.
Fiber-based Products.
The gross profit margin decreased to 46.4% in
2016
from 49.5% in
2015
primarily due to decreased manufacturing efficiency related to lower production volumes.
Operating Expenses
Selling, general, and administrative (SG&A) expenses increased $13.0 million, or 11%, to $135.8 million in
2016
from $122.8 million in
2015
, primarily due to an increase of $10.7 million from the inclusion of SG&A expenses from the PAAL acquisition and $1.8 million of acquisition-related expenses. SG&A expenses also increased in 2016 as a result of an additional $1.0 million of compliance-related costs and $0.7 million of non-recurring information system conversion costs. These increases were offset in part by a $2.3 million decrease from the favorable effect of foreign currency translation.
Total stock-based compensation expense was $5.1 million and $5.7 million in
2016
and
2015
, respectively, and is included in SG&A expenses.
Research and development (R&D) expenses increased $0.7 million, or 11%, to $7.4 million in
2016
from $6.7 million in
2015
and represented 2% of revenues in both periods. The increase in R&D expenses in
2016
primarily related to the inclusion of expenses from the PAAL acquisition.
Other Income and Restructuring Costs
Other income and restructuring costs included $0.3 million of other income and $0.5 million of restructuring costs in
2016
and
2015
, respectively. Other income in 2016 included a pre-tax gain of $0.3 million related to the sale of real estate in Sweden for cash proceeds of $0.4 million.
Restructuring costs in 2015 included severance costs of $0.3 million associated with the reduction of 25 employees in Canada and Brazil related to our 2015 restructuring plans. In addition, restructuring costs in 2015 also included severance costs of $0.2 million associated with the reduction of four employees in Sweden related to our 2014 restructuring plans. These actions were taken to streamline our operations and all occurred in our Papermaking Systems segment.
Interest Income
Interest income increased $0.1 million, or 35%, to $0.3 million in
2016
from $0.2 million in
2015
primarily due to higher average invested balances in
2016
.
26
|
Kadant Inc.
|
2016 Annual Report
|
|
Interest Expense
Interest expense increased $0.4 million, or 36%, to $1.3 million in
2016
from $0.9 million in
2015
primarily due to increases in borrowings and capital lease obligations associated with the PAAL acquisition.
Provision for Income Taxes
Our provision for income taxes was $12.1 million and $14.8 million in
2016
and
2015
, respectively, and represented 27% and 30% of pre-tax income. The effective tax rate of 27% in
2016
was lower than our statutory tax rate primarily due to the distribution of our worldwide earnings and the adoption of ASU No 2016-09 that resulted in a favorable adjustment for the net excess income tax benefits from stock-based compensation arrangements, offset in part by tax expense associated with an increase in nondeductible expenses. The effective tax rate of 30% in 2015 was lower than our statutory tax rate primarily due to the distribution of our worldwide earnings, offset in part by tax expense associated with an increase in nondeductible expenses and state income taxes. We expect our effective tax rate in 2017 to be approximately 27% to 28% compared to 27% in 2016.
Income from Continuing Operations
Income from continuing operations decreased $2.1 million, or 6%, to $32.5 million in
2016
from $34.6 million in
2015
, including a decrease in operating income of $4.5 million, offset in part by a decrease in provision for income taxes of $2.7 million (see
Revenues
,
Gross Profit Margin
,
Operating Expenses,
and
Provision for Income Taxes
discussed above).
Recent Accounting Pronouncements
Revenue from Contracts with Customers (Topic 606), Section A-Summary and Amendments That Create Revenue from Contracts with Customers (Topic 606) and Other Assets and Deferred Costs-Contracts with Customers (Subtopic 340-40).
In May 2014, the Financial Accounting Standards Board (FASB) issued ASU No. 2014-09, which requires an entity to recognize the amount of revenue to which it expects to be entitled for the transfer of promised goods or services to customers. The new guidance provides a five-step analysis of transactions to determine when and how revenue is recognized. The ASU will replace most existing revenue recognition guidance in GAAP when it becomes effective. In March 2016, the FASB issued ASU No. 2016-08, which further clarifies the guidance on the principal versus agent considerations within ASU No. 2014-09. In April 2016, the FASB issued ASU No. 2016-10 to expand the guidance on identifying performance obligations and licensing within ASU 2014-09. In May 2016, the FASB issued ASU No. 2016-11, which rescinds certain previously-issued guidance, including, among other items, guidance relating to accounting for shipping and handling fees and freight services effective upon adoption of ASU No. 2014-09. Also in May 2016, the FASB issued ASU No. 2016-12, which narrowly amended the revenue recognition guidance regarding collectability, noncash consideration, presentation of sales tax and transition. In December 2016, the FASB issued ASU No. 2016-20, which clarifies narrow aspects of Topic 606 and corrects unintended application of the guidance. These new ASUs are effective for us beginning in fiscal 2018. Early adoption is permitted in fiscal 2017. We are continuing to assess the potential effects of these ASUs on our consolidated financial statements, business processes, systems and controls. We are analyzing our current contracts and comparing our current accounting policies and practices pertaining to revenue recognition to those required under the new ASUs to identify potential differences. Our preliminary assessment of our most commonly used customer terms and conditions and routine sales transactions did not identify material impacts to our consolidated financial statements from the application of the guidance; however, a broad assessment is ongoing that includes surveying our major businesses concerning any unique customer contract terms or transactions that could have implications for the timing of revenue recognition under the new guidance. While the assessment process is ongoing, we currently anticipate adopting these ASUs using the modified retrospective transition approach. Under this approach, this guidance would apply to all new contracts initiated in fiscal 2018. For existing contracts that have remaining obligations as of the beginning of fiscal 2018, any difference between the recognition criteria in these ASUs and our current revenue recognition practices would be recognized using a cumulative effect adjustment to the opening balance of retained earnings. We are also in the process of developing and implementing appropriate changes to our business processes, systems and controls to support the recognition criteria and disclosure requirements of these ASUs.
Interest-Imputation of Interest (Subtopic 835-30), Simplifying the Presentation of Debt Issuance Costs.
In April 2015, the FASB issued ASU No. 2015-03, which requires that debt issuance costs related to a recognized debt liability be presented in the balance sheet as a direct deduction from the carrying amount of that debt liability, consistent with debt discounts. In addition, in June 2015, the FASB issued ASU No. 2015-15, which allows an entity to defer the requirements of ASU No. 2015-03 on deferred issuance costs related to line-of-credit arrangements. The recognition and measurement guidance for debt issuance costs are not affected by the amendments in these ASUs. These new disclosure items were effective for us beginning in fiscal 2016. We adopted these ASUs at the beginning of fiscal 2016. Adoption of these ASUs did not have an impact our consolidated financial statements.
Disclosures for Investments in Certain Entities That Calculate Net Asset Value per Share (or Its Equivalent).
In May 2015, the FASB issued ASU No. 2015-07, which removes the requirement to categorize within the fair value hierarchy all
27
|
Kadant Inc.
|
2016 Annual Report
|
|
investments for which fair value is measured using the net asset value per share practical expedient. This ASU also removes the requirement to make certain disclosures for all investments that are eligible to be measured at fair value using the net asset value per share practical expedient. Rather, those disclosures are limited to investments for which the entity has elected to measure the fair value using that practical expedient. We adopted the disclosure requirements in this guidance at the beginning of fiscal 2016. As this ASU is disclosure-related only, its adoption did not have an effect on our consolidated financial statements.
Inventory (Topic 330), Simplifying the Measurement of Inventory
. In July 2015, the FASB issued ASU No. 2015-11, which requires that an entity measure inventory within the scope of this ASU at the lower of cost or net realizable value. Net realizable value is the estimated selling price in the ordinary course of business, less reasonably predictable costs of completion, disposal, and transportation. Substantial and unusual losses that result from subsequent measurement of inventory should be disclosed in the financial statements. This new guidance is effective for us beginning in fiscal 2017. We do not expect that adoption of this ASU will have a material effect on our consolidated financial statements.
Business Combinations (Topic 805), Simplifying the Accounting for Measurement-Period Adjustments.
In September 2015, the FASB issued ASU No. 2015-16, which requires that an acquirer recognize adjustments to provisional amounts that are identified during the measurement period in the reporting period in which the adjustment amounts are determined. The acquirer is required to record, in the same period’s financial statements, the effect on earnings of changes in depreciation, amortization, or other income effects, if any, as a result of the change to the provisional amounts, calculated as if the accounting had been completed at the acquisition date. In addition, an entity is required to present, separately on the face of the statement of income or through disclosure in the notes, the portion of the amount recorded in current-period earnings by line item that would have been recorded in previous reporting periods if the adjustment to the provisional amounts had been recognized as of the acquisition date. We adopted this guidance at the beginning of fiscal 2016. Adoption of this ASU did not have an impact our consolidated financial statements.
Leases (Topic 842).
In February 2016, the FASB issued ASU No. 2016-02, which requires a lessee to recognize a right-of-use asset and a lease liability for operating leases, initially measured at the present value of the future lease payments, in our balance sheet. This ASU also requires a lessee to recognize a single lease cost, calculated so that the cost of the lease is allocated over the lease term, generally on a straight-line basis. This new guidance is effective for us in fiscal 2019. Early adoption is permitted. As part of the implementation of this new standard, we are in the process of reviewing current accounting policies and assessing the practical expedients allowed under this new guidance. We expect that most of our operating lease commitments will be subject to the new standard and recognized as operating lease liabilities and right-of-use assets upon adoption, which is required using the modified retrospective transition method. We are currently evaluating the other effects that the adoption of this ASU will have on our consolidated financial statements.
Compensation-Stock Compensation (Topic 718
),
Improvements to Employee Share-Based Payment Accounting.
In March 2016, the FASB issued ASU No. 2016-09, which simplifies several aspects of the accounting for share-based payment transactions, including the income tax consequences, classification of awards as either equity or liabilities, and classification in the statement of cash flows. We early adopted this ASU at the beginning of fiscal 2016. This ASU requires that excess income tax benefits and tax deficiencies related to stock-based compensation arrangements be recognized as discrete items within the provision for income taxes instead of capital in excess of par value in the reporting period in which they occur. As a result of the adoption of this ASU, we recognized an income tax benefit of $0.6 million, or $0.05 per diluted share, in our consolidated statement of income in 2016. We prospectively adopted the requirement to classify the excess tax benefits from stock-compensation awards within operating activities in the consolidated statement of cash flows in 2016. Prior period amounts were not restated. We also adopted the guidance in this ASU that requires that taxes paid related to the withholding of common stock upon the vesting of employee stock awards be presented separately within financing activities in the consolidated statement of cash flows. We have retrospectively restated fiscal 2015 and 2014 to reclassify the comparable amount, which was previously presented in other current liabilities within operating activities. There were no other material effects from adoption of this ASU on our consolidated financial statements.
Financial Instruments-Credit Losses (Topic 326), Measurement of Credit Losses on Financial Instruments.
In June 2016, the FASB issued ASU No. 2016-13, which significantly changes the way entities recognize impairment of many financial assets by requiring immediate recognition of estimated credit losses expected to occur over their remaining lives. This new guidance is effective for us in fiscal 2020. Early adoption is permitted beginning in fiscal 2019. We are currently evaluating the effects that the adoption of this ASU will have on our consolidated financial statements.
Statement of Cash Flows (Topic 230), Classification of Certain Cash Receipts and Cash Payments.
In August 2016, the FASB issued ASU No. 2016-15, which simplifies the diversity in practice related to the presentation and classification of certain cash receipts and cash payments in the statement of cash flows under Topic 230. This ASU addresses the following eight specific cash flow issues: debt prepayment or debt extinguishment costs; settlement of zero-coupon debt instruments or other debt instruments with coupon interest rates that are insignificant in relation to the effective interest rate of the borrowing; contingent consideration payments made after a business combination; proceeds from the settlement of insurance claims; proceeds from the settlement of corporate-owned life insurance; distributions received from equity method investees; beneficial interests in securitization transactions; and separately identifiable cash flows and application of the predominance principle.
28
|
Kadant Inc.
|
2016 Annual Report
|
|
This new guidance is effective for us in fiscal 2018. Early adoption is permitted. We do not believe that adoption of this ASU will have a material effect on our consolidated financial statements.
Income Taxes (Topic 740), Intra-Entity Transfers of Assets Other Than Inventory.
In October 2016, the FASB issued ASU No. 2016-16, which requires an entity to recognize the income tax consequences of an intra-entity transfer of an asset other than inventory when the transfer occurs and eliminates the exception for an intra-entity transfer of an asset other than inventory. This new guidance is effective for us in fiscal 2018 with adoption required on a modified retrospective basis through a cumulative-effect adjustment directly to retained earnings as of the beginning of the period of adoption. Early adoption is permitted. We are currently evaluating the effect that the adoption of this ASU will have on our consolidated financial statements.
Statement of Cash Flows (Topic 230), Restricted Cash.
In November 2016, the FASB issued ASU No. 2016-18, which requires inclusion of restricted cash and restricted cash equivalents within cash and cash equivalents when reconciling the beginning-of-period and end-of-period total amounts shown on the statement of cash flows. This new guidance is effective for us in fiscal 2018. Early adoption is permitted. We are currently evaluating the effect that the adoption of this ASU will have on our consolidated financial statements.
Business Combinations (Topic 805), Clarifying the Definition of a Business.
In January 2017, the FASB issued ASU No. 2017-01, which clarifies the definition of a business with the objective of adding guidance to assist entities with evaluating whether transactions should be accounted for as acquisitions (or disposals) of assets or businesses. The revised definition of a business under ASU 2017-01 will reduce the number of transactions that are accounted for as business combinations. This new guidance is effective on a prospective basis for us in fiscal 2018. Early adoption is allowed for certain transactions. We are currently evaluating the effects that the adoption of this ASU will have on our consolidated financial statements.
Accounting Changes and Error Corrections (Topic 250) and Investments - Equity Method and Joint Ventures (Topic 323), Amendments to SEC Paragraphs Pursuant to Staff Announcements at the September 22, 2016 and November 17, 2016 EITF Meetings.
In January 2017, the FASB issued ASU No. 2017-03 that provides amendments that add paragraph 250-10-S99-6 which includes the text of "SEC Staff Announcement: Disclosure of the Impact That Recently Issued Accounting Standards Will Have on the Financial Statements of a Registrant When Such Standards Are Adopted in a Future Period (in accordance with Staff Accounting Bulletin (SAB) Topic 11.M). This announcement applies to ASU No. 2014-09,
Revenue from Contracts with Customers (Topic 606)
; ASU No. 2016-02,
Leases (Topic 842)
; and ASU 2016-03,
Financial Instruments - Credit Losses (Topic 326), Measurement of Credit Losses on Financial Instruments
; and subsequent amendments. Therefore, we have enhanced our disclosures regarding the impact that these recently issued accounting standards to be adopted in future periods will have on our accounting and disclosures in this summary of recent accounting policies.
Intangibles - Goodwill and Other (Topic 350), Simplifying the Test for Goodwill Impairment.
In January 2017, the FASB issued ASU No. 2017-04, which eliminates Step 2 in goodwill impairment testing, which requires that goodwill impairment losses be measured as the difference between the implied value of a reporting unit’s goodwill and its carrying amount. This ASU will reduce the cost and complexity of impairment testing by requiring goodwill impairment losses to be measured as the excess of the reporting unit’s carrying amount, including goodwill and related goodwill tax effects, over its fair value. This new guidance is effective on a prospective basis for us in fiscal 2020. Early adoption is permitted. We do not believe that adoption of this ASU will have a material effect on our consolidated financial statements.
2015 Compared to 2014
The following table sets forth our consolidated statement of income expressed as a percentage of total revenues:
|
|
2015
|
2014
|
||||
|
Revenues
|
100
|
%
|
100
|
%
|
||
|
Costs and Operating Expenses:
|
|
|
|
|
||
|
Cost of revenues
|
54
|
|
56
|
|
||
|
Selling, general, and administrative expenses
|
31
|
|
32
|
|
||
|
Research and development expenses
|
2
|
|
2
|
|
||
|
Restructuring costs
|
—
|
|
—
|
|
||
|
|
87
|
|
90
|
|
||
|
Operating Income
|
13
|
|
10
|
|
||
|
Interest Income (Expense), Net
|
—
|
|
—
|
|
||
|
Income from Continuing Operations Before Provision for Income Taxes
|
13
|
|
10
|
|
||
|
Provision for Income Taxes
|
4
|
|
3
|
|
||
|
Income from Continuing Operations
|
9
|
%
|
7
|
%
|
||
29
|
Kadant Inc.
|
2016 Annual Report
|
|
Revenues
Revenues for 2015 and 2014 are as follows:
|
(In thousands)
|
2015
|
2014
|
||||||
|
Revenues:
|
||||||||
|
Papermaking Systems
|
$
|
342,661
|
|
$
|
348,199
|
|
||
|
Wood Processing Systems
|
36,387
|
|
41,647
|
|
||||
|
Fiber-based Products
|
11,059
|
|
12,281
|
|
||||
|
|
$
|
390,107
|
|
$
|
402,127
|
|
||
Papermaking Systems Segment
. Revenues at our Papermaking Systems segment decreased $5.5 million, or 2%, to $342.7 million in
2015
from $348.2 million in
2014
, including a $26.4 million decrease from the unfavorable effects of foreign currency exchange. Excluding the effects of foreign currency exchange, revenues in our Papermaking Systems segment increased $20.9 million primarily due to increased demand for our parts and consumables products, especially in our Stock-Preparation product line, and the inclusion of $6.7 million in revenue from an acquisition made in 2014.
Wood Processing Systems Segment.
Revenues at our Wood Processing Systems segment decreased $5.2 million, or 13%, to $36.4 million in
2015
from $41.6 million in
2014
, including a $5.8 million decrease from the unfavorable effects of foreign currency exchange. Excluding the effects of foreign currency translation, revenues in our Wood Processing Systems segment increased $0.6 million, or 1%, primarily due to increased demand for our parts and consumables products.
Fiber-based Products.
Revenues decreased $1.2 million, or 10%, to $11.1 million in
2015
from $12.3 million in
2014
due to decreased demand for our biodegradable granular products.
Papermaking Systems Segment by Product Line.
The following table presents revenues for our Papermaking Systems segment by product line, the changes in revenues by product line between
2015
and
2014
, and the changes in revenues by product line between
2015
and
2014
excluding the effect of currency translation. The increase (decrease) in revenues excluding the effect of currency translation represents the increase (decrease) resulting from converting
2015
revenues in local currency into U.S. dollars at
2014
exchange rates, and then comparing this result to actual revenues in
2014
. The presentation of the changes in revenues by product line excluding the effect of currency translation is a non-GAAP measure. We believe this non-GAAP measure helps investors gain an understanding of our underlying operations, consistent with how management measures and forecasts our performance, especially when comparing such results to prior periods or forecasts. This non-GAAP measure should not be considered superior to or a substitute for the corresponding GAAP measure.
|
(In thousands)
|
2015
|
2014
|
Increase (Decrease)
|
Increase (Decrease)
Excluding
Effect of
Currency
Translation
|
||||||||||||
|
Papermaking Systems Product Lines:
|
||||||||||||||||
|
Stock-Preparation
|
$
|
148,341
|
|
$
|
127,496
|
|
$
|
20,845
|
|
$
|
28,883
|
|
||||
|
Doctoring, Cleaning, & Filtration
|
101,523
|
|
117,389
|
|
(15,866
|
)
|
(7,409
|
)
|
||||||||
|
Fluid-Handling
|
92,797
|
|
103,314
|
|
(10,517
|
)
|
(603
|
)
|
||||||||
|
|
$
|
342,661
|
|
$
|
348,199
|
|
$
|
(5,538
|
)
|
$
|
20,871
|
|
||||
Revenues in our Stock-Preparation product line increased $20.8 million, or 16%, in 2015 compared to 2014, including an $8.1 million decrease due to the unfavorable effect of foreign currency translation. Excluding the effect of foreign currency translation, revenues from our Stock-Preparation product line increased $28.9 million, or 23%, in 2015 compared to 2014, due to increased demand for our parts and consumables products at our North American and European operations, increased demand for our capital products at our North American and Chinese operations, and the inclusion of $6.7 million in revenue from an acquisition made in 2014. Revenues in our Doctoring, Cleaning, & Filtration product line in 2015 included a decrease of $8.5 million from the unfavorable effect of foreign currency translation compared to 2014. Excluding the unfavorable effect of foreign currency translation, revenues from our Doctoring, Cleaning, & Filtration product line in 2015 decreased $7.4 million, or 6%, compared to 2014, primarily due to decreased demand for our capital products at our European and North American operations. This decrease was offset in part by increased demand for our parts and consumables products at our Chinese operations. Revenues in our Fluid-Handling product line in 2015 included a decrease of $9.9 million from the
30
|
Kadant Inc.
|
2016 Annual Report
|
|
unfavorable effect of foreign currency translation compared to 2014. Excluding the unfavorable effect of foreign currency translation, revenues in our Fluid-Handling product line decreased $0.6 million, or 1%, in 2015 compared to 2014, primarily due to decreased demand for our parts and consumables products.
Gross Profit Margin
Gross profit margins for
2015
and
2014
are as follows:
|
Gross Profit Margin:
|
2015
|
2014
|
||||
|
Papermaking Systems
|
45.9
|
%
|
45.4
|
%
|
||
|
Wood Processing Systems
|
47.9
|
%
|
35.4
|
%
|
||
|
Fiber-based Products
|
49.5
|
%
|
45.7
|
%
|
||
|
|
46.2
|
%
|
44.4
|
%
|
||
Papermaking Systems Segment.
The gross profit margin at the Papermaking Systems segment increased to 45.9% in
2015
from 45.4% in
2014
primarily due to a higher proportion of parts and consumables products sold in 2015, which tend to have higher gross margins.
Wood Processing Systems Segment.
The gross profit margin at the Wood Processing Systems segment increased to 47.9% in
2015
from 35.4% in
2014
primarily due to higher margins from our parts and consumables products. In addition, the gross profit margin in 2014 was reduced by amortization expense associated with acquired profit in inventory totaling $2.1 million, which had the effect of lowering the gross profit margin by 5.1 percentage points in 2014.
Fiber-based Products.
The gross profit margin increased to 49.5% in
2015
from 45.7% in
2014
primarily due to the lower cost of natural gas used in the production process.
Operating Expenses
SG&A expenses decreased $6.5 million, or 5%, to $122.8 million in
2015
from $129.3 million in
2014
, due to a decrease of $9.4 million, or 7%, from the favorable effect of foreign currency translation, offset in part by an increase of $1.6 million from SG&A expenses from an acquisition made in 2014.
Total stock-based compensation expense was $5.7 million and $5.8 million in
2015
and
2014
, respectively, and is included in SG&A expenses.
R&D expenses increased $0.5 million, or 8%, to $6.7 million in
2015
from $6.2 million in
2014
and represented 2% of revenues in both periods. The increase in R&D expenses in
2015
primarily related to product development costs at our Stock-Preparation product line.
Restructuring Costs
Restructuring costs were $0.5 million and $0.8 million in
2015
and
2014
, respectively.
Restructuring costs in 2015 included severance costs of $0.3 million associated with the reduction of 25 employees in Canada and Brazil related to our 2015 restructuring plans. In addition, restructuring costs in 2015 also included severance costs of $0.2 million associated with the reduction of four employees in Sweden related to our 2014 restructuring plans.
The 2014 restructuring charges included severance costs of $0.3 million associated with the reduction of eight employees in Brazil and $0.1 million associated with the reduction of three employees in Sweden. In addition, we recorded facility-related costs of $0.4 million related to restructuring plans prior to 2014.
These actions were taken to streamline our operations and all occurred in our Papermaking Systems segment.
Interest Income
Interest income decreased $0.2 million, or 50%, to $0.2 million in
2015
from $0.4 million in
2014
primarily due to lower average interest rates in
2015
.
Interest Expense
Interest expense decreased to $0.9 million in
2015
from $1.0 million in
2014
primarily due to lower average outstanding borrowings, offset in part by higher average interest rates in
2015
.
31
|
Kadant Inc.
|
2016 Annual Report
|
|
Provision for Income Taxes
Our provision for income taxes was $14.8 million and $12.4 million in
2015
and
2014
, respectively, and represented 30% of pre-tax income in both periods. The effective tax rate of 30% in
2015
was lower than our statutory tax rate primarily due to the distribution of our worldwide earnings, offset in part by tax expense associated with an increase in nondeductible expenses and state income taxes. The effective tax rate of 30% in 2014 was lower than our statutory tax rate primarily due to the distribution of our worldwide earnings, the release of tax reserves that resulted from the expiration of tax statutes of limitations, and the release of state tax reserves in the United States. These tax benefits in 2014 were offset in part by tax expense associated with an increase in nondeductible expenses and a reduction in deferred tax assets.
Income from Continuing Operations
Income from continuing operations increased $5.5 million, or 19%, to $34.6 million in
2015
from $29.1 million in
2014
, including an increase in operating income of $8.0 million, offset in part by an increase in provision for income taxes of $2.3 million (see
Revenues
,
Gross Profit Margin
,
Operating Expenses,
and
Provision for Income Taxes
discussed above).
Liquidity and Capital Resources
Consolidated working capital was $
118.4
million and $108.5 million at year-end 2016 and year-end 2015, respectively. Included in working capital were cash and cash equivalents of $
71.5
million and $65.5 million at year-end 2016 and year-end 2015, respectively. At year-end 2016, $66.9 million of cash and cash equivalents was held by our foreign subsidiaries.
2016
Our operating activities provided cash of $51.0 million in 2016. Working capital used cash of $0.6 million in 2016, including $5.2 million from a decrease in accounts payable primarily due to reduced project activity in our Stock-Preparation product line and $4.1 million from a decrease in other current liabilities primarily related to decreases in accrued income taxes and billings in excess of costs and fees. These uses of cash were offset in large part by $4.4 million of cash provided by decreases in unbilled costs and fees and accounts receivable and a decrease of $3.6 million in inventory primarily related to reduced project activity in our Stock-Preparation product line in 2016.
Our investing activities used cash of $62.0 million in 2016 which primarily related to the acquisition of PAAL for approximately $56.6 million in cash, net of cash acquired. In addition, we used $5.8 million for purchases of property, plant, and equipment in 2016.
Our financing activities provided cash of $22.7 million in 2016. We received cash proceeds of $51.0 million from borrowings under our unsecured revolving credit facility (2012 Credit Agreement), of which $29.9 million was used to fund the PAAL acquisition, and $2.4 million from the issuance of our common stock due to the exercise of employee stock options. These sources of cash were offset in part by $18.4 million used for principal payments on our outstanding debt obligations in 2016 of which $5.3 million was used to repay the remaining principal balance on our commercial real estate loan, $8.0 million used for cash dividends paid to stockholders, and $2.6 million used for tax withholding payments related to stock-based compensation. In addition, we paid $1.1 million of contingent consideration in 2016 related to a prior period acquisition
.
2015
Our operating activities provided cash of $40.4 million in 2015. We used cash of $12.2 million for accounts receivable and unbilled contract costs and fees and $6.5 million for inventory. The cash used for accounts receivable and unbilled contract costs and fees related to increased project activity, especially in our Stock-Preparation product line. The cash used for inventory was primarily due to an increase in inventory at our Wood Processing Systems segment and work in process at our Stock-Preparation product line in China related to projects shipped later in 2016. These uses of cash were offset in part by $11.7 million of cash provided by other current liabilities primarily due to an increase in accrued income taxes due to the timing of payments and an increase in customer deposits related to capital equipment projects.
Our investing activities used cash of $5.4 million in 2015 primarily for purchases of property, plant, and equipment.
Our financing activities used cash of $13.6 million in 2015. We used cash of $9.9 million for the repurchase of our common stock on the open market and $7.2 million for cash dividends paid to stockholders. We received $24.0 million in proceeds from borrowings under our 2012 Credit Agreement and used cash of $18.6 million for principal payments on our outstanding debt obligations.
2014
Our operating activities provided cash of $51.1 million in 2014. Changes in working capital provided cash of $2.5 million in 2014, including $8.4 million from accounts receivable and $5.1 million from inventory, primarily due to the timing of payments and the shipment of several large stock-preparation equipment contracts. These sources of cash were offset in large
32
|
Kadant Inc.
|
2016 Annual Report
|
|
part by uses of cash of $8.8 million from other current liabilities due to a decrease in customer deposits and, to a lesser extent, $2.3 million from unbilled contract costs and fees due to the timing of billings.
Our investing activities used cash of $18.5 million in 2014, including $12.0 million for acquisitions and $6.8 million for purchases of property, plant, and equipment.
Our financing activities used cash of $34.6 million in 2014, including cash used for principal payments on our outstanding debt obligations of $37.0 million, repurchases of our common stock on the open market of $15.1 million, and the payment of $6.3 million in cash dividends to stockholders. These uses of cash were offset in part by $24.5 million of proceeds from borrowings under our 2012 Credit Agreement.
Additional Liquidity and Capital Resources
On May 18, 2016, our board of directors approved the repurchase by us of up to $20 million of our equity securities during the period from May 18, 2016 to May 18, 2017. Through year-end
2016
, we did not purchase any shares of our common stock under this authorization.
We paid cash dividends of $8.0 million, $7.2 million and $6.3 million in
2016
,
2015
, and 2014, respectively. On November 16, 2016, we declared a quarterly cash dividend totaling $0.19 per outstanding share of our common stock, or approximately $2.1 million, which was paid on February 9, 2017. In addition, on March 8, 2017, we declared a quarterly cash dividend of $0.21 per outstanding share of our common stock, which will be paid on May 11, 2017. Future declarations of dividends are subject to our board of directors' approval and may be adjusted as business needs or market conditions change. The payment of cash dividends is subject to our compliance with the consolidated leverage ratio contained in our 2017 Credit Agreement.
As of year-end
2016
, we had cash and cash equivalents of $71.5 million, of which $66.9 million was held by our foreign subsidiaries. It is our intent to reinvest indefinitely the earnings of our international subsidiaries in order to support the current and future capital needs of their operations. We do not anticipate the need to repatriate funds to the United States to satisfy domestic liquidity needs arising in the ordinary course of business. Through year-end
2016
, we have not provided for U.S. income taxes on approximately $182.2 million of unremitted foreign earnings. The U.S. tax cost has not been determined due to the fact that it is not practicable to estimate at this time. The related foreign tax withholding, which would be required if we were to remit the foreign earnings to the United States, would be approximately $4.0 million.
Although we currently have no material commitments for capital expenditures, we plan to make expenditures of approximately $7 to $8 million during 2017 for property, plant, and equipment.
In the future, our liquidity position will be primarily affected by the level of cash flows from operations, cash paid to satisfy debt repayments, capital projects, dividends, stock repurchases, or acquisitions. We believe that our existing resources, together with the cash available from our credit facilities and the cash we expect to generate from operations, will be sufficient to meet the capital requirements of our current operations for the foreseeable future.
Amended and Restated Revolving Credit Facility
On March 1, 2017, we entered into an Amended and Restated Credit Agreement (2017 Credit Agreement), which became effective as of March 2, 2017. The 2017 Credit Agreement is a five-year unsecured revolving credit facility in the aggregate principal amount of up to $200 million. The 2017 Credit Agreement also includes an uncommitted unsecured incremental borrowing facility of up to an additional $100 million. The principal on any borrowings made under the 2017 Credit Agreement is due on March 1, 2022. Interest on any loans outstanding under the 2017 Credit Agreement accrues and generally is payable quarterly in arrears at one of the following rates selected by us: (i) the Base Rate, calculated as the highest of (a) the federal funds rate plus 0.50%, (b) the prime rate as published by Citizens Bank, and (c) the thirty-day LIBOR rate, as defined, plus 0.50%; or (ii) the LIBOR rate (with a zero percent floor), as defined, plus an applicable margin of 1% to 2%. The applicable margin is determined based upon the ratio of our total debt, net of certain cash, as defined, to earnings before interest, taxes, depreciation, and amortization (EBITDA), as defined in the 2017 Credit Agreement. For this purpose, total debt net of certain cash is defined as total debt less the sum of (i) unrestricted U.S. cash, and (ii) 65% of unrestricted cash outside of the United States, but no more than an aggregate amount of $30 million. Contemporaneously with the execution of the 2017 Credit Agreement, Kadant borrowed $42.0 million and 26.3 million euros under the 2017 Credit Agreement and applied the proceeds to pay off the 2012 Credit Agreement.
Our obligations under the 2017 Credit Agreement may be accelerated upon the occurrence of an event of default under the 2017 Credit Agreement, which includes customary events of default including without limitation payment defaults, defaults in the performance of affirmative and negative covenants, the inaccuracy of representations or warranties, bankruptcy- and insolvency-related defaults, defaults relating to such matters as the Employment Retirement Income Security Act (ERISA), unsatisfied judgments, the failure to pay certain indebtedness, and a change of control default. In addition, the 2017 Credit Agreement contains negative covenants applicable to us, including financial covenants requiring us to comply with a maximum consolidated leverage ratio of 3.5 to 1, a minimum consolidated interest coverage ratio of 3 to 1, and restrictions on liens, indebtedness, fundamental changes, dispositions of property, making certain restricted payments (including dividends and stock
33
|
Kadant Inc.
|
2016 Annual Report
|
|
repurchases), investments, transactions with affiliates, sale and leaseback transactions, swap agreements, changing our fiscal year, arrangements affecting subsidiary distributions, entering into new lines of business, and certain actions related to the discontinued operation.
Loans under the 2017 Credit Agreement are guaranteed by certain of our domestic subsidiaries pursuant to an Amended and Restated Guarantee Agreement, dated as of March 1, 2017. In addition, one of our foreign subsidiaries entered into a Guarantee Agreement limited to certain obligations of two foreign subsidiary borrowers pursuant to a Guarantee Agreement dated as of March 1, 2017.
Obligations Under Capital Lease
In connection with the acquisition of PAAL, the Company assumed a sale-leaseback financing arrangement for PAAL's facility in Germany. Under this arrangement, the quarterly lease payment includes principal and interest based on an interest rate which is reset, from time to time, to prevailing short-term borrowing rates in Germany. The interest rate at year-end 2016 was 3.30%. The lease arrangement includes a fixed price purchase option of $1.4 million at the end of the lease term in 2022. At year-end
2016
, $4.2 million was outstanding under this capital lease obligation.
Interest Rate Swap Agreement
On January 16, 2015, we entered into a swap agreement (2015 Swap Agreement) to hedge our exposure to movements in the three-month LIBOR rate on future outstanding debt. The 2015 Swap Agreement expires on March 27, 2020 and has a $10 million notional value. Under the 2015 Swap Agreement, on a quarterly basis we receive a three-month LIBOR rate and pay a fixed rate of interest of 1.50% plus an applicable margin.
At year-end
2016
, the 2015 Swap Agreement had a net unrealized gain of $0.1 million. We believe that any credit risk associated with the swap agreement is remote based on our financial position and the creditworthiness of the financial institution issuing the swap agreement.
The counterparty to the 2015 Swap Agreement could demand an early termination of the 2015 Swap Agreement if we are in default under the 2017 Credit Agreement, or any agreement that amends or replaces the 2017 Credit Agreement in which the counterparty is a member, and we are unable to cure the default. An event of default under the 2017 Credit Agreement includes customary events of default and failure to comply with financial covenants, including a maximum consolidated leverage ratio of 3.5 to 1 and a minimum consolidated interest coverage ratio of 3 to 1. The net unrealized gain of $0.1 million associated with the 2015 Swap Agreement as of year-end
2016
represents the estimated amount that we would receive from the counterparty in the event of an early termination.
Contractual Obligations and Other Commercial Commitments
The following table summarizes our known contractual obligations and commercial commitments to make future payments or other consideration pursuant to certain contracts as of year-end
2016
, as well as an estimate of the timing in which these obligations are expected to be satisfied. Detailed information concerning these obligations and commitments can be found in Notes 2, 3, 6 and 7 to our consolidated financial statements.
|
|
Payments Due by Period or Expiration of Commitment
|
|||||||||||||||||||
|
(In millions)
|
Less than
1 Year
|
2-3
Years
|
4-5
Years
|
After
5 Years
|
Total
|
|||||||||||||||
|
Contractual Obligations and Other Commitments: (a)(b)
|
||||||||||||||||||||
|
Letters of credit and bank guarantees
|
$
|
11.1
|
|
$
|
2.7
|
|
$
|
—
|
|
$
|
—
|
|
$
|
13.8
|
|
|||||
|
Retirement obligations on balance sheet
|
1.5
|
|
2.3
|
|
0.8
|
|
5.1
|
|
9.7
|
|
||||||||||
|
Revolving credit facility (c)
|
—
|
|
61.5
|
|
—
|
|
—
|
|
61.5
|
|
||||||||||
|
Capital lease obligations (d)
|
0.5
|
|
0.9
|
|
0.9
|
|
0.6
|
|
2.9
|
|
||||||||||
|
Operating lease obligations
|
2.8
|
|
2.8
|
|
1.4
|
|
1.0
|
|
8.0
|
|
||||||||||
|
Interest (e)
|
1.1
|
|
1.1
|
|
0.1
|
|
—
|
|
2.3
|
|
||||||||||
|
Acquisition-related consideration
|
0.2
|
|
—
|
|
—
|
|
—
|
|
0.2
|
|
||||||||||
|
Total (f)
|
$
|
17.2
|
|
$
|
71.3
|
|
$
|
3.2
|
|
$
|
6.7
|
|
$
|
98.4
|
|
|||||
_________________________________
|
(a)
|
We have purchase obligations related to the acquisition of raw material made in the ordinary course of business that may be terminated with minimal notice and are excluded from this table.
|
34
|
Kadant Inc.
|
2016 Annual Report
|
|
|
(b)
|
In the ordinary course of business, certain contracts contain limited performance guarantees, which do not require letters of credit, relating to our equipment and systems. We typically limit our liability under these guarantees to amounts that would not exceed the value of the contract. We believe that we have adequate reserves for any potential liability in connection with such guarantees. These guarantees are not included in this table.
|
|
(c)
|
Under the amended and restated 2017 Credit Agreement, dated March 1, 2017, the principal amount on any borrowings is now due on March 1, 2022.
|
|
(d)
|
This table excludes a liability of $1.4 million related to the fixed price purchase option exercisable in 2022.
|
|
(e)
|
Amounts assume interest rates on variable rate debt remain unchanged from rates as of year-end
2016
.
|
|
(f)
|
This table excludes a liability for unrecognized tax benefits and an accrual for the related interest and penalties totaling $6.8 million. Due to the uncertain nature of these income tax matters, we are unable to make a reasonably reliable estimate as to if and when cash settlements with the appropriate taxing authorities will occur.
|
Provisions in financial guarantees or commitments, debt or lease agreements, or other arrangements could trigger a requirement for an early payment, additional collateral support, amended terms, or acceleration of maturity.
We do not have special-purpose entities nor do we use off-balance-sheet financing arrangements.
We are exposed to market risk from changes in interest rates and foreign currency exchange rates, which could affect our future results of operations and financial condition. We manage our exposure to these risks through our regular operating and financing activities. We entered into a "receive-variable pay-fixed" swap agreement in 2015 to hedge our exposure to variable rate long-term debt. Additionally, we use short-term forward contracts to manage certain exposures to foreign currencies. We enter into forward currency-exchange contracts to hedge firm purchase and sale commitments denominated in currencies other than our subsidiaries' local currencies. We do not engage in extensive foreign currency hedging activities; however, the purpose of our foreign currency hedging activities is to protect our local currency cash flows related to these commitments from fluctuations in foreign exchange rates. Our forward currency-exchange contracts hedge transactions primarily denominated in U.S. dollars, euros, and Chinese renminbi. Gains and losses arising from forward contracts are recognized as offsets to gains and losses resulting from the transactions being hedged. We do not hold or engage in transactions involving derivative instruments for purposes other than risk management.
Interest Rates
Our cash and cash equivalents are sensitive to changes in interest rates. Interest rate changes would result in a change in interest income due to the difference between the current interest rates on cash and cash equivalents and the variable rates to which these financial instruments may adjust in the future. A 10% decrease in year-end interest rates would have resulted in an immaterial impact on net income in both
2016
and
2015
.
Our borrowings under the revolving credit facility bear a variable rate of interest, which adjusts quarterly. In
2016
, a 10% increase in interest rates on the Company’s variable-rate debt and interest rate swap agreement would have increased the Company’s annual pre-tax interest expense by approximately $0.1 million. A portion of our outstanding variable-rate debt at year-end
2016
and
2015
was hedged with a "receive-variable pay-fixed" swap agreement. The fair value of the swap agreement is sensitive to changes in the three-month LIBOR forward curve. A 10% decrease in the three-month LIBOR forward curve would not have had a material impact on unrealized losses at year-end
2016
and
2015
. Our capital lease obligations and other borrowings assumed in the PAAL acquisition totaled $4.9 million at year-end
2016
, including $4.2 million that bears interest at a rate that adjusts semi-annually to prevailing short-term borrowing rates in Germany. A 10% increase in short-term borrowing rates in Germany would have resulted in an immaterial impact on net income in
2016
.
Currency Exchange Rates
We generally view our investment in foreign subsidiaries in a functional currency other than our reporting currency as long-term. Our investment in foreign subsidiaries is sensitive to fluctuations in foreign currency exchange rates. The functional currencies of our foreign subsidiaries are principally denominated in euros, British pounds sterling, Mexican pesos, Canadian dollars, Chinese renminbi, Brazilian reals, and Swedish krona. The effect of changes in foreign exchange rates on our net investment in foreign subsidiaries is reflected in the "accumulated other comprehensive items" component of stockholders' equity. A 10% decrease in functional currencies at year-end
2016
and
2015
, relative to the U.S. dollar, would have resulted in a reduction in stockholders' equity of $23.2 million and $21.6 million, respectively.
The fair value of forward currency-exchange contracts is sensitive to fluctuations in foreign currency exchange rates. The fair value of forward currency-exchange contracts is the estimated amount that we would pay or receive upon termination of the contracts, taking into account the change in foreign currency exchange rates. A 10% adverse change in year-end
2016
and
2015
foreign currency exchange rates related to our contracts would have resulted in an increase in unrealized losses on forward
35
|
Kadant Inc.
|
2016 Annual Report
|
|
currency-exchange contracts of $1.4 million in
2016
and a decrease in unrealized gains of $0.9 million in
2015
. Since we use forward currency-exchange contracts as hedges of firm purchase and sale commitments, the unrealized gain or loss on forward currency-exchange contracts resulting from changes in foreign currency exchange rates would be offset primarily by corresponding changes in the fair value of the hedged items.
This data is submitted as a separate section to this Report and incorporated herein by reference. See Item 15, "Exhibits and Financial Statement Schedules."
Not applicable.
Evaluation of Disclosure Controls and Procedures
Our management, under the supervision and with the participation of our Chief Executive Officer and Chief Financial Officer, evaluated the effectiveness of our disclosure controls and procedures as of
December 31, 2016
. The term "disclosure controls and procedures," as defined in Securities Exchange Act Rules 13a-15(e) and 15d-15(e), means controls and other procedures of a company that are designed to ensure that information required to be disclosed by the company in the reports that it files or submits under the Exchange Act is recorded, processed, summarized, and reported within the time periods specified in the SEC's rules and forms. Disclosure controls and procedures include, without limitation, controls and procedures designed to ensure that information required to be disclosed by a company in the reports that it files or submits under the Exchange Act is accumulated and communicated to the company's management, including its principal executive and principal financial officers, as appropriate to allow timely decisions regarding required disclosure. Management recognizes that any controls and procedures, no matter how well designed and operated, can provide only reasonable assurance of achieving their objectives, and management necessarily applies its judgment in evaluating the cost-benefit relationship of possible controls and procedures. Based upon the evaluation of our disclosure controls and procedures as of
December 31, 2016
, our Chief Executive Officer and Chief Financial Officer concluded that as of
December 31, 2016
, our disclosure controls and procedures were effective at the reasonable assurance level.
Management's Annual Report on Internal Control over Financial Reporting
Our management is responsible for establishing and maintaining adequate internal control over financial reporting, as such term is defined in Securities Exchange Act Rules 13a-15(f) and 15d-15(f). Our management assessed the effectiveness of our internal control over financial reporting as of
December 31, 2016
. In making this assessment, our management used the criteria set forth in "Internal Control—Integrated Framework (2013)" issued by the Committee of Sponsoring Organizations of the Treadway Commission (COSO). Based on our assessment, management believes that as of
December 31, 2016
our internal control over financial reporting was effective based on the criteria issued by COSO.
In 2016, we acquired all the outstanding shares of RT Holding GmbH, the parent corporation of PAAL. Our audited consolidated financial statements include the results of PAAL since the acquisition date, including total assets of $77.6 million (of which $54.5 million represents goodwill and intangible assets included within the scope of our assessment) and total revenues of $40.8 million as of and for the year ended
December 31, 2016
, but management's assessment does not include an assessment of the internal controls over financial reporting of PAAL.
Because of inherent limitations, internal control over financial reporting may not prevent or detect misstatements. Projections of any evaluation of effectiveness to future periods are subject to the risk that controls may become inadequate because of changes in conditions, or that the degree of compliance with the policies or procedures may deteriorate.
Our independent registered public accountants, KPMG LLP, have issued an audit report on our internal control over financial reporting, which is included herein on page F-3 and incorporated into this Item 9A by reference.
Changes in Internal Control over Financial Reporting
There have not been any changes in our internal control over financial reporting (as defined in Rules 13a-15(f) and 15d-15(f) under the Securities Exchange Act of 1934, as amended) during the fiscal quarter ended
December 31, 2016
that have materially affected, or are reasonably likely to materially affect, our internal control over financial reporting.
Not applicable.
36
|
Kadant Inc.
|
2016 Annual Report
|
|
This information will be included under the heading "Election of Directors" in our 2017 proxy statement for our 2017 Annual Meeting of Shareholders and is incorporated in this Report by reference, except for the information concerning executive officers, which is included under the heading "Executive Officers of the Registrant" in Item 1 of Part I of this Report.
Section 16(a) Beneficial Ownership Reporting Compliance
The information required under Item 405 of Regulation S-K will be included under the heading "Stock Ownership–Section 16(a) Beneficial Ownership Reporting Compliance" in our 2017 proxy statement and is incorporated in this Report by reference.
Corporate Governance
The information required under Items 406 and 407 of Regulation S-K will be included under the heading "Corporate Governance" in our 2017 proxy statement and is incorporated in this Report by reference.
This information will be included under the headings "Executive Compensation", "Corporate Governance - Compensation Committee Interlocks and Insider Participation", and "Compensation Discussion and Analysis" in our 2017 proxy statement and is incorporated in this Report by reference.
37
|
Kadant Inc.
|
2016 Annual Report
|
|
Except for the information concerning equity compensation plans, this information will be included under the heading "Stock Ownership" in our 2017 proxy statement and is incorporated in this Report by reference.
The following table provides information about the securities authorized for issuance under our equity compensation plans as of
December 31, 2016
:
Equity Compensation Plan Information
|
Plan Category
|
Number of Securities
to be Issued upon
Exercise of
Outstanding Options,
Warrants, and
Rights
|
|
Weighted-Average Exercise Price of Outstanding Options, Warrants, and Rights
|
|
Number of Securities
Remaining Available for
Future Issuance Under
Equity Compensation
Plans (Excluding
Securities Reflected in
the First Column)
|
|
||||||||||
|
Equity compensation plans approved by security holders
|
509,875
|
|
(1)
|
$
|
28.47
|
|
(1)
|
612,887
|
|
(2)
|
||||||
|
Equity compensation plans not approved by security holders
|
—
|
|
|
$
|
—
|
|
|
—
|
|
|
||||||
|
Total
|
509,875
|
|
(1)
|
$
|
28.47
|
|
(1)
|
612,887
|
|
(2)
|
||||||
__________________________________
|
(1)
|
Excludes an aggregate of 51,725 shares of common stock issuable under our employees' stock purchase plan in connection with current and future offering periods under the plan.
|
|
(2)
|
Includes an aggregate of 51,725 shares of common stock issuable under our employees' stock purchase plan in connection with current and future offering periods under the plan.
|
This information will be included under the heading "Corporate Governance" in our 2017 proxy statement and is incorporated in this Report by reference.
This information will be included under the heading "Independent Registered Public Accounting Firm" in our 2017 proxy statement and is incorporated in this Report by reference.
38
|
Kadant Inc.
|
2016 Annual Report
|
|
|
(a)
|
The following documents are filed as part of this Report:
|
|
(1)
|
Consolidated Financial Statements (see Index on Page F-1 of this Report):
|
Reports of Independent Registered Public Accounting Firm
Consolidated Balance Sheet
Consolidated Statement of Income
Consolidated Statement of Comprehensive Income
Consolidated Statement of Cash Flows
Consolidated Statement of Stockholders' Equity
Notes to Consolidated Financial Statements
|
(2)
|
All schedules are omitted because they are not applicable or not required, or because the required information is shown either in the consolidated financial statements or in the notes thereto.
|
|
(3)
|
Exhibits filed herewith or incorporated in this Report by reference are set forth in the Exhibit Index beginning on page 41. This list of exhibits identifies each management contract or compensatory plan or arrangement required to be filed as an exhibit to this Report.
|
|
(b)
|
Exhibits
|
See the Exhibit Index beginning on page 41.
39
|
Kadant Inc.
|
2016 Annual Report
|
|
Signatures
Pursuant to the requirements of Section 13 or 15(d) of the Securities Exchange Act of 1934, the Registrant has duly caused this Report to be signed on its behalf by the undersigned, thereunto duly authorized.
|
|
KADANT INC.
|
|
|
|
|
|
|
Date: March 15, 2017
|
By:
|
/s/ Jonathan W. Painter
|
|
|
|
Jonathan W. Painter
|
|
|
|
Chief Executive Officer and President
|
Pursuant to the requirements of the Securities Exchange Act of 1934, this Report has been signed below by the following persons on behalf of the Registrant and in the capacities indicated, on March 15, 2017.
|
|
Signature
|
|
Title
|
|
|
|
|
|
|
By:
|
/s/ Jonathan W. Painter
|
|
Chief Executive Officer, President and Director
|
|
|
Jonathan W. Painter
|
|
(Principal Executive Officer)
|
|
|
|
|
|
|
By:
|
/s/ Michael J. McKenney
|
|
Senior Vice President and Chief Financial Officer
|
|
|
Michael J. McKenney
|
|
(Principal Financial Officer)
|
|
|
|
|
|
|
By:
|
/s/ Deborah S. Selwood
|
|
Vice President and Chief Accounting Officer
|
|
|
Deborah S. Selwood
|
|
(Principal Accounting Officer)
|
|
|
|
|
|
|
By:
|
/s/ William A. Rainville
|
|
Director and Chairman of the Board
|
|
|
William A. Rainville
|
|
|
|
|
|
|
|
|
By:
|
/s/ John M. Albertine
|
|
Director
|
|
|
John M. Albertine
|
|
|
|
|
|
|
|
|
By:
|
/s/ Thomas C. Leonard
|
|
Director
|
|
|
Thomas C. Leonard
|
|
|
|
|
|
|
|
|
By:
|
/s/ William P. Tully
|
|
Director
|
|
|
William P. Tully
|
|
|
40
Exhibit Index
|
Exhibit
Number
|
Description of Exhibit
|
|
|
|
|
2.1
|
Deed Number 99/2016 representing the Share Purchase and Transfer Agreement dated April 4, 2016, among GEP SPV Limited, Mr. Franzotto Hornung, and Mr. Stuart Craig Heley, (collectively, the “Sellers”), RT Holding GmbH (the “Company”), and Kadant Johnson Deutschland GmbH and Kadant Cayman Ltd. (collectively, the “Purchasers”) (filed as Exhibit 2.1 to the Registrant's Quarterly Report on Form 10-Q for the quarter ended April 2, 2016 [File No. 1-11406] and incorporated in this document by reference). (1)
|
|
3.1
|
Restated Certificate of Incorporation of the Registrant (filed as Exhibit 3.1 to the Registrant's Quarterly Report on Form 10-Q for the quarter ended June 30, 2001 [File No. 1-11406] and incorporated in this document by reference).
|
|
|
|
|
3.2
|
Amended and Restated Bylaws of the Registrant effective November 20, 2014 (filed as Exhibit 3.1 to the Registrant's Form 8-K [File No. 1-11406] filed with the Commission on November 25, 2014 and incorporated in this document by reference).
|
|
|
|
|
10.1*
|
Form of Indemnification Agreement between the Registrant and its directors and officers (filed as Exhibit 10.1 to the Registrant's Quarterly Report on Form 10-Q for the quarter ended June 30, 2001 [File No. 1-11406] and incorporated in this document by reference).
|
|
|
|
|
10.2*
|
Form of Amended and Restated Executive Retention Agreement (change in control agreement) between the Company and its named executive officers, as amended and restated on December 9, 2008 (filed as Exhibit 10.3 to the Registrant's Annual Report on Form 10-K for the year ended January 3, 2009 [File No. 1-11406] and incorporated in this document by reference).
|
|
|
|
|
10.3*
|
Form of Executive Retention Agreement (change in control agreement) between the Company and its executive officers for new agreements entered into from and after November 16, 2016.
|
|
10.4*
|
Amended and Restated Equity Incentive Plan of the Registrant (filed as Exhibit 10.5 to the Registrant's Annual Report on Form 10-K for the year ended January 3, 2009 [File No. 1-11406] and incorporated in this document by reference).
|
|
|
|
|
10.5*
|
Amended and Restated 2006 Equity Incentive Plan of the Registrant effective as of May 20, 2014 (filed as Exhibit 10.2 to the Registrant's Quarterly Report on Form 10-Q for the quarter ended June 28, 2014 [File No. 1-11406] and incorporated in this document by reference).
|
|
|
|
|
10.6*
|
Cash Incentive Plan of the Registrant (filed as Exhibit 10.10 to the Registrant's Annual Report on Form 10-K for the year ended January 3, 2009 [File No. 1-11406] and incorporated in this document by reference).
|
|
10.7*
|
Restoration Plan of the Registrant (filed as Exhibit 10.1 to the Registrant's Quarterly Report on Form 10-Q for the quarter ended April 2, 2011 [File No. 1-11406] and incorporated in this document by reference).
|
|
|
|
|
10.8*
|
Amendments to the Restoration Plan of the Registrant effective as of May 20, 2014 (filed as Exhibit 10.1 to the Registrant's Quarterly Report on Form 10-Q for the quarter ended June 28, 2014 [File No. 1-11406] and incorporated in this document by reference).
|
|
|
|
|
10.9*
|
Summary of non-employee director compensation of the Registrant.
|
|
|
|
|
10.10*
|
Form of Cash-Settled Restricted Stock Unit Award Agreement between the Company and its non-employee directors used for change-in-control (filed as Exhibit 10.1 to the Registrant's Quarterly Report on Form 10-Q for the quarter ended April 4, 2015 [File No. 1-11406] and incorporated in this document by reference).
|
|
|
|
|
10.11*
|
Form of Performance-Based Restricted Stock Unit Award Agreement between the Company and its executive officers used for restricted stock unit awards granted in 2010 through 2013 (filed as Exhibit 10.20 to the Registrant's Annual Report on Form 10-K for the year ended January 2, 2010 [File No. 1-11406] and incorporated in this document by reference).
|
41
Exhibit Index
|
Exhibit
Number
|
Description of Exhibit
|
|
|
|
|
10.12*
|
Notice of Amendment to Performance-Based Restricted Stock Unit Award Agreement between the Company and its executive officers (filed as Exhibit 10.1 to the Registrant's Quarterly Report on Form 10-Q for the quarter ended September 28, 2013 [File No. 1-11406] and incorporated in this document by reference).
|
|
|
|
|
10.13*
|
Form of Performance-Based Restricted Stock Unit Award Agreement between the Company and its executive officers used for restricted stock unit awards on or after March 5, 2014 (filed as Exhibit 10.1 to the Registrant's Quarterly Report on Form 10-Q for the quarter ended March 29, 2014 [File No. 1-11406] and incorporated in this document by reference).
|
|
|
|
|
10.14*
|
Form of Time-Based Restricted Stock Unit Award Agreement between the Company and its executive officers used for restricted stock unit awards on or after March 5, 2014 (filed as Exhibit 10.2 to the Registrant's Quarterly Report on Form 10-Q for the quarter ended March 29, 2014 [File No. 1-11406] and incorporated in this document by reference).
|
|
|
|
|
10.15*
|
Form of Stock Option Agreement between the Company and its executive officers used for stock option awards (filed as Exhibit 10.21 to the Registrant's Annual Report on Form 10-K for the year ended January 2, 2010 [File No. 1-11406] and incorporated in this document by reference).
|
|
|
|
|
10.16*
|
Notice of Amendment to Stock Option Agreements between the Company and its executive officers used for stock option awards (filed as Exhibit 10.2 to the Registrant's Quarterly Report on Form 10-Q for the quarter ended September 28, 2013 [File No. 1-11406] and incorporated in this document by reference).
|
|
|
|
|
10.17
|
Credit Agreement dated August 3, 2012, among Kadant Inc., the Foreign Subsidiary Borrowers from time to time parties thereto, the several banks and other financial institutions or entities from time to time parties thereto, RBS Citizens, N.A., as Administrative Agent and Multi-currency Administrative Agent (filed as Exhibit 99.1 to the Registrant's Quarterly Report on Form 10-Q for the quarter ended June 30, 2012 [File No. 1-11406] and incorporated in this document by reference).
|
|
10.18
|
Guarantee Agreement dated August 3, 2012, among Kadant Inc. and the Subsidiary Guarantors, in favor of RBS Citizens, N.A., as Administrative Agent for the several banks and other financial institutions or entities from time to time parties to the Credit Agreement dated as of August 3, 2012 (filed as Exhibit 99.2 to the Registrant's Quarterly Report on Form 10-Q for the quarter ended June 30, 2012 [File No. 1-11406] and incorporated in this document by reference).
|
|
|
|
|
10.19
|
First Amendment to Credit Agreement dated November 1, 2013, among Kadant Inc., the Foreign Subsidiary Borrowers from time to time parties thereto, the several banks and other financial institutions or entities from time to time parties thereto, RBS Citizens, N.A., as Administrative Agent and Multi-currency Administrative Agent (filed as Exhibit 10.14 to the Registrant's Annual Report on Form 10-K for the year ended December 28, 2013 [File No. 1-11406] and incorporated in this document by reference).
|
|
10.20
|
Second Amendment to Credit Agreement dated March 29, 2016, among Kadant Inc., the Foreign Subsidiary Borrowers from time to time parties thereto, the several banks and other financial institutions or entities from time to time parties thereto, Citizens Bank, N.A., as Administrative Agent and Multi-currency Administrative Agent (filed as Exhibit 10.1 to the Registrant's Quarterly Report on Form 10-Q for the quarter ended April 2, 2016 [File No. 1-11406] and incorporated in this document by reference).
|
|
10.21
|
Amended and Restated Credit Agreement dated as of March 1, 2017, among Kadant Inc., the Foreign Subsidiary Borrowers from time to time parties thereto, the several banks and other financial institutions or entities from time to time parties thereto, Citizens Bank, N.A., as Administrative Agent and Multi-currency Administrative Agent (filed as Exhibit 99.1 to the Registrant's Current Report on Form 8-K [File No. 1-11406] filed with the Commission on March 7, 2017 and incorporated in this document by reference).
|
42
Exhibit Index
|
Exhibit
Number
|
Description of Exhibit
|
||
|
10.22
|
Amended and Restated Guarantee Agreement dated as of March 1, 2017, among the Registrant, as Borrower, and each of the Subsidiary Guarantors, in favor of Citizens Bank, N.A., as Administrative Agent and as Multicurrency Agent for the bank and other financial institutions or entities from time to time parties to the Amended and Restated Credit Facility (filed as Exhibit 99.2 to the Registrant's Current Report on Form 8-K [File No. 1-11406] filed with the Commission on March 7, 2017 and incorporated in this document by reference).
|
||
|
10.23
|
Guarantee Agreement dated as of March 1, 2017, by Kadant Cayman Ltd. in favor of Citizens Bank, N.A., as Administrative Agent and as Multicurrency Agent for the banks and other financial institutions or entities from time to time parties to the Amended and Restated Credit Facility (filed as Exhibit 99.3 to the Registrant's Current Report on Form 8-K [File No. 1-11406] filed with the Commission on March 7, 2017 and incorporated in this document by reference).
|
||
|
10.24
|
Swap Confirmation dated January 16, 2015 between the Registrant and Citizens Bank, National Association (filed as Exhibit 10.2 to the Registrant's Quarterly Report on Form 10-Q for the quarter ended April 4, 2015 [File No. 1-11406] and incorporated in this document by reference).
|
||
|
|
|||
|
10.25
|
International Swap Dealers Association, Inc. Master Agreement dated May 13, 2005 between the Registrant and Citizens Bank of Massachusetts and Swap Confirmation dated May 18, 2005 (filed as Exhibit 10.1 to the Registrant's Quarterly Report on Form 10-Q for the quarter ended July 2, 2005 [File No. 1-11406] and incorporated in this document by reference).
|
||
|
21
|
Subsidiaries of the Registrant.
|
||
|
|
|
||
|
23
|
Consent of KPMG LLP.
|
||
|
|
|
||
|
31.1
|
Certification of the Principal Executive Officer of the Registrant Pursuant to Rule 13a-14(a) and Rule 15d-14(a) of the Securities Exchange Act of 1934, as amended.
|
||
|
31.2
|
Certification of the Principal Financial Officer of the Registrant Pursuant to Rule 13a-14(a) and Rule 15d-14(a) of the Securities Exchange Act of 1934, as amended.
|
||
|
32
|
Certification of the Chief Executive Officer and the Chief Financial Officer of the Registrant pursuant to 18 U.S.C. Section 1350, as adopted pursuant to Section 906 of the Sarbanes-Oxley Act of 2002.
|
||
|
101.INS
|
XBRL Instance Document.**
|
||
|
101.SCH
|
XBRL Taxonomy Extension Schema Document.**
|
||
|
|
|
||
|
101.CAL
|
XBRL Taxonomy Calculation Linkbase Document.**
|
||
|
|
|
||
|
101.LAB
|
XBRL Taxonomy Label Linkbase Document.**
|
||
43
Exhibit Index
|
Exhibit
Number
|
Description of Exhibit
|
||
|
|
|
||
|
101.PRE
|
XBRL Taxonomy Presentation Linkbase Document.**
|
||
|
|
|
||
|
101.DEF
|
XBRL Taxonomy Definition Linkbase Document.**
|
||
|
*
|
Management contract or compensatory plan or arrangement.
|
||
|
**
|
Submitted electronically herewith.
|
||
|
(1)
|
The schedules to this document have been omitted from this filing pursuant to Item 601(b)(2) of Regulation S-K. The Company will furnish copies of any of the schedules to the U.S. Securities and Exchange Commission upon request.
|
Attached as Exhibit 101 to this report are the following formatted in XBRL (Extensible Business Reporting Language): (i) Consolidated Balance Sheet as of
December 31, 2016
and
January 2, 2016
, (ii) Consolidated Statement of Income for the years ended
December 31, 2016
,
January 2, 2016
and
January 3, 2015
, (iii) Consolidated Statement of Comprehensive Income for the years ended
December 31, 2016
,
January 2, 2016
and
January 3, 2015
, (iv) Consolidated Statement of Cash Flows for the years ended
December 31, 2016
,
January 2, 2016
and
January 3, 2015
, (v) Consolidated Statement of Stockholders' Equity for the years ended
December 31, 2016
,
January 2, 2016
and
January 3, 2015
, and (vi) Notes to Consolidated Financial Statements.
44
Kadant Inc.
Annual Report on Form 10-K
Index to Consolidated Financial Statements and Schedule
The following Consolidated Financial Statements of the Registrant and its subsidiaries are required to be included in Item 8:
|
Page
|
|
|
|
|
|
|
|
|
|
|
|
|
|
|
|
|
|
|
|
|
|
|
F-1
Report of Independent Registered Public Accounting Firm
The Board of Directors and Stockholders
Kadant Inc.:
We have audited the accompanying consolidated balance sheets of Kadant Inc. and subsidiaries as of
December 31, 2016
and
January 2, 2016
, and the related consolidated statements of income, comprehensive income, cash flows, and stockholders’ equity for each of the years in the three‑year period ended
December 31, 2016
.
T
hese consolidated financial statements are the responsibility of the Company’s management. Our responsibility is to express an opinion on these consolidated financial statements based on our audits.
We conducted our audits in accordance with the standards of the Public Company Accounting Oversight Board (United States). Those standards require that we plan and perform the audit to obtain reasonable assurance about whether the financial statements are free of material misstatement. An audit includes examining, on a test basis, evidence supporting the amounts and disclosures in the financial statements. An audit also includes assessing the accounting principles used and significant estimates made by management, as well as evaluating the overall financial statement presentation. We believe that our audits provide a reasonable basis for our opinion.
In our opinion, the consolidated financial statements referred to above present fairly, in all material respects, the financial position of Kadant Inc. and subsidiaries as of
December 31, 2016
and
January 2, 2016
, and the results of their operations and their cash flows for each of the years in the three-year period ended
December 31, 2016
, in conformity with U.S. generally accepted accounting principles.
We also have audited, in accordance with the standards of the Public Company Accounting Oversight Board (United States), Kadant Inc.'s internal control over financial reporting as of
December 31, 2016
, based on criteria established in
Internal Control - Integrated Framework (2013)
issued by the Committee of Sponsoring Organizations of the Treadway Commission, and our report dated March 15, 2017 expressed an unqualified opinion on the effectiveness of the Company’s internal control over financial reporting.
/s/ KPMG LLP
Boston, Massachusetts
March 15, 2017
F-2
Report of Independent Registered Public Accounting Firm
The Board of Directors and Stockholders
Kadant Inc.:
We have audited Kadant Inc.'s internal control over financial reporting as of
December 31, 2016
, based on criteria established in
Internal Control - Integrated Framework
issued by the Committee of Sponsoring Organizations of the Treadway Commission (COSO). Kadant Inc.’s management is responsible for maintaining effective internal control over financial reporting and for its assessment of the effectiveness of internal control over financial reporting, included in the accompanying Management’s Annual Report on Internal Control over Financial Reporting. Our responsibility is to express an opinion on the Company’s internal control over financial reporting based on our audit.
We conducted our audit in accordance with the standards of the Public Company Accounting Oversight Board (United States). Those standards require that we plan and perform the audit to obtain reasonable assurance about whether effective internal control over financial reporting was maintained in all material respects. Our audit included obtaining an understanding of internal control over financial reporting, assessing the risk that a material weakness exists, and testing and evaluating the design and operating effectiveness of internal control based on the assessed risk. Our audit also included performing such other procedures as we considered necessary in the circumstances. We believe that our audit provides a reasonable basis for our opinion.
A company’s internal control over financial reporting is a process designed to provide reasonable assurance regarding the reliability of financial reporting and the preparation of financial statements for external purposes in accordance with generally accepted accounting principles. A company’s internal control over financial reporting includes those policies and procedures that (1) pertain to the maintenance of records that, in reasonable detail, accurately and fairly reflect the transactions and dispositions of the assets of the company; (2) provide reasonable assurance that transactions are recorded as necessary to permit preparation of financial statements in accordance with generally accepted accounting principles, and that receipts and expenditures of the company are being made only in accordance with authorizations of management and directors of the company; and (3) provide reasonable assurance regarding prevention or timely detection of unauthorized acquisition, use, or disposition of the company’s assets that could have a material effect on the financial statements.
Because of its inherent limitations, internal control over financial reporting may not prevent or detect misstatements. Also, projections of any evaluation of effectiveness to future periods are subject to the risk that controls may become inadequate because of changes in conditions, or that the degree of compliance with the policies or procedures may deteriorate.
In our opinion, Kadant Inc. maintained, in all material respects, effective internal control over financial reporting as of
December 31, 2016
, based on the criteria established in
Internal Control—Integrated Framework
(2013)
issued by the Committee of Sponsoring Organizations of the Treadway Commission.
Kadant Inc. acquired all of the outstanding shares of RT Holding GmbH, the parent corporation of a group of companies known as the PAALGROUP (PAAL) during 2016, and management excluded from its assessment the effectiveness of Kadant Inc.’s internal control over financial reporting as of
December 31, 2016
, PAAL’s internal control over financial reporting associated with total assets of $77.6 million (of which $54.5 million represented goodwill and intangible assets included within the scope of the assessment), and total revenues of $40.8 million included in the consolidated financial statements of Kadant Inc. and subsidiaries as of and for the year ended
December 31, 2016
. Our audit of internal control over financial reporting of Kadant Inc. also excluded an evaluation of the internal control over financial reporting of PAAL.
We also have audited, in accordance with the standards of the Public Company Accounting Oversight Board (United States), the consolidated balance sheets of Kadant Inc. and subsidiaries as of
December 31, 2016
and
January 2, 2016
, and the related consolidated statements of income, comprehensive income, cash flows, and stockholders’ equity for each of the years in the three-year period ended
December 31, 2016
, and our report dated March 15, 2017 expressed an unqualified opinion on those consolidated financial statements.
/s/ KPMG LLP
Boston, Massachusetts
March 15, 2017
F-3
|
Kadant Inc.
|
2016 Financial Statements
|
|
|
(In thousands, except share amounts)
|
2016
|
2015
|
||||||
|
Assets
|
||||||||
|
Current Assets:
|
||||||||
|
Cash and cash equivalents
|
$
|
71,487
|
|
$
|
65,530
|
|
||
|
Restricted cash
|
2,082
|
|
1,406
|
|
||||
|
Accounts receivable, less allowances of $2,395 and $2,163
|
65,963
|
|
64,321
|
|
||||
|
Inventories
|
54,951
|
|
56,758
|
|
||||
|
Unbilled contract costs and fees
|
3,068
|
|
6,580
|
|
||||
|
Other current assets
|
9,799
|
|
10,525
|
|
||||
|
Total Current Assets
|
207,350
|
|
205,120
|
|
||||
|
Property, Plant, and Equipment, at Cost, Net
|
47,704
|
|
42,293
|
|
||||
|
Other Assets
|
11,452
|
|
11,002
|
|
||||
|
Intangible Assets, Net
|
52,730
|
|
38,032
|
|
||||
|
Goodwill
|
151,455
|
|
119,051
|
|
||||
|
Total Assets
|
$
|
470,691
|
|
$
|
415,498
|
|
||
|
Liabilities and Stockholders' Equity
|
|
|
|
|
||||
|
Current Liabilities:
|
|
|
|
|
||||
|
Short-term obligations (Note 6)
|
$
|
643
|
|
$
|
5,250
|
|
||
|
Accounts payable
|
23,929
|
|
24,418
|
|
||||
|
Accrued payroll and employee benefits
|
20,508
|
|
19,583
|
|
||||
|
Customer deposits
|
21,168
|
|
20,123
|
|
||||
|
Accrued income taxes
|
2,739
|
|
5,333
|
|
||||
|
Other current liabilities
|
19,926
|
|
21,921
|
|
||||
|
Total Current Liabilities
|
88,913
|
|
96,628
|
|
||||
|
Long-Term Deferred Income Taxes (Note 5)
|
14,631
|
|
8,992
|
|
||||
|
Other Long-Term Liabilities (Note 3)
|
17,100
|
|
15,933
|
|
||||
|
Long-Term Obligations (Note 6)
|
65,768
|
|
26,000
|
|
||||
|
Commitments and Contingencies (Note 7)
|
|
|
|
|
||||
|
Stockholders' Equity (Notes 3 and 4):
|
|
|
|
|
||||
|
Preferred stock, $.01 par value, 5,000,000 shares authorized; none issued
|
—
|
|
—
|
|
||||
|
Common stock, $.01 par value, 150,000,000 shares authorized; 14,624,159 shares issued
|
146
|
|
146
|
|
||||
|
Capital in excess of par value
|
101,405
|
|
100,536
|
|
||||
|
Retained earnings
|
321,050
|
|
297,258
|
|
||||
|
Treasury stock at cost, 3,686,532 and 3,850,779 shares
|
(90,335
|
)
|
(94,359
|
)
|
||||
|
Accumulated other comprehensive items (Note 13)
|
(49,637
|
)
|
(36,972
|
)
|
||||
|
Total Kadant Stockholders' Equity
|
282,629
|
|
266,609
|
|
||||
|
Noncontrolling interest
|
1,650
|
|
1,336
|
|
||||
|
Total Stockholders' Equity
|
284,279
|
|
267,945
|
|
||||
|
Total Liabilities and Stockholders' Equity
|
$
|
470,691
|
|
$
|
415,498
|
|
||
The accompanying notes are an integral part of these consolidated financial statements.
F-4
|
Kadant Inc.
|
2016 Financial Statements
|
|
|
(In thousands, except per share amounts)
|
2016
|
2015
|
2014
|
|||||||||
|
Revenues (Note 11)
|
$
|
414,126
|
|
$
|
390,107
|
|
$
|
402,127
|
|
|||
|
Costs and Operating Expenses:
|
|
|
|
|
||||||||
|
Cost of revenues
|
225,737
|
|
209,982
|
|
223,754
|
|
||||||
|
Selling, general, and administrative expenses
|
135,753
|
|
122,814
|
|
129,319
|
|
||||||
|
Research and development expenses
|
7,380
|
|
6,677
|
|
6,163
|
|
||||||
|
Other income and restructuring costs (Note 8)
|
(317
|
)
|
515
|
|
805
|
|
||||||
|
|
368,553
|
|
339,988
|
|
360,041
|
|
||||||
|
Operating Income
|
45,573
|
|
50,119
|
|
42,086
|
|
||||||
|
Interest Income
|
269
|
|
200
|
|
398
|
|
||||||
|
Interest Expense
|
(1,293
|
)
|
(948
|
)
|
(966
|
)
|
||||||
|
Income from Continuing Operations Before Provision for Income Taxes
|
44,549
|
|
49,371
|
|
41,518
|
|
||||||
|
Provision for Income Taxes (Note 5)
|
12,083
|
|
14,762
|
|
12,447
|
|
||||||
|
Income from Continuing Operations
|
32,466
|
|
34,609
|
|
29,071
|
|
||||||
|
Income (Loss) from Discontinued Operation (net of income tax (provision) benefit of $(2), $(43), and $14 in 2016, 2015, and 2014, respectively)
|
3
|
|
74
|
|
(23
|
)
|
||||||
|
Net Income
|
32,469
|
|
34,683
|
|
29,048
|
|
||||||
|
Net Income Attributable to Noncontrolling Interest
|
(392
|
)
|
(294
|
)
|
(389
|
)
|
||||||
|
Net Income Attributable to Kadant
|
$
|
32,077
|
|
$
|
34,389
|
|
$
|
28,659
|
|
|||
|
Amounts Attributable to Kadant:
|
|
|
|
|
|
|
||||||
|
Income from Continuing Operations
|
$
|
32,074
|
|
$
|
34,315
|
|
$
|
28,682
|
|
|||
|
Income (Loss) from Discontinued Operation
|
3
|
|
74
|
|
(23
|
)
|
||||||
|
Net Income Attributable to Kadant
|
$
|
32,077
|
|
$
|
34,389
|
|
$
|
28,659
|
|
|||
|
Earnings per Share from Continuing Operations Attributable to Kadant
(Note 12) |
|
|
|
|
|
|
||||||
|
Basic
|
$
|
2.95
|
|
$
|
3.16
|
|
$
|
2.61
|
|
|||
|
Diluted
|
$
|
2.88
|
|
$
|
3.09
|
|
$
|
2.56
|
|
|||
|
Earnings per Share Attributable to Kadant
(Note 12)
|
|
|
|
|
|
|
||||||
|
Basic
|
$
|
2.95
|
|
$
|
3.16
|
|
$
|
2.61
|
|
|||
|
Diluted
|
$
|
2.88
|
|
$
|
3.10
|
|
$
|
2.56
|
|
|||
|
Weighted Average Shares
(Note 12)
|
|
|
|
|
||||||||
|
Basic
|
10,869
|
|
10,867
|
|
10,988
|
|
||||||
|
Diluted
|
11,149
|
|
11,094
|
|
11,210
|
|
||||||
|
Cash Dividends Declared per Common Share
|
$
|
0.76
|
|
$
|
0.68
|
|
$
|
0.60
|
|
|||
The accompanying notes are an integral part of these consolidated financial statements.
F-5
|
Kadant Inc.
|
2016 Financial Statements
|
|
Consolidated Statement of Comprehensive Income
|
(In thousands)
|
2016
|
2015
|
2014
|
|||||||||
|
Comprehensive Income
|
||||||||||||
|
Net Income
|
$
|
32,469
|
|
$
|
34,683
|
|
$
|
29,048
|
|
|||
|
Other Comprehensive Items:
|
|
|
|
|
|
|
||||||
|
Foreign currency translation loss
|
(13,240
|
)
|
(20,687
|
)
|
(16,436
|
)
|
||||||
|
Pension and other post-retirement liability adjustments, net (net of tax provision (benefit) of $125, $107, and $(792) in 2016, 2015, and 2014, respectively)
|
256
|
|
172
|
|
(1,407
|
)
|
||||||
|
Deferred gain (loss) on hedging instruments (net of tax (benefit) provision of $(67), $84, and $151 in 2016, 2015, and 2014, respectively)
|
241
|
|
563
|
|
(159
|
)
|
||||||
|
Other Comprehensive Items
|
(12,743
|
)
|
(19,952
|
)
|
(18,002
|
)
|
||||||
|
Comprehensive Income
|
19,726
|
|
14,731
|
|
11,046
|
|
||||||
|
Comprehensive Income Attributable to Noncontrolling Interest
|
(314
|
)
|
(168
|
)
|
(243
|
)
|
||||||
|
Comprehensive Income Attributable to Kadant
|
$
|
19,412
|
|
$
|
14,563
|
|
$
|
10,803
|
|
|||
The accompanying notes are an integral part of these consolidated financial statements.
F-6
|
Kadant Inc.
|
2016 Financial Statements
|
|
|
(In thousands)
|
2016
|
2015
|
2014
|
|||||||||
|
Operating Activities
|
||||||||||||
|
Net income attributable to Kadant
|
$
|
32,077
|
|
$
|
34,389
|
|
$
|
28,659
|
|
|||
|
Net income attributable to noncontrolling interest
|
392
|
|
294
|
|
389
|
|
||||||
|
(Income) loss from discontinued operation
|
(3
|
)
|
(74
|
)
|
23
|
|
||||||
|
Income from continuing operations
|
32,466
|
|
34,609
|
|
29,071
|
|
||||||
|
Adjustments to reconcile income from continuing operations to net cash provided by operating activities:
|
||||||||||||
|
Depreciation and amortization
|
14,326
|
|
10,821
|
|
11,189
|
|
||||||
|
Stock-based compensation expense
|
5,069
|
|
5,741
|
|
5,813
|
|
||||||
|
Tax benefits from stock-based compensation awards
|
—
|
|
(881
|
)
|
(771
|
)
|
||||||
|
Provision for losses on accounts receivable
|
453
|
|
379
|
|
246
|
|
||||||
|
(Gain) loss on sale of property, plant, and equipment
|
(350
|
)
|
4
|
|
(118
|
)
|
||||||
|
Deferred income tax (benefit) provision
|
(613
|
)
|
(1,706
|
)
|
2,951
|
|
||||||
|
Other items, net
|
1,362
|
|
(287
|
)
|
1,318
|
|
||||||
|
Contributions to U.S. pension plan
|
(1,080
|
)
|
(1,080
|
)
|
(1,080
|
)
|
||||||
|
Changes in current assets and liabilities, net of effects of acquisitions:
|
|
|
|
|
|
|
||||||
|
Accounts receivable
|
1,003
|
|
(10,640
|
)
|
8,429
|
|
||||||
|
Unbilled contract costs and fees
|
3,407
|
|
(1,534
|
)
|
(2,277
|
)
|
||||||
|
Inventories
|
3,553
|
|
(6,486
|
)
|
5,067
|
|
||||||
|
Other current assets
|
753
|
|
1,495
|
|
(563
|
)
|
||||||
|
Accounts payable
|
(5,238
|
)
|
(1,752
|
)
|
652
|
|
||||||
|
Other current liabilities
|
(4,111
|
)
|
11,727
|
|
(8,817
|
)
|
||||||
|
Net cash provided by continuing operations
|
51,000
|
|
40,410
|
|
51,110
|
|
||||||
|
Net cash provided by (used in) discontinued operation
|
3
|
|
(38
|
)
|
5
|
|
||||||
|
Net cash provided by operating activities
|
51,003
|
|
40,372
|
|
51,115
|
|
||||||
|
Investing Activities
|
|
|
|
|
|
|
||||||
|
Acquisitions, net of cash acquired (Note 2)
|
(56,617
|
)
|
—
|
|
(11,984
|
)
|
||||||
|
Purchases of property, plant, and equipment
|
(5,804
|
)
|
(5,479
|
)
|
(6,755
|
)
|
||||||
|
Proceeds from sale of property, plant, and equipment
|
428
|
|
30
|
|
242
|
|
||||||
|
Net cash used in continuing operations for investing activities
|
(61,993
|
)
|
(5,449
|
)
|
(18,497
|
)
|
||||||
|
Financing Activities
|
|
|
|
|
|
|
||||||
|
Proceeds from issuance of short- and long-term obligations
|
51,046
|
|
24,000
|
|
24,512
|
|
||||||
|
Repayments of short- and long-term obligations
|
(18,429
|
)
|
(18,611
|
)
|
(36,953
|
)
|
||||||
|
Purchases of Company common stock
|
—
|
|
(9,906
|
)
|
(15,136
|
)
|
||||||
|
Dividends paid
|
(8,038
|
)
|
(7,179
|
)
|
(6,339
|
)
|
||||||
|
Tax withholding payments related to stock-based compensation
|
(2,572
|
)
|
(2,499
|
)
|
(2,243
|
)
|
||||||
|
Proceeds from issuance of Company common stock
|
2,350
|
|
754
|
|
1,119
|
|
||||||
|
Payment of contingent consideration (Note 2)
|
(1,091
|
)
|
—
|
|
—
|
|
||||||
|
Change in restricted cash
|
(789
|
)
|
(1,066
|
)
|
(299
|
)
|
||||||
|
Tax benefits from stock-based compensation awards
|
—
|
|
881
|
|
771
|
|
||||||
|
Other items
|
189
|
|
—
|
|
—
|
|
||||||
|
Net cash provided by (used in) continuing operations for financing activities
|
22,666
|
|
(13,626
|
)
|
(34,568
|
)
|
||||||
|
Exchange Rate Effect on Cash and Cash Equivalents from Continuing Operations
|
(5,714
|
)
|
(1,145
|
)
|
(2,704
|
)
|
||||||
|
Change in Cash from Discontinued Operation
|
(5
|
)
|
—
|
|
—
|
|
||||||
|
Increase (Decrease) in Cash and Cash Equivalents from Continuing Operations
|
5,957
|
|
20,152
|
|
(4,654
|
)
|
||||||
|
Cash and Cash Equivalents at Beginning of Year
|
65,530
|
|
45,378
|
|
50,032
|
|
||||||
|
Cash and Cash Equivalents at End of Year
|
$
|
71,487
|
|
$
|
65,530
|
|
$
|
45,378
|
|
|||
See Note 1 for supplemental cash flow information.
The accompanying notes are an integral part of these consolidated financial statements.
F-7
|
Kadant Inc.
|
2016 Financial Statements
|
|
Consolidated Statement of Stockholders' Equity
|
Capital in
|
Accumulated
Other |
Total
|
||||||||||||||||||||||||||||||||
|
|
Common Stock
|
Excess of
|
Retained
|
Treasury Stock
|
Comprehensive
|
Noncontrolling
|
Stockholders'
|
|||||||||||||||||||||||||||
|
(In thousands, except share amounts)
|
Shares
|
Amount
|
Par Value
|
Earnings
|
Shares
|
Amount
|
Items
|
Interest
|
Equity
|
|||||||||||||||||||||||||
|
Balance at December 28, 2013
|
14,624,159
|
|
$
|
146
|
|
$
|
96,809
|
|
$
|
248,170
|
|
3,524,742
|
|
$
|
(76,339
|
)
|
$
|
710
|
|
$
|
925
|
|
$
|
270,421
|
|
|||||||||
|
Net income
|
—
|
|
—
|
|
—
|
|
28,659
|
|
—
|
|
—
|
|
—
|
|
389
|
|
29,048
|
|
||||||||||||||||
|
Dividends declared
|
—
|
|
—
|
|
—
|
|
(6,580
|
)
|
—
|
|
—
|
|
—
|
|
—
|
|
(6,580
|
)
|
||||||||||||||||
|
Activity under stock plans
|
—
|
|
—
|
|
1,189
|
|
—
|
|
(169,858
|
)
|
3,748
|
|
—
|
|
—
|
|
4,937
|
|
||||||||||||||||
|
Tax benefits related to employees' and directors' stock plans
|
—
|
|
—
|
|
771
|
|
—
|
|
—
|
|
—
|
|
—
|
|
—
|
|
771
|
|
||||||||||||||||
|
Purchases of Company common stock
|
—
|
|
—
|
|
—
|
|
—
|
|
405,135
|
|
(15,136
|
)
|
—
|
|
—
|
|
(15,136
|
)
|
||||||||||||||||
|
Other comprehensive items
|
—
|
|
—
|
|
—
|
|
—
|
|
—
|
|
—
|
|
(17,856
|
)
|
(146
|
)
|
(18,002
|
)
|
||||||||||||||||
|
Balance at January 3, 2015
|
14,624,159
|
|
$
|
146
|
|
$
|
98,769
|
|
$
|
270,249
|
|
3,760,019
|
|
$
|
(87,727
|
)
|
$
|
(17,146
|
)
|
$
|
1,168
|
|
$
|
265,459
|
|
|||||||||
|
Net income
|
—
|
|
—
|
|
—
|
|
34,389
|
|
—
|
|
—
|
|
—
|
|
294
|
|
34,683
|
|
||||||||||||||||
|
Dividends declared
|
—
|
|
—
|
|
—
|
|
(7,380
|
)
|
—
|
|
—
|
|
—
|
|
—
|
|
(7,380
|
)
|
||||||||||||||||
|
Activity under stock plans
|
—
|
|
—
|
|
886
|
|
—
|
|
(139,000
|
)
|
3,274
|
|
—
|
|
—
|
|
4,160
|
|
||||||||||||||||
|
Tax benefits related to employees' and directors' stock plans
|
—
|
|
—
|
|
881
|
|
—
|
|
—
|
|
—
|
|
—
|
|
—
|
|
881
|
|
||||||||||||||||
|
Purchases of Company common stock
|
—
|
|
—
|
|
—
|
|
—
|
|
229,760
|
|
(9,906
|
)
|
—
|
|
—
|
|
(9,906
|
)
|
||||||||||||||||
|
Other comprehensive items
|
—
|
|
—
|
|
—
|
|
—
|
|
—
|
|
—
|
|
(19,826
|
)
|
(126
|
)
|
(19,952
|
)
|
||||||||||||||||
|
Balance at January 2, 2016
|
14,624,159
|
|
$
|
146
|
|
$
|
100,536
|
|
$
|
297,258
|
|
3,850,779
|
|
$
|
(94,359
|
)
|
$
|
(36,972
|
)
|
$
|
1,336
|
|
$
|
267,945
|
|
|||||||||
|
Net income
|
—
|
|
—
|
|
—
|
|
32,077
|
|
—
|
|
—
|
|
—
|
|
392
|
|
32,469
|
|
||||||||||||||||
|
Dividends declared
|
—
|
|
—
|
|
—
|
|
(8,285
|
)
|
—
|
|
—
|
|
—
|
|
—
|
|
(8,285
|
)
|
||||||||||||||||
|
Activity under stock plans
|
—
|
|
—
|
|
869
|
|
—
|
|
(164,247
|
)
|
4,024
|
|
—
|
|
—
|
|
4,893
|
|
||||||||||||||||
|
Other comprehensive items
|
—
|
|
—
|
|
—
|
|
—
|
|
—
|
|
—
|
|
(12,665
|
)
|
(78
|
)
|
(12,743
|
)
|
||||||||||||||||
|
Balance at December 31, 2016
|
14,624,159
|
|
$
|
146
|
|
$
|
101,405
|
|
$
|
321,050
|
|
3,686,532
|
|
$
|
(90,335
|
)
|
$
|
(49,637
|
)
|
$
|
1,650
|
|
$
|
284,279
|
|
|||||||||
The accompanying notes are an integral part of these consolidated financial statements.
F-8
|
Kadant Inc.
|
2016 Financial Statements
|
|
1.
Nature of Operations and Summary of Significant Accounting Policies
Nature of Operations
Kadant Inc. was incorporated in Delaware in November 1991 and currently trades on the New York Stock Exchange under the ticker symbol "KAI."
Kadant Inc. and its subsidiaries' (collectively, the Company) continuing operations include
two
reportable operating segments, Papermaking Systems and Wood Processing Systems, and a separate product line, Fiber-based Products.
Through its Papermaking Systems segment, the Company develops, manufactures, and markets a range of equipment and products primarily for the global papermaking, paper recycling, recycling and waste management, and other process industries. The Company's principal products in this segment include custom-engineered stock-preparation systems and equipment for the preparation of wastepaper for conversion into recycled paper and balers and related equipment used in the processing of recyclable and waste materials; fluid-handling systems used primarily in the dryer section of the papermaking process and during the production of corrugated boxboard, metals, plastics, rubber, textiles, chemicals, and food; doctoring systems and equipment and related consumables important to the efficient operation of paper machines; and cleaning and filtration systems essential for draining, purifying, and recycling process water and cleaning paper machine fabrics and rolls.
Through its Wood Processing Systems segment, the Company develops, manufactures, and markets stranders and related equipment used in the production of oriented strand board (OSB), an engineered wood panel product used primarily in home construction. This segment also sells debarking and wood chipping equipment used in the forest products and the pulp and paper industries. Through this segment, the Company also provides refurbishment and repair of pulping equipment for the pulp and paper industry.
Through its Fiber-based Products business, the Company manufactures and sells granules derived from papermaking by-products primarily for use as agricultural carriers and for home lawn and garden applications, as well as for oil and grease absorption.
Principles of Consolidation
The accompanying consolidated financial statements of the Company include the accounts of its wholly and majority-owned subsidiaries. All material intercompany accounts and transactions have been eliminated.
Financial Statement Presentation
Certain reclassifications have been made to prior periods to conform with current reporting. As a result of the adoption of the Financial Accounting Standards Board (FASB) Accounting Standards Update (ASU) No. 2016-09, "Improvements to Employee Share-Based Payment Arrangements," tax withholding payments made related to stock-based compensation awards have been reclassified from other current liabilities within operating activities and presented separately within financing activities in the accompanying consolidated statement of cash flows for the 2015 and 2014 fiscal years.
Fiscal Year
Typically, the Company's fiscal quarters and fiscal year consist of 13 and 52 weeks, respectively, ending on the Saturday closest to the end of the corresponding calendar quarter for the Company's fiscal quarters and on the Saturday closest to December 31 for the Company's fourth fiscal quarter and fiscal year. As a result of the difference between the fiscal and calendar periods, a 53rd week is added to the Company's fiscal year every five or six years. In a 53-week fiscal year, the Company's fourth fiscal quarter contains 14 weeks. The Company's fiscal year ended December 31, 2016 (fiscal 2016) and January 2, 2016 (fiscal 2015) both contained 52 weeks and the Company's fiscal year ended January 3, 2015 (fiscal 2014) contained 53 weeks. Each quarter of fiscal 2016, 2015 and 2014 contained 13 weeks, except the fourth quarter of 2014, which contained 14 weeks.
Use of Estimates and Critical Accounting Policies
The preparation of financial statements in conformity with U.S. generally accepted accounting principles (GAAP) requires management to make estimates and assumptions that affect the reported amounts of assets and liabilities, disclosure of contingent assets and liabilities at the date of the financial statements, and the reported amounts of revenues and expenses during the reporting period.
Critical accounting policies are defined as those that entail significant judgments and estimates, and could potentially result in materially different results under different assumptions and conditions. The Company believes that the most critical accounting policies upon which its financial position depends, and which involve the most complex or subjective decisions or
F-9
|
Kadant Inc.
|
2016 Financial Statements
|
|
Notes to Consolidated Financial Statements
1.
Nature of Operations and Summary of Significant Accounting Policies (continued)
assessments, concern revenue recognition and accounts receivable, warranty obligations, income taxes, the valuation of goodwill and intangible assets, inventories, and pension obligations. A discussion on the application of these and other accounting policies is included in Notes 1 and 3.
Although the Company makes every effort to ensure the accuracy of the estimates and assumptions used in the preparation of its consolidated financial statements or in the application of accounting policies, if business conditions were different, or if the Company were to use different estimates and assumptions, it is possible that materially different amounts could be reported in the Company's consolidated financial statements.
Revenue Recognition and Accounts Receivable
The Company recognizes revenue under Accounting Standards Codification (ASC) 605, "Revenue Recognition," (ASC 605) when the following criteria have been met: persuasive evidence of an arrangement exists, delivery has occurred or service has been rendered, the sales price is fixed or determinable, and collectability is reasonably assured. When the terms of the sale include customer acceptance provisions, and compliance with those provisions cannot be demonstrated until customer acceptance, revenues are recognized upon such acceptance. The Company includes in revenue amounts invoiced for shipping and handling with the corresponding costs reflected in cost of revenues. Provisions for discounts, warranties, returns and other adjustments are provided for in the period in which the related sales are recorded. Sales taxes, value-added taxes and certain excise taxes collected from customers and remitted to governmental authorities are accounted for on a net basis and therefore are excluded from revenue.
Most of the Company's revenue is recognized in accordance with the accounting policies in the preceding paragraph. However, when a sale arrangement involves multiple elements, such as equipment and installation, the Company considers the guidance in ASC 605. Such transactions are evaluated to determine whether the deliverables in the arrangement represent separate units of accounting based on the following criteria: the delivered item has value to the customer on a stand-alone basis, and if the contract includes a general right of return relative to the delivered item, delivery or performance of the undelivered item is considered probable and substantially under the control of the Company. Revenue is allocated to each unit of accounting or element based on relative selling prices and is recognized as each element is delivered or completed. The Company determines relative selling prices by using either vendor-specific objective evidence (VSOE) if that exists, or third-party evidence of selling price. When neither VSOE nor third-party evidence of selling price exists for a deliverable, the Company uses its best estimate of the selling price for that deliverable. In cases in which elements cannot be treated as separate units of accounting, the elements are combined into a single unit of accounting for revenue recognition purposes.
In addition, revenues and profits on certain long-term contracts are recognized using the percentage-of-completion method or the completed-contract method of accounting pursuant to ASC 605. Revenues recorded under the percentage-of-completion method were
$23,300,000
,
$32,078,000
, and
$19,078,000
in
2016
,
2015
, and
2014
, respectively. The percentage of completion is determined by comparing the actual costs incurred to date to an estimate of total costs to be incurred on each contract. If a loss is indicated on any contract in process, a provision is made currently for the entire estimated loss. The Company's contracts generally provide for billing of customers upon the attainment of certain milestones specified in each contract. Revenues earned on contracts in process in excess of billings are classified as unbilled contract costs and fees, and amounts billed in excess of revenues earned are classified as billings in excess of contract costs and fees, which are included in other current liabilities in the accompanying consolidated balance sheet. There are no significant amounts included in the accompanying consolidated balance sheet that are not expected to be recovered from existing contracts at current contract values, or that are not expected to be collected within one year, including amounts that are billed but not paid under retainage provisions.
For long-term contracts that do not meet the criteria under ASC 605-35 to be accounted for under the percentage-of-completion method, the Company recognizes revenue, primarily in China, using the completed-contract method. When using the completed-contract method, the Company recognizes revenue when the contract has been substantially completed, the product has been delivered, and, if applicable, the customer acceptance criteria have been met. Inventory included
$274,000
at year-end
2015
associated with long-term contracts accounted for under the completed-contract method. Customer deposits included
$5,158,000
and
$2,374,000
of advance payments on long-term contracts accounted for under the completed-contract method at year-end
2016
and year-end
2015
, respectively.
Accounts receivable are recorded at the invoiced amount and do not bear interest. The Company exercises judgment in determining its allowance for doubtful accounts, which is based on its historical collection experience, current trends, credit policies, specific customer collection issues, and accounts receivable aging categories. In determining this allowance, the Company looks at historical write-offs of its receivables. The Company also looks at current trends in the credit quality of its customer base as well as changes in its credit policies. The Company performs ongoing credit evaluations of its customers and adjusts credit limits based upon payment history and each customer's current creditworthiness. The Company continuously
F-10
|
Kadant Inc.
|
2016 Financial Statements
|
|
Notes to Consolidated Financial Statements
1.
Nature of Operations and Summary of Significant Accounting Policies (continued)
monitors collections and payments from its customers. Account balances are charged off against the allowance when the Company believes it is probable the receivable will not be recovered. In some instances, the Company utilizes letters of credit to mitigate its credit exposure.
The Company's Chinese subsidiaries may receive banker's acceptance drafts from customers as payment for their trade accounts receivable. The banker's acceptance drafts are non-interest bearing obligations of the issuing bank and mature within six months of the origination date. The Company can sell the drafts at a discount to a third-party financial institution or transfer the drafts to vendors in settlement of current accounts payable prior to the scheduled maturity date. These drafts, which totaled
$7,852,000
and
$8,314,000
at year-end
2016
and year-end
2015
, respectively, are included in accounts receivable in the accompanying consolidated balance sheet until the subsidiary sells the drafts to a bank and receives a discounted amount, transfers the banker's acceptance drafts in settlement of current accounts payable prior to maturity, or obtains cash payment on the scheduled maturity date.
The changes in the allowance for doubtful accounts are as follows:
|
(In thousands)
|
2016
|
2015
|
2014
|
|||||||||
|
Balance at Beginning of Year
|
$
|
2,163
|
|
$
|
2,198
|
|
$
|
2,689
|
|
|||
|
Provision charged to expense
|
453
|
|
379
|
|
246
|
|
||||||
|
Accounts recovered
|
—
|
|
—
|
|
15
|
|
||||||
|
Accounts written off
|
(128
|
)
|
(205
|
)
|
(590
|
)
|
||||||
|
Currency translation
|
(93
|
)
|
(209
|
)
|
(162
|
)
|
||||||
|
Balance at End of Year
|
$
|
2,395
|
|
$
|
2,163
|
|
$
|
2,198
|
|
|||
Warranty Obligations
The Company provides for the estimated cost of product warranties at the time of sale based on the actual historical occurrence rates and repair costs, as well as knowledge of any specific warranty problems that indicate that projected warranty costs may vary from historical patterns. The Company typically negotiates the terms regarding warranty coverage and length of warranty depending on the products and applications. While the Company engages in extensive product quality programs and processes, the Company's warranty obligation is affected by product failure rates, repair costs, service delivery costs incurred in correcting a product failure, and supplier warranties on parts delivered to the Company. Should actual product failure rates, repair costs, service delivery costs, or supplier warranties on parts differ from the Company's estimates, revisions to the estimated warranty liability would be required.
The changes in the carrying amount of accrued warranty costs included in other current liabilities in the accompanying consolidated balance sheet are as follows:
|
(In thousands)
|
2016
|
2015
|
||||||
|
Balance at Beginning of Year
|
$
|
3,670
|
|
$
|
3,875
|
|
||
|
Provision charged to income
|
3,091
|
|
2,660
|
|
||||
|
Usage
|
(3,632
|
)
|
(2,559
|
)
|
||||
|
Acquisition
|
991
|
|
—
|
|
||||
|
Currency translation
|
(277
|
)
|
(306
|
)
|
||||
|
Balance at End of Year
|
$
|
3,843
|
|
$
|
3,670
|
|
||
Income Taxes
In accordance with ASC 740, "Income Taxes," (ASC 740), the Company recognizes deferred income taxes based on the expected future tax consequences of differences between the financial statement basis and the tax basis of assets and liabilities, calculated using enacted tax rates in effect for the year in which these differences are expected to reverse. A tax valuation allowance is established, as needed, to reduce deferred tax assets to the amount expected to be realized. In the period in which it becomes more likely than not that some or all of the deferred tax assets will be realized, the valuation allowance will be adjusted.
It is the Company's policy to provide for uncertain tax positions and the related interest and penalties based upon management's assessment of whether a tax benefit is more likely than not to be sustained upon examination by tax authorities.
F-11
|
Kadant Inc.
|
2016 Financial Statements
|
|
Notes to Consolidated Financial Statements
1.
Nature of Operations and Summary of Significant Accounting Policies (continued)
The Company recognizes accrued interest and penalties related to unrecognized tax benefits in the provision for income taxes. At
December 31, 2016
, the Company believes that it has appropriately accounted for any liability for unrecognized tax benefits. To the extent the Company prevails in matters for which a liability for an unrecognized tax benefit is established, the statute of limitations expires for a tax jurisdiction year, or the Company is required to pay amounts in excess of the liability, its effective tax rate in a given financial statement period may be affected.
In November 2015, the FASB issued ASU No. 2015-17, "Income Taxes (Topic 740), Balance Sheet Classification of Deferred Taxes," which simplifies the presentation of deferred income taxes, as it requires that deferred tax assets and liabilities be classified as non-current in the accompanying consolidated balance sheet. The Company early adopted this ASU prospectively for the year ended January 2, 2016, which resulted in all deferred taxes being reported as non-current in its accompanying consolidated balance sheet. See Note 5, Income Taxes, for additional information.
Earnings per Share
Basic earnings per share (EPS) has been computed by dividing net income attributable to Kadant by the weighted average number of shares outstanding during the year. Diluted EPS was computed using the treasury stock method assuming the effect of all potentially dilutive securities, including stock options, restricted stock units (RSUs) and employee stock purchase plan shares.
Cash and Cash Equivalents
At year-end
2016
and
2015
, the Company's cash equivalents included investments in money market funds and other marketable securities, which had maturities of three months or less at the date of purchase. The carrying amounts of cash equivalents approximate their fair values due to the short-term nature of these instruments.
Restricted Cash
At year-end
2016
and
2015
, the Company had approximately
$2,082,000
and
$1,406,000
of restricted cash, respectively. This cash serves as collateral for bank guarantees primarily associated with providing assurance to customers that the Company will fulfill certain customer obligations entered into in the normal course of business. The majority of the bank guarantees expire by the end of 2017.
Supplemental Cash Flow Information
|
(In thousands)
|
2016
|
2015
|
2014
|
|||||||||
|
Cash Paid for Interest
|
$
|
1,183
|
|
$
|
616
|
|
$
|
1,081
|
|
|||
|
Cash Paid for Income Taxes, Net of Refunds
|
$
|
15,632
|
|
$
|
11,497
|
|
$
|
10,035
|
|
|||
|
Non-Cash Investing Activities:
|
||||||||||||
|
Fair value of assets of acquired businesses
|
$
|
84,969
|
|
$
|
—
|
|
$
|
14,771
|
|
|||
|
Cash paid for acquired businesses
|
(58,894
|
)
|
—
|
|
(12,658
|
)
|
||||||
|
Liabilities assumed of acquired businesses
|
$
|
26,075
|
|
$
|
—
|
|
$
|
2,113
|
|
|||
|
Non-Cash Financing Activities:
|
|
|
|
|
|
|
||||||
|
Issuance of company common stock
|
$
|
3,463
|
|
$
|
3,423
|
|
$
|
3,220
|
|
|||
|
Dividends declared but unpaid
|
$
|
2,078
|
|
$
|
1,831
|
|
$
|
1,630
|
|
|||
Inventories
Inventories are stated at the lower of cost (on a first-in, first-out; or weighted average basis) or market value and include materials, labor, and manufacturing overhead. The Company regularly reviews its quantities of inventories on hand and compares these amounts to the historical and forecasted usage of and demand for each particular product or product line. The Company records a charge to cost of revenues for excess and obsolete inventory to reduce the carrying value of inventories to net realizable value.
F-12
|
Kadant Inc.
|
2016 Financial Statements
|
|
Notes to Consolidated Financial Statements
1.
Nature of Operations and Summary of Significant Accounting Policies (continued)
The components of inventories are as follows:
|
(In thousands)
|
2016
|
2015
|
||||||
|
Raw Materials and Supplies
|
$
|
21,086
|
|
$
|
22,324
|
|
||
|
Work in Process
|
12,293
|
|
13,819
|
|
||||
|
Finished Goods (includes $1,249 and $1,262 at customer locations)
|
21,572
|
|
20,615
|
|
||||
|
|
$
|
54,951
|
|
$
|
56,758
|
|
||
Property, Plant, and Equipment
Property, plant, and equipment are stated at cost. The costs of additions and improvements are capitalized, while maintenance and repairs are charged to expense as incurred. The Company provides for depreciation and amortization primarily using the straight-line method over the estimated useful lives of the property as follows: buildings,
10
to
40
years; machinery and equipment,
2
to
10
years; and leasehold improvements, the shorter of the term of the lease or the life of the asset.
Property, plant, and equipment consist of the following:
|
(In thousands)
|
2016
|
2015
|
||||||
|
Land
|
$
|
4,827
|
|
$
|
3,792
|
|
||
|
Buildings
|
39,706
|
|
36,547
|
|
||||
|
Machinery, Equipment, and Leasehold Improvements
|
79,891
|
|
77,675
|
|
||||
|
|
124,424
|
|
118,014
|
|
||||
|
Less: Accumulated Depreciation and Amortization
|
76,720
|
|
75,721
|
|
||||
|
|
$
|
47,704
|
|
$
|
42,293
|
|
||
Property, plant, and equipment at year-end 2016 included assets under capital lease that were acquired in 2016. The gross amount and accumulated amortization of property, plant, and equipment under capital lease were
$5,335,000
and
$221,000
as of year-end
2016
, respectively. Amortization of property, plant, and equipment under capital lease is included within depreciation and amortization expense. Depreciation and amortization expense related to property, plant, and equipment was
$6,194,000
,
$5,814,000
, and
$5,661,000
in
2016
,
2015
, and
2014
, respectively.
Intangible Assets
Intangible assets in the accompanying consolidated balance sheet include the costs of acquired intellectual property, tradenames, patents, customer relationships, non-compete agreements and other specifically identifiable intangible assets. An intangible asset of
$8,100,000
associated with the acquisition of the Johnson tradename as part of the Company's acquisition of The Johnson Corporation in 2005 has an indefinite life and is not being amortized. The remaining intangible assets have been amortized as the underlying economic benefits are realized with a weighted-average amortization period of
12 years
. The intangible asset lives have been determined based on the anticipated period over which the Company will derive future cash flow benefits from the intangible assets. The Company has considered the effects of legal, regulatory, contractual, competitive, and other economic factors in determining these useful lives.
F-13
|
Kadant Inc.
|
2016 Financial Statements
|
|
Notes to Consolidated Financial Statements
1.
Nature of Operations and Summary of Significant Accounting Policies (continued)
Acquired intangible assets are as follows:
|
(In thousands)
|
2016
|
2015
|
||||||
|
Indefinite-Lived Intangible Asset
|
$
|
8,100
|
|
$
|
8,100
|
|
||
|
Definite-Lived Intangible Assets, Gross
|
$
|
77,052
|
|
$
|
77,052
|
|
||
|
Acquisition (Note 2)
|
24,691
|
|
—
|
|
||||
|
Accumulated amortization
|
(49,040
|
)
|
(40,908
|
)
|
||||
|
Currency translation
|
(8,073
|
)
|
(6,212
|
)
|
||||
|
Definite-Lived Intangible Assets, Net
|
$
|
44,630
|
|
$
|
29,932
|
|
||
|
Total Intangible Assets, Net
|
$
|
52,730
|
|
$
|
38,032
|
|
||
Acquired intangible assets by major asset class are as follows:
|
(In thousands)
|
Gross
|
Currency
Translation |
Accumulated
Amortization |
Net
|
||||||||||||
|
December 31, 2016
|
||||||||||||||||
|
Customer relationships
|
$
|
59,101
|
|
$
|
(5,202
|
)
|
$
|
(21,805
|
)
|
$
|
32,094
|
|
||||
|
Intellectual property
|
27,101
|
|
(2,052
|
)
|
(17,105
|
)
|
7,944
|
|
||||||||
|
Tradenames
|
12,547
|
|
(591
|
)
|
(1,065
|
)
|
10,891
|
|
||||||||
|
Non-compete agreements
|
3,662
|
|
(85
|
)
|
(3,373
|
)
|
204
|
|
||||||||
|
Distribution network
|
2,400
|
|
—
|
|
(1,642
|
)
|
758
|
|
||||||||
|
Licensing agreements
|
400
|
|
—
|
|
(233
|
)
|
167
|
|
||||||||
|
Other
|
4,632
|
|
(143
|
)
|
(3,817
|
)
|
672
|
|
||||||||
|
|
$
|
109,843
|
|
$
|
(8,073
|
)
|
$
|
(49,040
|
)
|
$
|
52,730
|
|
||||
|
January 2, 2016
|
|
|
|
|
|
|
|
|
||||||||
|
Customer relationships
|
$
|
43,271
|
|
$
|
(3,916
|
)
|
$
|
(17,314
|
)
|
$
|
22,041
|
|
||||
|
Intellectual property
|
22,899
|
|
(1,772
|
)
|
(15,584
|
)
|
5,543
|
|
||||||||
|
Tradenames
|
10,269
|
|
(405
|
)
|
(698
|
)
|
9,166
|
|
||||||||
|
Non-compete agreements
|
3,548
|
|
(55
|
)
|
(3,298
|
)
|
195
|
|
||||||||
|
Distribution network
|
2,400
|
|
—
|
|
(1,501
|
)
|
899
|
|
||||||||
|
Licensing agreements
|
400
|
|
—
|
|
(213
|
)
|
187
|
|
||||||||
|
Other
|
2,365
|
|
(64
|
)
|
(2,300
|
)
|
1
|
|
||||||||
|
|
$
|
85,152
|
|
$
|
(6,212
|
)
|
$
|
(40,908
|
)
|
$
|
38,032
|
|
||||
Amortization of acquired intangible assets was
$8,132,000
,
$5,007,000
, and
$5,528,000
in
2016
,
2015
, and
2014
, respectively. The estimated future amortization expense of acquired definite-lived intangible assets is
$6,832,000
in 2017;
$6,481,000
in 2018;
$5,945,000
in 2019;
$5,450,000
in 2020;
$5,051,000
in 2021; and
$14,871,000
in the aggregate thereafter.
Goodwill
Goodwill represents the excess of the cost of an acquisition over the fair value of the identifiable net assets of the acquired business at the date of acquisition. The Company’s acquisitions have historically been made at prices above the fair value of the acquired net assets, resulting in goodwill, due to the expectation of synergies from combining the businesses.
F-14
|
Kadant Inc.
|
2016 Financial Statements
|
|
Notes to Consolidated Financial Statements
1.
Nature of Operations and Summary of Significant Accounting Policies (continued)
The changes in the carrying amount of goodwill by segment are as follows:
|
(In thousands)
|
Papermaking Systems Segment
|
Wood Processing Systems Segment
|
Total
|
|||||||||
|
Balance as of January 3, 2015
|
||||||||||||
|
Gross balance
|
$
|
193,279
|
|
$
|
20,112
|
|
$
|
213,391
|
|
|||
|
Accumulated impairment losses
|
(85,509
|
)
|
—
|
|
(85,509
|
)
|
||||||
|
Net balance
|
107,770
|
|
20,112
|
|
127,882
|
|
||||||
|
Currency Translation
|
(5,559
|
)
|
(3,272
|
)
|
(8,831
|
)
|
||||||
|
Total 2015 Adjustments
|
(5,559
|
)
|
(3,272
|
)
|
(8,831
|
)
|
||||||
|
Balance at January 2, 2016
|
|
|
|
|
|
|
||||||
|
Gross balance
|
187,720
|
|
16,840
|
|
204,560
|
|
||||||
|
Accumulated impairment losses
|
(85,509
|
)
|
—
|
|
(85,509
|
)
|
||||||
|
Net balance
|
102,211
|
|
16,840
|
|
119,051
|
|
||||||
|
Increase Due to Acquisition (Note 2)
|
38,552
|
|
—
|
|
38,552
|
|
||||||
|
Currency Translation
|
(6,573
|
)
|
425
|
|
(6,148
|
)
|
||||||
|
Total 2016 Adjustments
|
31,979
|
|
425
|
|
32,404
|
|
||||||
|
Balance at December 31, 2016
|
|
|
|
|
|
|
||||||
|
Gross balance
|
219,699
|
|
17,265
|
|
236,964
|
|
||||||
|
Accumulated impairment losses
|
(85,509
|
)
|
—
|
|
(85,509
|
)
|
||||||
|
Net balance
|
$
|
134,190
|
|
$
|
17,265
|
|
$
|
151,455
|
|
|||
Impairment of Long-Lived Assets
The Company evaluates the recoverability of goodwill and intangible assets with indefinite useful lives as of the end of each fiscal year, or more frequently if events or changes in circumstances, such as a significant decline in sales, earnings, or cash flows, or material adverse changes in the business climate, indicate that the carrying value of an asset might be impaired. Testing goodwill for impairment involves a two-step quantitative process. However, prior to performing the two-step quantitative goodwill impairment test, the Company has the option to first perform an assessment of qualitative factors to determine whether it is more likely than not that the fair value of a reporting unit is less than its carrying amount.
At
December 31, 2016
and
January 2, 2016
, the Company performed a qualitative goodwill impairment analysis. This impairment analysis included an assessment of certain qualitative factors including, but not limited to, the results of prior fair value calculations, the movement of the Company's share price and market capitalization, the reporting unit and overall financial performance, and macroeconomic and industry conditions. The Company considered the qualitative factors and weighed the evidence obtained, and determined that it was not more likely than not that the fair value of any of the reporting units was less than its carrying amount. Although the Company believes the factors considered in the impairment analysis are reasonable, significant changes in any one of the assumptions used could have produced a different result.
Goodwill by reporting unit is as follows:
|
(In thousands)
|
2016
|
2015
|
||||||
|
Stock-Preparation
|
$
|
54,751
|
|
$
|
19,527
|
|
||
|
Doctoring, Cleaning, & Filtration
|
33,839
|
|
35,990
|
|
||||
|
Fluid-Handling
|
45,600
|
|
46,694
|
|
||||
|
Wood Processing Systems
|
17,265
|
|
16,840
|
|
||||
|
|
$
|
151,455
|
|
$
|
119,051
|
|
||
At
December 31, 2016
and
January 2, 2016
, the Company performed a quantitative impairment analysis on its indefinite-lived intangible asset, the Johnson tradename totaling
$8,100,000
, and determined that the asset was not impaired.
The Company assesses its long-lived assets, other than goodwill and indefinite-lived intangible assets, for impairment whenever facts and circumstances indicate that the carrying amounts may not be fully recoverable. To analyze recoverability, the Company projects undiscounted net future cash flows over the remaining lives of such assets or asset groups. If these projected cash flows were to be less than the carrying amounts, an impairment loss would be recognized, resulting in a write-
F-15
|
Kadant Inc.
|
2016 Financial Statements
|
|
Notes to Consolidated Financial Statements
1.
Nature of Operations and Summary of Significant Accounting Policies (continued)
down of the assets with a corresponding charge to earnings. The impairment loss would be measured based upon the difference between the carrying amounts and the fair values of the assets. No indicators of impairment were identified in
2016
or
2015
.
Foreign Currency Translation and Transactions
All assets and liabilities of the Company's foreign subsidiaries are translated at year-end exchange rates, and revenues and expenses are translated at average exchange rates for each quarter in accordance with ASC 830, "Foreign Currency Matters." Resulting translation adjustments are reflected in the "accumulated other comprehensive items (AOCI)" component of stockholders' equity (see Note 13). Foreign currency transaction gains and losses are included in the accompanying consolidated statement of income and are not material for the three years presented.
Stock-Based Compensation
The Company recognizes compensation cost for all stock-based awards granted to employees and directors based on the grant date estimate of fair value for those awards. The fair value of RSUs is based on the grant date trading price of the Company's common stock, reduced by the present value of estimated dividends foregone during the requisite service period. The fair value of stock options is based on the Black-Scholes option-pricing model. For stock options and time-based RSUs, compensation expense is recognized ratably over the requisite service period for the entire award net of forfeitures. For performance-based RSUs, compensation expense is recognized ratably over the requisite service period for each separately-vesting portion of the award net of forfeitures and remeasured at each reporting period until the total number of RSUs to be issued is known. Compensation expense related to any modified stock-based awards is based on the fair value for those awards as of the modification date with any remaining incremental compensation expense recognized ratably over the remaining requisite service period.
Derivatives
The Company uses derivative instruments primarily to reduce its exposure to changes in currency exchange rates and interest rates. When the Company enters into a derivative contract, the Company makes a determination as to whether the transaction is deemed to be a hedge for accounting purposes. For a contract deemed to be a hedge, the Company formally documents the relationship between the derivative instrument and the risk being hedged. In this documentation, the Company specifically identifies the asset, liability, forecasted transaction, cash flow, or net investment that has been designated as the hedged item, and evaluates whether the derivative instrument is expected to reduce the risks associated with the hedged item. To the extent these criteria are not met, the Company does not use hedge accounting for the derivative. The changes in the fair value of a derivative not deemed to be a hedge are recorded currently in earnings. The Company does not hold or engage in transactions involving derivative instruments for purposes other than risk management.
ASC 815, "Derivatives and Hedging," requires that all derivatives be recognized on the balance sheet at fair value. For derivatives designated as cash flow hedges, the related gains or losses on these contracts are deferred as a component of AOCI. These deferred gains and losses are recognized in the period in which the underlying anticipated transaction occurs. For derivatives designated as fair value hedges, the unrealized gains and losses resulting from the impact of currency exchange rate movements are recognized in earnings in the period in which the exchange rates change and offset the currency gains and losses on the underlying exposures being hedged. The Company performs an evaluation of the effectiveness of the hedge both at inception and on an ongoing basis. The ineffective portion of a hedge, if any, and changes in the fair value of a derivative not deemed to be a hedge, are recorded in the consolidated statement of income.
Recent Accounting Pronouncements
Revenue from Contracts with Customers (Topic 606), Section A-Summary and Amendments That Create Revenue from Contracts with Customers (Topic 606) and Other Assets and Deferred Costs-Contracts with Customers (Subtopic 340-40).
In May 2014, the FASB issued ASU No. 2014-09, which requires an entity to recognize the amount of revenue to which it expects to be entitled for the transfer of promised goods or services to customers. The new guidance provides a five-step analysis of transactions to determine when and how revenue is recognized. The ASU will replace most existing revenue recognition guidance in GAAP when it becomes effective. In March 2016, the FASB issued ASU No. 2016-08, which further clarifies the guidance on the principal versus agent considerations within ASU No. 2014-09. In April 2016, the FASB issued ASU No. 2016-10 to expand the guidance on identifying performance obligations and licensing within ASU 2014-09. In May 2016, the FASB issued ASU No. 2016-11, which rescinds certain previously-issued guidance, including, among other items, guidance relating to accounting for shipping and handling fees and freight services effective upon adoption of ASU No. 2014-09. Also in May 2016, the FASB issued ASU No. 2016-12, which narrowly amended the revenue recognition guidance regarding
F-16
|
Kadant Inc.
|
2016 Financial Statements
|
|
Notes to Consolidated Financial Statements
1.
Nature of Operations and Summary of Significant Accounting Policies (continued)
collectability, noncash consideration, presentation of sales tax and transition. In December 2016, the FASB issued ASU No. 2016-20, which clarifies narrow aspects of Topic 606 and corrects unintended application of the guidance. These new ASUs are effective for the Company beginning in fiscal 2018. Early adoption is permitted in fiscal 2017. The Company is continuing to assess the potential effects of these ASUs on its consolidated financial statements, business processes, systems and controls. The Company is analyzing its current contracts and comparing its current accounting policies and practices pertaining to revenue recognition to those required under the new ASUs to identify potential differences. The Company’s preliminary assessment of its most commonly used customer terms and conditions and routine sales transactions did not identify material impacts to its consolidated financial statements from the application of the guidance; however, a broad assessment is ongoing that includes surveying its major businesses concerning any unique customer contract terms or transactions that could have implications for the timing of revenue recognition under the new guidance. While the assessment process is ongoing, the Company currently anticipates adopting these ASUs using the modified retrospective transition approach. Under this approach, this guidance would apply to all new contracts initiated in fiscal 2018. For existing contracts that have remaining obligations as of the beginning of fiscal 2018, any difference between the recognition criteria in these ASUs and the Company’s current revenue recognition practices would be recognized using a cumulative effect adjustment to the opening balance of retained earnings. The Company is also in the process of developing and implementing appropriate changes to its business processes, systems and controls to support the recognition criteria and disclosure requirements of these ASUs.
Interest-Imputation of Interest (Subtopic 835-30), Simplifying the Presentation of Debt Issuance Costs.
In April 2015, the FASB issued ASU No. 2015-03, which requires that debt issuance costs related to a recognized debt liability be presented in the balance sheet as a direct deduction from the carrying amount of that debt liability, consistent with debt discounts. In addition, in June 2015, the FASB issued ASU No. 2015-15, which allows an entity to defer the requirements of ASU No. 2015-03 on deferred issuance costs related to line-of-credit arrangements. The recognition and measurement guidance for debt issuance costs are not affected by the amendments in these ASUs. These new disclosure items were effective for the Company beginning in fiscal 2016. The Company adopted these ASUs at the beginning of fiscal 2016. Adoption of these ASUs did not have an impact on the Company’s consolidated financial statements.
Disclosures for Investments in Certain Entities That Calculate Net Asset Value per Share (or Its Equivalent).
In May 2015, the FASB issued ASU No. 2015-07, which removes the requirement to categorize within the fair value hierarchy all investments for which fair value is measured using the net asset value per share practical expedient. This ASU also removes the requirement to make certain disclosures for all investments that are eligible to be measured at fair value using the net asset value per share practical expedient. Rather, those disclosures are limited to investments for which the entity has elected to measure the fair value using that practical expedient. The Company adopted the disclosure requirements in this guidance at the beginning of fiscal 2016. As this ASU is disclosure-related only, its adoption did not have an effect on the Company’s consolidated financial statements.
Inventory (Topic 330), Simplifying the Measurement of Inventory
. In July 2015, the FASB issued ASU No. 2015-11, which requires that an entity measure inventory within the scope of this ASU at the lower of cost or net realizable value. Net realizable value is the estimated selling price in the ordinary course of business, less reasonably predictable costs of completion, disposal, and transportation. Substantial and unusual losses that result from subsequent measurement of inventory should be disclosed in the financial statements. This new guidance is effective for the Company beginning in fiscal 2017. The Company does not expect that adoption of this ASU will have a material effect on its consolidated financial statements.
Business Combinations (Topic 805), Simplifying the Accounting for Measurement-Period Adjustments.
In September 2015, the FASB issued ASU No. 2015-16, which requires that an acquirer recognize adjustments to provisional amounts that are identified during the measurement period in the reporting period in which the adjustment amounts are determined. The acquirer is required to record, in the same period’s financial statements, the effect on earnings of changes in depreciation, amortization, or other income effects, if any, as a result of the change to the provisional amounts, calculated as if the accounting had been completed at the acquisition date. In addition, an entity is required to present, separately on the face of the statement of income or through disclosure in the notes, the portion of the amount recorded in current-period earnings by line item that would have been recorded in previous reporting periods if the adjustment to the provisional amounts had been recognized as of the acquisition date. The Company adopted this guidance at the beginning of fiscal 2016. Adoption of this ASU did not have an impact on the Company’s consolidated financial statements.
Leases (Topic 842).
In February 2016, the FASB issued ASU No. 2016-02, which requires a lessee to recognize a right-of-use asset and a lease liability for operating leases, initially measured at the present value of the future lease payments, in its balance sheet. This ASU also requires a lessee to recognize a single lease cost, calculated so that the cost of the lease is allocated over the lease term, generally on a straight-line basis. This new guidance is effective for the Company in fiscal 2019. Early adoption is permitted. As part of the implementation of this new standard, the Company is in the process of reviewing current accounting policies and assessing the practical expedients allowed under this new guidance. The Company expects that most of its operating lease commitments will be subject to the new standard and recognized as operating lease liabilities and
F-17
|
Kadant Inc.
|
2016 Financial Statements
|
|
Notes to Consolidated Financial Statements
1.
Nature of Operations and Summary of Significant Accounting Policies (continued)
right-of-use assets upon adoption, which is required using the modified retrospective transition method. The Company is currently evaluating the other effects that the adoption of this ASU will have on its consolidated financial statements.
Compensation-Stock Compensation (Topic 718
),
Improvements to Employee Share-Based Payment Accounting.
In March 2016, the FASB issued ASU No. 2016-09, which simplifies several aspects of the accounting for share-based payment transactions, including the income tax consequences, classification of awards as either equity or liabilities, and classification in the statement of cash flows. The Company early adopted this ASU at the beginning of fiscal 2016. This ASU requires that excess income tax benefits and tax deficiencies related to stock-based compensation arrangements be recognized as discrete items within the provision for income taxes instead of capital in excess of par value in the reporting period in which they occur. As a result of the adoption of this ASU, the Company recognized an income tax benefit of
$582,000
, or
$0.05
per diluted share, in the Company’s consolidated statement of income in 2016. The Company prospectively adopted the requirement to classify the excess tax benefits from stock-compensation awards within operating activities in the consolidated statement of cash flows in 2016. Prior period amounts were not restated. The Company also adopted the guidance in this ASU that requires that taxes paid related to the withholding of common stock upon the vesting of employee stock awards be presented separately within financing activities in the consolidated statement of cash flows. The Company has retrospectively restated fiscal 2015 and 2014 to reclassify the comparable amount, which was previously presented in other current liabilities within operating activities. There were no other material effects from adoption of this ASU on the Company’s consolidated financial statements.
Financial Instruments-Credit Losses (Topic 326), Measurement of Credit Losses on Financial Instruments.
In June 2016, the FASB issued ASU No. 2016-13, which significantly changes the way entities recognize impairment of many financial assets by requiring immediate recognition of estimated credit losses expected to occur over their remaining lives. This new guidance is effective for the Company in fiscal 2020. Early adoption is permitted beginning in fiscal 2019. The Company is currently evaluating the effects that the adoption of this ASU will have on its consolidated financial statements.
Statement of Cash Flows (Topic 230), Classification of Certain Cash Receipts and Cash Payments.
In August 2016, the FASB issued ASU No. 2016-15, which simplifies the diversity in practice related to the presentation and classification of certain cash receipts and cash payments in the statement of cash flows under Topic 230. This ASU addresses the following eight specific cash flow issues: debt prepayment or debt extinguishment costs; settlement of zero-coupon debt instruments or other debt instruments with coupon interest rates that are insignificant in relation to the effective interest rate of the borrowing; contingent consideration payments made after a business combination; proceeds from the settlement of insurance claims; proceeds from the settlement of corporate-owned life insurance; distributions received from equity method investees; beneficial interests in securitization transactions; and separately identifiable cash flows and application of the predominance principle. This new guidance is effective for the Company in fiscal 2018. Early adoption is permitted. The Company does not believe that adoption of this ASU will have a material impact on its consolidated financial statements.
Income Taxes (Topic 740), Intra-Entity Transfers of Assets Other Than Inventory.
In October 2016, the FASB issued ASU No. 2016-16, which requires an entity to recognize the income tax consequences of an intra-entity transfer of an asset other than inventory when the transfer occurs and eliminates the exception for an intra-entity transfer of an asset other than inventory. This new guidance is effective for the Company in fiscal 2018 with adoption required on a modified retrospective basis through a cumulative-effect adjustment directly to retained earnings as of the beginning of the period of adoption. Early adoption is permitted. The Company is currently evaluating the effect that the adoption of this ASU will have on its consolidated financial statements.
Statement of Cash Flows (Topic 230), Restricted Cash.
In November 2016, the FASB issued ASU No. 2016-18, which requires inclusion of restricted cash and restricted cash equivalents within cash and cash equivalents when reconciling the beginning-of-period and end-of-period total amounts shown on the statement of cash flows. This new guidance is effective for the Company in fiscal 2018. Early adoption is permitted. The Company is currently evaluating the effect that the adoption of this ASU will have on its consolidated financial statements.
Business Combinations (Topic 805), Clarifying the Definition of a Business.
In January 2017, the FASB issued ASU No. 2017-01, which clarifies the definition of a business with the objective of adding guidance to assist entities with evaluating whether transactions should be accounted for as acquisitions (or disposals) of assets or businesses. The revised definition of a business under ASU 2017-01 will reduce the number of transactions that are accounted for as business combinations. This new guidance is effective on a prospective basis for the Company in fiscal 2018. Early adoption is allowed for certain transactions. The Company is currently evaluating the effects that the adoption of this ASU will have on its consolidated financial statements.
Accounting Changes and Error Corrections (Topic 250) and Investments - Equity Method and Joint Ventures (Topic 323), Amendments to Securities and Exchange Commission (SEC) Paragraphs Pursuant to Staff Announcements at the September 22, 2016 and November 17, 2016 EITF Meetings.
In January 2017, the FASB issued ASU No. 2017-03 that provides amendments that add paragraph 250-10-S99-6 which includes the text of "SEC Staff Announcement: Disclosure of the Impact That Recently Issued Accounting Standards Will Have on the Financial Statements of a Registrant When Such Standards Are
F-18
|
Kadant Inc.
|
2016 Financial Statements
|
|
Notes to Consolidated Financial Statements
1.
Nature of Operations and Summary of Significant Accounting Policies (continued)
Adopted in a Future Period (in accordance with Staff Accounting Bulletin (SAB) Topic 11.M). This announcement applies to ASU No. 2014-09,
Revenue from Contracts with Customers (Topic 606)
; ASU No. 2016-02,
Leases (Topic 842)
; and ASU 2016-03,
Financial Instruments - Credit Losses (Topic 326), Measurement of Credit Losses on Financial Instruments
; and subsequent amendments. Therefore, the Company has enhanced its disclosures regarding the impact that these recently issued accounting standards to be adopted in future periods will have on its accounting and disclosures in this footnote.
Intangibles - Goodwill and Other (Topic 350), Simplifying the Test for Goodwill Impairment.
In January 2017, the FASB issued ASU No. 2017-04, which eliminates Step 2 in goodwill impairment testing, which requires that goodwill impairment losses be measured as the difference between the implied value of a reporting unit’s goodwill and its carrying amount. This ASU will reduce the cost and complexity of impairment testing by requiring goodwill impairment losses to be measured as the excess of the reporting unit’s carrying amount, including goodwill and related goodwill tax effects, over its fair value. This new guidance is effective on a prospective basis for the Company in fiscal 2020. Early adoption is permitted. The Company does not believe that adoption of this ASU will have a material effect on its consolidated financial statements.
|
2.
|
Acquisitions
|
The Company’s acquisitions have been accounted for using the purchase method of accounting and the acquired companies’ results have been included in the accompanying consolidated financial statements from the dates of the acquisitions. The Company incurred acquisition transaction costs of approximately
$1,832,000
and $
326,000
in 2016 and 2014, respectively, which are included in selling, general, and administrative (SG&A) expenses in the accompanying consolidated statement of income. The Company's acquisitions have historically been made at prices above the fair value of the acquired net assets, resulting in goodwill, due to expectations of synergies from combining the businesses. The Company realizes synergies in connection with these acquisitions, including the use of the Company's existing distribution channels to expand sales of the products of the acquired businesses.
2016
On April 4, 2016, the Company acquired all the outstanding shares of RT Holding GmbH, the parent corporation of a group of companies known as the PAALGROUP (PAAL) for approximately
49,713,000
euros, net of cash acquired, or approximately
$56,617,000
. Additional post-closing consideration of
$165,000
was paid to the sellers in the first quarter of 2017. The Company entered into a
$29,866,000
euro-denominated borrowing under its unsecured revolving credit facility in the first quarter of 2016 to partially fund the acquisition. The remainder of the purchase price was funded from the Company's internal overseas cash.
PAAL, which is part of the Company's Papermaking Systems segment's Stock-Preparation product line, manufactures balers and related equipment used in the processing of recyclable and waste materials. This acquisition broadened the Company's product portfolio and extended its presence deeper into recycling and waste management. PAAL, headquartered in Germany, also has operations in the United Kingdom, France, and Spain. The Company anticipates several synergies in connection with this acquisition, including expanding sales of the products of the acquired business by leveraging Kadant's geographic presence to enter or further penetrate existing markets, as well as sourcing and manufacturing efficiencies.
This acquisition has been accounted for by using the purchase method of accounting and PAAL’s results have been included in the accompanying consolidated financial statements from its date of acquisition. For 2016, PAAL had revenue of
$40,783,000
and a loss of
$0.01
per diluted share, which included acquisition costs of
$0.15
and fair value step-up charges associated with acquired inventory and backlog of
$0.12
. The excess of the purchase price for the acquisition of PAAL over the tangible and identifiable intangible assets was recorded as goodwill and amounted to approximately
$38,552,000
, which is not deductible for tax purposes.
F-19
|
Kadant Inc.
|
2016 Financial Statements
|
|
Notes to Consolidated Financial Statements
|
2.
|
Acquisitions (continued)
|
The following table summarizes the purchase method of accounting for the acquisition made in 2016 and the estimated fair values of assets acquired and liabilities assumed:
|
2016 Acquisition (In thousands)
|
Total
|
|||
|
Net Assets Acquired:
|
||||
|
Cash and Cash Equivalents
|
$
|
2,277
|
|
|
|
Accounts Receivable
|
5,441
|
|
||
|
Inventories
|
3,947
|
|
||
|
Property, Plant, and Equipment
|
7,179
|
|
||
|
Other Assets
|
2,882
|
|
||
|
Intangible Assets
|
24,691
|
|
||
|
Goodwill
|
38,552
|
|
||
|
Total assets acquired
|
84,969
|
|
||
|
Accounts Payable
|
5,536
|
|
||
|
Customer Deposits
|
2,471
|
|
||
|
Obligations Under Capital Lease
|
4,842
|
|
||
|
Long-Term Deferred Income Taxes
|
6,148
|
|
||
|
Other Liabilities
|
6,913
|
|
||
|
Total liabilities assumed
|
25,910
|
|
||
|
Net assets acquired
|
$
|
59,059
|
|
|
|
|
||||
|
Purchase Price:
|
|
|
||
|
Cash
|
$
|
29,028
|
|
|
|
Cash Paid to Seller Borrowed Under the Revolving Credit Facility
|
29,866
|
|
||
|
Cash Due to Seller
|
165
|
|
||
|
Total purchase price
|
$
|
59,059
|
|
|
Definite-lived intangible assets acquired related to the PAAL acquisition included
$15,831,000
for customer relationships,
$4,203,000
for product technology,
$2,278,000
for tradenames, and
$2,379,000
for other intangibles. The weighted-average amortization period for definite-lived intangible assets acquired is
12 years
, which includes weighted-average amortization periods of
13 years
for customer relationships,
9 years
for product technology, and
14 years
for tradenames.
Unaudited Supplemental Pro Forma Information
Had the acquisition of PAAL been completed as of the beginning of 2015, the Company’s pro forma results of operations for 2016 and 2015 would have been as follows:
|
(In thousands, except per share amounts)
|
2016
|
2015
|
||||||
|
Revenues
|
$
|
427,273
|
|
$
|
444,350
|
|
||
|
Net Income Attributable to Kadant
|
$
|
35,321
|
|
$
|
33,881
|
|
||
|
Earnings per Share Attributable to Kadant:
|
||||||||
|
Basic
|
$
|
3.25
|
|
$
|
3.12
|
|
||
|
Diluted
|
$
|
3.17
|
|
$
|
3.05
|
|
||
Pro forma results include non-recurring pro forma adjustments that were directly attributable to the business combination to reflect amounts as if the acquisition of PAAL had been completed as of the beginning of 2015, as follows:
|
•
|
Pre-tax charge to SG&A expenses of $
1,832,000
in 2015 and reversal in 2016, for acquisition-related transaction costs.
|
F-20
|
Kadant Inc.
|
2016 Financial Statements
|
|
Notes to Consolidated Financial Statements
|
2.
|
Acquisitions (continued)
|
|
•
|
Pre-tax charge to cost of revenues of $
458,000
in 2015 and reversal in 2016, for the sale of PAAL inventory revalued at the date of acquisition.
|
|
•
|
Pre-tax charge to SG&A expenses of $
1,468,000
in 2015 and reversal in 2016, for intangible amortization related to acquired backlog.
|
|
•
|
Reversal of $
1,636,000
of interest expense in 2015 and
$454,000
in 2016 related to pre-acquisition debt, which was settled in the business combination.
|
These pro forma results of operations have been prepared for comparative purposes only, and they do not purport to be indicative of the results of operations that actually would have resulted had the acquisition of PAAL occurred as of the beginning of 2015, or that may result in the future.
2014
On October 31, 2014, the Company acquired certain assets of the screen cylinder business of a U.S.-based company for approximately
$9,174,000
in cash. This technology-based acquisition enhanced the Company’s stock-preparation equipment product offerings to pulp and paper mills worldwide.
On December 30, 2013, the Company acquired all the outstanding shares of a European producer of creping and coating blades for approximately
$2,666,000
in cash, including
$674,000
of cash acquired. An additional
1,000,000
euros, or approximately
$1,091,000
of contingent consideration was paid to the sellers on January 4, 2016.
The following table summarizes the purchase method of accounting for the acquisitions made in 2014 and the estimated fair values of assets acquired and liabilities assumed:
|
2014 Acquisitions (In thousands)
|
Total
|
|||
|
Net Assets Acquired:
|
||||
|
Cash and Cash Equivalents
|
$
|
674
|
|
|
|
Inventories
|
1,064
|
|
||
|
Other Current Assets
|
324
|
|
||
|
Property, Plant, and Equipment
|
847
|
|
||
|
Intangibles
|
||||
|
Customer relationships
|
4,700
|
|
||
|
Intellectual property
|
2,600
|
|
||
|
Other
|
360
|
|
||
|
Goodwill
|
3,463
|
|
||
|
Total assets acquired
|
14,032
|
|
||
|
|
|
|
||
|
Total Liabilities Assumed
|
1,001
|
|
||
|
Net assets acquired
|
$
|
13,031
|
|
|
|
|
||||
|
Purchase Price:
|
|
|
||
|
Cash
|
$
|
11,840
|
|
|
|
Contingent Consideration
|
1,191
|
|
||
|
Total purchase price
|
$
|
13,031
|
|
|
The excess of the purchase price for the acquisitions made in 2014 over the tangible and identifiable intangible assets was recorded as goodwill and amounted to approximately
$3,463,000
, of which
$2,004,000
is deductible for tax purposes. The weighted-average amortization period for intangibles acquired in 2014 is
9
years, which includes weighted-average amortization periods of
8
years for customer relationships and
11
years for intellectual property.
During 2014, the Company made post-closing adjustment payments of
$818,000
related to acquisitions completed prior to 2014.
Pro forma disclosures of the results of operations are not required, as the acquisitions are not considered material business combinations.
F-21
|
Kadant Inc.
|
2016 Financial Statements
|
|
3. Employee Benefit Plans
Stock-Based Compensation Plans
The Company maintains stock-based compensation plans primarily for its key employees and directors, although the plans permit awards to others expected to make significant contributions to the future of the Company. The plans authorize the compensation committee of the Company's board of directors (the board committee) to award a variety of stock and stock-based incentives, such as restricted stock, RSUs, nonqualified and incentive stock options, stock bonus shares, or performance-based shares. The award recipients and the terms of awards, including price, granted under these plans are determined by the board committee. Upon a change of control, as defined in the plans, all options or other awards become fully vested and all restrictions lapse. The Company had
561,162
shares available for grant under stock-based compensation plans at year-end
2016
. The Company generally issues its common stock out of treasury stock, to the extent available, for share issuances related to its stock-based compensation plans.
The Company recognizes compensation cost for all stock-based awards granted to employees and directors based on the grant date estimate of fair value for those awards. The fair value of RSUs is based on the grant date trading price of the Company's common stock, reduced by the present value of estimated dividends foregone during the requisite service period. The fair value of stock options is based on the Black-Scholes option-pricing model. Total stock-based compensation expense was
$5,069,000
,
$5,741,000
, and
$5,813,000
in
2016
,
2015
, and
2014
, respectively, and is included in SG&A expenses in the accompanying consolidated statement of income.
The components of pre-tax stock-based compensation expense are as follows:
|
(In thousands)
|
2016
|
2015
|
2014
|
|||||||||
|
Restricted Stock Unit Awards
|
$
|
4,848
|
|
$
|
5,185
|
|
$
|
4,904
|
|
|||
|
Stock Option Awards
|
51
|
|
420
|
|
782
|
|
||||||
|
Employee Stock Purchase Plan Awards
|
170
|
|
136
|
|
127
|
|
||||||
|
Total
|
$
|
5,069
|
|
$
|
5,741
|
|
$
|
5,813
|
|
|||
The Company has elected to recognize excess income tax benefits from stock option exercises and the vesting of RSUs in capital in excess of par value using the tax return ordering approach. The Company measures the tax benefit associated with excess tax deductions related to stock-based compensation expense by multiplying the excess tax deductions by the statutory tax rates. As a result of the adoption of ASU No. 2016-09, the Company did not recognize any income tax benefits in capital in excess of par value in
2016
. The Company recognized income tax benefits in capital in excess of par value of
$881,000
and
$771,000
in
2015
and
2014
, respectively, associated with stock-based compensation.
The Company grants RSUs to non-employee directors and certain employees. Holders of RSUs have no voting rights and are not entitled to receive cash dividends.
Non-Employee Director Restricted Stock Units
For the past three fiscal years, the Company has granted
5,000
RSUs to each of its non-employee directors in the first quarter of each fiscal year. The shares vest ratably on the last day of each fiscal quarter within the year. In addition, on
March 9, 2015
, the Company also granted
10,000
cash-settled RSUs to each of its non-employee directors, which totaled
50,000
in the aggregate and had a grant date fair value of
$2,279,000
. These RSUs would have only vested and compensation expense would only have been recognized if a change in control as defined in the Company's 2006 equity incentive plan had occurred before the last day of the first quarter of 2020. If a change in control had occurred, the directors would have received cash compensation equal to the value of the RSUs at the trading price of the Company's common stock on the change in control date. During 2015,
10,000
RSUs were forfeited, and the remaining
40,000
RSUs were outstanding at year-end 2016. These cash-settled RSUs were canceled without value on March 8, 2017.
Performance-Based Restricted Stock Units
The Company grants performance-based RSUs to executive officers of the Company. Each performance-based RSU represents the right to receive
one
share of the Company's common stock upon vesting. The RSUs are subject to adjustment based on the achievement of a performance measure selected for the fiscal year, which is a specified target for adjusted earnings before interest, taxes, depreciation, and amortization (adjusted EBITDA) generated from continuing operations. Following
F-22
|
Kadant Inc.
|
2016 Financial Statements
|
|
Notes to Consolidated Financial Statements
3.
Employee Benefit Plans (continued)
adjustment, the RSUs are subject to additional time-based vesting, and vest in
three
equal annual installments, provided that the executive officer is employed by the Company on the applicable vesting dates.
The Company recognizes compensation expense associated with performance-based RSUs ratably over the requisite service period for each separately-vesting portion of the award based on the grant date fair value. Compensation expense recognized is net of forfeitures and remeasured each reporting period until the total number of RSUs to be issued is known. Unrecognized compensation expense related to the unvested performance-based RSUs totaled approximately
$1,467,000
at year-end
2016
, and will be recognized over a weighted average period of
1.3
years.
The performance-based RSU agreements provide for forfeiture in certain events, such as voluntary or involuntary termination of employment, and for acceleration of vesting in certain events, such as death, disability or a change in control of the Company. If death, disability, or a change in control occurs prior to the end of the performance period, the officer will receive the target RSU amount; otherwise, the officer will receive the number of deliverable RSUs based on the achievement of the performance goal, as stated in the RSU agreements.
Time-Based Restricted Stock Units
The Company grants time-based RSUs to certain executive officers and other employees of the Company. Each time-based RSU represents the right to receive
one
share of the Company's common stock upon vesting. The Company recognizes compensation expense associated with these time-based RSUs ratably over the requisite service period for the entire award based on the grant date fair value and net of forfeitures. The time-based RSU agreement provides for forfeiture in certain events, such as voluntary or involuntary termination of employment, and for acceleration of vesting in certain events, such as death, disability, or a change in control of the Company. Unrecognized compensation expense related to the time-based RSUs totaled approximately
$2,614,000
at year-end
2016
, and will be recognized over a weighted average period of
1.8
years.
A summary of the activity of the Company's unvested RSUs for
2016
is as follows:
|
Unvested Restricted Stock Units
|
Units
(In thousands) |
Weighted
Average Grant- Date Fair Value |
|||||
|
Unvested RSUs at January 2, 2016
|
216
|
|
$
|
37.01
|
|
||
|
Granted
|
132
|
|
$
|
40.41
|
|
||
|
Vested
|
(143
|
)
|
$
|
35.46
|
|
||
|
Forfeited / Expired
|
(2
|
)
|
$
|
40.87
|
|
||
|
Unvested RSUs at December 31, 2016
|
203
|
|
$
|
40.23
|
|
||
The weighted-average grant date fair value of RSUs granted was
$40.41
,
$44.75
, and
$38.52
in
2016
,
2015
, and
2014
, respectively. The total fair value of shares vested was
$6,233,000
,
$7,502,000
, and
$6,895,000
in
2016
,
2015
, and
2014
, respectively.
Stock Options
The Company did not grant stock options during the last three fiscal years. Prior to 2014, the Company granted nonqualified stock options to its executive officers that vested over
three
years and were not exercisable until vested. To date, all options have been granted at an exercise price equal to the fair market value of the Company's common stock on the date of grant. Stock options vested in
three
equal annual installments beginning on the first anniversary of the grant date, provided that the recipient remained employed by the Company on the applicable vesting dates and expire on the tenth anniversary of the grant date. All outstanding stock options are fully vested. The Company recognized compensation expense associated with these stock options ratably over the requisite service period for the entire award based on the grant date fair value and net of forfeitures. There was no unrecognized compensation expense related to these stock options at year-end
2016
.
The Black-Scholes option-pricing model was developed for use in estimating the fair value of traded options, which have no vesting restrictions and are fully transferable. In addition, option-pricing models require the input of highly subjective assumptions, including expected stock price volatility. Expected stock price volatility was calculated based on a review of the Company's actual historic stock prices commensurate with the expected life of the award. The expected option life was derived based on a review of the Company's historic option holding periods, including consideration of the holding period inherent in currently vested but unexercised options. The expected annual dividend rate was calculated by dividing the Company's annual dividend by the closing stock price on the grant date. The risk-free interest rate is based on the yield on zero-coupon U.S.
F-23
|
Kadant Inc.
|
2016 Financial Statements
|
|
Notes to Consolidated Financial Statements
3.
Employee Benefit Plans (continued)
Treasury securities for a period that is commensurate with the expected term of the option. The compensation expense recognized for all equity-based awards is net of estimated forfeitures. Forfeitures are estimated based on an analysis of actual option forfeitures.
A summary of the Company's stock option activity for
2016
is as follows:
|
(In thousands, except per share amounts)
|
|
Number
of Shares |
Weighted
Average Exercise Price |
Weighted
Average Remaining Contractual Life |
Aggregate
Intrinsic Value (a) |
||||||||
|
Options Outstanding at January 2, 2016
|
|
358
|
|
$
|
21.12
|
|
|
|
|
||||
|
Exercised
|
|
(51
|
)
|
$
|
23.57
|
|
|
|
|
||||
|
Options Outstanding at December 31, 2016
|
|
307
|
|
$
|
20.72
|
|
4.5 years
|
$
|
12,443
|
|
|||
|
Vested and Exercisable at December 31, 2016
|
|
307
|
|
$
|
20.72
|
|
4.5 years
|
$
|
12,443
|
|
|||
|
(a)
|
The closing price per share on the last trading day prior to
December 31, 2016
was
$61.20
.
|
A summary of the Company's stock option exercises in
2016
,
2015
, and
2014
is as follows.
|
(In thousands)
|
2016
|
2015
|
2014
|
|||||||||
|
Total Intrinsic Value of Options Exercised
|
$
|
1,341
|
|
$
|
442
|
|
$
|
438
|
|
|||
|
Cash Received From Options Exercised
|
$
|
1,189
|
|
$
|
284
|
|
$
|
336
|
|
|||
Modified Awards
On September 15, 2014, the Company entered into an executive transition agreement with its former chief financial officer in connection with his retirement on June 30, 2015. This agreement included provisions for post-employment compensation and modifications to outstanding equity awards. The Company recognized
$360,000
of post-employment compensation ratably through the retirement date. Pursuant to this agreement, any unvested stock options immediately vested on the retirement date and any unvested RSUs at the retirement date vested on June 30, 2015 and were distributed on March 10, 2016. As of September 15, 2014,
5,201
stock options were remeasured at a grant date fair value of
$17.96
per option based on the Black-Scholes option-pricing model and
12,313
RSUs were remeasured at a fair value of
$39.94
per unit. The remaining compensation expense associated with the modified stock options and RSUs totaled
$428,000
as of September 15, 2014, which was recognized ratably through the retirement date.
Employee Stock Purchase Plan
The Company's eligible U.S. employees may elect to participate in its employee stock purchase plan. Under the plan, shares of the Company's common stock may be purchased at a
15%
discount from the fair market value at the beginning or end of the purchase period, whichever is lower. Shares purchased under the plan are subject to a
one
-year resale restriction and are purchased through payroll deductions of up to
10%
of each participating employee's gross wages. For the
2016
,
2015
, and
2014
plan years, the Company issued
17,874
,
13,573
, and
12,017
shares, respectively, of its common stock under this plan.
401(k) Savings and Other Defined Contribution Plans
The Company's U.S. subsidiaries participate in the Kadant Inc. 401(k) Retirement Savings Plan sponsored by the Company. Contributions to the plan are made by both the employee and the Company and are immediately vested. Company contributions are based upon the level of employee contributions.
Certain of the Company's subsidiaries offer other retirement plans, the majority of which are defined contribution plans. Company contributions to these plans are based on formulas determined by the Company.
For these plans, the Company contributed and charged to expense approximately
$3,005,000
,
$2,749,000
, and
$2,655,000
in
2016
,
2015
, and
2014
, respectively.
F-24
|
Kadant Inc.
|
2016 Financial Statements
|
|
Notes to Consolidated Financial Statements
3.
Employee Benefit Plans (continued)
Pension and Other Post-Retirement Benefits Plans
The Company sponsors a noncontributory defined benefit pension plan for eligible employees at one of its U.S. divisions and its corporate office. Effective December 31, 2005, this plan was closed to new participants. Three of the Company’s non-U.S. subsidiaries also sponsor defined benefit pension plans covering certain employees at those subsidiaries. Funds for the U.S. pension plan and one of the non-U.S. pension plans are contributed to a trustee as necessary to provide for current service and for any unfunded projected benefit obligation over a reasonable period. The remaining two non-U.S. pension plans are unfunded as permitted under their plans and applicable laws. Benefits under the Company’s pension plans are based on years of service and employee compensation.
The Company also provides other post-retirement benefits under two plans in the United States, which are both closed to new retirees, and at one of its non-U.S. subsidiaries. In addition, the Company provides for a restoration plan for certain executive officers which fully supplements benefits lost under the noncontributory defined benefit retirement plan as a consequence of applicable Internal Revenue Service limits.
In accordance with ASC 715, "Compensation-Retirement Benefits," (ASC 715), an employer is required to recognize the funded status of defined benefit pension and other post-retirement benefit plans as an asset or liability and changes in that funded status through comprehensive income. These amounts will be subsequently recognized as net periodic pension cost pursuant to the Company's historical accounting policy for amortizing such amounts. Further, actuarial gains and losses that arise in subsequent periods and are not recognized as net periodic pension cost in the same periods will be recognized as a component of AOCI. The actuarial loss and prior service loss included in AOCI and expected to be recognized in net periodic benefit cost in
2017
are
$541,000
and
$144,000
, respectively.
The following table summarizes the change in benefit obligation; the change in plan assets; the unfunded status; and the amounts recognized in the accompanying consolidated balance sheet for the Company's U.S. and non-U.S. pension benefit plans and other post-retirement benefit plans. In accordance with the adoption of ASU No. 2015-04 in 2015, the Company has elected to measure its plan assets and benefit obligations as of December 31, which coincides with its fiscal year-end in
2016
and is the closest month-end to its fiscal year-end in 2015.
F-25
|
Kadant Inc.
|
2016 Financial Statements
|
|
Notes to Consolidated Financial Statements
3.
Employee Benefit Plans (continued)
|
|
U.S. Pension Benefits
|
Non-U.S.
Pension Benefits
|
Other Post-Retirement Benefits
|
|||||||||||||||||||||
|
(In thousands)
|
2016
|
2015
|
2016
|
2015
|
2016
|
2015
|
||||||||||||||||||
|
Change in Benefit Obligation:
|
||||||||||||||||||||||||
|
Benefit obligation at beginning of year
|
$
|
31,310
|
|
$
|
32,213
|
|
$
|
3,041
|
|
$
|
3,531
|
|
$
|
3,539
|
|
$
|
3,823
|
|
||||||
|
Acquisition
|
—
|
|
—
|
|
380
|
|
—
|
|
—
|
|
—
|
|
||||||||||||
|
Service cost
|
723
|
|
842
|
|
102
|
|
105
|
|
130
|
|
117
|
|
||||||||||||
|
Interest cost
|
1,273
|
|
1,229
|
|
107
|
|
102
|
|
156
|
|
147
|
|
||||||||||||
|
Actuarial loss (gain)
|
575
|
|
(1,448
|
)
|
58
|
|
(102
|
)
|
686
|
|
(299
|
)
|
||||||||||||
|
Benefits paid
|
(1,946
|
)
|
(1,526
|
)
|
(63
|
)
|
(189
|
)
|
(180
|
)
|
(219
|
)
|
||||||||||||
|
Settlement payment
|
—
|
|
—
|
|
—
|
|
—
|
|
(415
|
)
|
—
|
|
||||||||||||
|
Currency translation
|
—
|
|
—
|
|
(284
|
)
|
(406
|
)
|
(22
|
)
|
(30
|
)
|
||||||||||||
|
Benefit obligation at end of year
|
$
|
31,935
|
|
$
|
31,310
|
|
$
|
3,341
|
|
$
|
3,041
|
|
$
|
3,894
|
|
$
|
3,539
|
|
||||||
|
Change in Plan Assets:
|
|
|
|
|
|
|
|
|
|
|
|
|
||||||||||||
|
Fair value of plan assets at beginning of year
|
$
|
27,776
|
|
$
|
28,986
|
|
$
|
396
|
|
$
|
632
|
|
$
|
26
|
|
$
|
34
|
|
||||||
|
Actual return on plan assets
|
2,075
|
|
(764
|
)
|
6
|
|
(142
|
)
|
1
|
|
(3
|
)
|
||||||||||||
|
Employer contributions
|
1,080
|
|
1,080
|
|
159
|
|
189
|
|
601
|
|
219
|
|
||||||||||||
|
Benefits paid
|
(1,946
|
)
|
(1,526
|
)
|
(63
|
)
|
(189
|
)
|
(180
|
)
|
(219
|
)
|
||||||||||||
|
Settlement payment
|
—
|
|
—
|
|
—
|
|
—
|
|
(415
|
)
|
—
|
|
||||||||||||
|
Currency translation
|
—
|
|
—
|
|
(72
|
)
|
(94
|
)
|
(5
|
)
|
(5
|
)
|
||||||||||||
|
Fair value of plan assets at end of year
|
$
|
28,985
|
|
$
|
27,776
|
|
$
|
426
|
|
$
|
396
|
|
$
|
28
|
|
$
|
26
|
|
||||||
|
Unfunded Status
|
$
|
(2,950
|
)
|
$
|
(3,534
|
)
|
$
|
(2,915
|
)
|
$
|
(2,645
|
)
|
$
|
(3,866
|
)
|
$
|
(3,513
|
)
|
||||||
|
Accumulated Benefit Obligation at End of Year
|
$
|
27,573
|
|
$
|
26,844
|
|
$
|
2,549
|
|
$
|
2,169
|
|
$
|
—
|
|
$
|
—
|
|
||||||
|
Amounts Recognized in the Balance Sheet:
|
|
|
|
|
|
|
|
|
||||||||||||||||
|
Current liability
|
$
|
—
|
|
$
|
—
|
|
$
|
(194
|
)
|
$
|
(133
|
)
|
$
|
(183
|
)
|
$
|
(187
|
)
|
||||||
|
Non-current liability
|
$
|
(2,950
|
)
|
$
|
(3,534
|
)
|
$
|
(2,721
|
)
|
$
|
(2,512
|
)
|
$
|
(3,683
|
)
|
$
|
(2,911
|
)
|
||||||
|
Amounts Recognized in Accumulated Other Comprehensive Items Before Tax:
|
|
|
|
|
||||||||||||||||||||
|
Unrecognized net actuarial loss
|
$
|
(7,383
|
)
|
$
|
(8,094
|
)
|
$
|
(784
|
)
|
$
|
(832
|
)
|
$
|
(872
|
)
|
$
|
(325
|
)
|
||||||
|
Unrecognized prior service cost
|
(53
|
)
|
(108
|
)
|
(42
|
)
|
(47
|
)
|
(525
|
)
|
(610
|
)
|
||||||||||||
|
Total
|
$
|
(7,436
|
)
|
$
|
(8,202
|
)
|
$
|
(826
|
)
|
$
|
(879
|
)
|
$
|
(1,397
|
)
|
$
|
(935
|
)
|
||||||
|
Changes in Amounts Recognized in Accumulated Other Comprehensive Items Before Tax:
|
|
|
|
|
||||||||||||||||||||
|
Current year unrecognized net actuarial gain (loss)
|
$
|
213
|
|
$
|
(737
|
)
|
$
|
(75
|
)
|
$
|
(75
|
)
|
$
|
(685
|
)
|
$
|
237
|
|
||||||
|
Amortization of unrecognized prior service cost
|
55
|
|
55
|
|
4
|
|
4
|
|
88
|
|
88
|
|
||||||||||||
|
Amortization of unrecognized net actuarial loss
|
498
|
|
508
|
|
39
|
|
38
|
|
50
|
|
30
|
|
||||||||||||
|
Settlement loss
|
—
|
|
—
|
|
—
|
|
—
|
|
114
|
|
—
|
|
||||||||||||
|
Currency translation
|
—
|
|
—
|
|
85
|
|
109
|
|
(29
|
)
|
35
|
|
||||||||||||
|
Total
|
$
|
766
|
|
$
|
(174
|
)
|
$
|
53
|
|
$
|
76
|
|
$
|
(462
|
)
|
$
|
390
|
|
||||||
F-26
|
Kadant Inc.
|
2016 Financial Statements
|
|
Notes to Consolidated Financial Statements
3.
Employee Benefit Plans (continued)
The weighted-average assumptions used to determine the benefit obligation as of year-end are as follows:
|
U.S. Pension Benefits
|
Non-U.S.
Pension Benefits
|
Other Post-Retirement Benefits
|
||||||||||||||||
|
|
||||||||||||||||||
|
|
2016
|
2015
|
2016
|
2015
|
2016
|
2015
|
||||||||||||
|
Discount rate
|
4.03
|
%
|
4.22
|
%
|
3.26
|
%
|
3.55
|
%
|
4.20
|
%
|
4.32
|
%
|
||||||
|
Rate of compensation increase
|
3.00
|
%
|
3.00
|
%
|
3.33
|
%
|
3.47
|
%
|
3.12
|
%
|
3.18
|
%
|
||||||
The discount rates for pension and other post-retirement plans are based on market yields on high-quality corporate bonds currently available and expected to be available during the period to maturity of the benefits. For pension and post-retirement plans, which have been closed to new participants thereby shortening the duration, the discount rate is determined based on discounting the projected benefit streams against the Citigroup Pension discount curve.
The projected benefit obligations and fair values of plan assets for the Company's pension plans with projected benefit obligations in excess of plan assets are as follows:
|
U.S. Pension Benefits
|
Non-U.S.
Pension Benefits
|
|||||||||||||||
|
|
||||||||||||||||
|
(In thousands)
|
2016
|
2015
|
2016
|
2015
|
||||||||||||
|
Pension Plans with Projected Benefit Obligations in Excess of Plan Assets:
|
||||||||||||||||
|
Projected benefit obligation
|
$
|
31,935
|
|
$
|
31,310
|
|
$
|
3,341
|
|
$
|
3,041
|
|
||||
|
Fair value of plan assets
|
$
|
28,985
|
|
$
|
27,776
|
|
$
|
426
|
|
$
|
396
|
|
||||
The accumulated benefit obligations and fair values of plan assets for the Company's pension plans with accumulated benefit obligations in excess of plan assets are as follows:
|
U.S. Pension Benefits
|
Non-U.S.
Pension Benefits
|
|||||||||||||||
|
|
||||||||||||||||
|
(In thousands)
|
2016
|
2015
|
2016
|
2015
|
||||||||||||
|
Pension Plans with Accumulated Benefit Obligations in Excess of Plan Assets:
|
||||||||||||||||
|
Accumulated benefit obligation
|
$
|
—
|
|
$
|
—
|
|
$
|
2,549
|
|
$
|
2,169
|
|
||||
|
Fair value of plan assets
|
$
|
—
|
|
$
|
—
|
|
$
|
426
|
|
$
|
396
|
|
||||
The components of net periodic benefit cost are as follows:
|
U.S.
Pension Benefits
|
Non-U.S.
Pension Benefits
|
Other
Post-Retirement Benefits
|
||||||||||||||||||||||||||||||||||
|
|
||||||||||||||||||||||||||||||||||||
|
(In thousands)
|
2016
|
2015
|
2014
|
2016
|
2015
|
2014
|
2016
|
2015
|
2014
|
|||||||||||||||||||||||||||
|
Components of Net Periodic Benefit Cost:
|
||||||||||||||||||||||||||||||||||||
|
Service cost
|
$
|
723
|
|
$
|
842
|
|
$
|
850
|
|
$
|
102
|
|
$
|
105
|
|
$
|
193
|
|
$
|
130
|
|
$
|
117
|
|
$
|
103
|
|
|||||||||
|
Interest cost
|
1,273
|
|
1,229
|
|
1,286
|
|
107
|
|
102
|
|
138
|
|
156
|
|
147
|
|
163
|
|
||||||||||||||||||
|
Expected return on plan assets
|
(1,288
|
)
|
(1,421
|
)
|
(1,480
|
)
|
(25
|
)
|
(40
|
)
|
(44
|
)
|
(2
|
)
|
(2
|
)
|
(2
|
)
|
||||||||||||||||||
|
Recognized net actuarial loss
|
498
|
|
508
|
|
315
|
|
39
|
|
38
|
|
18
|
|
50
|
|
30
|
|
22
|
|
||||||||||||||||||
|
Amortization of prior service cost
|
55
|
|
55
|
|
55
|
|
4
|
|
4
|
|
6
|
|
88
|
|
88
|
|
88
|
|
||||||||||||||||||
|
Settlement loss
|
—
|
|
—
|
|
—
|
|
—
|
|
—
|
|
—
|
|
114
|
|
—
|
|
—
|
|
||||||||||||||||||
|
Net Periodic Benefit Cost
|
$
|
1,261
|
|
$
|
1,213
|
|
$
|
1,026
|
|
$
|
227
|
|
$
|
209
|
|
$
|
311
|
|
$
|
536
|
|
$
|
380
|
|
$
|
374
|
|
|||||||||
F-27
|
Kadant Inc.
|
2016 Financial Statements
|
|
Notes to Consolidated Financial Statements
3.
Employee Benefit Plans (continued)
The weighted-average assumptions used to determine net periodic benefit cost are as follows:
|
U.S.
Pension Benefits
|
Non-U.S.
Pension Benefits
|
Other
Post-Retirement Benefits
|
|||||||||||||||||||||||||
|
|
|||||||||||||||||||||||||||
|
|
2016
|
2015
|
2014
|
2016
|
2015
|
2014
|
2016
|
2015
|
2014
|
||||||||||||||||||
|
Discount Rate
|
4.22
|
%
|
3.87
|
%
|
4.79
|
%
|
3.87
|
%
|
3.33
|
%
|
3.68
|
%
|
5.38
|
%
|
4.01
|
%
|
4.91
|
%
|
|||||||||
|
Expected Long-Term Return on Plan Assets
|
5.00
|
%
|
5.25
|
%
|
5.75
|
%
|
7.72
|
%
|
6.90
|
%
|
6.75
|
%
|
7.72
|
%
|
6.90
|
%
|
6.75
|
%
|
|||||||||
|
Rate of Compensation Increase
|
3.00
|
%
|
3.00
|
%
|
3.50
|
%
|
3.67
|
%
|
3.42
|
%
|
2.70
|
%
|
3.94
|
%
|
3.15
|
%
|
3.52
|
%
|
|||||||||
In developing the overall expected long-term return on plan assets assumption, a building block approach was used in which rates of return in excess of inflation were considered separately for equity securities, debt securities, and other assets. The excess returns were weighted by the representative target allocation and added along with an appropriate rate of inflation to develop the overall expected long-term return on plan assets assumption. The Company believes this determination is consistent with ASC 715.
Assumed weighted-average healthcare cost trend rates as of year-end were as follows:
|
Other Post-Retirement Benefits
|
||||
|
|
2016
|
2015
|
||
|
Healthcare Cost Trend Rate Assumed for Next Year
|
8.00%
|
8.00%
|
||
|
Ultimate Healthcare Cost Trend Rate
|
8.00%
|
8.00%
|
||
|
Year Assumed Rate Reaches Ultimate Rate
|
2016
|
2015
|
||
Plan Assets
The fair values of the Company's noncontributory defined benefit retirement plan assets at year-end
2016
and
2015
by asset category are as follows:
|
|
2016 Fair Value Measurement
|
|||||||||||||||
|
(In thousands)
|
Quoted Prices in
Active Markets for Identical Assets (Level 1) |
Significant
Observable Inputs (Level 2) |
Significant
Unobservable Inputs (Level 3) |
Total
|
||||||||||||
|
U.S. Pension Plan Assets:
|
||||||||||||||||
|
Mutual Funds
|
$
|
20,318
|
|
$
|
—
|
|
$
|
—
|
|
$
|
20,318
|
|
||||
|
|
$
|
20,318
|
|
$
|
—
|
|
$
|
—
|
|
$
|
20,318
|
|
||||
|
Investments measured at NAV
|
8,667
|
|
||||||||||||||
|
Total assets at fair value
|
$
|
28,985
|
|
|||||||||||||
|
Non-U.S. Pension Plan Assets:
|
||||||||||||||||
|
Mutual Funds
|
$
|
426
|
|
$
|
—
|
|
$
|
—
|
|
$
|
426
|
|
||||
|
Total assets at fair value
|
$
|
426
|
|
$
|
—
|
|
$
|
—
|
|
$
|
426
|
|
||||
F-28
|
Kadant Inc.
|
2016 Financial Statements
|
|
Notes to Consolidated Financial Statements
3.
Employee Benefit Plans (continued)
|
|
2015 Fair Value Measurement
|
|||||||||||||||
|
(In thousands)
|
Quoted Prices in
Active Markets for Identical Assets (Level 1) |
Significant
Observable Inputs (Level 2) |
Significant
Unobservable Inputs (Level 3) |
Total
|
||||||||||||
|
U.S. Pension Plan Assets:
|
||||||||||||||||
|
Mutual Funds
|
$
|
19,485
|
|
$
|
—
|
|
$
|
—
|
|
$
|
19,485
|
|
||||
|
|
$
|
19,485
|
|
$
|
—
|
|
$
|
—
|
|
$
|
19,485
|
|
||||
|
Investments measured at NAV
|
8,291
|
|
||||||||||||||
|
Total assets at fair value
|
$
|
27,776
|
|
|||||||||||||
|
Non-U.S. Pension Plan Assets:
|
||||||||||||||||
|
Mutual Funds
|
$
|
396
|
|
$
|
—
|
|
$
|
—
|
|
$
|
396
|
|
||||
|
Total assets at fair value
|
$
|
396
|
|
$
|
—
|
|
$
|
—
|
|
$
|
396
|
|
||||
Description of Fair Value Measurements
Level 1 – Quoted, active market prices for identical assets.
Level 2 – Observable inputs other than Level 1 prices, based on model-derived valuations in which all significant inputs are observable in active markets.
Level 3 – Unobservable inputs based on the Company's own assumptions.
The following is a description of the valuation methodologies used for assets measured at fair value. There were no changes in valuation techniques during 2016 or 2015.
Mutual funds
- Investments in common stock index and fixed income funds. Share prices of the funds, referred to as a fund's Net Asset Value (NAV), are calculated daily based on the closing market prices and accruals of securities in the fund's total portfolio (total value of the fund) divided by the number of fund shares currently issued and outstanding. There are no redemption restrictions.
Investments measured at NAV
- Investments in common collective trusts that invest in a diversified blend of investment and non-investment grade fixed income securities and are valued at NAV provided by the fund administrator. The NAV is used as the practical expedient to estimate fair value. The NAVs of the funds are calculated monthly based on the closing market prices and accruals of securities in the fund's total portfolio (total value of the fund) divided by the number of fund shares currently issued and outstanding. Redemptions of the investments occur by contract at the respective fund's redemption date NAV.
The Company has developed an investment policy for its U.S. noncontributory defined benefit retirement plan. The investment strategy is to emphasize total return, that is, the aggregate return from capital appreciation and dividend and interest income. The primary objective of the investment management for the plan's assets is the emphasis on consistent growth; specifically, growth in a manner that protects the plan's assets from excessive volatility in market value from year to year. The investment policy takes into consideration the benefit obligations, including timing of distributions.
The following target asset allocation has been established for the plan:
|
Asset Category
|
Minimum
|
Neutral
|
Maximum
|
||||||
|
Equity Securities
|
5
|
%
|
15
|
%
|
20
|
%
|
|||
|
Debt Securities
|
80
|
%
|
85
|
%
|
95
|
%
|
|||
|
Total
|
|
|
100
|
%
|
|
|
|||
All equity securities must be drawn from recognized securities exchanges. Debt securities must be weighted to reflect a portfolio average maturity of not more than
ten
years, with average benchmark duration of
five
years. The credit quality must equal or exceed high investment grade quality ("Baa" or better).
F-29
|
Kadant Inc.
|
2016 Financial Statements
|
|
Notes to Consolidated Financial Statements
3.
Employee Benefit Plans (continued)
Cash Flows
Contributions
The Company expects to make cash contributions of
$1,080,000
to its U.S. noncontributory defined benefit pension plan in 2017. For the remaining pension and post-retirement benefit plans, no cash contributions other than to fund current benefit payments are expected in 2017.
Estimated Future Benefit Payments
Expected benefit payments are based on the same assumptions used to measure the Company's benefit obligation at year-end
2016
. Estimated future benefit payments during the next five years and in aggregate for the five years thereafter are as follows:
|
Other
Post-retirement
Benefits |
||||||||||||
|
(In thousands)
|
U.S.
Pension
Benefits |
Non-U.S.
Pension
Benefits |
||||||||||
|
2017
|
$
|
1,485
|
|
$
|
227
|
|
$
|
187
|
|
|||
|
2018
|
1,479
|
|
30
|
|
177
|
|
||||||
|
2019
|
1,485
|
|
105
|
|
169
|
|
||||||
|
2020
|
4,131
|
|
87
|
|
308
|
|
||||||
|
2021
|
1,894
|
|
237
|
|
162
|
|
||||||
|
2022-2026
|
11,488
|
|
2,029
|
|
2,753
|
|
||||||
4.
Stockholders' Equity
Preferred Stock
The Company's Certificate of Incorporation authorizes up to
5,000,000
shares of preferred stock,
$.01
par value per share, for issuance by the Company's board of directors without further shareholder approval.
Common Stock
At year-end
2016
, the Company had reserved
1,122,762
unissued shares of its common stock for possible issuance under its stock-based compensation plans.
F-30
|
Kadant Inc.
|
2016 Financial Statements
|
|
5. Income Taxes
The components of income from continuing operations before provision for income taxes are as follows:
|
(In thousands)
|
2016
|
2015
|
2014
|
|||||||||
|
Domestic
|
$
|
6,196
|
|
$
|
13,076
|
|
$
|
10,951
|
|
|||
|
Foreign
|
38,353
|
|
36,295
|
|
30,567
|
|
||||||
|
|
$
|
44,549
|
|
$
|
49,371
|
|
$
|
41,518
|
|
|||
The components of the provision for income taxes from continuing operations are as follows:
|
(In thousands)
|
2016
|
2015
|
2014
|
|||||||||
|
Current Provision:
|
||||||||||||
|
Federal
|
$
|
535
|
|
$
|
4,693
|
|
$
|
1,080
|
|
|||
|
Foreign
|
11,323
|
|
10,623
|
|
7,703
|
|
||||||
|
State
|
838
|
|
1,152
|
|
713
|
|
||||||
|
|
12,696
|
|
16,468
|
|
9,496
|
|
||||||
|
Deferred (Benefit) Provision:
|
|
|
|
|
|
|
||||||
|
Federal
|
1,738
|
|
45
|
|
2,179
|
|
||||||
|
Foreign
|
(1,818
|
)
|
(1,378
|
)
|
418
|
|
||||||
|
State
|
(533
|
)
|
(373
|
)
|
354
|
|
||||||
|
|
(613
|
)
|
(1,706
|
)
|
2,951
|
|
||||||
|
|
$
|
12,083
|
|
$
|
14,762
|
|
$
|
12,447
|
|
|||
The provision for income taxes included in the accompanying consolidated statement of income is as follows:
|
(In thousands)
|
2016
|
2015
|
2014
|
|||||||||
|
Continuing Operations
|
$
|
12,083
|
|
$
|
14,762
|
|
$
|
12,447
|
|
|||
|
Discontinued Operation
|
2
|
|
43
|
|
(14
|
)
|
||||||
|
|
$
|
12,085
|
|
$
|
14,805
|
|
$
|
12,433
|
|
|||
The Company receives a tax deduction upon the exercise of nonqualified stock options and the vesting of RSUs. The current provision for income taxes in the accompanying consolidated statement of income does not reflect
$881,000
and
$771,000
of such excess tax benefits in
2015
and
2014
, respectively, from the exercise of stock options and vesting of RSUs. In March 2016, the FASB issued ASU No. 2016-09, which the Company early adopted at the beginning of fiscal 2016. This ASU requires that excess income tax benefits and tax deficiencies related to stock-based compensation arrangements be recognized as discrete items within the provision for income taxes instead of capital in excess of par value in the reporting period in which they occur. As a result of the adoption of this ASU, the Company recognized an income tax benefit of
$582,000
in the Company's accompanying consolidated statement of income in 2016.
F-31
|
Kadant Inc.
|
2016 Financial Statements
|
|
Notes to Consolidated Financial Statements
5.
Income Taxes (continued)
The provision for income taxes from continuing operations in the accompanying statement of income differs from the provision calculated by applying the statutory federal income tax rate of
35%
to income from continuing operations before provision for income taxes due to the following:
|
(In thousands)
|
2016
|
2015
|
2014
|
|||||||||
|
Provision for Income Taxes at Statutory Rate
|
$
|
15,592
|
|
$
|
17,279
|
|
$
|
14,531
|
|
|||
|
Increases (Decreases) Resulting From:
|
|
|
|
|
|
|
||||||
|
State income taxes, net of federal tax
|
189
|
|
506
|
|
694
|
|
||||||
|
U.S. tax cost of foreign earnings
|
192
|
|
455
|
|
206
|
|
||||||
|
Foreign tax rate differential
|
(3,921
|
)
|
(3,852
|
)
|
(3,026
|
)
|
||||||
|
(Reversal of) provision for tax benefit reserves, net
|
(76
|
)
|
33
|
|
(1,017
|
)
|
||||||
|
Change in valuation allowance
|
(131
|
)
|
99
|
|
125
|
|
||||||
|
Nondeductible expenses
|
1,090
|
|
704
|
|
1,398
|
|
||||||
|
Research and development tax credits
|
(229
|
)
|
(210
|
)
|
(274
|
)
|
||||||
|
Excess tax benefit related to share-based compensation
|
(553
|
)
|
—
|
|
—
|
|
||||||
|
Other
|
(70
|
)
|
(252
|
)
|
(190
|
)
|
||||||
|
|
$
|
12,083
|
|
$
|
14,762
|
|
$
|
12,447
|
|
|||
Net deferred tax liability in the accompanying consolidated balance sheet consists of the following:
|
(In thousands)
|
2016
|
2015
|
||||||
|
Deferred Tax Asset:
|
||||||||
|
Foreign, state, and alternative minimum tax credit carryforwards
|
$
|
161
|
|
$
|
23
|
|
||
|
Reserves and accruals
|
4,842
|
|
5,003
|
|
||||
|
Net operating loss carryforwards
|
13,694
|
|
12,306
|
|
||||
|
Inventory basis difference
|
3,005
|
|
3,253
|
|
||||
|
Research and development
|
75
|
|
246
|
|
||||
|
Employee compensation
|
4,966
|
|
5,427
|
|
||||
|
Allowance for doubtful accounts
|
488
|
|
405
|
|
||||
|
Revenue recognition
|
636
|
|
525
|
|
||||
|
Other
|
249
|
|
151
|
|
||||
|
Deferred tax asset, gross
|
28,116
|
|
27,339
|
|
||||
|
Less: valuation allowance
|
(10,863
|
)
|
(11,493
|
)
|
||||
|
Deferred tax asset, net
|
17,253
|
|
15,846
|
|
||||
|
Deferred Tax Liability:
|
|
|
|
|
||||
|
Goodwill and intangible assets
|
(21,853
|
)
|
(17,450
|
)
|
||||
|
Fixed asset basis difference
|
(4,325
|
)
|
(3,234
|
)
|
||||
|
Reserves and accruals
|
—
|
|
(32
|
)
|
||||
|
Other
|
(1,199
|
)
|
(284
|
)
|
||||
|
Deferred tax liability
|
(27,377
|
)
|
(21,000
|
)
|
||||
|
Net deferred tax liability
|
$
|
(10,124
|
)
|
$
|
(5,154
|
)
|
||
In November 2015, the FASB issued ASU No. 2015-17, Income Taxes (Topic 740), Balance Sheet Classification of Deferred Taxes, which simplifies the presentation of deferred income taxes as it requires that deferred tax assets and liabilities be classified as non-current in the consolidated balance sheet. The Company early adopted this ASU for the year ended January 2, 2016, which resulted in all deferred taxes being reported as non-current in its accompanying consolidated balance sheet. In both 2016 and 2015, the deferred tax assets and liabilities are presented in the accompanying consolidated balance sheet within other assets and long-term deferred income taxes, respectively, on a net basis by tax jurisdiction.
The Company has established valuation allowances related to certain domestic and foreign deferred tax assets on deductible temporary differences, tax losses, and tax credit carryforwards. The valuation allowance at year-end
2016
was
$10,863,000
, consisting of
$835,000
in the United States and
$10,028,000
in foreign jurisdictions. The decrease in the valuation allowance in
2016
of
$630,000
related primarily to fluctuations in foreign currency exchange rates, tax rate changes, and expected future utilization of net operating losses in certain state and foreign jurisdictions. Compliance with ASC 740 requires the Company to periodically evaluate the necessity of establishing or adjusting a valuation allowance for deferred tax assets depending on whether it is more likely than not that a related tax benefit will be realized in future periods. When assessing the need for a valuation allowance in a tax jurisdiction, the Company evaluates the weight of all available evidence to determine
F-32
|
Kadant Inc.
|
2016 Financial Statements
|
|
Notes to Consolidated Financial Statements
5.
Income Taxes (continued)
whether it is more likely than not that some portion or all of the deferred tax assets will not be realized. As part of this evaluation, the Company considers its cumulative three-year history of earnings before income taxes, taxable income in prior carryback years, future reversals of existing taxable temporary differences, prudent and feasible tax planning strategies, and expected future results of operations. As of year-end
2016
, the Company continued to maintain a valuation allowance in the United States against a large portion of its state operating loss carryforwards due to the uncertainty of future profitability in state jurisdictions. As of year-end
2016
, the Company maintained valuation allowances in certain foreign jurisdictions because of the uncertainty of future profitability.
At year-end
2016
, the Company had domestic state and foreign net operating loss carryforwards of
$34,087,000
and
$43,773,000
, respectively. The domestic state loss carryforwards will expire in the years 2017 through 2036. Their utilization is limited to future taxable income from the Company's domestic subsidiaries. Of the foreign net operating loss carryforwards,
$34,000
will expire in the years 2017 through 2021, and the remainder do not expire.
The Company has not recognized a deferred tax liability for the difference between the book basis and the tax basis of its investment in the stock of its domestic subsidiaries, related primarily to unremitted earnings of subsidiaries, because it does not expect this basis difference to become subject to tax at the parent level. It is the Company's intention to reinvest indefinitely the earnings of its international subsidiaries in order to support the current and future capital needs of their operations in the foreign jurisdictions. Through year-end
2016
, the Company has not provided for U.S. income taxes on approximately
$182,166,000
of unremitted foreign earnings. The U.S. tax cost has not been determined due to the fact that it is not practicable to estimate at this time. The related foreign tax withholding, which would be required if the Company were to remit these foreign earnings to the United States, would be approximately
$3,951,000
.
The Company operates within multiple tax jurisdictions and could be subject to audit in those jurisdictions. Such audits can involve complex income tax issues, which may require an extended period of time to resolve and may cover multiple years. In management's opinion, adequate provisions for income taxes have been made for all years subject to audit.
As of year-end
2016
, the Company had
$5,467,000
of unrecognized tax benefits which, if recognized, would reduce the effective tax rate. A reconciliation of the beginning and ending amount of unrecognized tax benefits at year-end
2016
and
2015
is as follows:
|
(In thousands)
|
2016
|
2015
|
||||||
|
Unrecognized Tax Benefits, Beginning of Year
|
$
|
5,052
|
|
$
|
5,006
|
|
||
|
Gross Increases—Tax Positions in Prior Periods
|
403
|
|
—
|
|
||||
|
Gross Decreases—Tax Positions in Prior Periods
|
(23
|
)
|
(28
|
)
|
||||
|
Gross Increases—Current-period Tax Positions
|
480
|
|
476
|
|
||||
|
Lapses of Statutes of Limitations
|
(359
|
)
|
(253
|
)
|
||||
|
Currency Translation
|
(86
|
)
|
(149
|
)
|
||||
|
Unrecognized Tax Benefits, End of Year
|
$
|
5,467
|
|
$
|
5,052
|
|
||
The Company recognizes accrued interest and penalties related to unrecognized tax benefits in the provision for income taxes. The Company has accrued
$1,321,000
and
$1,246,000
for the potential payment of interest and penalties at year-end
2016
and
2015
, respectively. The interest and penalties included in the accompanying consolidated statement of income was an expense of
$69,000
and
$103,000
in
2016
and
2015
, respectively.
The Company is currently under audit in certain non-U.S. taxing jurisdictions. It is reasonably possible that over the
next fiscal year
the amount of liability for unrecognized tax benefits may be reduced by up to
$188,000
primarily from the expiration of tax statutes of limitations.
The Company remains subject to U.S. Federal income tax examinations for the tax years 2004 through 2016, and to non-U.S. income tax examinations for the tax years 2004 through 2016. In addition, the Company remains subject to state and local income tax examinations in the United States for the tax years 2001 through 2016.
F-33
|
Kadant Inc.
|
2016 Financial Statements
|
|
6. Short- and Long-Term Obligations
Short- and long-term obligations at year-end
2016
and
2015
are as follows:
|
(In thousands)
|
2016
|
2015
|
||||||
|
Revolving Credit Facility, due 2018
|
$
|
61,494
|
|
$
|
26,000
|
|
||
|
Commercial Real Estate Loan, due 2016
|
—
|
|
5,250
|
|
||||
|
Obligations Under Capital Lease, due 2017 to 2022
|
4,309
|
|
—
|
|
||||
|
Other Borrowings, due 2017 to 2023
|
608
|
|
—
|
|
||||
|
Total Short- and Long-Term Obligations
|
66,411
|
|
31,250
|
|
||||
|
Less: Short-Term Obligations
|
(643
|
)
|
(5,250
|
)
|
||||
|
Long-Term Obligations
|
$
|
65,768
|
|
$
|
26,000
|
|
||
See Note 10 for the fair value information related to the Company's long-term obligations.
Revolving Credit Facility
The Company entered into a
five
-year unsecured revolving credit facility (2012 Credit Agreement) in the aggregate principal amount of up to
$100,000,000
on August 3, 2012 and amended it on November 1, 2013 and March 29, 2016. The 2012 Credit Agreement also includes an uncommitted unsecured incremental borrowing facility of up to an additional
$50,000,000
. The principal on any borrowings made under the 2012 Credit Agreement is due on
November 1, 2018
. Interest on any loans outstanding under the 2012 Credit Agreement accrues and is payable quarterly in arrears at one of the following rates selected by the Company: (i) the highest of (a) the federal funds rate plus
0.50%
plus an applicable margin of
0%
to
1%
, (b) the prime rate, as defined, plus an applicable margin of
0%
to
1%
and (c) the Eurocurrency rate, as defined, plus
0.50%
plus an applicable margin of
0%
to
1%
or (ii) the Eurocurrency rate, as defined, plus an applicable margin of
1%
to
2%
. The applicable margin is determined based upon the ratio of the Company's total debt to earnings before interest, taxes, depreciation and amortization, as defined in the 2012 Credit Agreement. For this purpose, total debt is defined as total debt less up to
$25,000,000
of unrestricted U.S. cash.
The obligations of the Company under the 2012 Credit Agreement may be accelerated upon the occurrence of an event of default under the 2012 Credit Agreement, which includes customary events of default including without limitation payment defaults, defaults in the performance of affirmative and negative covenants, the inaccuracy of representations or warranties, bankruptcy- and insolvency-related defaults, defaults relating to such matters as the Employment Retirement Income Security Act (ERISA), unsatisfied judgments, the failure to pay certain indebtedness, and a change of control default. In addition, the 2012 Credit Agreement contains negative covenants applicable to the Company and its subsidiaries, including financial covenants requiring the Company to comply with a maximum consolidated leverage ratio of
3.5
to 1, a minimum consolidated interest coverage ratio of
3
to 1, and restrictions on liens, indebtedness, fundamental changes, dispositions of property, making certain restricted payments (including dividends and stock repurchases), investments, transactions with affiliates, sale and leaseback transactions, swap agreements, changing its fiscal year, arrangements affecting subsidiary distributions, entering into new lines of business, and certain actions related to the discontinued operation. At year-end
2016
, the Company was in compliance with these covenants.
Loans under the 2012 Credit Agreement are guaranteed by certain domestic subsidiaries of the Company pursuant to a Guarantee Agreement, effective August 3, 2012.
At year-end
2016
, the outstanding balance under the 2012 Credit Agreement was
$61,494,000
, of which
$27,494,000
was a euro-denominated borrowing used to fund the PAAL acquisition. At year-end
2016
, the Company had
$36,518,000
of borrowing capacity available under the committed portion of its 2012 Credit Agreement. The amount the Company is able to borrow under the 2012 Credit Agreement is the total borrowing capacity of
$100,000,000
less any outstanding borrowings, letters of credit and multi-currency borrowings issued under the 2012 Credit Agreement.
The weighted average interest rate for the Revolving Credit Facility was
1.52%
and
1.81%
at year-end
2016
and
2015
, respectively.
On March 1, 2017 the Company entered into an Amended and Restated Credit Agreement (2017 Credit Agreement) which became effective on March 2, 2017. See Note 15, Subsequent Event
for further details.
Commercial Real Estate Loan
On May 4, 2006, the Company borrowed
$10,000,000
under a promissory note (Commercial Real Estate Loan), which was repayable in quarterly installments of
$125,000
over a
ten
-year period with the remaining principal balance of
$5,000,000
F-34
|
Kadant Inc.
|
2016 Financial Statements
|
|
Notes to Consolidated Financial Statements
6.
Short- and Long-Term Obligations (continued)
due upon maturity in May 2016. In the second quarter of 2016, the Company repaid the outstanding principal balance on this loan.
Interest on the Commercial Real Estate Loan was accrued and payable quarterly in arrears at one of the following rates selected by the Company: (a) the prime rate or (b) the three-month London Inter-Bank Offered Rate (LIBOR) plus a
0.75%
margin. The weighted average interest rate for the Commercial Real Estate Loan was
6.38%
at year-end
2015
.
Debt Issuance Costs
Debt issuance costs associated with the Commercial Real Estate Loan were being amortized to interest expense over the corresponding debt term based on the effective-interest method. Debt issuance costs associated with the 2012 Credit Agreement are being amortized to interest expense based on the straight-line method. As of year-end
2016
, unamortized debt issuance costs, included in other assets in the accompanying consolidated balance sheet, were
$266,000
.
Obligations Under Capital Lease
In connection with the acquisition of PAAL, the Company assumed a sale-leaseback financing arrangement for PAAL's facility in Germany. Under this arrangement, the quarterly lease payment includes principal and interest based on an interest rate which is reset, from time to time, to prevailing short-term borrowing rates in Germany. The interest rate at year-end 2016 was
3.30%
. The quarterly lease payment also includes a payment toward a corresponding loan receivable from the landlord. The loan receivable, which is included in other assets in the accompanying consolidated balance sheet, was $
233,000
at year-end 2016. The lease arrangement provides for a fixed price purchase option, net of the loan receivable, of
$1,390,000
at the end of the lease term in 2022. If the Company does not exercise the purchase option for the facility, the Company will receive cash from the landlord to settle the loan receivable. As of year-end
2016
,
$4,188,000
was outstanding under this capital lease obligation. The Company also assumed capital lease obligations for certain equipment as part of the PAAL acquisition. These capital lease obligations bear a weighted average interest rate of
3.44%
and have an average remaining term of
3.1 years
. As of year-end
2016
,
$121,000
was outstanding under these capital lease obligations.
The following schedule presents future minimum lease payments under the capital lease obligations and the present value of the minimum lease payments as of year-end
2016
.
|
(In thousands)
|
Capital Lease Obligations
|
|||
|
2017
|
$
|
560
|
|
|
|
2018
|
553
|
|
||
|
2019
|
547
|
|
||
|
2020
|
554
|
|
||
|
2021
|
521
|
|
||
|
2022 and Thereafter
|
624
|
|
||
|
Total Minimum Lease Payments
|
$
|
3,359
|
|
|
|
Less: Imputed Interest
|
(440
|
)
|
||
|
Present Value of Minimum Lease Payments
|
$
|
2,919
|
|
|
Other Borrowings
Our PAAL subsidiary sells certain equipment to an intermediary who leases the equipment to a third party. The revenue from the equipment sale is deferred due to risk of default and repurchase obligation provisions. Revenue is recognized and the borrowing reduced over the corresponding lease term with the remaining residual value of the equipment recognized when the default provisions lapse. Other borrowings related to this lease arrangement totaled
$608,000
at year-end
2016
.
F-35
|
Kadant Inc.
|
2016 Financial Statements
|
|
7. Commitments and Contingencies
Operating Leases
The Company occupies office and operating facilities under various operating leases. The accompanying consolidated statement of income includes expenses from operating leases of
$4,298,000
,
$3,797,000
, and
$3,948,000
in
2016
,
2015
, and
2014
, respectively. The future minimum payments due under noncancelable operating leases at year-end
2016
are
$2,779,000
in
2017
;
$1,659,000
in
2018
;
$1,193,000
in
2019
;
$748,000
in
2020
;
$698,000
in
2021
and
$959,000
thereafter. Total future minimum lease payments are
$8,036,000
.
Letters of Credit and Bank Guarantees
Outstanding letters of credit and bank guarantees issued on behalf of the Company as applicant, principally relating to performance obligations and customer deposit guarantees, totaled
$13,813,000
at year-end
2016
. Certain of the Company's contracts, particularly for stock-preparation and systems orders, require the Company to provide a standby letter of credit or bank guarantee to a customer as beneficiary, limited in amount to a negotiated percentage of the total contract value, in order to guarantee warranty and performance obligations of the Company under the contract. Typically, these standby letters of credit and bank guarantees expire without being drawn by the beneficiary.
Right of Recourse
In the ordinary course of business, the Company's subsidiaries in China may receive banker's acceptance drafts from customers as payment for outstanding accounts receivable. These banker's acceptance drafts are non-interest bearing and mature within six months of the origination date. The Company's subsidiaries in China may use these banker's acceptance drafts prior to the scheduled maturity date to settle outstanding accounts payable with vendors. Banker's acceptance drafts transferred to vendors are subject to customary right of recourse provisions prior to their scheduled maturity dates. At year-end
2016
, the Company had
$4,824,000
of banker's acceptance drafts subject to recourse, which were transferred to vendors and had not reached their scheduled maturity dates. Historically, the banker's acceptance drafts have settled upon maturity without any claim of recourse against the Company.
Contingencies
In the ordinary course of business, the Company is, at times, required to issue limited performance guarantees, some of which do not require the issuance of letters of credit to customers in support of these guarantees, relating to its equipment and systems. The Company typically limits its liability under these guarantees to amounts that would not exceed the value of the contract. The Company believes that it has adequate reserves for any potential liability in connection with such guarantees.
Litigation
From time to time, the Company is subject to various claims and legal proceedings covering a range of matters that arise in the ordinary course of business. Such litigation may include claims and counterclaims by and against the Company for breach of contract or warranty, canceled contracts, product liability, or bankruptcy-related claims. For legal proceedings in which a loss is probable and estimable, the Company accrues a loss based on the low end of the range of estimated loss when there is no better estimate within the range. If the Company were found to be liable for any of the claims or counterclaims against it, the Company would incur a charge against earnings for amounts in excess of legal accruals.
F-36
|
Kadant Inc.
|
2016 Financial Statements
|
|
8. Other Income and Restructuring Costs
In 2016, other income consisted of a pre-tax gain of
$317,000
from the sale of real estate in Sweden for cash proceeds of
$368,000
.
In 2015, the Company recorded restructuring costs of
$515,000
, including
$344,000
related to its 2015 restructuring plans and
$171,000
related to its 2014 restructuring plans.
In 2014, the Company recorded restructuring costs of
$805,000
, including
$370,000
related to its 2014 restructuring plans and
$435,000
related to restructuring plans prior to 2014.
2015 Restructuring Plans
In 2015, the Company developed plans to streamline operations in its Papermaking Systems Segment. The Company recorded costs of
$344,000
associated with the reduction of
25
employees in Canada and Brazil.
2014 Restructuring Plans
The Company recorded restructuring costs of
$541,000
associated with its 2014 restructuring plans. In 2014, the Company recorded severance costs of
$321,000
associated with the reduction of
eight
employees in Brazil. The Company also recorded severance costs of $
220,000
, including $
49,000
and $
171,000
in 2014 and 2015 respectively, associated with the reduction of
seven
employees in Sweden. These actions were taken to further streamline the Company's operations in Brazil and Sweden and all occurred in the Papermaking Systems segment.
Restructuring Plans prior to 2014
The Company recorded total restructuring costs of
$2,278,000
in 2013 and 2014, including severance costs of
$1,158,000
associated with the reduction of
22
employees in Brazil and severance costs of
$497,000
associated with the reduction of
25
employees in Sweden. Also included in restructuring costs were facility-related costs of
$623,000
. These actions were taken to streamline the Company's operations as a result of the CBTI and Noss acquisitions. All of these actions occurred in the Papermaking Systems segment.
A summary of the changes in accrued restructuring costs are as follows:
|
(In thousands)
|
Severance
Costs |
Other
Costs |
Total
Costs |
|||||||||
|
2015 Restructuring Plans
|
|
|
|
|||||||||
|
Provision
|
$
|
344
|
|
$
|
—
|
|
$
|
344
|
|
|||
|
Usage
|
(323
|
)
|
—
|
|
(323
|
)
|
||||||
|
Currency translation
|
(21
|
)
|
—
|
|
(21
|
)
|
||||||
|
Balance at January 2, 2016
|
$
|
—
|
|
$
|
—
|
|
$
|
—
|
|
|||
|
2014 Restructuring Plans
|
||||||||||||
|
Provision
|
$
|
370
|
|
$
|
—
|
|
$
|
370
|
|
|||
|
Usage
|
(267
|
)
|
—
|
|
(267
|
)
|
||||||
|
Currency translation
|
(56
|
)
|
—
|
|
(56
|
)
|
||||||
|
Balance at January 3, 2015
|
$
|
47
|
|
$
|
—
|
|
$
|
47
|
|
|||
|
Provision
|
171
|
|
—
|
|
171
|
|
||||||
|
Usage
|
(214
|
)
|
—
|
|
(214
|
)
|
||||||
|
Currency translation
|
(4
|
)
|
—
|
|
(4
|
)
|
||||||
|
Balance at January 2, 2016
|
$
|
—
|
|
$
|
—
|
|
$
|
—
|
|
|||
F-37
|
Kadant Inc.
|
2016 Financial Statements
|
|
Notes to Consolidated Financial Statements
8.
Other Income and Restructuring Costs (continued)
|
(In thousands)
|
Severance
Costs |
Other
Costs |
Total
Costs |
|||||||||
|
Restructuring Plans Prior to 2014
|
||||||||||||
|
Balance at December 28, 2013
|
$
|
519
|
|
$
|
—
|
|
$
|
519
|
|
|||
|
Provision
|
(11
|
)
|
446
|
|
435
|
|
||||||
|
Usage
|
(370
|
)
|
(445
|
)
|
(815
|
)
|
||||||
|
Currency translation
|
(82
|
)
|
(1
|
)
|
(83
|
)
|
||||||
|
Balance at January 3, 2015
|
$
|
56
|
|
$
|
—
|
|
$
|
56
|
|
|||
|
Provision
|
—
|
|
—
|
|
—
|
|
||||||
|
Usage
|
(15
|
)
|
—
|
|
(15
|
)
|
||||||
|
Currency translation
|
(3
|
)
|
—
|
|
(3
|
)
|
||||||
|
Balance at January 2, 2016
|
$
|
38
|
|
$
|
—
|
|
$
|
38
|
|
|||
|
Usage
|
(35
|
)
|
—
|
|
(35
|
)
|
||||||
|
Currency translation
|
(3
|
)
|
—
|
|
(3
|
)
|
||||||
|
Balance at December 31, 2016
|
$
|
—
|
|
$
|
—
|
|
$
|
—
|
|
|||
9.
Derivatives
Interest Rate Swaps
On January 16, 2015, the Company entered into a swap agreement (2015 Swap Agreement) to hedge its exposure to movements in the three-month London Inter-Bank Offered Rate (LIBOR) rate on future outstanding debt and has designated the 2015 Swap Agreement as a cash flow hedge. The 2015 Swap Agreement expires on March 27, 2020 and has a
$10,000,000
notional value. Under the 2015 Swap Agreement, on a quarterly basis, the Company receives a three-month LIBOR rate and pays a fixed rate of interest of
1.50%
plus an applicable margin. The fair value of the 2015 Swap Agreement as of
December 31, 2016
is included in other long-term assets, with an offset to AOCI (net of tax) in the accompanying consolidated balance sheet.
The Company has structured the 2015 Swap Agreement to be
100%
effective and, as a result, there is no current impact to earnings resulting from hedge ineffectiveness. Management believes that any credit risk associated with the 2015 Swap Agreement is remote based on the Company's financial position and the creditworthiness of the financial institution issuing the 2015 Swap Agreement.
The counterparty to the 2015 Swap Agreement could demand an early termination of the 2015 Swap Agreement if the Company is in default under the 2012 Credit Agreement, or any agreement that amends or replaces the 2012 Credit Agreement in which the counterparty is a member, and the Company is unable to cure the default. An event of default under the 2012 Credit Agreement includes customary events of default and failure to comply with financial covenants, including a maximum consolidated leverage ratio of
3.5
to 1 and a minimum consolidated interest coverage ratio of
3
to 1. As of
December 31, 2016
, the Company was in compliance with these covenants. The unrealized gain associated with the 2015 Swap Agreement was
$62,000
as of
December 31, 2016
, which represents the estimated amount that the Company would receive from the counterparty in the event of an early termination.
The Company entered into a swap agreement in 2006 (2006 Swap Agreement) to convert a portion of the Company's outstanding debt from a floating to a fixed rate of interest. The 2006 Swap Agreement expired in May 2016.
Forward Currency-Exchange Contracts
The Company uses forward currency-exchange contracts primarily to hedge exposures resulting from fluctuations in currency exchange rates. Such exposures result primarily from portions of the Company's operations and assets and liabilities that are denominated in currencies other than the functional currencies of the businesses conducting the operations or holding the assets and liabilities. The Company typically manages its level of exposure to the risk of currency-exchange fluctuations by hedging a portion of its currency exposures anticipated over the ensuing 12-month period, using forward currency-exchange contracts that have maturities of
12 months
or less.
Forward currency-exchange contracts that hedge forecasted accounts receivable or accounts payable are designated as cash flow hedges. The fair values for these instruments are included in other current assets for unrecognized gains and in other current liabilities for unrecognized losses, with an offset in AOCI (net of tax). For forward currency-exchange contracts that are designated as fair value hedges, the gain or loss on the derivative, as well as the offsetting loss or gain on the hedged item are recognized currently in earnings. The fair values of forward currency-exchange contracts that are not designated as hedges are
F-38
|
Kadant Inc.
|
2016 Financial Statements
|
|
Notes to Consolidated Financial Statements
9.
Derivatives (continued)
recorded currently in earnings. The Company recognized within SG&A expenses in the accompanying consolidated statement of income losses of
$797,000
,
$386,000
and
$14,000
in
2016
,
2015
and
2014
, respectively, associated with forward currency-exchange contracts that were not designated as hedges. Management believes that any credit risk associated with forward currency-exchange contracts is remote based on the Company's financial position and the creditworthiness of the financial institutions issuing the contracts.
The following table summarizes the fair value of the Company's derivative instruments designated and not designated as hedging instruments, the notional value of the associated derivative contracts, and the location of these instruments in the accompanying consolidated balance sheet:
|
|
|
2016
|
2015
|
|||||||||||||||
|
(In thousands)
|
Balance Sheet
Location |
Asset
(Liability) (a) |
Notional
Amount (b) |
Asset
(Liability) (a) |
Notional
Amount (b) |
|||||||||||||
|
Derivatives Designated as Hedging Instruments:
|
|
|||||||||||||||||
|
Derivatives in an Asset Position:
|
|
|||||||||||||||||
|
Interest rate swap agreement
|
Other Long-Term
Assets |
$
|
62
|
|
$
|
10,000
|
|
$
|
38
|
|
$
|
10,000
|
|
|||||
|
Derivatives in a Liability Position:
|
|
|
|
|
|
|
|
|
|
|||||||||
|
Forward currency-exchange contracts
|
Other Current
Liabilities |
$
|
(41
|
)
|
$
|
2,380
|
|
$
|
(101
|
)
|
$
|
6,525
|
|
|||||
|
Interest rate swap agreement
|
Other Current
Liabilities |
$
|
—
|
|
$
|
—
|
|
$
|
(91
|
)
|
$
|
5,250
|
|
|||||
|
Derivatives Not Designated as Hedging Instruments:
|
|
|
|
|
|
|
|
|
|
|||||||||
|
Derivatives in an Asset Position:
|
|
|
|
|
|
|
|
|
|
|||||||||
|
Forward currency-exchange contracts
|
Other Current
Assets |
$
|
2
|
|
$
|
227
|
|
$
|
2,536
|
|
$
|
15,612
|
|
|||||
|
Derivatives in a Liability Position:
|
|
|
|
|
|
|
|
|
|
|||||||||
|
Forward currency-exchange contracts
|
Other Current
Liabilities |
$
|
(237
|
)
|
$
|
17,185
|
|
$
|
—
|
|
$
|
—
|
|
|||||
|
(a)
|
See Note 10 for the fair value measurements relating to these financial instruments.
|
|
(b)
|
The total notional amount is indicative of the level of the Company's derivative activity during
2016
and
2015
.
|
The following table summarizes the activity in AOCI associated with the Company's derivative instruments designated as cash flow hedges as of and for the period ended
December 31, 2016
:
|
(In thousands)
|
Interest Rate Swap
Agreements |
Forward Currency-
Exchange Contracts |
Total
|
|||||||||
|
Unrealized Loss, Net of Tax, at January 2, 2016
|
$
|
(162
|
)
|
$
|
(67
|
)
|
$
|
(229
|
)
|
|||
|
Loss Reclassified to Earnings (a)
|
241
|
|
170
|
|
411
|
|
||||||
|
Loss Recognized in AOCI
|
(39
|
)
|
(131
|
)
|
(170
|
)
|
||||||
|
Unrealized Gain (Loss), Net of Tax, at December 31, 2016
|
$
|
40
|
|
$
|
(28
|
)
|
$
|
12
|
|
|||
|
(a)
|
See Note 13 for the income statement classification.
|
As of
December 31, 2016
, the Company expects to reclassify
$49,000
of the net unrealized loss included in AOCI to earnings over the next twelve months.
F-39
|
Kadant Inc.
|
2016 Financial Statements
|
|
10. Fair Value Measurements and Fair Value of Financial Instruments
Fair value measurement is defined as the price that would be received to sell an asset or paid to transfer a liability in the principal or most advantageous market for the asset or liability in an orderly transaction between market participants at the measurement date. A fair value hierarchy is established, which prioritizes the inputs used in measuring fair value into three broad levels as follows:
|
•
|
Level 1—Quoted prices in active markets for identical assets or liabilities.
|
|
•
|
Level 2—Inputs, other than quoted prices in active markets, that are observable either directly or indirectly.
|
|
•
|
Level 3—Unobservable inputs based on the Company's own assumptions.
|
The following table presents the fair value hierarchy for those assets and liabilities measured at fair value on a recurring basis:
|
|
Fair Value as of December 31, 2016
|
|||||||||||||||
|
(In thousands)
|
Level 1
|
Level 2
|
Level 3
|
Total
|
||||||||||||
|
Assets:
|
||||||||||||||||
|
Money market funds and time deposits
|
$
|
10,855
|
|
$
|
—
|
|
$
|
—
|
|
$
|
10,855
|
|
||||
|
Forward currency-exchange contracts
|
$
|
—
|
|
$
|
2
|
|
$
|
—
|
|
$
|
2
|
|
||||
|
Interest rate swap agreement
|
$
|
—
|
|
$
|
62
|
|
$
|
—
|
|
$
|
62
|
|
||||
|
Banker's acceptance drafts (a)
|
$
|
—
|
|
$
|
7,852
|
|
$
|
—
|
|
$
|
7,852
|
|
||||
|
Liabilities:
|
|
|
|
|
|
|
|
|
||||||||
|
Forward currency-exchange contracts
|
$
|
—
|
|
$
|
278
|
|
$
|
—
|
|
$
|
278
|
|
||||
|
|
Fair Value as of January 2, 2016
|
|||||||||||||||
|
(In thousands)
|
Level 1
|
Level 2
|
Level 3
|
Total
|
||||||||||||
|
Assets:
|
||||||||||||||||
|
Money market funds and time deposits
|
$
|
9,767
|
|
$
|
—
|
|
$
|
—
|
|
$
|
9,767
|
|
||||
|
Forward currency-exchange contracts
|
$
|
—
|
|
$
|
2,536
|
|
$
|
—
|
|
$
|
2,536
|
|
||||
|
Interest rate swap agreement
|
$
|
—
|
|
$
|
38
|
|
$
|
—
|
|
$
|
38
|
|
||||
|
Banker's acceptance drafts (a)
|
$
|
—
|
|
$
|
8,314
|
|
$
|
—
|
|
$
|
8,314
|
|
||||
|
Liabilities:
|
|
|
|
|
|
|
|
|
||||||||
|
Forward currency-exchange contracts
|
$
|
—
|
|
$
|
101
|
|
$
|
—
|
|
$
|
101
|
|
||||
|
Interest rate swap agreement
|
$
|
—
|
|
$
|
91
|
|
$
|
—
|
|
$
|
91
|
|
||||
|
Contingent consideration (b)
|
$
|
—
|
|
$
|
—
|
|
$
|
1,091
|
|
$
|
1,091
|
|
||||
|
(a)
|
Included in accounts receivable in the accompanying consolidated balance sheet.
|
|
(b)
|
Included in other current liabilities in the accompanying consolidated balance sheet.
|
The Company uses the market approach technique to value its financial assets and liabilities, and there were no changes in valuation techniques during
2016
. The Company's financial assets and liabilities carried at fair value are comprised of cash equivalents, banker's acceptance drafts, and derivative instruments used to hedge the Company's foreign currency and interest rate risks. The Company's cash equivalents are comprised of money market funds and bank deposits which are highly liquid and readily tradable. These investments are valued using inputs observable in active markets for identical securities. The carrying value of banker's acceptance drafts approximates their fair value due to the short-term nature of the negotiable instrument. The fair values of the Company's interest rate swap agreements are based on LIBOR yield curves at the reporting date. The fair values of the Company's forward currency-exchange contracts are based on quoted forward foreign exchange rates at the reporting date. The forward currency-exchange contracts and interest rate swap agreements are hedges of either recorded assets or liabilities or anticipated transactions. Changes in values of the underlying hedged assets and liabilities or anticipated transactions are not reflected in the table above. The Company recorded contingent consideration as part of its acquisition of a European manufacturer on December 30, 2013. The fair value of the contingent consideration was based on the present value of the estimated future cash flows. Changes to the fair value of contingent consideration were recorded in SG&A expenses in the accompanying consolidated statement of income. This contingent consideration was paid during the first quarter of 2016.
F-40
|
Kadant Inc.
|
2016 Financial Statements
|
|
Notes to Consolidated Financial Statements
10. Fair Value Measurements and Fair Value of Financial Instruments (continued)
The following table provides a rollforward of the fair value, as determined by Level 3 inputs, of the contingent consideration:
|
(In thousands)
|
2016
|
2015
|
||||||
|
Balance at Beginning of Year
|
$
|
1,091
|
|
$
|
1,133
|
|
||
|
Payment
|
(1,091
|
)
|
—
|
|
||||
|
Current period expense
|
—
|
|
71
|
|
||||
|
Currency translation
|
—
|
|
(113
|
)
|
||||
|
Balance at End of Year
|
$
|
—
|
|
$
|
1,091
|
|
||
The carrying value and fair value of the Company's long-term debt obligations are as follows:
|
|
2016
|
2015
|
||||||||||||||
|
(In thousands)
|
Carrying
Value |
Fair
Value |
Carrying
Value |
Fair
Value |
||||||||||||
|
Long-term Debt Obligations:
|
||||||||||||||||
|
Revolving credit facility
|
$
|
61,494
|
|
$
|
61,494
|
|
$
|
26,000
|
|
$
|
26,000
|
|
||||
|
Capital lease obligations
|
3,857
|
|
3,857
|
|
—
|
|
—
|
|
||||||||
|
Other borrowings
|
417
|
|
417
|
|
—
|
|
—
|
|
||||||||
|
$
|
65,768
|
|
$
|
65,768
|
|
$
|
26,000
|
|
$
|
26,000
|
|
|||||
The carrying values of the Company's revolving credit facility and capital lease obligations approximate fair value as the obligations bear variable rates of interest, which adjust quarterly and semi-annually, respectively, based on prevailing market rates.
11.
Business Segment and Geographical Information
The Company has combined its operating entities into
two
reportable operating segments, Papermaking Systems and Wood Processing Systems, and a separate product line, Fiber-based Products. In classifying operational entities into a particular segment, the Company has aggregated businesses with similar economic characteristics, products and services, production processes, customers, and methods of distribution.
The Company's Papermaking Systems segment develops, manufactures, and markets stock-preparation systems and equipment; fluid-handling systems; and doctoring, cleaning, and filtration systems and related consumables for the pulp and paper industry worldwide. Principal products manufactured by this segment include: custom-engineered stock-preparation systems and equipment for the preparation of wastepaper for conversion into recycled paper and balers and related equipment used in the processing of recyclable and waste materials; fluid-handling systems used primarily in the dryer section of the papermaking process and during the production of corrugated boxboard, metals, plastics, rubber, textiles, chemicals, and food; doctoring systems and equipment and related consumables important to the efficient operation of paper machines; and cleaning and filtration systems essential for draining, purifying, and recycling process water and cleaning paper machine fabrics and rolls.
The Wood Processing Systems segment develops, manufactures and markets stranders and related equipment used in the production of OSB, an engineered wood panel product used primarily in home construction. This segment supplies debarking and wood chipping equipment used in the forest products and the pulp and paper industries. This segment also provides refurbishment and repair of pulping equipment for the pulp and paper industry.
The Fiber-based Products business manufactures and sells granules derived from papermaking by-products primarily for use as agricultural carriers and for home lawn and garden applications, as well as for oil and grease absorption.
F-41
|
Kadant Inc.
|
2016 Financial Statements
|
|
Notes to Consolidated Financial Statements
11.
Business Segment and Geographical Information (continued)
|
(In thousands)
|
2016
|
2015
|
2014
|
|||||||||
|
Business Segment Information
|
||||||||||||
|
Revenues by Product Line:
|
||||||||||||
|
Papermaking Systems:
|
||||||||||||
|
Stock-Preparation
|
$
|
171,378
|
|
$
|
148,341
|
|
$
|
127,496
|
|
|||
|
Doctoring, Cleaning, & Filtration
|
105,938
|
|
101,523
|
|
117,389
|
|
||||||
|
Fluid-Handling
|
89,145
|
|
92,797
|
|
103,314
|
|
||||||
|
Papermaking Systems
|
$
|
366,461
|
|
$
|
342,661
|
|
$
|
348,199
|
|
|||
|
Wood Processing Systems
|
36,850
|
|
36,387
|
|
41,647
|
|
||||||
|
Fiber-based Products
|
10,815
|
|
11,059
|
|
12,281
|
|
||||||
|
|
$
|
414,126
|
|
$
|
390,107
|
|
$
|
402,127
|
|
|||
|
Income from Continuing Operations Before Provision for Income Taxes:
|
|
|
|
|
|
|
||||||
|
Papermaking Systems (a)
|
$
|
57,427
|
|
$
|
56,789
|
|
$
|
50,485
|
|
|||
|
Wood Processing Systems
|
8,327
|
|
10,926
|
|
6,977
|
|
||||||
|
Corporate and Fiber-based Products (b)
|
(20,181
|
)
|
(17,596
|
)
|
(15,376
|
)
|
||||||
|
Total operating income
|
45,573
|
|
50,119
|
|
42,086
|
|
||||||
|
Interest expense, net
|
(1,024
|
)
|
(748
|
)
|
(568
|
)
|
||||||
|
|
$
|
44,549
|
|
$
|
49,371
|
|
$
|
41,518
|
|
|||
|
Total Assets:
|
||||||||||||
|
Papermaking Systems
|
$
|
407,538
|
|
$
|
354,417
|
|
$
|
343,937
|
|
|||
|
Wood Processing Systems
|
52,407
|
|
53,347
|
|
55,634
|
|
||||||
|
Other (c)
|
10,746
|
|
7,734
|
|
14,176
|
|
||||||
|
Total Assets
|
$
|
470,691
|
|
$
|
415,498
|
|
$
|
413,747
|
|
|||
|
Depreciation and Amortization:
|
|
|
|
|
|
|
||||||
|
Papermaking Systems
|
$
|
11,513
|
|
$
|
7,898
|
|
$
|
7,724
|
|
|||
|
Wood Processing Systems
|
2,188
|
|
2,384
|
|
2,977
|
|
||||||
|
Other
|
625
|
|
539
|
|
488
|
|
||||||
|
|
$
|
14,326
|
|
$
|
10,821
|
|
$
|
11,189
|
|
|||
|
Capital Expenditures:
|
|
|
|
|
|
|
||||||
|
Papermaking Systems
|
$
|
5,504
|
|
$
|
4,639
|
|
$
|
5,640
|
|
|||
|
Other
|
300
|
|
840
|
|
1,115
|
|
||||||
|
|
$
|
5,804
|
|
$
|
5,479
|
|
$
|
6,755
|
|
|||
F-42
|
Kadant Inc.
|
2016 Financial Statements
|
|
Notes to Consolidated Financial Statements
11.
Business Segment and Geographical Information (continued)
|
(In thousands)
|
2016
|
2015
|
2014
|
|||||||||
|
Geographical Information
|
|
|
|
|
|
|
||||||
|
Revenues (d):
|
|
|
|
|
|
|
||||||
|
United States
|
$
|
165,335
|
|
$
|
193,383
|
|
$
|
174,003
|
|
|||
|
China
|
43,299
|
|
50,814
|
|
43,867
|
|
||||||
|
Other
|
205,492
|
|
145,910
|
|
184,257
|
|
||||||
|
|
$
|
414,126
|
|
$
|
390,107
|
|
$
|
402,127
|
|
|||
|
Long-lived Assets (e):
|
|
|
|
|
|
|
||||||
|
United States
|
$
|
18,482
|
|
$
|
17,373
|
|
$
|
15,685
|
|
|||
|
China
|
10,714
|
|
12,278
|
|
13,996
|
|
||||||
|
Germany
|
5,792
|
|
63
|
|
85
|
|
||||||
|
Other
|
12,716
|
|
12,579
|
|
15,199
|
|
||||||
|
|
$
|
47,704
|
|
$
|
42,293
|
|
$
|
44,965
|
|
|||
|
(a)
|
Includes other income of
$0.3 million
in
2016
, and restructuring costs of
$0.5 million
and
$0.8 million
in
2015
and
2014
, respectively (see Note 8).
|
|
(b)
|
Corporate primarily includes general and administrative expenses.
|
|
(c)
|
Primarily includes Corporate and Fiber-based Products' cash and cash equivalents and property, plant, and equipment.
|
|
(d)
|
Revenues are attributed to countries based on customer location.
|
|
(e)
|
Represents property, plant, and equipment, net.
|
12. Earnings per Share
Basic and diluted EPS were calculated as follows:
|
(In thousands, except per share amounts)
|
2016
|
2015
|
2014
|
|||||||||
|
Amounts Attributable to Kadant:
|
||||||||||||
|
Income from Continuing Operations
|
$
|
32,074
|
|
$
|
34,315
|
|
$
|
28,682
|
|
|||
|
Income (Loss) from Discontinued Operation
|
3
|
|
74
|
|
(23
|
)
|
||||||
|
Net Income Attributable to Kadant
|
$
|
32,077
|
|
$
|
34,389
|
|
$
|
28,659
|
|
|||
|
Basic Weighted Average Shares
|
10,869
|
|
10,867
|
|
10,988
|
|
||||||
|
Effect of Stock Options, Restricted Stock Units and Employee Stock Purchase Plan
|
280
|
|
227
|
|
222
|
|
||||||
|
Diluted Weighted Average Shares
|
11,149
|
|
11,094
|
|
11,210
|
|
||||||
|
Basic EPS:
|
|
|
|
|
|
|
||||||
|
Continuing Operations
|
$
|
2.95
|
|
$
|
3.16
|
|
$
|
2.61
|
|
|||
|
Discontinued Operation
|
$
|
—
|
|
$
|
0.01
|
|
$
|
—
|
|
|||
|
Net Income per Basic Share
|
$
|
2.95
|
|
$
|
3.16
|
|
$
|
2.61
|
|
|||
|
Diluted EPS:
|
|
|
|
|
|
|
||||||
|
Continuing Operations
|
$
|
2.88
|
|
$
|
3.09
|
|
$
|
2.56
|
|
|||
|
Discontinued Operation
|
$
|
—
|
|
$
|
0.01
|
|
$
|
—
|
|
|||
|
Net Income per Diluted Share
|
$
|
2.88
|
|
$
|
3.10
|
|
$
|
2.56
|
|
|||
The dilutive effect of RSUs totaling
36,700
,
23,100
, and
33,000
shares of common stock was not included in the computation of diluted EPS in
2016
,
2015
, and
2014
, respectively, as the effect would have been antidilutive or, for unvested performance-based RSUs, the performance conditions had not been met as of the end of the reporting periods during the year.
F-43
|
Kadant Inc.
|
2016 Financial Statements
|
|
13. Accumulated Other Comprehensive Items
Comprehensive income combines net income and other comprehensive items, which represent certain amounts that are reported as components of stockholders' equity in the accompanying consolidated balance sheet, including foreign currency translation adjustments, unrecognized prior service cost and deferred losses associated with pension and other post-retirement benefit plans, and deferred losses and gains on hedging instruments.
Changes in each component of AOCI, net of tax are as follows:
|
(In thousands)
|
Foreign Currency Translation Adjustment
|
Unrecognized Prior Service Cost
|
Deferred Loss on Pension and Other Post-Retirement Benefit Plans
|
Deferred (Loss) Gain on Hedging Instruments
|
Accumulated Other Comprehensive Items
|
|||||||||||||||
|
Balance at January 2, 2016
|
$
|
(27,932
|
)
|
$
|
(489
|
)
|
$
|
(8,322
|
)
|
$
|
(229
|
)
|
$
|
(36,972
|
)
|
|||||
|
Other comprehensive loss before reclassifications
|
(13,162
|
)
|
(3
|
)
|
(294
|
)
|
(170
|
)
|
(13,629
|
)
|
||||||||||
|
Reclassifications from AOCI
|
—
|
|
95
|
|
458
|
|
411
|
|
964
|
|
||||||||||
|
Net current period other comprehensive (loss) income
|
(13,162
|
)
|
92
|
|
164
|
|
241
|
|
(12,665
|
)
|
||||||||||
|
Balance at December 31, 2016
|
$
|
(41,094
|
)
|
$
|
(397
|
)
|
$
|
(8,158
|
)
|
$
|
12
|
|
$
|
(49,637
|
)
|
|||||
Amounts reclassified out of AOCI are as follows:
|
(In thousands)
|
2016
|
2015
|
2014
|
Income Statement
Line Item |
||||||||||
|
Pension and Other Post-Retirement Plans (1)
|
|
|||||||||||||
|
Amortization of prior service costs
|
$
|
(147
|
)
|
$
|
(147
|
)
|
$
|
(148
|
)
|
SG&A expenses
|
||||
|
Amortization of actuarial losses
|
(701
|
)
|
(576
|
)
|
(352
|
)
|
SG&A expenses
|
|||||||
|
Total expense before income taxes
|
(848
|
)
|
(723
|
)
|
(500
|
)
|
|
|||||||
|
Income tax benefit
|
295
|
|
249
|
|
175
|
|
Provision for income taxes
|
|||||||
|
|
(553
|
)
|
(474
|
)
|
(325
|
)
|
|
|||||||
|
Cash Flow Hedges (2)
|
|
|
|
|
|
|
|
|||||||
|
Interest rate swap agreements
|
(174
|
)
|
(420
|
)
|
(332
|
)
|
Interest expense
|
|||||||
|
Forward currency-exchange contracts
|
(14
|
)
|
(12
|
)
|
31
|
|
Revenues
|
|||||||
|
Forward currency-exchange contracts
|
(186
|
)
|
—
|
|
—
|
|
Cost of revenues
|
|||||||
|
Forward currency-exchange contracts
|
—
|
|
1,691
|
|
1,247
|
|
SG&A expenses
|
|||||||
|
Total (expense) income before income taxes
|
(374
|
)
|
1,259
|
|
946
|
|
|
|||||||
|
Income tax provision
|
(37
|
)
|
(150
|
)
|
(57
|
)
|
Provision for income taxes
|
|||||||
|
|
(411
|
)
|
1,109
|
|
889
|
|
|
|||||||
|
Total Reclassifications
|
$
|
(964
|
)
|
$
|
635
|
|
$
|
564
|
|
|
||||
|
(1)
|
Included in the computation of net periodic benefit costs. See Note 3 for additional information.
|
|
(2)
|
See Note 9 for additional information.
|
F-44
|
Kadant Inc.
|
2016 Financial Statements
|
|
14. Unaudited Quarterly Information
|
2016 (In thousands, except per share amounts)
|
First
|
Second
|
Third
|
Fourth
|
||||||||||||
|
Revenues
|
$
|
96,538
|
|
$
|
111,828
|
|
$
|
105,519
|
|
$
|
100,241
|
|
||||
|
Gross Profit
|
43,976
|
|
50,261
|
|
48,079
|
|
46,073
|
|
||||||||
|
Amounts Attributable to Kadant:
|
|
|
|
|
|
|
|
|
||||||||
|
Income from Continuing Operations
|
6,876
|
|
8,311
|
|
9,154
|
|
7,733
|
|
||||||||
|
Income from Discontinued Operation
|
—
|
|
—
|
|
3
|
|
—
|
|
||||||||
|
Net Income Attributable to Kadant
|
$
|
6,876
|
|
$
|
8,311
|
|
$
|
9,157
|
|
$
|
7,733
|
|
||||
|
Basic Earnings per Share:
|
|
|
|
|
|
|
|
|
||||||||
|
Continuing Operations
|
$
|
0.64
|
|
$
|
0.76
|
|
$
|
0.84
|
|
$
|
0.71
|
|
||||
|
Net Income Attributable to Kadant
|
$
|
0.64
|
|
$
|
0.76
|
|
$
|
0.84
|
|
$
|
0.71
|
|
||||
|
Diluted Earnings per Share:
|
|
|
|
|
|
|
|
|
||||||||
|
Continuing Operations
|
$
|
0.62
|
|
$
|
0.75
|
|
$
|
0.82
|
|
$
|
0.69
|
|
||||
|
Net Income Attributable to Kadant
|
$
|
0.62
|
|
$
|
0.75
|
|
$
|
0.82
|
|
$
|
0.69
|
|
||||
|
Cash Dividends Declared per Common Share
|
$
|
0.19
|
|
$
|
0.19
|
|
$
|
0.19
|
|
$
|
0.19
|
|
||||
|
2015 (In thousands, except per share amounts)
|
First
|
Second
|
Third
|
Fourth
|
||||||||||||
|
Revenues
|
$
|
92,251
|
|
$
|
98,327
|
|
$
|
91,929
|
|
$
|
107,600
|
|
||||
|
Gross Profit
|
44,337
|
|
45,727
|
|
43,668
|
|
46,393
|
|
||||||||
|
Amounts Attributable to Kadant:
|
|
|
|
|
|
|
|
|
||||||||
|
Income from Continuing Operations
|
6,832
|
|
8,469
|
|
8,647
|
|
10,367
|
|
||||||||
|
Income (Loss) from Discontinued Operation
|
65
|
|
(5
|
)
|
(4
|
)
|
18
|
|
||||||||
|
Net Income Attributable to Kadant
|
$
|
6,897
|
|
$
|
8,464
|
|
$
|
8,643
|
|
$
|
10,385
|
|
||||
|
Basic Earnings per Share:
|
|
|
|
|
|
|
|
|
||||||||
|
Continuing Operations
|
$
|
0.63
|
|
$
|
0.77
|
|
$
|
0.80
|
|
$
|
0.96
|
|
||||
|
Net Income Attributable to Kadant
|
$
|
0.63
|
|
$
|
0.77
|
|
$
|
0.80
|
|
$
|
0.96
|
|
||||
|
Diluted Earnings per Share:
|
|
|
|
|
|
|
|
|
||||||||
|
Continuing Operations
|
$
|
0.62
|
|
$
|
0.76
|
|
$
|
0.78
|
|
$
|
0.94
|
|
||||
|
Net Income Attributable to Kadant
|
$
|
0.62
|
|
$
|
0.76
|
|
$
|
0.78
|
|
$
|
0.94
|
|
||||
|
Cash Dividends Declared per Common Share
|
$
|
0.17
|
|
$
|
0.17
|
|
$
|
0.17
|
|
$
|
0.17
|
|
||||
15. Subsequent Event
On March 1, 2017 the Company entered into an Amended and Restated Credit Agreement (2017 Credit Agreement) which became effective on March 2, 2017. The 2017 Credit Agreement is a
five
-year unsecured revolving credit facility in the aggregate principal amount of up to
$200,000,000
. The 2017 Credit Agreement also includes an uncommitted unsecured incremental borrowing facility of up to an additional
$100,000,000
. The principal on any borrowings made under the 2017 Credit Agreement is due on March 1, 2022. Interest on any loans outstanding under the 2017 Credit Agreement accrues and generally is payable quarterly in arrears at one of the following rates selected by the Company: (i) the Base Rate, calculated as the highest of (a) the federal funds rate plus
0.50%
, (b) the prime rate as published by Citizens Bank, and (c) the thirty-day LIBOR rate, as defined, plus
0.50%
; or (ii) the LIBOR rate (with a
zero
percent floor), as defined, plus an applicable margin of
1%
to
2%
. The applicable margin is determined based upon the ratio of the Company's total debt, net of certain cash, as defined, to earnings before interest, taxes, depreciation, and amortization (EBITDA), as defined in the 2017 Credit Agreement. For this purpose, total debt net of certain cash is defined as total debt less the sum of (i) unrestricted U.S. cash, and (ii)
65%
of unrestricted cash outside of the United States, but no more than an aggregate amount of
$30,000,000
.
The obligations of the Company under the 2017 Credit Agreement may be accelerated upon the occurrence of an event of default under the 2017 Credit Agreement, which includes customary events of default including without limitation payment defaults, defaults in the performance of affirmative and negative covenants, the inaccuracy of representations or warranties, bankruptcy- and insolvency-related defaults, defaults relating to such matters as the Employment Retirement Income Security Act (ERISA), unsatisfied judgments, the failure to pay certain indebtedness, and a change of control default. In addition, the 2017 Credit Agreement contains negative covenants applicable to the Company and its subsidiaries, including financial covenants requiring the Company to comply with a maximum consolidated leverage ratio of
3.5
to
1
, a minimum consolidated interest coverage ratio of
3
to
1
, and restrictions on liens, indebtedness, fundamental changes, dispositions of property, making certain restricted payments (including dividends and stock repurchases), investments, transactions with affiliates, sale and
F-45
|
Kadant Inc.
|
2016 Financial Statements
|
|
Notes to Consolidated Financial Statements
15.
Subsequent Event (continued)
leaseback transactions, swap agreements, changing its fiscal year, arrangements affecting subsidiary distributions, entering into new lines of business, and certain actions related to the discontinued operation.
Loans under the 2017 Credit Agreement are guaranteed by certain domestic subsidiaries of the Company pursuant to an Amended and Restated Guarantee Agreement, dated as of March 1, 2017. In addition, one of Kadant's foreign subsidiaries entered into a Guarantee Agreement limited to certain obligations of two foreign subsidiary borrowers pursuant to a Guarantee Agreement dated as of March 1, 2017.
F-46
TABLE OF CONTENTS
Part IItem 1. BusinessItem 1A. Risk FactorsItem 1B. Unresolved Staff CommentsItem 2. PropertiesItem 3. Legal ProceedingsItem 4. Mine Safety DisclosuresPart IIItem 5. Market For Registrant's Common Equity, Related Stockholder Matters, and Issuer Purchases Of Equity SecuritiesItem 6. Selected Financial DataItem 7. Management's Discussion and Analysis Of Financial Condition and Results Of OperationsItem 7A. Quantitative and Qualitative Disclosures About Market RiskItem 8. Financial Statements and Supplementary DataItem 9. Changes in and Disagreements with Accountants on Accounting and Financial DisclosureItem 9A. Controls and ProceduresItem 9B. Other InformationPart IIIItem 10. Directors, Executive Officers, and Corporate GovernanceItem 11. Executive CompensationItem 12. Security Ownership Of Certain Beneficial Owners and Management and Related Stockholder MattersItem 13. Certain Relationships and Related Transactions, and Director IndependenceItem 14. Principal Accountant Fees and ServicesPart IVItem 15. Exhibits and Financial Statement Schedules