KAR AUCTION SERVICES, INC.
10-Ks and 10-Qs
|
|
|
|
|
|
|
|
|
|
|
|
|
|
|
|
|
|
|
|
|
|
|
|
|
|
|
|
|
|
|
|
|
|
|
|
|
|
|
|
|
|
|
|
|
|
|
|
|
|
|
|
|
UNITED STATES
SECURITIES AND EXCHANGE COMMISSION
Washington, D.C. 20549
Form 10-K
|
ý
|
ANNUAL REPORT PURSUANT TO SECTION 13 OR 15(d) OF THE SECURITIES EXCHANGE ACT OF 1934
|
|
|
For the fiscal year ended December 31, 2016
|
||
|
OR
|
||
|
o
|
TRANSITION REPORT PURSUANT TO SECTION 13 OR 15(d) OF THE SECURITIES EXCHANGE ACT OF 1934
|
|
Commission File Number: 001-34568
KAR Auction Services, Inc.
(Exact name of Registrant as specified in its charter)
|
Delaware
(State or other jurisdiction of incorporation or organization)
|
|
20-8744739
(I.R.S. Employer Identification No.)
|
13085 Hamilton Crossing Boulevard, Carmel, Indiana 46032
(Address of principal executive offices, including zip code)
Registrant's telephone number, including area code:
(800) 923-3725
Securities registered pursuant to Section 12(b) of the Act:
|
Title of each class
|
|
Name of each exchange on which registered
|
|
Common Stock, par value $0.01 per share
|
|
New York Stock Exchange
|
Securities registered pursuant to Section 12(g) of the Act:
None
_______________________________________________________________________________
Indicate by check mark if the registrant is a well-known seasoned issuer, as defined in Rule 405 of the Securities Act. Yes
ý
No
o
Indicate by check mark if the registrant is not required to file reports pursuant to Section 13 or Section 15(d) of the Act. Yes
o
No
ý
Indicate by check mark whether the registrant (1) has filed all reports required to be filed by Section 13 or 15(d) of the Securities Exchange Act of 1934 during the preceding 12 months (or for such shorter period that the Registrant was required to file such reports), and (2) has been subject to such filing requirements for the past 90 days. Yes
ý
No
o
Indicate by check mark whether the registrant has submitted electronically and posted on its corporate Web site, if any, every Interactive Data File required to be submitted and posted pursuant to Rule 405 of Regulation S-T (§ 232.405 of this chapter) during the preceding 12 months (or for such shorter period that the registrant was required to submit and post such files). Yes
ý
No
o
Indicate by check mark if disclosure of delinquent filers pursuant to Item 405 of Regulation S-K (§ 229.405 of this chapter) is not contained herein, and will not be contained, to the best of registrant's knowledge, in definitive proxy or information statements incorporated by reference in Part III of this Form 10-K or any amendment to this Form 10-K.
o
Indicate by check mark whether the registrant is a large accelerated filer, an accelerated filer, a non-accelerated filer, or a smaller reporting company. See the definitions of "large accelerated filer," "accelerated filer" and "smaller reporting company" in Rule 12b-2 of the Exchange Act.
|
Large accelerated filer
ý
|
|
Accelerated filer
o
|
|
Non-accelerated filer
o
|
|
Smaller reporting company
o
|
Indicate by check mark whether the registrant is a shell company (as defined in Rule 12b-2 of the Act). Yes
o
No
ý
The aggregate market value of the registrant's common stock held by stockholders who were not affiliates (as defined by regulations of the Securities and Exchange Commission) of the registrant was
$5,748,110,691
at June 30, 2016.
As of
February 15, 2017
,
136,728,422
shares of the registrant's common stock, par value $0.01 per share, were outstanding.
Documents Incorporated by Reference
Certain information required by Part III of this Annual Report on Form 10-K is incorporated by reference herein from the registrant's Definitive Proxy Statement for its 2017 Annual Meeting of Stockholders to be filed with the SEC within 120 days after the end of the registrant's fiscal year ended
December 31, 2016
.
Index
|
|
|
Page
|
|
|
||
|
|
||
|
|
||
|
|
||
2
DEFINED TERMS
Unless otherwise indicated or unless the context otherwise requires, the following terms used in this Annual Report on Form 10-K have the following meanings:
|
•
|
"we," "us," "our" and "the Company" refer, collectively, to KAR Auction Services, Inc. and all of its subsidiaries;
|
|
•
|
"ADESA" or "ADESA Auctions" refer, collectively, to ADESA, Inc., a wholly-owned subsidiary of KAR Auction Services, and ADESA, Inc.'s subsidiaries, including Openlane, Inc. (together with Openlane, Inc.'s subsidiaries, "Openlane") and ADESA Remarketing Limited (formerly known as GRS Remarketing Limited ("GRS" or "ADESA Remarketing Limited"));
|
|
•
|
"AFC" refers, collectively, to Automotive Finance Corporation, a wholly-owned subsidiary of ADESA, and Automotive Finance Corporation's subsidiaries and other related entities, including PWI Holdings, Inc.;
|
|
•
|
"AutoVIN" refers to AutoVIN, Inc., our wholly-owned subsidiary;
|
|
•
|
"Credit Agreement" refers to the Amended and Restated Credit Agreement, dated March 11, 2014, as amended on March 9, 2016, among KAR Auction Services, as the borrower, the several banks and other financial institutions or entities from time to time parties thereto and the administrative agent;
|
|
•
|
"Credit Facility" refers to the three-year senior secured term loan B-1 facility ("Term Loan B-1"), the seven-year senior secured term loan B-2 facility ("Term Loan B-2"), the seven-year senior secured term loan B-3 facility ("Term Loan B-3"), the $300 million, five-year senior secured revolving credit facility (the "revolving credit facility") and the $250 million, five-year senior secured revolving credit facility (the "old revolving credit facility"), the terms of which are set forth in the Credit Agreement. Term Loan B-1 and the old revolving credit facility were extinguished in March 2016 with proceeds received from Term Loan B-3;
|
|
•
|
"IAA" refers, collectively, to Insurance Auto Auctions, Inc., a wholly-owned subsidiary of KAR Auction Services, and Insurance Auto Auctions, Inc.'s subsidiaries and other related entities, including HBC Vehicle Services Limited ("HBC"); and
|
|
•
|
"KAR Auction Services" refers to KAR Auction Services, Inc., and not to its subsidiaries.
|
3
Overview
We are a leading provider of used car auction services and salvage auction services in North America and the United Kingdom. We facilitate an efficient marketplace by providing auction services for sellers of used, or "whole car," vehicles and salvage vehicles through our 249 North American physical auction locations at
December 31, 2016
, and multiple proprietary Internet venues. In
2016
, we facilitated the sale of approximately 5.1 million used and salvage vehicles. Our revenues are generated through auction fees from both vehicle buyers and sellers, as well as by providing value-added ancillary services, including transportation, reconditioning, inspections, marshalling, titling and floorplan financing. We facilitate the transfer of ownership directly from seller to buyer and generally we do not take title to or ownership of vehicles sold through our auctions.
ADESA, our whole car auction services business, is the second largest provider of used vehicle auction services in North America. Vehicles at ADESA's auctions are typically sold by used vehicle dealers, vehicle manufacturers and their captive finance companies, financial institutions, commercial fleet operators and rental car companies to franchised and independent used vehicle dealers. Through ADESA.com, powered by Openlane technology, ADESA provides a comprehensive remarketing solution to automobile manufacturers, captive finance companies, lease and daily rental car companies, financial institutions and wholesale automobile auctions. IAA, our salvage auction services business, is one of the two largest providers of salvage auction services in North America. Vehicles at our salvage auctions are typically damaged or low-value vehicles that are predominantly sold by automobile insurance companies, non-profit organizations, automobile dealers, vehicle leasing companies and rental car companies to licensed dismantlers, rebuilders, scrap dealers or qualified public buyers. An important component of ADESA's and IAA's services to their buyers is providing short-term inventory-secured financing, known as floorplan financing, primarily to independent used vehicle dealers through our wholly-owned subsidiary, AFC.
At
December 31, 2016
, we had a North American network of
77
whole car auction locations and
172
salvage vehicle auction sites; in addition, we offer online auctions for both whole car and salvage vehicles. ADESA also includes ADESA Remarketing Limited, an online whole car vehicle remarketing business in the United Kingdom. IAA also includes HBC Vehicle Services Limited, which operates from
11
locations in the United Kingdom. Our auction locations are primarily standalone facilities dedicated to either whole car or salvage auctions; however, some of our sites are utilized to service both whole car and salvage customers at the same location. We believe our extensive geographic network and diverse product offerings enable us to leverage relationships with providers and buyers of used and salvage vehicles.
Our Corporate History
KAR Auction Services (formerly KAR Holdings, Inc.) was incorporated in 2006 and commenced operations in April 2007. On November 3, 2009, we changed our name from KAR Holdings, Inc. to KAR Auction Services, Inc. ADESA entered the vehicle remarketing industry in 1989 and first became a public company in 1992. In 1994, ADESA acquired AFC. ADESA remained a public company until 1995 when ALLETE, Inc. purchased a majority of its outstanding equity interests. In June 2004, ALLETE, Inc. sold 20% of ADESA to the public and then spun off their remaining 80% interest to shareholders in September 2004. ADESA was acquired by the Company in April 2007. IAA entered the vehicle salvage business in 1982, and first became a public company in 1991. After growing through a series of acquisitions, IAA was acquired by two private equity firms in 2005. The two private equity firms and certain members of IAA management contributed IAA to KAR Auction Services in April 2007. In a series of transactions between December 2012 and November 2013, our former owners (private equity firms) sold all of their common stock in secondary offerings.
4
Our Industry
Auctions are the hub of the remarketing system for used and salvage vehicles, bringing professional sellers and buyers together and creating a marketplace for the sale of these vehicles. Whole car auction vehicles include vehicles from dealers turning their inventory, off-lease vehicles, vehicles repossessed by financial institutions and rental and other program fleet vehicles that have reached a predetermined age or mileage. The salvage vehicle auction industry provides a venue for sellers, primarily automobile insurance companies, to dispose or liquidate damaged or low value vehicles to dismantlers, rebuilders, scrap dealers or qualified public buyers. The following are key industry highlights:
Whole Car Auction Industry Volumes
Whole car auction volumes in North America, including online only volumes, were approximately
9.2 million
and
9.9 million
in
2014
and
2015
, respectively. Data for the whole car auction industry is collected by the National Auto Auction Association ("NAAA") through an annual survey. NAAA industry volumes for
2016
have not yet been released; however, we estimate that used vehicle auction volumes in North America in
2016
will be approximately 10.6 million vehicles (including approximately 0.7 million vehicles sold online by ADESA prior to reaching a physical auction). We expect the industry to experience an increase in whole car auction volumes in 2017 as a result of increasing new vehicle sales and lease originations since 2009, as well as readily available credit, which supports retail used car sales.
Salvage Auction Industry Volumes
We believe that the North American salvage vehicle auction industry volumes are affected primarily by accident rates, the age of the vehicle fleet on the road, miles driven, weather, the complexity of vehicles in operation, repair costs and recycled parts utilization. Vehicles deemed a total loss by automobile insurance companies represent the largest category of vehicles sold in the salvage vehicle auction industry. As vehicle design becomes more complex with additional enhancements, such as airbags and electrical components, vehicles are more costly to repair following an accident and insurance companies are more likely to declare a damaged vehicle a total loss. In addition, the utilization of recycled parts from salvage vehicles by the collision repair industry continues to increase as the quality of these parts gains wider acceptance and insurance companies attempt to reduce their repair claim costs. We believe that salvage volumes will continue to grow for the foreseeable future as the number of total loss vehicles increases.
Consolidated Whole Car and Salvage Auction Markets
The North American used vehicle auction market is largely consolidated. We estimate that Manheim, a subsidiary of Cox Enterprises, and ADESA together represent approximately 70% of the North American whole car auction market. We estimate that ADESA represents approximately 28% of the North American whole car auction market. The North American salvage vehicle auction market is also largely consolidated with the top two competitors, IAA and Copart, Inc., together representing over 80% of the market.
Our Business Strategy
The Company has a comprehensive strategy that leverages KAR’s unique collection of assets, proven track record with commercial sellers, extensive North American physical footprint, global network of customers and unique set of transaction data. The Company’s strategy for the future builds on this base, and we believe it will enable the Company to meet new opportunities emerging in the automotive remarketing industry, which is being impacted by several meaningful trends, including:
|
•
|
Remarketing channels and systems that are increasingly becoming more interconnected;
|
|
•
|
An increase in customer demand and dependency on data in buying and selling decisions; and
|
|
•
|
Rapidly advancing technology with opportunity for application in the remarketing industry.
|
KAR is focused on expanding our end-to-end remarketing platform across the used vehicle industry through innovation, data science, and a strategic physical footprint. We have invested in technology and talent and deployed a suite of complementary online, digital and mobile capabilities that we believe will simplify and streamline the buying and selling experience for our customers. Additionally we believe our unique, integrated platform of whole car, salvage, and finance solutions deliver differentiated value to customers across North America, and positions the Company for further growth around the globe. To execute our strategy of providing the best remarketing venue and analytical evidence for every vehicle, while generating value for our shareholders and customers, we intend to focus on the following strategic initiatives:
|
•
|
Extend and integrate our platform
|
|
•
|
Leverage unique data and analytic capabilities
|
|
•
|
Continue to improve operating efficiency
|
5
|
•
|
Using excess cash flow to invest in strategic growth initiatives and return capital to shareholders
|
Extend and Integrate Our Platform
We believe that the Company’s collection of 260 whole car and salvage auction sites, along with their online counterparts, makes us uniquely qualified to provide the best set of remarketing marketplaces for our customers. Additionally, these venues provide the opportunity to anchor further expansion and growth of the catalog of integrated ancillary and related services offered by the Company. We are therefore focused on the following strategies to further extend and integrate our platform.
|
•
|
Establishing Physical Auction Presence in Key Automotive Marketplaces
: The Company is focused on expanding its physical auction footprint into key markets where there is opportunity for growth and meaningful customer demand for greater choice, technology, and integrated remarketing solutions. These geographies also provide a platform for the regional deployment and expansion of the Company’s other ancillary and related services, as well as enhancing AFC's floorplan financing to independent used vehicle dealers. In 2016, the Company completed acquisitions or opened new physical sites as follows:
|
|
◦
|
Brasher’s Auto Auctions: adding eight auction locations and Brasher’s floorplan financing business to the ADESA and AFC business units and establishing the Company’s physical presence in northern California, Oregon, Washington, Utah and Washington.
|
|
◦
|
Sanford Auto Dealers Exchange: establishing the Company’s presence in the Orlando and central Florida marketplaces.
|
|
◦
|
Flint Auto Auction: located in the Detroit metropolitan area serving customers in Michigan, Ohio, Indiana and Illinois.
|
|
◦
|
ADESA Chicago: KAR successfully opened a new used car auction site in Chicago in October 2016. Chicago is one of the largest automotive markets in the U.S. The Company now delivers the full range of whole car, salvage, and financing solutions in the Chicago marketplace.
|
|
•
|
Expanding Opportunities for Customers to Buy and Sell Online
: We are focused on enhancing our Internet solutions in all of the key channels in which we operate, and we will continue to invest in technology platforms in order to capitalize on new opportunities and attract new customers. Online vehicle remarketing solutions provide the opportunity to improve the customer experience, expand our volume of transactions and potentially increase proceeds for sellers through greater buyer participation at auctions. Online buying activity continues to accelerate and represents an increasing portion of wholesale transactions across the industry. Providing consistent, accurate and user-friendly online solutions remains a strategic priority. Advancing our online solutions allows us to connect more effectively with our current customers and engage with a broader range of geographically diverse customers.
|
We acquired Openlane in order to better capitalize on the increasing use of the Internet as a means to purchase wholesale vehicles. Powered by Openlane technology, ADESA offers comprehensive private label remarketing solutions to automobile manufacturers, captive finance companies, lease and daily rental car companies, financial institutions and wholesale automobile auctions throughout the United States and Canada. IAA is the only national salvage auction company that offers buyers both live and Internet purchasing opportunities. ADESA provides online solutions to sell vehicles directly from a dealership or other interim storage location (upstream selling); online solutions to offer vehicles for sale while in transit to auction locations (midstream selling); simultaneously broadcasting video and audio of the physical auctions to online bidders (LiveBlock® ); and bulletin-board or real-time online auctions (DealerBlock® ).
We will continue to make investments in our online technology to enhance the selling and buying experience for our customers. These investments involve creating a more streamlined user experience and embedding additional Company capabilities and offerings within our online tools.
|
•
|
Expanding our International Presence
: In both our whole car and salvage vehicle businesses, we have experience managing a global buyer base with relationships in over 110 countries. We believe we are well positioned to grow internationally. We continue to identify opportunities to expand certain of our service offerings globally. We expect that our ability to efficiently layer in our product and technology licensing will allow us to enter other mature auction markets.
|
In 2016, the Company acquired GRS Remarketing Limited, a subsidiary of Greenhous Group Limited. GRS is a U.K.-based remarketing business with robust technology, effective operations and relationships with commercial customers. We believe GRS’ technology platform will complement our physical auction presence to bring U.K. customers
6
additional value and choice. The Company has renamed GRS to ADESA Remarketing Limited to help bring additional awareness, brand recognition and interest to the Company’s whole-car auction solution.
Also in 2016, TradeRev U.K. announced a partnership with Arval to provide upstream remarketing services for a luxury segment of the leasing firm’s U.K. portfolio. KAR business unit ADESA holds a 50 percent stake in TradeRev. The Company believes this partnership is strategically complementary to the GRS acquisition and will help build a platform to bring additional KAR services to the U.K. and position ADESA Remarketing Limited in the active European marketplace.
|
•
|
Develop alternative marketplaces
: The Company is identifying innovative venues for the exchange of used vehicles through internal development, targeted partnerships and acquisitions.
|
Leverage Unique Data and Analytic Capabilities
The Company has observed increased demand from commercial customers (e.g., OEMs, insurance companies, finance companies, rental companies, large dealer groups, etc.) for more sophisticated, data-driven, end-to-end remarketing solutions. Specifically, customers are seeking tools, technology and information that simplify the auction process and help them make more efficient and better-informed buying and selling decisions. As a result, the Company continues to invest in both its data analytics capabilities and leadership. The Company’s newly-formed data science team aggregates the Company’s broad and unique data set captured through millions of auction transactions and ancillary and related services performed each year. As customer expectations and dependence on data continue to increase and evolve, the Company will further develop its data analytic capabilities.
Continue to Improve Operating Efficiency
We continue to focus on reducing costs by optimizing efficiency at each of our auction locations and consolidating certain management functions. A number of initiatives have been implemented, which have streamlined operations and improved operating efficiencies. As part of these initiatives, we introduced a management operating system to actively monitor and manage staffing levels and, as a result, have realized additional labor efficiency gains.
The Company is highly focused on integrating the newly acquired sites and facilities from its 2016 acquisitions. Since the time of acquisition, work has been underway to evaluate the sites and assess their current levels of performance, resources, and productivity and ensure they are operating as efficiently and effectively as possible. Where practical and beneficial, the Company will implement its data-driven and efficiency-based operating model that has been successful at our existing auction locations. We expect this work to continue through 2017 and into 2018.
The company also introduced two internal technology and communication tools to help connect our 17,400 employees and foster greater collaboration, innovation, and sharing of expertise and best practices across our locations and businesses. By streamlining the employee and manager experience, we believe we will be able to return additional productive hours to employees. Additionally, the Company launched a new internal communications tool that provides communication, information sharing, and virtual collaboration space across our businesses.
Using Excess Cash Flow to Invest in Strategic Growth Initiatives and Return Capital to Shareholders
We generate strong cash flows as a result of our attractive margins, the ability to leverage our corporate infrastructure across our multiple auction locations, relatively low levels of capital expenditures and limited working capital requirements. Management plans to utilize excess cash generated by the business to invest in strategic growth initiatives and return capital to shareholders. We generated $360.8 million and $475.0 million of cash flow from operations for the twelve months ended December 31, 2016 and 2015, respectively. After paying any future dividends to shareholders (subject to prior declaration by our board of directors), we expect that significant cash flow will remain to support growth initiatives or return additional capital to shareholders.
Selective acquisitions and greenfield expansion represent possible growth initiatives. Increased demand for single source solutions by our customers and other factors may increase our opportunities to acquire competitors. Both ADESA and IAA have a strong record of acquiring and integrating independent auction operations and improving profitability. We will continue to evaluate opportunities to open and acquire new sites in selected markets in order to effectively leverage our sales and marketing capabilities and expand our buyer base and geographic presence for both ADESA and IAA. In addition, we may pursue opportunities to acquire additional product offerings in each of our business segments.
7
We paid cash dividends to shareholders of $157.1 million and $151.9 million for the years ended December 31, 2016 and 2015, respectively. In addition, we paid $80.4 million and $227.6 million for the years ended December 31, 2016 and 2015, respectively, to repurchase and retire shares of our common stock.
Our Business Segments
We operate as three reportable business segments: ADESA Auctions, IAA and AFC. Our revenues for the year ended
December 31, 2016
were distributed as follows: ADESA 56%, IAA 35% and AFC 9%. No single customer accounted for more than 10% of our total revenue, including seller, buyer, ancillary and other related services revenue. Geographic information as well as comparative segment revenues and related financial information pertaining to ADESA, IAA and AFC for the years ended
December 31, 2016
,
2015
and
2014
are presented in the tables in Note 18,
Segment Information,
to the Consolidated Financial Statements for KAR Auction Services, Inc., which are included under Item 8 in this Annual Report on Form 10-K.
ADESA
Overview
We are the second largest provider of whole car auctions and related services to the vehicle remarketing industry in North America. We serve our customer base through online auctions and auction facilities that are developed and strategically located to draw professional sellers and buyers together and allow the buyers to inspect and compare vehicles remotely via ADESA.com or in person. Our online service offerings include ADESA.com, LiveBlock and DealerBlock and allow us to offer vehicles for sale from any location. ADESA also includes ADESA Remarketing Limited, an online whole car vehicle remarketing business in the United Kingdom.
Vehicles available at our auctions include vehicles from institutional customers such as off-lease vehicles, repossessed vehicles, rental vehicles and other program fleet vehicles that have reached a predetermined age or mileage and have been repurchased by the manufacturers, as well as vehicles from used vehicle dealers turning their inventory. The number of vehicles offered for sale at auction is the key driver of our costs incurred in the whole car auction process, and the number of vehicles sold is the key driver of the related fees generated by the remarketing process.
We offer both online and physical auctions as well as value-enhancing ancillary services in an effective and efficient manner to maximize returns for the sellers of used vehicles. We quickly transfer the vehicles and ownership to the buyer and the net funds to the seller. Vehicles are typically offered for sale at the physical auctions on at least a weekly basis at most locations and the auctions are simulcast over the Internet with streaming audio and video (LiveBlock) so that remote bidders can participate via our online products. Our online auctions (DealerBlock) function 24 hours a day, 7 days a week, providing our customers with maximum exposure for their vehicles and the flexibility to offer vehicles at "buy now" prices or in auctions that last for a few hours, days or even weeks. We also provide customized "private label" selling systems (including "buy now" functionality as well as online auctions) for our customers, primarily utilizing technology acquired with the purchase of Openlane.
We generate revenue primarily from auction fees paid by vehicle buyers and sellers, as well as fees from related services. Generally, we do not take title to or bear the risk of loss for vehicles sold at whole car auctions. Our buyer fees and dealer seller fees are typically based on a tiered structure with fees increasing with the sale price of the vehicle, while institutional seller fees are typically fixed. We add buyer fees to the gross sales price paid by buyers for each vehicle, and generally customers do not receive title or possession of vehicles after purchase until payment is received, proof of floorplan financing is provided or credit is approved. We generally deduct seller fees and other ancillary service fees to sellers from the gross sales price of each vehicle before remitting the net amount to the seller.
Customers
Suppliers of vehicles to our whole car auctions primarily include (i) large institutions, such as vehicle manufacturers and their captive finance arms, vehicle rental companies, financial institutions, and commercial fleets and fleet management companies (collectively "institutional customers"); and (ii) franchised and independent used vehicle dealers (collectively "dealer customers"). Buyers of vehicles at our whole car auctions primarily include franchised and independent used vehicle dealers.
8
Services
Our whole car auctions also provide a full range of innovative and value-added services to sellers and buyers that enable us to serve as a "one-stop shop." Many of these services may be provided or purchased independently from the auction process, including:
|
Services
|
|
Description
|
|
Auction Related Services
|
|
ADESA provides marketing and advertising for the vehicles to be auctioned, dealer registration, storage of consigned and purchased inventory, clearing of funds, arbitration of disputes, auction vehicle registration, condition report processing, photo services, post-sale inspections, security for consigned inventory, title processing, sales results reports, pre-sale lineups and auctioning of vehicles by licensed auctioneers.
|
|
Transportation Services
|
|
We provide both inbound (pickup) and outbound (delivery) transportation services utilizing our own equipment and personnel as well as licensed and insured third party carriers. Through our subsidiary, CarsArrive and its Internet-based system which provides automated vehicle shipping services, customers can instantly review price quotes and delivery times, and vehicle transporters can check available loads and also receive instant notification of available shipments. The same system is utilized at our whole car auction locations.
|
|
Reconditioning Services
|
|
Our auctions provide detailing, body work, paintless dent repair ("PDR"), light mechanical work, glass repair, tire and key replacement and upholstery repair. Key replacement services are primarily provided by our subsidiary, HTL.
|
|
Inspection Services Provided By AutoVIN
|
|
AutoVIN provides vehicle condition reporting, inventory verification auditing, program compliance auditing and facility inspections. Field managers are equipped with handheld computers and digital cameras to record all inspection and audit data on-site. The same technology is utilized at our whole car auction locations and we believe that the expanded utilization of comprehensive vehicle condition reports with pictures facilitates dealers sourcing vehicles via the Internet.
|
|
Title and Repossession Administration and Remarketing Services
|
|
PAR provides end-to-end management of the remarketing process including titling, repossession administration, inventory management, auction selection, pricing and representation of the vehicles at auction for those customers seeking to outsource all or just a portion of their remarketing needs. Recovery Database Network, Inc. ("RDN") is a specialized provider of B2B software and data solutions for automotive lenders and repossession companies.
|
|
Vehicle Research Services Provided by Autoniq
|
Autoniq provides dealers real-time vehicle information such as pricing, history reports and market guides. Its mobile app allows used car dealers to scan VINs on mobile devices, view auction run lists and access vehicle history reports and market value reports instantly. Autoniq offers access to valued resources such as CARFAX and AutoCheck, as well as Black Book Daily, NADA guides, Kelley Blue Book and Galves pricing guide information. It also includes a comprehensive wholesale and retail market report for all markets in the United States.
|
|
|
ADESA Analytical Services
|
|
ADESA Analytical Services provides value-added market analysis to our customers and the media. These services include access to publications and custom analysis of wholesale market trends for ADESA's customers, including peer group and market benchmarking studies, analysis of the benefits of reconditioning, site selection for optimized remarketing of vehicles, portfolio analysis of auction sales and computer-generated mapping and buyer analysis.
|
Sales and Marketing
Our sales and marketing approach at ADESA is to develop strong relationships and interactive dialogue with our customers. We have relationship managers for the various institutional customers, including vehicle manufacturers, fleet companies, rental car companies, finance companies and others. These relationship managers focus on current trends and customer needs for their respective customers in order to better coordinate our sales effort and service offerings.
Managers of individual auction locations are ultimately responsible for providing services to the institutional customers whose vehicles are directed to the auctions by the corporate sales team. Developing and servicing the largest possible population of buying dealers for the vehicles consigned for sale at each auction is integral to maximizing value for our vehicle suppliers.
9
We have local auction sales representatives who have experience in the used vehicle business and an intimate knowledge of local markets. These local representatives focus on the dealer segment and are complemented by local telesales representatives and are managed by a corporate-level team focused on developing and implementing standard best practices and expanding relationships with major dealer groups. We believe this combination of a centralized structure with decentralized resources enhances relationships with the dealer community and may further increase dealer consignment business at our auctions.
Through our ADESA Analytical Services department, we also provide market analysis to our customers, as they use analytical techniques in making their remarketing decisions.
Online Solutions
Our current ADESA online solutions include:
|
Proprietary ADESA Technology
|
|
Description
|
|
ADESA.com and ADESA DealerBlock®
|
|
This platform provides for either real-time or "bulletin-board" online auctions of consigned inventory at physical auction locations and is powered by Openlane technology. We also utilize this platform to provide upstream and midstream selling capabilities for our consignors, which facilitate the sale of vehicles prior to their arrival at a physical auction site. Auctions can be either closed (restricted to certain eligible dealers) or open (available to all eligible dealers) and inventory feeds of vehicles are automated with many customers' systems as well as third party providers that are integrated with various dealer management systems. Oftentimes, the upstream and midstream closed sales are "private-labeled" for the consignors.
|
|
ADESA LiveBlock®
|
|
Our live auction Internet bidding solution, ADESA LiveBlock®, operates in concert with our physical auctions and provides registered buyers with the opportunity to participate in live auctions. Potential buyers bid online in real time along with the live local bidders and other Internet bidders via a simple, web-based interface. ADESA LiveBlock® provides real-time streaming audio and video from the live auction and still images of vehicles and other data. Buyers inspect and evaluate the vehicle and listen to the live call of the auctioneer while viewing the physical auction that is underway.
|
|
ADESA Run List®
|
|
Provides a summary of consigned vehicles offered for auction sale, allowing dealers to preview inventory and vehicle condition reports prior to an auction event.
|
|
ADESA Market Guide®
|
|
Provides wholesale auction prices, auction sales results, market data and vehicle condition information.
|
|
ADESA Virtual Inventory
|
|
Subscription-based service to allow dealers to embed ADESA's search technology into a dealer's website to increase the number of vehicles advertised by the dealer.
|
Competition
In the North American whole car auction industry, we compete with Manheim, a subsidiary of Cox Enterprises, Inc., OVE.com (Manheim's "Online Vehicle Exchange"), RMS Automotive (a subsidiary of Cox Enterprises, Inc.), SmartAuction, as well as several smaller chains of auctions and independent auctions, some of which are affiliated through their membership in industry associations, and auctions held by retail dealers. In the United States, competition is strongest with Manheim for the supply of used vehicles from national institutional customers. In Canada, we are the largest provider of whole car vehicle auction services. The supply of vehicles from dealers is dispersed among all of the auctions in the used vehicle market.
Due to the increased viability of the Internet as a marketing and distribution channel, new competition has arisen from Internet-based companies and our own customers who have historically remarketed vehicles through various channels, including auctions. Direct sales of vehicles by institutional customers and large dealer groups through internally developed or third-party online platforms have largely replaced telephonic and other non-auction methods, becoming a significant portion of overall used vehicle remarketing. The extent of use of direct, online systems varies by customer. In addition, we and some of our competitors offer online auctions in connection with physical auctions, and other online companies now include used vehicles among the products offered at their auctions.
10
IAA
Overview
As one of the leading providers of total loss solutions and salvage vehicle auctions, we operate as IAA in the United States and Impact Auto Auctions in Canada and serve our customer base through salvage auction locations throughout North America. We facilitate the remarketing of vehicles for a variety of sellers, including insurance companies, dealerships, rental car companies, fleet lease companies and charitable organizations. Our auctions provide buyers from around the globe with the salvage vehicles they need to fulfill their scrap demand, replacement part inventory or vehicle rebuild requirements. Fees for our services are earned from both sellers and buyers of salvage vehicles.
IAA processes salvage vehicles primarily on a consignment basis. In return for agreed-upon fees, vehicles are sold on behalf of our sellers, which continue to own the vehicle until it is sold to buyers at auction. Other services available to vehicle sellers, for which fees may be charged, include towing, total loss claims solutions (as described below), title processing, inspection services, marketing and other administrative services. Under all methods of sale, we also charge fees to the buyer of each vehicle based on a tiered structure that increases with the sale price of the vehicle as well as fixed fees for other services.
Auctions are typically held weekly at most locations. Vehicles are marketed at each respective auction site to live bidders as well as to online bidders via IAA's dual platform auction model. In addition, auction listings are available online, allowing prospective bidders to preview and bid on vehicles prior to the actual auction event. IAA's Auction Center feature provides Internet buyers with an open, competitive bidding environment that reflects the dynamics of a live salvage auction. The Auction Center includes such services as comprehensive auction lists featuring links to digital images of vehicles available for sale, a "Find a Vehicle" function that promotes the search for specific vehicles within the auction system and special auction notifications such as "Rental," "Classic," or "Motorcycles." Higher prices at auction are generally driven by broader market exposure and increased competitive bidding. Our mobile device applications provide great flexibility for buyers who interact with our auctions. In addition, our mobile applications are designed for the latest handheld devices, including Apple and Android, and are optimized for the most recent operating systems.
Tools and services focused on total loss claims have been developed to assist insurance consignors in improving policy holder satisfaction and more effectively managing costs during the total loss claims process. Further building upon the IAA Total Loss Solutions® suite of products launched with IAA Inspection Services™ and IAA Title Services™ in 2015, IAA launched an additional five product offerings within the suite of products in 2016. The new products and services deliver additional cycle time reduction, further provide transparency for the insured, and greater integrate within IAA’s flagship salvage management tool, CSAToday®. Through IAA's auction model, vehicles are offered simultaneously to live and online buyers in a live auction format utilizing i-Bid LIVE
SM
. We believe the capability of the auction models maximizes auction proceeds and returns to our customers. First, the physical auctions allow buyers to inspect and compare the vehicles, enabling them to make fully-informed bidding decisions. These physical auction abilities are an important part of the bidding process. Second, our Internet auction capabilities allow buyers to participate in a greater number of auctions than if physical attendance was required. Online inventory browsing and digital alerts (via email or through buyer app) reduce the time required to acquire vehicles.
In June 2015, we acquired HBC, a salvage vehicle auction business operating in the United Kingdom. HBC provides salvage collection and disposal services for the U.K.'s top insurance, fleet and accident management companies, and conducts business using a variety of sales channels, including online auctions. HBC's business model differs from that of IAA, as the majority of HBC's vehicles are sold under purchase contracts, rather than under consignment.
Services
IAA offers a comprehensive suite of auction, logistics and vehicle selling services aimed at maximizing the value of vehicles sold at auction, lowering administrative costs, shortening the selling cycle and increasing the predictability of returns to vehicle sellers. This is achieved while expanding IAA's ability to handle an increasing proportion of the vehicle-processing function as a "one-stop shop" for sellers. Some of the services provided by IAA include:
11
|
Services
|
|
Description
|
|
Live and Live Online Auction Model
|
|
Vehicles are offered simultaneously to live and online buyers in a live auction format utilizing i-Bid LIVE
SM
technology. We believe this exposes the vehicles to the maximum number of potential buyers.
|
|
Total Loss Solutions
TM
|
Provides insurance companies with outsource solutions for the portion of the claims process prior to total loss determination and assignment to a salvage auction. The suite of products includes vehicle inspection and title procurement services that help insurance companies reduce cycle time and cost, while improving employee engagement, ultimately increasing policyholder retention.
|
|
|
Catastrophe (CAT) Services
|
|
IAA’s Catastrophe Services is a key offering to our insurance clients. Catastrophic weather events can cause extensive damage, often resulting in thousands of total-loss vehicles. Our CAT services philosophy is built upon a three-tier approach; pre-CAT planning, on-scene response and effective post-CAT management. To provide our insurance carrier partner with the highest level of service, we carefully track storm patterns and have response teams ready when disaster strikes. In the event of a catastrophe, IAA draws from an established network of partners to securing towing services and storage space. A mobile CAT Command Center as well as dedicated IAA staff serve as an on-the-go, centralized point of crisis management. When the vehicles are ready for sale, we promote them to our global buyer base with targeted marketing efforts for efficient sale and file closure.
|
|
Vehicle Inspection Centers
|
|
We maintain vehicle inspection centers ("VIC") at many of our facilities. A VIC is a temporary storage and inspection facility located at one of our sites that is operated by the insurance company. Some of these sites are formalized through temporary license agreements with the insurance companies that supply the vehicles. Having a VIC minimizes vehicle storage charges incurred by insurance company suppliers at the temporary storage facility or repair shop and also improves service time for the policyholder.
|
|
Transportation and Towing
|
|
Inbound logistics administration with actual services typically provided by third-party carriers.
|
|
Remarketing Market
|
|
Focuses on vehicles, rental sellers, fleet and leasing companies, banks and dealer trade-in inventory.
|
|
Donation Market
|
|
Processes vehicles for a variety of charitable organizations across the United States and Canada, assisting them in turning donated vehicles into cash to support their respective cause.
|
Customers
We obtain IAA's supply of vehicles from insurance companies, non-profit organizations, automobile dealers and vehicle leasing and rental car companies and the general public. We have established long-term relationships with virtually all of the major automobile insurance companies. The vast majority of the vehicles we process are on a consignment basis. The buyers of salvage vehicles include automotive body shops, rebuilders, used car dealers, automotive wholesalers, exporters, dismantlers, recyclers, brokers, and where allowed, non-licensed (public) buyers.
Sales and Marketing
The IAA sales force solicits prospective vehicle sellers and buyers at the national, regional and local levels. Branch managers address customer needs at the local level. We also participate in a number of local, regional and national trade show events that further promote the benefits of our products and services.
In addition to providing sellers with a means of processing and selling vehicles, IAA offers a comprehensive suite of services to help maximize returns and shorten the selling and processing time. We help establish workflow integration within our sellers' processes, and view such mutually beneficial relationships as an essential component of our effort to attract and retain suppliers.
By analyzing industry data, we provide sellers with a detailed analysis of their current selling prices and returns, and a proposal detailing methods to improve selling prices and returns, reduce administrative costs and provide proprietary turn-key selling and processing services.
We also focus on expanding our seller relationships through recommendations from customers at the local level to other local offices of the same company. Our broad and industry leading geographic coverage allows us to service sellers on a national basis.
12
Online Solutions
Our current IAA online solutions include:
|
Proprietary IAA Technology
|
|
Description
|
|
i-Bid LIVE
SM
|
|
Our live auction Internet bidding solution, i-Bid LIVE, operates in concert with our physical auctions and provides registered buyers with the opportunity to participate in live auctions. Potential buyers bid online in real time along with the live local bidders and other Internet bidders via a simple, web-based interface. In addition, i-Bid LIVE provides real-time streaming audio from the live auction and images of salvage vehicles and other data. Buyers inspect and evaluate the salvage vehicle and listen to the auction while it is underway.
|
|
I-Buy Fast
SM
|
|
I-Buy Fast is an immediate buying option that allows qualified buyers to purchase vehicles between auctions for a fixed price. Each I-Buy Fast vehicle first runs at a previous auction where an established reserve price was not met.
|
|
CSAToday®
|
|
The process of salvage disposition through our system begins when a vehicle seller first consigns the vehicle to be sold through IAA via a variety of factors including a total loss, a recovered theft, a vehicle donation, a fleet vehicle retired, a vehicle repossessed, etc. A seller representative consigns the vehicle to us, either by phone, facsimile or electronically through CSAToday, our online proprietary salvage inventory management system.
|
|
With CSAToday, vehicle sellers enter vehicle data electronically and then track and manage the progress of vehicles in terms of both time and sales price. With this tool, they have 24-hour access to their vehicles. The information provided through this system ranges from the details associated with a specific vehicle, to comprehensive management reports for an entire area or geographic region. Additional features of this system include inventory management tools and a powerful new IAA Market Value
TM
tool that helps customers determine the approximate value of a potential vehicle. This tool is helpful to adjusters when evaluating the "repair vs. total" decision. The management tools provided by CSAToday enable seller personnel to monitor and manage their vehicles more effectively. For example, insurance company sellers can also use CSAToday to view original garage receipts, verify ignition key availability, view settlement documents and images of the vehicles and receive updates of other current meaningful data.
|
||
|
Automated Salvage Auction Processing (ASAP)
|
|
We have developed a proprietary web-based information system, Automated Salvage Auction Processing system, or ASAP, to streamline all aspects of our operations and centralize operational data collection. The system provides sellers with 24-hour online access to powerful tools to manage the salvage disposition process, including inventory management, sales price analysis and electronic data interchange of titling information.
|
|
Our other information systems, including i-Bid LIVE and CSAToday systems, are integrated with our ASAP product, facilitating seamless auction processes and information flow with internal operational systems. Our technology platform is a significant competitive advantage that allows us to efficiently manage our business, improve customer selling prices, shorten customers' selling cycle and lower our customers' administration costs.
|
||
Competition
In the salvage sector, the competition includes Copart; Total Resource Auctions, a subsidiary of Cox Enterprises, Inc.; independent auctions, some of which are affiliated through their membership in industry organizations to provide broader coverage through network relationships; and a limited number of used vehicle auctions that regularly remarket salvage vehicles. Additionally, some dismantlers of salvage vehicles such as LKQ Corporation and Internet-based companies have entered the market, thus providing alternate avenues for sellers to remarket vehicles. While most insurance companies have abandoned or reduced efforts to sell salvage vehicles without the use of service providers such as us, they may in the future decide to dispose of their vehicles directly to end users.
In Canada, we are the largest provider of salvage vehicle auction services. Our competitors include Copart, independent vehicle auctions, brokers, online auction companies, and vehicle recyclers and dismantlers.
13
AFC
Overview
We are a leading provider of floorplan financing to independent used vehicle dealers. We provide short-term inventory-secured financing, known as floorplan financing, to independent used vehicle dealers through branches throughout North America. In
2016
, AFC serviced over 1.7 million loan transactions, which includes both loans paid off and loans extended, or curtailed. We sell the majority of our U.S. dollar-denominated finance receivables without recourse to a wholly-owned bankruptcy remote special purpose entity, which sells an undivided participation interest in such finance receivables to a group of bank purchasers on a revolving basis. We also securitize the majority of our Canadian dollar denominated finance receivables through a separate third-party facility. We generate a significant portion of our revenues from fees. These fees include origination, floorplan, curtailment and other related program fees. When the loan is extended or paid in full, AFC collects all accrued fees and interest.
In June 2013, we acquired Preferred Warranties, Inc., a vehicle service contract business, as part of our strategy to provide new services to independent used vehicle dealers. We receive advance payments for the vehicle service contracts and unearned revenue is deferred and recognized over the terms of the contracts, which range from 3 months to 7 years, on an individual contract basis. The average term of these contracts originated in 2016 was approximately 1.6 years. We currently purchase program insurance which provides for satisfaction of certain of the Company's vehicle service contracts related liabilities in the event the Company is unable to perform under the terms of specific vehicle service contracts covered by program insurance.
Customers and Locations
Floorplan financing supports independent used vehicle dealers in North America who purchase vehicles from our auctions, other auctions and non-auction purchases. In
2016
, over 83% of the vehicles floorplanned by AFC were vehicles purchased by dealers at auction. Our ability to provide floorplan financing facilitates the growth of vehicle sales at auction. As of
December 31, 2016
, we serviced auctions through
126
locations which are conveniently located at or within close proximity of auctions held by ADESA and other auctions, which allows dealers to reduce transaction time by providing immediate payment for vehicles purchased at auction. We provide availability lists on behalf of our customers to auction representatives regarding the financing capacity of our customers, thereby increasing the purchasing potential at auctions. In addition, we have the ability to send finance representatives on-site to most approved independent auctions during auction sale-days, as well as maintaining a presence at the ADESA auctions. Geographic proximity to the customers gives our employees the ability to stay in close contact with outstanding accounts, thereby better enabling them to manage credit risk.
As of
December 31, 2016
, AFC had approximately 12,200 active dealers with an average line of credit of approximately $260,000 and no one dealer representing greater than 1.3% of our portfolio. An average of approximately 15 vehicles per active dealer was floorplanned with an approximate average value outstanding of $9,500 per vehicle as of
December 31, 2016
.
Sales and Marketing
AFC approaches and seeks to expand its share of the independent dealer floorplan market through a number of methods and channels. We target and solicit new dealers through both direct sales efforts at the dealer's place of business as well as auction-based sales and customer service representatives, who service our dealers at auctions where they replenish and rotate vehicle inventory. These largely local efforts are handled by branch managers, branch personnel and dealer sales managers. AFC's corporate-level team and Business Development Center provide sales and marketing support to AFC field personnel by helping to identify target dealers and coordinating promotional activity with auctions and other vehicle supply sources.
Credit
Our procedures and proprietary computer-based system enable us to manage our credit risk by tracking each vehicle from origination to payoff, while expediting services through our branch network. Typically, we assess a floorplan fee at the inception of a loan and we collect all accrued fees and interest when the loan is extended or repaid in full. In addition, AFC generally holds the title or other evidence of ownership to all vehicles which are floorplanned. Typical loan terms are 30 to 90 days, each with a possible loan extension. For an additional fee, this loan extension allows the dealer to extend the duration of the loan beyond the original term for another 30 to 90 days if the dealer makes payment towards principal and pays accrued fees and interest.
14
The extension of a credit line to a dealer starts with the underwriting process. Credit lines up to $500,000 are extended using a proprietary scoring model developed internally by AFC. Credit lines in excess of $500,000 may be extended using underwriting guidelines which generally require dealership and personal financial statements, monthly bank statement, sales reports and tax returns. The underwriting of each line of credit requires an analysis, write-up and recommendation by the credit department and, in case of credit lines in excess of $500,000, final review by a credit committee.
Collateral Management
Collateral management is an integral part of daily operations at each AFC branch and our corporate headquarters. AFC's proprietary computer-based system facilitates this daily collateral management by providing real-time access to dealer information and enables branch and corporate personnel to assess and manage potential collection issues. Restrictions are automatically placed on customer accounts in the event of a delinquency, payments by dealers from bank accounts with insufficient funds or poor audit results. Branch personnel are proactive in managing collateral by monitoring loans and notifying dealers that payments are coming due. In addition, over 81,000 routine audits, or lot checks, are performed annually on the dealers' lots through our AutoVIN subsidiary. Poor results from lot checks typically require branch personnel to take actions to determine the status of missing collateral, including visiting the dealer personally, verifying units held off-site and collecting payments for units sold. Audits also identify troubled accounts, triggering the involvement of AFC's collections department.
AFC operates three divisions which are organized into fourteen regions in North America. Each division and region is monitored by managers who oversee daily operations. At the corporate level, AFC employs full-time collection specialists and collection attorneys who are assigned to specific regions and monitor collection activity for these areas. Collection specialists work closely with the branches to track trends before an account becomes a troubled account and to determine, together with collection attorneys, the best strategy to secure the collateral once a troubled account is identified.
Securitization
AFC sells the majority of its U.S. dollar denominated finance receivables on a revolving basis and without recourse to a wholly-owned, bankruptcy remote, consolidated, special purpose subsidiary ("AFC Funding Corporation"), established for the purpose of purchasing AFC's finance receivables. A securitization agreement allows for the revolving sale by AFC Funding Corporation to a group of bank purchasers of undivided interests in certain finance receivables subject to committed liquidity. AFC's securitization facility has been in place since 1996. AFC Funding Corporation had a committed facility of
$1.50 billion
from a third party facility for U.S. finance receivables at
December 31, 2016
. The agreement expires on
January 31, 2020
.
We also have an agreement in place for the securitization of Automotive Finance Canada Inc.'s ("AFCI") receivables. This securitization facility provides up to
C$125 million
in financing for eligible finance receivables through a third party conduit (separate from the U.S. facility). The agreement expires on
January 31, 2020
. The receivables sold pursuant to both the U.S. and Canadian securitization agreements are accounted for as secured borrowings.
Competition
AFC primarily provides short-term dealer floorplan financing of wholesale vehicles to independent vehicle dealers in North America. At the national level, AFC's competition includes NextGear Capital, a subsidiary of Cox Enterprises, Inc., other specialty lenders, banks and financial institutions. At the local level, AFC faces competition from banks, credit unions and independent auctions who may offer floorplan financing to local auction customers. Such entities typically service only one or a small number of auctions.
Some of our industry competitors who operate whole car auctions on a national scale may endeavor to capture a larger portion of the floorplan financing market. AFC competes primarily on the basis of quality of service, convenience of payment, scope of services offered and historical and consistent commitment to the sector. Our long-term relationships with customers have been established over time and act as a competitive strength for us.
15
Seasonality
The volume of vehicles sold through our auctions generally fluctuates from quarter to quarter. This seasonality is caused by several factors including weather, the timing of used vehicles available for sale from selling customers, the availability and quality of salvage vehicles, holidays, and the seasonality of the retail market for used vehicles, which affects the demand side of the auction industry. Used vehicle auction volumes tend to decline during prolonged periods of winter weather conditions. In addition, mild weather conditions and decreases in traffic volume can each lead to a decline in the available supply of salvage vehicles because fewer traffic accidents occur, resulting in fewer damaged vehicles overall. As a result, revenues and operating expenses related to volume will fluctuate accordingly on a quarterly basis. The fourth calendar quarter typically experiences lower used vehicle auction volume as well as additional costs associated with the holidays and winter weather.
Vehicle and Lending Regulation
Our operations are subject to regulation, supervision and licensing under various federal, state, provincial and local authorities, agencies, statutes and ordinances, which, among other things, require us to obtain and maintain certain licenses, permits and qualifications, provide certain disclosures and notices and limit interest rates, fees and other charges. Some examples of the regulations and laws that impact our company are included in Item 1A "Risk Factors" under the risk: "We are subject to extensive governmental regulations, including vehicle brokerage and auction laws and currency reporting obligations. Our business is subject to risks related to litigation and regulatory actions."
Environmental Regulation
Our operations are subject to various foreign, federal, state and local environmental, health and safety laws and regulations, including those governing the emission or discharge of pollutants into the air or water, the generation, treatment, storage and release of hazardous materials and wastes and the investigation and remediation of contamination. Our failure to comply with current or future environmental, health or safety laws or to obtain and comply with permits required under such laws, could subject us to significant liability or require costly investigative, remedial or corrective actions.
In the used vehicle remarketing industry, large numbers of vehicles, including wrecked vehicles at salvage auctions, are stored and/or refurbished at auction facilities and during that time minor releases of fuel, motor oil and other materials may occur. We have investigated or remediated, or are currently investigating or remediating, contamination resulting from various sources, including gasoline, fuel additives (such as methyl tertiary butyl ether, or MTBE), motor oil, petroleum products and other hazardous materials released from aboveground or underground storage tanks or in connection with current or former operations conducted at our facilities. We have incurred, and may in the future incur, expenditures relating to releases of hazardous materials, investigative, remedial or corrective actions, claims by third parties and other environmental issues, and such expenditures, individually or in the aggregate, could be significant.
Federal and state environmental authorities are currently investigating IAA's role, if any, in contributing to contamination at the Lower Duwamish Waterway Superfund Site in Seattle, Washington. IAA's potential liability, if any, at this site cannot be estimated at this time. See Item 3, "Legal Proceedings" for a further discussion of this matter.
Management considers the likelihood of loss or the incurrence of a liability, as well as the ability to reasonably estimate the amount of loss, in determining loss contingencies. We accrue an estimated loss contingency when it is probable that a liability has been incurred and the amount of loss (or range of possible losses) can be reasonably estimated. Management regularly evaluates current information available to determine whether accrual amounts should be adjusted. Accruals for contingencies including environmental matters are included in "Other accrued expenses" at undiscounted amounts and exclude claims for recoveries from insurance or other third parties. These accruals are adjusted periodically as assessment and remediation efforts progress, or as additional technical or legal information becomes available. If the amount of an actual loss is greater than the amount accrued, this could have an adverse impact on our operating results in that period.
Employees
At
December 31, 2016
, we had a total of approximately 17,400 employees, of which approximately 12,900 were located in the U.S. and approximately 4,500 were located in Canada, Mexico and the United Kingdom. Approximately 75% of our workforce consists of full-time employees. Currently, none of our employees participate in collective bargaining agreements.
In addition to the employee workforce, we also utilize temporary labor services to assist in handling the vehicles consigned to us and to provide certain other services. Nearly all of our auctioneers are independent contractors. Some of the services we provide are outsourced to third party providers that perform the services either on-site or off-site. The use of third party providers depends upon the resources available at each auction facility as well as peaks in the volume of vehicles offered at auction.
16
Available Information
Our web address is www.karauctionservices.com. Our electronic filings with the Securities and Exchange Commission ("SEC") (including all Annual Reports on Form 10-K, Quarterly Reports on Form 10-Q, Current Reports on Form 8-K, and if applicable, amendments to those reports) are available free of charge on the website as soon as reasonably practicable after they are electronically filed with, or furnished to, the SEC. In addition, our Corporate Governance Guidelines, Code of Conduct and Ethics, Code of Ethics for Principal Executive and Senior Financial Officers and charters of the audit committee, the nominating and corporate governance committee, the risk committee and the compensation committee of our board of directors are available on our website and available in print to any shareholder who requests it. The information posted on our website is not incorporated into this Annual Report.
Any materials that we file with the SEC may be read and copied at the SEC's Public Reference Room at 100 F Street, N.E., Washington, D.C. 20549. Information on the operation of the Public Reference Room may be obtained by calling the SEC at 1-800-SEC-0330. In addition, the SEC maintains a website that contains reports, proxy statements and other information about issuers, like us, that file electronically with the SEC. The address of that site is www.sec.gov.
17
Investing in our Company involves a high degree of risk. You should carefully consider the following risk factors, as well as all of the other information contained in this Annual Report on Form 10-K, before deciding to invest in our Company. The occurrence of any of the following risks could materially and adversely affect our business, financial condition, prospects, results of operations and cash flows. In such case, the trading price of our common stock could decline and you could lose all or part of your investment. These risks are not the only ones we face. Additional risks and uncertainties not presently known to us or that we currently deem immaterial may also materially affect our business, financial condition, results of operations and prospects.
Risks Related to Our Business
We may not be successful in the implementation of our business strategy or we may improperly align new strategies with the Company’s vision, which could lead to the misapplication of Company resources.
Our strategy is to provide the best remarketing venue and analytical evidence for every vehicle. To execute our strategy, we are pursuing strategic initiatives that management considers critical to our long-term success, including but not limited to developing alternative marketplaces, establishing exceptional analytics capabilities, leveraging the Company's unique remarketing portfolio and data and growing the Company's buyer base. There are significant risks involved with the execution of these initiatives, including significant business, economic and competitive uncertainties, many of which are outside of our control. Accordingly, we cannot predict whether we will succeed in implementing these strategic initiatives. For example, if we are unsuccessful in continuing to generate significant cash provided by operations (we generated
$360.8 million
and
$475.0 million
of cash flow from operations for the years ended
December 31, 2016
and
2015
, respectively), we may be unable to reinvest in our business, return capital to shareholders or reduce our outstanding indebtedness, which could negatively affect our financial position and results of operations and our ability to execute our other strategies. It could take several years to realize any direct financial benefits from these initiatives, if any direct financial benefits from these initiatives are achieved at all. Additionally, our business strategy may change from time to time, which could delay our ability to implement initiatives that we believe are important to our business.
We may not properly leverage or make the appropriate investment in technology advancements, which could result in the loss of any sustainable competitive advantage in products, services and processes.
Our business is dependent on information technology. Robust information technology systems, platforms and products are critical to our operating environment, digital online products and competitive position. We may not be successful in structuring our information technology or developing, acquiring or implementing information systems which are competitive and responsive to the needs of our customers. We might lack sufficient resources to continue to make the significant investments in information technology to compete with our competitors. Certain information technology initiatives that management considers important to our long-term success will require capital investment, have significant risks associated with their execution, and could take several years to implement. We may not be able to develop/implement these initiatives in a cost-effective, timely manner or at all.
Cyber-security Environment
Information technology risks (including the confidentiality, integrity and availability of digital assets) for companies have significantly increased in recent years in part because of the proliferation of new technologies, the use of the Internet and telecommunications technologies to conduct financial transactions and the increased sophistication and activities of organized crime, hackers, terrorists and other external parties. These threats may derive from fraud or malice on the part of our employees or third parties, or may result from human error or accidental technological failure. Our customers and other parties in the payments value chain rely on our digital online products as well as other information technologies, computers, software and networks to conduct their operations. In addition, to access our online products and services, our customers increasingly use personal smartphones, tablet PCs and other mobile devices that may be beyond our control.
We are subject to cyber-threats and our information technology has been subject to cyber-attacks and we believe we will continue to be a potential target of such threats and attacks. In June 2015, we identified that unauthorized third parties had gained access to legacy servers containing archived data that would likely be considered to be personal information. We immediately investigated, including the engagement of an external expert security firm, and although we had no evidence that any information had been misused, stolen or compromised, we notified all of the individuals whose information may have been accessed and any applicable regulatory agencies. To date, this incident has not been material to our operations or financial results.
18
Continuous cyber-attacks or a sustained attack could lead to service interruptions, malfunctions or other failures in the information technology that supports our businesses and customers (such as the lack of availability of our value-added systems), as well as the operations of our customers or other third parties. Continuous cyber-attacks could also lead to damage to our reputation with our customers and other parties and the market, additional costs (such as repairing systems, adding new personnel or protection technologies or compliance costs), regulatory penalties, financial losses to both us and our customers and partners and the loss of customers and business opportunities. If such attacks are not detected in a timely manner, their effect could be compounded.
If our information technology is compromised, becomes inoperable for extended periods of time or ceases to function properly, we may have to make a significant investment to fix or replace the information technology and our ability to provide many of our electronic and online solutions to our customers may be impaired, which would have a material adverse effect on our consolidated operating results and financial position. In addition, as cyber-threats continue to evolve, we may be required to expend significant additional resources to continue to modify or enhance our protective measures or to investigate and remediate any information security vulnerabilities. Any of the risks described above could disrupt our business, damage our reputation and materially adversely affect our consolidated financial position and results of operations.
In addition, aspects of our operations and business are subject to privacy regulation in the United States and elsewhere. Many U.S. states have enacted data breach regulations and laws requiring varying levels of consumer notification in the event of a security breach. Increased regulation and enforcement activity throughout the world in the areas of data privacy and data security/breach may materially increase our costs, which could have a material adverse effect on our operating results. Our failure to comply with the privacy and data security/breach laws to which we are subject could also result in fines, sanctions and damage to our reputation and tradenames or the loss of significant customers.
If we are not successful in competing with our known competitors, customers and/or disruptive new entrants, then our market position or competitive advantage could be threatened, as well as our business and results of operations.
We face significant competition for the supply of used and salvage vehicles, the buyers of those vehicles and the floorplan financing of these vehicles. Our principal sources of competition historically have come from: (1) direct competitors (e.g., Manheim, Copart and NextGear Capital), (2) new entrants, including new vehicle remarketing venues and dealer financing services, and (3) existing alternative vehicle remarketing venues. Due to the increasing use of the Internet and other technology as marketing and distribution channels, we also face increasing competition from online wholesale and retail vehicle selling platforms (generally without any meaningful physical presence) and from our own customers when they sell directly to end users through such platforms rather than remarket vehicles through our auctions and other channels. Increased competition could result in price reductions, reduced margins or loss of market share.
Our future success also depends on our ability to respond to evolving industry trends, changes in customer requirements and new technologies. One potentially adverse trend would be a market shift towards the simultaneous listing and selling of vehicles on multiple online sales platforms. Were such a trend to take hold, the vehicle remarketing industry's economics could change. For example, we might need to incur additional costs or otherwise alter our business model to adapt to these changes. In such case, the volume of vehicles supplied to us and our overall revenues and fees per vehicle sold could decrease. Since 2013, many participants in the whole car industry have been discussing the development of a multiple platform bidding system. Any such collaboration may be unsuccessful, unworkable or deemed inadvisable. In such case, we may lose vehicle volume and market share, and our business, revenues and profitability could be negatively impacted.
Some of our competitors may have greater financial and marketing resources than we do, may be able to respond more quickly to evolving industry dynamics and changes in customer requirements, or may be able to devote greater resources to the development, promotion and sale of new or emerging services and technologies. If we are unable to compete successfully or to successfully adapt to industry changes, our business, revenues and profitability could be materially adversely affected.
ADESA currently competes with online wholesale and retail vehicle selling platforms, including OVE.com and RMS Automotive (both affiliated with Cox Enterprises), SmartAuction, eBay Motors and others. With the exception of OVE.com, these online selling platforms generally do not have any meaningful physical presence and may cause the volume of vehicles sold through our online and physical auctions to decrease. If the number of vehicles sold through our auctions decreases due to these competitors or other industry changes, our revenue and profitability may be negatively impacted. In addition, our long-lived assets could also become subject to impairment.
19
In our salvage auction business, potential competitors include used vehicle auctions, providers of claims software to insurance companies and certain salvage buyer groups and automobile insurance companies, some of which currently supply salvage vehicles to us. Insurance companies may in the future decide to dispose of their salvage vehicles directly to end users, which would negatively affect our volumes, revenue and profitability.
At the national level, AFC's competition includes NextGear Capital, a subsidiary of Cox Enterprises, Inc., other specialty lenders, banks and financial institutions. At the local level, AFC faces competition from banks, credit unions and independent auctions who may offer floorplan financing to local auction customers. Such entities typically service only one or a small number of auctions. Some of our industry competitors who operate whole car auctions on a national scale may endeavor to capture a larger portion of the floorplan financing market. AFC competes primarily on the basis of quality of service, convenience of payment, scope of services offered and historical and consistent commitment to the sector. If the number of loans originated and serviced decreases due to these competitors, our revenue and profitability may be negatively impacted.
If we fail to attract and retain key personnel, or have inadequate succession planning, we may not be able to execute our business strategies and our financial results could be negatively affected.
Our success depends in large part on the performance of our executive management team and other key employees, including key field and information technology personnel. If we lose the services of one or more of our executive officers or key employees, or if one or more of them decides to join a competitor or otherwise compete with us, we may not be able to effectively implement our business strategies, our business could suffer and the value of our common stock could be materially adversely affected. Our auction business is directly impacted by the business relationships our employees have established with customers and suppliers and, as a result, if we lose key personnel, we may have difficulty in retaining and attracting customers, developing new services, negotiating favorable agreements with customers and providing acceptable levels of customer service. Leadership changes will occur from time to time and we cannot predict whether significant resignations will occur or whether we will be able to recruit additional qualified personnel. We do not have nor do we currently expect to obtain key person insurance on any of our executive officers.
We may be unable to meet or exceed our customers’ expectations, which could result in poor customer retention and adversely affect our operating results and financial condition.
We believe our future success depends in part on our ability to respond to changes in customer requirements. Our customers include vehicle manufacturers and their captive finance arms, vehicle leasing and rental companies, financial institutions, fleet management companies, franchised and independent used vehicle dealers, insurance companies, non-profit organizations, automotive body shops, rebuilders, automotive wholesalers, exporters, dismantlers, recyclers and brokers. We work to develop strong relationships and interactive dialogue with our customers to better understand current trends and customer needs. If we are not successful in meeting our customers' expectations, our customer relationships could be negatively affected and result in a loss of future business, which would adversely affect our operating results and financial condition.
ADESA and IAA's agreements with its largest institutional suppliers of used and salvage vehicles are generally subject to cancellation by either party upon 30 to 90 days' notice. In addition, it is common that institutional suppliers regularly review their relationships with whole car and salvage auctions through written requests for proposals. Such suppliers may from time to time require us to make changes to the way we do business as part of the request for proposal process. There can be no assurance that our existing agreements will not be canceled or that we will be able to enter into future agreements with these or other suppliers that disrupt our supplier base on similar terms, or at all, and our ability to grow and sustain profitability could be impaired.
If we acquire businesses that: are not aligned with the Company’s strategy; lack the proper research and preparation; create unnecessary risks; improperly value and price a target; have poor integration execution; and/or do not achieve the desired outcomes, then our operating results, financial condition and growth prospects could be adversely affected.
Acquisitions are a significant part of our growth strategy and have enabled us to further broaden and diversify our service offerings. Our strategy generally involves the acquisition and integration of additional physical auction sites, technologies and personnel. Acquisition of businesses requires substantial time and attention of management personnel and may also require additional equity or debt financings. Further, integration of newly established or acquired businesses is often disruptive. Since we have acquired or in the future may acquire one or more businesses, there can be no assurance that we will identify appropriate targets, will acquire such businesses on favorable terms, or will be able to successfully integrate such organizations into our business. Failure to do so could materially adversely affect our business, financial condition and results of operations. In addition, we expect to compete against other auction groups or new industry consolidators for suitable acquisitions. If we are able to consummate acquisitions, such acquisitions could be dilutive to earnings, and we could overpay for such acquisitions.
20
In pursuing a strategy of acquiring other businesses, we face other risks including, but not limited to:
|
•
|
incurring significantly higher capital expenditures and operating expenses;
|
|
•
|
entering new markets with which we are unfamiliar;
|
|
•
|
incurring potential undiscovered liabilities at acquired businesses;
|
|
•
|
failing to maintain uniform standards, controls and policies;
|
|
•
|
impairing relationships with employees and customers as a result of management changes; and
|
|
•
|
increasing expenses for accounting and computer systems, as well as integration difficulties.
|
Acquisitions and other strategies to expand our operations beyond North America subject us to significant risks and uncertainties. As a result, we may not be successful in realizing anticipated synergies or we may experience unanticipated integration expenses. As we continue to explore opportunities to expand our business internationally, we will need to develop policies and procedures to manage our business on a global scale. Operationally, acquired businesses typically depend on key relationships and our failure to maintain those relationships could have an adverse affect on our operating results and financial condition.
In addition, we anticipate that our non-U.S. based operations will continue to subject us to risks associated with operating on an international basis, including:
|
•
|
exposure to foreign currency exchange rate risk, which may have an adverse impact on our revenues and profitability;
|
|
•
|
restrictions on our ability to repatriate funds, as well as repatriation of funds currently held in foreign jurisdictions to the U.S. may result in higher effective tax rates;
|
|
•
|
tariffs and trade barriers and other regulatory or contractual limitations on our ability to operate in certain foreign markets;
|
|
•
|
compliance with the Foreign Corrupt Practices Act;
|
|
•
|
dealing with unfamiliar regulatory agencies and laws favoring local competitors;
|
|
•
|
dealing with political and/or economic instability;
|
|
•
|
the difficulty of managing and staffing foreign offices, as well as the increased travel, infrastructure, legal and compliance costs associated with international operations;
|
|
•
|
localizing our product offerings; and
|
|
•
|
adapting to different business cultures and market structures.
|
As we continue to explore opportunities to expand globally, our success will depend on our ability to anticipate and effectively manage these and other risks associated with operating on an international basis. Our failure to manage these risks could have an adverse affect on our operating results and financial condition.
Decreases in the supply of used vehicles coming to auction may impact auction sales volumes, which may adversely affect our revenues and profitability. In addition, a decrease in the number of used vehicles sold at physical auctions could adversely affect our revenue growth, operating results and financial condition.
The number of new and used vehicles that are leased by consumers affects the supply of vehicles coming to auction in future periods as the leases mature. If manufacturers and other lenders decrease the number of new vehicle lease originations and extend the terms of some of the existing leases, the number of off-lease vehicles available at auction for the industry would decline. If the supply of off-lease vehicles coming to auction declines, our revenues and profitability may be adversely affected.
21
Volumes of off-lease vehicles in subsequent periods will be affected by total new vehicle sales and the future leasing behavior of manufacturers and lenders; therefore, we may not be able to accurately predict the volume of vehicles coming to auction. The supply of off-lease vehicles coming to auction is also affected by the market value of used vehicles compared to the residual value of those vehicles per the lease terms. In most cases, the lessee and the dealer have the ability to purchase the vehicle at the residual price at the end of the lease term. Generally, as market values of used vehicles rise, the number of vehicles purchased at residual value by the lessees and dealers increases, thus decreasing the number of off-lease vehicles available at auction.
Furthermore, online only auction platforms were utilized for the sale of approximately 26% of vehicles sold by ADESA in 2016, compared with 24% in 2015. If sellers and buyers increase the number of vehicles transacted on online only auction platforms, our revenue per vehicle will likely decline. In connection with online auctions, ADESA offers physical auctions, which allow buyers to physically inspect and compare vehicles. In addition, our cost structure includes a significant fixed cost component, including occupancy costs, that cannot be readily reduced if revenue per vehicle declines. If a shift in the percentage of used vehicles sold on online only auction platforms as compared with used vehicles sold at physical auctions occurs, and we are unable to generate new sources of revenue, our operating results and financial condition could be adversely affected.
Used vehicle prices impact fee revenue per unit and may impact the supply of used vehicles, as well as loan losses at AFC.
The volume of new vehicle production, accuracy of lease residual estimates, interest rate fluctuations, customer demand and changes in regulations, among other things, all potentially affect the pricing of used vehicles. Used vehicle prices may affect the volume of vehicles entered for sale at our auctions and the demand for those used vehicles, the fee revenue per unit, loan losses for our dealer financing business and our ability to retain customers. When used vehicle prices are high, used vehicle dealers may retail more of their trade-in vehicles on their own rather than selling them at auction. In addition, a sustained reduction in used vehicle pricing could result in lower proceeds from the sale of salvage vehicles and a related reduction in revenue per vehicle, a potential loss of consignors, an increase in loan losses at AFC and decreased profitability. Furthermore, when vehicles are purchased, we are subject to changes in vehicle values, such as those caused from changes in commodity prices for steel and platinum. Decreases in commodity prices may negatively affect vehicle values and demand at salvage auctions.
If our facilities lack the capacity to accept additional vehicles, then our relationships with insurance companies or other vehicle suppliers could be adversely affected.
We regularly evaluate our capacity in all our markets and where appropriate, seek to increase capacity through the acquisition of additional land and facilities. Capacity at our facilities varies from period to period and by region as a result of various factors, including natural disasters. We may not be able to reach agreements to purchase or lease storage facilities in markets where we have limited excess capacity, and zoning restrictions or difficulties obtaining use permits may limit our ability to expand our capacity through acquisitions of new land. In addition, we may not be able to renew or enter into new leases at commercially reasonable rates. If we fail to have sufficient capacity at one or more of our facilities, our relationships with insurance companies or other vehicle suppliers could be adversely affected, which could adversely affect our operating results and financial condition.
Fluctuations in the supply of and demand for salvage vehicles impact auction sales volumes, which may adversely affect our revenues and profitability.
We are dependent upon receiving a sufficient number of total loss vehicles to sustain profit margins in our salvage auction business. Factors that can adversely affect the number of vehicles received include, but are not limited to, a decrease in the number of vehicles in operation or miles driven, mild weather conditions that cause fewer traffic accidents, reduction of policy writing by insurance providers that would affect the number of claims over a period of time, changes in vehicle technology and autonomous vehicles, a decrease in the percentage of claims resulting in a total loss or elimination of automotive collision coverage by consumers, delays or changes in state title processing, government regulations on the standards for producing vehicles and changes in direct repair procedures that would reduce the number of newer, less damaged total loss vehicles, which tend to have higher salvage values. In addition, our salvage auction business depends on a limited number of automobile insurance companies to supply the
salvage vehicles we sell at auction. Our agreements with these insurance company suppliers are generally subject to cancellation by either party upon 30 to 90 days’ notice. There can be no assurance that our existing agreements will not be canceled or that we will be able to enter into future agreements with these suppliers. Future decreases in the quality and quantity of vehicle inventory, and in particular the availability of newer and less damaged vehicles, could have a material adverse effect on our operating results and financial condition. If the supply or value of salvage vehicles coming to
22
auction declines significantly, our revenues and profitability may be adversely affected. In addition, decreases in commodity prices, such as steel and platinum, may negatively affect vehicle values and demand at salvage auctions.
Our business and operating results would be adversely affected if we lose one or more significant customers.
Loss of business from, or changes in the consignment patterns of, our key customers could have a material adverse effect on our business and operating results. Generally, institutional and dealer customers make no binding long-term commitments to us regarding consignment volumes. Any such customer could reduce its overall supply of vehicles for our auctions or otherwise seek to materially change the terms of its business relationship with us at any time. Any such change could harm our business and operating results. While no single customer accounted for 10% or more of our consolidated revenues in 2016, the loss of, or material reduction in business from, our key customers could have a material adverse effect on our business and operating results.
At a segment level, approximately 80% of IAA segment’s revenues derive from insurance company customers and a small number of these customers account for a large share of IAA’s revenues. In 2016, approximately 40% of IAA’s revenues were associated with the fees generated from the auction of salvage vehicles, including buyer fees, from its three largest insurance customers, each of which accounted for over 10%. If one or more of IAA’s large customers were to significantly reduce consignments for any reason or favor competitors or new entrants, IAA may not be successful in replacing such business and IAA’s profitability and operating results would be materially adversely affected.
Adverse economic conditions may negatively affect our business and results of operations.
Future adverse economic conditions could increase our exposure to several risks, including:
|
•
|
Fluctuations in the supply of used vehicles.
We are dependent on the supply of used vehicles coming to auction, and our financial performance depends, in part, on conditions in the automotive industry. During the past global economic downturn and credit crisis, there was an erosion of retail demand for new and used vehicles that led many lenders to cut back on originations of new loans and leases and led to significant manufacturing capacity reductions by automakers selling vehicles in the United States and Canada. Capacity reductions could depress the number of vehicles received at auction in the future and could lead to reduced vehicles from various suppliers, negatively impacting auction volumes. In addition, weak growth in or declining new vehicle sales negatively impacts used vehicle trade-ins to dealers and auction volumes. These factors could adversely affect our revenues and profitability.
|
|
•
|
Decline in the demand for used vehicles.
We may experience a decrease in demand for used vehicles from buyers due to factors including the lack of availability of consumer credit and declines in consumer spending and consumer confidence. Adverse credit conditions also affect the ability of dealers to secure financing to purchase used vehicles at auction, which further negatively affects buyer demand. In addition, a reduction in the number of franchised and independent used car dealers may reduce dealer demand for used vehicles.
|
|
•
|
Decrease in consumer spending.
Consumer purchases of new and used vehicles may be adversely affected by economic conditions such as employment levels, wage and salary levels, trends in consumer confidence and spending, reductions in consumer net worth, interest rates, inflation, the availability of consumer credit and taxation policies. Consumer purchases in general may decline during recessions, periods of prolonged declines in the equity markets or housing markets and periods when disposable income and perceptions of consumer wealth are lower. Changes to U.S. federal tax policy may negatively affect consumer spending. In addition, the increased use of vehicle sharing and alternate methods of transportation, including autonomous vehicles, could lead to a decrease in consumer purchases of new and used vehicles and a decrease in vehicle rentals. To the extent retail and rental car company demand for new and used vehicles decreases, negatively impacting our auction volumes, our results of operations and financial position could be materially and adversely affected.
|
|
•
|
Volatility in the asset-backed securities market.
Volatility and disruption in the asset-backed commercial paper market could lead to a narrowing of interest rate spreads at AFC in certain periods. In addition, any volatility and disruption has affected, and could affect, AFC’s cost of financing related to its securitization facility.
|
|
•
|
Ability to service and refinance indebtedness.
Uncertainty in the financial markets may negatively affect our ability to service our existing debt, access additional financing or to refinance our existing indebtedness on favorable terms or at all. If economic weakness exists, it may affect our cash flow from operations and results of operations, which may affect our ability to service payment obligations on our debt or to comply with our debt covenants.
|
23
|
•
|
Increased counterparty credit risk.
Any market deterioration could increase the risk of the failure of financial institutions party to our Credit Agreement and other counterparties with which we do business to honor their obligations to us. Our ability to replace any such obligations on the same or similar terms may be limited if challenging credit and general economic conditions exist.
|
Declining values for salvage vehicles purchased could adversely affect our profitability.
In the United Kingdom, the salvage market typically operates on a principal basis, in which a vehicle is purchased and then resold, rather than on an agent basis, in which the auction acts as a sales agent for the owner of the vehicle. Operating on a principal basis exposes us to inventory risks, including losses from theft, damage and obsolescence. Furthermore, in periods when the supply of vehicles from the insurance sector in North America declines, salvage operators have acquired and in the future may acquire vehicles on their own. If we purchase vehicles, the increased costs associated with acquiring the vehicles could have a material adverse effect on our gross profit and operating results. In addition, when vehicles are purchased, we are subject to changes in vehicle values, such as those caused from changes in commodity prices for steel and platinum. Decreases in commodity prices may negatively affect vehicle values and demand at salvage auctions.
AFC is exposed to credit risk with our dealer borrowers, which could adversely affect our profitability and financial condition.
AFC is subject to credit risk resulting from defaults in payment by our dealer customers on our floorplan loans. Furthermore, a weak economic environment, decreased demand for used vehicles, disruptions in pricing of used vehicle inventory or consumers’ lack of access to financing could exert pressure on our dealer customers resulting in higher delinquencies, bankruptcies, repossessions and credit losses. There can be no assurances that our monitoring of our credit risk as it affects the collectability of these loans and our efforts to mitigate credit risk through appropriate underwriting policies and loss-mitigation strategies are, or will be, sufficient to prevent an adverse impact in our profitability and financial condition.
If we are unable to protect our intellectual property, the value of our brand and other intangible assets may be diminished, and our business may be adversely affected.
We rely and expect to continue to rely on a combination of confidentiality and license agreements with our employees, consultants and third parties with whom we have relationships, as well as trademark, copyright, patent, trade secret, and domain name protection laws, to protect our proprietary rights. In the United States and internationally, we have filed various applications for protection of certain aspects of our intellectual property, and we currently hold issued patents in the United States. However, third parties may knowingly or unknowingly infringe our proprietary rights, third parties may challenge proprietary rights held by us, and pending and future trademark and patent applications may not be approved. In addition, effective intellectual property protection may not be available in every country in which we operate or intend to operate our business. In any or all of these cases, we may be required to expend significant time and expense in order to prevent infringement or to enforce our rights. Although we have taken measures to protect our proprietary rights, there can be no assurance that others will not offer products or concepts that are substantially similar to ours and compete with our business. If the protection of our proprietary rights is inadequate to prevent unauthorized use or appropriation by third parties, the value of our brand and other intangible assets may be diminished and competitors may be able to more effectively mimic our service and methods of operations. Any of these events could have an adverse effect on our business and financial results.
We may be subject to patent or other intellectual property infringement claims, which could have an impact on our business or operating results due to a disruption in our business operations, the incurrence of significant costs and other factors.
From time to time, we may receive notices from others claiming that we infringed or otherwise violated their patent or intellectual property rights, and the number of these claims could increase in the future. Claims of intellectual property infringement or other intellectual property violations could require us to enter into licensing agreements on unfavorable terms, incur substantial monetary liability or be enjoined preliminarily or permanently from further use of the intellectual property in question, which could require us to change business practices and limit our ability to compete effectively. Even if we believe that the claims are without merit, the claims can be time-consuming and costly to defend and may divert management’s attention and resources away from our businesses. If we are required to take any of these actions, it could have an adverse impact on our business and operating results.
24
Weather-related and other events beyond our control may adversely impact operations.
Extreme weather or other events, such as hurricanes, tornadoes, earthquakes, forest fires, floods, terrorist attacks or war, may adversely affect the overall economic environment, the markets in which we compete, our operations and profitability. These events may impact our physical auction facilities, causing a material increase in costs, or delays or cancellation of auction sales, which could have a material adverse impact on our revenues and profitability. In some instances, for example with the severe storm in October 2012, known as “Superstorm Sandy,” these events may result in a sharp influx in the available supply of salvage vehicles and there can be no assurance that our salvage auction business will have sufficient resources to handle such extreme increases in supply. Our failure to meet our customers’ demands in such situations could negatively affect our relationships with such customers and result in a loss of future business, which would adversely affect our operating results and financial condition. In addition, salvage revenues generated as a result of the total loss of vehicles associated with such a catastrophe are typically recognized subsequent to the incurrence of incremental costs and such revenues may not be sufficient to offset the costs incurred.
Mild weather conditions tend to result in a decrease in the available supply of salvage vehicles because traffic accidents decrease and fewer vehicles are damaged. Accordingly, mild weather can have an adverse effect on our salvage vehicle inventories, which would be expected to have an adverse effect on our revenue and operating results and related growth rates.
A portion of our net income is derived from our international operations, primarily Canada, which exposes us to foreign exchange risks that may impact our financial statements. In addition, increases in the value of the U.S. dollar relative to certain foreign currencies may negatively impact foreign buyer participation at our auctions.
Fluctuations between U.S. and foreign currency values may adversely affect our results of operations and financial position, particularly fluctuations with Canadian currency values. In addition, there may be tax inefficiencies in repatriating cash from Canada. Approximately 11% of our revenues were attributable to our Canadian operations for the year ended
December 31, 2016
. A decrease in the value of the Canadian currency relative to the U.S. dollar would reduce our profits from Canadian operations and the value of the net assets of our Canadian operations when reported in U.S. dollars in our financial statements. This could have a material adverse effect on our business, financial condition or results of operations as reported in U.S. dollars. A 1% change in the average Canadian exchange rate for the year ended
December 31, 2016
would have impacted net income by approximately $0.9 million.
In addition, fluctuations in exchange rates may make it more difficult to perform period-to-period comparisons of our reported results of operations. For purposes of accounting, the assets and liabilities of our Canadian operations are translated using period-end exchange rates; such translation gains and losses are reported in “Accumulated other comprehensive income/loss” as a component of stockholders’ equity. The revenues and expenses of our Canadian operations are translated using average exchange rates during each period.
Likewise, we have a significant number of non-U.S. based buyers who participate in our auctions. Increases in the value of the U.S. dollar relative to these buyers’ local currencies may reduce the prices they are willing to pay at auction, which may negatively affect our revenues.
Increases in fuel prices could lead to a reduction in miles driven and may have an adverse effect on our revenues and operating results, as well as our earnings growth rates.
Increased fuel prices could lead to a reduction in the miles driven per vehicle, which may reduce accident rates. Increases in fuel prices may also disproportionately affect the demand for sports cars, luxury vehicles, sport utility and full-sized vehicles which are generally not as fuel-efficient as smaller vehicles. Retail sales and accident rates are factors that affect the number of used and salvage vehicles sold at auction, wholesale prices of those vehicles and the conversion rates at used vehicle auctions. Additionally, higher fuel costs increase the cost of transportation and towing of vehicles and we may not be able to pass on such higher costs to our customers.
Environmental, health and safety risks could adversely affect our operating results and financial condition.
Our operations are subject to various foreign, federal, state and local environmental, health and safety laws and regulations, including those governing the emission or discharge of pollutants into the air or water, the generation, treatment, storage and release of hazardous materials and wastes and the investigation and remediation of contamination. Our failure to comply with current or future environmental, health or safety laws or to obtain and comply with permits required under such laws, could subject us to significant liability or require costly investigative, remedial or corrective actions.
25
In the used vehicle remarketing industry, large numbers of vehicles, including wrecked vehicles at salvage auctions, are stored and/or refurbished at auction facilities and during that time minor releases of fuel, motor oil and other materials may occur. We have investigated or remediated, or are currently investigating or remediating, contamination resulting from various sources, including gasoline, fuel additives (such as methyl tertiary butyl ether, or MTBE), motor oil, petroleum products and other hazardous materials released from aboveground or underground storage tanks or in connection with current or former operations conducted at our facilities. We have incurred and may in the future incur expenditures relating to releases of hazardous materials, investigative, remedial or corrective actions, claims by third parties and other environmental issues, and such expenditures, individually or in the aggregate, could be significant.
Federal and state environmental authorities are currently investigating IAA’s role in contributing to contamination at the Lower Duwamish Waterway Superfund Site in Seattle, Washington. IAA’s potential liability at this site cannot be estimated at this time. See Item 3, “Legal Proceedings” for a further discussion of this matter.
We have a substantial amount of debt, which could impair our financial condition and adversely affect our ability to react to changes in our business.
As of
December 31, 2016
, our total corporate debt was approximately
$2.5 billion
, exclusive of liabilities related to our securitization facilities which are not secured by the general assets of KAR, and we had $219.5 million of borrowing capacity under our senior secured credit facilities. In addition, we had related outstanding letters of credit in the aggregate amount of
$29.7 million
at
December 31, 2016
, which would reduce the $219.5 million available for borrowings under the credit facilities.
Our indebtedness could have important consequences including:
|
•
|
limiting our ability to borrow additional amounts to fund working capital, capital expenditures, debt service requirements, execution of our business strategy, acquisitions and other purposes;
|
|
•
|
requiring us to dedicate a substantial portion of our cash flow from operations to pay principal and interest on debt, which would reduce the funds available for other purposes, including funding future expansion;
|
|
•
|
making us more vulnerable to adverse changes in general economic, industry and competitive conditions, in government regulation and in our business by limiting our flexibility in planning for, and making it more difficult to react quickly to, changing conditions; and
|
|
•
|
exposing us to risks inherent in interest rate fluctuations because the majority of our indebtedness is at variable rates of interest, which could result in higher interest expenses in the event of increases in interest rates.
|
In addition, if we are unable to generate sufficient cash from operations to service our debt and meet other cash needs, we may be forced to reduce or delay capital expenditures, suspend or eliminate dividends, sell assets or operations, seek additional capital or restructure or refinance our indebtedness. We may not be able to refinance our debt or sell additional debt or equity securities or our assets on favorable terms, if at all, particularly because of our high levels of debt and the restrictions imposed by the agreement governing our Credit Facility on our ability to incur additional debt and use the proceeds from asset sales. If we must sell certain of our assets, it may negatively affect our ability to generate revenue. The inability to obtain additional financing could have a material adverse effect on our financial condition.
If we cannot make scheduled payments on our debt, we would be in default and, as a result:
|
•
|
our debt holders could declare all outstanding principal and interest to be due and payable;
|
|
•
|
the lenders under our senior secured credit facilities could terminate their commitments to lend us money and foreclose against the assets securing their borrowings; and
|
|
•
|
we could be forced into bankruptcy or liquidation.
|
Furthermore, the agreement governing our Credit Facility includes, and future debt instruments may include, certain restrictive covenants which could limit our ability to enter into certain transactions in the future and may adversely affect our ability to operate our business.
26
Changes in interest rates or market conditions could adversely impact the profitability and business of AFC.
Rising interest rates may have the effect of depressing the sales of used vehicles because many consumers finance their vehicle purchases. In addition, AFC securitizes a majority of its finance receivables on a revolving basis. Volatility and/or market disruption in the asset-backed securities market in the United States or Canada can impact AFC’s cost of financing related to, or its ability to arrange financing on acceptable terms through, its securitization facility, which could negatively affect AFC’s business and our financial condition and operations.
We assume the settlement risk for all vehicles sold through our auctions.
We do not have recourse against sellers for any buyer’s failure to satisfy its payment obligations. Since revenue for most vehicles does not include the gross sales proceeds, failure to collect the receivables in full may result in a net loss up to the gross sales proceeds on a per vehicle basis in addition to any expenses incurred to collect the receivables and to provide the services associated with the vehicle. If we are unable to collect payments on a large number of vehicles, the resulting payment obligations to the seller and decreased fee revenues may have a material adverse effect on our results of operations and financial condition.
Changes in laws affecting the importation of salvage vehicles may have an adverse effect on our business and financial condition.
Our Internet-based auction services have allowed us to offer our products and services to international markets and has increased our international buyer base. As a result, foreign buyers of salvage vehicles now represent a significant part of our total buyer base. Changes in laws and regulations that restrict the importation of salvage vehicles into foreign countries may reduce the demand for salvage vehicles and impact our ability to maintain or increase our international buyer base. For example, a decree issued by the president of Mexico has placed restrictions on the types of vehicles that can be imported into Mexico from the United States. The adoption of similar laws or regulations in other jurisdictions that have the effect of reducing or curtailing our activities abroad could have a material adverse effect on our results of operations and financial condition by reducing the demand for our products and services.
We are subject to extensive governmental regulations, including vehicle brokerage and auction laws and currency reporting obligations. Our business is subject to risks related to litigation and regulatory actions.
Our operations are subject to regulation, supervision and licensing under various federal, state, provincial and local authorities, agencies, statutes and ordinances, which, among other things, require us to obtain and maintain certain licenses, permits and qualifications, provide certain disclosures and notices and limit interest rates, fees and other charges. The regulations and laws that impact our company include, without limitation, the following:
|
•
|
The acquisition and sale of used, leased, totaled and recovered theft vehicles are regulated by state or other local motor vehicle departments in each of the locations in which we operate.
|
|
•
|
Some of the transport vehicles used at our auctions are regulated by the U.S. Department of Transportation or similar regulatory agencies in the other countries in which we operate.
|
|
•
|
In many states and provinces, regulations require that a salvage vehicle be forever “branded” with a salvage notice in order to notify prospective purchasers of the vehicle’s previous salvage status.
|
|
•
|
Some state, provincial and local regulations limit who can purchase salvage vehicles, as well as determine whether a salvage vehicle can be sold as rebuildable or must be sold for parts or scrap only.
|
|
•
|
AFC is subject to laws in certain states and in Canada which regulate commercial lending activities and interest rates and, in certain jurisdictions, require AFC or one of its subsidiaries to be licensed.
|
|
•
|
PWI is subject to laws, regulations and insurance licensing requirements in certain states which are applicable to the sale of vehicle service contracts.
|
|
•
|
We are subject to various local zoning requirements with regard to the location of our auction and storage facilities, which requirements vary from location to location.
|
27
|
•
|
Certain of the Company's subsidiaries are indirectly subject to the regulations of the Consumer Financial Protection Act of 2010, or the CFPA, due to their vendor relationships with financial institutions.
|
|
•
|
PAR is subject to laws in certain states which regulate repossession administration activities and, in certain jurisdictions, require PAR to be licensed.
|
|
•
|
We deal with significant amounts of cash in our operations and are subject to various reporting and anti-money laundering regulations.
|
Changes in law or governmental regulations or interpretations of existing law or regulations could result in increased costs, reduced vehicle prices and decreased profitability for us. In addition, failure to comply with present or future laws and regulations or changes in existing laws or regulations or in their interpretation could have a material adverse effect on our operating results and financial condition.
We are also subject from time to time to a variety of legal actions relating to our current and past business operations, including litigation relating to employment-related issues, the environment and personal injury claims. There is no guarantee that we will be successful in defending ourselves in legal and administrative actions or in asserting our rights under various laws. In addition, we could incur substantial costs in defending ourselves or in asserting our rights in such actions. The costs and other effects of pending litigation and administrative actions against us cannot be determined with certainty. Although we currently believe that no such proceedings will have a material adverse effect, there can be no assurance that the outcome of such proceedings will be as expected.
We are partially self-insured for certain losses.
We self-insure a portion of employee medical benefits under the terms of our employee health insurance program, as well as a portion of our automobile, general liability and workers’ compensation claims. We record an accrual for the claims expense related to our employee medical benefits, automobile, general liability and workers’ compensation claims based upon the expected amount of all such claims. If actual trends, including the severity of claims and medical cost inflation above expectations were to occur, our self-insured costs would increase, which could have an adverse impact on the operating results in that period.
We are dependent on the continued and uninterrupted service from our workforce.
Currently, none of our employees are covered by collective bargaining agreements. If we negotiate a first-time collective bargaining agreement, we could be subject to a substantial increase in labor and benefits expenses that we may be unable to pass through to customers for some period of time, if at all.
We have a material amount of goodwill which, if it becomes impaired, would result in a reduction in our net income.
Goodwill represents the amount by which the cost of an acquisition accounted for using the purchase method exceeds the fair value of the net assets acquired. Current accounting standards require that goodwill no longer be amortized but instead be periodically evaluated for impairment based on the fair value of the reporting unit. A significant percentage of our total assets represents goodwill. Declines in our profitability or the value of comparable companies may impact the fair value of our reporting units, which could result in a write-down of goodwill and a reduction in net income.
New accounting pronouncements or new interpretations of existing standards could require us to make adjustments to accounting policies that could adversely affect the financial statements.
The Financial Accounting Standards Board, or the FASB, the Public Company Accounting Oversight Board, the SEC, and other accounting organizations or governmental entities from time to time issue new pronouncements or new interpretations of existing accounting and auditing standards that require changes to our accounting policies and procedures and could cause us to incur additional costs. To date, we do not believe any new pronouncements or interpretations have had a material adverse effect on our financial condition or results of operations, but future pronouncements or interpretations could require the change of policies or procedures.
28
Risks Related to Ownership of Our Common Stock
The market price and trading volume of our common stock may be volatile, which could result in rapid and substantial losses for our stockholders.
You should consider an investment in our common stock to be risky, and you should invest in our common stock only if you can withstand a significant loss and wide fluctuations in the market value of your investment. Many factors could cause the market price of our common stock to rise and fall, including the following:
|
•
|
our announcements or our competitors’ announcements regarding new products or services, enhancements, significant contracts, acquisitions or strategic investments;
|
|
•
|
changes in earnings estimates or recommendations by securities analysts, if any, who cover our common stock;
|
|
•
|
results of operations that are below our announced guidance or below securities analysts’ or consensus estimates or expectations;
|
|
•
|
fluctuations in our quarterly financial results or the quarterly financial results of companies perceived to be similar to us;
|
|
•
|
changes in our capital structure, such as future issuances of securities, sales of large blocks of common stock by our stockholders or our incurrence of additional debt;
|
|
•
|
repurchases of our common stock pursuant to our share repurchase program;
|
|
•
|
investors’ general perception of us and our industry;
|
|
•
|
changes in general economic and market conditions;
|
|
•
|
changes in industry conditions; and
|
|
•
|
changes in regulatory and other dynamics.
|
In addition, if the market for stocks in our industry, or the stock market in general, experiences a loss of investor confidence, the trading price of our common stock could decline for reasons unrelated to our business, financial condition or results of operations. If any of the foregoing occurs, it could cause our stock price to fall and may expose us to lawsuits that, even if successfully defended, could be costly to defend and a distraction to management.
Future offerings of debt or equity securities, which would rank senior to our common stock, may adversely affect the market price of our common stock.
If, in the future, we decide to issue debt or equity securities that rank senior to our common stock, it is likely that such securities will be governed by an indenture or other instrument containing covenants restricting our operating flexibility. Additionally, any convertible or exchangeable securities that we issue in the future may have rights, preferences and privileges more favorable than those of our common stock and may result in dilution to owners of our common stock. We and, indirectly, our stockholders, will bear the cost of issuing and servicing such securities. Because our decision to issue debt or equity securities in any future offering will depend on market conditions and other factors beyond our control, we cannot predict or estimate the amount, timing or nature of our future offerings. Thus, holders of our common stock will bear the risk of our future offerings reducing the market price of our common stock and diluting the value of their stock holdings in us.
The market price of our common stock could be negatively affected by sales of substantial amounts of our common stock in the public market.
Future sales by us or by our existing stockholders of substantial amounts of our common stock in the public market, or the perception that these sales may occur, could cause the market price of our common stock to decline. These sales also could impede our ability to raise future capital. Under our amended and restated certificate of incorporation, we are authorized to issue up to 400,000,000 shares of common stock, of which 136,639,217 shares of common stock were outstanding as of
December 31, 2016
. In addition, pursuant to a registration statement under the Securities Act, we have registered shares of common stock reserved for issuance in respect of stock options and other incentive awards granted to our officers and certain of
29
our employees. If any of these holders cause a large number of securities to be sold in the public market, the sales could reduce the trading price of our common stock. We cannot predict the size of future sales of shares of our common stock or the effect, if any, that future sales, or the perception that such sales may occur, would have on the market price of our common stock.
Provisions in our amended and restated certificate of incorporation and by-laws, and of Delaware law, may prevent or delay an acquisition of us, which could decrease the trading price of our common stock.
Our amended and restated certificate of incorporation and by-laws contain provisions that may be considered to have an anti-takeover effect and may delay or prevent a tender offer or other corporate transaction that a stockholder might consider to be in its best interest, including those transactions that might result in a premium over the market price for our shares.
These provisions include:
|
•
|
rules regarding how our stockholders may present proposals or nominate directors for election at stockholder meetings;
|
|
•
|
permitting our board of directors to issue preferred stock without stockholder approval;
|
|
•
|
granting to the board of directors, and not the stockholders, the sole power to set the number of directors;
|
|
•
|
authorizing vacancies on our board of directors to be filled only by a vote of the majority of the directors then in office and specifically denying our stockholders the right to fill vacancies in the board;
|
|
•
|
authorizing the removal of directors only upon the affirmative vote of holders of a majority of the outstanding shares of our common stock entitled to vote for the election of directors; and
|
|
•
|
prohibiting stockholder action by written consent.
|
These provisions apply even if an offer may be considered beneficial by some stockholders.
You may not receive any future dividends on our common stock.
On November 30, 2012, we announced that our board of directors approved the initiation of a quarterly cash dividend on our common stock. Holders of our common stock are only entitled to receive such dividends as our board of directors may declare out of funds legally available for such payments. We are not required to declare cash dividends on our common stock. Future dividend decisions will be based on and affected by a variety of factors, including our financial condition and results of operations, contractual restrictions, including restrictive covenants contained in our Credit Agreement and AFC’s securitization facilities, capital requirements and other factors that our board of directors deems relevant. Therefore, no assurance can be given as to whether any future dividends may be declared by our board of directors or the amount thereof.
Our share repurchase program could affect the price of our common stock and increase volatility. In addition, it may be suspended or discontinued at any time, which could result in a decrease in the trading price of our common stock.
Repurchases of our common stock pursuant to our share repurchase program could affect our stock price and increase its volatility. The existence of a share repurchase program could also cause our stock price to be higher than it would be in the absence of such a program and could potentially reduce the market liquidity for our stock. There can be no assurance that any share repurchases will enhance stockholder value because the market price of our common stock may decline below the levels at which we repurchased the shares of common stock. Although our share repurchase program is intended to enhance long-term stockholder value, short-term stock price fluctuations could reduce the program's effectiveness. Furthermore, the program does not obligate the Company to repurchase any dollar amount or number of shares of common stock, and may be suspended or discontinued at any time, which could cause the market price of our stock to decline.
In October 2014, our board of directors authorized a repurchase of up to $300 million of the Company’s outstanding
common stock through October 28, 2016. Approximately $227.6 million of the Company's common stock was repurchased under the October 2014 authorization. In October 2016, our board of directors authorized a repurchase of up to $500 million of the Company’s outstanding common stock through October 26, 2019. As of December 31, 2016, approximately $80.4 million of the Company's common stock had been repurchased under the October 2016 authorization. No assurance can be given as to whether the board of directors will authorize additional shares for repurchase, which could cause the market value of our stock to decline.
30
None.
The corporate headquarters of KAR Auction Services, ADESA and AFC are located in Carmel, Indiana. The facilities are leased properties, with office space being leased in each case through 2019. At
December 31, 2016
, properties utilized by the ADESA business segment include
77
used vehicle auction facilities in North America, which are either owned or leased. Each auction is generally a multi-lane, drive-through facility, and may have additional buildings for reconditioning, registration, maintenance, bodywork, and other ancillary and administrative services. Each auction also has secure parking areas to store vehicles. The ADESA facilities in North America consist on average of approximately 65 acres of land per site.
IAA is headquartered in Westchester, Illinois, with office space being leased through 2027. At
December 31, 2016
, properties utilized by the IAA business segment include
172
salvage vehicle auction facilities in the United States and Canada, most of which are leased. IAA also includes HBC, which operates from
11
locations in the United Kingdom. Salvage auctions are generally smaller than used vehicle auctions in terms of acreage and building size and some locations share facilities with ADESA. The IAA North American properties are used primarily for auction and storage purposes consisting on average of approximately 30 acres of land per site.
Of AFC's
126
locations in North America at
December 31, 2016
, 91 are physically located at auction facilities (including 60 at ADESA and 14 at IAA). Each of the remaining AFC offices is strategically located in close proximity to at least one of the auctions that it serves. AFC generally leases its branches.
We regularly evaluate our capacity in all our markets and where appropriate, seek to increase capacity through the acquisition of additional land and facilities. Capacity at our facilities varies from period to period and by region as a result of various factors, including natural disasters.
31
We are involved in litigation and disputes arising in the ordinary course of business, such as actions related to injuries; property damage; handling, storage or disposal of vehicles; environmental laws and regulations; and other litigation incidental to the business such as employment matters and dealer disputes. Such litigation is generally not, in the opinion of management, likely to have a material adverse effect on our financial condition, results of operations or cash flows. Legal and regulatory proceedings which could be material are discussed below.
IAA—Lower Duwamish Waterway
Since June 2004, IAA has operated a branch on property it leases in Tukwila, Washington just south of Seattle. The property is located adjacent to a Superfund site known as the Lower Duwamish Waterway Superfund Site ("LDW Site"). The LDW Site had been designated a Superfund site in 2001, three years prior to IAA’s tenancy. On March 25, 2008, the United States Environmental Protection Agency, or the "EPA," issued IAA a General Notice of Potential Liability, or "General Notice," pursuant to Section 107(a), and a Request for Information pursuant to Section 104(e) of the Comprehensive Environmental Response, Compensation, and Liability Act, or "CERCLA," related to the LDW Site. On November 7, 2012, the EPA issued IAA a Second General Notice of Potential Liability, or "Second General Notice," for the LDW Site. The EPA's website indicates that the EPA has issued general notice letters to approximately 116 entities, and has issued Section 104(e) Requests to more than 300 entities related to the LDW Site. In the General Notice and Second General Notice, the EPA informed IAA that the EPA believes IAA may be a Potentially Responsible Party, or "PRP," but the EPA did not specify the factual basis for this assertion. At this time, the EPA still has not specified the factual basis for this assertion and has not demanded that IAA pay any funds or take any action apart from responding to the Section 104(e) Information Request. Four PRPs, The Boeing Company, the City of Seattle, the Port of Seattle and King County - the Lower Duwamish Waterway Group ("LDWG"), have funded a remedial investigation and feasibility study related to the cleanup of the LDW Site. In December 2014, the EPA issued a Record of Decision (ROD), detailing the final cleanup plan for the LDW Site. The ROD estimates the cost of cleanup to be $342 million, with the plan involving dredging of 105 acres, capping 24 acres, and enhanced natural recovery of 48 acres. The estimated length of the cleanup is 17 years, including 7 years of active remediation, and 10 years of monitored natural recovery. IAA is aware that certain authorities may bring natural resource damage claims against PRPs. On February 11, 2016, IAA received a Notice of Intent letter from the United States National Oceanic and Atmospheric Administration informing IAA that the Elliott Bay Trustee Council are beginning to conduct an injury assessment for natural resource damages in the LDW. The Notice of Intent indicates that the decision of the trustees to proceed with this natural resources injury assessment followed a pre-assessment screen performed by the trustees. More recently, in a letter dated August 16, 2016, EPA issued a status update to the PRPs at the LDW Site. The letter stated that EPA expects the bulk of the pre-remedial design work currently being performed by the LDWG to be completed by the beginning of 2018, with the Remedial Design/Remedial Action ("RD/RA")phase to follow. EPA expects to initiate RD/RA negotiations with all PRPs beginning in early 2018. At this time, however, the Company does not have adequate information to determine IAA's responsibility, if any, for contamination at this site, or to estimate IAA's loss as a result of this potential liability.
In addition, the Washington State Department of Ecology ("Ecology") is working with the EPA in relation to the LDW Site, primarily to investigate and address sources of potential contamination contributing to the LDW Site. In 2007, IAA installed a stormwater capture and filtration system designed to treat sources of potential contamination before discharge to the LDW site. The immediate-past property owner, the former property owner and IAA have had discussions with Ecology concerning possible source control measures, including an investigation of the water and soils entering the stormwater system, an analysis of the source of contamination identified within the system, if any, and possible repairs and upgrades to the stormwater system if required. Additional source control measures, if any, are not expected to have a material adverse effect on future recurring operating costs.
32
Market Information and Holders of Record
KAR Auction Services' common stock is traded on the New York Stock Exchange ("NYSE") under the symbol "KAR" and has been traded on the NYSE since December 11, 2009. As of
February 15, 2017
, there was one stockholder of record. Because many shares of our common stock are held by brokers and other institutions on behalf of stockholders, we are unable to estimate the total number of stockholders represented by this holder of record.
The following table sets forth the range of high and low intraday sales prices per share of common stock for each quarter during fiscal years
2016
and
2015
:
|
|
2016
|
2015
|
|||||||||||||
|
|
High
|
Low
|
High
|
Low
|
|||||||||||
|
4th Quarter (October 1 - December 31)
|
$
|
44.10
|
|
$
|
38.16
|
|
$
|
38.98
|
|
$
|
35.26
|
|
|||
|
3rd Quarter (July 1 - September 30)
|
$
|
43.91
|
|
$
|
40.23
|
|
$
|
39.87
|
|
$
|
34.70
|
|
|||
|
2nd Quarter (April 1 - June 30)
|
$
|
41.76
|
|
$
|
35.68
|
|
$
|
38.77
|
|
$
|
35.87
|
|
|||
|
1st Quarter (January 1 - March 31)
|
$
|
38.44
|
|
$
|
31.54
|
|
$
|
39.52
|
|
$
|
33.25
|
|
|||
Dividend Policy
The following table presents the dividends declared per share of common stock for each quarter during fiscal years
2016
and
2015
:
|
|
2016
|
2015
|
|||||
|
4th Quarter (October 1 - December 31)
|
$
|
0.32
|
|
$
|
0.27
|
|
|
|
3rd Quarter (July 1 - September 30)
|
$
|
0.29
|
|
$
|
0.27
|
|
|
|
2nd Quarter (April 1 - June 30)
|
$
|
0.29
|
|
$
|
0.27
|
|
|
|
1st Quarter (January 1 - March 31)
|
$
|
0.29
|
|
$
|
0.27
|
|
|
Future dividend decisions will be based on and affected by a variety of factors, including our financial condition and results of operations, contractual restrictions, including restrictive covenants contained in our Credit Agreement and AFC's securitization facilities, capital requirements and other factors that our board of directors deems relevant. The restrictive covenants are further described in "Management's Discussion and Analysis of Financial Condition and Results of Operations." No assurance can be given as to whether any future dividends may be declared by our board of directors or the amount thereof.
33
Issuer Purchases of Equity Securities
The following table provides information about purchases by KAR Auction Services of its shares of common stock during the quarter ended
December 31, 2016
:
|
Period
|
Total Number of Shares Purchased
|
Average Price Paid per Share
|
Total Number of Shares Purchased as Part of Publicly Announced Plans or Programs
|
Approximate Dollar Value of Shares that May Yet Be Purchased Under the Plans or Programs (1)
(Dollars in millions)
|
||||||||||
|
October 1 - October 31
|
—
|
|
$
|
—
|
|
—
|
|
$
|
500.0
|
|
||||
|
November 1 - November 30
|
1,131,000
|
|
41.33
|
|
1,131,000
|
|
453.3
|
|
||||||
|
December 1 - December 31
|
800,200
|
|
42.01
|
|
800,200
|
|
419.6
|
|
||||||
|
Total
|
1,931,200
|
|
$
|
41.61
|
|
1,931,200
|
|
|||||||
|
(1)
|
In October 2016, the board of directors authorized a repurchase of up to
$500 million
of the Company’s outstanding common stock, par value
$0.01
per share, through October 26, 2019. Repurchases may be made in the open market or through privately negotiated transactions, in accordance with applicable securities laws and regulations, including pursuant to repurchase plans designed to comply with Rule 10b5-1 of the Securities Exchange Act of 1934, as amended. The timing and amount of any repurchases is subject to market and other conditions.
|
34
Stock Price Performance Graph
The graph below shows the cumulative total stockholder return, assuming an investment of $100 and dividend reinvestment, for the period beginning on December 31, 2011 and ending on
December 31, 2016
, on each of KAR Auction Services' common stock, the Standard & Poor's 400 Midcap Index and the Standard and Poor's 500 Index. Our stock price performance shown in the following graph is not indicative of future stock price performance.
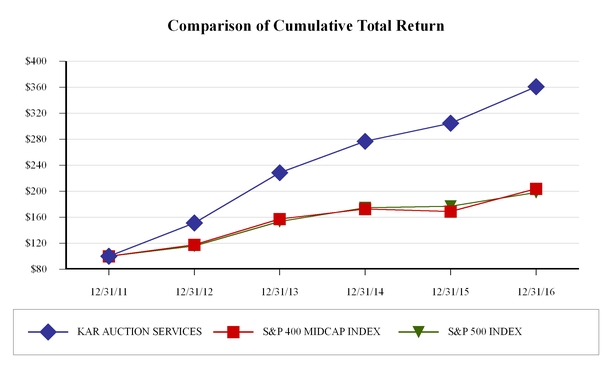
|
Company/Index
|
Base Period
12/31/2011
|
12/31/2012
|
12/31/2013
|
12/31/2014
|
12/31/2015
|
12/31/2016
|
|||||||||||||||||
|
KAR Auction Services, Inc.
|
$
|
100
|
|
$
|
151.44
|
|
$
|
228.63
|
|
$
|
276.88
|
|
$
|
304.58
|
|
$
|
361.01
|
|
|||||
|
S&P 400 Midcap Index
|
$
|
100
|
|
$
|
117.88
|
|
$
|
157.37
|
|
$
|
172.74
|
|
$
|
168.99
|
|
$
|
204.03
|
|
|||||
|
S&P 500 Index
|
$
|
100
|
|
$
|
116.00
|
|
$
|
153.57
|
|
$
|
174.60
|
|
$
|
177.01
|
|
$
|
198.18
|
|
|||||
35
The following selected financial data should be read in conjunction with "Management's Discussion and Analysis of Financial Condition and Results of Operations," the audited consolidated financial statements and related notes thereto of KAR Auction Services, Inc. and other financial information included elsewhere in this Annual Report on Form 10-K.
Selected Financial Data of KAR Auction Services
For the Years Ended
December 31, 2016
,
2015
,
2014
,
2013
and
2012
The following consolidated financial data for the years ended
December 31, 2016
,
2015
,
2014
,
2013
and
2012
is based on our audited financial statements.
|
|
Year Ended December 31,
|
||||||||||||||||||
|
(Dollars in millions except per share amounts)
|
2016
|
2015
|
2014
|
2013
|
2012
|
||||||||||||||
|
Operations:
|
|
|
|
|
|
||||||||||||||
|
Operating revenues
|
|
|
|
|
|
||||||||||||||
|
ADESA
(1)
|
$
|
1,765.3
|
|
$
|
1,427.8
|
|
$
|
1,271.0
|
|
$
|
1,165.5
|
|
$
|
1,097.2
|
|
||||
|
IAA
|
1,098.0
|
|
994.4
|
|
895.9
|
|
830.0
|
|
716.1
|
|
|||||||||
|
AFC
|
286.8
|
|
268.4
|
|
250.1
|
|
224.7
|
|
193.8
|
|
|||||||||
|
Total operating revenues
|
$
|
3,150.1
|
|
$
|
2,690.6
|
|
$
|
2,417.0
|
|
$
|
2,220.2
|
|
$
|
2,007.1
|
|
||||
|
Operating expenses
(exclusive of depreciation and amortization)
(1)
|
2,410.5
|
|
2,050.5
|
|
1,842.7
|
|
1,769.1
|
|
1,549.9
|
|
|||||||||
|
Operating profit
|
499.0
|
|
427.3
|
|
377.7
|
|
256.7
|
|
267.0
|
|
|||||||||
|
Interest expense
|
138.8
|
|
91.4
|
|
86.2
|
|
104.7
|
|
119.4
|
|
|||||||||
|
Net income
|
222.4
|
|
214.6
|
|
169.3
|
|
67.7
|
|
92.0
|
|
|||||||||
|
Net income per share
|
|
|
|
|
|
||||||||||||||
|
Basic
|
1.62
|
|
1.53
|
|
1.21
|
|
0.49
|
|
0.67
|
|
|||||||||
|
Diluted
|
1.60
|
|
1.51
|
|
1.19
|
|
0.48
|
|
0.66
|
|
|||||||||
|
Weighted average shares outstanding
|
|
|
|
|
|
||||||||||||||
|
Basic
|
137.6
|
|
140.1
|
|
140.2
|
|
137.9
|
|
136.5
|
|
|||||||||
|
Diluted
|
139.1
|
|
142.3
|
|
141.8
|
|
140.8
|
|
139.0
|
|
|||||||||
|
Cash dividends declared per common share
|
1.19
|
|
1.08
|
|
1.02
|
|
0.82
|
|
0.19
|
|
|||||||||
|
|
As of December 31,
|
||||||||||||||||||
|
|
2016
|
2015
|
2014
|
2013
|
2012
|
||||||||||||||
|
Financial Position:
|
|
|
|
|
|
||||||||||||||
|
Working capital
(2)(3)
|
$
|
506.2
|
|
$
|
232.2
|
|
$
|
490.2
|
|
$
|
366.0
|
|
$
|
297.6
|
|
||||
|
Total assets
(3)
|
6,557.6
|
|
5,771.5
|
|
5,334.8
|
|
5,089.3
|
|
4,897.4
|
|
|||||||||
|
Total debt, net of unamortized debt issuance costs/discounts
(2)
|
2,470.3
|
|
1,865.1
|
|
1,743.5
|
|
1,738.4
|
|
1,796.5
|
|
|||||||||
|
Total stockholders' equity
|
1,397.3
|
|
1,386.1
|
|
1,547.1
|
|
1,481.8
|
|
1,443.7
|
|
|||||||||
|
|
Year Ended December 31,
|
||||||||||||||||||
|
|
2016
|
2015
|
2014
|
2013
|
2012
|
||||||||||||||
|
Other Financial Data:
|
|
|
|
|
|
||||||||||||||
|
Net cash provided by operating activities
|
$
|
360.8
|
|
$
|
475.0
|
|
$
|
431.3
|
|
$
|
434.0
|
|
$
|
290.2
|
|
||||
|
Capital expenditures
|
155.1
|
|
134.7
|
|
101.0
|
|
96.6
|
|
102.0
|
|
|||||||||
|
Depreciation and amortization
|
240.6
|
|
212.8
|
|
196.6
|
|
194.4
|
|
190.2
|
|
|||||||||
___________________________________________________________________
|
(1)
|
Prior to 2016, the gross selling prices for certain vehicles owned and subsequently sold by ADESA were incorrectly netted against cost of services, but have been deemed immaterial. Beginning in 2016, the gross selling prices of the owned vehicles were included in revenue and costs of services, resulting in an increase to ADESA’s revenue and a corresponding increase in cost of services. Prior year amounts have been revised to reflect these changes. For the years ended December
|
36
31, 2016, 2015, 2014, 2013 and 2012 “ADESA revenue” and “Cost of services” were increased by $60.6 million, $51.0 million, $52.5 million, $46.9 million and $43.7 million, respectively. For further information, see Note 2 to the Consolidated Financial Statements, included elsewhere in this Annual Report on Form 10-K.
|
(2)
|
Working capital is defined as current assets less current liabilities.
|
|
(3)
|
Amounts prior to 2016 have been adjusted to reflect the adoption of ASU 2015-03. The update required debt issuance costs related to a recognized debt liability to be presented in the balance sheet as a direct deduction from the carrying amount of the related debt liability instead of being presented as an asset. For further information, see Note 2 to the Consolidated Financial Statements, included elsewhere in this Annual Report on Form 10-K.
|
37
The following discussion and analysis of our financial condition and results of operations should be read in conjunction with the "Selected Financial Data" and the consolidated financial statements and notes thereto included elsewhere in this Annual Report on Form 10-K.
Forward-Looking Statements
This Annual Report on Form 10-K contains forward-looking statements within the meaning of the Private Securities Litigation Reform Act of 1995 and which are subject to certain risks, trends and uncertainties. In particular, statements made in this report on Form 10-K that are not historical facts (including, but not limited to, expectations, estimates, assumptions and projections regarding the industry, business, future operating results, potential acquisitions and anticipated cash requirements) may be forward-looking statements. Words such as "should," "may," "will," "anticipates," "expects," "intends," "plans," "believes," "seeks," "estimates" and similar expressions identify forward-looking statements. Such statements, including statements regarding our future growth; anticipated cost savings, revenue increases, credit losses and capital expenditures; dividend declarations and payments; common stock repurchases; strategic initiatives, greenfields and acquisitions; our competitive position and retention of customers; and our continued investment in information technology, are not guarantees of future performance and are subject to risks and uncertainties that could cause actual results to differ materially from the results projected, expressed or implied by these forward-looking statements. Factors that could cause or contribute to such differences include, but are not limited to, those discussed in Item 1A "Risk Factors" of this Annual Report on Form 10-K. Some of these factors include:
|
•
|
our ability to successfully implement our business strategies or realize expected cost savings and revenue enhancements;
|
|
•
|
our ability to effectively maintain or update information and technology systems;
|
|
•
|
our ability to implement and maintain measures to protect against cyber-attacks;
|
|
•
|
significant current competition and the introduction of new competitors;
|
|
•
|
competitive pricing pressures;
|
|
•
|
any losses of key personnel;
|
|
•
|
our ability to meet or exceed customers' expectations, as well as develop and implement information systems responsive to customer needs;
|
|
•
|
business development activities, including greenfields, acquisitions and integration of acquired businesses;
|
|
•
|
costs associated with the acquisition of businesses or technologies;
|
|
•
|
fluctuations in consumer demand for and in the supply of used, leased and salvage vehicles and the resulting impact on auction sales volumes, conversion rates and loan transaction volumes;
|
|
•
|
our ability to obtain land or renew/enter into new leases at commercially reasonable rates;
|
|
•
|
decreases in the number of used vehicles sold at physical auctions;
|
|
•
|
changes in the market value of vehicles auctioned, including changes in the actual cash value of salvage vehicles;
|
|
•
|
trends in new and used vehicle sales and incentives, including wholesale used vehicle pricing;
|
|
•
|
the ability of consumers to lease or finance the purchase of new and/or used vehicles;
|
|
•
|
the ability to recover or collect from delinquent or bankrupt customers;
|
|
•
|
economic conditions including fuel prices, commodity prices, foreign exchange rates and interest rate fluctuations;
|
|
•
|
trends in the vehicle remarketing industry;
|
|
•
|
trends in the number of commercial vehicles being brought to auction, in particular off-lease volumes;
|
|
•
|
changes in the volume of vehicle production, including capacity reductions at the major original equipment manufacturers;
|
|
•
|
laws, regulations and industry standards, including changes in regulations governing the sale of used vehicles, the processing of salvage vehicles and commercial lending activities;
|
38
|
•
|
our ability to maintain our brand and protect our intellectual property;
|
|
•
|
the costs of environmental compliance and/or the imposition of liabilities under environmental laws and regulations;
|
|
•
|
weather, including increased expenses as a result of catastrophic events;
|
|
•
|
general business conditions;
|
|
•
|
our substantial amount of debt;
|
|
•
|
restrictive covenants in our debt agreements;
|
|
•
|
our assumption of the settlement risk for vehicles sold;
|
|
•
|
litigation developments;
|
|
•
|
our self-insurance for certain risks;
|
|
•
|
interruptions to service from our workforce;
|
|
•
|
any impairment to our goodwill or other intangible assets;
|
|
•
|
changes in effective tax rates;
|
|
•
|
changes to accounting standards; and
|
|
•
|
other risks described from time to time in our filings with the SEC, including the Quarterly Reports on Form 10-Q to be filed by us in 2017.
|
Many of these risk factors are outside of our control, and as such, they involve risks which are not currently known that could cause actual results to differ materially from those discussed or implied herein. The forward-looking statements in this document are made as of the date on which they are made and we do not undertake to update our forward-looking statements.
Our future growth depends on a variety of factors, including our ability to increase vehicle sold volumes and loan transaction volumes, expand our product and service offerings, including information systems development, acquire and integrate additional business entities, manage expansion, control costs in our operations, introduce fee increases, and retain our executive officers and key employees. We cannot predict whether our growth strategy will be successful. In addition, we cannot predict what portion of overall sales will be conducted through online auctions or other remarketing methods in the future and what impact this may have on our auction business.
Overview
We provide whole car auction services and salvage auction services in North America and the United Kingdom. Our business is divided into three reportable business segments, each of which is an integral part of the vehicle remarketing industry: ADESA Auctions, IAA and AFC.
|
•
|
The ADESA Auctions segment serves a domestic and international customer base through live and online auctions and through
77
whole car auction facilities in North America that are developed and strategically located to draw professional sellers and buyers together and allow the buyers to inspect and compare vehicles remotely or in person. Through ADESA.com, powered by Openlane technology, ADESA offers comprehensive private label remarketing solutions to automobile manufacturers, captive finance companies and other institutions to offer vehicles via the Internet prior to arrival at the physical auction. Vehicles at ADESA's auctions are typically sold by commercial fleet operators, financial institutions, rental car companies, new and used vehicle dealers and vehicle manufacturers and their captive finance companies to franchise and independent used vehicle dealers. ADESA also provides value-added ancillary services including inbound and outbound transportation logistics, reconditioning, vehicle inspection and certification, titling, administrative and collateral recovery services. ADESA also includes ADESA Remarketing Limited, an online whole car vehicle remarketing business in the United Kingdom.
|
|
•
|
The IAA segment serves a domestic and international customer base through live and online auctions and through
172
salvage vehicle auction sites in the United States and Canada at
December 31, 2016
. IAA also includes HBC, which operates from
11
locations in the United Kingdom. The salvage auctions facilitate the remarketing of damaged vehicles designated as total losses by insurance companies, charity donation vehicles, recovered stolen (or theft) vehicles and low value used vehicles. The salvage auction business specializes in providing services such as inbound transportation, titling, salvage recovery and claims settlement administrative services.
|
39
|
•
|
The AFC segment provides short-term, inventory-secured financing, known as floorplan financing, primarily to independent used vehicle dealers. At
December 31, 2016
, AFC conducted business at
126
locations in the United States and Canada. The Company also sells vehicle service contracts through Preferred Warranties, Inc. ("PWI").
|
The holding company is maintained separately from the three reportable segments and includes expenses associated with the corporate offices, such as salaries, benefits and travel costs for our management team, certain human resources, information technology and accounting costs, and certain insurance, treasury, legal and risk management costs. Holding company interest expense includes the interest expense incurred on capital leases and the corporate debt structure. Intercompany charges relate primarily to interest on intercompany debt or receivables and certain administrative costs allocated by the holding company.
Industry Trends
Whole Car
Used vehicles sold in North America through whole car auctions, including online only sales, were approximately
9.2 million
,
9.9 million
and an estimated
10.6 million
in
2014
,
2015
and
2016
, respectively. We expect that used vehicle auction volumes in North America, including online only volumes, will be over 10.6 million units in 2017, 2018 and 2019. Our estimates are based on information from the Bureau of Economic Analysis, IHS Automotive, Kontos Total Market Estimates, NAAA's 2015 Annual Review and management estimates. A primary driver of the anticipated improvement is more off-lease and repossessed vehicles entering the market over the next three years.
Salvage
Vehicles deemed a total loss by automobile insurance companies represent the largest category of vehicles sold in the salvage vehicle auction industry. The percentage of claims resulting in total losses was approximately 17% in
2016
, 16% in 2015 and 14% in 2014. There is no central reporting system for the salvage vehicle auction industry that tracks the number of salvage vehicle auction volumes in any given year, which makes estimating industry volumes difficult.
Fluctuations in used vehicle and commodity pricing (aluminum, steel, etc.) have an impact on proceeds received in the salvage vehicle auction industry. In times of rising prices, revenue and gross profit are positively impacted. If used vehicle and commodity prices decrease, as the industry has recently experienced, proceeds, revenue and gross profit at salvage auctions may be negatively impacted, which could adversely affect the level of profitability. For example, the average price per ton of crushed auto bodies in North America decreased from $312 in December 2013 to $198 in December 2014 to $115 in December 2015. This reduction in the price of crushed auto bodies has had an adverse impact on the value of salvage vehicles being sold in the salvage auction industry and resulted in reduced revenue per vehicle sold and gross profit. During 2016, the price per ton of crushed auto bodies in North America has ranged from $109 to $188 and finished December 2016 at $136.
Automotive Finance
AFC works with independent used vehicle dealers to improve their results by providing a comprehensive set of business and financial solutions that leverages its local branches, industry experience and scale, as well as KAR affiliations. Over the last few years AFC's North American dealer base grew from over 9,700 dealers in 2009 to approximately 15,700 dealers in
2016
and loan transactions, which includes both loans paid off and loans curtailed, grew from approximately 800,000 in 2009 to approximately 1,718,000 in
2016
. As a result of this increased activity, AFC is experiencing increased competition.
Key challenges for the independent used vehicle dealer include demand for used vehicles, disruptions in pricing of used vehicle inventory and lack of access to consumer financing. These same challenges, to the extent they occur, could result in a material negative impact on AFC's results of operations. A significant decline in used vehicle sales would result in a decrease in consumer auto loan originations and an increased number of dealers defaulting on their loans. In addition, volatility in wholesale vehicle pricing impacts the value of recovered collateral on defaulted loans and the resulting severity of credit losses at AFC.
Seasonality
The volume of vehicles sold through our auctions generally fluctuates from quarter-to-quarter. This seasonality is caused by several factors including weather, the timing of used vehicles available for sale from selling customers, the availability and quality of salvage vehicles, holidays, and the seasonality of the retail market for used vehicles, which affects the demand side of the auction industry. Used vehicle auction volumes tend to decline during prolonged periods of winter weather conditions. In addition, mild weather conditions and decreases in traffic volume can each lead to a decline in the available supply of salvage vehicles because fewer traffic accidents occur, resulting in fewer damaged vehicles overall. As a result, revenues and operating expenses related to volume will fluctuate accordingly on a quarterly basis. The fourth calendar quarter typically experiences lower used vehicle auction volume as well as additional costs associated with the holidays and winter weather.
40
Sources of Revenues and Expenses
Our revenue is derived from auction fees and related services associated with our whole car and salvage auctions, and from dealer financing fees, interest income and other service revenue at AFC. Although auction revenues primarily include the auction services and related fees, our related receivables and payables include the gross value of the vehicles sold.
Prior to 2016, the gross selling prices for certain vehicles owned and subsequently sold by ADESA were incorrectly netted against cost of services. Beginning in 2016, the gross selling prices of the owned vehicles were included in revenue and costs of services, resulting in an increase to ADESA’s revenue and a corresponding increase in cost of services. Prior year amounts have been reclassified to reflect these changes. For further information, see Note 2 to the Consolidated Financial Statements, included elsewhere in this Annual Report on Form 10-K.
Our operating expenses consist of cost of services, selling, general and administrative and depreciation and amortization. Cost of services is composed of payroll and related costs, subcontract services, the cost of vehicles purchased, supplies, insurance, property taxes, utilities, service contract claims, maintenance and lease expense related to the auction sites and loan offices. Cost of services excludes depreciation and amortization. Selling, general and administrative expenses are composed of payroll and related costs, sales and marketing, information technology services and professional fees.
41
Results of Operations
Overview of Results of KAR Auction Services, Inc. for the Years Ended
December 31, 2016
and
2015
:
|
|
Year Ended
December 31,
|
||||||
|
(Dollars in millions except per share amounts)
|
2016
|
2015
|
|||||
|
Revenues
|
|
|
|||||
|
ADESA
|
$
|
1,765.3
|
|
$
|
1,427.8
|
|
|
|
IAA
|
1,098.0
|
|
994.4
|
|
|||
|
AFC
|
286.8
|
|
268.4
|
|
|||
|
Total revenues
|
3,150.1
|
|
2,690.6
|
|
|||
|
Cost of services*
|
1,827.4
|
|
1,548.5
|
|
|||
|
Gross profit*
|
1,322.7
|
|
1,142.1
|
|
|||
|
Selling, general and administrative
|
583.1
|
|
502.0
|
|
|||
|
Depreciation and amortization
|
240.6
|
|
212.8
|
|
|||
|
Operating profit
|
499.0
|
|
427.3
|
|
|||
|
Interest expense
|
138.8
|
|
91.4
|
|
|||
|
Other income, net
|
(0.5
|
)
|
(4.6
|
)
|
|||
|
Loss on extinguishment of debt
|
5.4
|
|
—
|
|
|||
|
Income before income taxes
|
355.3
|
|
340.5
|
|
|||
|
Income taxes
|
132.9
|
|
125.9
|
|
|||
|
Net income
|
$
|
222.4
|
|
$
|
214.6
|
|
|
|
Net income per share
|
|
|
|||||
|
Basic
|
$
|
1.62
|
|
$
|
1.53
|
|
|
|
Diluted
|
$
|
1.60
|
|
$
|
1.51
|
|
|
* Exclusive of depreciation and amortization
Overview
For the year ended
December 31, 2016
, we had revenue of
$3,150.1 million
compared with revenue of
$2,690.6 million
for the year ended
December 31, 2015
, an increase of
17%
. For a further discussion of revenues, gross profit and selling, general and administrative expenses, see the segment results discussions below.
Depreciation and Amortization
Depreciation and amortization increased
$27.8 million
, or
13%
, to
$240.6 million
for the year ended
December 31, 2016
, compared with
$212.8 million
for the year ended
December 31, 2015
. The increase in depreciation and amortization was primarily the result of certain assets placed in service over the last twelve months and depreciation and amortization for the assets of businesses acquired in 2015 and 2016.
Interest Expense
Interest expense increased
$47.4 million
, or
52%
, to
$138.8 million
for the year ended
December 31, 2016
, compared with
$91.4 million
for the year ended
December 31, 2015
. The increase was primarily attributable to the interest associated with the new Term Loan B-3, the increase in interest rate on Term Loan B-2, as well as the interest associated with outstanding revolver borrowings. In addition, there was an increase in interest expense at AFC of $10.0 million, which resulted from an increase in the average portfolio financed in
2016
as compared with
2015
.
Loss on Extinguishment of Debt
In March 2016, we amended our Credit Agreement and recorded a $4.0 million pretax charge resulting from the write-off of unamortized debt issue costs associated with Term Loan B-1 and unamortized debt issue costs associated with the old revolving credit facility. Additionally, in December 2016, we recorded a $1.4 million pretax charge primarily resulting from the write-off of a portion of unamortized securitization issuance costs associated with AFC's Receivables Purchase Agreement.
42
Income Taxes
We had an effective tax rate of 37.4% for the year ended
December 31, 2016
, compared with an effective tax rate of 37.0% for the year ended
December 31, 2015
.
Impact of Foreign Currency
The strengthening of the U.S. dollar has impacted the reporting of our Canadian operations in U.S. dollars. For the year ended
December 31, 2016
, fluctuations in the Canadian exchange rate decreased revenue by $11.9 million, operating profit by $4.0 million, net income by $2.3 million and net income per diluted share by $0.02.
ADESA Results
|
|
Year Ended
December 31,
|
||||||
|
(Dollars in millions)
|
2016
|
2015
|
|||||
|
ADESA revenue
|
$
|
1,765.3
|
|
$
|
1,427.8
|
|
|
|
Cost of services*
|
1,036.5
|
|
836.9
|
|
|||
|
Gross profit*
|
728.8
|
|
590.9
|
|
|||
|
Selling, general and administrative
|
327.0
|
|
276.6
|
|
|||
|
Depreciation and amortization
|
100.0
|
|
86.2
|
|
|||
|
Operating profit
|
$
|
301.8
|
|
$
|
228.1
|
|
|
|
Vehicles sold
|
2,885,000
|
|
2,465,000
|
|
|||
* Exclusive of depreciation and amortization
Note: Prior to 2016, the gross selling prices for certain vehicles owned and subsequently sold by ADESA were incorrectly netted against cost of services. At December 31, 2016, the gross selling prices of the owned vehicles were included in revenue and costs of services, resulting in an increase to ADESA’s revenue and a corresponding increase in cost of services. For the year ended December 31, 2016, “ADESA revenue” and “Cost of services” have both been increased by $60.6 million. For the year ended December 31, 2015, “ADESA revenue” and “Cost of services” have both been increased by $51.0 million.
Revenue
Revenue from ADESA increased
$337.5 million
, or
24%
, to
$1,765.3 million
for the year ended
December 31, 2016
, compared with
$1,427.8 million
for the year ended
December 31, 2015
. The increase in revenue was primarily a result of a 17% increase in the number of vehicles sold (9% increase excluding acquisitions), as well as a 6% increase in revenue per vehicle sold. Businesses acquired in 2016 and 2015 accounted for an increase in revenue of $137.1 million. Revenue decreased $8.5 million due to fluctuations in the Canadian exchange rate.
The increase in volume sold was primarily attributable to a 22% increase in institutional volume (16% increase excluding acquisitions), including vehicles sold on our online only platform, as well as a 9% increase in dealer consignment units sold (2% decrease excluding acquisitions) for the year ended
December 31, 2016
compared with the year ended
December 31, 2015
. Online sales volume for ADESA represented approximately 42% of the total vehicles sold in
2016
, compared with approximately 40% in
2015
. "Online sales" includes the following: (i) selling vehicles directly from a dealership or other interim storage location (upstream selling); (ii) online solutions that offer vehicles for sale while in transit to auction locations (midstream selling); (iii) simultaneously broadcasting video and audio of the physical auctions to online bidders (LiveBlock
®
); and (iv) bulletin-board or real-time online auctions (DealerBlock
®
). Upstream and midstream selling represent online only sales, which accounted for approximately 63% of ADESA's online sales volume. ADESA sold approximately 743,000 and 592,000 vehicles through its online only offerings in
2016
and
2015
, respectively, of which approximately 385,000 and 352,000 represented vehicle sales to grounding dealers in
2016
and
2015
, respectively. For the year ended
December 31, 2016
, dealer consignment vehicles represented approximately 48% of used vehicles sold at ADESA physical auction locations, compared with approximately 50% for the year ended
December 31, 2015
. Vehicles sold at physical auction locations increased 14% (4% increase excluding acquisitions) in
2016
, compared with
2015
. The used vehicle conversion percentage at North American physical auction locations, calculated as the number of vehicles sold as a percentage of the number of vehicles entered for sale at our ADESA auctions was 58.3% for the years ended
December 31, 2016
and
2015
.
Physical auction revenue per vehicle sold increased $53, or 7%, to $781 for the year ended
December 31, 2016
, compared with $728 for the year ended
December 31, 2015
. Physical auction revenue per vehicle sold includes revenue from seller and
43
buyer auction fees and ancillary and other related services, which includes non-auction services and the sale of purchased vehicles. The increase in physical auction revenue per vehicle sold was primarily attributable to an increase in lower margin ancillary and other related services revenue, including revenue from certain businesses acquired, partially offset by a decrease in physical auction revenue per vehicle sold of $4 due to fluctuations in the Canadian exchange rate. Excluding vehicles purchased, physical auction revenue per vehicle would have been $753 and $701 for the year ended
December 31, 2016
and
2015
, respectively.
Online only auction revenue per vehicle sold increased $17 to $124 for the year ended
December 31, 2016
, compared with $107 for the year ended
December 31, 2015
. The increase in online only auction revenue per vehicle sold was attributable to an increase in purchased vehicles associated with the ADESA Assurance Program and an increase in the mix of cars sold in closed sales to non-grounding dealers, partially offset by a decrease in online only auction revenue per vehicle sold of $1 due to fluctuations in the Canadian exchange rate. Excluding vehicles purchased as part of the ADESA Assurance Program, online only revenue per vehicle would have been $110 and $102 for the year ended
December 31, 2016
and
2015
, respectively.
Gross Profit
For the year ended
December 31, 2016
, gross profit for ADESA increased
$137.9 million
, or
23%
, to
$728.8 million
, compared with
$590.9 million
for the year ended
December 31, 2015
. Gross profit for ADESA was
41.3%
of revenue for the year ended
December 31, 2016
, compared with 41.4% of revenue for the year ended
December 31, 2015
. The increase in gross profit was mainly attributable to the 17% increase in the number of vehicles sold.
Selling, General and Administrative
Selling, general and administrative expenses for the ADESA segment increased
$50.4 million
, or
18%
, to
$327.0 million
for the year ended
December 31, 2016
, compared with
$276.6 million
for the year ended
December 31, 2015
, primarily due to increases in selling, general and administrative expenses associated with acquisitions of $27.7 million, compensation expense of $11.8 million, bad debt expense of $5.1 million, information technology costs of $3.3 million, professional fees of $1.9 million, benefit-related expenses of $1.6 million, supply and mailing expenses of $1.5 million and other miscellaneous expenses aggregating $3.8 million, partially offset by a decrease in marketing expenses of $3.1 million, a decrease in the loss on disposal of certain assets of $1.7 million and fluctuations in the Canadian exchange rate of $1.5 million.
IAA Results
|
|
Year Ended
December 31,
|
||||||
|
(Dollars in millions)
|
2016
|
2015
|
|||||
|
IAA revenue
|
$
|
1,098.0
|
|
$
|
994.4
|
|
|
|
Cost of services*
|
708.0
|
|
633.6
|
|
|||
|
Gross profit*
|
390.0
|
|
360.8
|
|
|||
|
Selling, general and administrative
|
104.2
|
|
98.1
|
|
|||
|
Depreciation and amortization
|
87.9
|
|
80.8
|
|
|||
|
Operating profit
|
$
|
197.9
|
|
$
|
181.9
|
|
|
|
Vehicles sold
|
2,184,000
|
|
1,970,000
|
|
|||
* Exclusive of depreciation and amortization
Revenue
Revenue from IAA increased
$103.6 million
, or
10%
, to
$1,098.0 million
for the year ended
December 31, 2016
, compared with
$994.4 million
for the year ended
December 31, 2015
, and included an increase in revenue of $25.8 million from HBC (HBC was acquired in June 2015). The increase in revenue was a result of an increase in vehicles sold of approximately 11% (10% excluding HBC) for the year ended
December 31, 2016
, partially offset by a decrease in revenue of $6.9 million due to fluctuations in the U.K. exchange rate and $2.8 million due to fluctuations in the Canadian exchange rate. Revenue per vehicle sold was consistent year over year. IAA's North American same-store total loss vehicle inventory increased approximately 25% at December 31, 2016, as compared to December 31, 2015, in part related to recent catastrophic events. Vehicles sold under purchase agreements were approximately 7% (5% excluding HBC) and 7% (6% excluding HBC) of total salvage vehicles sold for the year ended
December 31, 2016
and
2015
, respectively. Online sales volumes for IAA for the years ended
December 31, 2016
and
2015
represented approximately 60% of the total vehicles sold by IAA.
44
Gross Profit
For the year ended
December 31, 2016
, gross profit at IAA increased to
$390.0 million
, or
35.5%
of revenue, compared with
$360.8 million
, or 36.3% of revenue, for the year ended
December 31, 2015
. The increase in gross profit was mainly attributable to a
10%
increase in revenue, partially offset by a
12%
increase in cost of services, which included costs associated with purchase contract vehicles and volume growth. Excluding HBC, IAA's gross profit margin was 36.7% and 37.0% for the year ended
December 31, 2016
and
2015
, respectively. For the year ended
December 31, 2016
and
2015
, HBC had revenue of approximately $51.6 million and $25.8 million, respectively, and cost of services of approximately $45.8 million and $23.5 million, respectively, as the majority of HBC's vehicles are sold under purchase contracts. HBC accounted for a 0.5% decrease in IAA's gross profit margin percentage for the year ended
December 31, 2016
.
Selling, General and Administrative
Selling, general and administrative expenses at IAA increased
$6.1 million
, or
6%
, to
$104.2 million
for the year ended
December 31, 2016
, compared with
$98.1 million
for the year ended
December 31, 2015
. The increase in selling, general and administrative expenses was primarily attributable to an increase in expenses at HBC of $1.5 million, increases in stock-based compensation expense of $1.3 million, telecom costs of $1.1 million, bad debt expense of $0.9 million, benefit-related expenses of $0.9 million, non-income based taxes of $0.7 million, employee related expenses of $0.4 million, incentive-based compensation of $0.4 million and other miscellaneous expenses aggregating $1.3 million, partially offset by decreases in professional fees of $1.6 million and travel expenses of $0.8 million.
AFC Results
|
|
Year Ended
December 31,
|
||||||
|
(Dollars in millions except volumes and per loan amounts)
|
2016
|
2015
|
|||||
|
AFC revenue
|
|
||||||
|
Interest and fee income
|
$
|
275.1
|
|
$
|
246.8
|
|
|
|
Other revenue
|
10.3
|
|
9.7
|
|
|||
|
Provision for credit losses
|
(30.7
|
)
|
(16.0
|
)
|
|||
|
Other service revenue
|
32.1
|
|
27.9
|
|
|||
|
Total AFC revenue
|
286.8
|
|
268.4
|
|
|||
|
Cost of services*
|
82.9
|
|
78.0
|
|
|||
|
Gross profit*
|
203.9
|
|
190.4
|
|
|||
|
Selling, general and administrative
|
28.7
|
|
27.8
|
|
|||
|
Depreciation and amortization
|
31.1
|
|
30.8
|
|
|||
|
Operating profit
|
$
|
144.1
|
|
$
|
131.8
|
|
|
|
Loan transactions
|
1,718,000
|
|
1,607,000
|
|
|||
|
Revenue per loan transaction, excluding "Other service revenue"
|
$
|
148
|
|
$
|
150
|
|
|
* Exclusive of depreciation and amortization
Revenue
For the year ended
December 31, 2016
, AFC revenue increased
$18.4 million
, or
7%
, to
$286.8 million
, compared with
$268.4 million
for the year ended
December 31, 2015
. The increase in revenue was the result of a 7% increase in loan transactions and an increase of 15% in "Other service revenue" generated by PWI, partially offset by an increase in the provision for credit losses to 1.8% of the average managed receivables for the year ended
December 31, 2016
. The increase in revenue and decrease in revenue per loan transaction included the impact of a decrease in revenue of $0.6 million due to fluctuations in the Canadian exchange rate. In addition, managed receivables increased to
$1,792.2 million
at
December 31, 2016
from
$1,641.0 million
at
December 31, 2015
.
Revenue per loan transaction, which includes both loans paid off and loans curtailed, decreased $2, or 1%, primarily as a result of an increase in the provision for credit losses, a decrease in floorplan fee income per unit and a decrease in interest yield, partially offset by increases in average loan values, other revenue and average portfolio duration. Revenue per loan transaction excludes "Other service revenue."
45
The provision for credit losses has increased to 1.8% from 1.1% of the average managed receivables for the year ended
December 31, 2016
compared with the year ended
December 31, 2015
. In the current credit environment, the provision for credit losses is expected to be approximately 1.75% to 2.25%, annually, of the average managed receivables balance. However, the actual losses in any particular quarter could deviate from this range.
Gross Profit
For the year ended
December 31, 2016
, gross profit for the AFC segment increased
$13.5 million
, or
7%
, to
$203.9 million
, or
71.1%
of revenue, compared with
$190.4 million
, or 70.9% of revenue, for the year ended
December 31, 2015
, primarily as a result of a
7%
increase in revenue, partially offset by a
6%
increase in cost of services. The floorplan lending business gross profit margin percentage increased from 77.5% to 77.7%. The gross profit margin percentage in the warranty service contract business also improved.
Selling, General and Administrative
Selling, general and administrative expenses at AFC increased
$0.9 million
, or
3%
, to
$28.7 million
for the year ended
December 31, 2016
, compared with
$27.8 million
for the year ended
December 31, 2015
. The increase was primarily attributable to increases in stock-based compensation expense of $0.7 million, information technology costs of $0.7 million and other miscellaneous expenses aggregating $0.5 million, partially offset by a decrease in incentive-based compensation of $0.6 million and a decrease in selling, general and administrative costs at PWI of $0.4 million.
Holding Company Results
|
|
Year Ended
December 31,
|
||||||
|
(Dollars in millions)
|
2016
|
2015
|
|||||
|
Selling, general and administrative
|
$
|
123.2
|
|
$
|
99.5
|
|
|
|
Depreciation and amortization
|
21.6
|
|
15.0
|
|
|||
|
Operating loss
|
$
|
(144.8
|
)
|
$
|
(114.5
|
)
|
|
Selling, General and Administrative
For the year ended
December 31, 2016
, selling, general and administrative expenses at the holding company increased
$23.7 million
, or
24%
, to
$123.2 million
, compared with
$99.5 million
for the year ended
December 31, 2015
, primarily as a result of increases in compensation expense of $8.7 million, professional fees of $7.5 million, stock-based compensation expense of $3.4 million, incentive-based compensation expense of $1.8 million, acquisition-related professional fees of $1.7 million and other miscellaneous expenses aggregating $2.2 million, partially offset by a decrease in medical expenses of $1.6 million. The Company has increased Holding Company expenses to support the growing businesses of KAR. The increase in expenses relate to costs associated with talent management, technology and support of strategic initiatives.
46
Overview of Results of KAR Auction Services, Inc. for the Years Ended
December 31, 2015
and
2014
:
|
|
Year Ended
December 31,
|
||||||
|
(Dollars in millions except per share amounts)
|
2015
|
2014
|
|||||
|
Revenues
|
|
|
|||||
|
ADESA
|
$
|
1,427.8
|
|
$
|
1,271.0
|
|
|
|
IAA
|
994.4
|
|
895.9
|
|
|||
|
AFC
|
268.4
|
|
250.1
|
|
|||
|
Total revenues
|
2,690.6
|
|
2,417.0
|
|
|||
|
Cost of services*
|
1,548.5
|
|
1,371.3
|
|
|||
|
Gross profit*
|
1,142.1
|
|
1,045.7
|
|
|||
|
Selling, general and administrative
|
502.0
|
|
471.4
|
|
|||
|
Depreciation and amortization
|
212.8
|
|
196.6
|
|
|||
|
Operating profit
|
427.3
|
|
377.7
|
|
|||
|
Interest expense
|
91.4
|
|
86.2
|
|
|||
|
Other income, net
|
(4.6
|
)
|
(3.8
|
)
|
|||
|
Loss on extinguishment of debt
|
—
|
|
30.3
|
|
|||
|
Income before income taxes
|
340.5
|
|
265.0
|
|
|||
|
Income taxes
|
125.9
|
|
95.7
|
|
|||
|
Net income
|
$
|
214.6
|
|
$
|
169.3
|
|
|
|
Net income per share
|
|
|
|||||
|
Basic
|
$
|
1.53
|
|
$
|
1.21
|
|
|
|
Diluted
|
$
|
1.51
|
|
$
|
1.19
|
|
|
* Exclusive of depreciation and amortization
Revenue
For the year ended December 31, 2015, we had revenue of $
2,690.6 million
compared with revenue of $
2,417.0 million
for the year ended December 31, 2014, an increase of 11%. For a further discussion of revenues, gross profit and selling, general and administrative expenses, see the segment results discussions below.
Depreciation and Amortization
Depreciation and amortization increased $16.2 million, or 8%, to $212.8 million for the year ended December 31, 2015, compared with $196.6 million for the year ended December 31, 2014. The increase in depreciation and amortization was primarily the result of certain assets placed in service over the last twelve months and depreciation and amortization for the assets of businesses acquired.
Interest Expense
Interest expense increased $5.2 million, or 6%, to $91.4 million for the year ended December 31, 2015, compared with $86.2 million for the year ended December 31, 2014. The increase was primarily attributable to an increase in interest expense at AFC of $5.5 million, which resulted from an increase in the average U.S. portfolio financed in 2015 as compared with 2014.
Loss on Extinguishment of Debt
In March 2014, we amended and restated our Credit Agreement and recorded a $30.3 million pretax charge resulting from the write-off of unamortized debt discount and unamortized debt issue costs.
Income Taxes
We had an effective tax rate of 37.0% for the year ended December 31, 2015, compared with an effective tax rate of 36.1% for the year ended December 31, 2014. During the year ended December 31, 2014, our effective tax rate benefited from a favorable state law change as well as changes to our income tax reserves for uncertain tax positions which resulted in a net
47
benefit of $3.3 million. Excluding the effect of the discrete items, our effective tax rate for the year ended December 31, 2015 and 2014 would have been 36.7% and 37.9%, respectively.
Impact of Foreign Currency
The strengthening of the U.S. dollar had a significant impact on the reporting of our Canadian operations in U.S. dollars. For the year ended December 31, 2015, fluctuations in the Canadian exchange rate decreased revenue by $49.4 million, operating profit by $16.0 million, net income by $9.2 million and net income per diluted share by $0.06.
ADESA Results
|
|
Year Ended
December 31,
|
||||||
|
(Dollars in millions)
|
2015
|
2014
|
|||||
|
ADESA revenue
|
$
|
1,427.8
|
|
$
|
1,271.0
|
|
|
|
Cost of services*
|
836.9
|
|
745.9
|
|
|||
|
Gross profit*
|
590.9
|
|
525.1
|
|
|||
|
Selling, general and administrative
|
276.6
|
|
259.9
|
|
|||
|
Depreciation and amortization
|
86.2
|
|
80.2
|
|
|||
|
Operating profit
|
$
|
228.1
|
|
$
|
185.0
|
|
|
|
Vehicles sold
|
2,465,000
|
|
2,198,000
|
|
|||
* Exclusive of depreciation and amortization
Note: Prior to 2016, the gross selling prices for certain vehicles owned and subsequently sold by ADESA were incorrectly netted against cost of services. At December 31, 2016, the gross selling prices of the owned vehicles were included in revenue and costs of services, resulting in an increase to ADESA’s revenue and a corresponding increase in cost of services. For the year ended December 31, 2015, “ADESA revenue” and “Cost of services” have both been increased by $51.0 million. For the year ended December 31, 2014, “ADESA revenue” and “Cost of services” have both been increased by $52.5 million.
Revenue
Revenue from ADESA increased $156.8 million, or 12%, to
$1,427.8 million
for the year ended December 31, 2015, compared with
$1,271.0 million
for the year ended December 31, 2014. The increase in revenue was primarily a result of a 12% increase in the number of vehicles sold, as well as a 1% increase in revenue per vehicle sold, which included an increase in revenue of $39.5 million for businesses acquired in 2015 and a decrease in revenue of $35.9 million due to fluctuations in the Canadian exchange rate.
The increase in volume sold was primarily attributable to an increase in institutional volume, including vehicles sold on our online only platform, as well as a 7% increase in dealer consignment units sold for the year ended December 31, 2015 compared with the year ended December 31, 2014. Online sales volume for ADESA represented approximately 40% of the total vehicles sold in 2015, compared with approximately 38% in 2014. "Online sales" includes the following: (i) selling vehicles directly from a dealership or other interim storage location (upstream selling); (ii) online solutions that offer vehicles for sale while in transit to auction locations (midstream selling); (iii) simultaneously broadcasting video and audio of the physical auctions to online bidders (LiveBlock
®
); and (iv) bulletin-board or real-time online auctions (DealerBlock
®
). Both the upstream and midstream selling represent online only sales, which accounted for over half of ADESA's online sales volume. ADESA sold approximately 592,000 and 495,000 vehicles through its online only offerings in 2015 and 2014, respectively, of which approximately 352,000 and 312,000 represented vehicle sales to grounding dealers in 2015 and 2014, respectively. For the year ended December 31, 2015 and 2014, dealer consignment vehicles represented approximately 50% and 51%, respectively, of used vehicles sold at ADESA physical auction locations. Vehicles sold at physical auction locations increased 10% in 2015, compared with 2014. The used vehicle conversion percentage at physical auction locations, calculated as the number of vehicles sold as a percentage of the number of vehicles entered for sale at our ADESA auctions, increased to 58.3% for the year ended December 31, 2015, compared with 58.2% for the year ended December 31, 2014.
Physical auction revenue per vehicle sold increased $12 or 2%, to $728 for the year ended December 31, 2015, compared with $716 for the year ended December 31, 2014. Physical auction revenue per vehicle sold includes revenue from seller and buyer auction fees and ancillary and other related services, which includes non-auction services and the sale of purchased vehicles. The increase in physical auction revenue per vehicle sold was primarily attributable to an increase in lower margin
48
ancillary and other related services revenue, including revenue from certain businesses acquired, partially offset by a decrease in physical auction revenue per vehicle sold of $18 due to fluctuations in the Canadian exchange rate. Excluding vehicles purchased, revenue per vehicle would have been $701 and $685 for the year ended December 31, 2015 and 2014, respectively.
Online only auction revenue per vehicle sold increased $3 to $107 for the year ended December 31, 2015, compared with $104 for the year ended December 31, 2014. The increase in online only auction revenue per vehicle sold was attributable to an increase in fees per car sold, primarily due to an increase in the mix of cars sold in closed sales to non-grounding dealers, as well as an increase in the number of purchased vehicles associated with the ADESA Assurance Program, partially offset by a decrease in online only auction revenue per vehicle sold of $3 due to fluctuations in the Canadian exchange rate.
Gross Profit
For the year ended December 31, 2015, gross profit for ADESA increased $65.8 million, or 13%, to $590.9 million, compared with $525.1 million for the year ended December 31, 2014. Gross profit for ADESA was 41.4% of revenue for the year ended December 31, 2015, compared with 41.3% of revenue for the year ended December 31, 2014. The decrease in gross profit percentage for the year ended December 31, 2015, compared with the year ended December 31, 2014, was primarily the result of the 12% increase in cost of services. The increase in cost of services was primarily attributable to an increase in lower margin ancillary and non-auction services, partially offset by fluctuations in the Canadian exchange rate.
Selling, General and Administrative
Selling, general and administrative expenses for the ADESA segment increased $16.7 million, or 6%, to $276.6 million for the year ended December 31, 2015, compared with $259.9 million for the year ended December 31, 2014, primarily due to increases in compensation expense of $9.7 million, selling, general and administrative expenses associated with acquisitions of $7.4 million, incentive-based compensation expense of $4.9 million, acquisition-related professional fees of $2.5 million, customer incentives and marketing related expenses of $2.4 million, the loss on disposal of certain assets of $2.0 million, supply expenses of $1.6 million and travel expenses of $1.5 million, partially offset by a decrease in stock-based compensation expense of $9.1 million and fluctuations in the Canadian exchange rate of $6.4 million.
IAA Results
|
|
Year Ended
December 31,
|
||||||
|
(Dollars in millions)
|
2015
|
2014
|
|||||
|
IAA revenue
|
$
|
994.4
|
|
$
|
895.9
|
|
|
|
Cost of services*
|
633.6
|
|
555.7
|
|
|||
|
Gross profit*
|
360.8
|
|
340.2
|
|
|||
|
Selling, general and administrative
|
98.1
|
|
98.8
|
|
|||
|
Depreciation and amortization
|
80.8
|
|
76.2
|
|
|||
|
Operating profit
|
$
|
181.9
|
|
$
|
165.2
|
|
|
|
Vehicles sold
|
1,970,000
|
|
1,732,000
|
|
|||
* Exclusive of depreciation and amortization
Revenue
Revenue from IAA increased $98.5 million, or 11%, to $994.4 million for the year ended December 31, 2015, compared with $895.9 million for the year ended December 31, 2014. The increase in revenue was a result of an increase in vehicles sold of approximately 14% for the year ended December 31, 2015, partially offset by a 2% decrease in revenue per vehicle sold, which included an increase in revenue of $25.8 million from HBC and a decrease in revenue of $11.2 million due to fluctuations in the Canadian exchange rate. Revenue per vehicle sold was also negatively impacted by lower average auction prices due to a decrease in scrap prices and the impact of a strong U.S. dollar. IAA's total loss vehicle inventory increased approximately 14% at December 31, 2015, as compared to December 31, 2014. Vehicles sold under purchase agreements were approximately 7% of total salvage vehicles sold for the year ended December 31, 2015, compared with approximately 6% for the year ended December 31, 2014. The 1% increase in vehicles sold under purchase agreements is representative of vehicles sold by HBC. Online sales volumes for IAA for the years ended December 31, 2015 and 2014 represented over half of the total vehicles sold by IAA.
49
Gross Profit
For the year ended December 31, 2015, gross profit at IAA increased to $360.8 million, or 36.3% of revenue, compared with $340.2 million, or 38.0% of revenue, for the year ended December 31, 2014. The increase in gross profit was mainly attributable to an 11% increase in revenue, partially offset by a 14% increase in cost of services, which included costs associated with purchase contract vehicles and volume growth. For the year ended December 31, 2015, HBC had revenue of approximately $25.8 million and cost of services of approximately $23.5 million, as the majority of HBC's vehicles are sold under purchase contracts. HBC accounted for a 0.7% decrease in IAA's gross profit margin percentage for the year ended December 31, 2015. In addition, the reduction in gross profit on North American purchase contract vehicles accounted for a 0.6% decrease in IAA's gross profit margin percentage for the year ended December 31, 2015.
Selling, General and Administrative
Selling, general and administrative expenses at IAA decreased $0.7 million, or 1%, to $98.1 million for the year ended December 31, 2015, compared with $98.8 million for the year ended December 31, 2014. The decrease in selling, general and administrative expenses was primarily attributable to decreases in stock-based compensation expense of $5.1 million, non-income based taxes of $1.6 million, bad debt expense of $0.9 million, fluctuations in the Canadian exchange rate of $0.8 million and professional fees of $0.7 million, partially offset by increases in telecom costs and other information technology costs of $3.6 million, the inclusion of expenses associated with HBC of $2.2 million and compensation expense of $2.0 million.
AFC Results
|
|
Year Ended
December 31,
|
||||||
|
(Dollars in millions except volumes and per loan amounts)
|
2015
|
2014
|
|||||
|
AFC revenue
|
|
|
|||||
|
Interest and fee income
|
$
|
246.8
|
|
$
|
225.0
|
|
|
|
Other revenue
|
9.7
|
|
11.9
|
|
|||
|
Provision for credit losses
|
(16.0
|
)
|
(12.3
|
)
|
|||
|
Other service revenue
|
27.9
|
|
25.5
|
|
|||
|
Total AFC revenue
|
268.4
|
|
250.1
|
|
|||
|
Cost of services*
|
78.0
|
|
69.7
|
|
|||
|
Gross profit*
|
190.4
|
|
180.4
|
|
|||
|
Selling, general and administrative
|
27.8
|
|
28.8
|
|
|||
|
Depreciation and amortization
|
30.8
|
|
30.4
|
|
|||
|
Operating profit
|
$
|
131.8
|
|
$
|
121.2
|
|
|
|
Loan transactions
|
1,607,000
|
|
1,445,000
|
|
|||
|
Revenue per loan transaction, excluding "Other service revenue"
|
$
|
150
|
|
$
|
155
|
|
|
* Exclusive of depreciation and amortization
Revenue
For the year ended December 31, 2015, AFC revenue increased $18.3 million, or 7%, to $268.4 million, compared with $250.1 million for the year ended December 31, 2014. The increase in revenue was the result of an 11% increase in loan transactions and an increase of 9% in "Other service revenue" generated by PWI, partially offset by a 3% decrease in revenue per loan transaction for the year ended December 31, 2015, which included the impact of a decrease in revenue of $2.4 million, or $1 per loan transaction, due to fluctuations in the Canadian exchange rate. In addition, managed receivables increased to $1,641.0 million at December 31, 2015 from $1,371.1 million at December 31, 2014.
Revenue per loan transaction, which includes both loans paid off and loans curtailed, decreased $5, or 3%, primarily as a result of a decrease in interest and fee income, fluctuations in the Canadian exchange rate and an increase in the provision for credit losses, partially offset by increases in average loan values, other revenue and average portfolio duration. Revenue per loan transaction excludes "Other service revenue."
50
Gross Profit
For the year ended December 31, 2015, gross profit for the AFC segment increased $10.0 million, or 6%, to $190.4 million, or 70.9% of revenue, compared with $180.4 million, or 72.1% of revenue, for the year ended December 31, 2014, primarily as a result of a 7% increase in revenue, partially offset by a 12% increase in cost of services. The floorplan lending business gross profit margin percentage decreased from 78.5% to 77.5% as a result of lower revenue per loan transaction and increased compensation expense. The gross profit margin percentage in the warranty service contract business decreased from 15.5% to 14.8% partially as a result of costs associated with the expansion of the warranty service contract business into new markets.
Selling, General and Administrative
Selling, general and administrative expenses at AFC decreased $1.0 million, or 3%, to $27.8 million for the year ended December 31, 2015, compared with $28.8 million for the year ended December 31, 2014. The decrease was primarily attributable to a decrease in stock-based compensation expense of $2.7 million, partially offset by increases in compensation expense, travel expense and licensing fees.
Holding Company Results
|
|
Year Ended
December 31,
|
||||||
|
(Dollars in millions)
|
2015
|
2014
|
|||||
|
Selling, general and administrative
|
$
|
99.5
|
|
$
|
83.9
|
|
|
|
Depreciation and amortization
|
15.0
|
|
9.8
|
|
|||
|
Operating loss
|
$
|
(114.5
|
)
|
$
|
(93.7
|
)
|
|
Selling, General and Administrative
For the year ended December 31, 2015, selling, general and administrative expenses at the holding company increased $15.6 million, or 19%, to $99.5 million, compared with $83.9 million for the year ended December 31, 2014, primarily as a result of increases in employee related benefits expense of $5.0 million, compensation expense of $5.1 million, acquisition-related professional fees of $1.7 million, stock-based compensation and incentive-based compensation of $1.3 million, other professional fees of $1.0 million and other miscellaneous expenses aggregating $1.5 million.
51
Overview of Results of KAR Auction Services, Inc. for the Three Months Ended
December 31, 2016
and
2015
:
|
|
Three Months Ended
December 31,
|
||||||
|
(Dollars in millions except per share amounts)
|
2016
|
2015
|
|||||
|
Revenues
|
|
|
|||||
|
ADESA
|
$
|
442.3
|
|
$
|
365.9
|
|
|
|
IAA
|
302.6
|
|
261.6
|
|
|||
|
AFC
|
68.8
|
|
68.2
|
|
|||
|
Total revenues
|
813.7
|
|
695.7
|
|
|||
|
Cost of services*
|
488.3
|
|
414.3
|
|
|||
|
Gross profit*
|
325.4
|
|
281.4
|
|
|||
|
Selling, general and administrative
|
148.8
|
|
128.5
|
|
|||
|
Depreciation and amortization
|
64.7
|
|
56.0
|
|
|||
|
Operating profit
|
111.9
|
|
96.9
|
|
|||
|
Interest expense
|
38.0
|
|
24.2
|
|
|||
|
Other expense (income), net
|
0.3
|
|
(2.5
|
)
|
|||
|
Loss on extinguishment of debt
|
1.4
|
|
—
|
|
|||
|
Income before income taxes
|
72.2
|
|
75.2
|
|
|||
|
Income taxes
|
26.7
|
|
26.9
|
|
|||
|
Net income
|
$
|
45.5
|
|
$
|
48.3
|
|
|
|
Net income per share
|
|
|
|||||
|
Basic
|
$
|
0.33
|
|
$
|
0.35
|
|
|
|
Diluted
|
$
|
0.33
|
|
$
|
0.35
|
|
|
* Exclusive of depreciation and amortization
Overview
For the three months ended
December 31, 2016
, we had revenue of
$813.7 million
compared with revenue of
$695.7 million
for the three months ended
December 31, 2015
, an increase of 17%. For a further discussion of revenues, gross profit and selling, general and administrative expenses, see the segment results discussions below.
Income Taxes
We had an effective tax rate of 37.0% for the three months ended
December 31, 2016
, compared with an effective tax rate of 35.8% for the three months ended
December 31, 2015
.
ADESA Results
|
|
Three Months Ended
December 31, |
||||||
|
(Dollars in millions)
|
2016
|
2015
|
|||||
|
ADESA revenue
|
$
|
442.3
|
|
$
|
365.9
|
|
|
|
Cost of services*
|
269.4
|
|
221.3
|
|
|||
|
Gross profit*
|
172.9
|
|
144.6
|
|
|||
|
Selling, general and administrative
|
89.2
|
|
69.3
|
|
|||
|
Depreciation and amortization
|
27.4
|
|
22.4
|
|
|||
|
Operating profit
|
$
|
56.3
|
|
$
|
52.9
|
|
|
|
Vehicles sold
|
700,000
|
|
605,000
|
|
|||
* Exclusive of depreciation and amortization
52
Note: Prior to 2016, the gross selling prices for certain vehicles owned and subsequently sold by ADESA were incorrectly netted against cost of services. At December 31, 2016, the gross selling prices of the owned vehicles were included in revenue and costs of services, resulting in an increase to ADESA’s revenue and a corresponding increase in cost of services. For the three months ended December 31, 2016, “ADESA revenue” and “Cost of services” have both been increased by $14.8 million. For the three months ended December 31, 2015, “ADESA revenue” and “Cost of services” have both been increased by $13.5 million.
Revenue
Revenue from ADESA increased $76.4 million, or 21%, to
$442.3 million
for the three months ended
December 31, 2016
, compared with
$365.9 million
for the three months ended
December 31, 2015
. The increase in revenue was primarily a result of a 16% increase in the number of vehicles sold (4% increase excluding acquisitions), as well as a 5% increase in revenue per vehicle sold. Businesses acquired in the last 12 months accounted for an increase in revenue of $37.4 million.
The increase in volume sold was primarily attributable to a 21% increase in institutional volume (11% increase excluding acquisitions), including vehicles sold on our online only platform, as well as a 7% increase in dealer consignment units sold (7% decrease excluding acquisitions) for the three months ended
December 31, 2016
compared with the three months ended
December 31, 2015
. Online sales volume for ADESA represented approximately 41% of the total vehicles sold in the
fourth
quarter of
2016
and
2015
. "Online sales" includes the following: (i) selling vehicles directly from a dealership or other interim storage location (upstream selling); (ii) online solutions that offer vehicles for sale while in transit to auction locations (midstream selling); (iii) simultaneously broadcasting video and audio of the physical auctions to online bidders (LiveBlock
®
); and (iv) bulletin-board or real-time online auctions (DealerBlock
®
). Both the upstream and midstream selling represent online only sales, which accounted for approximately 62% of ADESA's online sales volume. ADESA sold approximately 177,000 and 152,000 vehicles through its online only offerings in the
fourth
quarter of
2016
and
2015
, respectively, of which approximately 88,000 and 80,000 represented vehicle sales to grounding dealers in the
fourth
quarter of
2016
and
2015
, respectively. For the three months ended
December 31, 2016
, dealer consignment vehicles represented approximately 45% of used vehicles sold at ADESA physical auction locations, compared with approximately 49% for the three months ended
December 31, 2015
. Vehicles sold at physical auction locations increased 15% (no increase excluding acquisitions) in the
fourth
quarter of
2016
, compared with the
fourth
quarter of
2015
. The used vehicle conversion percentage at North American physical auction locations, calculated as the number of vehicles sold as a percentage of the number of vehicles entered for sale at our ADESA auctions, decreased to 54.7% for the three months ended
December 31, 2016
, compared with 56.1% for the three months ended
December 31, 2015
.
Physical auction revenue per vehicle sold increased $31, or 4%, to $801 for the three months ended
December 31, 2016
, compared with $770 for the three months ended
December 31, 2015
. Physical auction revenue per vehicle sold includes revenue from seller and buyer auction fees and ancillary and other related services, which includes non-auction services and the sale of purchased vehicles. The increase in physical auction revenue per vehicle sold was primarily attributable to an increase in lower margin ancillary and other related services revenue. Excluding vehicles purchased, physical auction revenue per vehicle would have been $773 and $740 for the three months ended
December 31, 2016
and
2015
, respectively.
Online only auction revenue per vehicle sold increased $18 to $131 for the three months ended
December 31, 2016
, compared with $113 for the three months ended
December 31, 2015
. The increase in online only auction revenue per vehicle sold was attributable to an increase in purchased vehicles associated with the ADESA Assurance Program and an increase in the mix of cars sold in closed sales to non-grounding dealers. Excluding vehicles purchased as part of the ADESA Assurance Program, online only revenue per vehicle would have been $115 and $105 for the three months ended
December 31, 2016
and
2015
, respectively.
Gross Profit
For the three months ended
December 31, 2016
, gross profit for ADESA increased $28.3 million, or 20%, to
$172.9 million
, compared with
$144.6 million
for the three months ended
December 31, 2015
. Gross profit for ADESA was 39.1% of revenue for the three months ended
December 31, 2016
, compared with 39.5% of revenue for the three months ended
December 31, 2015
. The increase in gross profit for the three months ended
December 31, 2016
, compared with the three months ended
December 31, 2015
, was mainly attributable to the 16% increase in the number of vehicles sold. The decrease in gross profit percentage was primarily the result of the increase in cost of services, which was attributable to an increase in lower margin ancillary and other related services.
Selling, General and Administrative
Selling, general and administrative expenses for the ADESA segment increased $19.9 million, or 29%, to
$89.2 million
for the three months ended
December 31, 2016
, compared with
$69.3 million
for the three months ended
December 31, 2015
,
53
primarily due to increases in selling, general and administrative expenses associated with acquisitions of $8.4 million, bad debt expense of $4.4 million, compensation expense of $2.9 million, information technology costs of $1.2 million, professional fees of $0.7 million and other miscellaneous expenses aggregating $3.7 million, partially offset by a decrease in incentive-based compensation expense of $1.4 million.
IAA Results
|
|
Three Months Ended
December 31, |
||||||
|
(Dollars in millions)
|
2016
|
2015
|
|||||
|
IAA revenue
|
$
|
302.6
|
|
$
|
261.6
|
|
|
|
Cost of services*
|
198.7
|
|
173.0
|
|
|||
|
Gross profit*
|
103.9
|
|
88.6
|
|
|||
|
Selling, general and administrative
|
25.3
|
|
25.5
|
|
|||
|
Depreciation and amortization
|
23.5
|
|
21.7
|
|
|||
|
Operating profit
|
$
|
55.1
|
|
$
|
41.4
|
|
|
|
Vehicles sold
|
610,000
|
|
517,000
|
|
|||
* Exclusive of depreciation and amortization
Revenue
Revenue from IAA increased $41.0 million, or 16%, to
$302.6 million
for the three months ended
December 31, 2016
, compared with
$261.6 million
for the three months ended
December 31, 2015
, and included an increase in revenue of $0.2 million from HBC. The increase in revenue was a result of an increase in vehicles sold of approximately 18% (18% increase excluding HBC), partially offset by a decrease in revenue per vehicle sold of approximately 2% for the three months ended
December 31, 2016
, including a decrease in revenue of $2.7 million due to fluctuations in the U.K. exchange rate. IAA's North American same-store total loss vehicle inventory increased approximately 25% at
December 31, 2016
, as compared to
December 31, 2015
, in part related to recent catastrophic events. Vehicles sold under purchase agreements were approximately 6% (5% excluding HBC) and 7% (6% excluding HBC) of total salvage vehicles sold for the three months ended
December 31, 2016
and
2015
, respectively. Online sales volumes for IAA for the three months ended
December 31, 2016
and
2015
represented approximately 60% of the total vehicles sold by IAA.
Gross Profit
For the three months ended
December 31, 2016
, gross profit at IAA increased to
$103.9 million
, or 34.3% of revenue, compared with
$88.6 million
, or 33.9% of revenue, for the three months ended
December 31, 2015
. The increase in gross profit was mainly attributable to a 16% increase in revenue, partially offset by a 15% increase in cost of services, which included costs associated with purchase contract vehicles and volume growth. Excluding HBC, IAA's gross profit margin was 35.1% and 34.9% for the three months ended
December 31, 2016
and
2015
, respectively. For the three months ended
December 31, 2016
and
2015
, HBC had revenue of approximately $12.0 million and $11.8 million, respectively, and cost of services of approximately $10.1 million and $10.5 million, respectively, as the majority of HBC's vehicles are sold under purchase contracts.
Selling, General and Administrative
Selling, general and administrative expenses at IAA decreased $0.2 million, or 1%, to
$25.3 million
for the three months ended
December 31, 2016
, compared with
$25.5 million
for the three months ended
December 31, 2015
.
54
AFC Results
|
|
Three Months Ended
December 31, |
||||||
|
(Dollars in millions except volumes and per loan amounts)
|
2016
|
2015
|
|||||
|
AFC revenue
|
|
||||||
|
Interest and fee income
|
$
|
69.6
|
|
$
|
63.9
|
|
|
|
Other revenue
|
2.6
|
|
2.7
|
|
|||
|
Provision for credit losses
|
(11.7
|
)
|
(5.5
|
)
|
|||
|
Other service revenue
|
8.3
|
|
7.1
|
|
|||
|
Total AFC revenue
|
68.8
|
|
68.2
|
|
|||
|
Cost of services*
|
20.2
|
|
20.0
|
|
|||
|
Gross profit*
|
48.6
|
|
48.2
|
|
|||
|
Selling, general and administrative
|
6.8
|
|
6.8
|
|
|||
|
Depreciation and amortization
|
7.7
|
|
7.6
|
|
|||
|
Operating profit
|
$
|
34.1
|
|
$
|
33.8
|
|
|
|
Loan transactions
|
417,000
|
|
408,000
|
|
|||
|
Revenue per loan transaction, excluding "Other service revenue"
|
$
|
145
|
|
$
|
150
|
|
|
* Exclusive of depreciation and amortization
Revenue
For the three months ended
December 31, 2016
, AFC revenue increased $0.6 million, or 1%, to
$68.8 million
, compared with
$68.2 million
for the three months ended
December 31, 2015
. The increase in revenue was the result of a 2% increase in loan transactions and an increase of 17% in "Other service revenue" generated by PWI, partially offset by a 3% decrease in revenue per loan transaction for the three months ended
December 31, 2016
. In addition managed receivables increased to
$1,792.2 million
at
December 31, 2016
from
$1,641.0 million
at
December 31, 2015
.
Revenue per loan transaction, which includes both loans paid off and loans curtailed, decreased $5, or 3%, primarily as a result of an increase in the provision for credit losses and a decrease in interest and fee income, partially offset by increases in other revenue, average loan values, and average portfolio duration. Revenue per loan transaction excludes "Other service revenue."
The provision for credit losses has increased to 2.6% from 1.4% of the average managed receivables for the three months ended
December 31, 2016
compared with the three months ended
December 31, 2015
. The provision for credit losses was 1.8% of the average managed receivables for the year ended
December 31, 2016
. In the current credit environment, the provision for credit losses is expected to be approximately 1.75% to 2.25%, annually, of the average managed receivables balance. However, the actual losses in any particular quarter could deviate from this range.
Gross Profit
For the three months ended
December 31, 2016
, gross profit for the AFC segment increased $0.4 million to
$48.6 million
, or 70.6% of revenue, compared with
$48.2 million
, or 70.7% of revenue, for the three months ended
December 31, 2015
. The floorplan lending business gross profit margin percentage decreased from 77.3% to 76.8% as a result of lower revenue per loan transaction. The gross profit margin percentage in the warranty service contract business improved.
Selling, General and Administrative
Selling, general and administrative expenses at AFC remained consistent year over year at
$6.8 million
for the three months ended
December 31, 2016
and
2015
. Stock-based compensation expense and information technology costs both increased $0.2 million, offset by a decrease in incentive-based compensation of $0.4 million.
55
Holding Company Results
|
|
Three Months Ended
December 31, |
||||||
|
(Dollars in millions)
|
2016
|
2015
|
|||||
|
Selling, general and administrative
|
$
|
27.5
|
|
$
|
26.9
|
|
|
|
Depreciation and amortization
|
6.1
|
|
4.3
|
|
|||
|
Operating loss
|
$
|
(33.6
|
)
|
$
|
(31.2
|
)
|
|
Selling, General and Administrative
For the three months ended
December 31, 2016
, selling, general and administrative expenses at the holding company increased $0.6 million, or 2%, to
$27.5 million
, compared with
$26.9 million
for the three months ended
December 31, 2015
, primarily as a result of increases in compensation expense of $3.0 million and professional fees of $2.0 million partially offset by a decrease in medical expenses of $4.4 million. The Company has increased Holding Company expenses to support the growing businesses of KAR. The increase in expenses relate to costs associated with talent management, technology and support of strategic initiatives.
LIQUIDITY AND CAPITAL RESOURCES
We believe that the significant indicators of liquidity for our business are cash on hand, cash flow from operations, working capital and amounts available under our Credit Facility. Our principal sources of liquidity consist of cash generated by operations and borrowings under our revolving credit facility.
|
|
December 31,
|
||||||
|
(Dollars in millions)
|
2016
|
2015
|
|||||
|
Cash and cash equivalents
|
$
|
201.8
|
|
$
|
155.0
|
|
|
|
Restricted cash
|
17.9
|
|
16.2
|
|
|||
|
Working capital
|
506.2
|
|
232.2
|
|
|||
|
Amounts available under Credit Facility*
|
219.5
|
|
110.0
|
|
|||
|
Cash flow from operations for the year ended
|
360.8
|
|
475.0
|
|
|||
|
*
|
There were related outstanding letters of credit totaling approximately
$29.7 million
and
$28.0 million
at
December 31, 2016
and
2015
, respectively, which reduced the amount available for borrowings under the revolving credit facility.
|
We regularly evaluate alternatives for our capital structure and liquidity given our expected cash flows, growth and operating capital requirements as well as capital market conditions.
Working Capital
A substantial amount of our working capital is generated from the payments received for services provided. The majority of our working capital needs are short-term in nature, usually less than a week in duration. Due to the decentralized nature of the business, payments for most vehicles purchased are received at each auction and branch. Most of the financial institutions place a temporary hold on the availability of the funds deposited that generally can range up to two business days, resulting in cash in our accounts and on our balance sheet that is unavailable for use until it is made available by the various financial institutions. There are outstanding checks (book overdrafts) to sellers and vendors included in current liabilities. Because a portion of these outstanding checks for operations in the U.S. are drawn upon bank accounts at financial institutions other than the financial institutions that hold the cash, we cannot offset all the cash and the outstanding checks on our balance sheet. Changes in working capital vary from quarter-to-quarter as a result of the timing of collections and disbursements of funds to consignors from auctions held near period end. The significant increase in working capital from December 31, 2015 to December 31, 2016 was primarily a result of the cash provided from the refinancing of our debt in the first quarter of 2016.
Approximately $98.1 million of available cash was held by our foreign subsidiaries. If the portion of funds held by our foreign subsidiaries that are considered to be permanently reinvested were to be repatriated, tax expense would need to be accrued at the U.S. statutory rate, net of any applicable foreign tax credits. Such foreign tax credits would substantially offset any U.S. taxes that would be due in the event cash held by our foreign subsidiaries was repatriated.
56
AFC offers short-term inventory-secured financing, also known as floorplan financing, to independent used vehicle dealers. Financing is primarily provided for terms of 30 to 90 days. AFC principally generates its funding through the sale of its receivables. The receivables sold pursuant to the securitization agreements are accounted for as secured borrowings. For further discussion of AFC's securitization arrangements, see "Securitization Facilities."
Credit Facilities
On March 9, 2016, we entered into an Incremental Commitment Agreement and First Amendment (the "First
Amendment") to the Credit Agreement. The First Amendment provided for, among other things, (i) a new seven-year senior
secured term loan facility ("Term Loan B-3") and (ii) a $300 million, five-year senior secured revolving credit facility (the
"revolving credit facility"), which replaced the previously existing revolving credit facility (the "old revolving credit facility").
The proceeds received from Term Loan B-3 were used to repay in full Term Loan B-1 and the amount outstanding on the old
revolving credit facility. No early termination penalties were incurred by the Company; however, we incurred a non-cash loss
on the extinguishment of debt of $4.0 million in the first quarter of 2016. The loss was a result of the write-off of unamortized
debt issuance costs associated with Term Loan B-1 and the old revolving credit facility. The First Amendment did not change
the amount outstanding on Term Loan B-2, but did increase its interest rate margin. In addition, we capitalized approximately
$18.0 million of debt issuance costs in connection with the First Amendment.
The Credit Facility is available for letters of credit, working capital, permitted acquisitions and general corporate
purposes. The Credit Agreement provides that with respect to the revolving credit facility, up to $75 million is available for
letters of credit and up to $75 million is available for swing line loans.
Term Loan B-2 was issued at a discount of $2.8 million and Term Loan B-3 was issued at a discount of $13.5 million.
The discounts are being amortized using the effective interest method to interest expense over the respective terms of the loans.
Both Term Loan B-2 and Term Loan B-3 are payable in quarterly installments equal to 0.25% of the original aggregate
principal amounts of the term loans, respectively. Such payments commenced on June 30, 2014 for Term Loan B-2 and on June
30, 2016 for Term Loan B-3, with the balances payable at each respective maturity date. The Credit Facility is subject to
mandatory prepayments and reduction in an amount equal to the net proceeds of certain debt offerings, certain asset sales and
certain insurance recovery even
ts. In addition, in accordance with the terms of the Credit Agreement,
50%
of the net cash proceeds from the sale-lea
seback of certain technology and capital equipment were used to prepay
$6.5 million
and
$7.8 million
of Term Loan B-2 and Term Loan B-3, respectively, for the year ended
December 31, 2016
. Each such prepayment is credited to prepay, on a pro rata basis, in order of maturity the unpaid amounts due on the first
eight
scheduled quarterly installments of Term Loan B-2 and Term Loan B-3 and thereafter to the remaining scheduled quarterly installments of each term loan on a pro rata basis.
As set forth in the Credit Agreement, Term Loan B-2 bears interest at Adjusted LIBOR (as defined in the Credit
Agreement) plus 3.1875% (with an Adjusted LIBOR floor of 0.75% per annum), Term Loan B-3 at Adjusted LIBOR (as
defined in the Credit Agreement) plus 3.50% (with an Adjusted LIBOR floor of 0.75% per annum) and revolving loan
borrowings at Adjusted LIBOR plus 2.50%. However, for specified types of borrowings, the Company may elect to make Term
Loan B-2 borrowings at a Base Rate (as defined in the Credit Agreement) plus 2.1875%, Term Loan B-3 at a Base Rate plus
2.50% and revolving loan borrowings at a Base Rate plus 1.50%. The rates on Term Loan B-2 and Term Loan B-3 were
4.19%
and
4.50%
at
December 31, 2016
, respectively
. In addition, if the Company reduces its Consolidated Senior Secured Leverage Ratio, which is based on a net debt calculation, to levels specified in the Credit Agreement, the applicable interest rate on the revolving credit facility will step down by 25 basis points. The Company also pays a commitment fee of 40 basis points, payable quarterly, on the average daily unused amount of the revolving credit facility. The fee may step down to 35 basis points based on the Company's Consolidated Senior Secured Leverage Ratio as described above.
On
December 31, 2016
,
$1,082.7 million
w
as outstanding on Term Loan B-
2,
$1,339.9 million
was
outstanding on Term Loan B-3 a
nd
$80.5 million
was drawn on the revolving credit facility.
In addition, there were related outstanding letters of credit in the aggregate amount
of
$29.7 million
and
$28.0 million
at
December 31, 2016
and
December 31, 2015
, respectively, which reduce the amount available for borrowings under the Credit Facilit
y. The Company intends to repay the
$80.5 million
of outstanding borrowings under the revolving credit facility within the next twelve months. Our C
anadian operations also have a C$8 million line of credit which wa
s undrawn a
s of
December 31, 2016
. However, there were related letters of credit outstanding totaling approxima
tely C$0.9 m
illion at
December 31, 2016
, which reduce credit available under the Canadian line of credit.
The obligations of the Company under the Credit Facility are guaranteed by certain of our domestic subsidiaries (the "Subsidiary Guarantors") and are secured by substantially all of the assets of the Company and the Subsidiary Guarantors, including but not limited to: (a) pledges of and first priority perfected security interests in 100% of the equity interests of certain of the Company's and the Subsidiary Guarantors' domestic subsidiaries and 65% of the equity interests of certain of the
57
Company's and the Subsidiary Guarantors' first tier foreign subsidiaries and (b) perfected first priority security interests in substantially all other tangible and intangible assets of the Company and each Subsidiary Guarantor, subject to certain exceptions.
The Credit Agreement contains certain restrictive loan covenants, including, among others, a financial covenant requiring that a maximum consolidated senior secured leverage ratio be satisfied as of the last day of each fiscal quarter if revolving loans are outstanding, and covenants limiting our ability to incur indebtedness, grant liens, make acquisitions, consummate change of control transactions, dispose of assets, pay dividends, make investments and engage in certain transactions with affiliates. The senior secured leverage ratio is calculated as total senior secured debt divided by the last four quarters consolidated Adjusted EBITDA. Senior secured debt includes term loan borrowings, revolving loans and capital lease liabilities less available cash as defined in the Credit Agreement. Consolidated Adjusted EBITDA is EBITDA (earnings before interest expense, income taxes, depreciation and amortization) adjusted to exclude among other things (a) gains and losses from asset sales; (b) unrealized foreign currency translation gains and losses in respect of indebtedness; (c) certain non-recurring gains and losses; (d) stock-based compensation expense; (e) certain other non-cash amounts included in the determination of net income; (f) charges and revenue reductions resulting from purchase accounting; (g) minority interest; (h) expenses associated with the consolidation of salvage operations; (i) consulting expenses incurred for cost reduction, operating restructuring and business improvement efforts; (j) expenses realized upon the termination of employees and the termination or cancellation of leases, software licenses or other contracts in connection with the operational restructuring and business improvement efforts; (k) expenses incurred in connection with permitted acquisitions; (l) any impairment charges or write-offs of intangibles; and (m) any extraordinary, unusual or non-recurring charges, expenses or losses.
Certain covenants contained within the Credit Agreement are critical to an investor's understanding of our financial liquidity, as the failure to maintain compliance with these covenants could result in a default and allow our lenders to declare all amounts borrowed immediately due and payable. The maximum consolidated senior secured leverage ratio is required to be met when there are revolving loans outstanding under our Credit Agreement. For the quarter ended December 31, 2016 the ratio could not exceed 3.75 to 1.0 and it steps down to 3.5 to 1.0 at September 30, 2017. Our actual consolidated senior secured leverage ratio, including capital lease obligations of $51.5 mil
lion, w
as 3.25 to 1.0 at
December 31, 2016
, excluding pro forma Adjusted EBITDA for businesses acquired in the last twelve months.
In addition, the Credit Agreement contains certain financial and operational restrictions that limit our ability to pay dividends and other distributions, make certain acquisitions or investments, incur indebtedness, grant liens and sell assets. The covenants in the Credit Agreement affect our operating flexibility by, among other things, restricting our ability to incur expenses and indebtedness that could be used to grow the business, as well as to fund general corporate purposes. We were in compliance with the covenants in the Credit Agreement at
December 31, 2016
.
We believe our sources of liquidity from our cash and cash equivalents on hand, working capital, cash provided by operating activities, and availability under our credit facility are sufficient to meet our short and long-term operating needs for the foreseeable future. In addition, we believe the previously mentioned sources of liquidity will be sufficient to fund our capital requirements, debt service payments, announced acquisitions and dividends for the next twelve months.
Securitization Facilities
AFC sells the majority of its U.S. dollar denominated finance receivables on a revolving basis and without recourse to AFC Funding Corporation. A securitization agreement allows for the revolving sale by AFC Funding Corporation to a group of bank purchasers of undivided interests in certain finance receivables subject to committed liquidity. AFC Funding Corporation had committed liquidity of
$1.50 billion
for U.S. finance receivables at
December 31, 2016
.
In December 2016, AFC and AFC Funding Corporation entered into the Seventh Amended and Restated Receivables Purchase Agreement (the "Receivables Purchase Agreement"). The Receivables Purchase Agreement increased AFC Funding's U.S. committed liquidity from
$1.25 billion
to
$1.50 billion
and extended the facility's maturity date from June 29, 2018 to
January 31, 2020
. In addition, the definition of eligible receivables was expanded and the tangible net worth requirement increased. We capitalized approximately
$12.7 million
of costs in connection with the Receivables Purchase Agreement. In addition, we recorded a
$1.4 million
pretax charge resulting from the write-off of a portion of the unamortized securitization issuance costs.
We also have an agreement for the securitization of AFCI's receivables. AFCI's committed facility is provided through a third party conduit (separate from the U.S. facility) and was
C$125 million
at
December 31, 2016
. In December 2016, AFCI entered into the Fourth Amended and Restated Receivables Purchase Agreement (the "Canadian Receivables Purchase Agreement"). The Canadian Receivables Purchase Agreement extended the facility's maturity date from June 29, 2018 to
January 31, 2020
. We capitalized approximately
$0.7 million
of costs in connection with the Canadian Receivables Purchase
58
Agreement. The receivables sold pursuant to both the U.S. and Canadian securitization agreements are accounted for as secured borrowings.
AFC manage
d total finance receivables
of
$1,792.2 million
and
$1,641.0 million
at
December 31, 2016
and
December 31, 2015
, respectively. AFC's allowance for losses wa
s
$12.0 million
and
$9.0 million
at
December 31, 2016
and
December 31, 2015
, respectively.
As of
December 31, 2016
and
December 31, 2015
,
$1,774.8 million
and
$1,626.6 million
, respectively, of finance receivables and a cash reserve of 1 percent of the obligations collateralized by finance receivables served as security for the
$1,280.3 million
and
$1,189.0 million
of obligations collateralized by finance receivables at
December 31, 2016
and
December 31, 2015
, respectively. There were unamortized securitization issuance costs of approximately
$19.7 million
and
$12.2 million
at
December 31, 2016
and
December 31, 2015
, respectively. After the occurrence of a termination event, as defined in the U.S. securitization agreement, the banks may, and could, cause the stock of AFC Funding Corporation to be transferred to the bank facility, though as a practical matter the bank facility would look to the liquidation of the receivables under the transaction documents as their primary remedy.
Proceeds from the revolving sale of receivables to the bank facilities are used to fund new loans to customers. AFC, AFC Funding Corporation and AFCI must maintain certain financial covenants including, among others, limits on the amount of debt AFC and AFCI can incur, minimum levels of tangible net worth, and other covenants tied to the performance of the finance receivables portfolio. The securitization agreements also incorporate the financial covenants of our Credit Facility. At
December 31, 2016
, we were in compliance with the covenants in the securitization agreements.
EBITDA and Adjusted EBITDA
EBITDA and Adjusted EBITDA, as presented herein, are supplemental measures of our performance that are not required by, or presented in accordance with, generally accepted accounting principles in the United States, or GAAP. They are not measurements of our financial performance under GAAP and should not be considered substitutes for net income (loss) or any other performance measures derived in accordance with GAAP.
EBITDA is defined as net income (loss), plus interest expense net of interest income, income tax provision (benefit), depreciation and amortization. Adjusted EBITDA is EBITDA adjusted for the items of income and expense and expected incremental revenue and cost savings, as described above in the discussion of certain restrictive loan covenants under "Credit Facilities."
Management believes that the inclusion of supplementary adjustments to EBITDA applied in presenting Adjusted EBITDA is appropriate to provide additional information to investors about one of the principal measures of performance used by our creditors. In addition, management uses EBITDA and Adjusted EBITDA to evaluate our performance. EBITDA and Adjusted EBITDA have limitations as analytical tools, and should not be considered in isolation or as a substitute for analysis of the results as reported under GAAP. These measures may not be comparable to similarly titled measures reported by other companies.
59
The following tables reconcile EBITDA and Adjusted EBITDA to net income (loss) for the periods presented:
|
|
Three Months Ended December 31, 2016
|
||||||||||||||||||
|
(Dollars in millions)
|
ADESA
|
IAA
|
AFC
|
Corporate
|
Consolidated
|
||||||||||||||
|
Net income (loss)
|
$
|
27.9
|
|
$
|
29.0
|
|
$
|
19.8
|
|
$
|
(31.2
|
)
|
$
|
45.5
|
|
||||
|
Add back:
|
|
||||||||||||||||||
|
Income taxes
|
16.0
|
|
16.8
|
|
12.2
|
|
(18.3
|
)
|
26.7
|
|
|||||||||
|
Interest expense, net of interest income
|
(0.2
|
)
|
—
|
|
9.4
|
|
28.7
|
|
37.9
|
|
|||||||||
|
Depreciation and amortization
|
27.4
|
|
23.5
|
|
7.7
|
|
6.1
|
|
64.7
|
|
|||||||||
|
Intercompany interest
|
9.3
|
|
9.5
|
|
(8.7
|
)
|
(10.1
|
)
|
—
|
|
|||||||||
|
EBITDA
|
80.4
|
|
78.8
|
|
40.4
|
|
(24.8
|
)
|
174.8
|
|
|||||||||
|
Intercompany charges
|
3.1
|
|
—
|
|
—
|
|
(3.1
|
)
|
—
|
|
|||||||||
|
Non-cash stock-based compensation
|
1.2
|
|
0.7
|
|
0.4
|
|
1.7
|
|
4.0
|
|
|||||||||
|
Loss on extinguishment of debt
|
—
|
|
—
|
|
1.4
|
|
—
|
|
1.4
|
|
|||||||||
|
Acquisition related costs
|
1.3
|
|
—
|
|
—
|
|
0.1
|
|
1.4
|
|
|||||||||
|
Securitization interest
|
—
|
|
—
|
|
(7.7
|
)
|
—
|
|
(7.7
|
)
|
|||||||||
|
Minority interest
|
1.1
|
|
—
|
|
—
|
|
—
|
|
1.1
|
|
|||||||||
|
Other
|
0.9
|
|
0.7
|
|
0.2
|
|
(0.3
|
)
|
1.5
|
|
|||||||||
|
Total addbacks
|
7.6
|
|
1.4
|
|
(5.7
|
)
|
(1.6
|
)
|
1.7
|
|
|||||||||
|
Adjusted EBITDA
|
$
|
88.0
|
|
$
|
80.2
|
|
$
|
34.7
|
|
$
|
(26.4
|
)
|
$
|
176.5
|
|
||||
|
|
Three Months Ended December 31, 2015
|
||||||||||||||||||
|
(Dollars in millions)
|
ADESA
|
IAA
|
AFC
|
Corporate
|
Consolidated
|
||||||||||||||
|
Net income (loss)
|
$
|
25.1
|
|
$
|
23.3
|
|
$
|
21.4
|
|
$
|
(21.5
|
)
|
$
|
48.3
|
|
||||
|
Add back:
|
|
||||||||||||||||||
|
Income taxes
|
13.9
|
|
11.1
|
|
13.4
|
|
(11.5
|
)
|
26.9
|
|
|||||||||
|
Interest expense, net of interest income
|
(0.3
|
)
|
—
|
|
6.9
|
|
17.2
|
|
23.8
|
|
|||||||||
|
Depreciation and amortization
|
22.4
|
|
21.7
|
|
7.6
|
|
4.3
|
|
56.0
|
|
|||||||||
|
Intercompany interest
|
12.1
|
|
9.5
|
|
(7.9
|
)
|
(13.7
|
)
|
—
|
|
|||||||||
|
EBITDA
|
73.2
|
|
65.6
|
|
41.4
|
|
(25.2
|
)
|
155.0
|
|
|||||||||
|
Intercompany charges
|
1.9
|
|
0.1
|
|
—
|
|
(2.0
|
)
|
—
|
|
|||||||||
|
Non-cash stock-based compensation
|
0.9
|
|
0.3
|
|
0.3
|
|
1.4
|
|
2.9
|
|
|||||||||
|
Acquisition related costs
|
0.6
|
|
—
|
|
0.2
|
|
0.2
|
|
1.0
|
|
|||||||||
|
Securitization interest
|
—
|
|
—
|
|
(5.5
|
)
|
—
|
|
(5.5
|
)
|
|||||||||
|
Minority interest
|
0.2
|
|
(1.1
|
)
|
—
|
|
—
|
|
(0.9
|
)
|
|||||||||
|
Other
|
0.8
|
|
0.7
|
|
0.3
|
|
0.2
|
|
2.0
|
|
|||||||||
|
Total addbacks
|
4.4
|
|
—
|
|
(4.7
|
)
|
(0.2
|
)
|
(0.5
|
)
|
|||||||||
|
Adjusted EBITDA
|
$
|
77.6
|
|
$
|
65.6
|
|
$
|
36.7
|
|
$
|
(25.4
|
)
|
$
|
154.5
|
|
||||
60
|
|
Year Ended December 31, 2016
|
||||||||||||||||||
|
(Dollars in millions)
|
ADESA
|
IAA
|
AFC
|
Corporate
|
Consolidated
|
||||||||||||||
|
Net income (loss)
|
$
|
156.9
|
|
$
|
101.1
|
|
$
|
88.4
|
|
$
|
(124.0
|
)
|
$
|
222.4
|
|
||||
|
Add back:
|
|
||||||||||||||||||
|
Income taxes
|
92.7
|
|
59.3
|
|
54.0
|
|
(73.1
|
)
|
132.9
|
|
|||||||||
|
Interest expense, net of interest income
|
(0.3
|
)
|
—
|
|
34.1
|
|
104.6
|
|
138.4
|
|
|||||||||
|
Depreciation and amortization
|
100.0
|
|
87.9
|
|
31.1
|
|
21.6
|
|
240.6
|
|
|||||||||
|
Intercompany interest
|
41.7
|
|
37.8
|
|
(33.8
|
)
|
(45.7
|
)
|
—
|
|
|||||||||
|
EBITDA
|
391.0
|
|
286.1
|
|
173.8
|
|
(116.6
|
)
|
734.3
|
|
|||||||||
|
Intercompany charges
|
10.9
|
|
0.3
|
|
—
|
|
(11.2
|
)
|
—
|
|
|||||||||
|
Non-cash stock-based compensation
|
4.6
|
|
2.6
|
|
1.8
|
|
10.1
|
|
19.1
|
|
|||||||||
|
Loss on extinguishment of debt
|
—
|
|
—
|
|
1.4
|
|
4.0
|
|
5.4
|
|
|||||||||
|
Acquisition related costs
|
4.9
|
|
0.2
|
|
0.1
|
|
3.4
|
|
8.6
|
|
|||||||||
|
Securitization interest
|
—
|
|
—
|
|
(28.0
|
)
|
—
|
|
(28.0
|
)
|
|||||||||
|
Minority interest
|
3.8
|
|
—
|
|
—
|
|
—
|
|
3.8
|
|
|||||||||
|
(Gain)/Loss on asset sales
|
1.6
|
|
0.2
|
|
—
|
|
0.6
|
|
2.4
|
|
|||||||||
|
Other
|
2.7
|
|
(0.5
|
)
|
0.2
|
|
(0.1
|
)
|
2.3
|
|
|||||||||
|
Total addbacks
|
28.5
|
|
2.8
|
|
(24.5
|
)
|
6.8
|
|
13.6
|
|
|||||||||
|
Adjusted EBITDA
|
$
|
419.5
|
|
$
|
288.9
|
|
$
|
149.3
|
|
$
|
(109.8
|
)
|
$
|
747.9
|
|
||||
|
|
Year Ended December 31, 2015
|
||||||||||||||||||
|
(Dollars in millions)
|
ADESA
|
IAA
|
AFC
|
Corporate
|
Consolidated
|
||||||||||||||
|
Net income (loss)
|
$
|
109.2
|
|
$
|
92.8
|
|
$
|
83.2
|
|
$
|
(70.6
|
)
|
$
|
214.6
|
|
||||
|
Add back:
|
|
||||||||||||||||||
|
Income taxes
|
62.3
|
|
52.4
|
|
51.3
|
|
(40.1
|
)
|
125.9
|
|
|||||||||
|
Interest expense, net of interest income
|
0.1
|
|
—
|
|
24.1
|
|
66.6
|
|
90.8
|
|
|||||||||
|
Depreciation and amortization
|
86.2
|
|
80.8
|
|
30.8
|
|
15.0
|
|
212.8
|
|
|||||||||
|
Intercompany interest
|
49.7
|
|
37.7
|
|
(25.3
|
)
|
(62.1
|
)
|
—
|
|
|||||||||
|
EBITDA
|
307.5
|
|
263.7
|
|
164.1
|
|
(91.2
|
)
|
644.1
|
|
|||||||||
|
Intercompany charges
|
7.9
|
|
0.7
|
|
—
|
|
(8.6
|
)
|
—
|
|
|||||||||
|
Non-cash stock-based compensation
|
3.8
|
|
1.1
|
|
1.3
|
|
6.5
|
|
12.7
|
|
|||||||||
|
Acquisition related costs
|
2.7
|
|
0.1
|
|
0.2
|
|
1.8
|
|
4.8
|
|
|||||||||
|
Securitization interest
|
—
|
|
—
|
|
(18.7
|
)
|
—
|
|
(18.7
|
)
|
|||||||||
|
Minority interest
|
0.8
|
|
(1.4
|
)
|
—
|
|
—
|
|
(0.6
|
)
|
|||||||||
|
(Gain)/Loss on asset sales
|
3.6
|
|
(0.1
|
)
|
—
|
|
—
|
|
3.5
|
|
|||||||||
|
Other
|
2.3
|
|
1.0
|
|
0.4
|
|
0.3
|
|
4.0
|
|
|||||||||
|
Total addbacks
|
21.1
|
|
1.4
|
|
(16.8
|
)
|
—
|
|
5.7
|
|
|||||||||
|
Adjusted EBITDA
|
$
|
328.6
|
|
$
|
265.1
|
|
$
|
147.3
|
|
$
|
(91.2
|
)
|
$
|
649.8
|
|
||||
61
Certain of our loan covenant calculations utilize financial results for the most recent four consecutive fiscal quarters. The following table reconciles EBITDA and Adjusted EBITDA to net income (loss) for the periods presented:
|
|
Three Months Ended
|
Twelve
Months
Ended
|
|||||||||||||||||
|
(Dollars in millions)
|
March 31,
2016
|
June 30,
2016
|
September 30,
2016
|
December 31,
2016 |
December 31, 2016
|
||||||||||||||
|
Net income (loss)
|
$
|
60.7
|
|
$
|
61.8
|
|
$
|
54.4
|
|
$
|
45.5
|
|
$
|
222.4
|
|
||||
|
Add back:
|
|
|
|
|
|
||||||||||||||
|
Income taxes
|
36.7
|
|
37.7
|
|
31.8
|
|
26.7
|
|
132.9
|
|
|||||||||
|
Interest expense, net of interest income
|
28.7
|
|
35.7
|
|
36.1
|
|
37.9
|
|
138.4
|
|
|||||||||
|
Depreciation and amortization
|
56.4
|
|
59.0
|
|
60.5
|
|
64.7
|
|
240.6
|
|
|||||||||
|
EBITDA
|
182.5
|
|
194.2
|
|
182.8
|
|
174.8
|
|
734.3
|
|
|||||||||
|
Non-cash stock-based compensation
|
5.5
|
|
4.9
|
|
4.7
|
|
4.0
|
|
19.1
|
|
|||||||||
|
Loss on extinguishment of debt
|
4.0
|
|
—
|
|
—
|
|
1.4
|
|
5.4
|
|
|||||||||
|
Acquisition related costs
|
2.6
|
|
3.3
|
|
1.3
|
|
1.4
|
|
8.6
|
|
|||||||||
|
Securitization interest
|
(6.4
|
)
|
(6.7
|
)
|
(7.2
|
)
|
(7.7
|
)
|
(28.0
|
)
|
|||||||||
|
Minority interest
|
0.6
|
|
1.0
|
|
1.1
|
|
1.1
|
|
3.8
|
|
|||||||||
|
(Gain)/Loss on asset sales
|
0.4
|
|
0.4
|
|
1.3
|
|
0.3
|
|
2.4
|
|
|||||||||
|
Other
|
0.3
|
|
—
|
|
0.8
|
|
1.2
|
|
2.3
|
|
|||||||||
|
Total addbacks
|
7.0
|
|
2.9
|
|
2.0
|
|
1.7
|
|
13.6
|
|
|||||||||
|
Adjusted EBITDA
|
$
|
189.5
|
|
$
|
197.1
|
|
$
|
184.8
|
|
$
|
176.5
|
|
$
|
747.9
|
|
||||
Summary of Cash Flows
|
|
Year Ended
December 31,
|
||||||
|
(Dollars in millions)
|
2016
|
2015
|
|||||
|
Net cash provided by (used by):
|
|
|
|||||
|
Operating activities
|
$
|
360.8
|
|
$
|
475.0
|
|
|
|
Investing activities
|
(765.3
|
)
|
(547.6
|
)
|
|||
|
Financing activities
|
453.2
|
|
94.5
|
|
|||
|
Effect of exchange rate on cash
|
(1.9
|
)
|
(19.8
|
)
|
|||
|
Net increase in cash and cash equivalents
|
$
|
46.8
|
|
$
|
2.1
|
|
|
Cash flow from operating activities was
$360.8 million
for the year ended
December 31, 2016
, compared with
$475.0 million
for the year ended
December 31, 2015
. The decrease in operating cash flow was primarily attributable to changes in operating assets and liabilities as a result of the timing of collections and the disbursement of funds to consignors for auctions held near period-ends, partially offset by a net increase in non-cash adjustments to net income and increased profitability.
Net cash used by investing activities was
$765.3 million
for the year ended
December 31, 2016
, compared with
$547.6 million
for the year ended
December 31, 2015
. The increase in net cash used by investing activities was primarily attributable to:
|
•
|
an increase in cash used for acquisitions of approximately $314.0 million; and
|
|
•
|
an increase in capital expenditures of approximately $20.4 million. For a discussion of the Company's capital expenditures, see “Capital Expenditures” below;
|
partially offset by:
|
•
|
a decrease in the additional finance receivables held for investment of approximately $119.5 million.
|
62
Net cash provided by financing activities was
$453.2 million
for the year ended
December 31, 2016
, compared with
$94.5 million
for the year ended
December 31, 2015
. The increase in net cash from financing activities was primarily attributable to:
|
•
|
the debt refinancing and payment activities in the first quarter of 2016, for which the Company received approximately $558.9 million of cash after the repayment and rollover of debt; and
|
|
•
|
a $147.2 million decrease in cash used for the repurchase and retirement of common stock;
|
partially offset by:
|
•
|
a decrease in the additional obligations collateralized by finance receivables of approximately $253.0 million; and
|
|
•
|
an increase in payments for debt issuance costs of $21.9 million.
|
Capital Expenditures
Capital expenditures for the years ended
December 31, 2016
and
2015
approximated
$155.1 million
and
$134.7 million
, respectively. Included in the capital expenditures for the year ended
December 31, 2016
was approximately $27.4 million for the greenfield development of ADESA Chicago. Capital expenditures were funded primarily from internally generated funds. We continue to invest in our core information technology capabilities and capacity expansion. Capital expenditures are expected to be approximately $145 million for fiscal year
2017
. Anticipated capital expenditures are primarily attributable to ongoing information system projects, upkeep, improvements and expansion at vehicle auction facilities and improvements in information technology systems and infrastructure. Future capital expenditures could vary substantially based on capital project timing, the opening of new auction facilities, capital expenditures related to acquired businesses and the initiation of new information systems projects to support our business strategies.
Dividends
Subject to board of director approval, we expect to pay a quarterly dividend of $0.32 per share in 2017 using cash flow from operations, representing an annualized dividend of $1.28 per share. The following dividend information has been released in 2016 and 2017:
|
•
|
On
February 17, 2016
, the Company announced a cash dividend of
$0.29
per share that was paid on
April 5, 2016
, to stockholders of record at the close of business on
March 23, 2016
.
|
|
•
|
On
May 3, 2016
, the Company announced a cash dividend of
$0.29
per share that was paid on
July 5, 2016
, to stockholders of record at the close of business on
June 22, 2016
.
|
|
•
|
On
August 2, 2016
, the Company announced a cash dividend of
$0.29
per share that was paid on
October 4, 2016
, to stockholders of record at the close of business on
September 21, 2016
.
|
|
•
|
On
November 3, 2016
, the Company announced a cash dividend of
$0.32
per share that was paid on
January 6, 2017
, to stockholders of record at the close of business on
December 21, 2016
.
|
|
•
|
On
February 21, 2017
, the Company announced a cash dividend of
$0.32
per share that is payable on
April 4, 2017
, to stockholders of record at the close of business on
March 22, 2017
.
|
Future dividend decisions will be based on and affected by a variety of factors, including our financial condition and results of operations, contractual restrictions, including restrictive covenants contained in our Credit Agreement and AFC's securitization facilities, capital requirements and other factors that our board of directors deems relevant. No assurance can be given as to whether any future dividends may be declared by our board of directors or the amount thereof.
Acquisitions
The aggregate purchase price for the businesses acquired in 2016, net of cash acquired, was approximately
$433.4 million
, which included estimated contingent payments with a fair value of
$1.3 million
. The maximum amount of undiscounted contingent payments related to these acquisitions was approximately
$1.5 million
. The purchase price for the acquired businesses was allocated to acquired assets and liabilities based upon fair values, including
$136.8 million
to intangible assets, representing the fair value of acquired customer relationships of
$129.8 million
, software of
$4.9 million
,
tradenames of
$1.8 million
and non-competes of
$0.3 million
, which are being amortized over their expected useful lives. The purchase accounting associated with these acquisitions is preliminary, subject to determination of working capital adjustments
63
and a final valuation of intangibles related to the acquisition of Flint Auto Auction. The Company does not expect adjustments to the purchase accounting will be material. The acquisitions resulted in aggregate goodwill of
$269.6 million
. The goodwill is recorded in the ADESA Auctions and AFC reportable segments. The financial impact of these acquisitions, including pro forma financial results, was immaterial to the Company’s consolidated results for the year ended
December 31, 2016
.
In February 2016, ADESA signed a definitive agreement to acquire auctions owned by the Brasher family. In April 2016, ADESA completed the acquisition of Brasher's
eight
auctions, which strengthens ADESA's western U.S. footprint. In 2015, Brasher's had revenues of approximately
$140 million
. We entered into operating lease obligations related to various facilities through 2036. Initial annual lease payments for the various facilities are approximately
$5 million
per year.
In March 2016, ADESA signed a definitive agreement to acquire Sanford Auto Dealers Exchange ("SADE"). In May 2016, ADESA completed the acquisition of SADE, which expands ADESA's geographic footprint in central Florida.
In June 2016, the Company acquired GRS Remarketing Limited ("GRS"), a subsidiary of Greenhous Group Limited.
GRS is an established online vehicle remarketing business in the U.K. The acquisition complements the Company's wide range
of vehicle remarketing services and provides the opportunity to offer our full range of services in the U.K.
In November 2016, ADESA completed the acquisition of Flint Auto Auction, a whole car auction facility in Flint, Michigan. This acquisition expands ADESA's geographic footprint in the Midwest.
Certain of the purchase agreements included contingent payments related to vehicle volumes subsequent to the purchase date. The purchased assets included land, buildings, accounts receivable, operating equipment, customer relationships, tradenames, software, inventory and other intangible assets. Financial results for each acquisition have been included in our consolidated financial statements from the date of acquisition.
Contractual Obligations
The table below sets forth a summary of our contractual debt and lease obligations as of
December 31, 2016
. Some of the figures included in this table are based on management's estimates and assumptions about these obligations, including their duration, the possibility of renewal and other factors. Because these estimates and assumptions are necessarily subjective, the obligations we may actually pay in future periods could vary from those reflected in the table. The following summarizes our contractual cash obligations as of
December 31, 2016
(in millions)
:
|
|
Payments Due by Period
|
||||||||||||||||||
|
Contractual Obligations
|
Total
|
Less than
1 year
|
1 - 3 Years
|
4 - 5 Years
|
More than
5 Years
|
||||||||||||||
|
Long-term debt
|
|
|
|
|
|
||||||||||||||
|
$300 million revolving credit facility
|
$
|
80.5
|
|
$
|
80.5
|
|
$
|
—
|
|
$
|
—
|
|
$
|
—
|
|
||||
|
Term Loan B-2 (a)
|
1,082.7
|
|
11.2
|
|
22.4
|
|
1,049.1
|
|
—
|
|
|||||||||
|
Term Loan B-3 (a)
|
1,339.9
|
|
13.5
|
|
27.0
|
|
27.0
|
|
1,272.4
|
|
|||||||||
|
Capital lease obligations (b)
|
52.5
|
|
27.2
|
|
25.1
|
|
0.2
|
|
—
|
|
|||||||||
|
Interest payments relating to long-term debt (c)
|
561.3
|
|
108.1
|
|
209.9
|
|
172.1
|
|
71.2
|
|
|||||||||
|
Operating leases (d)
|
1,118.9
|
|
121.7
|
|
220.2
|
|
182.6
|
|
594.4
|
|
|||||||||
|
Total contractual cash obligations
|
$
|
4,235.8
|
|
$
|
362.2
|
|
$
|
504.6
|
|
$
|
1,431.0
|
|
$
|
1,938.0
|
|
||||
________________________________________
|
(a)
|
The table assumes the long-term debt is held to maturity.
|
|
(b)
|
We have entered into capital leases for furniture, fixtures, equipment and software. The amounts include the interest portion of the capital leases. Future capital lease obligations would change if we entered into additional capital lease agreements.
|
|
(c)
|
Interest payments on long-term debt are projected based on the contractual rates of the debt securities. Interest rates for the variable rate term debt instruments were held constant at rates as of
December 31, 2016
.
|
|
(d)
|
Operating leases are entered into in the normal course of business. We lease most of our auction facilities, as well as other property and equipment under operating leases. Some lease agreements contain options to renew the lease or purchase the leased property. Future operating lease obligations would change if the renewal options were exercised and/or if we entered into additional operating lease agreements.
|
64
Critical Accounting Estimates
In preparing the financial statements in accordance with U.S. generally accepted accounting principles, management must often make estimates and assumptions that affect the reported amounts of assets, liabilities, revenues, expenses and related disclosures at the date of the financial statements and during the reporting period. Some of those judgments can be subjective and complex. Consequently, actual results could differ from those estimates. Accounting measurements that management believes are most critical to the reported results of our operations and financial condition include: uncollectible receivables and allowance for credit losses and doubtful accounts, goodwill and long-lived assets, self-insurance programs, legal proceedings and other loss contingencies and income taxes.
In addition to the critical accounting estimates, there are other items used in the preparation of the consolidated financial statements that require estimation, but are not deemed critical. Changes in estimates used in these and other items could have a material impact on our financial statements.
We continually evaluate the accounting policies and estimates used to prepare the consolidated financial statements. In cases where management estimates are used, they are based on historical experience, information from third-party professionals, and various other assumptions believed to be reasonable. In addition, our most significant accounting policies are discussed in Note 2 and elsewhere in the Notes to the Consolidated Financial Statements for the year ended
December 31, 2016
, which are included in this Annual Report on Form 10-K.
Uncollectible Receivables and Allowance for Credit Losses and Doubtful Accounts
We maintain an allowance for credit losses and doubtful accounts for estimated losses resulting from the inability of customers to make required payments. Delinquencies and losses are monitored on an ongoing basis and this historical experience provides the primary basis for estimating the allowance. The allowances for credit losses and doubtful accounts are also based on management's evaluation of the receivables portfolio under current economic conditions, the size of the portfolio, overall portfolio credit quality, review of specific collection matters and such other factors which, in management's judgment, deserve recognition in estimating losses. Specific collection matters can be impacted by the outcome of negotiations, litigation and bankruptcy proceedings with individual customers.
Due to the nature of our business, substantially all trade receivables are due from vehicle dealers, salvage buyers, institutional customers and insurance companies. We generally have possession of vehicles or vehicle titles collateralizing a significant portion of these receivables. At the auction sites, risk is mitigated through a pre-auction registration process that includes verification of identification, bank accounts, dealer license status, acceptable credit history, buying history at other auctions and the written acceptance of all of the auction's policies and procedures.
AFC controls credit risk through credit approvals, credit limits, underwriting and collateral management monitoring procedures, including over 81,000 lot audits and holding vehicle titles where permitted. The estimates are based on management’s evaluation of many factors, including AFC’s historical credit loss experience, the value of the underlying collateral, delinquency trends and economic conditions. The estimates are based on information available as of each reporting date. Actual losses may differ from the original estimates due to actual results varying from those assumed in our estimates.
As a measure of sensitivity, if we had experienced a 10% increase in net charge-offs of trade and finance receivables for the year ended
December 31, 2016
, our provision for credit losses would have increased by approximately $3.1 million in
2016
.
Goodwill and Long-Lived Assets
When we acquire businesses, we estimate and recognize the fair values of tangible assets and liabilities and identifiable intangible assets acquired. Any residual purchase price is recorded as goodwill. The purchase accounting process requires management to make significant estimates in determining the fair values of assets acquired and liabilities assumed, especially with respect to intangible assets. These estimates are based on historical experience and information obtained from the management of the acquired companies. These estimates can include, but are not limited to, the cash flows that an asset is expected to generate in the future, the appropriate weighted-average cost of capital, and the cost savings expected to be derived from acquiring an asset. These estimates are inherently uncertain and unpredictable. In addition, unanticipated events and circumstances may occur which may affect the accuracy or validity of such estimates.
In accordance with ASC 350,
Intangibles—Goodwill and Other
, we assess goodwill for impairment at least annually and whenever events or circumstances indicate that the carrying amount of the goodwill may be impaired. Important factors that could trigger an impairment review include significant under-performance relative to historical or projected future operating results; significant negative industry or economic trends; and our market valuation relative to our book value. In assessing goodwill, we must make assumptions regarding estimated future cash flows and earnings, changes in our business strategy and economic conditions affecting market valuations related to the fair values of our reporting units. In response to changes in
65
industry and market conditions, we may be required to strategically realign our resources and consider restructuring, disposing of or otherwise exiting businesses, which could result in an impairment of goodwill.
ASC 350 permits an entity to assess qualitative factors to determine whether it is more likely than not that the fair value of a reporting unit is less than its carrying amount before applying the two-step goodwill impairment model. If it is determined through the qualitative assessment that a reporting unit's fair value is more likely than not greater than its carrying value, the remaining impairment steps would be unnecessary. The qualitative assessment is optional, allowing companies to go directly to the quantitative assessment. The quantitative assessment for goodwill impairment is a two-step test. Under the first step, the fair value of each reporting unit is compared with its carrying value (including goodwill). If the fair value of the reporting unit is less than its carrying value, an indication of goodwill impairment exists for the reporting unit and we must perform step two of the impairment test (measurement). Under step two, an impairment loss is recognized for any excess of the carrying amount of the reporting unit's goodwill over the implied fair value of that goodwill. The implied fair value of goodwill is determined by allocating the fair value of the reporting unit in a manner similar to a purchase price allocation, in accordance with ASC 805,
Business Combinations
. The residual fair value after this allocation is the implied fair value of the reporting unit goodwill. Fair value of the reporting unit is determined using a discounted cash flow analysis. If the fair value of the reporting unit exceeds its carrying value, step two does not need to be performed.
Based on our goodwill assessments, the Company has not identified a reporting unit for which the goodwill was impaired in 2016, 2015 or 2014. As a measure of sensitivity, a 10% decrease in the estimated fair value of the Company's reporting units would have ha
d no impact on
the carrying value of goodwill at the annual measurement date in
2016
.
As with goodwill, we assess indefinite-lived tradenames for impairment, in accordance with ASC 350, at least annually and whenever events or circumstances indicate that the carrying amount of the indefinite-lived tradenames may be impaired. At the end of each assessment, we make a determination as to whether the tradenames still have an indefinite life.
We review long-lived assets for possible impairment whenever circumstances indicate that their carrying amount may not be recoverable. If it is determined that the carrying amount of a long-lived asset exceeds the total amount of the estimated undiscounted future cash flows from that asset, we would recognize a loss to the extent that the carrying amount exceeds the fair value of the asset. Management judgment is involved in both deciding if testing for recovery is necessary and in estimating undiscounted cash flows. Our impairment analysis is based on the current business strategy, expected growth rates and estimated future economic conditions.
Self-Insurance Programs
We self-insure a portion of employee medical benefits under the terms of our employee health insurance program, as well as a portion of our automobile, general liability and workers' compensation claims. We have insurance coverage that limits the exposure on individual claims. We also have insurance coverage that limits the total exposure to overall automobile, general liability and workers' compensation claims.
We record an accrual for the claims expense related to our employee medical benefits, automobile, general liability and workers' compensation claims based upon the expected amount of all such claims, utilizing historical claims experience. Our calculation of self-insurance program reserves requires management to apply judgment to estimate the ultimate cost of reported claims and claims incurred but not yet reported as of the balance sheet date and the application of alternative assumptions could result in a different estimate of these liabilities. Trends in healthcare and legal costs could have a significant impact on anticipated claims. If actual claims are higher than anticipated, our reserves might be insufficient to cover the claims costs, which would have an adverse impact on the operating results in that period. As we obtain additional information that affects the assumptions and estimates we used to recognize liabilities for claims incurred in prior accounting periods, we adjust our self-insurance program reserves to reflect the revised estimates based on this additional information.
As a measure of sensitivity, a 10% change in our estimated self-insurance program reserves at
December 31, 2016
, would have impacted operating expenses approximately $4.3 million.
Legal Proceedings and Other Loss Contingencies
We are subject to the possibility of various legal proceedings and other loss contingencies, many involving litigation incidental to the business and a variety of environmental laws and regulations. Litigation and other loss contingencies are subject to inherent uncertainties and the outcomes of such matters are often very difficult to predict and generally are resolved over long periods of time. We consider the likelihood of loss or the incurrence of a liability, as well as the ability to reasonably estimate the amount of loss, in determining loss contingencies. Estimating probable losses requires the analysis of multiple possible outcomes that often are dependent on the judgment about potential actions by third parties. Contingencies are recorded in the consolidated financial statements, or otherwise disclosed, in accordance with ASC 450,
Contingencies
. We accrue for an estimated loss contingency when it is probable that a liability has been incurred and the amount of loss can be reasonably
66
estimated. Management regularly evaluates current information available to determine whether accrual amounts should be adjusted. If the amount of an actual loss is greater than the amount accrued, this could have an adverse impact on our operating results in that period.
Income Taxes
All income tax amounts reflect the use of the asset and liability method. Under this method, deferred tax assets and liabilities are determined based on the expected future tax consequences of temporary differences between the carrying amounts of assets and liabilities for financial and income tax reporting purposes, including the future tax benefits of tax net operating losses, tax credits and capital loss carryforwards. Quarterly, we evaluate the recoverability of our deferred tax assets by assessing the likelihood of sufficient future taxable income to realize our deferred tax assets. If it is more likely than not that some portion or all of a deferred tax asset will not be realized, a valuation allowance is recognized. At
December 31, 2016
, we recorded a valuation allowance of
$26.4 million
against tax net operating losses, tax credits and capital loss carryforwards of $32.5 million. In the event our operating performance declines, future assessments could conclude that a larger valuation allowance will be needed to further reduce these deferred tax assets.
We operate in multiple tax jurisdictions with different tax rates and must determine the appropriate allocation of income to each of these jurisdictions. In the normal course of business, we will undergo scheduled reviews by taxing authorities regarding the amount of taxes due. These reviews include questions regarding the timing and amount of deductions and the allocation of income among various tax jurisdictions. Tax reviews often require an extended period of time to resolve and may result in income tax adjustments if changes to the allocation are required between jurisdictions with different tax rates.
We record our tax provision based on existing laws, experience with previous settlement agreements, the status of current IRS (or other taxing authority) examinations and management's understanding of how the tax authorities view certain relevant industry and commercial matters. In accordance with ASC 740,
Income Taxes
, we recognize the effect of income tax positions only if those positions are more likely than not of being sustained. Recognized income tax positions are measured at the largest amount that is greater than 50% likely of being realized. Changes in recognition or measurement are reflected in the period in which the change in judgment occurs. We establish reserves when we believe that certain positions may not prevail if challenged by a taxing authority. We adjust these reserves in light of changing facts and circumstances. At
December 31, 2016
, the balance of unrecognized tax benefits was
$14.0 million
. This balance includes tax positions for which it is reasonably possible that the currently remaining unrecognized tax benefits will decrease within the next 12 months. This decrease is estimated to be in the range of
$2.0 million
to
$4.0 million
based on the potential outcome of the Company’s tax examinations and the expiration of the statute of limitations for specific jurisdictions.
A more complete description of our income taxes is disclosed in “Note 14 – Income Taxes” of our consolidated financial statements.
Off-Balance Sheet Arrangements
As of
December 31, 2016
, we had no off-balance sheet arrangements pursuant to Item 303(a)(4) of Regulation S-K under the Securities Exchange Act of 1934, as amended (the "Exchange Act").
New Accounting Standards
In November 2016, the Financial Accounting Standards Board ("FASB") issued Accounting Standards Update ("ASU") 2016-18,
Statement of Cash Flows (Topic 230): Restricted Cash,
which addresses diversity in practice that exists in the classification and presentation of changes in restricted cash on the statement of cash flows. The new guidance is effective for annual periods beginning after December 15, 2017, including interim periods within those fiscal years. Early adoption is permitted. The Company is currently evaluating the impact the adoption of ASU 2016-18 will have on the consolidated financial statements.
In August 2016, the FASB issued ASU 2016-15,
Statement of Cash Flows (Topic 230): Classification of Certain Cash Receipts and Cash Payments
, which provides guidance on the statement of cash flows presentation of certain transactions where diversity in practice exists. The new guidance is effective for annual periods beginning after December 15, 2017, including interim periods within those fiscal years. Early adoption is permitted. The Company is currently evaluating the impact the adoption of ASU 2016-15 will have on the consolidated financial statements.
67
In June 2016, the FASB issued ASU 2016-13,
Financial Instruments - Credit Losses (Topic 326): Measurement of Credit Losses on Financial Instruments.
The update changes the methodology for measuring credit losses on financial instruments and the timing of when such losses are recorded. The new guidance is effective for annual periods beginning after December 15, 2019, including interim periods within those fiscal years. Early adoption is permitted beginning in annual periods beginning after December 15, 2018, including interim periods within those fiscal years. The Company is currently evaluating the impact the adoption of ASU 2016-13 will have on the consolidated financial statements.
In March 2016, the FASB issued ASU 2016-09,
Compensation - Stock Compensation (Topic 718): Improvements to Employee Share-Based Payment Accounting.
The update changes how companies account for certain aspects of share-based payment awards to employees, including the accounting for income taxes, forfeitures and statutory tax withholding requirements, as well as classification in the statement of cash flows. The new guidance is effective for annual periods beginning after December 15, 2016, and interim periods within those annual periods. Early adoption is permitted. The Company will adopt ASU 2016-09 in the first quarter of 2017 and, unless offset by other factors, expects that its income tax expense will initially be lower as a result of excess tax benefits from stock-based compensation, including the expected exercise of approximately 0.4 million options that expire in 2017.
In February 2016, the FASB issued ASU 2016-02,
Leases (Topic 842),
which replaces existing lease guidance. The ASU is intended to provide enhanced transparency and comparability by requiring lessees to record right-of-use assets and corresponding lease liabilities on the balance sheet, with an exception for leases that meet the definition of a short-term lease. The new guidance will continue to classify leases as either finance or operating, with classification affecting the pattern of expense recognition in the statement of income. The new guidance is effective for fiscal years beginning after December 15, 2018, including interim periods within those fiscal years. Early adoption is permitted and the ASU is required to be applied with a modified retrospective approach to each prior reporting period presented with various optional practical expedients. The Company is currently evaluating the impact the adoption of ASU 2016-02 will have on the consolidated financial statements and anticipates that the new guidance will significantly impact its consolidated financial statements, as the Company has a significant number of leases. Our current minimum commitments under non-cancelable operating leases are disclosed in Note 13. In addition, the recognition of these leases on our consolidated balance sheet would increase our net debt calculation which is included in the determination of our Consolidated Senior Secured Leverage Ratio. In this event, our Credit Agreement specifies that the covenant shall continue to be calculated as if the accounting standard had not occurred and that we could enter into negotiations to amend such provisions in the Credit Agreement so as to equitably reflect such changes with the desired result that the criteria for evaluating our financial condition would be the same after the change as if such change had not been made. We plan to amend the applicable provision in our Credit Agreement upon the adoption of ASU 2016-02.
In May 2014, the FASB issued ASU 2014-09,
Revenue from Contracts with Customers (Topic 606)
, which superseded the revenue recognition requirements in Accounting Standards Codification 605,
Revenue Recognition
. The new guidance provides clarification on the recognition of revenue to depict the transfer of promised goods or services to customers in an amount that reflects the consideration to which the entity expects to be entitled in exchange for those goods or services. ASU 2014-09 also requires additional disclosures to help financial statement users better understand the nature, amount, timing and uncertainty of revenue that is recognized. In August 2015, the FASB issued ASU 2015-14
Revenue from Contracts with Customers (Topic 606): Deferral of the Effective Date
, which defers the effective date of ASU 2014-09 by one year. In accordance with the agreed upon delay, the new guidance is effective for the first annual reporting period and interim periods beginning after December 15, 2017, and will require either retrospective application to each prior reporting period presented or retrospective application with the cumulative effect of initially applying the standard recognized at the date of adoption. The Company expects to use retrospective application with the cumulative effect as its transition method. The Company is currently evaluating the impact the adoption of ASU 2014-09 will have on the consolidated financial statements and related disclosures. However, we have identified services such as towing, vehicle inspection reports and other pre-sale services which could result in the acceleration of revenue recognition.
68
Foreign Currency
Our foreign currency exposure is limited and arises from transactions denominated in foreign currencies, particularly intercompany loans, as well as from translation of the results of operations from our Canadian and, to a much lesser extent, United Kingdom and Mexican subsidiaries. However, fluctuations between U.S. and non-U.S. currency values may adversely affect our results of operations and financial position. We have not entered into any foreign exchange contracts to hedge changes in the Canadian dollar, British pound or Mexican peso. Canadian currency translation negatively affected net income by approximately $2.3 million and $9.2 million for the years ended
December 31, 2016
and
2015
, respectively. A 1% change in the average Canadian exchange rate for the year ended
December 31, 2016
would have impacted net income by approximately $0.9 million. Currency exposure of our U.K. and Mexican operations is not material to the results of operations.
Interest Rates
We are exposed to interest rate risk on our variable rate borrowings. Accordingly, interest rate fluctuations affect the amount of interest expense we are obligated to pay. We currently use interest rate cap agreements to manage our exposure to interest rate changes. We have not designated any of the interest rate caps as hedges for accounting purposes. Accordingly, changes in the fair value of the interest rate caps are recognized as "Interest expense" in the consolidated statement of income.
In August 2015, we purchased three interest rate caps for an aggregate amount of approximately $1.5 million with an aggregate notional amount of $800 million to manage our exposure to interest rate movements on our variable rate Credit Facility if/when three-month LIBOR (i) exceeded 2.0% between August 19, 2015 (the effective date) and September 29, 2016 and (ii) exceeds 1.75% between September 30, 2016 and August 19, 2017 (the maturity date).
In April 2015, we purchased two interest rate caps for approximately $0.7 million with an aggregate notional amount of $400 million to manage our exposure to interest rate movements on our variable rate Credit Facility when three-month LIBOR exceeds 1.5%. The interest rate cap agreements cap three-month LIBOR at 1.5%, had an effective date of April 16, 2015 and mature on March 31, 2017.
Taking our interest rate caps into account, a sensitivity analysis of the impact on our variable rate corporate debt instruments to a hypothetical 100 basis point increase in short-term rates (LIBOR) for the year ended
December 31, 2016
would have resulted in an increase in interest expense of approximately $21.8 million.
69
Index to Financial Statements
|
|
Page
|
|
KAR Auction Services, Inc.
|
|
70
Management's Report on Internal Control Over Financial Reporting
Our management is responsible for establishing and maintaining adequate internal control over financial reporting as defined in Rule 13a-15(f) under the Exchange Act. Our internal control over financial reporting is designed under the supervision of our principal executive officer and principal financial and accounting officer, and effected by our Board of Directors, management and other personnel, to provide reasonable assurance regarding the reliability of financial reporting and the preparation of financial statements for external purposes in accordance with U.S. GAAP and include those policies and procedures that:
|
•
|
Pertain to the maintenance of records that in reasonable detail accurately and fairly reflect our transactions and the dispositions of our assets;
|
|
•
|
Provide reasonable assurance that our transactions are recorded as necessary to permit preparation of financial statements in accordance with U.S. GAAP, and that our receipts and expenditures are being made only in accordance with authorizations of our management and Board of Directors; and
|
|
•
|
Provide reasonable assurance regarding prevention or timely detection of unauthorized acquisition, use or disposition of our assets that could have a material effect on our financial statements.
|
Because of its inherent limitations, internal control over financial reporting may not prevent or detect misstatements. Therefore, even those systems determined to be effective can provide only reasonable assurance with respect to financial statement preparation and presentation.
Under the supervision and with the participation of our management, including our principal executive officer and principal financial and accounting officer, we assessed the effectiveness of our internal control over financial reporting as of
December 31, 2016
, using the criteria set forth by the Committee of Sponsoring Organizations of the Treadway Commission (COSO) in
Internal Control—Integrated Framework (2013)
. Based on our assessment, we have concluded that our internal control over financial reporting was effective as of
December 31, 2016
. During our assessment, we did not identify any material weaknesses in our internal control over financial reporting.
We have excluded the 2016 acquisitions from our assessment of internal control over financial reporting as of December 31, 2016 because we are continuing to integrate the acquisitions into our corporate processes. The total assets of the 2016 acquisitions represent 6.5% (of which 5.2% represents goodwill and intangibles included within the scope of the assessment) and the total revenues of the 2016 acquisitions represent 3.5% of the related consolidated financial statement amounts as of and for the year ended December 31, 2016. No potential internal control changes due to new acquisitions would be considered material to, or are reasonably likely to materially affect, our internal control over financial reporting.
KPMG LLP, the independent registered public accounting firm that audited our consolidated financial statements for the year ended
December 31, 2016
, also audited the effectiveness of the Company's internal control over financial reporting as of
December 31, 2016
as stated in their report included in Item 8,
Financial Statements and Supplementary Data,
of this Annual Report on Form 10-K.
|
/s/ JAMES P. HALLETT
|
|
James P. Hallett
Chief Executive Officer
(Principal Executive Officer)
|
|
/s/ ERIC M. LOUGHMILLER
|
|
Eric M. Loughmiller
Chief Financial Officer
(Principal Financial and Accounting Officer)
|
71
Report of Independent Registered Public Accounting Firm
The Board of Directors and Stockholders
KAR Auction Services, Inc.:
We have audited the accompanying consolidated balance sheets of KAR Auction Services, Inc. and subsidiaries (the "Company") as of
December 31, 2016
and
2015
, and the related consolidated statements of income, comprehensive income, stockholders' equity and cash flows for each of the years in the three-year period ended
December 31, 2016
. We also have audited the Company's internal control over financial reporting as of
December 31, 2016
, based on criteria established in
Internal Control — Integrated Framework (2013)
issued by the Committee of Sponsoring Organizations of the Treadway Commission (COSO). The Company's management is responsible for these consolidated financial statements, for maintaining effective internal control over financial reporting, and for its assessment of the effectiveness of internal control over financial reporting, included in the accompanying management's report on internal control over financial reporting. Our responsibility is to express an opinion on these consolidated financial statements and an opinion on the Company's internal control over financial reporting based on our audits.
We conducted our audits in accordance with the standards of the Public Company Accounting Oversight Board (United States). Those standards require that we plan and perform the audits to obtain reasonable assurance about whether the financial statements are free of material misstatement and whether effective internal control over financial reporting was maintained in all material respects. Our audits of the consolidated financial statements included examining, on a test basis, evidence supporting the amounts and disclosures in the financial statements, assessing the accounting principles used and significant estimates made by management, and evaluating the overall financial statement presentation. Our audit of internal control over financial reporting included obtaining an understanding of internal control over financial reporting, assessing the risk that a material weakness exists, and testing and evaluating the design and operating effectiveness of internal control based on the assessed risk. Our audits also included performing such other procedures as we considered necessary in the circumstances. We believe that our audits provide a reasonable basis for our opinions.
A company's internal control over financial reporting is a process designed to provide reasonable assurance regarding the reliability of financial reporting and the preparation of financial statements for external purposes in accordance with generally accepted accounting principles. A company's internal control over financial reporting includes those policies and procedures that (1) pertain to the maintenance of records that, in reasonable detail, accurately and fairly reflect the transactions and dispositions of the assets of the company; (2) provide reasonable assurance that transactions are recorded as necessary to permit preparation of financial statements in accordance with generally accepted accounting principles, and that receipts and expenditures of the company are being made only in accordance with authorizations of management and directors of the company; and (3) provide reasonable assurance regarding prevention or timely detection of unauthorized acquisition, use, or disposition of the company's assets that could have a material effect on the financial statements.
Because of its inherent limitations, internal control over financial reporting may not prevent or detect misstatements. Also, projections of any evaluation of effectiveness to future periods are subject to the risk that controls may become inadequate because of changes in conditions, or that the degree of compliance with the policies or procedures may deteriorate.
In our opinion, the consolidated financial statements referred to above present fairly, in all material respects, the financial position of KAR Auction Services, Inc. and subsidiaries as of
December 31, 2016
and
2015
, and the results of their operations and their cash flows for each of the years in the three-year period ended
December 31, 2016
, in conformity with U.S. generally accepted accounting principles. Also in our opinion, KAR Auction Services, Inc. and subsidiaries maintained, in all material respects, effective internal control over financial reporting as of
December 31, 2016
, based on criteria established in
Internal Control — Integrated Framework (2013)
issued by COSO.
Management has excluded from its assessment of internal control over financial reporting as of December 31, 2016, the 2016 acquisitions' internal control over financial reporting associated with total assets of 6.5% (of which 5.2% represents goodwill and intangibles included within the scope of the assessment) and total revenues of 3.5% included in the consolidated financial statements of KAR Auction Services, Inc. and subsidiaries as of and for the year ended December 31, 2016. Our audit of internal control over financial reporting of KAR Auction Services, Inc. and subsidiaries also excluded an evaluation of the internal control over financial reporting of the 2016 acquisitions.
/s/ KPMG LLP
Indianapolis, Indiana
February 23, 2017
72
KAR Auction Services, Inc.
(In millions, except per share data)
|
|
Year Ended December 31,
|
||||||||||
|
|
2016
|
2015
|
2014
|
||||||||
|
Operating revenues
|
|
|
|
||||||||
|
ADESA Auction Services
|
$
|
1,765.3
|
|
$
|
1,427.8
|
|
$
|
1,271.0
|
|
||
|
IAA Salvage Services
|
1,098.0
|
|
994.4
|
|
895.9
|
|
|||||
|
AFC
|
286.8
|
|
268.4
|
|
250.1
|
|
|||||
|
Total operating revenues
|
3,150.1
|
|
2,690.6
|
|
2,417.0
|
|
|||||
|
Operating expenses
|
|
|
|
||||||||
|
Cost of services (exclusive of depreciation and amortization)
|
1,827.4
|
|
1,548.5
|
|
1,371.3
|
|
|||||
|
Selling, general and administrative
|
583.1
|
|
502.0
|
|
471.4
|
|
|||||
|
Depreciation and amortization
|
240.6
|
|
212.8
|
|
196.6
|
|
|||||
|
Total operating expenses
|
2,651.1
|
|
2,263.3
|
|
2,039.3
|
|
|||||
|
Operating profit
|
499.0
|
|
427.3
|
|
377.7
|
|
|||||
|
Interest expense
|
138.8
|
|
91.4
|
|
86.2
|
|
|||||
|
Other income, net
|
(0.5
|
)
|
(4.6
|
)
|
(3.8
|
)
|
|||||
|
Loss on extinguishment of debt
|
5.4
|
|
—
|
|
30.3
|
|
|||||
|
Income before income taxes
|
355.3
|
|
340.5
|
|
265.0
|
|
|||||
|
Income taxes
|
132.9
|
|
125.9
|
|
95.7
|
|
|||||
|
Net income
|
$
|
222.4
|
|
$
|
214.6
|
|
$
|
169.3
|
|
||
|
Net income per share
|
|
|
|
||||||||
|
Basic
|
$
|
1.62
|
|
$
|
1.53
|
|
$
|
1.21
|
|
||
|
Diluted
|
$
|
1.60
|
|
$
|
1.51
|
|
$
|
1.19
|
|
||
|
Dividends declared per common share
|
$
|
1.19
|
|
$
|
1.08
|
|
$
|
1.02
|
|
||
See accompanying notes to consolidated financial statements
73
KAR Auction Services, Inc.
Consolidated Statements of Comprehensive Income
(In millions)
|
|
Year Ended December 31,
|
||||||||||
|
|
2016
|
2015
|
2014
|
||||||||
|
Net income
|
$
|
222.4
|
|
$
|
214.6
|
|
$
|
169.3
|
|
||
|
Other comprehensive loss, net of tax
|
|
|
|
||||||||
|
Foreign currency translation loss
|
(9.1
|
)
|
(38.5
|
)
|
(20.3
|
)
|
|||||
|
Unrealized loss on postretirement benefit obligation
|
—
|
|
(0.1
|
)
|
—
|
|
|||||
|
Total other comprehensive loss, net of tax
|
(9.1
|
)
|
(38.6
|
)
|
(20.3
|
)
|
|||||
|
Comprehensive income
|
$
|
213.3
|
|
$
|
176.0
|
|
$
|
149.0
|
|
||
See accompanying notes to consolidated financial statements
74
KAR Auction Services, Inc.
(In millions)
|
|
December 31,
|
||||||
|
|
2016
|
2015
|
|||||
|
Assets
|
|
|
|||||
|
Current assets
|
|
|
|||||
|
Cash and cash equivalents
|
$
|
201.8
|
|
$
|
155.0
|
|
|
|
Restricted cash
|
17.9
|
|
16.2
|
|
|||
|
Trade receivables, net of allowances of $13.0 and $6.6
|
682.9
|
|
511.9
|
|
|||
|
Finance receivables, net of allowances $12.0 and $9.0
|
1,780.2
|
|
1,632.0
|
|
|||
|
Other current assets
|
158.4
|
|
131.0
|
|
|||
|
Total current assets
|
2,841.2
|
|
2,446.1
|
|
|||
|
Other assets
|
|
|
|||||
|
Goodwill
|
2,057.0
|
|
1,795.9
|
|
|||
|
Customer relationships, net of accumulated amortization of $707.8 and $619.3
|
461.0
|
|
417.7
|
|
|||
|
Other intangible assets, net of accumulated amortization of $301.6 and $258.1
|
320.1
|
|
310.8
|
|
|||
|
Other assets
|
35.8
|
|
34.1
|
|
|||
|
Total other assets
|
2,873.9
|
|
2,558.5
|
|
|||
|
Property and equipment, net of accumulated depreciation of $655.6 and $569.6
|
842.5
|
|
766.9
|
|
|||
|
Total assets
|
$
|
6,557.6
|
|
$
|
5,771.5
|
|
|
See accompanying notes to consolidated financial statements
75
KAR Auction Services, Inc.
Consolidated Balance Sheets
(In millions, except share and per share data)
|
|
December 31,
|
||||||
|
|
2016
|
2015
|
|||||
|
Liabilities and Stockholders' Equity
|
|
|
|||||
|
Current liabilities
|
|
|
|||||
|
Accounts payable
|
$
|
648.5
|
|
$
|
608.4
|
|
|
|
Accrued employee benefits and compensation expenses
|
100.7
|
|
90.9
|
|
|||
|
Accrued interest
|
2.2
|
|
0.8
|
|
|||
|
Other accrued expenses
|
149.4
|
|
128.4
|
|
|||
|
Income taxes payable
|
5.0
|
|
5.3
|
|
|||
|
Dividends payable
|
43.7
|
|
37.2
|
|
|||
|
Obligations collateralized by finance receivables
|
1,280.3
|
|
1,189.0
|
|
|||
|
Current maturities of long-term debt
|
105.2
|
|
153.9
|
|
|||
|
Total current liabilities
|
2,335.0
|
|
2,213.9
|
|
|||
|
Non-current liabilities
|
|
|
|||||
|
Long-term debt
|
2,365.1
|
|
1,711.2
|
|
|||
|
Deferred income tax liabilities
|
291.7
|
|
300.8
|
|
|||
|
Other liabilities
|
168.5
|
|
159.5
|
|
|||
|
Total non-current liabilities
|
2,825.3
|
|
2,171.5
|
|
|||
|
Commitments and contingencies (Note 16)
|
|
|
|||||
|
Stockholders' equity
|
|
|
|||||
|
Preferred stock, $0.01 par value:
|
|
|
|||||
|
Authorized shares: 100,000,000
|
|
|
|
|
|||
|
Issued shares: none
|
—
|
|
—
|
|
|||
|
Common stock, $0.01 par value:
|
|
|
|||||
|
Authorized shares: 400,000,000
|
|
|
|
|
|||
|
Issued and outstanding shares:
|
|
|
|
|
|||
|
136,639,217 (2016)
|
|
|
|
|
|||
|
137,795,296 (2015)
|
1.4
|
|
1.4
|
|
|||
|
Additional paid-in capital
|
1,371.1
|
|
1,407.6
|
|
|||
|
Retained earnings
|
74.1
|
|
17.3
|
|
|||
|
Accumulated other comprehensive loss
|
(49.3
|
)
|
(40.2
|
)
|
|||
|
Total stockholders' equity
|
1,397.3
|
|
1,386.1
|
|
|||
|
Total liabilities and stockholders' equity
|
$
|
6,557.6
|
|
$
|
5,771.5
|
|
|
See accompanying notes to consolidated financial statements
76
KAR Auction Services, Inc.
Consolidated Statements of Stockholders' Equity
(In millions)
|
Common
Stock
Shares
|
Common
Stock
Amount
|
Additional
Paid-In
Capital
|
(Accumulated
Deficit)/Retained Earnings
|
Accumulated
Other
Comprehensive
Income (Loss)
|
Total
|
|||||||||||||||||
|
Balance at December 31, 2013
|
139.0
|
|
$
|
1.4
|
|
$
|
1,534.0
|
|
$
|
(72.3
|
)
|
$
|
18.7
|
|
$
|
1,481.8
|
|
|||||
|
Net income
|
|
|
169.3
|
|
169.3
|
|
||||||||||||||||
|
Other comprehensive loss
|
|
|
(20.3
|
)
|
(20.3
|
)
|
||||||||||||||||
|
Issuance of common stock under stock plans
|
2.3
|
|
27.6
|
|
27.6
|
|
||||||||||||||||
|
Stock-based compensation expense
|
|
|
28.0
|
|
28.0
|
|
||||||||||||||||
|
Excess tax benefit from stock-based compensation
|
|
|
4.1
|
|
4.1
|
|
||||||||||||||||
|
Cash dividends declared to stockholders ($1.02 per share)
|
(143.4
|
)
|
(143.4
|
)
|
||||||||||||||||||
|
Balance at December 31, 2014
|
141.3
|
|
1.4
|
|
1,593.7
|
|
(46.4
|
)
|
(1.6
|
)
|
1,547.1
|
|
||||||||||
|
Net income
|
|
|
214.6
|
|
214.6
|
|
||||||||||||||||
|
Other comprehensive loss
|
|
|
(38.6
|
)
|
(38.6
|
)
|
||||||||||||||||
|
Issuance of common stock under stock plans
|
1.8
|
|
22.7
|
|
22.7
|
|
||||||||||||||||
|
Stock-based compensation expense
|
|
|
11.7
|
|
11.7
|
|
||||||||||||||||
|
Excess tax benefit from stock-based compensation
|
|
|
7.1
|
|
7.1
|
|
||||||||||||||||
|
Repurchase and retirement of common stock
|
(5.3
|
)
|
(227.6
|
)
|
(227.6
|
)
|
||||||||||||||||
|
Cash dividends declared to stockholders ($1.08 per share)
|
(150.9
|
)
|
(150.9
|
)
|
||||||||||||||||||
|
Balance at December 31, 2015
|
137.8
|
|
1.4
|
|
1,407.6
|
|
17.3
|
|
(40.2
|
)
|
1,386.1
|
|
||||||||||
|
Net income
|
|
|
222.4
|
|
222.4
|
|
||||||||||||||||
|
Other comprehensive loss
|
|
|
(9.1
|
)
|
(9.1
|
)
|
||||||||||||||||
|
Issuance of common stock under stock plans
|
1.5
|
|
6.6
|
|
6.6
|
|
||||||||||||||||
|
Stock-based compensation expense
|
|
|
18.1
|
|
18.1
|
|
||||||||||||||||
|
Excess tax benefit from stock-based compensation
|
|
|
17.2
|
|
17.2
|
|
||||||||||||||||
|
Repurchase and retirement of common stock
|
(2.7
|
)
|
(80.4
|
)
|
(80.4
|
)
|
||||||||||||||||
|
Dividends earned under stock plans
|
2.0
|
|
(2.0
|
)
|
—
|
|
||||||||||||||||
|
Cash dividends declared to stockholders ($1.19 per share)
|
|
|
(163.6
|
)
|
(163.6
|
)
|
||||||||||||||||
|
Balance at December 31, 2016
|
136.6
|
|
$
|
1.4
|
|
$
|
1,371.1
|
|
$
|
74.1
|
|
$
|
(49.3
|
)
|
$
|
1,397.3
|
|
|||||
See accompanying notes to consolidated financial statements
77
KAR Auction Services, Inc.
(In millions)
|
|
Year Ended December 31,
|
||||||||||
|
|
2016
|
2015
|
2014
|
||||||||
|
Operating activities
|
|
|
|
||||||||
|
Net income
|
$
|
222.4
|
|
$
|
214.6
|
|
$
|
169.3
|
|
||
|
Adjustments to reconcile net income to net cash provided by operating activities:
|
|
|
|
||||||||
|
Depreciation and amortization
|
240.6
|
|
212.8
|
|
196.6
|
|
|||||
|
Provision for credit losses
|
40.5
|
|
18.8
|
|
16.6
|
|
|||||
|
Deferred income taxes
|
(4.2
|
)
|
5.0
|
|
(24.5
|
)
|
|||||
|
Amortization of debt issuance costs
|
8.8
|
|
7.2
|
|
7.5
|
|
|||||
|
Stock-based compensation
|
18.1
|
|
11.7
|
|
28.0
|
|
|||||
|
Excess tax benefit from stock-based compensation
|
(17.2
|
)
|
(7.1
|
)
|
(4.1
|
)
|
|||||
|
Loss (gain) on disposal of fixed assets
|
0.1
|
|
0.9
|
|
(0.2
|
)
|
|||||
|
Loss on extinguishment of debt
|
5.4
|
|
—
|
|
30.3
|
|
|||||
|
Other non-cash, net
|
9.5
|
|
2.0
|
|
3.6
|
|
|||||
|
Changes in operating assets and liabilities, net of acquisitions:
|
|
|
|
||||||||
|
Trade receivables and other assets
|
(194.7
|
)
|
(127.0
|
)
|
(52.3
|
)
|
|||||
|
Accounts payable and accrued expenses
|
31.5
|
|
136.1
|
|
60.5
|
|
|||||
|
Net cash provided by operating activities
|
360.8
|
|
475.0
|
|
431.3
|
|
|||||
|
Investing activities
|
|
|
|
||||||||
|
Net increase in finance receivables held for investment
|
(176.4
|
)
|
(295.9
|
)
|
(282.8
|
)
|
|||||
|
Acquisition of businesses (net of cash acquired) and equity method investments
|
(432.1
|
)
|
(118.1
|
)
|
(31.9
|
)
|
|||||
|
Purchases of property, equipment and computer software
|
(155.1
|
)
|
(134.7
|
)
|
(101.0
|
)
|
|||||
|
Proceeds from the sale of property and equipment
|
—
|
|
0.3
|
|
1.1
|
|
|||||
|
(Increase) decrease in restricted cash
|
(1.7
|
)
|
0.8
|
|
1.8
|
|
|||||
|
Net cash used by investing activities
|
(765.3
|
)
|
(547.6
|
)
|
(412.8
|
)
|
|||||
|
Financing activities
|
|
|
|
||||||||
|
Net increase in book overdrafts
|
17.7
|
|
10.7
|
|
9.9
|
|
|||||
|
Net (decrease) increase in borrowings from lines of credit
|
(59.5
|
)
|
140.0
|
|
—
|
|
|||||
|
Net increase in obligations collateralized by finance receivables
|
96.8
|
|
349.8
|
|
99.6
|
|
|||||
|
Proceeds from long-term debt
|
1,336.5
|
|
—
|
|
1,767.2
|
|
|||||
|
Payments for debt issuance costs/amendments
|
(32.8
|
)
|
(10.9
|
)
|
(12.3
|
)
|
|||||
|
Payments on long-term debt
|
(662.6
|
)
|
(21.5
|
)
|
(1,785.1
|
)
|
|||||
|
Payments on capital leases
|
(25.6
|
)
|
(20.5
|
)
|
(19.4
|
)
|
|||||
|
Payments of contingent consideration and deferred acquisition costs
|
(3.6
|
)
|
(1.2
|
)
|
(0.2
|
)
|
|||||
|
Initial net investment for interest rate caps
|
—
|
|
(2.2
|
)
|
—
|
|
|||||
|
Issuance of common stock under stock plans
|
6.6
|
|
22.7
|
|
27.6
|
|
|||||
|
Excess tax benefit from stock-based compensation
|
17.2
|
|
7.1
|
|
4.1
|
|
|||||
|
Repurchase and retirement of common stock
|
(80.4
|
)
|
(227.6
|
)
|
—
|
|
|||||
|
Dividends paid to stockholders
|
(157.1
|
)
|
(151.9
|
)
|
(139.9
|
)
|
|||||
|
Net cash provided by (used by) financing activities
|
453.2
|
|
94.5
|
|
(48.5
|
)
|
|||||
|
Effect of exchange rate changes on cash
|
(1.9
|
)
|
(19.8
|
)
|
(8.7
|
)
|
|||||
|
Net increase (decrease) in cash and cash equivalents
|
46.8
|
|
2.1
|
|
(38.7
|
)
|
|||||
|
Cash and cash equivalents at beginning of period
|
155.0
|
|
152.9
|
|
191.6
|
|
|||||
|
Cash and cash equivalents at end of period
|
$
|
201.8
|
|
$
|
155.0
|
|
$
|
152.9
|
|
||
|
Cash paid for interest
|
$
|
124.5
|
|
$
|
79.7
|
|
$
|
75.9
|
|
||
|
Cash paid for taxes, net of refunds
|
$
|
121.6
|
|
$
|
129.9
|
|
$
|
102.2
|
|
||
See accompanying notes to consolidated financial statements
78
KAR Auction Services, Inc.
Notes to Consolidated Financial Statements
December 31, 2016
,
2015
and
2014
KAR Auction Services, Inc. was organized in the State of Delaware on November 9, 2006. The KAR group of companies is comprised of ADESA, Inc., Insurance Auto Auctions, Inc., Automotive Finance Corporation and additional business units.
Defined Terms
Unless otherwise indicated or unless the context otherwise requires, the following terms used herein shall have the following meanings:
|
•
|
"we," "us," "our" and "the Company" refer, collectively, to KAR Auction Services, Inc. and all of its subsidiaries;
|
|
•
|
"ADESA" or "ADESA Auctions" refer, collectively, to ADESA, Inc., a wholly-owned subsidiary of KAR Auction Services, and ADESA, Inc.'s subsidiaries, including Openlane, Inc. (together with Openlane, Inc.'s subsidiaries, "Openlane") and ADESA Remarketing Limited (formerly known as GRS Remarketing Limited ("GRS" or "ADESA Remarketing Limited"));
|
|
•
|
"AFC" refers, collectively, to Automotive Finance Corporation, a wholly-owned subsidiary of ADESA, and Automotive Finance Corporation's subsidiaries and other related entities, including PWI Holdings, Inc.;
|
|
•
|
"Credit Agreement" refers to the Amended and Restated Credit Agreement, dated March 11, 2014, as amended on March 9, 2016, among KAR Auction Services, as the borrower, the several banks and other financial institutions or entities from time to time parties thereto and the administrative agent;
|
|
•
|
"Original Credit Agreement" refers to the Credit Agreement, dated May 19, 2011, as amended on November 29, 2012 and March 12, 2013, among KAR Auction Services, as the borrower, the several banks and other financial institutions or entities from time to time parties thereto and the administrative agent;
|
|
•
|
"Credit Facility" refers to the
three
-year senior secured term loan B-1 facility ("Term Loan B-1"), the
seven
-year senior secured term loan B-2 facility ("Term Loan B-2"), the
seven
-year senior secured term loan B-3 facility ("Term Loan B-3"), the
$300 million
,
five
-year senior secured revolving credit facility (the "revolving credit facility") and the
$250 million
,
five
-year senior secured revolving credit facility (the "old revolving credit facility"), the terms of which are set forth in the Credit Agreement. Term Loan B-1 and the old revolving credit facility were extinguished in March 2016 with proceeds received from Term Loan B-3;
|
|
•
|
"Original Credit Facility" refers to the
six
-year senior secured term loan facility ("Term Loan B") and the
$250 million
,
five
-year senior secured revolving credit facility, the terms of which are set forth in the Original Credit Agreement;
|
|
•
|
"IAA" refers, collectively, to Insurance Auto Auctions, Inc., a wholly-owned subsidiary of KAR Auction Services, and Insurance Auto Auctions, Inc.'s subsidiaries and other related entities, including HBC Vehicle Services Limited ("HBC"); and
|
|
•
|
"KAR Auction Services" refers to KAR Auction Services, Inc. and not to its subsidiaries.
|
Business and Nature of Operations
As of
December 31, 2016
, we have a North American network of
77
ADESA whole car auction sites and
172
IAA salvage vehicle auction sites; in addition, we offer online auctions for both whole car and salvage vehicles. ADESA also includes ADESA Remarketing Limited, an online whole car vehicle remarketing business in the United Kingdom. IAA also includes HBC Vehicle Services Limited, which operates from
11
locations in the United Kingdom. Our auctions facilitate the sale of used and salvage vehicles through physical, online or hybrid auctions, which permit Internet buyers to participate in physical auctions. ADESA and IAA are leading, national providers of wholesale and salvage vehicle auctions and related vehicle remarketing services for the automotive industry in North America. ADESA's online service offerings include customized private label solutions powered with software developed by its wholly-owned subsidiary, Openlane, that allow our institutional consignors (automobile manufacturers, captive finance companies and other institutions) to offer vehicles via the Internet prior to arrival at the physical auction. Remarketing services include a variety of activities designed to transfer used and salvage vehicles between sellers and buyers throughout the vehicle life cycle. ADESA and IAA facilitate the exchange of these vehicles through an auction marketplace, which aligns sellers and buyers. As an agent for customers, the Company
79
KAR Auction Services, Inc.
Notes to Consolidated Financial Statements (Continued)
December 31, 2016, 2015 and 2014
generally does not take title to or ownership of vehicles sold at the auctions. Generally, fees are earned from the seller and buyer on each successful auction transaction in addition to fees earned for ancillary services.
ADESA has the second largest used vehicle auction network in North America, based upon the number of used vehicles sold through auctions annually, and also provides services such as inbound and outbound transportation logistics, reconditioning, vehicle inspection and certification, titling, administrative and collateral recovery services. ADESA is able to serve the diverse and multi-faceted needs of its customers through the wide range of services offered.
IAA is one of the leading providers of salvage vehicle auctions and related services. The salvage auctions facilitate the remarketing of damaged vehicles that are designated as total losses by insurance companies, recovered stolen vehicles for which an insurance settlement with the vehicle owner has already been made, purchased vehicles and older model vehicles donated to charity or sold by dealers in salvage auctions. The salvage auction business specializes in providing services such as inbound transportation logistics, inspections, evaluations, salvage recovery services, titling and settlement administrative services.
AFC is a leading provider of floorplan financing to independent used vehicle dealers and this financing is provided through
126
locations throughout the United States and Canada as of
December 31, 2016
. Floorplan financing supports independent used vehicle dealers in North America who purchase vehicles at ADESA, IAA, other used vehicle and salvage auctions and non-auction purchases. In addition to floorplan financing, AFC also provides independent used vehicle dealers with other related services and products, such as vehicle service contracts.
Principles of Consolidation
The consolidated financial statements include the accounts of KAR Auction Services and all of its majority owned subsidiaries. Significant intercompany transactions and balances have been eliminated.
Use of Estimates
The preparation of the consolidated financial statements in conformity with accounting principles generally accepted in the U.S. requires management to make estimates based in part on assumptions about current, and for some estimates, future economic and market conditions that affect the reported amounts of assets and liabilities and disclosure of contingent assets and liabilities at the date of the financial statements, and the reported amounts of revenues and expenses during the period. Although the current estimates contemplate current conditions and expected future changes, as appropriate, it is reasonably possible that future conditions could differ from these estimates, which could materially affect our results of operations and financial position. Among other effects, such changes could result in future impairments of goodwill, intangible assets and long-lived assets, incremental losses on finance receivables, additional allowances on accounts receivable and deferred tax assets, changes in litigation and other loss contingencies and changes in self insurance reserves.
Business Segments
Our operations are grouped into
three
operating segments: ADESA Auctions, IAA and AFC. The
three
operating segments also serve as our reportable business segments. Operations are measured through detailed budgeting and monitoring of contributions to consolidated income by each business segment.
Derivative Instruments and Hedging Activity
We recognize all derivative financial instruments in the consolidated financial statements at fair value in accordance with Accounting Standards Codification ("ASC") 815,
Derivatives and Hedging
. We currently use
five
interest rate caps to manage the variability of cash flows to be paid due to interest rate movements on our variable rate debt. The fair values of the interest rate derivatives are based on quoted market prices for similar instruments from commercial banks. The fair value of the derivatives is recorded in "Other assets" on the consolidated balance sheet. We have not designated any of the current interest rate caps as hedges for accounting purposes. Accordingly, changes in the fair value of the interest rate derivatives are recognized as "Interest expense" in the consolidated statement of income.
80
KAR Auction Services, Inc.
Notes to Consolidated Financial Statements (Continued)
December 31, 2016, 2015 and 2014
Foreign Currency Translation
The local currency is the functional currency for each of our foreign entities. Revenues and expenses denominated in foreign currencies are translated into U.S. dollars at average exchange rates in effect during the year. Assets and liabilities of foreign operations are translated using the exchange rates in effect at year end. Foreign currency transaction gains and losses are included in the consolidated statements of income within "Other income, net" and resulted in a loss of
$0.7 million
for the year ended
December 31, 2016
, a loss of
$1.0 million
for the year ended
December 31, 2015
and a loss of
$0.3 million
for the year ended
December 31, 2014
. Adjustments arising from the translation of net assets located outside the U.S. (gains and losses) are shown as a component of "Accumulated other comprehensive income."
Cash Equivalents
All highly liquid investments with an original maturity of three months or less are considered to be cash equivalents. These investments are valued at cost, which approximates fair value.
Restricted Cash
AFC Funding Corporation, a wholly-owned, bankruptcy remote, consolidated, special purpose subsidiary of AFC, is required to maintain a minimum cash reserve of
1
percent of total receivables sold to the group of bank purchasers as security for the receivables sold. Automotive Finance Canada Inc. ("AFCI") is also required to maintain a minimum cash reserve of
1
percent of total receivables sold to its securitization facility. The amount of the cash reserve depends on circumstances which are set forth in the securitization agreements. AFC also maintains other cash reserves from time to time associated with its banking and vehicle service contract program insurance relationships.
Receivables
Trade receivables include the unremitted purchase price of vehicles purchased by third parties at the auctions, fees to be collected from those buyers and amounts due for services provided by us related to certain consigned vehicles in our possession. The amounts due with respect to the consigned vehicles are generally deducted from the sales proceeds upon the eventual auction or other disposition of the related vehicles.
Finance receivables include floorplan receivables created by financing dealer purchases of vehicles in exchange for a security interest in those vehicles and special purpose loans. Floorplan receivables become due at the earlier of the dealer subsequently selling the vehicle or a predetermined time period (generally
30
to
90
days). Special purpose loans relate to loans that are either line of credit loans or working capital loans that can be either secured or unsecured based on the facts and circumstances of the specific loans.
Due to the nature of our business, substantially all trade and finance receivables are due from vehicle dealers, salvage buyers, institutional sellers and insurance companies. We have possession of vehicles or vehicle titles collateralizing a significant portion of the trade and finance receivables.
Trade receivables and finance receivables are reported net of an allowance for doubtful accounts and credit losses. The allowances for doubtful accounts and credit losses are based on management's evaluation of the receivables portfolio under current conditions, the volume of the portfolio, overall portfolio credit quality, review of specific collection issues and such other factors which in management's judgment deserve recognition in estimating losses.
Other Current Assets
Other current assets consist of inventories, prepaid expenses, taxes receivable and other miscellaneous assets. The inventories, which consist of vehicles, supplies and parts, are accounted for on the specific identification method and are stated at the lower of cost or net realizable value.
Goodwill
Goodwill represents the excess of cost over fair value of identifiable net assets of businesses acquired. Goodwill is tested for impairment annually in the second quarter, or more frequently as impairment indicators arise. ASC 350,
Intangibles—Goodwill and Other
, permits an entity to assess qualitative factors to determine whether it is more likely than not that the fair value of a reporting unit is less than its carrying amount before applying the two-step goodwill impairment model. If it is determined through the qualitative assessment that a reporting unit's fair value is more likely than not greater than its carrying
81
KAR Auction Services, Inc.
Notes to Consolidated Financial Statements (Continued)
December 31, 2016, 2015 and 2014
value, the remaining impairment steps would be unnecessary. The qualitative assessment is optional, allowing companies to go directly to the quantitative assessment. The quantitative assessment for goodwill impairment is a two-step test. Under the first step, the fair value of each reporting unit is compared with its carrying value (including goodwill). If the fair value of the reporting unit is less than its carrying value, an indication of goodwill impairment exists for the reporting unit and we must perform step two of the impairment test (measurement). Under step two, an impairment loss is recognized for any excess of the carrying amount of the reporting unit's goodwill over the implied fair value of that goodwill. The implied fair value of goodwill is determined by allocating the fair value of the reporting unit in a manner similar to a purchase price allocation, in accordance with ASC 805,
Business Combinations
. The residual fair value after this allocation is the implied fair value of the reporting unit goodwill. Fair value of the reporting unit is determined using a discounted cash flow analysis. If the fair value of the reporting unit exceeds its carrying value, step two does not need to be performed.
Customer Relationships and Other Intangible Assets
Customer relationships are amortized on a straight-line basis over the life determined in the valuation of the particular acquisition. Other intangible assets generally consist of tradenames, computer software and non-compete agreements, which if amortized, are amortized using the straight-line method. Tradenames with indefinite lives are not amortized and tradenames that have been assigned a useful life are amortized over their estimated useful lives. Costs incurred related to software developed or obtained for internal use are capitalized during the application development stage of software development and amortized over their estimated useful lives. The non-compete agreements are amortized over the life of the agreements. The lives of other intangible assets are re-evaluated periodically when facts and circumstances indicate that revised estimates of useful lives may be warranted. Indefinite-lived tradenames are assessed for impairment, in accordance with ASC 350, annually in the second quarter or more frequently as impairment indicators arise. At the end of each assessment, we make a determination as to whether the tradenames still have an indefinite life.
Property and Equipment
Property and equipment are stated at historical cost less accumulated depreciation. Depreciation is computed using the straight-line method at rates intended to depreciate the costs of assets over their estimated useful lives. Upon retirement or sale of property and equipment, the cost of the disposed assets and related accumulated depreciation is removed from the accounts and any resulting gain or loss is credited or charged to selling, general and administrative expenses. Expenditures for normal repairs and maintenance are charged to expense as incurred. Additions and expenditures for improving or rebuilding existing assets that extend the useful life are capitalized. Leasehold improvements made either at the inception of the lease or during the lease term are amortized over the shorter of their economic lives or the lease term including any renewals that are reasonably assured.
Unamortized Debt Issuance Costs
Debt issuance costs reflect the expenditures incurred in conjunction with term loan debt, the revolving credit facility and the U.S. and Canadian receivables purchase agreements. The debt issuance costs are being amortized to interest expense using the effective interest method or the straight-line method, as applicable, over the lives of the related debt issues.
We adopted Accounting Standards Update (“ASU”) 2015-03,
Interest - Imputation of Interest (Subtopic 835-30): Simplifying the Presentation of Debt Issuance Costs
, in the first quarter of 2016. The update required debt issuance costs related to a recognized debt liability to be presented in the balance sheet as a direct deduction from the carrying amount of the related debt liability instead of being presented as an asset. The new guidance represents a change in accounting principle and required retrospective application. As shown in the table below, we have reclassified unamortized debt issuance costs previously reported as of December 31, 2015
(in millions):
|
Originally Reported
|
Reclassified
|
As Adjusted
|
|||||||||
|
Unamortized debt issuance costs
|
$
|
20.3
|
|
$
|
(20.3
|
)
|
$
|
—
|
|
||
|
Obligations collateralized by finance receivables
|
1,201.2
|
|
(12.2
|
)
|
1,189.0
|
|
|||||
|
Long-term debt
|
1,719.3
|
|
(8.1
|
)
|
1,711.2
|
|
|||||
82
KAR Auction Services, Inc.
Notes to Consolidated Financial Statements (Continued)
December 31, 2016, 2015 and 2014
Other Assets
Other assets consist of equity method investments, below market leases, deposits, notes receivable and other long-term assets.
Equity Method Investments
We use the equity method to account for investments in companies when we have the ability to exercise significant influence over operating and financial policies of the investee but do not have a controlling financial interest. Our judgment regarding the level of influence over an equity method investment includes considering key factors such as our ownership interest, representation on the board of directors, participation in policy making decisions and material intercompany transactions. Under this method of accounting, the Company records its proportionate share of the net earnings or losses of the equity method investee and a corresponding increase or decrease to the investment balance, which is included in "Other assets" on the consolidated balance sheet. Based on the timing of when financial information is received from the investee, the Company records its share of net earnings or losses of such investments on a lag basis. The Company evaluates its equity method investments for impairment whenever events or changes in circumstances indicate that the carrying amounts of such investments may not be recoverable.
Long-Lived Assets
Management reviews our property and equipment, customer relationships and other intangible assets for impairment whenever events or changes in circumstances indicate that their carrying amount may not be recoverable. The determination includes evaluation of factors such as current market value, future asset utilization, business climate, and future cash flows expected to result from the use of the related assets. If the carrying amount of a long-lived asset exceeds the total amount of the estimated undiscounted future cash flows from that asset, a loss is recognized in the period to the extent that the carrying amount exceeds the fair value of the asset. The impairment analysis is based on our current business strategy, expected growth rates and estimated future economic and regulatory conditions.
Accounts Payable
Accounts payable include amounts due sellers from the proceeds of the sale of their consigned vehicles less any fees, as well as outstanding checks to sellers and vendors. Book overdrafts, representing outstanding checks in excess of funds on deposit, are recorded in "Accounts payable" and amounted to
$154.4 million
and
$136.7 million
at
December 31, 2016
and
2015
, respectively.
Self Insurance Reserves
We self-insure our employee medical benefits, as well as a portion of our automobile, general liability and workers' compensation claims. We have insurance coverage that limits the exposure on individual claims. We also have insurance coverage that limits the total exposure to overall automobile, general liability and workers' compensation claims. The cost of the insurance is expensed over the contract periods. We record an accrual for the claims expense related to our employee medical benefits, automobile, general liability and workers' compensation claims based upon the expected amount of all such claims. Accrued medical benefits and workers' compensation expenses are included in "Accrued employee benefits and compensation expenses" while accrued automobile and general liability expenses are included in "Other accrued expenses."
Environmental Liabilities
Accruals for environmental matters are recorded when it is probable that a liability has been incurred and the amount of the liability can be reasonably estimated, based on current law and existing technologies. These accruals are adjusted periodically as assessment and remediation efforts progress, or as additional technical or legal information becomes available. Accruals for environmental liabilities are included in "Other accrued expenses" at undiscounted amounts and exclude claims for recoveries from insurance or other third parties.
Revenue Recognition
ADESA Auction Services
Revenues and the related costs are recognized when the services are performed. Auction fees from sellers and buyers are recognized upon the sale of the vehicle through the auction process. Most of the vehicles that are sold through auctions are
83
KAR Auction Services, Inc.
Notes to Consolidated Financial Statements (Continued)
December 31, 2016, 2015 and 2014
consigned to ADESA by the seller and held at ADESA's facilities or third party locations. ADESA does not take title to these consigned vehicles and recognizes revenue when a service is performed as requested by the owner of the vehicle. ADESA does not record the gross selling price of the consigned vehicles sold at auction as revenue. Instead, ADESA records only its auction fees as revenue because it does not take title to the consigned vehicles, has no influence on the vehicle auction selling price agreed to by the seller and buyer at the auction and the fees that ADESA receives for its services are generally a fixed amount. Revenues from reconditioning, logistics, vehicle inspection and certification, titling, evaluation and salvage recovery services are generally recognized when the services are performed.
Subsequent to the issuance of our consolidated financial statements for the year ended December 31, 2015, we identified that the gross selling price for certain vehicles owned and subsequently sold by ADESA had been incorrectly netted against cost of services. As a result of the correction of this immaterial item, ADESA Auction Services revenue and cost of services have increased by
$51.0 million
and
$52.5 million
for the years ended December 31, 2015 and 2014, respectively. In addition, we have adjusted ADESA Auction Services revenue and cost of services in the applicable notes to the consolidated financial statements, including the unaudited quarterly financial data in Note 19.
IAA Salvage Services
Revenues (including vehicle sales and fee income) are generally recognized at the date the vehicles are sold at auction. Most of the vehicles that are sold through auctions are consigned to IAA by the seller and held at IAA's facilities. IAA does not take title to these consigned vehicles and recognizes revenue when a service is performed as requested by the owner of the vehicle. IAA does not record the gross selling price of the consigned vehicles sold at auction as revenue. Revenue not recognized at the date the vehicles are sold at auction includes annual buyer registration fees, which are recognized on a straight-line basis, and certain buyer-related fees, which are recognized when payment is received.
AFC
AFC's revenue is comprised of interest and fee income, provision for credit losses and other revenues associated with our finance receivables, as well as other service revenue. The following table summarizes the primary components of AFC's revenue:
|
|
Year Ended December 31,
|
||||||||||
|
AFC Revenue (In millions)
|
2016
|
2015
|
2014
|
||||||||
|
Interest and fee income
|
$
|
275.1
|
|
$
|
246.8
|
|
$
|
225.0
|
|
||
|
Other revenue
|
10.3
|
|
9.7
|
|
11.9
|
|
|||||
|
Provision for credit losses
|
(30.7
|
)
|
(16.0
|
)
|
(12.3
|
)
|
|||||
|
Other service revenue
|
32.1
|
|
27.9
|
|
25.5
|
|
|||||
|
$
|
286.8
|
|
$
|
268.4
|
|
$
|
250.1
|
|
|||
Interest and fee income
Interest on finance receivables is recognized based on the number of days the vehicle remains financed. AFC ceases recognition of interest on finance receivables when the loans become delinquent, which is generally
31
days past due. Dealers are also charged a fee to floorplan a vehicle ("floorplan fee"), to extend the terms of the receivable ("curtailment fee") and a document processing fee. AFC fee income including floorplan and curtailment fees is recognized over the life of the finance receivable.
Other revenue
Other revenue includes lot check fees, filing fees and lien holder payoff services, each of which are charged to and collected from AFC's customers.
Other service revenue
Other service revenue represents the revenue generated by Preferred Warranties, Inc. ("PWI"). PWI, a service contract business, was acquired in June 2013. PWI receives advance payments for vehicle service contracts and unearned revenue is deferred and recognized over the terms of the contracts.
84
KAR Auction Services, Inc.
Notes to Consolidated Financial Statements (Continued)
December 31, 2016, 2015 and 2014
Income Taxes
We file federal, state and foreign income tax returns in accordance with the applicable rules of each jurisdiction. We account for income taxes under the asset and liability method in accordance with ASC 740,
Income Taxes
. The provision for income taxes includes federal, foreign, state and local income taxes currently payable, as well as deferred taxes. Deferred tax assets and liabilities are recognized for the future tax consequences attributable to differences between the financial statement carrying amounts of existing assets and liabilities and their respective tax bases. Deferred tax assets and liabilities are measured using enacted tax rates expected to apply to taxable amounts in years in which those temporary differences are expected to be recovered or settled. If it is more likely than not that some portion or all of a deferred tax asset will not be realized, a valuation allowance is recognized.
In accordance with ASC 740, we recognize the effect of income tax positions only if those positions are more likely than not of being sustained. Recognized income tax positions are measured at the largest amount that is greater than
50%
likely of being realized. Changes in recognition or measurement are reflected in the period in which the change in judgment occurs.
Net Income per Share
Basic net income per share is computed by dividing net income by the weighted average common shares outstanding during the year. Diluted net income per share represents net income divided by the sum of the weighted average common shares outstanding plus potential dilutive instruments related to our stock-based employee compensation program. The effect of stock options and restricted stock on net income per share-diluted is determined through the application of the treasury stock method, whereby net proceeds received by the Company based on assumed exercises are hypothetically used to repurchase our common stock at the average market price during the period. Stock options that would have an anti-dilutive effect on net income per diluted share and performance-based restricted stock units ("PRSUs") subject to performance conditions which have not yet been satisfied are excluded from the calculations.
Accounting for Stock-Based Compensation
The Company accounts for stock-based compensation under ASC 718,
Compensation—Stock Compensation
. We recognize all stock-based compensation as expense in the financial statements and that cost is measured as the fair value of the award at the grant date for equity-classified awards, while liability-classified awards are remeasured each reporting period at fair value. We also consider forfeitures in determining compensation expense. Additionally, in accordance with ASC 718, cash flows resulting from tax deductions from the exercise of stock options in excess of recognized compensation cost (excess tax benefits) are classified as financing cash flows.
New Accounting Standards
In November 2016, the Financial Accounting Standards Board ("FASB") issued ASU 2016-18,
Statement of Cash Flows (Topic 230): Restricted Cash,
which addresses diversity in practice that exists in the classification and presentation of changes in restricted cash on the statement of cash flows. The new guidance is effective for annual periods beginning after December 15, 2017, including interim periods within those fiscal years. Early adoption is permitted. The Company is currently evaluating the impact the adoption of ASU 2016-18 will have on the consolidated financial statements.
In August 2016, the FASB issued ASU 2016-15,
Statement of Cash Flows (Topic 230): Classification of Certain Cash Receipts and Cash Payments,
which provides guidance on the statement of cash flows presentation of certain transactions where diversity in practice exists. The new guidance is effective for annual periods beginning after December 15, 2017, including interim periods within those fiscal years. Early adoption is permitted. The Company is currently evaluating the impact the adoption of ASU 2016-15 will have on the consolidated financial statements.
In June 2016, the FASB issued ASU 2016-13,
Financial Instruments - Credit Losses (Topic 326): Measurement of Credit Losses on Financial Instruments.
The update changes the methodology for measuring credit losses on financial instruments and the timing of when such losses are recorded. The new guidance is effective for annual periods beginning after December 15, 2019, including interim periods within those fiscal years. Early adoption is permitted beginning in annual periods beginning after December 15, 2018, including interim periods within those fiscal years. The Company is currently evaluating the impact the adoption of ASU 2016-13 will have on the consolidated financial statements.
85
KAR Auction Services, Inc.
Notes to Consolidated Financial Statements (Continued)
December 31, 2016, 2015 and 2014
In March 2016, the FASB issued ASU 2016-09,
Compensation - Stock Compensation (Topic 718): Improvements to Employee Share-Based Payment Accounting
. The update changes how companies account for certain aspects of share-based payment awards to employees, including the accounting for income taxes, forfeitures and statutory tax withholding requirements, as well as classification in the statement of cash flows. The new guidance is effective for annual periods beginning after December 15, 2016, and interim periods within those annual periods. Early adoption is permitted. The Company will adopt ASU 2016-09 in the first quarter of 2017 and, unless offset by other factors, expects that its income tax expense will initially be lower as a result of excess tax benefits from stock-based compensation, including the expected exercise of approximately
0.4 million
options that expire in 2017.
In February 2016, the FASB issued ASU 2016-02,
Leases (Topic 842)
, which replaces existing lease guidance. The ASU is intended to provide enhanced transparency and comparability by requiring lessees to record right-of-use assets and corresponding lease liabilities on the balance sheet, with an exception for leases that meet the definition of a short-term lease. The new guidance will continue to classify leases as either finance or operating, with classification affecting the pattern of expense recognition in the statement of income. The new guidance is effective for fiscal years beginning after December 15, 2018, including interim periods within those fiscal years. Early adoption is permitted and the ASU is required to be applied with a modified retrospective approach to each prior reporting period presented with various optional practical expedients. The Company is currently evaluating the impact the adoption of ASU 2016-02 will have on the consolidated financial statements and anticipates that the new guidance will significantly impact its consolidated financial statements, as the Company has a significant number of leases. Our current minimum commitments under non-cancelable operating leases are disclosed in Note 13. In addition, the recognition of these leases on our consolidated balance sheet would increase our net debt calculation which is included in the determination of our Consolidated Senior Secured Leverage Ratio. In this event, our Credit Agreement specifies that the covenant shall continue to be calculated as if the accounting standard had not occurred and that we could enter into negotiations to amend such provisions in the Credit Agreement so as to equitably reflect such changes with the desired result that the criteria for evaluating our financial condition would be the same after the change as if such change had not been made. We plan to amend the applicable provision in our Credit Agreement upon the adoption of ASU 2016-02.
In May 2014, the FASB issued ASU 2014-09,
Revenue from Contracts with Customers (Topic 606)
, which superseded the revenue recognition requirements in ASC 605,
Revenue Recognition
. The new guidance provides clarification on the recognition of revenue to depict the transfer of promised goods or services to customers in an amount that reflects the consideration to which the entity expects to be entitled in exchange for those goods or services. ASU 2014-09 also requires additional disclosures to help financial statement users better understand the nature, amount, timing and uncertainty of revenue that is recognized. In August 2015, the FASB issued ASU 2015-14
Revenue from Contracts with Customers (Topic 606): Deferral of the Effective Date
,
which defers the effective date of ASU 2014-09 by one year. In accordance with the agreed upon delay, the new guidance is effective for the first annual reporting period and interim periods beginning after December 15, 2017, and will require either retrospective application to each prior reporting period presented or retrospective application with the cumulative effect of initially applying the standard recognized at the date of adoption. The Company expects to use retrospective application with the cumulative effect as its transition method. The Company is currently evaluating the impact the adoption of ASU 2014-09 will have on the consolidated financial statements and related disclosures. However, we have identified services such as towing, vehicle inspection reports and other pre-sale services which could result in the acceleration of revenue recognition.
2016 Acquisitions
In February 2016, ADESA signed a definitive agreement to acquire auctions owned by the Brasher family. In April 2016, ADESA completed the acquisition of Brasher's
eight
auctions, which strengthens ADESA's western U.S. footprint. In 2015, Brasher's had revenues of approximately
$140 million
. We entered into operating lease obligations related to various facilities through 2036. Initial annual lease payments for the various facilities are approximately
$5 million
per year.
In March 2016, ADESA signed a definitive agreement to acquire Sanford Auto Dealers Exchange ("SADE"). In May 2016, ADESA completed the acquisition of SADE, which expands ADESA's geographic footprint in central Florida.
86
KAR Auction Services, Inc.
Notes to Consolidated Financial Statements (Continued)
December 31, 2016, 2015 and 2014
In June 2016, the Company acquired GRS, a subsidiary of Greenhous Group Limited. GRS is an established online vehicle remarketing business in the U.K. The acquisition complements the Company's wide range of vehicle remarketing services and provides the opportunity to offer our full range of services in the U.K.
In November 2016, ADESA completed the acquisition of Flint Auto Auction, a whole car auction facility in Flint, Michigan. This acquisition expands ADESA's geographic footprint in the Midwest.
Certain of the purchase agreements included contingent payments related to vehicle volumes subsequent to the purchase date. The purchased assets included land, buildings, accounts receivable, operating equipment, customer relationships, tradenames, software, inventory and other intangible assets. Financial results for each acquisition have been included in our consolidated financial statements from the date of acquisition.
The aggregate purchase price for the businesses acquired in 2016, net of cash acquired, was approximately
$433.4 million
, which included estimated contingent payments with a fair value of
$1.3 million
. The maximum amount of undiscounted contingent payments related to these acquisitions could approximate
$1.5 million
. The purchase price for the acquired businesses was allocated to acquired assets and liabilities based upon fair values, including
$136.8 million
to intangible assets, representing the fair value of acquired customer relationships of
$129.8 million
, software of
$4.9 million
, tradenames of
$1.8 million
and non-competes of
$0.3 million
, which are being amortized over their expected useful lives. The purchase accounting associated with these acquisitions is preliminary, subject to determination of working capital adjustments and a final valuation of intangibles related to the acquisition of Flint Auto Auction. The Company does not expect adjustments to the purchase accounting will be material. The acquisitions resulted in aggregate goodwill of
$269.6 million
. The goodwill is recorded in the ADESA Auctions and AFC reportable segments. The financial impact of these acquisitions, including pro forma financial results, was immaterial to the Company’s consolidated results for the year ended December 31, 2016.
2015 Acquisitions
In March 2015, ADESA completed the acquisition of Pittsburgh Auto Auction. This acquisition bolsters ADESA’s presence in the eastern region and complements its current buyer base.
In April 2015, ADESA purchased all of the equity interests in MobileTrac LLC ("MobileTrac"). MobileTrac provides retail and wholesale car buyers with instaVIN’s vehicle history reports as well as the instaLEAD and instaDEAL technology through which automotive dealers can attract and structure retail transactions with consumers online. MobileTrac enhances the Company’s portfolio of service offerings to its customers.
In May 2015, AutoVIN, a subsidiary of ADESA, completed the acquisition of the vehicle inspection business from DataScan Field Services. AutoVIN utilizes Internet-based technology to perform vehicle inspection services for major auto manufacturers, financial institutions, leasing companies and warranty companies. The network’s broad geographical reach in the U.S. and Canada will provide expanded coverage for inspection customers, and the acquisition also brings new offerings to the AutoVIN portfolio, including warranty claim inspections, certified pre-owned audits and physical damage appraisals.
In May 2015, ADESA purchased all of the issued and outstanding membership interests in Autoniq, LLC ("Autoniq"). Autoniq provides real-time information such as vehicle pricing, history reports and market guides to dealers. Its mobile app allows used car dealers to scan VINs on mobile devices, view auction run lists and access vehicle history reports and market value reports instantly. Autoniq offers access to valued resources such as CARFAX and AutoCheck, as well as Black Book Daily, NADA guides, Kelley Blue Book and Galves pricing guide information. It also includes a comprehensive wholesale and retail market report for all markets in the United States. Autoniq enhances the Company’s portfolio of service offerings to its customers.
In June 2015, ADESA (UK) Limited completed the acquisition of HBC, which specializes in salvage vehicle auctions and related services and is headquartered in Canvey Island, England. HBC provides salvage collection and disposal services for the U.K.’s top insurance, fleet and accident management companies. HBC conducts business using a variety of sales channels, including online auctions.
In December 2015, Impact Auto Auctions, a subsidiary of IAA, purchased the assets of Sudbury Auto Auction Ltd. ("SAA"). The purchase of SAA provides the opportunity to expand into northern Ontario.
87
KAR Auction Services, Inc.
Notes to Consolidated Financial Statements (Continued)
December 31, 2016, 2015 and 2014
Certain of the purchase agreements included contingent payments related to financial results subsequent to the purchase
date. The purchased assets included land, buildings, accounts receivable, operating equipment, customer relationships,
tradenames, software, inventory and other intangible assets. Financial results for each acquisition have been included in our
consolidated financial statements from the date of acquisition.
The aggregate purchase price for the businesses acquired in 2015, net of cash acquired, was approximately
$128.0 million
, which included estimated contingent payments with a fair value of
$9.9 million
. The maximum amount of
undiscounted contingent payments related to these acquisitions could approximate
$18.6 million
. The purchase price for the
acquired businesses was allocated to acquired assets and liabilities based upon fair values, including
$33.3 million
to intangible
assets, representing the fair value of acquired customer relationships, tradenames and software, which are being amortized over
their expected useful lives. The acquisitions resulted in aggregate goodwill of
$92.3 million
. The goodwill is recorded in the
ADESA Auctions and IAA reportable segments. The financial impact of these acquisitions, including pro forma financial
results, was immaterial to the Company’s consolidated results for the year ended December 31, 2015.
Equity Method Investment
In August 2014, ADESA acquired a
50%
interest in Nth Gen Software Inc. ("TradeRev") and its online vehicle remarketing system for approximately
$30 million
in cash. TradeRev is an online automotive remarketing system where dealers can launch and participate in real-time vehicle auctions at any time from their mobile devices or desktop. In addition, ADESA also entered into a joint marketing agreement with TradeRev to assist in expanding its footprint in the dealer-to-dealer online space in the U.S. and Canadian markets.
ASC 323,
Investments - Equity Method and Joint Ventures
, specifies that to the extent there is a basis difference between the cost and the underlying equity in the net assets of an equity investment, such difference is required to be allocated between tangible and intangible assets. At the date of acquisition, the carrying amount of the investment in TradeRev was greater than the Company’s equity in the underlying assets of TradeRev by approximately
$21.8 million
as a result of the difference in the carrying amounts of intangible assets. The difference attributable to amortizable intangible assets was approximately
$4.8 million
at the time of the equity investment, which is being amortized on a straight-line basis over the expected useful lives of the intangible assets, which range from
6
to
14
years. The intangible assets are not reflected on the balance sheet of KAR Auction Services.
TradeRev’s results of operations are recorded on a one-month lag basis. The Company’s share in the net losses of TradeRev for fiscal year 2016, 2015 and 2014 was
$3.8 million
,
$0.8 million
and
$0.2 million
, respectively. This amount was recorded to “Other income, net” in the consolidated statements of income.
Our stock-based compensation expense has included expense associated with KAR Auction Services, Inc. PRSUs, service-based restricted stock units ("RSUs"), service options and exit options. We have classified the KAR Auction Services, Inc. PRSUs, RSUs, service options and exit options as equity awards.
The compensation cost that was charged against income for all stock-based compensation plans was
$18.1 million
,
$11.7 million
and
$28.0 million
for the years ended
December 31, 2016
,
2015
and
2014
, respectively, and the total income tax benefit recognized in the consolidated statement of income for options, PRSUs and RSUs was approximately
$6.9 million
,
$4.4 million
and
$10.1 million
for the years ended
December 31, 2016
,
2015
and
2014
, respectively. We did not capitalize any stock-based compensation cost in the years ended
December 31, 2016
,
2015
or
2014
.
88
KAR Auction Services, Inc.
Notes to Consolidated Financial Statements (Continued)
December 31, 2016, 2015 and 2014
The following table summarizes our stock-based compensation expense by type of award
(in millions)
:
|
|
Year Ended December 31,
|
||||||||||
|
|
2016
|
2015
|
2014
|
||||||||
|
PRSUs
|
$
|
10.3
|
|
$
|
6.1
|
|
$
|
3.5
|
|
||
|
RSUs
|
5.9
|
|
2.5
|
|
—
|
|
|||||
|
Service options
|
1.9
|
|
3.1
|
|
3.6
|
|
|||||
|
Exit options
|
—
|
|
—
|
|
20.9
|
|
|||||
|
Total stock-based compensation expense
|
$
|
18.1
|
|
$
|
11.7
|
|
$
|
28.0
|
|
||
KAR Auction Services, Inc. 2009 Omnibus Stock and Incentive Plan - PRSUs, RSUs, Service Options and Exit Options
We adopted the KAR Auction Services, Inc. 2009 Omnibus Stock and Incentive Plan ("Omnibus Plan") in December 2009. The Omnibus Plan is intended to provide equity or cash-based awards to our employees. At KAR Auction Services' Annual Meeting of Stockholders in June 2014, the stockholders approved the amendment and restatement of the Omnibus Plan. As a result, the maximum number of shares that may be issued pursuant to awards under the Omnibus Plan was increased from
6.5 million
to
12.5 million
. The Omnibus Plan provides for the grant of options, restricted stock, stock appreciation rights, other stock-based awards and cash-based awards. The PRSU and RSU grants described below were made pursuant to the Company's Policy on Granting Equity Awards.
PRSUs
In 2016, we granted a target amount of approximately
0.3 million
PRSUs to certain executive officers and management of the Company. The PRSUs vest if and to the extent that the Company's
three
-year operating adjusted earnings per share attains certain specified goals. The weighted average grant date fair value of the PRSUs was
$34.94
per share, which was determined using the closing price of the Company's common stock on the dates of grant.
In 2015, we granted a target amount of approximately
0.2 million
PRSUs to certain executive officers and management of the Company. The PRSUs vest if and to the extent that the Company's
three
-year adjusted earnings per share attains certain specified goals. The weighted average grant date fair value of the PRSUs was
$37.03
per share, which was determined using the closing price of the Company's common stock on the dates of grant.
In the first quarter of 2014, we granted a target amount of approximately
0.1 million
PRSUs to certain executive officers of the Company. Half of the PRSUs vest
three
years from the grant date if and to the extent that the Company's total shareholder return relative to that of companies within the S&P 500 Index exceeds certain levels over the same period. The other half of the PRSUs vest if and to the extent that the Company's
three
-year adjusted earnings per share attains certain specified goals. The grant date fair value of the PRSUs tied to total shareholder return was
$36.54
per share and was developed in consultation with independent valuation specialists who used a Monte-Carlo simulation using a geometric Brownian motion based upon a risk-neutral framework. Key assumptions in the valuation included the fair market value of our common stock on the date of grant, the expected volatility of our common stock over the expected term of the award and the risk-free interest rate for the expected term of the award. The grant date fair value of the PRSUs tied to adjusted earnings per share was
$30.89
per share, which was the closing price of the Company's common stock on the date of grant.
In December 2013, we granted a target amount of approximately
0.2 million
PRSUs to certain executive officers of the Company. The PRSUs vest
three
years from the grant date if and to the extent that the Company's total shareholder return relative to that of companies within the S&P 500 Index exceeds certain levels over the same period. The grant date fair value of the PRSUs granted in 2013 was
$32.79
per share and was developed in consultation with independent valuation specialists who used a Monte-Carlo simulation using a geometric Brownian motion based upon a risk neutral framework. Key assumptions in the valuation included the fair market value of our common stock on the date of grant, the expected volatility of our common stock over the expected term of the award and the risk-free interest rate for the expected term of the award.
As of December 31, 2016, an estimated
$8.8 million
of unrecognized compensation expense related to nonvested PRSUs is expected to be recognized over a weighted average term of approximately
1.6
years. Dividend equivalents accrue on the PRSUs and are subject to the same vesting and forfeiture terms as the PRSUs.
89
KAR Auction Services, Inc.
Notes to Consolidated Financial Statements (Continued)
December 31, 2016, 2015 and 2014
RSUs
In 2016 and 2015, approximately
0.3 million
and
0.3 million
, respectively, RSUs were granted to certain executive officers and management of the Company. The RSUs are contingent upon continued employment and vest in
three
equal annual installments. The fair value of RSUs is the value of the Company's common stock at the date of grant and the weighted average grant date fair value of the RSUs was
$34.91
per share and
$37.04
per share in 2016 and 2015, respectively. Dividend equivalents accrue on the RSUs and are subject to the same vesting and forfeiture terms as the RSUs.
The following table summarizes RSU activity, excluding dividend equivalents, under the Omnibus Plan for the year ended December 31, 2016:
|
Restricted Stock Units
|
Number
|
Weighted Average Grant Date Fair Value
|
|||||
|
RSUs at January 1, 2016
|
240,387
|
|
$
|
37.04
|
|
||
|
Granted
|
285,386
|
|
34.91
|
|
|||
|
Vested
|
(82,860
|
)
|
36.96
|
|
|||
|
Forfeited
|
(25,201
|
)
|
35.78
|
|
|||
|
RSUs at December 31, 2016
|
417,712
|
|
$
|
35.67
|
|
||
As of December 31, 2016, there was approximately
$9.5 million
of unrecognized compensation expense related to nonvested RSUs which is expected to be recognized over a weighted average term of
1.8
years.
Service Options
In
2014
, we granted approximately
0.9 million
service options, with a weighted average exercise price of
$30.06
per share under the Omnibus Plan. The service options have a
ten
year life and generally vest in
four
equal annual installments, commencing on the first anniversary of the respective grant dates.
Exit Options
The outstanding exit options granted in 2010 under the Omnibus Plan contain the same vesting criteria as the exit options noted below under the KAR Auction Services, Inc. Stock Incentive Plan.
KAR Auction Services, Inc. Stock Incentive Plan - Service Options and Exit Options
The Company adopted the KAR Auction Services, Inc. Stock Incentive Plan (the "Plan") in May 2007. The Plan was intended to provide equity incentive benefits to the Company's employees. The maximum number of shares that were to be issued pursuant to awards under the Plan was approximately
7.9 million
. The Plan provided for the grant of incentive stock options and non-qualified stock options and restricted stock. Awards granted since the adoption of the Plan were non-qualified stock options, and no further grants will be awarded under the Plan.
The Plan provided
two
types of stock options: service-related options, which were to vest ratably in
four
annual installments from the date of grant based upon the passage of time, and performance-related exit options, which were generally to become exercisable upon a change in equity control of our former parent company. Under the exit options, in addition to the change in equity control requirement, the number of options that vest were to be determined based on the strike price and certain performance hurdles based on our former owners and other investors' achievement of certain multiples on their original indirect equity investment in KAR Auction Services subject to a minimum internal rate of return at the time of change in equity control. All vesting criteria was subject to continued employment with our former parent company or affiliates thereof. Options were to be granted under the Plan at an exercise price of not less than the fair market value of a share of KAR Auction Services common stock on the date of grant and have a contractual life of
ten
years.
On December 10, 2009, in conjunction with the initial public offering, all outstanding service options became fully vested and exercisable. In addition, the vesting criteria and exercisability of the exit options were modified to become based on the price per share of our common stock, rather than vest upon the achievement of certain specified performance goals at the time of an exit event. On March 1, 2013, the board of directors approved additional amendments to the outstanding exit options that previously vested based on a
90
-day average closing price of the Company's common stock being above a stated dollar amount.
90
KAR Auction Services, Inc.
Notes to Consolidated Financial Statements (Continued)
December 31, 2016, 2015 and 2014
Generally, such vesting terms were amended to require that the average closing price over a period of
90
trading days be greater than a specified dollar amount to instead requiring that the closing price be greater than the specified dollar amount over a period of
20
consecutive trading days. As a result of this change, effective on March 1, 2013, approximately
1.4
million of such exit options became vested. The incremental expense related to the modification was approximately
$0.8 million
.
On November 6, 2013, another modification occurred stating that upon an exit event, exercisable stock option awards would not be canceled in exchange for cash and unexercisable options would not be canceled and forfeited, as specified in the Plan. As a result of the modification, there was
no
incremental compensation expense for the vested service and exit options under the Plan. The fair value of the vested service and exit options immediately before and immediately after the modification both approximated the intrinsic value of the respective options. However, the modification resulted in incremental compensation expense for the unvested exit options of approximately
$32.6 million
, which was recognized through December 31, 2014.
The exit options granted under the Plan and the Omnibus Plan vested as follows:
|
Amount Vested
|
|
Vesting Conditions
|
Vested & Exercisable Date
|
|
|
25% of exit options vested and became exercisable when
|
|
(i) the fair market value of Company common stock exceeded $20.00
|
March 2013
|
|
|
An additional 25% of exit options vested and became exercisable when
|
|
(i) the fair market value of Company common stock exceeded $25.00
|
August 2013
|
|
|
An additional 25% of exit options vested and became exercisable when
|
|
(i) the fair market value of Company common stock exceeded $30.00
|
March 2014
|
|
|
An additional 25% of exit options vested and became exercisable when
|
|
(i) the fair market value of Company common stock exceeds $35.00
|
March 2015
|
|
Service Options Summary
The following table summarizes service option activity under the Omnibus Plan and the Plan for the year ended
December 31, 2016
:
|
Service Options
|
Number
|
Weighted
Average
Exercise
Price
|
Weighted
Average
Remaining
Contractual
Term
|
Aggregate
Intrinsic
Value
(in millions)
|
||||||||
|
Outstanding at January 1, 2016
|
2,163,329
|
|
$
|
21.66
|
|
|
|
|
||||
|
Granted
|
—
|
|
N/A
|
|
|
|
|
|||||
|
Exercised
|
(429,274
|
)
|
17.57
|
|
|
|
|
|||||
|
Forfeited
|
(28,760
|
)
|
25.66
|
|
|
|
|
|||||
|
Canceled
|
(17,370
|
)
|
25.87
|
|
|
|
|
|||||
|
Outstanding at December 31, 2016
|
1,687,925
|
|
$
|
22.59
|
|
5.8 years
|
$
|
33.8
|
|
|||
|
Exercisable at December 31, 2016
|
1,149,057
|
|
$
|
19.45
|
|
5.1 years
|
$
|
26.6
|
|
|||
The intrinsic value presented in the table above represents the amount by which the market value of the underlying stock exceeds the exercise price of the option at
December 31, 2016
. The intrinsic value changes continuously based on the fair value of our stock. The market value is based on KAR Auction Services' closing stock price of
$42.62
on
December 31, 2016
. The total intrinsic value of service options exercised during the years ended
December 31, 2016
,
2015
and
2014
was
$9.6 million
,
$11.0 million
and
$12.4 million
, respectively. The fair value of all vested and exercisable service options at
December 31, 2016
and
2015
was
$49.0 million
and
$45.1 million
, respectively.
As of
December 31, 2016
, there was approximately
$1.8 million
of unrecognized compensation expense related to nonvested service options which is expected to be recognized over a weighted average term of
1.1
years.
91
KAR Auction Services, Inc.
Notes to Consolidated Financial Statements (Continued)
December 31, 2016, 2015 and 2014
Service options have been accounted for as equity awards and, as such, compensation expense was measured based on the fair value of the award at the date of grant and recognized over the
four
year service periods, using the straight-line attribution method. The weighted average fair value of the service options granted was
$6.37
per share for the year ended December 31, 2014. The fair value of service options granted was estimated on the date of grant using the Black-Scholes option pricing model and the following assumptions:
|
Assumptions
|
2014
|
|
|
Risk-free interest rate
|
1.80% - 1.915%
|
|
|
Expected life
|
6.25 years
|
|
|
Expected volatility
|
30.0
|
%
|
|
Dividend yield
|
3.24% - 3.45%
|
|
Risk-free interest rate
—This is the yield on U.S. Treasury Securities posted at the date of grant (or date of modification) having a term equal to the expected life of the option. An increase in the risk-free interest rate will increase compensation expense.
Expected life—years
—This is the period of time over which the options granted are expected to remain outstanding. Options granted by KAR Auction Services have a maximum term of
ten
years. An increase in the expected life will increase compensation expense.
Expected volatility
—Actual changes in the market value of stock are used to calculate the volatility assumption. Based on the Company's limited time as a publicly traded company, the expected volatility used was determined based on a combination of historical volatility, the volatility of selected comparable companies and other relevant factors. An increase in the expected volatility will increase compensation expense.
Dividend yield
—This is the annual rate of dividends per share over the exercise price of the option. An increase in the dividend yield will decrease compensation expense.
Exit Options Summary
The following table summarizes exit option activity under the Omnibus Plan and the Plan for the year ended
December 31, 2016
:
|
Exit Options
|
Number
|
Weighted
Average
Exercise
Price
|
Weighted
Average
Remaining
Contractual
Term
|
Aggregate
Intrinsic
Value
(in millions)
|
||||||||
|
Outstanding at January 1, 2016
|
1,808,428
|
|
$
|
11.27
|
|
|
|
|
||||
|
Granted
|
—
|
|
N/A
|
|
|
|
|
|||||
|
Exercised
|
(817,152
|
)
|
10.54
|
|
|
|
|
|||||
|
Forfeited
|
—
|
|
N/A
|
|
|
|
|
|||||
|
Canceled
|
—
|
|
N/A
|
|
|
|
|
|||||
|
Outstanding at December 31, 2016
|
991,276
|
|
$
|
11.90
|
|
2.0 years
|
$
|
30.4
|
|
|||
|
Exercisable at December 31, 2016
|
991,276
|
|
$
|
11.90
|
|
2.0 years
|
$
|
30.4
|
|
|||
The intrinsic value presented in the table above represents the amount by which the market value of the underlying stock exceeds the exercise price of the option at
December 31, 2016
. The intrinsic value changes continuously based on the fair value of our stock. The market value is based on KAR Auction Services' closing stock price of
$42.62
on
December 31, 2016
. The total intrinsic value of exit options exercised during the years ended
December 31, 2016
,
2015
and
2014
was
$23.8 million
,
$35.9 million
and
$30.8 million
, respectively. The fair value of all vested and exercisable exit options at
December 31, 2016
and
2015
was
$42.2 million
and
$67.0 million
, respectively.
92
KAR Auction Services, Inc.
Notes to Consolidated Financial Statements (Continued)
December 31, 2016, 2015 and 2014
The requisite service period and the fair value of the exit options were developed in consultation with independent valuation specialists. The original time horizons over which our stock price was projected to achieve the market conditions noted in the above tables ranged from
1.2
years to
3.9
years. As a result, compensation expense was originally recognized over the derived service periods ranging from
1.2
years to
3.9
years. In connection with the modifications in 2013, incremental compensation expense was recognized over a new derived service period which ended December 31, 2014. As of December 31, 2014, all of the compensation expense related to the exit options was recognized.
KAR Auction Services, Inc. Employee Stock Purchase Plan
A maximum of
1,000,000
shares of our common stock have been reserved for issuance under the KAR Auction Services, Inc. Employee Stock Purchase Plan ("ESPP"). At
December 31, 2016
,
554,576
shares remain available for purchase under the ESPP. The ESPP provides for one month offering periods with a
15%
discount from the fair market value of a share on the date of purchase. In accordance with ASC 718,
Compensation—Stock Compensation
, the entire
15%
purchase discount is recorded as compensation expense. A participant's combined payroll deductions and cash payments in the ESPP may not exceed
$25,000
per year.
Share Repurchase Programs
In October 2016, the board of directors authorized a repurchase of up to
$500 million
of the Company’s outstanding common stock, par value
$0.01
per share, through
October 26, 2019
. Repurchases may be made in the open market or through privately negotiated transactions, in accordance with applicable securities laws and regulations, including pursuant to repurchase plans designed to comply with Rule 10b5-1 of the Securities Exchange Act of 1934, as amended. The timing and amount of any repurchases is subject to market and other conditions. As of
December 31, 2016
, we had repurchased and retired a total of
1,931,200
shares of common stock in the open market at a weighted average price of
$41.61
per share under the October 2016 authorization.
In October 2014, the board of directors authorized a repurchase of up to
$300 million
of the Company’s outstanding common stock, par value
$0.01
per share, through
October 28, 2016
. Repurchases were made in the open market or through privately negotiated transactions, in accordance with applicable securities laws and regulations, including pursuant to repurchase plans designed to comply with Rule 10b5-1 of the Securities Exchange Act of 1934, as amended. The timing and amount of any repurchases was subject to market and other conditions. In 2015 we repurchased and retired a total of
744,900
shares of common stock in the open market at a weighted average price of
$37.04
per share. In 2016 we made
no
repurchases of common stock in the open market under the October 2014 authorization.
In August 2015, as part of the authorized program to repurchase common stock noted above, the Company entered into an accelerated share repurchase agreement under which it paid
$200 million
for an initial delivery of approximately
4.6 million
shares of its common stock. The initial delivery of shares represented
90%
of the shares anticipated to be repurchased based on current market prices at that time. The initial delivery of shares also resulted in an immediate reduction in the number of shares used to calculate the weighted average common shares outstanding for basic and diluted net income per share. The Company settled the accelerated share repurchase agreement in January 2016 and received approximately
0.8 million
additional shares of its common stock based on an adjusted volume weighted average price of its stock over the period. In total,
5,413,274
shares were repurchased under the accelerated share repurchase agreement at an average repurchase price of
$36.95
per share.
93
KAR Auction Services, Inc.
Notes to Consolidated Financial Statements (Continued)
December 31, 2016, 2015 and 2014
The following table sets forth the computation of net income per share
(in millions except per share amounts)
:
|
|
Year Ended December 31,
|
||||||||||
|
|
2016
|
2015
|
2014
|
||||||||
|
Net income
|
$
|
222.4
|
|
$
|
214.6
|
|
$
|
169.3
|
|
||
|
Weighted average common shares outstanding
|
137.6
|
|
140.1
|
|
140.2
|
|
|||||
|
Effect of dilutive stock options and restricted stock awards
|
1.5
|
|
2.2
|
|
1.6
|
|
|||||
|
Weighted average common shares outstanding and potential common shares
|
139.1
|
|
142.3
|
|
141.8
|
|
|||||
|
Net income per share
|
|
|
|||||||||
|
Basic
|
$
|
1.62
|
|
$
|
1.53
|
|
$
|
1.21
|
|
||
|
Diluted
|
$
|
1.60
|
|
$
|
1.51
|
|
$
|
1.19
|
|
||
Basic net income per share was calculated by dividing net income by the weighted average number of outstanding common shares for the period. Diluted net income per share was calculated consistent with basic net income per share including the effect of dilutive unissued common shares related to our stock-based employee compensation program. The effect of stock options and restricted stock on net income per share-diluted is determined through the application of the treasury stock method, whereby net proceeds received by the Company based on assumed exercises are hypothetically used to repurchase our common stock at the average market price during the period. Stock options that would have an anti-dilutive effect on net income per diluted share and PRSUs subject to performance conditions which have not yet been satisfied are excluded from the calculations.
No
options were excluded from the calculation of diluted net income per share for the years ended
December 31, 2016
and
2015
, respectively, and approximately
0.4 million
were excluded from the calculation of diluted net income per share for the year ended
December 31, 2014
. In addition, approximately
0.5 million
,
0.3 million
, and
0.1 million
PRSUs were excluded from the calculation of diluted net income per share for the years ended
December 31, 2016
,
2015
, and
2014
, respectively. Total options outstanding at
December 31, 2016
,
2015
and
2014
were
2.7 million
,
4.0 million
and
5.9 million
, respectively.
The following is a summary of the changes in the allowance for credit losses related to finance receivables (
in millions
):
|
|
Year Ended December 31,
|
||||||||||
|
|
2016
|
2015
|
2014
|
||||||||
|
Allowance for Credit Losses
|
|
|
|
||||||||
|
Balance at beginning of period
|
$
|
9.0
|
|
$
|
8.0
|
|
$
|
8.0
|
|
||
|
Provision for credit losses
|
30.7
|
|
16.0
|
|
12.3
|
|
|||||
|
Recoveries
|
4.2
|
|
4.1
|
|
3.5
|
|
|||||
|
Less charge-offs
|
(31.9
|
)
|
(19.1
|
)
|
(15.8
|
)
|
|||||
|
Balance at end of period
|
$
|
12.0
|
|
$
|
9.0
|
|
$
|
8.0
|
|
||
AFC's allowance for credit losses includes estimated losses for finance receivables currently held on the balance sheet of AFC and its subsidiaries.
94
KAR Auction Services, Inc.
Notes to Consolidated Financial Statements (Continued)
December 31, 2016, 2015 and 2014
The following is a summary of changes in the allowance for doubtful accounts related to trade receivables (
in millions
):
|
|
Year Ended December 31,
|
||||||||||
|
|
2016
|
2015
|
2014
|
||||||||
|
Allowance for Doubtful Accounts
|
|
|
|
||||||||
|
Balance at beginning of period
|
$
|
6.6
|
|
$
|
6.3
|
|
$
|
4.8
|
|
||
|
Provision for credit losses
|
9.8
|
|
2.8
|
|
4.3
|
|
|||||
|
Less net charge-offs
|
(3.4
|
)
|
(2.5
|
)
|
(2.8
|
)
|
|||||
|
Balance at end of period
|
$
|
13.0
|
|
$
|
6.6
|
|
$
|
6.3
|
|
||
Recoveries of trade receivables were netted with charge-offs, as they were not material. Changes in the Canadian exchange rate did not have a material effect on the allowance for doubtful accounts.
AFC sells the majority of its U.S. dollar denominated finance receivables on a revolving basis and without recourse to a wholly-owned, bankruptcy remote, consolidated, special purpose subsidiary ("AFC Funding Corporation"), established for the purpose of purchasing AFC's finance receivables. A securitization agreement allows for the revolving sale by AFC Funding Corporation to a group of bank purchasers of undivided interests in certain finance receivables subject to committed liquidity. AFC Funding Corporation had committed liquidity of
$1.50 billion
for U.S. finance receivables at
December 31, 2016
.
In December 2016, AFC and AFC Funding Corporation entered into the Seventh Amended and Restated Receivables Purchase Agreement (the "Receivables Purchase Agreement"). The Receivables Purchase Agreement increased AFC Funding's U.S. committed liquidity from
$1.25 billion
to
$1.50 billion
and extended the facility's maturity date from June 29, 2018 to
January 31, 2020
. In addition, the definition of eligible receivables was expanded and the tangible net worth requirement increased. We capitalized approximately
$12.7 million
of costs in connection with the Receivables Purchase Agreement. In addition, we recorded a
$1.4 million
pretax charge resulting from the write-off of a portion of the unamortized securitization issuance costs.
In March 2016, AFC and AFC Funding Corporation entered into Amendment No. 1 (the "Amendment") to the Sixth Amended and Restated Receivables Purchase Agreement. The Amendment increased AFC Funding's U.S. committed liquidity from
$1.15 billion
to
$1.25 billion
. We capitalized approximately
$0.8 million
of costs in connection with the Amendment.
In June 2015, AFC and AFC Funding Corporation entered into the Sixth Amended and Restated Receivables Purchase Agreement. The Sixth Amended and Restated Receivables Purchase Agreement increased AFC Funding's U.S. committed liquidity from
$950 million
to
$1.15 billion
and extended the facility's maturity date. In addition, the definition of eligible receivables was expanded and the overcollateralization requirement was reduced. We capitalized approximately
$10.0 million
of costs in connection with the Sixth Amended and Restated Receivables Purchase Agreement.
We also have an agreement for the securitization of AFCI's receivables. AFCI's committed facility is provided through a third party conduit (separate from the U.S. facility) and was
C$125 million
at
December 31, 2016
. In December 2016, AFCI entered into the Fourth Amended and Restated Receivables Purchase Agreement (the "Canadian Receivables Purchase Agreement"). The Canadian Receivables Purchase Agreement extended the facility's maturity date from June 29, 2018 to
January 31, 2020
. We capitalized approximately
$0.7 million
of costs in connection with the Canadian Receivables Purchase Agreement. In June 2015, AFCI entered into the Third Amended and Restated Receivables Purchase Agreement. The Third Amended and Restated Receivables Purchase Agreement increased AFCI's committed liquidity from
C$100 million
to
C$125 million
and extended the facility's maturity date. In addition, the definition of eligible receivables was expanded. We capitalized approximately
$0.9 million
of costs in connection with the Third Amended and Restated Receivables Purchase Agreement. The receivables sold pursuant to both the U.S. and Canadian securitization agreements are accounted for as secured borrowings.
95
KAR Auction Services, Inc.
Notes to Consolidated Financial Statements (Continued)
December 31, 2016, 2015 and 2014
The following tables present quantitative information about delinquencies, credit losses less recoveries ("net credit losses") and components of securitized financial assets and other related assets managed. For purposes of this illustration, delinquent receivables are defined as receivables
31
days or more past due.
|
|
December 31, 2016
|
Net Credit Losses
During 2016
|
|||||||||
|
|
Principal Amount of:
|
||||||||||
|
(in millions)
|
Receivables
|
Receivables
Delinquent
|
|||||||||
|
Floorplan receivables
|
$
|
1,781.1
|
|
$
|
12.0
|
|
$
|
27.7
|
|
||
|
Other loans
|
11.1
|
|
—
|
|
—
|
|
|||||
|
Total receivables managed
|
$
|
1,792.2
|
|
$
|
12.0
|
|
$
|
27.7
|
|
||
|
|
December 31, 2015
|
Net Credit Losses
During 2015
|
|||||||||
|
|
Principal Amount of:
|
||||||||||
|
(in millions)
|
Receivables
|
Receivables
Delinquent
|
|||||||||
|
Floorplan receivables
|
$
|
1,635.5
|
|
$
|
7.0
|
|
$
|
15.0
|
|
||
|
Other loans
|
5.5
|
|
—
|
|
—
|
|
|||||
|
Total receivables managed
|
$
|
1,641.0
|
|
$
|
7.0
|
|
$
|
15.0
|
|
||
AFC's allowance for losses was
$12.0 million
and
$9.0 million
at
December 31, 2016
and
2015
, respectively.
As of
December 31, 2016
and
2015
,
$1,774.8 million
and
$1,626.6 million
, respectively, of finance receivables and a cash reserve of
1
percent of the obligations collateralized by finance receivables served as security for the obligations collateralized by finance receivables. Obligations collateralized by finance receivables consisted of the following:
|
December 31,
2016 |
December 31,
2015 |
||||||
|
Obligations collateralized by finance receivables, gross
|
$
|
1,300.0
|
|
$
|
1,201.2
|
|
|
|
Unamortized securitization issuance costs
|
(19.7
|
)
|
(12.2
|
)
|
|||
|
Obligations collateralized by finance receivables
|
$
|
1,280.3
|
|
$
|
1,189.0
|
|
|
Proceeds from the revolving sale of receivables to the bank facilities are used to fund new loans to customers. AFC, AFC Funding Corporation and AFCI must maintain certain financial covenants including, among others, limits on the amount of debt AFC and AFCI can incur, minimum levels of tangible net worth, and other covenants tied to the performance of the finance receivables portfolio. The securitization agreements also incorporate the financial covenants of our Credit Facility. At
December 31, 2016
, we were in compliance with the covenants in the securitization agreements.
96
KAR Auction Services, Inc.
Notes to Consolidated Financial Statements (Continued)
December 31, 2016, 2015 and 2014
Goodwill consisted of the following (
in millions
):
|
ADESA
Auctions
|
IAA
|
AFC
|
Total
|
||||||||||||
|
Balance at December 31, 2014
|
$
|
962.7
|
|
$
|
523.5
|
|
$
|
219.0
|
|
$
|
1,705.2
|
|
|||
|
Increase for acquisition activity
|
77.6
|
|
14.7
|
|
—
|
|
92.3
|
|
|||||||
|
Other
|
(0.9
|
)
|
(0.7
|
)
|
—
|
|
(1.6
|
)
|
|||||||
|
Balance at December 31, 2015
|
$
|
1,039.4
|
|
$
|
537.5
|
|
$
|
219.0
|
|
$
|
1,795.9
|
|
|||
|
Increase for acquisition activity
|
224.1
|
|
0.8
|
|
44.7
|
|
269.6
|
|
|||||||
|
Other
|
(6.6
|
)
|
(1.9
|
)
|
—
|
|
(8.5
|
)
|
|||||||
|
Balance at December 31, 2016
|
$
|
1,256.9
|
|
$
|
536.4
|
|
$
|
263.7
|
|
$
|
2,057.0
|
|
|||
Goodwill represents the excess cost over fair value of identifiable net assets of businesses acquired. Goodwill increased in 2016 and 2015 primarily as a result of acquisitions. A majority of the goodwill resulting from the businesses acquired in 2016 and 2015 is expected to be deductible for tax purposes. The "other" category primarily represents the impact of fluctuations in exchange rates.
A summary of customer relationships is as follows (
in millions
):
|
|
|
December 31, 2016
|
December 31, 2015
|
||||||||||||||||||||||
|
|
Useful
Lives
(in years)
|
Gross
Carrying
Amount
|
Accumulated
Amortization
|
Carrying
Value
|
Gross
Carrying
Amount
|
Accumulated
Amortization
|
Carrying
Value
|
||||||||||||||||||
|
Customer relationships
|
5 - 19
|
$
|
1,168.8
|
|
$
|
(707.8
|
)
|
$
|
461.0
|
|
$
|
1,037.0
|
|
$
|
(619.3
|
)
|
$
|
417.7
|
|
||||||
The increase in customer relationships in 2016 was primarily related to customer relationships acquired, partially offset by the amortization of existing customer relationships, as well as changes in the Canadian exchange rate.
A summary of other intangibles is as follows (
in millions
):
|
|
|
December 31, 2016
|
December 31, 2015
|
||||||||||||||||||||||
|
|
Useful Lives
(in years)
|
Gross
Carrying
Amount
|
Accumulated
Amortization
|
Carrying
Value
|
Gross
Carrying
Amount
|
Accumulated
Amortization
|
Carrying
Value
|
||||||||||||||||||
|
Tradenames
|
2 - Indefinite
|
$
|
201.1
|
|
$
|
(6.9
|
)
|
$
|
194.2
|
|
$
|
199.2
|
|
$
|
(5.3
|
)
|
$
|
193.9
|
|
||||||
|
Computer software & technology
|
3 - 13
|
404.8
|
|
(279.7
|
)
|
125.1
|
|
354.2
|
|
(238.3
|
)
|
115.9
|
|
||||||||||||
|
Covenants not to compete
|
1 - 5
|
15.8
|
|
(15.0
|
)
|
0.8
|
|
15.5
|
|
(14.5
|
)
|
1.0
|
|
||||||||||||
|
Total
|
|
$
|
621.7
|
|
$
|
(301.6
|
)
|
$
|
320.1
|
|
$
|
568.9
|
|
$
|
(258.1
|
)
|
$
|
310.8
|
|
||||||
Other intangibles increased in 2016 primarily as a result of computer software additions and acquisitions, partially offset by the amortization of existing intangibles.
Amortization expense for customer relationships and other intangibles was
$151.0 million
,
$138.0 million
and
$128.8 million
for the years ended
December 31, 2016
,
2015
and
2014
, respectively. Estimated amortization expense on existing intangible assets for the next five years is
$146.1 million
for
2017
,
$109.3 million
for
2018
,
$81.7 million
for
2019
,
$57.6 million
for
2020
and
$40.7 million
for
2021
.
97
KAR Auction Services, Inc.
Notes to Consolidated Financial Statements (Continued)
December 31, 2016, 2015 and 2014
Property and equipment consisted of the following (
in millions
):
|
|
Useful Lives
(in years)
|
December 31,
|
|||||||
|
|
2016
|
2015
|
|||||||
|
Land
|
|
$
|
266.4
|
|
$
|
236.8
|
|
||
|
Buildings
|
5 - 40
|
244.7
|
|
217.0
|
|
||||
|
Land improvements
|
5 - 20
|
167.7
|
|
149.1
|
|
||||
|
Building and leasehold improvements
|
3 - 33
|
384.5
|
|
348.4
|
|
||||
|
Furniture, fixtures and equipment
|
1 - 10
|
388.6
|
|
325.5
|
|
||||
|
Vehicles
|
3 - 10
|
19.1
|
|
15.0
|
|
||||
|
Construction in progress
|
|
27.1
|
|
44.7
|
|
||||
|
|
1,498.1
|
|
1,336.5
|
|
|||||
|
Accumulated depreciation
|
|
(655.6
|
)
|
(569.6
|
)
|
||||
|
Property and equipment, net
|
|
$
|
842.5
|
|
$
|
766.9
|
|
||
Depreciation expense for the years ended
December 31, 2016
,
2015
and
2014
was
$89.6 million
,
$74.8 million
and
$67.8 million
, respectively.
We have acquired furniture, fixtures and equipment by undertaking capital lease obligations. Assets held under the capital leases are depreciated in a manner consistent with our depreciation policy for owned assets. The assets included above that are held under capital leases are summarized below (
in millions
):
|
|
December 31,
|
||||||
|
Classes of Property
|
2016
|
2015
|
|||||
|
Furniture, fixtures and equipment
|
$
|
149.2
|
|
$
|
120.4
|
|
|
|
Accumulated depreciation
|
(94.2
|
)
|
(71.3
|
)
|
|||
|
Capital lease assets
|
$
|
55.0
|
|
$
|
49.1
|
|
|
We self-insure our employee medical benefits, as well as a portion of our automobile, general liability and workers' compensation claims. We have insurance coverage that limits the exposure on individual claims. We also have insurance coverage that limits the total exposure to overall automobile, general liability and workers' compensation claims. The cost of the insurance is expensed over the contract periods. Utilizing historical claims experience, we record an accrual for the claims based upon the expected amount of all such claims, which includes the cost of claims that have been incurred but not reported. Accrued medical benefits and workers' compensation expenses are included in "Accrued employee benefits and compensation expenses" while accrued automobile and general liability expenses are included in "Other accrued expenses."
The following is a summary of the changes in the reserves for self-insurance and the retained losses (
in millions)
:
|
|
Year Ended December 31,
|
||||||||||
|
|
2016
|
2015
|
2014
|
||||||||
|
Balance at beginning of period
|
$
|
36.1
|
|
$
|
33.3
|
|
$
|
27.8
|
|
||
|
Net payments
|
(76.5
|
)
|
(66.3
|
)
|
(55.8
|
)
|
|||||
|
Expense
|
83.5
|
|
69.1
|
|
61.3
|
|
|||||
|
Balance at end of period
|
$
|
43.1
|
|
$
|
36.1
|
|
$
|
33.3
|
|
||
98
KAR Auction Services, Inc.
Notes to Consolidated Financial Statements (Continued)
December 31, 2016, 2015 and 2014
Individual stop-loss coverage for medical benefits was
$0.5 million
in
2016
and
2015
. There was no aggregate policy limit for medical benefits for the Company in either year. The retention for automobile and general liability claims was
$1.0 million
per occurrence and the retention for workers' compensation claims was
$0.5 million
per occurrence with a
$1.0 million
corridor deductible in the
2016
policy year. The retention for automobile, general liability and workers' compensation claims was
$0.5 million
per occurrence with a
$1.0 million
corridor deductible in the
2015
policy year. Once the
$1.0 million
corridor deductible is met for workers' compensation claims, the deductible reverts back to
$0.5 million
per occurrence. The aggregate policy limits for the combined automobile, general liability and workers' compensation program was
$30.4 million
and
$25.0 million
for the
2016
and
2015
policy years, respectively.
Long-term debt consisted of the following
(in millions)
:
|
|
|
|
December 31,
|
||||||||||
|
|
Interest Rate*
|
Maturity
|
2016
|
2015
|
|||||||||
|
Term Loan B-1
|
LIBOR
|
+ 2.50%
|
March 11, 2017
|
$
|
—
|
|
$
|
637.2
|
|
||||
|
Term Loan B-2
|
Adjusted LIBOR
|
+ 3.1875%
|
March 11, 2021
|
1,082.7
|
|
1,098.0
|
|
||||||
|
Term Loan B-3
|
Adjusted LIBOR
|
+ 3.50%
|
March 9, 2023
|
1,339.9
|
|
—
|
|
||||||
|
Revolving credit facility
|
Adjusted LIBOR
|
+ 2.50%
|
March 9, 2021
|
80.5
|
|
—
|
|
||||||
|
Old revolving credit facility
|
LIBOR
|
+ 2.25%
|
March 11, 2019
|
—
|
|
140.0
|
|
||||||
|
Canadian line of credit
|
CAD Prime
|
+ 0.50%
|
Repayable upon demand
|
—
|
|
—
|
|
||||||
|
Total debt
|
|
|
2,503.1
|
|
1,875.2
|
|
|||||||
|
Unamortized debt issuance costs/discounts
|
|
(32.8
|
)
|
(10.1
|
)
|
||||||||
|
Current portion of long-term debt
|
|
|
(105.2
|
)
|
(153.9
|
)
|
|||||||
|
Long-term debt
|
|
|
$
|
2,365.1
|
|
$
|
1,711.2
|
|
|||||
*The interest rates presented in the table above represent the rates in place at December 31, 2016. The weighted average interest rate on our variable rate debt was
4.39%
and
3.31%
at
December 31, 2016
and
2015
, respectively.
Credit Facility
On March 9, 2016, we entered into an Incremental Commitment Agreement and First Amendment (the "First Amendment") to the Credit Agreement. The First Amendment provided for, among other things, (i) a new
seven
-year senior secured term loan facility ("Term Loan B-3") and (ii) a
$300 million
,
five
-year senior secured revolving credit facility (the "revolving credit facility"), which replaced the previously existing revolving credit facility (the "old revolving credit facility"). The proceeds received from Term Loan B-3 were used to repay in full Term Loan B-1 and the amount outstanding on the old revolving credit facility.
No
early termination penalties were incurred by the Company; however, we incurred a non-cash loss on the extinguishment of debt of
$4.0 million
in the first quarter of 2016. The loss was a result of the write-off of unamortized debt issuance costs associated with Term Loan B-1 and the old revolving credit facility. The First Amendment did not change the amount outstanding on Term Loan B-2, but did increase its interest rate margin. In addition, we capitalized approximately
$18.0 million
of debt issuance costs in connection with the First Amendment.
The Credit Facility is available for letters of credit, working capital, permitted acquisitions and general corporate purposes. The Credit Agreement provides that with respect to the revolving credit facility, up to
$75 million
is available for letters of credit and up to
$75 million
is available for swing line loans.
Term Loan B-2 was issued at a discount of
$2.8 million
and the Term Loan B-3 was issued at a discount of
$13.5 million
. The discounts are being amortized using the effective interest method to interest expense over the respective terms of the loans. Both Term Loan B-2 and Term Loan B-3 are payable in quarterly installments equal to
0.25%
of the original aggregate principal amounts of the term loans, respectively. Such payments commenced on June 30, 2014 for Term Loan B-2 and on June 30, 2016 for Term Loan B-3, with the balances payable at each respective maturity date. The Credit Facility is subject to mandatory prepayments and reduction in an amount equal to the net proceeds of certain debt offerings, certain asset sales and
99
KAR Auction Services, Inc.
Notes to Consolidated Financial Statements (Continued)
December 31, 2016, 2015 and 2014
certain insurance recovery events. In addition, in accordance with the terms of the Credit Agreement,
50%
of the net cash proceeds from the sale-leaseback of certain technology and capital equipment were used to prepay
$6.5 million
and
$7.8 million
of Term Loan B-2 and Term Loan B-3, respectively, for the year ended
December 31, 2016
. Each such prepayment is credited to prepay, on a pro rata basis, in order of maturity the unpaid amounts due on the first
eight
scheduled quarterly installments of Term Loan B-2 and Term Loan B-3 and thereafter to the remaining scheduled quarterly installments of each term loan on a pro rata basis.
The obligations of the Company under the Credit Facility are guaranteed by certain of our domestic subsidiaries (the "Subsidiary Guarantors") and are secured by substantially all of the assets of the Company and the Subsidiary Guarantors, including but not limited to: (a) pledges of and first priority perfected security interests in
100%
of the equity interests of certain of the Company's and the Subsidiary Guarantors' domestic subsidiaries and
65%
of the equity interests of certain of the Company's and the Subsidiary Guarantors' first tier foreign subsidiaries and (b) perfected first priority security interests in substantially all other tangible and intangible assets of the Company and each Subsidiary Guarantor, subject to certain exceptions. The Credit Agreement contains affirmative and negative covenants that we believe are usual and customary for a senior secured credit agreement. The negative covenants include, among other things, limitations on asset sales, mergers and acquisitions, indebtedness, liens, dividends, investments and transactions with our affiliates. The Credit Agreement also requires us to maintain a maximum leverage ratio, provided there are revolving loans outstanding. We were in compliance with the covenants in the Credit Agreement at
December 31, 2016
.
As set forth in the Credit Agreement, Term Loan B-2 bears interest at
Adjusted LIBOR
(as defined in the Credit Agreement) plus
3.1875%
(with an Adjusted LIBOR floor of
0.75%
per annum), Term Loan B-3 at
Adjusted LIBOR
(as defined in the Credit Agreement) plus
3.50%
(with an
Adjusted LIBOR
floor of
0.75%
per annum) and revolving loan borrowings at
Adjusted LIBOR
plus
2.50%
. However, for specified types of borrowings, the Company may elect to make Term Loan B-2 borrowings at a
Base Rate
(as defined in the Credit Agreement) plus
2.1875%
, Term Loan B-3 at a
Base Rate
plus
2.50%
and revolving loan borrowings at a
Base Rate
plus
1.50%
. The rates on Term Loan B-2 and Term Loan B-3 were
4.19%
and
4.50%
at
December 31, 2016
, respectively. In addition, if the Company reduces its Consolidated Senior Secured Leverage Ratio, which is based on a net debt calculation, to levels specified in the Credit Agreement, the applicable interest rate on the revolving credit facility will step down by 25 basis points. The Company also pays a commitment fee of 40 basis points, payable quarterly, on the average daily unused amount of the revolving credit facility. The fee may step down to 35 basis points based on the Company's Consolidated Senior Secured Leverage Ratio as described above.
On
December 31, 2016
,
$80.5 million
was drawn on the revolving credit facility and
$140.0 million
was drawn on the old revolving credit facility at
December 31, 2015
. In addition, we had related outstanding letters of credit in the aggregate amount of
$29.7 million
and
$28.0 million
at
December 31, 2016
and
2015
, respectively, which reduce the amount available for borrowings under the respective revolving credit facility. The
$80.5 million
of outstanding borrowings under the revolving credit facility have been classified as current debt as the Company intends to repay the outstanding borrowings within the next twelve months.
Original Credit Facility
On March 11, 2014, we repaid all principal outstanding and interest due under the Original Credit Agreement.
No
early termination penalties were incurred by the Company in connection with the refinancing; however, we incurred a non-cash loss on the extinguishment of debt under the Original Credit Agreement of
$30.3 million
. The loss was a result of the write-off of certain unamortized debt issuance costs and the unamortized debt discount on Term Loan B.
Canadian Line of Credit
ADESA Canada has a
C$8 million
line of credit. The line of credit bears interest at a rate equal to the Canadian prime rate plus 50 basis points. There were
no
borrowings under the Canadian line of credit at
December 31, 2016
or
2015
. There were related letters of credit outstanding totaling approximately
C$0.9 million
at
December 31, 2016
and
2015
, which reduce credit available under the Canadian line of credit, but do not affect amounts available for borrowings under our revolving credit facility. The line of credit is guaranteed by certain ADESA Canada companies.
100
KAR Auction Services, Inc.
Notes to Consolidated Financial Statements (Continued)
December 31, 2016, 2015 and 2014
Future Principal Payments
At
December 31, 2016
, aggregate future principal payments on long-term debt are as follows (
in millions
):
|
2017
|
$
|
105.2
|
|
|
2018
|
24.7
|
|
|
|
2019
|
24.7
|
|
|
|
2020
|
24.7
|
|
|
|
2021
|
1,051.4
|
|
|
|
Thereafter
|
1,272.4
|
|
|
|
$
|
2,503.1
|
|
|
Our derivative activities are initiated within the guidelines of documented corporate risk management policies. We do not enter into any derivative transactions for speculative or trading purposes.
Interest Rate Risk Management
We are exposed to interest rate risk on our variable rate borrowings. Accordingly, interest rate fluctuations affect the amount of interest expense we are obligated to pay. We use interest rate derivatives with the objective of managing exposure to interest rate movements, thereby reducing the effect of interest rate changes and the effect they could have on future cash flows. Currently, interest rate cap agreements are used to accomplish this objective.
|
•
|
In August 2015, we purchased
three
interest rate caps for an aggregate amount of approximately
$1.5 million
with an aggregate notional amount of
$800 million
to manage our exposure to interest rate movements on our variable rate Credit Facility if/when
three-month LIBOR
(i) exceeded
2.0%
between August 19, 2015 (the effective date) and September 29, 2016 and (ii) exceeds
1.75%
between September 30, 2016 and August 19, 2017 (the maturity date).
|
|
•
|
In April 2015, we purchased
two
interest rate caps for an aggregate amount of approximately
$0.7 million
with an aggregate notional amount of
$400 million
to manage our exposure to interest rate movements on our variable rate Credit Facility when
three-month LIBOR
exceeds
1.5%
. The interest rate cap agreements each had an effective date of April 16, 2015 and each matures on March 31, 2017.
|
|
•
|
In August 2013, we purchased
four
interest rate caps for an aggregate amount of approximately
$2.2 million
with an aggregate notional amount of
$1.2 billion
to manage our exposure to interest rate movements on our variable rate Credit Facility if/when
three-month LIBOR
exceeded
1.0%
. The interest rate cap agreements each matured on August 16, 2015.
|
We are exposed to credit loss in the event of non-performance by the counterparties; however, non-performance is not anticipated. ASC 815,
Derivatives and Hedging
, requires companies to recognize all derivative instruments as either assets or liabilities at fair value in the balance sheet. The fair values of the interest rate derivatives are based on quoted market prices for similar instruments from commercial banks. The following table presents the fair value of our interest rate derivatives included in the consolidated balance sheets for the periods presented (
in millions
):
|
Asset Derivatives
|
||||||||||||
|
December 31, 2016
|
December 31, 2015
|
|||||||||||
|
Derivatives Not Designated as Hedging Instruments
|
Balance Sheet Location
|
Fair Value
|
Balance Sheet Location
|
Fair Value
|
||||||||
|
2015 Interest rate caps
|
Other assets
|
$
|
—
|
|
Other assets
|
$
|
0.7
|
|
||||
101
KAR Auction Services, Inc.
Notes to Consolidated Financial Statements (Continued)
December 31, 2016, 2015 and 2014
We have not designated any of the interest rate caps as hedges for accounting purposes. Accordingly, changes in the fair value of the interest rate caps are recognized as "Interest expense" in the consolidated statement of income. The following table presents the effect of the interest rate derivatives on our consolidated statements of income for the periods presented (
in millions
):
|
Location of Gain / (Loss) Recognized in Income on Derivatives
|
Amount of Gain / (Loss)
Recognized in Income on Derivatives
|
|||||||||||||
|
Year Ended December 31,
|
||||||||||||||
|
Derivatives Not Designated as Hedging Instruments
|
2016
|
2015
|
2014
|
|||||||||||
|
2015 Interest rate caps
|
Interest expense
|
$
|
(0.7
|
)
|
$
|
(1.5
|
)
|
N/A
|
|
|||||
|
2013 Interest rate caps
|
Interest expense
|
N/A
|
|
—
|
|
(0.8
|
)
|
|||||||
Concentrations of Credit Risk
Financial instruments that potentially subject us to credit risk consist principally of interest-bearing investments, finance receivables, trade receivables and interest rate derivatives. We maintain cash and cash equivalents, short-term investments, and certain other financial instruments with various major financial institutions. We perform periodic evaluations of the relative credit standing of these financial institutions and companies and limit the amount of credit exposure with any one institution. Cash and cash equivalents include interest-bearing investments with maturities of three months or less. Due to the nature of our business, substantially all trade and finance receivables are due from vehicle dealers, salvage buyers, institutional sellers and insurance companies. We have possession of vehicles or vehicle titles collateralizing a significant portion of the trade and finance receivables. The risk associated with this concentration is limited due to the large number of accounts and their geographic dispersion. We monitor the creditworthiness of customers to which we grant credit terms in the normal course of business. In the event of nonperformance by counterparties to financial instruments we are exposed to credit-related losses, but management believes this credit risk is limited by periodically reviewing the creditworthiness of the counterparties to the transactions.
Financial Instruments
The carrying amounts of trade receivables, finance receivables, other current assets, accounts payable, accrued expenses and borrowings under our short-term revolving line of credit facilities approximate fair value because of the short-term nature of those instruments.
As of
December 31, 2016
and
2015
, the estimated fair value of our long-term debt amounted to
$2,528.0 million
and
$1,867.4 million
, respectively. The estimates of fair value were based on broker-dealer quotes for our debt as of
December 31, 2016
and
2015
. The estimates presented on long-term financial instruments are not necessarily indicative of the amounts that would be realized in a current market exchange.
We lease property, computer equipment and software, automobiles, trucks and trailers, pursuant to operating lease agreements with terms expiring through 2036. Some of the leases contain renewal provisions upon the expiration of the initial lease term, as well as fair market value purchase provisions. In accordance with ASC 840,
Leases
, rental expense is being recognized ratably over the lease period, including those leases containing escalation clauses. The deferred portion of the rent, for the leases containing escalation clauses, is included in "Other liabilities" on the consolidated balance sheet.
We also lease furniture, fixtures and equipment under capital leases. The economic substance of the leases is that we are financing the purchase of furniture, fixtures and equipment through leases and, accordingly, they are recorded as assets and liabilities. The capital lease liabilities are included in "Other accrued expenses" and "Other liabilities" on the consolidated balance sheet. Depreciation expense includes the amortization of assets held under capital leases.
102
KAR Auction Services, Inc.
Notes to Consolidated Financial Statements (Continued)
December 31, 2016, 2015 and 2014
Total future minimum lease payments for non-cancelable operating and capital leases with terms in excess of one year (excluding renewal periods) as of
December 31, 2016
are as follows (
in millions
):
|
Operating
Leases
|
Capital
Leases
|
||||||
|
2017
|
$
|
121.7
|
|
$
|
27.2
|
|
|
|
2018
|
115.0
|
|
17.9
|
|
|||
|
2019
|
105.2
|
|
7.2
|
|
|||
|
2020
|
94.5
|
|
0.1
|
|
|||
|
2021
|
88.1
|
|
0.1
|
|
|||
|
Thereafter
|
594.4
|
|
—
|
|
|||
|
$
|
1,118.9
|
|
$
|
52.5
|
|
||
|
Less: interest portion of capital leases
|
|
|
0.8
|
|
|||
|
Total
|
|
|
$
|
51.7
|
|
||
Total lease expense for the years ended
December 31, 2016
,
2015
and
2014
was
$134.8 million
,
$115.0 million
and
$108.9 million
, respectively.
The components of our income before income taxes and the provision for income taxes are as follows (
in millions
):
|
|
Year Ended December 31,
|
||||||||||
|
|
2016
|
2015
|
2014
|
||||||||
|
Income before income taxes:
|
|
|
|||||||||
|
Domestic
|
$
|
265.8
|
|
$
|
259.5
|
|
$
|
199.3
|
|
||
|
Foreign
|
89.5
|
|
81.0
|
|
65.7
|
|
|||||
|
Total
|
$
|
355.3
|
|
$
|
340.5
|
|
$
|
265.0
|
|
||
|
Income tax expense (benefit):
|
|
|
|
||||||||
|
Current:
|
|
|
|
||||||||
|
Federal
|
$
|
100.1
|
|
$
|
88.6
|
|
$
|
87.0
|
|
||
|
Foreign
|
22.9
|
|
22.6
|
|
21.1
|
|
|||||
|
State
|
14.1
|
|
9.7
|
|
12.1
|
|
|||||
|
Total current provision
|
137.1
|
|
120.9
|
|
120.2
|
|
|||||
|
Deferred:
|
|
|
|
||||||||
|
Federal
|
(1.6
|
)
|
6.5
|
|
(18.6
|
)
|
|||||
|
Foreign
|
(2.4
|
)
|
(1.8
|
)
|
(2.2
|
)
|
|||||
|
State
|
(0.2
|
)
|
0.3
|
|
(3.7
|
)
|
|||||
|
Total deferred provision
|
(4.2
|
)
|
5.0
|
|
(24.5
|
)
|
|||||
|
Income tax expense
|
$
|
132.9
|
|
$
|
125.9
|
|
$
|
95.7
|
|
||
103
KAR Auction Services, Inc.
Notes to Consolidated Financial Statements (Continued)
December 31, 2016, 2015 and 2014
The provision for income taxes was different from the U.S. federal statutory rate applied to income before taxes, and is reconciled as follows:
|
|
Year Ended December 31,
|
|||||||
|
|
2016
|
2015
|
2014
|
|||||
|
Statutory rate
|
35.0
|
%
|
35.0
|
%
|
35.0
|
%
|
||
|
State and local income taxes, net
|
2.4
|
%
|
2.1
|
%
|
3.0
|
%
|
||
|
Reserves for tax exposures
|
(0.2
|
)%
|
0.3
|
%
|
(0.1
|
)%
|
||
|
Change in valuation allowance
|
0.6
|
%
|
0.3
|
%
|
(0.2
|
)%
|
||
|
International operations
|
(0.8
|
)%
|
(1.2
|
)%
|
(0.6
|
)%
|
||
|
Other, net
|
0.4
|
%
|
0.5
|
%
|
(1.0
|
)%
|
||
|
Effective rate
|
37.4
|
%
|
37.0
|
%
|
36.1
|
%
|
||
Deferred income taxes reflect the net tax effects of temporary differences between the carrying amount of assets and liabilities for financial reporting purposes and the amounts used for income tax purposes. We believe that it is more likely than not that the results of future operations will generate sufficient taxable income to realize the net deferred tax assets. The valuation allowance as of December 31, 2016 primarily relates to net operating losses, tax credits and capital loss carryforwards that are not more likely than not to be utilized prior to their expiration.
We offset all deferred tax assets and liabilities by jurisdiction, as well as any related valuation allowance, and present them as a single non-current deferred income tax liability. Deferred tax assets (liabilities) are comprised of the following at December 31 (
in millions
):
|
2016
|
2015
|
||||||
|
Gross deferred tax assets:
|
|
|
|||||
|
Allowances for trade and finance receivables
|
$
|
9.1
|
|
$
|
5.5
|
|
|
|
Accruals and liabilities
|
62.6
|
|
54.1
|
|
|||
|
Employee benefits and compensation
|
30.6
|
|
27.2
|
|
|||
|
Net operating loss carryforwards
|
25.1
|
|
26.7
|
|
|||
|
Investment basis difference
|
4.1
|
|
2.6
|
|
|||
|
Other
|
11.6
|
|
9.9
|
|
|||
|
Total deferred tax assets
|
143.1
|
|
126.0
|
|
|||
|
Deferred tax asset valuation allowance
|
(26.4
|
)
|
(21.2
|
)
|
|||
|
Total
|
116.7
|
|
104.8
|
|
|||
|
Gross deferred tax liabilities:
|
|
|
|||||
|
Property and equipment
|
(120.0
|
)
|
(104.4
|
)
|
|||
|
Goodwill and intangible assets
|
(274.6
|
)
|
(293.4
|
)
|
|||
|
Other
|
(13.8
|
)
|
(7.8
|
)
|
|||
|
Total
|
(408.4
|
)
|
(405.6
|
)
|
|||
|
Net deferred tax liabilities
|
$
|
(291.7
|
)
|
$
|
(300.8
|
)
|
|
104
KAR Auction Services, Inc.
Notes to Consolidated Financial Statements (Continued)
December 31, 2016, 2015 and 2014
The tax benefit from state and federal net operating loss carryforwards expires as follows (
in millions
):
|
2017
|
$
|
0.3
|
|
|
2018
|
0.2
|
|
|
|
2019
|
0.2
|
|
|
|
2020
|
0.8
|
|
|
|
2021
|
0.8
|
|
|
|
2022 to 2036
|
22.8
|
|
|
|
$
|
25.1
|
|
|
Permanently reinvested undistributed earnings of our foreign subsidiaries were approximately
$120.3 million
at
December 31, 2016
. Because these amounts have been or will be permanently reinvested in properties and working capital, we have not recorded the deferred taxes associated with these earnings. If the undistributed earnings of foreign subsidiaries were to be remitted, tax expense would need to be recognized at the U.S. statutory rate, net of any applicable foreign tax credits. It is not practical for us to determine the additional tax that would be incurred upon remittance of these earnings.
We made federal income tax payments, net of federal income tax refunds, of
$79.2 million
,
$95.2 million
and
$69.2 million
in
2016
,
2015
and
2014
, respectively. State and foreign income taxes paid by us, net of refunds, totaled
$42.4 million
,
$34.7 million
and
$33.0 million
in
2016
,
2015
and
2014
, respectively.
We apply the provisions of ASC 740,
Income Taxes
. ASC 740 clarifies the accounting and reporting for uncertainty in income taxes recognized in an enterprise's financial statements. These provisions prescribe a comprehensive model for the financial statement recognition, measurement, presentation and disclosure of uncertain tax positions taken or expected to be taken on income tax returns.
A reconciliation of the beginning and ending amount of unrecognized tax benefits is as follows (
in millions
):
|
|
December 31,
|
||||||
|
|
2016
|
2015
|
|||||
|
Balance at beginning of period
|
$
|
14.9
|
|
$
|
18.6
|
|
|
|
Increase in prior year tax positions
|
1.2
|
|
—
|
|
|||
|
Decrease in prior year tax positions
|
—
|
|
(1.9
|
)
|
|||
|
Increase in current year tax positions
|
1.4
|
|
1.2
|
|
|||
|
Settlements
|
—
|
|
—
|
|
|||
|
Lapse in statute of limitations
|
(3.5
|
)
|
(3.0
|
)
|
|||
|
Balance at end of period
|
$
|
14.0
|
|
$
|
14.9
|
|
|
The total amount of unrecognized tax benefits that, if recognized, would affect our effective tax rate was
$7.8 million
and
$8.2 million
at
December 31, 2016
and
2015
, respectively.
We record interest and penalties associated with the uncertain tax positions within our provision for income taxes on the income statement. We had reserves totaling
$3.2 million
and
$4.6 million
in
2016
and
2015
, respectively, associated with interest and penalties, net of tax.
The provision for income taxes involves management judgment regarding interpretation of relevant facts and laws in the jurisdictions in which the Company operates. Future changes in applicable laws, projected levels of taxable income and tax planning could change the effective tax rate and tax balances recorded by us. In addition, U.S. and non-U.S. tax authorities periodically review income tax returns filed by us and can raise issues regarding our filing positions, timing and amount of income or deductions and the allocation of income among the jurisdictions in which we operate. A significant period of time may elapse between the filing of an income tax return and the ultimate resolution of an issue raised by a revenue authority with respect to that return. In the normal course of business we are subject to examination by taxing authorities in the U.S., Canada, United Kingdom and Mexico. In general, the examination of our material tax returns is completed for the years prior to 2011.
105
KAR Auction Services, Inc.
Notes to Consolidated Financial Statements (Continued)
December 31, 2016, 2015 and 2014
Based on the potential outcome of the Company's tax examinations and the expiration of the statute of limitations for specific jurisdictions, it is reasonably possible that the currently remaining unrecognized tax benefits will change within the next 12 months. The associated net tax impact on the reserve balance is estimated to be in the range of a
$2.0 million
to
$4.0 million
decrease.
401(k) Plan
We maintain a defined contribution 401(k) plan that covers substantially all U.S. employees. Participants are generally allowed to make non-forfeitable contributions up to the annual IRS limits. The Company matches
100 percent
of the amounts contributed by each individual participant up to
4 percent
of the participant's compensation. Participants are
100 percent
vested in the Company's contributions. For the years ended
December 31, 2016
,
2015
and
2014
we contributed
$13.0 million
,
$10.8 million
and
$9.0 million
, respectively.
We are involved in litigation and disputes arising in the ordinary course of business, such as actions related to injuries; property damage; handling, storage or disposal of vehicles; environmental laws and regulations; and other litigation incidental to the business such as employment matters and dealer disputes. Management considers the likelihood of loss or the incurrence of a liability, as well as the ability to reasonably estimate the amount of loss, in determining loss contingencies. We accrue an estimated loss contingency when it is probable that a liability has been incurred and the amount of loss (or range of possible losses) can be reasonably estimated. Management regularly evaluates current information available to determine whether accrual amounts should be adjusted. Accruals for contingencies including litigation and environmental matters are included in "Other accrued expenses" at undiscounted amounts and exclude claims for recoveries from insurance or other third parties. These accruals are adjusted periodically as assessment and remediation efforts progress, or as additional technical or legal information becomes available. If the amount of an actual loss is greater than the amount accrued, this could have an adverse impact on our operating results in that period. Legal fees are expensed as incurred.
We have accrued, as appropriate, for environmental remediation costs anticipated to be incurred at certain of our auction facilities. Liabilities for environmental matters included in "Other accrued expenses" were
$0.1 million
at
December 31, 2016
and
2015
. No amounts have been accrued as receivables for potential reimbursement or recoveries to offset this liability.
We store a significant number of vehicles owned by various customers that are consigned to us to be auctioned. We are contingently liable for each consigned vehicle until the eventual sale or other disposition, subject to certain natural disaster exceptions. Individual stop loss and aggregate insurance coverage is maintained on the consigned vehicles. These consigned vehicles are not included in the consolidated balance sheets.
In the normal course of business, we also enter into various other guarantees and indemnities in our relationships with suppliers, service providers, customers and others. These guarantees and indemnifications do not materially impact our financial condition or results of operations, but indemnifications associated with our actions generally have no dollar limitations and historically have been inconsequential.
As noted above, we are involved in litigation and disputes arising in the ordinary course of business, such as actions related to injuries; property damage; handling, storage or disposal of vehicles; environmental laws and regulations; and other litigation incidental to the business such as employment matters and dealer disputes. Such litigation is generally not, in the opinion of management, likely to have a material adverse effect on our financial condition, results of operations or cash flows. Legal and regulatory proceedings which could be material are discussed below.
IAA—Lower Duwamish Waterway
Since June 2004, IAA has operated a branch on property it leases in Tukwila, Washington just south of Seattle. The property is located adjacent to a Superfund site known as the Lower Duwamish Waterway Superfund Site ("LDW Site"). The LDW Site had been designated a Superfund site in 2001,
three
years prior to IAA’s tenancy. On March 25, 2008, the United States Environmental Protection Agency, or the "EPA," issued IAA a General Notice of Potential Liability, or "General Notice," pursuant to Section 107(a), and a Request for Information pursuant to Section 104(e) of the Comprehensive Environmental
106
KAR Auction Services, Inc.
Notes to Consolidated Financial Statements (Continued)
December 31, 2016, 2015 and 2014
Response, Compensation, and Liability Act, or "CERCLA," related to the LDW Site. On November 7, 2012, the EPA issued IAA a Second General Notice of Potential Liability, or "Second General Notice," for the LDW Site. The EPA's website indicates that the EPA has issued general notice letters to approximately
116
entities, and has issued Section 104(e) Requests to more than
300
entities related to the LDW Site. In the General Notice and Second General Notice, the EPA informed IAA that the EPA believes IAA may be a Potentially Responsible Party, or "PRP," but the EPA did not specify the factual basis for this assertion. At this time, the EPA still has not specified the factual basis for this assertion and has not demanded that IAA pay any funds or take any action apart from responding to the Section 104(e) Information Request.
Four
PRPs, The Boeing Company, the City of Seattle, the Port of Seattle and King County - the Lower Duwamish Waterway Group ("LDWG"), have funded a remedial investigation and feasibility study related to the cleanup of the LDW Site. In December 2014, the EPA issued a Record of Decision (ROD), detailing the final cleanup plan for the LDW Site. The ROD estimates the cost of cleanup to be
$342 million
, with the plan involving dredging of
105
acres, capping
24
acres, and enhanced natural recovery of
48
acres. The estimated length of the cleanup is
17
years, including
7
years of active remediation, and
10
years of monitored natural recovery. IAA is aware that certain authorities may bring natural resource damage claims against PRPs. On February 11, 2016, IAA received a Notice of Intent letter from the United States National Oceanic and Atmospheric Administration informing IAA that the Elliott Bay Trustee Council are beginning to conduct an injury assessment for natural resource damages in the LDW. The Notice of Intent indicates that the decision of the trustees to proceed with this natural resources injury assessment followed a pre-assessment screen performed by the trustees. More recently, in a letter dated August 16, 2016, EPA issued a status update to the PRPs at the LDW Site. The letter stated that EPA expects the bulk of the pre-remedial design work currently being performed by the LDWG to be completed by the beginning of 2018, with the Remedial Design/Remedial Action ("RD/RA")phase to follow. EPA expects to initiate RD/RA negotiations with all PRPs beginning in early 2018. At this time, however, the Company does not have adequate information to determine IAA's responsibility, if any, for contamination at this site, or to estimate IAA's loss as a result of this potential liability.
In addition, the Washington State Department of Ecology ("Ecology") is working with the EPA in relation to the LDW Site, primarily to investigate and address sources of potential contamination contributing to the LDW Site. In 2007, IAA installed a stormwater capture and filtration system designed to treat sources of potential contamination before discharge to the LDW site. The immediate-past property owner, the former property owner and IAA have had discussions with Ecology concerning possible source control measures, including an investigation of the water and soils entering the stormwater system, an analysis of the source of contamination identified within the system, if any, and possible repairs and upgrades to the stormwater system if required. Additional source control measures, if any, are not expected to have a material adverse effect on future recurring operating costs.
Accumulated other comprehensive loss consisted of the following (
in millions
):
|
|
December 31,
|
||||||
|
|
2016
|
2015
|
|||||
|
Foreign currency translation loss
|
$
|
(49.4
|
)
|
$
|
(40.3
|
)
|
|
|
Unrealized gain on postretirement benefit obligation, net of tax
|
0.1
|
|
0.1
|
|
|||
|
Accumulated other comprehensive loss
|
$
|
(49.3
|
)
|
$
|
(40.2
|
)
|
|
107
KAR Auction Services, Inc.
Notes to Consolidated Financial Statements (Continued)
December 31, 2016, 2015 and 2014
ASC 280,
Segment Reporting
, requires reporting of segment information that is consistent with the manner in which the chief operating decision maker operates and views the Company. Our operations are grouped into
three
operating segments: ADESA Auctions, IAA and AFC, which also serve as our reportable business segments. These reportable business segments offer different services and have fundamental differences in their operations.
ADESA Auctions encompasses all physical and online wholesale auctions throughout North America (U.S., Canada and Mexico). Beginning in June 2016, the ADESA Auctions segment also includes ADESA Remarketing Limited (formerly known as GRS), an online whole car vehicle remarketing business in the United Kingdom. ADESA Auctions relates to used vehicle remarketing, including auction services, remarketing, or make ready services and all are interrelated, synergistic elements along the auto remarketing chain.
IAA encompasses all salvage auctions throughout North America (U.S. and Canada). Beginning in June 2015, the IAA segment also includes HBC, which operates salvage vehicle auctions and related services in the United Kingdom. IAA provides insurance companies and other vehicle suppliers cost-effective salvage processing solutions, including selling total loss and recovered theft vehicles. As such, IAA relates to total loss vehicle remarketing, including auction services, remarketing, or make ready services. All are interrelated, synergistic elements along the total loss vehicle remarketing chain.
AFC is primarily engaged in the business of providing short-term, inventory-secured financing to independent, used vehicle dealers. AFC also includes other businesses and ventures that AFC may enter into, focusing on providing independent used vehicle dealer customers with other related services and products, including vehicle service contracts. AFC conducts business primarily at or near wholesale used vehicle auctions in the U.S. and Canada.
The holding company is maintained separately from the
three
reportable segments and includes expenses associated with the corporate offices, such as salaries, benefits and travel costs for the corporate management team, certain human resources, information technology and accounting costs, and certain insurance, treasury, legal and risk management costs. Holding company interest expense includes the interest expense incurred on capital leases and the corporate debt structure. Intercompany charges relate primarily to interest on intercompany debt or receivables and certain administrative costs allocated by the holding company.
Financial information regarding our reportable segments is set forth below for the year ended
December 31, 2016
(in millions)
:
|
ADESA
Auctions |
IAA
|
AFC
|
Holding
Company |
Consolidated
|
|||||||||||||||
|
Operating revenues
|
$
|
1,765.3
|
|
$
|
1,098.0
|
|
$
|
286.8
|
|
$
|
—
|
|
$
|
3,150.1
|
|
||||
|
Operating expenses
|
|
|
|
|
|
||||||||||||||
|
Cost of services (exclusive of depreciation and amortization)
|
1,036.5
|
|
708.0
|
|
82.9
|
|
—
|
|
1,827.4
|
|
|||||||||
|
Selling, general and administrative
|
327.0
|
|
104.2
|
|
28.7
|
|
123.2
|
|
583.1
|
|
|||||||||
|
Depreciation and amortization
|
100.0
|
|
87.9
|
|
31.1
|
|
21.6
|
|
240.6
|
|
|||||||||
|
Total operating expenses
|
1,463.5
|
|
900.1
|
|
142.7
|
|
144.8
|
|
2,651.1
|
|
|||||||||
|
Operating profit (loss)
|
301.8
|
|
197.9
|
|
144.1
|
|
(144.8
|
)
|
499.0
|
|
|||||||||
|
Interest expense
|
0.1
|
|
—
|
|
34.1
|
|
104.6
|
|
138.8
|
|
|||||||||
|
Other (income) expense, net
|
(0.5
|
)
|
(0.6
|
)
|
—
|
|
0.6
|
|
(0.5
|
)
|
|||||||||
|
Loss on extinguishment of debt
|
—
|
|
—
|
|
1.4
|
|
4.0
|
|
5.4
|
|
|||||||||
|
Intercompany expense (income)
|
52.6
|
|
38.1
|
|
(33.8
|
)
|
(56.9
|
)
|
—
|
|
|||||||||
|
Income (loss) before income taxes
|
249.6
|
|
160.4
|
|
142.4
|
|
(197.1
|
)
|
355.3
|
|
|||||||||
|
Income taxes
|
92.7
|
|
59.3
|
|
54.0
|
|
(73.1
|
)
|
132.9
|
|
|||||||||
|
Net income (loss)
|
$
|
156.9
|
|
$
|
101.1
|
|
$
|
88.4
|
|
$
|
(124.0
|
)
|
$
|
222.4
|
|
||||
|
Total assets
|
$
|
2,898.0
|
|
$
|
1,358.9
|
|
$
|
2,213.8
|
|
$
|
86.9
|
|
$
|
6,557.6
|
|
||||
|
Capital expenditures
|
$
|
74.8
|
|
$
|
41.1
|
|
$
|
7.3
|
|
$
|
31.9
|
|
$
|
155.1
|
|
||||
108
KAR Auction Services, Inc.
Notes to Consolidated Financial Statements (Continued)
December 31, 2016, 2015 and 2014
Financial information regarding our reportable segments is set forth below for the year ended
December 31, 2015
(in millions)
:
|
ADESA
Auctions
|
IAA
|
AFC
|
Holding
Company
|
Consolidated
|
|||||||||||||||
|
Operating revenues
|
$
|
1,427.8
|
|
$
|
994.4
|
|
$
|
268.4
|
|
$
|
—
|
|
$
|
2,690.6
|
|
||||
|
Operating expenses
|
|
|
|
|
|
||||||||||||||
|
Cost of services (exclusive of depreciation and amortization)
|
836.9
|
|
633.6
|
|
78.0
|
|
—
|
|
1,548.5
|
|
|||||||||
|
Selling, general and administrative
|
276.6
|
|
98.1
|
|
27.8
|
|
99.5
|
|
502.0
|
|
|||||||||
|
Depreciation and amortization
|
86.2
|
|
80.8
|
|
30.8
|
|
15.0
|
|
212.8
|
|
|||||||||
|
Total operating expenses
|
1,199.7
|
|
812.5
|
|
136.6
|
|
114.5
|
|
2,263.3
|
|
|||||||||
|
Operating profit (loss)
|
228.1
|
|
181.9
|
|
131.8
|
|
(114.5
|
)
|
427.3
|
|
|||||||||
|
Interest expense
|
0.7
|
|
—
|
|
24.1
|
|
66.6
|
|
91.4
|
|
|||||||||
|
Other (income) expense, net
|
(1.7
|
)
|
(1.7
|
)
|
(1.5
|
)
|
0.3
|
|
(4.6
|
)
|
|||||||||
|
Intercompany expense (income)
|
57.6
|
|
38.4
|
|
(25.3
|
)
|
(70.7
|
)
|
—
|
|
|||||||||
|
Income (loss) before income taxes
|
171.5
|
|
145.2
|
|
134.5
|
|
(110.7
|
)
|
340.5
|
|
|||||||||
|
Income taxes
|
62.3
|
|
52.4
|
|
51.3
|
|
(40.1
|
)
|
125.9
|
|
|||||||||
|
Net income (loss)
|
$
|
109.2
|
|
$
|
92.8
|
|
$
|
83.2
|
|
$
|
(70.6
|
)
|
$
|
214.6
|
|
||||
|
Total assets
|
$
|
2,390.9
|
|
$
|
1,292.1
|
|
$
|
2,025.0
|
|
$
|
63.5
|
|
$
|
5,771.5
|
|
||||
|
Capital expenditures
|
$
|
70.0
|
|
$
|
40.4
|
|
$
|
7.0
|
|
$
|
17.3
|
|
$
|
134.7
|
|
||||
Financial information regarding our reportable segments is set forth below for the year ended
December 31, 2014
(in millions)
:
|
ADESA
Auctions
|
IAA
|
AFC
|
Holding
Company
|
Consolidated
|
|||||||||||||||
|
Operating revenues
|
$
|
1,271.0
|
|
$
|
895.9
|
|
$
|
250.1
|
|
$
|
—
|
|
$
|
2,417.0
|
|
||||
|
Operating expenses
|
|
|
|
|
|
||||||||||||||
|
Cost of services (exclusive of depreciation and amortization)
|
745.9
|
|
555.7
|
|
69.7
|
|
—
|
|
1,371.3
|
|
|||||||||
|
Selling, general and administrative
|
259.9
|
|
98.8
|
|
28.8
|
|
83.9
|
|
471.4
|
|
|||||||||
|
Depreciation and amortization
|
80.2
|
|
76.2
|
|
30.4
|
|
9.8
|
|
196.6
|
|
|||||||||
|
Total operating expenses
|
1,086.0
|
|
730.7
|
|
128.9
|
|
93.7
|
|
2,039.3
|
|
|||||||||
|
Operating profit (loss)
|
185.0
|
|
165.2
|
|
121.2
|
|
(93.7
|
)
|
377.7
|
|
|||||||||
|
Interest expense
|
0.9
|
|
0.2
|
|
18.7
|
|
66.4
|
|
86.2
|
|
|||||||||
|
Other (income) expense, net
|
(2.4
|
)
|
(1.6
|
)
|
—
|
|
0.2
|
|
(3.8
|
)
|
|||||||||
|
Loss on extinguishment of debt
|
—
|
|
—
|
|
—
|
|
30.3
|
|
30.3
|
|
|||||||||
|
Intercompany expense (income)
|
56.9
|
|
38.5
|
|
(22.7
|
)
|
(72.7
|
)
|
—
|
|
|||||||||
|
Income (loss) before income taxes
|
129.6
|
|
128.1
|
|
125.2
|
|
(117.9
|
)
|
265.0
|
|
|||||||||
|
Income taxes
|
43.2
|
|
48.4
|
|
48.6
|
|
(44.5
|
)
|
95.7
|
|
|||||||||
|
Net income (loss)
|
$
|
86.4
|
|
$
|
79.7
|
|
$
|
76.6
|
|
$
|
(73.4
|
)
|
$
|
169.3
|
|
||||
|
Total assets
|
$
|
2,272.0
|
|
$
|
1,233.8
|
|
$
|
1,771.3
|
|
$
|
57.7
|
|
$
|
5,334.8
|
|
||||
|
Capital expenditures
|
$
|
42.3
|
|
$
|
39.3
|
|
$
|
6.4
|
|
$
|
13.0
|
|
$
|
101.0
|
|
||||
109
KAR Auction Services, Inc.
Notes to Consolidated Financial Statements (Continued)
December 31, 2016, 2015 and 2014
Geographic Information
Our foreign operations include Canada, Mexico and the U.K. Most of our operations outside the U.S. are in Canada. Information regarding the geographic areas of our operations is set forth below
(in millions)
:
|
|
Year Ended December 31,
|
||||||||||
|
|
2016
|
2015
|
2014
|
||||||||
|
Operating revenues
|
|
|
|
||||||||
|
U.S.
|
$
|
2,737.6
|
|
$
|
2,337.9
|
|
$
|
2,094.3
|
|
||
|
Foreign
|
412.5
|
|
352.7
|
|
322.7
|
|
|||||
|
$
|
3,150.1
|
|
$
|
2,690.6
|
|
$
|
2,417.0
|
|
|||
|
|
December 31,
|
||||||
|
|
2016
|
2015
|
|||||
|
Long-lived assets
|
|
|
|||||
|
U.S.
|
$
|
3,447.5
|
|
$
|
3,138.8
|
|
|
|
Foreign
|
268.9
|
|
186.6
|
|
|||
|
$
|
3,716.4
|
|
$
|
3,325.4
|
|
||
No single customer accounted for more than ten percent of our total revenues in any fiscal year presented.
110
KAR Auction Services, Inc.
Notes to Consolidated Financial Statements (Continued)
December 31, 2016, 2015 and 2014
Information for any one quarterly period is not necessarily indicative of the results that may be expected for the year. Revenues and cost of services shown in the tables below have been increased by the amounts for owned vehicles noted at the bottom of each of the tables. For a description of the changes, reference the
“Revenue Recognition - ADESA Auction Services”
section in Note 2.
|
2016 Quarter Ended
|
March 31
|
June 30
|
Sept. 30
|
Dec. 31
|
|||||||||||
|
Operating revenues
|
$
|
758.3
|
|
$
|
788.5
|
|
$
|
789.6
|
|
$
|
813.7
|
|
|||
|
Operating expenses
|
|||||||||||||||
|
Cost of services (exclusive of depreciation and amortization)
|
432.0
|
|
447.6
|
|
459.5
|
|
488.3
|
|
|||||||
|
Selling, general, and administrative
|
141.1
|
|
146.9
|
|
146.3
|
|
148.8
|
|
|||||||
|
Depreciation and amortization
|
56.4
|
|
59.0
|
|
60.5
|
|
64.7
|
|
|||||||
|
Total operating expenses
|
629.5
|
|
653.5
|
|
666.3
|
|
701.8
|
|
|||||||
|
Operating profit
|
128.8
|
|
135.0
|
|
123.3
|
|
111.9
|
|
|||||||
|
Interest expense
|
28.7
|
|
35.8
|
|
36.3
|
|
38.0
|
|
|||||||
|
Other (income) expense, net
|
(1.3
|
)
|
(0.3
|
)
|
0.8
|
|
0.3
|
|
|||||||
|
Loss on extinguishment of debt
|
4.0
|
|
—
|
|
—
|
|
1.4
|
|
|||||||
|
Income before income taxes
|
97.4
|
|
99.5
|
|
86.2
|
|
72.2
|
|
|||||||
|
Income taxes
|
36.7
|
|
37.7
|
|
31.8
|
|
26.7
|
|
|||||||
|
Net income
|
$
|
60.7
|
|
$
|
61.8
|
|
$
|
54.4
|
|
$
|
45.5
|
|
|||
|
Basic net income per share of common stock
|
$
|
0.44
|
|
$
|
0.45
|
|
$
|
0.39
|
|
$
|
0.33
|
|
|||
|
Diluted net income per share of common stock
|
$
|
0.44
|
|
$
|
0.44
|
|
$
|
0.39
|
|
$
|
0.33
|
|
|||
|
Recorded increase in ADESA operating revenues and cost of services for owned vehicles
|
$
|
13.3
|
|
$
|
16.7
|
|
$
|
15.8
|
|
$
|
14.8
|
|
|||
|
2015 Quarter Ended
|
March 31
|
June 30
|
Sept. 30
|
Dec. 31
|
|||||||||||
|
Operating revenues
|
$
|
645.0
|
|
$
|
671.5
|
|
$
|
678.4
|
|
$
|
695.7
|
|
|||
|
Operating expenses
|
|
|
|||||||||||||
|
Cost of services (exclusive of depreciation and amortization)
|
364.7
|
|
379.7
|
|
389.8
|
|
414.3
|
|
|||||||
|
Selling, general, and administrative
|
121.5
|
|
123.5
|
|
128.5
|
|
128.5
|
|
|||||||
|
Depreciation and amortization
|
50.9
|
|
51.8
|
|
54.1
|
|
56.0
|
|
|||||||
|
Total operating expenses
|
537.1
|
|
555.0
|
|
572.4
|
|
598.8
|
|
|||||||
|
Operating profit
|
107.9
|
|
116.5
|
|
106.0
|
|
96.9
|
|
|||||||
|
Interest expense
|
21.0
|
|
21.8
|
|
24.4
|
|
24.2
|
|
|||||||
|
Other (income) expense, net
|
(2.2
|
)
|
0.4
|
|
(0.3
|
)
|
(2.5
|
)
|
|||||||
|
Income before income taxes
|
89.1
|
|
94.3
|
|
81.9
|
|
75.2
|
|
|||||||
|
Income taxes
|
34.6
|
|
34.8
|
|
29.6
|
|
26.9
|
|
|||||||
|
Net income
|
$
|
54.5
|
|
$
|
59.5
|
|
$
|
52.3
|
|
$
|
48.3
|
|
|||
|
Basic net income per share of common stock
|
$
|
0.39
|
|
$
|
0.42
|
|
$
|
0.37
|
|
$
|
0.35
|
|
|||
|
Diluted net income per share of common stock
|
$
|
0.38
|
|
$
|
0.41
|
|
$
|
0.37
|
|
$
|
0.35
|
|
|||
|
Recorded increase in ADESA operating revenues and cost of services for owned vehicles
|
$
|
12.6
|
|
$
|
13.2
|
|
$
|
11.7
|
|
$
|
13.5
|
|
|||
111
Not applicable.
Evaluation of Disclosure Controls and Procedures
As of the end of the period covered by this Annual Report on Form 10-K, we carried out an evaluation under the supervision and with the participation of our management, including the Chief Executive Officer and Chief Financial Officer, of the effectiveness of the design and operation of our disclosure controls and procedures as defined in Exchange Act Rules 13a-15(e) and 15d-15(e). Based upon that evaluation, the Chief Executive Officer and the Chief Financial Officer concluded that our disclosure controls and procedures were effective.
Internal Control over Financial Reporting
Management's report on our internal control over financial reporting (as such term is defined in Rules 13a-15(f) and 15d-15(f) under the Exchange Act) and the related report of KPMG LLP, our independent registered public accounting firm, are included in Item 8, Financial Statements and Supplementary Data under the headings Management's Report on Internal Control over Financial Reporting and Report of Independent Registered Public Accounting Firm, respectively, and are incorporated herein by reference.
Changes in Internal Control over Financial Reporting
There has been no change in our internal control over financial reporting during the quarter ended
December 31, 2016
, that has materially affected, or is reasonably likely to materially affect, our internal control over financial reporting.
None.
112
Information relating to our directors and nominees will be included in our Definitive Proxy Statement for our
2017
Annual Meeting of Stockholders and such information will be incorporated by reference herein. Our executive officers as of
February 15, 2017
, are as follows:
James P. Hallett, 63, Chief Executive Officer and Chairman of the Board of Directors.
Mr. Hallett has served as the Chief Executive Officer since September 2009 and the Chairman of the Board of Directors since December 2014. Mr. Hallett served as President and Chief Executive Officer of ADESA from April 2007 to September 2009. Mr. Hallett served as: Executive Vice President of ADESA, Inc. from May 2004 to May 2005; President of ADESA Corporation, LLC from March 2004 to May 2005; President of ADESA Corporation between August 1996 and October 2001 and again between January 2003 and March 2004; Chief Executive Officer of ADESA Corporation from August 1996 to July 2003; ADESA Corporation's Chairman from October 2001 to July 2003; Chairman, President and Chief Executive Officer of ALLETE Automotive Services, Inc. from January 2001 to January 2003 and Executive Vice President from August 1996 to May 2004. Mr. Hallett left ADESA in May 2005 and thereafter served as President of the Columbus Fair Auto Auction until April 2007.
Warren W. Byrd, 54, Executive Vice President of Corporate Development and Real Estate.
Mr. Byrd has been the Executive Vice President of Corporate Development and Real Estate since June 2010. Mr. Byrd previously served as the Executive Vice President of Corporate Development of ADESA from April 2007 to June 2010. From April 2004 to April 2007, Mr. Byrd was the Chief Operating Officer of ServNet Auction Group, a trade co-operative of over 20 independent auto auctions in the U.S. Mr. Byrd previously served in the following positions between September 1994 and November 2003: President of ADESA Impact, a salvage auction subsidiary of ADESA, between February 2002 and November 2003; Senior Vice President and Chief Information Officer of ADESA between May 2001 and February 2002; Vice President of Corporate Development of ADESA between January 1999 and May 2001; General Counsel of ADESA between August 1996 and January 1999; and Legal Counsel of ADESA between September 1994 and August 1996. Prior to joining ADESA, Mr. Byrd practiced law with McHale, Cook and Welch in Indianapolis from May 1989 to September 1994.
Thomas J. Caruso, 57, Chief Client Officer.
Mr. Caruso has been the Chief Client Officer since January 2014. Mr. Caruso was the President and Chief Executive Officer of ADESA from September 2009 to January 2014. Mr. Caruso previously was the Chief Operating Officer of ADESA from May 2008 to September 2009. Mr. Caruso also served as Executive Vice President of ADESA from April 2007 to May 2008 and Regional Vice President of ADESA from January 2000 to April 2007. From November 1992 to January 2000 Mr. Caruso served as General Manager of ADESA Boston.
Donald S. Gottwald, 50, Chief Operating Officer.
Mr. Gottwald has been the Chief Operating Officer since March 2014. Mr. Gottwald previously served as the Chief Executive Officer of AFC from January 2009 to March 2014. Mr. Gottwald also served as the President of AFC from January 2009 to May 2013. Previously, Mr. Gottwald served in the role of Executive Vice President of Dealer Business for HSBC Auto Finance from December 2005 to October 2008. Prior to working at HSBC Auto Finance, Mr. Gottwald served in several roles of increased responsibility with GMAC Financial Services from June 1993 to December 2005, including Managing Director of Saab Financial Services Corp. and Managing Director of American Suzuki Financial Services. Mr. Gottwald has been active in the American Financial Services Association and previously served on the association's board of directors. In addition, Mr. Gottwald serves on the Northwood University Automotive Marketing Curriculum Advisory Board.
Peter J. Kelly, 48, President of Digital Services and Chief Technology Officer.
Mr. Kelly has been the President of Digital Services since December 2014 and the Chief Technology Officer since June 2013. Mr. Kelly was the President and Chief Executive Officer of Openlane from February 2011 to June 2013. Previously, Mr. Kelly was President and Chief Financial Officer of Openlane from February 2010 to February 2011. Prior to that, Mr. Kelly was Chief Financial Officer of Openlane from May 2008 to February 2010. Mr. Kelly was a co-founder of Openlane in 1999 and served in a number of executive roles at Openlane from 1999 to 2008.
John W. Kett, 53, Chief Executive Officer and President of IAA
. Mr. Kett has been Chief Executive Officer and President of IAA since May 2014. Mr. Kett joined IAA in 2001 as Senior Vice President of Planning and Business Development and was later promoted to Chief Financial Officer and then President. Prior to joining IAA, Mr. Kett served in a variety of senior financial and operational roles for Central Steel and Wire Co., Safelite Glass Corporation (formerly Vistar, Inc.), Newark Electronics and Deloitte LLP.
113
Eric M. Loughmiller, 57, Executive Vice President and Chief Financial Officer.
Mr. Loughmiller has been Executive Vice President and Chief Financial Officer since April 2007. Previously, from 2001 to 2006, Mr. Loughmiller was the Vice President and Chief Financial Officer of ThoughtWorks, Inc., an information technology consulting firm. Prior to that, Mr. Loughmiller served as Executive Vice President and Chief Financial Officer of May & Speh, Inc. from 1996 to 1998 until May & Speh was acquired by Acxiom Corporation. Mr. Loughmiller was the finance leader of the Outsourcing Division of Acxiom Corporation from 1998 to 2000. Prior to joining May & Speh, Mr. Loughmiller was an audit partner with PricewaterhouseCoopers LLP, an independent registered public accounting firm. Mr. Loughmiller is a certified public accountant.
James E. Money, 54, President of AFC.
Mr. Money has been President of AFC since June 2016. Mr. Money joined AFC in 1999 as Controller and was later promoted to Vice President of Finance in 2006 and to Chief Financial Officer in 2009. Prior to joining AFC, Mr. Money served as Chief Financial Officer of Fundex Games, LTD from 1998 to 1999. Mr. Money is a certified public accountant.
Rebecca C. Polak, 46, Executive Vice President, General Counsel and Secretary.
Ms. Polak has been Executive Vice President, General Counsel and Secretary since April 2007. Ms. Polak previously served as the Assistant General Counsel and Assistant Secretary of ADESA from February 2005 to April 2007 and as Vice President of ADESA from December 2006 to April 2007. Prior to joining ADESA, Ms. Polak practiced corporate and securities law with Krieg DeVault in Indianapolis from 2000 to 2005 and with Haynes and Boone in Dallas from 1995 to 1999.
Lisa A. Price, 42, Executive Vice President of Human Resources.
Ms. Price has been the Executive Vice President of Human Resources since June 2013. Ms. Price previously served as the Vice President of Employment and Litigation Counsel of the Company from January 2008 to June 2013 and Senior Corporate Counsel from November 2005 to January 2008. Prior to joining ADESA, Ms. Price practiced employment law with Stewart & Irwin in Indianapolis from November 2000 to November 2005.
Benjamin Skuy, 54, Executive Vice President of International Markets and Strategic Initiatives.
Mr. Skuy has been Executive Vice President of International Markets and Strategic Initiatives since September 2009. Mr. Skuy previously served in the following positions between July 1999 and September 2009: Executive Vice President of International Markets and Managing Director of ADESA Canada from January 2008 to September 2009; Managing Director and Chief Operating Officer of ADESA Canada from July 2006 to January 2008; Chief Operating Officer of ADESA Canada from January 2002 to July 2006; and Chief Financial Officer of ADESA Canada from July 1999 to January 2002. Prior to joining ADESA, Mr. Skuy served as Assistant Vice President at Manulife Financial from June 1998 to July 1999. From August 1990 to May 1998 he served as Senior Manager at The Bank of Nova Scotia.
Stephane St-Hilaire, 48, Chief Executive Officer and President of ADESA.
Mr. St-Hilaire has been the Chief Executive Officer and President of ADESA since January 2014. Mr. St-Hilaire previously served in the following positions between March 1998 and January 2014: President and Chief Operating Officer of ADESA Auctions Canada Corporation from September 2009 to January 2014; Regional Vice President Eastern Canada and General Manager of ADESA Montreal from September 1999 to September 2009; and Chief Financial Officer of ADESA Canada from March 1998 to September 1999. Prior to joining ADESA, Mr. St-Hilaire served as controller at AIT Corporation.
David Vignes, 54, Executive Vice President of Enterprise Optimization.
Mr. Vignes has been Executive Vice President of Enterprise Optimization since September 2009. Previously, Mr. Vignes served as Senior Vice President of Operations and Strategic Improvement of ADESA from July 2007 to August 2009. Prior to joining ADESA, Mr. Vignes served as Senior Vice President at Steiner + Associates, a real estate development company, from April 2004 to June 2007. From 1991 to 2004, Mr. Vignes held several executive positions in finance and operations with Disney Corporation companies, such as Disneyland Paris, Walt Disney World Orlando and the Disney cruise line. Mr. Vignes also is a director of Drayer Physical Therapy Institute and an advisor to the board of directors of Wellfount Corporation.
Section 16(a) Beneficial Ownership Reporting Compliance
The information required by this item is incorporated by reference herein from our Definitive Proxy Statement for our
2017
Annual Meeting of Stockholders to be filed with the SEC as set forth under the caption "Documents Incorporated by Reference."
114
Code of Business Conduct and Ethics
We have adopted the Code of Business Conduct and Ethics that applies to all of our employees, officers and directors, including those officers responsible for financial reporting. In addition, we have adopted the Code of Ethics for Principal Executive and Senior Financial Officers that applies to the Company's principal executive officer, principal financial and accounting officer and such other persons who are designated by our board of directors. Both codes are available on our website at www.karauctionservices.com and available in print to any stockholder who requests it. Information on, or accessible through, our website is not part of this Form 10-K. We expect that any amendments to these codes, or any waivers of their requirements, will be disclosed on our website.
The information required by this Item 11 is incorporated by reference herein from our Definitive Proxy Statement for our
2017
Annual Meeting of Stockholders to be filed with the SEC as set forth under the caption "Documents Incorporated by Reference."
The information required by Item 403 of Regulation S-K will be included in our Definitive Proxy Statement for our
2017
Annual Meeting and such information will be incorporated by reference herein.
Equity Compensation Plan Information
The following table sets forth the aggregate information of our equity compensation plans in effect as of
December 31, 2016
.
|
Plan Category
|
Number of
securities to be
issued upon exercise
of outstanding
options, warrants
and rights(1)
|
Weighted-average
exercise price of
outstanding
options,
warrants and
rights(2)
|
Number of securities
remaining available for
future issuance under equity
compensation
plans (excluding securities
reflected in first column)(3)
|
||||||
|
Equity compensation plans approved by security holder(s)
|
3,661,231
|
|
$
|
18.64
|
|
6,768,518
|
|
||
|
Equity compensation plans not approved by security holders
|
—
|
|
—
|
|
—
|
|
|||
|
Total
|
3,661,231
|
|
$
|
18.64
|
|
6,768,518
|
|
||
|
(1)
|
Includes (a) service options, exit options, performance-based restricted stock units ("PRSUs") and restricted stock units ("RSUs") issued under the KAR Auction Services, Inc. 2009 Omnibus Stock and Incentive Plan; and (b) service and exit options issued under the KAR Auction Services, Inc. Stock Incentive Plan. The amount of PRSUs outstanding at target of 564,318 have been included in the table above.
|
|
(2)
|
Awards issued by KAR Auction Services, Inc. have exercise prices ranging from $10.00 to $30.89. The weighted-average price in the table above only reflects the weighted-average exercise price of outstanding options. The weighted-average exercise price does not include the PRSUs or RSUs.
|
|
(3)
|
The number of securities available for future issuance includes (a) 6,213,942 shares of common stock that may be issued under the KAR Auction Services, Inc. 2009 Omnibus Stock and Incentive Plan; and (b)
554,576
shares of common stock that may be issued under the KAR Auction Services, Inc. Employee Stock Purchase Plan.
|
The information required by this Item 13 is incorporated by reference herein from our Definitive Proxy Statement for our
2017
Annual Meeting of Stockholders to be filed with the SEC as set forth under the caption "Documents Incorporated by Reference."
The information required by this Item 14 is incorporated by reference herein from our Definitive Proxy Statement for our
2017
Annual Meeting of Stockholders to be filed with the SEC as set forth under the caption "Documents Incorporated by Reference."
115
|
a)
|
The following documents have been filed as part of this report or, where noted, incorporated by reference:
|
|
1)
|
Financial Statements—the consolidated financial statements of KAR Auction Services, Inc. and its consolidated subsidiaries are filed as part of this report under Item 8.
|
|
2)
|
Financial Statement Schedules—all schedules have been omitted because the matter or conditions are not present or the information required to be set forth therein is included in the consolidated financial statements and related notes thereto.
|
|
3)
|
Exhibits—the exhibit list in the Exhibit Index is incorporated herein by reference as the list of exhibits required as part of this report.
|
In reviewing the agreements included as exhibits to this Form 10-K, please remember they are included to provide you with information regarding their terms and are not intended to provide any other factual or disclosure information about KAR Auction Services, ADESA, IAA, AFC or other parties to the agreements.
The agreements included or incorporated by reference as exhibits to this Annual Report on Form 10-K contain representations and warranties by each of the parties to the applicable agreement. These representations and warranties were made solely for the benefit of the other parties to the applicable agreement and (i) were not intended to be treated as categorical statements of fact, but rather as a way of allocating the risk to one of the parties if those statements prove to be inaccurate; (ii) may have been qualified in such agreement by disclosures that were made to the other party in connection with the negotiation of the applicable agreement; (iii) may apply contract standards of "materiality" that are different from "materiality" under the applicable securities laws; and (iv) were made only as of the date of the applicable agreement or such other date or dates as may be specified in the agreement.
The Company acknowledges that, notwithstanding the inclusion of the foregoing cautionary statements, it is responsible for considering whether additional specific disclosures of material information regarding material contractual provisions are required to make the statements in this Annual Report not misleading. Additional information about KAR Auction Services may be found elsewhere in this Annual Report on Form 10-K and KAR Auction Services, Inc.'s other public filings, which are available without charge through the SEC's website at http://www.sec.gov. See Item 1, "Business—Available Information."
116
SIGNATURES
Pursuant to the requirements of Section 13 or 15(d) of the Securities Exchange Act of 1934, the Registrant has duly caused this report to be signed on its behalf by the undersigned, thereunto duly authorized.
|
KAR Auction Services, Inc.
|
|||
|
By:
|
/s/ JAMES P. HALLETT
|
||
|
James P. Hallett
Chief Executive Officer
|
|||
|
February 23, 2017
|
|||
Pursuant to the requirements of the Securities Exchange Act of 1934, this report has been signed below by the following persons on behalf of the Registrant and in the capacities and on the dates indicated.
|
Signature
|
|
Title
|
|
Date
|
|
|
|
|
|
|
|
/s/ JAMES P. HALLETT
|
Chief Executive Officer and Chairman of the Board
|
February 23, 2017
|
||
|
James P. Hallett
|
|
(Principal Executive Officer)
|
|
|
|
/s/ ERIC M. LOUGHMILLER
|
Chief Financial Officer
|
February 23, 2017
|
||
|
Eric M. Loughmiller
|
|
(Principal Financial and Accounting Officer)
|
|
|
|
/s/ TODD F. BOURELL
|
Director
|
February 23, 2017
|
||
|
Todd F. Bourell
|
|
|
||
|
/s/ DONNA R. ECTON
|
Director
|
February 23, 2017
|
||
|
Donna R. Ecton
|
||||
|
/s/ MARK E. HILL
|
Director
|
February 23, 2017
|
||
|
Mark E. Hill
|
|
|
||
|
/s/ J. MARK HOWELL
|
Director
|
February 23, 2017
|
||
|
J. Mark Howell
|
|
|
||
|
/s/ LYNN JOLLIFFE
|
Director
|
February 23, 2017
|
||
|
Lynn Jolliffe
|
||||
|
/s/ MICHAEL T. KESTNER
|
Director
|
February 23, 2017
|
||
|
Michael T. Kestner
|
|
|
||
|
/s/ JOHN P. LARSON
|
Lead Independent Director
|
February 23, 2017
|
||
|
John P. Larson
|
|
|
||
|
/s/ STEPHEN E. SMITH
|
Director
|
February 23, 2017
|
||
|
Stephen E. Smith
|
|
|
||
117
EXHIBIT INDEX
|
|
|
Incorporated by Reference
|
|
||||||||||
|
Exhibit No.
|
Exhibit Description
|
Form
|
File No.
|
Exhibit
|
Filing
Date
|
Filed
Herewith
|
|||||||
|
2.1a
|
|
Asset Purchase Agreement, dated as of February 17, 2016, by and among ADESA, Inc., Brasher’s
Reno Auto Auction, L.L.C., BIAA, L.L.C., Brasher’s Auto Auctions, West Coast Auto Auctions, Inc.
and the other parties thereto
|
8-K
|
001-34568
|
2.1
|
2/18/2016
|
|||||||
|
2.1b
|
|
First Amendment to Asset Purchase Agreement, dated as of April 1, 2016, to that certain Asset Purchase Agreement dated as of February 17, 2016, by and among ADESA, Inc., Brasher’s Reno Auto Auction, L.L.C., BIAA, L.L.C., Brasher’s Auto Auctions, West Coast Auto Auctions, Inc. and the other parties thereto
|
10-Q
|
001-34568
|
2.1b
|
5/4/2016
|
|||||||
|
2.2
|
|
Asset Purchase Agreement, dated as of February 17, 2016, by and among ADESA, Inc., Brasher’s
Auto Auctions and the other parties thereto
|
8-K
|
001-34568
|
2.2
|
2/18/2016
|
|||||||
|
2.3
|
|
Asset Purchase Agreement, dated as of February 17, 2016, by and among ADESA, Inc., West Coast
Auto Auctions, Inc., Brasher’s Cascade Auto Auction, Inc., Brasher’s Northwest Auto Auction, Inc.,
Brasher’s Sacramento Auto Auction, Inc., Brasher’s Fresno Auto Auction, Inc. and the other parties
thereto
|
8-K
|
001-34568
|
2.3
|
2/18/2016
|
|||||||
|
3.1
|
|
Amended and Restated Certificate of Incorporation of KAR Auction Services, Inc.
|
10-Q
|
001-34568
|
3.1
|
8/3/2016
|
|||||||
|
3.2
|
|
Second Amended and Restated By-Laws of KAR Auction Services, Inc.
|
8-K
|
001-34568
|
3.1
|
11/4/2014
|
|
||||||
|
4.1
|
|
Form of common stock certificate
|
S-1/A
|
333-161907
|
4.15
|
12/10/2009
|
|
||||||
|
10.1a
|
|
Amendment and Restatement Agreement, dated March 11, 2014, among KAR Auction Services, Inc. and certain of its subsidiaries and JPMorgan Chase Bank, N.A., as administrative agent, swingline lender and issuing lender (the Amended and Restated Credit Agreement and the Amended and Restated Guarantee and Collateral Agreement are included as Exhibits A and B thereto, respectively)
|
8-K
|
001-34568
|
10.1
|
3/12/2014
|
|
||||||
|
10.1b
|
|
Incremental Commitment Agreement and First Amendment, dated as of March 9, 2016, among KAR Auction Services, Inc., JPMorgan Chase Bank, N.A., as administrative agent, certain subsidiaries of the Company party thereto and the several lenders party thereto
|
8-K
|
001-34568
|
10.1
|
3/9/2016
|
|||||||
|
10.2
|
|
*
|
KAR Auction Services, Inc. (formerly KAR Holdings, Inc.) Stock Incentive Plan
|
S-8
|
333-164032
|
10.1
|
12/24/2009
|
|
|||||
|
10.3
|
|
*
|
Form of Nonqualified Stock Option Agreement of KAR Auction Services, Inc. (formerly KAR Holdings, Inc.) pursuant to the Stock Incentive Plan
|
S-4
|
333-148847
|
10.15
|
1/25/2008
|
|
|||||
|
10.4
|
|
*
|
Employment Agreement, dated February 27, 2012, between KAR Auction Services, Inc. and James P. Hallett
|
10-K
|
001-34568
|
10.15
|
2/28/2012
|
|
|||||
|
10.5
|
|
*
|
Employment Agreement, dated April 13, 2015, between KAR Auction Services, Inc. and Stephane St-Hilaire
|
10-Q
|
001-34568
|
10.7
|
5/6/2015
|
||||||
118
|
|
|
|
Incorporated by Reference
|
|
|||||||||
|
Exhibit No.
|
|
Exhibit Description
|
Form
|
File No.
|
Exhibit
|
Filing
Date
|
Filed
Herewith
|
||||||
|
10.6
|
|
*
|
Amended and Restated Employment Agreement, dated March 24, 2014, between KAR Auction Services, Inc. and Don Gottwald
|
8-K
|
001-34568
|
10.1
|
3/20/2014
|
||||||
|
10.7
|
|
*
|
Employment Agreement, dated December 17, 2013, between KAR Auction Services, Inc. and Eric Loughmiller
|
8-K
|
001-34568
|
10.5
|
12/17/2013
|
||||||
|
10.8
|
|
*
|
Employment Agreement, dated May 1, 2014, between KAR Auction Services, Inc. and John Kett
|
10-K
|
001-34568
|
10.10
|
2/18/2016
|
||||||
|
10.9a
|
|
*
|
Employment Agreement, dated December 17, 2013, between KAR Auction Services, Inc. and Peter Kelly
|
X
|
|||||||||
|
10.9b
|
|
*
|
Amendment to Employment Agreement, dated December 31, 2014, between KAR Auction Services, Inc. and Peter Kelly
|
X
|
|||||||||
|
10.10
|
|
*
|
KAR Auction Services, Inc. (formerly KAR Holdings, Inc.) Annual Incentive Program (2014)
|
10-K
|
333-148847
|
10.29
|
3/11/2009
|
||||||
|
10.11
|
|
*
|
KAR Auction Services, Inc. Annual Incentive Plan Summary of Terms for Plan Year 2015
|
10-Q
|
001-34568
|
10.11
|
5/6/2015
|
||||||
|
10.12
|
|
*
|
KAR Auction Services, Inc. Annual Incentive Plan Summary of Terms for Plan Year 2016
|
10-Q
|
001-34568
|
10.13
|
5/4/2016
|
||||||
|
10.13
|
|
*
|
KAR Auction Services, Inc. Annual Incentive Program Summary of Terms 2017
|
X
|
|||||||||
|
10.14a
|
|
^
|
Amended and Restated Purchase and Sale Agreement, dated May 31, 2002, between AFC Funding Corporation and Automotive Finance Corporation
|
S-4
|
333-148847
|
10.32
|
1/25/2008
|
|
|||||
|
10.14b
|
|
|
Amendment No. 1 to Amended and Restated Purchase and Sale Agreement, dated June 15, 2004
|
S-4
|
333-148847
|
10.33
|
1/25/2008
|
||||||
|
10.14c
|
|
|
Amendment No. 2 to Amended and Restated Purchase and Sale Agreement, dated January 18, 2007
|
S-4
|
333-148847
|
10.34
|
1/25/2008
|
|
|||||
|
10.14d
|
|
^
|
Amendment No. 3 to Amended and Restated Purchase and Sale Agreement, dated April 20, 2007
|
S-4
|
333-148847
|
10.35
|
1/25/2008
|
|
|||||
|
10.14e
|
|
|
Amendment No. 4 to Amended and Restated Purchase and Sale Agreement, dated January 30, 2009
|
10-K
|
001-34568
|
10.19e
|
2/28/2012
|
|
|||||
|
10.14f
|
|
|
Amendment No. 5 to Amended and Restated Purchase and Sale Agreement, dated April 25, 2011
|
10-K
|
001-34568
|
10.19f
|
2/28/2012
|
|
|||||
|
10.15
|
|
^
|
Seventh Amended and Restated Receivables Purchase Agreement, dated December 20, 2016, among AFC Funding Corporation, Automotive Finance Corporation, the entities from time to time parties hereto as Purchasers or Purchaser Agents and Bank of Montreal
|
X
|
|||||||||
|
10.16
|
|
^
|
Fourth Amended and Restated Receivables Purchase Agreement, dated December 20, 2016, between Automotive Finance Canada Inc., KAR Auction Services, Inc. and BNY Trust Company of Canada
|
X
|
|||||||||
|
10.17a
|
|
Ground Lease, dated September 4, 2008, between ADESA San Diego, LLC and First Industrial L.P. (East 39 Acres at Otay Mesa, California)
|
8-K
|
333-148847
|
10.3
|
9/9/2008
|
|
||||||
|
10.17b
|
|
Guaranty of Lease, dated September 4, 2008, between KAR Auction Services, Inc. (formerly KAR Holdings, Inc.) and First Industrial L.P. (East 39 Acres at Otay Mesa, California)
|
8-K
|
333-148847
|
10.11
|
9/9/2008
|
|
||||||
119
|
|
|
|
Incorporated by Reference
|
|
||||||||
|
Exhibit No.
|
|
Exhibit Description
|
Form
|
File No.
|
Exhibit
|
Filing
Date
|
Filed
Herewith
|
|||||
|
10.18a
|
Ground Lease, dated September 4, 2008, between ADESA San Diego, LLC and First Industrial L.P. (West 39 Acres at Otay Mesa, California)
|
8-K
|
333-148847
|
10.4
|
9/9/2008
|
|||||||
|
10.18b
|
Guaranty of Lease, dated September 4, 2008, between KAR Auction Services, Inc. (formerly KAR Holdings, Inc.) and First Industrial L.P. (West 39 Acres at Otay Mesa, California)
|
8-K
|
333-148847
|
10.12
|
9/9/2008
|
|||||||
|
10.19a
|
Ground Lease, dated September 4, 2008, between ADESA California, LLC and ADESA San Diego, LLC and First Industrial Pennsylvania, L.P. (Sacramento, California)
|
8-K
|
333-148847
|
10.5
|
9/9/2008
|
|||||||
|
10.19b
|
Guaranty of Lease, dated September 4, 2008, between KAR Auction Services, Inc. (formerly KAR Holdings, Inc.) and First Industrial Pennsylvania, L.P. (Sacramento, California)
|
8-K
|
333-148847
|
10.13
|
9/9/2008
|
|||||||
|
10.20a
|
Ground Lease, dated September 4, 2008, between ADESA California, LLC and First Industrial Pennsylvania, L.P. (Tracy, California)
|
8-K
|
333-148847
|
10.6
|
9/9/2008
|
|||||||
|
10.20b
|
Guaranty of Lease, dated September 4, 2008, between KAR Auction Services, Inc. (formerly KAR Holdings, Inc.) and First Industrial Pennsylvania, L.P. (Tracy, California)
|
8-K
|
333-148847
|
10.14
|
9/9/2008
|
|||||||
|
10.21a
|
Ground Lease, dated September 4, 2008, between ADESA Washington, LLC and First Industrial, L.P. (Auburn, Washington)
|
8-K
|
333-148847
|
10.7
|
9/9/2008
|
|||||||
|
10.21b
|
Guaranty of Lease, dated September 4, 2008, between KAR Auction Services, Inc. (formerly KAR Holdings, Inc.) and First Industrial, L.P. (Auburn, Washington)
|
8-K
|
333-148847
|
10.15
|
9/9/2008
|
|||||||
|
10.22a
|
Ground Lease, dated September 4, 2008, between ADESA Texas, Inc. and First Industrial, L.P. (Houston, Texas)
|
8-K
|
333-148847
|
10.8
|
9/9/2008
|
|||||||
|
10.22b
|
|
Guaranty of Lease, dated September 4, 2008, between KAR Auction Services, Inc. (formerly KAR Holdings, Inc.) and First Industrial, L.P. (Houston, Texas)
|
8-K
|
333-148847
|
10.16
|
9/9/2008
|
||||||
|
10.23a
|
|
Ground Lease, dated September 4, 2008, between ADESA Florida, LLC and First Industrial Financing Partnership, L.P. (Bradenton, Florida)
|
8-K
|
333-148847
|
10.10
|
9/9/2008
|
|
|||||
|
10.23b
|
|
Guaranty of Lease, dated September 4, 2008, between KAR Auction Services, Inc. (formerly KAR Holdings, Inc.) and First Industrial Financing Partnership, L.P. (Bradenton, Florida)
|
8-K
|
333-148847
|
10.18
|
9/9/2008
|
|
|||||
|
10.24a
|
|
Ground Sublease, dated October 3, 2008, between ADESA Atlanta, LLC and First Industrial, L.P. (Fairburn, Georgia)
|
10-Q
|
333-148847
|
10.21
|
11/13/2008
|
|
|||||
|
10.24b
|
|
Guaranty of Lease, dated October 3, 2008, between KAR Auction Services, Inc. (formerly KAR Holdings, Inc.) and First Industrial, L.P. (Fairburn, Georgia)
|
10-Q
|
333-148847
|
10.22
|
11/13/2008
|
|
|||||
|
10.25
|
Form of Indemnification Agreement
|
8-K
|
001-34568
|
10.1
|
12/17/2013
|
|||||||
120
|
|
|
Incorporated by Reference
|
|
||||||||||
|
Exhibit No.
|
Exhibit Description
|
Form
|
File No.
|
Exhibit
|
Filing
Date
|
Filed
Herewith
|
|||||||
|
10.26a
|
|
*
|
KAR Auction Services, Inc. 2009 Omnibus Stock and Incentive Plan, as Amended June 10, 2014
|
DEF 14A
|
001-34568
|
Appendix A
|
4/29/2014
|
|
|||||
|
10.26b
|
|
*
|
First Amendment to the KAR Auction Services, Inc. 2009 Omnibus Stock and Incentive Plan
|
10-K
|
001-34568
|
10.24b
|
2/18/2016
|
||||||
|
10.27a
|
|
*
|
KAR Auction Services, Inc. Employee Stock Purchase Plan
|
S-8
|
333-164032
|
10.3
|
12/24/2009
|
||||||
|
10.27b
|
|
*
|
Amendment No. 1 to KAR Auction Services, Inc. Employee Stock Purchase Plan dated March 31, 2010
|
10-Q
|
001-34568
|
10.60
|
8/4/2010
|
||||||
|
10.27c
|
|
*
|
Amendment No. 2 to KAR Auction Services, Inc. Employee Stock Purchase Plan dated April 1, 2010
|
10-Q
|
001-34568
|
10.61
|
8/4/2010
|
||||||
|
10.28
|
|
*
|
KAR Auction Services, Inc. Directors Deferred Compensation Plan, effective December 10, 2009
|
10-Q
|
001-34568
|
10.62
|
8/4/2010
|
||||||
|
10.29
|
|
*
|
Form of Director Restricted Share Agreement
|
10-Q
|
001-34568
|
10.63
|
8/4/2010
|
||||||
|
10.30
|
|
*
|
Form of Nonqualified Stock Option Agreement
|
S-1/A
|
333-161907
|
10.65
|
12/4/2009
|
||||||
|
10.31
|
|
*
|
Form of 2015 Restricted Stock Unit Award Agreement for Section 16 Officers
|
10-Q
|
001-34568
|
10.29a
|
5/6/2015
|
||||||
|
10.32
|
|
*
|
Form of 2016 Restricted Stock Unit Award Agreement for Section 16 Officers
|
10-K
|
001-34568
|
10.30
|
2/18/2016
|
||||||
|
10.33
|
|
*
|
Form of 2017 Restricted Stock Unit Award Agreement for Section 16 Officers
|
X
|
|||||||||
|
10.34
|
|
*
|
Form of Performance-Based Restricted Stock Unit Agreement (Total Shareholder Return Percentile Rank vs. S&P 500)
|
8-K
|
001-34568
|
10.2
|
12/17/2013
|
||||||
|
10.35
|
|
*
|
Form of Performance-Based Restricted Stock Unit Agreement (Cumulative Adjusted Net Income Per Share)
|
8-K
|
001-34568
|
10.1
|
3/3/2014
|
||||||
|
10.36
|
|
*
|
Form of 2015 Performance-Based Restricted Stock Unit Agreement (Cumulative Adjusted Net Income Per Share)
|
10-Q
|
001-34568
|
10.32
|
5/6/2015
|
||||||
|
10.37
|
|
*
|
Form of 2016 Performance-Based Restricted Stock Unit Agreement (Cumulative Operating Adjusted Net Income Per Share)
|
10-K
|
001-34568
|
10.34
|
2/18/2016
|
||||||
|
10.38
|
|
*
|
Form of 2017 Performance-Based Restricted Stock Unit Agreement (Cumulative Operating Adjusted Net Income Per Share)
|
X
|
|||||||||
|
21.1
|
|
Subsidiaries of KAR Auction Services, Inc.
|
X
|
||||||||||
|
23.1
|
|
Consent of KPMG LLP, Independent Registered Public Accounting Firm
|
X
|
||||||||||
121
|
|
|
Incorporated by Reference
|
|
||||||||||
|
Exhibit No.
|
Exhibit Description
|
Form
|
File No.
|
Exhibit
|
Filing
Date
|
Filed
Herewith
|
|||||||
|
31.1
|
|
|
Certification of Chief Executive Officer Pursuant to Section 302 of the Sarbanes-Oxley Act of 2002
|
|
|
|
|
X
|
|||||
|
31.2
|
|
|
Certification of Chief Financial Officer Pursuant to Section 302 of the Sarbanes-Oxley Act of 2002
|
|
|
|
|
X
|
|||||
|
32.1
|
|
|
Certification of Chief Executive Officer Pursuant to Section 906 of the Sarbanes-Oxley Act of 2002
|
|
|
|
|
X
|
|||||
|
32.2
|
|
|
Certification of Chief Financial Officer Pursuant to Section 906 of the Sarbanes-Oxley Act of 2002
|
|
|
|
|
X
|
|||||
|
101.INS
|
|
XBRL Instance Document
|
|
|
|
|
X
|
||||||
|
101.SCH
|
|
XBRL Taxonomy Extension Schema
|
|
|
|
|
X
|
||||||
|
101.CAL
|
|
XBRL Taxonomy Extension Calculation Linkbase
|
|
|
|
|
X
|
||||||
|
101.DEF
|
|
XBRL Taxonomy Extension Definition Linkbase
|
|
|
|
|
X
|
||||||
|
101.LAB
|
|
XBRL Taxonomy Extension Label Linkbase
|
|
|
|
|
X
|
||||||
|
101.PRE
|
|
XBRL Taxonomy Extension Presentation Linkbase
|
|
|
|
|
X
|
||||||
_______________________________________________________________________________
|
^
|
Portions of this exhibit have been redacted pursuant to a request for confidential treatment filed separately with the Secretary of the Securities and Exchange Commission pursuant to Rule 406 under the Securities Act of 1933, as amended.
|
|
*
|
Denotes management contract or compensation plan, contract or arrangement.
|
122
TABLE OF CONTENTS
Part IItem 1. BusinessItem 1A. Risk FactorsItem 1B. Unresolved Staff CommentsItem 2. PropertiesItem 3. Legal ProceedingsPart IIItem 5. Market For Registrant's Common Equity, Related Stockholder Matters and Issuer Purchases Of Equity SecuritiesItem 6. Selected Financial DataItem 7. Management's Discussion and Analysis Of Financial Condition and Results Of OperationsItem 7A. Quantitative and Qualitative Disclosures About Market RiskItem 8. Financial Statements and Supplementary DataNote 1 Organization and Other MattersNote 2 Summary Of Significant Accounting PoliciesNote 3 Acquisitions and Equity Method InvestmentNote 4 Stock and Stock-based Compensation PlansNote 5 Net Income Per ShareNote 6 Allowance For Credit Losses and Doubtful AccountsNote 7 Finance Receivables and Obligations Collateralized By Finance ReceivablesNote 8 Goodwill and Other Intangible AssetsNote 9 Property and EquipmentNote 10 Self Insurance and Retained Loss ReservesNote 11 Long-term DebtNote 12 Financial InstrumentsNote 13 Leasing AgreementsNote 14 Income TaxesNote 15 Employee Benefit PlansNote 16 Commitments and ContingenciesNote 17 Accumulated Other Comprehensive LossNote 18 Segment InformationNote 19 Quarterly Financial Data (unaudited)Item 9. Changes in and Disagreements with Accountants on Accounting and Financial DisclosureItem 9A. Controls and ProceduresItem 9B. Other InformationPart IIIItem 10. Directors, Executive Officers and Corporate GovernanceItem 11. Executive CompensationItem 12. Security Ownership Of Certain Beneficial Owners and Management and Related Stockholder MattersItem 13. Certain Relationships and Related Transactions, and Director IndependenceItem 14. Principal Accounting Fees and ServicesPart IVItem 15. Exhibits, Financial Statement Schedules