KB HOME
10-Ks and 10-Qs
|
|
|
|
|
|
|
|
|
|
|
|
|
|
|
|
|
|
|
|
|
|
|
|
|
|
|
|
|
|
|
|
|
|
|
|
|
|
|
|
|
|
|
|
|
|
|
|
|
|
|
|
|
|
|
|
|
|
|
UNITED STATES
SECURITIES AND EXCHANGE COMMISSION
Washington, D.C. 20549
Form 10-K
ý
ANNUAL REPORT PURSUANT TO SECTION 13 OR 15(d) OF THE SECURITIES EXCHANGE ACT OF 1934
For the fiscal year ended
November 30, 2013
or
¨
TRANSITION REPORT PURSUANT TO SECTION 13 OR 15(d) OF THE SECURITIES EXCHANGE ACT OF 1934
For the transition period from
to
.
Commission File No. 001-09195
KB HOME
(Exact name of registrant as specified in its charter)
|
Delaware
|
95-3666267
|
|
(State or other jurisdiction of
incorporation or organization)
|
(I.R.S. Employer
Identification No.)
|
10990 Wilshire Boulevard, Los Angeles, California 90024
(Address of principal executive offices) (Zip Code)
Registrant’s telephone number, including area code: (310) 231-4000
Securities Registered Pursuant to Section 12(b) of the Act:
|
Title of each class
|
Name of each exchange
on which registered
|
|
Common Stock (par value $1.00 per share)
|
New York Stock Exchange
|
|
Rights to Purchase Series A Participating Cumulative Preferred Stock
|
New York Stock Exchange
|
Securities Registered Pursuant to Section 12(g) of the Act: None
Indicate by check mark if the registrant is a well-known seasoned issuer, as defined in Rule 405 of the Securities Act. Yes
ý
No
¨
Indicate by check mark if the registrant is not required to file reports pursuant to Section 13 or Section 15(d) of the Act. Yes
¨
No
ý
Indicate by check mark whether the registrant (1) has filed all reports required to be filed by Section 13 or 15(d) of the Securities Exchange Act of 1934 during the preceding 12 months (or for such shorter period that the registrant was required to file such reports), and (2) has been subject to such filing requirements for the past 90 days. Yes
ý
No
¨
Indicate by check mark whether the registrant has submitted electronically and posted on its corporate Web site, if any, every Interactive Data File required to be submitted and posted pursuant to Rule 405 of Regulation S-T during the preceding 12 months (or for such shorter period that the registrant was required to submit and post such files). Yes
ý
No
¨
Indicate by check mark if disclosure of delinquent filers pursuant to Item 405 of Regulation S-K is not contained herein, and will not be contained, to the best of registrant’s knowledge, in definitive proxy or information statements incorporated by reference in Part III of this Form 10-K or any amendment to this Form 10-K.
ý
Indicate by check mark whether the registrant is a large accelerated filer, an accelerated filer, a non-accelerated filer, or a smaller reporting company. See the definitions of “large accelerated filer,” “accelerated filer” and “smaller reporting company” in Rule 12b-2 of the Exchange Act.
Large accelerated filer
ý
Accelerated filer
¨
Non-accelerated filer
¨
Smaller reporting company
¨
Indicate by check mark whether the registrant is a shell company (as defined in Rule 12b-2 of the Exchange Act). Yes
¨
No
ý
The aggregate market value of voting stock held by non-affiliates of the registrant on May 31, 2013 was
$2,089,096,838
, including 10,559,844 shares held by the registrant’s grantor stock ownership trust and excluding 21,017,450 shares held in treasury.
There were
83,744,528
shares of the registrant’s common stock, par value $1.00 per share, outstanding on December 31, 2013. The registrant’s grantor stock ownership trust held an additional
10,501,844
shares of the registrant’s common stock on that date.
Documents Incorporated by Reference
Portions of the registrant’s definitive Proxy Statement for the 2014 Annual Meeting of Stockholders (incorporated into Part III).
KB HOME
FORM 10-K
FOR THE YEAR ENDED
NOVEMBER 30, 2013
TABLE OF CONTENTS
|
|
|
Page
Number
|
|
Item 1.
|
||
|
Item 1A.
|
||
|
Item 1B.
|
||
|
Item 2.
|
||
|
Item 3.
|
||
|
Item 4.
|
||
|
Item 5.
|
||
|
Item 6.
|
||
|
Item 7.
|
||
|
Item 7A.
|
||
|
Item 8.
|
||
|
Item 9.
|
||
|
Item 9A.
|
||
|
Item 9B.
|
||
|
Item 10.
|
||
|
Item 11.
|
||
|
Item 12.
|
||
|
Item 13.
|
||
|
Item 14.
|
||
|
Item 15.
|
||
|
Item 1.
|
BUSINESS
|
General
KB Home is one of the largest and most recognized homebuilding companies in the U.S. and has been building homes for more than 50 years. We construct and sell homes through our operating divisions under the name KB Home. Unless the context indicates otherwise, the terms “we,” “our” and “us” used in this report refer to KB Home, a Delaware corporation, and its predecessors and subsidiaries.
Beginning in 1957 and continuing until 1986, our business was conducted by various subsidiaries of Kaufman and Broad, Inc. (“KBI”) and its predecessors. In 1986, KBI transferred all of its homebuilding and mortgage banking operations to us. Shortly after the transfer, we completed an initial public offering of 8% of our common stock and began operating under the name Kaufman and Broad Home Corporation. In 1989, we were spun-off from KBI, which then changed its name to Broad Inc., and we became an independent public company, operating primarily in California and France. In 2001, we changed our name to KB Home. Today, having sold our French operations in 2007, we operate a homebuilding and financial services business serving homebuyers in various markets across the U.S.
Our homebuilding operations offer a variety of new homes designed primarily for first-time, move-up and active adult homebuyers, including attached and detached single-family residential homes, townhomes and condominiums. We offer homes in development communities, at urban in-fill locations and as part of mixed-use projects. In this report, we use the term “home” to refer to a single-family residence, whether it is a single-family home or other type of residential property, and we use the term “community” to refer to a single development in which homes are constructed as part of an integrated plan.
Through our four homebuilding reporting segments, we delivered
7,145
homes at an average selling price of
$291,700
during the year ended
November 30, 2013
, compared to
6,282
homes delivered at an average selling price of
$246,500
during the year ended
November 30, 2012
. Our homebuilding operations represent most of our business, accounting for 99.4% of our total revenues in
2013
and 99.3% of our total revenues in
2012
.
Our financial services reporting segment offers property and casualty insurance and, in certain instances, earthquake, flood and personal property insurance to our homebuyers
in the same markets where we build homes
and provides title services in the majority of our markets located
within our Central and Southeast homebuilding reporting segments.
In addition, since the third quarter of 2011, this segment has earned revenues pursuant to the terms of a marketing services agreement with a preferred mortgage lender that offers mortgage banking services, including mortgage loan originations, to our homebuyers
. Our financial services operations accounted for .6% of our total revenues in
2013
and .7% of our total revenues in
2012
.
In the year ended November 30,
2013
, we generated total revenues of
$2.10 billion
and net income of
$40.0 million
, compared to total revenues of
$1.56 billion
and a net loss of
$59.0 million
in the year ended November 30,
2012
.
Our principal executive offices are located at 10990 Wilshire Boulevard, Los Angeles, California 90024. The telephone number of our corporate headquarters is (310) 231-4000 and our primary website address is www.kbhome.com. In addition, community location and information is available at (888) KB-HOMES.
Markets
Reflecting the geographic reach of our homebuilding business, as of the date of this report, our ongoing principal operations are in the 10 states and 40 major markets presented below. We also operate in various submarkets within these major markets. From time to time, we refer to these markets and submarkets collectively as our “served markets.” For reporting purposes, we organize our homebuilding operations into four segments — West Coast, Southwest, Central and Southeast.
1
|
Segment
|
State(s)
|
Major Market(s)
|
||
|
West Coast
|
California
|
Contra Costa County, Fresno, Los Angeles, Madera, Oakland, Orange County, Riverside, Sacramento, San Bernardino, San Diego, San Francisco, San Jose, Santa Rosa-Petaluma, Stockton, Vallejo, Ventura and Yuba City
|
||
|
Southwest
|
Arizona
|
Phoenix and Tucson
|
||
|
Nevada
|
Las Vegas and Reno
|
|||
|
New Mexico
|
Albuquerque
|
|||
|
Central
|
Colorado
|
Denver
|
||
|
Texas
|
Austin, Dallas, Fort Worth, Houston and San Antonio
|
|||
|
Southeast
|
Florida
|
Daytona Beach, Jacksonville, Lakeland, Orlando, Palm Coast, Punta Gorda, Sarasota, Sebastian-Vero Beach and Tampa
|
||
|
Maryland
|
Rockville
|
|||
|
North Carolina
|
Raleigh
|
|||
|
Virginia
|
Washington, D.C.
|
|||
Segment Operating Information.
The following table presents certain operating information for our homebuilding reporting segments for the years ended
November 30, 2013
,
2012
and
2011
:
|
|
Years Ended November 30,
|
||||||||||
|
|
2013
|
2012
|
2011
|
||||||||
|
West Coast:
|
|||||||||||
|
Homes delivered
|
2,179
|
|
1,945
|
|
1,757
|
|
|||||
|
Percentage of total homes delivered
|
31
|
%
|
31
|
%
|
30
|
%
|
|||||
|
Average selling price
|
$
|
467,800
|
|
$
|
388,300
|
|
$
|
335,500
|
|
||
|
Total revenues (in millions) (a)
|
$
|
1,020.2
|
|
$
|
755.3
|
|
$
|
589.4
|
|
||
|
Southwest:
|
|||||||||||
|
Homes delivered
|
738
|
|
683
|
|
843
|
|
|||||
|
Percentage of total homes delivered
|
10
|
%
|
11
|
%
|
15
|
%
|
|||||
|
Average selling price
|
$
|
237,500
|
|
$
|
193,900
|
|
$
|
165,800
|
|
||
|
Total revenues (in millions) (a)
|
$
|
175.3
|
|
$
|
132.4
|
|
$
|
139.9
|
|
||
|
Central:
|
|||||||||||
|
Homes delivered
|
2,841
|
|
2,566
|
|
2,155
|
|
|||||
|
Percentage of total homes delivered
|
40
|
%
|
41
|
%
|
37
|
%
|
|||||
|
Average selling price
|
$
|
198,900
|
|
$
|
170,100
|
|
$
|
171,500
|
|
||
|
Total revenues (in millions) (a)
|
$
|
565.1
|
|
$
|
436.4
|
|
$
|
369.7
|
|
||
|
Southeast:
|
|||||||||||
|
Homes delivered
|
1,387
|
|
1,088
|
|
1,057
|
|
|||||
|
Percentage of total homes delivered
|
19
|
%
|
17
|
%
|
18
|
%
|
|||||
|
Average selling price
|
$
|
233,900
|
|
$
|
206,200
|
|
$
|
195,500
|
|
||
|
Total revenues (in millions)
|
$
|
324.4
|
|
$
|
224.3
|
|
$
|
206.6
|
|
||
|
Total:
|
|||||||||||
|
Homes delivered
|
7,145
|
|
6,282
|
|
5,812
|
|
|||||
|
Average selling price
|
$
|
291,700
|
|
$
|
246,500
|
|
$
|
224,600
|
|
||
|
Total revenues (in millions) (a)
|
$
|
2,085.0
|
|
$
|
1,548.4
|
|
$
|
1,305.6
|
|
||
|
(a)
|
Total revenues include revenues from housing and land sales.
|
2
Unconsolidated Joint Ventures.
The above table does not include homes delivered or revenues from unconsolidated joint ventures in which we participate. These unconsolidated joint ventures acquire and develop land in various markets where our homebuilding operations are located and, in some cases, build and deliver homes on the land developed.
Strategy
Since 1997, we have followed the principles of an operational business model that we call KBnxt. KBnxt provides the core framework under which we have established the primary operational and strategic goals for our homebuilding business. We believe the principles of KBnxt set us apart from other large-production homebuilders and provide the foundation for our long-term growth.
KBnxt
. With KBnxt, we seek to generate improved operating efficiencies and return on investment through a disciplined, fact-based and process-driven approach to homebuilding that is founded on a constant and systematic assessment of consumer preferences and market opportunities. The key principles of KBnxt include the following:
|
•
|
gaining a detailed understanding of consumer location and home design and interior/exterior design option preferences through regular surveys and research. In this report and elsewhere, we refer to our home designs and design options as our “products;”
|
|
•
|
managing our working capital and reducing our operating risks by acquiring primarily developed and entitled land at reasonable prices in preferred markets and submarkets that meet our investment return standards and market positioning (or “marketing”) strategy;
|
|
•
|
using our knowledge of consumer preferences to design, offer, construct and deliver products that meet the desires of the largest demographic of homebuyers in our served markets. Historically, this demographic has been comprised of first-time and move-up buyers;
|
|
•
|
in general, commencing construction of a home only after a purchase contract has been signed and preliminary credit approval or other evidence of financial ability to purchase the home has been obtained;
|
|
•
|
building a backlog of orders and minimizing the cycle time from initial construction to delivery of homes to customers;
|
|
•
|
establishing an even flow production of high-quality homes at the lowest possible cost; and
|
|
•
|
offering customers affordable base prices and the opportunity to customize their homes through the choice of lot location within a community, as well as choices of various elevations and floor plans and numerous design options available at our KB Home Studios.
|
While we consider KBnxt to be integral to our success in the homebuilding industry, there can be market-driven circumstances where we believe it is necessary or appropriate to temporarily deviate from certain of its principles. For example, at times we may be unable to maintain an even flow production of homes in a particular area because of slow net order activity. Also, in specific targeted communities with strong demand, we may start construction on a small number of homes before a corresponding purchase contract is signed to more quickly meet the delivery expectations of homebuyers and generate revenues. In some land constrained submarkets, or in submarkets experiencing significant homebuilding activity, we may acquire undeveloped or unentitled land parcels that otherwise fit with our marketing strategy and meet our investment return standards. Other circumstances may arise in the future that lead us to make specific short-term shifts from the principles of KBnxt.
Strategic and Operational Focus
. Guided by KBnxt, over the last few years we have broadly transformed the scope, scale and orientation of our business both geographically and operationally, compared to where it stood prior to the severe and prolonged housing market downturn that began in mid-2006. We did this largely by focusing on three integrated strategic goals:
|
•
|
achieving and maintaining profitability at the scale of prevailing market conditions;
|
|
•
|
generating cash and strengthening our balance sheet; and
|
|
•
|
positioning our business to capitalize on future growth opportunities.
|
In executing on these strategic goals, we shifted resources from underperforming areas to markets and submarkets offering perceived higher growth prospects, particularly land constrained locations in coastal areas of California, in order to maintain a solid growth platform; implemented measures to generate and conserve cash and bolster our balance sheet, including reduced spending, asset sales, opportunistic capital market transactions, and continuous efforts to improve our operating efficiencies and lower our overhead costs; and redesigned and re-engineered our products. Although we generally experienced declines in net
3
orders and revenues, and generated losses during this period, we believe our actions since the onset of the housing downturn have strengthened our ability to adapt to changing housing market dynamics and positioned us well for future growth.
In 2013, we saw continued progress in the housing recovery that had begun to take shape in 2012, and we shifted our priorities to focus on improving profitability per home delivered and generating revenue growth within our current operational footprint through a number of strategic growth initiatives that are discussed below under “Part II — Item 7. Management’s Discussion and Analysis of Financial Condition and Results of Operations.” As in 2012, we aggressively invested in land and land development and continued to evolve our community mix toward higher-performing, desirable locations in land constrained growth markets and our product offerings to meet changing consumer preferences. Increasing profitability per home delivered and executing on operational measures to grow revenues will continue to be our top priorities in 2014 as we seek to improve on our performance for 2013.
Based on our expectation that the healthier housing environment of the past two years will generally continue in 2014, we intend to pursue the following operational objectives, subject to conditions in the housing markets, the overall economy and the capital, credit and financial markets:
|
•
|
Active and Targeted Land Investment
: Owning or controlling a forecasted three-to-five year base supply of developed or developable land subject to our investment return and marketing standards, and accelerating our land development activities, predominantly in high-performing, choice locations. We invested approximately
$1.14 billion
in land and land development in 2013 and approximately
$565 million
in 2012. This investment orientation yielded improved year-over-year results in 2013, contributing to higher revenues, average selling prices and housing gross profit margins. This was particularly the case in our West Coast homebuilding reporting segment, where our ongoing investment concentration toward coastal submarkets in California has positioned us to open new home communities for sales in 2014 in areas and with products that we believe will appeal to more affluent buyers who desire larger homes and purchase more design options and features at our KB Home Studios.
|
In addition, we are pursuing opportunities to activate certain inventory previously held for future development in markets where improved conditions support such action. In 2012, we identified 21 communities for activation, primarily in Florida and Arizona, representing more than 1,000 lots, and delivered 293 homes from these communities in 2013. In 2013, we identified 20 communities for activation, primarily in California and Texas, representing approximately 1,700 lots. We expect to deliver homes and to realize the associated revenues from these activated assets in 2014.
Our community count at November 30, 2013 increased to
191
from
172
at November 30, 2012, largely as a result of the investments in land and land development we have made over the last few years. We use the term “community count” to refer to the number of new home communities with at least five homes/lots left to sell at the end of a reporting period.
|
•
|
Net Order Growth
: Optimizing our assets by increasing revenues per new home community open for sales through an intense focus on balancing sales pace and selling prices. In addition, expanding our overall average selling price with, among other things, incremental gains from lot location, floor plan, home exterior elevation, structural and other premiums and additional sales of design options. Our approach is simple — provide the best combination of value, quality and choice in homes and design options in attractive locations along with attentive service to our customers — and is at the core of our distinct Built to Order™ homebuying experience. With Built to Order, we offer homebuyers affordable base prices and, unlike many other large-production homebuilders, the opportunity to significantly customize the floor plans and design options for their new home.
|
|
•
|
Organizational and Production Efficiency
: Continuously enhancing our performance and taking steps to improve our housing gross profit margins by aligning our management resources, personnel levels and overhead costs with our growth platform, home delivery expectations and business needs, and by streamlining and constantly improving, to the extent possible, our home construction process and operational activities. In addition to even flow production scheduling, our home construction process includes developing and refining a set of value-engineered home designs in ways that allow us to meet the needs of our primary customer base in a variety of different markets, shorten cycle times and lower direct construction costs. It also includes taking advantage of economies of scale in contracting for building materials and skilled trade labor, and leveraging our organizational infrastructure in our served markets.
|
Promotional Marketing Strategy
. Our promotional marketing efforts are centered on differentiating the KB Home brand in the minds of our primary customer base from resale homes and from new homes sold by other homebuilders. These efforts increasingly involve using interactive Internet-based applications, social media outlets and other evolving communications technologies. We believe that our Built to Order message and experience generate a high perceived value for our products and our company among consumers and real estate professionals, and are unique among large-production homebuilders. In marketing our Built to Order approach, we emphasize how we partner with our homebuyers to create a home built to their individual preferences in design, floor plan, elevation, square footage and lot location, and give them the ability to significantly customize their home
4
with structural and design options that suit their needs and interests. In essence, Built to Order serves as the consumer face of core elements of KBnxt and is designed to ensure that our promotional marketing strategy and advertising campaigns are closely aligned with our overall operational focus. For greater consistency within our promotional marketing messages and in the execution of our Built to Order approach, the selling of our homes is carried out by in-house teams of sales representatives, design consultants and other personnel who work personally with each homebuyer to create a home that meets the homebuyer’s preferences and budget. In 2013, to further enhance our sales process, we began implementing a new design for our sales offices at communities we opened for sales during the year, reflecting a more contemporary look and technology to better engage with our homebuyers. We plan to continue to implement the new design for our sales offices in 2014.
Our KB Home Studios are a key component of the Built to Order experience we offer to our homebuyers and help increase the revenues we generate from home sales. These showrooms, which are generally centrally located within our market geographies, allow our homebuyers to customize their home by selecting from a wide variety of design options that are available at no-cost or for purchase as part of the original construction of their home. The coordinated efforts of our sales representatives and KB Home Studio consultants are intended to generate higher customer satisfaction and lead to enhanced customer retention and referrals.
Sustainability
. We have made a dedicated effort to further differentiate ourselves from other homebuilders and resale homes through our ongoing commitment to become a leading national company in environmental sustainability. Under this commitment, we:
|
•
|
refine our products and construction process to limit the materials needed to build our homes, and continuously look at ways to reduce construction and office waste;
|
|
•
|
build all of our new homes to the U.S. Environmental Protection Agency’s (“EPA”) ENERGY STAR® Version 3 standards;
|
|
•
|
build an increasing percentage of our homes to meet the U.S. EPA’s Watersense® specifications for water use efficiency;
|
|
•
|
build our homes with Watersense labeled fixtures;
|
|
•
|
seek out and utilize innovative technologies and systems to further improve the energy and water efficiency of our homes;
|
|
•
|
engage in campaigns and other educational efforts, sometimes together with other organizations and groups, to increase consumer awareness of the importance and impact of sustainability in selecting a home and the products within a home;
|
|
•
|
developed an Energy Performance Guide®, or EPG®, that informs our homebuyers of the relative energy efficiency and the related estimated monthly energy costs and potential energy cost savings of each of our homes as designed, compared to typical new and existing homes; and
|
|
•
|
created and are adding more net-zero energy design options, under a program called ZeroHouse 2.0™, that are available in select markets.
|
This commitment and the related initiatives we have implemented stem, in part, from growing sensitivities and regulatory attention to the potential impact that the construction and use of homes can have on the environment, including on the consumption of energy and water resources. They also reflect our efforts to balance these concerns with our homebuyers’ interest in affordable homes and in lowering their utility bills and total cost of homeownership on a long-term basis. More information about our sustainability commitment can be found in our annual sustainability reports, which we have published on our website since 2008. To date, we are the only national homebuilder to publish a comprehensive annual sustainability report. As we see environmental issues related to housing becoming increasingly important to consumers and government authorities at all levels, we intend to continue to research, evaluate and utilize new or improved products and construction and business practices consistent with our commitment. In addition to making good business sense, we believe our sustainability initiatives can help put us in a better position, compared to resale homes and homebuilders with less-developed programs, to comply with evolving local, state and federal rules and regulations intended to protect natural resources and to address climate change and similar environmental concerns.
Customer Service and Quality Control
Our goal is for our customers to be 100% satisfied with their new homes. Our on-site construction supervisors perform regular pre-closing quality checks and our sales representatives maintain regular contact with our homebuyers during the home construction process in an effort to ensure our homes meet our standards and our homebuyers’ expectations. We believe our prompt and courteous responses to homebuyers’ needs throughout the homebuying process help reduce post-closing repair costs, enhance our reputation for quality and service, and help encourage repeat and referral business from homebuyers and the real estate community. We also have employees who are responsible for responding to homebuyers’ post-closing needs, including warranty claims.
5
We provide a limited warranty on all of our homes. The specific terms and conditions vary depending on the markets where we do business. We generally provide a structural warranty of 10 years, a warranty on electrical, heating, cooling, plumbing and certain other building systems each varying from two to five years based on geographic market and state law, and a warranty of one year for other components of a home.
Local Expertise
To maximize KBnxt’s effectiveness and help ensure its consistent execution, our employees are continuously trained on KBnxt principles and are evaluated, in part, based on their achievement of relevant operational objectives. We also believe that our business requires in-depth knowledge of local markets in order to acquire land in preferred locations consistent with our investment return and marketing standards and on favorable terms, to engage subcontractors, to develop new home communities and offer products that meet local demand, to anticipate consumer tastes in specific markets, and to assess local regulatory environments. Accordingly, we operate our business through divisions with experienced management teams and trained personnel who have local market expertise. Though we centralize certain functions (such as promotional marketing, legal, purchasing administration, product development, architecture and accounting) to benefit from economies of scale, our local management exercises considerable autonomy in identifying land acquisition opportunities, developing and implementing product and sales strategies, and controlling costs.
Community Development and Land Inventory Management
Our community development process generally consists of four phases: land acquisition, land development, home construction and delivery of completed homes. Historically, our community development process has ranged from six to 24 months in our West Coast homebuilding reporting segment, with a somewhat shorter duration in our other homebuilding reporting segments. The community development process varies based on, among other things, the extent of government approvals required, the overall size of a particular community, necessary site preparation activities, the type of product(s) that will be offered, weather conditions, promotional marketing results, consumer demand and local and general economic and housing market conditions.
Although they vary significantly in size and complexity, our new home communities typically consist of 30 to 250 lots ranging in size from 1,900 to 20,000 square feet. In our communities, we typically offer from three to 15 home design choices. We also generally build one to three model homes at each community so that prospective buyers can preview various products available. Depending on the community, we may offer premium lots containing more square footage, better views and/or location benefits. A few of our communities consist of a single multiple-story structure that encompasses several attached condominium-style units.
The following table summarizes our average community count by homebuilding reporting segment:
|
For the Years Ended November 30,
|
West Coast
|
Southwest
|
Central
|
Southeast
|
Total
|
||||||||||
|
2013
|
41
|
|
18
|
|
82
|
|
41
|
|
182
|
|
|||||
|
2012
|
53
|
|
14
|
|
81
|
|
32
|
|
180
|
|
|||||
Land Acquisition and Land Development.
We continuously evaluate land acquisition opportunities against our investment return and marketing standards, balancing competing needs for financial strength, liquidity and land inventory for future growth. In many cases, we are able to leverage our long-standing business relationships and reputation with local land sellers, our financial resources and our steady operating history to secure opportunities ahead of other homebuilders, developers or investors. When we acquire land, we generally focus on land parcels containing fewer than 250 lots that are fully entitled for residential construction and are either physically developed to start home construction (referred to as “finished lots”) or partially finished. Acquiring finished or partially finished lots enables us to construct and deliver homes with minimal additional development work or expenditures. We believe this is a more efficient way to use our working capital and reduces the operating risks associated with having to develop and/or entitle land, such as unforeseen improvement costs and/or changes in market conditions. However, depending on market conditions and available opportunities, including opportunities to secure certain finished lots or property in land constrained or very active submarkets, we may acquire undeveloped and/or unentitled land. We may also invest in projects that require us to re-purpose and re-entitle property for residential use, such as in-fill developments. We expect that the overall balance of undeveloped, unentitled, entitled, partially finished and finished lots in our inventory will vary over time, and in implementing our strategic growth initiatives, we may acquire a greater proportion of undeveloped or unentitled land in the future.
Consistent with KBnxt, we target geographic areas for potential land acquisitions and community development based on the results of periodic surveys of both new and resale homebuyers in particular markets, prevailing local economic conditions, the supply and type of homes available for sale, and other research activities. Local, in-house land acquisition specialists analyze specific geographic areas to identify desirable land acquisition targets or to evaluate whether to dispose of an existing land interest.
6
We also use studies performed by third-party specialists. Using this internal and external data, some of the factors we consider in evaluating land acquisition targets are consumer preferences; general economic conditions; prevailing and expected home sales activity and the selling prices and pricing trends of comparable new and resale homes in the subject submarket; proximity to metropolitan areas and employment centers; population, household formation, demographic, and employment and commercial growth patterns; household income levels; availability of developable land parcels at reasonable cost, including estimated costs of completing land development and selling homes; our operational scale and experience in the subject submarket; and regulatory and environmental compliance matters.
We generally structure our land acquisition and land development activities to minimize, or to defer the timing of, expenditures, which improves our returns associated with land-related investments. While we use a variety of techniques to accomplish this, we typically use contracts that give us an option or similar right to acquire land at a future date, usually at a pre-determined price and for a small initial option or earnest money deposit payment. These contracts may also permit us to partially develop the underlying land prior to our acquisition and/or condition our acquisition obligation on our satisfaction with the feasibility of developing the subject land and selling homes on the land by a certain future date. We refer to land subject to such option or similar rights as being “controlled.” Our decision to exercise a particular land option or similar right is based on the results of due diligence and continued market viability analysis we conduct after entering into such a contract. In some cases, our decision to exercise a land option or similar right may be conditioned on the land seller obtaining necessary entitlements, such as zoning rights and environmental and development approvals, and/or physically developing the underlying land by a pre-determined date.
Our land option contracts and other similar contracts may also allow us to phase our land acquisitions and/or land development over a period of time and/or upon the satisfaction of certain conditions. We may also acquire land with seller financing that is non-recourse to us, or by working in conjunction with third-party land developers or other parties. The use of these land option contracts and other similar contracts generally allows us to reduce the market risks associated with direct land ownership and development, and to reduce our capital and financial commitments, including interest and other carrying costs.
Our land option contracts and other similar contracts generally do not contain provisions requiring our specific performance. However, depending on the circumstances, our initial option or earnest money deposit may or may not be refundable to us if we abandon the related land option contract or other similar contract and do not complete the acquisition of the underlying land. In addition, if we abandon a land option contract or other similar contract, we usually cannot recover the pre-acquisition costs we incurred after we entered into the contract, including those related to our due diligence and other evaluation activities and/or partial development of the subject land, if any.
Before we commit to any land acquisition, our senior corporate and regional management evaluate the asset based on the results of our local specialists’ due diligence, third-party data and a set of defined financial measures, including, but not limited to, housing gross profit margin analyses and specific discounted, after-tax cash flow internal rate of return requirements. The criteria guiding our land acquisition and disposition decisions have resulted in our maintaining inventory in areas that we believe generally offer better returns for lower risk and lower our upfront investment in inventory.
Our inventories include land we are holding for future development, which is comprised of land where we have suspended development activity or development has not yet begun but is expected to occur in the future. These assets held for future development are located in various submarkets where conditions do not presently support further investment or development, or are subject to a building permit moratorium or regulatory restrictions, or are portions of larger land parcels that we plan to build out over several years and/or that have not yet been entitled and, therefore, have an extended development timeline. We may also suspend development activity if we believe it will result in greater returns and/or maximize the economic performance of a community by delaying improvements for a period of time to allow earlier phases of a long-term, multi-phase community or a neighboring community to generate sales momentum or for market conditions to improve. We resume development activity when we believe our investment in this inventory will be optimized or, in some instances, to accelerate sales pace and/or our return on investment, and we have activated assets previously held for future development in certain markets as part of our strategic growth initiatives.
The following table presents the number of inventory lots we owned, in various stages of development, or controlled under land option contracts or other similar contracts by homebuilding reporting segment as of
November 30, 2013
and
2012
. The table does not include approximately 10 acres we owned as of
November 30, 2013
and approximately 326 acres we owned as of
November 30, 2012
that were not expected to be approved for subdivision into lots in the respective period.
7
|
Homes Under
Construction and Land
Under Development
|
Land Held for Future
Development
|
Land Under
Option
|
Total Land
Owned or
Under Option
|
||||||||||||||||||||
|
|
2013
|
2012
|
2013
|
2012
|
2013
|
2012
|
2013
|
2012
|
|||||||||||||||
|
West Coast
|
4,414
|
|
2,899
|
|
3,348
|
|
3,936
|
|
4,850
|
|
3,613
|
|
12,612
|
|
10,448
|
|
|||||||
|
Southwest
|
2,318
|
|
1,275
|
|
7,552
|
|
7,743
|
|
2,347
|
|
534
|
|
12,217
|
|
9,552
|
|
|||||||
|
Central
|
10,873
|
|
7,859
|
|
1,451
|
|
2,055
|
|
10,482
|
|
4,612
|
|
22,806
|
|
14,526
|
|
|||||||
|
Southeast
|
3,734
|
|
1,922
|
|
4,665
|
|
4,934
|
|
5,061
|
|
3,370
|
|
13,460
|
|
10,226
|
|
|||||||
|
Total
|
21,339
|
|
13,955
|
|
17,016
|
|
18,668
|
|
22,740
|
|
12,129
|
|
61,095
|
|
44,752
|
|
|||||||
Reflecting our geographic diversity and relatively balanced operational footprint, as of
November 30, 2013
,
21%
of the inventory lots we owned or controlled were located in our West Coast homebuilding reporting segment,
20%
were in our Southwest homebuilding reporting segment,
37%
were in our Central homebuilding reporting segment and
22%
were in our Southeast homebuilding reporting segment.
The following table presents the carrying value of inventory we owned, in various stages of development, or controlled under land option contracts or other similar contracts by homebuilding reporting segment as of
November 30, 2013
and
2012
(in thousands):
|
|
Homes Under
Construction and Land
Under Development
|
Land Held for Future
Development
|
Land Under
Option
|
Total Land
Owned or
Under Option
|
|||||||||||||||||||||||||||
|
|
2013
|
2012
|
2013
|
2012
|
2013
|
2012
|
2013
|
2012
|
|||||||||||||||||||||||
|
West Coast
|
$
|
797,540
|
|
$
|
471,650
|
|
$
|
297,420
|
|
$
|
337,229
|
|
$
|
49,224
|
|
$
|
33,718
|
|
$
|
1,144,184
|
|
$
|
842,597
|
|
|||||||
|
Southwest
|
141,153
|
|
63,456
|
|
157,924
|
|
156,159
|
|
5,162
|
|
1,830
|
|
304,239
|
|
221,445
|
|
|||||||||||||||
|
Central
|
383,210
|
|
292,475
|
|
15,193
|
|
21,806
|
|
12,673
|
|
5,443
|
|
411,076
|
|
319,724
|
|
|||||||||||||||
|
Southeast
|
265,708
|
|
154,992
|
|
158,992
|
|
153,661
|
|
14,378
|
|
14,152
|
|
439,078
|
|
322,805
|
|
|||||||||||||||
|
Total
|
$
|
1,587,611
|
|
$
|
982,573
|
|
$
|
629,529
|
|
$
|
668,855
|
|
$
|
81,437
|
|
$
|
55,143
|
|
$
|
2,298,577
|
|
$
|
1,706,571
|
|
|||||||
Home Construction and Deliveries.
Following the acquisition of land and, if necessary, the development of the land into finished lots, we typically begin constructing model homes and marketing homes for sale. The time required for construction of our homes depends on the weather, time of year, availability of local skilled trade labor and building materials and other factors. To minimize the costs and risks of unsold homes in production, we generally begin construction of a home only when we have a signed purchase contract with a homebuyer and have obtained preliminary credit approval or other evidence of a homebuyer’s financial ability to purchase the home. However, cancellations of home purchase contracts prior to the delivery of the underlying homes, the construction of attached products with some unsold units, or specific strategic considerations will result in our having unsold homes in production.
We act as the general contractor for the majority of our communities and hire experienced subcontractors to supply the skilled trade labor and to procure some of the building materials required for all production activities. Our contracts with our subcontractors require that they comply with all laws applicable to their work, including labor laws, meet performance standards, and follow local building codes and permits. We have established national and regional purchasing programs for certain building materials, appliances, fixtures and other items to take advantage of economies of scale and garner better pricing and more reliable supply and, where available, participate in manufacturer or supplier rebate programs. At all stages of production, our administrative and on-site supervisory personnel oversee and coordinate the activities of subcontractors to meet our production schedules and quality standards.
Backlog
We sell our homes under standard purchase contracts, which generally require a homebuyer to pay a deposit at the time of signing. The amount of the deposit required varies among markets and communities. Homebuyers also may be required to pay additional deposits when they select design options for their homes. Most of our home purchase contracts stipulate that if a homebuyer cancels a contract with us, we have the right to retain the homebuyer’s deposits. However, we generally permit our homebuyers to cancel their obligations and obtain refunds of all or a portion of their deposits in the event mortgage financing cannot be obtained within a certain period of time, as specified in their contract. We define our cancellation rate for a given period as the total number of contracts for new homes canceled divided by the total new (gross) orders for homes during the same period. Our cancellation rate for the year was
32%
in
2013
, compared to a cancellation rate of
31%
in
2012
. Our cancellation rate was
8
36%
in the fourth quarter of
2013
, compared to
35%
in the fourth quarter of
2012
. Our cancellation rates and the factors affecting our cancellation rates are further discussed below under “Item 1A. Risk Factors” and “Part II — Item 7. Management’s Discussion and Analysis of Financial Condition and Results of Operations.”
Our “backlog” consists of homes that are under a home purchase contract but have not yet been delivered to a homebuyer. Ending backlog represents the number of homes in backlog from the previous period plus the number of net orders (new orders for homes less cancellations) generated during the current period minus the number of homes delivered during the current period. Our backlog at any given time will be affected by cancellations and by our community count. The number of homes we deliver has historically increased from the first to the fourth quarter in any year.
Our backlog at
November 30, 2013
consisted of
2,557
homes, essentially flat with the
2,577
homes in backlog at
November 30, 2012
. Our backlog at
November 30, 2013
represented potential future housing revenues of approximately
$682.5 million
, a
10%
increase from potential future housing revenues of approximately
$618.6 million
at
November 30, 2012
, primarily due to a higher overall average selling price. Our backlog conversion ratio, defined as homes delivered in a quarter as a percentage of backlog at the beginning of that quarter, will vary from quarter to quarter, depending on the number of homes in our backlog that are under construction, home construction pace, cancellations and the number of homes we sell and deliver within a quarter.
Our net orders for the year ended
November 30, 2013
increased to
7,125
from
6,703
for the year ended November 30,
2012
, marking the third consecutive year that full-year net orders have increased from the previous year. The value of the net orders we generated for the year ended November 30, 2013 increased
24%
to
$2.16 billion
from
$1.73 billion
for the prior year. Our net order value for a given period represents the potential future housing revenues associated with net orders and homebuyers’ design option choices for homes in backlog during the same period. Our net order value may be further impacted by changes related to cancellations and change orders between periods.
The following tables present homes delivered, net orders (number of net orders and value) and cancellation rates by homebuilding reporting segment for each quarter during the years ended
November 30, 2013
and
2012
, and our ending backlog (number of homes and value) at the end of each quarter within those years:
|
West Coast
|
Southwest
|
Central
|
Southeast
|
Total
|
|||||||||||||||
|
Homes delivered
|
|||||||||||||||||||
|
2013
|
|||||||||||||||||||
|
First
|
509
|
|
140
|
|
571
|
|
265
|
|
1,485
|
|
|||||||||
|
Second
|
594
|
|
211
|
|
637
|
|
355
|
|
1,797
|
|
|||||||||
|
Third
|
555
|
|
194
|
|
757
|
|
319
|
|
1,825
|
|
|||||||||
|
Fourth
|
521
|
|
193
|
|
876
|
|
448
|
|
2,038
|
|
|||||||||
|
Total
|
2,179
|
|
738
|
|
2,841
|
|
1,387
|
|
7,145
|
|
|||||||||
|
2012
|
|||||||||||||||||||
|
First
|
309
|
|
170
|
|
487
|
|
184
|
|
1,150
|
|
|||||||||
|
Second
|
330
|
|
157
|
|
536
|
|
267
|
|
1,290
|
|
|||||||||
|
Third
|
541
|
|
186
|
|
700
|
|
293
|
|
1,720
|
|
|||||||||
|
Fourth
|
765
|
|
170
|
|
843
|
|
344
|
|
2,122
|
|
|||||||||
|
Total
|
1,945
|
|
683
|
|
2,566
|
|
1,088
|
|
6,282
|
|
|||||||||
9
|
West Coast
|
Southwest
|
Central
|
Southeast
|
Total
|
|||||||||||||||
|
Net orders
|
|||||||||||||||||||
|
2013
|
|||||||||||||||||||
|
First
|
530
|
|
199
|
|
653
|
|
289
|
|
1,671
|
|
|||||||||
|
Second
|
587
|
|
189
|
|
968
|
|
418
|
|
2,162
|
|
|||||||||
|
Third
|
427
|
|
180
|
|
743
|
|
386
|
|
1,736
|
|
|||||||||
|
Fourth
|
371
|
|
188
|
|
663
|
|
334
|
|
1,556
|
|
|||||||||
|
Total
|
1,915
|
|
756
|
|
3,027
|
|
1,427
|
|
7,125
|
|
|||||||||
|
2012
|
|||||||||||||||||||
|
First
|
289
|
|
140
|
|
547
|
|
221
|
|
1,197
|
|
|||||||||
|
Second
|
600
|
|
229
|
|
900
|
|
320
|
|
2,049
|
|
|||||||||
|
Third
|
658
|
|
154
|
|
765
|
|
323
|
|
1,900
|
|
|||||||||
|
Fourth
|
619
|
|
140
|
|
485
|
|
313
|
|
1,557
|
|
|||||||||
|
Total
|
2,166
|
|
663
|
|
2,697
|
|
1,177
|
|
6,703
|
|
|||||||||
|
Net orders — value, in thousands
|
|||||||||||||||||||
|
2013
|
|||||||||||||||||||
|
First
|
$
|
261,342
|
|
$
|
43,706
|
|
$
|
133,492
|
|
$
|
68,263
|
|
$
|
506,803
|
|
||||
|
Second
|
292,769
|
|
49,246
|
|
198,621
|
|
99,002
|
|
639,638
|
|
|||||||||
|
Third
|
227,119
|
|
44,885
|
|
160,566
|
|
96,352
|
|
528,922
|
|
|||||||||
|
Fourth
|
194,888
|
|
53,248
|
|
144,255
|
|
89,311
|
|
481,702
|
|
|||||||||
|
Total
|
$
|
976,118
|
|
$
|
191,085
|
|
$
|
636,934
|
|
$
|
352,928
|
|
$
|
2,157,065
|
|
||||
|
2012
|
|||||||||||||||||||
|
First
|
$
|
112,232
|
|
$
|
24,907
|
|
$
|
94,452
|
|
$
|
45,938
|
|
$
|
277,529
|
|
||||
|
Second
|
235,299
|
|
44,577
|
|
155,521
|
|
67,673
|
|
503,070
|
|
|||||||||
|
Third
|
252,566
|
|
34,536
|
|
135,934
|
|
70,241
|
|
493,277
|
|
|||||||||
|
Fourth
|
259,159
|
|
30,986
|
|
98,738
|
|
70,387
|
|
459,270
|
|
|||||||||
|
Total
|
$
|
859,256
|
|
$
|
135,006
|
|
$
|
484,645
|
|
$
|
254,239
|
|
$
|
1,733,146
|
|
||||
10
|
West Coast
|
Southwest
|
Central
|
Southeast
|
Total
|
|||||||||||||||
|
Cancellation rates
|
|||||||||||||||||||
|
2013
|
|||||||||||||||||||
|
First
|
23
|
%
|
22
|
%
|
39
|
%
|
34
|
%
|
32
|
%
|
|||||||||
|
Second
|
20
|
|
23
|
|
32
|
|
22
|
|
27
|
|
|||||||||
|
Third
|
25
|
|
24
|
|
41
|
|
27
|
|
33
|
|
|||||||||
|
Fourth
|
29
|
|
25
|
|
44
|
|
31
|
|
36
|
|
|||||||||
|
Total
|
24
|
%
|
24
|
%
|
39
|
%
|
28
|
%
|
32
|
%
|
|||||||||
|
2012
|
|||||||||||||||||||
|
First
|
34
|
%
|
24
|
%
|
39
|
%
|
37
|
%
|
36
|
%
|
|||||||||
|
Second
|
24
|
|
17
|
|
28
|
|
28
|
|
26
|
|
|||||||||
|
Third
|
23
|
|
16
|
|
35
|
|
27
|
|
29
|
|
|||||||||
|
Fourth
|
25
|
|
21
|
|
47
|
|
31
|
|
35
|
|
|||||||||
|
Total
|
26
|
%
|
19
|
%
|
37
|
%
|
30
|
%
|
31
|
%
|
|||||||||
|
Ending backlog — homes
|
|||||||||||||||||||
|
2013
|
|||||||||||||||||||
|
First
|
705
|
|
242
|
|
1,231
|
|
585
|
|
2,763
|
|
|||||||||
|
Second
|
698
|
|
220
|
|
1,562
|
|
648
|
|
3,128
|
|
|||||||||
|
Third
|
570
|
|
206
|
|
1,548
|
|
715
|
|
3,039
|
|
|||||||||
|
Fourth
|
420
|
|
201
|
|
1,335
|
|
601
|
|
2,557
|
|
|||||||||
|
2012
|
|||||||||||||||||||
|
First
|
443
|
|
173
|
|
1,078
|
|
509
|
|
2,203
|
|
|||||||||
|
Second
|
713
|
|
245
|
|
1,442
|
|
562
|
|
2,962
|
|
|||||||||
|
Third
|
830
|
|
213
|
|
1,507
|
|
592
|
|
3,142
|
|
|||||||||
|
Fourth
|
684
|
|
183
|
|
1,149
|
|
561
|
|
2,577
|
|
|||||||||
|
Ending backlog — value, in thousands
|
|||||||||||||||||||
|
2013
|
|||||||||||||||||||
|
First
|
$
|
287,970
|
|
$
|
54,604
|
|
$
|
235,759
|
|
$
|
125,560
|
|
$
|
703,893
|
|
||||
|
Second
|
337,878
|
|
48,524
|
|
296,949
|
|
143,262
|
|
826,613
|
|
|||||||||
|
Third
|
276,031
|
|
48,646
|
|
315,900
|
|
167,906
|
|
808,483
|
|
|||||||||
|
Fourth
|
206,308
|
|
50,858
|
|
279,424
|
|
145,899
|
|
682,489
|
|
|||||||||
|
2012
|
|||||||||||||||||||
|
First
|
$
|
150,638
|
|
$
|
32,139
|
|
$
|
177,998
|
|
$
|
99,176
|
|
$
|
459,951
|
|
||||
|
Second
|
301,652
|
|
43,518
|
|
237,558
|
|
110,680
|
|
693,408
|
|
|||||||||
|
Third
|
327,528
|
|
40,727
|
|
251,900
|
|
124,589
|
|
744,744
|
|
|||||||||
|
Fourth
|
248,790
|
|
40,206
|
|
204,473
|
|
125,157
|
|
618,626
|
|
|||||||||
Land and Raw Materials
Based on our current strategic plans, we strive to own or control land sufficient to meet our forecasted production goals for the next three to five years. As discussed above under “Strategy,” in 2014 we intend to acquire additional land subject to conditions in housing markets, the overall economy and the capital, credit and financial markets. However, we may also decide to sell certain land or land interests as part of our marketing strategy or for other reasons.
11
The principal raw materials used in the construction of our homes are concrete and forest products. In addition, we use a variety of other construction materials in the homebuilding process, including drywall and plumbing and electrical items. We attempt to enhance the efficiency of our operations by using, where practical, standardized materials that are commercially available on competitive terms from a variety of sources. In addition, our national and regional purchasing programs for certain building materials, appliances, fixtures and other items allow us to benefit from large quantity purchase discounts and, where available, manufacturer or supplier rebates. When possible, we arrange for bulk purchases of these products at favorable prices from manufacturers and suppliers. Although our purchasing strategies have helped us in negotiating favorable prices for raw materials, in 2013, we encountered higher prices for lumber, drywall, concrete and other materials and for skilled trade labor, and we expect to see additional cost increases if and as the present housing recovery progresses, as discussed further below under “Competition, Seasonality, Delivery Mix and Other Factors.”
Customer Financing
Our homebuyers may obtain mortgage financing to purchase our homes from any lender or other provider of their choice. We do not directly offer mortgage banking services or originate residential consumer mortgage loans (“mortgage loans”) for our customers. Prior to late June 2011, KBA Mortgage, LLC (“KBA Mortgage”), an unconsolidated mortgage banking joint venture of a subsidiary of ours and a subsidiary of Bank of America, N.A., provided mortgage banking services to a significant proportion of our homebuyers. KBA Mortgage ceased offering mortgage banking services after June 30, 2011.
Since mid-2011, we have had a marketing services agreement with a preferred mortgage lender that offers mortgage banking services, including mortgage loan originations, to our homebuyers who elect to use the lender. The mortgage banking services are described further under “Part II — Item 7. Management’s Discussion and Analysis of Financial Condition and Results of Operations — Financial Services Reporting Segment.” At no time has our preferred mortgage lender or its respective parent company been an affiliate of ours or any of our subsidiaries. Except as discussed below, we have not had any ownership, joint venture or other interests in or with our preferred mortgage lender or its respective parent company or with respect to the revenues or income that may be generated from our preferred mortgage lender providing mortgage banking services to, or originating mortgage loans for, our homebuyers. Until the first quarter of 2012, our preferred mortgage lender was MetLife Home Loans, a division of MetLife Bank, N.A., which announced in January 2012 that it was ceasing to offer forward mortgage banking services as part of its business. In March 2012, Nationstar Mortgage LLC (“Nationstar”) became our preferred mortgage lender. Nationstar began accepting new mortgage loan applications from our homebuyers on May 1, 2012.
On January 21, 2013, we entered into an agreement with Nationstar to form Home Community Mortgage, LLC (“Home Community Mortgage”), a mortgage banking company that will offer an array of mortgage banking services to our homebuyers. Nationstar will continue as our preferred mortgage lender until Home Community Mortgage begins offering mortgage banking services, which is expected in the first quarter of 2014. Home Community Mortgage is accounted for as an unconsolidated joint venture within our financial services reporting segment.
Employees
We employ a trained staff of land acquisition specialists, architects, planners, engineers, construction supervisors, marketing and sales personnel, and finance and accounting personnel, supplemented as necessary by outside consultants, who guide the development of our communities from their conception through the promotional marketing and delivery of completed homes.
At December 31, 2013 and 2012, we had approximately 1,430 and 1,200 full-time employees, respectively. None of our employees are represented by a collective bargaining agreement.
Competition, Seasonality, Delivery Mix and Other Factors
The homebuilding industry and housing market are highly competitive with respect to selling homes; hiring skilled trade labor, such as carpenters, roofers, electricians and plumbers; and acquiring attractive developable land. We compete for homebuyers, skilled trade workers, management talent and desirable land against numerous homebuilders, ranging from regional and national firms to small local enterprises. As to homebuyers, we primarily compete with other homebuilders on the basis of selling price, community location and amenities, availability of financing options, home designs, reputation, home construction quality and cycle time, and the design options and features that can be included in a home. In some cases, this competition occurs within larger residential development projects containing separate sections designed, planned and developed by other homebuilders. In addition, we compete for homebuyers against housing alternatives other than new homes, including resale homes, apartments, single-family rentals and other rental housing. In certain markets and at times when housing demand is high, we also compete with other homebuilders and commercial and remodeling contractors to hire skilled trade labor, primarily on the basis of pre-existing relationships, contract price and volume and consistency of available work. During the housing downturn, many skilled workers left construction for other industries. As a result, in 2013 and 2012, in markets experiencing increased residential
12
construction activity due to improved housing market conditions, the relatively smaller workforce combined with higher demand for trade labor created shortages of certain skilled workers, driving up costs and/or extending land development and home construction schedules. This elevated residential construction activity also contributed to notable increases in the cost of certain building materials, such as lumber, drywall and concrete, reflecting in part a smaller supplier base and lower production capacity than existed before the housing downturn. In 2013, we also saw higher prices for desirable land amid heightened competition with homebuilders and other developers and investors, particularly in the land constrained areas we are strategically targeting. We expect these upward trends in construction labor, building materials and land costs to continue, and possibly intensify, in 2014 if and as the present housing recovery progresses and there is greater competition for these resources.
Our performance is affected by seasonal demand trends for housing. Traditionally, there has been more consumer demand for home purchases and we tend to generate more net orders in the mid- to late-spring and early summer months (corresponding to most of our second and part of our third quarters) than at other times of the year. With our Built to Order approach and typical home construction cycle times, this “selling season” demand results in our delivering more homes and generating higher revenues from late summer through the fall months (corresponding to part of our third and our fourth quarters). On a relative basis, the winter and early spring months within our first and part of our second quarters usually produce the fewest net orders, homes delivered and revenues, and the sequential difference from our fourth quarter to our first quarter can be significant.
In addition to the overall volume of homes we sell and deliver, our results in a given period are significantly affected by the geographic mix of markets and submarkets in which we operate; the number and characteristics of the new home communities we have open for sales in those markets and submarkets; and the products we sell from those communities during the period. While there are some similarities, there are differences within and between our served markets in terms of the quantity, size and nature of the new home communities we operate and the products we offer to consumers. These differences reflect, among other things, local homebuyer preferences; household demographics (
e.g.
, large families or working professionals; income levels); geographic context (
e.g.
, urban or suburban; availability of reasonably priced finished lots; development constraints; residential density); and the shifts that can occur in these factors over time. These structural factors in each of our served markets will affect the costs we incur and the time it takes to locate, acquire rights to and develop land, open new home communities for sales, and market and build homes; the size of our homes; our selling prices (including the contribution from homebuyers’ purchases of design options); and the pace at which we sell and deliver homes and close out communities. Therefore, our results in any given period will fluctuate compared to other periods based on the proportion of homes delivered from areas with higher or lower selling prices and on the corresponding land and overhead costs incurred to generate those deliveries, as well as from our overall community count. In 2013, we targeted opening more of our new home communities for sales in higher-performing, choice locations — predominately in land constrained areas that have customers with higher household incomes who desire larger homes and purchase more design options, key drivers for our home selling prices and housing gross profit margins. Due in part to this focused approach, in 2013, we posted favorable year-over-year results in revenues as we delivered more homes from these areas, and generated higher housing gross profits for the year compared to 2012. At the same time, we had modest year-over-year growth in net orders. In 2014, we plan to continue our approach of opening new home communities for sales in locations with the above-described demand characteristics, and we anticipate that we will have more new home communities open for sales than we did in 2013.
Financing
We do not generally finance the development of our communities with project financing. By “project financing,” we mean loans from parties other than land sellers that are specifically obtained for, or secured by, particular communities or other inventory assets. Instead, our operations have historically been funded by results of operations, public debt and equity financing. We also have the ability to borrow funds under our unsecured revolving credit facility with various banks (as amended, the “Credit Facility”). Depending on market conditions in 2014, we may obtain project financing, or secure external financing with community or other inventory assets that we own or control. We may also arrange or engage in capital markets, bank loan, project debt or other financial transactions and/or expand the capacity of the Credit Facility or our cash-collateralized letter of credit facilities with various financial institutions (the “LOC Facilities”) or enter into additional such facilities. These transactions may include repurchases from time to time of our outstanding senior notes or other debt through redemptions, tender offers, exchange offers, private exchanges, open market purchases or other means, and may include potential new issuances of equity or senior or convertible senior notes or other debt through public offerings, private placements or other arrangements to raise new capital to support our current land and land development investment targets, and for other business purposes and/or to effect repurchases or redemptions of our outstanding senior notes or other debt. Our ability to engage in such financial transactions, however, may be constrained by economic, capital, credit and/or financial market conditions, investor interest and/or our current leverage ratios, and we can provide no assurance of the success or costs of any such transactions.
13
Environmental Compliance Matters
As part of our due diligence process for land acquisitions, we often use third-party environmental consultants to investigate potential environmental risks, and we require disclosures, representations and warranties from land sellers regarding environmental risks. Despite these efforts, there can be no assurance that we will avoid material liabilities relating to the existence or removal of toxic wastes, site restoration, monitoring or other environmental matters affecting properties currently or previously owned or controlled by us. No estimate of any potential liabilities can be made although we may, from time to time, acquire property that requires us to incur environmental clean-up costs after conducting appropriate due diligence, including, but not limited to, using detailed investigations performed by environmental consultants. In such instances, we take steps prior to our acquisition of the land to gain reasonable assurance as to the precise scope of work required and the costs associated with removal, site restoration and/or monitoring. To the extent contamination or other environmental issues have occurred in the past, we will attempt to recover restoration costs from third parties, such as the generators of hazardous waste, land sellers or others in the prior chain of title and/or their insurers. Based on these practices, we anticipate that it is unlikely that environmental clean-up costs will have a material effect on our consolidated financial statements. We have not been notified by any governmental agency of any claim that any of the properties owned or formerly owned by us are identified by the EPA (or similar state or local agency) as being a “Superfund” (or similar state or local) clean-up site requiring remediation, which could have a material effect on our future consolidated financial statements. Costs associated with the use of environmental consultants are not material to our consolidated financial statements.
Access to Our Information
We file annual, quarterly and current reports, proxy statements and other information with the Securities and Exchange Commission (“SEC”). We make our public SEC filings available, at no cost, through our investor relations website at www.investor.kbhome.com, as soon as reasonably practicable after the report is electronically filed with, or furnished to, the SEC. We will also provide these reports in electronic or paper format free of charge upon request made to our investor relations department at investorrelations@kbhome.com or at our principal executive offices. We intend for our investor relations website to be the primary location where investors and the general public can obtain announcements regarding and can learn more about our financial and operational performance, business plans and prospects, and our board of directors, our senior executive management team, and our corporate governance policies, including our articles of incorporation, by-laws, corporate governance principles, board committee charters, and ethics policy. We may from time to time choose to disclose or post important information about our business on or through our investor relations website, and/or through other electronic channels, including social media outlets and other evolving communications technologies. We webcast and archive quarterly earnings calls and other investor events in which we participate or host, and post related materials, on our investor relations website. Interested persons can register on our investor relations website to receive prompt notifications of new SEC filings, press releases and other information posted there. However, the content available on or through our primary website at www.kbhome.com or our investor relations website, including our sustainability reports, is not incorporated by reference in this report or in any other filing we make with the SEC. Our references in our SEC filings or otherwise to materials posted on or to any content available on or through our websites and/or through other electronic channels, including social media outlets and other evolving communications technologies, are intended to be inactive textual or oral references only. Our SEC filings are also available to the public over the Internet at the SEC’s website at www.sec.gov. The public may also read and copy any document we file at the SEC’s public reference room located at 100 F Street N.E., Washington, D.C. 20549. Please call the SEC at 1-800-SEC-0330 for further information on the operation of the public reference room.
|
Item 1A.
|
RISK FACTORS
|
The following important factors could adversely impact our business. These factors could cause our actual results to differ materially from the forward-looking and other statements that (a) we make in registration statements, periodic reports and other filings with the SEC and from time to time in our news releases, annual reports and other written reports or communications, (b) we post on or make available through our primary website at www.kbhome.com or our investor relations website at www.investor.kbhome.com and/or through other electronic channels, including social media outlets and other evolving communications technologies, and (c) our personnel and representatives make orally from time to time.
The recent improvement in housing market conditions following a severe and prolonged housing downturn may not continue, and any slowing or reversal of the present housing recovery generally, or in our served markets, or for the homebuilding industry may materially and adversely affect our business and consolidated financial statements.
In 2013, the housing recovery continued to advance after several years of weak demand and excess supply during the housing downturn. The present recovery, which began to take shape in 2012, has been fueled primarily by sustained demand for homes, low inventories of homes available for sale, and generally favorable economic and demographic trends. Housing demand has been supported by population growth, household formations, favorable housing affordability largely due to relatively low interest
14
rates for mortgage loans, and positive consumer confidence. However, the performance of housing markets varied throughout the year. Further, in mid-2013, a sudden rise in mortgage loan interest rates, combined with steadily increasing home prices, tempered a relatively heated sales pace seen earlier in the year, and an extended legislative impasse during federal government budget and debt ceiling negotiations in October 2013 negatively affected consumer confidence and net orders in our fourth quarter.
Despite the changing environment during the year, with the present housing recovery, we and other homebuilders for the most part reported higher orders and homes delivered and better financial results in 2013 than in 2012. However, the improved conditions did not extend to a number of housing markets we serve, and some markets and submarkets have been stronger than others. We expect that such unevenness will continue in 2014 and beyond whether or not the present housing recovery progresses, and that prevailing conditions in various housing markets and submarkets will fluctuate. These fluctuations may be significant and unfavorable in future periods. In addition, while some of the many negative factors that contributed to the housing downturn may have moderated, several remain, and they could return and/or intensify to inhibit any future improvement in housing market conditions in 2014. These negative factors include (a) weak general economic and employment growth that, among other things, restrains consumer incomes, consumer confidence and demand for homes; (b) delinquencies, defaults and foreclosures on mortgage loans that could add to a “shadow inventory” of lender-owned homes that may be sold in competition with new homes, including our homes, and resale homes at low “distressed” prices or that generate short sales activity at such price levels; (c) a significant number of homeowners whose outstanding principal balance on their mortgage loan exceeds the market value of their home, which undermines their ability to purchase another home that they otherwise might desire and be able to afford, and also cause lenders to curb mortgage loan origination activity; (d) volatility and uncertainty in domestic and international financial, credit and consumer lending markets amid slow growth or recessionary conditions in various regions around the world; and (e) tight lending standards and practices for mortgage loans, which may be driven by regulatory requirements, that limit consumers’ ability to qualify for mortgage financing to purchase a home, including increased minimum credit score requirements, credit risk/mortgage loan insurance premiums and/or other fees and required down payment amounts, more conservative appraisals of home values, lower loan-to-value ratios and extensive buyer income and asset documentation requirements. Additional headwinds may come from the efforts and proposals of lawmakers to reduce the debt of the federal government through tax increases and/or spending cuts, or the failure of lawmakers to timely agree on a budget or appropriation legislation to fund the operations of the federal government, and financial markets’ and businesses’ reactions to those efforts, proposals or failure, which could impair economic growth. Since these factors may persist or recur, we can provide no assurance that the present housing recovery will continue or gain further momentum, whether overall or in our served markets.
If, on an overall basis or in our served markets, the present housing recovery stalls or does not continue at the same pace, or any or all of the negative factors described above persist or worsen, particularly if there is limited economic growth or a decline, low growth or decreases in employment and consumer incomes, and/or continued tight mortgage lending standards and practices, there would likely be a corresponding adverse effect on our business and our consolidated financial statements, including, but not limited to, the number of homes we deliver, our average selling prices, the amount of revenues we generate and our ability to operate profitably, and the effect may be material. Even if the present housing recovery continues for an extended period, our and the homebuilding industry’s orders, homes delivered, revenues and profitability remain well below, and may not return to, the peak levels reached shortly before the housing downturn began.
Continued or additional tightening of mortgage lending standards and practices or mortgage financing requirements or volatility in financial, credit and consumer lending markets could adversely affect the availability of mortgage loans for potential purchasers of our homes and thereby reduce our net orders.
Since 2008, the mortgage lending and mortgage finance industries have experienced significant instability due to, among other things, relatively high rates of delinquencies, defaults and foreclosures on mortgage loans and a corresponding decline in their market value and the market value of securities backed by such loans, although there has been some improvement in these areas amid a general lift in housing prices over the past two years. With the instability, a number of providers, purchasers and insurers of mortgage loans and mortgage loan-backed securities have exited the market, and most mortgage loans are currently being originated under programs offered or supported by government agencies or government-sponsored enterprises — principally, the Federal Housing Administration (“FHA”), the Veterans Administration (“VA”), the Federal National Mortgage Association (also known as “Fannie Mae”), Federal Home Loan Mortgage Corporation (also known as “Freddie Mac”) and the U.S. Department of Agriculture. Compared to prior periods, these developments have led to reduced availability of mortgage loan products (particularly subprime and nonconforming loans), and tighter lending standards and practices for mortgage loans. As a result, it is generally more difficult for some categories of borrowers to finance the purchase of homes, which is restraining the housing market’s recovery, causing volatility in and elevating cancellation rates for us and other homebuilders, and reducing demand for homes, including our homes. If these factors continue, or if mortgage lending standards and practices further tighten, we expect that there would be a material adverse effect on our business and our consolidated financial statements, particularly since we depend on third-party lenders (including our preferred mortgage lender Nationstar) to provide mortgage loans to our homebuyers.
15
Further tightening of mortgage lending standards and practices and/or reduced credit availability for mortgages may also result from the implementation of regulations under the 2010 Dodd-Frank Wall Street Reform and Consumer Protection Act (the “Dodd-Frank Act”). Among other things, the Dodd-Frank Act established several requirements (including risk retention obligations) relating to the origination, securitizing and servicing of, and consumer disclosures for, mortgage loans. In addition, U.S. and international banking regulators have proposed or enacted higher capital standards and requirements for financial institutions. These standards and requirements, as and when implemented, may further reduce the availability of and/or increase the costs to borrowers to obtain mortgage loans, including by reducing allowable debt-to-income ratios, imposing restrictions on mortgage origination fees and lowering maximum conforming mortgage loan amounts. Federal regulators and lawmakers are also considering steps that may significantly reduce the ability or authority of the FHA, Fannie Mae and Freddie Mac to purchase or insure mortgage loans under their respective programs, including proposals to gradually wind down Fannie Mae and Freddie Mac. Further, since 2010, lenders and other mortgage banking services providers, brokers and other institutions, and their agents, have been under intense regulatory scrutiny and the targets of several civil actions by investors and government agencies regarding mortgage loan underwriting practices and/or representations made in connection with selling mortgage loans into private or Fannie Mae- or Freddie Mac-backed securitized pools. If such scrutiny and civil actions result in lenders and other mortgage banking services providers and brokers having to adjust their operations and/or pay significant amounts in damages or fines, they may further curtail or cease their mortgage loan origination activities due to reduced liquidity or to mitigate perceived risks.
Since 2012, the Federal Reserve has been purchasing billions of dollars of longer-term U.S. Treasury securities and mortgage loan-backed securities of Fannie Mae, Freddie Mac and the Government National Mortgage Association (or “Ginnie Mae,” which guarantees securities composed of FHA- and VA-qualified mortgage loans). It expects this asset purchase program to maintain downward pressure on longer-term interest rates, support mortgage markets and help make broader financial conditions more accommodative. However, in mid-2013, when the Federal Reserve Chairman announced that the program could be scaled back, or “tapered,” there was a measurable spike in mortgage loan interest rates and they have remained elevated compared to the first half of the year. If the Federal Reserve does taper or end its asset purchase program, and it announced in December 2013 a reduction in its monthly purchases from $85 billion to $75 billion, it is likely that mortgage loan interest rates will rise, subject to prevailing economic and financial market conditions. Even if the Federal Reserve’s asset purchase program does keep mortgage loan interest rates at relatively low levels, many potential homebuyers may still be unable to obtain mortgage loans to purchase homes, including our homes, if mortgage lending standards and practices remain tight or tighten further, or if lenders curtail or cease mortgage loan origination activity due to regulatory requirements and/or liquidity or risk concerns.
Interest rate increases or changes in federal lending programs or regulations could lower demand for our homes.
Nearly all of our customers finance the purchase of their homes. Before the housing downturn began, historically low interest rates and the increased availability of specialized mortgage loan products, including products requiring no or low down payments, and interest-only and adjustable-rate mortgage loans, made purchasing a home more affordable for a number of customers and more available to customers with lower credit scores. Increases in interest rates and/or decreases in the availability of mortgage financing or of certain mortgage loan products or programs may lead to fewer mortgage loans being provided, higher credit risk/mortgage loan insurance premiums and/or other fees, increased down payment and extensive buyer income and asset documentation requirements, or a combination of the foregoing, and, as a result, reduce demand for our homes and increase our cancellation rates.
Due to the volatility and uncertainty in the credit markets and in the mortgage lending and mortgage finance industries since 2008, the federal government has taken on a significant role in supporting mortgage lending through its conservatorship of Fannie Mae and Freddie Mac, and its insurance of mortgage loans through the FHA and the VA. FHA backing of mortgage loans has been particularly important to the mortgage finance industry and to our business. The availability and affordability of mortgage loans, including interest rates for such loans, could be adversely affected by a scaling back or termination of the federal government’s mortgage loan-related programs or policies. The FHA, for instance, increased its annual mortgage insurance premiums in 2013 and, among other actions, extended the period that such premiums are charged to borrowers, increased down payment requirements and raised its standards on the loans it will insure in order to address a significant cash reserve deficit (relative to its projected losses from delinquent loans). In addition, federal regulators significantly lowered the FHA’s maximum single-family forward mortgage loan limits in 650 “high-cost” counties effective January 1, 2014, including counties in California and in other of our served markets. These steps, whether individually or collectively, could prevent some homebuyers from qualifying for mortgage loans to purchase homes, including our homes. In addition, given growing federal budget deficits, the U.S. Treasury may not be able to continue, or may be required by future legislation or regulation to cease, supporting the mortgage loan-related activities of Fannie Mae, Freddie Mac, the FHA and the VA at present levels.
Because Fannie Mae-, Freddie Mac-, FHA- and VA-backed mortgage loans have been an important factor in marketing and selling many of our homes, any limitations or restrictions in the availability of, or higher consumer costs for, such government-backed financing could reduce our net orders, particularly in our coastal submarkets in California, and adversely affect our consolidated financial statements, and the effect could be material.
16
Third-party lenders may not complete mortgage loan originations for our homebuyers in a timely manner or at all, which can lead to cancellations and a lower backlog of orders, or to significant delays in our delivering homes and recognizing revenues from those homes.
Our homebuyers may obtain mortgage financing for their home purchases from any lender or other provider of their choice. If, due to credit or consumer lending market conditions, reduced liquidity, increased risk retention or minimum capital level obligations and/or regulatory restrictions related to the Dodd-Frank Act or other laws, or other factors or business decisions, these lenders refuse or are unable to provide mortgage loans to our homebuyers, the number of homes we deliver and our consolidated financial statements may be materially and adversely affected. For instance, tight mortgage lending standards and practices for mortgage loans have in recent periods led to significant delays in our delivering homes and/or have caused some potential homebuyers to cancel their home purchase contracts with us. We can provide no assurance that these tight mortgage lending conditions will relax or reverse in the foreseeable future.
In addition, as we were transitioning to Nationstar as our preferred mortgage lender in the first half of 2012, we experienced significant disruptions to our business due to the inability or unwillingness of several independent third-party lenders to complete in a timely fashion or at all the mortgage loan originations they had started for our homebuyers. Nationstar began accepting new mortgage loan applications from our homebuyers on May 1, 2012, and compared to other lenders has been providing more consistent execution and completion of mortgage loan originations for our homebuyers who choose to use Nationstar. Based on the number of homes delivered in 2013, approximately 59% of our homebuyers used Nationstar to finance the purchase of their home. In January 2013, we entered into an agreement with Nationstar to form Home Community Mortgage, a mortgage banking company that will offer an array of mortgage banking services to our homebuyers. Nationstar will provide management oversight of Home Community Mortgage’s operations, which are expected to begin in the first quarter of 2014. Although we expect an increasing percentage of our homebuyers will choose to use Nationstar/Home Community Mortgage, many of our homebuyers will continue to seek mortgage loans from other lenders and potentially be subject to the performance of such lenders, as well as the general mortgage financing industry issues described above. In addition, we can provide no assurance as to Nationstar’s ability or willingness, as our preferred mortgage provider or as the manager of Home Community Mortgage, to provide mortgage loans and other mortgage banking services to our homebuyers in future periods (whether due to the factors discussed above or otherwise), or as to its performance in doing so. Furthermore, the mortgage banking operations of Home Community Mortgage will be heavily regulated and subject to the rules and regulations promulgated by a number of governmental and quasi-governmental agencies. If Nationstar’s performance declines or Nationstar decides to end, or we decide to terminate, our relationship, or there is a finding that Home Community Mortgage materially violated any applicable rules or regulations and as a result is restricted from or unable to originate mortgage loans, we may experience mortgage loan funding issues similar to those we encountered in 2012, which would likely have a material adverse impact on our business and our consolidated financial statements.
Our current strategies may not generate improved financial and operational performance, and the continued implementation of these and other strategies may not be successful.
We believe our strategic actions during the housing downturn strengthened our overall business and that our current strategies and initiatives will enable us to profitably grow our business in 2014. However, our strategies, including, but not limited to, our strategic growth initiatives intended to improve our profitability and increase our revenues, such as our significant investments in land and land development, our plans to open more new home communities, our ongoing repositioning of our homebuilding activities and investments toward higher-performing, desirable locations in land constrained growth markets, and our efforts to optimize our sales pace at our new home communities, may prove to be unsuitable for some or all of our served markets. We can provide no guarantee that these strategies will be successfully or productively implemented or, even if they are implemented as designed, that they will generate growth and earnings, or that we will achieve in 2014 or beyond positive operational or financial results or results in any particular metric or measure equal to or better than our 2013 performance, or perform in any period as well as other homebuilders. In particular, our strategic effort to activate certain inventory that was previously held for future development may not generate positive results as many of these assets are generally located in submarkets that have only recently begun to stabilize. In addition, although we believe our new home communities and products will appeal to our primary customer base, we can provide no assurance that our new home community locations and product designs (or any refining of those designs) will successfully attract consumers or generate orders and revenues at the levels we have experienced in the past or anticipate in future periods, or at levels higher than other homebuilders. We also cannot provide any assurance that we will be able to maintain these strategies in 2014 and, due to unexpectedly favorable or unfavorable market conditions or other factors, we may determine that we need to adjust, refine or abandon all or portions of these strategies, although we cannot guarantee that any such changes will be successful. For instance, with the heightened land acquisition and development activities of homebuilders and other developers since 2012, there are significantly fewer well-located developable land parcels available at reasonable prices in several of our submarkets, making our land acquisition and development strategies more challenging to implement successfully, and we may not be able to achieve our land-related investment and community count growth goals. The failure of any one or more of our present strategies, or the failure of any adjustments or alternative strategies that we may pursue or implement, to be successful
17
will likely have an adverse effect on our ability to grow and increase the value and profitability of our business and on our consolidated financial statements, as well as on our overall liquidity, and the effect in each case could be material.
The success of our present strategies, growth initiatives and our long-term performance depends on the availability of finished and partially finished lots and undeveloped land that meet our investment return and marketing standards.
The availability of finished and partially finished lots and undeveloped land that meet our investment return and marketing standards depends on a number of factors outside of our control, including land availability in general, geographical/topographical constraints, land sellers’ business relationships with other homebuilders, developers or investors, climate conditions, competition with other homebuilders and land buyers for desirable property, financial and credit market conditions, legal or government agency processes, inflation in land prices, zoning, allowable housing density, our ability and the costs to obtain building permits, the amount of environmental impact fees, real estate tax rates and other regulatory requirements. Should suitable lots or land become less available, which is increasingly the case, the number of homes that we may be able to build and sell could be reduced, and the cost of attractive land could increase, perhaps substantially, which could adversely impact our consolidated financial statements including, but not limited to, our housing gross profit margins, and our ability to maintain ownership or control of a sufficient supply of developed or developable land inventory. The availability of suitable land could also affect the success of our current strategies and growth initiatives, and if we decide to reduce our land acquisition activity in 2014 due to a lack of available assets that meet our standards, our ability to increase our community count, to grow our revenues and housing gross profit margins, and to maintain or increase our profitability, would likely be constrained and could have a material adverse effect on our consolidated financial statements.
The value of the land and housing inventory we own or control may fall significantly.
The value of the inventory we currently own or control depends on market conditions, including estimates of future demand for, and the revenues that can be generated from, this inventory. The market value of our inventory can vary considerably because there is often a significant amount of time between our acquiring control or taking ownership of land and the delivery of homes on that land. The negative conditions of the housing downturn, which generally depressed home sales and selling prices, caused the fair value of certain of our owned or controlled inventory to fall, in some cases well below the estimated fair value at the time we acquired ownership or control. Even with the improved housing market conditions we saw in 2013, local submarket-specific or other factors could lead to a decrease in the fair value of certain of our inventory in 2014 whether or not the present housing recovery progresses. Based on our periodic assessments of inventory for recoverability, during the housing downturn, we wrote down the carrying value of certain of our inventory to its estimated fair value, including inventory that we had previously written down, and recorded corresponding charges against our earnings to reflect the impaired value. We also recorded charges in connection with abandoning our interests in certain land controlled under land option contracts and other similar contracts that no longer met our investment return or marketing standards. In 2013, we recorded
$.4 million
of inventory impairment charges and
$3.2 million
of land option contract abandonment charges. However, if in 2014 the present housing recovery slows or reverses, or if particular markets or submarkets experience challenging or unfavorable changes in prevailing conditions, we may need to take additional charges against our earnings for inventory impairments or land option contract abandonments, or both, to reflect changes in fair value of land or land interests in our inventory, including assets we have previously written down. Any such charges could have a material adverse effect on our consolidated financial statements, including our ability to maintain or increase our profitability.
Our business is cyclical and is significantly affected by changes in general and local economic conditions.
Our operations and consolidated financial statements can be substantially affected by adverse changes in general economic or business conditions that are outside of our control, including changes in, among other factors:
|
•
|
short- and long-term interest rates;
|
|
•
|
employment levels and job and personal income growth;
|
|
•
|
housing demand from population growth, household formation and other demographic changes;
|
|
•
|
availability and pricing of mortgage financing for homebuyers;
|
|
•
|
consumer confidence generally and the confidence of potential homebuyers in particular;
|
|
•
|
U.S. and global financial system and credit market stability;
|
|
•
|
private party and government mortgage loan programs (including changes in FHA, Fannie Mae- and Freddie Mac-conforming mortgage loan limits, credit risk/mortgage loan insurance premiums and/or other fees, down payment
|
18
requirements and underwriting standards), and federal and state regulation, oversight and legal action regarding lending, home value appraisal, foreclosure and short sale practices;
|
•
|
federal and state personal income tax rates and provisions, including provisions for the deduction of mortgage loan interest payments, real estate taxes and other expenses;
|
|
•
|
supply of and prices for available new or resale homes (including lender-owned homes) and other housing alternatives, such as apartments, single-family rentals and other rental housing;
|
|
•
|
homebuyer interest in our current or new product designs and new home community locations, and general consumer interest in purchasing a home compared to choosing other housing alternatives; and
|
|
•
|
real estate taxes.
|
Adverse changes in these conditions may affect our business nationally or may be more prevalent or concentrated in particular markets or submarkets in which we operate.
Inclement weather, natural disasters (such as earthquakes, hurricanes, tornadoes, floods, droughts and fires), and other environmental conditions can delay the delivery of our homes and/or increase our costs. Civil unrest or acts of terrorism can also have a negative effect on our business.
The potential difficulties described above can cause demand and prices for our homes to fall or cause us to take longer and incur more costs to develop land and build our homes. We may not be able to recover these increased costs by raising prices because of market conditions and because the price of each home we sell is usually set several months before the home is delivered, as our customers typically sign their home purchase contracts before home construction begins. The potential difficulties could also lead some homebuyers to cancel or refuse to honor their home purchase contracts altogether. Reflecting the difficult conditions in our served markets during the housing downturn, we have experienced volatility in our net orders and cancellation rates in recent years, and if the present housing recovery slows or reverses, we may experience similar or increased volatility in 2014. If we do, there could be a material adverse effect on our consolidated financial statements.
Home prices and sales activity in the particular markets and regions in which we do business materially affect our consolidated financial statements because our business is concentrated in these markets.
Home selling prices and sales activity in some of our key served markets have declined from time to time for market-specific reasons, including adverse weather, high levels of foreclosures, short sales and sales of lender-owned homes, and lack of affordability or economic contraction due to, among other things, the departure or decline of key industries and employers that could effectively price potential homebuyers out of purchasing homes, including our homes. If home selling prices or sales activity decline in one or more of our key served markets, including California, Florida, Nevada or Texas, our costs may not decline at all or at the same rate and, as a result, our consolidated financial statements may be materially and adversely affected. Adverse conditions in California would have a particularly material effect on our consolidated financial statements as our average selling price in the state is higher than in our other homebuilding reporting segments; a large percentage of our housing revenues is generated from California; and a significant proportion of our investments in land and land development since late 2009 was made, and in 2014 is expected to be made, in that state. In recent years, California’s state government and many of its regional and local governments have struggled to balance their budgets due to a number of factors, although the state’s budget outlook for its current fiscal year has improved slightly. These include lower tax revenues; higher debt service, public employee pension and social welfare obligations; lower federal government support; and, for regional and local governments and redevelopment agencies, various reductions, eliminations or reversals of state government support. As a result, there have been, and lawmakers have proposed making additional, significant cuts to government departments, subsidies, programs and public employee staffing levels, and taxes and fees have been raised, and lawmakers have proposed additional tax and fee increases, in an effort to balance governmental budgets. A few municipalities have declared bankruptcy, and others are reportedly considering such a step. California lawmakers’ efforts at all governmental levels to address ongoing and/or projected budget deficits through spending cuts and/or efforts to increase governmental revenues, could, among other things, cause businesses and residents to leave the state, or discourage businesses or households from coming to the state, which would limit economic growth; cause significant delays in obtaining required inspections, permits or approvals with respect to residential development at our new home communities located in the state, which we encountered in 2013, or result in higher costs for such permits or approvals; and could delay or prevent the release or repayment by applicable municipalities and other government agencies of performance bonds, letters of credit and/or similar deposits we have made in connection with our residential development activities. These negative impacts could adversely affect our ability to generate net orders and revenues and/or to maintain or increase our housing gross profit margins from our California operations, and the impact could be material and adverse to our consolidated financial statements.
19
Supply shortages and other risks related to demand for building materials and/or skilled trade labor could increase costs and delay deliveries.
As discussed above under “Item 1. Business — Competition, Seasonality, Delivery Mix and Other Factors,” there is a high level of competition in the homebuilding industry and the housing market for skilled trade labor and building materials that can, among other things, cause increases in land development and home construction costs, and development and construction delays. Also, in 2013, a smaller pool of skilled trade labor due to the housing downturn led to shortages in some markets that experienced increased residential construction activity, and such shortages could recur in 2014 if and as the present housing recovery progresses. Shortages or upward price fluctuations in lumber, drywall, concrete and other building materials, and labor, whether due to a small supplier base or supplier capacity constraints, increased residential construction activity, international demand, the occurrence of or rebuilding after natural disasters or other reasons, can also have an adverse effect on our business. We generally are unable to pass on increases in land development and home construction costs to homebuyers who have already entered into home purchase contracts, as the purchase contracts generally fix the price of the home at the time the contract is signed, and may be signed well in advance of when home construction commences. We also may not be able to raise our selling prices to cover such increases in land development and home construction costs because of market conditions, including competition for homebuyers with other homebuilders and resale homes. Sustained increases in land development and home construction costs due to higher skilled trade labor rates or elevated lumber, drywall, concrete and other building materials prices and/or our limited ability to successfully contain these costs may, among other things, decrease our housing gross profit margins, while shortages of skilled trade labor or building materials due to competition or other factors may delay deliveries of homes and our recognition of revenues. As a result, these negative items, individually or together, can have a material and adverse impact on our consolidated financial statements.
Inflation may adversely affect us by increasing costs that we may not be able to recover, particularly if home selling prices decrease, and the impact on our performance and our consolidated financial statements could be material.
Inflation can have an adverse impact on our consolidated financial statements because increasing costs for land, skilled trade labor or building materials could require us to increase our home selling prices in an effort to maintain satisfactory housing gross profit margins. In 2010 and 2011, worldwide demand for certain commodities and monetary policy actions led to price increases and price volatility for raw materials that are used in land development and home construction, including lumber and metals. Additionally, increased residential construction activity in 2012 and 2013 in combination with a relatively small supplier base further boosted prices and pricing volatility for lumber, drywall, concrete and other raw materials, and these trends are expected to continue, and possibly intensify, in 2014 if and as the present housing recovery progresses. These pricing trends, taken together with U.S. and international central bank and governmental policies and programs designed to boost economic growth, may lead to a general increase in inflation. However, we may not be able to increase our home selling prices to cover cost inflation due to market conditions, and may need to hold or reduce our selling prices in order to compete for home sales. If determined necessary, our lowering of home selling prices, in addition to impacting our housing gross profit margins, may also reduce the value of our land inventory, including the assets we have purchased in recent years, and make it more difficult for us to fully recover the costs of our land and any related land development through our home selling prices or, if we choose, through land sales. In addition, depressed land values may cause us to abandon and forfeit deposits on land option contracts and other similar contracts if we cannot satisfactorily renegotiate the purchase price of the subject land. We may incur charges against our earnings for inventory impairments if the value of our owned inventory is reduced or for land option contract abandonments if we choose not to exercise land option contracts or other similar contracts, and these charges may be substantial, as we experienced in certain periods during the housing downturn. Inflation may also increase interest rates for mortgage loans and thereby reduce demand for our homes and lead to lower revenues, as well as increase the interest rates we may need to accept to obtain external financing.
Reduced home sales may impair our ability to recoup development costs or force us to absorb additional costs.
We incur many costs before we begin to build homes in a community. Depending on the stage of development a land parcel is in when acquired, such costs may include costs of preparing land, finishing and entitling lots, and installing roads, sewers, water systems and other utilities; taxes and other costs related to ownership of the land on which we plan to build homes; constructing model homes; and promotional marketing and overhead expenses to prepare for the opening of a new home community for sales. In addition, local municipalities may impose requirements resulting in additional costs. If the rate at which we sell and deliver homes slows or falls, or if we delay the opening of new home communities for sales due to adjustments in our marketing strategy or other reasons, each of which has occurred throughout the housing downturn and in 2012 and 2013, we may incur additional costs and it will take a longer period of time for us to recover our costs, including the costs we incurred in acquiring and developing land in recent years. Furthermore, if the present housing recovery slows or reverses in 2014, we may decide to abandon certain land option contracts and other similar contracts, and sell certain land at a loss, and the costs of doing so may be adverse and material to our consolidated financial statements.
20
Some homebuyers may cancel their home purchases because the required deposits are small and sometimes refundable.
Our backlog at a given point in time reflects the number of homes under a home purchase contract that have not yet been delivered to a homebuyer. Our home purchase contracts typically require only a small deposit, some or all of which is refundable prior to closing. If the prices for new homes decline, competitors increase their use of sales incentives, lenders and others increase their efforts to sell resale homes, skilled trade labor or building materials shortages delay our home construction cycle times, mortgage loan interest rates increase, the availability of mortgage financing further diminishes or there is continued weakness or a downturn in local or regional economies or the national economy and in consumer confidence, customers may cancel their existing home purchase contracts with us because they have been unable to finalize their mortgage financing for the purchase, they desire to move into a home earlier than we can deliver it, or in order to attempt to negotiate for a lower price or explore other options or for other reasons they are unable or unwilling to complete the purchase. In recent years, we have experienced volatile cancellation rates, in part due to these reasons and in part due to the mortgage loan funding issues arising from the 2012 transition of our preferred mortgage lending relationship. To the extent they continue, volatile cancellation rates resulting from these conditions, or otherwise, could have a material adverse effect on our business and our consolidated financial statements.
Tax law changes could make home ownership more expensive or less attractive.
Under current tax law and policy, significant expenses of owning a home, including mortgage loan interest costs and real estate taxes, generally are deductible expenses for the purpose of calculating an individual’s or household’s federal, and in some cases state, taxable income subject to various limitations. For instance, under the American Taxpayer Relief Act of 2012 signed into law in January 2013, the federal government enacted higher income tax rates and limits on the value of tax deductions for certain high-income individuals and households. If the federal government or a state government changes or further changes its income tax laws, as some lawmakers have proposed, by eliminating, limiting or substantially reducing these income tax benefits, the after-tax cost of owning a home could increase substantially. Any additional increases in personal income tax rates and/or additional tax deduction limits or restrictions enacted at the federal or state levels could adversely impact demand for and/or selling prices of new homes, including our homes, and the effect on our consolidated financial statements could be material.
We are subject to substantial legal and regulatory requirements regarding the development of land, the homebuilding process and protection of the environment, which can cause us to suffer delays and incur costs associated with compliance and which can prohibit or restrict homebuilding activity in some regions or areas. The impact of such requirements, individually or collectively, could be adverse and material to the implementation of our strategic growth initiatives and our consolidated financial statements.
Our homebuilding business is heavily regulated and subject to a significant amount of local, state and federal regulation concerning zoning, allowable housing density, natural and other resource protection, building designs, land development and home construction methods, worksite safety and similar matters, as well as governmental taxes, fees and levies on the acquisition and development of land parcels. These regulations often provide broad discretion to government authorities that oversee these matters, which can result in unanticipated delays or increases in the cost of a specified development project or a number of projects in particular markets. We may also experience delays due to a building permit moratorium or regulatory restrictions in any of the locations in which we operate, which can affect the balance of land held for future development in our inventory.
In addition, we are subject to a variety of local, state and federal statutes, ordinances, rules and regulations concerning the environment, including requirements to manage and/or mitigate storm water runoff, dust particles and other environmental impacts of our land development and home construction activities at our new home communities. As discussed below with respect to potential climate change impacts, these laws and regulations, and/or evolving interpretations thereof, may cause delays in our land development and in our construction and delivery of homes, may cause us to incur substantial compliance and other costs, and can prohibit or restrict homebuilding activity in certain regions or areas.
As discussed above under “Item 1. Business — Environmental Compliance Matters,” environmental laws may also impose liability for the costs of removal or remediation of hazardous or toxic substances whether or not the developer or owner of the property knew of, or was responsible for, the presence of those substances. The presence of those substances on our properties may prevent us from selling our homes and we may also be liable, under applicable laws and regulations or lawsuits brought by private parties, for hazardous or toxic substances on land that we have sold in the past.
Further, a significant portion of our business is conducted in California, one of the most highly regulated and litigious states in the country. Therefore, our potential exposure to losses and expenses due to new laws, regulations or litigation may be greater than other homebuilders with a less significant California presence.
21
The homebuilding industry and housing market are very competitive, and competitive conditions could adversely affect our business or our consolidated financial statements.
As discussed above under “Item 1. Business — Competition, Seasonality, Delivery Mix and Other Factors,” we face significant competition in several areas of our business from other homebuilders and participants in the overall housing industry. These competitive conditions can result in:
|
•
|
our delivering fewer homes;
|
|
•
|
our selling homes at lower prices;
|
|
•
|
our offering or increasing sales incentives, discounts or price concessions for our homes;
|
|
•
|
our experiencing lower housing gross profit margins, particularly if we cannot raise our selling prices to cover increased land acquisition and development, home construction or overhead costs;
|
|
•
|
our selling fewer homes or experiencing a higher number of cancellations by homebuyers;
|
|
•
|
impairments in the value of our inventory and other assets;
|
|
•
|
difficulty in acquiring desirable land that meets our investment return or marketing standards, and in selling our interests in land that no longer meet such standards on favorable terms;
|
|
•
|
difficulty in our acquiring raw materials and skilled management and trade labor at acceptable prices;
|
|
•
|
delays in the development of land and/or the construction of our homes; and/or
|
|
•
|
difficulty in securing external financing, performance bonds or letter of credit facilities on favorable terms.
|
These competitive conditions may have a material adverse effect on our business and consolidated financial statements by decreasing our revenues, impairing our ability to successfully implement our current strategies, increasing our costs and/or diminishing growth in our local or regional homebuilding businesses. During the housing downturn in particular, actions taken by our new home and housing alternative competitors reduced the effectiveness of our efforts to achieve stability or increases in home selling prices, to generate higher deliveries of homes, revenues and housing gross profit margins, and to maintain or increase our profitability.
Homebuilding is subject to warranty and liability claims in the ordinary course of business that can be significant.
In the ordinary course of our homebuilding business, we are subject to home warranty and construction defect claims. We record warranty and other liabilities for the homes we deliver based primarily on historical experience in our served markets and our judgment of the risks associated with the types of homes we build. As further described in Note 15. Commitments and Contingencies in the Notes to Consolidated Financial Statements in this report, w
e maintain, and require the majority of our subcontractors to maintain, general liability insurance (including construction defect and bodily injury coverage) and workers’ compensation insurance. These insurance policies protect us against a portion of our risk of loss from claims related to our homebuilding activities, subject to certain self-insured retentions, deductibles and other coverage limits.
We self-insure a portion of our overall risk through the use of a captive insurance subsidiary. We also maintain certain other insurance policies.
In Arizona, California, Colorado and Nevada, our subcontractors’ general liability insurance primarily takes the form of a wrap-up policy, where eligible subcontractors are enrolled as insureds on each project. Enrolled subcontractors contribute toward the cost of the insurance and agree to pay a contractual amount in the future in the event of a claim related to their work.
For those enrolled subcontractors, we absorb their general liability associated with the work performed on our homes within the applicable projects as part of our overall general liability insurance and our self-insurance through our captive insurance subsidiary.
Because of the uncertainties inherent to these matters, we cannot provide any assurance that our various insurance arrangements and our liabilities will be adequate to address all our warranty and construction defect claims in the future, or that any potential inadequacies will not have an adverse effect on our consolidated financial statements. Additionally, the coverage offered by and the availability of general liability insurance for construction defects are currently limited and costly. There can be no assurance that coverage will not be further restricted, increasing our risks and financial exposure to claims, and/or become more costly and to a material degree.
We engage subcontractors to perform the actual construction of our homes, and in many cases, to obtain the necessary building materials.
Our contracts with our subcontractors require that they comply with all laws applicable to their work, including labor laws, meet performance standards, and follow local building codes and permits. However
, we may encounter improper construction practices or the installation of defective materials in our homes, among other things. When we discover these issues, we will evaluate and if necessary, repair the homes in accordance with our new home limited warranty and as required by law. For instance,
22
in late 2012 and during 2013, we undertook a significant effort to repair homes
in certain of our communities in central and southwest Florida affected by various problems that resulted in water intrusion-related issues.
The adverse costs of satisfying our warranty and other legal obligations in these instances may be significant and we may need to record charges to reflect an increased overall warranty liability, as has been the case with our repair efforts in
central and southwest Florida.
Although we will pursue recoveries from potentially responsible parties, we may be unable to recover the costs of warranty-related repairs from subcontractors, suppliers or insurers, which could have a material impact on our consolidated financial statements. We can provide no assurance that in 2014 we will not face more warranty-related claims and/or incur higher costs to satisfy repair or other obligations related to our new home limited warranty and customer service activities, or not need to record charges to adjust our overall warranty liability, or be successful in obtaining any recoveries for warranty-related costs we incur from responsible parties.
Because of the seasonal nature of our business, our quarterly operating results fluctuate.
As discussed above under “Item 1. Business — Competition, Seasonality, Delivery Mix and Other Factors,” we have experienced seasonal fluctuations in our quarterly operating results that can have a material impact on our results and our consolidated financial statements. Historically, a significant percentage of our home purchase contracts are entered into in the spring and early summer months, and we deliver a corresponding significant percentage of our homes in the late summer and fall months. As a result, we historically have experienced uneven quarterly results, with lower revenues and operating income generally during the first and second quarters of our fiscal year. We currently expect to experience the traditional seasonality cycle and its impact on our results as the present housing recovery progresses, but we can make no assurances as to the degree to which our historical seasonal patterns will occur in 2014 and beyond, if at all.
We may be restricted in accessing external capital, and to the extent we can access external capital, it may increase our costs of capital or result in stockholder dilution.
We have historically funded our homebuilding and financial services activities with internally generated cash flows and external sources of debt and equity financing. However, during the housing downturn, we relied primarily on the positive operating cash flow we generated, principally through the receipt of federal income tax refunds, and from home and land sales and our efforts to reduce our overhead costs, to meet our working capital needs and to repay outstanding indebtedness. In recent years, the impact of the housing downturn in reducing our stockholders’ equity and increasing our debt-to-capital ratio and volatility in the financial and credit markets made external sources of liquidity less available and more costly to us. In 2013, relatively favorable housing and credit market conditions enabled us to refinance and extend the maturity of our outstanding senior notes due in 2014 and certain of our outstanding senior notes due in 2015 through the issuance of new senior notes, albeit at somewhat higher interest rates than the refinanced debt, and to raise unrestricted cash for general business purposes. We also entered into the Credit Facility. We can provide no assurances, however, that we will be able to access external credit or equity markets in 2014 at favorable terms or at all.
Market conditions in 2014 and beyond may significantly limit our ability to replace or refinance indebtedness, particularly given the ratings of our senior notes by the three principal nationally recognized registered credit rating agencies, as discussed further below. The terms of potential future issuances of indebtedness by us may be more restrictive than the terms governing our current indebtedness, and the issuance, interest and debt service expenses are likely to be higher, as was the case with the new senior notes we issued in 2013. In addition, our lower stock price and unrestricted cash balance compared to the level reached before the housing downturn began and volatility in the stock markets could also impede our access to the equity markets or increase the amount of dilution our stockholders would experience should we seek to raise capital through the issuance of new equity or convertible securities.
While we believe we can meet our forecasted capital requirements from our cash resources, expected future cash flow, capital markets access and the external financing sources that we anticipate will be available to us, we can provide no assurance that we will be able to do so, or do so without incurring substantially higher costs or significantly diluting existing stockholders’ equity interests. The adverse effects of these conditions on our business, liquidity and consolidated financial statements could be material to us.
We have a substantial amount of indebtedness in relation to our tangible net worth and unrestricted cash balance, which may restrict our ability to meet our operational and strategic goals.
As of November 30, 2013, we had total outstanding debt of
$2.15 billion
, total stockholders’ equity of
$536.1 million
, and an unrestricted cash balance of
$530.1 million
. The amount of our debt overall and relative to our total stockholders’ equity and unrestricted cash balance could have important consequences. For example, it could:
|
•
|
limit our ability to obtain future financing for working capital, capital expenditures, acquisitions, debt service requirements or other business needs, including, but not limited to, supporting our strategic growth initiatives;
|
23
|
•
|
limit our ability to maintain compliance with the financial covenants of the Credit Facility or to renew or, if necessary or desirable, expand the capacity of the Credit Facility;
|
|
•
|
limit our ability to renew or, if necessary or desirable, expand the capacity of any letter of credit facilities, and to obtain performance bonds in the ordinary course of our business;
|
|
•
|
require us to dedicate a substantial portion of our cash flow from operations to the collateralization or payment of our debt and reduce our ability to use our cash flow for other purposes;
|
|
•
|
impact our flexibility in planning for, or reacting to, changes in our business;
|
|
•
|
limit our ability to implement our present strategies, particularly our land acquisition and development plans and asset activation initiatives, in part due to competition from other homebuilders, developers and investors with greater available liquidity or balance sheet strength;
|
|
•
|
place us at a competitive disadvantage because we have more debt or debt-related restrictions than some of our competitors; and
|
|
•
|
make us more vulnerable in the event of weakness or a downturn in our business or in general economic or housing market conditions.
|
Our ability to meet our debt service and other obligations will depend on our future performance. Our business is substantially affected by changes in economic cycles. Our revenues, earnings and cash flows vary with the level of general economic activity and competition in the markets in which we operate. They could also be affected by financial, political, regulatory, environmental and other factors, many of which are beyond our control. A higher interest rate on our debt could materially and adversely affect our consolidated financial statements.
Our business may not generate sufficient cash flow from operations and external financing at a reasonable cost may not be available to us in an amount sufficient to meet our debt service obligations, fulfill the financial or operational obligations we may have under certain unconsolidated joint venture transactions, support our letter of credit facilities (including the LOC Facilities), or to fund our other liquidity or operational needs. Further, if a change of control were to occur as defined in the instrument governing our senior notes, we would be required to offer to purchase all of our outstanding senior notes (with the exception of the amounts outstanding related to our 6 1/4% senior notes due 2015 (the “6 1/4% Senior Notes due 2015”) and our 7 1/4% senior notes due 2018 (the “7 1/4% Senior Notes due 2018”)) at 101% of their principal amount, together with all accrued and unpaid interest, if any. If a fundamental change under the terms of our 1.375% convertible senior notes due 2019 (the “1.375% Convertible Senior Notes due 2019”), which includes a change of control, occurs prior to their stated maturity date, the holders may require us to purchase for cash all or any portion of their notes at 100% of the principal amount of the notes, plus accrued and unpaid interest to, but not including, the fundamental change purchase date. In such circumstances of an applicable change of control and/or fundamental change, if we are unable to generate sufficient cash flow from operations, we may, given our unrestricted cash balance, need to refinance and/or restructure with our lenders or other creditors all or a portion of our outstanding debt obligations on or before their maturity, which we may not be able to do on favorable terms or at all, or raise capital through equity or convertible security issuances that would dilute existing stockholders’ interests, and the impact on our consolidated financial statements would be material and adverse.
Failure to comply with the restrictions and covenants imposed by the Credit Facility could restrict future borrowing or cause any outstanding indebtedness to become immediately due and payable.
Under the terms of the Credit Facility, we are required, among other things, to maintain compliance with various covenants, including financial covenants relating to our tangible net worth, leverage, and interest coverage or liquidity. The Credit Facility is also governed by a borrowing base test and includes a limitation on investments in joint ventures and non-guarantor subsidiaries. In addition, the existence of these restrictions and covenants may influence our operating decisions to enter into or structure certain transactions in order to maintain compliance. If we fail to comply, the participating financial institutions could terminate the Credit Facility, cause borrowings under the Credit Facility, if any, to become immediately due and payable and/or could demand that we compensate them for waiving instances of noncompliance. In addition, under certain circumstances, a default under the Credit Facility could cause a default with respect to our senior or convertible senior notes and result in the acceleration of the maturity of our senior or convertible senior notes and our inability to borrow under the Credit Facility, which would have a material adverse impact on our liquidity and on our consolidated financial statements. Moreover, we may need to curtail our investment activities and other uses of cash to maintain compliance with the restrictions and covenants under the Credit Facility.
24
Our ability to obtain external financing could be adversely affected by a negative change in our credit rating by a third-party rating agency.
Our ability to access the capital markets and external financing sources on favorable terms is a key factor in our ability to fund our operations and to grow our business. As of the date of this report, our credit rating by Fitch Ratings is B+, with a stable outlook, our credit rating by Moody’s Investor Services is B2, with a stable outlook, and our credit rating by Standard and Poor’s Financial Services is B, with a stable outlook. Downgrades of our credit rating by any of these principal nationally recognized registered credit rating agencies may make it more difficult and costly for us to access the capital markets and external financing sources, and could have a material adverse effect on our consolidated financial statements.
We may have difficulty in continuing to obtain the additional financing required to operate and develop our business.
Our homebuilding operations and our present strategies require significant amounts of cash and/or the availability of external financing. We have entered into the Credit Facility and the LOC Facilities in order to support certain aspects of our operations in the ordinary course of our business, including our acquisition of land and our development of new home communities and other of our strategic growth initiatives. We anticipate that we will need to maintain the Credit Facility and the LOC Facilities in 2014, and, if necessary or desirable, we may seek to expand their capacities or enter into additional such facilities, or other similar facility arrangements with the same or other financial institutions. It is not possible to predict the future terms or availability of additional external capital or for maintaining or, if necessary or desirable, expanding the capacity of the Credit Facility or the LOC Facilities or entering into additional such facilities. Moreover, our outstanding senior notes and convertible senior notes contain provisions that may restrict the amount and nature of debt we may incur in the future. As the financial and credit markets worldwide have been experiencing and may continue to experience volatility, there can be no assurance that we can at reasonable cost actually borrow additional funds, raise additional capital through other means, or successfully maintain or, if necessary or desirable, expand the capacity of the Credit Facility or the LOC Facilities or enter into additional such facilities, each of which depends, among other factors, on conditions in the capital markets and our perceived credit worthiness, as discussed above. If conditions in the financial and credit markets continue to be volatile or worsen, whether generally, or for homebuilders or us in particular, it could reduce our ability to generate home sales and may hinder our future growth and materially impact our consolidated financial statements. Potential federal and state regulations limiting the investment activities of financial institutions, including regulations that have been or may be issued under the Dodd-Frank Act, could also impact our ability to access the capital markets, to obtain additional external financing and to maintain or, if necessary or desirable, expand the Credit Facility or the LOC Facilities or enter into additional such facilities, in each case on acceptable terms or at all.
Failure to comply with the covenants and conditions imposed by the agreements governing our indebtedness could restrict future borrowing or cause our debt to become immediately due and payable.
The indenture governing our outstanding senior notes and convertible senior notes imposes restrictions on our business operations and activities. Though it does not contain any financial maintenance covenants, the indenture contains certain restrictive covenants that, among other things, limit our ability to incur secured indebtedness, to engage in sale-leaseback transactions involving property or assets above a specified value, and, as in the case of four of our outstanding senior notes and our convertible senior notes, to engage in mergers, consolidations, and sales of assets. Due to financial and credit market conditions, we may also need to include additional covenants, obligations or restrictions in our indenture or with respect to a specific issuance of securities or to our currently outstanding securities. If we fail to comply with these covenants, obligations or restrictions, the holders of our senior notes or convertible senior notes could cause our debt to become due and payable prior to maturity or could demand that we compensate them for waiving instances of noncompliance, and, if they are successful in doing so, the impact on our consolidated financial statements would be material and adverse. In addition, a default under any series of our senior notes or convertible senior notes could cause a default with respect to our other senior notes and result in the acceleration of the maturity of all such defaulted indebtedness and other debt obligations, as well as penalties or additional fees, which would have a material adverse impact on our consolidated financial statements.
We may not realize our deferred income tax assets. In addition, our net operating loss carryforwards could be substantially limited if we experience an ownership change as defined in the Internal Revenue Code.
Since the end of our 2007 fiscal year, we have generated a significant deferred tax asset as a result of our net operating losses (“NOL”). Under federal tax laws, we can use our NOL (and certain related tax credits) to reduce our future taxable income for up to 20 years, after which they expire for such purposes. In 2013, we were able to use a portion of our deferred tax assets to offset the taxable income we generated for the year. Until they expire, we can carry forward our NOL (and certain related tax credits) that we do not use in any particular year to reduce our taxable income in future years, and we have recorded a valuation allowance against our net deferred tax assets that include the NOL (and certain related tax credits) that we have generated but have not yet realized. At November 30, 2013, we had deferred tax assets, net of deferred tax liabilities, totaling
$859.4 million
25
against which we have provided a full valuation allowance. Our ability to realize our net deferred tax assets is based on the extent to which we generate sustained profits and we cannot provide any assurances as to when and to what extent we will generate sufficient future taxable income to realize our net deferred tax assets, whether in whole or in part.
The majority of our net deferred tax asset is federal related and is valued at a 35% corporate income tax rate. If, as some lawmakers have proposed, the U.S. corporate income tax rate is lowered, we would be required to write down a roughly proportionate amount of the value of our federal net deferred tax asset to account for this lower rate. We would also need to record a corresponding write down of our valuation allowance. The lower tax rate would reduce our future federal taxes, which may put a portion of our tax credits at risk of expiring before we could use them.
In addition, the benefits of our NOL, built-in losses and tax credits would be reduced or potentially eliminated if we experienced an “ownership change,” as determined under Internal Revenue Code Section 382 (“Section 382”). A Section 382 ownership change occurs if a stockholder or a group of stockholders who are deemed to own at least 5% of our common stock increase their ownership by more than 50 percentage points over their lowest ownership percentage within a rolling three-year period. If an ownership change were to occur, Section 382 would impose an annual limit on the amount of NOL we could use to reduce our taxable income equal to the product of the total value of our outstanding equity immediately prior to the ownership change (reduced by certain items specified in Section 382) and the federal long-term tax-exempt interest rate in effect for the month of the ownership change. A number of complex rules apply in calculating this annual limit.
While the complexity of Section 382’s provisions and the limited knowledge any public company has about the ownership of its publicly-traded stock make it difficult to determine whether an ownership change has occurred, we currently believe that an ownership change has not occurred. However, if an ownership change were to occur, the annual limit Section 382 may impose could result in a material amount of our NOL expiring unused. This would significantly impair the value of our NOL and, as a result, have a material negative impact on our consolidated financial statements.
In 2009, our stockholders approved an amendment to our restated certificate of incorporation that is designed to block transfers of our common stock that could result in an ownership change, and a rights agreement pursuant to which we have issued certain stock purchase rights with terms designed to deter transfers of our common stock that could result in an ownership change. However, these measures cannot guarantee complete protection against an ownership change and it remains possible that one may occur.
Our consolidated financial statements could be materially and adversely affected if we are unable to obtain performance bonds and/or letters of credit.
In the course of developing our communities, we
are often required to provide to various municipalities and other government agencies performance bonds and/or letters of credit to secure the completion of our projects and/or in support of obligations to build community improvements such as roads, sewers, water systems and other utilities, and to support similar development activities by certain of our unconsolidated joint ventures.
We may also be required to provide performance bonds and/or letters of credit to secure our performance under various escrow agreements, financial guarantees and other arrangements. Our ability to obtain such bonds or letters of credit and the cost to do so depend on our credit rating, overall market capitalization, available capital, past operational and financial performance, management expertise and other factors, including prevailing surety market conditions, and the underwriting practices and resources of performance bond and/or letter of credit issuers. If we are unable to obtain performance bonds and/or letters of credit when required or the cost or operational restrictions or conditions imposed by issuers to obtain them increases significantly in 2014 or later, we may not be able to develop or we may be significantly delayed in developing a community or communities and/or we may incur significant additional expenses, and, as a result, our consolidated financial statements, cash flows and/or liquidity could be materially and adversely affected.
Our ability to attract and retain talent is critical to the success of our business and a failure to do so may materially and adversely affect our performance.
Our officers and employees are an important resource, and we see attracting and retaining a dedicated and talented team to execute our KBnxt operational business model as crucial to our ability to achieve and maintain an advantage over other homebuilders. We face intense competition for qualified personnel, particularly at senior management levels, from other homebuilders, from other companies in the housing and real estate industries, particularly with the increased residential construction activity in 2012 and 2013, and from companies in various other industries with respect to certain roles or functions. Moreover, the prolonged housing downturn and the decline in the market value of our common stock during the housing downturn have made it difficult for us to attract and retain talent, even as we are making a targeted effort to strengthen and expand certain of our local field management teams and talent as part of our strategic growth initiatives. If we are unable to continue to retain and attract qualified employees, or if we need to significantly increase compensation and benefits to do so (including as a result of complying with pending health care coverage requirements of the federal Patient Protection and Affordable Care Act and the Health Care
26
Education Reconciliation Act of 2010), or, alternatively, if we are required or believe it is appropriate to reduce our overhead expenses through significant personnel reductions or adjustments to compensation and benefits, our performance, our ability to achieve and maintain a competitive advantage and our consolidated financial statements could be materially and adversely affected.
Changes in global or regional environmental conditions and governmental actions in response to such changes may adversely affect us by increasing the costs of or restricting our planned or future growth activities.
There is growing concern from members of the scientific community and the general public that an increase in global average temperatures due to emissions of greenhouse gases and other human activities have caused or will cause significant changes in weather patterns and increase the frequency and severity of natural disasters. An increased frequency or duration of extreme weather conditions and environmental events could limit, delay and/or increase the costs to develop land and build new homes and reduce the value of our land and housing inventory in locations that become less desirable to consumers or blocked to development. Projected climate change, if it occurs, may exacerbate the scarcity of water and other natural resources in affected regions, which could limit, prevent or increase the costs of residential development in certain areas. In addition, government mandates, standards or regulations intended to mitigate or reduce greenhouse gas emissions or projected climate change impacts could result in prohibitions or severe restrictions on land development in certain areas, increase energy, transportation and raw material costs that make building materials less available or more expensive, or cause us to incur compliance expenses and other financial obligations to meet permitting or land development- or home construction-related requirements that we will be unable to fully recover (due to market conditions or other factors), and reduce our housing gross profit margins and adversely affect our consolidated financial statements, potentially to a material degree. As a result, climate change impacts, and laws and land development and home construction standards, and/or the manner in which they are interpreted or implemented, to address potential climate change impacts, could increase our costs and have a long-term adverse impact on our business and our consolidated financial statements. This is a particular concern with respect to our key West Coast homebuilding reporting segment, as California has instituted some of the most extensive and stringent environmental laws and residential building construction standards in the country.
Information technology failures and data security breaches could harm our business.
We use information technology, digital telecommunications and other computer resources to carry out important operational and promotional marketing activities and to maintain our business records. Many of these resources are provided to us and/or maintained on our behalf by third-party service providers pursuant to agreements that specify to varying degrees certain security and service level standards. Although we and our service providers employ what we believe are adequate security, disaster recovery and other preventative and corrective measures, our ability to conduct our business may be impaired if these resources, including our primary website, are compromised, degraded, damaged or fail, whether due to a virus or other harmful circumstance, intentional penetration or disruption of our information technology resources by a third party, natural disaster, hardware or software corruption or failure or error (including a failure of security controls incorporated into or applied to such hardware or software), telecommunications system failure, service provider error or failure, intentional or unintentional personnel actions (including the failure to follow our security protocols), or lost connectivity to our networked resources. A significant and extended disruption in the functioning of these resources, including our primary website, could damage our reputation and cause us to lose customers, orders, deliveries of homes and revenues, result in the unintended and/or unauthorized public disclosure or the misappropriation of proprietary, personal identifying and confidential information (including information about our homebuyers and business partners), and require us to incur significant expense to address and remediate or otherwise resolve these kinds of issues. The release of confidential information may also lead to litigation or other proceedings against us by affected individuals and/or business partners and/or by regulators, and the outcome of such proceedings, which could include penalties or fines and cause reputational harm, could have a material and adverse effect on our consolidated financial statements. In addition, the costs of maintaining adequate protection against such threats, depending on their evolution, pervasiveness and frequency and/or government-mandated standards or obligations regarding protective efforts, could be material to our consolidated financial statements in a particular period or over various periods.
|
Item 1B.
|
UNRESOLVED STAFF COMMENTS
|
None.
|
Item 2.
|
PROPERTIES
|
We lease our corporate headquarters in Los Angeles, California. Our homebuilding division offices (except for our San Antonio, Texas office) and our KB Home Studios are located in leased space in the markets where we conduct business. We own the premises for our San Antonio office.
27
We believe that such properties, including the equipment located therein, are suitable and adequate to meet the needs of our businesses.
|
Item 3.
|
LEGAL PROCEEDINGS
|
Nevada Development Contract Litigation
KB HOME Nevada Inc., a wholly owned subsidiary of ours (“KB Nevada”), is a defendant in a case in the Eighth Judicial District Court in Clark County, Nevada entitled
Las Vegas Development Associates, LLC, Essex Real Estate Partners, LLC, et al. v. KB HOME Nevada Inc.
In 2007, Las Vegas Development Associates, LLC (“LVDA”) agreed to purchase from KB Nevada approximately
83
acres of land located near Las Vegas, Nevada. LVDA subsequently assigned its rights to Essex Real Estate Partners, LLC (“Essex”).
KB Nevada and Essex entered into a development agreement relating to certain major infrastructure improvements. LVDA’s and Essex’s complaint, initially filed in 2008, alleged that KB Nevada breached the development agreement, and also alleged that KB Nevada fraudulently induced them to enter into the purchase and development agreements. LVDA’s and Essex’s lenders subsequently filed related actions that were consolidated into the LVDA/Essex matter. The consolidated plaintiffs sought rescission of the agreements or, in the alternative, compensatory damages of
$55 million
plus unspecified punitive damages and other damages, and interest charges in excess of $41 million (the “Claimed Damages”).
KB Nevada has denied the allegations, and believes it has meritorious defenses to the consolidated plaintiffs’ claims. At a November 19, 2012 hearing, the court denied all of the consolidated plaintiffs’ motions for summary judgment on their claims. In addition, the court granted several of KB Nevada's motions for summary judgment, eliminating, among other of the consolidated plaintiffs’ claims, all claims for fraud, negligent misrepresentation, and punitive damages. With the court’s decisions, the only remaining claims against KB Nevada are for contract damages and rescission. In August 2013, the court granted motions that further narrowed the scope of the Claimed Damages. While the ultimate outcome is uncertain — we believe it is reasonably possible that the loss in this matter could range from
zero
to approximately $55 million
plus pre-judgment interest, which could be material to our consolidated financial statements — KB Nevada believes it will be successful in defending against the consolidated plaintiffs’ remaining claims and that the consolidated plaintiffs will not be awarded rescission or damages. The non-jury trial, originally set for September 2012, was recently continued again until May 20, 2014.
Other Matters
In addition to the specific proceeding described above,
we are involved in other litigation and regulatory proceedings incidental to our business that are in various procedural stages. We believe that the accruals we have recorded for probable and reasonably estimable losses with respect to these proceedings are adequate and that,
as of November 30, 2013,
it was not reasonably possible that an additional material loss had been incurred in an amount in excess of the estimated amounts already recognized on our consolidated financial statements. We evaluate our accruals for litigation and regulatory proceedings at least quarterly and, as appropriate, adjust them to reflect (a) the facts and circumstances known to us at the time, including information regarding negotiations, settlements, rulings and other relevant events and developments; (b) the advice and analyses of counsel; and (c) the assumptions and judgment of management. Similar factors and considerations are used in establishing new accruals for proceedings as to which losses have become probable and reasonably estimable at the time an evaluation is made. Based on our experience, we believe that the amounts that may be claimed or alleged against us in these proceedings are not a meaningful indicator of our potential liability. The outcome of any of these proceedings, including the defense and other litigation-related costs and expenses we may incur, however, is inherently uncertain and could differ significantly from the estimate reflected in a related accrual, if made. Therefore, it is possible that the ultimate outcome of any proceeding, if in excess of a related accrual or if no accrual had been made, could be material to our consolidated financial statements.
|
Item 4.
|
MINE SAFETY DISCLOSURES
|
Not applicable.
28
EXECUTIVE OFFICERS OF THE REGISTRANT
The following table presents certain information regarding our executive officers as of December 31, 2013:
|
Name
|
Age
|
Present Position
|
Year
Assumed
Present
Position
|
Years
at
KB
Home
|
Other Positions and Other
Business Experience within the
Last Five Years (a)
|
From – To
|
||||||
|
Jeffrey T. Mezger
|
58
|
President and Chief Executive Officer (b)
|
2006
|
20
|
||||||||
|
Jeff J. Kaminski
|
52
|
Executive Vice President and Chief Financial Officer
|
2010
|
3
|
Senior Vice President, Chief Financial Officer and Strategy Board member, Federal-Mogul Corporation (a global supplier of component parts and systems to the automotive, heavy-duty, industrial and transport markets)
|
2008-2010
|
||||||
|
Albert Z. Praw
|
65
|
Executive Vice President, Real Estate and Business Development
|
2011
|
17 (c)
|
Chief Executive Officer, Landstone Communities, LLC (a real estate development company)
|
2006-2011
|
||||||
|
Brian J. Woram
|
53
|
Executive Vice President and General Counsel
|
2010
|
3
|
Senior Vice President and Chief Legal Officer, H&R Block, Inc. (a provider of tax, banking and business and consulting services)
|
2009-2010
|
||||||
|
Senior Vice President, Chief Legal Officer and Chief Compliance Officer, Centex Corporation (a homebuilder and provider of mortgage banking services)
|
2005-2009
|
|||||||||||
|
William R. Hollinger
|
55
|
Senior Vice President and Chief Accounting Officer
|
2007
|
26
|
||||||||
|
Thomas F. Norton
|
43
|
Senior Vice President, Human Resources
|
2009
|
5
|
Chief Human Resources Officer, BJ’s Restaurants, Inc. (an owner and operator of national full service restaurants)
|
2006-2009
|
||||||
|
Tom Silk
|
45
|
Senior Vice President, Marketing and Communications
|
2011
|
2
|
Vice President of Marketing for Hydration and Juice Brands, PepsiCo Beverages Americas (a beverage marketing and distribution company)
|
2009-2011
|
||||||
|
Senior Director, Global Brand Management, Activision Blizzard, Inc. (a game publisher of interactive entertainment software)
|
2006-2009
|
|||||||||||
|
(a)
|
All positions described were with us, unless otherwise indicated.
|
|
(b)
|
Mr. Mezger has served as a director since 2006.
|
|
(c)
|
Mr. Praw was employed by us from 1989-1992 and from 1994-2006. He was elected to his present position in October 2011.
|
There is no family relationship between any of our executive officers or between any of our executive officers and any of our directors.
29
|
Item 5.
|
MARKET FOR REGISTRANT
’
S COMMON EQUITY, RELATED STOCKHOLDER MATTERS AND ISSUER PURCHASES OF EQUITY SECURITIES
|
As of December 31, 2013, there were 704 holders of record of our common stock. Our common stock is traded on the New York Stock Exchange under the ticker symbol “KBH.” The following table presents, for the periods indicated, the price ranges of our common stock, and cash dividends declared and paid per share:
|
|
Year Ended November 30, 2013
|
Year Ended November 30, 2012
|
|||||||||||||||||||||||||||||
|
|
High
|
Low
|
Dividends
Declared
|
Dividends
Paid
|
High
|
Low
|
Dividends
Declared
|
Dividends
Paid
|
|||||||||||||||||||||||
|
First Quarter
|
$
|
20.04
|
|
$
|
13.86
|
|
$
|
.0250
|
|
$
|
.0250
|
|
$
|
12.91
|
|
$
|
6.17
|
|
$
|
.0625
|
|
$
|
.0625
|
|
|||||||
|
Second Quarter
|
25.14
|
|
18.21
|
|
.0250
|
|
.0250
|
|
13.12
|
|
6.77
|
|
.0250
|
|
.0250
|
|
|||||||||||||||
|
Third Quarter
|
22.49
|
|
15.57
|
|
.0250
|
|
.0250
|
|
11.25
|
|
6.46
|
|
.0250
|
|
.0250
|
|
|||||||||||||||
|
Fourth Quarter
|
18.98
|
|
15.48
|
|
.0250
|
|
.0250
|
|
17.30
|
|
10.89
|
|
.0250
|
|
.0250
|
|
|||||||||||||||
The declaration and payment of cash dividends on shares of our common stock, whether at current levels or at all, are at the discretion of our board of directors, and depend upon, among other things, our expected future earnings, cash flows, capital requirements, debt structure and adjustments thereto, operational and financial investment strategy and general financial condition, as well as general business conditions.
The description of our equity compensation plans required by Item 201(d) of Regulation S-K is incorporated herein by reference to “Part III — Item 12. Security Ownership of Certain Beneficial Owners and Management and Related Stockholder Matters” of this report.
We did not repurchase any of our equity securities during the fourth quarter of 2013.
30
Stock Performance Graph
The graph below compares the five-year cumulative total return of KB Home common stock, the S&P 500 Index, the S&P Homebuilding Index and the Dow Jones Home Construction Index for the periods ended November 30.
Comparison of Five-Year Cumulative Total Return
Among KB Home, S&P 500 Index, S&P Homebuilding
Index and Dow Jones Home Construction Index
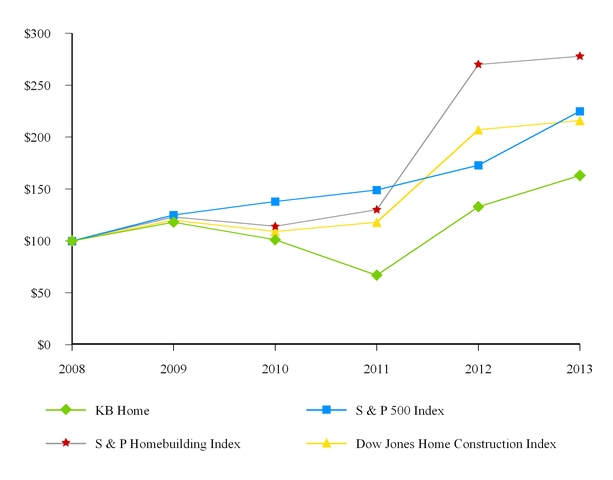
|
2008
|
2009
|
2010
|
2011
|
2012
|
2013
|
||||||||||||
|
KB Home
|
100
|
|
118
|
|
101
|
|
67
|
|
133
|
|
163
|
|
|||||
|
S & P 500 Index
|
100
|
|
125
|
|
138
|
|
149
|
|
173
|
|
225
|
|
|||||
|
S & P Homebuilding Index
|
100
|
|
123
|
|
114
|
|
130
|
|
270
|
|
278
|
|
|||||
|
Dow Jones Home Construction Index
|
100
|
|
120
|
|
109
|
|
118
|
|
207
|
|
216
|
|
|||||
The above graph is based on the KB Home common stock and index prices calculated as of the last trading day before December 1 of the year-end periods presented. The closing price of KB Home common stock on the New York Stock Exchange was $17.53 per share on
November 30, 2013
and $14.36 per share on November 30, 2012. The performance of our common stock depicted in the graphs above represents past performance only and is not indicative of future performance. Total return assumes $100 invested at market close on November 30, 2008 in KB Home common stock, the S&P 500 Index, the S&P Homebuilding Index and the Dow Jones Home Construction Index including reinvestment of dividends.
31
|
Item 6.
|
SELECTED FINANCIAL DATA
|
The data in this table should be read in conjunction with “Item 7. Management’s Discussion and Analysis of Financial Condition and Results of Operations” and our Consolidated Financial Statements and the Notes thereto, which are included in “Item 8. Financial Statements and Supplementary Data.” Both are included in this report.
KB HOME
SELECTED FINANCIAL INFORMATION
(Dollars In Thousands, Except Per Share Amounts)
|
|
Years Ended November 30,
|
||||||||||||||||||
|
|
2013
|
2012
|
2011
|
2010
|
2009
|
||||||||||||||
|
Statement of Operations Data:
|
|||||||||||||||||||
|
Revenues:
|
|||||||||||||||||||
|
Homebuilding
|
$
|
2,084,978
|
|
$
|
1,548,432
|
|
$
|
1,305,562
|
|
$
|
1,581,763
|
|
$
|
1,816,415
|
|
||||
|
Financial services
|
12,152
|
|
11,683
|
|
10,304
|
|
8,233
|
|
8,435
|
|
|||||||||
|
Total
|
$
|
2,097,130
|
|
$
|
1,560,115
|
|
$
|
1,315,866
|
|
$
|
1,589,996
|
|
$
|
1,824,850
|
|
||||
|
Operating income (loss):
|
|||||||||||||||||||
|
Homebuilding
|
$
|
92,084
|
|
$
|
(20,256
|
)
|
$
|
(103,074
|
)
|
$
|
(16,045
|
)
|
$
|
(236,520
|
)
|
||||
|
Financial services
|
9,110
|
|
8,692
|
|
6,792
|
|
5,114
|
|
5,184
|
|
|||||||||
|
Total
|
$
|
101,194
|
|
$
|
(11,564
|
)
|
$
|
(96,282
|
)
|
$
|
(10,931
|
)
|
$
|
(231,336
|
)
|
||||
|
Pretax income (loss)
|
$
|
38,363
|
|
$
|
(79,053
|
)
|
$
|
(181,168
|
)
|
$
|
(76,368
|
)
|
$
|
(311,184
|
)
|
||||
|
Net income (loss)
|
$
|
39,963
|
|
$
|
(58,953
|
)
|
$
|
(178,768
|
)
|
$
|
(69,368
|
)
|
$
|
(101,784
|
)
|
||||
|
Earnings (loss) per share:
|
|||||||||||||||||||
|
Basic
|
$
|
.48
|
|
$
|
(.76
|
)
|
$
|
(2.32
|
)
|
$
|
(.90
|
)
|
$
|
(1.33
|
)
|
||||
|
Diluted
|
$
|
.46
|
|
$
|
(.76
|
)
|
$
|
(2.32
|
)
|
$
|
(.90
|
)
|
$
|
(1.33
|
)
|
||||
|
Cash dividends declared per common share
|
$
|
.1000
|
|
$
|
.1375
|
|
$
|
.2500
|
|
$
|
.2500
|
|
$
|
.2500
|
|
||||
|
Balance Sheet Data:
|
|||||||||||||||||||
|
Assets:
|
|||||||||||||||||||
|
Homebuilding
|
$
|
3,183,595
|
|
$
|
2,557,243
|
|
$
|
2,480,369
|
|
$
|
3,080,306
|
|
$
|
3,402,565
|
|
||||
|
Financial services
|
10,040
|
|
4,455
|
|
32,173
|
|
29,443
|
|
33,424
|
|
|||||||||
|
Total
|
$
|
3,193,635
|
|
$
|
2,561,698
|
|
$
|
2,512,542
|
|
$
|
3,109,749
|
|
$
|
3,435,989
|
|
||||
|
Mortgages and notes payable
|
$
|
2,150,498
|
|
$
|
1,722,815
|
|
$
|
1,583,571
|
|
$
|
1,775,529
|
|
$
|
1,820,370
|
|
||||
|
Stockholders’ equity
|
$
|
536,086
|
|
$
|
376,806
|
|
$
|
442,657
|
|
$
|
631,878
|
|
$
|
707,224
|
|
||||
|
Homebuilding Data:
|
|||||||||||||||||||
|
Net orders
|
7,125
|
|
6,703
|
|
6,632
|
|
6,556
|
|
8,341
|
|
|||||||||
|
Unit backlog
|
2,557
|
|
2,577
|
|
2,156
|
|
1,336
|
|
2,126
|
|
|||||||||
|
Homes delivered
|
7,145
|
|
6,282
|
|
5,812
|
|
7,346
|
|
8,488
|
|
|||||||||
32
|
Item 7.
|
MANAGEMENT
’
S DISCUSSION AND ANALYSIS OF FINANCIAL CONDITION AND RESULTS OF OPERATIONS
|
RESULTS OF OPERATIONS
Overview.
Revenues are generated from our homebuilding and financial services operations. The following table presents a summary of our consolidated results of operations for the years ended November 30, 2013, 2012 and 2011 (in thousands, except per share amounts):
|
|
Years Ended November 30,
|
Variance
|
|||||||||||||||
|
|
2013
|
2012
|
2011
|
2013 vs 2012
|
2012 vs 2011
|
||||||||||||
|
Revenues:
|
|||||||||||||||||
|
Homebuilding
|
$
|
2,084,978
|
|
$
|
1,548,432
|
|
$
|
1,305,562
|
|
35
|
%
|
19
|
%
|
||||
|
Financial services
|
12,152
|
|
11,683
|
|
10,304
|
|
4
|
|
13
|
|
|||||||
|
Total
|
$
|
2,097,130
|
|
$
|
1,560,115
|
|
$
|
1,315,866
|
|
34
|
%
|
19
|
%
|
||||
|
Pretax income (loss):
|
|||||||||||||||||
|
Homebuilding
|
$
|
28,179
|
|
$
|
(89,936
|
)
|
$
|
(207,246
|
)
|
(a)
|
|
57
|
%
|
||||
|
Financial services
|
10,184
|
|
10,883
|
|
26,078
|
|
(6
|
)
|
(58
|
)
|
|||||||
|
Total pretax income (loss)
|
38,363
|
|
(79,053
|
)
|
(181,168
|
)
|
(a)
|
|
56
|
|
|||||||
|
Income tax benefit
|
1,600
|
|
20,100
|
|
2,400
|
|
(92
|
)
|
738
|
|
|||||||
|
Net income (loss)
|
$
|
39,963
|
|
$
|
(58,953
|
)
|
$
|
(178,768
|
)
|
(a)
|
|
67
|
%
|
||||
|
Earnings (loss) per share:
|
|||||||||||||||||
|
Basic
|
$
|
.48
|
|
$
|
(.76
|
)
|
$
|
(2.32
|
)
|
(a)
|
|
67
|
%
|
||||
|
Diluted
|
$
|
.46
|
|
$
|
(.76
|
)
|
$
|
(2.32
|
)
|
(a)
|
|
67
|
%
|
||||
(a) Percentage not meaningful.
The U.S. housing market continued to improve in 2013, supported by steady demand, low inventories of homes available for sale, relatively high housing affordability, and a generally favorable economic environment. However, the performance of individual housing markets varied over the course of 2013, and rising mortgage loan interest rates and home price levels, and a decline in consumer confidence in the fall, tempered home sales activity in the second half of the year. We believe this recent moderation in activity, which has slowed the rate of increases in home selling prices, may provide a healthier foundation for a strong, sustainable housing recovery, and that additional progress will be made in many housing markets and by the overall homebuilding industry in 2014.
We achieved measurably improved financial performance on key metrics in our business in each quarter of 2013, including year-over-year growth in revenues, expansion of our housing gross profit margin and improvement in our bottom line results, and generated full-year profitability for the first time in several years. We believe these improvements largely resulted from the various ongoing strategic initiatives we have implemented over the past few years to reposition our homebuilding activities and investments toward higher-performing, desirable locations in land constrained growth markets, refine our products to meet consumer preferences, and sharpen our focus on reaching our profitability and growth goals. We also benefited from the overall improvement in housing markets. Our success in implementing these initiatives was particularly evident in our West Coast homebuilding reporting segment, which generated nearly half of our revenues in 2013. This segment’s average selling price rose
20%
and its housing gross profit margin improved
840
basis points in 2013 compared to results in the prior year.
We took a number of steps in 2013 to further strengthen our business and to support our strategic growth initiatives. We raised capital in both public equity and debt markets, generating total net proceeds of
$775.5 million
through the concurrent underwritten public issuance of the 1.375% Convertible Senior Notes due 2019 and the underwritten public offering of 6,325,000 shares of our common stock, par value $1.00 per share, at a price of $18.25 per share (the “Common Stock Offering”), and the underwritten public issuance of our 7.00% senior notes due 2021 (the “7.00% Senior Notes due 2021”); entered into the Credit Facility; retired
$215.1 million
in aggregate principal amount of certain of our senior notes due 2014 and 2015 through a combination of purchases made pursuant to the terms of the applicable tender offers that were initially made on October 15, 2013 (the “October 2013 Tender Offers”) and redemptions; used the net proceeds from the equity and senior notes issuances and positive cash flows from operations
33
to invest
$1.14 billion
in land and land development; and formed a mortgage banking company in partnership with Nationstar to offer mortgage banking services to our homebuyers.
We believe these actions enabled us to generate positive year-over-year results in 2013 in several key metrics:
|
•
|
Revenues
. Total revenues of
$2.10 billion
for the year ended November 30, 2013 rose
34%
from
$1.56 billion
for 2012. This increase was primarily due to a
35%
rise in housing revenues to
$2.08 billion
from
$1.55 billion
for 2012, reflecting increases in both the number of homes delivered and the overall average selling price of those homes. For 2013, our total revenues included land sale revenues of
$.9 million
, compared to no land sale revenues for 2012. Also included in our total revenues were financial services revenues of
$12.2 million
for 2013 and
$11.7 million
for 2012.
|
|
◦
|
Homes Delivered
. We delivered
7,145
homes in 2013, up
14%
from
6,282
homes delivered in 2012, partly due to our relatively higher backlog at the beginning of the year, which was up
20%
on a year-over-year basis, and the strategic positioning of our communities in locations with relatively strong demand.
|
|
◦
|
Average Selling Price
. The overall average selling price of our homes delivered increased
18%
in 2013 (and
10%
in 2012 compared to 2011). This year-over-year increase reflected our efforts over the past few years to strategically position our new home communities in submarkets where buyers have higher household income levels and stronger credit profiles, are choosing to purchase larger homes at higher price points and are spending more on design options and features at our KB Home Studios. The increase also reflected our emphasis on pricing discipline to balance sales pace and the selling prices of our homes in our communities open for sales; our leveraging of our KBnxt operational business model to generate incremental revenues from lot location, floor plan, home exterior elevation, structural and other premiums; and general market increases in home prices as the housing recovery has progressed.
|
|
•
|
Operating Income (Loss).
Our homebuilding operating income improved by
$112.4 million
to
$92.1 million
in 2013, compared to an operating loss of
$20.3 million
in 2012, reflecting higher housing gross profits, partly offset by higher selling, general and administrative expenses largely incurred to support our strategic growth initiatives. As a percentage of homebuilding revenues, our operating income was
4.4%
in 2013, compared to an operating loss of
1.3%
in 2012.
|
|
◦
|
Housing Gross Profits
. Housing gross profits of
$347.8 million
in 2013 increased by
$131.4 million
, or
61%
, from
$216.4 million
in 2012, primarily due to the higher volume of homes delivered and a higher housing gross profit margin. Our housing gross profit margin improved by
270
basis points to
16.7%
in 2013 from
14.0%
in 2012. Our housing gross profits for 2013 included a net charge of
$32.0 million
for water intrusion-related repairs at certain of our communities in central and southwest Florida, and
$3.6 million
of inventory impairment and land option contract abandonment charges. In 2012, our housing gross profits included insurance recoveries of
$26.5 million
related to repair costs and costs to handle claims with respect to previously delivered homes, including homes affected by allegedly defective drywall manufactured in China, and favorable net warranty adjustments of
$8.6 million
that reflected trends in our overall warranty claims experience. The insurance recoveries and favorable warranty adjustments were mostly offset by inventory impairment and land option contract abandonment charges of
$28.5 million
. Our adjusted housing gross profit margin improved by
490
basis points to
18.4%
in 2013 from
13.5%
in 2012. The calculation of adjusted housing gross profit margin, which we believe provides a clearer measure of the performance of our business, is described below under “Non-GAAP Financial Measures.” The year-over-year improvement in our adjusted housing gross profit margin primarily reflected our sharpened focus on reaching our growth and profitability goals and our actions to generate greater operating efficiencies, partly offset by the impact of higher direct construction labor and material costs in 2013.
|
|
◦
|
Selling, General and Administrative Expenses.
Selling, general and administrative expenses increased by
$19.2 million
, or
8%
, to
$255.8 million
in 2013 from
$236.6 million
in 2012, reflecting, among other things, the increased volume of homes delivered and higher housing revenues generated in 2013. Selling, general and administrative expenses for 2013 included the reversal of a previously established accrual of
$8.2 million
due to a favorable court decision. In 2012, selling, general and administrative expenses included an
$8.8 million
charge related to an unfavorable court decision in the same matter. As a percentage of housing revenues, to which these expenses are most closely correlated, selling, general and administrative expenses improved to
12.3%
in 2013, compared to
15.3%
in 2012, mainly due to the
35%
year-over-year increase in housing revenues and our ongoing focus on containing our overhead costs to the extent possible.
|
|
◦
|
Interest Expense.
Interest expense of
$62.7 million
for 2013 decreased from
$69.8 million
for 2012, reflecting an increase in the amount of our inventory qualifying for interest capitalization in 2013. Interest expense in 2013 included a
$10.4 million
loss on the early extinguishment of debt associated with the retirement of certain of our senior notes due in 2014 and 2015, as discussed above. In 2012, interest expense included a
$10.3 million
loss on the early extinguishment of debt associated with the purchase of certain of our senior notes due 2014 and 2015 pursuant to the
|
34
applicable tender offers that were initially made on January 19, 2012 (the “January 2012 Tender Offers”) and on July 11, 2012 (the “July 2012 Tender Offers”).
|
•
|
Net Income (Loss)
. We generated net income of
$40.0 million
, or
$.46
per diluted share, in 2013, compared to a net loss of
$59.0 million
, or
$.76
per diluted share, in 2012. Our net income for 2013 included net water intrusion-related charges, a loss on the early extinguishment of debt, inventory impairment and land option contract abandonment charges, and the reversal of a previously established accrual, all as described above. Our 2013 net income also included an income tax benefit of
$1.6 million
, reflecting the resolution of a state tax audit. Our net loss for 2012 included inventory impairment and land option contract abandonment charges of
$28.5 million
, a loss on the early extinguishment of debt of
$10.3 million
, and an unfavorable court decision charge of
$8.8 million
, which were partly offset by insurance recoveries of
$26.5 million
and favorable net warranty adjustments of
$8.6 million
, all as described above. The net loss in 2012 also included an income tax benefit of
$20.1 million
, reflecting the resolution of federal and state tax audits.
|
Balance Sheet
|
•
|
Cash, Cash Equivalents and Restricted Cash
. Our cash, cash equivalents and restricted cash totaled
$572.0 million
at November 30, 2013, compared to
$567.1 million
at November 30, 2012. Of our total cash, cash equivalents and restricted cash at November 30, 2013 and 2012,
$530.1 million
and
$524.8 million
, respectively, were unrestricted. In 2013, our operating activities used net cash of
$443.5 million
, compared to $
34.6 million
of net cash provided in 2012, largely due to investment in land and land development that drove our inventories higher at November 30, 2013 compared to the level at November 30, 2012.
|
|
•
|
Inventories.
Reflecting our investment in land and land development of
$1.14 billion
in 2013, our inventory balance at November 30, 2013 grew to
$2.30 billion
compared to the
$1.71 billion
balance at November 30, 2012. We made investments in land and land development in each of our homebuilding reporting segments in 2013, with the majority made in our West Coast homebuilding reporting segment. We ended 2013 with a land inventory portfolio comprised of
61,095
lots owned or controlled, representing an increase of
37%
from the
44,752
lots owned or controlled at November 30, 2012.
|
|
•
|
Mortgages and Notes Payable
. Our debt balance was
$2.15 billion
at November 30, 2013, up from
$1.72 billion
at November 30, 2012. This increase reflected the underwritten public issuances of the 1.375% Convertible Senior Notes due 2019 and the 7.00% Senior Notes due 2021, partly offset by the retirement of
$215.1 million
in aggregate principal amount of certain of our senior notes due in 2014 and 2015. Our ratio of debt to total capital was
80.0%
at November 30, 2013, compared to
82.1%
at November 30, 2012. Our ratio of net debt to total capital (a calculation that is described below under “Non-GAAP Financial Measures”) was
74.6%
at November 30, 2013 and
75.4%
at November 30, 2012.
|
|
•
|
Stockholders’ Equity.
Our stockholders’ equity increased to $
536.1 million
at November 30, 2013 from
$376.8 million
at November 30, 2012, primarily due to the Common Stock Offering and net income we generated in 2013, partly offset by the cash dividends we paid on our common stock.
|
Net Orders and Backlog
|
•
|
Net Orders
. Net orders from our homebuilding operations increased
6%
to
7,125
in 2013 from
6,703
in 2012. This growth in our overall net orders reflected increases of
14%
,
12%
and
21%
in our Southwest, Central and Southeast homebuilding reporting segments, respectively, partly offset by a
12%
decrease in our West Coast homebuilding reporting segment.
|
|
◦
|
The year-over-year decline in net orders from our West Coast homebuilding reporting segment was largely due to a
23%
decrease in the average community count in this segment, as we sold through older communities and shifted our investment strategy to favor coastal California submarkets. We also experienced delays in opening new communities, which in some cases were due to extended municipal processing times from increased construction activity and reduced local government budget and staffing levels. In addition, we deliberately managed our sales pace in 2013 in certain higher-margin, higher-demand communities in California to drive profitability.
|
|
◦
|
Rising mortgage loan interest rates and home price levels, and a drop in consumer confidence leading up to and during the federal government shutdown in the fall of 2013, slowed net order activity somewhat in all of our homebuilding reporting segments in the second half of the year as compared to the first half.
|
|
◦
|
The overall value of the net orders we generated in 2013 increased
24%
to
$2.16 billion
from
$1.73 billion
in 2012, largely due to higher average selling prices in each of our homebuilding reporting segments. Each of our homebuilding reporting segments generated year-over-year increases in net order value in 2013, with our West Coast homebuilding reporting segment up
14%
to
$976.1 million
, our Southwest homebuilding reporting segment up
42%
to
$191.1
|
35
million
, our Central homebuilding reporting segment up
31%
to
$636.9 million
, and our Southeast homebuilding reporting segment up
39%
to
$352.9 million
.
|
◦
|
Our cancellation rate was
32%
in 2013, compared to
31%
in 2012.
|
|
•
|
Backlog
. Our backlog was comprised of
2,557
homes, representing potential future housing revenues of
$682.5 million
, at November 30, 2013, and
2,577
homes, representing potential future housing revenues of
$618.6 million
, at November 30, 2012. The number of homes in our ending backlog was essentially flat year over year, reflecting a
39%
decrease in our West Coast homebuilding reporting segment that was offset by increases of
10%
,
16%
, and
7%
in our Southwest, Central and Southeast homebuilding reporting segments, respectively. In our West Coast homebuilding reporting segment, the number of homes in backlog at November 30, 2013 decreased from the previous year due to a year-over-year decline in net orders, as described above. The potential future housing revenues in our backlog at November 30, 2013 increased
10%
from the prior year, primarily reflecting the higher overall average selling price of the homes in backlog. Backlog value increased in each of our homebuilding reporting segments, except for the West Coast homebuilding reporting segment, where the backlog value decreased by
17%
year over year reflecting the lower number of homes in backlog, partly offset by a higher average selling price. Substantially all of the homes in our backlog at November 30, 2013 are expected to be delivered during the year ended November 30, 2014.
|
The following table presents information concerning our net orders, cancellation rate, ending backlog, and community count for the years ended November 30, 2013 and 2012 (dollars in thousands):
|
Years Ended November 30,
|
||||||||
|
2013
|
2012
|
|||||||
|
Net orders
|
7,125
|
|
6,703
|
|
||||
|
Net order value
|
$
|
2,157,065
|
|
$
|
1,733,146
|
|
||
|
Cancellation rate
|
32
|
%
|
31
|
%
|
||||
|
Ending backlog — homes
|
2,557
|
|
2,577
|
|
||||
|
Ending backlog — value
|
$
|
682,489
|
|
$
|
618,626
|
|
||
|
Ending community count
|
191
|
|
172
|
|
||||
|
Average community count
|
182
|
|
180
|
|
||||
Effective December 1, 2012, we revised the methodology for determining our community count. Based on our current methodology, an approach used by many other public homebuilders, our community count represents the number of new home communities with at least five homes/lots left to sell at the end of a reporting period. Previously, our community count represented the number of new home communities with at least one home/lot left to sell at the end of a reporting period. Community count information for all periods presented in this report reflects our current methodology.
Our higher average community count in 2013 compared to 2012 reflected the impact of our increased investment in land and land development during 2013. Our average community count increased on a year-over-year basis in each of our homebuilding reporting segments, except for our West Coast homebuilding reporting segment, where there was a
23%
decrease in the average community count for the reasons discussed above. However, the ending community count in our West Coast homebuilding reporting segment as of November 30, 2013 increased
5%
from the prior year. Overall, our ending community count as of November 30, 2013 increased
11%
to
191
from
172
as of November 30, 2012. With the substantial inventory-related investments we made in 2013, and the investments we are planning to make in 2014, we expect that our overall community count will increase in 2014.
36
HOMEBUILDING
We have grouped our homebuilding activities into four reportable segments, which we refer to as West Coast, Southwest, Central and Southeast. As of November 30, 2013, our homebuilding reporting segments consisted of ongoing operations located in the following states: West Coast — California; Southwest — Arizona, Nevada and New Mexico; Central — Colorado and Texas; and Southeast — Florida, Maryland, North Carolina and Virginia.
The following table presents a summary of certain financial and operational data for our homebuilding operations (dollars in thousands, except average selling price):
|
|
Years Ended November 30,
|
||||||||||
|
|
2013
|
2012
|
2011
|
||||||||
|
Revenues:
|
|||||||||||
|
Housing
|
$
|
2,084,103
|
|
$
|
1,548,432
|
|
$
|
1,305,299
|
|
||
|
Land
|
875
|
|
—
|
|
263
|
|
|||||
|
Total
|
2,084,978
|
|
1,548,432
|
|
1,305,562
|
|
|||||
|
Costs and expenses:
|
|||||||||||
|
Construction and land costs
|
|||||||||||
|
Housing
|
(1,736,320
|
)
|
(1,332,045
|
)
|
(1,157,080
|
)
|
|||||
|
Land
|
(766
|
)
|
—
|
|
(200
|
)
|
|||||
|
Total
|
(1,737,086
|
)
|
(1,332,045
|
)
|
(1,157,280
|
)
|
|||||
|
Selling, general and administrative expenses
|
(255,808
|
)
|
(236,643
|
)
|
(220,591
|
)
|
|||||
|
Loss on loan guaranty
|
—
|
|
—
|
|
(30,765
|
)
|
|||||
|
Total
|
(1,992,894
|
)
|
(1,568,688
|
)
|
(1,408,636
|
)
|
|||||
|
Operating income (loss)
|
$
|
92,084
|
|
$
|
(20,256
|
)
|
$
|
(103,074
|
)
|
||
|
Homes delivered
|
7,145
|
|
6,282
|
|
5,812
|
|
|||||
|
Average selling price
|
$
|
291,700
|
|
$
|
246,500
|
|
$
|
224,600
|
|
||
|
Housing gross profit margin as a percentage of housing revenues
|
16.7
|
%
|
14.0
|
%
|
11.4
|
%
|
|||||
|
Adjusted housing gross profit margin as a percentage of housing revenues
|
18.4
|
%
|
13.5
|
%
|
12.8
|
%
|
|||||
|
Selling, general and administrative expenses as a percentage of housing revenues
|
12.3
|
%
|
15.3
|
%
|
16.9
|
%
|
|||||
|
Operating income (loss) as a percentage of homebuilding revenues
|
4.4
|
%
|
(1.3
|
)%
|
(7.9
|
)%
|
|||||
Revenues.
Homebuilding revenues totaled
$2.08 billion
in 2013, increasing
35%
from
$1.55 billion
in 2012, which had increased
19%
from
$1.31 billion
in 2011. In 2013 and 2011, nearly all of our homebuilding revenues were generated from housing operations, with a nominal amount of revenues produced from land sales in each year. Our homebuilding revenues in 2012 were generated entirely from housing operations.
The year-over-year increase in housing revenues in 2013 reflected a
14%
increase in the number of homes delivered and an
18%
increase in the overall average selling price of those homes. In 2012, housing revenues increased from 2011 due to an
8%
increase in homes delivered and a
10%
increase in the overall average selling price.
We delivered a total of
7,145
homes in 2013, up from
6,282
homes delivered in the previous year. The increase in the number of homes delivered was largely due to our higher backlog at the beginning of the year, which was up
20%
on a year-over-year basis. Within our homebuilding reporting segments, the number of homes delivered in 2013 increased by
12%
,
8%
,
11%
and
27%
in our West Coast, Southwest, Central and Southeast homebuilding reporting segments, respectively, in each case as compared to the year-earlier period.
In 2012, we delivered
6,282
homes, up from
5,812
homes delivered in 2011. The increase in the number of homes delivered was partly due to our relatively higher backlog at the beginning of 2012, which was up 61% on a year-over-year basis largely as
37
a result of a 39% increase in net orders in the latter half of 2011. Within our homebuilding reporting segments, the number of homes delivered in 2012 increased by
11%
,
19%
and
3%
in our West Coast, Central and Southeast homebuilding reporting segments, respectively, and decreased by
19%
in our Southwest homebuilding reporting segment, in each case as compared to the year-earlier period. The decrease in homes delivered in our Southwest homebuilding reporting segment reflected a reduction in our investments in certain underperforming locations in the segment and the significant downsizing of our business in Arizona during 2011 and into 2012, each part of an overall strategic repositioning of our operations to focus on better-performing markets.
The overall average selling price of homes delivered increased to
$291,700
in 2013, up
$45,200
, or
18%
, from
$246,500
in 2012. The higher average selling price in 2013 reflected our efforts over the past few years to strategically position our new home communities in submarkets where buyers have higher household income levels and stronger credit profiles, are choosing to purchase larger homes at higher price points and are spending more on design options and features at our KB Home Studios. The increase also reflected our emphasis on pricing discipline to balance sales pace and the selling prices of our homes in our communities open for sales; our leveraging of our KBnxt operational business model to generate incremental revenues from lot, floor plan, home exterior elevation, structural and other premiums; and general market increases in home prices as the housing recovery has progressed. Compared to the previous year, each of our homebuilding reporting segments posted a double-digit increase in average selling price for 2013, with increases ranging from
13%
in our Southeast homebuilding reporting segment to
22%
in our Southwest homebuilding reporting segment. In our West Coast homebuilding reporting segment, the average selling price increased
20%
year over year largely due to a shift in our geographic mix toward communities located in coastal submarkets in California, which feature generally higher selling prices and demand for homes as compared to inland submarkets in the state.
In 2012, our overall average selling price of homes delivered increased to
$246,500
from
$224,600
in 2011, primarily due to changes in community and product mix, as we delivered more homes from markets with economic and consumer demand dynamics that supported larger homes and higher average selling prices. Our higher average selling prices of homes delivered reflected year-over-year increases of
16%
,
17%
and
5%
in our West Coast, Southwest and Southeast homebuilding reporting segments, respectively. In our Central homebuilding reporting segment, the average selling price of homes delivered in 2012 remained essentially even with 2011.
Land sale revenues totaled
$.9 million
in 2013 and
$.3 million
in 2011. We had no land sales in 2012. Generally, land sale revenues fluctuate with our decisions to maintain or decrease our land ownership position in certain markets based upon the volume of our holdings, our marketing strategy, the strength and number of competing developers entering particular markets at given points in time, the availability of land at reasonable prices and prevailing market conditions.
Operating Income (Loss).
Our homebuilding business generated operating income of
$92.1 million
in 2013, an improvement
from operating losses of
$20.3 million
in 2012 and
$103.1 million
in 2011. Our homebuilding operating income as a percentage
of homebuilding revenues was
4.4%
in 2013. Our homebuilding operating loss as a percentage of homebuilding revenues was
1.3%
in 2012 and
7.9%
in 2011.
The following table presents a summary of charges and other items included in our operating income (loss) (in thousands):
|
Years Ended November 30,
|
||||||||||||
|
2013
|
2012
|
2011
|
||||||||||
|
Inventory impairment and land option contract abandonment charges
|
$
|
(3,581
|
)
|
$
|
(28,533
|
)
|
$
|
(25,791
|
)
|
|||
|
Water intrusion-related charges
|
(31,959
|
)
|
(2,576
|
)
|
—
|
|
||||||
|
Warranty adjustments
|
—
|
|
11,162
|
|
7,446
|
|
||||||
|
Court decision reversal (charge)
|
8,164
|
|
(8,764
|
)
|
—
|
|
||||||
|
Insurance and legal expense recoveries
|
—
|
|
26,534
|
|
8,307
|
|
||||||
|
Gain on sale of operating property
|
—
|
|
—
|
|
8,825
|
|
||||||
|
Total
|
$
|
(27,376
|
)
|
$
|
(2,177
|
)
|
$
|
(1,213
|
)
|
|||
In 2013, our operating income reflected higher housing gross profits, partly offset by higher selling, general and administrative expenses. Our housing gross profits for 2013 of
$347.8 million
increased by
$131.4 million
, or
61%
, from
$216.4 million
for the previous year, primarily due to the higher volume of homes delivered and a higher housing gross profit margin. Housing gross profits for 2013 included a net charge of
$32.0 million
for water intrusion-related repairs of homes at certain of our communities in central and southwest Florida, as discussed in Note 15. Commitments and Contingencies in the Notes to Consolidated Financial Statements in this report, and
$3.6 million
of inventory impairment and land option contract abandonment charges. Our 2013 housing gross profit margin improved by
270
percentage points to
16.7%
from
14.0%
in 2012. Our adjusted housing gross profit margin was
18.4%
in 2013, up
490
basis points from
13.5%
in 2012.
38
In 2012, the year-over-year improvement in our operating results was primarily due to higher housing gross profits, partly offset by higher selling, general and administrative expenses. The year-over-year improvement in 2012 also reflected the
$30.8 million
loss on loan guaranty recorded in 2011 related to our investment in a residential development joint venture located near Las Vegas, Nevada that underwent a bankruptcy reorganization in that year as discussed in Note 9. Investments in Unconsolidated Joint Ventures in the Notes to Consolidated Financial Statements in this report. Our housing gross profits for 2012 increased by
$68.2 million
from
$148.2 million
for 2011, primarily due to the higher volume of homes delivered. Housing gross profits for 2012 included
$26.5 million
of insurance recoveries related to repair costs and costs to handle claims with respect to previously delivered homes, including homes affected by allegedly defective drywall manufactured in China, and favorable net warranty adjustments of
$8.6 million
that reflected trends in our overall warranty claims experience. The impact of these items was mostly offset by inventory impairment and land option contract abandonment charges of
$28.5 million
. Our housing gross profit margin was
14.0%
in 2012, compared to
11.4%
in 2011. Our adjusted housing gross profit margin was
13.5%
in 2012 and
12.8%
in 2011. In 2011, our housing gross profits included
$25.7 million
of inventory impairment and land option contract abandonment charges, which were partly offset by
$7.4 million
of favorable warranty adjustments.
Our land sales generated income of
$.1 million
in both 2013 and in 2011. We had no land sale income in 2012. The land sale results in 2011 included impairment charges of $.1 million related to planned future land sales.
As discussed in Note 7. Inventory Impairments and Land Option Contract Abandonments in the Notes to Consolidated Financial Statements in this report, each community or land parcel in our owned inventory is assessed to determine if indicators of potential impairment exist. Based on our evaluations, we recognized charges for inventory impairments of
$.4 million
in 2013,
$28.1 million
in 2012 and
$22.7 million
in 2011. The higher level of inventory impairment charges in 2012 and 2011, compared to 2013, reflected challenging economic and housing market conditions in certain of our served markets in each of those years. In addition, the inventory impairment charges we recognized in 2012 were partly due to changes to our operational or selling strategy for certain communities in an effort to accelerate sales pace and/or our return on investment. In 2011, the inventory impairment charges included an $18.1 million adjustment to the fair value of real estate collateral that we took back on a note receivable.
Also as discussed in Note 7. Inventory Impairments and Land Option Contract Abandonments in the Notes to Consolidated Financial Statements in this report, when we decide not to exercise certain land option contracts or other similar contracts due to market conditions and/or changes in our marketing strategy, we write off the related inventory costs, including non-refundable deposits and unrecoverable pre-acquisition costs. Based on the results of our assessments, we recognized abandonment charges associated with land option contracts and other similar contracts of
$3.2 million
in 2013,
$.4 million
in 2012 and
$3.1 million
in 2011. Inventory impairment and land option contract abandonment charges are included in construction and land costs in our consolidated statements of operations.
Deterioration in the supply and demand factors in the overall housing market or in an individual market, or changes to our operational or selling strategy at certain communities may lead to additional inventory impairment charges, future charges associated with land sales or the abandonment of land option contracts or other similar contracts related to certain assets. Due to the nature or location of the projects, land held for future development that we activate as part of our strategic growth initiatives or to accelerate sales pace and/or our return on investment may have a somewhat greater likelihood of being impaired than other of our active inventory.
Selling, general and administrative expenses totaled
$255.8 million
in 2013, up from
$236.6 million
in 2012, which had increased from
$220.6 million
in 2011. The year-over-year increase in selling, general and administrative expenses in 2013 was due to costs associated with the increased volume of homes delivered and higher housing revenues generated during 2013, partly offset by the reversal of a previously established accrual of
$8.2 million
due to a favorable court decision. In 2012, the year-over-year increase was largely due to an unfavorable court decision charge of
$8.8 million
in the same matter, and costs associated with the year-over-year increase in the volume of homes delivered, partly offset by cost-saving initiatives. The unfavorable court decision charge in 2012 and the reversal of the related accrual in 2013 are discussed in Note 16. Legal Matters in the Notes to Consolidated Financial Statements in this report. Selling, general and administrative expenses for 2011 included a gain on the sale of operating property of
$8.8 million
and the favorable impact of legal expense recoveries of
$8.3 million
. As a percentage of housing revenues, to which these expenses are most closely correlated, selling, general and administrative expenses were
12.3%
in 2013,
15.3%
in 2012 and
16.9%
in 2011. The percentage improved in 2013 compared to 2012, mainly due to the
35%
year-over-year increase in our housing revenues, and our ongoing focus on containing our overhead costs to the extent possible. In 2012, the percentage improved from 2011, primarily due to the
19%
increase in our housing revenues.
Loss on Loan Guaranty.
The loss on loan guaranty of
$30.8 million
recognized in 2011 related to the Nevada joint venture noted above and reflected the consummation of the consensual plan of reorganization of the venture, known as South Edge, that was confirmed by a bankruptcy court in November 2011 and included, among other things, the elimination of a contingent payment guaranty that we had provided to the administrative agent for the lenders to South Edge.
39
Interest Income.
Interest income, which is generated from short-term investments, totaled
$.8 million
in 2013,
$.5 million
in 2012 and
$.9 million
in 2011. Generally, increases and decreases in interest income are attributable to changes in the interest-bearing average balances of short-term investments and fluctuations in interest rates.
Interest Expense.
Interest expense results principally from borrowings to finance land purchases, housing inventory and other operating and capital needs. Our interest expense, net of amounts capitalized, totaled
$62.7 million
in 2013,
$69.8 million
in 2012 and
$49.2 million
in 2011. Interest expense for 2013 included a
$10.4 million
loss on the early extinguishment of debt as a result of the retirement of
$215.1 million
in aggregate principal amount of certain of our senior notes due 2014 and 2015 through a combination of purchases made pursuant to the applicable October 2013 Tender Offers and redemptions. Interest expense for 2012 included a
$10.3 million
loss on the early extinguishment of debt as a result of completing the applicable January 2012 and July 2012 Tender Offers, while interest expense for 2011 included a
$3.6 million
gain on the early extinguishment of secured debt.
Gross interest incurred during 2013 increased by
$16.4 million
to
$149.1 million
from
$132.7 million
in 2012, primarily due to an increase in our average debt level and the inclusion of a
$10.4 million
loss on the early extinguishment of debt in 2013. The percentage of interest capitalized was
62%
in 2013,
51%
in 2012 and 54% in 2011. The percentage of interest capitalized generally fluctuates based on the amount of our inventory qualifying for interest capitalization. Gross interest incurred during 2012 increased by
$20.7 million
to
$132.7 million
from
$112.0 million
in 2011 as a result of the
$10.3 million
loss on the early extinguishment of debt in 2012, compared to the $3.6 million gain on the early extinguishment of secured debt in 2011, a higher average debt level in 2012 and the higher interest rates on the senior notes we issued in 2012 compared to the interest rates on the senior notes we purchased under the applicable January 2012 and July 2012 Tender Offers.
Equity in Loss of Unconsolidated Joint Ventures.
Our unconsolidated joint ventures operate in various markets, typically where our homebuilding operations are located. These unconsolidated joint ventures posted combined revenues of
$17.4 million
in 2013,
$31.8 million
in 2012 and
$.2 million
in 2011. All of the revenues in 2013 and 2012 were generated from land sales completed by an unconsolidated joint venture in Maryland. Activities performed by our unconsolidated joint ventures generally include acquiring, developing and selling land, and, in some cases, constructing and delivering homes. Our unconsolidated joint ventures delivered no homes in 2013 or 2012, and one home in 2011. Our unconsolidated joint ventures generated combined income of
$2.7 million
in 2013 and
$8.3 million
in 2012, compared to combined losses of
$4.3 million
in 2011. Our equity in loss of unconsolidated joint ventures totaled
$2.0 million
in 2013,
$.4 million
in 2012 and
$55.8 million
in 2011. In 2011, our equity in loss of unconsolidated joint ventures was significantly higher compared to 2013 and 2012, mainly due to a charge of
$53.7 million
incurred in 2011 to write off our remaining investment in South Edge, as discussed in Note 9. Investments in Unconsolidated Joint Ventures in the Notes to Consolidated Financial Statements in this report. There were no such charges in 2013 or 2012.
Non-GAAP Financial Measures
This report contains information about our adjusted housing gross profit margin and our ratio of net debt to total capital, both of which are not calculated in accordance with generally accepted accounting principles (“GAAP”). We believe these non-GAAP financial measures are relevant and useful to investors in understanding our operations and the leverage employed in our operations, and may be helpful in comparing us with other companies in the homebuilding industry to the extent they provide similar information. However, because the adjusted housing gross profit margin and the ratio of net debt to total capital are not calculated in accordance with GAAP, these financial measures may not be completely comparable to other companies in the homebuilding industry and thus, should not be considered in isolation or as an alternative to operating performance and/or financial measures prescribed by GAAP. Rather, these non-GAAP financial measures should be used to supplement their respective most directly comparable GAAP financial measures in order to provide a greater understanding of the factors and trends affecting our operations.
Adjusted Housing Gross Profit Margin.
The following table reconciles our housing gross profit margin calculated in accordance with GAAP to the non-GAAP financial measure of our adjusted housing gross profit margin (dollars in thousands):
40
|
|
Years Ended November 30,
|
||||||||||
|
|
2013
|
2012
|
2011
|
||||||||
|
Housing revenues
|
$
|
2,084,103
|
|
$
|
1,548,432
|
|
$
|
1,305,299
|
|
||
|
Housing construction and land costs
|
(1,736,320
|
)
|
(1,332,045
|
)
|
(1,157,080
|
)
|
|||||
|
Housing gross profits
|
347,783
|
|
216,387
|
|
148,219
|
|
|||||
|
Add: Inventory impairment and land option contract abandonment charges
|
3,581
|
|
28,533
|
|
25,740
|
|
|||||
|
Water intrusion-related charges
|
31,959
|
|
2,576
|
|
—
|
|
|||||
|
Less: Warranty adjustments
|
—
|
|
(11,162
|
)
|
(7,446
|
)
|
|||||
|
Insurance recoveries
|
—
|
|
(26,534
|
)
|
—
|
|
|||||
|
Adjusted housing gross profits
|
$
|
383,323
|
|
$
|
209,800
|
|
$
|
166,513
|
|
||
|
Housing gross profit margin as a percentage of housing revenues
|
16.7
|
%
|
14.0
|
%
|
11.4
|
%
|
|||||
|
Adjusted housing gross profit margin as a percentage of housing revenues
|
18.4
|
%
|
13.5
|
%
|
12.8
|
%
|
|||||
Adjusted housing gross profit margin is a non-GAAP financial measure, which we calculate by dividing housing revenues less housing construction and land costs excluding inventory impairment and land option contract abandonment charges, water intrusion-related charges, warranty adjustments and insurance recoveries (as applicable) associated with housing operations recorded during a given period, by housing revenues. The most directly comparable GAAP financial measure is housing gross profit margin. We believe adjusted housing gross profit margin is a relevant and useful financial measure to investors in evaluating our performance as it measures the gross profit we generated specifically on the homes delivered during a given period and enhances the comparability of housing gross profit margin between periods. This financial measure assists us in making strategic decisions regarding product mix, product pricing and construction pace. We also believe investors will find adjusted housing gross profit margin relevant and useful because it represents a profitability measure that may be compared to a prior period without regard to variability of inventory impairments and land option contract abandonment charges, water intrusion-related charges, warranty adjustments and insurance recoveries.
Ratio of Net Debt to Total Capital.
The following table reconciles our ratio of debt to total capital calculated in accordance with GAAP to the non-GAAP financial measure of our ratio of net debt to total capital (dollars in thousands):
|
|
November 30,
|
||||||
|
|
2013
|
2012
|
|||||
|
Mortgages and notes payable
|
$
|
2,150,498
|
|
$
|
1,722,815
|
|
|
|
Stockholders’ equity
|
536,086
|
|
376,806
|
|
|||
|
Total capital
|
$
|
2,686,584
|
|
$
|
2,099,621
|
|
|
|
Ratio of debt to total capital
|
80.0
|
%
|
82.1
|
%
|
|||
|
Mortgages and notes payable
|
$
|
2,150,498
|
|
$
|
1,722,815
|
|
|
|
Less: Cash and cash equivalents and restricted cash
|
(572,001
|
)
|
(567,127
|
)
|
|||
|
Net debt
|
1,578,497
|
|
1,155,688
|
|
|||
|
Stockholders’ equity
|
536,086
|
|
376,806
|
|
|||
|
Total capital
|
$
|
2,114,583
|
|
$
|
1,532,494
|
|
|
|
Ratio of net debt to total capital
|
74.6
|
%
|
75.4
|
%
|
|||
The ratio of net debt to total capital is a non-GAAP financial measure, which we calculate by dividing mortgages and notes payable, net of homebuilding cash and cash equivalents and restricted cash, by total capital (mortgages and notes payable, net of homebuilding cash and cash equivalents and restricted cash, plus stockholders’ equity). The most directly comparable GAAP financial measure is the ratio of debt to total capital. We believe the ratio of net debt to total capital is a relevant and useful financial measure to investors in understanding the leverage employed in our operations.
41
HOMEBUILDING REPORTING SEGMENTS
The following table presents financial information related to our homebuilding reporting segments for the years indicated (dollars in thousands):
|
|
Years Ended November 30,
|
Variance
|
|||||||||||||||
|
|
2013
|
2012
|
2011
|
2013 vs 2012
|
2012 vs 2011
|
||||||||||||
|
West Coast:
|
|||||||||||||||||
|
Revenues
|
$
|
1,020,218
|
|
$
|
755,259
|
|
$
|
589,387
|
|
35
|
%
|
28
|
%
|
||||
|
Construction and land costs
|
(811,921
|
)
|
(664,321
|
)
|
(498,846
|
)
|
(22
|
)
|
(33
|
)
|
|||||||
|
Selling, general and administrative expenses
|
(62,357
|
)
|
(68,651
|
)
|
(46,653
|
)
|
9
|
|
(47
|
)
|
|||||||
|
Operating income
|
145,940
|
|
22,287
|
|
43,888
|
|
555
|
|
(49
|
)
|
|||||||
|
Other, net
|
(27,676
|
)
|
(32,754
|
)
|
(24,249
|
)
|
16
|
|
(35
|
)
|
|||||||
|
Pretax income (loss)
|
$
|
118,264
|
|
$
|
(10,467
|
)
|
$
|
19,639
|
|
(a)
|
|
(a)
|
|
||||
|
Southwest:
|
|||||||||||||||||
|
Revenues
|
$
|
175,252
|
|
$
|
132,438
|
|
$
|
139,872
|
|
32
|
%
|
(5
|
)%
|
||||
|
Construction and land costs
|
(135,024
|
)
|
(107,203
|
)
|
(132,504
|
)
|
(26
|
)
|
19
|
|
|||||||
|
Selling, general and administrative expenses
|
(17,439
|
)
|
(17,168
|
)
|
(26,366
|
)
|
(2
|
)
|
35
|
|
|||||||
|
Loss on loan guaranty
|
—
|
|
—
|
|
(30,765
|
)
|
—
|
|
100
|
|
|||||||
|
Operating income (loss)
|
22,789
|
|
8,067
|
|
(49,763
|
)
|
182
|
|
(a)
|
|
|||||||
|
Other, net
|
(19,886
|
)
|
(18,261
|
)
|
(58,502
|
)
|
(9
|
)
|
69
|
|
|||||||
|
Pretax income (loss)
|
$
|
2,903
|
|
$
|
(10,194
|
)
|
$
|
(108,265
|
)
|
(a)
|
|
91
|
%
|
||||
|
Central:
|
|||||||||||||||||
|
Revenues
|
$
|
565,120
|
|
$
|
436,407
|
|
$
|
369,705
|
|
29
|
%
|
18
|
%
|
||||
|
Construction and land costs
|
(474,220
|
)
|
(376,024
|
)
|
(325,476
|
)
|
(26
|
)
|
(16
|
)
|
|||||||
|
Selling, general and administrative expenses
|
(62,928
|
)
|
(52,430
|
)
|
(50,641
|
)
|
(20
|
)
|
(4
|
)
|
|||||||
|
Operating income (loss)
|
27,972
|
|
7,953
|
|
(6,412
|
)
|
252
|
|
(a)
|
|
|||||||
|
Other, net
|
(5,697
|
)
|
(6,504
|
)
|
(6,512
|
)
|
12
|
|
—
|
|
|||||||
|
Pretax income (loss)
|
$
|
22,275
|
|
$
|
1,449
|
|
$
|
(12,924
|
)
|
(a)
|
|
(a)
|
|
||||
|
Southeast:
|
|||||||||||||||||
|
Revenues
|
$
|
324,388
|
|
$
|
224,328
|
|
$
|
206,598
|
|
45
|
%
|
9
|
%
|
||||
|
Construction and land costs
|
(312,733
|
)
|
(181,313
|
)
|
(194,449
|
)
|
(72
|
)
|
7
|
|
|||||||
|
Selling, general and administrative expenses
|
(44,699
|
)
|
(30,883
|
)
|
(34,119
|
)
|
(45
|
)
|
9
|
|
|||||||
|
Operating income (loss)
|
(33,044
|
)
|
12,132
|
|
(21,970
|
)
|
(a)
|
|
155
|
|
|||||||
|
Other, net
|
(12,948
|
)
|
(13,315
|
)
|
(16,013
|
)
|
3
|
|
17
|
|
|||||||
|
Pretax loss
|
$
|
(45,992
|
)
|
$
|
(1,183
|
)
|
$
|
(37,983
|
)
|
(a)
|
|
97
|
%
|
||||
|
(a)
|
Percentage not meaningful.
|
42
The following table presents information concerning our housing revenues, homes delivered and average selling price by homebuilding reporting segment:
|
Years Ended November 30,
|
Housing
Revenues (in thousands)
|
Percentage of
Total
Housing
Revenues
|
Homes
Delivered
|
Percentage of
Total
Homes
Delivered
|
Average
Selling Price
|
||||||||||||
|
2013
|
|||||||||||||||||
|
West Coast
|
$
|
1,019,343
|
|
49
|
%
|
2,179
|
|
31
|
%
|
$
|
467,800
|
|
|||||
|
Southwest
|
175,252
|
|
8
|
|
738
|
|
10
|
|
237,500
|
|
|||||||
|
Central
|
565,120
|
|
27
|
|
2,841
|
|
40
|
|
198,900
|
|
|||||||
|
Southeast
|
324,388
|
|
16
|
|
1,387
|
|
19
|
|
233,900
|
|
|||||||
|
Total
|
$
|
2,084,103
|
|
100
|
%
|
7,145
|
|
100
|
%
|
$
|
291,700
|
|
|||||
|
2012
|
|||||||||||||||||
|
West Coast
|
$
|
755,259
|
|
49
|
%
|
1,945
|
|
31
|
%
|
$
|
388,300
|
|
|||||
|
Southwest
|
132,438
|
|
9
|
|
683
|
|
11
|
|
193,900
|
|
|||||||
|
Central
|
436,407
|
|
28
|
|
2,566
|
|
41
|
|
170,100
|
|
|||||||
|
Southeast
|
224,328
|
|
14
|
|
1,088
|
|
17
|
|
206,200
|
|
|||||||
|
Total
|
$
|
1,548,432
|
|
100
|
%
|
6,282
|
|
100
|
%
|
$
|
246,500
|
|
|||||
|
2011
|
|||||||||||||||||
|
West Coast
|
$
|
589,387
|
|
45
|
%
|
1,757
|
|
30
|
%
|
$
|
335,500
|
|
|||||
|
Southwest
|
139,762
|
|
11
|
|
843
|
|
15
|
|
165,800
|
|
|||||||
|
Central
|
369,552
|
|
28
|
|
2,155
|
|
37
|
|
171,500
|
|
|||||||
|
Southeast
|
206,598
|
|
16
|
|
1,057
|
|
18
|
|
195,500
|
|
|||||||
|
Total
|
$
|
1,305,299
|
|
100
|
%
|
5,812
|
|
100
|
%
|
$
|
224,600
|
|
|||||
West Coast
. Our West Coast homebuilding reporting segment’s total revenues for 2013 were mostly comprised of revenues from housing operations, with
$.9 million
of revenues generated from land sales. In 2012 and 2011, this segment’s total revenues were entirely from housing operations. Housing revenues for 2013 increased
35%
from 2012 due to a
12%
increase in the number of homes delivered and a
20%
increase in the average selling price of those homes. The increase in homes delivered reflected a
48%
higher backlog at the beginning of 2013 as compared to the previous year, partly offset by the impact of a
12%
decrease in net orders in 2013 that was largely due to a
23%
decrease in the average community count in this segment. The lower average community count in 2013 resulted primarily from the combination of our selling through older communities and shifting our investment strategy to favor coastal submarkets in California, and delays in opening new communities. The average selling price for 2013 rose from 2012 due to the combination of a greater proportion of homes delivered from higher-priced communities located in coastal submarkets, a shift in product mix of homes delivered to larger homes, an increase in design option revenues per home and generally rising home prices. In 2012, the
28%
increase in housing revenues reflected an
11%
increase in the number of homes delivered and a
16%
increase in the average selling price of those homes. Homes delivered increased in 2012 from 2011 largely due to a higher backlog level at the beginning of 2012 compared to the prior year. The average selling price rose in 2012 primarily due to a greater proportion of homes delivered from higher-priced communities, reflecting our strategic repositioning initiatives and a change in product mix of homes delivered to larger homes.
In 2013, pretax income from this segment improved by
$128.7 million
from the pretax loss posted for the year-earlier period, mainly due to higher housing gross profits and lower selling, general and administrative expenses. The housing gross profit margin increased to
20.4%
in 2013 from
12.0%
in 2012, primarily due to an increased proportion of deliveries from higher-margin communities, generally rising home prices, increased leverage from the higher volume of homes delivered in 2013, and a decrease in inventory-related charges. In 2013, land option contract abandonment charges totaled
$3.2 million
and represented .3% of segment housing revenues, compared to inventory impairment charges of
$19.2 million
that represented 3% of segment housing revenues in 2012. The inventory impairment charges in 2012 reflected challenging economic and housing market conditions in certain of our served markets and changes to our operational or selling strategy for certain communities in an effort to accelerate
43
sales pace and/or our return on investment. Selling, general and administrative expenses for 2013 decreased by
$6.3 million
from 2012 largely due to the reversal of a previously established accrual of
$8.2 million
due to a favorable court decision, partly offset by increased costs associated with the higher volume of homes delivered and the increased number of new community openings in 2013. In addition, selling, general and administrative expenses in 2012 included an
$8.8 million
unfavorable court decision charge. The unfavorable court decision charge in 2012 and the reversal of the related accrual in 2013 are discussed in Note 16. Legal Matters in the Notes to Consolidated Financial Statements in this report. Other, net, for 2013 declined from the previous year due to a decrease in interest expense that resulted from an increase in the amount of this segment’s inventory qualifying for interest capitalization.
The year-over-year decline in pretax results for this segment in 2012 primarily reflected higher selling, general and administrative expenses and an increase in other, net. The housing gross profit margin decreased to
12.0%
in 2012 from
15.4%
in 2011, primarily due to higher inventory-related charges, a shift in product mix of homes delivered and a lower proportion of deliveries from higher-margin communities, partially offset by favorable warranty adjustments. Inventory impairment charges totaled
$19.2 million
in 2012, compared to inventory impairment and land option contract abandonment charges of
$3.3 million
in 2011. These charges represented 3% of segment total revenues in 2012 and less than 1% in 2011. The year-over-year increase in selling, general and administrative expenses in 2012 primarily reflected the unfavorable court decision charge, an increase in the number of homes delivered in 2012, and the impact of the gain recognized in 2011 on the sale of a multi-level residential building that we had operated as a rental property.
Southwest
. In 2013 and 2012, our Southwest homebuilding reporting segment’s total revenues were generated solely from housing operations. In 2011, this segment’s total revenues also included land sale revenues of $.1 million. Housing revenues for 2013 increased
32%
from the previous year, reflecting increases of
8%
in the number of homes delivered and
22%
in the average selling price of those homes. The year-over-year increase in the number of homes delivered in 2013 was mostly due to the
14%
increase in net orders in 2013. Most of the increase in homes delivered occurred in our Arizona operations, as a result of activating certain inventory in 2012 that was previously held for future development. The average selling price for 2013 increased from the year-earlier period due to a shift in community and product mix of homes delivered to higher-priced communities and larger homes, and generally rising home prices. In 2012, housing revenues declined
5%
year over year due to a
19%
decrease in the number of homes delivered, partly offset by a
17%
increase in the average selling price of those homes. Homes delivered decreased in 2012 due to the significant downsizing of our business in Arizona during 2011 and into 2012. The average selling price increased in 2012 largely due to a change in community and product mix of homes delivered.
Pretax income from this segment for 2013 improved by
$13.1 million
from the pretax loss posted in 2012, primarily reflecting an increase in housing gross profits. The housing gross profit margin increased to
23.0%
in 2013 from
19.1%
in 2012, primarily due to the increase in homes delivered from higher-margin communities. In 2012, the housing gross profit margin included favorable warranty adjustments of $4.3 million that were partly offset by inventory impairment charges of
$2.1 million
. Despite the higher volume of homes delivered and higher revenues generated from this segment in 2013, selling, general and administrative expenses increased only slightly from the previous year, primarily due to our cost containment efforts.
This segment’s pretax results improved significantly in 2012 compared to 2011 mostly due to the impact of the South Edge-related joint venture impairment charge of
$53.7 million
and loss on loan guaranty of
$30.8 million
recorded in 2011. The housing gross profit margin increased to
19.1%
in 2012 from
5.3%
in 2011, primarily due to a decrease in inventory-related charges, as well as favorable warranty adjustments. Inventory impairment charges totaled
$2.1 million
in 2012, compared to inventory impairment and land option contract abandonment charges of
$19.0 million
in 2011, which included an $18.1 million adjustment to the fair value of real estate collateral that we took back on a note receivable. These inventory-related charges represented 2% of segment total revenues in 2012 and 14% in 2011. Selling, general and administrative expenses decreased in 2012 compared to 2011, mainly due to overhead cost reductions and the lower volume of homes delivered. Other, net, in 2011 included the South Edge-related joint venture impairment charge. There was no such charge in 2012.
Central
. Our Central homebuilding reporting segment’s total revenues for 2013 and 2012 were generated solely from housing operations; total revenues for 2011 also included land sale revenues of $.2 million. Housing revenues for 2013 rose
29%
compared to the previous year as a result of an
11%
increase in the number of homes delivered and a
17%
increase in the average selling price of those homes. The increase in homes delivered principally reflected a
13%
higher backlog level at the beginning of 2013 compared to the previous year and a
12%
increase in net orders. The year-over-year increase in homes delivered in this segment for 2013 was largely attributable to our Texas operations. The average selling price for 2013 rose from the prior year primarily due to a greater proportion of homes delivered from higher-priced communities and generally rising home prices. In 2012, housing revenues increased
18%
compared to 2011 as a result of a
19%
increase in the number of homes delivered, partly offset by a
1%
decrease in the average selling price of those homes. Homes delivered increased in 2012 largely due to the higher number of homes in backlog at the start of 2012, while the average selling price declined largely due to a change in community and product mix.
44
In 2013, the pretax income from this segment improved by
$20.8 million
from the previous year, reflecting higher housing gross profits, partly offset by higher selling, general and administrative expenses. The housing gross profit margin increased to
16.1%
in 2013 from
13.8%
in 2012, due to an increased proportion of homes delivered from higher-margin communities in 2013. In 2012, favorable warranty adjustments of $1.9 million were mostly offset by inventory impairment and land option contract abandonment charges of
$1.4 million
. The year-over-year increase in selling, general and administrative expenses in 2013 was primarily due to an increase in the number of homes delivered and higher housing revenues. Other, net, for 2013 declined from the previous year due to a decrease in interest expense that resulted from an increase in the amount of this segment’s inventory qualifying for interest capitalization.
In 2012, the pretax results for this segment improved from 2011 mainly due to higher housing gross profits, reflecting the increase in homes delivered and a higher housing gross profit margin, partially offset by increased selling, general and administrative expenses. The housing gross profit margin increased to
13.8%
in 2012 from
12.0%
in the previous year, primarily due to favorable warranty adjustments, which were largely offset by inventory impairment and land option contract abandonment charges. Inventory impairment and land option contract abandonment charges in this segment totaled
$1.4 million
in each of 2012 and 2011 and were less than 1% of segment total revenues in each year. Selling, general and administrative expenses increased in 2012 compared to 2011, mainly due to the higher volume of homes delivered and revenues in 2012.
Southeast.
Our Southeast homebuilding reporting segment’s total revenues for 2013, 2012 and 2011 were generated solely from housing operations. In 2013, housing revenues increased
45%
compared to the prior year, reflecting a
27%
increase in the number of homes delivered and a
13%
increase in the average selling price of those homes. The increase in homes delivered reflected a
19%
higher backlog at the beginning of 2013 compared to the previous year, a
21%
increase in net orders during the year as a result of an increase in the community count, and a higher backlog conversion ratio for the first two quarters of 2013. Most of the year-over-year increase in homes delivered in this segment in 2013 was generated from our Florida operations. The year-over-year increase in the average selling price for 2013 was primarily due to a greater proportion of homes delivered from higher-priced communities, a change in product mix of homes delivered to larger homes, and generally rising home prices. In 2012, housing revenues increased
9%
from the previous year due to a
5%
increase in the average selling price and a
3%
increase in the number of homes delivered. We delivered more homes in 2012 compared to 2011, largely due to this segment having 57% more homes in backlog at the beginning of 2012 compared to 2011.
The pretax loss from this segment for 2013 increased by
$44.8 million
from 2012, reflecting a decrease in housing gross profits and higher selling, general and administrative expenses. The housing gross profit margin declined to
3.6%
in 2013 from
19.2%
in 2012, largely due to a net charge of
$32.0 million
for water intrusion-related repairs at certain of our communities in central and southwest Florida in 2013 as discussed in Note 15. Commitments and Contingencies in the Notes to Consolidated Financial Statements in this report. In addition, the housing gross profits for 2012 included insurance recoveries of
$26.5 million
that were partly offset by inventory impairment and land option contract abandonment charges of
$5.8 million
. The year-over-year increase in selling, general and administrative expenses in 2013 was primarily due to administrative costs associated with water intrusion-related repairs, an increase in the number of homes delivered and higher housing revenues. Other, net, for 2013 decreased from 2012 due to a decrease in interest expense that resulted from an increase in the amount of this segment’s inventory qualifying for interest capitalization.
The significant improvement in pretax results for this segment in 2012 reflected an increase in housing gross profits and a decrease in selling, general and administrative expenses. The housing gross profit margin improved to
19.2%
in 2012 from
5.9%
in 2011, mainly due to
$26.5 million
of insurance recoveries recorded in 2012, partly offset by unfavorable warranty adjustments.
In 2012, this segment had
$5.8 million
of inventory impairment and land option contract abandonment charges, compared to
$2.1 million
in the year-earlier period. As a percentage of segment total revenues, these charges were 3% in 2012 and 1% in 2011.
FINANCIAL SERVICES REPORTING SEGMENT
Our financial services reporting segment offers property and casualty insurance and, in certain instances, earthquake, flood and personal property insurance to our homebuyers
in the same markets as our homebuilding reporting segments
and provides title services in the majority of our markets located
within our Central and Southeast homebuilding reporting segments.
In addition, since the third quarter of 2011, this segment has earned revenues pursuant to the terms of a marketing services agreement with a preferred mortgage lender that offers mortgage banking services, including mortgage loan originations, to our homebuyers
who elect to use the lender. Our homebuyers are under no obligation to use our preferred mortgage lender and may select any lender of their choice to obtain mortgage financing for the purchase of a home.
We make available to our homebuyers marketing materials and other information regarding our preferred mortgage lender’s financing options and mortgage loan products, and are compensated solely for the fair market value of these services. Except as discussed below, we have had no affiliation, ownership, joint venture or other interests in or with our preferred mortgage lender or its affiliates, or with respect to the revenues or income that may have been generated from their provision of mortgage banking services to, or origination of mortgage loans for, our homebuyers.
45
From 2005 until June 30, 2011, we offered mortgage banking services to our homebuyers indirectly through KBA Mortgage, an unconsolidated joint venture of a subsidiary of ours and a subsidiary of Bank of America, N.A., with each partner having a
50%
interest in the venture. KBA Mortgage ceased offering mortgage banking services after June 30, 2011. The Bank of America, N.A. subsidiary partner operated KBA Mortgage. KBA Mortgage was accounted for as an unconsolidated joint venture within the financial services reporting segment of our consolidated financial statements.
Effective June 27, 2011 and into the second quarter of 2012, we had a preferred mortgage lender relationship with MetLife Home Loans, a division of MetLife Bank, N.A. Under this relationship, MetLife Home Loans’ personnel, located on site at several of our new home communities, could offer financing options and mortgage loan products to our homebuyers, to prequalify homebuyers for mortgage loans, and to commence the mortgage loan origination process for our homebuyers electing to use MetLife Home Loans.
Following MetLife Bank, N.A.’s announcement in January 2012 that it would cease offering forward mortgage banking services as part of its business, we evaluated various options and, in March 2012, entered into an agreement with Nationstar, a subsidiary of Nationstar Mortgage Holdings Inc., under which Nationstar became our new preferred mortgage lender, offering mortgage banking services to our homebuyers at our new home communities. The terms of our relationship with Nationstar are substantially similar to the terms of our prior relationship with MetLife Home Loans, as are the mortgage banking services offered by Nationstar. Nationstar began accepting new mortgage loan applications from our homebuyers on May 1, 2012.
On January 21, 2013, we entered into an agreement with Nationstar to form Home Community Mortgage, a mortgage banking company that will offer an array of mortgage banking services to our homebuyers. We have a
49.9%
ownership interest and Nationstar has a
50.1%
ownership interest in Home Community Mortgage, with Nationstar providing management oversight of Home Community Mortgage’s operations. Nationstar will continue as our preferred mortgage lender until Home Community Mortgage begins offering mortgage banking services, which is expected to occur in the first quarter of 2014. We made capital contributions of
$5.0 million
to Home Community Mortgage during the year ended November 30, 2013. Home Community Mortgage is accounted for as an unconsolidated joint venture within our financial services reporting segment of our consolidated financial statements.
Nationstar’s performance since May 1, 2012 as our preferred mortgage lender has provided more consistent execution and completion of mortgage loan originations as compared to other outside lenders, contributing more stability in the conversion of our backlog into home deliveries and revenues. Based on the number of homes delivered in 2013 and 2012, approximately 59% and 30%, respectively, of our homebuyers used Nationstar to finance the purchase of their home. We expect to see improvement in future periods if and as a greater percentage of our homebuyers obtain mortgage financing from Nationstar, as our preferred mortgage lender, and/or Home Community Mortgage.
The following table presents a summary of selected financial and operational data for our financial services segment (dollars in thousands):
|
|
Years Ended November 30,
|
||||||||||
|
|
2013
|
2012
|
2011
|
||||||||
|
Revenues
|
$
|
12,152
|
|
$
|
11,683
|
|
$
|
10,304
|
|
||
|
Expenses
|
(3,042
|
)
|
(2,991
|
)
|
(3,512
|
)
|
|||||
|
Equity in income/gain on wind down of unconsolidated joint venture
|
1,074
|
|
2,191
|
|
19,286
|
|
|||||
|
Pretax income
|
$
|
10,184
|
|
$
|
10,883
|
|
$
|
26,078
|
|
||
|
Total originations (a):
|
|||||||||||
|
Loans
|
—
|
|
—
|
|
1,633
|
|
|||||
|
Principal
|
$
|
—
|
|
$
|
—
|
|
$
|
315,899
|
|
||
|
Percentage of homebuyers using KBA Mortgage
|
—
|
|
—
|
|
67
|
%
|
|||||
|
Mortgage loans sold to third parties (a):
|
|||||||||||
|
Loans
|
—
|
|
—
|
|
1,862
|
|
|||||
|
Principal
|
$
|
—
|
|
$
|
—
|
|
$
|
370,599
|
|
||
|
(a)
|
Loan originations and sales in 2011 occurred within KBA Mortgage, which ceased offering mortgage banking services after June 30, 2011.
|
46
Revenues.
Our financial services reporting segment generates revenues primarily from insurance commissions, title services, marketing services fees and interest income.
Financial services revenues totaled
$12.2 million
in 2013,
$11.7 million
in 2012 and
$10.3 million
in 2011. The year-over-year increase in our financial services revenues in 2013 was primarily due to an increase in title services revenues, which was partly offset by a decrease in marketing services fees. In 2012, the year-over-year increase in financial services revenues reflected higher marketing services fees resulting from having a marketing services agreement in place for all of 2012, compared to only a portion of 2011, and higher title services revenues.
Financial services revenues included revenues from insurance commissions and title services totaling
$10.4 million
in 2013,
$9.5 million
in 2012 and
$9.2 million
in 2011, and a nominal amount of interest income in each year, which was earned primarily from money market deposits. In 2013, 2012 and 2011, financial services revenues also included
$1.8 million
,
$2.2 million
and
$1.1 million
, respectively, of revenues from marketing services fees. These fees are associated with the marketing services agreements in effect during each year and represent the fair value of the services we provided in connection with the agreements.
Expenses.
General and administrative expenses totaled
$3.0 million
in both 2013 and 2012, and
$3.5 million
in 2011.
Equity in Income/Gain on Wind Down of Unconsolidated Joint Venture.
The equity in income/gain on wind down of unconsolidated joint venture of
$1.1 million
in 2013,
$2.2 million
in 2012 and
$19.3 million
in 2011 related to our 50% interest in KBA Mortgage. The amounts for 2013, 2012 and 2011 included gains of
$1.1 million
,
$2.1 million
and
$19.8 million
, respectively, recognized in connection with the wind down of KBA Mortgage. Excluding these gains, our equity in income of KBA Mortgage totaled $.1 million in 2012 compared to our equity in loss of $.5 million in 2011. KBA Mortgage originated 1,633 loans in 2011.
INCOME TAXES
We recognized an income tax benefit of
$1.6 million
in 2013,
$20.1 million
in 2012 and
$2.4 million
in 2011. The income tax benefit for 2013 was due to the resolution of a state tax audit, which resulted in a refund receivable of
$1.4 million
, as well as the recognition of unrecognized tax benefits of
$1.0 million
, partly offset by the state tax liability of
$.8 million
. The income tax benefit of
$20.1 million
in 2012 primarily reflected the resolution of federal and state tax audits, which also resulted in the realization of $1.2 million of deferred tax assets. The income tax benefit in
2011
reflected the reversal of a
$2.6 million
liability for unrecognized tax benefits due to the status of federal and state tax audits. Due to the effects of our deferred tax asset valuation allowances, carrybacks of our NOL, and changes in our unrecognized tax benefits, our effective tax rates in 2013, 2012 and 2011 are not meaningful items as our income tax amounts are not directly correlated to the amount of our pretax income (loss) for those periods.
Due to the impact of the housing downturn on our business, the asset impairment and land option contract abandonment charges we incurred and the NOL we posted in the years prior to 2013, we generated substantial deferred tax assets and established a corresponding valuation allowance against those deferred tax assets. In accordance with Accounting Standards Codification Topic No. 740, “Income Taxes” (“ASC 740”),
we evaluate our deferred tax assets quarterly to determine if adjustments to the valuation allowance are required. ASC 740 requires that companies assess whether a valuation allowance should be established based on the consideration of all available positive and negative evidence using a “more likely than not” standard with respect to whether deferred tax assets will be realized.
The ultimate realization of deferred tax assets depends primarily on the generation of future taxable income. During 2013, we reduced the valuation allowance by
$20.7 million
to account for adjustments to our deferred tax assets primarily associated with the pretax income generated during the year. During 2012 and 2011, we recorded valuation allowances of
$32.3 million
and
$76.7 million
, respectively, against net deferred tax assets generated primarily from the pretax losses for those years. One of the primary pieces of negative evidence that we consider in evaluating the need for a valuation allowance is our three-year cumulative loss position, which is largely the result of our pretax losses in 2012 and 2011, as we generated pretax income in 2013. In 2013, we had two consecutive quarters of pretax income and have experienced year-over-year increases in our homes delivered, revenues, housing gross profit margin and net orders. In addition, our backlog value at November 30, 2013 was higher than at November 30, 2012. If such positive trends in our business continue, together with improvements in housing markets and the homebuilding industry, and we are profitable on a sustained basis, we believe that there could be sufficient positive evidence to support reducing a large portion of our valuation allowance during 2014.
We had no net deferred tax assets at November 30, 2013 or 2012 as we maintained a full valuation allowance against our deferred tax assets. The deferred tax asset valuation allowance decreased to
$859.4 million
at November 30, 2013 from
$880.1 million
at November 30, 2012, reflecting a reduction of
$20.7 million
in the valuation allowance due to the use of deferred tax assets to offset the pretax income generated during 2013, and the loss of certain state NOLs due to the expiration of the applicable statute of limitations. The deferred tax asset valuation allowance at November 30, 2012 increased from
$847.8 million
at November 30, 2011, reflecting the net impact of the
$32.3 million
valuation allowance recorded in 2012.
The benefits of our NOL, built-in losses and tax credits would be reduced or potentially eliminated if we experienced an “ownership change” under Section 382. Based on our analysis performed as of November 30, 2013, we do not believe that we
47
have experienced an ownership change as defined by Section 382, and, therefore, the NOL, built-in losses and tax credits we have generated should not be subject to a Section 382 limitation as of this reporting date.
LIQUIDITY AND CAPITAL RESOURCES
Overview.
We historically have funded our homebuilding and financial services activities with internally generated cash flows and external sources of debt and equity financing. We also have the ability to borrow funds under the Credit Facility.
We manage our use of cash in the operation of our business to support the execution of our primary strategic goals. Accordingly, we use our unrestricted cash balance primarily to acquire land, invest in land development and construct homes. Our investments in land and land development totaled approximately
$1.14 billion
in 2013, approximately
$565 million
in 2012 and approximately $478 million in 2011. While we made strategic investments in land and land development in each of our homebuilding reporting segments in each of these years, most were made in our West Coast homebuilding reporting segment. Our investments in land and land development in the future will depend significantly on market conditions and available opportunities that meet our investment return and marketing standards.
The following table presents the number of lots we owned or controlled under land option contracts or other similar contracts (dollars in thousands):
|
November 30,
|
Variance
|
|||||||||||||
|
2013
|
2012
|
Lots/$
|
%
|
|||||||||||
|
Number of lots owned or controlled under land option contracts or other similar contracts
|
61,095
|
|
44,752
|
|
16,343
|
|
37
|
%
|
||||||
|
Carrying value of inventory owned or controlled under land option contracts or other similar contracts
|
$
|
2,298,577
|
|
$
|
1,706,571
|
|
$
|
592,006
|
|
35
|
%
|
|||
The year-over-year increases in the number of lots owned or controlled under land option contracts or other similar contracts and the corresponding carrying value of such lots at November 30, 2013 reflected the significant investments we made in land and land development during 2013. Overall, the percentage of our total lots that we controlled under land option contracts or other similar contracts was
37%
at November 30, 2013 compared to 27% at November 30, 2012.
We ended our 2013 fiscal year with
$572.0 million
of cash and cash equivalents and restricted cash, compared to
$567.1 million
at November 30, 2012. Our balance of unrestricted cash and cash equivalents was
$530.1 million
at November 30, 2013 and
$524.8 million
at November 30, 2012. The increase in our unrestricted cash balance primarily reflected the total net proceeds of
$332.2 million
received from the concurrent underwritten public issuances of the 1.375% Convertible Senior Notes due 2019 and the Common Stock Offering in the first quarter of 2013, and net proceeds of
$443.3 million
from the underwritten public issuance of the 7.00% Senior Notes due 2021 in the fourth quarter of 2013, partly offset by the retirement of
$215.1 million
of certain of our senior notes due 2014 and 2015 through a combination of purchases made pursuant to the October 2013 Tender Offers and redemptions, and our investments in inventories during 2013.
Capital Resources.
Our mortgages and notes payable consisted of the following (in thousands):
|
November 30,
|
Variance
|
||||||||||
|
2013
|
2012
|
$
|
|||||||||
|
Mortgages and land contracts due to land sellers and other loans (at interest rates of 7% at November 30, 2013 and 6% to 7% at November 30, 2012)
|
$
|
13,615
|
|
$
|
52,311
|
|
$
|
(38,696
|
)
|
||
|
5 3/4% Senior notes due February 1, 2014
|
—
|
|
75,911
|
|
(75,911
|
)
|
|||||
|
5 7/8% Senior notes due January 15, 2015
|
—
|
|
101,999
|
|
(101,999
|
)
|
|||||
|
6 1/4% Senior notes due June 15, 2015
|
199,864
|
|
236,826
|
|
(36,962
|
)
|
|||||
|
9.10% Senior notes due September 15, 2017
|
262,048
|
|
261,430
|
|
618
|
|
|||||
|
7 1/4% Senior notes due June 15, 2018
|
299,261
|
|
299,129
|
|
132
|
|
|||||
|
8.00% Senior notes due March 15, 2020
|
345,710
|
|
345,209
|
|
501
|
|
|||||
|
7.00% Senior notes due December 15, 2021
|
450,000
|
|
—
|
|
450,000
|
|
|||||
|
7.50% Senior notes due September 15, 2022
|
350,000
|
|
350,000
|
|
—
|
|
|||||
|
1.375% Convertible senior notes due February 1, 2019
|
230,000
|
|
—
|
|
230,000
|
|
|||||
|
Total
|
$
|
2,150,498
|
|
$
|
1,722,815
|
|
$
|
427,683
|
|
||
48
Our debt balance at November 30, 2013 reflected the issuance of the 1.375% Convertible Senior Notes due 2019 in the first quarter of 2013. The net proceeds from this debt issuance were used for general corporate purposes. Our debt balance at November 30, 2013 also reflected the issuance of the 7.00% Senior Notes due 2021 in the fourth quarter of 2013. We used
$225.4 million
of the net proceeds from this issuance to purchase
$19.7 million
in aggregate principal amount of our 5 3/4% senior notes due 2014 (the “5 3/4% Senior Notes due 2014”),
$91.1 million
in aggregate principal amount of our 5 7/8% senior notes due 2015 (the “5 7/8% Senior Notes due 2015”) and
$37.0 million
in aggregate principal amount of the 6 1/4% Senior Notes due 2015, pursuant to the applicable October 2013 Tender Offers, and to redeem the remaining
$56.3 million
in aggregate principal amount of the 5 3/4% Senior Notes due 2014 and
$11.0 million
in aggregate principal amount of the 5 7/8% Senior Notes due 2015 that were not purchased in the applicable October 2013 Tender Offers. The October 2013 Tender Offers expired on November 12, 2013. We plan to use the remaining net proceeds from this issuance for general corporate purposes. We incurred a
$10.4 million
loss on the early extinguishment of debt in 2013 due to a premium paid under the applicable October 2013 Tender Offers, premiums paid to redeem the applicable remaining senior notes, and the unamortized original issue discount associated with these senior notes.
The terms of the 1.375% Convertible Senior Notes due 2019 and the 7.00% Senior Notes due 2021 are described in Note 13. Mortgages and Notes Payable in the Notes to Consolidated Financial Statements in this report. The above-described transactions extended our near-term debt maturities, and as a result, our next scheduled debt maturity is in 2015, when the remaining
$199.9 million
in aggregate principal amount of the 6 1/4% Senior Notes due 2015 becomes due.
Our financial leverage, as measured by the ratio of debt to total capital, was
80.0%
at November 30, 2013, compared to
82.1%
at November 30, 2012. The improvement in our financial leverage reflected the increase in our stockholders’ equity as a result of the Common Stock Offering and the net income we generated during the year ended November 30, 2013, partly offset by the net increase in our mortgages and notes payable balance. Our ratio of net debt to total capital at November 30, 2013 was
74.6%
, compared to
75.4%
at November 30, 2012.
LOC Facilities
.
We maintain the LOC Facilities with various financial institutions to obtain letters of credit in the ordinary course of operating our business.
As of November 30, 2013 and 2012, we had
$41.5 million
and
$41.9 million
, respectively, of letters of credit outstanding under the LOC Facilities.
The LOC Facilities require us to deposit and maintain cash with the issuing financial institutions as collateral for our letters of credit outstanding.
The amount of cash maintained for our LOC Facilities totaled
$41.9 million
at November 30, 2013 and
$42.4 million
at November 30, 2012, and these amounts were included in restricted cash in our consolidated balance sheets as of those dates.
We may maintain, revise or, if necessary or desirable, enter into additional or expanded letter of credit facilities, or other similar facility arrangements, with the same or other financial institutions.
Unsecured Revolving Credit Facility
. On March 12, 2013, we entered into the Credit Facility with a syndicate of financial institutions. The Credit Facility is further described in Note 13. Mortgages and Notes Payable in the Notes to Consolidated Financial Statements in this report. The amount of the Credit Facility available for cash borrowings or the issuance of letters of credit depends on the total cash borrowings and letters of credit outstanding under the Credit Facility and the maximum available amount under the terms of the Credit Facility. The maximum available amount is the lesser of (a) $200.0 million and (b) the difference of (i) 15% of our consolidated net tangible assets (as defined in the Credit Facility) and (ii) our secured debt. As of November 30, 2013, we had no cash borrowings or letters of credit outstanding under the Credit Facility and we had $200.0 million available under the Credit Facility for cash borrowings, with up to $100.0 million available for the issuance of letters of credit.
Under the terms of the Credit Facility, we are required, among other things, to maintain compliance with various covenants, including financial covenants regarding our consolidated tangible net worth, consolidated leverage ratio (“Leverage Ratio”), and either an interest coverage ratio or minimum liquidity. Our compliance with these financial covenants is measured by calculations and metrics that are specifically defined or described by the terms of the Credit Facility and can differ in certain respects from comparable GAAP or other commonly used terms. The financial covenant requirements are set forth below:
|
•
|
Consolidated Tangible Net Worth.
We must maintain a minimum consolidated tangible net worth equal to the sum of (a) $282.6 million; (b) 50% of cumulative positive consolidated net income after November 30, 2012, excluding consolidated net income realized from a reversal of our deferred tax asset valuation allowance after November 30, 2012; (c) 75% of any consolidated net income realized as a result of a reversal of our deferred tax asset valuation allowance after November 30, 2012; and (d) 50% of the cumulative net proceeds received from our issuance of capital stock after November 30, 2012. As of November 30, 2013, our applicable minimum consolidated tangible net worth requirement was
$365.1 million
.
|
|
•
|
Leverage Ratio.
We must also maintain a Leverage Ratio of .850 or less, which adjusts to .825 or less for the first and second quarters of 2015; and to .800 or less for the third quarter of 2015 and each quarter thereafter during the term of the Credit Facility. As defined under the Credit Facility, the Leverage Ratio is calculated as the ratio of our consolidated total indebtedness to the sum of consolidated total indebtedness and consolidated tangible net worth. As of November 30, 2013, our Leverage Ratio was
.800
.
|
49
|
•
|
Interest Coverage Ratio or Liquidity.
We are also required to maintain either (a) a minimum consolidated interest coverage ratio (“Coverage Ratio”) of 1.10, which adjusts to 1.20 for the second quarter of 2014; to 1.40 for the third quarter of 2014; to 1.60 for the fourth quarter of 2014; to 1.75 for the first and second quarter of 2015; and to 2.00 for the third quarter of 2015 and each quarter thereafter during the term of the Credit Facility; or (b) a minimum level of liquidity, but not both. As defined under the Credit Facility, the Coverage Ratio is the ratio of our consolidated adjusted EBITDA to consolidated interest incurred, in each case for the previous 12 months. Our minimum liquidity is required to be the greater of (a) $50.0 million or (b) the sum of (i) consolidated interest incurred for the four most recently ended quarters and (ii) the aggregate principal amount of indebtedness coming due in the next 12 months, provided that the highest minimum liquidity applicable under (b) is $200.0 million. As of November 30, 2013, our minimum liquidity requirement was
$143.0 million
.
|
In addition, under the Credit Facility, our investments in joint ventures and non-guarantor subsidiaries (which are shown, respectively, in Note 9. Investments in Unconsolidated Joint Ventures and in Note 22. Supplemental Guarantor Information in the Notes to Consolidated Financial Statements in this report) cannot exceed the sum of (a) $135.1 million and (b) 20% of consolidated tangible net worth; and our borrowing base indebtedness, which is the aggregate principal amount of our outstanding indebtedness and non-collateralized financial letters of credit, cannot be greater than our borrowing base (a measure of our inventory and unrestricted cash assets).
The financial covenants under our Credit Facility represent the most restrictive covenants that we are subject to with respect to our mortgages and notes payable. The following table summarizes the above-described financial covenants and other requirements under the Credit Facility and our actual levels or ratios (as applicable) with respect to those covenants and other requirements, in each case as of November 30, 2013:
|
Financial Covenants and Other Requirements
|
Covenant Requirement
|
Actual
|
|||||||
|
Consolidated tangible net worth
|
>
|
$
|
365.1
|
million
|
$
|
536.1
|
million
|
||
|
Leverage Ratio
|
<
|
.850
|
.800
|
||||||
|
Coverage Ratio (a)
|
>
|
1.10
|
1.43
|
||||||
|
Minimum Liquidity (a)
|
>
|
$
|
143.0
|
million
|
$
|
530.1
|
million
|
||
|
Investments in joint ventures and non-guarantor subsidiaries
|
<
|
$
|
242.3
|
million
|
$
|
170.1
|
million
|
||
|
Borrowing base in excess of borrowing base indebtedness (as defined)
|
|
n/a
|
$
|
235.6
|
million
|
||||
|
(a)
|
Under the terms of the Credit Facility, we are required to meet either the Coverage Ratio or the liquidity thresholds, but not both. As of November 30, 2013, we met both the Coverage Ratio and the minimum liquidity requirements.
|
The Credit Facility also prohibits us from repurchasing and exchanging equity securities from or with employees in excess of $10.0 million in cash consideration in any fiscal year.
The indenture governing the senior notes and the 1.375% Convertible Senior Notes due 2019 does not contain any financial covenants. Subject to specified exceptions, the indenture contains certain restrictive covenants that, among other things, limit our ability to incur secured indebtedness, or engage in sale-leaseback transactions involving property or assets above a certain specified value.
In addition, the 1.375% Convertible Senior Notes due 2019 and all of the senior notes (with the exception of the 6 1/4% Senior Notes due 2015 and the 7 1/4% Senior Notes due 2018)
contain certain limitations related to mergers, consolidations, and sales of assets.
Our obligations to pay principal, premium, if any, and interest under our senior notes and the 1.375% Convertible Senior Notes due 2019 and borrowings, if any, under the Credit Facility are guaranteed on a joint and several basis by certain of our subsidiaries (the “Guarantor Subsidiaries”) that meet the definition of a “significant subsidiary” as defined by Rule 1-02 of Regulation S-X using a
5%
rather than a 10% threshold, provided that the assets of our non-guarantor subsidiaries do not in the aggregate exceed
10%
of an adjusted measure of our consolidated total assets. The guarantees are full and unconditional and the Guarantor Subsidiaries are
100%
owned by us. We may also cause other subsidiaries of ours to become Guarantor Subsidiaries if we believe it to be in our or the relevant subsidiary’s best interests. Condensed consolidating financial information for our subsidiaries considered to be Guarantor Subsidiaries is provided in Note 22. Supplemental Guarantor Information in the Notes to Consolidated Financial Statements in this report.
As of November 30, 2013,
we were in compliance with the applicable terms of all our covenants under the Credit Facility, the senior notes, the 1.375% Convertible Senior Notes due 2019, the indenture, and the mortgages and land contracts due to land sellers and other loans. Our ability to access the Credit Facility for cash borrowings and letters of credit and our ability to secure future debt financing depend, in part, on our ability to remain in such compliance.
There are no agreements that restrict our payment of dividends other than to maintain compliance with the financial covenant requirements under the Credit Facility, which would restrict
50
our payment of dividends if there is a default under the Credit Facility existing at the time of any such payment, or if any such payment would result in such a default.
Depending on available terms, we finance certain land acquisitions with purchase-money financing from land sellers or with other forms of financing from third parties. At November 30, 2013, we had outstanding mortgages and land contracts due to land sellers and other loans payable in connection with such financing of
$13.6 million
, secured primarily by the underlying property, which had a carrying value of
$37.9 million
.
Consolidated Cash Flows.
The following table presents a summary of net cash provided by (used in) our operating, investing and financing activities (in thousands):
|
|
Years Ended November 30,
|
||||||||||
|
|
2013
|
2012
|
2011
|
||||||||
|
Net cash provided by (used in):
|
|||||||||||
|
Operating activities
|
$
|
(443,486
|
)
|
$
|
34,617
|
|
$
|
(347,545
|
)
|
||
|
Investing activities
|
(16,750
|
)
|
(760
|
)
|
13,098
|
|
|||||
|
Financing activities
|
467,071
|
|
73,757
|
|
(155,909
|
)
|
|||||
|
Net increase (decrease) in cash and cash equivalents
|
$
|
6,835
|
|
$
|
107,614
|
|
$
|
(490,356
|
)
|
||
Operating Activities.
Operating activities used net cash of
$443.5 million
in 2013 and provided net cash of
$34.6 million
in 2012. In 2011, operating activities used net cash of
$347.5 million
. The change in net operating cash flows in 2013 from the prior year was largely due to the increase in cash used for investments in land and land development during 2013 in support of our strategic growth initiatives. In 2012, the year-over-year change in net operating cash flows was primarily due to the lower net loss incurred in 2012 and the substantial payments we made in 2011 in connection with the consummation of the consensual plan of reorganization for South Edge and in resolving other matters surrounding the underlying joint venture.
Our uses of operating cash in 2013 included a net increase in inventories of
$563.2 million
(excluding
$27.6 million
of inventories acquired through seller financing, an increase of
$4.8 million
in consolidated inventories not owned, and inventory impairment land option contract abandonment charges of
$3.6 million
), in conjunction with our investments in land and land development, and a net increase in receivables of
$11.2 million
. Partially offsetting the cash used was a net increase in accounts payable, accrued expenses and other liabilities of
$59.8 million
(excluding
$8.3 million
related to the issuance of stock under stock-based compensation plans), net income of
$40.0 million
and other operating sources of
$1.3 million
.
In 2012, cash was provided by a net decrease in inventories of
$30.3 million
(excluding
$53.6 million
of inventories acquired through seller financing, inventory impairment and land option contract abandonment charges of
$28.5 million
and a decrease of
$19.8 million
in consolidated inventories not owned), and a decrease in receivables of
$25.0 million
. Partially offsetting the cash provided was a net loss of
$59.0 million
, a net decrease in accounts payable, accrued expenses and other liabilities of
$2.1 million
, and other operating uses of
$12.5 million
.
Our uses of operating cash in 2011 included a net loss of
$178.8 million
, a net decrease in accounts payable, accrued expenses and other liabilities of
$253.5 million
, a net increase in inventories of
$12.3 million
(excluding the real estate collateral in our Southwest homebuilding reporting segment that we took back on a
$40.0 million
note receivable, inventory impairment and land option contract abandonment charges of
$25.8 million
, and an increase of
$8.4 million
in consolidated inventories not owned), a net increase in receivables of
$2.2 million
and other operating uses of
$2.3 million
. The net decrease in accounts payable, accrued expenses and other liabilities was largely due to payments we made in connection with the consensual plan of reorganization for South Edge and in resolving other matters surrounding the underlying joint venture.
Investing Activities.
Investing activities used net cash of
$16.8 million
in 2013 and $.8 million in 2012, and provided net cash of
$13.1 million
in 2011. The change in net investing cash flows in 2013 compared to 2012 primarily reflected our contributions to unconsolidated joint ventures in 2013, compared to a return of investment in unconsolidated joint ventures in 2012. The year-over-year change in net investing cash flows in 2012 was mainly due to proceeds of
$80.6 million
we received in 2011 from the sale of a multi-level residential building we had operated as a rental property in our West Coast homebuilding reporting segment, partly offset by investments in unconsolidated joint ventures that year.
In 2013, cash of
$14.4 million
was mainly used for contributions to Home Community Mortgage and two unconsolidated joint ventures within our homebuilding reporting segment, and
$2.4 million
was used for net purchases of property and equipment. In 2012,
$1.7 million
was used for net purchases of property and equipment. The cash used was largely offset by
$1.0 million
of cash provided by a return of investment in unconsolidated joint ventures. In 2011, the
$80.6 million
we received from the sale of the
51
multi-level residential building was partly offset by $67.2 million used for investments in unconsolidated joint ventures and $.3 million used for net purchases of property and equipment.
Financing Activities.
Financing activities provided net cash of
$467.1 million
in 2013 and
$73.8 million
in 2012, and used net cash of
$155.9 million
in 2011. The increase in cash provided by financing activities in 2013 primarily reflected the concurrent underwritten public issuances of the 1.375% Convertible Senior Notes due 2019 and the Common Stock Offering, which together generated total net proceeds of
$332.2 million
, and the underwritten public issuance of the 7.00% Senior Notes due 2021, partly offset by the retirement of certain of our senior notes due in 2014 and 2015 through a combination of purchases made pursuant to the applicable October 2013 Tender Offers and redemptions, and payments on mortgages and land contracts due to land sellers and other loans. In 2012, we generated cash from financing activities mainly as a result of the issuances of the 8.00% senior notes due 2020 (the “8.00% Senior Notes due 2020”) and the 7.50% senior notes due 2022 (the “7.50% Senior Notes due 2022”), partly offset by the purchase of certain of our senior notes due in 2014 and 2015 pursuant to the applicable January 2012 Tender Offers and July 2012 Tender Offers.
In 2013, sources of financing cash included total net proceeds of
$680.0 million
from the issuances of the 1.375% Convertible Senior Notes due 2019 and the 7.00% Senior Notes due 2021, net proceeds of
$109.5 million
from the issuance of common stock in the Common Stock Offering,
$2.2 million
of cash provided from the issuance of common stock under employee stock plans and a decrease of
$.5 million
in our restricted cash balance. The cash provided was partially offset by
$225.4 million
used for the retirement of
$215.1 million
in aggregate principal amount of certain of our senior notes due 2014 and 2015 through a combination of purchases made pursuant to the applicable October 2013 Tender Offers and redemptions; payments on mortgages and land contracts due to land sellers and other loans of
$66.3 million
; the payment of debt issuance costs of
$16.5 million
associated with our issuances of the 1.375% Convertible Senior Notes due 2019 and the 7.00% Senior Notes due 2021 and costs associated with our entry into the Credit Facility, repurchases of our common stock of
$8.5 million
as discussed in Note 17. Stockholders’ Equity in the Notes to Consolidated Financial Statements in this report, and dividend payments on our common stock of
$8.4 million
.
In 2012, cash was provided by net proceeds of
$694.8 million
from the issuances of the 8.00% Senior Notes due 2020 and the 7.50% Senior Notes due 2022, a decrease of
$22.1 million
in our restricted cash balance and
$.6 million
of cash provided from the issuance of common stock under employee stock plans. The cash provided was partially offset by
$592.6 million
used to purchase $340.0 million in aggregate principal amount of certain of our senior notes due 2014 and 2015 pursuant to the applicable January 2012 Tender Offers and $244.9 million in aggregate principal amount of certain of our senior notes due 2014 and 2015 pursuant to the applicable July 2012 Tender Offers, including expenses associated with the applicable tender offers and with the issuances of the 8.00% Senior Notes due 2020 and the 7.50% Senior Notes due 2022. Uses of cash in 2012 also included payments on mortgages and land contracts due to land sellers and other loans of
$26.3 million
, the payment of senior note issuance costs of
$12.4 million
, dividend payments on our common stock of
$10.6 million
, and stock repurchases of
$1.8 million
in connection with the satisfaction of employee withholding taxes on vested restricted stock.
In 2011, cash was used for the repayment of the remaining
$100.0 million
in aggregate principal amount of our 6 3/8% senior notes due 2011 (the “6 3/8% Senior Notes due 2011”) at their August 15, 2011 maturity, and for net payments on mortgages and land contracts due to land sellers and other loans of
$89.5 million
, primarily related to the repayment of debt secured by the multi-level residential building we sold during the year. Uses of cash in 2011 also included dividend payments on our common stock of
$19.2 million
. The cash used was partially offset by a
$51.0 million
decrease in our restricted cash balance, of which $26.8 million related to cash collateral no longer required on a surety bond, and
$1.8 million
of cash provided from the issuance of common stock under employee stock plans.
Our board of directors declared four quarterly cash dividends of
$.0250
per share of common stock in 2013. During 2012, our board of directors declared a cash dividend of
$.0625
per share of common stock in the first quarter and quarterly dividends of
$.0250
per share of common stock in each of the second, third and fourth quarters.
In the second quarter of 2012, our board of directors decided to reduce the quarterly cash dividend from $.0625 per share to enable the redeployment of our unrestricted cash in support of our strategic growth initiatives. O
ur board of directors declared four quarterly cash dividends of
$.0625
per share of common stock
during 2011. The declaration and payment of future cash dividends on our common stock are at the discretion of our board of directors, and depend upon, among other things, our expected future earnings, cash flows, capital requirements, debt structure and any adjustments thereto, operational and financial investment strategy and general financial condition, as well as general business conditions.
Shelf Registration Statement.
We have an automatically effective universal shelf registration statement on file with the SEC, which was filed on September 20, 2011 (the “2011 Shelf Registration”). The 2011 Shelf Registration registers the offering of debt and equity securities that we may issue from time to time in amounts to be determined. In 2013, we conducted the concurrent underwritten public issuances of the 1.375% Convertible Senior Notes due 2019 and the Common Stock Offering, and the underwritten public issuance of the 7.00% Senior Notes due 2021 under the 2011 Shelf Registration. In 2012, we issued both the 8.00% Senior Notes due 2020 and the 7.50% Senior Notes due 2022 under the 2011 Shelf Registration.
52
Share Repurchase Program.
As of November 30, 2013, we were authorized to repurchase 4,000,000 shares of our common stock under a board-approved share repurchase program.
We did not repurchase any of our common stock under this program in 2013, 2012 or 2011. Any resumption of such stock repurchases under this program or any other program will be at the discretion of our board of directors.
Unrelated to the common stock repurchase plan, in connection with an amendment of the Amended and Restated KB Home Non-Employee Directors Compensation Plan (the “Director Plan”) as discussed in Note 17. Stockholders’ Equity in the Notes to Consolidated Financial Statements in this report, our board of directors authorized the repurchase of no more than 482,000 shares of our common stock solely as necessary for director elections in respect of outstanding stock units under the Director Plan. During the third quarter of 2013, we repurchased through open market transactions
478,294
shares of our common stock pursuant to this board of directors authorization at an aggregate price of
$7.9 million
. We do not anticipate any additional repurchases of our common stock pursuant to this board of directors authorization.
In the present environment, we are managing our use of cash for investments to maintain and grow our business. Based on our current capital position, we believe that we will have adequate resources and sufficient access to the capital markets and external financing sources to satisfy our current and reasonably anticipated long-term requirements for funds to acquire capital and land, to develop acquired land, to construct homes, to finance our financial services operations, and to meet other needs in the ordinary course of our business. Although our land and land development activities for 2014 will be subject to market conditions and available opportunities, we will likely use a portion of our unrestricted cash resources to acquire and/or develop land that meets our investment return and marketing standards. In 2014, we may also use or redeploy our unrestricted cash resources to support other business purposes that are aligned with our primary strategic goals, including our growth initiatives. In addition, we may also arrange or engage in capital markets, bank loan, project debt or other financial transactions, and/or expand the capacity of the Credit Facility or the LOC Facilities or enter into additional such facilities. These transactions may include repurchases from time to time of our outstanding senior notes or other debt through redemptions, tender offers, exchange offers, private exchanges, open market purchases or other means, and may include potential new issuances of equity or senior or convertible senior notes or other debt through public offerings, private placements or other arrangements to raise new capital to support our current land and land development investment targets, and for other business purposes and/or to effect repurchases or redemptions of our outstanding senior notes or other debt. Our ability to engage in such financial transactions, however, may be constrained by economic, capital, credit and/or financial market conditions, investor interest and/or our current leverage ratios, and we can provide no assurance of the success or costs of any such transactions.
OFF-BALANCE SHEET ARRANGEMENTS
As discussed in Note 9. Investments in Unconsolidated Joint Ventures in the Notes to Consolidated Financial Statements in this report, we have investments in unconsolidated joint ventures that conduct land acquisition, land development and/or other homebuilding activities in various markets where our homebuilding operations are located.
We and our unconsolidated joint venture partners make initial and/or ongoing capital contributions to these unconsolidated joint ventures, typically on a pro rata basis, equal to our respective equity interests. The obligations to make capital contributions are governed by each unconsolidated joint venture’s respective operating agreement and related governing documents.
We also
share in the profits and losses of these unconsolidated joint ventures generally in accordance with our respective equity interests.
Our unconsolidated joint ventures had total assets of
$406.0 million
at November 30, 2013 and
$389.8 million
at November 30, 2012. Our investments in unconsolidated joint ventures totaled
$130.2 million
at November 30, 2013 and
$123.7 million
at November 30, 2012.
Our unconsolidated joint ventures finance land and inventory investments for a project through a variety of arrangements, and certain of our unconsolidated joint ventures have obtained loans from third-party lenders that are secured by the underlying property and related project assets.
However, none of our unconsolidated joint ventures had outstanding debt at November 30, 2013 or 2012.
As further discussed in Note 9. Investments in Unconsolidated Joint Ventures in the Notes to Consolidated Financial Statements in this report, our investments in unconsolidated joint ventures as of November 30, 2013 and 2012 included our investment of
$75.9 million
and
$71.0 million
, respectively, in Inspirada Builders, LLC, an unconsolidated joint venture that was formed in 2011 in connection with the consensual plan of reorganization for the South Edge joint venture, and in which a subsidiary that is 100% owned by us is a member. As part of the terms of the reorganization plan for South Edge, land previously owned by the joint venture, including our share that consists of approximately 600 developable acres, was acquired by Inspirada Builders, LLC in November 2011. We anticipate that we will acquire our share of the land from Inspirada Builders, LLC through a future distribution.
Our investments in
joint ventures may create a variable interest in a
variable interest entity (“VIE”),
depending on the contractual terms of the arrangement. We analyze our joint ventures in accordance with
Accounting Standards Codification Topic No. 810, “Consolidation” (“ASC 810”),
to determine whether they are VIEs and, if so, whether we are the primary beneficiary.
None of
53
our joint ventures at November 30, 2013 and 2012
were determined under the provisions of ASC 810 to be VIEs. All of our joint ventures were unconsolidated and accounted for under the equity method because we did not have a controlling financial interest.
As discussed in Note 8. Variable Interest Entities in the Notes to Consolidated Financial Statements in this report, in the ordinary course of our business, we enter into land option contracts and other similar contracts to acquire rights to land for the construction of homes.
We analyze each of our land option contracts and other similar contracts under the provisions of ASC 810 to determine whether the land seller is a VIE and, if so, whether we are the primary beneficiary. Although we do not have legal title to the underlying land, ASC 810 requires us to consolidate a VIE if we are determined to be the primary beneficiary. In determining whether we are the primary beneficiary, we consider, among other things, whether we have the power to direct the activities of the VIE that most significantly impact the VIE’s economic performance. Such activities would include, among other things, determining or limiting the scope or purpose of the VIE, selling or transferring property owned or controlled by the VIE, or arranging financing for the VIE. As a result of our analyses, we determined that as of November 30, 2013 and 2012 we were not the primary beneficiary of any VIEs from which we have acquired rights to land under land option contracts and other similar contracts.
The following table presents a summary of our interests in land option contracts and other similar contracts (in thousands):
|
November 30, 2013
|
November 30, 2012
|
||||||||||||||
|
Cash
Deposits
|
Aggregate
Purchase Price
|
Cash
Deposits
|
Aggregate
Purchase Price
|
||||||||||||
|
Unconsolidated VIEs
|
$
|
11,063
|
|
$
|
616,000
|
|
$
|
8,463
|
|
$
|
327,196
|
|
|||
|
Other land option contracts and other similar contracts
|
30,502
|
|
535,496
|
|
17,219
|
|
298,139
|
|
|||||||
|
$
|
41,565
|
|
$
|
1,151,496
|
|
$
|
25,682
|
|
$
|
625,335
|
|
||||
In addition to the cash deposits presented in the table above, our exposure to loss related to our land option contracts and other similar contracts with third parties and unconsolidated entities consisted of pre-acquisition costs of
$31.0 million
at November 30, 2013 and
$25.4 million
at November 30, 2012. These pre-acquisition costs and cash deposits were included in inventories on our consolidated balance sheets. We also had outstanding letters of credit of
$.1 million
at November 30, 2013 and
$.5 million
at November 30, 2012 in lieu of cash deposits under certain land option contracts and other similar contracts.
We also evaluate our land option contracts and other similar contracts for financing arrangements in accordance with
Accounting Standards Codification Topic No. 470, “Debt” (“ASC 470”),
and, as a result of our evaluations, increased inventories, with a corresponding increase to accrued expenses and other liabilities, in our consolidated balance sheets by
$8.9 million
at
November 30, 2013
and
$4.1 million
at
November 30, 2012
.
CONTRACTUAL OBLIGATIONS AND COMMERCIAL COMMITMENTS
The following table presents our future cash requirements under contractual obligations as of November 30, 2013 (in millions):
|
|
Payments due by Period
|
||||||||||||||||||
|
|
Total
|
2014
|
2015-2016
|
2017-2018
|
Thereafter
|
||||||||||||||
|
Contractual obligations:
|
|||||||||||||||||||
|
Long-term debt
|
$
|
2,150.5
|
|
$
|
8.8
|
|
$
|
204.7
|
|
$
|
561.3
|
|
$
|
1,375.7
|
|
||||
|
Interest
|
885.9
|
|
147.3
|
|
276.3
|
|
230.4
|
|
231.9
|
|
|||||||||
|
Inventory-related obligations (a)
|
29.6
|
|
9.5
|
|
3.6
|
|
3.2
|
|
13.3
|
|
|||||||||
|
Operating lease obligations
|
18.8
|
|
7.2
|
|
8.5
|
|
2.7
|
|
.4
|
|
|||||||||
|
Total (b)
|
$
|
3,084.8
|
|
$
|
172.8
|
|
$
|
493.1
|
|
$
|
797.6
|
|
$
|
1,621.3
|
|
||||
|
(a)
|
Represents liabilities for fixed or determinable amounts associated with tax increment financing entities (“TIFE”) and liabilities related to inventory not owned. As homes are delivered, the obligation to pay the remaining TIFE assessments associated with each lot is transferred to the homebuyer. As such, these obligations will be paid by us only to the extent we do not deliver the applicable homes before the debt matures.
|
|
(b)
|
Total contractual obligations exclude our accrual for uncertain tax positions recorded for financial reporting purposes as of November 30, 2013 because we are unable to make a reasonable estimate of cash settlements with the respective taxing authorities for all periods presented. We anticipate these potential cash settlement requirements for 2014 to range from $.1 million to $.3 million.
|
54
We
are often required to provide to various municipalities and other government agencies performance bonds and/or letters of credit to secure the completion of our projects and/or in support of obligations to build community improvements such as roads, sewers, water systems and other utilities, and to support similar development activities by certain of our unconsolidated joint ventures.
At November 30, 2013, we had
$410.8 million
of performance bonds and
$41.5 million
of letters of credit outstanding. At November 30, 2012, we had
$286.1 million
of performance bonds and
$41.9 million
of letters of credit outstanding.
If any such performance bonds or letters of credit are called, we would be obligated to reimburse the issuer of the performance bond or letter of credit. We do not believe that a material amount of any currently outstanding performance bonds or letters of credit will be called. Performance bonds do not have stated expiration dates. Rather, we are released from the performance bonds as the underlying performance is completed. The expiration dates of some letters of credit issued in connection with community improvements coincide with the expected completion dates of the related projects or obligations. Most letters of credit, however, are issued with an initial term of one year and are typically extended on a year-to-year basis until the related performance obligations are completed.
CRITICAL ACCOUNTING POLICIES
Discussed below are accounting policies that we believe are critical because of the significance of the activity to which they relate or because they require the use of significant judgment in their application.
Homebuilding Revenue Recognition.
As discussed in Note 1. Summary of Significant Accounting Policies in the Notes to Consolidated Financial Statements in this report, revenues from housing and other real estate sales are recognized in accordance with Accounting Standards Codification Topic No. 360, “Property, Plant and Equipment” (“ASC 360”),
when sales are closed and title passes to the buyer. Sales are closed when all of the following conditions are met: a sale is consummated, a sufficient down payment is received, the earnings process is complete and the collection of any remaining receivables is reasonably assured.
Concurrent with the recognition of revenues in our consolidated statements of operations, sales incentives in the form of price concessions on the selling price of a home are recorded as a reduction of revenues, while the cost of incentives in the form of a free product or service to homebuyers, including option upgrades and closing cost allowances used to cover a portion of the fees and costs charged to a homebuyer, are reflected as construction and land costs.
Inventories and Cost of Sales.
As discussed in Note 1. Summary of Significant Accounting Policies in the Notes to Consolidated Financial Statements in this report, h
ousing and land inventories are stated at cost, unless the carrying value is determined not to be recoverable, in which case the affected inventories are written down to fair value in accordance with ASC 360.
Fair value is determined based on estimated future net cash flows discounted for inherent risks associated with the real estate assets, or other valuation techniques. Due to uncertainties in the estimation process and other factors beyond our control, it is possible that actual results could differ from those estimated. Our inventories typically do not consist of completed unsold homes. However, cancellations or strategic considerations may result in our having some inventory of unsold completed or partially completed homes.
Our inventories include land we are holding for future development, which is comprised of land
where development activity has been suspended or has not yet begun, but is expected to occur in the future. These assets held for future development are located in various submarkets where conditions do not presently support further investment or development, or are subject to a building permit moratorium or regulatory restrictions, or are portions of larger land parcels that we plan to build out over several years and/or that have not yet been entitled. We may also suspend development activity if we believe it will result in greater returns and/or maximize the economic performance of a community by delaying improvements for a period of time to allow earlier phases of a long-term, multi-phase community or a neighboring community to generate sales momentum or for market conditions to improve.
We resume development activity when we believe our investment in this inventory will be optimized or, in some instances, to accelerate sales pace and/or our return on investment, and we have activated assets previously held for future development in certain markets as part of our strategic growth initiatives. Interest and real estate taxes are not capitalized on land held for future development.
As discussed in Note 6. Inventories in the Notes to Consolidated Financial Statements in this report, for those communities for which development activity has been suspended, applicable interest and real estate taxes are expensed as incurred.
We rely on certain estimates to determine our construction and land costs and resulting housing gross profit margins associated with revenues recognized. Construction and land costs are comprised of direct and allocated costs, including estimated future costs for warranties and amenities. Land acquisition, land development and other common costs are generally allocated on a relative fair value basis to homes within a community or land parcel. Land acquisition and land development costs include related interest and real estate taxes.
In determining a portion of the construction and land costs recognized for each period, we rely on project budgets that are based on a variety of assumptions, including future construction schedules and costs to be incurred. It is possible that actual results could differ from budgeted amounts for various reasons, including construction delays, labor or materials shortages, increases in
55
costs that have not yet been committed, changes in governmental requirements, unforeseen environmental hazard discoveries or other unanticipated issues encountered during construction and other factors beyond our control. While the actual results for a particular construction project are accurately reported over time, variances between the budgeted and actual costs of a project could result in the understatement or overstatement of construction and land costs and homebuilding gross profits in a particular reporting period. To reduce the potential for such distortion, we have set forth procedures that collectively comprise a “critical accounting policy.” These procedures, which we have applied on a consistent basis, include assessing, updating and revising project budgets on a monthly basis, obtaining commitments from subcontractors and vendors for future costs to be incurred, reviewing the adequacy of warranty accruals and historical warranty claims experience, and utilizing the most current information available to estimate construction and land costs to be charged to expense. Variances to the budgeted costs after an estimate has been charged to expense that are related to project costs are generally allocated on a relative fair value basis to the remaining homes to be delivered within the community or land parcel, while such variances related to direct construction costs are generally expensed as incurred. The variances between budgeted and actual costs have historically not been material to our consolidated financial statements. We believe that our policies provide for reasonably dependable estimates to be used in the calculation and reporting of construction and land costs.
Inventory Impairments and Land Option Contract Abandonments.
As discussed in Note 7. Inventory Impairments and Land Option Contract Abandonments in the Notes to Consolidated Financial Statements in this report, e
ach community or land parcel in our owned inventory is assessed to determine if indicators of potential impairment exist. Impairment indicators are assessed separately for each community or land parcel on a quarterly basis and include, but are not limited to the following: significant decreases in net orders, average selling prices, volume of homes delivered, gross profit margins on homes delivered or projected gross profit margins on homes in backlog or future deliveries; significant increases in budgeted land development and home construction costs or cancellation rates; or projected losses on expected future land sales. If indicators of potential impairment exist for a community or land parcel, the identified asset is evaluated for recoverability in accordance with ASC 360.
The following table presents information regarding inventory impairment and land option contract abandonment charges included in construction and land costs in our consolidated statements of operations (dollars in thousands):
|
|
Years Ended November 30,
|
||||||||||
|
|
2013
|
2012
|
2011
|
||||||||
|
Inventory impairments:
|
|||||||||||
|
Number of communities or land parcels evaluated for recoverability (a)
|
67
|
|
135
|
|
138
|
|
|||||
|
Number of communities or land parcels impaired (b)
|
1
|
|
14
|
|
12
|
|
|||||
|
Pre-impairment carrying value of communities or land parcels impaired
|
$
|
1,534
|
|
$
|
67,958
|
|
$
|
56,752
|
|
||
|
Inventory impairment charges (b)
|
(391
|
)
|
(28,107
|
)
|
(22,730
|
)
|
|||||
|
Post-impairment fair value
|
$
|
1,143
|
|
$
|
39,851
|
|
$
|
34,022
|
|
||
|
Land option contract abandonment charges:
|
|||||||||||
|
Number of lots abandoned
|
295
|
|
446
|
|
830
|
|
|||||
|
Land option contract abandonment charges
|
$
|
3,190
|
|
$
|
426
|
|
$
|
3,061
|
|
||
|
(a)
|
As impairment indicators are assessed on a quarterly basis, some of the communities or land parcels evaluated during the years ended
November 30, 2013
,
2012
and
2011
were evaluated in more than one quarterly period.
|
|
(b)
|
The higher level of inventory impairment charges we recorded during
2012
and
2011
, as compared to 2013, reflected challenging economic and housing market conditions in certain of our served markets in those years. In addition, the inventory impairment charges in 2012 were partly due to changes to our operational or selling strategy for certain communities in an effort to accelerate sales pace and/or our return on investment. The inventory impairment charges in 2011 also included an $18.1 million adjustment to the fair value of real estate collateral in our Southwest homebuilding reporting segment that we took back on a note receivable. In some cases, we have recognized impairment charges for particular communities or land parcels in multiple years.
|
When an indicator of potential impairment is identified for a community or land parcel, we test the asset for recoverability by comparing the carrying value of the asset to the undiscounted future net cash flows expected to be generated by the asset. The undiscounted future net cash flows are impacted by then-current conditions and trends in the market in which the asset is located as well as factors known to us at the time the cash flows are calculated. With the undiscounted future net cash flows, we also consider recent trends in our orders, backlog, cancellation rates and volume of homes delivered, as well as our expectations related
56
to the following: product offerings; market supply and demand, including estimated average selling prices and related price appreciation; and land development, home construction and overhead costs to be incurred and related cost inflation.
With respect to the year ended November 30, 2013,
these expectations reflected our experience that, notwithstanding fluctuations in our company-wide net orders, backlog levels, homes delivered and housing gross profit margin, on a year-over-year basis, market conditions for each of our assets in inventory where impairment indicators were identified have been generally stable or improved, with no significant deterioration identified as to revenue and cost drivers that would prevent or otherwise impact recoverability. Based on this experience, and taking into account the signs of stability and improvement in many markets for new home sales, our inventory assessments as of November 30, 2013 considered an expected steady overall sales pace and average selling price performance for 2014 relative to the pace and performance in recent quarters.
While in the fourth quarter of 2013, our West Coast homebuilding reporting segment reported year-over-year decreases in homes delivered, net orders and ending backlog, these decreases were largely due to our selling through older communities and shifting our investment strategy to favor coastal California submarkets, and delays in opening new communities, and were not reflective of a decline in market conditions, particularly as the average selling price of homes delivered in the segment increased
by 29%
in the 2013 fourth quarter and the housing gross profit margin improved
to 22.2% from 14.3%.
Given the inherent challenges and uncertainties in forecasting future results, our inventory assessments at the time they are made take into consideration whether a community or land parcel is active, meaning whether it is open for sales and/or undergoing development, or whether it is being held for future development. Due to the short-term nature of active communities and land parcels as compared to land held for future development, our inventory assessments generally assume the continuation of then-current market conditions, subject to identifying information suggesting significant sustained changes in such conditions. These assessments, at the time made, generally anticipate net orders, average selling prices, volume of homes delivered and costs for land development and home construction to continue at or near then-current levels through the particular asset’s estimated remaining life. Inventory assessments for our land held for future development consider then-current market conditions as well as subjective forecasts regarding the timing and costs of land development and home construction and related cost inflation; the product(s) to be offered; and the net orders, volume of homes delivered, and selling prices and related price appreciation of the offered product(s) when an associated community is anticipated to open for sales. We evaluate various factors to develop these forecasts, including the availability of and demand for homes and finished lots within the relevant marketplace; historical, current and expected future sales trends for the marketplace; and third-party data, if available. These various estimates, trends, expectations and assumptions used in each of our inventory assessments are specific to each community or land parcel based on what we believe are reasonable forecasts for performance and may vary among communities or land parcels and may vary over time.
We record an inventory impairment charge when the carrying value of a real estate asset is greater than the undiscounted future net cash flows the asset is expected to generate. These real estate assets are written down to fair value, which is primarily based on the estimated future net cash flows discounted for inherent risk associated with each such asset.
Inputs used in our calculation of estimated discounted future net cash flows are specific to each affected community or land parcel and are based on our expectations for each such asset as of the applicable measurement date, including, among others, expectations related to average selling prices and volume of homes delivered.
The discount rates used in our estimated discounted cash flows ranged from 17% to 20% during 2013, 2012 and 2011.
The discount rates we used were impacted by the following at the time the calculation was made: the risk-free rate of return; expected risk premium based on estimated land development, home construction and delivery timelines; market risk from potential future price erosion; cost uncertainty due to land development or home construction cost increases; and other risks specific to the asset or conditions in the market in which the asset is located.
As of
November 30, 2013
, the aggregate carrying value of our inventory that had been impacted by inventory impairment charges was
$293.1 million
, representing
42
communities and various other land parcels. As of
November 30, 2012
, the aggregate carrying value of our inventory that had been impacted by inventory impairment charges was
$307.2 million
, representing
46
communities and various other land parcels.
Our inventory controlled under land option contracts and other similar contracts is assessed to determine whether it continues to meet our internal investment and marketing standards. Assessments are made separately for each optioned land parcel on a quarterly basis and are affected by the following factors relative to the market in which the asset is located, among others: current and/or anticipated net orders, average selling prices and volume of homes delivered; estimated land development and home construction costs; and projected profitability on expected future housing or land sales. When a decision is made not to exercise certain land option contracts and other similar contracts due to market conditions and/or changes in our marketing strategy, we write off the related inventory costs, including non-refundable deposits and unrecoverable pre-acquisition costs.
The estimated remaining life of each community or land parcel in our inventory depends on various factors, such as the total number of lots remaining; the expected timeline to acquire and entitle land and develop lots to build homes; the anticipated future net order and cancellation rates; and the expected timeline to build and deliver homes sold. While it is difficult to determine a precise timeframe for any particular inventory asset, we estimate our inventory assets’ remaining operating lives under current and expected future market conditions to range generally from
one year to in excess of 10 years.
Based on current market conditions
57
and expected delivery timelines, we expect to realize, on an overall basis, the majority of our current inventory balance within
five years. The following table presents our inventory balance as of November 30, 2013, based on our current estimated timeframe of delivery for the last home within an applicable community or land parcel (in millions):
|
0-2 years
|
3-5 years
|
6-10 years
|
Greater than
10 years
|
Total
|
|||||||||||||||
|
Inventories as of November 30, 2013
|
$
|
1,109.4
|
|
$
|
621.1
|
|
$
|
409.7
|
|
$
|
158.4
|
|
$
|
2,298.6
|
|
||||
The inventory balance in the 6 to 10 years category as of November 30, 2013 was located throughout all of our homebuilding reporting segments, though mostly in our West Coast and Southeast homebuilding reporting segments. The inventory balance in the greater than 10 years category as of November 30, 2013 was located in our West Coast, Southwest, and Southeast homebuilding reporting segments. The inventory balances in the 6 to 10 years and greater than 10 years categories, which collectively represented 25% of our total inventory at November 30, 2013, were primarily comprised of land held for future development.
Due to the judgment and assumptions applied in the estimation process with respect to inventory impairments, land option contract abandonments, the remaining operating lives of our inventory assets and the realization of our inventory balances, particularly as to inventory held for future development, it is possible that actual results could differ substantially from those estimated.
We believe that the carrying value of our inventory balance as of November 30, 2013 is recoverable. Our considerations in making this determination include the factors and trends incorporated into our impairment analyses, and as applicable, the prevailing regulatory environment, competition from other homebuilders, inventory levels and sales activity of resale homes, and the local economic conditions where an asset is located. In addition, we consider the financial and operational status and expectations of our inventories as well as unique attributes of each community or land parcel that could be viewed as indicators for potential future impairments. However, if conditions in the overall housing market or in specific markets worsen in the future beyond our current expectations, if future changes in our marketing strategy significantly affect any key assumptions used in our projections of future cash flows, or if there are material changes in any of the other items we consider in assessing recoverability, we may recognize charges in future periods for inventory impairments or land option contract abandonments, or both, related to our current inventory assets. Any such charges could be material to our consolidated financial statements.
Fair Value Measurements.
As discussed in Note 14. Fair Value Disclosures in the Notes to Consolidated Financial Statements in this report, Accounting Standards Codification Topic No. 820, “Fair Value Measurements and Disclosures” (“ASC 820”),
provides a framework for measuring the fair value of assets and liabilities under GAAP, and establishes a fair value hierarchy that requires an entity to maximize the use of observable inputs and minimize the use of unobservable inputs when measuring fair value.
The fair value hierarchy can be summarized as follows:
|
Level 1
|
Fair value determined based on quoted prices in active markets for identical assets or liabilities.
|
|
Level 2
|
Fair value determined using significant observable inputs, such as quoted prices for similar assets or liabilities or quoted prices for identical or similar assets or liabilities in markets that are not active, inputs other than quoted prices that are observable for the asset or liability, or inputs that are derived principally from or corroborated by observable market data, by correlation or other means.
|
|
Level 3
|
Fair value determined using significant unobservable inputs, such as pricing models, discounted cash flows, or similar techniques.
|
Fair value measurements are used for inventories on a nonrecurring basis when events and circumstances indicate the carrying value is not recoverable.
The fair values for long-lived assets held and used that were determined using Level 3 inputs were primarily based on the estimated future net cash flows discounted for inherent risk associated with each asset
as described in Note 7. Inventory Impairments and Land Option Contract Abandonments in the Notes to Consolidated Financial Statements in this report.
The discount rates we used were impacted by the following at the time the calculation was made: the risk-free rate of return; expected risk premium based on estimated land development, home construction and delivery timelines; market risk from potential future price erosion; cost uncertainty due to land development or home construction cost increases; and other risks specific to the asset or conditions in the market in which the asset is located.
These factors were specific to each affected community or land parcel and may have varied among communities or land parcels. Due to uncertainties in the estimation process, it is possible that actual results could differ from those estimated.
Our financial instruments consist of cash and cash equivalents, restricted cash, senior notes, the 1.375% Convertible Senior Notes due 2019, and mortgages and land contracts due to land sellers and other loans. Fair value measurements of financial instruments are determined by various market data and other valuation techniques as appropriate. When available, we use quoted market prices in active markets to determine fair value.
58
Warranty Costs.
As discussed in Note 15. Commitments and Contingencies in the Notes to Consolidated Financial Statements in this report, we
provide a limited warranty on all of our homes.
The specific terms and conditions of our limited warranty program vary depending upon the markets in which we do business.
We estimate the costs that may be incurred under each limited warranty and record a liability in the amount of such costs at the time the revenue associated with the sale of each home is recognized.
Our expense associated with the issuance of these warranties totaled
$14.3 million
in 2013,
$8.4 million
in 2012 and
$4.9 million
in 2011. The year-over-year increase in the expense associated with warranties issued in 2013 and 2012 reflected higher housing revenues in each of those years. Additionally, in 2013, we increased the warranty accrual rate per home based on historical claims experience.
Our primary assumption in estimating the amounts we accrue for warranty costs is that historical claims experience is a strong indicator of future claims experience. Factors that affect our warranty liability include the number of homes delivered, historical and anticipated rates of warranty claims, and cost per claim. We periodically assess the adequacy of our accrued warranty liability
, which is included in accrued expenses and other liabilities in our consolidated balance sheets,
and adjust the amount as necessary based on our assessment.
Our assessment includes the review of our actual warranty costs incurred to identify trends and changes in our warranty claims experience, and considers our home construction quality and customer service initiatives and outside events.
In assessing our overall warranty liability at a reporting date, we evaluate the costs for warranty-related items on a combined basis for all of our previously delivered homes that are under our limited warranty program. This includes any such homes in central and southwest Florida that have been identified as having water intrusion-related issues and similarly affected homes in central and southwest Florida that we believe are likely to be identified in the future as discussed in Note 15. Commitments and Contingencies in the Notes to Consolidated Financial Statements in this report. In 2013, based on our assessment of our overall warranty liability, we recorded adjustments to increase our warranty liability by
$32.0
million with a corresponding charge to construction and land costs in our consolidated statements of operations. The adjustments reflected the remaining estimated repair costs associated with homes in central and southwest Florida that have been identified as having water intrusion-related issues and the estimated repair costs associated with similarly affected homes in central and southwest Florida that we believe are likely to be identified in the future, net of estimated probable recoveries of such repair costs and other adjustments.
Depending on the number of additional affected homes in central and southwest Florida that are identified as having water intrusion-related issues, and the actual costs we incur in future periods to repair identified affected homes, our estimate of costs to repair similarly affected homes in central and southwest Florida that we believe are likely be identified in the future, and/or actual or estimated costs to repair homes affected by other issues, including costs to provide affected homeowners with temporary housing, we may revise the amount of our estimated liability, which could result in an increase or decrease in our overall warranty liability. Based on our investigation of these water intrusion-related issues, we believe that our warranty liability is adequate to cover the estimated probable total repair costs on these affected homes, similarly affected homes that we believe are likely to be identified in the future and on homes affected by other issues, although we believe it is reasonably possible that our loss in this matter could exceed the amount accrued as of November 30, 2013 by up to $6 million.
In 2012 and 2011, notwithstanding our actual or estimated remaining repair cost related to the allegedly defective drywall material and water intrusion-related issues, as discussed in Note 15. Commitments and Contingencies in the Notes to Consolidated Financial Statements in this report, we had experienced favorable trends in our actual warranty costs incurred for the previous several years with respect to claims relating to other warranty-related items, reflecting, among other things, our ongoing focus on construction quality and customer service. Based on our assessments of these and other relevant factors on a combined basis, we determined that our overall warranty liability at the end of each year was sufficient to cover our overall warranty obligations on previously delivered homes that are under our limited warranty program. We recorded favorable warranty adjustments of
$11.2 million
during 2012 and
$7.4 million
during 2011 as reductions to construction and land costs in our consolidated statements of operations in those periods. Additionally, based on our assessment of our overall warranty liability as of November 30, 2012 on a combined basis for all of our previously delivered homes that were under our limited warranty, including the homes identified as affected or potentially affected by allegedly defective drywall material and the increased number of homes potentially affected by water intrusion-related issues, we recorded an adjustment to increase our overall warranty liability by
$2.6 million
in the fourth quarter of 2012 with a corresponding charge to construction and land costs in our consolidated statements of operations.
While we believe the warranty liability currently reflected in our consolidated balance sheets to be adequate, unanticipated changes or developments in the legal environment, local weather, land or environmental conditions, quality of materials or methods used in the construction of homes or customer service practices and the results of our investigation of and the repair efforts related to homes in central and southwest Florida affected by water intrusion-related issues could have a significant impact on our actual warranty costs in the future and such amounts could differ from our current estimates.
A 10% change in the historical warranty rates used to estimate our warranty accrual would not result in a material change in our accrual.
Self-Insurance.
As discussed in Note 15. Commitments and Contingencies in the Notes to Consolidated Financial Statements in this report, w
e maintain, and require the majority of our subcontractors to maintain, general liability insurance (including
59
construction defect and bodily injury coverage) and workers’ compensation insurance. These insurance policies protect us against a portion of our risk of loss from claims related to our homebuilding activities, subject to certain self-insured retentions, deductibles and other coverage limits.
We self-insure a portion of our overall risk through the use of a captive insurance subsidiary. We also maintain certain other insurance policies.
In Arizona, California, Colorado and Nevada, our subcontractors’ general liability insurance primarily takes the form of a wrap-up policy, where eligible subcontractors are enrolled as insureds on each project. Enrolled subcontractors contribute toward the cost of the insurance and agree to pay a contractual amount in the future in the event of a claim related to their work.
We record expenses and liabilities based on the estimated costs required to cover our self-insured retention and deductible amounts under our insurance policies, and the estimated costs of potential claims and claim adjustment expenses that are above our coverage limits or that are not covered by our insurance policies. These estimated costs are based on an analysis of our historical claims and industry data, and include an estimate of construction defect claims incurred but not yet reported.
Our estimated liabilities for such items were
$92.2 million
at
November 30, 2013
and
$93.3 million
at
November 30, 2012
. These amounts are included in accrued expenses and other liabilities in our consolidated balance sheets. Our expenses associated with self-insurance totaled
$8.2 million
in
2013
,
$8.7 million
in
2012
and
$7.2 million
in
2011
. These expenses were largely offset by contributions from subcontractors participating in the wrap-up policy.
We engage a third-party actuary that uses our historical claim and expense data, as well as industry data, to estimate our liabilities related to unpaid claims, claim adjustment expenses, third-party recoveries and incurred but not yet reported claims for the risks that we are assuming under our self-insurance.
These estimates are subject to uncertainty due to a variety of factors, the most significant being the long period of time between the delivery of a home to a homebuyer and when a structural warranty or construction defect claim is made, and the ultimate resolution of the construction defect claim. Though state regulations vary, construction defect claims are reported and resolved over a prolonged period of time, which can extend for 10 years or longer. As a result, the majority of the estimated liability relates to incurred but not yet reported claims. Because the majority of our estimated liabilities relate to incurred but not yet reported claims, adjustments related to individual existing claims generally do not significantly impact the overall estimated liability. Adjustments to our liabilities related to homes delivered in prior years are recorded in the period in which a change in our estimate occurs.
The projection of losses related to these liabilities requires actuarial assumptions that are subject to variability due to uncertainties regarding construction defect claims relative to our markets and the types of product we build, insurance industry practices and legal or regulatory interpretations, among other factors. Key assumptions used in these estimates include claim frequencies, severities and settlement patterns, which can occur over an extended period of time.
In addition, changes in the frequency and severity of reported claims and the estimates to settle claims can impact the trends and assumptions used in the actuarial analysis, which could be material to our consolidated financial statements.
Due to the degree of judgment required and the potential for variability in these underlying assumptions, our actual future costs could differ from those estimated
. Based on the actuarial analysis performed, we believe it is reasonably possible that our losses related to construction defect claims as of November 30, 2013 could range from $80 million to $105 million. While this range represents our best estimate of our ultimate liability, there can be no assurance that the actual costs will fall within this range and they could be higher.
Stock-Based Compensation.
As discussed in Note 1. Summary of Significant Accounting Policies in the Notes to Consolidated Financial Statements in this report, w
e measure and recognize compensation expense associated with our grant of equity-based awards in accordance with
Accounting Standards Codification Topic No. 718, “Compensation—Stock Compensation” (“ASC 718”),
which requires that companies measure and recognize compensation expense at an amount equal to the fair value of share-based payments granted under compensation arrangements over the vesting period.
As discussed in Note 19. Employee Benefit and Stock Plans in the Notes to Consolidated Financial Statements in this report, we have provided compensation benefits to certain of our employees in the form of stock options, restricted stock, performance-based restricted stock units (each a “PSU”), phantom shares and stock appreciation rights (“SARs”). Determining the fair value of share-based awards requires judgment to identify the appropriate valuation model and develop the assumptions, including the expected term of the stock options or SARs, expected stock-price volatility and dividend yield, to be used in the calculation. Judgment is also required in estimating the percentage of share-based awards that are expected to vest.
We estimate the fair value of stock options and SARs granted using the Black-Scholes option-pricing model with assumptions based primarily on historical data.
The expected volatility factor was based on a combination of the historical volatility of our common stock and the implied volatility of publicly traded options on our common stock. If actual results differ significantly from these estimates, stock-based compensation expense could be higher and have a material impact on our consolidated financial statements.
Income Taxes.
As discussed in Note 1. Summary of Significant Accounting Policies in the Notes to Consolidated Financial Statements in this report, we account for income taxes in accordance with ASC 740.
The provision for, or benefit from, income taxes is calculated using the asset and liability method, under which deferred tax assets and liabilities are recorded based on the difference between the financial statement and tax basis of assets and liabilities using enacted tax rates in effect for the year in which the differences are expected to reverse. Deferred tax assets are evaluated on a quarterly basis to determine if adjustments
60
to the valuation allowance are required. In accordance with ASC 740, we assess whether a valuation allowance should be established based on the consideration of all available evidence using a “more likely than not” standard with respect to whether deferred tax assets will be realized. The ultimate realization of deferred tax assets depends primarily on the generation of future taxable income. The value of our deferred tax assets will depend on applicable income tax rates.
Judgment is required in determining the future tax consequences of events that have been recognized in our consolidated financial statements and/or tax returns. Differences between anticipated and actual outcomes of these future tax consequences could have a material impact on our consolidated financial statements.
As discussed in Note 12. Income Taxes in the Notes to Consolidated Financial Statements in this report, w
e recognize accrued interest and penalties related to unrecognized tax benefits in our consolidated financial statements as a component of the provision for income taxes.
Our liability for unrecognized tax benefits, combined with accrued interest and penalties, is reflected as a component of accrued expenses and other liabilities in our consolidated balance sheets. Judgment is required in evaluating uncertain tax positions. We evaluate our uncertain tax positions quarterly based on various factors, including changes in facts or circumstances, tax laws or the status of audits by tax authorities. Changes in the recognition or measurement of uncertain tax positions could have a material impact on our consolidated financial statements in the period in which we make the change.
RECENT ACCOUNTING PRONOUNCEMENTS
In June 2011, the Financial Accounting Standards Board (“FASB”) issued Accounting Standards Update No. 2011-05, “Presentation of Comprehensive Income” (“ASU 2011-05”). The amendments in ASU 2011-05 allow
an entity the option to present the total of comprehensive income, the components of net income, and the components of other comprehensive income either in a single continuous statement of comprehensive income or in two separate but consecutive statements. In both instances, an entity is required to present each component of net income along with total net income, each component of other comprehensive income along with a total for other comprehensive income, and a total amount for comprehensive income. ASU 2011-05 eliminates the option to present the components of other comprehensive income as part of the statement of changes in stockholders’ equity. The amendments in ASU 2011-05 do not change the items that must be reported in other comprehensive income or when an item of other comprehensive income must be reclassified to net income. However, in December 2011, the FASB issued
Accounting Standards Update No. 2011-12, “Deferral of the Effective Date for Amendments to the Presentation of Reclassifications of Items Out of Accumulated Other Comprehensive Income in Accounting Standards Update No. 2011-05” (“ASU 2011-12”),
which deferred the guidance on whether to require entities to present reclassification adjustments out of accumulated other comprehensive income by component in both the statement where net income is presented and the statement where other comprehensive income is presented for both interim and annual financial statements. ASU 2011-12 reinstated the requirements for the presentation of reclassifications that were in place prior to the issuance of ASU 2011-05 and did not change the effective date for ASU 2011-05. For public entities, the amendments in ASU 2011-05 and ASU 2011-12 are effective for fiscal years, and interim periods within those years, beginning after December 15, 2011, and should be applied retrospectively. Our adoption of this guidance, which is related to disclosure only, as of February 28, 2013 did not have a material impact on our consolidated financial statements.
In February 2013, the FASB issued Accounting Standards Update No. 2013-02, “Reporting of Amounts Reclassified Out of Accumulated Other Comprehensive Income” (“ASU 2013-02”),
which requires an entity to provide information about the amounts reclassified out of accumulated other comprehensive income by component. In addition, ASU 2013-02 requires an entity to present, either on the face of the income statement or in the notes to financial statements, significant amounts reclassified out of accumulated other comprehensive income by the respective line items of net income but only if the amount reclassified is required under GAAP to be reclassified to net income in its entirety in the same reporting period. For other amounts, an entity is required to cross-reference to other disclosures required under GAAP that provide additional detail about those amounts. The amendments in ASU 2013-02 do not change the current requirements for reporting net income or other comprehensive income in the financial statements. For public entities, the amendments in ASU 2013-02 are effective prospectively for reporting periods beginning after December 15, 2012. Our adoption of this guidance, which is related to disclosure only, as of May 31, 2013 did not have a material impact on our consolidated financial statements.
In July 2013, the FASB issued Accounting Standards Update No. 2013-11, “Income Taxes (Topic 740): Presentation of an Unrecognized Tax Benefit When a Net Operating Loss Carryforward, a Similar Tax Loss, or a Tax Credit Carryforward Exists (a consensus of the FASB Emerging Issues Task Force)” (“ASU 2013-11”),
which states that an unrecognized tax benefit, or a portion of an unrecognized tax benefit, should be presented in the financial statements as a reduction to a deferred tax asset for a net operating loss carryforward, a similar tax loss, or a tax credit carryforward, except as follows. To the extent a net operating loss carryforward, a similar tax loss, or a tax credit carryforward is not available at the reporting date under the tax law of the applicable jurisdiction to settle any additional income taxes that would result from the disallowance of a tax position or that the tax law of the applicable jurisdiction does not require the entity to use, and the entity does not intend to use, the deferred tax asset for such purpose, the unrecognized tax benefit should be presented in the financial statements as a liability and should not be combined with deferred tax assets. ASU 2013-11 applies to all entities that have unrecognized tax benefits when a net operating loss
61
carryforward, a similar tax loss, or a tax credit carryforward exists at the reporting date. The amendments in ASU 2013-11 are effective for fiscal years, and interim periods within those years, beginning after December 15, 2013. Early adoption is permitted. The amendments should be applied prospectively to all unrecognized tax benefits that exist at the effective date. Retrospective application is permitted. We believe the adoption of this guidance will not have a material impact on our consolidated financial statements.
OUTLOOK
As we enter 2014, we expect most housing markets to continue to advance from the generally improved conditions of 2013, although it is likely to be at a more measured pace than in the first half of 2013. Inventories of both new and existing homes available for sale are low and there is steady demand for housing. We also expect the positive trends underpinning the present housing recovery, including population growth, job growth, rising home equity levels, and household formation growth above the rate of new home construction, to remain intact for 2014. In addition, despite the increase in mortgage loan interest rates and home selling prices that slowed sales activity in the second half of 2013, housing affordability remains favorable by historical standards, and we believe demand for homes will remain healthy in 2014 as consumers accept higher home price levels. In our view, the housing recovery that began taking shape in 2012 is still at an early stage of a longer-term, sustainable upward cycle, with its progress largely dependent on economic growth. As a result, and given recent government reports of strong improvement in employment and GDP growth, we believe there is significant opportunity for us to build on the momentum and full-year net income we generated in 2013 to profitably expand our business in 2014.
Over the past few years, we have worked diligently to strategically position our homebuilding activities and inventory investments in higher-performing, desirable locations in land constrained growth markets, to refine our products to meet consumer preferences and to execute on related profitability and growth strategies. These coordinated actions are reshaping our geographic submarket and product mix and have resulted in an expansion of our customer base and achieve a better balance of first-time and move-up buyers within that base. Moreover, we are attracting buyers with higher household income levels and stronger credit profiles to our Built to Order homes, and they are choosing to purchase larger homes at higher price points and to spend more on design options and features at our KB Home Studios. These trends are clearest in our West Coast homebuilding reporting segment, where our investment focus toward coastal California submarkets, which feature generally higher selling prices and demand for homes as compared to the state’s inland submarkets, drove significant increases in the segment’s average selling price and housing gross profit margin in each quarter of 2013, both sequentially and on a year-over-year basis. With the performance we experienced in 2013 and the pipeline of new community openings we currently have in place for 2014, we expect our business in this segment, as well as in our other three homebuilding reporting segments, to continue to grow. Further, our deliberate strategic shift within our core homebuyer profile across our operations produced both top- and bottom-line improvements throughout 2013, and generated earnings in the second half of the year.
We believe our results for 2013 demonstrate the progress we have made on our profitability and revenue growth priorities. We achieved measurable improvement in our financial and operating performance on a year-over-year basis, with expansion in revenues, homes delivered, net order value and housing gross profit margin, and a reduction in our selling, general and administrative expenses as a percentage of housing revenues. Most significantly, we reported full-year net income in 2013 for the first time since 2006. With the backlog we have in place as of November 30, 2013, we believe the continued implementation of our strategic growth initiatives will drive year-over-year improvements in revenues, homes delivered, average selling price, housing gross profit margin and homebuilding operating income as a percentage of homebuilding revenues in 2014.
For 2014, as in 2013, we intend to prioritize increasing profitability per home delivered and executing on operational measures to grow revenues. Along with investing in land and land development and advancing the shift of our community mix towards higher-performing submarkets, we are focused on balancing three interconnected initiatives — optimizing sales pace, expanding margins, and growing our community count — with the goals of sustaining our present upward revenue and profit trajectory and maximizing returns on our land assets. In addition, we will continue to leverage the strengths of our KBnxt operational business model to capture additional premiums from higher-demand floor plans, community lot locations, home exterior elevations and certain structural options, among other revenue-generating strategies. Through these actions, we anticipate that our overall average selling price will continue to trend higher in 2014, though the percentage growth rate is expected to moderate to the mid- to high-single digit range for the year as we are starting from a higher base. We are also working to further value engineer our products, achieve greater operating efficiencies, and contain direct construction costs.
Strategic investment in land and land development will remain an important component of our efforts to expand our community count and grow our revenues. In 2013, we invested
$1.14 billion
in land and land development and ended the fiscal year with 61,095 lots owned or controlled, up
37%
from November 30, 2012. We also added to our liquidity by raising total net proceeds of more than $330 million from the successful concurrent underwritten public issuance of the 1.375% Convertible Senior Notes due 2019 and the Common Stock Offering, and further enhanced our financial flexibility by entering into the Credit Facility. In the fourth quarter of 2013, we generated net proceeds of
$443.3 million
from the underwritten public issuance of the 7.00% Senior
62
Notes due 2021 and retired
$215.1 million
in aggregate principal amount of our senior notes due 2014 and 2015. These steps have positioned our balance sheet to support our future growth through additional investments in land and land development in 2014 in line with market conditions and available opportunities that meet our investment return and marketing standards.
We believe increasing our community count will be a primary driver of our top-line growth in 2014, in combination with other strategic efforts to expand our average selling price and sales pace per community where possible in our served markets. We expect to open more new home communities for sales in 2014 than we did in 2013, and that our community count will increase in the range of 10% to 20% year over year by the end of 2014, with most of the growth occurring in the second half of the year. At the same time, consistent with our goal to prioritize profitability, we will continue to calibrate sales pace with local market conditions at our communities open for sales to improve our margins and return on investment.
With the strategic actions we have taken and the improved results we achieved in 2013, we believe that we are favorably situated to accomplish our top profitability and growth priorities in 2014, particularly in view of the positive longer-term demographic and population growth trends that we expect will continue to drive future demand for homeownership in our served markets. In particular, we believe we have a competitive advantage with our business in California, which accounted for nearly half of both our 2013 and 2012 revenues, and where our projected housing gross profit margins in backlog increased 34% in 2013 on a year-over-year basis. Based on these trends and generally favorable housing market conditions in our served markets in the state, we expect that California will continue to be a significant contributor to our performance in 2014. We also anticipate that all four of our homebuilding reporting segments will generate year-over-year growth in homes delivered, average selling prices and revenues in 2014.
While the strength and durability of the present housing recovery, our future performance and the strategies we implement (and adjust or refine as necessary or appropriate) will depend significantly on prevailing economic and capital, credit and financial market conditions and on a fairly stable and constructive political and regulatory environment (particularly in regards to housing and mortgage loan financing policies), among other factors, and we caution that our future quarterly results could fluctuate, we expect to be profitable for 2014, and to achieve solid growth in the years ahead if and as housing markets continue to improve.
63
FORWARD-LOOKING STATEMENTS
Investors are cautioned that certain statements contained in this report, as well as some statements by us in periodic press releases and other public disclosures and some oral statements by us to securities analysts, stockholders and others during presentations, are “forward-looking statements” within the meaning of the Private Securities Litigation Reform Act of 1995 (the “Act”). Statements that are predictive in nature, that depend upon or refer to future events or conditions, or that include words such as “expects,” “anticipates,” “intends,” “plans,” “believes,” “estimates,” “hopes,” and similar expressions constitute forward-looking statements. In addition, any statements that we may make or provide concerning future financial or operating performance (including, without limitation, future revenues, community count, homes delivered, net orders, selling prices, sales pace per new home community, expenses, expense ratios, housing gross profit margins, earnings or earnings per share, or growth or growth rates), future market conditions, future interest rates, and other economic conditions, ongoing business strategies or prospects, future dividends and changes in dividend levels, the value of our backlog (including amounts that we expect to realize upon delivery of homes included in our backlog and the timing of those deliveries), the value of our net orders, potential future asset acquisitions and the impact of completed acquisitions, future share issuances or repurchases, future debt issuances, repurchases or redemptions and possible future actions are also forward-looking statements as defined by the Act. Forward-looking statements are based on our current expectations and projections about future events and are subject to risks, uncertainties, and assumptions about our operations, economic and market factors, and the homebuilding industry, among other things. These statements are not guarantees of future performance, and we have no specific policy or intention to update these statements.
Actual events and results may differ materially from those expressed or forecasted in forward-looking statements due to a number of factors. The most important risk factors that could cause our actual performance and future events and actions to differ materially from such forward-looking statements include, but are not limited to the following:
|
•
|
general economic, employment and business conditions;
|
|
•
|
population growth, household formations and demographic trends;
|
|
•
|
adverse market conditions, including an increased supply of unsold homes, declining home prices and greater foreclosure and short sale activity, among other things, that could negatively affect our consolidated financial statements, including due to additional impairment or land option contract abandonment charges, lower revenues and operating and other losses;
|
|
•
|
conditions in the capital, credit and financial markets (including mortgage lending standards, the availability of mortgage financing and mortgage foreclosure rates);
|
|
•
|
material prices and availability;
|
|
•
|
labor costs and availability;
|
|
•
|
changes in interest rates;
|
|
•
|
inflation;
|
|
•
|
our debt level, including our ratio of debt to total capital, and our ability to adjust our debt level, maturity schedule and structure and to access the equity, credit, capital or other financial markets or other external financing sources, including raising capital through the public or private issuance of common stock, debt or other securities, and/or project financing, on favorable terms;
|
|
•
|
our compliance with the terms and covenants of the Credit Facility;
|
|
•
|
weak or declining consumer confidence, either generally or specifically with respect to purchasing homes;
|
|
•
|
competition for home sales from other sellers of new and resale homes, including lenders and other sellers of homes obtained through foreclosures or short sales;
|
|
•
|
weather conditions, significant natural disasters and other environmental factors;
|
|
•
|
government actions, policies, programs and regulations directed at or affecting the housing market (including the Dodd-Frank Act, tax credits, tax incentives and/or subsidies for home purchases, tax deductions for mortgage interest payments and real estate taxes, tax exemptions for profits on home sales, programs intended to modify existing mortgage loans and to prevent mortgage foreclosures and the standards, fees and size limits applicable to the purchase or insuring of mortgage
|
64
loans by government-sponsored enterprises and government agencies), the homebuilding industry, or construction activities;
|
•
|
decisions regarding federal fiscal and monetary policies, including those relating to taxation, government spending, interest rates and economic stimulus measures;
|
|
•
|
the availability and cost of land in desirable areas;
|
|
•
|
our warranty claims experience with respect to homes previously delivered and actual warranty costs incurred, including our warranty claims and costs experience at certain of our communities in Florida;
|
|
•
|
legal or regulatory proceedings or claims;
|
|
•
|
our ability to use/realize the net deferred tax assets we have generated;
|
|
•
|
our ability to successfully implement our current and planned strategies and initiatives with respect to product, geographic and market positioning (including our efforts to expand our inventory base/pipeline with desirable land positions or interests at reasonable cost and to expand our community count, open additional new home communities for sales and sell higher-priced homes and more design options, and our operational and investment concentration in markets in California), revenue growth, asset optimization, asset activation, local field management and talent investment, and overhead reduction and cost management;
|
|
•
|
consumer traffic to our new home communities and consumer interest in our product designs and offerings, particularly higher-income consumers;
|
|
•
|
cancellations and our ability to realize our backlog by converting net orders to home deliveries;
|
|
•
|
our home sales and delivery performance, particularly in key markets in California;
|
|
•
|
the manner in which our homebuyers are offered, and whether they are able, to obtain mortgage loans and mortgage banking services, including from our preferred mortgage lender, Nationstar;
|
|
•
|
the performance of Nationstar as our preferred mortgage lender;
|
|
•
|
the ability of Home Community Mortgage to become operational in all of our served markets as and by the time currently anticipa
ted, and its performance upon becoming operational
;
|
|
•
|
information technology failures and data security breaches; and
|
|
•
|
other events outside of our control.
|
65
|
Item 7A.
|
QUANTITATIVE AND QUALITATIVE DISCLOSURES ABOUT MARKET RISK
|
We enter into debt obligations primarily to support general corporate purposes, including the operations of our subsidiaries. We are subject to interest rate risk on our senior notes and the 1.375% Convertible Senior Notes due 2019. For fixed rate debt, changes in interest rates generally affect the fair value of the debt instrument, but not our earnings or cash flows. Under our current policies, we do not use interest rate derivative instruments to manage our exposure to changes in interest rates.
The following tables present principal cash flows by scheduled maturity, weighted average interest rates and the estimated fair value of our long-term fixed rate debt obligations as of November 30, 2013 and 2012 (dollars in thousands):
|
As of November 30, 2013 for the Years Ended November 30,
|
Fair Value at
November 30,
2013
|
||||||||||||||||||||||||||||||
|
2014
|
2015
|
2016
|
2017
|
2018
|
Thereafter
|
Total
|
|||||||||||||||||||||||||
|
Long-term debt
|
|||||||||||||||||||||||||||||||
|
Fixed Rate
|
$
|
—
|
|
$
|
199,864
|
|
$
|
—
|
|
$
|
262,048
|
|
$
|
299,261
|
|
$
|
1,375,710
|
|
$
|
2,136,883
|
|
$
|
2,294,150
|
|
|||||||
|
Weighted Average Interest Rate
|
—
|
%
|
6.3
|
%
|
—
|
%
|
9.1
|
%
|
7.3
|
%
|
6.4
|
%
|
6.9
|
%
|
|||||||||||||||||
|
As of November 30, 2012 for the Years Ended November 30,
|
Fair Value at
November 30,
2012
|
||||||||||||||||||||||||||||||
|
2013
|
2014
|
2015
|
2016
|
2017
|
Thereafter
|
Total
|
|||||||||||||||||||||||||
|
Long-term debt
|
|||||||||||||||||||||||||||||||
|
Fixed Rate
|
$
|
—
|
|
$
|
75,911
|
|
$
|
338,825
|
|
$
|
—
|
|
$
|
261,430
|
|
$
|
994,338
|
|
$
|
1,670,504
|
|
$
|
1,831,596
|
|
|||||||
|
Weighted Average Interest Rate
|
—
|
%
|
5.8
|
%
|
6.1
|
%
|
—
|
%
|
9.1
|
%
|
7.6
|
%
|
7.5
|
%
|
|||||||||||||||||
66
|
Item 8.
|
FINANCIAL STATEMENTS AND SUPPLEMENTARY DATA
|
KB HOME
INDEX TO CONSOLIDATED FINANCIAL STATEMENTS
|
|
Page
Number
|
Separate combined financial statements of our unconsolidated joint venture activities have been omitted because, if considered in the aggregate, they would not constitute a significant subsidiary as defined by Rule 3-09 of Regulation S-X.
67
KB HOME
(In Thousands, Except Per Share Amounts)
|
|
Years Ended November 30,
|
||||||||||
|
|
2013
|
2012
|
2011
|
||||||||
|
Total revenues
|
$
|
2,097,130
|
|
$
|
1,560,115
|
|
$
|
1,315,866
|
|
||
|
Homebuilding:
|
|||||||||||
|
Revenues
|
$
|
2,084,978
|
|
$
|
1,548,432
|
|
$
|
1,305,562
|
|
||
|
Construction and land costs
|
(1,737,086
|
)
|
(1,332,045
|
)
|
(1,157,280
|
)
|
|||||
|
Selling, general and administrative expenses
|
(255,808
|
)
|
(236,643
|
)
|
(220,591
|
)
|
|||||
|
Loss on loan guaranty
|
—
|
|
—
|
|
(30,765
|
)
|
|||||
|
Operating income (loss)
|
92,084
|
|
(20,256
|
)
|
(103,074
|
)
|
|||||
|
Interest income
|
792
|
|
518
|
|
871
|
|
|||||
|
Interest expense
|
(62,690
|
)
|
(69,804
|
)
|
(49,204
|
)
|
|||||
|
Equity in loss of unconsolidated joint ventures
|
(2,007
|
)
|
(394
|
)
|
(55,839
|
)
|
|||||
|
Homebuilding pretax income (loss)
|
28,179
|
|
(89,936
|
)
|
(207,246
|
)
|
|||||
|
Financial services:
|
|||||||||||
|
Revenues
|
12,152
|
|
11,683
|
|
10,304
|
|
|||||
|
Expenses
|
(3,042
|
)
|
(2,991
|
)
|
(3,512
|
)
|
|||||
|
Equity in income/gain on wind down of unconsolidated joint venture
|
1,074
|
|
2,191
|
|
19,286
|
|
|||||
|
Financial services pretax income
|
10,184
|
|
10,883
|
|
26,078
|
|
|||||
|
Total pretax income (loss)
|
38,363
|
|
(79,053
|
)
|
(181,168
|
)
|
|||||
|
Income tax benefit
|
1,600
|
|
20,100
|
|
2,400
|
|
|||||
|
Net income (loss)
|
$
|
39,963
|
|
$
|
(58,953
|
)
|
$
|
(178,768
|
)
|
||
|
Earnings (loss) per share:
|
|||||||||||
|
Basic
|
$
|
.48
|
|
$
|
(.76
|
)
|
$
|
(2.32
|
)
|
||
|
Diluted
|
$
|
.46
|
|
$
|
(.76
|
)
|
$
|
(2.32
|
)
|
||
|
Weighted average shares outstanding:
|
|||||||||||
|
Basic
|
82,630
|
|
77,106
|
|
77,043
|
|
|||||
|
Diluted
|
91,559
|
|
77,106
|
|
77,043
|
|
|||||
See accompanying notes.
68
KB HOME
CONSOLIDATED STATEMENTS OF COMPREHENSIVE INCOME (LOSS)
(In Thousands)
|
|
Years Ended November 30,
|
||||||||||
|
|
2013
|
2012
|
2011
|
||||||||
|
Net income (loss)
|
$
|
39,963
|
|
$
|
(58,953
|
)
|
$
|
(178,768
|
)
|
||
|
Other comprehensive income (loss):
|
|||||||||||
|
Postretirement benefit plan adjustments:
|
|||||||||||
|
Net actuarial gain (loss) arising during the period
|
7,083
|
|
(4,765
|
)
|
(5,646
|
)
|
|||||
|
Amortization of net actuarial loss
|
1,803
|
|
1,403
|
|
595
|
|
|||||
|
Amortization of prior service cost
|
1,556
|
|
1,556
|
|
1,556
|
|
|||||
|
Other comprehensive income (loss)
|
10,442
|
|
(1,806
|
)
|
(3,495
|
)
|
|||||
|
Comprehensive income (loss)
|
$
|
50,405
|
|
$
|
(60,759
|
)
|
$
|
(182,263
|
)
|
||
See accompanying notes.
69
KB HOME
(In Thousands, Except Shares)
|
|
November 30,
|
||||||
|
|
2013
|
2012
|
|||||
|
Assets
|
|||||||
|
Homebuilding:
|
|||||||
|
Cash and cash equivalents
|
$
|
530,095
|
|
$
|
524,765
|
|
|
|
Restricted cash
|
41,906
|
|
42,362
|
|
|||
|
Receivables
|
75,749
|
|
64,821
|
|
|||
|
Inventories
|
2,298,577
|
|
1,706,571
|
|
|||
|
Investments in unconsolidated joint ventures
|
130,192
|
|
123,674
|
|
|||
|
Other assets
|
107,076
|
|
95,050
|
|
|||
|
3,183,595
|
|
2,557,243
|
|
||||
|
Financial services
|
10,040
|
|
4,455
|
|
|||
|
Total assets
|
$
|
3,193,635
|
|
$
|
2,561,698
|
|
|
|
Liabilities and stockholders’ equity
|
|||||||
|
Homebuilding:
|
|||||||
|
Accounts payable
|
$
|
148,282
|
|
$
|
118,544
|
|
|
|
Accrued expenses and other liabilities
|
356,176
|
|
340,345
|
|
|||
|
Mortgages and notes payable
|
2,150,498
|
|
1,722,815
|
|
|||
|
2,654,956
|
|
2,181,704
|
|
||||
|
Financial services
|
2,593
|
|
3,188
|
|
|||
|
Stockholders’ equity:
|
|||||||
|
Preferred stock — $1.00 par value; 10,000,000 shares authorized; none issued
|
—
|
|
—
|
|
|||
|
Common stock — $1.00 par value; 290,000,000 shares authorized at November 30, 2013 and 2012; 115,296,395 and 115,178,187 shares issued at November 30, 2013 and 2012, respectively
|
115,296
|
|
115,178
|
|
|||
|
Paid-in capital
|
788,893
|
|
888,579
|
|
|||
|
Retained earnings
|
481,889
|
|
450,292
|
|
|||
|
Accumulated other comprehensive loss
|
(17,516
|
)
|
(27,958
|
)
|
|||
|
Grantor stock ownership trust, at cost: 10,501,844 and 10,615,934 shares at November 30, 2013 and 2012, respectively
|
(113,911
|
)
|
(115,149
|
)
|
|||
|
Treasury stock, at cost: 21,050,023 and 27,340,468 shares at November 30, 2013 and 2012, respectively
|
(718,565
|
)
|
(934,136
|
)
|
|||
|
Total stockholders’ equity
|
536,086
|
|
376,806
|
|
|||
|
Total liabilities and stockholders’ equity
|
$
|
3,193,635
|
|
$
|
2,561,698
|
|
|
See accompanying notes.
70
KB HOME
CONSOLIDATED STATEMENTS OF STOCKHOLDERS’ EQUITY
(In Thousands)
|
|
Years Ended November 30, 2013, 2012 and 2011
|
|||||||||||||||||||||||||||||||||||
|
|
Number of Shares
|
Common
Stock
|
Paid-in
Capital
|
Retained
Earnings
|
Accumulated
Other
Comprehensive
Loss
|
Grantor
Stock
Ownership
Trust
|
Treasury
Stock
|
Total
Stockholders’
Equity
|
||||||||||||||||||||||||||||
|
Common
Stock
|
Grantor
Stock
Ownership
Trust
|
Treasury
Stock
|
||||||||||||||||||||||||||||||||||
|
Balance at November 30, 2010
|
115,149
|
|
(11,083
|
)
|
(27,095
|
)
|
$
|
115,149
|
|
$
|
873,519
|
|
$
|
717,852
|
|
$
|
(22,657
|
)
|
$
|
(120,442
|
)
|
$
|
(931,543
|
)
|
$
|
631,878
|
|
|||||||||
|
Net loss
|
—
|
|
—
|
|
—
|
|
—
|
|
—
|
|
(178,768
|
)
|
—
|
|
—
|
|
—
|
|
(178,768
|
)
|
||||||||||||||||
|
Other comprehensive loss
|
—
|
|
—
|
|
—
|
|
—
|
|
—
|
|
—
|
|
(3,495
|
)
|
—
|
|
—
|
|
(3,495
|
)
|
||||||||||||||||
|
Dividends on common stock
|
—
|
|
—
|
|
—
|
|
—
|
|
—
|
|
(19,240
|
)
|
—
|
|
—
|
|
—
|
|
(19,240
|
)
|
||||||||||||||||
|
Employee stock options and other
|
22
|
|
—
|
|
—
|
|
22
|
|
2,410
|
|
—
|
|
—
|
|
—
|
|
—
|
|
2,432
|
|
||||||||||||||||
|
Forfeited restricted stock
|
—
|
|
—
|
|
(119
|
)
|
—
|
|
794
|
|
—
|
|
—
|
|
—
|
|
(794
|
)
|
—
|
|
||||||||||||||||
|
Stock-based compensation
|
—
|
|
—
|
|
—
|
|
—
|
|
8,054
|
|
—
|
|
—
|
|
—
|
|
—
|
|
8,054
|
|
||||||||||||||||
|
Grantor stock ownership trust
|
—
|
|
199
|
|
—
|
|
—
|
|
(587
|
)
|
—
|
|
—
|
|
2,383
|
|
—
|
|
1,796
|
|
||||||||||||||||
|
Balance at November 30, 2011
|
115,171
|
|
(10,884
|
)
|
(27,214
|
)
|
115,171
|
|
884,190
|
|
519,844
|
|
(26,152
|
)
|
(118,059
|
)
|
(932,337
|
)
|
442,657
|
|
||||||||||||||||
|
Net loss
|
—
|
|
—
|
|
—
|
|
—
|
|
—
|
|
(58,953
|
)
|
—
|
|
—
|
|
—
|
|
(58,953
|
)
|
||||||||||||||||
|
Other comprehensive loss
|
—
|
|
—
|
|
—
|
|
—
|
|
—
|
|
—
|
|
(1,806
|
)
|
—
|
|
—
|
|
(1,806
|
)
|
||||||||||||||||
|
Dividends on common stock
|
—
|
|
—
|
|
—
|
|
—
|
|
—
|
|
(10,599
|
)
|
—
|
|
—
|
|
—
|
|
(10,599
|
)
|
||||||||||||||||
|
Employee stock options and other
|
7
|
|
—
|
|
—
|
|
7
|
|
97
|
|
—
|
|
—
|
|
—
|
|
—
|
|
104
|
|
||||||||||||||||
|
Restricted stock awards
|
—
|
|
208
|
|
—
|
|
—
|
|
(2,253
|
)
|
—
|
|
—
|
|
2,253
|
|
—
|
|
—
|
|
||||||||||||||||
|
Stock-based compensation
|
—
|
|
—
|
|
—
|
|
—
|
|
6,713
|
|
—
|
|
—
|
|
—
|
|
—
|
|
6,713
|
|
||||||||||||||||
|
Grantor stock ownership trust
|
—
|
|
60
|
|
—
|
|
—
|
|
(168
|
)
|
—
|
|
—
|
|
657
|
|
—
|
|
489
|
|
||||||||||||||||
|
Stock repurchases
|
—
|
|
—
|
|
(126
|
)
|
—
|
|
—
|
|
—
|
|
—
|
|
—
|
|
(1,799
|
)
|
(1,799
|
)
|
||||||||||||||||
|
Balance at November 30, 2012
|
115,178
|
|
(10,616
|
)
|
(27,340
|
)
|
115,178
|
|
888,579
|
|
450,292
|
|
(27,958
|
)
|
(115,149
|
)
|
(934,136
|
)
|
376,806
|
|
||||||||||||||||
|
Net income
|
—
|
|
—
|
|
—
|
|
—
|
|
—
|
|
39,963
|
|
—
|
|
—
|
|
—
|
|
39,963
|
|
||||||||||||||||
|
Other comprehensive income
|
—
|
|
—
|
|
—
|
|
—
|
|
—
|
|
—
|
|
10,442
|
|
—
|
|
—
|
|
10,442
|
|
||||||||||||||||
|
Dividends on common stock
|
—
|
|
—
|
|
—
|
|
—
|
|
—
|
|
(8,366
|
)
|
—
|
|
—
|
|
—
|
|
(8,366
|
)
|
||||||||||||||||
|
Employee stock options and other
|
118
|
|
—
|
|
—
|
|
118
|
|
1,474
|
|
—
|
|
—
|
|
—
|
|
—
|
|
1,592
|
|
||||||||||||||||
|
Issuance of stock under stock-based compensation plans
|
—
|
|
—
|
|
478
|
|
—
|
|
412
|
|
—
|
|
—
|
|
—
|
|
7,934
|
|
8,346
|
|
||||||||||||||||
|
Restricted stock awards
|
—
|
|
88
|
|
—
|
|
—
|
|
(954
|
)
|
—
|
|
—
|
|
954
|
|
—
|
|
—
|
|
||||||||||||||||
|
Stock-based compensation
|
—
|
|
—
|
|
—
|
|
—
|
|
5,699
|
|
—
|
|
—
|
|
—
|
|
—
|
|
5,699
|
|
||||||||||||||||
|
Issuance of common stock
|
—
|
|
—
|
|
6,325
|
|
—
|
|
(106,622
|
)
|
—
|
|
—
|
|
—
|
|
216,125
|
|
109,503
|
|
||||||||||||||||
|
Grantor stock ownership trust
|
—
|
|
26
|
|
—
|
|
—
|
|
305
|
|
—
|
|
—
|
|
284
|
|
—
|
|
589
|
|
||||||||||||||||
|
Stock repurchases
|
—
|
|
—
|
|
(513
|
)
|
—
|
|
—
|
|
—
|
|
—
|
|
—
|
|
(8,488
|
)
|
(8,488
|
)
|
||||||||||||||||
|
Balance at November 30, 2013
|
115,296
|
|
(10,502
|
)
|
(21,050
|
)
|
$
|
115,296
|
|
$
|
788,893
|
|
$
|
481,889
|
|
$
|
(17,516
|
)
|
$
|
(113,911
|
)
|
$
|
(718,565
|
)
|
$
|
536,086
|
|
|||||||||
See accompanying notes.
71
KB HOME
(In Thousands)
|
|
Years Ended November 30,
|
||||||||||
|
|
2013
|
2012
|
2011
|
||||||||
|
Cash flows from operating activities:
|
|||||||||||
|
Net income (loss)
|
$
|
39,963
|
|
$
|
(58,953
|
)
|
$
|
(178,768
|
)
|
||
|
Adjustments to reconcile net income (loss) to net cash provided by (used in) operating activities:
|
|||||||||||
|
Equity in (income) loss/(gain) on wind down of unconsolidated joint ventures
|
933
|
|
(1,797
|
)
|
36,553
|
|
|||||
|
Distributions of earnings from unconsolidated joint ventures
|
1,949
|
|
3,316
|
|
8,703
|
|
|||||
|
Loss on loan guaranty
|
—
|
|
—
|
|
30,765
|
|
|||||
|
Gain on sale of operating property
|
—
|
|
—
|
|
(8,825
|
)
|
|||||
|
Amortization of discounts and issuance costs
|
5,347
|
|
3,016
|
|
2,150
|
|
|||||
|
Depreciation and amortization
|
1,857
|
|
1,622
|
|
2,031
|
|
|||||
|
Provision for deferred income taxes
|
—
|
|
1,152
|
|
—
|
|
|||||
|
Loss (gain) on early extinguishment of debt
|
10,448
|
|
10,278
|
|
(3,612
|
)
|
|||||
|
Stock-based compensation
|
5,699
|
|
6,713
|
|
8,054
|
|
|||||
|
Inventory impairments and land option contract abandonments
|
3,581
|
|
28,533
|
|
25,791
|
|
|||||
|
Changes in assets and liabilities:
|
|||||||||||
|
Receivables
|
(11,153
|
)
|
24,994
|
|
(2,220
|
)
|
|||||
|
Inventories
|
(563,189
|
)
|
30,347
|
|
(12,345
|
)
|
|||||
|
Accounts payable, accrued expenses and other liabilities
|
59,763
|
|
(2,143
|
)
|
(253,547
|
)
|
|||||
|
Other, net
|
1,316
|
|
(12,461
|
)
|
(2,275
|
)
|
|||||
|
Net cash provided by (used in) operating activities
|
(443,486
|
)
|
34,617
|
|
(347,545
|
)
|
|||||
|
Cash flows from investing activities:
|
|||||||||||
|
Return of investments in (contributions to) unconsolidated joint ventures
|
(14,359
|
)
|
989
|
|
(67,260
|
)
|
|||||
|
Proceeds from sale of operating property
|
—
|
|
—
|
|
80,600
|
|
|||||
|
Purchases of property and equipment, net
|
(2,391
|
)
|
(1,749
|
)
|
(242
|
)
|
|||||
|
Net cash provided by (used in) investing activities
|
(16,750
|
)
|
(760
|
)
|
13,098
|
|
|||||
|
Cash flows from financing activities:
|
|||||||||||
|
Change in restricted cash
|
456
|
|
22,119
|
|
50,996
|
|
|||||
|
Proceeds from issuance of debt
|
680,000
|
|
694,831
|
|
—
|
|
|||||
|
Payment of debt issuance costs
|
(16,525
|
)
|
(12,445
|
)
|
—
|
|
|||||
|
Repayment of senior notes
|
(225,394
|
)
|
(592,645
|
)
|
(100,000
|
)
|
|||||
|
Payments on mortgages and land contracts due to land sellers and other loans
|
(66,296
|
)
|
(26,298
|
)
|
(89,461
|
)
|
|||||
|
Proceeds from issuance of common stock, net
|
109,503
|
|
—
|
|
—
|
|
|||||
|
Issuance of common stock under employee stock plans
|
2,181
|
|
593
|
|
1,796
|
|
|||||
|
Payments of cash dividends
|
(8,366
|
)
|
(10,599
|
)
|
(19,240
|
)
|
|||||
|
Stock repurchases
|
(8,488
|
)
|
(1,799
|
)
|
—
|
|
|||||
|
Net cash provided by (used in) financing activities
|
467,071
|
|
73,757
|
|
(155,909
|
)
|
|||||
|
Net increase (decrease) in cash and cash equivalents
|
6,835
|
|
107,614
|
|
(490,356
|
)
|
|||||
|
Cash and cash equivalents at beginning of year
|
525,688
|
|
418,074
|
|
908,430
|
|
|||||
|
Cash and cash equivalents at end of year
|
$
|
532,523
|
|
$
|
525,688
|
|
$
|
418,074
|
|
||
See accompanying notes.
72
KB HOME
NOTES TO CONSOLIDATED FINANCIAL STATEMENTS
|
Note 1.
|
Summary of Significant Accounting Policies
|
Operations.
KB Home is a builder of attached and detached single-family residential homes, townhomes and condominiums. As of November 30, 2013, we conducted ongoing operations in Arizona, California, Colorado, Florida, Maryland, Nevada, New Mexico, North Carolina, Texas and Virginia. Through our financial services subsidiary, KB Home Mortgage Company (“KBHMC”), we offer insurance services to our homebuyers in the same markets where we build homes and we provide title services in the majority of our markets located within our Central and Southeast homebuilding reporting segments. From 2005 until June 30, 2011, we also offered mortgage banking services to our homebuyers indirectly through KBA Mortgage, an unconsolidated joint venture of a subsidiary of ours and a subsidiary of Bank of America, N.A., with each partner having a
50%
interest in the venture. KBA Mortgage ceased offering mortgage banking services after June 30, 2011. KBA Mortgage is accounted for as an unconsolidated joint venture within our financial services reporting segment.
Basis of Presentation.
The consolidated financial statements have been prepared in accordance with GAAP and include our accounts and those of the consolidated subsidiaries in which we have a controlling financial interest. All intercompany balances and transactions have been eliminated in consolidation. Investments in unconsolidated joint ventures in which we have less than a controlling interest are accounted for using the equity method.
Use of Estimates.
The preparation of financial statements in conformity with GAAP requires management to make informed estimates and assumptions that affect the amounts reported in the consolidated financial statements and accompanying notes. Actual results could differ from those estimates.
Cash and Cash Equivalents and Restricted Cash.
We consider all highly liquid short-term investments purchased with an original maturity of three months or less to be cash equivalents. Our cash equivalents totaled
$436.2 million
at
November 30, 2013
and
$396.3 million
at
November 30, 2012
. The majority of our cash and cash equivalents were invested in money market funds and interest-bearing bank deposit accounts.
Restricted cash of
$41.9 million
at
November 30, 2013
and
$42.4 million
at
November 30, 2012
consisted of cash deposited with various financial institutions that was required as collateral for the LOC Facilities.
Property and Equipment and Depreciation.
Property and equipment are recorded at cost and are depreciated over their estimated useful lives, which generally range from
two
to
10
years, using the straight-line method. Repair and maintenance costs are charged to earnings as incurred. Property and equipment are included in other assets on the consolidated balance sheets. Property and equipment totaled
$8.5 million
, net of accumulated depreciation of
$14.4 million
, at November 30, 2013, and
$7.9 million
, net of accumulated depreciation of
$18.5 million
, at
November 30, 2012
. Depreciation expense totaled
$1.9 million
in
2013
,
$1.6 million
in
2012
and
$2.0 million
in
2011
.
Homebuilding Operations.
Revenues from housing and other real estate sales are recognized in accordance with ASC 360
when sales are closed and title passes to the buyer. Sales are closed when all of the following conditions are met: a sale is consummated, a sufficient down payment is received, the earnings process is complete and the collection of any remaining receivables is reasonably assured.
Concurrent with the recognition of revenues in our consolidated statements of operations, sales incentives in the form of price concessions on the selling price of a home are recorded as a reduction of revenues, while the cost of incentives in the form of a free product or service to homebuyers, including option upgrades and closing cost allowances used to cover a portion of the fees and costs charged to a homebuyer, are reflected as construction and land costs.
Construction and land costs are comprised of direct and allocated costs, including estimated future costs for the limited warranty on our homes and amenities within a community. Land acquisition, land development and other common costs are generally allocated on a relative fair value basis to the homes or lots within a community or land parcel. Land acquisition and land development costs include related interest and real estate taxes.
H
ousing and land inventories are stated at cost, unless the carrying value is determined not to be recoverable, in which case the affected inventories are written down to fair value in accordance with ASC 360.
ASC 360 requires that real estate assets, such as our housing and land inventories, be tested for recoverability whenever events or changes in circumstances indicate that their carrying value may not be recoverable. Recoverability is measured by comparing the carrying value of an asset to the undiscounted future net cash flows expected to be generated by the asset. These impairment evaluations are significantly impacted by estimates for the amounts and timing of future revenues, costs and expenses, and other factors. If the carrying value of real estate assets is not recoverable, the impairment to be recognized is measured by the amount by which the carrying value of the affected asset exceeds its estimated fair value.
73
Capitalized Interest.
Interest is capitalized to inventories while the related communities are being actively developed and until homes are completed. Capitalized interest is amortized to construction and land costs as the related inventories are delivered to homebuyers. For those communities where development activity has been suspended, applicable interest is expensed as incurred.
Fair Value Measurements.
ASC 820 provides a framework for measuring the fair value of assets and liabilities under GAAP and establishes a fair value hierarchy that requires an entity to maximize the use of observable inputs and minimize the use of unobservable inputs when measuring fair value.
Fair value measurements are used for inventories on a nonrecurring basis when events and circumstances indicate the carrying value is not recoverable. Fair value is determined based on estimated future net cash flows discounted for inherent risks associated with the real estate assets, or other valuation techniques.
Our financial instruments consist of cash and cash equivalents, restricted cash, senior notes, the 1.375% Convertible Senior Notes due 2019, and mortgages and land contracts due to land sellers and other loans. Fair value measurements of financial instruments are determined by various market data and other valuation techniques as appropriate. When available, we use quoted market prices in active markets to determine fair value.
Financial Services Operations.
Our financial services reporting segment generates revenues primarily from insurance commissions, title services, marketing services fees and interest income.
Insurance commissions are recognized when policies are issued. Title services revenues are recorded when closing services are rendered and title insurance policies are issued, both of which generally occur at the time each applicable home is closed. Marketing services fees are recognized when earned, and interest income is accrued as earned.
Warranty Costs.
We
provide a limited warranty on all of our homes.
We estimate the costs that may be incurred under each limited warranty and record a liability in the amount of such costs at the time the revenue associated with the sale of each home is recognized.
Our primary assumption in estimating the amounts we accrue for warranty costs is that historical claims experience is a strong indicator of future claims experience. Factors that affect our warranty liability include the number of homes delivered, historical and anticipated rates of warranty claims, and cost per claim. We periodically assess the adequacy of our accrued warranty liability
and adjust the amount as necessary based on our assessment.
Self-Insurance.
We self-insure a portion of our overall risk through the use of a captive insurance subsidiary. We also maintain certain other insurance policies.
We record expenses and liabilities based on the estimated costs required to cover our self-insured retention and deductible amounts under our insurance policies, and the estimated costs of potential claims and claim adjustment expenses that are above our coverage limits or that are not covered by our insurance policies. These estimated costs are based on an analysis of our historical claims and industry data, and include an estimate of construction defect claims incurred but not yet reported.
We engage a third-party actuary that uses our historical claim and expense data, as well as industry data, to estimate our liabilities related to unpaid claims, claim adjustment expenses, third-party recoveries and incurred but not yet reported claims for the risks that we are assuming under our self-insurance.
The projection of losses related to these liabilities requires actuarial assumptions that are subject to variability due to uncertainties regarding construction defect claims relative to our markets and the types of product we build, insurance industry practices and legal or regulatory interpretations, among other factors. Key assumptions used in these estimates include claim frequencies, severities and settlement patterns, which can occur over an extended period of time.
Due to the degree of judgment required and the potential for variability in these underlying assumptions, our actual future costs could differ from those estimated
.
Advertising Costs.
We expense advertising costs as incurred. We incurred advertising costs of
$25.3 million
in 2013,
$24.6 million
in 2012 and
$32.4 million
in 2011.
Legal Fees.
Legal fees associated with litigation and similar proceedings that are not expected to provide a benefit in future periods are generally expensed as incurred. Legal fees associated with land acquisition and development and other activities that are expected to provide a benefit in future periods are capitalized as incurred in our consolidated balance sheets. We expensed legal fees of
$10.1 million
in
2013
,
$12.6 million
in
2012
and
$16.9 million
in
2011
.
Stock-Based Compensation.
With the approval of the management development and compensation committee, consisting entirely of independent members of our board of directors, we have provided compensation benefits to certain of our employees in the form of stock options, restricted stock, PSUs, phantom shares and SARs.
W
e measure and recognize compensation expense associated with our grant of equity-based awards in accordance with
ASC 718,
which requires that companies measure and recognize compensation expense at an amount equal to the fair value of share-based payments granted under compensation arrangements over the vesting period.
We estimate the fair value of stock options
74
and SARs granted using the Black-Scholes option-pricing model with assumptions based primarily on historical data.
ASC 718 also requires the tax benefit resulting from tax deductions in excess of the compensation expense recognized for those options to be reported in the statement of cash flows as an operating cash outflow and a financing cash inflow.
Income Taxes.
Income taxes are accounted for in accordance with ASC 740.
The provision for, or benefit from, income taxes is calculated using the asset and liability method, under which deferred tax assets and liabilities are recorded based on the difference between the financial statement and tax basis of assets and liabilities using enacted tax rates in effect for the year in which the differences are expected to reverse. Deferred tax assets are evaluated on a quarterly basis to determine if adjustments to the valuation allowance are required. In accordance with ASC 740, we assess whether a valuation allowance should be established based on the consideration of all available evidence using a “more likely than not” standard with respect to whether deferred tax assets will be realized. The ultimate realization of deferred tax assets depends primarily on the generation of future taxable income. The value of our deferred tax assets will depend on applicable income tax rates.
Judgment is required in determining the future tax consequences of events that have been recognized in our consolidated financial statements and/or tax returns. Differences between anticipated and actual outcomes of these future tax consequences could have a material impact on our consolidated financial statements.
Accumulated Other Comprehensive Loss.
The accumulated balances of other comprehensive loss in the consolidated balance sheets as of
November 30, 2013
and
2012
were comprised solely of adjustments recorded directly to accumulated other comprehensive loss in accordance with Accounting Standards Codification Topic No. 715, “Compensation — Retirement Benefits” (“ASC 715”). Such adjustments are made annually as of November 30, when our benefit plan obligations are remeasured. ASC 715 requires an employer to recognize the funded status of defined postretirement benefit plans as an asset or liability on the balance sheet and requires any unrecognized prior service costs and actuarial gains/losses to be recognized in accumulated other comprehensive income (loss).
Earnings (Loss) Per Share.
We compute earnings (loss) per share using the two-class method in accordance with Accounting Standards Codification Topic No. 260, “Earnings Per Share.” The two-class method is an allocation of earnings between the holders of common stock and a company’s participating security holders. Our outstanding non-vested shares of restricted stock contain non-forfeitable rights to dividends and, therefore, are considered participating securities for purposes of computing earnings per share pursuant to the two-class method. We had no other participating securities at November 30, 2013, 2012 or 2011.
Recent Accounting Pronouncements.
In June 2011, the FASB issued ASU 2011-05, which allows
an entity the option to present the total of comprehensive income, the components of net income, and the components of other comprehensive income either in a single continuous statement of comprehensive income or in two separate but consecutive statements. In both instances, an entity is required to present each component of net income along with total net income, each component of other comprehensive income along with a total for other comprehensive income, and a total amount for comprehensive income. ASU 2011-05 eliminates the option to present the components of other comprehensive income as part of the statement of changes in stockholders’ equity. The amendments in ASU 2011-05 do not change the items that must be reported in other comprehensive income or when an item of other comprehensive income must be reclassified to net income. However, in December 2011, the FASB issued
ASU 2011-12,
which deferred the guidance on whether to require entities to present reclassification adjustments out of accumulated other comprehensive income by component in both the statement where net income is presented and the statement where other comprehensive income is presented for both interim and annual financial statements. ASU 2011-12 reinstated the requirements for the presentation of reclassifications that were in place prior to the issuance of ASU 2011-05 and did not change the effective date for ASU 2011-05. For public entities, the amendments in ASU 2011-05 and ASU 2011-12 are effective for fiscal years, and interim periods within those years, beginning after December 15, 2011, and should be applied retrospectively. Our adoption of this guidance, which is related to disclosure only, as of February 28, 2013 did not have a material impact on our consolidated financial statements.
In February 2013, the FASB issued ASU 2013-02,
which requires an entity to provide information about the amounts reclassified out of accumulated other comprehensive income by component. In addition, ASU 2013-02 requires an entity to present, either on the face of the income statement or in the notes to financial statements, significant amounts reclassified out of accumulated other comprehensive income by the respective line items of net income but only if the amount reclassified is required under GAAP to be reclassified to net income in its entirety in the same reporting period. For other amounts, an entity is required to cross-reference to other disclosures required under GAAP that provide additional detail about those amounts. The amendments in ASU 2013-02 do not change the current requirements for reporting net income or other comprehensive income in the financial statements. For public entities, the amendments in ASU 2013-02 are effective prospectively for reporting periods beginning after December 15, 2012. Our adoption of this guidance, which is related to disclosure only, as of May 31, 2013 did not have a material impact on our consolidated financial statements.
In July 2013, the FASB issued ASU 2013-11,
which states that an unrecognized tax benefit, or a portion of an unrecognized tax benefit, should be presented in the financial statements as a reduction to a deferred tax asset for a net operating loss carryforward,
75
a similar tax loss, or a tax credit carryforward, except as follows. To the extent a net operating loss carryforward, a similar tax loss, or a tax credit carryforward is not available at the reporting date under the tax law of the applicable jurisdiction to settle any additional income taxes that would result from the disallowance of a tax position or that the tax law of the applicable jurisdiction does not require the entity to use, and the entity does not intend to use, the deferred tax asset for such purpose, the unrecognized tax benefit should be presented in the financial statements as a liability and should not be combined with deferred tax assets. ASU 2013-11 applies to all entities that have unrecognized tax benefits when a net operating loss carryforward, a similar tax loss, or a tax credit carryforward exists at the reporting date. The amendments in ASU 2013-11 are effective for fiscal years, and interim periods within those years, beginning after December 15, 2013. Early adoption is permitted. The amendments should be applied prospectively to all unrecognized tax benefits that exist at the effective date. Retrospective application is permitted. We believe the adoption of this guidance will not have a material impact on our consolidated financial statements.
Homebuyer Closing Cost Allowances Reclassification.
Effective December 1, 2012, we elected to reclassify closing cost allowances given to certain homebuyers from selling, general and administrative expenses to construction and land costs in our consolidated statements of operations. These allowances, which totaled
$10.6 million
and represented
.5%
of housing revenues in 2013, are used to cover a portion of non-recurring third-party fees, such as escrow fees, title costs, recording fees, finance processing fees, and prepaid real estate taxes and insurance costs that are charged to a homebuyer in connection with the closing of the sale of a home. The amounts in the consolidated statements of operations of prior years have been reclassified to conform to the 2013 presentation. The reclassifications reduced both our housing gross profits and selling, general and administrative expenses for 2012 and 2011 by
$14.5 million
and
$27.1 million
, respectively, which represented
.9%
and
2.1%
of housing revenues, respectively. The reclassification had no impact on the homebuilding operating income (loss) or consolidated net income (loss) amounts previously reported.
Other Reclassifications.
Certain amounts in the consolidated financial statements of prior years have been reclassified to conform to the 2013 presentation.
|
Note 2.
|
Segment Information
|
As of
November 30, 2013
, we had identified
five
reporting segments, comprised of
four
homebuilding reporting segments and
one
financial services reporting segment, within our consolidated operations in accordance with Accounting Standards Codification Topic No. 280, “Segment Reporting.” As of
November 30, 2013
, our homebuilding reporting segments conducted ongoing operations in the following states:
West Coast: California
Southwest: Arizona, Nevada and New Mexico
Central: Colorado and Texas
Southeast: Florida, Maryland, North Carolina and Virginia
Our homebuilding operations represented most of our business for the years ended
November 30, 2013
, 2012 and 2011. Our homebuilding reporting segments are engaged in the acquisition and development of land primarily for residential purposes and offer a wide variety of homes that are designed to appeal to first-time, move-up and active adult homebuyers. Our homebuilding operations generate the majority of their revenues from the delivery of completed homes to homebuyers, and to a lesser extent from the sale of land.
Our homebuilding reporting segments were identified based primarily on similarities in economic and geographic characteristics, product types, regulatory environments, methods used to sell and construct homes and land acquisition characteristics. We evaluate segment performance primarily based on segment pretax results.
Our financial services reporting segment offers property and casualty insurance and, in certain instances, earthquake, flood and personal property insurance to our homebuyers
in the same markets as our homebuilding reporting segments
and provides title services in the majority of our markets located
within our Central and Southeast homebuilding reporting segments.
In addition, since the third quarter of 2011, this segment has earned revenues pursuant to the terms of a marketing services agreement with a preferred mortgage lender that offers mortgage banking services, including mortgage loan originations, to our homebuyers
who elect to use the lender. Our homebuyers are under no obligation to use our preferred mortgage lender and may select any lender of their choice to obtain mortgage financing for the purchase of a home.
Except as discussed below, we have had no affiliation, ownership, joint venture or other interests in or with our preferred mortgage lender or its affiliates, or with respect to the revenues or income that may have been generated from their provision of mortgage banking services to, or origination of mortgage loans for, our homebuyers.
Prior to late June 2011, this reporting segment provided mortgage banking services to our homebuyers indirectly through
KBA Mortgage.
76
On January 21, 2013, we entered into an agreement with Nationstar to form Home Community Mortgage, a mortgage banking company that will offer an array of mortgage banking services to our homebuyers. We have a
49.9%
ownership interest and Nationstar has a
50.1%
ownership interest in Home Community Mortgage, with Nationstar providing management oversight of Home Community Mortgage’s operations. Nationstar will continue as our preferred mortgage lender until Home Community Mortgage begins offering mortgage banking services, which is expected to occur in the first quarter of 2014. We made capital contributions of
$5.0 million
to Home Community Mortgage during the year ended November 30, 2013. Home Community Mortgage is accounted for as an unconsolidated joint venture within our financial services reporting segment of our consolidated financial statements.
Our reporting segments follow the same accounting policies used for our consolidated financial statements as described in Note 1. Summary of Significant Accounting Policies. Operational results of each segment are not necessarily indicative of the results that would have occurred had the segment been an independent, stand-alone entity during the periods presented, nor are they indicative of the results to be expected in future periods.
The following tables present financial information relating to our reporting segments (in thousands):
|
|
Years Ended November 30,
|
||||||||||
|
|
2013
|
2012
|
2011
|
||||||||
|
Revenues:
|
|||||||||||
|
West Coast
|
$
|
1,020,218
|
|
$
|
755,259
|
|
$
|
589,387
|
|
||
|
Southwest
|
175,252
|
|
132,438
|
|
139,872
|
|
|||||
|
Central
|
565,120
|
|
436,407
|
|
369,705
|
|
|||||
|
Southeast
|
324,388
|
|
224,328
|
|
206,598
|
|
|||||
|
Total homebuilding revenues
|
2,084,978
|
|
1,548,432
|
|
1,305,562
|
|
|||||
|
Financial services
|
12,152
|
|
11,683
|
|
10,304
|
|
|||||
|
Total
|
$
|
2,097,130
|
|
$
|
1,560,115
|
|
$
|
1,315,866
|
|
||
|
Pretax income (loss):
|
|||||||||||
|
West Coast
|
$
|
118,264
|
|
$
|
(10,467
|
)
|
$
|
19,639
|
|
||
|
Southwest
|
2,903
|
|
(10,194
|
)
|
(108,265
|
)
|
|||||
|
Central
|
22,275
|
|
1,449
|
|
(12,924
|
)
|
|||||
|
Southeast
|
(45,992
|
)
|
(1,183
|
)
|
(37,983
|
)
|
|||||
|
Corporate and other (a)
|
(69,271
|
)
|
(69,541
|
)
|
(67,713
|
)
|
|||||
|
Total homebuilding pretax income (loss)
|
28,179
|
|
(89,936
|
)
|
(207,246
|
)
|
|||||
|
Financial services
|
10,184
|
|
10,883
|
|
26,078
|
|
|||||
|
Total
|
$
|
38,363
|
|
$
|
(79,053
|
)
|
$
|
(181,168
|
)
|
||
|
Equity in income (loss) of unconsolidated joint ventures:
|
|||||||||||
|
West Coast
|
$
|
(148
|
)
|
$
|
(174
|
)
|
$
|
68
|
|
||
|
Southwest
|
(2,355
|
)
|
(811
|
)
|
(55,902
|
)
|
|||||
|
Central
|
—
|
|
—
|
|
—
|
|
|||||
|
Southeast
|
496
|
|
591
|
|
(5
|
)
|
|||||
|
Total
|
$
|
(2,007
|
)
|
$
|
(394
|
)
|
$
|
(55,839
|
)
|
||
|
(a) Corporate and other includes corporate general and administrative expenses.
|
|||||||||||
77
|
|
Years Ended November 30,
|
||||||||||
|
|
2013
|
2012
|
2011
|
||||||||
|
Inventory impairment charges:
|
|||||||||||
|
West Coast
|
$
|
—
|
|
$
|
19,235
|
|
$
|
2,598
|
|
||
|
Southwest
|
—
|
|
2,135
|
|
18,715
|
|
|||||
|
Central
|
—
|
|
1,267
|
|
51
|
|
|||||
|
Southeast
|
391
|
|
5,470
|
|
1,366
|
|
|||||
|
Total
|
$
|
391
|
|
$
|
28,107
|
|
$
|
22,730
|
|
||
|
Land option contract abandonment charges:
|
|||||||||||
|
West Coast
|
$
|
3,190
|
|
$
|
—
|
|
$
|
704
|
|
||
|
Southwest
|
—
|
|
—
|
|
296
|
|
|||||
|
Central
|
—
|
|
133
|
|
1,310
|
|
|||||
|
Southeast
|
—
|
|
293
|
|
751
|
|
|||||
|
Total
|
$
|
3,190
|
|
$
|
426
|
|
$
|
3,061
|
|
||
|
Joint venture impairment charges:
|
|||||||||||
|
West Coast
|
$
|
—
|
|
$
|
—
|
|
$
|
—
|
|
||
|
Southwest
|
—
|
|
—
|
|
53,727
|
|
|||||
|
Central
|
—
|
|
—
|
|
—
|
|
|||||
|
Southeast
|
—
|
|
—
|
|
—
|
|
|||||
|
Total
|
$
|
—
|
|
$
|
—
|
|
$
|
53,727
|
|
||
|
|
November 30,
|
||||||
|
|
2013
|
2012
|
|||||
|
Assets:
|
|||||||
|
West Coast
|
$
|
1,230,761
|
|
$
|
930,450
|
|
|
|
Southwest
|
402,443
|
|
319,863
|
|
|||
|
Central
|
465,547
|
|
369,294
|
|
|||
|
Southeast
|
456,965
|
|
341,460
|
|
|||
|
Corporate and other
|
627,879
|
|
596,176
|
|
|||
|
Total homebuilding assets
|
3,183,595
|
|
2,557,243
|
|
|||
|
Financial services
|
10,040
|
|
4,455
|
|
|||
|
Total
|
$
|
3,193,635
|
|
$
|
2,561,698
|
|
|
|
Investments in unconsolidated joint ventures:
|
|||||||
|
West Coast
|
$
|
40,246
|
|
$
|
38,372
|
|
|
|
Southwest
|
80,877
|
|
75,920
|
|
|||
|
Central
|
—
|
|
—
|
|
|||
|
Southeast
|
9,069
|
|
9,382
|
|
|||
|
Total
|
$
|
130,192
|
|
$
|
123,674
|
|
|
78
|
Note 3.
|
Financial Services
|
The following tables present financial information relating to our financial services reporting segment (in thousands):
|
|
Years Ended November 30,
|
||||||||||
|
|
2013
|
2012
|
2011
|
||||||||
|
Revenues
|
|||||||||||
|
Insurance commissions
|
$
|
7,177
|
|
$
|
7,140
|
|
$
|
7,188
|
|
||
|
Title services
|
3,172
|
|
2,362
|
|
1,983
|
|
|||||
|
Marketing services fees
|
1,800
|
|
2,175
|
|
1,125
|
|
|||||
|
Interest income
|
3
|
|
6
|
|
8
|
|
|||||
|
Total
|
12,152
|
|
11,683
|
|
10,304
|
|
|||||
|
Expenses
|
|||||||||||
|
General and administrative
|
(3,042
|
)
|
(2,991
|
)
|
(3,512
|
)
|
|||||
|
Operating income
|
9,110
|
|
8,692
|
|
6,792
|
|
|||||
|
Equity in income/gain on wind down of unconsolidated joint ventures
|
1,074
|
|
2,191
|
|
19,286
|
|
|||||
|
Pretax income
|
$
|
10,184
|
|
$
|
10,883
|
|
$
|
26,078
|
|
||
|
|
November 30,
|
||||||
|
|
2013
|
2012
|
|||||
|
Assets
|
|||||||
|
Cash and cash equivalents
|
$
|
2,428
|
|
$
|
923
|
|
|
|
Receivables
|
2,084
|
|
1,859
|
|
|||
|
Investments in unconsolidated joint ventures
|
5,490
|
|
1,630
|
|
|||
|
Other assets
|
38
|
|
43
|
|
|||
|
Total assets
|
$
|
10,040
|
|
$
|
4,455
|
|
|
|
Liabilities
|
|||||||
|
Accounts payable and accrued expenses
|
$
|
2,593
|
|
$
|
3,188
|
|
|
|
Total liabilities
|
$
|
2,593
|
|
$
|
3,188
|
|
|
The equity in income/gain on wind down of unconsolidated joint ventures amounts for 2013, 2012 and 2011 included gains of
$1.1 million
,
$2.1 million
and
$19.8 million
, respectively, recognized in connection with the wind down of KBA Mortgage’s business operations. In addition, our investments in unconsolidated joint ventures at November 30, 2013 included a
$5.0 million
capital contribution we made to Home Community Mortgage during the year.
Although KBHMC ceased originating and selling mortgage loans on September 1, 2005, it may be required to repurchase, or provide indemnification with respect to, an individual loan that it funded on or before August 31, 2005 and sold to an investor if the representations or warranties that it made in connection with the sale of the loan are breached, in the event of an early payment default, if the loan does not comply with the underwriting standards or other requirements of the ultimate investor or an applicable insurer, or due to a delinquency or other matters arising in connection with the loan.
79
|
Note 4.
|
Earnings (Loss) Per Share
|
Basic and diluted earnings (loss) per share were calculated as follows (in thousands, except per share amounts):
|
|
Years Ended November 30,
|
||||||||||
|
|
2013
|
2012
|
2011
|
||||||||
|
Numerator:
|
|||||||||||
|
Net income (loss)
|
$
|
39,963
|
|
$
|
(58,953
|
)
|
$
|
(178,768
|
)
|
||
|
Less: Distributed earnings allocated to nonvested restricted stock
|
(24
|
)
|
—
|
|
—
|
|
|||||
|
Less: Undistributed earnings allocated to nonvested restricted stock
|
(90
|
)
|
—
|
|
—
|
|
|||||
|
Numerator for basic earnings (loss) per share
|
39,849
|
|
(58,953
|
)
|
(178,768
|
)
|
|||||
|
Effect of dilutive securities:
|
|||||||||||
|
Interest expense and amortization of debt issuance costs associated with convertible senior notes, net of taxes
|
2,230
|
|
—
|
|
—
|
|
|||||
|
Add: Undistributed earnings allocated to nonvested restricted stock
|
90
|
|
—
|
|
—
|
|
|||||
|
Less: Undistributed earnings reallocated to nonvested restricted stock
|
(81
|
)
|
—
|
|
—
|
|
|||||
|
Numerator for diluted earnings (loss) per share
|
$
|
42,088
|
|
$
|
(58,953
|
)
|
$
|
(178,768
|
)
|
||
|
Denominator:
|
|||||||||||
|
Weighted average shares outstanding — basic
|
82,630
|
|
77,106
|
|
77,043
|
|
|||||
|
Effect of dilutive securities:
|
|||||||||||
|
Share-based payments
|
1,885
|
|
—
|
|
—
|
|
|||||
|
Convertible senior notes
|
7,044
|
|
—
|
|
—
|
|
|||||
|
Weighted average shares outstanding — diluted
|
91,559
|
|
77,106
|
|
77,043
|
|
|||||
|
Basic earnings (loss) per share
|
$
|
.48
|
|
$
|
(.76
|
)
|
$
|
(2.32
|
)
|
||
|
Diluted earnings (loss) per share
|
$
|
.46
|
|
$
|
(.76
|
)
|
$
|
(2.32
|
)
|
||
As discussed in Note 13. Mortgages and Notes Payable, in 2013, we issued the
1.375%
Convertible Senior Notes due 2019 which are initially convertible into shares of our common stock at a conversion rate of
36.5297
shares for each $1,000 principal amount of the notes. Outstanding stock options to purchase
5.2 million
shares of common stock were excluded from the diluted earnings per share calculation for 2013 and all outstanding stock options were excluded from the diluted loss per share calculations for the years ended November 30,
2012
and
2011
because the effect of their inclusion would be antidilutive. Contingently issuable shares associated with outstanding PSUs were not included in the earnings (loss) per share calculations for the periods presented as the vesting conditions have not been satisfied.
|
Note 5.
|
Receivables
|
Receivables of
$75.7 million
at
November 30, 2013
and
$64.8 million
at
November 30, 2012
included amounts due from utility companies and municipalities, state income taxes receivable and escrow deposits. Receivables from utility companies and municipalities generally relate to infrastructure improvements we make with respect to our communities. We are generally reimbursed for these receivables when the improvements are accepted by the utility company or municipality, or after certain events occur, depending on the terms of the applicable agreements. These events may include, but are not limited to, the connection of utilities or the issuance of bonds by the respective municipalities.
Each receivable is evaluated for collectibility at least quarterly and allowances for potential losses are established or maintained on applicable receivables when collection becomes doubtful, taking into account historical experience, present economic conditions and other relevant factors. Receivables were net of allowances for doubtful accounts of
$20.3 million
in
2013
and
$21.3 million
in
2012
.
80
|
Note 6.
|
Inventories
|
Inventories consisted of the following (in thousands):
|
|
November 30,
|
||||||
|
|
2013
|
2012
|
|||||
|
Homes under construction
|
$
|
586,439
|
|
$
|
454,108
|
|
|
|
Land under development
|
1,066,916
|
|
567,470
|
|
|||
|
Land held for future development
|
645,222
|
|
684,993
|
|
|||
|
Total
|
$
|
2,298,577
|
|
$
|
1,706,571
|
|
|
Homes under construction is comprised of costs associated with homes in various stages of construction and includes direct construction and related land acquisition and land development costs. Land under development primarily consists of land acquisition and land development costs, which include capitalized interest and real estate taxes associated with land undergoing improvement activity. When home construction begins, the associated land acquisition and land development costs are included in homes under construction. Land held for future development principally reflects land acquisition and land development costs related to land
where development activity has been suspended or has not yet begun, but is expected to occur in the future. These assets held for future development are located in various submarkets where conditions do not presently support further investment or development, or are subject to a building permit moratorium or regulatory restrictions, or are portions of larger land parcels that we plan to build out over several years and/or that have not yet been entitled. We may also suspend development activity if we believe it will result in greater returns and/or maximize the economic performance of a community by delaying improvements for a period of time to allow earlier phases of a long-term, multi-phase community or a neighboring community to generate sales momentum or for market conditions to improve.
We resume development activity when we believe our investment in this inventory will be optimized or, in some instances, to accelerate sales pace and/or our return on investment, and we have activated assets previously held for future development in certain markets as part of our strategic growth initiatives. Interest and real estate taxes are not capitalized on land held for future development.
Our interest costs are as follows (in thousands):
|
|
Years Ended November 30,
|
||||||||||
|
|
2013
|
2012
|
2011
|
||||||||
|
Capitalized interest at beginning of year
|
$
|
217,684
|
|
$
|
233,461
|
|
$
|
249,966
|
|
||
|
Interest incurred (a)
|
149,101
|
|
132,657
|
|
112,037
|
|
|||||
|
Interest expensed (a)
|
(62,690
|
)
|
(69,804
|
)
|
(49,204
|
)
|
|||||
|
Interest amortized to construction and land costs
|
(87,414
|
)
|
(78,630
|
)
|
(79,338
|
)
|
|||||
|
Capitalized interest at end of year (b)
|
$
|
216,681
|
|
$
|
217,684
|
|
$
|
233,461
|
|
||
|
(a)
|
Amounts for the years ended
November 30, 2013
and 2012 included losses on the early extinguishment of debt of
$10.4 million
and
$10.3 million
, respectively. Amounts for the year ended
November 30, 2011
included a gain on the early extinguishment of secured debt of
$3.6 million
.
|
|
(b)
|
Inventory impairment charges are recognized against all inventory costs of a community, such as land acquisition, land development, cost of home construction and capitalized interest. Capitalized interest amounts presented in the table reflect the gross amount of capitalized interest as impairment charges recognized are not generally allocated to specific components of inventory.
|
|
Note 7.
|
Inventory Impairments and Land Option Contract Abandonments
|
E
ach community or land parcel in our owned inventory is assessed to determine if indicators of potential impairment exist. Impairment indicators are assessed separately for each community or land parcel on a quarterly basis and include, but are not limited to the following: significant decreases in net orders, average selling prices, volume of homes delivered, gross profit margins on homes delivered or projected gross profit margins on homes in backlog or future deliveries; significant increases in budgeted land development and home construction costs or cancellation rates; or projected losses on expected future land sales. If indicators of potential impairment exist for a community or land parcel, the identified asset is evaluated for recoverability in accordance with ASC 360.
We evaluated
67
,
135
and
138
communities or land parcels for recoverability during the years ended
November 30,
81
2013
,
2012
and
2011
, respectively. As impairment indicators are assessed on a quarterly basis, some of the communities or land parcels evaluated during these years were evaluated in more than one quarterly period.
When an indicator of potential impairment is identified for a community or land parcel, we test the asset for recoverability by comparing the carrying value of the asset to the undiscounted future net cash flows expected to be generated by the asset. The undiscounted future net cash flows are impacted by then-current conditions and trends in the market in which the asset is located as well as factors known to us at the time the cash flows are calculated. With the undiscounted future net cash flows, we also consider recent trends in our orders, backlog, cancellation rates and volume of homes delivered, as well as our expectations related to the following: product offerings; market supply and demand, including estimated average selling prices and related price appreciation; and land development, home construction and overhead costs to be incurred and related cost inflation.
With respect to the years ended
November 30, 2013
and 2012,
these expectations reflected our experience that, notwithstanding fluctuations in our company-wide net orders, backlog levels, homes delivered and housing gross profit margin, on a year-over-year basis, market conditions for each of our assets in inventory where impairment indicators were identified have been generally stable or improved, with no significant deterioration identified as to revenue and cost drivers that would prevent or otherwise impact recoverability. Based on this experience, and taking into account the signs of stability and improvement in many markets for new home sales, our inventory assessments as of November 30, 2013 considered an expected steady overall sales pace and average selling price performance for 2014 relative to the pace and performance in recent quarters.
While in the fourth quarter of 2013, our West Coast homebuilding reporting segment reported year-over-year decreases in homes delivered, net orders and ending backlog, these decreases were largely due to our selling through older communities and shifting our investment strategy to favor coastal California submarkets, and delays in opening new communities, and were not reflective of a decline in market conditions, particularly as the average selling price of homes delivered in the segment increased
in the 2013 fourth quarter and the housing gross profit margin improved
.
Given the inherent challenges and uncertainties in forecasting future results, our inventory assessments at the time they are made take into consideration whether a community or land parcel is active, meaning whether it is open for sales and/or undergoing development, or whether it is being held for future development. Due to the short-term nature of active communities and land parcels as compared to land held for future development, our inventory assessments generally assume the continuation of then-current market conditions, subject to identifying information suggesting significant sustained changes in such conditions. These assessments, at the time made, generally anticipate net orders, average selling prices, volume of homes delivered and costs for land development and home construction to continue at or near then-current levels through the particular asset’s estimated remaining life. Inventory assessments for our land held for future development consider then-current market conditions as well as subjective forecasts regarding the timing and costs of land development and home construction and related cost inflation; the product(s) to be offered; and the net orders, volume of homes delivered, and selling prices and related price appreciation of the offered product(s) when an associated community is anticipated to open for sales. We evaluate various factors to develop these forecasts, including the availability of and demand for homes and finished lots within the relevant marketplace; historical, current and expected future sales trends for the marketplace; and third-party data, if available. These various estimates, trends, expectations and assumptions used in each of our inventory assessments are specific to each community or land parcel based on what we believe are reasonable forecasts for performance and may vary among communities or land parcels and may vary over time.
We record an inventory impairment charge when the carrying value of a real estate asset is greater than the undiscounted future net cash flows the asset is expected to generate. These real estate assets are written down to fair value, which is primarily based on the estimated future net cash flows discounted for inherent risk associated with each such asset.
Inputs used in our calculation of estimated discounted future net cash flows are specific to each affected community or land parcel and are based on our expectations for each such asset as of the applicable measurement date, including, among others, expectations related to average selling prices and volume of homes delivered.
The discount rates we used were impacted by the following at the time the calculation was made: the risk-free rate of return; expected risk premium based on estimated land development, home construction and delivery timelines; market risk from potential future price erosion; cost uncertainty due to land development or home construction cost increases; and other risks specific to the asset or conditions in the market in which the asset is located.
The following table summarizes ranges for significant quantitative unobservable inputs we utilized in our fair value measurements with respect to the impaired communities or land parcels written down to fair value during the years presented:
|
Years Ended November 30,
|
||||||
|
Unobservable Input (a)
|
2013
|
2012
|
2011
|
|||
|
Average selling price
|
$339,700
|
$115,200 - $556,300
|
$142,900 - $391,900
|
|||
|
Deliveries per month
|
1
|
1 - 6
|
1 - 10
|
|||
|
Discount rate
|
17%
|
17% - 20%
|
17% - 20%
|
|||
82
|
(a)
|
The ranges of inputs used in each period primarily reflect the underlying variability among the housing markets where each of the impacted communities or land parcels are located, rather than fluctuations in prevailing market conditions.
|
Based on the results of our evaluations, we recognized inventory impairment charges of
$.4 million
in
2013
associated with
one
community, with a post-impairment fair value of
$1.1 million
. In
2012
, we recognized inventory impairment charges of
$28.1 million
associated with
14
communities, with a post-impairment fair value of
$39.9 million
. In
2011
, we recognized inventory impairment charges of
$22.7 million
associated with
12
communities or land parcels, with a post-impairment fair value of
$34.0 million
. The higher level of inventory impairment charges in
2012
and
2011
, compared to 2013, reflected challenging economic and housing market conditions in certain of our served markets in each of those years. In addition, the inventory impairment charges we recognized in 2012 were partly due to changes in our operational or selling strategy for certain communities in an effort to accelerate sales pace and/or our return on investment. In 2011, the inventory impairment charges included an
$18.1 million
adjustment to the fair value of real estate collateral in our Southwest homebuilding reporting segment that we took back on a note receivable. In some cases, we have recognized inventory impairment charges for particular communities or land parcels in multiple years. Inventory impairment charges are included in construction and land costs in our consolidated statements of operations.
As of
November 30, 2013
, the aggregate carrying value of our inventory that had been impacted by inventory impairment charges was
$293.1 million
, representing
42
communities and various other land parcels. As of
November 30, 2012
, the aggregate carrying value of our inventory that had been impacted by inventory impairment charges was
$307.2 million
, representing
46
communities and various other land parcels.
Our inventory controlled under land option contracts and other similar contracts is assessed to determine whether it continues to meet our internal investment and marketing standards. Assessments are made separately for each optioned land parcel on a quarterly basis and are affected by the following factors relative to the market in which the asset is located, among others: current and/or anticipated net orders, average selling prices and volume of homes delivered; estimated land development and home construction costs; and projected profitability on expected future housing or land sales. When a decision is made not to exercise certain land option contracts and other similar contracts due to market conditions and/or changes in our marketing strategy, we write off the related inventory costs, including non-refundable deposits and unrecoverable pre-acquisition costs.
Based on the results of our assessments, we recognized land option contract abandonment charges of
$3.2 million
corresponding to
295
lots in
2013
,
$.4 million
corresponding to
446
lots in
2012
, and
$3.1 million
corresponding to
830
lots in
2011
. We sometimes walk away from land option contracts or other similar contracts when we have incurred costs of less than $100,000; such costs are not included in the amounts above. Land option contract abandonment charges are included in construction and land costs in our consolidated statements of operations.
The estimated remaining life of each community or land parcel in our inventory depends on various factors, such as the total number of lots remaining; the expected timeline to acquire and entitle land and develop lots to build homes; the anticipated future net order and cancellation rates; and the expected timeline to build and deliver homes sold. While it is difficult to determine a precise timeframe for any particular inventory asset, we estimate our inventory assets’ remaining operating lives under current and expected future market conditions to range generally from
one
year to in excess of
10
years.
Based on current market conditions and expected delivery timelines, we expect to realize, on an overall basis, the majority of our current inventory balance within
five
years.
Due to the judgment and assumptions applied in the estimation process with respect to inventory impairments, land option contract abandonments, the remaining operating lives of our inventory assets and the realization of our inventory balances, particularly as to inventory held for future development, it is possible that actual results could differ substantially from those estimated.
|
Note 8.
|
Variable Interest Entities
|
We participate in joint ventures from time to time that conduct land acquisition, land development and/or other homebuilding activities in various markets where our homebuilding operations are located. Our investments in these
joint ventures may create a variable interest in a
VIE,
depending on the contractual terms of the arrangement. We analyze our joint ventures in accordance with
ASC 810
to determine whether they are VIEs and, if so, whether we are the primary beneficiary.
None of our joint ventures at
November 30, 2013
and
2012
were determined under the provisions of ASC 810 to be VIEs. All of our joint ventures were unconsolidated and accounted for under the equity method because we did not have a controlling financial interest.
In the ordinary course of our business, we enter into land option contracts and other similar contracts to acquire rights to land for the construction of homes. The use of such land option contracts and other similar contracts generally allows us to reduce the market risks associated with direct land ownership and development, and to reduce our capital and financial commitments, including
83
interest and other carrying costs. Under such contracts, we typically pay a specified option or earnest money deposit in consideration for the right to purchase land in the future, usually at a predetermined price.
We analyze each of our land option contracts and other similar contracts under the provisions of ASC 810 to determine whether the land seller is a VIE and, if so, whether we are the primary beneficiary. Although we do not have legal title to the underlying land, ASC 810 requires us to consolidate a VIE if we are determined to be the primary beneficiary. In determining whether we are the primary beneficiary, we consider, among other things, whether we have the power to direct the activities of the VIE that most significantly impact the VIE’s economic performance. Such activities would include, among other things, determining or limiting the scope or purpose of the VIE, selling or transferring property owned or controlled by the VIE, or arranging financing for the VIE. As a result of our analyses, we determined that as of November 30, 2013 and 2012 we were not the primary beneficiary of any VIEs from which we have acquired rights to land under land option contracts and other similar contracts.
The following table presents a summary of our interests in land option contracts and other similar contracts (in thousands):
|
November 30, 2013
|
November 30, 2012
|
||||||||||||||
|
Cash
Deposits
|
Aggregate
Purchase Price
|
Cash
Deposits
|
Aggregate
Purchase Price
|
||||||||||||
|
Unconsolidated VIEs
|
$
|
11,063
|
|
$
|
616,000
|
|
$
|
8,463
|
|
$
|
327,196
|
|
|||
|
Other land option contracts and other similar contracts
|
30,502
|
|
535,496
|
|
17,219
|
|
298,139
|
|
|||||||
|
$
|
41,565
|
|
$
|
1,151,496
|
|
$
|
25,682
|
|
$
|
625,335
|
|
||||
In addition to the cash deposits presented in the table above, our exposure to loss related to our land option contracts and other similar contracts with third parties and unconsolidated entities consisted of pre-acquisition costs of
$31.0 million
at November 30, 2013 and
$25.4 million
at November 30, 2012. These pre-acquisition costs and cash deposits were included in inventories in our consolidated balance sheets. We also had outstanding letters of credit of
$.1 million
at November 30, 2013 and
$.5 million
at November 30, 2012 in lieu of cash deposits under certain land option contracts and other similar contracts.
We also evaluate our land option contracts and other similar contracts for financing arrangements in accordance with
ASC 470,
and, as a result of our evaluations, increased inventories, with a corresponding increase to accrued expenses and other liabilities, in our consolidated balance sheets by
$8.9 million
at
November 30, 2013
and
$4.1 million
at
November 30, 2012
.
|
Note 9.
|
Investments in Unconsolidated Joint Ventures
|
We have investments in unconsolidated joint ventures that conduct land acquisition, land development and/or other homebuilding activities in various markets where our homebuilding operations are located. Our partners in these unconsolidated joint ventures are unrelated homebuilders, and/or land developers and other real estate entities, or commercial enterprises. These investments are designed primarily to reduce market and development risks and to increase the number of lots we own or control. In some instances, participating in unconsolidated joint ventures has enabled us to acquire and develop land that we might not otherwise have had access to due to a project’s size, financing needs, duration of development or other circumstances. While we consider our participation in unconsolidated joint ventures as potentially beneficial to our homebuilding activities, we do not view such participation as essential.
We typically have obtained rights to acquire portions of the land held by the unconsolidated joint ventures in which we currently participate. When an unconsolidated joint venture sells land to our homebuilding operations, we defer recognition of our share of such unconsolidated joint venture’s earnings until a home sale is closed and title passes to a homebuyer, at which time we account for those earnings as a reduction of the cost of purchasing the land from the unconsolidated joint venture.
We and our unconsolidated joint venture partners make initial and/or ongoing capital contributions to these unconsolidated joint ventures, typically on a pro rata basis, equal to our respective equity interests. The obligations to make capital contributions are governed by each unconsolidated joint venture’s respective operating agreement and related governing documents.
Each unconsolidated joint venture is obligated to maintain financial statements in accordance with GAAP. We
share in the profits and losses of these unconsolidated joint ventures generally in accordance with our respective equity interests.
In some instances, we recognize profits and losses related to our investment in an unconsolidated joint venture that differ from our equity interest in the unconsolidated joint venture. This may arise from impairments that we recognize related to our investment that differ from the impairments the unconsolidated joint venture recognizes with respect to the unconsolidated joint venture’s assets; differences between our basis in assets we have transferred to the unconsolidated joint venture and the unconsolidated joint venture’s basis in those assets; our deferral of the unconsolidated joint venture’s profits from land sales to us; or other items.
84
With respect to our investments in unconsolidated joint ventures, our equity in loss of unconsolidated joint ventures included impairment charges of
$53.7 million
in
2011
. There were no such impairment charges in 2013 or 2012. In 2011, the impairment charge reflected the write off of our remaining investment in South Edge, a residential development joint venture in our Southwest homebuilding reporting segment. We wrote off our remaining investment based on our determination that South Edge was no longer able to perform its originally intended activities following a 2011 court decision to enter an order for relief on a Chapter 11 involuntary bankruptcy petition filed against South Edge.
The following table presents combined condensed information from the statements of operations of our unconsolidated joint ventures (in thousands):
|
|
Years Ended November 30,
|
||||||||||
|
|
2013
|
2012
|
2011
|
||||||||
|
Revenues
|
$
|
17,446
|
|
$
|
31,772
|
|
$
|
230
|
|
||
|
Construction and land costs
|
(10,709
|
)
|
(21,467
|
)
|
(54
|
)
|
|||||
|
Other expenses, net
|
(4,042
|
)
|
(2,009
|
)
|
(4,506
|
)
|
|||||
|
Income (loss)
|
$
|
2,695
|
|
$
|
8,296
|
|
$
|
(4,330
|
)
|
||
For the years ended November 30, 2013 and 2012, combined revenues, construction and land costs, and income from our unconsolidated joint ventures primarily reflected land sales completed by an unconsolidated joint venture in Maryland.
The following table presents combined condensed balance sheet information for our unconsolidated joint ventures (in thousands):
|
|
November 30,
|
||||||
|
|
2013
|
2012
|
|||||
|
Assets
|
|||||||
|
Cash
|
$
|
18,752
|
|
$
|
29,721
|
|
|
|
Receivables
|
4,902
|
|
6,104
|
|
|||
|
Inventories
|
381,195
|
|
352,791
|
|
|||
|
Other assets
|
1,183
|
|
1,175
|
|
|||
|
Total assets
|
$
|
406,032
|
|
$
|
389,791
|
|
|
|
Liabilities and equity
|
|||||||
|
Accounts payable and other liabilities
|
$
|
85,386
|
|
$
|
88,027
|
|
|
|
Equity
|
320,646
|
|
301,764
|
|
|||
|
Total liabilities and equity
|
$
|
406,032
|
|
$
|
389,791
|
|
|
The following table presents information relating to our investments in unconsolidated joint ventures (dollars in thousands):
|
|
November 30,
|
||||||
|
|
2013
|
2012
|
|||||
|
Number of investments in unconsolidated joint ventures
|
9
|
|
8
|
|
|||
|
Investments in unconsolidated joint ventures
|
$
|
130,192
|
|
$
|
123,674
|
|
|
|
Number of unconsolidated joint venture lots controlled under land option contracts or other similar contracts
|
5,367
|
|
4,940
|
|
|||
As of November 30, 2013 and 2012, our total amount of investments in unconsolidated joint ventures was largely comprised of investments in Inspirada Builders, LLC, as described below, and a joint venture in California.
Our unconsolidated joint ventures finance land and inventory investments for a project through a variety of arrangements, and certain of our unconsolidated joint ventures have obtained loans from third-party lenders that are secured by the underlying property and related project assets.
However,
none
of our unconsolidated joint ventures had outstanding debt at
November 30, 2013
or 2012.
85
In 2011, we recognized an aggregate loss on loan guaranty charge of
$30.8 million
in our consolidated statements of operations related to our investment in South Edge, which underwent a bankruptcy reorganization in that year. This charge resulted from our recording a probable obligation related to a contingent payment guaranty that we had provided to the administrative agent for the lenders to South Edge and the bankruptcy court’s confirmation of the consensual plan of reorganization for South Edge, and took into account accruals we had previously established with respect to our investment in South Edge. The loss on loan guaranty charge was in addition to the joint venture impairment charge of
$53.7 million
that we recognized in 2011 to write off our remaining investment in South Edge. In connection with the reorganization plan for South Edge and the resolution of other matters surrounding South Edge, we made payments of
$251.9 million
in the fourth quarter of 2011, including a payment to the administrative agent, which satisfied the respective liens of the administrative agent and most of the South Edge lenders on the land South Edge owned. Accordingly, our obligations under the contingent payment guaranty were eliminated.
Our investments in unconsolidated joint ventures as of November 30, 2013 and 2012 included our investment of
$75.9 million
and
$71.0 million
, respectively, in Inspirada Builders, LLC, an unconsolidated joint venture that was formed in 2011 in connection with the consensual plan of reorganization plan for South Edge, and in which a subsidiary that is 100% owned by us is a member. As part of the terms of the reorganization plan for South Edge, land previously owned by the South Edge joint venture, including our share that consists of approximately
600
developable acres, was acquired by Inspirada Builders, LLC in November 2011. We anticipate that we will acquire our share of the land from Inspirada Builders, LLC through a future distribution.
|
Note 10.
|
Other Assets
|
Other assets consisted of the following (in thousands):
|
|
November 30,
|
||||||
|
|
2013
|
2012
|
|||||
|
Cash surrender value of insurance contracts
|
$
|
68,534
|
|
$
|
64,757
|
|
|
|
Debt issuance costs (a)
|
27,366
|
|
14,563
|
|
|||
|
Property and equipment, net
|
8,460
|
|
7,920
|
|
|||
|
Prepaid expenses
|
2,716
|
|
7,810
|
|
|||
|
Total
|
$
|
107,076
|
|
$
|
95,050
|
|
|
|
(a)
|
The increase in debt issuance costs as of November 30, 2013 compared to November 30, 2012 primarily reflected the costs associated with our underwritten public issuances of the 1.375% Convertible Senior Notes due 2019 and the 7.00% Senior Notes due 2021, and our entry into the Credit Facility during 2013.
|
|
Note 11.
|
Accrued Expenses and Other Liabilities
|
Accrued expenses and other liabilities consisted of the following (in thousands):
|
|
November 30,
|
||||||
|
|
2013
|
2012
|
|||||
|
Self-insurance and other litigation liabilities
|
$
|
99,612
|
|
$
|
107,111
|
|
|
|
Employee compensation and related benefits
|
99,332
|
|
97,189
|
|
|||
|
Warranty liability
|
48,704
|
|
47,822
|
|
|||
|
Accrued interest payable
|
45,562
|
|
47,392
|
|
|||
|
Inventory-related obligations
|
29,517
|
|
11,674
|
|
|||
|
Real estate and business taxes
|
8,131
|
|
8,453
|
|
|||
|
Other
|
25,318
|
|
20,704
|
|
|||
|
Total
|
$
|
356,176
|
|
$
|
340,345
|
|
|
86
|
Note 12.
|
Income Taxes
|
Income Tax Benefit (Expense).
The components of income tax benefit (expense) in the consolidated statements of operations are as follows (in thousands):
|
Federal
|
State
|
Total
|
|||||||||
|
2013
|
|||||||||||
|
Current
|
$
|
—
|
|
$
|
1,600
|
|
$
|
1,600
|
|
||
|
Deferred
|
—
|
|
—
|
|
—
|
|
|||||
|
Income tax benefit
|
$
|
—
|
|
$
|
1,600
|
|
$
|
1,600
|
|
||
|
2012
|
|||||||||||
|
Current
|
$
|
16,500
|
|
$
|
3,600
|
|
$
|
20,100
|
|
||
|
Deferred
|
—
|
|
—
|
|
—
|
|
|||||
|
Income tax benefit
|
$
|
16,500
|
|
$
|
3,600
|
|
$
|
20,100
|
|
||
|
2011
|
|||||||||||
|
Current
|
$
|
2,600
|
|
$
|
(200
|
)
|
$
|
2,400
|
|
||
|
Deferred
|
—
|
|
—
|
|
—
|
|
|||||
|
Income tax benefit (expense)
|
$
|
2,600
|
|
$
|
(200
|
)
|
$
|
2,400
|
|
||
We recognized an income tax benefit of
$1.6 million
in
2013
,
$20.1 million
in
2012
and
$2.4 million
in
2011
. The income tax benefit for 2013 was due to the resolution of a state tax audit, which resulted in a refund receivable of
$1.4 million
, as well as the recognition of unrecognized tax benefits of
$1.0 million
, partly offset by the state tax liability of
$.8 million
. The income tax benefit of
$20.1 million
in 2012 primarily reflected the resolution of federal and state tax audits, which also resulted in the realization of
$1.2 million
of deferred tax assets. The income tax benefit in
2011
reflected the reversal of a
$2.6 million
liability for unrecognized tax benefits due to the status of federal and state tax audits. Due to the effects of our deferred tax asset valuation allowances, carrybacks of our NOL, and changes in our unrecognized tax benefits, our effective tax rates in 2013, 2012 and 2011 are not meaningful items as our income tax amounts are not directly correlated to the amount of our pretax income (loss) for those periods.
Deferred Income Taxes.
Deferred income taxes result from temporary differences in the financial and tax basis of assets and liabilities. Significant components of our deferred tax liabilities and assets are as follows (in thousands):
87
|
|
November 30,
|
||||||
|
|
2013
|
2012
|
|||||
|
Deferred tax liabilities:
|
|||||||
|
Capitalized expenses
|
$
|
87,599
|
|
$
|
76,112
|
|
|
|
State taxes
|
62,884
|
|
64,577
|
|
|||
|
Depreciation and amortization
|
300
|
|
—
|
|
|||
|
Other
|
208
|
|
218
|
|
|||
|
Total
|
$
|
150,991
|
|
$
|
140,907
|
|
|
|
Deferred tax assets:
|
|||||||
|
Inventory impairments and land option contract abandonments
|
$
|
110,745
|
|
$
|
132,099
|
|
|
|
NOL from 2006 through 2013
|
459,885
|
|
442,621
|
|
|||
|
Warranty, legal and other accruals
|
50,110
|
|
54,744
|
|
|||
|
Employee benefits
|
73,039
|
|
68,644
|
|
|||
|
Partnerships and joint ventures
|
122,081
|
|
132,851
|
|
|||
|
Depreciation and amortization
|
—
|
|
7,467
|
|
|||
|
Capitalized expenses
|
9,359
|
|
6,646
|
|
|||
|
Tax credits
|
173,289
|
|
169,173
|
|
|||
|
Deferred income
|
656
|
|
668
|
|
|||
|
Other
|
11,267
|
|
6,107
|
|
|||
|
Total
|
1,010,431
|
|
1,021,020
|
|
|||
|
Valuation allowance
|
(859,440
|
)
|
(880,113
|
)
|
|||
|
Total
|
150,991
|
|
140,907
|
|
|||
|
Net deferred tax assets
|
$
|
—
|
|
$
|
—
|
|
|
Reconciliation of Expected Income Tax Benefit (Expense).
The income tax benefit (expense) computed at the statutory U.S. federal income tax rate and the income tax benefit provided in the consolidated statements of operations differ as follows (in thousands):
|
|
Years Ended November 30,
|
||||||||||
|
|
2013
|
2012
|
2011
|
||||||||
|
Income tax benefit (expense) computed at statutory rate
|
$
|
(13,427
|
)
|
$
|
27,672
|
|
$
|
63,397
|
|
||
|
State taxes, net of federal income tax benefit
|
(1,947
|
)
|
9,948
|
|
4,691
|
|
|||||
|
Reserve and deferred income
|
(1,808
|
)
|
(9,146
|
)
|
(1,161
|
)
|
|||||
|
Capitalized expenses
|
—
|
|
7,960
|
|
(3,501
|
)
|
|||||
|
Basis in joint ventures
|
(9,598
|
)
|
42,503
|
|
4,401
|
|
|||||
|
NOL reconciliation
|
(3,806
|
)
|
(5,345
|
)
|
715
|
|
|||||
|
Inventory impairments
|
2,827
|
|
(59,401
|
)
|
(1,852
|
)
|
|||||
|
Recognition of federal and state tax benefits
|
1,600
|
|
17,650
|
|
2,600
|
|
|||||
|
Tax credits
|
2,675
|
|
17,889
|
|
5,477
|
|
|||||
|
Valuation allowance for deferred tax assets
|
20,673
|
|
(32,286
|
)
|
(76,747
|
)
|
|||||
|
Depreciation and amortization
|
4,523
|
|
2,482
|
|
—
|
|
|||||
|
Other, net
|
(112
|
)
|
174
|
|
4,380
|
|
|||||
|
Income tax benefit
|
$
|
1,600
|
|
$
|
20,100
|
|
$
|
2,400
|
|
||
Valuation Allowance.
In accordance with ASC 740,
we evaluate our deferred tax assets quarterly to determine if adjustments to the valuation allowance are required. ASC 740 requires that companies assess whether a valuation allowance should be established based on the consideration of all available positive and negative evidence using a “more likely than not” standard with
88
respect to whether deferred tax assets will be realized.
The ultimate realization of deferred tax assets depends primarily on the generation of future taxable income. The value of our deferred tax assets will depend on applicable income tax rates. During 2013, we reduced the valuation allowance by
$20.7 million
to account for adjustments to our deferred tax assets associated with the pretax income generated during the year and the loss of state NOLs due to the expiration of the applicable statute of limitations. During 2012 and 2011, we recorded valuation allowances of
$32.3 million
and
$76.7 million
, respectively, against net deferred tax assets generated primarily from the pretax losses for those years. One of the primary pieces of negative evidence that we consider in evaluating the need for a valuation allowance is our three-year cumulative loss position, which is largely the result of our pretax losses in 2012 and 2011, as we generated pretax income in 2013. In 2013, we had two consecutive quarters of pretax income and have experienced year-over-year increases in our homes delivered, revenues, housing gross profit margin and net orders. In addition, our backlog value at November 30, 2013 was higher than at November 30, 2012. If such positive trends in our business continue, together with improvements in housing markets and the homebuilding industry, and we are profitable on a sustained basis, we believe that there could be sufficient positive evidence to support reducing a large portion of our valuation allowance during 2014.
The majority of the tax benefits associated with our NOL can be carried forward for
20
years and applied to offset future taxable income. The federal NOL carryforwards of
$329.0 million
, if not utilized, will begin to expire in
2030
through
2033
. The state NOL carryforwards of
$130.9 million
will begin to expire between
2014
and
2033
if not utilized. During 2013,
$3.5 million
of state NOL carryforwards expired.
In addition,
$84.4 million
of our tax credits, if not utilized, will begin to expire in
2015
through
2033
. Included in the
$84.4 million
are
$7.8 million
of investment tax credits, of which
$7.0 million
and
$.8 million
will expire in
2026
and
2027
, respectively.
We had no net deferred tax assets at November 30, 2013 or 2012 as we maintained a full valuation allowance against our deferred tax assets. The deferred tax asset valuation allowance decreased to
$859.4 million
at November 30, 2013 from
$880.1 million
at November 30, 2012, reflecting a reduction of
$20.7 million
due to the use of deferred tax assets to offset the income taxes associated with the net income generated during 2013, and the loss of certain state NOLs due to the expiration of the applicable statute of limitations. To the extent we generate sufficient taxable income in the future to fully utilize the tax benefits of the related deferred tax assets, we expect our effective tax rate to decrease as the valuation allowance is reversed.
Unrecognized Tax Benefits.
Gross unrecognized tax benefits are the differences between a tax position taken or expected to be taken in a tax return, and the benefit recognized for accounting purposes. A reconciliation of the beginning and ending balances of the gross unrecognized tax benefits, excluding interest and penalties, is as follows (in thousands):
|
|
Years Ended November 30,
|
||||||||||
|
|
2013
|
2012
|
2011
|
||||||||
|
Balance at beginning of year
|
$
|
1,671
|
|
$
|
1,899
|
|
$
|
11,308
|
|
||
|
Additions for tax positions related to prior years
|
—
|
|
—
|
|
5
|
|
|||||
|
Reductions for tax positions related to prior years
|
—
|
|
(165
|
)
|
—
|
|
|||||
|
Reductions due to lapse of statute of limitations
|
(1,465
|
)
|
(63
|
)
|
(2,476
|
)
|
|||||
|
Reductions due to resolution of federal and state audits
|
—
|
|
—
|
|
(6,938
|
)
|
|||||
|
Balance at end of year
|
$
|
206
|
|
$
|
1,671
|
|
$
|
1,899
|
|
||
W
e recognize accrued interest and penalties related to unrecognized tax benefits in our consolidated financial statements as a component of the provision for income taxes.
As of
November 30, 2013
,
2012
and
2011
, there were
$.3 million
,
$1.3 million
and
$1.8 million
, respectively, of gross unrecognized tax benefits (including interest and penalties), that if recognized would affect our annual effective tax rate. Our total accrued interest and penalties related to unrecognized income tax benefits was
$.3 million
at
November 30, 2013
and
$.6 million
at
November 30, 2012
. Our liabilities for unrecognized tax benefits at
November 30, 2013
and
2012
are included in accrued expenses and other liabilities in our consolidated balance sheets.
Included in the balance of gross unrecognized tax benefits at
November 30, 2013
and
2012
were tax positions of
$.2 million
and
$1.0 million
, respectively, for which the ultimate deductibility is highly certain but the timing of such deductibility is uncertain. Because of the impact of deferred tax accounting, other than interest and penalties, the disallowance of the shorter deductibility period would not affect our annual effective tax rate, but would accelerate the payment of cash to a tax authority to an earlier period.
As of
November 30, 2013
, our gross unrecognized tax benefits (including interest and penalties) totaled
$.5 million
. We anticipate that these gross unrecognized tax benefits will decrease by an amount ranging from
$.1 million
to
$.3 million
during
89
the 12 months from this reporting date due to various state filings associated with the resolution of a federal audit. The fiscal years ending 2010 and later remain open to federal and state examinations.
The benefits of our NOL, built-in losses and tax credits would be reduced or potentially eliminated if we experienced an “ownership change” under Section 382. Based on our analysis performed as of November 30, 2013, we do not believe that we have experienced an ownership change as defined by Section 382, and, therefore, the NOL, built-in losses and tax credits we have generated should not be subject to a Section 382 limitation as of this reporting date.
|
Note 13.
|
Mortgages and Notes Payable
|
Mortgages and notes payable consisted of the following (in thousands):
|
|
November 30,
|
||||||
|
|
2013
|
2012
|
|||||
|
Mortgages and land contracts due to land sellers and other loans (at interest rates of 7% at November 30, 2013 and 6% to 7% at November 30, 2012)
|
$
|
13,615
|
|
$
|
52,311
|
|
|
|
5 3/4% Senior notes due February 1, 2014
|
—
|
|
75,911
|
|
|||
|
5 7/8% Senior notes due January 15, 2015
|
—
|
|
101,999
|
|
|||
|
6 1/4% Senior notes due June 15, 2015
|
199,864
|
|
236,826
|
|
|||
|
9.10% Senior notes due September 15, 2017
|
262,048
|
|
261,430
|
|
|||
|
7 1/4% Senior notes due June 15, 2018
|
299,261
|
|
299,129
|
|
|||
|
8.00% Senior notes due March 15, 2020
|
345,710
|
|
345,209
|
|
|||
|
7.00% Senior notes due December 15, 2021
|
450,000
|
|
—
|
|
|||
|
7.50% Senior notes due September 15, 2022
|
350,000
|
|
350,000
|
|
|||
|
1.375% Convertible senior notes due February 1, 2019
|
230,000
|
|
—
|
|
|||
|
Total
|
$
|
2,150,498
|
|
$
|
1,722,815
|
|
|
Unsecured Revolving Credit Facility.
On March 12, 2013, we entered into the Credit Facility with a syndicate of financial institutions. The Credit Facility will mature on
March 12, 2016
. The Credit F
acility contains an uncommitted accordion feature under which its aggregate principal amount can be increased to up to
$300.0 million
under certain conditions and the availability of additional bank commitments, as well as a sublimit of
$100.0 million
for the issuance of letters of credit, which may be utilized in combination with, or to replace, the LOC Facilities. Interest on amounts borrowed under the Credit Facility is payable quarterly in arrears at a rate based on either the London Interbank Offered Rate or a base rate, plus a spread that depends on our debt rating and Leverage Ratio, as defined under the Credit Facility. The Credit Facility also requires the payment of a commitment fee ranging from
.50%
to
.75%
of the unused commitment, based on our debt rating and Leverage Ratio. Under the terms of the Credit Facility, we are required, among other things, to maintain compliance with various covenants, including financial covenants relating to consolidated tangible net worth, the Leverage Ratio, and either an interest coverage ratio or a minimum level of liquidity, each as defined therein. The amount of the Credit Facility available for cash borrowings or the issuance of letters of credit depends on the total cash borrowings and letters of credit outstanding under the Credit Facility and the maximum available amount under the terms of the Credit Facility. As of November 30, 2013, we had
no
cash borrowings or letters of credit outstanding under the Credit Facility and we had
$200.0 million
available for cash borrowings, with up to
$100.0 million
available for the issuance of letters of credit.
Borrowings under the Credit Facility are required to be unconditionally guaranteed jointly and severally by certain of our subsidiaries (the “Guarantor Subsidiaries”) that meet the definition of a “significant subsidiary” as defined by Rule 1-02 of Regulation S-X using a
5%
rather than a 10% threshold, provided that the assets of our non-guarantor subsidiaries do not in the aggregate exceed
10%
of an adjusted measure of our consolidated total assets. Each of the Guarantor Subsidiaries is a
100%
owned subsidiary of ours. We may also cause other subsidiaries of ours to become Guarantor Subsidiaries if we believe it to be in our or the relevant subsidiary’s best interests.
Letter of Credit Facilities.
We maintain the LOC Facilities with various financial institutions to obtain letters of credit in the ordinary course of operating our business.
As of November 30, 2013 and 2012,
$41.5 million
and
$41.9 million
, respectively, of letters of credit were outstanding under the LOC Facilities.
The LOC Facilities require us to deposit and maintain cash with the issuing financial institutions as collateral for our letters of credit outstanding.
We may maintain, revise or, if necessary or desirable, enter into additional or expanded letter of credit facilities, or other similar facility arrangements, with the same or other financial institutions.
90
Mortgages and Land Contracts Due to Land Sellers and Other Loans.
As of November 30, 2013, inventories having a carrying value of
$37.9 million
were pledged to collateralize mortgages and land contracts due to land sellers and other loans.
Shelf Registration.
We have an automatically effective universal shelf registration statement on file with the SEC. The 2011 Shelf Registration registers the offering of debt and equity securities that we may issue from time to time in amounts to be determined.
Senior Notes.
All of our senior notes outstanding at November 30, 2013 and 2012 represent senior unsecured obligations, rank equally in right of payment with all of our existing and future indebtedness and are unconditionally guaranteed jointly and severally by the Guarantor Subsidiaries on a senior unsecured basis. At our option, these notes may be redeemed, in whole at any time or from time to time in part, at a redemption price equal to the greater of (a) 100% of the principal amount of the notes being redeemed and (b) the sum of the present values of the remaining scheduled payments of principal and interest on the notes being redeemed discounted to the redemption date at a defined rate, plus, in each case, accrued and unpaid interest on the notes being redeemed to the applicable redemption date.
On January 28, 2004, we issued the 5 3/4% Senior Notes due 2014 at
99.474%
of the
$250.0 million
in aggregate principal amount of these notes in a private placement. On June 16, 2004, we exchanged all of the privately placed 5 3/4% Senior Notes due 2014 for notes that are substantially identical except that the new 5 3/4% Senior Notes due 2014 are registered under the Securities Act of 1933.
On December 15, 2004, pursuant to the shelf registration statement filed with the SEC on November 12, 2004 (the “2004 Shelf Registration”), we issued the 5 7/8% Senior Notes due 2015 at
99.357%
of the
$300.0 million
in aggregate principal amount of these notes.
On June 2, 2005, pursuant to the 2004 Shelf Registration, we issued
$300.0 million
of the 6 1/4% Senior Notes due 2015 at
99.533%
of the aggregate principal amount of these notes, and on June 27, 2005, issued
$150.0 million
additional senior notes in the same series at
100.614%
of the aggregate principal amount of these notes.
On July 30, 2009, pursuant to the shelf registration statement filed with the SEC on October 17, 2008, we issued the
9.10%
senior notes due 2017 (the “9.10% Senior Notes due 2017”) at
98.014%
of the
$265.0 million
in aggregate principal amount of these notes. We used substantially all of the net proceeds from the issuance of the
9.10%
Senior Notes due 2017 to purchase, pursuant to a simultaneous tender offer,
$250.0 million
in aggregate principal amount of the 6 3/8% Senior Notes due 2011. On August 15, 2011, we repaid the remaining
$100.0 million
in aggregate principal amount of the 6 3/8% Senior Notes due 2011 at their maturity.
On April 3, 2006, pursuant to the 2004 Shelf Registration, we issued the 7 1/4% Senior Notes due 2018 at
99.486%
of the
$300.0 million
in aggregate principal amount of these notes.
On February 7, 2012, pursuant to the 2011 Shelf Registration, we issued the
8.00%
Senior Notes due 2020 at
98.523%
of the
$350.0 million
in aggregate principal amount of these notes. We used substantially all of the net proceeds from this issuance to purchase, pursuant to the terms of the applicable January 2012 Tender Offers,
$340.0 million
in aggregate principal amount of portions of each of the 5 3/4% Senior Notes due 2014, the 5 7/8% Senior Notes due 2015 and the 6 1/4% Senior Notes due 2015. The total amount paid to purchase these senior notes was
$340.5 million
. We incurred a
$2.0 million
loss on the early extinguishment of debt in 2012 due to a premium paid under the applicable January 2012 Tender Offers and the unamortized original issue discount.
On July 31, 2012, pursuant to the 2011 Shelf Registration, we issued the
7.50%
Senior Notes due 2022 at
100%
of the
$350.0 million
in aggregate principal amount of these notes. We used
$252.2 million
of the net proceeds from this issuance to purchase, pursuant to the terms of the applicable July 2012 Tender Offers,
$244.9 million
in aggregate principal amount of portions of each of the 5 3/4% Senior Notes due 2014, the 5 7/8% Senior Notes due 2015 and the 6 1/4% Senior Notes due 2015. We used the remaining net proceeds from this issuance for general corporate purposes. We incurred an
$8.3 million
loss on the early extinguishment of debt in 2012 due to a premium paid under the applicable July 2012 Tender Offers and the unamortized original issue discount.
On October 29, 2013, pursuant to the 2011 Shelf Registration, we issued the
7.00%
Senior Notes due 2021 at
100%
of the
$450.0 million
in aggregate principal amount of these notes. We used
$225.4 million
of the net proceeds from this issuance to purchase
$19.7 million
in aggregate principal amount of the 5 3/4% Senior Notes due 2014,
$91.1 million
in aggregate principal amount of the 5 7/8% Senior Notes due 2015 and
$37.0 million
in aggregate principal amount of the 6 1/4% Senior Notes due 2015, pursuant to the terms of the applicable October 2013 Tender Offers, and to redeem the remaining
$56.3 million
in aggregate principal amount of the 5 3/4% Senior Notes due 2014 and
$11.0 million
in aggregate principal amount of the 5 7/8% Senior Notes due 2015 that were not purchased in the applicable October 2013 Tender Offers. The October 2013 Tender Offers expired on November 12, 2013. We plan to use the remaining net proceeds from this issuance for general corporate purposes. We incurred
91
a
$10.4 million
loss on the early extinguishment of debt in 2013 due to a premium paid under the applicable October 2013 Tender Offers, premiums paid to redeem the applicable remaining senior notes, and the unamortized original issue discount associated with these senior notes.
If a change in control occurs as defined in the instruments governing our senior notes, we would be required to offer to purchase all of our outstanding senior notes (with the exception of the amounts outstanding related to our 6 1/4% Senior Notes due 2015 and our 7 1/4% Senior Notes due 2018) at 101% of their principal amount, together with all accrued and unpaid interest, if any.
Convertible Senior Notes.
On January 29, 2013 and February 4, 2013, pursuant to the 2011 Shelf Registration, we issued in an underwritten public offering the 1.375% Convertible Senior Notes due 2019 at
100%
of the
$230.0 million
in aggregate principal amount of these notes. The issuance on February 4, 2013 was made pursuant to the exercise of an option granted to the underwriters to purchase such notes to cover over-allotments. Interest on the 1.375% Convertible Senior Notes due 2019, which represent senior unsecured obligations of ours and rank equally in right of payment with all of our other senior unsecured indebtedness, is payable semi-annually in arrears on February 1 and August 1, commencing on August 1, 2013. We will also pay interest on November 1, 2018. The 1.375% Convertible Senior Notes due 2019 will mature on February 1, 2019, unless converted earlier by the holders, at their option, or redeemed by us, or purchased by us at the option of the holders following the occurrence of a fundamental change, as defined in the instruments governing the 1.375% Convertible Senior Notes due 2019.
At any time prior to the close of business on the business day immediately preceding the maturity date, holders may convert all or any portion of their 1.375% Convertible Senior Notes due 2019. The 1.375% Convertible Senior Notes due 2019 are initially convertible into shares of our common stock at a conversion rate of
36.5297
shares for each $1,000 principal amount of the notes, which represents an initial conversion price of approximately
$27.37
per share and a conversion premium of approximately
47%
based on the closing price of our common stock on January 29, 2013, which was
$18.62
per share. This initial conversion rate equates to
8,401,831
shares of our common stock. The conversion rate is subject to adjustment upon the occurrence of certain events, including: subdivisions and combinations of our common stock; the issuance of stock dividends, or certain rights, options or warrants, capital stock, indebtedness, assets or cash dividends to all or substantially all holders of our common stock; and certain issuer tender or exchange offers. The conversion rate will not, however, be adjusted for other events, such as a third party tender or exchange offer or an issuance of common stock for cash or an acquisition, that may adversely affect the trading price of the notes or our common stock. On conversion, holders of the 1.375% Convertible Senior Notes due 2019 will not be entitled to receive cash in lieu of shares of our common stock, except for cash in lieu of fractional shares.
We may not redeem the 1.375% Convertible Senior Notes due 2019 prior to November 6, 2018. On or after November 6, 2018, and prior to the stated maturity date, we may at our option redeem all or part of the 1.375% Convertible Senior Notes due 2019 for a cash price equal to
100%
of the principal amount of the notes being redeemed, plus accrued and unpaid interest to, but not including, the redemption date. If a fundamental change, as defined in the instruments governing the 1.375% Convertible Senior Notes due 2019, occurs prior to the stated maturity date, the holders may require us to purchase for cash all or any portion of their 1.375% Convertible Senior Notes due 2019 at
100%
of the principal amount of the notes, plus accrued and unpaid interest to, but not including, the fundamental change purchase date.
The 1.375% Convertible Senior Notes due 2019 are fully and unconditionally guaranteed jointly and severally by the Guarantor Subsidiaries. We used the
$222.7 million
in total net proceeds from the issuance of the 1.375% Convertible Senior Notes due 2019 together with the total net proceeds from a concurrent underwritten public offering of our common stock, which is described in Note 17. Stockholders’ Equity, for general corporate purposes, including for investments in land and land development.
The indenture governing the senior notes and the 1.375% Convertible Senior Notes due 2019 does not contain any financial covenants. Subject to specified exceptions, the indenture contains certain restrictive covenants that, among other things, limit our ability to incur secured indebtedness, or engage in sale-leaseback transactions involving property or assets above a certain specified value.
In addition, the 1.375% Convertible Senior Notes due 2019 and all of the senior notes (with the exception of the 6 1/4% Senior Notes due 2015 and the 7 1/4% Senior Notes due 2018)
contain certain limitations related to mergers, consolidations, and sales of assets.
As of November 30, 2013,
we were in compliance with the applicable terms of all our covenants under the Credit Facility, the senior notes, the 1.375% Convertible Senior Notes due 2019, the indenture, and the mortgages and land contracts due to land sellers and other loans. Our ability to access the Credit Facility for cash borrowings and letters of credit and our ability to secure future debt financing depend, in part, on our ability to remain in such compliance.
Our inability to do so could make it more difficult and expensive to maintain our current level of external debt financing or to obtain additional financing.
There are no agreements that restrict our payment of dividends other than to maintain compliance with the financial covenant requirements under the Credit Facility, which would restrict our payment of dividends if there is a default under the Credit Facility existing at the time of any such payment, or if any such payment would result in such a default.
92
Principal payments on senior notes, mortgages and land contracts due to land sellers and other loans are due during each year ended November 30 as follows: 2014 —
$8.8 million
; 2015—
$204.7 million
; 2016 —
$0
; 2017 —
$262.0 million
; 2018 —
$299.3 million
; and thereafter —
$1.38 billion
.
|
Note 14.
|
Fair Value Disclosures
|
ASC 820
provides a framework for measuring the fair value of assets and liabilities under GAAP, and establishes a fair value hierarchy that requires an entity to maximize the use of observable inputs and minimize the use of unobservable inputs when measuring fair value.
The fair value hierarchy can be summarized as follows:
|
Level 1
|
Fair value determined based on quoted prices in active markets for identical assets or liabilities.
|
|
Level 2
|
Fair value determined using significant observable inputs, such as quoted prices for similar assets or liabilities or quoted prices for identical or similar assets or liabilities in markets that are not active, inputs other than quoted prices that are observable for the asset or liability, or inputs that are derived principally from or corroborated by observable market data, by correlation or other means.
|
|
Level 3
|
Fair value determined using significant unobservable inputs, such as pricing models, discounted cash flows, or similar techniques.
|
Fair value measurements are used for inventories on a nonrecurring basis when events and circumstances indicate the carrying value is not recoverable.
The following table presents the fair value hierarchy and our assets measured at fair value on a nonrecurring basis for the years ended November 30, 2013 and 2012 (in thousands):
|
|
Fair Value
|
|||||||||
|
Description
|
Hierarchy
|
November 30,
2013 (a) |
November 30,
2012 (a) |
|||||||
|
Long-lived assets held and used
|
Level 3
|
$
|
1,143
|
|
$
|
39,851
|
|
|||
|
(a)
|
Amounts represent the aggregate fair value for communities or land parcels where we recognized inventory impairment charges during the period, as of the date that the fair value measurements were made. The carrying value for these communities or land parcels may have subsequently increased or decreased from the fair value reflected due to activity that has occurred since the measurement date.
|
In accordance with the provisions of ASC 360, long-lived assets held and used with a carrying value of
$1.5 million
were written down to their fair value of
$1.1 million
during the year ended
November 30, 2013
, resulting in inventory impairment charges of
$.4 million
. Long-lived assets held and used with a carrying value of
$68.0 million
were written down to their fair value of
$39.9 million
during the year ended
November 30, 2012
, resulting in inventory impairment charges of
$28.1 million
.
The fair values for long-lived assets held and used that were determined using Level 3 inputs were primarily based on the estimated future net cash flows discounted for inherent risk associated with each asset
as described in Note 7. Inventory Impairments and Land Option Contract Abandonments.
The discount rates we used were impacted by the following at the time the calculation was made: the risk-free rate of return; expected risk premium based on estimated land development, home construction and delivery timelines; market risk from potential future price erosion; cost uncertainty due to land development or home construction cost increases; and other risks specific to the asset or conditions in the market in which the asset is located.
These factors were specific to each affected community or land parcel and may have varied among communities or land parcels and may have varied over time.
Our financial instruments consist of cash and cash equivalents, restricted cash, senior notes, the 1.375% Convertible Senior Notes due 2019, and mortgages and land contracts due to land sellers and other loans. Fair value measurements of financial instruments are determined by various market data and other valuation techniques as appropriate. When available, we use quoted market prices in active markets to determine fair value.
The following table presents the fair value hierarchy, carrying values and estimated fair values of our financial instruments, except those for which the carrying values approximate fair values (in thousands):
93
|
|
November 30,
|
||||||||||||||||
|
|
2013
|
2012
|
|||||||||||||||
|
Fair Value Hierarchy
|
Carrying
Value
|
Estimated
Fair Value
|
Carrying
Value
|
Estimated
Fair Value
|
|||||||||||||
|
Financial Liabilities:
|
|||||||||||||||||
|
Senior notes
|
Level 2
|
$
|
1,906,883
|
|
$
|
2,069,325
|
|
$
|
1,670,504
|
|
$
|
1,831,596
|
|
||||
|
1.375% Convertible senior notes due February 1, 2019
|
Level 2
|
230,000
|
|
224,825
|
|
—
|
|
—
|
|
||||||||
The fair values of our senior notes and the 1.375% Convertible Senior Notes due 2019 are generally estimated based on quoted market prices for these instruments. The carrying values reported for cash and cash equivalents, restricted cash, and mortgages and land contracts due to land sellers and other loans approximate fair values.
|
Note 15.
|
Commitments and Contingencies
|
Commitments and contingencies include typical obligations of homebuilders for the completion of contracts and those incurred in the ordinary course of business.
Warranty.
We
provide a limited warranty on all of our homes.
The specific terms and conditions of our limited warranty program vary depending upon the markets in which we do business. We generally provide a structural warranty of
10 years
, a warranty on electrical, heating, cooling, plumbing and certain other building systems each varying from
two
to
five years
based on geographic market and state law, and a warranty of
one year
for other components of the home. Our limited warranty program is ordinarily how we respond to and account for homeowners’ requests to local division offices seeking repairs, including claims where we could have liability under applicable state statutes or tort law for a defective condition in or damages to a home.
We estimate the costs that may be incurred under each limited warranty and record a liability in the amount of such costs at the time the revenue associated with the sale of each home is recognized.
Our primary assumption in estimating the amounts we accrue for warranty costs is that historical claims experience is a strong indicator of future claims experience. Factors that affect our warranty liability include the number of homes delivered, historical and anticipated rates of warranty claims, and cost per claim. We periodically assess the adequacy of our accrued warranty liability
, which is included in accrued expenses and other liabilities in our consolidated balance sheets,
and adjust the amount as necessary based on our assessment.
Our assessment includes the review of our actual warranty costs incurred to identify trends and changes in our warranty claims experience, and considers our home construction quality and customer service initiatives and outside events.
While we believe the warranty liability currently reflected in our consolidated balance sheets to be adequate, unanticipated changes or developments in the legal environment, local weather, land or environmental conditions, quality of materials or methods used in the construction of homes or customer service practices and the results of our investigation of and the repair efforts related to homes in central and southwest Florida affected by water intrusion-related issues could have a significant impact on our actual warranty costs in the future and such amounts could differ from our current estimates.
The changes in our warranty liability are as follows (in thousands):
|
|
Years Ended November 30,
|
||||||||||
|
|
2013
|
2012
|
2011
|
||||||||
|
Balance at beginning of year
|
$
|
47,822
|
|
$
|
67,693
|
|
$
|
93,988
|
|
||
|
Warranties issued (a)
|
14,261
|
|
8,416
|
|
4,852
|
|
|||||
|
Payments
|
(45,338
|
)
|
(19,701
|
)
|
(25,024
|
)
|
|||||
|
Adjustments (b)
|
31,959
|
|
(8,586
|
)
|
(6,123
|
)
|
|||||
|
Balance at end of year
|
$
|
48,704
|
|
$
|
47,822
|
|
$
|
67,693
|
|
||
|
(a)
|
The year-over-year increase in the expense associated with warranties issued in 2013 and 2012 reflected higher housing revenues in each of those years. Additionally, in 2013, we increased the warranty accrual rate per home based on our historical claims experience.
|
|
(b)
|
Adjustments in 2013 were comprised of charges associated with water intrusion-related issues in central and southwest Florida, while in 2012, favorable warranty adjustments were partly offset by such water intrusion-related charges. In 2011, favorable warranty adjustments were partly offset by the impact of our consolidation of a previously unconsolidated joint venture.
|
94
Central and Southwest Florida Claims
.
During 2012, we received warranty claims from homeowners in certain of our communities in central and southwest Florida that primarily involved framing, stucco, roofing and/or sealant matters on homes we delivered between 2003 and 2009, many of which have resulted in water intrusion-related issues. While we initially believed these issues were isolated, after additional investigation we determined in the fourth quarter of 2012 that more homes and communities may have been affected. Throughout 2013, we continued our investigation in an effort to identify the scope of the issues, to fully understand the causes and to address them as quickly and completely as possible, and we encountered an evolving and at times unexpected range of varied and complex conditions and repairs. As a result, during 2013, the number of identified affected homes and our estimate of the total repair costs associated with those homes were revised upward. In addition, prior to the second quarter of 2013 we were unable to estimate the number of similarly affected homes likely to be identified in the future and the repair costs associated with those homes. As our assessment process and our continued efforts to identify, examine and repair affected homes progressed during the second, third and fourth quarters of 2013, we believed we had accumulated adequate experience with these water intrusion-related issues to be able to reasonably estimate as of the end of each respective period the number of similarly affected homes that we believed were likely to be identified in the future and the probable repair costs associated with such similarly affected homes, in addition to revising the number of identified affected homes and our estimate of the repair costs associated with such identified affected homes. Based on the status of our ongoing investigation and repair efforts, our overall warranty liability at November 30, 2013 included
$28.9 million
for estimated remaining repair costs associated with homes in central and southwest Florida that have been identified as having water intrusion-related issues and estimated repair costs associated with similarly affected homes in central and southwest Florida that we believe are likely to be identified in the future. As of
November 30, 2013
, this amount encompasses what we believe is the probable overall cost of the repair effort remaining before insurance and other recoveries. However, our actual costs to fully resolve repairs on affected homes could differ from the overall costs we have estimated, and the difference could be material to our consolidated financial statements.
As of
November 30, 2013
, we had identified a total of
1,464
affected homes requiring more than minor repairs and resolved repairs on
754
of them. During 2013, we paid
$32.7 million
to repair such homes. As of
November 30, 2013
, we had paid
$36.7 million
of the total estimated repair costs of
$65.6 million
associated with the affected homes that have been identified and similarly affected homes that we believe are likely to be identified in the future. Approximately half of the total estimated repair costs as of
November 30, 2013
related to
two
attached-home communities. We consider warranty-related repairs for homes to be resolved when all repairs are complete and all repair costs are fully paid. We anticipate resolving repairs on homes affected by the water intrusion-related issues by the end of 2014.
As discussed below, largely due to the scope and nature of the water intrusion-related issues that we encountered, we recorded charges, net of estimated probable recoveries, during 2013 to increase our overall warranty liability for all of our previously delivered homes that are covered under our limited warranty program, including any such homes in central and southwest Florida that have been identified as having water intrusion-related issues and similarly affected homes in central and southwest Florida that we believe are likely to be identified in the future. In addition to reflecting the remaining estimated repair costs associated with homes in central and southwest Florida that have been identified as having water intrusion-related issues, the charges recorded in 2013 included estimated repair costs associated with similarly affected homes in central and southwest Florida that we believe are likely to be identified in the future. Our investigation and repair efforts in central and southwest Florida remain ongoing. While we have been able to make a determination of the probable overall cost of the repair effort, depending on the number of additional affected homes that are identified and the actual costs we incur in future periods to repair identified affected homes, we may revise the estimated amount of our liability with respect to this matter, which could result in an increase or decrease in our overall warranty liability.
As of
November 30, 2013
, based on our investigation into the central and southwest Florida water intrusion-related issues, we believe it is probable that we will recover a portion of our total estimated repair costs associated with affected homes from various sources, including subcontractors involved with the original construction of the homes and their insurers, and our direct insurers. Our investigation into the water intrusion-related issues, including the process of determining potentially responsible parties and our efforts to obtain recoveries, is ongoing, and as a result, our estimate of probable recoveries may change as additional information is obtained.
Allegedly Defective Drywall Material Claims
.
During the years ended November 30, 2013,
2012
and
2011
, we paid
$.5 million
,
$2.9 million
and
$13.7 million
, respectively, to repair homes identified as affected or potentially affected by allegedly defective drywall manufactured in China. These homes are located in Florida and were primarily delivered in 2006 and 2007. The drywall used in the construction of our homes is purchased and installed by subcontractors. Our subcontractors obtained drywall material from multiple domestic and foreign sources through late 2008. In late 2008, we directed our subcontractors to obtain only domestically sourced drywall. Based on the significantly reduced warranty claim rate on the issue (only a nominal number of additional homes were identified in 2013 and 2012 as containing or potentially containing allegedly defective drywall manufactured in China), previous community-wide reviews we have conducted, and the domestic sourcing of drywall material since late 2008, we believe that we have identified substantially all affected homes and will receive at most only nominal additional claims in future periods.
95
As of November 30, 2013, we were a defendant in
two
lawsuits relating to allegedly defective drywall manufactured in China.
One
of the lawsuits is an “omnibus” class action purportedly filed on behalf of numerous homeowners asserting claims for damages against drywall manufacturers, homebuilders and other parties in the supply chain of the allegedly defective drywall material. This class action is now in the process of being dismissed pursuant to a final global settlement of claims approved in February 2013 by the federal court judge overseeing a multidistrict litigation case —
In re: Chinese Manufactured Drywall Products Liability Litigation (MDL-2047)
. We were also a defendant in
one
lawsuit brought in Florida state court by individual homeowners. Except for the Florida state court case, the global settlement resolved all current claims against us, including the remaining omnibus class action (and those that have been previously dismissed) in which we were named as a defendant, and bars any future claims against all participating defendants, including us. Our total obligation as a participating defendant under the global settlement was
$.3 million
, which we paid on March 25, 2013. We also expect to receive certain amounts under the global settlement in 2014 based on repairs we made to homes of certain settlement class members. The plaintiffs in the Florida state court case opted out of the global settlement, and we settled the case with those plaintiffs in the third quarter of 2013. The case was submitted to the court for dismissal in the first quarter of 2014.
Other Claims
. With respect to potential recoveries on claims regarding other homes previously delivered, we have tendered claims with responsible liability insurance carriers, seeking reimbursement of costs we have incurred to make repairs and to handle claims. During 2012, we recognized insurance recoveries of
$26.5 million
as a reduction to construction and land costs in our consolidated statements of operations, representing amounts we received from one of our insurance carriers for a portion of the claims we have tendered. We intend to continue to undertake efforts, including legal proceedings, to obtain reimbursement from various sources, including subcontractors, suppliers and their insurers, for the costs we have incurred or expect to incur to investigate and complete repairs and to defend ourselves in litigation. Given uncertainties in the potential outcomes of these efforts, we have not recorded any amounts for potential future recoveries as of November 30, 2013.
Overall Warranty Liability Assessment
.
In assessing our overall warranty liability at a reporting date, we evaluate the costs for warranty-related items on a combined basis for all of our previously delivered homes that are under our limited warranty program, which would include any such homes in central and southwest Florida that have been identified as having water intrusion-related issues and similarly affected homes in central and southwest Florida that we believe are likely to be identified in the future. In 2013, based on our assessment of our overall warranty liability, we recorded adjustments to increase our warranty liability by
$32.0
million with a corresponding charge to construction and land costs in our consolidated statements of operations. The adjustments reflected the remaining estimated repair costs associated with homes in central and southwest Florida that have been identified as having water intrusion-related issues and the estimated repair costs associated with similarly affected homes in central and southwest Florida that we believe are likely to be identified in the future, net of estimated probable recoveries of such repair costs and other adjustments.
These adjustments, which were made in each quarter of 2013 as our assessment process continued and we gained more experience and knowledge of the scope and nature of the water intrusion-related issues and the associated repair efforts and costs, were largely related to
one
attached-home community in Florida. At this particular community, we determined in each of the third and fourth quarters of 2013 that additional significant and previously unanticipated repair work would need to be undertaken, and that the costs for certain items, including framing material and labor, stucco and windows, would be substantially higher than previously expected. The adjustments we made in 2013 also reflected the identification of
687
additional affected homes at other communities in central and southwest Florida, and our estimate of the total number of affected homes that we believe are likely to be identified in the future.
Depending on the number of additional affected homes in central and southwest Florida that are identified as having water intrusion-related issues, and the actual costs we incur in future periods to repair identified affected homes, our estimate of costs to repair similarly affected homes in central and southwest Florida that we believe are likely be identified in the future, and/or actual or estimated costs to repair homes affected by other issues, including costs to provide affected homeowners with temporary housing, we may revise the amount of our estimated liability, which could result in an increase or decrease in our overall warranty liability. Based on our investigation of these water intrusion-related issues, we believe that our warranty liability is adequate to cover the estimated probable total repair costs on these affected homes, similarly affected homes that we believe are likely to be identified in the future and homes affected by other issues, though we believe it is reasonably possible that our loss associated with water intrusion-related issues could exceed the amount accrued as of November 30, 2013 by up to
$6 million
.
In 2012 and 2011, notwithstanding our actual or estimated remaining repair costs related to the allegedly defective drywall material and water intrusion-related issues, we had experienced favorable trends in our actual warranty costs incurred for the previous several years with respect to claims relating to other warranty-related items, reflecting, among other things, our ongoing focus on construction quality and customer service. Based on our assessments of these and other relevant factors on a combined basis,
we determined that our overall warranty liability at the end of each year was sufficient to cover our overall warranty obligations on previously delivered homes that are under our limited warranty program.
Additionally,
based on our assessment of the trends in our warranty claims experience, and taking into account the decrease in the overall number of homes we had delivered over the
96
past several years before 2012 and the steady reduction in our estimated remaining repair costs and actual repair costs incurred for homes identified as affected or potentially affected by the allegedly defective drywall,
we recorded favorable warranty adjustments of
$11.2 million
in 2012 and
$7.4 million
in 2011 as reductions to construction and land costs in our consolidated statements of operations in those periods. However, as of November 30, 2012, based on our assessment of our overall warranty liability on a combined basis for all of our previously delivered homes that were under our limited warranty, including the homes identified as affected or potentially affected by the allegedly defective drywall and the increased number of homes potentially affected by water intrusion-related issues, we recorded an adjustment to increase our overall warranty liability by
$2.6 million
in the fourth quarter of 2012 with a corresponding charge to construction and land costs in our consolidated statements of operations.
Guarantees.
In the normal course of our business, we issue certain representations, warranties and guarantees related to our home sales and land sales that may be affected by Accounting Standards Codification Topic No. 460, “Guarantees.” Based on historical evidence, we do not believe any potential liability with respect to these representations, warranties or guarantees would be material to our consolidated financial statements.
Self-Insurance.
W
e maintain, and require the majority of our subcontractors to maintain, general liability insurance (including construction defect and bodily injury coverage) and workers’ compensation insurance. These insurance policies protect us against a portion of our risk of loss from claims related to our homebuilding activities, subject to certain self-insured retentions, deductibles and other coverage limits.
We self-insure a portion of our overall risk through the use of a captive insurance subsidiary. We also maintain certain other insurance policies.
In Arizona, California, Colorado and Nevada, our subcontractors’ general liability insurance primarily takes the form of a wrap-up policy, where eligible subcontractors are enrolled as insureds on each project. Enrolled subcontractors contribute toward the cost of the insurance and agree to pay a contractual amount in the future in the event of a claim related to their work.
For those enrolled subcontractors, we absorb their general liability associated with the work performed on our homes within the applicable projects as part of our overall general liability insurance and our self-insurance through our captive insurance subsidiary.
We record expenses and liabilities based on the estimated costs required to cover our self-insured retention and deductible amounts under our insurance policies, and the estimated costs of potential claims and claim adjustment expenses that are above our coverage limits or that are not covered by our insurance policies. These estimated costs are based on an analysis of our historical claims and industry data, and include an estimate of construction defect claims incurred but not yet reported.
We engage a third-party actuary that uses our historical claim and expense data, as well as industry data, to estimate our liabilities related to unpaid claims, claim adjustment expenses, third-party recoveries and incurred but not yet reported claims for the risks that we are assuming under our self-insurance.
These estimates are subject to uncertainty due to a variety of factors, the most significant being the long period of time between the delivery of a home to a homebuyer and when a structural warranty or construction defect claim is made, and the ultimate resolution of the construction defect claim. Though state regulations vary, construction defect claims are reported and resolved over a prolonged period of time, which can extend for 10 years or longer. As a result, the majority of the estimated liability relates to incurred but not yet reported claims. Because the majority of our estimated liabilities relate to incurred but not yet reported claims, adjustments related to individual existing claims generally do not significantly impact the overall estimated liability. Adjustments to our liabilities related to homes delivered in prior years are recorded in the period in which a change in our estimate occurs.
The changes in our self-insurance liability are as follows (in thousands):
|
|
Years Ended November 30,
|
||||||||||
|
|
2013
|
2012
|
2011
|
||||||||
|
Balance at beginning of year
|
$
|
93,349
|
|
$
|
94,823
|
|
$
|
95,665
|
|
||
|
Self-insurance expense (a)
|
8,239
|
|
7,894
|
|
7,220
|
|
|||||
|
Payments, net of recoveries (b)
|
(9,374
|
)
|
(10,168
|
)
|
(8,062
|
)
|
|||||
|
Adjustments
|
—
|
|
800
|
|
—
|
|
|||||
|
Balance at end of year
|
$
|
92,214
|
|
$
|
93,349
|
|
$
|
94,823
|
|
||
|
(a)
|
These expenses are included in selling, general and administrative expenses and largely offset by contributions from subcontractors participating in the wrap-up policy.
|
|
(b)
|
Recoveries are reflected at the time we receive funds from subcontractors and/or their insurers.
|
The projection of losses related to these liabilities requires actuarial assumptions that are subject to variability due to uncertainties regarding construction defect claims relative to our markets and the types of product we build, insurance industry practices and legal or regulatory interpretations, among other factors. Key assumptions used in these estimates include claim
97
frequencies, severities and settlement patterns, which can occur over an extended period of time.
In addition, changes in the frequency and severity of reported claims and the estimates to settle claims can impact the trends and assumptions used in the actuarial analysis, which could be material to our consolidated financial statements.
Due to the degree of judgment required and the potential for variability in these underlying assumptions, our actual future costs could differ from those estimated
.
Performance Bonds and Letters of Credit.
We
are often required to provide to various municipalities and other government agencies performance bonds and/or letters of credit to secure the completion of our projects and/or in support of obligations to build community improvements such as roads, sewers, water systems and other utilities, and to support similar development activities by certain of our unconsolidated joint ventures.
At
November 30, 2013
, we had
$410.8 million
of performance bonds and
$41.5 million
of letters of credit outstanding. At
November 30, 2012
, we had
$286.1 million
of performance bonds and
$41.9 million
of letters of credit outstanding.
If any such performance bonds or letters of credit are called, we would be obligated to reimburse the issuer of the performance bond or letter of credit. We do not believe that a material amount of any currently outstanding performance bonds or letters of credit will be called. Performance bonds do not have stated expiration dates. Rather, we are released from the performance bonds as the underlying performance is completed. The expiration dates of some letters of credit issued in connection with community improvements coincide with the expected completion dates of the related projects or obligations. Most letters of credit, however, are issued with an initial term of one year and are typically extended on a year-to-year basis until the related performance obligations are completed.
Land Option Contracts.
In the ordinary course of business, we enter into land option contracts and other similar contracts to acquire rights to land for the construction of homes. At
November 30, 2013
, we had total deposits of
$41.7 million
, comprised of
$41.6 million
of cash deposits and
$.1 million
of letters of credit, to purchase land having an aggregate purchase price of
$1.15 billion
. Our land option contracts and other similar contracts generally do not contain provisions requiring our specific performance.
Leases.
We lease certain property and equipment under noncancelable operating leases. Office and equipment leases are typically for terms of
three
to
five
years and generally provide renewal options for terms up to an additional
five years
. In most cases, we expect that leases that expire will be renewed or replaced by other leases with similar terms. The future minimum rental payments under operating leases, which primarily consist of office leases having initial or remaining noncancelable lease terms in excess of
one year
, are as follows (in thousands):
|
Years Ending November 30,
|
||||
|
2014
|
$
|
7,158
|
|
|
|
2015
|
5,276
|
|
||
|
2016
|
3,224
|
|
||
|
2017
|
1,649
|
|
||
|
2018
|
1,098
|
|
||
|
Thereafter
|
387
|
|
||
|
Total minimum lease payments
|
$
|
18,792
|
|
|
Rental expense on our operating leases was
$6.5 million
in
2013
,
$5.5 million
in
2012
and
$6.7 million
in
2011
.
|
Note 16.
|
Legal Matters
|
Nevada Development Contract Litigation.
KB Nevada is a defendant in a case in the Eighth Judicial District Court in Clark County, Nevada
entitled
Las Vegas Development Associates, LLC, Essex Real Estate Partners, LLC, et al. v. KB HOME Nevada Inc.
In 2007, LVDA agreed to purchase from KB Nevada approximately
83
acres of land located near Las Vegas, Nevada. LVDA subsequently assigned its rights to Essex.
KB Nevada and Essex entered into a development agreement relating to certain major infrastructure improvements. LVDA’s and Essex’s complaint, initially filed in 2008, alleged that KB Nevada breached the development agreement, and also alleged that KB Nevada fraudulently induced them to enter into the purchase and development agreements. LVDA’s and Essex’s lenders subsequently filed related actions that were consolidated into the LVDA/Essex matter. The consolidated plaintiffs sought rescission of the agreements or, in the alternative, compensatory damages of
$55 million
plus the Claimed Damages.
KB Nevada has denied the allegations, and believes it has meritorious defenses to the consolidated plaintiffs’ claims. At a November 19, 2012 hearing, the court denied all of the consolidated plaintiffs’ motions for summary judgment on their claims. In addition, the court granted several of KB Nevada's motions for summary judgment, eliminating, among other of the consolidated plaintiffs’ claims, all claims for fraud, negligent misrepresentation, and punitive damages. With the court’s decisions, the only remaining claims against KB Nevada are for contract damages and rescission. In August 2013, the court granted motions that further narrowed the scope of the Claimed Damages. While the ultimate outcome is uncertain — we believe it is
98
reasonably possible that the loss in this matter could range from
zero
to approximately
$55 million
plus pre-judgment interest, which could be material to our consolidated financial statements — KB Nevada believes it will be successful in defending against the consolidated plaintiffs’ remaining claims and that the consolidated plaintiffs will not be awarded rescission or damages. The non-jury trial, originally set for September 2012, was recently continued again until May 20, 2014.
Southern California Project Development Case.
On December 27, 2011, the jury in a case entitled
Estancia Coastal, LLC v. KB HOME Coastal Inc. et al.
returned a verdict against KB HOME Coastal Inc., a wholly owned subsidiary of ours, and us for
$9.8 million
, excluding legal fees and interest. The case related to a land option contract and a construction agreement between KB HOME Coastal Inc. and the plaintiff. Based on pre-trial analysis, the verdict was not expected, and we and KB HOME Coastal Inc. jointly filed a motion for judgment notwithstanding the verdict and a motion for a new trial, which were heard on May 18, 2012. On May 23, 2012, the trial court denied the motions and on June 4, 2012 entered a judgment in favor of the plaintiff in the amount of
$9.2 million
plus pre-judgment interest of approximately
$.9 million
. The judgment entered reflects an earlier payment by us to the plaintiff of a portion of the jury’s award and does not include legal fees and costs and post-judgment interest. We had established an accrual for this matter based on our pre-judgment estimate of the probable loss. However, as a result of the trial court’s decision and probable legal fees and costs award, we recorded a charge of
$8.8 million
in 2012 to increase the accrual for this matter to
$11.7 million
. On September 14, 2012, following a hearing, the trial court awarded legal fees and costs to the plaintiff of approximately
$1.4 million
. In 2013, we recorded charges of
$1.2 million
to reflect additional post-judgment interest and made a partial payment of
$3.0 million
, which reduced our accrual for this matter. On December 16, 2013, an appeals court reversed, in part, the decision of the trial court. In accordance with Accounting Standards Codification Topic No. 855, “Subsequent Events,” we reflected this decision in our 2013 financial statements by reversing
$8.2 million
of the previously established accrual, bringing our accrual balance for this matter to
$1.7 million
as of November 30, 2013. The charges recorded in 2013 and 2012 and the reversal recorded in 2013 were included in selling, general and administrative expenses in our consolidated statements of operations. Our accrual at November 30, 2013 reflects our view of the probable outcome based on the current state of the judgment in the matter.
Other Matters.
In addition to the specific proceedings described above,
we are involved in other litigation and regulatory proceedings incidental to our business that are in various procedural stages. We believe that the accruals we have recorded for probable and reasonably estimable losses with respect to these proceedings are adequate and that,
as of November 30, 2013,
it was not reasonably possible that an additional material loss had been incurred in an amount in excess of the estimated amounts already recognized on our consolidated financial statements. We evaluate our accruals for litigation and regulatory proceedings at least quarterly and, as appropriate, adjust them to reflect (a) the facts and circumstances known to us at the time, including information regarding negotiations, settlements, rulings and other relevant events and developments; (b) the advice and analyses of counsel; and (c) the assumptions and judgment of management. Similar factors and considerations are used in establishing new accruals for proceedings as to which losses have become probable and reasonably estimable at the time an evaluation is made. Based on our experience, we believe that the amounts that may be claimed or alleged against us in these proceedings are not a meaningful indicator of our potential liability. The outcome of any of these proceedings, including the defense and other litigation-related costs and expenses we may incur, however, is inherently uncertain and could differ significantly from the estimate reflected in a related accrual, if made. Therefore, it is possible that the ultimate outcome of any proceeding, if in excess of a related accrual or if no accrual had been made, could be material to our consolidated financial statements.
|
Note 17.
|
Stockholders’ Equity
|
Preferred Stock.
To help protect the benefits of our NOL, built-in losses and tax credits from the impact of an ownership change under Section 382, on January 22, 2009, we adopted a Rights Agreement between us and Computershare Shareowner Services LLC (successor to Mellon Investor Services LLC), as rights agent, dated as of that date (the “2009 Rights Agreement”), and we declared a dividend distribution of one preferred share purchase right for each outstanding share of common stock that was payable to stockholders of record as of the close of business on March 5, 2009. Subject to the terms, provisions and conditions of the 2009 Rights Agreement, if these rights become exercisable, each right would initially represent the right to purchase from us 1/100th of a share of our Series A Participating Cumulative Preferred Stock for a purchase price of
$85.00
(the “Purchase Price”). If issued, each fractional share of preferred stock would generally give a stockholder approximately the same dividend, voting and liquidation rights as does one share of our common stock. However, prior to exercise, a right does not give its holder any rights as a stockholder, including without limitation any dividend, voting or liquidation rights. The rights will not be exercisable until the earlier of (a)
10
calendar days after a public announcement by us that a person or group has become an Acquiring Person (as defined under the 2009 Rights Agreement) and (b)
10
business days after the commencement of a tender or exchange offer by a person or group if upon consummation of the offer the person or group would beneficially own
4.9%
or more of our outstanding common stock.
Until these rights become exercisable (the “Distribution Date”), common stock certificates will evidence the rights and may contain a notation to that effect. Any transfer of shares of our common stock prior to the Distribution Date will constitute a transfer
99
of the associated rights. After the Distribution Date, the rights may be transferred other than in connection with the transfer of the underlying shares of our common stock. If there is an Acquiring Person on the Distribution Date or a person or group becomes an Acquiring Person after the Distribution Date, each holder of a right, other than rights that are or were beneficially owned by an Acquiring Person, which will be void, will thereafter have the right to receive upon exercise of a right and payment of the Purchase Price, that number of shares of our common stock having a market value of two times the Purchase Price. After the later of the Distribution Date and the time we publicly announce that an Acquiring Person has become such, our board of directors may exchange the rights, other than rights that are or were beneficially owned by an Acquiring Person, which will be void, in whole or in part, at an exchange ratio of one share of common stock per right, subject to adjustment.
At any time prior to the later of the Distribution Date and the time we publicly announce that an Acquiring Person becomes such, our board of directors may redeem all of the then-outstanding rights in whole, but not in part, at a price of
$.001
per right, subject to adjustment (the “Redemption Price”). The redemption will be effective immediately upon the board of directors’ action, unless the action provides that such redemption will be effective at a subsequent time or upon the occurrence or nonoccurrence of one or more specified events, in which case the redemption will be effective in accordance with the provisions of the action. Immediately upon the effectiveness of the redemption of the rights, the right to exercise the rights will terminate and the only right of the holders of rights will be to receive the Redemption Price, with interest thereon. The rights issued pursuant to the 2009 Rights Agreement will expire on the earliest of (a) the close of business on March 5, 2019, (b) the time at which the rights are redeemed, (c) the time at which the rights are exchanged, (d) the time at which our board of directors determines that a related provision in our Restated Certificate of Incorporation is no longer necessary, and (e) the close of business on the first day of a taxable year of ours to which our board of directors determines that no tax benefits may be carried forward. At our annual meeting of stockholders on April 2, 2009, our stockholders approved the 2009 Rights Agreement.
Common Stock.
On January 29, 2013, pursuant to the 2011 Shelf Registration, we issued
6,325,000
shares of our common stock, par value
$1.00
per share, in an underwritten public offering at a price of
$18.25
per share. We used
6,325,000
shares of treasury stock for the issuance and received net proceeds of
$109.5 million
after underwriting discounts, commissions and transaction expenses.
In connection with the issuance of the 1.375% Convertible Senior Notes due 2019, which is discussed in Note 13. Mortgages and Notes Payable, we established a common stock reserve account with our transfer agent to reserve the maximum number of shares of our common stock potentially deliverable upon conversion to holders of the 1.375% Convertible Senior Notes due 2019 based on the terms of the instruments governing these notes. Accordingly, the common stock reserve account had a balance of
12,602,735
shares at November 30, 2013. The maximum number of shares would potentially be deliverable to holders only in certain limited circumstances as set forth in the instruments governing the 1.375% Convertible Senior Notes due 2019.
Effective July 18, 2013, our board of directors amended the Director Plan to provide directors with a one-time opportunity to irrevocably elect to receive an equivalent value of shares of our common stock in lieu of the cash payments that are otherwise due upon the settlement of their outstanding stock units under the terms of the Director Plan. At that date, there were a total of
481,554
outstanding stock units. Concurrent with the amendment of the Director Plan, our board of directors authorized the repurchase of no more than
482,000
shares of our common stock solely as necessary for director elections in respect of outstanding stock units. During the 2013 third quarter, following the amendment of the Director Plan, directors made irrevocable elections to receive an aggregate of
478,294
shares of our common stock upon the respective settlement of their outstanding stock units, and we repurchased through open market transactions such shares pursuant to the authorization at an aggregate price of
$7.9 million
. We do not anticipate any additional repurchases of our common stock pursuant to this board of directors authorization. The repurchased shares were apportioned to directors per their respective elections, and the shares are subject to transfer restrictions to the directors until the respective settlement of their applicable outstanding stock units, which, in most cases, will occur upon their leaving the board of directors. The director elections changed only the method of settlement of the outstanding stock units and did not change any of the other terms of these awards or impact the value to the directors. As a result of the directors’ elections, the relevant outstanding stock units became stock-settled awards, which are accounted for as equity awards, instead of cash-settled liability awards, thereby reducing the degree of variability in the expense associated with such stock units in future quarters.
As of November 30, 2013, we were authorized to repurchase
4,000,000
shares of our common stock under a board-approved share repurchase program.
We did not repurchase any of our common stock under this program in 2013, 2012 or 2011. Any resumption of such stock repurchases under this program or any other program will be at the discretion of our board of directors.
Our board of directors declared four quarterly cash dividends of
$.0250
per share of common stock in 2013. During 2012, our board of directors declared a cash dividend of
$.0625
per share of common stock in the first quarter and quarterly dividends of
$.0250
per share of common stock in each of the second, third and fourth quarters.
During 2011, o
ur board of directors declared four quarterly cash dividends of
$.0625
per share of common stock
. All dividends declared during 2013, 2012 and 2011 were also paid during those years.
100
Treasury Stock.
We acquired
$8.5 million
and
$1.8 million
of our common stock in 2013 and 2012, respectively. The common stock acquired in 2013 was primarily related to director elections in respect of outstanding stock units under the Director Plan, as described above. In addition, a portion of the common stock acquired in 2013 and all of the common stock acquired in 2012 consisted of previously issued shares delivered to us by employees to satisfy their withholding tax obligations on the vesting of restricted stock awards or of forfeitures of previous restricted stock awards. We did not acquire any shares of our common stock in 2011. Treasury stock is recorded at cost. Differences between the cost of treasury stock and the reissuance proceeds are recorded to paid-in capital. These transactions are not considered repurchases under the share repurchase program.
|
Note 18.
|
Accumulated Other Comprehensive Loss
|
The following table presents the changes in the balances of each component of accumulated other comprehensive loss (in thousands):
|
Postretirement Benefit Plan Adjustments
|
Total Accumulated Other Comprehensive Loss
|
||||
|
Balance at November 30, 2011
|
$
|
(26,152
|
)
|
||
|
Other comprehensive loss before reclassifications
|
(4,765
|
)
|
|||
|
Amounts reclassified from accumulated other comprehensive loss
|
2,959
|
|
|||
|
Net current-period other comprehensive loss
|
(1,806
|
)
|
|||
|
Balance at November 30, 2012
|
(27,958
|
)
|
|||
|
Other comprehensive income before reclassifications
|
7,083
|
|
|||
|
Amounts reclassified from accumulated other comprehensive loss
|
3,359
|
|
|||
|
Net current-period other comprehensive income
|
10,442
|
|
|||
|
Balance at November 30, 2013
|
$
|
(17,516
|
)
|
||
The amounts presented in the table above do not include an income tax benefit or expense as any such impacts were fully offset by deferred tax asset valuation allowances recorded in 2013 and 2012.
The amounts reclassified from accumulated other comprehensive loss consisted of the following (in thousands):
|
Years Ended November 30,
|
||||||||||||
|
Details About Accumulated Other Comprehensive Loss Components
|
2013
|
2012
|
2011
|
|||||||||
|
Postretirement benefit plan adjustments
|
||||||||||||
|
Amortization of net actuarial loss
|
$
|
1,803
|
|
$
|
1,403
|
|
$
|
595
|
|
|||
|
Amortization of prior service cost
|
1,556
|
|
1,556
|
|
1,556
|
|
||||||
|
Total reclassifications (a)
|
$
|
3,359
|
|
$
|
2,959
|
|
$
|
2,151
|
|
|||
|
(a)
|
The accumulated other comprehensive loss components are included in the computation of net periodic benefit costs as further discussed in Note 20. Postretirement Benefits.
|
The estimated net actuarial loss and prior service cost expected to be amortized from accumulated other comprehensive loss into net periodic benefit cost during 2014 are
$.4 million
and
$1.6 million
, respectively.
|
Note 19.
|
Employee Benefit and Stock Plans
|
Most of our employees are eligible to participate in the KB Home 401(k) Savings Plan (the “401(k) Plan”) under which contributions by employees are partially matched by us. The aggregate cost of the 401(k) Plan to us was
$3.5 million
in
2013
,
$2.6 million
in
2012
and
$2.8 million
in
2011
. The assets of the 401(k) Plan are held by a third-party trustee. The 401(k) Plan participants may direct the investment of their funds among one or more of the several fund options offered by the 401(k) Plan. Effective May 9, 2013, our common stock has been one of the investment choices available to participants. Prior to May 9, 2013, a fund composed of units that reflected the market value of our common stock was one of the investment choices available to participants. As of
November 30, 2013
,
2012
and
2011
, approximately
7%
,
7%
and
4%
, respectively, of the 401(k) Plan’s net
101
assets were invested in our common stock or in the former unitized fund that reflected the market value of our common stock, as applicable.
At our Annual Meeting of Stockholders held on April 1, 2010, our stockholders approved the KB Home 2010 Equity Incentive Plan (the “2010 Plan”), authorizing, among other things, the issuance of up to
3,500,000
shares of our common stock for grants of stock-based awards to our employees, non-employee directors and consultants. This pool of shares includes all of the shares that were available for grant as of April 1, 2010 under our 2001 Stock Incentive Plan, under which no new awards may be made. As a result, since April 1, 2010, the 2010 Plan has been our only active equity compensation plan. Under the 2010 Plan, grants of stock options and other similar awards reduce the 2010 Plan’s share capacity on a
1
-for-
1
basis, and grants of restricted stock and other similar “full value” awards reduce the 2010 Plan’s share capacity on a
1.78
-for-
1
basis. In addition, subject to the 2010 Plan’s terms and conditions, a stock-based award may also be granted under the 2010 Plan to replace an outstanding award granted under another of our plans (subject to the terms of such other plan) with terms substantially identical to those of the award being replaced.
At our Annual Meeting of Stockholders held on April 7, 2011, our stockholders approved an amendment to the 2010 Plan to increase the number of shares of our common stock that may be issued under the 2010 Plan by an additional
4,000,000
shares.
The 2010 Plan provides that stock options, performance stock, restricted stock and stock units may be awarded for periods of up to
10 years
. The 2010 Plan also enables us to grant cash bonuses, SARs and other stock-based awards. As of November 30, 2013, 2012 and 2011, in addition to awards outstanding under the 2010 Plan, we had awards outstanding under our Amended and Restated 1999 Incentive Plan (the “1999 Plan”), which provided for generally the same types of awards as the 2010 Plan. We also had awards outstanding under our Performance-Based Incentive Plan for Senior Management, which provided for generally the same types of awards as the 2010 Plan, but stock option awards granted under this plan had terms of up to
15 years
. In addition, as of November 2012 and 2011, we had awards outstanding under our 1988 Employee Stock Plan, which provided for generally the same types of awards as the 2010 Plan, but stock option awards granted under this plan had terms of up to
15 years
.
Stock Options.
Stock option transactions are summarized as follows:
|
|
Years Ended November 30,
|
|||||||||||||||||||
|
|
2013
|
2012
|
2011
|
|||||||||||||||||
|
|
Options
|
Weighted
Average
Exercise
Price
|
Options
|
Weighted
Average
Exercise
Price
|
Options
|
Weighted
Average
Exercise
Price
|
||||||||||||||
|
Options outstanding at beginning of year
|
10,105,546
|
|
$
|
21.27
|
|
10,160,396
|
|
$
|
21.27
|
|
8,798,613
|
|
$
|
24.19
|
|
|||||
|
Granted
|
550,000
|
|
16.63
|
|
30,000
|
|
9.08
|
|
1,716,000
|
|
6.36
|
|
||||||||
|
Exercised
|
(118,208
|
)
|
13.46
|
|
(7,494
|
)
|
13.93
|
|
—
|
|
—
|
|
||||||||
|
Cancelled
|
(5,400
|
)
|
24.24
|
|
(77,356
|
)
|
17.96
|
|
(354,217
|
)
|
21.47
|
|
||||||||
|
Options outstanding at end of year
|
10,531,938
|
|
$
|
21.11
|
|
10,105,546
|
|
$
|
21.27
|
|
10,160,396
|
|
$
|
21.27
|
|
|||||
|
Options exercisable at end of year
|
9,414,935
|
|
$
|
22.26
|
|
8,533,224
|
|
$
|
23.76
|
|
7,142,568
|
|
$
|
26.43
|
|
|||||
|
Options available for grant at end of year
|
746,043
|
|
1,721,847
|
|
2,477,219
|
|
||||||||||||||
The total intrinsic value of stock options exercised was
$1.2 million
for the year ended
November 30, 2013
and less than
$.1 million
for the year ended November 30, 2012. There were
no
stock options exercised during the year ended November 30, 2011. The aggregate intrinsic value of stock options outstanding was
$32.3 million
,
$18.2 million
and
$1.7 million
at
November 30, 2013
,
2012
and
2011
, respectively. The intrinsic value of stock options exercisable was
$25.5 million
at
November 30, 2013
and
$7.8 million
at November 30,
2012
. Stock options exercisable had
no
intrinsic value at
November 30, 2011
. The intrinsic value of a stock option is the amount by which the market value of the underlying stock exceeds the price of the option.
On October 6, 2011, our president and chief executive officer was granted an award of performance-based stock options to purchase an aggregate of
365,000
shares of our common stock at the purchase price of
$6.32
per share. The performance-based stock options shall vest and become exercisable if there is a determination by the management development and compensation committee of our board of directors that the applicable performance goal, as set forth in the applicable performance option agreement, has been satisfied and our president and chief executive officer does not experience a termination of service prior to the applicable dates described in that agreement. In January 2013, the management development and compensation committee determined that the performance component was satisfied; therefore, the full amount of options will vest and become exercisable
102
once the required service component is completed. In accordance with ASC 718, we used the Black-Scholes option-pricing model to estimate the grant date fair value per performance-based stock option of
$2.54
.
On October 7, 2010, our president and chief executive officer was granted an award of performance-based stock options to purchase an aggregate of
260,000
shares of our common stock at the purchase price of
$11.06
per share. The performance-based stock options shall vest and become exercisable if there is a determination by the management development and compensation committee of our board of directors that the applicable performance goal, as set forth in the applicable performance option agreement, has been satisfied and our president and chief executive officer does not experience a termination of service prior to the applicable dates described in that agreement. In accordance with ASC 718, we used the Black-Scholes option-pricing model to estimate the grant date fair value per performance-based stock option of
$4.59
.
Stock options outstanding and stock options exercisable at
November 30, 2013
are as follows:
|
|
Options Outstanding
|
Options Exercisable
|
||||||||||||||||||
|
Range of Exercise Price
|
Options
|
Weighted
Average
Exercise
Price
|
Weighted
Average
Remaining
Contractual
Life
|
Options
|
Weighted
Average
Exercise
Price
|
Weighted
Average
Remaining
Contractual
Life
|
||||||||||||||
|
$ 6.32 to $10.54
|
1,693,165
|
|
$
|
6.43
|
|
7.8
|
|
1,126,162
|
|
$
|
6.42
|
|
||||||||
|
$10.55 to $14.96
|
1,968,424
|
|
12.09
|
|
5.6
|
|
1,968,424
|
|
12.09
|
|
||||||||||
|
$14.97 to $20.08
|
2,717,523
|
|
17.47
|
|
6.2
|
|
2,167,523
|
|
17.68
|
|
||||||||||
|
$20.09 to $33.92
|
2,019,721
|
|
27.36
|
|
4.1
|
|
2,019,721
|
|
27.36
|
|
||||||||||
|
$33.93 to $69.63
|
2,133,105
|
|
39.81
|
|
4.4
|
|
2,133,105
|
|
39.81
|
|
||||||||||
|
$ 6.32 to $69.63
|
10,531,938
|
|
$
|
21.11
|
|
5.6
|
|
9,414,935
|
|
$
|
22.26
|
|
5.2
|
|
||||||
The weighted average grant date fair value of stock options granted in
2013
,
2012
and
2011
was
$6.96
,
$4.18
and
$2.56
, respectively. The fair value of each stock option grant is estimated on the date of grant using the Black-Scholes option-pricing model with the following assumptions:
|
|
Years Ended November 30,
|
|||||||
|
|
2013
|
2012
|
2011
|
|||||
|
Risk-free interest rate
|
1.3
|
%
|
.7
|
%
|
.9
|
%
|
||
|
Expected volatility factor
|
52.3
|
%
|
65.6
|
%
|
65.6
|
%
|
||
|
Expected dividend yield
|
.6
|
%
|
1.9
|
%
|
3.9
|
%
|
||
|
Expected term
|
5 years
|
|
5 years
|
|
5 years
|
|
||
The risk-free interest rate assumption is determined based on observed interest rates appropriate for the expected term of our stock options. The expected volatility factor is based on a combination of the historical volatility of our common stock and the implied volatility of publicly traded options on our stock. The expected dividend yield assumption is based on our history of dividend payouts. The expected term of employee stock options is estimated using historical data.
Our stock-based compensation expense related to stock option grants was
$2.3 million
in
2013
,
$5.0 million
in
2012
and
$5.9 million
in
2011
. As of
November 30, 2013
, there was
$3.4 million
of total unrecognized stock-based compensation expense related to unvested stock option awards. This expense is expected to be recognized over a weighted average period of
1.8
years.
We record proceeds from the exercise of stock options as additions to common stock and paid-in capital. The tax shortfalls of
$.7 million
in
2013
,
$.3 million
in
2012
and
$1.0 million
in
2011
resulting from the cancellation of stock awards were reflected in paid-in capital. In 2013, 2012 and 2011, in accordance with the cash flow classification requirements of ASC 718, the consolidated statement of cash flows reflected
no
excess tax benefit associated with the exercise of stock options.
Other Stock-Based Awards.
From time to time, we grant restricted stock to various employees as a compensation benefit. During the restriction periods, these employees are entitled to vote and to receive cash dividends on such shares. The restrictions imposed with respect to the shares granted generally lapse over periods of
three
years if certain conditions are met.
103
Restricted stock transactions are summarized as follows:
|
|
Years Ended November 30,
|
|||||||||||||||||||
|
|
2013
|
2012
|
2011
|
|||||||||||||||||
|
|
Shares
|
Weighted
Average
per Share
Grant Date
Fair Value
|
Shares
|
Weighted
Average
per Share
Grant Date
Fair Value
|
Shares
|
Weighted
Average
per Share
Grant Date
Fair Value
|
||||||||||||||
|
Outstanding at beginning of year
|
229,724
|
|
$
|
15.81
|
|
338,912
|
|
$
|
15.03
|
|
402,477
|
|
$
|
15.09
|
|
|||||
|
Granted
|
88,000
|
|
17.50
|
|
207,617
|
|
16.23
|
|
—
|
|
—
|
|
||||||||
|
Vested
|
(91,312
|
)
|
15.18
|
|
(176,135
|
)
|
14.25
|
|
(10,930
|
)
|
13.49
|
|
||||||||
|
Cancelled
|
(6,784
|
)
|
17.24
|
|
(140,670
|
)
|
15.44
|
|
(52,635
|
)
|
15.44
|
|
||||||||
|
Outstanding at end of year
|
219,628
|
|
$
|
16.23
|
|
229,724
|
|
$
|
15.81
|
|
338,912
|
|
$
|
15.03
|
|
|||||
As of November 30, 2013, we had
$3.5 million
of total unrecognized compensation cost related to restricted stock awards that will be recognized over a weighted average period of approximately
three
years.
On October 10, 2013, we granted PSUs to certain employees. Each PSU grant corresponds to a target amount of our common stock (the “Award Shares”). Each PSU entitles the recipient to receive a grant of between
0%
and
200%
of the recipient’s Award Shares, and will vest based on our achieving, over a
three
-year period commencing on December 1, 2013 and ending on November 30, 2016, specified levels of (a) average return on equity performance and (b) revenue growth relative to a peer group of high-production public homebuilding companies, subject to the recipient’s continued employment with us through and including the date on which the management development and compensation committee of our board of directors determines performance for each of the measures. The grant date fair value of each such PSU was
$16.63
.
On November 8, 2012, we granted PSUs to certain employees. Each PSU grant corresponds to a target amount of Award Shares. Each PSU entitles the recipient to receive a grant of between
0%
and
200%
of the recipient’s Award Shares, and will vest based on our achieving, over a
three
-year performance period commencing on December 1, 2012 and ending on November 30, 2015, specified levels of (a) average return on equity performance and (b) revenue growth relative to a peer group of high-production public homebuilding companies, subject to the recipient’s continued employment with us through and including the date on which the management development and compensation committee of our board of directors determines performance for each of the measures. The grant date fair value of each such PSU was
$16.23
.
PSU transactions are summarized as follows:
|
|
Years Ended November 30,
|
||||||||||||
|
|
2013
|
2012
|
|||||||||||
|
|
Shares
|
Weighted
Average
per Share
Grant Date
Fair Value
|
Shares
|
Weighted
Average
per Share
Grant Date
Fair Value
|
|||||||||
|
Outstanding at beginning of year
|
227,049
|
|
$
|
16.23
|
|
—
|
|
$
|
—
|
|
|||
|
Granted
|
158,000
|
|
16.63
|
|
227,049
|
|
16.23
|
|
|||||
|
Vested
|
—
|
|
—
|
|
—
|
|
—
|
|
|||||
|
Cancelled
|
—
|
|
—
|
|
—
|
|
—
|
|
|||||
|
Outstanding at end of year
|
385,049
|
|
$
|
16.39
|
|
227,049
|
|
$
|
16.23
|
|
|||
The number of shares of our common stock actually granted to a recipient, if any, when a PSU vests will depend on the degree of achievement of the applicable performance measures during the applicable three-year performance period. The PSUs have no dividend or voting rights during the performance period. Compensation cost for PSUs is initially estimated based on target performance achievement and adjusted as appropriate throughout the performance period. Accordingly, future compensation costs associated with outstanding PSUs may increase or decrease based on the probability of our achievement with respect to the applicable performance measures. At November 30, 2013, we had
$7.3 million
of total unrecognized compensation cost related to unvested PSUs, which is expected to be recognized over a weighted-average period of approximately
three
years.
104
In 2009 and 2008, we granted phantom shares to various employees. In 2008, we also granted SARs to various employees. These cash-settled awards have been accounted for as liabilities in our consolidated financial statements. Each phantom share represented the right to receive a cash payment equal to the closing price of our common stock on the applicable vesting date. Each SAR represents a right to receive a cash payment equal to the positive difference, if any, between the grant price and the market value of a share of our common stock on the date of exercise. The phantom shares vested in full at the end of
three years
, while the SARs vested in equal annual installments over
three years
. There were
no
phantom shares outstanding as of November 30, 2013 and 2012, and
5,556
phantom shares outstanding as of November 30, 2011. At November 30, 2013 and 2012, we had
29,939
SARs outstanding, which are fully vested and will expire in July 2017.
We recognized total compensation expense of
$3.4 million
in
2013
,
$1.7 million
in
2012
and
$1.2 million
in
2011
related to restricted stock, PSUs, phantom shares and SARs.
Grantor Stock Ownership Trust.
On August 27, 1999, we established a grantor stock ownership trust (the “Trust”) into which certain shares repurchased in 2000 and 1999 were transferred. The Trust, administered by a third-party trustee, holds and distributes the shares of common stock acquired to support certain employee compensation and employee benefit obligations under our existing stock option plan, the 401(k) Plan and other employee benefit plans. The existence of the Trust has no impact on the amount of benefits or compensation that is paid under these plans.
For financial reporting purposes, the Trust is consolidated with us, and therefore any dividend transactions between us and the Trust are eliminated. Acquired shares held by the Trust remain valued at the market price on the date of purchase and are shown as a reduction to stockholders’ equity in the consolidated balance sheets. The difference between the Trust share value and the market value on the date shares are released from the Trust is included in paid-in capital. Common stock held in the Trust is not considered outstanding in the computations of earnings (loss) per share. The Trust held
10,501,844
and
10,615,934
shares of common stock at
November 30, 2013
and
2012
, respectively. The trustee votes shares held by the Trust in accordance with voting directions from eligible employees, as specified in a trust agreement with the trustee.
|
Note 20.
|
Postretirement Benefits
|
We have a supplemental non-qualified, unfunded retirement plan, the KB Home Retirement Plan, effective as of July 11, 2002, pursuant to which we have offered to pay supplemental pension benefits to certain designated individuals (consisting of current and former employees) in connection with their retirement. The plan was closed to new participants in 2004. In connection with the plan, we have purchased cost recovery life insurance contracts on the lives of the designated individuals. The insurance contracts associated with the plan are held by a trust, established as part of the plan to implement and carry out the provisions of the plan and to finance the benefits offered under the plan. The trust is the owner and beneficiary of such insurance contracts. The amount of the insurance coverage under the contracts is designed to provide sufficient funds to cover all costs of the plan if assumptions made as to employment term, mortality experience, policy earnings and other factors are realized. The cash surrender value of these insurance contracts was
$47.4 million
at
November 30, 2013
and
$42.4 million
at
November 30, 2012
. In 2013, 2012 and 2011, we paid
$1.1 million
,
$.5 million
and
$.1 million
, respectively, in benefits under the plan to eligible former employees.
We also have an unfunded death benefit plan, the KB Home Death Benefit Only Plan, implemented on November 1, 2001, for certain designated individuals (consisting of current and former employees). The plan was closed to new participants in 2004. In connection with the plan, we have purchased cost recovery life insurance contracts on the lives of the designated individuals. The insurance contracts associated with the plan are held by a trust, established as part of the plan to implement and carry out the provisions of the plan and to finance the benefits offered under the plan. The trust is the owner and beneficiary of such insurance contracts. The amount of the insurance coverage under the contracts is designed to provide sufficient funds to cover all costs of the plan if assumptions made as to employment term, mortality experience, policy earnings and other factors are realized. The cash surrender value of these insurance contracts was
$16.2 million
at
November 30, 2013
and
$14.8 million
at
November 30, 2012
. We have not paid out any benefits under the plan.
The net periodic benefit cost of our postretirement benefit plans for the year ended
November 30, 2013
was
$6.9 million
, which included service costs of
$1.5 million
, interest costs of
$2.1 million
, amortization of unrecognized loss of
$1.8 million
and amortization of prior service costs of
$1.5 million
. The net periodic benefit cost of these plans for the year ended
November 30, 2012
was
$6.6 million
, which included service costs of
$1.3 million
, interest costs of
$2.3 million
, amortization of unrecognized loss of
$1.4 million
, and amortization of prior service costs of
$1.6 million
. For the year ended
November 30, 2011
, the net periodic benefit cost of these plans was
$5.5 million
, which included service costs of
$1.2 million
, interest costs of
$2.3 million
, amortization of unrecognized loss of
$.6 million
, and amortization of prior service costs of
$1.5 million
, partly offset by other income of
$.1 million
. The liabilities related to these plans were
$56.3 million
at
November 30, 2013
and
$60.9 million
at
November 30, 2012
, and are included in accrued expenses and other liabilities in the consolidated balance sheets. For the years ended
November 30,
2013
and
2012
, the discount rates we used for the plans were
4.4%
and
3.3%
, respectively.
105
Benefit payments under our postretirement benefit plans are expected to be paid during each year ended November 30 as follows: 2014 —
$1.4 million
; 2015 —
$1.8 million
; 2016 —
$2.4 million
; 2017 —
$2.6 million
; 2018 —
$2.9 million
; and for the five years ended November 30, 2023 —
$18.9 million
in the aggregate.
|
Note 21.
|
Supplemental Disclosure to Consolidated Statements of Cash Flows
|
The following are supplemental disclosures to the consolidated statements of cash flows (in thousands):
|
|
Years Ended November 30,
|
||||||||||
|
|
2013
|
2012
|
2011
|
||||||||
|
Summary of cash and cash equivalents at the end of the year:
|
|||||||||||
|
Homebuilding
|
$
|
530,095
|
|
$
|
524,765
|
|
$
|
415,050
|
|
||
|
Financial services
|
2,428
|
|
923
|
|
3,024
|
|
|||||
|
Total
|
$
|
532,523
|
|
$
|
525,688
|
|
$
|
418,074
|
|
||
|
Supplemental disclosure of cash flow information:
|
|||||||||||
|
Interest paid, net of amounts capitalized
|
$
|
64,520
|
|
$
|
65,541
|
|
$
|
48,038
|
|
||
|
Income taxes paid
|
800
|
|
826
|
|
335
|
|
|||||
|
Income taxes refunded
|
61
|
|
22,342
|
|
213
|
|
|||||
|
Supplemental disclosure of noncash activities:
|
|||||||||||
|
Cost of inventories acquired through seller financing
|
$
|
27,600
|
|
$
|
53,625
|
|
$
|
—
|
|
||
|
Increase (decrease) in consolidated inventories not owned
|
4,798
|
|
(19,803
|
)
|
8,354
|
|
|||||
|
Acquired property securing note receivable
|
—
|
|
—
|
|
40,000
|
|
|||||
|
Issuance of stock under stock-based compensation plans
|
8,346
|
|
—
|
|
—
|
|
|||||
|
Note 22.
|
Supplemental Guarantor Information
|
Our obligations to pay principal, premium, if any, and interest under our senior notes and the 1.375% Convertible Senior Notes due 2019 and borrowings, if any, under the Credit Facility are guaranteed on a joint and several basis by the Guarantor Subsidiaries. The guarantees are full and unconditional and the Guarantor Subsidiaries are
100%
owned by us. Pursuant to the terms of the indenture governing our senior notes and the 1.375% Convertible Senior Notes due 2019, and the terms of the Credit Facility, a Guarantor Subsidiary will be automatically and unconditionally released and discharged from its guaranty of our senior notes, the 1.375% Convertible Senior Notes due 2019 and the Credit Facility if such Guarantor Subsidiary ceases to be a “significant subsidiary” as defined by Rule 1-02 of Regulation S-X using a
5%
rather than a 10% threshold, provided that the assets of our non-guarantor subsidiaries do not in the aggregate exceed
10%
of an adjusted measure of our consolidated total assets, so long as all guarantees by such Guarantor Subsidiary of any other of our or our subsidiaries’ indebtedness are terminated at or prior to the time of such release. We have determined that separate, full financial statements of the Guarantor Subsidiaries would not be material to investors and, accordingly, supplemental financial information for the Guarantor Subsidiaries is presented.
The supplemental financial information for all periods presented below reflects the relevant subsidiaries that were Guarantor Subsidiaries as of November 30, 2013. The format of the condensed consolidating financial statements has been revised for the periods previously reported in our annual reports to retrospectively reflect (a) the transfer of certain of our subsidiaries from non-guarantor subsidiaries to guarantor subsidiaries as a result of such subsidiaries becoming guarantor subsidiaries during 2013 and (b) the following elective reclassifications which relate solely to transactions between KB Home corporate and its subsidiaries: (i) the reclassification of KB Home corporate, guarantor and non-guarantor intercompany interest, which had previously been included in interest expense, to a separate line item with corresponding offsets in the consolidating adjustments column; (ii) the reclassification of guarantor and non-guarantor intercompany receivables and payables, which had previously been presented on a net basis, with corresponding offsets in the consolidating adjustments column; (iii) the reclassification of the net intercompany funding activity of KB Home corporate, which was previously included in cash flows provided by (used in) financing activities, to cash flows from investing activities with corresponding offsets in the consolidating adjustments column; and (iv) the reclassification of dividends received by KB Home corporate from its subsidiaries to cash provided by (used in) operating activities. Such dividends were previously included in net cash provided by (used in) financing activities. This revised presentation of the condensed consolidating financial statements had no impact or effect on our consolidated financial statements for any periods presented, including our consolidated statements of operations, consolidated statements of comprehensive income (loss), consolidated balance sheets and consolidated statements of cash flows.
106
Condensed Consolidating Statement of Operations
(in thousands)
|
|
Year Ended November 30, 2013
|
||||||||||||||||||
|
|
KB Home
Corporate
|
Guarantor
Subsidiaries
|
Non-Guarantor
Subsidiaries
|
Consolidating
Adjustments
|
Total
|
||||||||||||||
|
Revenues
|
$
|
—
|
|
$
|
2,036,340
|
|
$
|
60,790
|
|
$
|
—
|
|
$
|
2,097,130
|
|
||||
|
Homebuilding:
|
|||||||||||||||||||
|
Revenues
|
$
|
—
|
|
$
|
2,036,340
|
|
$
|
48,638
|
|
$
|
—
|
|
$
|
2,084,978
|
|
||||
|
Construction and land costs
|
—
|
|
(1,692,525
|
)
|
(44,561
|
)
|
—
|
|
(1,737,086
|
)
|
|||||||||
|
Selling, general and administrative expenses
|
(60,545
|
)
|
(180,344
|
)
|
(14,919
|
)
|
—
|
|
(255,808
|
)
|
|||||||||
|
Operating income (loss)
|
(60,545
|
)
|
163,471
|
|
(10,842
|
)
|
—
|
|
92,084
|
|
|||||||||
|
Interest income
|
768
|
|
18
|
|
6
|
|
—
|
|
792
|
|
|||||||||
|
Interest expense
|
(143,902
|
)
|
(5,199
|
)
|
—
|
|
86,411
|
|
(62,690
|
)
|
|||||||||
|
Intercompany interest
|
203,096
|
|
(117,180
|
)
|
495
|
|
(86,411
|
)
|
—
|
|
|||||||||
|
Equity in loss of unconsolidated joint ventures
|
—
|
|
(2,007
|
)
|
—
|
|
—
|
|
(2,007
|
)
|
|||||||||
|
Homebuilding pretax income (loss)
|
(583
|
)
|
39,103
|
|
(10,341
|
)
|
—
|
|
28,179
|
|
|||||||||
|
Financial services pretax income
|
—
|
|
—
|
|
10,184
|
|
—
|
|
10,184
|
|
|||||||||
|
Total pretax income (loss)
|
(583
|
)
|
39,103
|
|
(157
|
)
|
—
|
|
38,363
|
|
|||||||||
|
Income tax benefit
|
—
|
|
1,500
|
|
100
|
|
—
|
|
1,600
|
|
|||||||||
|
Equity in net income of subsidiaries
|
40,546
|
|
—
|
|
—
|
|
(40,546
|
)
|
—
|
|
|||||||||
|
Net income (loss)
|
$
|
39,963
|
|
$
|
40,603
|
|
$
|
(57
|
)
|
$
|
(40,546
|
)
|
$
|
39,963
|
|
||||
107
Condensed Consolidating Statement of Operations
(in thousands)
|
|
Year Ended November 30, 2012
|
||||||||||||||||||
|
|
KB Home
Corporate
|
Guarantor
Subsidiaries
|
Non-Guarantor
Subsidiaries
|
Consolidating
Adjustments
|
Total
|
||||||||||||||
|
Revenues
|
$
|
—
|
|
$
|
1,506,333
|
|
$
|
53,782
|
|
$
|
—
|
|
$
|
1,560,115
|
|
||||
|
Homebuilding:
|
|||||||||||||||||||
|
Revenues
|
$
|
—
|
|
$
|
1,506,333
|
|
$
|
42,099
|
|
$
|
—
|
|
$
|
1,548,432
|
|
||||
|
Construction and land costs
|
—
|
|
(1,291,877
|
)
|
(40,168
|
)
|
—
|
|
(1,332,045
|
)
|
|||||||||
|
Selling, general and administrative expenses
|
(60,101
|
)
|
(163,266
|
)
|
(13,276
|
)
|
—
|
|
(236,643
|
)
|
|||||||||
|
Operating income (loss)
|
(60,101
|
)
|
51,190
|
|
(11,345
|
)
|
—
|
|
(20,256
|
)
|
|||||||||
|
Interest income
|
480
|
|
13
|
|
25
|
|
—
|
|
518
|
|
|||||||||
|
Interest expense
|
(127,291
|
)
|
(5,365
|
)
|
—
|
|
62,852
|
|
(69,804
|
)
|
|||||||||
|
Intercompany interest
|
176,977
|
|
(114,286
|
)
|
161
|
|
(62,852
|
)
|
—
|
|
|||||||||
|
Equity in loss of unconsolidated joint ventures
|
—
|
|
(394
|
)
|
—
|
|
—
|
|
(394
|
)
|
|||||||||
|
Homebuilding pretax loss
|
(9,935
|
)
|
(68,842
|
)
|
(11,159
|
)
|
—
|
|
(89,936
|
)
|
|||||||||
|
Financial services pretax income
|
—
|
|
—
|
|
10,883
|
|
—
|
|
10,883
|
|
|||||||||
|
Total pretax loss
|
(9,935
|
)
|
(68,842
|
)
|
(276
|
)
|
—
|
|
(79,053
|
)
|
|||||||||
|
Income tax benefit
|
2,500
|
|
17,500
|
|
100
|
|
—
|
|
20,100
|
|
|||||||||
|
Equity in net loss of subsidiaries
|
(51,518
|
)
|
—
|
|
—
|
|
51,518
|
|
—
|
|
|||||||||
|
Net loss
|
$
|
(58,953
|
)
|
$
|
(51,342
|
)
|
$
|
(176
|
)
|
$
|
51,518
|
|
$
|
(58,953
|
)
|
||||
108
Condensed Consolidating Statement of Operations
(in thousands)
|
|
Year Ended November 30, 2011
|
||||||||||||||||||
|
|
KB Home
Corporate
|
Guarantor
Subsidiaries
|
Non-Guarantor
Subsidiaries
|
Consolidating
Adjustments
|
Total
|
||||||||||||||
|
Revenues
|
$
|
—
|
|
$
|
1,262,453
|
|
$
|
53,413
|
|
$
|
—
|
|
$
|
1,315,866
|
|
||||
|
Homebuilding:
|
|||||||||||||||||||
|
Revenues
|
$
|
—
|
|
$
|
1,262,453
|
|
$
|
43,109
|
|
$
|
—
|
|
$
|
1,305,562
|
|
||||
|
Construction and land costs
|
—
|
|
(1,108,572
|
)
|
(48,708
|
)
|
—
|
|
(1,157,280
|
)
|
|||||||||
|
Selling, general and administrative expenses
|
(52,784
|
)
|
(151,916
|
)
|
(15,891
|
)
|
—
|
|
(220,591
|
)
|
|||||||||
|
Loss on loan guaranty
|
—
|
|
(30,765
|
)
|
—
|
|
—
|
|
(30,765
|
)
|
|||||||||
|
Operating loss
|
(52,784
|
)
|
(28,800
|
)
|
(21,490
|
)
|
—
|
|
(103,074
|
)
|
|||||||||
|
Interest income
|
715
|
|
48
|
|
108
|
|
—
|
|
871
|
|
|||||||||
|
Interest expense
|
(110,068
|
)
|
(3,007
|
)
|
1,038
|
|
62,833
|
|
(49,204
|
)
|
|||||||||
|
Intercompany interest
|
162,025
|
|
(97,623
|
)
|
(1,569
|
)
|
(62,833
|
)
|
—
|
|
|||||||||
|
Equity in income (loss) of unconsolidated joint ventures
|
—
|
|
(55,840
|
)
|
1
|
|
—
|
|
(55,839
|
)
|
|||||||||
|
Homebuilding pretax loss
|
(112
|
)
|
(185,222
|
)
|
(21,912
|
)
|
—
|
|
(207,246
|
)
|
|||||||||
|
Financial services pretax income
|
—
|
|
—
|
|
26,078
|
|
—
|
|
26,078
|
|
|||||||||
|
Total pretax income (loss)
|
(112
|
)
|
(185,222
|
)
|
4,166
|
|
—
|
|
(181,168
|
)
|
|||||||||
|
Income tax benefit
|
—
|
|
2,300
|
|
100
|
|
—
|
|
2,400
|
|
|||||||||
|
Equity in net loss of subsidiaries
|
(178,656
|
)
|
—
|
|
—
|
|
178,656
|
|
—
|
|
|||||||||
|
Net income (loss)
|
$
|
(178,768
|
)
|
$
|
(182,922
|
)
|
$
|
4,266
|
|
$
|
178,656
|
|
$
|
(178,768
|
)
|
||||
109
Condensed Consolidating Statements of Comprehensive Income (Loss)
(in thousands)
|
|
Year Ended November 30, 2013
|
||||||||||||||||||
|
|
KB Home
Corporate
|
Guarantor
Subsidiaries
|
Non-Guarantor
Subsidiaries
|
Consolidating
Adjustments
|
Total
|
||||||||||||||
|
Net income (loss)
|
$
|
39,963
|
|
$
|
40,603
|
|
$
|
(57
|
)
|
$
|
(40,546
|
)
|
$
|
39,963
|
|
||||
|
Other comprehensive income:
|
|||||||||||||||||||
|
Postretirement benefit plan adjustments
|
10,442
|
|
—
|
|
—
|
|
—
|
|
10,442
|
|
|||||||||
|
Other comprehensive income
|
10,442
|
|
—
|
|
—
|
|
—
|
|
10,442
|
|
|||||||||
|
Comprehensive income (loss)
|
$
|
50,405
|
|
$
|
40,603
|
|
$
|
(57
|
)
|
$
|
(40,546
|
)
|
$
|
50,405
|
|
||||
|
|
Year Ended November 30, 2012
|
||||||||||||||||||
|
|
KB Home
Corporate
|
Guarantor
Subsidiaries
|
Non-Guarantor
Subsidiaries
|
Consolidating
Adjustments
|
Total
|
||||||||||||||
|
Net loss
|
$
|
(58,953
|
)
|
$
|
(51,342
|
)
|
$
|
(176
|
)
|
$
|
51,518
|
|
$
|
(58,953
|
)
|
||||
|
Other comprehensive loss:
|
|||||||||||||||||||
|
Postretirement benefit plan adjustments
|
(1,806
|
)
|
—
|
|
—
|
|
—
|
|
(1,806
|
)
|
|||||||||
|
Other comprehensive loss
|
(1,806
|
)
|
—
|
|
—
|
|
—
|
|
(1,806
|
)
|
|||||||||
|
Comprehensive loss
|
$
|
(60,759
|
)
|
$
|
(51,342
|
)
|
$
|
(176
|
)
|
$
|
51,518
|
|
$
|
(60,759
|
)
|
||||
|
|
Year Ended November 30, 2011
|
||||||||||||||||||
|
|
KB Home
Corporate
|
Guarantor
Subsidiaries
|
Non-Guarantor
Subsidiaries
|
Consolidating
Adjustments
|
Total
|
||||||||||||||
|
Net income (loss)
|
$
|
(178,768
|
)
|
$
|
(182,922
|
)
|
$
|
4,266
|
|
$
|
178,656
|
|
$
|
(178,768
|
)
|
||||
|
Other comprehensive loss:
|
|||||||||||||||||||
|
Postretirement benefit plan adjustments
|
(3,495
|
)
|
—
|
|
—
|
|
—
|
|
(3,495
|
)
|
|||||||||
|
Other comprehensive loss
|
(3,495
|
)
|
—
|
|
—
|
|
—
|
|
(3,495
|
)
|
|||||||||
|
Comprehensive income (loss)
|
$
|
(182,263
|
)
|
$
|
(182,922
|
)
|
$
|
4,266
|
|
$
|
178,656
|
|
$
|
(182,263
|
)
|
||||
110
Condensed Consolidating Balance Sheet
(in thousands)
|
|
November 30, 2013
|
||||||||||||||||||
|
|
KB Home
Corporate
|
Guarantor
Subsidiaries
|
Non-Guarantor
Subsidiaries
|
Consolidating
Adjustments
|
Total
|
||||||||||||||
|
Assets
|
|||||||||||||||||||
|
Homebuilding:
|
|||||||||||||||||||
|
Cash and cash equivalents
|
$
|
476,847
|
|
$
|
41,316
|
|
$
|
11,932
|
|
$
|
—
|
|
$
|
530,095
|
|
||||
|
Restricted cash
|
41,906
|
|
—
|
|
—
|
|
—
|
|
41,906
|
|
|||||||||
|
Receivables
|
1,472
|
|
74,186
|
|
91
|
|
—
|
|
75,749
|
|
|||||||||
|
Inventories
|
—
|
|
2,263,034
|
|
35,543
|
|
—
|
|
2,298,577
|
|
|||||||||
|
Investments in unconsolidated joint ventures
|
—
|
|
130,192
|
|
—
|
|
—
|
|
130,192
|
|
|||||||||
|
Other assets
|
97,647
|
|
9,072
|
|
357
|
|
—
|
|
107,076
|
|
|||||||||
|
617,872
|
|
2,517,800
|
|
47,923
|
|
—
|
|
3,183,595
|
|
||||||||||
|
Financial services
|
—
|
|
—
|
|
10,040
|
|
—
|
|
10,040
|
|
|||||||||
|
Intercompany receivables
|
2,129,729
|
|
—
|
|
117,829
|
|
(2,247,558
|
)
|
—
|
|
|||||||||
|
Investments in subsidiaries
|
39,955
|
|
—
|
|
—
|
|
(39,955
|
)
|
—
|
|
|||||||||
|
Total assets
|
$
|
2,787,556
|
|
$
|
2,517,800
|
|
$
|
175,792
|
|
$
|
(2,287,513
|
)
|
$
|
3,193,635
|
|
||||
|
Liabilities and stockholders’ equity
|
|||||||||||||||||||
|
Homebuilding:
|
|||||||||||||||||||
|
Accounts payable, accrued expenses and other liabilities
|
$
|
117,875
|
|
$
|
292,220
|
|
$
|
94,363
|
|
$
|
—
|
|
$
|
504,458
|
|
||||
|
Mortgages and notes payable
|
2,111,773
|
|
38,725
|
|
—
|
|
—
|
|
2,150,498
|
|
|||||||||
|
2,229,648
|
|
330,945
|
|
94,363
|
|
—
|
|
2,654,956
|
|
||||||||||
|
Financial services
|
—
|
|
—
|
|
2,593
|
|
—
|
|
2,593
|
|
|||||||||
|
Intercompany payables
|
21,822
|
|
2,186,855
|
|
38,881
|
|
(2,247,558
|
)
|
—
|
|
|||||||||
|
Stockholders’ equity
|
536,086
|
|
—
|
|
39,955
|
|
(39,955
|
)
|
536,086
|
|
|||||||||
|
Total liabilities and stockholders’ equity
|
$
|
2,787,556
|
|
$
|
2,517,800
|
|
$
|
175,792
|
|
$
|
(2,287,513
|
)
|
$
|
3,193,635
|
|
||||
111
Condensed Consolidating Balance Sheet
(in thousands)
|
|
November 30, 2012
|
||||||||||||||||||
|
|
KB Home
Corporate
|
Guarantor
Subsidiaries
|
Non-Guarantor
Subsidiaries
|
Consolidating
Adjustments
|
Total
|
||||||||||||||
|
Assets
|
|||||||||||||||||||
|
Homebuilding:
|
|||||||||||||||||||
|
Cash and cash equivalents
|
$
|
457,007
|
|
$
|
54,205
|
|
$
|
13,553
|
|
$
|
—
|
|
$
|
524,765
|
|
||||
|
Restricted cash
|
42,362
|
|
—
|
|
—
|
|
—
|
|
42,362
|
|
|||||||||
|
Receivables
|
121
|
|
64,504
|
|
196
|
|
—
|
|
64,821
|
|
|||||||||
|
Inventories
|
—
|
|
1,688,301
|
|
18,270
|
|
—
|
|
1,706,571
|
|
|||||||||
|
Investments in unconsolidated joint ventures
|
—
|
|
116,793
|
|
6,881
|
|
—
|
|
123,674
|
|
|||||||||
|
Other assets
|
85,901
|
|
15,980
|
|
(6,831
|
)
|
—
|
|
95,050
|
|
|||||||||
|
585,391
|
|
1,939,783
|
|
32,069
|
|
—
|
|
2,557,243
|
|
||||||||||
|
Financial services
|
—
|
|
—
|
|
4,455
|
|
—
|
|
4,455
|
|
|||||||||
|
Intercompany receivables
|
1,559,712
|
|
—
|
|
122,580
|
|
(1,682,292
|
)
|
—
|
|
|||||||||
|
Investments in subsidiaries
|
38,479
|
|
—
|
|
—
|
|
(38,479
|
)
|
—
|
|
|||||||||
|
Total assets
|
$
|
2,183,582
|
|
$
|
1,939,783
|
|
$
|
159,104
|
|
$
|
(1,720,771
|
)
|
$
|
2,561,698
|
|
||||
|
Liabilities and stockholders’ equity
|
|||||||||||||||||||
|
Homebuilding:
|
|||||||||||||||||||
|
Accounts payable, accrued expenses and other liabilities
|
$
|
134,314
|
|
$
|
221,611
|
|
$
|
102,964
|
|
$
|
—
|
|
$
|
458,889
|
|
||||
|
Mortgages and notes payable
|
1,645,394
|
|
77,421
|
|
—
|
|
—
|
|
1,722,815
|
|
|||||||||
|
1,779,708
|
|
299,032
|
|
102,964
|
|
—
|
|
2,181,704
|
|
||||||||||
|
Financial services
|
—
|
|
—
|
|
3,188
|
|
—
|
|
3,188
|
|
|||||||||
|
Intercompany payables
|
27,068
|
|
1,640,751
|
|
14,473
|
|
(1,682,292
|
)
|
—
|
|
|||||||||
|
Stockholders’ equity
|
376,806
|
|
—
|
|
38,479
|
|
(38,479
|
)
|
376,806
|
|
|||||||||
|
Total liabilities and stockholders’ equity
|
$
|
2,183,582
|
|
$
|
1,939,783
|
|
$
|
159,104
|
|
$
|
(1,720,771
|
)
|
$
|
2,561,698
|
|
||||
112
Condensed Consolidating Statement of Cash Flows
(in thousands)
|
|
Year Ended November 30, 2013
|
||||||||||||||||||
|
|
KB Home
Corporate
|
Guarantor
Subsidiaries
|
Non-Guarantor
Subsidiaries
|
Consolidating
Adjustments
|
Total
|
||||||||||||||
|
Net cash provided by (used in) operating activities
|
$
|
4,695
|
|
$
|
(441,236
|
)
|
$
|
(6,945
|
)
|
$
|
—
|
|
$
|
(443,486
|
)
|
||||
|
Cash flows from investing activities:
|
|||||||||||||||||||
|
Contributions to unconsolidated joint ventures
|
—
|
|
(9,368
|
)
|
(4,991
|
)
|
—
|
|
(14,359
|
)
|
|||||||||
|
Purchases of property and equipment, net
|
(519
|
)
|
(1,491
|
)
|
(381
|
)
|
—
|
|
(2,391
|
)
|
|||||||||
|
Intercompany
|
(517,703
|
)
|
—
|
|
—
|
|
517,703
|
|
—
|
|
|||||||||
|
Net cash used in investing activities
|
(518,222
|
)
|
(10,859
|
)
|
(5,372
|
)
|
517,703
|
|
(16,750
|
)
|
|||||||||
|
Cash flows from financing activities:
|
|||||||||||||||||||
|
Change in restricted cash
|
456
|
|
—
|
|
—
|
|
—
|
|
456
|
|
|||||||||
|
Proceeds from issuance of debt
|
680,000
|
|
—
|
|
—
|
|
—
|
|
680,000
|
|
|||||||||
|
Payment of debt issuance costs
|
(16,525
|
)
|
—
|
|
—
|
|
—
|
|
(16,525
|
)
|
|||||||||
|
Repayment of senior notes
|
(225,394
|
)
|
—
|
|
—
|
|
—
|
|
(225,394
|
)
|
|||||||||
|
Payments on mortgages and land contracts due to land sellers and other loans
|
—
|
|
(66,296
|
)
|
—
|
|
—
|
|
(66,296
|
)
|
|||||||||
|
Proceeds from issuance of common stock, net
|
109,503
|
|
—
|
|
—
|
|
—
|
|
109,503
|
|
|||||||||
|
Issuance of common stock under employee stock plans
|
2,181
|
|
—
|
|
—
|
|
—
|
|
2,181
|
|
|||||||||
|
Payments of cash dividends
|
(8,366
|
)
|
—
|
|
—
|
|
—
|
|
(8,366
|
)
|
|||||||||
|
Stock repurchases
|
(8,488
|
)
|
—
|
|
—
|
|
—
|
|
(8,488
|
)
|
|||||||||
|
Intercompany
|
—
|
|
505,502
|
|
12,201
|
|
(517,703
|
)
|
—
|
|
|||||||||
|
Net cash provided by financing activities
|
533,367
|
|
439,206
|
|
12,201
|
|
(517,703
|
)
|
467,071
|
|
|||||||||
|
Net increase (decrease) in cash and cash equivalents
|
19,840
|
|
(12,889
|
)
|
(116
|
)
|
—
|
|
6,835
|
|
|||||||||
|
Cash and cash equivalents at beginning of year
|
457,007
|
|
54,205
|
|
14,476
|
|
—
|
|
525,688
|
|
|||||||||
|
Cash and cash equivalents at end of year
|
$
|
476,847
|
|
$
|
41,316
|
|
$
|
14,360
|
|
$
|
—
|
|
$
|
532,523
|
|
||||
113
Condensed Consolidating Statement of Cash Flows
(in thousands)
|
|
Year Ended November 30, 2012
|
||||||||||||||||||
|
|
KB Home
Corporate
|
Guarantor
Subsidiaries
|
Non-Guarantor
Subsidiaries
|
Consolidating
Adjustments
|
Total
|
||||||||||||||
|
Net cash provided by operating activities
|
$
|
11,033
|
|
$
|
4,943
|
|
$
|
18,641
|
|
$
|
—
|
|
$
|
34,617
|
|
||||
|
Cash flows from investing activities:
|
|||||||||||||||||||
|
Return of investments in (contributions to) unconsolidated joint ventures
|
—
|
|
1,922
|
|
(933
|
)
|
—
|
|
989
|
|
|||||||||
|
Purchases of property and equipment, net
|
(175
|
)
|
(1,540
|
)
|
(34
|
)
|
—
|
|
(1,749
|
)
|
|||||||||
|
Intercompany
|
5,137
|
|
—
|
|
—
|
|
(5,137
|
)
|
—
|
|
|||||||||
|
Net cash provided by (used in) investing activities
|
4,962
|
|
382
|
|
(967
|
)
|
(5,137
|
)
|
(760
|
)
|
|||||||||
|
Cash flows from financing activities:
|
|||||||||||||||||||
|
Change in restricted cash
|
22,119
|
|
—
|
|
—
|
|
—
|
|
22,119
|
|
|||||||||
|
Proceeds from issuance of debt
|
694,831
|
|
—
|
|
—
|
|
—
|
|
694,831
|
|
|||||||||
|
Payment of debt issuance costs
|
(12,445
|
)
|
—
|
|
—
|
|
—
|
|
(12,445
|
)
|
|||||||||
|
Repayment of senior notes
|
(592,645
|
)
|
—
|
|
—
|
|
—
|
|
(592,645
|
)
|
|||||||||
|
Payments on mortgages and land contracts due to land sellers and other loans
|
—
|
|
(26,298
|
)
|
—
|
|
—
|
|
(26,298
|
)
|
|||||||||
|
Issuance of common stock under employee stock plans
|
593
|
|
—
|
|
—
|
|
—
|
|
593
|
|
|||||||||
|
Payments of cash dividends
|
(10,599
|
)
|
—
|
|
—
|
|
—
|
|
(10,599
|
)
|
|||||||||
|
Stock repurchases
|
(1,799
|
)
|
—
|
|
—
|
|
—
|
|
(1,799
|
)
|
|||||||||
|
Intercompany
|
—
|
|
22,915
|
|
(28,052
|
)
|
5,137
|
|
—
|
|
|||||||||
|
Net cash provided by (used in) financing activities
|
100,055
|
|
(3,383
|
)
|
(28,052
|
)
|
5,137
|
|
73,757
|
|
|||||||||
|
Net increase (decrease) in cash and cash equivalents
|
116,050
|
|
1,942
|
|
(10,378
|
)
|
—
|
|
107,614
|
|
|||||||||
|
Cash and cash equivalents at beginning of year
|
340,957
|
|
52,263
|
|
24,854
|
|
—
|
|
418,074
|
|
|||||||||
|
Cash and cash equivalents at end of year
|
$
|
457,007
|
|
$
|
54,205
|
|
$
|
14,476
|
|
$
|
—
|
|
$
|
525,688
|
|
||||
114
Condensed Consolidating Statement of Cash Flows
(in thousands)
|
|
Year Ended November 30, 2011
|
||||||||||||||||||
|
|
KB Home
Corporate
|
Guarantor
Subsidiaries
|
Non-Guarantor
Subsidiaries
|
Consolidating
Adjustments
|
Total
|
||||||||||||||
|
Net cash provided by (used in) operating activities
|
$
|
9,443
|
|
$
|
(355,165
|
)
|
$
|
(1,823
|
)
|
$
|
—
|
|
$
|
(347,545
|
)
|
||||
|
Cash flows from investing activities:
|
|||||||||||||||||||
|
Return of investments in (contributions to) unconsolidated joint ventures
|
—
|
|
(78,619
|
)
|
11,359
|
|
—
|
|
(67,260
|
)
|
|||||||||
|
Proceeds from sale of operating property
|
—
|
|
80,600
|
|
—
|
|
—
|
|
80,600
|
|
|||||||||
|
Sales (purchases) of property and equipment, net
|
(200
|
)
|
(649
|
)
|
607
|
|
—
|
|
(242
|
)
|
|||||||||
|
Intercompany
|
(349,081
|
)
|
—
|
|
—
|
|
349,081
|
|
—
|
|
|||||||||
|
Net cash provided by (used in) investing activities
|
(349,281
|
)
|
1,332
|
|
11,966
|
|
349,081
|
|
13,098
|
|
|||||||||
|
Cash flows from financing activities:
|
|||||||||||||||||||
|
Change in restricted cash
|
24,239
|
|
26,757
|
|
—
|
|
—
|
|
50,996
|
|
|||||||||
|
Repayment of senior notes
|
(100,000
|
)
|
—
|
|
—
|
|
—
|
|
(100,000
|
)
|
|||||||||
|
Payments on mortgages and land contracts due to land sellers and other loans
|
3,397
|
|
(89,461
|
)
|
(3,397
|
)
|
—
|
|
(89,461
|
)
|
|||||||||
|
Issuance of common stock under employee stock plans
|
1,796
|
|
—
|
|
—
|
|
—
|
|
1,796
|
|
|||||||||
|
Payments of cash dividends
|
(19,240
|
)
|
—
|
|
—
|
|
—
|
|
(19,240
|
)
|
|||||||||
|
Intercompany
|
—
|
|
443,698
|
|
(94,617
|
)
|
(349,081
|
)
|
—
|
|
|||||||||
|
Net cash provided by (used in) financing activities
|
(89,808
|
)
|
380,994
|
|
(98,014
|
)
|
(349,081
|
)
|
(155,909
|
)
|
|||||||||
|
Net increase (decrease) in cash and cash equivalents
|
(429,646
|
)
|
27,161
|
|
(87,871
|
)
|
—
|
|
(490,356
|
)
|
|||||||||
|
Cash and cash equivalents at beginning of year
|
770,603
|
|
25,102
|
|
112,725
|
|
—
|
|
908,430
|
|
|||||||||
|
Cash and cash equivalents at end of year
|
$
|
340,957
|
|
$
|
52,263
|
|
$
|
24,854
|
|
$
|
—
|
|
$
|
418,074
|
|
||||
115
|
Note 23.
|
Quarterly Results (unaudited)
|
The following tables present our consolidated quarterly results for the years ended
November 30, 2013
and
2012
(in thousands, except per share amounts):
|
First Quarter
|
Second Quarter
|
Third Quarter
|
Fourth Quarter
|
||||||||||||
|
2013
|
|||||||||||||||
|
Revenues
|
$
|
405,219
|
|
$
|
524,406
|
|
$
|
548,974
|
|
$
|
618,531
|
|
|||
|
Gross profits
|
61,119
|
|
80,772
|
|
101,829
|
|
113,282
|
|
|||||||
|
Pretax income (loss)
|
(12,358
|
)
|
(4,173
|
)
|
26,578
|
|
28,316
|
|
|||||||
|
Net income (loss)
|
(12,458
|
)
|
(2,973
|
)
|
27,278
|
|
28,116
|
|
|||||||
|
Earnings (loss) per share:
|
|||||||||||||||
|
Basic
|
$
|
(.16
|
)
|
$
|
(.04
|
)
|
$
|
.32
|
|
$
|
.33
|
|
|||
|
Diluted
|
$
|
(.16
|
)
|
$
|
(.04
|
)
|
$
|
.30
|
|
$
|
.31
|
|
|||
|
2012
|
|||||||||||||||
|
Revenues
|
$
|
254,558
|
|
$
|
302,852
|
|
$
|
424,504
|
|
$
|
578,201
|
|
|||
|
Gross profits
|
21,891
|
|
49,118
|
|
72,439
|
|
81,631
|
|
|||||||
|
Pretax income (loss)
|
(45,402
|
)
|
(28,636
|
)
|
(7,439
|
)
|
2,424
|
|
|||||||
|
Net income (loss)
|
(45,802
|
)
|
(24,136
|
)
|
3,261
|
|
7,724
|
|
|||||||
|
Earnings (loss) per share:
|
|||||||||||||||
|
Basic
|
$
|
(.59
|
)
|
$
|
(.31
|
)
|
$
|
.04
|
|
$
|
.10
|
|
|||
|
Diluted
|
$
|
(.59
|
)
|
$
|
(.31
|
)
|
$
|
.04
|
|
$
|
.10
|
|
|||
Gross profits in the first, second, third and fourth quarters of 2013 included charges of
$1.6 million
,
$15.9 million
,
$5.9 million
, and
$8.5 million
, respectively, associated with water intrusion-related repairs at certain of our communities in central and southwest Florida. Gross profits in the second quarter of 2013 also included land option contract abandonment charges of
$.3 million
. In addition, gross profits in the fourth quarter of
2013
included land option contract abandonment charges of
$2.9 million
and inventory impairment charges of
$.4 million
.
Gross profits in the first, second, third and fourth quarters of
2012
included inventory impairment charges of
$6.6 million
,
$9.9 million
,
$6.4 million
and
$5.2 million
, respectively. In addition, gross profits in the second quarter of 2012 included favorable warranty adjustments of
$11.2 million
and insurance recoveries of
$10.0 million
, gross profits in the third quarter of 2012 included insurance recoveries of
$16.5 million
, and gross profits in the fourth quarter of 2012 included an unfavorable warranty adjustment of
$2.6 million
and land option contract abandonment charges of
$.4 million
.
Pretax income in the fourth quarter of 2013 included the reversal of a previously established accrual of
$8.2 million
due to a favorable court decision. In the second quarter of 2012, the pretax loss included an
$8.8 million
charge associated with an unfavorable court decision related to the same matter as the favorable court decision in 2013.
Quarterly and year-to-date computations of per share amounts are made independently. Therefore, the sum of per share amounts for the quarters may not agree with per share amounts for the year.
116
REPORT OF INDEPENDENT REGISTERED PUBLIC ACCOUNTING FIRM
The Board of Directors and Stockholders of KB Home:
We have audited the accompanying consolidated balance sheets of KB Home as of November 30, 2013 and 2012, and the related consolidated statements of operations, comprehensive income (loss), stockholders’ equity, and cash flows for each of the three years in the period ended November 30, 2013. These financial statements are the responsibility of the Company’s management. Our responsibility is to express an opinion on these financial statements based on our audits.
We conducted our audits in accordance with the standards of the Public Company Accounting Oversight Board (United States). Those standards require that we plan and perform the audit to obtain reasonable assurance about whether the financial statements are free of material misstatement. An audit includes examining, on a test basis, evidence supporting the amounts and disclosures in the financial statements. An audit also includes assessing the accounting principles used and significant estimates made by management, as well as evaluating the overall financial statement presentation. We believe that our audits provide a reasonable basis for our opinion.
In our opinion, the financial statements referred to above present fairly, in all material respects, the consolidated financial position of KB Home at November 30, 2013 and 2012, and the consolidated results of its operations and its cash flows for each of the three years in the period ended November 30, 2013, in conformity with U.S. generally accepted accounting principles.
We also have audited, in accordance with the standards of the Public Company Accounting Oversight Board (United States), KB Home’s internal control over financial reporting as of November 30, 2013, based on criteria established in Internal Control — Integrated Framework issued by the Committee of Sponsoring Organizations of the Treadway Commission (1992 Framework) and our report dated January 24, 2014 expressed an unqualified opinion thereon.

Los Angeles, California
January 24, 2014
117
|
Item 9.
|
CHANGES IN AND DISAGREEMENTS WITH ACCOUNTANTS ON ACCOUNTING AND FINANCIAL DISCLOSURE
|
None.
|
Item 9A.
|
CONTROLS AND PROCEDURES
|
Disclosure Controls and Procedures
We have established disclosure controls and procedures to ensure that information we are required to disclose in the reports we file or submit under the Securities and Exchange Act of 1934 is recorded, processed, summarized and reported within the time periods specified in the SEC’s rules and forms, and accumulated and communicated to management, including the President and Chief Executive Officer (the “Principal Executive Officer”) and Executive Vice President and Chief Financial Officer (the “Principal Financial Officer”), as appropriate, to allow timely decisions regarding required disclosure. Under the supervision and with the participation of senior management, including our Principal Executive Officer and Principal Financial Officer, we evaluated our disclosure controls and procedures, as such term is defined under Rule 13a-15(e) promulgated under the Securities Exchange Act of 1934. Based on this evaluation, our Principal Executive Officer and Principal Financial Officer concluded that our disclosure controls and procedures were effective as of November 30, 2013.
Internal Control Over Financial Reporting
|
(a)
|
Management’s Annual Report on Internal Control Over Financial Reporting
|
Our management is responsible for establishing and maintaining adequate internal control over financial reporting, as such term is defined in Rule 13a-15(f) under the Securities and Exchange Act of 1934. Under the supervision and with the participation of senior management, including our Principal Executive Officer and Principal Financial Officer, we evaluated the effectiveness of our internal control over financial reporting based on the framework in
Internal Control-Integrated Framework
issued by the Committee of Sponsoring Organizations of the Treadway Commission in 1992. Based on the evaluation under that framework and applicable SEC rules, our management concluded that our internal control over financial reporting was effective as of November 30, 2013.
Ernst & Young LLP, the independent registered public accounting firm that audited our consolidated financial statements included in this annual report, has issued its report on the effectiveness of our internal control over financial reporting as of November 30, 2013.
|
(b)
|
Report of Independent Registered Public Accounting Firm
|
The Board of Directors and Stockholders of KB Home:
We have audited KB Home’s internal control over financial reporting as of November 30, 2013, based on criteria established in Internal Control — Integrated Framework issued by the Committee of Sponsoring Organizations of the Treadway Commission (1992 Framework) (the COSO criteria). KB Home’s management is responsible for maintaining effective internal control over financial reporting, and for its assessment of the effectiveness of internal control over financial reporting included in the accompanying Management’s Annual Report on Internal Control Over Financial Reporting. Our responsibility is to express an opinion on the company’s internal control over financial reporting based on our audit.
We conducted our audit in accordance with the standards of the Public Company Accounting Oversight Board (United States). Those standards require that we plan and perform the audit to obtain reasonable assurance about whether effective internal control over financial reporting was maintained in all material respects. Our audit included obtaining an understanding of internal control over financial reporting, assessing the risk that a material weakness exists, testing and evaluating the design and operating effectiveness of internal control based on the assessed risk, and performing such other procedures as we considered necessary in the circumstances. We believe that our audit provides a reasonable basis for our opinion.
A company’s internal control over financial reporting is a process designed to provide reasonable assurance regarding the reliability of financial reporting and the preparation of financial statements for external purposes in accordance with generally accepted accounting principles. A company’s internal control over financial reporting includes those policies and procedures that (1) pertain to the maintenance of records that, in reasonable detail, accurately and fairly reflect the transactions and dispositions of the assets of the company; (2) provide reasonable assurance that transactions are recorded as necessary to permit preparation of financial statements in accordance with generally accepted accounting principles, and that receipts and expenditures of the company are being made only in accordance with authorizations of management and directors of the company; and (3) provide
118
reasonable assurance regarding prevention or timely detection of unauthorized acquisition, use, or disposition of the company’s assets that could have a material effect on the financial statements.
Because of its inherent limitations, internal control over financial reporting may not prevent or detect misstatements. Also, projections of any evaluation of effectiveness to future periods are subject to the risk that controls may become inadequate because of changes in conditions, or that the degree of compliance with the policies or procedures may deteriorate.
In our opinion, KB Home maintained, in all material respects, effective internal control over financial reporting as of November 30, 2013, based on the COSO criteria.
We also have audited, in accordance with the standards of the Public Company Accounting Oversight Board (United States), the consolidated balance sheets of KB Home as of November 30, 2013 and 2012, and the related consolidated statements of operations, comprehensive income (loss), stockholders’ equity, and cash flows for each of the three years in the period ended November 30, 2013 and our report dated January 24, 2014 expressed an unqualified opinion thereon.
Los Angeles, California
January 24, 2014
|
(c)
|
Changes in Internal Control Over Financial Reporting
|
There have been no changes in our internal control over financial reporting during the quarter ended November 30, 2013 that have materially affected, or are reasonably likely to materially affect, our internal control over financial reporting.
|
Item 9B.
|
OTHER INFORMATION
|
None.
|
Item 10.
|
DIRECTORS, EXECUTIVE OFFICERS AND CORPORATE GOVERNANCE
|
The information required by this item for executive officers is set forth under “Executive Officers of the Registrant” in Part I. Except as set forth below, the other information called for by this item will be included under the captions “Corporate Governance and Board Matters” and “Election of Directors” in our Proxy Statement for the 2014 Annual Meeting of Stockholders (the “2014 Proxy Statement”), which will be filed with the SEC not later than March 30, 2014 (120 days after the end of our fiscal year), and is incorporated herein by reference.
Ethics Policy
We have adopted an Ethics Policy for our directors, officers (including our principal executive officer, principal financial officer and principal accounting officer) and employees. The Ethics Policy is available on our investor relations website at www.investor.kbhome.com. Stockholders may request a free copy of the Ethics Policy from:
KB Home
Attention: Investor Relations
10990 Wilshire Boulevard
Los Angeles, California 90024
(310) 231-4000
investorrelations@kbhome.com
Within the time period required by the SEC and the New York Stock Exchange, we will post on our investor relations website any amendment to our Ethics Policy and any waiver applicable to our principal executive officer, principal financial officer or principal accounting officer, or persons performing similar functions, and our other executive officers or directors.
119
Corporate Governance Principles
We have adopted Corporate Governance Principles, which are available on our investor relations website. Stockholders may request a free copy of the Corporate Governance Principles from the address, phone number and email address set forth above under “Ethics Policy.”
|
Item 11.
|
EXECUTIVE COMPENSATION
|
The information required by this item will be included under the captions “Corporate Governance and Board Matters” and “Executive Compensation” in the 2014 Proxy Statement and is incorporated herein by reference.
|
Item 12.
|
SECURITY OWNERSHIP OF CERTAIN BENEFICIAL OWNERS AND MANAGEMENT AND RELATED STOCKHOLDER MATTERS
|
The information required by this item will be included under the caption “Ownership of KB Home Securities” in the 2014 Proxy Statement and is incorporated herein by reference, except for the information required by Item 201(d) of Regulation S-K, which is provided below.
The following table presents information as of November 30, 2013 with respect to shares of our common stock that may be issued under our existing compensation plans:
|
Equity Compensation Plan Information
|
|
|||||||||||
|
Plan category
|
Number of
common shares to
be issued upon
exercise of
outstanding options,
warrants and
rights
(a)
|
Weighted-average
exercise price of
outstanding options,
warrants and rights
(b)
|
Number of common
shares remaining
available for future
issuance under equity
compensation plans
(excluding common
shares reflected in
column(a))
(c)
|
|
||||||||
|
Equity compensation plans approved by stockholders
|
10,531,938
|
|
$
|
21.11
|
|
746,043
|
|
|
||||
|
Equity compensation plans not approved by stockholders
|
—
|
|
—
|
|
—
|
|
(1
|
)
|
||||
|
Total
|
10,531,938
|
|
$
|
21.11
|
|
746,043
|
|
|
||||
|
(1)
|
Represents our current compensation plan for our non-employee directors that provides for grants of deferred common stock units or stock options. These stock units and options are described in the “Director Compensation” section of our 2014 Proxy Statement, which is incorporated herein. As discussed in Note 17. Stockholders’ Equity in the Notes to Consolidated Financial Statements in this report, our board of directors amended the Director Plan in 2013 to provide directors with a one-time opportunity to irrevocably elect to receive an equivalent value of shares of our common stock in lieu of the cash payments that are otherwise due upon the settlement of their outstanding stock units under the terms of the Director Plan. Therefore, we consider the non-employee directors compensation plans as having no available capacity to issue shares of our common stock.
|
|
Item 13.
|
CERTAIN RELATIONSHIPS AND RELATED TRANSACTIONS, AND DIRECTOR INDEPENDENCE
|
The information required by this item will be included under the captions “Corporate Governance and Board Matters” and “Other Matters” in the 2014 Proxy Statement and is incorporated herein by reference.
|
Item 14.
|
PRINCIPAL ACCOUNTING FEES AND SERVICES
|
The information required by this item will be included under the caption “Independent Auditor Fees and Services” in the 2014 Proxy Statement and is incorporated herein by reference.
120
|
Item 15.
|
EXHIBITS, FINANCIAL STATEMENT SCHEDULES
|
(a) 1. Financial Statements
Reference is made to the index set forth on page 67 of this Annual Report on Form 10-K.
2. Financial Statement Schedules
Financial statement schedules have been omitted because they are not applicable or the required information is provided in the consolidated financial statements or notes thereto.
3. Exhibits
|
Exhibit
Number
|
Description
|
|
|
3.1
|
Restated Certificate of Incorporation, as amended, filed as an exhibit to our Current Report on Form 8-K dated April 7, 2009 (File No. 001-09195), is incorporated by reference herein.
|
|
|
3.2
|
By-Laws, as amended and restated on April 5, 2007, filed as an exhibit to our Quarterly Report on Form 10-Q for the quarter ended February 28, 2007 (File No. 001-09195), is incorporated by reference herein.
|
|
|
4.1
|
Rights Agreement between us and Mellon Investor Services LLC, as rights agent, dated January 22, 2009, filed as an exhibit to our Current Report on Form 8-K/A dated January 28, 2009 (File No. 001-09195), is incorporated by reference herein.
|
|
|
4.2
|
Indenture and Supplemental Indenture relating to 5 3/4% Senior Notes due 2014 among us, the Guarantors and Sun Trust Bank, Atlanta, each dated January 28, 2004, filed as exhibits to our Registration Statement No. 333-114761 on Form S-4, are incorporated by reference herein.
|
|
|
4.3
|
Third Supplemental Indenture relating to our Senior Notes by and between us, the Guarantors named therein, the Subsidiary Guarantor named therein and SunTrust Bank, dated as of May 1, 2006, filed as an exhibit to our Current Report on Form 8-K dated May 3, 2006 (File No. 001-09195), is incorporated by reference herein.
|
|
|
4.4
|
Fourth Supplemental Indenture relating to our Senior Notes by and between us, the Guarantors named therein and U.S. Bank National Association, dated as of November 9, 2006, filed as an exhibit to our Current Report on Form 8-K dated November 13, 2006 (File No. 001-09195), is incorporated by reference herein.
|
|
|
4.5
|
Fifth Supplemental Indenture, dated August 17, 2007, relating to our Senior Notes by and between us, the Guarantors, and the Trustee, filed as an exhibit to our Current Report on Form 8-K dated August 22, 2007 (File No. 001-09195), is incorporated by reference herein.
|
|
|
4.6
|
Sixth Supplemental Indenture, dated as of January 30, 2012, relating to our Senior Notes by and between us, the Guarantors and the Trustee, filed as an exhibit to our Current Report on Form 8-K dated February 2, 2012 (File No. 001-09195), is incorporated by reference herein.
|
|
|
4.7
|
Se
venth Supplemental Indenture, dated as of January 11, 2013, relating to our Senior Notes by and among us, the Guarantors and the Trustee, filed as an exhibit to our Current Report on Form 8-K dated January 11, 2013 (File No. 001-09195), is incorporated by reference herein.
|
|
|
4.8
|
Specimen of 5 3/4% Senior Notes due 2014, filed as an exhibit to our Registration Statement No. 333-114761 on Form S-4, is incorporated by reference herein.
|
|
|
4.9
|
Specimen of 5 7/8% Senior Notes due 2015, filed as an exhibit to our Current Report on Form 8-K dated December 15, 2004 (File No. 001-09195), is incorporated by reference herein.
|
|
|
4.10
|
Form of officers’ certificates and guarantors’ certificates establishing the terms of the 5 7/8% Senior Notes due 2015, filed as an exhibit to our Current Report on Form 8-K dated December 15, 2004 (File No. 001-09195), is incorporated by reference herein.
|
|
|
4.11
|
Specimen of 6 1/4% Senior Notes due 2015, filed as an exhibit to our Current Report on Form 8-K dated June 2, 2005 (File No. 001-09195), is incorporated by reference herein.
|
|
|
4.12
|
Form of officers’ certificates and guarantors’ certificates establishing the terms of the 6 1/4% Senior Notes due 2015, filed as an exhibit to our Current Report on Form 8-K dated June 2, 2005 (File No. 001-09195), is incorporated by reference herein.
|
|
121
|
Exhibit
Number
|
Description
|
|
|
4.13
|
Specimen of 6 1/4% Senior Notes due 2015, filed as an exhibit to our Current Report on Form 8-K dated June 27, 2005 (File No. 001-09195), is incorporated by reference herein.
|
|
|
4.14
|
Form of officers’ certificates and guarantors’ certificates establishing the terms of the 6 1/4% Senior Notes due 2015, filed as an exhibit to our Current Report on Form 8-K dated June 27, 2005 (File No. 001-09195), is incorporated by reference herein.
|
|
|
4.15
|
Specimen of 7 1/4% Senior Notes due 2018, filed as an exhibit to our Current Report on Form 8-K dated April 3, 2006 (File No. 001-09195), is incorporated by reference herein.
|
|
|
4.16
|
Form of officers’ certificates and guarantors’ certificates establishing the terms of the 7 1/4% Senior Notes due 2018, filed as an exhibit to our Current Report on Form 8-K dated April 3, 2006 (File No. 001-09195), is incorporated by reference herein.
|
|
|
4.17
|
Specimen of 9.100% Senior Notes due 2017, filed as an exhibit to our Current Report on Form 8-K dated July 30, 2009 (File No. 001-09195), is incorporated by reference herein.
|
|
|
4.18
|
Form of officers’ certificates and guarantors’ certificates establishing the terms of the 9.100% Senior Notes due 2017, filed as an exhibit to our Current Report on Form 8-K dated July 30, 2009 (File No. 001-09195), is incorporated by reference herein.
|
|
|
4.19
|
Specimen of 8.00% Senior Notes due 2020, filed as an exhibit to our Current Report on Form 8-K dated February 7, 2012 (File No. 001-09195), is incorporated by reference herein.
|
|
|
4.20
|
Form of officers’ certificates and guarantors’ certificates establishing the terms of the 8.00% Senior Notes due 2020, filed as an exhibit to our Current Report on Form 8-K dated February 7, 2012 (File No. 001-09195), is incorporated by reference herein.
|
|
|
4.21
|
Specimen of 7.50% Senior Notes due 2022, filed as an exhibit to our Current Report on Form 8-K dated July 31, 2012 (File No. 001-09195), is incorporated by reference herein.
|
|
|
4.22
|
Form of officers’ certificates and guarantors’ certificates establishing the terms of the 7.50% Senior Notes due 2022, filed as an exhibit to our Current Report on Form 8-K dated July 31, 2012 (File No. 001-09195), is incorporated by reference herein.
|
|
|
4.23
|
Form of officers’ certificate and guarantors’ officers’ certificates establishing the form and terms of the 1.375% Convertible Senior Notes due 2019, filed as an exhibit to our Current Report on Form 8-K dated January 29, 2013 (File No. 001-09195), is incorporated by reference herein.
|
|
|
4.24
|
Form of 1.375% Convertible Senior Notes due 2019, filed as an exhibit to our Current Report on Form 8-K dated January 29, 2013 (File No. 001-09195), is incorporated by reference herein.
|
|
|
4.25
|
Form of supplemental officers’ certificate and guarantors’ officers’ certificates establishing the form and terms of the 1.375% Convertible Senior Notes due 2019, filed as an exhibit to our Quarterly Report on Form 10-Q for the quarter ended February 28, 2013 (File No. 001-09195), is incorporated by reference herein.
|
|
|
4.26
|
Eighth Supplemental Indenture, dated as of March 12, 2013, by and among us, the Guarantors party thereto, the Additional Guarantors named therein and U.S. Bank National Association, as Trustee, filed as an exhibit to our Quarterly Report on Form 10-Q for the quarter ended May 31, 2013 (File No. 001-09195), is incorporated by reference herein.
|
|
|
4.27
|
Specimen of 7.00% Senior Notes due 2021, filed as an exhibit to our Current Report on Form 8-K dated October 29, 2013 (File No. 001-09195), is incorporated by reference herein.
|
|
|
4.28
|
Form of officers’ certificates and guarantors’ certificates establishing the terms of the 7.00% Senior Notes due 2021, filed as an exhibit to our Current Report on Form 8-K dated October 29, 2013 (File No. 001-09195), is incorporated by reference herein.
|
|
|
10.1*
|
Kaufman and Broad, Inc. Executive Deferred Compensation Plan, effective as of July 11, 1985, filed as an exhibit to our 2007 Annual Report on Form 10-K (File No. 001-09195), is incorporated by reference herein.
|
|
|
10.2*
|
Amendment to Kaufman and Broad, Inc. Executive Deferred Compensation Plan for amounts earned or vested on or after January 1, 2005, effective January 1, 2009, filed as an exhibit to our 2008 Annual Report on Form 10-K (File No. 001-09195), is incorporated by reference herein.
|
|
|
10.3*
|
KB Home 1988 Employee Stock Plan, as amended and restated on October 2, 2008, filed as an exhibit to our 2008 Annual Report on Form 10-K (File No. 001-09195), is incorporated by reference herein.
|
|
122
|
Exhibit
Number
|
Description
|
|
|
10.4*
|
Kaufman and Broad Home Corporation Directors’ Deferred Compensation Plan established effective as of July 27, 1989, filed as an exhibit to our 2007 Annual Report on Form 10-K (File No. 001-09195), is incorporated by reference herein.
|
|
|
10.5*
|
KB Home Performance-Based Incentive Plan for Senior Management, as amended and restated on October 2, 2008, filed as an exhibit to our 2008 Annual Report on Form 10-K (File No. 001-09195), is incorporated by reference herein.
|
|
|
10.6*
|
Form of Stock Option Agreement under KB Home Performance-Based Incentive Plan for Senior Management, filed as an exhibit to our 1995 Annual Report on Form 10-K (File No. 001-09195), is incorporated by reference herein.
|
|
|
10.7*
|
KB Home 1998 Stock Incentive Plan, as amended and restated on October 2, 2008, filed as an exhibit to our 2008 Annual Report on Form 10-K (File No. 001-09195), is incorporated by reference herein.
|
|
|
10.8
|
KB Home Directors’ Legacy Program, as amended January 1, 1999, filed as an exhibit to our 1998 Annual Report on Form 10-K (File No. 001-09195), is incorporated by reference herein.
|
|
|
10.9
|
Trust Agreement between Kaufman and Broad Home Corporation and Wachovia Bank, N.A. as Trustee, dated as of August 27, 1999, filed as an exhibit to our 1999 Annual Report on Form 10-K (File No. 001-09195), is incorporated by reference herein.
|
|
|
10.10*
|
Amended and Restated KB Home 1999 Incentive Plan, as amended and restated on October 2, 2008, filed as an exhibit to our 2008 Annual Report on Form 10-K (File No. 001-09195), is incorporated by reference herein.
|
|
|
10.11*
|
Form of Non-Qualified Stock Option Agreement under our Amended and Restated 1999 Incentive Plan, filed as an exhibit to our 2011 Annual Report on Form 10-K (File No. 001-09195), is incorporated by reference herein.
|
|
|
10.12*
|
Form of Restricted Stock Agreement under our Amended and Restated 1999 Incentive Plan, filed as an exhibit to our 2011 Annual Report on Form 10-K (File No. 001-09195), is incorporated by reference herein.
|
|
|
10.13*
|
KB Home 2001 Stock Incentive Plan, as amended and restated on October 2, 2008, filed as an exhibit to our 2008 Annual Report on Form 10-K (File No. 001-09195), is incorporated by reference herein.
|
|
|
10.14*
|
Form of Stock Option Agreement under our 2001 Stock Incentive Plan, filed as an exhibit to our 2011 Annual Report on Form 10-K (File No. 001-09195), is incorporated by reference herein.
|
|
|
10.15*
|
Form of Stock Restriction Agreement under our 2001 Stock Incentive Plan, filed as an exhibit to our 2011 Annual Report on Form 10-K (File No. 001-09195), is incorporated by reference herein.
|
|
|
10.16*
|
KB Home Nonqualified Deferred Compensation Plan with respect to deferrals prior to January 1, 2005, effective March 1, 2001, filed as an exhibit to our 2001 Annual Report on Form 10-K (File No. 001-09195), is incorporated by reference herein.
|
|
|
10.17*
|
KB Home Nonqualified Deferred Compensation Plan with respect to deferrals on and after January 1, 2005, effective January 1, 2009 (File No. 001-09195), filed as an exhibit to our 2008 Annual Report on Form 10-K, is incorporated by reference herein.
|
|
|
10.18*
|
KB Home Change in Control Severance Plan, as amended and restated effective January 1, 2009, filed as an exhibit to our 2008 Annual Report on Form 10-K (File No. 001-09195), is incorporated by reference herein.
|
|
|
10.19*
|
KB Home Death Benefit Only Plan, filed as an exhibit to our 2001 Annual Report on Form 10-K (File No. 001-09195), is incorporated by reference herein.
|
|
|
10.20*
|
Amendment No. 1 to the KB Home Death Benefit Only Plan, effective as of January 1, 2009, filed as an exhibit to our 2008 Annual Report on Form 10-K (File No. 001-09195), is incorporated by reference herein.
|
|
|
10.21*
|
KB Home Retirement Plan, as amended and restated effective January 1, 2009, filed as an exhibit to our 2008 Annual Report on Form 10-K (File No. 001-09195), is incorporated by reference herein.
|
|
|
10.22*
|
Employment Agreement of Jeffrey T. Mezger, dated February 28, 2007, filed as an exhibit to our Current Report on Form 8-K dated March 6, 2007 (File No. 001-09195), is incorporated by reference herein.
|
|
|
10.23*
|
Amendment to the Employment Agreement of Jeffrey T. Mezger, dated December 24, 2008, filed as an exhibit to our 2008 Annual Report on Form 10-K (File No. 001-09195), is incorporated by reference herein.
|
|
|
10.24*
|
Form of Stock Option Agreement under the Employment Agreement between us and Jeffrey T. Mezger dated as of February 28, 2007, filed as an exhibit to our Current Report on Form 8-K dated July 18, 2007 (File No. 001-09195), is incorporated by reference herein.
|
|
123
|
Exhibit
Number
|
Description
|
|
|
10.25*
|
Form of Stock Option Agreement under the Amended and Restated 1999 Incentive Plan for stock option grant to Jeffrey T. Mezger, filed as an exhibit to our Quarterly Report on Form 10-Q for the quarter ended August 31, 2007 (File No. 001-09195), is incorporated by reference herein.
|
|
|
10.26*
|
Policy Regarding Stockholder Approval of Certain Severance Payments, adopted July 10, 2008, filed as an exhibit to our Current Report on Form 8-K dated July 15, 2008 (File No. 001-09195), is incorporated by reference herein.
|
|
|
10.27*
|
KB Home Executive Severance Plan, filed as an exhibit to our Quarterly Report on Form 10-Q for the quarter ended August 31, 2008 (File No. 001-09195), is incorporated by reference herein.
|
|
|
10.28*
|
Form of Fiscal Year 2009 Phantom Shares Agreement, filed as an exhibit to our Current Report on Form 8-K dated October 8, 2008 (File No. 001-09195), is incorporated by reference herein.
|
|
|
10.29*
|
KB Home Annual Incentive Plan for Executive Officers, filed as Attachment C to our Proxy Statement on Schedule 14A for the 2009 Annual Meeting of Stockholders (File No. 001-09195), is incorporated by reference herein.
|
|
|
10.30
|
Amendment to Trust Agreement by and between KB Home and Wachovia Bank, N.A., dated August 24, 2009, filed as an exhibit to our Quarterly Report on Form 10-Q for the quarter ended August 31, 2009 (File No. 001-09195), is incorporated by reference herein.
|
|
|
10.31
|
Form of Indemnification Agreement, filed as an exhibit to our Current Report on Form 8-K dated April 2, 2010 (File No. 001-09195), is incorporated by reference herein.
|
|
|
10.32*
|
KB Home 2010 Equity Incentive Plan, filed as an exhibit to our Quarterly Report on Form 10-Q for the quarter ended February 28, 2010 (File No. 001-09195), is incorporated by reference herein.
|
|
|
10.33*
|
Form of Stock Option Award Agreement under the KB Home 2010 Equity Incentive Plan, filed as an exhibit to our Current Report on Form 8-K dated July 20, 2010 (File No. 001-09195), is incorporated by reference herein.
|
|
|
10.34*
|
Form of Restricted Stock Award Agreement under the KB Home 2010 Equity Incentive Plan, filed as an exhibit to our Current Report on Form 8-K dated July 20, 2010 (File No. 001-09195), is incorporated by reference herein.
|
|
|
10.35*
|
Form of Fiscal Year 2011 Restricted Cash Award Agreement, filed as an exhibit to our Current Report on Form 8-K dated October 13, 2010 (File No. 001-09195), is incorporated by reference herein.
|
|
|
10.36*
|
KB Home 2010 Equity Incentive Plan Stock Option Agreement for performance stock option grant to Jeffrey T. Mezger, filed as an exhibit to our 2010 Annual Report on Form 10-K (File No. 001-09195), is incorporated by reference herein.
|
|
|
10.37*
|
Amendment to the KB Home 2010 Equity Incentive Plan, filed as an exhibit to our Quarterly Report on Form 10-Q for the quarter ended February 28, 2011 (File No. 001-09195), is incorporated by reference herein.
|
|
|
10.38*
|
Executive Severance Benefit Decisions, filed as an exhibit to our Quarterly Report on Form 10-Q for the quarter ended February 28, 2011 (File No. 001-09195), is incorporated by reference herein.
|
|
|
10.39
|
Consensual agreement effective June 10, 2011, filed as an exhibit to our Quarterly Report on Form 10-Q for the quarter ended August 31, 2011 (File No. 001-09195), is incorporated by reference herein.
|
|
|
10.40*
|
Form of 2010 Equity Incentive Plan Performance Cash Award Agreement, filed as an exhibit to our Current Report on Form 8-K dated October 12, 2011 (File No. 001-09195), is incorporated by reference herein.
|
|
|
10.41*
|
KB Home 2010 Equity Incentive Plan Stock Option Agreement for performance stock option grant to Jeffrey T. Mezger, filed as an exhibit to our 2011 Annual Report on Form 10-K (File No. 001-09195), is incorporated by reference herein.
|
|
|
10.42*
|
Form of KB Home 2010 Equity Incentive Plan Performance-Based Restricted Stock Unit Award Agreement, filed as an exhibit to our 2012 Annual Report on Form 10-K (File No. 001-09195), is incorporated by reference herein.
|
|
|
10.43*
|
KB Home 2010 Equity Incentive Plan Performance-Based Restricted Stock Unit Award Agreement for performance-based restricted stock unit award to Jeffrey T. Mezger, filed as an exhibit to our 2012 Annual Report on Form 10-K (File No. 001-09195), is incorporated by reference herein.
|
|
|
10.44*
|
Form of KB Home 2010 Equity Incentive Plan Restricted Stock Unit Award Agreement, filed as an exhibit to our 2012 Annual Report on Form 10-K (File No. 001-09195), is incorporated by reference herein.
|
|
124
|
Exhibit
Number
|
Description
|
|
|
10.45
|
Revolving Loan Agreement, dated as of March 12, 2013, among us, the banks party thereto, and Citibank, N.A., as Administrative Agent, filed as an exhibit to our Quarterly Report on Form 10-Q for the quarter ended May 31, 2013 (File No. 001-09195), is incorporated by reference herein.
|
|
|
10.46
|
Amended and Restated KB Home Non-Employee Directors Compensation Plan, effective July 18, 2013, filed as an exhibit to our Quarterly Report on Form 10-Q for the quarter ended August 31, 2013 (File No. 001-09195), is incorporated by reference herein.
|
|
|
10.47†
|
First Amendment to the Revolving Loan Agreement, dated as of November 19, 2013, among us, the banks party thereto, and Citibank, N.A., as Administrative Agent.
|
|
|
12.1†
|
Computation of Ratio of Earnings to Fixed Charges.
|
|
|
21†
|
Subsidiaries of the Registrant.
|
|
|
23†
|
Consent of Independent Registered Public Accounting Firm.
|
|
|
31.1†
|
Certification of Jeffrey T. Mezger, President and Chief Executive Officer of KB Home Pursuant to Section 302 of the Sarbanes-Oxley Act of 2002.
|
|
|
31.2†
|
Certification of Jeff J. Kaminski, Executive Vice President and Chief Financial Officer of KB Home Pursuant to Section 302 of the Sarbanes-Oxley Act of 2002.
|
|
|
32.1†
|
Certification of Jeffrey T. Mezger, President and Chief Executive Officer of KB Home Pursuant to 18 U.S.C. Section 1350, as Adopted Pursuant to Section 906 of the Sarbanes-Oxley Act of 2002.
|
|
|
32.2†
|
Certification of Jeff J. Kaminski, Executive Vice President and Chief Financial Officer of KB Home Pursuant to 18 U.S.C. Section 1350, as Adopted Pursuant to Section 906 of the Sarbanes-Oxley Act of 2002.
|
|
|
101†
|
The following materials from KB Home’s Annual Report on Form 10-K for the year ended November 30, 2013, formatted in eXtensible Business Reporting Language (XBRL): (a) Consolidated Statements of Operations for the years ended November 30, 2013, 2012 and 2011, (b) Consolidated Statements of Comprehensive Income (Loss) for the Years Ended November 30, 2013, 2012 and 2011, (c) Consolidated Balance Sheets as of November 30, 2013 and 2012, (d) Consolidated Statements of Stockholders’ Equity for the years ended November 30, 2013, 2012 and 2011, (e) Consolidated Statements of Cash Flows for the years ended November 30, 2013, 2012 and 2011, and (f) the Notes to Consolidated Financial Statements.
|
|
* Management contract or compensatory plan or arrangement in which executive officers are eligible to participate.
† Document filed with this Form 10-K.
125
SIGNATURES
Pursuant to the requirements of Section 13 or 15(d) of the Securities Exchange Act of 1934, the registrant has duly caused this report to be signed on its behalf by the undersigned, thereunto duly authorized.
|
KB Home
|
||
|
By:
|
/
S
/ JEFF J. KAMINSKI
|
|
|
Jeff J. Kaminski
|
||
|
Executive Vice President and Chief Financial Officer
|
||
|
Date: January 24, 2014
|
||
Pursuant to the requirements of the Securities Exchange Act of 1934, this report has been signed below by the following persons on behalf of the registrant and in the capacities and on the dates indicated:
|
Signature
|
Title
|
Date
|
||
|
/
S
/ JEFFREY T. MEZGER
|
Director, President and
Chief Executive Officer
(Principal Executive Officer)
|
January 24, 2014
|
||
|
Jeffrey T. Mezger
|
||||
|
/
S
/ JEFF J. KAMINSKI
|
Executive Vice President and
Chief Financial Officer
(Principal Financial Officer)
|
January 24, 2014
|
||
|
Jeff J. Kaminski
|
||||
|
/
S
/ WILLIAM R. HOLLINGER
|
Senior Vice President and
Chief Accounting Officer
(Principal Accounting Officer)
|
January 24, 2014
|
||
|
William R. Hollinger
|
||||
|
/
S
/ STEPHEN F. BOLLENBACH
|
Chairman of the Board and Director
|
January 24, 2014
|
||
|
Stephen F. Bollenbach
|
||||
|
/
S
/ BARBARA T. ALEXANDER
|
Director
|
January 24, 2014
|
||
|
Barbara T. Alexander
|
||||
|
/
S
/ TIMOTHY W. FINCHEM
|
Director
|
January 24, 2014
|
||
|
Timothy W. Finchem
|
||||
|
/
S
/ THOMAS W. GILLIGAN
|
Director
|
January 24, 2014
|
||
|
Thomas W. Gilligan
|
||||
|
/
S
/ KENNETH M. JASTROW, II
|
Director
|
January 24, 2014
|
||
|
Kenneth M. Jastrow, II
|
||||
|
/
S
/ ROBERT L. JOHNSON
|
Director
|
January 24, 2014
|
||
|
Robert L. Johnson
|
||||
|
/
S
/ MELISSA LORA
|
Director
|
January 24, 2014
|
||
|
Melissa Lora
|
||||
|
/
S
/ MICHAEL G. MCCAFFERY
|
Director
|
January 24, 2014
|
||
|
Michael G. McCaffery
|
||||
|
/
S
/ LUIS G. NOGALES
|
Director
|
January 24, 2014
|
||
|
Luis G. Nogales
|
||||
126
LIST OF EXHIBITS FILED
|
Exhibit
Number
|
Description
|
Sequential
Page
Number
|
||
|
3.1
|
Restated Certificate of Incorporation, as amended, filed as an exhibit to our Current Report on Form 8-K dated April 7, 2009 (File No. 001-09195), is incorporated by reference herein.
|
|||
|
3.2
|
By-Laws, as amended and restated on April 5, 2007, filed as an exhibit to our Quarterly Report on Form 10-Q for the quarter ended February 28, 2007 (File No. 001-09195), is incorporated by reference herein.
|
|||
|
4.1
|
Rights Agreement between us and Mellon Investor Services LLC, as rights agent, dated January 22, 2009, filed as an exhibit to our Current Report on Form 8-K/A dated January 28, 2009 (File No. 001-09195), is incorporated by reference herein.
|
|||
|
4.2
|
Indenture and Supplemental Indenture relating to 5 3/4% Senior Notes due 2014 among us, the Guarantors and Sun Trust Bank, Atlanta, each dated January 28, 2004, filed as exhibits to our Registration Statement No. 333-114761 on Form S-4, are incorporated by reference herein.
|
|||
|
4.3
|
Third Supplemental Indenture relating to our Senior Notes by and between us, the Guarantors named therein, the Subsidiary Guarantor named therein and SunTrust Bank, dated as of May 1, 2006, filed as an exhibit to our Current Report on Form 8-K dated May 3, 2006 (File No. 001-09195), is incorporated by reference herein.
|
|||
|
4.4
|
Fourth Supplemental Indenture relating to our Senior Notes by and between us, the Guarantors named therein and U.S. Bank National Association, dated as of November 9, 2006, filed as an exhibit to our Current Report on Form 8-K dated November 13, 2006 (File No. 001-09195), is incorporated by reference herein.
|
|||
|
4.5
|
Fifth Supplemental Indenture, dated August 17, 2007, relating to our Senior Notes by and between us, the Guarantors, and the Trustee, filed as an exhibit to our Current Report on Form 8-K dated August 22, 2007 (File No. 001-09195), is incorporated by reference herein.
|
|||
|
4.6
|
Sixth Supplemental Indenture, dated as of January 30, 2012, relating to our Senior Notes by and between us, the Guarantors and the Trustee, filed as an exhibit to our Current Report on Form 8-K dated February 2, 2012 (File No. 001-09195), is incorporated by reference herein.
|
|||
|
4.7
|
Seventh Supplemental Indenture, dated as of January 11, 2013, relating to our Senior Notes by and among us, the Guarantors and the Trustee, filed as an exhibit to our Current Report on Form 8-K dated January 11, 2013 (File No. 001-09195), is incorporated by reference herein.
|
|||
|
4.8
|
Specimen of 5 3/4% Senior Notes due 2014, filed as an exhibit to our Registration Statement No. 333-114761 on Form S-4, is incorporated by reference herein.
|
|||
|
4.9
|
Specimen of 5 7/8% Senior Notes due 2015, filed as an exhibit to our Current Report on Form 8-K dated December 15, 2004 (File No. 001-09195), is incorporated by reference herein.
|
|||
|
4.10
|
Form of officers’ certificates and guarantors’ certificates establishing the terms of the 5 7/8% Senior Notes due 2015, filed as an exhibit to our Current Report on Form 8-K dated December 15, 2004 (File No. 001-09195), is incorporated by reference herein.
|
|||
|
4.11
|
Specimen of 6 1/4% Senior Notes due 2015, filed as an exhibit to our Current Report on Form 8-K dated June 2, 2005 (File No. 001-09195), is incorporated by reference herein.
|
|||
|
4.12
|
Form of officers’ certificates and guarantors’ certificates establishing the terms of the 6 1/4% Senior Notes due 2015, filed as an exhibit to our Current Report on Form 8-K dated June 2, 2005 (File No. 001-09195), is incorporated by reference herein.
|
|||
|
4.13
|
Specimen of 6 1/4% Senior Notes due 2015, filed as an exhibit to our Current Report on Form 8-K dated June 27, 2005 (File No. 001-09195), is incorporated by reference herein.
|
|||
|
4.14
|
Form of officers’ certificates and guarantors’ certificates establishing the terms of the 6 1/4% Senior Notes due 2015, filed as an exhibit to our Current Report on Form 8-K dated June 27, 2005 (File No. 001-09195), is incorporated by reference herein.
|
|||
|
4.15
|
Specimen of 7 1/4% Senior Notes due 2018, filed as an exhibit to our Current Report on Form 8-K dated April 3, 2006 (File No. 001-09195), is incorporated by reference herein.
|
|||
127
|
Exhibit
Number
|
Description
|
Sequential
Page
Number
|
||
|
4.16
|
Form of officers’ certificates and guarantors’ certificates establishing the terms of the 7 1/4% Senior Notes due 2018, filed as an exhibit to our Current Report on Form 8-K dated April 3, 2006 (File No. 001-09195), is incorporated by reference herein.
|
|||
|
4.17
|
Specimen of 9.100% Senior Notes due 2017, filed as an exhibit to our Current Report on Form 8-K dated July 30, 2009 (File No. 001-09195), is incorporated by reference herein.
|
|||
|
4.18
|
Form of officers’ certificates and guarantors’ certificates establishing the terms of the 9.100% Senior Notes due 2017, filed as an exhibit to our Current Report on Form 8-K dated July 30, 2009 (File No. 001-09195), is incorporated by reference herein.
|
|||
|
4.19
|
Specimen of 8.00% Senior Notes due 2020, filed as an exhibit to our Current Report on Form 8-K dated February 7, 2012 (File No. 001-09195), is incorporated by reference herein.
|
|||
|
4.20
|
Form of officers’ certificates and guarantors’ certificates establishing the terms of the 8.00% Senior Notes due 2020, filed as an exhibit to our Current Report on Form 8-K dated February 7, 2012 (File No. 001-09195), is incorporated by reference herein.
|
|||
|
4.21
|
Specimen of 7.50% Senior Notes due 2022, filed as an exhibit to our Current Report on Form 8-K dated July 31, 2012 (File No. 001-09195), is incorporated by reference herein.
|
|||
|
4.22
|
Form of officers’ certificates and guarantors’ certificates establishing the terms of the 7.50% Senior Notes due 2022, filed as an exhibit to our Current Report on Form 8-K dated July 31, 2012 (File No. 001-09195), is incorporated by reference herein.
|
|||
|
4.23
|
Form of officers’ certificate and guarantors’ officers’ certificates establishing the form and terms of the 1.375% Convertible Senior Notes due 2019, filed as an exhibit to our Current Report on Form 8-K dated January 29, 2013 (File No. 001-09195), is incorporated by reference herein.
|
|||
|
4.24
|
Form of 1.375% Convertible Senior Notes due 2019, filed as an exhibit to our Current Report on Form 8-K dated January 29, 2013 (File No. 001-09195), is incorporated by reference herein.
|
|||
|
4.25
|
Form of supplemental officers’ certificate and guarantors’ officers’ certificates establishing the form and terms of the 1.375% Convertible Senior Notes due 2019, filed as an exhibit to our Quarterly Report on Form 10-Q for the quarter ended February 28, 2013 (File No. 001-09195), is incorporated by reference herein.
|
|||
|
4.26
|
Eighth Supplemental Indenture, dated as of March 12, 2013, by and among us, the Guarantors party thereto, the Additional Guarantors named therein and U.S. Bank National Association, as Trustee, filed as an exhibit to our Quarterly Report on Form 10-Q for the quarter ended May 31, 2013 (File No. 001-09195), is incorporated by reference herein.
|
|||
|
4.27
|
Specimen of 7.00% Senior Notes due 2021, filed as an exhibit to our Current Report on Form 8-K dated October 29, 2013 (File No. 001-09195), is incorporated by reference herein.
|
|||
|
4.28
|
Form of officers’ certificates and guarantors’ certificates establishing the terms of the 7.00% Senior Notes due 2021, filed as an exhibit to our Current Report on Form 8-K dated October 29, 2013 (File No. 001-09195), is incorporated by reference herein.
|
|||
|
10.1*
|
Kaufman and Broad, Inc. Executive Deferred Compensation Plan, effective as of July 11, 1985, filed as an exhibit to our 2007 Annual Report on Form 10-K (File No. 001-09195), is incorporated by reference herein.
|
|||
|
10.2*
|
Amendment to Kaufman and Broad, Inc. Executive Deferred Compensation Plan for amounts earned or vested on or after January 1, 2005, effective January 1, 2009, filed as an exhibit to our 2008 Annual Report on Form 10-K (File No. 001-09195), is incorporated by reference herein.
|
|||
|
10.3*
|
KB Home 1988 Employee Stock Plan, as amended and restated on October 2, 2008, filed as an exhibit to our 2008 Annual Report on Form 10-K (File No. 001-09195), is incorporated by reference herein.
|
|||
|
10.4*
|
Kaufman and Broad Home Corporation Directors’ Deferred Compensation Plan established effective as of July 27, 1989, filed as an exhibit to our 2007 Annual Report on Form 10-K (File No. 001-09195), is incorporated by reference herein.
|
|||
128
|
Exhibit
Number
|
Description
|
Sequential
Page
Number
|
||
|
10.5*
|
KB Home Performance-Based Incentive Plan for Senior Management, as amended and restated on October 2, 2008, filed as an exhibit to our 2008 Annual Report on Form 10-K (File No. 001-09195), is incorporated by reference herein.
|
|||
|
10.6*
|
Form of Stock Option Agreement under KB Home Performance-Based Incentive Plan for Senior Management, filed as an exhibit to our 1995 Annual Report on Form 10-K (File No. 001-09195), is incorporated by reference herein.
|
|||
|
10.7*
|
KB Home 1998 Stock Incentive Plan, as amended and restated on October 2, 2008, filed as an exhibit to our 2008 Annual Report on Form 10-K (File No. 001-09195), is incorporated by reference herein.
|
|||
|
10.8
|
KB Home Directors’ Legacy Program, as amended January 1, 1999, filed as an exhibit to our 1998 Annual Report on Form 10-K (File No. 001-09195), is incorporated by reference herein.
|
|||
|
10.9
|
Trust Agreement between Kaufman and Broad Home Corporation and Wachovia Bank, N.A. as Trustee, dated as of August 27, 1999, filed as an exhibit to our 1999 Annual Report on Form 10-K (File No. 001-09195), is incorporated by reference herein.
|
|||
|
10.10*
|
Amended and Restated KB Home 1999 Incentive Plan, as amended and restated on October 2, 2008, filed as an exhibit to our 2008 Annual Report on Form 10-K (File No. 001-09195), is incorporated by reference herein.
|
|||
|
10.11*
|
Form of Non-Qualified Stock Option Agreement under our Amended and Restated 1999 Incentive Plan, filed as an exhibit to our 2011 Annual Report on Form 10-K (File No. 001-09195), is incorporated by reference herein.
|
|||
|
10.12*
|
Form of Restricted Stock Agreement under our Amended and Restated 1999 Incentive Plan, filed as an exhibit to our 2011 Annual Report on Form 10-K (File No. 001-09195), is incorporated by reference herein.
|
|||
|
10.13*
|
KB Home 2001 Stock Incentive Plan, as amended and restated on October 2, 2008, filed as an exhibit to our 2008 Annual Report on Form 10-K (File No. 001-09195), is incorporated by reference herein.
|
|||
|
10.14*
|
Form of Stock Option Agreement under our 2001 Stock Incentive Plan, filed as an exhibit to our 2011 Annual Report on Form 10-K (File No. 001-09195), is incorporated by reference herein.
|
|||
|
10.15*
|
Form of Stock Restriction Agreement under our 2001 Stock Incentive Plan, filed as an exhibit to our 2011 Annual Report on Form 10-K (File No. 001-09195), is incorporated by reference herein.
|
|||
|
10.16*
|
KB Home Nonqualified Deferred Compensation Plan with respect to deferrals prior to January 1, 2005, effective March 1, 2001, filed as an exhibit to our 2001 Annual Report on Form 10-K (File No. 001-09195), is incorporated by reference herein.
|
|||
|
10.17*
|
KB Home Nonqualified Deferred Compensation Plan with respect to deferrals on and after January 1, 2005, effective January 1, 2009 (File No. 001-09195), filed as an exhibit to our 2008 Annual Report on Form 10-K, is incorporated by reference herein.
|
|||
|
10.18*
|
KB Home Change in Control Severance Plan, as amended and restated effective January 1, 2009, filed as an exhibit to our 2008 Annual Report on Form 10-K (File No. 001-09195), is incorporated by reference herein.
|
|||
|
10.19*
|
KB Home Death Benefit Only Plan, filed as an exhibit to our 2001 Annual Report on Form 10-K (File No. 001-09195), is incorporated by reference herein.
|
|||
|
10.20*
|
Amendment No. 1 to the KB Home Death Benefit Only Plan, effective as of January 1, 2009, filed as an exhibit to our 2008 Annual Report on Form 10-K (File No. 001-09195), is incorporated by reference herein.
|
|||
|
10.21*
|
KB Home Retirement Plan, as amended and restated effective January 1, 2009, filed as an exhibit to our 2008 Annual Report on Form 10-K (File No. 001-09195), is incorporated by reference herein.
|
|||
|
10.22*
|
Employment Agreement of Jeffrey T. Mezger, dated February 28, 2007, filed as an exhibit to our Current Report on Form 8-K dated March 6, 2007 (File No. 001-09195), is incorporated by reference herein.
|
|||
129
|
Exhibit
Number
|
Description
|
Sequential
Page
Number
|
||
|
10.23*
|
Amendment to the Employment Agreement of Jeffrey T. Mezger, dated December 24, 2008, filed as an exhibit to our 2008 Annual Report on Form 10-K (File No. 001-09195), is incorporated by reference herein.
|
|||
|
10.24*
|
Form of Stock Option Agreement under the Employment Agreement between us and Jeffrey T. Mezger dated as of February 28, 2007, filed as an exhibit to our Current Report on Form 8-K dated July 18, 2007 (File No. 001-09195), is incorporated by reference herein.
|
|||
|
10.25*
|
Form of Stock Option Agreement under the Amended and Restated 1999 Incentive Plan for stock option grant to Jeffrey T. Mezger, filed as an exhibit to our Quarterly Report on Form 10-Q for the quarter ended August 31, 2007 (File No. 001-09195), is incorporated by reference herein.
|
|||
|
10.26*
|
Policy Regarding Stockholder Approval of Certain Severance Payments, adopted July 10, 2008, filed as an exhibit to our Current Report on Form 8-K dated July 15, 2008 (File No. 001-09195), is incorporated by reference herein.
|
|||
|
10.27*
|
KB Home Executive Severance Plan, filed as an exhibit to our Quarterly Report on Form 10-Q for the quarter ended August 31, 2008 (File No. 001-09195), is incorporated by reference herein.
|
|||
|
10.28*
|
Form of Fiscal Year 2009 Phantom Shares Agreement, filed as an exhibit to our Current Report on Form 8-K dated October 8, 2008 (File No. 001-09195), is incorporated by reference herein.
|
|||
|
10.29*
|
KB Home Annual Incentive Plan for Executive Officers, filed as Attachment C to our Proxy Statement on Schedule 14A for the 2009 Annual Meeting of Stockholders (File No. 001-09195), is incorporated by reference herein.
|
|||
|
10.30
|
Amendment to Trust Agreement by and between KB Home and Wachovia Bank, N.A., dated August 24, 2009, filed as an exhibit to our Quarterly Report on Form 10-Q for the quarter ended August 31, 2009 (File No. 001-09195), is incorporated by reference herein.
|
|||
|
10.31
|
Form of Indemnification Agreement, filed as an exhibit to our Current Report on Form 8-K dated April 2, 2010 (File No. 001-09195), is incorporated by reference herein.
|
|||
|
10.32*
|
KB Home 2010 Equity Incentive Plan, filed as an exhibit to our Quarterly Report on Form 10-Q for the quarter ended February 28, 2010 (File No. 001-09195), is incorporated by reference herein.
|
|||
|
10.33*
|
Form of Stock Option Award Agreement under the KB Home 2010 Equity Incentive Plan, filed as an exhibit to our Current Report on Form 8-K dated July 20, 2010 (File No. 001-09195), is incorporated by reference herein.
|
|||
|
10.34*
|
Form of Restricted Stock Award Agreement under the KB Home 2010 Equity Incentive Plan, filed as an exhibit to our Current Report on Form 8-K dated July 20, 2010 (File No. 001-09195), is incorporated by reference herein.
|
|||
|
10.35*
|
Form of Fiscal Year 2011 Restricted Cash Award Agreement, filed as an exhibit to our Current Report on Form 8-K dated October 13, 2010 (File No. 001-09195), is incorporated by reference herein.
|
|||
|
10.36*
|
KB Home 2010 Equity Incentive Plan Stock Option Agreement for performance stock option grant to Jeffrey T. Mezger, filed as an exhibit to our 2010 Annual Report on Form 10-K (File No. 001-09195), is incorporated by reference herein.
|
|||
|
10.37*
|
Amendment to the KB Home 2010 Equity Incentive Plan, filed as an exhibit to our Quarterly Report on Form 10-Q for the quarter ended February 28, 2011 (File No. 001-09195), is incorporated by reference herein.
|
|||
|
10.38*
|
Executive Severance Benefit Decisions, filed as an exhibit to our Quarterly Report on Form 10-Q for the quarter ended February 28, 2011 (File No. 001-09195), is incorporated by reference herein.
|
|||
|
10.39
|
Consensual agreement effective June 10, 2011, filed as an exhibit to our Quarterly Report on Form 10-Q for the quarter ended August 31, 2011 (File No. 001-09195), is incorporated by reference herein.
|
|||
|
10.40*
|
Form of 2010 Equity Incentive Plan Performance Cash Award Agreement, filed as an exhibit to our Current Report on Form 8-K dated October 12, 2011 (File No. 001-09195), is incorporated by reference herein.
|
|||
130
|
Exhibit
Number
|
Description
|
Sequential
Page
Number
|
||
|
10.41*
|
KB Home 2010 Equity Incentive Plan Stock Option Agreement for performance stock option grant to Jeffrey T. Mezger, filed as an exhibit to our 2011 Annual Report on Form 10-K (File No. 001-09195), is incorporated by reference herein.
|
|||
|
10.42*
|
Form of KB Home 2010 Equity Incentive Plan Performance-Based Restricted Stock Unit Award Agreement, filed as an exhibit to our 2012 Annual Report on Form 10-K (File No. 001-09195), is incorporated by reference herein.
|
|||
|
10.43*
|
KB Home 2010 Equity Incentive Plan Performance-Based Restricted Stock Unit Award Agreement for performance-based restricted stock unit award to Jeffrey T. Mezger, filed as an exhibit to our 2012 Annual Report on Form 10-K (File No. 001-09195), is incorporated by reference herein.
|
|||
|
10.44*
|
Form of KB Home 2010 Equity Incentive Plan Restricted Stock Unit Award Agreement, filed as an exhibit to our 2012 Annual Report on Form 10-K (File No. 001-09195), is incorporated by reference herein.
|
|||
|
10.45
|
Revolving Loan Agreement, dated as of March 12, 2013, among us, the banks party thereto, and Citibank, N.A., as Administrative Agent, filed as an exhibit to our Quarterly Report on Form 10-Q for the quarter ended May 31, 2013 (File No. 001-09195), is incorporated by reference herein.
|
|||
|
10.46
|
Amended and Restated KB Home Non-Employee Directors Compensation Plan, effective July 18, 2013, filed as an exhibit to our Quarterly Report on Form 10-Q for the quarter ended August 31, 2013 (File No. 001-09195), is incorporated by reference herein.
|
|||
|
10.47†
|
First Amendment to the Revolving Loan Agreement, dated as of November 19, 2013, among us, the banks party thereto, and Citibank, N.A., as Administrative Agent.
|
|||
|
12.1†
|
Computation of Ratio of Earnings to Fixed Charges.
|
|||
|
21†
|
Subsidiaries of the Registrant.
|
|||
|
23†
|
Consent of Independent Registered Public Accounting Firm.
|
|||
|
31.1†
|
Certification of Jeffrey T. Mezger, President and Chief Executive Officer of KB Home Pursuant to Section 302 of the Sarbanes-Oxley Act of 2002.
|
|||
|
31.2†
|
Certification of Jeff J. Kaminski, Executive Vice President and Chief Financial Officer of KB Home Pursuant to Section 302 of the Sarbanes-Oxley Act of 2002.
|
|||
|
32.1†
|
Certification of Jeffrey T. Mezger, President and Chief Executive Officer of KB Home Pursuant to 18 U.S.C. Section 1350, as Adopted Pursuant to Section 906 of the Sarbanes-Oxley Act of 2002.
|
|||
|
32.2†
|
Certification of Jeff J. Kaminski, Executive Vice President and Chief Financial Officer of KB Home Pursuant to 18 U.S.C. Section 1350, as Adopted Pursuant to Section 906 of the Sarbanes-Oxley Act of 2002.
|
|||
|
101†
|
The following materials from KB Home’s Annual Report on Form 10-K for the year ended November 30, 2013, formatted in eXtensible Business Reporting Language (XBRL): (a) Consolidated Statements of Operations for the years ended November 30, 2013, 2012 and 2011, (b) Consolidated Statements of Comprehensive Income (Loss) for the Years Ended November 30, 2013, 2012 and 2011, (c) Consolidated Balance Sheets as of November 30, 2013 and 2012, (d) Consolidated Statements of Stockholders’ Equity for the years ended November 30, 2013, 2012 and 2011, (e) Consolidated Statements of Cash Flows for the years ended November 30, 2013, 2012 and 2011, and (f) the Notes to Consolidated Financial Statements.
|
|||
* Management contract or compensatory plan or arrangement in which executive officers are eligible to participate.
† Document filed with this Form 10-K.
131
TABLE OF CONTENTS
Part IItem 1. BusinessItem 1A. Risk FactorsItem 1B. Unresolved Staff CommentsItem 2. PropertiesItem 3. Legal ProceedingsItem 4. Mine Safety DisclosuresPart IIItem 5. Market For Registrant S Common Equity, Related Stockholder Matters and Issuer Purchases Of Equity SecuritiesItem 6. Selected Financial DataItem 7. Management S Discussion and Analysis Of Financial Condition and Results Of OperationsItem 7A. Quantitative and Qualitative Disclosures About Market RiskItem 8. Financial Statements and Supplementary DataNote 1. Summary Of Significant Accounting PoliciesNote 2. Segment InformationNote 3. Financial ServicesNote 4. Earnings (loss) Per ShareNote 5. ReceivablesNote 6. InventoriesNote 7. Inventory Impairments and Land Option Contract AbandonmentsNote 8. Variable Interest EntitiesNote 9. Investments in Unconsolidated Joint VenturesNote 10. Other AssetsNote 11. Accrued Expenses and Other LiabilitiesNote 12. Income TaxesNote 13. Mortgages and Notes PayableNote 14. Fair Value DisclosuresNote 15. Commitments and ContingenciesNote 16. Legal MattersNote 17. Stockholders EquityNote 18. Accumulated Other Comprehensive LossNote 19. Employee Benefit and Stock PlansNote 20. Postretirement BenefitsNote 21. Supplemental Disclosure To Consolidated Statements Of Cash FlowsNote 22. Supplemental Guarantor InformationNote 23. Quarterly Results (unaudited)Item 9. Changes in and Disagreements with Accountants on Accounting and Financial DisclosureItem 9A. Controls and ProceduresItem 9B. Other InformationPart IIIItem 10. Directors, Executive Officers and Corporate GovernanceItem 11. Executive CompensationItem 12. Security Ownership Of Certain Beneficial Owners and Management and Related Stockholder MattersItem 13. Certain Relationships and Related Transactions, and Director IndependenceItem 14. Principal Accounting Fees and ServicesPart IVItem 15. Exhibits, Financial Statement Schedules