KB HOME
10-Ks and 10-Qs
|
|
|
|
|
|
|
|
|
|
|
|
|
|
|
|
|
|
|
|
|
|
|
|
|
|
|
|
|
|
|
|
|
|
|
|
|
|
|
|
|
|
|
|
|
|
|
|
|
|
|
|
|
|
|
|
|
|
|
UNITED STATES
SECURITIES AND EXCHANGE COMMISSION
Washington, D.C. 20549
Form 10-K
☒ ANNUAL REPORT PURSUANT TO SECTION 13 OR 15(d) OF THE SECURITIES EXCHANGE ACT OF 1934
For the fiscal year ended
November 30, 2016
or
☐ TRANSITION REPORT PURSUANT TO SECTION 13 OR 15(d) OF THE SECURITIES EXCHANGE ACT OF 1934
For the transition period from
to
.
Commission File No. 001-09195
KB HOME
(Exact name of registrant as specified in its charter)
|
Delaware
|
95-3666267
|
|
(State or other jurisdiction of
incorporation or organization)
|
(I.R.S. Employer
Identification No.)
|
10990 Wilshire Boulevard, Los Angeles, California 90024
(Address of principal executive offices) (Zip Code)
Registrant’s telephone number, including area code: (310) 231-4000
Securities Registered Pursuant to Section 12(b) of the Act:
|
Title of each class
|
Name of each exchange
on which registered
|
|
Common Stock (par value $1.00 per share)
|
New York Stock Exchange
|
|
Rights to Purchase Series A Participating Cumulative Preferred Stock
|
New York Stock Exchange
|
Securities Registered Pursuant to Section 12(g) of the Act: None
Indicate by check mark if the registrant is a well-known seasoned issuer, as defined in Rule 405 of the Securities Act. Yes
☒
No
☐
Indicate by check mark if the registrant is not required to file reports pursuant to Section 13 or Section 15(d) of the Act. Yes
☐
No
☒
Indicate by check mark whether the registrant (1) has filed all reports required to be filed by Section 13 or 15(d) of the Securities Exchange Act of 1934 during the preceding 12 months (or for such shorter period that the registrant was required to file such reports), and (2) has been subject to such filing requirements for the past 90 days. Yes
☒
No
☐
Indicate by check mark whether the registrant has submitted electronically and posted on its corporate Web site, if any, every Interactive Data File required to be submitted and posted pursuant to Rule 405 of Regulation S-T during the preceding 12 months (or for such shorter period that the registrant was required to submit and post such files). Yes
☒
No
☐
Indicate by check mark if disclosure of delinquent filers pursuant to Item 405 of Regulation S-K is not contained herein, and will not be contained, to the best of registrant’s knowledge, in definitive proxy or information statements incorporated by reference in Part III of this Form 10-K or any amendment to this Form 10-K.
☒
Indicate by check mark whether the registrant is a large accelerated filer, an accelerated filer, a non-accelerated filer, or a smaller reporting company. See the definitions of “large accelerated filer,” “accelerated filer” and “smaller reporting company” in Rule 12b-2 of the Exchange Act.
Large accelerated filer
☒
Accelerated filer
☐
Non-accelerated filer
☐
Smaller reporting company
☐
Indicate by check mark whether the registrant is a shell company (as defined in Rule 12b-2 of the Act). Yes
☐
No
☒
The aggregate market value of the voting common stock held by non-affiliates of the registrant on May 31, 2016 was
$1,310,456,995
, including
9,760,831
shares held by the registrant’s grantor stock ownership trust and excluding
21,665,352
shares held in treasury.
There were
85,072,695
shares of the registrant’s common stock, par value $1.00 per share, outstanding on December 31, 2016. The registrant’s grantor stock ownership trust held an additional
9,431,756
shares of the registrant’s common stock on that date.
Documents Incorporated by Reference
Portions of the registrant’s definitive Proxy Statement for the 2017 Annual Meeting of Stockholders (incorporated into Part III).
KB HOME
FORM 10-K
FOR THE YEAR ENDED
NOVEMBER 30, 2016
TABLE OF CONTENTS
|
|
|
Page
Number
|
|
Item 1.
|
||
|
Item 1A.
|
||
|
Item 1B.
|
||
|
Item 2.
|
||
|
Item 3.
|
||
|
Item 4.
|
||
|
Item 5.
|
||
|
Item 6.
|
||
|
Item 7.
|
||
|
Item 7A.
|
||
|
Item 8.
|
||
|
Item 9.
|
||
|
Item 9A.
|
||
|
Item 9B.
|
||
|
Item 10.
|
||
|
Item 11.
|
||
|
Item 12.
|
||
|
Item 13.
|
||
|
Item 14.
|
||
|
Item 15.
|
||
|
Item 16.
|
Form 10-K Summary
|
|
|
Item 1.
|
BUSINESS
|
General
KB Home is one of the largest and most recognized homebuilding companies in the U.S. and has been building homes for nearly 60 years. We sell and build a variety of new homes designed primarily for first-time, move-up and active adult homebuyers, including attached and detached single-family residential homes, townhomes and condominiums. We offer homes in development communities, at urban in-fill locations and as part of mixed-use projects. Our homebuilding operations represent most of our business, accounting for 99.7% of our total revenues in
2016
. Our financial services operations, which accounted for .3% of our total revenues in
2016
, offer various insurance products to our homebuyers and title services in certain markets. From July 2014 until October 2016, our financial services operations provided mortgage banking services, including residential consumer mortgage loan (“mortgage loan”) originations, to our homebuyers indirectly through Home Community Mortgage, LLC (“HCM”), an unconsolidated joint venture we formed with Nationstar Mortgage LLC (“Nationstar”).
Unless the context indicates otherwise, the terms “we,” “our” and “us” used in this report refer to KB Home, a Delaware corporation, and its predecessors and subsidiaries. Also, as used in this report, “home” is a single-family residence, whether it is a single-family home or other type of residential property; “community” is a single development in which new homes are constructed as part of an integrated plan; and “community count” is the number of communities we have open for sales with at least five homes/lots left to sell.
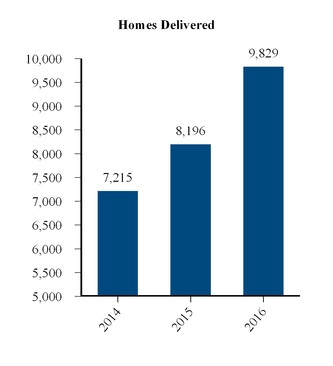
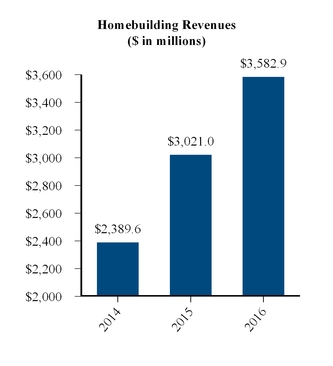
The following charts present homes delivered and homebuilding revenues for the years ended November 30, 2014, 2015 and 2016:
Markets
Reflecting the geographic reach of our homebuilding business, we have ongoing operations in the seven states and 36 major markets presented below. We also operate in various submarkets within these major markets. From time to time, we refer to these markets and submarkets collectively as our “served markets.” For reporting purposes, we organize our homebuilding operations into four segments — West Coast, Southwest, Central and Southeast.
1
|
Segment
|
State(s)
|
Major Market(s)
|
||
|
West Coast
|
California
|
Contra Costa County, Fresno, Los Angeles, Madera, Oakland, Orange County, Riverside, Sacramento, San Bernardino, San Diego, San Francisco, San Jose, Santa Rosa-Petaluma, Stockton, Vallejo, Ventura and Yuba City
|
||
|
Southwest
|
Arizona
|
Phoenix and Tucson
|
||
|
Nevada
|
Las Vegas
|
|||
|
Central
|
Colorado
|
Denver
|
||
|
Texas
|
Austin, Dallas, Fort Worth, Houston and San Antonio
|
|||
|
Southeast
|
Florida
|
Daytona Beach, Jacksonville, Lakeland, Orlando, Palm Coast, Punta Gorda, Sarasota, Sebastian-Vero Beach and Tampa
|
||
|
North Carolina
|
Raleigh
|
|||
Segment Operating Information.
The following table presents certain operating information for our homebuilding reporting segments for the years ended
November 30, 2016
,
2015
and
2014
(dollars in millions, except average selling price):
|
|
Years Ended November 30,
|
||||||||||
|
|
2016
|
2015
|
2014
|
||||||||
|
West Coast:
|
|||||||||||
|
Homes delivered
|
2,825
|
|
2,258
|
|
1,913
|
|
|||||
|
Percentage of total homes delivered
|
29
|
%
|
27
|
%
|
27
|
%
|
|||||
|
Average selling price
|
$
|
579,900
|
|
$
|
587,000
|
|
$
|
569,700
|
|
||
|
Total revenues (a)
|
$
|
1,638.1
|
|
$
|
1,402.3
|
|
$
|
1,089.9
|
|
||
|
Southwest:
|
|||||||||||
|
Homes delivered
|
1,559
|
|
1,311
|
|
736
|
|
|||||
|
Percentage of total homes delivered
|
16
|
%
|
16
|
%
|
10
|
%
|
|||||
|
Average selling price
|
$
|
287,000
|
|
$
|
284,600
|
|
$
|
271,100
|
|
||
|
Total revenues (a)
|
$
|
447.5
|
|
$
|
398.2
|
|
$
|
199.5
|
|
||
|
Central:
|
|||||||||||
|
Homes delivered
|
3,744
|
|
3,183
|
|
3,098
|
|
|||||
|
Percentage of total homes delivered
|
38
|
%
|
39
|
%
|
43
|
%
|
|||||
|
Average selling price
|
$
|
270,100
|
|
$
|
252,200
|
|
$
|
223,800
|
|
||
|
Total revenues (a)
|
$
|
1,018.5
|
|
$
|
809.7
|
|
$
|
698.4
|
|
||
|
Southeast:
|
|||||||||||
|
Homes delivered
|
1,701
|
|
1,444
|
|
1,468
|
|
|||||
|
Percentage of total homes delivered
|
17
|
%
|
18
|
%
|
20
|
%
|
|||||
|
Average selling price
|
$
|
281,400
|
|
$
|
281,900
|
|
$
|
263,600
|
|
||
|
Total revenues (a)
|
$
|
478.9
|
|
$
|
410.8
|
|
$
|
401.9
|
|
||
|
Total:
|
|||||||||||
|
Homes delivered
|
9,829
|
|
8,196
|
|
7,215
|
|
|||||
|
Average selling price
|
$
|
363,800
|
|
$
|
354,800
|
|
$
|
328,400
|
|
||
|
Total revenues (a)
|
$
|
3,582.9
|
|
$
|
3,021.0
|
|
$
|
2,389.6
|
|
||
|
(a)
|
Total revenues include revenues from housing and land sales.
|
Additional financial and operational information related to our homebuilding reporting segments, including revenues, pretax income (loss), inventories and assets, is provided below in the “Management’s Discussion and Analysis of Financial Condition and Results of Operations” section and in Note 2 – Segment Information in the Notes to Consolidated Financial Statements in this report.
2
Unconsolidated Joint Ventures.
The above table does not include homes delivered or revenues from unconsolidated joint ventures in which we participate. These unconsolidated joint ventures acquire and develop land in various markets where our homebuilding operations are located and, in some cases, build and deliver homes on the land developed.
Strategy
In the 2016 fourth quarter, we outlined a plan for returns-focused growth that is designed to drive higher revenues and improvement in our operating income margin, return on invested capital, return on equity and leverage ratio, and we established three-year financial targets for these metrics. The plan’s main components are (1) executing our core business strategy; (2) improving our asset efficiency and (3) monetizing our significant deferred tax assets. We believe implementing this plan will, among other things, accelerate internal cash generation that will support a balanced approach to investing in land and land development and reducing our debt.
Executing Our Core Business Strategy
. Our core business strategy, which we refined in 2016 and call KB 2020, is to expand our scale within our current geographic footprint to establish a top-five market share position in each of our served markets (based on homes delivered) by building communities that offer a compelling combination of affordability, choice and personalization. This strategy is grounded in a systematic, fact-based and process-driven approach to homebuilding and encompasses the following key principles with respect to customers, land, products and operations:
|
•
|
Customers
. For each of our served markets, we gain a detailed understanding of consumers’ location and product preferences, as well as product price-to-value perceptions, through ongoing customer surveys and other market research. Our primary focus is on first-time and first move-up buyers. First-time buyers have comprised nearly 60% of our homes delivered over the past 10 years. In addition, our Built-to-Order™ homebuying process provides our buyers with a wide range of choices in the major aspects of their future home, together with a personalized customer experience through our in-house community teams. These teams are made up of sales representatives, design consultants and other personnel who partner closely with each buyer and maintain constant communication from the initial sale of their home to its delivery.
|
|
•
|
Land
. We seek to manage our working capital and reduce our operating risks by primarily acquiring entitled land parcels at reasonable prices within attractive submarkets as identified by our market research activities. We typically focus on metropolitan areas with favorable long-term economic and population growth prospects that we believe have the potential to sustain a minimum of 800 homes delivered per year, and target land parcels that provide a two- to three-year supply of lots per community and meet our investment return standards. Identified consumer preferences and home sales activity largely direct where our land acquisition teams search for available land. We leverage the relationships we have with land owners, developers and brokers in our served markets to acquire land, and use our experience in working with municipalities to efficiently obtain entitlements and any other required development approvals, typically before or concurrently with closing on a parcel.
|
|
•
|
Products
. We offer our customers a base product with a standardized set of functions and features at a competitive and relatively affordable price that generally aligns with the local area’s median household income level. Our Built-to-Order approach provides customers the opportunity to select their lot location, floor plan, elevation and structural options, and to personalize their homes with numerous interior design options and upgrades in our design studios. Our design studios, generally centrally located within our served markets, are a key component of our Built-to-Order process, and the mix of design options and upgrades they offer are primarily based on the preferences identified by consumer survey and purchase frequency data. We utilize a centralized internal architectural group that designs homes to meet or exceed customers’ price-to-value expectations while being as efficient as possible to construct. Our architectural group has developed a core series of flexible floor plans and elevations that we can offer across many of our served markets, which helps us understand the cost to build our products and enables us to compare and implement best practices across divisions or communities. We also incorporate energy-efficient features into our product designs to help lower the total cost of homeownership for our buyers and to reduce our homes’ impact on the environment, as further discussed below. As used in this report and elsewhere, the term “product” encompasses a home’s floor plan design and interior/exterior style, amenities, functions and features.
|
|
•
|
Operations
. In addition to differentiating us from other high-production homebuilders, our Built-to-Order process helps to drive low-cost production. We generally commence construction of a home only after we have a signed purchase contract with a buyer and have obtained preliminary credit approval or other evidence of the buyer’s financial ability to purchase a home, and seek to build a backlog of sold homes. Maintaining a healthy backlog, along with centralized scheduling and standardized reporting processes, helps us sustain an even-flow production of pre-sold homes, which reduces our inventory risk, enhances efficiencies in the construction process and our relationships with independent subcontractors, and provides us with greater visibility and predictability on future deliveries.
|
3
We consider our strategy to be integral to our success in the homebuilding industry. However, there may be market-driven circumstances where we believe it is necessary or appropriate to temporarily deviate from certain of its principles. These deviations may include starting construction on a small number of homes in a community before corresponding purchase contracts are signed with buyers to more quickly meet customer delivery expectations and generate revenues; or acquiring land parcels in peripheral neighborhoods of a core metropolitan area that otherwise fit our growth strategy and meet our investment return standards. In addition, other circumstances could arise in the future that may lead us to make specific short-term shifts from these principles.
Improving Asset Efficiency
. We have had an ongoing focus on, and will continue our efforts in 2017 for, improving our asset efficiency, including, among other things, generating higher net orders per community and greater profitability per home delivered by balancing sales pace and selling prices, and managing our direct construction costs, within our communities; structuring land acquisitions to minimize upfront costs, as further discussed below; reactivating communities that have been held for future development; and selling non-core assets.
We have achieved significant progress in reactivating communities over the past several years and plan to reactivate additional communities in 2017. As of November 30, 2016, our land held for future development represented
11%
of our total inventories, down from
16%
at November 30, 2015 and from its peak of
43%
at November 30, 2011. Our objective is to reduce our land held for future development, through reactivations and land sales, to less than 4% of our total inventory by 2019.
In line with this objective, in the 2016 fourth quarter, we announced our decision to sell more than 20 land parcels that no longer fit into our business plans due to one or more of the following reasons: the land is in excess of near-term requirements; we now believe the necessary incremental investment in development is not justified; the land is located in areas outside of our served markets; and/or the land is entitled for certain product types that are not aligned with our primary product offerings. Actions required to complete the planned sales have been or will soon be initiated, with the objective of closing these transactions within one year. As discussed in Note 7 – Inventory Impairments and Land Option Contract Abandonments in the Notes to Consolidated Financial Statements in this report, we recognized inventory impairment charges to reduce the carrying values of these land parcels to their estimated fair values, less associated costs to sell.
While reactivations and land sales can have a negative impact on our housing gross profit margin, they are generally accretive to earnings and returns, and generate cash that we can redeploy for investments in land that are expected to generate a higher return and grow our business. Such growth should enable us to leverage greater operating efficiencies that are expected to accompany a larger scale. The cash proceeds from activations and land sales can also be used to reduce our debt, consistent with our plan.
Monetizing Our Deferred Tax Assets.
By increasing our scale and further improving our asset efficiency, the anticipated associated revenue and pretax income growth will enable us to accelerate the utilization of our deferred tax assets, which totaled
$739 million
at November 30, 2016. We believe we can realize $300 million to $400 million in tax cash savings by the end of 2019, and intend to productively deploy the cash to invest in our business and/or to reduce debt.
Key Three-Year Financial Targets.
We have set the following specific financial targets for 2019 that we believe will result from executing on our returns-focused growth plan:
|
•
|
Housing revenues greater than $5 billion.
|
|
•
|
Operating income margin of 8% to 9%.
|
|
•
|
Return on invested capital in excess of 10%.
|
|
•
|
Return on equity in the low-to-mid double-digit range.
|
|
•
|
Net debt-to-capital ratio of 40% to 50%.
|
We believe that our plan provides a clear roadmap for achieving these targets, and the potential to produce a meaningful increase in long-term stockholder value. By increasing our scale while improving our asset efficiency, we expect to generate higher revenues, profitability and internal cash flows, both from operations and from using our deferred tax assets. The stronger cash flows, in turn, can be directed, in a balanced manner, to invest in the further growth of our business and/or reduce debt, providing an opportunity for improved housing gross profit margins.
Promotional Marketing Strategy
. Our promotional marketing efforts are centered on differentiating the KB Home brand from resale homes and from new homes sold by other homebuilders. These efforts increasingly involve interactive Internet-based applications, social media outlets and other evolving communication technologies.
4
In each of our communities, we build, decorate and landscape model homes which play a key role in providing customers with a hands-on experience. Our sales teams are trained by us and have extensive knowledge of management operating policies and our products, assisting homebuyers in all aspects of their purchase.
Customer Service.
Our on-site construction supervisors perform regular pre-closing quality checks and our sales representatives maintain regular contact with our homebuyers during the home construction process in an effort to ensure our homes meet our standards and our homebuyers’ expectations. We also have employees who are responsible for responding to homebuyers’ post-closing needs, including warranty claims. Information about our limited warranty program is provided in Note 15 – Commitments and Contingencies in the Notes to Consolidated Financial Statements in this report.
Operational Structure.
We operate our homebuilding business through divisions with experienced management teams who have in-depth local knowledge of their particular served markets, which helps us acquire land in preferred locations; develop communities with products that meet local demand; and understand local regulatory environments. Our division management teams exercise considerable autonomy in identifying land acquisition opportunities; developing land and communities; implementing product, marketing and sales strategies; and controlling costs. To help maintain consistent execution within the organization, our division management teams and other employees are continuously trained on KB2020 principles and are evaluated, in part, based on their achievement of relevant operational objectives.
Our corporate management and support personnel develop and oversee the implementation of company-wide strategic initiatives, our overall operational policies and internal control standards, and perform various centralized functions, including architecture; purchasing and national contracts; treasury and cash management; land acquisition approval; risk and litigation management; accounting and financial reporting; internal audit and compliance activities; information technology systems; and investor and media relations.
Corporate management is responsible for, among other things, evaluating and selecting the geographic markets in which we operate, consistent with our overall business strategy; allocating capital resources to markets for land acquisition and development activities; making major personnel decisions related to employee compensation and benefits; and monitoring the financial and operational performance of our divisions.
Community Development and Land Inventory Management
Developable land for the production of homes is a core resource for our business. Based on our current strategic plans, we seek to own or control land sufficient to meet our forecasted production goals for the next three to five years. In 2017, we intend to continue to invest in and develop land positions within attractive submarkets and selectively acquire or control additional land that meets our investment return standards. However, we may decide to sell certain land interests or monetize land previously held for future development as part of our returns-focused growth plan, or for other reasons.
Our community development process generally consists of four phases: land acquisition, land development into finished lots for a community (if necessary), home construction and delivery of completed homes to buyers. Historically, our community development process has typically ranged from six to 24 months in our West Coast homebuilding reporting segment, with a somewhat shorter duration in our other homebuilding reporting segments. Our community development process varies based on, among other things, the extent and speed of required government approvals and utility service activations, the overall size of a particular community, the scope of necessary site preparation activities, the type of product(s) that will be offered, weather conditions, time of year, promotional marketing results, the availability of construction resources, consumer demand, local and general economic and housing market conditions, and other factors.
Although they vary significantly in size and complexity, our communities typically consist of 30 to 250 lots ranging in size from 1,900 to 11,500 square feet. In our communities, we typically offer three to 15 home design choices. We also generally build one to three model homes at each community so that prospective buyers can preview the various products available. Depending on the community, we may offer premium lots containing more square footage, better views and/or location benefits. Some of our communities consist of multiple-story structures that encompass several attached condominium-style units.
Land Acquisition and Land Development.
We continuously evaluate land acquisition opportunities against our investment return standards, while also balancing competing needs for financial strength, liquidity and land inventory for future growth. When we acquire land, we generally focus on parcels with lots that are entitled for residential construction and are either physically developed to start home construction (referred to as “finished lots”) or partially finished. However, depending on market conditions and available opportunities, we may acquire undeveloped and/or unentitled land. We may also invest in land that requires us to repurpose and re-entitle the property for residential use, such as in-fill developments. We expect that the overall balance of undeveloped, unentitled, entitled, partially finished and finished lots in our inventory will vary over time, and in implementing our strategic growth initiatives, we may acquire a greater proportion of undeveloped or unentitled land in the future if and as the availability of reasonably-priced land with finished or partially finished lots diminishes.
5
As noted above, we target geographic areas for potential land acquisitions and community development based on the results of periodic surveys of both new and resale homebuyers in particular markets, prevailing local economic conditions and home sales activity, the supply and type of homes that are available for sale, and other market research activities. Local, in-house specialists analyze specific geographic areas to identify desirable land acquisition targets, or to evaluate whether to dispose of an existing land interest. We also use studies performed by third-party specialists.
We generally structure our land acquisition and land development activities to minimize, or to defer the timing of, expenditures in order to reduce both the market risks associated with holding land and our working capital and financial commitments, including interest and other carrying costs. We typically use contracts that, in exchange for a small initial option payment or earnest money deposit, give us an option or similar right to acquire land at a future date, usually at a pre-determined price and pending our satisfaction with the feasibility of developing and selling homes on the land and/or an underlying land seller’s completion of certain obligations, such as securing entitlements, developing infrastructure or finishing lots. We refer to land subject to such option or similar contractual rights as being “controlled.” Our decision to exercise a particular land option or similar right is based on the results of our due diligence and continued market viability analysis after entering into such a contract. Information related to our land option contracts and other similar contracts is provided in Note 7 – Inventory Impairments and Land Option Contract Abandonments in the Notes to Consolidated Financial Statements in this report.
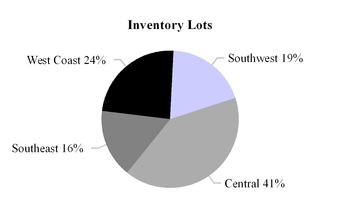
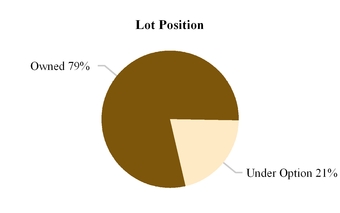
The following table presents the number of inventory lots we owned, in various stages of development, or controlled under land option contracts or other similar contracts by homebuilding reporting segment as of
November 30, 2016
and
2015
:
|
Homes Under
Construction and Land
Under Development
|
Land Held for Future
Development or Sale
|
Land Under
Option
|
Total Land
Owned or
Under Option
|
||||||||||||||||||||
|
|
2016
|
2015
|
2016
|
2015
|
2016
|
2015
|
2016
|
2015
|
|||||||||||||||
|
West Coast
|
5,192
|
|
4,526
|
|
2,202
|
|
2,768
|
|
3,510
|
|
4,126
|
|
10,904
|
|
11,420
|
|
|||||||
|
Southwest
|
4,912
|
|
6,349
|
|
2,525
|
|
1,871
|
|
901
|
|
761
|
|
8,338
|
|
8,981
|
|
|||||||
|
Central
|
13,090
|
|
13,793
|
|
1,058
|
|
1,254
|
|
4,124
|
|
2,700
|
|
18,272
|
|
17,747
|
|
|||||||
|
Southeast
|
3,453
|
|
3,999
|
|
3,150
|
|
3,500
|
|
708
|
|
1,752
|
|
7,311
|
|
9,251
|
|
|||||||
|
Total
|
26,647
|
|
28,667
|
|
8,935
|
|
9,393
|
|
9,243
|
|
9,339
|
|
44,825
|
|
47,399
|
|
|||||||
The following charts present the percentage of inventory lots we owned or controlled under land option contracts or other similar contracts by homebuilding reporting segment and the percentage of total lots we owned and controlled under option as of
November 30, 2016
:
6
Home Construction and Deliveries.
Following the acquisition of land and, if necessary, the development of the land into finished lots, we typically begin constructing model homes and marketing homes for sale. To minimize the costs and risks of unsold homes in production, we generally begin construction of a home only after we have a signed purchase contract with a buyer and have obtained preliminary credit approval or other evidence of the buyer’s financial ability to purchase the home. However, cancellations of home purchase contracts prior to the delivery of the underlying homes, the construction of attached products with some unsold units, or specific strategic considerations will result in our having unsold completed or partially completed homes in our inventory.
We act as the general contractor for the majority of our communities, and engage outside general contractors in all other instances. We, or the outside general contractors we engage, contract with a variety of independent subcontractors, who are typically locally based, to perform all land development and home construction work through their own employees or subcontractors. We do not self-perform any land development or home construction work. These independent subcontractors also supply some of the building materials required for such production activities. Our contracts with these independent subcontractors require that they comply with all laws applicable to their work, including wage and safety laws, meet performance standards, and follow local building codes and permits.
Raw Materials
. Outside of land, the principal raw materials used in our production process are concrete and forest products. Other primary materials used in home construction include drywall and plumbing and electrical items. We source all of our building materials from third parties. We attempt to enhance the efficiency of our operations by using, where practical, standardized materials that are commercially available on competitive terms from a variety of outside sources. In addition, we have national and regional purchasing programs for certain building materials, appliances, fixtures and other items that allow us to benefit from large-quantity purchase discounts and, where available, participate in outside manufacturer or supplier rebate programs. When possible, we arrange for bulk purchases of these products at favorable prices from such manufacturers and suppliers. Although our purchasing strategies have helped us in negotiating favorable prices for raw materials, in recent years we have encountered higher prices for certain raw materials.
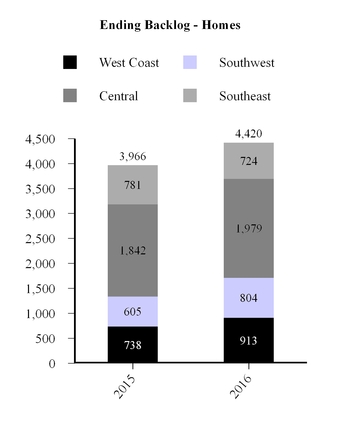
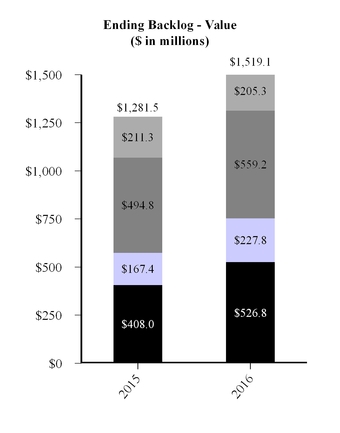
Backlog
Our “backlog” consists of homes that are under a purchase contract but have not yet been delivered to a buyer. Ending backlog represents the number of homes in backlog from the previous period plus the number of net orders (new orders for homes less cancellations) generated during the current period minus the number of homes delivered during the current period. Our backlog at any given time will be affected by cancellations, homes delivered and our community count. Our cancellation rates and the factors affecting such rates are further discussed below in both the “Risk Factors” and “Management’s Discussion and Analysis of Financial Condition and Results of Operations” sections in this report. The number of homes we deliver has historically increased from the first to the fourth quarter in any year. Substantially all of our homes in backlog at
November 30, 2016
are expected to be delivered during the year ended November 30, 2017.
Our backlog at
November 30, 2016
increased
11%
to
4,420
from
3,966
homes at
November 30, 2015
, largely due to a year-over-year increase in our net orders in 2016. Our backlog at
November 30, 2016
represented potential future housing revenues of approximately
$1.52 billion
, a
19%
increase from approximately
$1.28 billion
at
November 30, 2015
, reflecting the larger number of homes in our backlog and a higher average selling price of those homes.
The following charts present our ending backlog (number of homes and value) by homebuilding reporting segment as of
November 30, 2015
and
2016
:
7
Employees
At December 31, 2016 and 2015, we had approximately 1,790 and 1,680 full-time employees, respectively. None of our employees are represented by a collective bargaining agreement.
Competition, Seasonality, Delivery Mix and Other Factors
Competition.
The homebuilding industry and housing market are highly competitive with respect to selling homes; contracting for construction services, such as carpentry, roofing, electrical and plumbing; and acquiring attractive developable land, though the intensity of competition can vary and fluctuate between and within individual markets and submarkets. We compete for homebuyers, construction resources and desirable land against numerous homebuilders, ranging from regional and national firms to small local enterprises. As to homebuyers, we primarily compete with other homebuilders on the basis of selling price, community location and amenities, availability of financing options, home designs, reputation, home construction cycle time, and the design options and upgrades that can be included in a home. In some cases, this competition occurs within larger residential development projects containing separate sections designed, planned and developed by other homebuilders. We also compete for homebuyers against housing alternatives to new homes, including resale homes, apartments, single-family rentals and other rental housing. In markets experiencing heavy construction activity, there can be severe craft and skilled trade shortages that limit independent subcontractors’ ability to supply construction services to us, which in turn tends to drive up our costs and/or extend our production schedules. Elevated construction activity has also contributed to measurable increases in the cost of certain building materials, such as lumber, drywall and concrete. Since 2013, we also have seen higher prices for desirable land amid heightened competition with homebuilders and other developers and investors, particularly in the land-constrained areas we are strategically targeting. We expect these upward cost trends to continue in 2017 if and as housing market activity grows and there is greater competition for these resources.
Seasonality.
Our performance is affected by seasonal demand trends for housing. Traditionally, there has been more consumer demand for home purchases and we tend to generate more net orders in the spring and early summer months (corresponding to most of our second quarter and part of our third quarter) than at other times of the year. With our distinct homebuying approach and typical home construction cycle times, this “selling season” demand results in our delivering more homes and generating higher revenues from late summer through the fall months (corresponding to part of our third quarter and all of our fourth quarter). On a relative basis, the winter and early spring months within our first quarter and part of our second quarter usually produce the
8
fewest net orders, homes delivered and revenues, and the sequential difference from our fourth quarter to our first quarter can be significant.
Delivery Mix and Other Factors.
In addition to the overall volume of homes we sell and deliver, our results in a given period are significantly affected by the geographic mix of markets and submarkets in which we operate; the number and characteristics of the communities we have open for sales in those markets and submarkets; and the products we sell from those communities during the period. While there are some similarities, there are differences within and between our served markets in terms of the quantity, size and nature of the communities we operate and the products we offer to consumers. These differences reflect, among other things, local homebuyer preferences; household demographics (e.g., large families or working professionals; income levels); geographic context (e.g., urban or suburban; availability of reasonably priced finished lots; development constraints; residential density); and the shifts that can occur in these factors over time. These factors in each of our served markets will affect the costs we incur and the time it takes to locate, acquire rights to and develop land, open communities for sales, and market and build homes; the size of our homes; our selling prices (including the contribution from homebuyers’ purchases of design options and upgrades); the pace at which we sell and deliver homes and close out communities; and our housing gross profits and housing gross profit margins. Therefore, our results in any given period will fluctuate compared to other periods based on the proportion of homes delivered from areas with higher or lower selling prices and on the corresponding land and overhead costs incurred to generate those deliveries, as well as from our overall community count.
Financing
Our operations have historically been funded by internally generated cash flows, public equity and debt issuances, land option contracts and other similar contracts and land seller financing, and performance bonds and letters of credit. We also have the ability to borrow funds under our unsecured revolving credit facility with various banks (“Credit Facility”). Depending on market conditions and available opportunities, we may obtain project financing, or secure external financing with community or other inventory assets that we own or control. By “project financing,” we mean loans that are specifically obtained for, or secured by, particular communities or other inventory assets. We may also arrange or engage in bank loan, project debt or other financial transactions and/or expand the capacity of the Credit Facility or our cash-collateralized letter of credit facility with a financial institution (the “LOC Facility”) or enter into additional such facilities.
Environmental Compliance Matters and Sustainability
As part of our due diligence process for land acquisitions, we often use third-party environmental consultants to investigate potential environmental risks, and we require disclosures, representations and warranties from land sellers regarding environmental risks. We may, from time to time, acquire property that requires us to incur environmental clean-up costs after conducting appropriate due diligence, including, but not limited to, using detailed investigations performed by environmental consultants. In such instances, we take steps prior to our acquisition of the land to gain reasonable assurance as to the precise scope of work required and the costs associated with removal, site restoration and/or monitoring. To the extent contamination or other environmental issues have occurred in the past, we will attempt to recover restoration costs from third parties, such as the generators of hazardous waste, land sellers or others in the prior chain of title and/or their insurers. Based on these practices, we anticipate that it is unlikely that environmental clean-up costs will have a material effect on our consolidated financial statements. However, despite these efforts, there can be no assurance that we will avoid material liabilities relating to the existence or removal of toxic wastes, site restoration, monitoring or other environmental matters affecting properties currently or previously owned or controlled by us, and no estimate of any potential liabilities can be made. We have not been notified by any governmental agency of any claim that any of the properties owned or formerly owned by us are identified by the U.S. Environmental Protection Agency (or similar state or local agency) as being a “Superfund” (or similar state or local) clean-up site requiring remediation, which could have a material effect on our future consolidated financial statements. Costs associated with the use of environmental consultants are not material to our consolidated financial statements.
We have made a dedicated effort to further differentiate ourselves from other homebuilders and resale homes through our ongoing commitment to become a leading national company in environmental sustainability. We continually seek out and utilize innovative technologies and systems to further improve the energy and water efficiency of our homes, as well as engage in campaigns and other educational efforts, sometimes together with other companies, organizations and groups, to increase consumer awareness of the importance and impact of sustainability in selecting a home and the products within a home. Under our commitment to sustainability, we, among other things:
|
•
|
build energy- and water-efficient new homes;
|
|
•
|
developed an Energy Performance Guide®, or EPG®, that informs our homebuyers of the relative energy efficiency and the related estimated monthly energy costs of each of our homes as designed, compared to typical new and existing homes;
|
9
|
•
|
advanced home automation technologies, components and systems that can increase convenience for our homebuyers; and
|
|
•
|
created and are adding more net-zero energy and zero freshwater design options, under a program called Double ZeroHouse™ 3.0, that are available in select markets.
|
More information about our sustainability commitment can be found in our annual sustainability reports, which we have published on our website since 2008. We intend to continue to research, evaluate and utilize new or improved products and construction and business practices consistent with our commitment and believe our sustainability initiatives can help put us in a better position, compared to resale homes and homebuilders with less-developed programs, to comply with evolving local, state and federal rules and regulations intended to protect natural resources and to address climate change and similar environmental concerns.
Access to Our Information
Our annual reports on Form 10-K, quarterly reports on Form 10-Q, current reports on Form 8-K, beneficial ownership reports on Forms 3, 4 and 5 and proxy statements, as well as all amendments to those reports are available free of charge through our investor relations website at investor.kbhome.com, as soon as reasonably practicable after such reports are electronically filed with, or furnished to, the Securities and Exchange Commission (“SEC”). We will also provide these reports in electronic or paper format free of charge upon request made to our investor relations department at investorrelations@kbhome.com or at our principal executive offices. We intend for our investor relations website to be the primary location where investors and the general public can obtain announcements regarding, and can learn more about, our financial and operational performance, business plans and prospects, our board of directors, our senior executive management team, and our corporate governance policies, including our articles of incorporation, by-laws, corporate governance principles, board committee charters, and ethics policy. We may from time to time choose to disclose or post important information about our business on or through our investor relations website, and/or through other electronic channels, including social media outlets, such as Facebook® (Facebook.com/KBHome) and Twitter® (Twitter.com/KBHome), and other evolving communication technologies. The content available on or through our primary website at www.kbhome.com, our investor relations website, including our sustainability reports, or social media outlets and other evolving communication technologies is not incorporated by reference in this report or in any other filing we make with the SEC, and our references to such content are intended to be inactive textual or oral references only. Our SEC filings are also available to the public over the Internet at the SEC’s website at www.sec.gov. The public may also read and copy any document we file at the SEC’s public reference room located at 100 F Street N.E., Washington, D.C. 20549. Please call the SEC at 1-800-SEC-0330 for further information on the operation of the public reference room.
|
Item 1A.
|
RISK FACTORS
|
The following important economic and market, strategic, operational, and legal and regulatory risk factors could adversely impact our business. These factors could cause our actual results to differ materially from the forward-looking and other statements that (a) we make in registration statements, periodic reports (including this report) and other filings with the SEC and from time to time in our news releases, annual reports and other written reports or communications, (b) we post on or make available through our websites and/or through other electronic channels, and (c) our personnel and representatives make orally from time to time.
Economic and Market Risks
Soft or negative economic or housing market conditions generally or in our served markets may materially and adversely affect our business and consolidated financial statements.
As in 2016, we expect future home sales activity and selling price appreciation (or depreciation) to vary in strength between markets and within submarkets based to a substantial degree on their specific economic and housing environments, which may also reflect national, state and/or regional factors. These variations may be significant and unfavorable, and could be more pronounced and/or prolonged in our served markets due to changes in conditions that are outside of our control, including, but not limited to, the following:
|
•
|
Employment levels and job and wage growth, particularly for individuals and households who make up our core first-time and first move-up homebuyer demographic groups. If the recent upward trends in employment and income levels for these demographic groups weaken or reverse, a corresponding reduction in demand for homes could negatively impact our business, and the impact may be greater for us than for homebuilders that target more-experienced and/or higher-income buyers.
|
|
•
|
Negative population growth, household formations or other demographic changes that can impair demand for housing.
|
10
|
•
|
Diminished consumer confidence in general or specifically with respect to purchasing homes, or lack of consumer interest in purchasing a home compared to other housing alternatives.
|
|
•
|
Inflation, which could result in our production costs increasing at a rate or to a level that we cannot recover through the selling prices of our homes. Inflation may also cause increases in mortgage loan interest rates, and in the interest rates we may need to accept to obtain external financing for our business.
|
|
•
|
Shortages or rising prices of building materials and construction services, including independent contractor or outside supplier capacity constraints. These conditions could increase our costs and/or extend our construction and home delivery schedules, and we may be unable to raise the selling prices of our homes to cover the impact of such cost increases and/or delays.
|
|
•
|
Seasonality, which as discussed above in the “Competition, Seasonality, Delivery Mix and Other Factors” section in this report, generally results in fluctuations in our quarterly operating results, with a significant proportion of our homes delivered and revenues generated in our third and fourth fiscal quarters. While this pattern reflects when consumers have generally preferred to buy homes, we can provide no assurance that this historical seasonality will occur in 2017 or beyond, if at all.
|
|
•
|
Civil unrest and acts of terrorism, and government responses to such acts, as well as inclement weather, natural disasters, and other environmental conditions can delay the delivery of our homes and/or increase our costs.
|
If economic or housing conditions become more challenging generally or in our served markets, due to the factors listed above, whether individually or collectively, or otherwise, or home sales or selling prices do not continue to advance at the same pace as in recent years or decline, there would likely be a corresponding adverse effect on our business and our consolidated financial statements, including, but not limited to, our net orders, the number of homes we deliver, our average selling prices, the revenues we generate, our housing gross profit margins and our ability to operate profitably, and the effect may be material. In addition, adjustments to federal government economic, taxation and spending laws, policies or programs by the newly elected administration and U.S. Congress may negatively impact the financial markets, consumer spending and/or the housing market, and, in turn, materially and adversely affect our operating results and consolidated financial statements.
Tight mortgage lending standards and/or interest rate increases could adversely affect the availability or affordability of mortgage loans for potential buyers of our homes and thereby reduce our net orders, homes delivered and revenues. The poor performance of third-party mortgage lenders could delay our delivery of homes and recognition of revenues from those homes.
We depend on third-party lenders to provide mortgage loans to our buyers who need such financing to purchase our homes, and our dependence on such lenders is greater than for other homebuilders that operate a captive mortgage lender, have a mortgage banking services joint venture, or have secured a marketing relationship with a lender or loan originator. Buyers’ ability to obtain financing largely depends on prevailing mortgage loan interest rates, the credit standards that mortgage lenders use and the availability of mortgage loan programs provided by federal government agencies (such as Federal Housing Administration (“FHA”)- or Veterans Administration-insured mortgage loans), or government-sponsored enterprises (such as the Federal National Mortgage Association (also known as “Fannie Mae”) or the Federal Home Loan Mortgage Corporation (also known as “Freddie Mac”)), which have been a critical source of liquidity for the mortgage finance industry and an important factor in marketing and selling many of our homes. Although mortgage loan interest rates have been at historically low levels for the last few years, they have trended higher since the 2016 fourth quarter. If mortgage loan interest rates increase further, credit standards are tightened and/or the federal government reduces or terminates its mortgage loan programs, the affordability of and demand for homes, including our homes, would likely be adversely impacted, and the impact could be material to our business and consolidated financial statements.
Our buyers may obtain mortgage financing for their home purchases from any lender of their choice. However, we can provide no assurance as to third-party lenders’ ability or willingness to complete, in a timely fashion or at all, the mortgage loan originations they start for our homebuyers. Lenders’ inability or unwillingness may result in mortgage loan funding issues that delay deliveries of our homes and/or cause cancellations, which could in the aggregate have a material adverse effect on our business and our consolidated financial statements.
The homebuilding industry and housing market are very competitive, and competitive conditions could adversely affect our business and consolidated financial statements.
We face significant competition in several areas of our business from other homebuilders, sellers of existing homes, and other participants in the overall housing industry, including landlords and other rental housing operators. These competitive conditions can result in, among other things, our selling and delivering fewer homes; our reducing the selling prices of our homes and/or offering or increasing sales incentives; our being unable to acquire desirable land that meets our investment return standards; and
11
our being unable to obtain construction resources at acceptable prices or when needed to meet our production schedules. These competitive conditions could have a material adverse effect on our business and consolidated financial statements by decreasing our revenues and housing gross profit margins; impairing our ability to successfully implement our current strategies, initiatives or actions; increasing our costs; and/or diminishing growth in our business.
Strategic Risks
Our ability to execute on our primary strategies is inherently uncertain, and we may be unable to achieve our goals.
We can provide no assurance that our strategies, and any related initiatives or actions, will be successful, that they will generate growth or earnings or returns at any particular level or within any particular time frame, or that we will achieve in 2017 or beyond positive operational or financial results or results in any particular metric or measure equal to or better than our 2016 performance, or perform in any period as well as other homebuilders. We also cannot provide any assurance that we will be able to maintain our strategies, and any related initiatives or actions, in 2017 and, due to unexpectedly favorable or unfavorable market conditions or other factors, we may determine that we need to adjust, refine or abandon all or portions of our strategies, initiatives or actions, though we cannot guarantee that any such changes will be successful. The failure of any one or more of our present strategies, or any related initiatives or actions, or the failure of any adjustments that we may pursue or implement, would likely have an adverse effect on our ability to increase the value and profitability of our business; on our ability to operate our business in the ordinary course; on our overall liquidity; and on our consolidated financial statements, and the effect in each case could be material.
The success of our present strategies depends on the availability of developable land that meets our investment return standards.
The availability of developable land, particularly finished and partially finished lots, meeting our investment return standards depends on several factors, including, among other things, land availability in general, geographical/topographical/governmental constraints, land sellers’ business relationships and competition for desirable property. Should suitable land become less available, the number of homes we deliver could be reduced. In addition, the cost of attractive land could increase and adversely impact our housing gross profit margins and our ability to maintain ownership or control of a sufficient supply of land to meet our production goals. A lack of available suitable land could also affect the success of our current strategies, and related initiatives, including our ability to grow our scale and share in our served markets; to expand our community count; to maintain or increase our revenues; and to maintain or improve our profitability in 2017 and beyond, and could have a material adverse effect on our business and consolidated financial statements.
Our business is concentrated in certain geographic markets and declines in one or more of our key served markets could materially affect our business and consolidated financial statements.
Home sales activity and selling prices in some of our key served markets have varied from time to time for market-specific and other reasons, including adverse weather, high levels of foreclosures, short sales and sales of lender-owned homes, and lack of affordability or economic contraction. If home sales activity or selling prices decline in one or more of our key served markets, including California, Florida, Nevada or Texas, our costs may not decline at all or at the same rate and, as a result, our consolidated financial statements may be materially and adversely affected.
Adverse conditions in California, which makes up our West Coast homebuilding reporting segment, would have a particularly significant effect as our average selling price in this segment is the highest among all of our homebuilding reporting segments, a large percentage of our housing revenues is generated from this segment, and a significant proportion of our investments in land and land development have been made, and in 2017 are expected to be made, in that state. In addition, as some of the areas we serve in California are, or have until recently been, experiencing extreme or exceptional drought conditions, we can offer no assurance as to the conservation measures, including impact fees or penalties, that might be imposed by local water agencies/suppliers that could limit, impair or delay our ability to sell and deliver homes; increase our production costs; or decrease the value of land we own or control, which may result in inventory impairment or land option contract abandonment charges, or both. These impacts, individually or collectively, could adversely affect our overall business and consolidated financial statements, and the effect could be material. Moreover, as California is one of the most highly regulated and litigious states in the country, our potential exposure to losses and expenses due to new laws, regulations or litigation may be greater than for other homebuilders with a less significant California presence.
12
Operational Risks
We may have difficulty in obtaining additional financing and/or may be restricted in accessing external capital, and to the extent we can access external financing, it may increase our capital costs or result in stockholder dilution. Under certain circumstances, our obligations to repay our indebtedness may be accelerated and we may be unable to do so.
Our homebuilding operations and our present strategies require significant amounts of cash and/or the availability of external financing. We have historically supported our operations with internally generated cash flows, public equity and debt issuances, land option contracts and other similar contracts and land seller financing. In addition, we have entered into the Credit Facility and the LOC Facility and obtained performance bonds for certain ordinary course aspects of our operations. While we believe we can meet our forecasted capital and operating requirements from our cash resources, expected future cash flows from our operations and anticipated available external financing sources, we can provide no assurance that we will be able to do so at all or without incurring substantially higher costs.
Capital market conditions in 2017 and beyond may significantly limit our ability to obtain additional external financing and/or maintain or, if necessary or appropriate, expand the Credit Facility’s or the LOC Facility’s capacity, or enter into additional or similar such facilities, or obtain performance bonds, in each case on acceptable terms or at all. The relatively low market value of our common stock and volatility in the securities markets could impede our access to such markets or increase the dilution our stockholders would experience if we believe it is necessary or appropriate to issue additional equity securities. As of the date of this report, our credit rating by Fitch Ratings is B+, with a stable outlook, our credit rating by Moody’s Investor Services is B2, with a positive outlook, and our credit rating by Standard and Poor’s Financial Services is B, with a stable outlook. Downgrades of our credit rating by any of these firms may also make it more difficult and costly for us to access external financing sources. The adverse effects of these conditions or events could be material to our business and our consolidated financial statements.
If we fail to comply with the covenants and other requirements imposed by the Credit Facility and the other instruments governing our indebtedness, the participating financial institutions and/or investors could terminate the Credit Facility, cause borrowings under the Credit Facility, if any, or the outstanding principal and unpaid interest under our senior notes, if applicable, to become immediately due and payable and/or could demand that we compensate them for waiving instances of noncompliance. In addition, a default under the Credit Facility or under any series of our senior notes could in certain cases accelerate the maturity of all of our senior notes and restrict borrowings under the Credit Facility, as well as result in penalties and additional fees.
If any such covenant noncompliance or default occurs, it would likely have a material adverse impact on our liquidity, on our ability to operate our business in the ordinary course and on our consolidated financial statements. In addition, we may need to curtail our investment activities and other uses of cash to maintain compliance with the covenants and other requirements under the Credit Facility and the other instruments governing our indebtedness, which could impair our ability to achieve our strategic growth goals.
As described in Note 13 – Notes Payable in the Notes to Consolidated Financial Statements in this report, if a change of control or if a fundamental change were to occur prior to the stated maturity date of our senior notes, we may be required to offer to purchase certain of our senior notes, plus accrued interest and unpaid interest, if any. In such circumstances, if we are unable to generate sufficient cash flows from our operations, we may need to refinance and/or restructure with our lenders or other creditors all or a portion of our outstanding debt obligations on or before their maturity, which we may not be able to do on favorable terms or at all, or raise capital through equity or convertible security issuances that could significantly dilute existing stockholders’ interests, and the impact of such circumstances on our liquidity and consolidated financial statements would be material and adverse.
We have a substantial amount of indebtedness in relation to our tangible net worth and unrestricted cash balance, which may restrict our ability to meet our operational and strategic growth goals.
The amount of our debt overall and relative to our total stockholders’ equity and unrestricted cash balance could have important consequences. For example, it could limit our ability to obtain future financing for working capital, capital expenditures, acquisitions, debt service obligations or other business needs; limit our ability to maintain compliance with the Credit Facility’s financial covenants, or to renew or expand the capacity of the Credit Facility; require us to dedicate a substantial portion of our cash flows from our operations to the payment of our debt service obligations and reduce our ability to use our cash flows for other purposes; impact our flexibility in planning for, or reacting to, changes in our business; limit our ability to successfully implement our current strategies, initiatives or actions, in part due to competition from others with greater available liquidity; place us at a competitive disadvantage because we have more debt than some of our competitors; and make us more vulnerable in the event of a downturn in our business or in general economic or housing market conditions.
Our ability to meet our debt service and other obligations necessary to operate our business in the ordinary course will depend on our future performance. As of the date of this report, our next scheduled maturity of senior notes is on September 15, 2017
13
with respect to
$165.0 million
in aggregate principal amount of our 9.100% senior notes due 2017 (“9.10% Senior Notes due 2017”), reflecting our optional early redemption of
$100.0 million
in aggregate principal amount of the notes outstanding in January 2017.
Reduced home sales may impair our ability to recoup development costs or force us to absorb additional costs.
Depending on the stage of development a land parcel is in when acquired, we may incur expenditures for developing land into a community, such as entitling and finishing lots and installing roads, sewers, water systems and other utilities; taxes and other levies related to ownership of the land; constructing model homes; and promotional marketing and overhead expenses to prepare the community to open for home sales. If the rate at which we sell and deliver homes slows or falls, or if our opening of communities for home sales is delayed due to adjustments in our investment strategy, protracted governmental approval processes or utility service activations, or other reasons, we may incur additional costs, which would adversely affect our housing gross profit margins, and it will take a longer period of time for us to recover our costs.
The value of the land and housing inventory we own or control may fall significantly.
The value of the land and housing inventory we currently own or control depends on market conditions, including estimates of future demand for, and the revenues that can be generated from, this inventory. The value of our inventory can vary considerably because there is often a significant amount of time between our acquiring control or taking ownership of land and the delivery of homes on that land, particularly undeveloped and/or unentitled land. If, in 2017, the present economic or housing environment weakens, if particular markets or submarkets experience challenging or unfavorable changes in prevailing business conditions, including an increase in inflation, if we are unable to sell our land held for sale at its current estimated fair value, or if we elect to revise our strategy relating to certain land positions, we may need to record charges against our earnings for inventory impairments or land option contract abandonments, or both, which occurred in 2016. We may also decide to sell certain land at a loss and record a corresponding charge. In addition, we may record charges against our earnings in connection with activating or selling certain land held for future development in connection with our current strategic initiatives. Any such charges could have a material adverse effect on our consolidated financial statements.
Homebuilding is subject to warranty and liability claims in the ordinary course of business that can be significant.
In the ordinary course of our homebuilding business, we are subject to home warranty and other construction defect claims. We rely upon independent subcontractors to perform actual construction of our homes and in some cases, to select and obtain building materials. We maintain, and require the majority of our independent subcontractors to maintain, general liability insurance (including construction defect and bodily injury coverage) and workers’ compensation insurance. We self-insure a portion of our overall risk through the use of a captive insurance subsidiary. We also maintain certain other insurance policies. However, the coverage offered by and the availability of general liability insurance for construction defects are currently limited and costly, and, in our case, have relatively high self-insured retentions that limit coverage significantly.
Because of the uncertainties inherent to these matters, including our ability to obtain recoveries for home warranty or other construction defect claims from responsible independent contractors and/or their or our insurers, our recorded warranty and other liabilities may not be adequate to address all of our expenditures associated with such claims in the future, and any such inadequacies could negatively affect our consolidated financial statements, including from potentially recording charges to adjust our warranty liability. Home warranty and other construction defect issues may also generate negative publicity in various media outlets, including social media, websites, Internet blogs and newsletters, that could be detrimental to our reputation and adversely affect our efforts to sell homes.
We can provide no assurance that in 2017 we will not face additional home warranty and other construction defect claims and/or incur additional related repair and other costs, or experience negative publicity/reputational harm or be successful in obtaining any recoveries of related repair and other costs, and that any of these items — if they occur, or with respect to recoveries of related repair and other costs, fail to occur — could, individually or collectively, have a material and adverse impact on our business and consolidated financial statements.
We may not realize our significant deferred income tax assets. In addition, our net operating loss carryforwards could be substantially limited if we experience an ownership change as defined in the Internal Revenue Code.
At November 30, 2016, we had deferred tax assets of
$739.0 million
, net of a
$24.8 million
valuation allowance. Our ability to realize our deferred tax assets is based on the extent to which we generate future taxable income and prevailing corporate income tax rates, and we cannot provide any assurance as to when and to what extent we will generate sufficient future taxable income to realize our deferred tax assets, whether in whole or in any part. Changes in existing tax laws or enacted corporate income tax rates could impact such realization as well as the value of our deferred tax assets in our consolidated balance sheets, and these impacts could be material.
14
The benefits of our deferred tax assets, including our net operating losses (“NOLs”), built-in losses and tax credits, would be reduced or potentially eliminated if we experienced an “ownership change” under Internal Revenue Code Section 382 (“Section 382”). We currently believe that an ownership change has not occurred. However, if an ownership change were to occur, the annual limit Section 382 may impose on the amount of NOLs we could use to reduce our taxable income could result in a material amount of our NOLs expiring unused. This would significantly impair the value of our net deferred tax assets and, as a result, have a material negative impact on our consolidated financial statements.
Our ability to attract and retain talent is critical to the success of our business and a failure to do so may materially and adversely affect our performance.
Our officers and employees are important resources, and we see attracting and retaining a dedicated and talented team as crucial to our success. If we are unable to continue to retain and attract qualified employees, or, alternatively, if we are required or believe it is appropriate to reduce our overhead expenses through significant personnel reductions or adjustments to compensation and benefits, our performance, our ability to achieve our strategic growth goals, our business and our consolidated financial statements could be materially and adversely affected.
Information technology failures and data security breaches could harm our business.
We use information technology and other computer resources to carry out important operational activities and to maintain our business records. Many of these resources are provided to us and/or maintained on our behalf by third-party service providers pursuant to agreements that specify to varying degrees certain security and service level standards. Although we and our service providers employ what we believe are adequate security, disaster recovery and other preventative and corrective measures, our ability to conduct our business may be impaired if these resources, including our websites or e-mail system, are compromised, degraded, damaged or fail, whether due to a virus or other harmful circumstance, intentional penetration or disruption of our information technology resources by a third party, natural disaster, hardware or software corruption or failure or error or poor product or vendor/developer selection (including a failure of security controls incorporated into or applied to such hardware or software), telecommunications system failure, service provider error or failure, intentional or unintentional personnel actions (including the failure to follow our security protocols), or lost connectivity to our networked resources.
A significant and extended disruption could damage our reputation and cause us to lose customers, orders, deliveries of homes and revenues, result in the unintended and/or unauthorized public disclosure or the misappropriation of proprietary, personal identifying and confidential information, and require us to incur significant expenses to address and remediate or otherwise resolve these kinds of issues. The release of confidential information may also lead to litigation or other proceedings against us by affected individuals, business partners and/or regulators, and the outcome of such proceedings, which could include losses, penalties, fines, injunctions, expenses and charges recorded against our earnings and cause us reputational harm, could have a material and adverse effect on our business and consolidated financial statements. Depending on its nature, a data security breach may result in the unauthorized use or loss of our assets or financial resources, and such unauthorized use(s) or loss(es), which could be significant, may not be detected for some period of time. In addition, the costs of maintaining adequate protection against data security threats, based on considerations of their evolution, pervasiveness and frequency and/or government-mandated standards or obligations regarding protective efforts, could be material to our consolidated financial statements in a particular period or over various periods.
Legal and Regulatory Risks
We are subject to substantial legal and regulatory requirements regarding the development of land, the homebuilding process and the protection of the environment, which can cause us to suffer production delays and incur costs associated with compliance, and/or prohibit or restrict homebuilding activity in some regions or areas. Our business is also subject to a number of local, state and federal laws, statutes, ordinances, rules, policies and other legal and regulatory requirements. The impact of such requirements or our failure to comply with such requirements, individually or collectively, could be adverse and material to our consolidated financial statements.
Our homebuilding business is heavily regulated and subject to a significant amount of local, state and federal regulation including, among other things, zoning, building designs, worksite health and safety and home construction methods, as well as governmental taxes, fees and levies on the acquisition and development of land. These regulations often provide broad discretion to government authorities that oversee these matters, which can result in unanticipated delays, restrictions, penalties for non-compliance and/or increases in the cost of a development project in particular markets. We can provide no assurance that these regulations will not be interpreted or revised in ways that will require us to change our present strategies or operations, incur significant compliance costs or record charges against our earnings, have a negative impact on our reputation or our relationships with relevant agencies or government authorities, and/or restrict the manner in which we conduct our activities. Any such actions or events, and associated costs and charges, could adversely and materially affect our consolidated financial statements. Also, there have been significant cuts to government departments, subsidies, programs and public employee staffing levels, limiting economic growth and/or resulting in significant delays and/or higher costs in obtaining required inspections, permits or approvals
15
with respect to the development of our communities. These actions or events could adversely affect our ability to generate orders and revenues and/or to maintain or increase our housing gross profit margins, and the impact could be material and adverse to our consolidated financial statements.
In addition, we are subject to a variety of local, state and federal laws, statutes, ordinances, rules and regulations concerning the environment. These requirements and/or evolving interpretations thereof, may cause production delays, may cause us to incur substantial costs, and can prohibit or restrict homebuilding activity in certain areas; any of which could also reduce the value of the affected inventory and require us to record significant impairment charges. Environmental laws may also impose liability for the costs of removal or remediation of hazardous or toxic substances whether or not the developer or owner of the property knew of, or was responsible for, the presence of those substances. The actual or potential presence of those substances on or nearby our properties may prevent us from selling our homes and we may also be liable, under applicable laws and regulations or lawsuits brought by private parties, for hazardous or toxic substances on land that we have sold in the past.
We are also involved in legal, arbitral or regulatory proceedings or investigations incidental to our business, the outcome or settlement of which could result in claims, losses, monetary damage awards, penalties, or other direct or indirect payments recorded against our earnings, or injunctions, consent decrees or other voluntary or involuntary restrictions or adjustments to our business operations or practices. Any such adverse results could be beyond our expectations and/or accruals at particular points in time and material to our business and consolidated financial statements. Unfavorable litigation, arbitral or administrative outcomes may also generate negative publicity in various media outlets, including social media, websites, Internet blogs and newsletters, that could be detrimental to our reputation and adversely affect our efforts to sell homes.
The mortgage banking operations of HCM are heavily regulated and subject to rules and regulations promulgated by a number of governmental and quasi-governmental agencies. If there is a finding that Nationstar, which provided management oversight of HCM’s operations, or HCM materially violated any applicable rules or regulations, or mortgage investors seek to have HCM buy back mortgage loans or compensate them for losses incurred on mortgage loans HCM has sold based on claims that it breached its limited representations or warranties, HCM could face significant liabilities, which could exceed its reserves and cause us to recognize additional losses with respect to our equity interest in HCM.
Tax law changes could make home ownership more expensive or less attractive.
Under current tax law, significant expenses of owning a home, including mortgage loan interest costs and real estate taxes, generally are deductible expenses for the purpose of calculating an individual’s or household’s federal, and in some cases state, taxable income subject to various limitations. If the federal government or a state government changes its income tax laws by eliminating, limiting or substantially reducing these income tax benefits, the after-tax cost of owning a home could increase substantially. Any increases in personal income tax rates and/or tax deduction limits or restrictions enacted at the federal or state levels could adversely impact demand for and/or selling prices of new homes, including our homes, and the effect on our consolidated financial statements could be adverse and material.
|
Item 1B.
|
UNRESOLVED STAFF COMMENTS
|
None.
|
Item 2.
|
PROPERTIES
|
We lease our corporate headquarters in Los Angeles, California. Our homebuilding division offices (except for our San Antonio, Texas office) and our design studios are located in leased space in the markets where we conduct business. We own the premises for our San Antonio office.
We believe that such properties, including the equipment located therein, are suitable and adequate to meet the needs of our businesses.
|
Item 3.
|
LEGAL PROCEEDINGS
|
Our legal proceedings are discussed in Note 16 – Legal Matters in the Notes to Consolidated Financial Statements in this report.
|
Item 4.
|
MINE SAFETY DISCLOSURES
|
Not applicable.
16
EXECUTIVE OFFICERS OF THE REGISTRANT
The following table presents certain information regarding our executive officers as of December 31, 2016:
|
Name
|
Age
|
Present Position
|
Year
Assumed
Present
Position
|
Years
at
KB
Home
|
Other Positions and Other
Business Experience within the
Last Five Years (a)
|
From – To
|
||||||
|
Jeffrey T. Mezger
|
61
|
Chairman, President and Chief Executive Officer (b)
|
2016
|
23
|
President and Chief Executive Officer (b)
|
2006-2016
|
||||||
|
Nicholas S. Franklin
|
48
|
Executive Vice President, Strategic Operations
|
2015
|
2
|
Executive Vice President, Next Generation Experience, Walt Disney Parks and Resorts Worldwide, Inc. (an international family entertainment and media enterprise)
|
2009-2014
|
||||||
|
Jeff J. Kaminski
|
55
|
Executive Vice President and Chief Financial Officer
|
2010
|
6
|
||||||||
|
Albert Z. Praw
|
68
|
Executive Vice President, Real Estate and Business Development
|
2011
|
20
|
||||||||
|
Brian J. Woram
|
56
|
Executive Vice President and General Counsel
|
2010
|
6
|
||||||||
|
William R. Hollinger
|
58
|
Senior Vice President and Chief Accounting Officer
|
2007
|
29
|
||||||||
|
Thomas F. Norton
|
46
|
Senior Vice President, Human Resources
|
2009
|
8
|
||||||||
|
(a)
|
All positions described were with us, unless otherwise indicated.
|
|
(b)
|
Mr. Mezger has served as a director since 2006. He was elected Chairman of our board of directors in August 2016.
|
There is no family relationship between any of our executive officers or between any of our executive officers and any of our directors.
|
Item 5.
|
MARKET FOR REGISTRANT
’
S COMMON EQUITY, RELATED STOCKHOLDER MATTERS AND ISSUER PURCHASES OF EQUITY SECURITIES
|
As of December 31, 2016, there were 600 holders of record of our common stock. Our common stock is traded on the New York Stock Exchange under the ticker symbol “KBH.” The following table presents, for the periods indicated, the price ranges of our common stock, and cash dividends declared and paid per share:
|
|
Year Ended November 30, 2016
|
Year Ended November 30, 2015
|
|||||||||||||||||||||||||||||
|
|
High
|
Low
|
Dividends
Declared
|
Dividends
Paid
|
High
|
Low
|
Dividends
Declared
|
Dividends
Paid
|
|||||||||||||||||||||||
|
First Quarter
|
$
|
14.50
|
|
$
|
9.04
|
|
$
|
.0250
|
|
$
|
.0250
|
|
$
|
17.57
|
|
$
|
11.76
|
|
$
|
.0250
|
|
$
|
.0250
|
|
|||||||
|
Second Quarter
|
14.92
|
|
12.20
|
|
.0250
|
|
.0250
|
|
16.37
|
|
13.21
|
|
.0250
|
|
.0250
|
|
|||||||||||||||
|
Third Quarter
|
16.76
|
|
13.66
|
|
.0250
|
|
.0250
|
|
17.42
|
|
13.50
|
|
.0250
|
|
.0250
|
|
|||||||||||||||
|
Fourth Quarter
|
16.57
|
|
14.06
|
|
.0250
|
|
.0250
|
|
15.53
|
|
12.72
|
|
.0250
|
|
.0250
|
|
|||||||||||||||
The declaration and payment of cash dividends on shares of our common stock, whether at current levels or at all, are at the discretion of our board of directors, and depend upon, among other things, our expected future earnings, cash flows from our operations, capital requirements, access to external financing, debt structure and adjustments thereto, covenants and other requirements under the Credit Facility or other of our debt obligations, operational and financial investment strategy and general financial condition, as well as general business conditions.
Information regarding the shares of our common stock that may be issued under our equity compensation plans is provided below in the “Security Ownership of Certain Beneficial Owners and Management and Related Stockholder Matters” section in this report.
The following table summarizes our purchases of our own equity securities during the three months ended November 30, 2016:
17
|
Period
|
Total Number of Shares Purchased
|
Average Price Paid per Share
|
Total Number of Shares Purchased as Part of Publicly Announced Plans or Programs
|
Maximum Number of Shares That May Yet be Purchased Under the Plans or Programs
|
|||||||||
|
September 1-30
|
—
|
|
$
|
—
|
|
—
|
|
1,627,000
|
|
||||
|
October 1-31
|
54,405
|
|
15.23
|
|
—
|
|
1,627,000
|
|
|||||
|
November 1-30
|
—
|
|
—
|
|
—
|
|
1,627,000
|
|
|||||
|
Total
|
54,405
|
|
$
|
15.23
|
|
—
|
|
||||||
As we publicly reported, on January 12, 2016, our board of directors authorized us to repurchase a total of up to 10,000,000 shares of our outstanding common stock. As of
November 30, 2016
, we had repurchased
8,373,000
shares of our common stock pursuant to this authorization, at a total cost of
$85.9 million
.
The shares purchased during the three months ended November 30, 2016 were previously issued shares delivered to us by employees to satisfy withholding taxes on the vesting of restricted stock awards as well as shares forfeited by individuals upon their termination of employment. These transactions are not considered repurchases under the board of directors’ authorization.
Stock Performance Graph
The following graph compares the five-year cumulative total return of KB Home common stock, the S&P 500 Index and the Dow Jones US Home Construction Index for the periods ended November 30:
Comparison of Five-Year Cumulative Total Return
Among KB Home, S&P 500 Index and
Dow Jones US Home Construction Index
|
2011
|
2012
|
2013
|
2014
|
2015
|
2016
|
||||||||||||||||||
|
KB Home
|
$
|
100
|
|
$
|
198
|
|
$
|
243
|
|
$
|
245
|
|
$
|
198
|
|
$
|
224
|
|
|||||
|
S&P 500 Index
|
100
|
|
116
|
|
151
|
|
177
|
|
182
|
|
196
|
|
|||||||||||
|
Dow Jones US Home Construction Index
|
100
|
|
175
|
|
183
|
|
220
|
|
250
|
|
220
|
|
|||||||||||
The above graph is based on the KB Home common stock and index prices calculated as of the last trading day before December 1 of the year-end periods presented. The closing price of KB Home common stock on the New York Stock Exchange was $15.84 per share on
November 30, 2016
and $14.09 per share on November 30, 2015. The performance of our common stock
18
as presented above reflects past performance only and is not indicative of future performance. Total return assumes $100 invested at market close on November 30, 2011 in KB Home common stock, the S&P 500 Index and the Dow Jones US Home Construction Index, including reinvestment of dividends.
|
Item 6.
|
SELECTED FINANCIAL DATA
|
The data in this table should be read in conjunction with the “Management’s Discussion and Analysis of Financial Condition and Results of Operations” and “Financial Statements and Supplementary Data” sections in this report.
KB HOME
SELECTED FINANCIAL DATA
(Dollars In Thousands, Except Per Share Amounts)
|
|
Years Ended November 30,
|
||||||||||||||||||
|
|
2016
|
2015
|
2014
|
2013
|
2012
|
||||||||||||||
|
Statement of Operations Data:
|
|||||||||||||||||||
|
Revenues:
|
|||||||||||||||||||
|
Homebuilding
|
$
|
3,582,943
|
|
$
|
3,020,987
|
|
$
|
2,389,643
|
|
$
|
2,084,978
|
|
$
|
1,548,432
|
|
||||
|
Financial services
|
11,703
|
|
11,043
|
|
11,306
|
|
12,152
|
|
11,683
|
|
|||||||||
|
Total
|
$
|
3,594,646
|
|
$
|
3,032,030
|
|
$
|
2,400,949
|
|
$
|
2,097,130
|
|
$
|
1,560,115
|
|
||||
|
Operating income (loss):
|
|||||||||||||||||||
|
Homebuilding
|
$
|
152,401
|
|
$
|
138,621
|
|
$
|
115,969
|
|
$
|
92,084
|
|
$
|
(20,256
|
)
|
||||
|
Financial services
|
7,886
|
|
7,332
|
|
7,860
|
|
9,110
|
|
8,692
|
|
|||||||||
|
Total
|
$
|
160,287
|
|
$
|
145,953
|
|
$
|
123,829
|
|
$
|
101,194
|
|
$
|
(11,564
|
)
|
||||
|
Pretax income (loss)
|
$
|
149,315
|
|
$
|
127,043
|
|
$
|
94,949
|
|
$
|
38,363
|
|
$
|
(79,053
|
)
|
||||
|
Net income (loss) (a)
|
105,615
|
|
84,643
|
|
918,349
|
|
39,963
|
|
(58,953
|
)
|
|||||||||
|
Earnings (loss) per share:
|
|||||||||||||||||||
|
Basic
|
$
|
1.23
|
|
$
|
.92
|
|
$
|
10.26
|
|
$
|
.48
|
|
$
|
(.76
|
)
|
||||
|
Diluted
|
1.12
|
|
.85
|
|
9.25
|
|
.46
|
|
(.76
|
)
|
|||||||||
|
Cash dividends declared per common share
|
.1000
|
|
.1000
|
|
.1000
|
|
.1000
|
|
.1375
|
|
|||||||||
|
Balance Sheet Data:
|
|||||||||||||||||||
|
Assets:
|
|||||||||||||||||||
|
Homebuilding
|
$
|
5,121,125
|
|
$
|
5,072,877
|
|
$
|
4,846,083
|
|
$
|
3,309,558
|
|
$
|
2,693,434
|
|
||||
|
Financial services
|
10,499
|
|
14,028
|
|
10,486
|
|
10,040
|
|
4,455
|
|
|||||||||
|
Total
|
$
|
5,131,624
|
|
$
|
5,086,905
|
|
$
|
4,856,569
|
|
$
|
3,319,598
|
|
$
|
2,697,889
|
|
||||
|
Notes payable
|
$
|
2,640,149
|
|
$
|
2,601,754
|
|
$
|
2,550,622
|
|
$
|
2,125,254
|
|
$
|
1,708,252
|
|
||||
|
Stockholders’ equity
|
1,723,145
|
|
1,690,834
|
|
1,595,910
|
|
536,086
|
|
376,806
|
|
|||||||||
|
Homebuilding Data:
|
|||||||||||||||||||
|
Net orders
|
10,283
|
|
9,253
|
|
7,567
|
|
7,125
|
|
6,703
|
|
|||||||||
|
Unit backlog
|
4,420
|
|
3,966
|
|
2,909
|
|
2,557
|
|
2,577
|
|
|||||||||
|
Homes delivered
|
9,829
|
|
8,196
|
|
7,215
|
|
7,145
|
|
6,282
|
|
|||||||||
|
(a)
|
Net income for the year ended November 30, 2014 included the impact of an
$825.2 million
deferred tax asset valuation allowance reversal in the 2014 fourth quarter.
|
19
|
Item 7.
|
MANAGEMENT
’
S DISCUSSION AND ANALYSIS OF FINANCIAL CONDITION AND RESULTS OF OPERATIONS
|
RESULTS OF OPERATIONS
Overview.
Revenues are generated from our homebuilding and financial services operations. The following table presents a summary of our consolidated results of operations (dollars in thousands, except per share amounts):
|
|
Years Ended November 30,
|
Variance
|
|||||||||||||||
|
|
2016
|
2015
|
2014
|
2016 vs 2015
|
2015 vs 2014
|
||||||||||||
|
Revenues:
|
|||||||||||||||||
|
Homebuilding
|
$
|
3,582,943
|
|
$
|
3,020,987
|
|
$
|
2,389,643
|
|
19
|
%
|
26
|
%
|
||||
|
Financial services
|
11,703
|
|
11,043
|
|
11,306
|
|
6
|
|
(2
|
)
|
|||||||
|
Total
|
$
|
3,594,646
|
|
$
|
3,032,030
|
|
$
|
2,400,949
|
|
19
|
%
|
26
|
%
|
||||
|
Pretax income:
|
|||||||||||||||||
|
Homebuilding
|
$
|
144,849
|
|
$
|
115,419
|
|
$
|
86,403
|
|
25
|
%
|
34
|
%
|
||||
|
Financial services
|
4,466
|
|
11,624
|
|
8,546
|
|
(62
|
)
|
36
|
|
|||||||
|
Total
|
149,315
|
|
127,043
|
|
94,949
|
|
18
|
|
34
|
|
|||||||
|
Income tax benefit (expense)
|
(43,700
|
)
|
(42,400
|
)
|
823,400
|
|
(3
|
)
|
(a)
|
|
|||||||
|
Net income
|
$
|
105,615
|
|
$
|
84,643
|
|
$
|
918,349
|
|
25
|
%
|
(91
|
)%
|
||||
|
Earnings per share:
|
|||||||||||||||||
|
Basic
|
$
|
1.23
|
|
$
|
.92
|
|
$
|
10.26
|
|
34
|
%
|
(91
|
)%
|
||||
|
Diluted
|
$
|
1.12
|
|
$
|
.85
|
|
$
|
9.25
|
|
32
|
%
|
(91
|
)%
|
||||
(a) Percentage not meaningful.
With favorable conditions in most of our served markets, reflecting generally positive economic and employment trends, and our steady execution on our key strategies during 2016, we significantly expanded both our revenues and earnings compared to 2015. Within our homebuilding operations, housing revenues grew
23%
year over year to
$3.58 billion
, as the number of homes we delivered increased
20%
to
9,829
and the overall average selling price of those homes rose
3%
to
$363,800
. Our housing gross profit margin for 2016 decreased
10
basis points year over year to
16.2%
. Our selling, general and administrative expense ratio for 2016 improved
90
basis points year over year to
10.9%
of housing revenues, reflecting enhanced operating leverage on fixed costs due to successful cost containment efforts and corresponding higher housing revenues. Homebuilding operating income for 2016 increased
10%
to
$152.4 million
, including total inventory-related charges of
$52.8 million
in 2016, compared to
$9.6 million
in the year-earlier period. The year-over-year increase in total inventory-related charges was largely due to inventory impairment charges associated with our decision in the 2016 fourth quarter to monetize certain non-strategic land parcels through land sales as part of our returns-focused growth plan, which is described in the “Business” section of this report, and inventory impairment and land option contract abandonment charges associated with the wind down of our Metro Washington, D.C. operations. For the year ended November 30, 2016, we posted net income of
$105.6 million
, up
25%
from 2015, and diluted earnings per share of
$1.12
, up
32%
from a year ago.
During 2016, we invested
$1.36 billion
in land and land development to expand the number of our community openings in 2017 and beyond. In 2015, such investments totaled
$967.2 million
. Approximately
46%
of our total investment in 2016 related to land acquisitions, compared to approximately
32%
in the year-earlier period.
The following table presents information concerning our net orders, cancellation rate, ending backlog, and community count for the years ended November 30, 2016 and 2015 (dollars in thousands):
20
|
Years Ended November 30,
|
||||||||
|
2016
|
2015
|
|||||||
|
Net orders
|
10,283
|
|
9,253
|
|
||||
|
Net order value (a)
|
$
|
3,813,155
|
|
$
|
3,255,170
|
|
||
|
Cancellation rate (b)
|
25
|
%
|
27
|
%
|
||||
|
Ending backlog — homes
|
4,420
|
|
3,966
|
|
||||
|
Ending backlog — value
|
$
|
1,519,089
|
|
$
|
1,281,478
|
|
||
|
Ending community count
|
235
|
|
247
|
|
||||
|
Average community count
|
238
|
|
244
|
|
||||
|
(a)
|
Net order value represents the potential future housing revenues associated with net orders generated during a period as well as homebuyer selections of lot and product premiums and design studio options and upgrades for homes in backlog during the same period.
|
|
(b)
|
The cancellation rate represents the total number of contracts for new homes canceled during a period divided by the total (gross) orders for new homes generated during the same period.
|
Net Orders
. In 2016, net orders from our homebuilding operations increased
11%
from 2015, despite a decrease in our average community count. The combination of higher net orders and a higher overall average selling price resulted in the value of our 2016 net orders increasing
17%
from 2015. Our cancellation rate for 2016 also showed improvement compared to the previous year.
Backlog
. The number of homes in our backlog at November 30, 2016 rose
11%
from the previous year, largely due to a year-over-year increase in our net orders in 2016. The potential future housing revenues in our backlog at November 30, 2016 grew
19%
from the prior year, reflecting the larger number of homes in our backlog and the higher average selling price of those homes. Substantially all of the homes in our backlog at November 30, 2016 are expected to be delivered during the year ending November 30, 2017.
Communit
y
Count
. Our ending and average community counts for 2016 decreased
5%
and
2%
, respectively, each on a year-over-year basis. The majority of these decreases occurred in our Southeast homebuilding reporting segment due to the wind down of our Metro Washington, D.C. operations as well as fewer community openings during 2016.
In the 2016 second quarter, we announced that we had begun a transition out of the Metro Washington, D.C. market. This transition is expected to be completed in 2017. We decided to wind down our operations in this market in order to reallocate our resources to markets where we believe we can generate stronger returns. Our operations in the Metro Washington, D.C. market consisted of communities in Maryland and Virginia, which are included in our Southeast homebuilding reporting segment and represented
2%
and
3%
of our consolidated homebuilding revenues in 2016 and 2015, respectively. We are constructing and delivering homes in our remaining communities in this market. We also have other land interests in this market that we intend to build out or sell.
HOMEBUILDING
The following table presents a summary of certain financial and operational data for our homebuilding operations (dollars in thousands, except average selling price):
21
|
|
Years Ended November 30,
|
||||||||||
|
|
2016
|
2015
|
2014
|
||||||||
|
Revenues:
|
|||||||||||
|
Housing
|
$
|
3,575,548
|
|
$
|
2,908,236
|
|
$
|
2,369,633
|
|
||
|
Land
|
7,395
|
|
112,751
|
|
20,010
|
|
|||||
|
Total
|
3,582,943
|
|
3,020,987
|
|
2,389,643
|
|
|||||
|
Costs and expenses:
|
|||||||||||
|
Construction and land costs
|
|||||||||||
|
Housing
|
(2,997,073
|
)
|
(2,433,683
|
)
|
(1,940,100
|
)
|
|||||
|
Land
|
(44,028
|
)
|
(105,685
|
)
|
(45,551
|
)
|
|||||
|
Total
|
(3,041,101
|
)
|
(2,539,368
|
)
|
(1,985,651
|
)
|
|||||
|
Selling, general and administrative expenses
|
(389,441
|
)
|
(342,998
|
)
|
(288,023
|
)
|
|||||
|
Total
|
(3,430,542
|
)
|
(2,882,366
|
)
|
(2,273,674
|
)
|
|||||
|
Operating income
|
$
|
152,401
|
|
$
|
138,621
|
|
$
|
115,969
|
|
||
|
Homes delivered
|
9,829
|
|
8,196
|
|
7,215
|
|
|||||
|
Average selling price
|
$
|
363,800
|
|
$
|
354,800
|
|
$
|
328,400
|
|
||
|
Housing gross profit margin as a percentage of housing revenues
|
16.2
|
%
|
16.3
|
%
|
18.1
|
%
|
|||||
|
Adjusted housing gross profit margin as a percentage of housing revenues
|
21.1
|
%
|
21.0
|
%
|
22.5
|
%
|
|||||
|
Selling, general and administrative expenses as a percentage of housing revenues
|
10.9
|
%
|
11.8
|
%
|
12.2
|
%
|
|||||
|
Operating income as a percentage of homebuilding revenues
|
4.3
|
%
|
4.6
|
%
|
4.9
|
%
|
|||||
The following tables present homes delivered, net orders, cancellation rates, net order value, average community count, and ending backlog (number of homes and value) by homebuilding reporting segment (dollars in thousands):
|
Years Ended November 30,
|
||||||||||||||||||
|
Homes Delivered
|
Net Orders
|
Cancellation Rates
|
||||||||||||||||
|
Segment
|
2016
|
2015
|
2016
|
2015
|
2016
|
2015
|
||||||||||||
|
West Coast
|
2,825
|
|
2,258
|
|
3,000
|
|
2,403
|
|
18
|
%
|
21
|
%
|
||||||
|
Southwest
|
1,559
|
|
1,311
|
|
1,758
|
|
1,592
|
|
20
|
|
22
|
|
||||||
|
Central
|
3,744
|
|
3,183
|
|
3,881
|
|
3,536
|
|
30
|
|
33
|
|
||||||
|
Southeast
|
1,701
|
|
1,444
|
|
1,644
|
|
1,722
|
|
29
|
|
26
|
|
||||||
|
Total
|
9,829
|
|
8,196
|
|
10,283
|
|
9,253
|
|
25
|
%
|
27
|
%
|
||||||
|
|
Net Order Value
|
Average Community Count
|
||||||||||||||||||||
|
Segment
|
2016
|
2015
|
Variance
|
2016
|
2015
|
Variance
|
||||||||||||||||
|
West Coast
|
$
|
1,756,945
|
|
$
|
1,378,644
|
|
27
|
%
|
59
|
|
53
|
|
11
|
%
|
||||||||
|
Southwest
|
507,870
|
|
455,918
|
|
11
|
|
37
|
|
37
|
|
—
|
|
||||||||||
|
Central
|
1,075,586
|
|
943,568
|
|
14
|
|
90
|
|
93
|
|
(3
|
)
|
||||||||||
|
Southeast
|
472,754
|
|
477,040
|
|
(1
|
)
|
52
|
|
61
|
|
(15
|
)
|
||||||||||
|
Total
|
$
|
3,813,155
|
|
$
|
3,255,170
|
|
17
|
%
|
238
|
|
244
|
|
(2
|
)%
|
||||||||
|
|
||||||||||||||||||||||
22
|
November 30,
|
||||||||||||||||||||||
|
|
Backlog – Homes
|
Backlog – Value
|
||||||||||||||||||||
|
Segment
|
2016
|
2015
|
Variance
|
2016
|
2015
|
Variance
|
||||||||||||||||
|
West Coast
|
913
|
|
738
|
|
24
|
%
|
$
|
526,840
|
|
$
|
407,972
|
|
29
|
%
|
||||||||
|
Southwest
|
804
|
|
605
|
|
33
|
|
227,822
|
|
167,425
|
|
36
|
|
||||||||||
|
Central
|
1,979
|
|
1,842
|
|
7
|
|
559,172
|
|
494,836
|
|
13
|
|
||||||||||
|
Southeast
|
724
|
|
781
|
|
(7
|
)
|
205,255
|
|
211,245
|
|
(3
|
)
|
||||||||||
|
Total
|
4,420
|
|
3,966
|
|
11
|
%
|
$
|
1,519,089
|
|
$
|
1,281,478
|
|
19
|
%
|
||||||||
Revenues.
Homebuilding revenues totaled
$3.58 billion
in 2016, up
19%
from 2015, which had increased
26%
from 2014. The year-over-year growth in our homebuilding revenues in 2016 reflected an increase in our housing revenues that was partly offset by a decrease in revenues from land sales in the current year. In 2015, the year-over-year growth in homebuilding revenues was driven by increases in both housing and land sale revenues.
Housing revenues in 2016 rose
23%
from the previous year, reflecting a
20%
increase in the number of homes delivered and a
3%
increase in the overall average selling price of those homes. In 2015, housing revenues grew
23%
from 2014 due to a
14%
increase in the number of homes delivered and an
8%
increase in the overall average selling price. We delivered a total of
9,829
homes in 2016, up from
8,196
in 2015. This year-over-year increase primarily reflected the
36%
higher backlog of homes we had at the beginning of 2016 as compared to the previous year and an
11%
increase in our net orders during the current year. In 2015, the number of homes delivered rose from
7,215
in 2014 mainly as a result of the 14% higher backlog of homes we had at the beginning of 2015 and a
22%
increase in our net orders during 2015.
The overall average selling price of homes delivered rose to
$363,800
in 2016 from
$354,800
in 2015, which had increased from
$328,400
in 2014. The year-over-year increases in our overall average selling price in both 2016 and 2015 resulted from a strategic focus on positioning our new home communities in attractive, land-constrained locations that feature higher-income homebuyers; higher median home selling prices; our actions to balance sales pace and selling prices within our communities to optimize revenues and profits; and generally favorable market conditions.
Land sale revenues totaled
$7.4 million
in 2016,
$112.8 million
in 2015 and
$20.0 million
in 2014. The higher land sale revenues in 2015 as compared to 2016 and 2014 reflected our execution on opportunistic transactions in each of our four homebuilding reporting segments aligned with ongoing efforts to improve our asset efficiency. The transactions in 2015 were mainly comprised of the sale of a large land parcel in northern California and sales of other non-strategic land parcels that had previously been held for future development. Generally, land sale revenues fluctuate with our decisions to maintain or decrease our land ownership position in certain markets based upon the volume of our holdings, our business strategy, the strength and number of developers and other land buyers in particular markets at given points in time, the availability of opportunities to sell land at acceptable prices and prevailing market conditions.
Operating Income.
Our homebuilding operating income increased
10%
to
$152.4 million
in 2016 compared to
$138.6 million
in 2015, which had increased
20%
from
$116.0 million
in 2014. As a percentage of homebuilding revenues, homebuilding operating income was
4.3%
in 2016,
4.6%
in 2015 and
4.9%
in 2014. The year-over-year growth in homebuilding operating income for 2016 was due to an increase in housing gross profits that was partly offset by an increase in selling, general and administrative expenses, and land sale losses. Our homebuilding operating income included total inventory-related charges of
$52.8 million
in 2016, compared to
$9.6 million
in the year-earlier period. In 2015, the year-over-year growth in our homebuilding operating income reflected higher housing gross profits and improved land sale results that were partly offset by higher selling, general and administrative expenses.
In 2016, housing gross profits increased by
$103.9 million
, or
22%
, from
$474.6 million
in 2015 due to the higher volume of homes delivered, partly offset by a slight decrease in the housing gross profit margin. Housing gross profits for 2016 included
$16.2 million
of inventory impairment and land option contract abandonment charges. In 2015, our housing gross profits increased by
$45.0 million
, or
10%
, from
$429.5 million
in the previous year due to the higher volume of homes delivered, partly offset by a lower housing gross profit margin. Housing gross profits for 2015 included
$9.6 million
of inventory impairment and land option contract abandonment charges, compared to
$12.8 million
of such charges for 2014.
Our housing gross profit margin for 2016 declined
10
basis points to
16.2%
from
16.3%
in the previous year, primarily due to higher construction and land costs (approximately
20
basis points), as well as increases in both inventory-related charges (approximately
10
basis points) and the amortization of previously capitalized interest (approximately
10
basis points), partly offset by improved operating leverage on fixed costs as a result of our higher volume of homes delivered and corresponding higher housing revenues (approximately
30
basis points). In 2015, the housing gross profit margin decreased by
180
basis points as
23
compared to
18.1%
in 2014, primarily due to higher construction and land costs (approximately
210
basis points) and an increase in the amortization of previously capitalized interest (approximately
60
basis points), partly offset by a decrease in inventory-related charges (approximately
30
basis points) and improved operating leverage on fixed costs as a result of our higher volume of homes delivered and corresponding higher housing revenues (approximately
60
basis points). Sales incentives did not have a significant impact on our year-over-year housing gross profit margin comparisons in 2016 or 2015.
Excluding the amortization of previously capitalized interest associated with housing operations of
$160.6 million
,
$126.8 million
and
$90.8 million
in 2016, 2015 and 2014, respectively, and the above-mentioned inventory-related charges in the applicable periods, our adjusted housing gross profit margin increased
10
basis points to
21.1%
in 2016 from
21.0%
in 2015, which had decreased
150
basis points from
22.5%
in 2014. The calculation of adjusted housing gross profit margin, which we believe provides a clearer measure of the performance of our business, is described below under “Non-GAAP Financial Measures.”
Land sales generated losses of
$36.6 million
in 2016, profits of
$7.1 million
in 2015 and losses of
$25.5 million
in 2014. The land sale results in 2016 included inventory impairment charges of
$36.7 million
, most of which were recognized in the fourth quarter associated with our decision to monetize certain non-strategic land parcels through land sales as part of our returns-focused growth plan, which is described in the “Business” section of this report. These land parcels, which were classified as land held for sale at November 30, 2016, included land in excess of our near-term requirements; land where we now believe the necessary incremental investment in development is not justified; land located in areas outside of our served markets; and/or land entitled for certain product types that are not aligned with our primary product offerings. The majority of these land parcels are located in our Southeast homebuilding reporting segment. We also recorded inventory impairment charges in the 2016 second quarter associated with the planned future sales of two land parcels in the Metro Washington, D.C. market as a result of our decision to wind down our operations in this market, and in the 2016 first quarter related to the sales of our last remaining land parcels in the Rio Grande Valley area of Texas that closed in the second quarter. The land sale results in 2014 included inventory impairment charges of
$26.6 million
related to then-planned land sales, all of which had closed as of November 30, 2015.
As discussed in Note 7 – Inventory Impairments and Land Option Contract Abandonments in the Notes to Consolidated Financial Statements in this report, we recognized total inventory impairment charges (including those associated with the above-mentioned land sales) of
$49.6 million
in 2016,
$8.0 million
in 2015 and
$37.6 million
in 2014, and land option contract abandonment charges of
$3.2 million
in 2016,
$1.6 million
in 2015 and
$1.8 million
in 2014.
Selling, general and administrative expenses totaled
$389.4 million
in 2016, up from
$343.0 million
in 2015, which had increased from
$288.0 million
in 2014. The year-over-year increases in selling, general and administrative expenses in 2016 and 2015 mainly reflected higher variable expenses associated with the increases in the volume of homes delivered and corresponding housing revenues. Also contributing to the year-over-year increase in 2015 were higher staffing levels and new community and related operating platform investments to support both the strategic expansion of our community count that year and anticipated growth in homes delivered, the acceleration of compensation expense associated with stock options due to certain recipients meeting retirement provisions, and legal settlements. As a percentage of housing revenues, selling, general and administrative expenses were
10.9%
in 2016,
11.8%
in 2015 and
12.2%
in 2014. The percentages improved on a year-over-year basis in both 2016 and 2015 largely due to improved operating leverage on fixed costs from the increased volume of homes delivered and corresponding higher housing revenues in each of those years and our ongoing efforts to contain our overhead costs to the extent possible.
Interest Income.
Interest income, which is generated from short-term investments, totaled
$.5 million
in each of 2016 and 2015 and
$.4 million
in 2014. Generally, increases and decreases in interest income are attributable to changes in the interest-bearing average balances of short-term investments and fluctuations in interest rates.
Interest Expense.
Interest expense results principally from our borrowings to finance land acquisitions, land development, home construction and other operating and capital needs. Our interest expense, net of amounts capitalized, decreased to
$5.9 million
in 2016 compared to
$21.9 million
in 2015, which had decreased from
$30.8 million
in 2014. In 2016, the year-over-year decrease in interest expense reflected a slight decrease in interest incurred and an increase in the amount of interest capitalized due to a higher amount of inventory qualifying for interest capitalization in the current year. In 2015, interest expense decreased on a year-over-year basis as an increase in interest incurred, stemming from our higher average debt level, was more than offset by an increase in the amount of interest capitalized due to a higher amount of inventory qualifying for interest capitalization.
For the years ended November 30, 2016, 2015 and 2014, the average amount of our inventory qualifying for interest capitalization was lower than our average debt level; therefore, a portion of the interest we incurred was reflected as interest expense. In both 2016 and 2015, the amount of inventory qualifying for interest capitalization increased more than our debt level increased, each as compared to the previous year, primarily as a result of our substantial investment in land and land development as well as the activation of land previously held for future development in each of those years. Accordingly, our interest expense decreased on a year-over-year basis in both 2016 and 2015.
24
Interest incurred decreased
1%
to
$185.5 million
in 2016 from
$186.9 million
in 2015, which rose
9%
from
$171.5 million
in 2014. The amount of interest incurred generally fluctuates based on the average amount of debt outstanding for the period and/or the interest rate on that debt. We capitalized
$179.6 million
,
$165.0 million
and
$140.8 million
of the interest incurred in 2016, 2015 and 2014, respectively. The percentage of interest capitalized was
97%
in 2016,
88%
in 2015 and
82%
in 2014. The percentage of interest capitalized generally fluctuates based on the amount of our inventory qualifying for interest capitalization and the amount of debt outstanding.
Interest amortized to construction and land costs associated with housing operations totaled
$160.6 million
in 2016,
$126.8 million
in 2015 and
$90.8 million
in 2014. The increases in interest amortized in 2016 and 2015 reflected year-over-year increases in the number of homes delivered and higher overall construction and land costs attributable to those homes. As a percentage of housing revenues, the amortization of previously capitalized interest associated with housing operations was
4.5%
for 2016,
4.4%
for 2015 and
3.8%
for 2014. Additionally, interest amortized to construction and land costs in 2016 and 2015 included
$.7 million
and
$16.4 million
, respectively, of amortization of previously capitalized interest related to land sales that occurred during those years.
Equity in Income (Loss) of Unconsolidated Joint Ventures.
Our equity in loss of unconsolidated joint ventures totaled
$2.2 million
in 2016 and
$1.8 million
in 2015. In 2014, our equity in income of unconsolidated joint ventures of
$.7 million
included a
$3.2 million
gain on the sale of our interest in an unconsolidated joint venture in Maryland. Further information regarding our investments in unconsolidated joint ventures is provided in Note 9 – Investments in Unconsolidated Joint Ventures in the Notes to Consolidated Financial Statements in this report.
Non-GAAP Financial Measures
This report contains information about our adjusted housing gross profit margin and ratio of net debt to capital, neither of which are calculated in accordance with generally accepted accounting principles (“GAAP”). We believe these non-GAAP financial measures are relevant and useful to investors in understanding our operations and the leverage employed in our operations, and may be helpful in comparing us with other companies in the homebuilding industry to the extent they provide similar information. However, because the adjusted housing gross profit margin and the ratio of net debt to capital are not calculated in accordance with GAAP, these financial measures may not be completely comparable to other companies in the homebuilding industry and thus, should not be considered in isolation or as an alternative to operating performance and/or financial measures prescribed by GAAP. Rather, these non-GAAP financial measures should be used to supplement their respective most directly comparable GAAP financial measures in order to provide a greater understanding of the factors and trends affecting our operations.
Adjusted Housing Gross Profit Margin.
The following table reconciles our housing gross profit margin calculated in accordance with GAAP to the non-GAAP financial measure of our adjusted housing gross profit margin (dollars in thousands):
|
|
Years Ended November 30,
|
||||||||||
|
|
2016
|
2015
|
2014
|
||||||||
|
Housing revenues
|
$
|
3,575,548
|
|
$
|
2,908,236
|
|
$
|
2,369,633
|
|
||
|
Housing construction and land costs
|
(2,997,073
|
)
|
(2,433,683
|
)
|
(1,940,100
|
)
|
|||||
|
Housing gross profits
|
578,475
|
|
474,553
|
|
429,533
|
|
|||||
|
Add: Amortization of previously capitalized interest (a)
|
160,633
|
|
126,817
|
|
90,804
|
|
|||||
|
Inventory-related charges (b)
|
16,152
|
|
9,591
|
|
12,788
|
|
|||||
|
Adjusted housing gross profits
|
$
|
755,260
|
|
$
|
610,961
|
|
$
|
533,125
|
|
||
|
Housing gross profit margin as a percentage of housing revenues
|
16.2
|
%
|
16.3
|
%
|
18.1
|
%
|
|||||
|
Adjusted housing gross profit margin as a percentage of housing revenues
|
21.1
|
%
|
21.0
|
%
|
22.5
|
%
|
|||||
|
(a)
|
Represents the amortization of previously capitalized interest associated with housing operations.
|
|
(b)
|
Represents inventory impairment and land option contract abandonment charges associated with housing operations.
|
Adjusted housing gross profit margin is a non-GAAP financial measure, which we calculate by dividing housing revenues less housing construction and land costs excluding (1) amortization of previously capitalized interest associated with housing operations and (2) housing inventory impairment and land option contract abandonment charges (as applicable) recorded during a given period, by housing revenues. The most directly comparable GAAP financial measure is housing gross profit margin. We believe adjusted housing gross profit margin is a relevant and useful financial measure to investors in evaluating our performance
25
as it measures the gross profits we generated specifically on the homes delivered during a given period. This non-GAAP financial measure isolates the impact that the amortization of previously capitalized interest associated with housing operations, and housing inventory impairment and land option contract abandonment charges, have on housing gross profit margins, and allows investors to make comparisons with our competitors that adjust housing gross profit margins in a similar manner. We also believe investors will find adjusted housing gross profit margin relevant and useful because it represents a profitability measure that may be compared to a prior period without regard to variability of amortization of previously capitalized interest associated with housing operations, and housing inventory impairment and land option contract abandonment charges. This financial measure assists us in making strategic decisions regarding community location and product mix, product pricing and construction pace.
Ratio of Net Debt to Capital.
The following table reconciles our ratio of debt to capital calculated in accordance with GAAP to the non-GAAP financial measure of our ratio of net debt to capital (dollars in thousands):
|
|
November 30,
|
||||||
|
|
2016
|
2015
|
|||||
|
Notes payable
|
$
|
2,640,149
|
|
$
|
2,601,754
|
|
|
|
Stockholders’ equity
|
1,723,145
|
|
1,690,834
|
|
|||
|
Total capital
|
$
|
4,363,294
|
|
$
|
4,292,588
|
|
|
|
Ratio of debt to capital
|
60.5
|
%
|
60.6
|
%
|
|||
|
Notes payable
|
$
|
2,640,149
|
|
$
|
2,601,754
|
|
|
|
Less: Cash and cash equivalents and restricted cash
|
(592,086
|
)
|
(568,386
|
)
|
|||
|
Net debt
|
2,048,063
|
|
2,033,368
|
|
|||
|
Stockholders’ equity
|
1,723,145
|
|
1,690,834
|
|
|||
|
Total capital
|
$
|
3,771,208
|
|
$
|
3,724,202
|
|
|
|
Ratio of net debt to capital
|
54.3
|
%
|
54.6
|
%
|
|||
The ratio of net debt to capital is a non-GAAP financial measure, which we calculate by dividing notes payable, net of homebuilding cash and cash equivalents and restricted cash, by capital (notes payable, net of homebuilding cash and cash equivalents and restricted cash, plus stockholders’ equity). The most directly comparable GAAP financial measure is the ratio of debt to capital. We believe the ratio of net debt to capital is a relevant and useful financial measure to investors in understanding the leverage employed in our operations.
HOMEBUILDING REPORTING SEGMENTS
Below is a discussion of the financial results of each of our homebuilding reporting segments. Further information regarding these segments, including their pretax income (loss), is included in Note 2 – Segment Information in the Notes to Consolidated Financial Statements in this report. The difference between each homebuilding reporting segment’s operating income (loss) and pretax income (loss) is generally due to the equity in income (loss) of unconsolidated joint ventures, which is also presented in Note 2 – Segment Information in the Notes to Consolidated Financial Statements in this report, and/or interest income and expense.
West Coast
. The following table presents financial information related to our West Coast homebuilding reporting segment for the years indicated (dollars in thousands, except average selling price):
26
|
|
Years Ended November 30,
|
Variance
|
|||||||||||||||
|
|
2016
|
2015
|
2014
|
2016 vs 2015
|
2015 vs 2014
|
||||||||||||
|
Revenues
|
$
|
1,638,078
|
|
$
|
1,402,264
|
|
$
|
1,089,857
|
|
17
|
%
|
29
|
%
|
||||
|
Construction and land costs
|
(1,386,270
|
)
|
(1,179,222
|
)
|
(889,345
|
)
|
(18
|
)
|
(33
|
)
|
|||||||
|
Selling, general and administrative expenses
|
(100,425
|
)
|
(84,875
|
)
|
(69,774
|
)
|
(18
|
)
|
(22
|
)
|
|||||||
|
Operating income
|
$
|
151,383
|
|
$
|
138,167
|
|
$
|
130,738
|
|
10
|
%
|
6
|
%
|
||||
|
Homes delivered
|
2,825
|
|
2,258
|
|
1,913
|
|
25
|
%
|
18
|
%
|
|||||||
|
Average selling price
|
$
|
579,900
|
|
$
|
587,000
|
|
$
|
569,700
|
|
(1
|
) %
|
3
|
%
|
||||
|
Housing gross profit margin
|
15.4
|
%
|
16.4
|
%
|
20.5
|
%
|
(100
|
)bps
|
(410
|
)bps
|
|||||||
This segment’s revenues in 2016 and 2014 were generated entirely from housing operations. In 2015, revenues were generated from both housing operations and land sales. Housing revenues of
$1.64 billion
in 2016 grew
24%
from
$1.33 billion
in 2015, which had increased from
$1.09 billion
in 2014. The year-over-year growth in housing revenues in 2016 reflected an increase in the number of homes delivered primarily from our southern California operations, stemming from the higher backlog of homes at the beginning of 2016 and a higher volume of net orders in the current year. The 2016 average selling price decreased slightly from the previous year due to a shift in product and geographic mix, with a greater proportion of homes delivered from communities located in our inland submarkets. In 2015, housing revenues increased
22%
from 2014 due to an increase in the number of homes delivered and an increase in the average selling price of those homes. The year-over-year increase in the number of homes delivered in 2015 occurred mostly in our coastal submarkets and reflected the higher backlog of homes at the beginning of 2015. The average selling price for 2015 rose from the previous year due to the combination of a greater proportion of homes delivered from higher-priced communities located in our coastal submarkets, a shift in product mix, and generally rising home prices. This segment generated land sale revenues of
$76.8 million
in 2015, primarily reflecting sales of a large parcel in northern California and a parcel located in an inland southern California submarket.
In 2016, this segment’s operating income increased by
$13.2 million
from the previous year, reflecting an increase in housing gross profits that was partly offset by a decline in land sale results and higher selling, general and administrative expenses. The increase in housing gross profits reflected a higher volume of homes delivered, partly offset by a decline in the housing gross profit margin. The year-over-year decrease in the housing gross profit margin was mainly due to an increase in inventory impairment and land option contract abandonment charges, higher construction and land costs and a shift in product and geographic mix of homes delivered. Inventory-related charges impacting the segment’s housing gross profit margin totaled
$8.4 million
in 2016, compared to
$1.0 million
in 2015. Land sale losses of
$.6 million
in 2016 reflected inventory impairment charges related to land held for sale. In 2015, land sales generated profits of
$6.2 million
. Selling, general and administrative expenses for 2016 rose from the previous year, primarily due to higher variable expenses associated with the increased volume of homes delivered and corresponding higher housing revenues.
In 2015, operating income increased by
$7.4 million
from 2014, reflecting improved land sale results, partly offset by an increase in selling, general and administrative expenses and a decrease in housing gross profits. The year-over-year decrease in housing gross profits in 2015 reflected a decline in the housing gross profit margin, partly offset by the impact of an increase in the number of homes delivered. The housing gross profit margin decreased mainly due to higher construction and land costs, a shift in product and geographic mix, including the close-out of certain higher-margin communities in the latter part of 2014, and increased pricing pressures in some markets, partly offset by increased operating leverage on fixed costs as a result of the higher home delivery volume and corresponding higher housing revenues. Inventory impairment and land option contract abandonment charges impacting the segment’s housing gross profit margin totaled
$1.0 million
in 2015 and
$4.6 million
in 2014. Land sales produced profits in 2015, compared to losses of
$23.2 million
in 2014 that reflected an inventory impairment charge related to the then-planned sale of the inland southern California land parcel noted above, and as further described in Note 7 – Inventory Impairments and Land Option Contract Abandonments in the Notes to Consolidated Financial Statements in this report. Selling, general and administrative expenses for 2015 rose from 2014 primarily due to increased variable expenses associated with the increases in both the number of homes delivered and corresponding housing revenues, and higher staffing levels to support delivery growth.
Southwest
. The following table presents financial information related to our Southwest homebuilding reporting segment for the years indicated (dollars in thousands, except average selling price):
27
|
|
Years Ended November 30,
|
Variance
|
|||||||||||||||
|
|
2016
|
2015
|
2014
|
2016 vs 2015
|
2015 vs 2014
|
||||||||||||
|
Revenues
|
$
|
447,473
|
|
$
|
398,242
|
|
$
|
199,504
|
|
12
|
%
|
100
|
%
|
||||
|
Construction and land costs
|
(371,509
|
)
|
(329,203
|
)
|
(162,560
|
)
|
(13
|
)
|
(103
|
)
|
|||||||
|
Selling, general and administrative expenses
|
(35,786
|
)
|
(31,228
|
)
|
(22,069
|
)
|
(15
|
)
|
(42
|
)
|
|||||||
|
Operating income
|
$
|
40,178
|
|
$
|
37,811
|
|
$
|
14,875
|
|
6
|
%
|
154
|
%
|
||||
|
Homes delivered
|
1,559
|
|
1,311
|
|
736
|
|
19
|
%
|
78
|
%
|
|||||||
|
Average selling price
|
$
|
287,000
|
|
$
|
284,600
|
|
$
|
271,100
|
|
1
|
%
|
5
|
%
|
||||
|
Housing gross profit margin
|
17.4
|
%
|
18.4
|
%
|
18.5
|
%
|
(100
|
)bps
|
(10
|
)bps
|
|||||||
In 2016 and 2014, this segment’s revenues were generated entirely from housing operations. In 2015, revenues were generated from both housing operations and land sales. Housing revenues of
$447.5 million
in 2016 grew
20%
from the previous year, primarily due to substantial year-over-year growth in the number of homes delivered from both our Arizona and Nevada operations. Housing revenues of
$373.1 million
for 2015 rose
87%
from 2014, largely driven by increases in the number of homes delivered from both our Arizona and Nevada operations as we delivered homes from more communities in those markets. In addition, the average selling price of the homes delivered increased from the previous year, primarily due to a shift in the product and geographic mix of homes delivered. In 2015, revenues included
$25.2 million
associated with land sales in Nevada.
In 2016, operating income from this segment grew
$2.4 million
from 2015, reflecting an increase in housing gross profits that was partly offset by an increase in selling, general and administrative expenses and land sale losses in the current period. Housing gross profits increased in 2016 primarily due to the higher volume of homes delivered, partly offset by a decrease in the housing gross profit margin. The margin decrease resulted from higher construction and land costs and a shift in product mix, partially offset by improved operating leverage on fixed costs from the increased volume of homes delivered, a decrease in inventory-related charges, and a decrease in sales incentives as a percentage of housing revenues. Housing gross profits in 2016 included
$1.5 million
of inventory impairment and land option contract abandonment charges, compared to
$3.3 million
of inventory impairment charges in 2015. Land sale losses of
$1.9 million
in 2016 reflected inventory impairment charges related to land held for sale at November 30, 2016. In 2015, land sales produced gross profits of
$.3 million
. Selling, general and administrative expenses for 2016 rose from the previous year, primarily due to higher variable expenses associated with the increased volume of homes delivered and corresponding higher housing revenues, partly offset by a favorable legal settlement in 2016.
In 2015, operating income rose
$22.9 million
from the previous year as the impact of an increase in housing gross profits was partly offset by an increase in selling, general and administrative expenses. Housing gross profits increased in 2015 primarily due to the higher volume of homes delivered as the housing gross profit margin was nearly even with 2014. In 2015, housing gross profits included
$3.3 million
of inventory impairment charges, while housing gross profits in 2014 included
$6.4 million
of such charges. Sales incentives as a percentage of housing revenues in 2015 were slightly lower on a year-over-year basis. The land sale activity in 2015 generated gross profits of
$.3 million
. Selling, general and administrative expenses rose in 2015 from 2014, primarily due to increases in the number of homes delivered and corresponding housing revenues, and higher community opening-related expenses in connection with the strategic expansion of our community count in 2015.
Central
. The following table presents financial information related to our Central homebuilding reporting segment for the years indicated (dollars in thousands, except average selling price):
|
|
Years Ended November 30,
|
Variance
|
|||||||||||||||
|
|
2016
|
2015
|
2014
|
2016 vs 2015
|
2015 vs 2014
|
||||||||||||
|
Revenues
|
$
|
1,018,535
|
|
$
|
809,738
|
|
$
|
698,429
|
|
26
|
%
|
16
|
%
|
||||
|
Construction and land costs
|
(830,368
|
)
|
(657,316
|
)
|
(578,711
|
)
|
(26
|
)
|
(14
|
)
|
|||||||
|
Selling, general and administrative expenses
|
(102,300
|
)
|
(82,400
|
)
|
(72,742
|
)
|
(24
|
)
|
(13
|
)
|
|||||||
|
Operating income
|
$
|
85,867
|
|
$
|
70,022
|
|
$
|
46,976
|
|
23
|
%
|
49
|
%
|
||||
28
|
|
Years Ended November 30,
|
Variance
|
|||||||||||||||
|
|
2016
|
2015
|
2014
|
2016 vs 2015
|
2015 vs 2014
|
||||||||||||
|
Homes delivered
|
3,744
|
|
3,183
|
|
3,098
|
|
18
|
%
|
3
|
%
|
|||||||
|
Average selling price
|
$
|
270,100
|
|
$
|
252,200
|
|
$
|
223,800
|
|
7
|
%
|
13
|
%
|
||||
|
Housing gross profit margin
|
19.6
|
%
|
19.0
|
%
|
17.2
|
%
|
60
|
bps
|
180
|
bps
|
|||||||
In 2016, 2015 and 2014, revenues for this segment were generated from both housing operations and land sales. Housing revenues in 2016 rose
26%
to
$1.01 billion
from
$802.6 million
in 2015, reflecting increases in both the number of homes delivered and the average selling price of those homes. The year-over-year growth in the number of homes delivered in 2016 reflected increases from both our Colorado and Texas operations. The average selling price rose from 2015, primarily due to a greater proportion of homes delivered from higher-priced communities, a shift in product mix and generally rising home prices. In 2015, housing revenues rose
16%
from
$693.3 million
in 2014 due to increases in both the number of homes delivered and the average selling price of those homes. The year-over-year growth in the number of homes delivered for 2015 primarily reflected an increase in our Colorado operations as a result of a higher number of communities within those operations delivering homes. The increase in the average selling price from 2014 was mainly due to a greater proportion of homes delivered from higher-priced communities and generally rising home prices. Land sale revenues totaled
$7.3 million
in 2016,
$7.1 million
in 2015 and
$5.2 million
in 2014.
The operating income generated by this segment in 2016 increased
$15.8 million
from 2015, primarily due to growth in housing gross profits that was partly offset by an increase in selling, general and administrative expenses and land sale losses in the current year. The year-over-year growth in housing gross profits reflected the increased volume of homes delivered and improvement in our housing gross profit margin. The housing gross profit margin for 2016 improved on a year-over-year basis largely due to improved operating leverage on fixed costs and lower overall construction and land costs, partly offset by unfavorable warranty adjustments. Land sale losses totaled
$10.5 million
in 2016, primarily due to inventory impairment charges related to land held for sale at November 30, 2016 and the sales of our last remaining parcels in the Rio Grande Valley area of Texas, both as further described in Note 7 – Inventory Impairments and Land Option Contract Abandonments in the Notes to Consolidated Financial Statements in this report. Selling, general and administrative expenses for 2016 rose from 2015, mainly due to higher variable expenses associated with the increased volume of homes delivered and corresponding higher housing revenues, and an increase to a legal accrual, partly offset by lower overhead costs as a result of our cost containment efforts.
In 2015, operating income improved by
$23.0 million
from 2014, reflecting higher housing gross profits, partly offset by higher selling, general and administrative expenses. The housing gross profit margin increased to
19.0%
from
17.2%
for 2014, mainly due to an increased proportion of homes delivered from higher-margin communities, and improved operating leverage on fixed costs from the increased volume of homes delivered and corresponding higher housing revenues. Housing gross profits included
$.2 million
of land option contract abandonment charges in 2015, compared to
$1.0 million
of such charges included in 2014. Land sale activity in 2015 generated nominal profits. The year-over-year increase in selling, general and administrative expenses for 2015 was primarily due to higher variable expenses associated with the increase in housing revenues.
Southeast.
The following table presents financial information related to our Southeast homebuilding reporting segment for the years indicated (dollars in thousands, except average selling price):
|
|
Years Ended November 30,
|
Variance
|
|||||||||||||||
|
|
2016
|
2015
|
2014
|
2016 vs 2015
|
2015 vs 2014
|
||||||||||||
|
Revenues
|
$
|
478,857
|
|
$
|
410,743
|
|
$
|
401,853
|
|
17
|
%
|
2
|
%
|
||||
|
Construction and land costs
|
(446,539
|
)
|
(367,668
|
)
|
(351,634
|
)
|
(21
|
)
|
(5
|
)
|
|||||||
|
Selling, general and administrative expenses
|
(58,361
|
)
|
(57,552
|
)
|
(54,412
|
)
|
(1
|
)
|
(6
|
)
|
|||||||
|
Operating loss
|
$
|
(26,043
|
)
|
$
|
(14,477
|
)
|
$
|
(4,193
|
)
|
(80
|
) %
|
(245
|
) %
|
||||
|
Homes delivered
|
1,701
|
|
1,444
|
|
1,468
|
|
18
|
%
|
(2
|
) %
|
|||||||
|
Average selling price
|
$
|
281,400
|
|
$
|
281,900
|
|
$
|
263,600
|
|
—
|
|
7
|
%
|
||||
|
Housing gross profit margin
|
11.7
|
%
|
10.4
|
%
|
13.6
|
%
|
130
|
bps
|
(320
|
)bps
|
|||||||
This segment’s revenues in 2016, 2015 and 2014 were comprised of revenues from both housing operations and land sales. Housing revenues in 2016 grew
18%
to
$478.7 million
from
$407.1 million
in 2015. The year-over-year growth in housing revenues in 2016 was due to increases in the number of homes delivered, as the average selling price was essentially flat year over
29
year. The growth in the number of homes delivered for 2016, compared to the year earlier period, was attributable to our Florida operations. In 2015, housing revenues grew
5%
from
$387.0 million
in 2014 due to an increase in the average selling price, as the number of homes delivered was nearly flat with the year-earlier period. The year-over-year increase in the average selling price for 2015 was primarily due to a greater proportion of homes delivered from higher-priced communities, a change in product mix and generally rising home prices. This segment generated land sale revenues of
$.1 million
,
$3.6 million
and
$14.8 million
in 2016, 2015 and 2014, respectively.
In 2016, this segment’s operating results declined
$11.6 million
, reflecting land sale losses and a slight increase in selling, general and administrative expenses that were partially offset by an increase in housing gross profits. The growth in this segment’s housing gross profits was due to the increase in the number of homes delivered and an improvement in the housing gross profit margin. The housing gross profit margin increased on a year-over-year basis primarily due to improved operating leverage on fixed costs from the increased volume of homes delivered and corresponding higher housing revenues, and lower construction and land costs, partly offset by an increase in inventory-related charges. In 2016, inventory-related charges impacting the housing gross profit margin totaled
$5.8 million
and were largely related to the wind down of our Metro Washington, D.C. operations. In 2015, the housing gross profit margin was impacted by
$5.1 million
of inventory impairment and land option contract abandonment charges. Land sale losses totaled
$23.6 million
for 2016, compared to land sale profits of
$.6 million
for the previous year, primarily due to inventory impairment charges associated with the land held for sale at November 30, 2016, including two land parcels in the Metro Washington, D.C. area that we plan to sell in connection with the wind down of our operations in this market, as further described in Note 7 – Inventory Impairments and Land Option Contract Abandonments in the Notes to Consolidated Financial Statements in this report. In 2016, selling, general and administrative expenses rose from the previous year primarily due to higher variable expenses associated with the increase in housing revenues and a legal accrual. In 2015, selling general and administrative expenses included an increase in the accrual for a Florida legal inquiry that was resolved in February 2016, as further described in Note 15 – Commitments and Contingencies in the Notes to Consolidated Financial Statements in this report.
In 2015, the operating loss increased by
$10.3 million
from 2014 as a result of a decrease in housing gross profits and an increase in selling, general and administrative expenses. These impacts were partly offset by a year-over-year improvement in land sale results. The year-over-year decrease in housing gross profits reflected a decline in the housing gross profit margin primarily due to the combined impact of higher land and construction costs, lower margins on homes delivered from recently activated communities that were previously held for future development,
$5.1 million
of inventory impairment and land option contract abandonment charges, and unfavorable warranty adjustments in 2015. In addition, sales incentives as a percentage of housing revenues in 2015 were slightly higher on a year-over-year basis. In 2014, inventory impairment and land option contract abandonment charges impacting this segment’s housing gross profit margin totaled
$.8 million
. Land sale profits were
$.6 million
in 2015, compared to land sale losses of
$2.6 million
in 2014, which included an inventory impairment charge of
$3.4 million
related to the then-planned land sale of our last remaining land parcel in Atlanta, Georgia. Selling, general and administrative expenses rose from 2014, primarily due to increased variable expenses associated with the increase in housing revenues, higher overhead costs to support new community openings, and the above-mentioned increase in the accrual for the estimated minimum probable loss with respect to a Florida legal inquiry that has since been resolved.
FINANCIAL SERVICES REPORTING SEGMENT
The following table presents a summary of selected financial and operational data for our financial services reporting segment (dollars in thousands):
|
|
Years Ended November 30,
|
||||||||||
|
|
2016
|
2015
|
2014
|
||||||||
|
Revenues
|
$
|
11,703
|
|
$
|
11,043
|
|
$
|
11,306
|
|
||
|
Expenses
|
(3,817
|
)
|
(3,711
|
)
|
(3,446
|
)
|
|||||
|
Equity in income (loss) of unconsolidated joint ventures
|
(3,420
|
)
|
4,292
|
|
686
|
|
|||||
|
Pretax income
|
$
|
4,466
|
|
$
|
11,624
|
|
$
|
8,546
|
|
||
30
|
|
Years Ended November 30,
|
||||||||||
|
|
2016
|
2015
|
2014
|
||||||||
|
Total originations (a):
|
|||||||||||
|
Loans
|
3,320
|
|
4,460
|
|
1,501
|
|
|||||
|
Principal
|
$
|
847,905
|
|
$
|
1,132,479
|
|
$
|
374,263
|
|
||
|
Percentage of homebuyers using HCM
|
37
|
%
|
62
|
%
|
61
|
%
|
|||||
|
Average FICO score
|
713
|
|
718
|
|
716
|
|
|||||
|
Loans sold (a):
|
|||||||||||
|
Loans sold to Nationstar
|
3,730
|
|
4,168
|
|
1,035
|
|
|||||
|
Principal
|
$
|
966,155
|
|
$
|
1,055,551
|
|
$
|
252,583
|
|
||
|
Loans sold to other third parties
|
234
|
|
161
|
|
—
|
|
|||||
|
Principal
|
$
|
47,936
|
|
$
|
38,608
|
|
$
|
—
|
|
||
|
Mortgage loan origination mix (a):
|
||||||||
|
Conventional/non-conventional loans
|
43
|
%
|
45
|
%
|
52
|
%
|
||
|
FHA loans
|
38
|
%
|
38
|
%
|
26
|
%
|
||
|
Other government loans
|
19
|
%
|
17
|
%
|
22
|
%
|
||
|
Loan type (a):
|
||||||||
|
Fixed
|
100
|
%
|
98
|
%
|
91
|
%
|
||
|
ARM
|
—
|
%
|
2
|
%
|
9
|
%
|
||
|
(a)
|
Loan originations and sales occurred within HCM, which began operations in July 2014. In the 2016 fourth quarter, we and Nationstar began the process to wind down HCM and transfer HCM’s operations and certain assets to Stearns Lending, LLC (“Stearns Lending”).
|
Revenues.
Our financial services reporting segment generates revenues primarily from insurance commissions and title services. These operations also earned marketing services fees, pursuant to a marketing services agreement with a preferred lender, until July 2014.
The year-over-year growth in our financial services revenues for 2016 reflected an increase in title services revenues, partly offset by a decrease in insurance commissions. In 2015, the year-over-year decrease in our financial services revenues was due to the absence of marketing services revenues, which was largely offset by an increase in insurance commissions and title services revenues. In 2014, marketing services fees totaled
$1.1 million
and represented the fair value of the services we provided in connection with the marketing services agreement.
Expenses.
General and administrative expenses totaled
$3.8 million
in 2016,
$3.7 million
in 2015 and
$3.4 million
in 2014.
Equity in Income (Loss) of Unconsolidated Joint Ventures.
The equity in loss of unconsolidated joint ventures was
$3.4 million
in 2016, compared to equity in income of unconsolidated joint ventures of
$4.3 million
in 2015 and
$.7 million
in 2014. The equity in income (loss) of unconsolidated joint ventures for each of the years ended November 30, 2016, 2015 and 2014 was primarily related to HCM. The equity in loss of unconsolidated joint ventures in 2016 reflected fewer loan originations and higher overhead costs as well as the wind down of HCM, which, as noted above, began in the 2016 fourth quarter, and included an increase in HCM’s reserves for potential future losses on certain loans it originated. While we believe we will not need to record any additional charges, it is reasonably possible that we may incur further losses with respect to our equity interest in future periods as the wind down of HCM is completed. Although we are currently unable to estimate the amount or range of such losses, if any, we believe they would not have a material impact on our consolidated financial statements.
In the 2016 fourth quarter, a subsidiary of ours and a subsidiary of Stearns Lending entered into an agreement to form a mortgage banking joint venture in which we each have a
50.0%
ownership interest. The unconsolidated joint venture, which had no impact on our consolidated statement of operations for the year ended November 30, 2016, is expected to begin offering services, including mortgage loan originations, to our homebuyers in most of our served markets by the end of our 2017 second quarter, subject to obtaining all requisite regulatory approvals and clearances.
Based on the number of homes delivered in 2016, approximately
37%
of our homebuyers who obtained mortgage financing used HCM to finance the purchase of their home, compared to approximately
62%
that used HCM in 2015 and approximately
61%
that used HCM or Nationstar in 2014. The year-over-year decrease in 2016 was primarily due to HCM’s transition to a new
31
loan origination system that limited its ability to originate certain loans, insufficient staffing in certain markets, and its wind down. The year-over-year decrease in the percentage of homebuyers that used HCM did not have a significant impact on our orders, cancellation rate or the number of homes we delivered in 2016.
INCOME TAXES
Income Tax Expense.
Our income tax expense and effective income tax rate were as follows (dollars in thousands):
|
|
Years Ended November 30,
|
||||||||||
|
|
2016
|
2015
|
2014
|
||||||||
|
Income tax expense (benefit)
|
$
|
43,700
|
|
$
|
42,400
|
|
$
|
(823,400
|
)
|
||
|
Effective income tax rate
|
29.3
|
%
|
33.4
|
%
|
(a)
|
|
|||||
|
(a)
|
Percentage not meaningful.
|
Our income tax expense for 2016 and 2015 reflected the favorable net impact of
$15.2 million
and
$5.6 million
, respectively, of federal energy tax credits we earned from building energy-efficient homes. The income tax benefit in 2014 was primarily due to the reversal of a substantial portion of our deferred tax asset valuation allowance at November 30, 2014. Due to the effects of our deferred tax asset valuation allowance and changes in our unrecognized tax benefits, our effective tax rate in 2014 was not meaningful as our income tax amount was not directly correlated to the amount of our pretax income for that period. The majority of the federal energy tax credits for 2016 resulted from legislation enacted in 2015 that extended the availability of a business tax credit for building new energy-efficient homes through December 31, 2016. There has been no new legislation enacted extending the business tax credit beyond December 31, 2016.
At November 30, 2016 and 2015, we had deferred tax assets of
$763.8 million
and
$820.0 million
, respectively, that were partially offset by valuation allowances of
$24.8 million
and
$37.8 million
, respectively. The valuation allowance at November 30, 2016 was primarily related to certain state NOLs that had not met the “more likely than not” realization standard at that date. The valuation allowance at November 30, 2015 was mainly related to foreign tax credits and certain state NOLs that had not met the “more likely than not” realization standard at that date. We evaluated our deferred tax assets as of November 30, 2016 and 2015 to determine whether any adjustment to our deferred tax asset valuation allowance was necessary. We determined that most of our deferred tax assets as of November 30, 2016 and 2015 would be realized. We reduced our valuation allowance by
$13.0 million
in 2016 to account for the expiration of foreign tax credits, the release of valuation allowance associated with state NOLs that met the “more likely than not” realization standard and the establishment of a valuation allowance for state NOLs related to the wind down of our Metro Washington, D.C. operations. In 2015, the valuation allowance was reduced by
$3.4 million
to account for the expiration of foreign tax credits and state NOLs that were not utilized.
Further information regarding our income taxes is provided in Note 12 – Income Taxes in the Notes to Consolidated Financial Statements in this report.
LIQUIDITY AND CAPITAL RESOURCES
Overview.
We have funded our homebuilding and financial services activities over the last several years with:
|
•
|
internally generated cash flows;
|
|
•
|
public issuances of our common stock;
|
|
•
|
public issuances of debt securities;
|
|
•
|
land option contracts and other similar contracts and seller notes; and
|
|
•
|
letters of credit and performance bonds.
|
We also have the ability to borrow funds under the Credit Facility. We manage our use of cash in the operation of our business to support the execution of our primary strategic goals. Over the past several years, we have primarily used cash for:
|
•
|
land acquisitions and land development;
|
|
•
|
home construction;
|
|
•
|
operating expenses;
|
|
•
|
principal and interest payments on notes payable; and
|
|
•
|
cash collateral.
|
32
In the 2016 first quarter, we used
$85.9 million
in cash to repurchase
8,373,000
shares of our outstanding common stock pursuant to a board of directors’ authorization, as further discussed below.
Our investments in land and land development totaled approximately
$1.36 billion
in 2016,
$967.2 million
in 2015 and
$1.47 billion
in 2014. Approximately
46%
of our total investments in 2016 related to land acquisitions, compared to approximately
32%
in 2015 and approximately
54%
in 2014. While we made strategic investments in land and land development in each of our homebuilding reporting segments in each of these years, approximately
64%
in 2016,
51%
in 2015 and
56%
in 2014, were made in our West Coast homebuilding reporting segment. Our investments in land and land development in the future will depend significantly on market conditions and available opportunities that meet our investment return standards for home delivery growth in 2017 and beyond.
The following table presents the number of lots and carrying value of inventory we owned or controlled under land option contracts and other similar contracts by homebuilding reporting segment (dollars in thousands):
|
November 30, 2016
|
November 30, 2015
|
Variance
|
|||||||||||||||||||
|
Segment
|
Lots
|
$
|
Lots
|
$
|
Lots
|
$
|
|||||||||||||||
|
West Coast
|
10,904
|
|
$
|
1,726,740
|
|
11,420
|
|
$
|
1,602,356
|
|
(516
|
)
|
$
|
124,384
|
|
||||||
|
Southwest
|
8,338
|
|
522,320
|
|
8,981
|
|
534,040
|
|
(643
|
)
|
(11,720
|
)
|
|||||||||
|
Central
|
18,272
|
|
769,237
|
|
17,747
|
|
707,210
|
|
525
|
|
62,027
|
|
|||||||||
|
Southeast
|
7,311
|
|
384,931
|
|
9,251
|
|
470,141
|
|
(1,940
|
)
|
(85,210
|
)
|
|||||||||
|
Total
|
44,825
|
|
$
|
3,403,228
|
|
47,399
|
|
$
|
3,313,747
|
|
(2,574
|
)
|
$
|
89,481
|
|
||||||
The carrying value of lots owned or controlled under land option and other similar contracts at
November 30, 2016
increased from November 30, 2015 primarily due to the investments in land and land development we made during 2016. Overall, the number of lots we controlled under land option contracts and other similar contracts as a percentage of total lots was
21%
at November 30, 2016 and
20%
at November 30, 2015. Generally, this percentage fluctuates with our decisions to control (or abandon) lots under land option contracts and other similar contracts or to purchase (or sell owned) lots based on available opportunities and our investment return standards.
We ended our 2016 fiscal year with
$592.1 million
of cash and cash equivalents, compared to
$568.4 million
at November 30, 2015. The majority of our cash and cash equivalents at
November 30, 2016
were invested in interest-bearing bank deposit accounts. The majority of our cash and cash equivalents at November 30, 2015 were invested in money market funds and interest-bearing bank deposit accounts. At November 30, 2015, we also had restricted cash of
$9.3 million
.
Capital Resources.
Our notes payable consisted of the following (in thousands):
|
November 30,
|
|||||||||||
|
2016
|
2015
|
Variance
|
|||||||||
|
Mortgages and land contracts due to land sellers and other loans
|
$
|
66,927
|
|
$
|
35,664
|
|
$
|
31,263
|
|
||
|
Senior notes
|
2,345,843
|
|
2,339,920
|
|
5,923
|
|
|||||
|
Convertible senior notes
|
227,379
|
|
226,170
|
|
1,209
|
|
|||||
|
Total
|
$
|
2,640,149
|
|
$
|
2,601,754
|
|
$
|
38,395
|
|
||
On December 14, 2016, we elected to exercise our optional redemption rights under the terms of our
9.10%
Senior Notes due 2017, which mature on September 15, 2017. On January 13, 2017, we redeemed
$100.0 million
in aggregate principal amount of the notes outstanding at the redemption price calculated in accordance with the “make-whole” provisions of the notes. We used internally generated cash to fund this redemption. Upon this redemption,
$165.0 million
in aggregate principal amount of the notes remained outstanding. In connection with this early extinguishment of debt, we will recognize a charge of approximately
$5.4 million
in the 2017 first quarter.
Our financial leverage, as measured by the ratio of debt to capital, was
60.5%
at November 30, 2016, compared to
60.6%
at November 30, 2015. Our ratio of net debt to capital (a calculation that is described above under “Non-GAAP Financial Measures”) at November 30, 2016 was
54.3%
, compared to
54.6%
at November 30, 2015.
LOC Facility
. We had no letters of credit outstanding under the LOC Facility at November 30, 2016, compared to
$9.1 million
of such letters of credit outstanding at November 30, 2015.
The LOC Facility requires us to deposit and maintain cash with the
33
issuing financial institution as collateral for our letters of credit outstanding.
The amount of cash maintained for our LOC Facility totaled
$9.3 million
at November 30, 2015, and was included in restricted cash in our consolidated balance sheet as of that date.
Unsecured Revolving Credit Facility
. We have a
$275.0 million
Credit Facility that will mature on August 7, 2019. The amount of our Credit Facility available for cash borrowings and the issuance of letters of credit depends on the total cash borrowings and letters of credit outstanding under the Credit Facility and the maximum available amount under the terms of the Credit Facility. As of
November 30, 2016
, we had no cash borrowings and
$31.0 million
of letters of credit outstanding under the Credit Facility. Therefore, as of
November 30, 2016
, we had
$244.0 million
available for cash borrowings under the Credit Facility, with up to
$106.5 million
of that amount available for the issuance of additional letters of credit. The Credit Facility is further described in Note 13 – Notes Payable in the Notes to Consolidated Financial Statements in this report.
Under the terms of the Credit Facility, we are required, among other things, to maintain compliance with various covenants, including financial covenants regarding our consolidated tangible net worth, consolidated leverage ratio (“Leverage Ratio”), and either a consolidated interest coverage ratio (“Interest Coverage Ratio”) or minimum liquidity level, each as defined therein. Our compliance with these financial covenants is measured by calculations and metrics that are specifically defined or described by the terms of the Credit Facility and can differ in certain respects from comparable GAAP or other commonly used terms. The financial covenant requirements are set forth below:
|
•
|
Consolidated Tangible Net Worth.
We must maintain a minimum consolidated tangible net worth at the end of any fiscal quarter equal to the sum of (a) $1.13 billion, plus (b) an amount equal to 50% of the aggregate of the cumulative consolidated net income for each fiscal quarter commencing after May 31, 2015 and ending as of the last day of such fiscal quarter (though there is no reduction if there is a consolidated net loss in any fiscal quarter), plus (c) an amount equal to 50% of the cumulative net proceeds we receive from the issuance of our capital stock after May 31, 2015.
|
|
•
|
Leverage Ratio.
We were required to maintain a Leverage Ratio of less than or equal to .700 for the 2016 fourth quarter. This requirement adjusts to less than or equal to .650 for the 2017 first quarter and each quarter thereafter for the term of the Credit Facility. The Leverage Ratio is calculated as the ratio of our consolidated total indebtedness to the sum of consolidated total indebtedness and consolidated tangible net worth, all as defined under the Credit Facility.
|
|
•
|
Interest Coverage Ratio or Liquidity.
We are required to maintain either (a) an Interest Coverage Ratio of greater than or equal to 1.50 for the remaining term of the Credit Facility; or (b) a minimum level of liquidity, but not both. The Interest Coverage Ratio is the ratio of our consolidated adjusted EBITDA to consolidated interest incurred, each as defined under the Credit Facility, in each case for the previous 12 months. Our minimum liquidity level is required to be greater than or equal to consolidated interest incurred, as defined under the Credit Facility, for the four most recently-ended fiscal quarters in the aggregate.
|
In addition, under the Credit Facility, our investments in joint ventures and non-guarantor subsidiaries (which are shown, respectively, in Note 9 – Investments in Unconsolidated Joint Ventures and in Note 22 – Supplemental Guarantor Information in the Notes to Consolidated Financial Statements in this report) cannot exceed the sum of (a) $117.4 million and (b) 20% of consolidated tangible net worth; and our borrowing base indebtedness, which is the aggregate principal amount of our outstanding indebtedness for borrowed money and non-collateralized financial letters of credit, cannot be greater than our borrowing base (a measure relating to our inventory and unrestricted cash assets).
The covenants and other requirements under our Credit Facility represent the most restrictive provisions that we are subject to with respect to our notes payable. The following table summarizes the financial covenants and other requirements under the Credit Facility, and our actual levels or ratios (as applicable) with respect to those covenants and other requirements, in each case as of
November 30, 2016
:
|
Financial Covenants and Other Requirements
|
Covenant Requirement
|
Actual
|
|||||||
|
Consolidated tangible net worth
|
>
|
$
|
1.22
|
billion
|
$
|
1.72
|
billion
|
||
|
Leverage Ratio
|
<
|
.700
|
|
.605
|
|
||||
|
Interest Coverage Ratio (a)
|
>
|
1.500
|
|
2.071
|
|
||||
|
Minimum liquidity (a)
|
>
|
$
|
181.9
|
million
|
$
|
592.1
|
million
|
||
|
Investments in joint ventures and non-guarantor subsidiaries
|
<
|
$
|
462.1
|
million
|
$
|
100.0
|
million
|
||
|
Borrowing base in excess of borrowing base indebtedness (as defined)
|
|
n/a
|
$
|
513.6
|
million
|
||||
|
(a)
|
Under the terms of the Credit Facility, we are required to meet either the Interest Coverage Ratio or a minimum level of liquidity, but not both. As of
November 30, 2016
, we met both the Interest Coverage Ratio and the minimum liquidity requirements.
|
34
The indenture governing the senior notes does not contain any financial covenants. Subject to specified exceptions, the indenture contains certain restrictive covenants that, among other things, limit our ability to incur secured indebtedness, or engage in sale-leaseback transactions involving property or assets above a certain specified value.
In addition, the senior notes (with the exception of the 7 1/4% senior notes due 2018 (“7 1/4% Senior Notes due 2018”))
contain certain limitations related to mergers, consolidations, and sales of assets.
Our obligations to pay principal, premium, if any, and interest under our senior notes and borrowings, if any, under the Credit Facility are guaranteed on a joint and several basis by certain of our subsidiaries (“Guarantor Subsidiaries”). The guarantees are full and unconditional and the Guarantor Subsidiaries are
100%
owned by us. We may also cause other subsidiaries of ours to become Guarantor Subsidiaries if we believe it to be in our or the relevant subsidiary’s best interests. Condensed consolidating financial information for our subsidiaries considered to be Guarantor Subsidiaries is provided in Note 22 – Supplemental Guarantor Information in the Notes to Consolidated Financial Statements in this report.
As of November 30, 2016,
we were in compliance with the applicable terms of all our covenants and other requirements under the Credit Facility, the senior notes, the indenture, and the mortgages and land contracts due to land sellers and other loans. Our ability to access the Credit Facility for cash borrowings and letters of credit and our ability to secure future debt financing depend, in part, on our ability to remain in such compliance.
There are no agreements that restrict our payment of dividends other than to maintain compliance with the financial covenant requirements under the Credit Facility, which would restrict our payment of dividends if a default under the Credit Facility exists at the time of any such payment, or if any such payment would result in such a default.
Depending on available terms, we finance certain land acquisitions with purchase-money financing from land sellers or with other forms of financing from third parties. At
November 30, 2016
, we had outstanding mortgages and land contracts due to land sellers and other loans payable in connection with such financing of
$66.9 million
, secured primarily by the underlying property, which had an aggregate carrying value of
$181.8 million
.
Consolidated Cash Flows.
The following table presents a summary of net cash provided by (used in) our operating, investing and financing activities (in thousands):
|
|
Years Ended November 30,
|
||||||||||
|
|
2016
|
2015
|
2014
|
||||||||
|
Net cash provided by (used in):
|
|||||||||||
|
Operating activities
|
$
|
188,655
|
|
$
|
181,185
|
|
$
|
(630,691
|
)
|
||
|
Investing activities
|
(6,079
|
)
|
(11,303
|
)
|
(44,782
|
)
|
|||||
|
Financing activities
|
(149,917
|
)
|
31,691
|
|
501,718
|
|
|||||
|
Net increase (decrease) in cash and cash equivalents
|
$
|
32,659
|
|
$
|
201,573
|
|
$
|
(173,755
|
)
|
||
Operating Activities.
Operating activities provided net cash of
$188.7 million
in 2016 and
$181.2 million
in 2015, and used net cash of
$630.7 million
in 2014. Generally, our net operating cash flows fluctuate primarily based on changes in our inventories and our profitability. The year-over-year change in net operating cash flows for 2016 primarily reflected an increase in net income, partly offset by a net increase in inventories. Our net cash provided by operating activities in 2015 was mainly driven by net income and a decrease in inventories. In 2014, the net cash used in operating activities was largely due to cash used for investments in land and land development during that year in support of our strategic growth initiatives, partly offset by an increase in net income.
Our net cash provided by operating activities in 2016 largely reflected net income of
$105.6 million
, a net increase in accounts payable, accrued expenses and other liabilities of
$32.7 million
and a net decrease in receivables of
$19.0 million
, partly offset by net cash of
$98.3 million
used for investments in inventories. In 2015, our net cash provided by operating activities primarily reflected net income of
$84.6 million
, a net decrease in inventories of
$34.9 million
, and a net decrease in receivables of
$9.1 million
. These sources of cash were partly offset by a net decrease in accounts payable, accrued expenses and other liabilities of
$27.6 million
. In 2014, our net cash used by operating activities primarily reflected net cash of
$780.1 million
used to increase our inventories through investments in land and land development, partly offset by pretax income of
$94.9 million
.
Investing Activities.
Investing activities used net cash of
$6.1 million
in 2016,
$11.3 million
in 2015 and
$44.8 million
in 2014. Our uses of cash in 2016 included
$5.6 million
for contributions to unconsolidated joint ventures and
$4.8 million
for net purchases of property and equipment. These uses of cash were largely offset by a
$4.3 million
return of investments in unconsolidated joint ventures. In 2015, the net cash used in investing activities reflected
$20.6 million
of contributions to unconsolidated joint ventures and
$4.7 million
of cash used for net purchases of property and equipment, which were partially offset by a return of investments in unconsolidated joint ventures of
$14.0 million
. In 2014, the net cash used in investing activities was largely due to contributions
35
of
$49.1 million
to unconsolidated joint ventures, partly offset by proceeds of
$10.1 million
from the sale of our investment in an unconsolidated joint venture in Maryland.
Financing Activities.
Financing activities used net cash of
$149.9 million
in 2016 and provided net cash of
$31.7 million
in 2015 and
$501.7 million
in 2014. The year-over-year change in 2016 was primarily due to cash used to repurchase shares of our common stock, compared to the net proceeds received from the underwritten public issuance of senior notes in 2015. In 2016, cash was used for repurchases of shares of our common stock at a total cost of
$88.4 million
, payments on mortgages and land contracts due to land sellers and other loans of
$67.8 million
and dividend payments on our common stock of
$8.6 million
. The cash used was partly offset by a decrease of
$9.3 million
in our restricted cash balance and
$5.3 million
of issuances of common stock under employee stock plans. In 2015, the year-over-year change in cash provided by financing activities was largely due to the issuance of senior notes and common stock in 2014. In 2015, cash was mainly provided by proceeds of
$250.0 million
received from the issuance of the 7.625% Senior Notes due 2023 and a decrease of
$17.9 million
in our restricted cash balance. The cash provided was partly offset by cash used to retire
$199.9 million
in aggregate principal amount of certain senior notes at their maturity on June 15, 2015, payments on mortgages and land contracts due to land sellers and other loans of
$22.9 million
, dividend payments on our common stock of
$9.2 million
, and the payment of debt issuance costs of
$4.6 million
associated with the issuance of the 7.625% Senior Notes due 2023 and the Credit Facility. In 2014, the cash provided from financing activities primarily reflected
$400.0 million
from the issuance of the 4.75% senior notes due 2019 (“4.75% Senior Notes due 2019”) and net proceeds of
$137.0 million
from the underwritten public issuance of 7,986,111 shares of our common stock.
Our board of directors declared four quarterly cash dividends of
$.0250
per share of common stock in 2016, 2015 and 2014.
Cash dividends declared and paid during each of the years ended November 30, 2016, 2015 and 2014 totaled $.10 per share of common stock. The declaration and payment of future cash dividends on our common stock are at the discretion of our board of directors, and depend upon, among other things, our expected future earnings, cash flows, capital requirements, debt structure and any adjustments thereto, operational and financial investment strategy and general financial condition, as well as general business conditions.
Shelf Registration Statement.
We have an automatically effective universal shelf registration statement (“2014 Shelf Registration”), which was filed on July 18, 2014, on file with the SEC. Issuances of debt and equity securities under our 2014 Shelf Registration require the filing of a prospectus supplement identifying the amount and terms of the securities to be issued. Our ability to issue equity and/or debt is subject to market conditions and other factors impacting our borrowing capacity.
Share Repurchase Program.
On January 12, 2016, our board of directors authorized us to repurchase a total of up to
10,000,000
shares of our outstanding common stock. This authorization reaffirmed and incorporated the then-current balance of
4,000,000
shares that remained under a prior board-approved share repurchase program. The amount and timing of shares purchased under this
10,000,000
share repurchase program are subject to market and business conditions and other factors, and purchases may be made from time to time and at any time through open market or privately negotiated transactions. This share repurchase authorization will continue in effect until fully used or earlier terminated or suspended by the board of directors. As of November 30, 2016, we had repurchased
8,373,000
shares of our common stock pursuant to this authorization, at a total cost of
$85.9 million
. All of these share repurchases were made in the 2016 first quarter. We did not repurchase any of our common stock under this program in 2015 or 2014.
Unrelated to the common stock repurchase program, as further discussed in Note 17 – Stockholders’ Equity in the Notes to Consolidated Financial Statements in this report, our board of directors authorized in 2014 the repurchase of no more than 680,000 shares of our outstanding common stock solely as necessary for director compensation elections with respect to settling outstanding stock appreciation rights awards (“Director Plan SARs”) granted under our Non-Employee Directors Compensation Plan (“Director Plan”). As of November 30, 2016, no Director Plan SARs had been settled. We do not anticipate any additional repurchases of our common stock pursuant to this board of directors authorization.
We believe we have adequate capital resources and sufficient access to the credit and capital markets and external financing sources to satisfy our current and reasonably anticipated long-term requirements for funds to acquire assets and land, to use and/or develop acquired assets and land, to construct homes, to finance our financial services operations and to meet other needs in the ordinary course of our business. In addition to acquiring and/or developing land that meets our investment return standards, in 2017, we may use or redeploy our unrestricted cash resources or cash borrowings under the Credit Facility to support other business purposes that are aligned with our primary strategic growth goals. We may also arrange or engage in capital markets, bank loan, project debt or other financial transactions. These transactions may include repurchases from time to time of our outstanding common stock. They may also include repurchases from time to time of our outstanding senior notes or other debt through redemptions, tender offers, exchange offers, private exchanges, open market or private purchases or other means, as well as potential new issuances of equity or senior or convertible senior notes or other debt through public offerings, private placements or other arrangements to raise or access additional capital to support our current land and land development investment targets, to complete strategic transactions and for other business purposes and/or to effect repurchases or redemptions of our outstanding senior notes
36
or other debt. The amounts involved in these transactions, if any, may be material. As necessary or desirable, we may adjust or amend the terms of and/or expand the capacity of the Credit Facility or the LOC Facility, or enter into additional letter of credit facilities, or other similar facility arrangements, in each case with the same or other financial institutions, or allow any such facilities to mature or expire. Our ability to engage in such transactions, however, may be constrained by economic, capital, credit and/or financial market conditions, investor interest and/or our current leverage ratios, and we can provide no assurance of the success or costs of any such transactions.
OFF-BALANCE SHEET ARRANGEMENTS
Unconsolidated Joint Ventures.
As discussed in Note 9 – Investments in Unconsolidated Joint Ventures in the Notes to Consolidated Financial Statements in this report, we have investments in unconsolidated joint ventures in various markets where our homebuilding operations are located. Our unconsolidated joint ventures had total combined assets of
$198.8 million
at
November 30, 2016
and
$207.0 million
at November 30, 2015. Our investments in unconsolidated joint ventures totaled
$64.0 million
at
November 30, 2016
and
$71.6 million
at November 30, 2015. As of
November 30, 2016
and 2015, one of our unconsolidated joint ventures had outstanding secured debt of
$44.4 million
and
$39.1 million
, respectively, under a construction loan agreement. The unconsolidated joint venture’s outstanding secured debt is non-recourse to us and is scheduled to mature in August 2018. While we and our partner in the unconsolidated joint venture provided certain guarantees and indemnities to the lender, we do not have a guaranty or any other obligation to repay or to support the value of the collateral underlying the unconsolidated joint venture’s outstanding secured debt. We do not believe that our existing exposure under our guaranty and indemnity obligations related to the unconsolidated joint venture’s outstanding secured debt is material to our consolidated financial statements. None of our other unconsolidated joint ventures had outstanding debt at
November 30, 2016
or 2015. As discussed in Note 8 – Variable Interest Entities in the Notes to Consolidated Financial Statements in this report, we determined that one of our joint ventures at
November 30, 2016
was a VIE, but we were not the primary beneficiary of this VIE. At
November 30, 2015
, we determined that none of our joint ventures were VIEs. All of our joint ventures were unconsolidated and accounted for under the equity method because we did not have a controlling financial interest.
Land Option Contracts and Other Similar Contracts.
As discussed in Note 8 – Variable Interest Entities in the Notes to Consolidated Financial Statements in this report, in the ordinary course of our business, we enter into land option contracts and other similar contracts with third parties and unconsolidated entities to acquire rights to land for the construction of homes. At
November 30, 2016
, we had total cash deposits of
$42.8 million
to purchase land having an aggregate purchase price of
$1.07 billion
. At
November 30, 2015
, we had total cash deposits of
$54.5 million
to purchase land having an aggregate purchase price of
$1.19 billion
. Our land option contracts and other similar contracts generally do not contain provisions requiring our specific performance. Our decision to exercise a particular land option contract or other similar contract depends on the results of our due diligence reviews and ongoing market and project feasibility analysis that we conduct after entering into such a contract. In some cases, our decision to exercise a land option contract or other similar contract may be conditioned on the land seller obtaining necessary entitlements, such as zoning rights and environmental and development approvals, and/or physically developing the underlying land by a pre-determined date. We typically have the ability not to exercise our rights to the underlying land for any reason and forfeit our deposits without further penalty or obligation to the sellers. If we were to acquire all of the land we controlled under our land option contracts and other similar contracts at
November 30, 2016
, we estimate the remaining purchase price to be paid would be as follows: 2017 –
$681.1 million
; 2018 –
$116.5 million
; 2019 –
$85.9 million
; 2020 –
$37.2 million
; 2021 –
$32.8 million
; and thereafter –
$77.3 million
.
In addition to the cash deposits, our exposure to loss related to our land option contracts and other similar contracts consisted of pre-acquisition costs of
$56.0 million
at
November 30, 2016
and
$65.6 million
at November 30, 2015. These pre-acquisition costs and cash deposits were included in inventories in our consolidated balance sheets.
We determined that as of
November 30, 2016
and November 30, 2015 we were not the primary beneficiary of any VIEs from which we have acquired rights to land under land option contracts and other similar contracts. We also evaluate our land option contracts and other similar contracts for financing arrangements, and, as a result of our evaluations, increased inventories, with a corresponding increase to accrued expenses and other liabilities, in our consolidated balance sheets by
$50.5 million
at
November 30, 2016
and
$110.0 million
at November 30, 2015, as further discussed in Note 8 – Variable Interest Entities in the Notes to Consolidated Financial Statements in this report.
37
CONTRACTUAL OBLIGATIONS AND COMMERCIAL COMMITMENTS
The following table presents our future cash requirements under contractual obligations as of November 30, 2016 (in millions):
|
|
Payments due by Period
|
||||||||||||||||||
|
|
Total
|
2017
|
2018-2019
|
2020-2021
|
Thereafter
|
||||||||||||||
|
Contractual obligations:
|
|||||||||||||||||||
|
Long-term debt
|
$
|
2,661.9
|
|
$
|
331.9
|
|
$
|
930.0
|
|
$
|
350.0
|
|
$
|
1,050.0
|
|
||||
|
Interest
|
668.9
|
|
174.1
|
|
256.6
|
|
167.6
|
|
70.6
|
|
|||||||||
|
Inventory-related obligations (a)
|
82.7
|
|
48.0
|
|
7.0
|
|
3.2
|
|
24.5
|
|
|||||||||
|
Purchase obligation (b)
|
53.0
|
|
17.8
|
|
32.8
|
|
2.4
|
|
—
|
|
|||||||||
|
Operating lease obligations
|
36.2
|
|
7.7
|
|
13.9
|
|
7.0
|
|
7.6
|
|
|||||||||
|
Total (c)
|
$
|
3,502.7
|
|
$
|
579.5
|
|
$
|
1,240.3
|
|
$
|
530.2
|
|
$
|
1,152.7
|
|
||||
|
(a)
|
Represents liabilities for inventory not owned associated with financing arrangements as discussed in Note 8 – Variable Interest Entities in the Notes to Consolidated Financial Statements in this report, as well as liabilities for fixed or determinable amounts associated with tax increment financing entity (“TIFE”) assessments. As homes are delivered, the obligation to pay the remaining TIFE assessments associated with each underlying lot is transferred to the homebuyer. As such, these assessment obligations will be paid by us only to the extent we do not deliver homes on applicable lots before the related TIFE obligations mature.
|
|
(b)
|
Represents our commitment to purchase lots from one of our unconsolidated joint ventures as discussed in Note 9 – Investments in Unconsolidated Joint Ventures in the Notes to Consolidated Financial Statements in this report. Our land option contracts and other similar contracts generally do not contain provisions requiring our specific performance.
|
|
(c)
|
Total contractual obligations exclude our accrual for uncertain tax positions recorded for financial reporting purposes as of November 30, 2016 because we are unable to make a reasonable estimate of cash settlements with the respective taxing authorities for all periods presented. We anticipate these potential cash settlement requirements for 2017 to range from zero to $.1 million.
|
As discussed in Note 15 – Commitments and Contingencies in the Notes to Consolidated Financial Statements in this report, we had
$535.7 million
of performance bonds and
$31.0 million
of letters of credit outstanding at November 30, 2016. At November 30, 2015, we had
$565.4 million
of performance bonds and
$33.4 million
of letters of credit outstanding.
CRITICAL ACCOUNTING POLICIES AND ESTIMATES
The accompanying consolidated financial statements were prepared in conformity with GAAP. The preparation of these financial statements requires the use of estimates, judgments and assumptions that affect the reported amounts of assets and liabilities at the date of the financial statements and reported amounts of revenues and expenses during the periods presented. Actual results could differ from those estimates and assumptions. See Note 1 – Summary of Significant Accounting Policies in the Notes to Consolidated Financial Statements in this report for a discussion of our significant accounting policies. The following are accounting policies that we believe are critical because of the significance of the activity to which they relate or because they require the use of significant estimates, judgments and/or other assumptions in their application.
Homebuilding Revenue Recognition.
Revenues from housing and other real estate sales are recognized
when sales are closed and title passes to the buyer. Sales are closed when all of the following conditions are met: a sale is consummated, a sufficient down payment is received, the earnings process is complete and the collection of any remaining receivables is reasonably assured.
Concurrent with the recognition of revenues in our consolidated statements of operations, sales incentives in the form of price concessions on the selling price of a home are recorded as a reduction of revenues, while the costs of sales incentives in the form of free or discounted products or services to homebuyers, including option upgrades and closing cost allowances used to cover a portion of the fees and costs charged to a homebuyer, are reflected as construction and land costs.
Inventories and Cost of Sales.
H
ousing and land inventories are stated at cost, unless the carrying value is determined not to be recoverable, in which case the affected inventories are written down to fair value or fair value less associated costs to sell.
Fair value is determined based on estimated future net cash flows discounted for inherent risks associated with the real estate assets, or other valuation techniques. Due to uncertainties in the estimation process and other factors beyond our control, it is possible
38
that actual results could differ from those estimated. Our inventories typically do not consist of completed unsold homes. However, cancellations or strategic considerations may result in our having unsold completed or partially completed homes in our inventory.
We rely on certain estimates to determine our construction and land costs and resulting housing gross profit margins associated with revenues recognized.
Construction and land costs are comprised of direct and allocated costs, including estimated future costs for the limited warranty we provide on our homes and certain amenities within a community. Land acquisition, land development and other common costs are generally allocated on a relative fair value basis to the homes or lots within the applicable community or land parcel. Land acquisition and land development costs include related interest and real estate taxes.
In determining a portion of the construction and land costs recognized for each period, we rely on project budgets that are based on a variety of assumptions, including future construction schedules and costs to be incurred. It is possible that actual results could differ from budgeted amounts for various reasons, including construction delays, construction resource shortages, increases in costs that have not yet been committed, changes in governmental requirements, unforeseen environmental hazards or other unanticipated issues encountered during construction and other factors beyond our control. While the actual results for a particular construction project are accurately reported over time, variances between the budgeted and actual costs of a project could result in the understatement or overstatement of construction and land costs and homebuilding gross profits in a particular reporting period. To reduce the potential for such distortion, we have set forth procedures that collectively comprise a critical accounting policy. These procedures, which we have applied on a consistent basis, include assessing, updating and revising project budgets on a monthly basis, obtaining commitments to the extent possible from independent subcontractors and vendors for future costs to be incurred, reviewing the adequacy of warranty accruals and historical warranty claims experience, and utilizing the most current information available to estimate construction and land costs to be charged to expense. Variances to the budgeted costs after an estimate has been charged to expense that are related to project costs are generally allocated on a relative fair value basis to the remaining homes to be delivered within the community or land parcel, while such variances related to direct construction costs are generally expensed as incurred. The variances between budgeted and actual costs have historically not been material to our consolidated financial statements. We believe that our policies provide for reasonably dependable estimates to be used in the calculation and reporting of construction and land costs.
Inventory Impairments and Land Option Contract Abandonments.
E
ach community or land parcel in our owned inventory is assessed to determine if indicators of potential impairment exist. Impairment indicators are assessed separately for each community or land parcel on a quarterly basis and include, but are not limited to, the following: significant decreases in net orders, average selling prices, volume of homes delivered, gross profit margins on homes delivered or projected gross profit margins on homes in backlog or future deliveries; significant increases in budgeted land development and home construction costs or cancellation rates; or projected losses on expected future land sales. If indicators of potential impairment exist for a community or land parcel, the identified asset is evaluated for recoverability.
The following table presents information regarding inventory impairment and land option contract abandonment charges included in construction and land costs in our consolidated statements of operations (dollars in thousands):
|
|
Years Ended November 30,
|
||||||||||
|
|
2016
|
2015
|
2014
|
||||||||
|
Inventory impairments:
|
|||||||||||
|
Number of communities or land parcels evaluated for recoverability (a)
|
68
|
|
35
|
|
32
|
|
|||||
|
Carrying value of communities or land parcels evaluated for recoverability (a)
|
$
|
423,122
|
|
$
|
286,333
|
|
$
|
266,850
|
|
||
|
Number of communities or land parcels written down to fair value
|
30
|
|
4
|
|
8
|
|
|||||
|
Pre-impairment carrying value of communities or land parcels written down to fair value
|
$
|
89,097
|
|
$
|
20,018
|
|
$
|
68,223
|
|
||
|
Inventory impairment charges
|
(49,580
|
)
|
(8,030
|
)
|
(37,628
|
)
|
|||||
|
Post-impairment fair value
|
$
|
39,517
|
|
$
|
11,988
|
|
$
|
30,595
|
|
||
|
Land option contract abandonments:
|
|||||||||||
|
Number of lots abandoned
|
744
|
|
1,166
|
|
1,306
|
|
|||||
|
Land option contract abandonment charges
|
$
|
3,232
|
|
$
|
1,561
|
|
$
|
1,803
|
|
||
|
(a)
|
As impairment indicators are assessed on a quarterly basis, some of the communities or land parcels evaluated during the years ended
November 30, 2016
,
2015
and
2014
were evaluated in more than one quarterly period.
Communities or land
|
39
parcels evaluated for recoverability in more than one quarterly period are counted only once for each applicable year.
The year-over-year increase in the number and carrying value of communities evaluated for impairment in 2016 reflected our decisions to make changes in our operational strategies for specific communities or land parcels aimed at more quickly monetizing our investment in those inventories, as discussed further
in Note 7 – Inventory Impairments and Land Option Contract Abandonments in the Notes to Consolidated Financial Statements in this report.
When an indicator of potential impairment is identified for a community or land parcel, we test the asset for recoverability by comparing the carrying value of the asset to the undiscounted future net cash flows expected to be generated by the asset. The undiscounted future net cash flows are impacted by then-current conditions and trends in the market in which the asset is located as well as factors known to us at the time the cash flows are calculated. These factors may include recent trends in our orders, backlog, cancellation rates and volume of homes delivered, as well as our expectations related to the following: product offerings; market supply and demand, including estimated average selling prices and related price appreciation; and land development, home construction and overhead costs to be incurred and related cost inflation.
As further described in Note 7 – Inventory Impairments and Land Option Contract Abandonments in the Notes to Consolidated Financial Statements in this report, given the inherent challenges and uncertainties in forecasting future results, our inventory assessments at the time they are made take into consideration whether a community or land parcel is active, meaning whether it is open for sales and/or undergoing development, or whether it is being held for future development or held for sale.
We record an inventory impairment charge on a community or land parcel that is active or held for future development when its carrying value is greater than the undiscounted future net cash flows the asset is expected to generate. These real estate assets are written down to fair value, which is primarily determined based on the estimated future net cash flows discounted for inherent risk associated with each such asset, or other valuation techniques.
Inputs used in our calculation of estimated discounted future net cash flows are specific to each affected real estate asset and are based on our expectations for each such asset as of the applicable measurement date, including, among others, expectations related to average selling prices and volume of homes delivered.
The discount rates used in our estimated discounted cash flows ranged from 17% to 20% during both 2016 and 2015, and 17% to 19% during 2014.
The discount rates we used were impacted by one or more of the following at the time the calculation was made: the risk-free rate of return; expected risk premium based on estimated land development, home construction and delivery timelines; market risk from potential future price erosion; cost uncertainty due to land development or home construction cost increases; and other risks specific to the asset or conditions in the market in which the asset is located.
We record an inventory impairment charge on land held for sale when the carrying value of the real estate asset is greater than its fair value. These real estate assets are written down to fair value, less associated costs to sell. The fair value of such real estate assets is generally based on bona fide letters of intent from outside parties, executed sales contracts, broker quotes or similar information.
As of
November 30, 2016
, the aggregate carrying value of our inventory that had been impacted by inventory impairment charges was
$215.3 million
, representing
28
communities and various other land parcels. As of
November 30, 2015
, the aggregate carrying value of our inventory that had been impacted by inventory impairment charges was
$254.2 million
, representing
28
communities and various other land parcels.
Our inventory controlled under land option contracts and other similar contracts is assessed to determine whether it continues to meet our investment return standards. Assessments are made separately for each optioned land parcel on a quarterly basis and are affected by the following factors relative to the market in which the asset is located, among others: current and/or anticipated net orders, average selling prices and volume of homes delivered; estimated land development and home construction costs; and projected profitability on expected future housing or land sales. When a decision is made not to exercise certain land option contracts and other similar contracts due to market conditions and/or changes in our marketing strategy, we write off the related inventory costs, including non-refundable deposits and unrecoverable pre-acquisition costs.
The estimated remaining life of each community or land parcel in our inventory depends on various factors, such as the total number of lots remaining; the expected timeline to acquire and entitle land and develop lots to build homes; the anticipated future net order and cancellation rates; and the expected timeline to build and deliver homes sold. While it is difficult to determine a precise timeframe for any particular inventory asset, based on current market conditions and expected delivery timelines, we estimate our inventory assets’ remaining operating lives to range generally from
one year to in excess of 10 years
and expect to realize, on an overall basis, the majority of our inventory balance as of November 30, 2016 within
five years. The following table presents our inventory balance as of November 30, 2016, based on our current estimated timeframe of delivery for the last home within an applicable community or land parcel (in millions):
40
|
0-2 years
|
3-5 years
|
6-10 years
|
Greater than
10 years
|
Total
|
|||||||||||||||
|
Inventories
|
$
|
1,919.8
|
|
$
|
1,171.0
|
|
$
|
229.0
|
|
$
|
83.4
|
|
$
|
3,403.2
|
|
||||
The inventory balances in the 0-2 years and 3-5 years categories were located throughout all of our homebuilding reporting segments, though mostly in our West Coast and Central homebuilding reporting segments. These categories collectively represented
91%
of our total inventories as of November 30, 2016, compared to
85%
as of November 30, 2015. The inventory balances in the 6-10 years and greater than 10 years categories were primarily comprised of land held for future development, and together totaled
$312.4 million
at November 30, 2016, compared to
$489.2 million
at November 30, 2015. The year-over-year decrease was primarily related to our decisions to monetize certain non-strategic land parcels through land sales and to accelerate the overall timing for selling, building and delivering homes through community reactivations.
Due to the judgment and assumptions applied in our inventory impairment and land option contract abandonment assessment processes, and in our estimations of the remaining operating lives of our inventory assets and the realization of our inventory balances, particularly as to land held for future development, it is possible that actual results could differ substantially from those estimated.
Deterioration in the supply and demand factors in the overall housing market or in an individual market or submarket, or changes to our operational or selling strategy at certain communities may lead to additional inventory impairment charges, future charges associated with land sales or the abandonment of land option contracts or other similar contracts related to certain assets. Due to the nature or location of the projects, land held for future development that we activate as part of our strategic growth initiatives or to accelerate sales and/or our return on investment, or that we otherwise monetize to help improve our asset efficiency, may have a somewhat greater likelihood of being impaired than other of our active inventory.
We believe that the carrying value of our inventory balance as of
November 30, 2016
is recoverable. Our considerations in making this determination include the factors and trends incorporated into our impairment analyses, and as applicable, the prevailing regulatory environment, competition from other homebuilders, inventory levels and sales activity of resale homes, and the local
economic conditions where an asset is located. In addition, we consider the financial and operational status and expectations of our inventories as well as unique attributes of each community or land parcel that could be viewed as indicators for potential future impairments. However, if conditions in the overall housing market or in a specific market or submarket worsen in the future beyond our current expectations, if future changes in our business strategy significantly affect any key assumptions used in our projections of future cash flows, or if there are material changes in any of the other items we consider in assessing recoverability, we may recognize charges in future periods for inventory impairments or land option contract abandonments, or both, related to our current inventory assets. Any such charges could be material to our consolidated financial statements.
Warranty Costs.
We
provide a limited warranty on all of our homes.
The specific terms and conditions of our limited warranty program vary depending upon the markets in which we do business.
We estimate the costs that may be incurred under each limited warranty and record a liability in the amount of such costs at the time the revenue associated with the sale of each home is recognized.
In assessing our overall warranty liability at a reporting date, we evaluate the costs for warranty-related items on a combined basis for all of our previously delivered homes that are under our limited warranty program.
Our primary assumption in estimating the amounts we accrue for warranty costs is that historical claims experience is a strong indicator of future claims experience. Factors that affect our warranty liability include the number of homes delivered, historical and anticipated rates of warranty claims, and cost per claim. We periodically assess the adequacy of our accrued warranty liability
, which is included in accrued expenses and other liabilities in our consolidated balance sheets,
and adjust the amount as necessary based on our assessment.
Our assessment includes the review of our actual warranty costs incurred to identify trends and changes in our warranty claims experience, and considers our home construction quality and customer service initiatives and outside events.
While we believe the warranty liability currently reflected in our consolidated balance sheets to be adequate, unanticipated changes or developments in the legal environment, local weather, land or environmental conditions, quality of materials or methods used in the construction of homes or customer service practices and/or our warranty claims experience could have a significant impact on our actual warranty costs in future periods and such amounts could differ significantly from our current estimates.
A 10% change in the historical warranty rates used to estimate our warranty accrual would not result in a material change in our accrual.
Self-Insurance.
W
e maintain, and require the majority of our independent subcontractors to maintain, general liability insurance (including construction defect and bodily injury coverage) and workers’ compensation insurance. These insurance policies protect us against a portion of our risk of loss from claims related to our homebuilding activities, subject to certain self-insured retentions, deductibles and other coverage limits
.
We self-insure a portion of our overall risk through the use of a captive insurance subsidiary. We also maintain certain other insurance policies.
In Arizona, California, Colorado and Nevada, our subcontractors’ general
41
liability insurance primarily takes the form of a wrap-up policy under a program where eligible independent subcontractors are enrolled as insureds on each community. Enrolled subcontractors contribute toward the cost of the insurance and agree to pay a contractual amount in the future if there is a claim related to their work.
We record liabilities based on the estimated costs required to cover reported claims, claims incurred but not yet reported, and claim adjustment expenses. These estimated costs are based on an actuarial analysis of our historical claims and expense data, as well as industry data.
Our self-insurance liabilities are presented on a gross basis without consideration of insurance recoveries and amounts we have paid on behalf of and expect to recover from other parties, if any.
The amount of our self-insurance liability is based on an analysis performed by a third-party actuary that uses our historical claim and expense data, as well as industry data to estimate these overall costs.
These estimates are subject to uncertainty due to a variety of factors, the most significant being the long period of time between the delivery of a home to a homebuyer and when a structural warranty or construction defect claim may be made, and the ultimate resolution of any such construction defect claim.
Though state regulations vary, construction defect claims are reported and resolved over a long period of time, which can extend for 10 years or more. As a result, the majority of the estimated self-insurance liability based on the actuarial analysis relates to claims incurred but not yet reported. Therefore, adjustments related to individual existing claims generally do not significantly impact the overall estimated liability. Adjustments to our liabilities related to homes delivered in prior years are recorded in the period in which a change in our estimate occurs.
The projection of losses related to these liabilities requires the use of actuarial assumptions.
Key assumptions used in developing these estimates include claim frequencies, severities and resolution patterns, which can occur over an extended period of time. These estimates are subject to variability due to the length of time between the delivery of a home to a homebuyer and when a construction defect claim is made, and the ultimate resolution of such claim; uncertainties regarding such claims relative to our markets and the types of product we build; and legal or regulatory actions and/or interpretations, among other factors. Due to the degree of judgment involved and the potential for variability in these underlying assumptions, our actual future costs could differ from those estimated. In addition, changes in the frequency and severity of reported claims and the estimates to resolve claims can impact the trends and assumptions used in the actuarial analysis, which could be material to our consolidated financial statements.
Based on the actuarial analysis performed, we believe it is reasonably possible that our losses related to construction defect claims, prior to the consideration of insurance recoveries, as of
November 30, 2016
could range from $145 million to $170 million; however, there can be no assurance that the actual costs will fall within this range and they could be higher.
Estimates of insurance recoveries and amounts we have paid on behalf of other parties, if any, are recorded as receivables when such recoveries are considered probable. These estimated recoveries are principally based on actuarially determined amounts and depend on various factors, including, among other things, the above-described claim cost estimates, our insurance policy coverage limits for the applicable policy year(s), historical third party recovery rates, insurance industry practices, the regulatory environment, and legal precedent, and are subject to a high degree of variability from year to year. Because of the inherent uncertainty and variability in these assumptions, our actual insurance recoveries could differ significantly from amounts currently estimated.
Stock-Based Compensation.
We measure and recognize compensation expense associated with our grants of equity-based awards at an amount equal to the fair value of such share-based payments over their applicable vesting period. We have provided compensation benefits to certain of our employees in the form of stock options, restricted stock, performance-based restricted stock units (each a “PSU”) and stock appreciation rights (“SARs”), and to our non-employee directors in the form of unrestricted shares of common stock, deferred common stock awards and Director Plan SARs. Determining the fair value of share-based awards requires judgment to identify the appropriate valuation model and develop the assumptions to be used in the calculation, including the expected term of the stock options, SARs or Director Plan SARs, expected stock-price volatility and dividend yield.
We estimate the fair value of stock options, SARs and Director Plan SARs granted using the Black-Scholes option-pricing model with assumptions based primarily on historical data.
The expected volatility factor is based on a combination of the historical volatility of our common stock and the implied volatility of publicly traded options on our common stock. Additionally, judgment is required in estimating the percentage of share-based awards that are expected to vest, and in the case of PSUs, the level of performance that will be achieved and the number of shares that will be earned. If actual results differ significantly from these estimates, stock-based compensation expense could be higher and have a material impact on our consolidated financial statements.
Income Taxes.
As discussed in Note 12 – Income Taxes in the Notes to the Consolidated Financial Statements in this report, we evaluate our deferred tax assets quarterly to determine if adjustments to our valuation allowance are required based on the consideration of all available positive and negative evidence using a “more likely than not” standard with respect to whether deferred tax assets will be realized. This evaluation
considers, among other factors, our historical operating results, our expectation of future profitability, the duration of the applicable statutory carryforward periods, and conditions in the housing market and the broader economy.
The ultimate realization of our deferred tax assets depends primarily on our ability to generate future taxable income during the periods in which the related temporary differences in the financial basis and the tax basis of the assets become
42
deductible.
The value of our deferred tax assets in our consolidated balance sheets depends on applicable income tax rates. We base our estimate of deferred tax assets and liabilities on current tax laws and rates. In certain cases, we also base this estimate on business plan forecasts and other expectations about future outcomes. Changes in positive and negative evidence, including differences between our future operating results and estimates, could result in the establishment of an additional valuation allowance against our deferred tax assets. Accounting for deferred taxes is based upon estimates of future results. Judgment is required in determining the future tax consequences of events that have been recognized in our consolidated financial statements and/or tax returns. Differences between the anticipated and actual outcomes of these future results could have a material impact on our consolidated financial statements. Also, changes in existing federal and state tax laws and corporate income tax rates could affect future tax results and the realization of deferred tax assets over time.
W
e recognize accrued interest and penalties related to unrecognized tax benefits in our consolidated financial statements as a component of the provision for or benefit from income taxes.
Our liability for unrecognized tax benefits, combined with accrued interest and penalties, is reflected as a component of accrued expenses and other liabilities in our consolidated balance sheets. Judgment is required in evaluating uncertain tax positions. We evaluate our uncertain tax positions quarterly based on various factors, including changes in facts or circumstances, tax laws or the status of audits by tax authorities. Changes in the recognition
or measurement of uncertain tax positions could have a material impact on our consolidated financial statements in the period in which we make the change.
RECENT ACCOUNTING PRONOUNCEMENTS
Recent accounting pronouncements are discussed in Note 1 – Summary of Significant Accounting Policies in the Notes to Consolidated Financial Statements in this report.
OUTLOOK
In 2017, we intend to execute on our returns-focused growth plan, which is described in the “Business” section of this report. We believe that doing so will enable us to generate higher cash flows that we can deploy in a targeted fashion to support the balanced growth of our business and increase our return on invested capital, as well as reduce our debt, with the principal aim of driving long-term stockholder value. Our present 2017 outlook is as follows:
|
•
|
We expect our full-year housing revenues to be in the range of $3.8 billion to $4.2 billion, an increase from
$3.6 billion
in 2016, and anticipate our average selling price to be in the range of $370,000 to $385,000, representing an increase in the range of 2% to 6% as compared to 2016.
|
|
•
|
We expect our full-year housing gross profit margin to range from 16.0% to 16.5%.
|
|
•
|
We expect our full-year operating income margin to range from 5.7% to 6.3%.
|
|
•
|
We expect our full-year selling, general and administrative expenses as a percentage of housing revenues to be in the range of 10.0% to 10.5%.
|
|
•
|
We expect our average community count to be approximately flat relative to 2016.
|
We believe we are well-positioned to achieve our top financial and operational targets for 2017 due to, among other things, our backlog levels at November 30, 2016, our planned new home community openings, community reactivations and investments in land and land development, as well as a recent increase in demand from first-time homebuyers and current positive economic and demographic trends, to varying degrees, in many of our served markets.
Our future performance and the strategies we implement (and adjust or refine as necessary or appropriate) will depend significantly on prevailing economic and capital, credit and financial market conditions and on a fairly stable and constructive political and regulatory environment (particularly in regards to housing and mortgage loan financing policies), among other factors.
FORWARD-LOOKING STATEMENTS
Investors are cautioned that certain statements contained in this report, as well as some statements by us in periodic press releases and other public disclosures and some oral statements by us to securities analysts, stockholders and others during presentations, are “forward-looking statements” within the meaning of the Private Securities Litigation Reform Act of 1995 (the “Act”). Statements that are predictive in nature, that depend upon or refer to future events or conditions, or that include words such as “expect,” “anticipate,” “intend,” “plan,” “believe,” “estimate,” “hope,” and similar expressions constitute forward-looking statements. In addition, any statements that we may make or provide concerning future financial or operating performance (including without limitation future revenues, community count, homes delivered, net orders, selling prices, sales pace per new
43
community, expenses, expense ratios, housing gross profits, housing gross profit margins, earnings or earnings per share, or growth or growth rates), future market conditions, future interest rates, and other economic conditions, ongoing business strategies or prospects, future dividends and changes in dividend levels, the value of our backlog (including amounts that we expect to realize upon delivery of homes included in our backlog and the timing of those deliveries), the value of our net orders, potential future asset acquisitions and the impact of completed acquisitions, future share issuances or repurchases, future debt issuances, repurchases or redemptions and other possible future actions are also forward-looking statements as defined by the Act. Forward-looking statements are based on our current expectations and projections about future events and are subject to risks, uncertainties, and assumptions about our operations, economic and market factors, and the homebuilding industry, among other things. These statements are not guarantees of future performance, and we have no specific policy or intention to update these statements. In addition, forward-looking and other statements in this report and in other public or oral disclosures that express or contain opinions, views or assumptions about market or economic conditions; the success, performance, effectiveness and/or relative positioning of our strategies, initiatives or operational activities; and other matters, may be based in whole or in part on general observations of our management, limited or anecdotal evidence and/or business or industry experience without in-depth or any particular empirical investigation, inquiry or analysis.
Actual events and results may differ materially from those expressed or forecasted in forward-looking statements due to a number of factors. The most important risk factors that could cause our actual performance and future events and actions to differ materially from such forward-looking statements include, but are not limited to, the following:
|
•
|
general economic, employment and business conditions;
|
|
•
|
population growth, household formations and demographic trends;
|
|
•
|
conditions in the capital, credit and financial markets;
|
|
•
|
our ability to access external financing sources and raise capital through the issuance of common stock, debt or other securities, and/or project financing, on favorable terms;
|
|
•
|
material and trade costs and availability;
|
|
•
|
changes in interest rates;
|
|
•
|
our debt level, including our ratio of debt to capital, and our ability to adjust our debt level and maturity schedule;
|
|
•
|
our compliance with the terms of the Credit Facility;
|
|
•
|
volatility in the market price of our common stock;
|
|
•
|
weak or declining consumer confidence, either generally or specifically with respect to purchasing homes;
|
|
•
|
competition from other sellers of new and resale homes;
|
|
•
|
weather events, significant natural disasters and other climate and environmental factors, including the severe prolonged drought and related water-constrained conditions in the southwest United States and California;
|
|
•
|
government actions, policies, programs and regulations directed at or affecting the housing market (including the Dodd-Frank Act, tax benefits associated with purchasing and owning a home, and the standards, fees and size limits applicable to the purchase or insuring of mortgage loans by government-sponsored enterprises and government agencies), the homebuilding industry, or construction activities;
|
|
•
|
changes in existing tax laws or enacted corporate income tax rates;
|
|
•
|
the availability and cost of land in desirable areas;
|
|
•
|
our warranty claims experience with respect to homes previously delivered and actual warranty costs incurred;
|
|
•
|
costs and/or charges arising from regulatory compliance requirements or from legal, arbitral or regulatory proceedings, investigations, claims or settlements, including unfavorable outcomes in any such matters resulting in actual or potential monetary damage awards, penalties, fines or other direct or indirect payments, or injunctions, consent decrees or other voluntary or involuntary restrictions or adjustments to our business operations or practices that are beyond our current expectations and/or accruals;
|
|
•
|
our ability to use/realize the net deferred tax assets we have generated;
|
44
|
•
|
our ability to successfully implement our current and planned strategies and initiatives related to our product, geographic and market positioning (including our transition out of the Metro Washington, D.C. area), gaining share and scale in our served markets;
|
|
•
|
our operational and investment concentration in markets in California;
|
|
•
|
consumer interest in our new home communities and products, particularly from first-time homebuyers and
higher-income consumers;
|
|
•
|
our ability to generate orders and
convert our backlog of orders to home deliveries and revenues, particularly in key markets in California;
|
|
•
|
our ability to successfully implement our returns-focused growth roadmap/strategy and achieve the associated revenue, margin, profitability, cash flow, community reactivation, land sales, business growth, asset efficiency, return on invested capital, return on equity, net debt-to-capital ratio and other financial and operational targets and objectives;
|
|
•
|
the ability of our homebuyers to obtain residential mortgage loans and mortgage banking services;
|
|
•
|
the performance of mortgage lenders to our homebuyers;
|
|
•
|
completing the wind down of HCM as planned;
|
|
•
|
Stearns Lending’s management of HCM’s assets and operations;
|
|
•
|
whether we can operate a joint venture with Stearns Lending or any other mortgage banking services provider, and the performance of any such mortgage banking joint venture once operational;
|
|
•
|
information technology failures and data security breaches; and
|
|
•
|
other events outside of our control.
|
|
Item 7A.
|
QUANTITATIVE AND QUALITATIVE DISCLOSURES ABOUT MARKET RISK
|
We enter into debt obligations primarily to support general corporate purposes, including the operations of our subsidiaries. We are subject to interest rate risk on our senior notes. For fixed rate debt, changes in interest rates generally affect the fair value of the debt instrument, but not our earnings or cash flows. Under our current policies, we do not use interest rate derivative instruments to manage our exposure to changes in interest rates.
The following tables present principal cash flows by scheduled maturity, weighted average effective interest rates and the estimated fair value of our long-term fixed rate debt obligations as of
November 30, 2016
and
2015
(dollars in thousands):
|
As of November 30, 2016 for the Years Ended November 30,
|
Fair Value at
November 30,
2016
|
||||||||||||||||||||||||||||||
|
2017
|
2018
|
2019
|
2020
|
2021
|
Thereafter
|
Total
|
|||||||||||||||||||||||||
|
Long-term debt
|
|||||||||||||||||||||||||||||||
|
Fixed Rate
|
$
|
265,000
|
|
$
|
300,000
|
|
$
|
630,000
|
|
$
|
350,000
|
|
$
|
—
|
|
$
|
1,050,000
|
|
$
|
2,595,000
|
|
$
|
2,718,519
|
|
|||||||
|
Weighted Average Effective Interest Rate
|
9.6
|
%
|
7.3
|
%
|
3.9
|
%
|
8.5
|
%
|
—
|
%
|
7.5
|
%
|
7.0
|
%
|
|||||||||||||||||
|
As of November 30, 2015 for the Years Ended November 30,
|
Fair Value at
November 30,
2015
|
||||||||||||||||||||||||||||||
|
2016
|
2017
|
2018
|
2019
|
2020
|
Thereafter
|
Total
|
|||||||||||||||||||||||||
|
Long-term debt
|
|||||||||||||||||||||||||||||||
|
Fixed Rate
|
$
|
—
|
|
$
|
265,000
|
|
$
|
300,000
|
|
$
|
630,000
|
|
$
|
350,000
|
|
$
|
1,050,000
|
|
$
|
2,595,000
|
|
$
|
2,641,163
|
|
|||||||
|
Weighted Average Effective Interest Rate
|
—
|
%
|
9.6
|
%
|
7.3
|
%
|
3.9
|
%
|
8.5
|
%
|
7.5
|
%
|
7.0
|
%
|
|||||||||||||||||
45
|
Item 8.
|
FINANCIAL STATEMENTS AND SUPPLEMENTARY DATA
|
KB HOME
INDEX TO CONSOLIDATED FINANCIAL STATEMENTS
|
|
Page
Number
|
Separate combined financial statements of our unconsolidated joint venture activities have been omitted because, if considered in the aggregate, they would not constitute a significant subsidiary as defined by Rule 3-09 of Regulation S-X.
46
KB HOME
(In Thousands, Except Per Share Amounts)
|
|
Years Ended November 30,
|
||||||||||
|
|
2016
|
2015
|
2014
|
||||||||
|
Total revenues
|
$
|
3,594,646
|
|
$
|
3,032,030
|
|
$
|
2,400,949
|
|
||
|
Homebuilding:
|
|||||||||||
|
Revenues
|
$
|
3,582,943
|
|
$
|
3,020,987
|
|
$
|
2,389,643
|
|
||
|
Construction and land costs
|
(3,041,101
|
)
|
(2,539,368
|
)
|
(1,985,651
|
)
|
|||||
|
Selling, general and administrative expenses
|
(389,441
|
)
|
(342,998
|
)
|
(288,023
|
)
|
|||||
|
Operating income
|
152,401
|
|
138,621
|
|
115,969
|
|
|||||
|
Interest income
|
529
|
|
458
|
|
443
|
|
|||||
|
Interest expense
|
(5,900
|
)
|
(21,856
|
)
|
(30,750
|
)
|
|||||
|
Equity in income (loss) of unconsolidated joint ventures
|
(2,181
|
)
|
(1,804
|
)
|
741
|
|
|||||
|
Homebuilding pretax income
|
144,849
|
|
115,419
|
|
86,403
|
|
|||||
|
Financial services:
|
|||||||||||
|
Revenues
|
11,703
|
|
11,043
|
|
11,306
|
|
|||||
|
Expenses
|
(3,817
|
)
|
(3,711
|
)
|
(3,446
|
)
|
|||||
|
Equity in income (loss) of unconsolidated joint ventures
|
(3,420
|
)
|
4,292
|
|
686
|
|
|||||
|
Financial services pretax income
|
4,466
|
|
11,624
|
|
8,546
|
|
|||||
|
Total pretax income
|
149,315
|
|
127,043
|
|
94,949
|
|
|||||
|
Income tax benefit (expense)
|
(43,700
|
)
|
(42,400
|
)
|
823,400
|
|
|||||
|
Net income
|
$
|
105,615
|
|
$
|
84,643
|
|
$
|
918,349
|
|
||
|
Earnings per share:
|
|||||||||||
|
Basic
|
$
|
1.23
|
|
$
|
.92
|
|
$
|
10.26
|
|
||
|
Diluted
|
$
|
1.12
|
|
$
|
.85
|
|
$
|
9.25
|
|
||
|
Weighted average shares outstanding:
|
|||||||||||
|
Basic
|
85,706
|
|
92,054
|
|
89,265
|
|
|||||
|
Diluted
|
96,278
|
|
102,857
|
|
99,314
|
|
|||||
See accompanying notes.
47
KB HOME
CONSOLIDATED STATEMENTS OF COMPREHENSIVE INCOME
(In Thousands)
|
|
Years Ended November 30,
|
||||||||||
|
|
2016
|
2015
|
2014
|
||||||||
|
Net income
|
$
|
105,615
|
|
$
|
84,643
|
|
$
|
918,349
|
|
||
|
Other comprehensive income (loss):
|
|||||||||||
|
Postretirement benefit plan adjustments:
|
|||||||||||
|
Net actuarial gain (loss) arising during the period
|
468
|
|
3,745
|
|
(3,801
|
)
|
|||||
|
Amortization of net actuarial loss
|
79
|
|
848
|
|
357
|
|
|||||
|
Amortization of prior service cost
|
1,556
|
|
1,556
|
|
1,556
|
|
|||||
|
Other comprehensive income (loss) before tax
|
2,103
|
|
6,149
|
|
(1,888
|
)
|
|||||
|
Income tax expense related to items of other comprehensive income
|
(841
|
)
|
(2,460
|
)
|
(1,604
|
)
|
|||||
|
Other comprehensive income (loss), net of tax
|
1,262
|
|
3,689
|
|
(3,492
|
)
|
|||||
|
Comprehensive income
|
$
|
106,877
|
|
$
|
88,332
|
|
$
|
914,857
|
|
||
See accompanying notes.
48
KB HOME
(In Thousands, Except Shares)
|
|
November 30,
|
||||||
|
|
2016
|
2015
|
|||||
|
Assets
|
|||||||
|
Homebuilding:
|
|||||||
|
Cash and cash equivalents
|
$
|
592,086
|
|
$
|
559,042
|
|
|
|
Restricted cash
|
—
|
|
9,344
|
|
|||
|
Receivables
|
231,665
|
|
247,998
|
|
|||
|
Inventories
|
3,403,228
|
|
3,313,747
|
|
|||
|
Investments in unconsolidated joint ventures
|
64,016
|
|
71,558
|
|
|||
|
Deferred tax assets, net
|
738,985
|
|
782,196
|
|
|||
|
Other assets
|
91,145
|
|
88,992
|
|
|||
|
5,121,125
|
|
5,072,877
|
|
||||
|
Financial services
|
10,499
|
|
14,028
|
|
|||
|
Total assets
|
$
|
5,131,624
|
|
$
|
5,086,905
|
|
|
|
Liabilities and stockholders’ equity
|
|||||||
|
Homebuilding:
|
|||||||
|
Accounts payable
|
$
|
215,331
|
|
$
|
183,770
|
|
|
|
Accrued expenses and other liabilities
|
550,996
|
|
608,730
|
|
|||
|
Notes payable
|
2,640,149
|
|
2,601,754
|
|
|||
|
3,406,476
|
|
3,394,254
|
|
||||
|
Financial services
|
2,003
|
|
1,817
|
|
|||
|
Stockholders’ equity:
|
|||||||
|
Preferred stock — $1.00 par value; 10,000,000 shares authorized; none issued
|
—
|
|
—
|
|
|||
|
Common stock — $1.00 par value; 290,000,000 shares authorized at November 30, 2016 and 2015; 116,224,208 and 115,547,682 shares issued at November 30, 2016 and 2015, respectively
|
116,224
|
|
115,548
|
|
|||
|
Paid-in capital
|
696,938
|
|
682,871
|
|
|||
|
Retained earnings
|
1,563,742
|
|
1,466,713
|
|
|||
|
Accumulated other comprehensive loss
|
(16,057
|
)
|
(17,319
|
)
|
|||
|
Grantor stock ownership trust, at cost: 9,431,756 and 10,135,461 shares at November 30, 2016 and 2015, respectively
|
(102,300
|
)
|
(109,936
|
)
|
|||
|
Treasury stock, at cost: 21,719,757 and 13,136,563 shares at November 30, 2016 and 2015, respectively
|
(535,402
|
)
|
(447,043
|
)
|
|||
|
Total stockholders’ equity
|
1,723,145
|
|
1,690,834
|
|
|||
|
Total liabilities and stockholders’ equity
|
$
|
5,131,624
|
|
$
|
5,086,905
|
|
|
See accompanying notes.
49
KB HOME
CONSOLIDATED STATEMENTS OF STOCKHOLDERS’ EQUITY
(In Thousands)
|
|
Years Ended November 30, 2016, 2015 and 2014
|
|||||||||||||||||||||||||||||||||||
|
|
Number of Shares
|
Common
Stock
|
Paid-in
Capital
|
Retained
Earnings
|
Accumulated
Other
Comprehensive
Loss
|
Grantor
Stock
Ownership
Trust
|
Treasury
Stock
|
Total
Stockholders’
Equity
|
||||||||||||||||||||||||||||
|
Common
Stock
|
Grantor
Stock
Ownership
Trust
|
Treasury
Stock
|
||||||||||||||||||||||||||||||||||
|
Balance at November 30, 2013
|
115,296
|
|
(10,502
|
)
|
(21,050
|
)
|
$
|
115,296
|
|
$
|
788,893
|
|
$
|
481,889
|
|
$
|
(17,516
|
)
|
$
|
(113,911
|
)
|
$
|
(718,565
|
)
|
$
|
536,086
|
|
|||||||||
|
Net income
|
—
|
|
—
|
|
—
|
|
—
|
|
—
|
|
918,349
|
|
—
|
|
—
|
|
—
|
|
918,349
|
|
||||||||||||||||
|
Other comprehensive income, net of tax
|
—
|
|
—
|
|
—
|
|
—
|
|
—
|
|
—
|
|
(3,492
|
)
|
—
|
|
—
|
|
(3,492
|
)
|
||||||||||||||||
|
Dividends on common stock
|
—
|
|
—
|
|
—
|
|
—
|
|
—
|
|
(8,982
|
)
|
—
|
|
—
|
|
—
|
|
(8,982
|
)
|
||||||||||||||||
|
Employee stock options/other
|
37
|
|
—
|
|
—
|
|
37
|
|
1,859
|
|
—
|
|
—
|
|
—
|
|
—
|
|
1,896
|
|
||||||||||||||||
|
Conversion of liability awards to equity awards
|
—
|
|
—
|
|
—
|
|
—
|
|
6,455
|
|
—
|
|
—
|
|
—
|
|
—
|
|
6,455
|
|
||||||||||||||||
|
Stock awards
|
54
|
|
166
|
|
—
|
|
54
|
|
(1,859
|
)
|
—
|
|
—
|
|
1,805
|
|
—
|
|
—
|
|
||||||||||||||||
|
Stock-based compensation
|
—
|
|
—
|
|
—
|
|
—
|
|
9,099
|
|
—
|
|
—
|
|
—
|
|
—
|
|
9,099
|
|
||||||||||||||||
|
Issuance of common stock
|
—
|
|
—
|
|
7,986
|
|
—
|
|
(135,590
|
)
|
—
|
|
—
|
|
—
|
|
272,635
|
|
137,045
|
|
||||||||||||||||
|
Stock repurchases
|
—
|
|
—
|
|
(33
|
)
|
—
|
|
—
|
|
—
|
|
—
|
|
—
|
|
(546
|
)
|
(546
|
)
|
||||||||||||||||
|
Balance at November 30, 2014
|
115,387
|
|
(10,336
|
)
|
(13,097
|
)
|
115,387
|
|
668,857
|
|
1,391,256
|
|
(21,008
|
)
|
(112,106
|
)
|
(446,476
|
)
|
1,595,910
|
|
||||||||||||||||
|
Net income
|
—
|
|
—
|
|
—
|
|
—
|
|
—
|
|
84,643
|
|
—
|
|
—
|
|
—
|
|
84,643
|
|
||||||||||||||||
|
Other comprehensive loss, net of tax
|
—
|
|
—
|
|
—
|
|
—
|
|
—
|
|
—
|
|
3,689
|
|
—
|
|
—
|
|
3,689
|
|
||||||||||||||||
|
Dividends on common stock
|
—
|
|
—
|
|
—
|
|
—
|
|
—
|
|
(9,186
|
)
|
—
|
|
—
|
|
—
|
|
(9,186
|
)
|
||||||||||||||||
|
Employee stock options/other
|
76
|
|
—
|
|
—
|
|
76
|
|
(874
|
)
|
—
|
|
—
|
|
—
|
|
—
|
|
(798
|
)
|
||||||||||||||||
|
Stock awards
|
85
|
|
200
|
|
—
|
|
85
|
|
(2,255
|
)
|
—
|
|
—
|
|
2,170
|
|
—
|
|
—
|
|
||||||||||||||||
|
Stock-based compensation
|
—
|
|
—
|
|
—
|
|
—
|
|
17,143
|
|
—
|
|
—
|
|
—
|
|
—
|
|
17,143
|
|
||||||||||||||||
|
Stock repurchases
|
—
|
|
—
|
|
(40
|
)
|
—
|
|
—
|
|
—
|
|
—
|
|
—
|
|
(567
|
)
|
(567
|
)
|
||||||||||||||||
|
Balance at November 30, 2015
|
115,548
|
|
(10,136
|
)
|
(13,137
|
)
|
115,548
|
|
682,871
|
|
1,466,713
|
|
(17,319
|
)
|
(109,936
|
)
|
(447,043
|
)
|
1,690,834
|
|
||||||||||||||||
|
Net income
|
—
|
|
—
|
|
—
|
|
—
|
|
—
|
|
105,615
|
|
—
|
|
—
|
|
—
|
|
105,615
|
|
||||||||||||||||
|
Other comprehensive income, net of tax
|
—
|
|
—
|
|
—
|
|
—
|
|
—
|
|
—
|
|
1,262
|
|
—
|
|
—
|
|
1,262
|
|
||||||||||||||||
|
Dividends on common stock
|
—
|
|
—
|
|
—
|
|
—
|
|
—
|
|
(8,586
|
)
|
—
|
|
—
|
|
—
|
|
(8,586
|
)
|
||||||||||||||||
|
Employee stock options/other
|
552
|
|
—
|
|
—
|
|
552
|
|
4,977
|
|
—
|
|
—
|
|
—
|
|
—
|
|
5,529
|
|
||||||||||||||||
|
Stock awards
|
124
|
|
704
|
|
—
|
|
124
|
|
(7,760
|
)
|
—
|
|
—
|
|
7,636
|
|
—
|
|
—
|
|
||||||||||||||||
|
Stock-based compensation
|
—
|
|
—
|
|
—
|
|
—
|
|
16,850
|
|
—
|
|
—
|
|
—
|
|
—
|
|
16,850
|
|
||||||||||||||||
|
Stock repurchases
|
—
|
|
—
|
|
(8,583
|
)
|
—
|
|
—
|
|
—
|
|
—
|
|
—
|
|
(88,359
|
)
|
(88,359
|
)
|
||||||||||||||||
|
Balance at November 30, 2016
|
116,224
|
|
(9,432
|
)
|
(21,720
|
)
|
$
|
116,224
|
|
$
|
696,938
|
|
$
|
1,563,742
|
|
$
|
(16,057
|
)
|
$
|
(102,300
|
)
|
$
|
(535,402
|
)
|
$
|
1,723,145
|
|
|||||||||
See accompanying notes.
50
KB HOME
(In Thousands)
|
|
Years Ended November 30,
|
||||||||||
|
|
2016
|
2015
|
2014
|
||||||||
|
Cash flows from operating activities:
|
|||||||||||
|
Net income
|
$
|
105,615
|
|
$
|
84,643
|
|
$
|
918,349
|
|
||
|
Adjustments to reconcile net income to net cash provided by (used in) operating activities:
|
|||||||||||
|
Equity in (income) loss of unconsolidated joint ventures
|
5,601
|
|
(2,488
|
)
|
(1,427
|
)
|
|||||
|
Distributions of earnings from unconsolidated joint ventures
|
—
|
|
—
|
|
364
|
|
|||||
|
Amortization of discounts and issuance costs
|
7,576
|
|
7,738
|
|
7,124
|
|
|||||
|
Depreciation and amortization
|
3,637
|
|
3,411
|
|
2,420
|
|
|||||
|
Deferred income taxes
|
43,211
|
|
43,036
|
|
(825,232
|
)
|
|||||
|
Excess tax benefits from stock-based compensation
|
(186
|
)
|
(157
|
)
|
—
|
|
|||||
|
Stock-based compensation
|
16,850
|
|
17,143
|
|
9,099
|
|
|||||
|
Inventory impairments and land option contract abandonments
|
52,812
|
|
9,591
|
|
39,431
|
|
|||||
|
Changes in assets and liabilities:
|
|||||||||||
|
Receivables
|
18,965
|
|
9,143
|
|
(4,998
|
)
|
|||||
|
Inventories
|
(98,321
|
)
|
34,852
|
|
(780,131
|
)
|
|||||
|
Accounts payable, accrued expenses and other liabilities
|
32,723
|
|
(27,615
|
)
|
9,219
|
|
|||||
|
Other, net
|
172
|
|
1,888
|
|
(4,909
|
)
|
|||||
|
Net cash provided by (used in) operating activities
|
188,655
|
|
181,185
|
|
(630,691
|
)
|
|||||
|
Cash flows from investing activities:
|
|||||||||||
|
Contributions to unconsolidated joint ventures
|
(5,602
|
)
|
(20,626
|
)
|
(49,097
|
)
|
|||||
|
Return of investments in unconsolidated joint ventures
|
4,307
|
|
14,000
|
|
—
|
|
|||||
|
Proceeds from sale of investment in unconsolidated joint venture
|
—
|
|
—
|
|
10,110
|
|
|||||
|
Purchases of property and equipment, net
|
(4,784
|
)
|
(4,677
|
)
|
(5,795
|
)
|
|||||
|
Net cash used in investing activities
|
(6,079
|
)
|
(11,303
|
)
|
(44,782
|
)
|
|||||
|
Cash flows from financing activities:
|
|||||||||||
|
Change in restricted cash
|
9,344
|
|
17,891
|
|
14,671
|
|
|||||
|
Proceeds from issuance of debt
|
—
|
|
250,000
|
|
400,000
|
|
|||||
|
Payment of debt issuance costs
|
—
|
|
(4,561
|
)
|
(5,448
|
)
|
|||||
|
Repayment of senior notes
|
—
|
|
(199,906
|
)
|
—
|
|
|||||
|
Payments on mortgages and land contracts due to land sellers and other loans
|
(67,845
|
)
|
(22,877
|
)
|
(36,918
|
)
|
|||||
|
Proceeds from issuance of common stock, net
|
—
|
|
—
|
|
137,045
|
|
|||||
|
Issuance of common stock under employee stock plans
|
5,343
|
|
740
|
|
1,896
|
|
|||||
|
Excess tax benefits from stock-based compensation
|
186
|
|
157
|
|
—
|
|
|||||
|
Payments of cash dividends
|
(8,586
|
)
|
(9,186
|
)
|
(8,982
|
)
|
|||||
|
Stock repurchases
|
(88,359
|
)
|
(567
|
)
|
(546
|
)
|
|||||
|
Net cash provided by (used in) financing activities
|
(149,917
|
)
|
31,691
|
|
501,718
|
|
|||||
|
Net increase (decrease) in cash and cash equivalents
|
32,659
|
|
201,573
|
|
(173,755
|
)
|
|||||
|
Cash and cash equivalents at beginning of year
|
560,341
|
|
358,768
|
|
532,523
|
|
|||||
|
Cash and cash equivalents at end of year
|
$
|
593,000
|
|
$
|
560,341
|
|
$
|
358,768
|
|
||
See accompanying notes.
51
KB HOME
NOTES TO CONSOLIDATED FINANCIAL STATEMENTS
|
Note 1.
|
Summary of Significant Accounting Policies
|
Operations.
KB Home is a builder of attached and detached single-family residential homes, townhomes and condominiums. As of
November 30, 2016
, we conducted ongoing operations in Arizona, California, Colorado, Florida, Nevada, North Carolina and Texas. We also offer property and casualty insurance and, in certain instances, earthquake, flood and personal property insurance to our homebuyers in the same markets where we build homes, and provide title services in the majority of our markets located within our Central and Southeast homebuilding reporting segments. Until October 2016, we provided mortgage banking services, including mortgage loan originations, to our homebuyers indirectly through HCM, a joint venture of a subsidiary of ours and a subsidiary of Nationstar. HCM is accounted for as an unconsolidated joint venture within our financial services reporting segment.
Basis of Presentation.
Our consolidated financial statements have been prepared in accordance with GAAP and include our accounts and those of the consolidated subsidiaries in which we have a controlling financial interest. All intercompany balances and transactions have been eliminated in consolidation. Investments in unconsolidated joint ventures in which we have less than a controlling financial interest are accounted for using the equity method.
Use of Estimates.
The preparation of financial statements in conformity with GAAP requires management to make estimates and judgments that affect the amounts reported in the consolidated financial statements and accompanying notes. Actual results could differ from those estimates.
Cash and Cash Equivalents and Restricted Cash.
We consider all highly liquid short-term investments purchased with an original maturity of three months or less to be cash equivalents. Our cash equivalents totaled
$396.1 million
at
November 30, 2016
and
$342.3 million
at
November 30, 2015
. At November 30, 2016, the majority of our cash and cash equivalents was invested in interest-bearing bank deposit accounts. At November 30, 2015, the majority of our cash and cash equivalents was invested in money market funds and interest-bearing bank deposit accounts.
Restricted cash at
November 30, 2015
consisted of cash deposited with various financial institutions as required collateral for our LOC Facility.
Receivables.
Receivables are evaluated for collectibility at least quarterly, and allowances for potential losses are established or maintained on applicable receivables when collection is considered doubtful, taking into account historical experience, prevailing economic conditions and other relevant information.
Property and Equipment and Depreciation.
Property and equipment are recorded at cost and are depreciated over their estimated useful lives, which generally range from
two
to
10
years, using the straight-line method. Repair and maintenance costs are expensed as incurred. Property and equipment totaled
$14.2 million
, net of accumulated depreciation of
$18.2 million
, at
November 30, 2016
, and
$13.1 million
, net of accumulated depreciation of
$15.3 million
, at
November 30, 2015
. Depreciation expense totaled
$3.6 million
in
2016
,
$3.4 million
in
2015
and
$2.4 million
in
2014
.
Homebuilding Operations.
Revenues from housing and other real estate sales are recognized
when sales are closed and title passes to the buyer. Sales are closed when all of the following conditions are met: a sale is consummated, a sufficient down payment is received, the earnings process is complete and the collection of any remaining receivables is reasonably assured.
Concurrent with the recognition of revenues in our consolidated statements of operations, sales incentives in the form of price concessions on the selling price of a home are recorded as a reduction of revenues, while the costs of sales incentives in the form of free or discounted products or services to homebuyers, including option upgrades and closing cost allowances used to cover a portion of the fees and costs charged to a homebuyer, are reflected as construction and land costs.
Construction and land costs are comprised of direct and allocated costs, including estimated future costs for the limited warranty we provide on our homes and certain amenities within a community. Land acquisition, land development and other common costs are generally allocated on a relative fair value basis to the homes or lots within the applicable community or land parcel. Land acquisition and land development costs include related interest and real estate taxes.
H
ousing and land inventories are stated at cost, unless the carrying value is determined not to be recoverable, in which case the affected inventories are written down to fair value or fair value less associated costs to sell.
Real estate assets, such as our housing and land inventories, are tested for recoverability whenever events or changes in circumstances indicate that their carrying value may not be recoverable. Recoverability is measured by comparing the carrying value of an asset to the undiscounted future net cash flows expected to be generated by the asset. These impairment evaluations are significantly impacted by estimates for the amounts and timing of future revenues, costs and expenses, and other factors. If the carrying value of a real estate asset is
52
determined not to be recoverable, the impairment charge to be recognized is measured by the amount by which the carrying value of the affected asset exceeds its estimated fair value. For land held for sale, if the fair value less associated costs to sell exceeds the asset’s carrying value, no impairment charge is recognized.
Capitalized Interest.
Interest is capitalized to inventories while the related communities or land are being actively developed and until homes are completed or the land is available for immediate sale. Capitalized interest is amortized to construction and land costs as the related inventories are delivered to homebuyers or land buyers (as applicable). For land held for future development or sale, applicable interest is expensed as incurred.
Fair Value Measurements.
Fair value measurements are used for inventories on a nonrecurring basis when events and circumstances indicate that their carrying value is not recoverable. For these real estate assets, fair value is determined based on the estimated future net cash flows discounted for inherent risk associated with each such asset, or other valuation techniques.
Our financial instruments consist of cash and cash equivalents, restricted cash, senior notes, convertible senior notes, and mortgages and land contracts due to land sellers and other loans. Fair value measurements of financial instruments are determined by various market data and other valuation techniques as appropriate. When available, we use quoted market prices in active markets to determine fair value.
Financial Services Operations.
Our financial services reporting segment generates revenues primarily from insurance commissions and title services. These operations also earned marketing services fees, pursuant to a marketing services agreement with a preferred lender, until July 2014.
Marketing services fees were recognized when earned. Insurance commissions are recognized when policies are issued. Title services revenues are recorded when closing services are rendered and title insurance policies are issued, both of which generally occur at the time each applicable home is closed.
Warranty Costs.
We
provide a limited warranty on all of our homes.
We estimate the costs that may be incurred under each limited warranty and record a liability in the amount of such costs at the time the revenue associated with the sale of each home is recognized.
Our primary assumption in estimating the amounts we accrue for warranty costs is that historical claims experience is a strong indicator of future claims experience. Factors that affect our warranty liability include the number of homes delivered, historical and anticipated rates of warranty claims, and cost per claim. We periodically assess the adequacy of our accrued warranty liability
and adjust the amount as necessary based on our assessment.
Self-Insurance.
We self-insure a portion of our overall risk through the use of a captive insurance subsidiary. We also maintain certain other insurance policies.
We record liabilities based on the estimated costs required to cover reported claims, claims incurred but not yet reported, and claim adjustment expenses. These estimated costs are based on an actuarial analysis of our historical claims and expense data, as well as industry data.
Our self-insurance liabilities are presented on a gross basis without consideration of insurance recoveries and amounts we have paid on behalf of and expect to recover from other parties, if any. Estimates of insurance recoveries and amounts we have paid on behalf of other parties, if any, are recorded as receivables when such recoveries are considered probable.
Advertising Costs.
We expense advertising costs as incurred. We incurred advertising costs of
$32.7 million
in
2016
,
$33.4 million
in
2015
and
$30.2 million
in
2014
.
Legal Fees.
Legal fees associated with litigation and similar proceedings that are not expected to provide a benefit in future periods are generally expensed as incurred. Legal fees associated with land acquisition and development and other activities that are expected to provide a benefit in future periods are capitalized to inventories in our consolidated balance sheets as incurred. We expensed legal fees of
$13.6 million
in
2016
,
$11.7 million
in
2015
and
$10.9 million
in
2014
.
Stock-Based Compensation.
We measure and recognize compensation expense associated with our grant of equity-based awards at an amount equal to the fair value of share-based payments granted under compensation arrangements over the vesting period.
We estimate the fair value of stock options, SARs and Director Plan SARs granted using the Black-Scholes option-pricing model with assumptions based primarily on historical data.
We report the tax benefit resulting from tax deductions in excess of the compensation expense recognized for stock options and SARs in our consolidated statements of cash flows as an operating cash outflow and a financing cash inflow.
Income Taxes.
The provision for, or benefit from, income taxes is calculated using the asset and liability method, under which deferred tax assets and liabilities are recorded based on the difference between the financial statement and tax basis of assets and liabilities using enacted tax rates in effect for the year in which the differences are expected to reverse. Deferred tax assets are evaluated on a quarterly basis to determine if adjustments to the valuation allowance are required. This evaluation is based on the consideration of all available positive and negative evidence using a “more likely than not” standard with respect to whether deferred tax assets will be realized.
The ultimate realization of our deferred tax assets depends primarily on our ability to generate future taxable income during the periods in which the related temporary differences in the financial basis and the tax basis of the
53
assets become deductible.
The value of our deferred tax assets in our consolidated balance sheets depends on applicable income tax rates.
Accumulated Other Comprehensive Loss.
The accumulated balances of other comprehensive loss in the consolidated balance sheets as of
November 30, 2016
and
2015
were comprised solely of adjustments recorded directly to accumulated other comprehensive loss related to our benefit plan obligations. Such adjustments are made annually as of November 30, when our benefit plan obligations are remeasured.
Earnings Per Share.
We compute earnings per share using the two-class method, which is an allocation of earnings between the holders of common stock and a company’s participating security holders. Our outstanding nonvested shares of restricted stock contain non-forfeitable rights to dividends and, therefore, are considered participating securities for purposes of computing earnings per share pursuant to the two-class method. We had no other participating securities at November 30,
2016
,
2015
or
2014
.
Recent Accounting Pronouncements Not Yet Adopted.
In May 2014, the Financial Accounting Standards Board (“FASB”) issued Accounting Standards Update No. 2014-09, “Revenue from Contracts with Customers (Topic 606)” (“ASU 2014-09”). The core principle of ASU 2014-09 is that an entity should recognize revenue to depict the transfer of promised goods or services to customers in an amount that reflects the consideration to which the entity expects to be entitled in exchange for those goods or services. In August 2015, the FASB issued Accounting Standards Update No. 2015-14, “Revenue from Contracts with Customers (Topic 606): Deferral of the Effective Date,” which delayed the effective date of ASU 2014-09 by one year. In 2016, the FASB issued accounting standards updates that amended several aspects of ASU 2014-09. ASU 2014-09, as amended, is effective for us beginning December 1, 2018 (with early adoption permitted beginning in our 2018 fiscal year) and allows for full retrospective or modified retrospective methods of adoption. We are currently evaluating the potential impact of adopting this guidance on our consolidated financial statements, as well as the method we will use to adopt the new guidance, and have been involved in industry-specific discussions with the FASB on the treatment of certain items. We do not believe the adoption of ASU 2014-09 will have a material impact on the amount or timing of our homebuilding revenues.
In February 2016, the FASB issued Accounting Standards Update No. 2016-02, “Leases (Topic 842)” (“ASU 2016-02”). ASU 2016-02 will require lessees to recognize on the balance sheet the assets and liabilities for the rights and obligations created by those leases. Under ASU 2016-02, a lessee will be required to recognize assets and liabilities for leases with terms of more than 12 months. Lessor accounting remains substantially similar to current GAAP. In addition, disclosures of leasing activities are to be expanded to include qualitative along with specific quantitative information. ASU 2016-02 will be effective for us beginning December 1, 2019 (with early adoption permitted). ASU 2016-02 mandates a modified retrospective transition method. We are currently evaluating the potential impact of adopting this guidance on our consolidated financial statements.
In March 2016, the FASB issued Accounting Standards Update No. 2016-09, “Compensation — Stock Compensation (Topic 718): Improvements to Employee Share-Based Payment Accounting” (“ASU 2016-09”). ASU 2016-09 simplifies several aspects of the accounting for share-based payment transactions, including the income tax consequences, classification of awards as either equity or liabilities, and classification on the statement of cash flows. ASU 2016-09 will be effective for us beginning December 1, 2017 (with early adoption permitted). We are currently evaluating the potential impact of adopting this guidance on our consolidated financial statements.
In August 2016, the FASB issued Accounting Standards Update No. 2016-15, “Statement of Cash Flows (Topic 230): Classification of Certain Cash Receipts and Cash Payments” (“ASU 2016-15”). ASU 2016-15 provides guidance on how certain cash receipts and cash payments are to be presented and classified in the statement of cash flows. ASU 2016-15 will be effective for us beginning December 1, 2018 (with early adoption permitted). We are currently evaluating the potential impact of adopting this guidance on our consolidated financial statements.
In November 2016, the FASB issued Accounting Standards Update No. 2016-18, “Statement of Cash Flows (Topic 230): Restricted Cash” (“ASU 2016-18”). ASU 2016-18 requires that a statement of cash flows explain the change during the period in the total of cash, cash equivalents, and amounts generally described as restricted cash or restricted cash equivalents. Therefore, amounts generally described as restricted cash and restricted cash equivalents should be included with cash and cash equivalents when reconciling the beginning-of-period and end-of-period total amounts shown on the statement of cash flows. ASU 2016-18 will be effective for us beginning December 1, 2018 (with early adoption permitted) and will be applied using a retrospective transition method to each period presented. We are currently evaluating the potential impact of adopting this guidance on our consolidated financial statements.
Adoption of New Accounting Pronouncement.
In April 2015, the FASB issued Accounting Standards Update No. 2015-03, “Interest — Imputation of Interest (Subtopic 835-30): Simplifying the Presentation of Debt Issuance Costs”
(“ASU 2015-03”). ASU 2015-03 requires that debt issuance costs related to a recognized debt liability be presented in the balance sheet as a direct deduction from the carrying amount of that debt liability, consistent with debt discounts. ASU 2015-03 is to be applied on a retrospective basis and represents a change in accounting principle. In August 2015, the FASB issued Accounting Standards Update
54
No. 2015-15, “Interest — Imputation of Interest (Subtopic 835-30): Presentation and Subsequent Measurement of Debt Issuance Costs Associated with Line-of-Credit Arrangements — Amendments to SEC Paragraphs Pursuant to Staff Announcement at June 18, 2015 EITF Meeting”
(“ASU 2015-15”), which clarifies the treatment of debt issuance costs from line-of-credit arrangements after the adoption of ASU 2015-03. In particular, ASU 2015-15 clarifies that the SEC staff would not object to an entity deferring and presenting debt issuance costs related to a line-of-credit arrangement as an asset and subsequently amortizing the deferred debt issuance costs ratably over the term of such arrangement, regardless of whether there are any outstanding borrowings on the line-of-credit arrangement. We elected to early adopt ASU 2015-03 effective November 30, 2016. The adoption of ASU 2015-03 resulted in the reclassification of unamortized debt issuance costs related to senior notes from other assets to notes payable in our consolidated balance sheets in the amount of
$18.3 million
at November 30, 2016 and
$23.8 million
at November 30, 2015. As permitted by ASU 2015-15, we elected not to reclassify unamortized debt issuance costs associated with our Credit Facility and continue to present such capitalized costs in other assets.
Reclassifications.
Certain amounts in our consolidated financial statements of prior years have been reclassified to conform to the current period presentation.
|
Note 2.
|
Segment Information
|
We have identified
five
operating reporting segments, comprised of
four
homebuilding reporting segments and
one
financial services reporting segment. As of
November 30, 2016
, our homebuilding reporting segments conducted ongoing operations in the following states:
West Coast: California
Southwest: Arizona and Nevada
Central: Colorado and Texas
Southeast: Florida and North Carolina
Our homebuilding reporting segments are engaged in the acquisition and development of land primarily for residential purposes and offer a wide variety of homes that are designed to appeal to first-time, move-up and active adult homebuyers. Our homebuilding operations generate most of their revenues from the delivery of completed homes to homebuyers. They also earn revenues from the sale of land.
Our homebuilding reporting segments were identified based primarily on similarities in economic and geographic characteristics, product types, regulatory environments, methods used to sell and construct homes and land acquisition characteristics. Management evaluates segment performance primarily based on segment pretax results.
In the 2016 second quarter, we announced that we had begun a transition out of the Metro Washington, D.C. market that is expected to be completed in 2017. Our operations in the Metro Washington, D.C. market consisted of communities in Maryland and Virginia, which are included in our Southeast homebuilding reporting segment, and represented
2%
of our consolidated homebuilding revenues for the year ended November 30, 2016. We are constructing and delivering homes in our remaining communities in this market. We also have other land interests in this market that we intend to build out or sell. As described in Note 7 – Inventory Impairments and Land Option Contract Abandonments, we recorded inventory impairment and land option contract abandonment charges related to this transition during the year ended November 30, 2016.
Our financial services reporting segment offers property and casualty insurance and, in certain instances, earthquake, flood and personal property insurance to our homebuyers in the same markets as our homebuilding reporting segments, and provides title services in the majority of our markets located within our Central and Southeast homebuilding reporting segments. This segment earns revenues primarily from insurance commissions and the provision of title services. Prior to July 2014, this segment also earned revenues pursuant to the terms of a marketing services agreement with Nationstar, under which Nationstar was our preferred mortgage lender and offered mortgage banking services, including mortgage loan originations, to our homebuyers who elected to use the lender. From July 2014 until October 2016, we provided mortgage banking services, including mortgage loan originations, to our homebuyers indirectly through HCM, a joint venture of a subsidiary of ours and a subsidiary of Nationstar. Through these respective subsidiaries, we have a
49.9%
ownership interest and Nationstar has a
50.1%
ownership interest in HCM, with Nationstar providing management oversight of HCM’s operations. In the 2016 fourth quarter, we and Nationstar began the process to wind down HCM and transfer HCM’s operations and certain assets to Stearns Lending. Our homebuyers may select any lender of their choice to obtain mortgage financing for the purchase of their home.
In the 2016 fourth quarter, a subsidiary of ours and a subsidiary of Stearns Lending entered into an agreement to form a mortgage banking joint venture in which we each have a
50.0%
ownership interest. The unconsolidated joint venture, which had no impact on our consolidated statement of operations for the year ended November 30, 2016, is expected to begin offering services, including mortgage loan originations, to our homebuyers in most of our served markets by the end of our 2017 second quarter,
55
subject to obtaining all requisite regulatory approvals and clearances.
Our financial services reporting segment is separately reported in our consolidated financial statements.
Corporate and other is a non-operating segment that develops and oversees the implementation of company-wide strategic initiatives and provides support to our reporting segments by centralizing certain administrative functions.
Corporate management is responsible for, among other things, evaluating and selecting the geographic markets in which we operate, consistent with our overall business strategy; allocating capital resources to markets for land acquisition and development activities; making major personnel decisions related to employee compensation and benefits; and monitoring the financial and operational performance of our divisions.
Corporate and other includes general and administrative expenses related to operating our corporate headquarters. A portion of the expenses incurred by Corporate and other is allocated to our homebuilding reporting segments.
Our segments follow the same accounting policies used for our consolidated financial statements as described in Note 1 – Summary of Significant Accounting Policies. The results of each segment are not necessarily indicative of the results that would have occurred had the segment been an independent, stand-alone entity during the periods presented, nor are they indicative of the results to be expected in future periods.
The following tables present financial information relating to our homebuilding reporting segments (in thousands):
|
|
Years Ended November 30,
|
||||||||||
|
|
2016
|
2015
|
2014
|
||||||||
|
Revenues:
|
|||||||||||
|
West Coast
|
$
|
1,638,078
|
|
$
|
1,402,264
|
|
$
|
1,089,857
|
|
||
|
Southwest
|
447,473
|
|
398,242
|
|
199,504
|
|
|||||
|
Central
|
1,018,535
|
|
809,738
|
|
698,429
|
|
|||||
|
Southeast
|
478,857
|
|
410,743
|
|
401,853
|
|
|||||
|
Total
|
$
|
3,582,943
|
|
$
|
3,020,987
|
|
$
|
2,389,643
|
|
||
|
Pretax income (loss):
|
|||||||||||
|
West Coast
|
$
|
148,014
|
|
$
|
127,946
|
|
$
|
116,325
|
|
||
|
Southwest
|
38,807
|
|
31,718
|
|
6,015
|
|
|||||
|
Central
|
85,924
|
|
70,959
|
|
47,214
|
|
|||||
|
Southeast
|
(29,385
|
)
|
(22,758
|
)
|
(11,158
|
)
|
|||||
|
Corporate and other
|
(98,511
|
)
|
(92,446
|
)
|
(71,993
|
)
|
|||||
|
Total
|
$
|
144,849
|
|
$
|
115,419
|
|
$
|
86,403
|
|
||
|
Equity in income (loss) of unconsolidated joint ventures:
|
|||||||||||
|
West Coast
|
$
|
(1,561
|
)
|
$
|
(1,106
|
)
|
$
|
(374
|
)
|
||
|
Southwest
|
(618
|
)
|
(696
|
)
|
(2,176
|
)
|
|||||
|
Central
|
—
|
|
—
|
|
—
|
|
|||||
|
Southeast
|
(2
|
)
|
(2
|
)
|
3,291
|
|
|||||
|
Total
|
$
|
(2,181
|
)
|
$
|
(1,804
|
)
|
$
|
741
|
|
||
|
Inventory impairment charges:
|
|||||||||||
|
West Coast
|
$
|
8,209
|
|
$
|
645
|
|
$
|
27,285
|
|
||
|
Southwest
|
3,191
|
|
3,253
|
|
6,392
|
|
|||||
|
Central
|
10,633
|
|
—
|
|
—
|
|
|||||
|
Southeast
|
27,547
|
|
4,132
|
|
3,951
|
|
|||||
|
Total
|
$
|
49,580
|
|
$
|
8,030
|
|
$
|
37,628
|
|
||
56
|
Years Ended November 30,
|
|||||||||||
|
2016
|
2015
|
2014
|
|||||||||
|
Land option contract abandonments:
|
|||||||||||
|
West Coast
|
$
|
769
|
|
$
|
352
|
|
$
|
554
|
|
||
|
Southwest
|
253
|
|
—
|
|
—
|
|
|||||
|
Central
|
460
|
|
225
|
|
995
|
|
|||||
|
Southeast
|
1,750
|
|
984
|
|
254
|
|
|||||
|
Total
|
$
|
3,232
|
|
$
|
1,561
|
|
$
|
1,803
|
|
||
|
|
November 30,
|
||||||
|
|
2016
|
2015
|
|||||
|
Inventories:
|
|||||||
|
Homes under construction
|
|||||||
|
West Coast
|
$
|
695,742
|
|
$
|
535,795
|
|
|
|
Southwest
|
130,886
|
|
112,032
|
|
|||
|
Central
|
297,290
|
|
263,345
|
|
|||
|
Southeast
|
122,020
|
|
120,184
|
|
|||
|
Subtotal
|
1,245,938
|
|
1,031,356
|
|
|||
|
Land under development
|
|||||||
|
West Coast
|
820,088
|
|
788,607
|
|
|||
|
Southwest
|
268,507
|
|
317,331
|
|
|||
|
Central
|
456,508
|
|
421,783
|
|
|||
|
Southeast
|
182,554
|
|
238,324
|
|
|||
|
Subtotal
|
1,727,657
|
|
1,766,045
|
|
|||
|
Land held for future development or sale
|
|||||||
|
West Coast
|
210,910
|
|
277,954
|
|
|||
|
Southwest
|
122,927
|
|
104,677
|
|
|||
|
Central
|
15,439
|
|
22,082
|
|
|||
|
Southeast
|
80,357
|
|
111,633
|
|
|||
|
Subtotal
|
429,633
|
|
516,346
|
|
|||
|
Total
|
$
|
3,403,228
|
|
$
|
3,313,747
|
|
|
|
Investments in unconsolidated joint ventures:
|
|||||||
|
West Coast
|
$
|
51,612
|
|
$
|
54,360
|
|
|
|
Southwest
|
9,905
|
|
14,697
|
|
|||
|
Central
|
—
|
|
—
|
|
|||
|
Southeast
|
2,499
|
|
2,501
|
|
|||
|
Total
|
$
|
64,016
|
|
$
|
71,558
|
|
|
|
Assets:
|
|||||||
|
West Coast
|
$
|
1,847,279
|
|
$
|
1,740,299
|
|
|
|
Southwest
|
564,636
|
|
582,030
|
|
|||
|
Central
|
909,497
|
|
829,811
|
|
|||
|
Southeast
|
414,730
|
|
507,844
|
|
|||
|
Corporate and other
|
1,384,983
|
|
1,412,893
|
|
|||
|
Total
|
$
|
5,121,125
|
|
$
|
5,072,877
|
|
|
57
|
Note 3.
|
Financial Services
|
The following tables present financial information relating to our financial services reporting segment (in thousands):
|
|
Years Ended November 30,
|
||||||||||
|
|
2016
|
2015
|
2014
|
||||||||
|
Revenues
|
|||||||||||
|
Insurance commissions
|
$
|
6,728
|
|
$
|
7,137
|
|
$
|
6,566
|
|
||
|
Title services
|
4,975
|
|
3,905
|
|
3,593
|
|
|||||
|
Marketing services fees
|
—
|
|
—
|
|
1,147
|
|
|||||
|
Interest income
|
—
|
|
1
|
|
—
|
|
|||||
|
Total
|
11,703
|
|
11,043
|
|
11,306
|
|
|||||
|
Expenses
|
|||||||||||
|
General and administrative
|
(3,817
|
)
|
(3,711
|
)
|
(3,446
|
)
|
|||||
|
Operating income
|
7,886
|
|
7,332
|
|
7,860
|
|
|||||
|
Equity in income (loss) of unconsolidated joint ventures
|
(3,420
|
)
|
4,292
|
|
686
|
|
|||||
|
Pretax income
|
$
|
4,466
|
|
$
|
11,624
|
|
$
|
8,546
|
|
||
|
|
November 30,
|
||||||
|
|
2016
|
2015
|
|||||
|
Assets
|
|||||||
|
Cash and cash equivalents
|
$
|
914
|
|
$
|
1,299
|
|
|
|
Receivables
|
1,764
|
|
2,245
|
|
|||
|
Investments in unconsolidated joint ventures
|
7,771
|
|
10,440
|
|
|||
|
Other assets
|
50
|
|
44
|
|
|||
|
Total assets
|
$
|
10,499
|
|
$
|
14,028
|
|
|
|
Liabilities
|
|||||||
|
Accounts payable and accrued expenses
|
$
|
2,003
|
|
$
|
1,817
|
|
|
|
Total liabilities
|
$
|
2,003
|
|
$
|
1,817
|
|
|
The equity in loss of unconsolidated joint ventures in 2016 reflected fewer loan originations and higher overhead costs as well as the wind down of HCM, and included an increase in HCM’s reserves for potential future losses on certain loans it originated. While we believe we will not need to record any additional charges, it is reasonably possible that we may incur further losses with respect to our equity interest in future periods as the wind down of HCM is completed. Although we are currently unable to estimate the amount or range of such losses, if any, we believe they would not have a material impact on our consolidated financial statements.
Although KB HOME Mortgage Company, which is 100% owned by us, ceased originating and selling mortgage loans in September 2005, it may be required to repurchase, or provide indemnification with respect to, an individual loan that it funded on or before August 31, 2005 and sold to an investor if the representations or warranties that it made in connection with the sale of the loan are breached, in the event of an early payment default, if the loan does not comply with the underwriting standards or other requirements of the ultimate investor or an applicable insurer, or due to a delinquency or other matters arising in connection with the loan. KB HOME Mortgage Company was not required to repurchase any loans in the past few years.
58
|
Note 4.
|
Earnings Per Share
|
Basic and diluted earnings per share were calculated as follows (in thousands, except per share amounts):
|
|
Years Ended November 30,
|
||||||||||
|
|
2016
|
2015
|
2014
|
||||||||
|
Numerator:
|
|||||||||||
|
Net income
|
$
|
105,615
|
|
$
|
84,643
|
|
$
|
918,349
|
|
||
|
Less: Distributed earnings allocated to nonvested restricted stock
|
(45
|
)
|
(33
|
)
|
(26
|
)
|
|||||
|
Less: Undistributed earnings allocated to nonvested restricted stock
|
(508
|
)
|
(273
|
)
|
(2,667
|
)
|
|||||
|
Numerator for basic earnings per share
|
105,062
|
|
84,337
|
|
915,656
|
|
|||||
|
Effect of dilutive securities:
|
|||||||||||
|
Interest expense and amortization of debt issuance costs associated with convertible senior notes, net of taxes
|
2,667
|
|
2,667
|
|
2,667
|
|
|||||
|
Add: Undistributed earnings allocated to nonvested restricted stock
|
508
|
|
273
|
|
2,667
|
|
|||||
|
Less: Undistributed earnings reallocated to nonvested restricted stock
|
(453
|
)
|
(244
|
)
|
(2,398
|
)
|
|||||
|
Numerator for diluted earnings per share
|
$
|
107,784
|
|
$
|
87,033
|
|
$
|
918,592
|
|
||
|
Denominator:
|
|||||||||||
|
Weighted average shares outstanding — basic
|
85,706
|
|
92,054
|
|
89,265
|
|
|||||
|
Effect of dilutive securities:
|
|||||||||||
|
Share-based payments
|
2,170
|
|
2,401
|
|
1,647
|
|
|||||
|
Convertible senior notes
|
8,402
|
|
8,402
|
|
8,402
|
|
|||||
|
Weighted average shares outstanding — diluted
|
96,278
|
|
102,857
|
|
99,314
|
|
|||||
|
Basic earnings per share
|
$
|
1.23
|
|
$
|
.92
|
|
$
|
10.26
|
|
||
|
Diluted earnings per share
|
$
|
1.12
|
|
$
|
.85
|
|
$
|
9.25
|
|
||
As discussed in Note 13 – Notes Payable, in 2013, we issued the
1.375%
Convertible Senior Notes due 2019 that, from issuance, have been convertible into shares of our common stock at a conversion rate of
36.5297
shares for each $1,000 principal amount of the notes. Outstanding stock options to purchase
7.3 million
,
8.0 million
and
5.2 million
shares of common stock were excluded from the diluted earnings per share calculations for
2016
,
2015
and
2014
, respectively, because the effect of their inclusion would be antidilutive. Contingently issuable shares associated with outstanding PSUs were not included in the basic earnings per share calculations for the periods presented, as the applicable vesting conditions had not been satisfied.
|
Note 5.
|
Receivables
|
Receivables consisted of the following (in thousands):
|
|
November 30,
|
||||||
|
|
2016
|
2015
|
|||||
|
Due from utility companies, improvement districts and municipalities (a)
|
$
|
102,780
|
|
$
|
92,082
|
|
|
|
Recoveries related to self-insurance claims (b)
|
84,476
|
|
95,316
|
|
|||
|
Recoveries related to warranty and other claims (b)
|
14,609
|
|
23,836
|
|
|||
|
Refundable deposits and bonds
|
13,665
|
|
12,355
|
|
|||
|
Other
|
28,745
|
|
36,626
|
|
|||
|
Subtotal
|
244,275
|
|
260,215
|
|
|||
|
Allowance for doubtful accounts
|
(12,610
|
)
|
(12,217
|
)
|
|||
|
Total
|
$
|
231,665
|
|
$
|
247,998
|
|
|
59
|
(a)
|
These receivables typically relate to infrastructure improvements we make with respect to our communities. We are generally reimbursed for the cost of such improvements when they are accepted by the utility company, improvement district or municipality, or after certain events occur, depending on the terms of the applicable agreements. These events may include, but are not limited to, the connection of utilities or the issuance of bonds by the respective improvement districts or municipalities.
|
|
(b)
|
As described in Note 15 – Commitments and Contingencies, in 2016, we reclassified estimated probable insurance and other recoveries from our self-insurance liability to receivables for all years presented.
|
|
Note 6.
|
Inventories
|
Inventories consisted of the following (in thousands):
|
|
November 30,
|
||||||
|
|
2016
|
2015
|
|||||
|
Homes under construction
|
$
|
1,245,938
|
|
$
|
1,031,356
|
|
|
|
Land under development
|
1,727,657
|
|
1,766,045
|
|
|||
|
Land held for future development or sale (a)
|
429,633
|
|
516,346
|
|
|||
|
Total
|
$
|
3,403,228
|
|
$
|
3,313,747
|
|
|
|
(a)
|
Land held for sale totaled
$63.4 million
at November 30, 2016 and
$5.7 million
at November 30, 2015.
|
Homes under construction is comprised of costs associated with homes in various stages of construction and includes direct construction and related land acquisition and land development costs. Land under development primarily consists of land acquisition and land development costs. Land development costs also include capitalized interest and real estate taxes. When home construction begins, the associated land acquisition and land development costs are included in homes under construction. Land held for future development principally reflects land acquisition and land development costs related to land where development activity has been suspended or has not yet begun but is expected to occur in the future. These assets held for future development are located in various submarkets where conditions do not presently support further investment or development, or are subject to a building permit moratorium or regulatory restrictions, or are portions of larger land parcels that we plan to build out over several years and/or that have not yet been entitled. We may also suspend development activity if we believe it will result in greater returns and/or maximize the economic performance of a particular community by delaying improvements for a period of time to, for instance, allow earlier phases of a long-term, multi-phase community or a neighboring community to generate or extend sales momentum or for market conditions to improve. In some instances, we may activate or resume development activity for such inventory to accelerate sales and/or our return on investment. We have activated assets previously held for future development in certain markets as part of our strategic growth initiatives in 2016 and 2015. Land is generally considered held for sale when management commits to a plan to sell the land; the land is available for immediate sale in its present condition; an active program to locate a buyer and other actions required to complete the plan to sell have been initiated; the sale of the land is expected to be completed within one year; the land is being actively marketed for sale at a price that is reasonable in relation to its current fair value; and it is unlikely that the plan to sell will be withdrawn or that significant changes to the plan will be made. Interest and real estate taxes are not capitalized on land held for future development or sale.
In the 2016 fourth quarter, we changed our strategy related to certain land parcels that were either held for future development or under development and decided to monetize these assets through land sales, rather than build and sell homes on these parcels as previously intended. These parcels, which were classified as land held for sale at November 30, 2016, included land in excess of our near-term requirements; land where we now believe the necessary incremental investment in development is not justified; land located in areas outside of our served markets; and/or land entitled for certain product types that are not aligned with our primary product offerings. The majority of these land parcels are located in our Southeast homebuilding reporting segment. As discussed in Note 7 – Inventory Impairments and Land Option Contract Abandonments, we recognized inventory impairment charges to reduce the carrying values of these land parcels to their estimated fair values, less associated costs to sell.
Our interest costs were as follows (in thousands):
60
|
|
Years Ended November 30,
|
||||||||||
|
|
2016
|
2015
|
2014
|
||||||||
|
Capitalized interest at beginning of year
|
$
|
288,442
|
|
$
|
266,668
|
|
$
|
216,681
|
|
||
|
Interest incurred
|
185,466
|
|
186,885
|
|
171,541
|
|
|||||
|
Interest expensed
|
(5,900
|
)
|
(21,856
|
)
|
(30,750
|
)
|
|||||
|
Interest amortized to construction and land costs (a)
|
(161,285
|
)
|
(143,255
|
)
|
(90,804
|
)
|
|||||
|
Capitalized interest at end of year (b)
|
$
|
306,723
|
|
$
|
288,442
|
|
$
|
266,668
|
|
||
|
(a)
|
Interest amortized to construction and land costs for the years ended November 30, 2016 and 2015 included
$.7 million
and
$16.4 million
, respectively, related to land sales during the periods.
|
|
(b)
|
Capitalized interest amounts presented in the table reflect the gross amount of capitalized interest, as inventory impairment charges recognized, if any, are not generally allocated to specific components of inventory.
|
|
Note 7.
|
Inventory Impairments and Land Option Contract Abandonments
|
E
ach community or land parcel in our owned inventory is assessed to determine if indicators of potential impairment exist. Impairment indicators are assessed separately for each community or land parcel on a quarterly basis and include, but are not limited to, the following: significant decreases in net orders, average selling prices, volume of homes delivered, gross profit margins on homes delivered or projected gross profit margins on homes in backlog or future deliveries; significant increases in budgeted land development and home construction costs or cancellation rates; or projected losses on expected future land sales. If indicators of potential impairment exist for a community or land parcel, the identified asset is evaluated for recoverability.
We evaluated
68
,
35
and
32
communities or land parcels for recoverability during the years ended
November 30, 2016
,
2015
and
2014
, respectively. The carrying value of those communities or land parcels evaluated was
$423.1 million
,
$286.3 million
and
$266.9 million
during the years ended
November 30, 2016
,
2015
and
2014
, respectively.
The year-over-year increase in the number and carrying value of communities evaluated for impairment in 2016 reflected our decisions to make changes in our operational strategies for specific communities or land parcels aimed at more quickly monetizing our investment in those inventories, as discussed further
below. As impairment indicators are assessed on a quarterly basis, some of the communities or land parcels evaluated during these years were evaluated in more than one quarterly period.
Communities or land parcels evaluated for recoverability in more than one quarterly period are counted only once for each applicable year.
In some cases, we have recognized inventory impairment charges for particular communities or land parcels in multiple years. Inventory impairment charges are included in construction and land costs in our consolidated statements of operations.
When an indicator of potential impairment is identified for a community or land parcel, we test the asset for recoverability by comparing the carrying value of the asset to the undiscounted future net cash flows expected to be generated by the asset. The undiscounted future net cash flows are impacted by then-current conditions and trends in the market in which the asset is located as well as factors known to us at the time the cash flows are calculated. These factors may include recent trends in our orders, backlog, cancellation rates and volume of homes delivered, as well as our expectations related to the following: product offerings; market supply and demand, including estimated average selling prices and related price appreciation; and land development, home construction and overhead costs to be incurred and related cost inflation.
With respect to the years ended
November 30, 2016
and
2015
, these expectations reflected our experience that, notwithstanding fluctuations in our company-wide net orders, backlog levels, homes delivered and housing gross profit margin, on a year-over-year basis, conditions in the markets where assessed assets were located have been generally stable or improved, with no significant deterioration identified or projected, as to revenue and cost drivers that would prevent or otherwise impact recoverability. Based on this experience, and taking into account the generally healthy conditions in many of our served markets for new home sales, excluding the Metro Washington, D.C. market, where we began a wind down of our operations in 2016, our inventory assessments as of November 30, 2016 considered an expected steady overall sales pace and average selling price performance for 2017 and beyond relative to the pace and performance in recent quarters.
Given the inherent challenges and uncertainties in forecasting future results, our inventory assessments at the time they are made take into consideration whether a community or land parcel is active, meaning whether it is open for sales and/or undergoing development, or whether it is being held for future development or held for sale. Due to the short-term nature of active communities and land held for sale, as compared to land held for future development, our inventory assessments generally assume the continuation of then-current market conditions, subject to identifying information suggesting significant sustained changes in such conditions. Our assessments of active communities, at the time made, generally anticipate net orders, average selling prices, volume of homes delivered and costs for land development and home construction to continue at or near then-current levels through the particular asset’s estimated remaining life. Inventory assessments for our land held for future development consider then-current market
61
conditions as well as subjective forecasts regarding the timing and costs of land development and home construction and related cost inflation; the product(s) to be offered; and the net orders, volume of homes delivered, and selling prices and related price appreciation of the offered product(s) when an associated community is anticipated to open for sales. We evaluate various factors to develop these forecasts, including the availability of and demand for homes and finished lots within the relevant marketplace; historical, current and expected future sales trends for the marketplace; and third-party data, if available. The estimates, expectations and assumptions used in each of our inventory assessments are specific to each community or land parcel based on what we believe are reasonable forecasts for their particular performance, and may vary among communities or land parcels and may vary over time.
We record an inventory impairment charge on a community or land parcel that is active or held for future development when its carrying value is greater than the undiscounted future net cash flows the asset is expected to generate. These real estate assets are written down to fair value, which is primarily determined based on the estimated future net cash flows discounted for inherent risk associated with each such asset, or other valuation techniques.
Inputs used in our calculation of estimated discounted future net cash flows are specific to each affected real estate asset and are based on our expectations for each such asset as of the applicable measurement date, including, among others, expectations related to average selling prices and volume of homes delivered.
The discount rates we used were impacted by one or more of the following at the time the calculation was made: the risk-free rate of return; expected risk premium based on estimated land development, home construction and delivery timelines; market risk from potential future price erosion; cost uncertainty due to land development or home construction cost increases; and other risks specific to the asset or conditions in the market in which the asset is located.
We record an inventory impairment charge on land held for sale when the carrying value of a land parcel is greater than its fair value. These real estate assets are written down to fair value, less associated costs to sell. The estimated fair values of such assets are generally based on bona fide letters of intent from outside parties, executed sales contracts, broker quotes or similar information.
The following table summarizes ranges for significant quantitative unobservable inputs we utilized in our fair value measurements with respect to impaired communities, other than land held for sale, written down to fair value during the years presented:
|
Years Ended November 30,
|
||||||
|
Unobservable Input (a)
|
2016
|
2015
|
2014
|
|||
|
Average selling price
|
$216,200 - $977,400
|
$178,100 - $509,400
|
$216,100 - $316,800
|
|||
|
Deliveries per month
|
1 - 4
|
2 - 4
|
1 - 4
|
|||
|
Discount rate
|
17% - 20%
|
17% - 20%
|
17% - 19%
|
|||
|
(a)
|
The ranges of inputs used in each period primarily reflect differences between the housing markets where each of the impacted communities are located, rather than fluctuations in prevailing market conditions.
|
Based on the results of our evaluations, we recognized inventory impairment charges of
$49.6 million
in 2016 related to
30
communities or land parcels with a post-impairment fair value of
$39.5 million
that reflected our decisions to make changes in our operational strategies for specific communities or land parcels aimed at more quickly monetizing our investment in those inventories. Of these inventory impairment charges,
$36.7 million
related to certain land previously held for future development that we decided in the 2016 fourth quarter to monetize through land sales as discussed in Note 6 – Inventories; land that we are planning to sell in connection with the wind down of our Metro Washington, D.C. operations; and the sales of our last remaining land parcels in the Rio Grande Valley area of Texas, which closed in the 2016 second quarter. The remaining
$12.9 million
of inventory impairment charges reflected our decision to activate and thereby accelerate the overall timing for selling, building and delivering homes in certain of our California, Arizona and Florida communities that were previously held for future development, and to accelerate the overall pace for selling, building and delivering homes, primarily through lowering selling prices, at other communities in California and Metro Washington, D.C. If we change our strategy for any given asset, it is possible that we may recognize additional inventory impairment charges in the future.
In 2015, we recognized inventory impairment charges of
$8.0 million
related to
four
communities with a post-impairment fair value of
$12.0 million
. We decided to change our operational strategy for these communities in order to monetize our investment more quickly primarily through lowering home selling prices or by accelerating the overall timing and pace for selling, building and delivering homes on land that had been held for future development. In 2014, we recognized inventory impairment charges of
$37.6 million
associated with
eight
communities or land parcels with a post-impairment fair value of
$30.6 million
. Of these charges,
$26.6 million
related to
two
properties, located in inland southern California and Atlanta, Georgia, where we decided to change our strategy and monetize our investment through land sales rather than build and sell homes on the parcels as previously intended. The remaining
$11.0 million
related to
six
communities primarily located in inland California and Arizona, reflecting
62
decisions we made to monetize our investment in these land positions sooner by accelerating the overall timing and pace for selling, building and delivering homes on land that had been held for future development, and/or then-softening conditions in the relevant submarkets.
As of
November 30, 2016
, the aggregate carrying value of our inventory that had been impacted by inventory impairment charges was
$215.3 million
, representing
28
communities and various other land parcels. As of
November 30, 2015
, the aggregate carrying value of our inventory that had been impacted by inventory impairment charges was
$254.2 million
, representing
28
communities and various other land parcels.
Our inventory controlled under land option contracts and other similar contracts is assessed to determine whether it continues to meet our investment return standards. Assessments are made separately for each optioned land parcel on a quarterly basis and are affected by the following factors relative to the market in which the asset is located, among others: current and/or anticipated net orders, average selling prices and volume of homes delivered; estimated land development and home construction costs; and projected profitability on expected future housing or land sales. When a decision is made not to exercise certain land option contracts and other similar contracts due to market conditions and/or changes in our marketing strategy, we write off the related inventory costs, including non-refundable deposits and unrecoverable pre-acquisition costs.
Based on the results of our assessments, we recognized land option contract abandonment charges of
$3.2 million
corresponding to
744
lots in 2016,
$1.6 million
corresponding to
1,166
lots in 2015 and
$1.8 million
corresponding to
1,306
lots in 2014. Of the land option contract abandonment charges recognized for 2016,
$1.4 million
related to the wind down of our Metro Washington, D.C. operations. Land option contract abandonment charges are included in construction and land costs in our consolidated statements of operations.
The estimated remaining life of each community or land parcel in our inventory depends on various factors, such as the total number of lots remaining; the expected timeline to acquire and entitle land and develop lots to build homes; the anticipated future net order and cancellation rates; and the expected timeline to build and deliver homes sold. While it is difficult to determine a precise timeframe for any particular inventory asset, based on current market conditions and expected delivery timelines, we estimate our inventory assets’ remaining operating lives to range generally from
one
year to in excess of
10
years,
and expect to realize, on an overall basis, the majority of our inventory balance as of November 30, 2016 within
five
years.
Due to the judgment and assumptions applied in our inventory impairment and land option contract abandonment assessment processes, and in our estimations of the remaining operating lives of our inventory assets and the realization of our inventory balances, particularly as to land held for future development, it is possible that actual results could differ substantially from those estimated.
|
Note 8.
|
Variable Interest Entities
|
Unconsolidated Joint Ventures.
We participate in joint ventures from time to time that conduct land acquisition, land development and/or other homebuilding activities in various markets where our homebuilding operations are located. Our investments in these joint ventures may create a variable interest in a VIE, depending on the contractual terms of the arrangement. We analyze our joint ventures under the variable interest model to determine whether they are VIEs and, if so, whether we are the primary beneficiary. Based on our analysis, we determined that
one
of our joint ventures at
November 30, 2016
was a VIE, but we were not the primary beneficiary of the VIE. At
November 30, 2015
, we determined that
none
of our joint ventures were VIEs. All of our joint ventures at
November 30, 2016
and
2015
were unconsolidated and accounted for under the equity method because we did not have a controlling financial interest.
Land Option Contracts and Other Similar Contracts.
In the ordinary course of our business, we enter into land option contracts and other similar contracts with third parties and unconsolidated entities to acquire rights to land for the construction of homes. The use of these contracts generally allows us to reduce the market risks associated with direct land ownership and development, and reduce our capital and financial commitments, including interest and other carrying costs. Under these contracts, we typically make a specified option payment or earnest money deposit in consideration for the right to purchase land in the future, usually at a predetermined price.
We analyze each of our land option contracts and other similar contracts to determine whether the land seller is a VIE and, if so, whether we are the primary beneficiary. Although we do not have legal title to the underlying land, we are required to consolidate a VIE if we are the primary beneficiary. In determining whether we are the primary beneficiary, we consider, among other things, whether we have the power to direct the activities of the VIE that most significantly impact the VIE’s economic performance. Such activities would include, among other things, determining or limiting the scope or purpose of the VIE, selling or transferring property owned or controlled by the VIE, or arranging financing for the VIE. As a result of our analyses, we determined that as of
November 30, 2016
and
2015
, we were not the primary beneficiary of any VIEs from which we have acquired rights to land under land option contracts and other similar contracts. We perform ongoing reassessments of whether we are the primary beneficiary of a VIE.
63
The following table presents a summary of our interests in land option contracts and other similar contracts (in thousands):
|
November 30, 2016
|
November 30, 2015
|
||||||||||||||
|
Cash
Deposits
|
Aggregate
Purchase Price
|
Cash
Deposits
|
Aggregate
Purchase Price
|
||||||||||||
|
Unconsolidated VIEs
|
$
|
24,910
|
|
$
|
641,642
|
|
$
|
32,436
|
|
$
|
611,567
|
|
|||
|
Other land option contracts and other similar contracts
|
17,919
|
|
431,954
|
|
22,101
|
|
576,140
|
|
|||||||
|
Total
|
$
|
42,829
|
|
$
|
1,073,596
|
|
$
|
54,537
|
|
$
|
1,187,707
|
|
|||
In addition to the cash deposits presented in the table above, our exposure to loss related to our land option contracts and other similar contracts with third parties and unconsolidated entities consisted of pre-acquisition costs of
$56.0 million
at
November 30, 2016
and
$65.6 million
at November 30, 2015. These pre-acquisition costs and cash deposits were included in inventories in our consolidated balance sheets.
For land option contracts and other similar contracts where the land seller entity is not required to be consolidated under the variable interest model, we consider whether such contracts should be accounted for as financing arrangements. Land option contracts and other similar contracts that may be considered financing arrangements include those we enter into with third-party land financiers or developers in conjunction with such third parties acquiring a specific land parcel(s) on our behalf, at our direction, and those with other landowners where we or our designee make improvements to the optioned land parcel(s) during the applicable option period. For these land option contracts and other similar contracts, we record the remaining purchase price of the associated land parcel(s) in inventories on our consolidated balance sheet with a corresponding financing obligation if we determine that we are effectively compelled to exercise the option under the land option contract and purchase the optioned land parcel(s). In making this determination with respect to a land option contract, we consider the non-refundable deposit(s) we have made and any non-reimbursable expenditures we have incurred for land improvement activities or other items up to the assessment date; additional costs associated with abandoning the contract; and our commitments, if any, to incur non-reimbursable costs associated with the contract. As a result of our evaluations of land option contracts and other similar contracts for financing arrangements, we recorded inventories in our consolidated balance sheets, with a corresponding increase to accrued expenses and other liabilities, of
$50.5 million
at
November 30, 2016
and
$110.0 million
at
November 30, 2015
.
|
Note 9.
|
Investments in Unconsolidated Joint Ventures
|
We have investments in unconsolidated joint ventures that conduct land acquisition, land development and/or other homebuilding activities in various markets where our homebuilding operations are located. We and our unconsolidated joint venture partners make initial and/or ongoing capital contributions to these unconsolidated joint ventures, typically on a pro rata basis, according to our respective equity interests. The obligations to make capital contributions are governed by each such unconsolidated joint venture’s respective operating agreement and related governing documents. Our partners in these unconsolidated joint ventures are unrelated homebuilders, and/or land developers and other real estate entities, or commercial enterprises. These investments are designed primarily to reduce market and development risks and to increase the number of lots we own or control. In some instances, participating in unconsolidated joint ventures has enabled us to acquire and develop land that we might not otherwise have had access to due to a project’s size, financing needs, duration of development or other circumstances. While we consider our participation in unconsolidated joint ventures as potentially beneficial to our homebuilding activities, we do not view such participation as essential.
We typically have obtained rights to acquire portions of the land held by the unconsolidated joint ventures in which we currently participate. When an unconsolidated joint venture sells land to our homebuilding operations, we defer recognition of our share of such unconsolidated joint venture’s earnings (losses) until a home sale is closed and title passes to a homebuyer, at which time we account for those earnings (losses) as a reduction (increase) to the cost of purchasing the land from the unconsolidated joint venture. We defer recognition of our share of such unconsolidated joint venture losses only to the extent profits are to be generated from the sale of the home to a homebuyer.
We share in the earnings (losses) of these unconsolidated joint ventures generally in accordance with our respective equity interests. In some instances, we recognize earnings (losses) related to our investment in an unconsolidated joint venture that differ from our equity interest in the unconsolidated joint venture. This typically arises from our deferral of the unconsolidated joint venture’s earnings (losses) from land sales to us, or other items.
The following table presents combined condensed information from the statements of operations of our unconsolidated joint ventures (in thousands):
64
|
|
Years Ended November 30,
|
||||||||||
|
|
2016
|
2015
|
2014
|
||||||||
|
Revenues
|
$
|
46,389
|
|
$
|
15,322
|
|
$
|
12,538
|
|
||
|
Construction and land costs
|
(50,566
|
)
|
(23,123
|
)
|
(10,790
|
)
|
|||||
|
Other expenses, net
|
(4,465
|
)
|
(3,360
|
)
|
(1,476
|
)
|
|||||
|
Income (loss)
|
$
|
(8,642
|
)
|
$
|
(11,161
|
)
|
$
|
272
|
|
||
For the years ended
November 30, 2016
, 2015 and 2014, combined revenues and construction and land costs were generated primarily from land sales.
The following table presents combined condensed balance sheet information for our unconsolidated joint ventures (in thousands):
|
|
November 30,
|
||||||
|
|
2016
|
2015
|
|||||
|
Assets
|
|||||||
|
Cash
|
$
|
31,928
|
|
$
|
23,309
|
|
|
|
Receivables
|
882
|
|
7,546
|
|
|||
|
Inventories
|
165,385
|
|
175,196
|
|
|||
|
Other assets
|
629
|
|
910
|
|
|||
|
Total assets
|
$
|
198,824
|
|
$
|
206,961
|
|
|
|
Liabilities and equity
|
|||||||
|
Accounts payable and other liabilities
|
$
|
19,880
|
|
$
|
17,108
|
|
|
|
Notes payable (a)
|
44,381
|
|
39,064
|
|
|||
|
Equity
|
134,563
|
|
150,789
|
|
|||
|
Total liabilities and equity
|
$
|
198,824
|
|
$
|
206,961
|
|
|
|
(a)
|
One
of our unconsolidated joint ventures has a construction loan agreement with a third-party lender to finance its land development activities that is secured by the underlying property and related project assets. Outstanding debt under the agreement is non-recourse to us and is scheduled to mature in August 2018. None of our other unconsolidated joint ventures had outstanding debt at
November 30, 2016
or 2015.
|
The following table presents additional information relating to our investments in unconsolidated joint ventures (dollars in thousands):
|
|
November 30,
|
|||||||
|
|
2016
|
2015
|
||||||
|
Number of investments in unconsolidated joint ventures
|
7
|
|
7
|
|
||||
|
Investments in unconsolidated joint ventures
|
$
|
64,016
|
|
$
|
71,558
|
|
||
|
Number of unconsolidated joint venture lots controlled under land option contracts and other similar contracts
|
471
|
|
677
|
|
||||
We and our partner in the unconsolidated joint venture that has the construction loan agreement described above provided certain guarantees and indemnities to the lender, including a guaranty to complete the construction of improvements for the project; a guaranty against losses the lender suffers due to certain bad acts or failures to act by the unconsolidated joint venture or its partners; a guaranty of interest payments on the outstanding balance of the secured debt under the construction loan agreement; and an indemnity of the lender from environmental issues. In each case, our actual responsibility under the foregoing guaranty and indemnity obligations is limited to our pro rata interest in the unconsolidated joint venture. We do not have a guaranty or any other obligation to repay or to support the value of the collateral underlying the unconsolidated joint venture’s outstanding secured debt under the construction loan agreement. However, various financial and non-financial covenants apply with respect to the outstanding secured debt and the related guaranty and indemnity obligations, and a failure to comply with such covenants could
65
result in a default and cause the lender to seek to enforce such guaranty and indemnity obligations, if and as may be applicable. As of
November 30, 2016
, we were in compliance with the applicable terms of our relevant covenants with respect to the construction loan agreement. We do not believe that our existing exposure under our guaranty and indemnity obligations related to the unconsolidated joint venture’s outstanding secured debt is material to our consolidated financial statements.
Of the unconsolidated joint venture lots controlled under land option contracts and other similar contracts at
November 30, 2016
, we are committed to purchase
121
lots from
one
of our unconsolidated joint ventures in quarterly takedowns over the next
four years
for an aggregate purchase price of
$53.0 million
under agreements that we entered into with the unconsolidated joint venture in 2016.
|
Note 10.
|
Other Assets
|
Other assets consisted of the following (in thousands):
|
|
November 30,
|
||||||
|
|
2016
|
2015
|
|||||
|
Cash surrender value of insurance contracts
|
$
|
70,829
|
|
$
|
67,786
|
|
|
|
Property and equipment, net
|
14,240
|
|
13,100
|
|
|||
|
Prepaid expenses
|
4,894
|
|
6,480
|
|
|||
|
Debt issuance costs (a)
|
1,182
|
|
1,626
|
|
|||
|
Total
|
$
|
91,145
|
|
$
|
88,992
|
|
|
|
(a)
|
As described in Note 1 – Summary of Significant Accounting Policies, in connection with our adoption of ASU 2015-03 effective November 30, 2016, unamortized debt issuance costs associated with our senior notes were retrospectively reclassified from other assets to notes payable in our consolidated balance sheets. The debt issuance costs reflected are associated with our Credit Facility.
|
|
Note 11.
|
Accrued Expenses and Other Liabilities
|
Accrued expenses and other liabilities consisted of the following (in thousands):
|
|
November 30,
|
||||||
|
|
2016
|
2015
|
|||||
|
Self-insurance and other litigation liabilities (a)
|
$
|
170,988
|
|
$
|
191,812
|
|
|
|
Employee compensation and related benefits
|
130,352
|
|
114,456
|
|
|||
|
Inventory-related obligations (b)
|
82,682
|
|
148,887
|
|
|||
|
Accrued interest payable
|
67,411
|
|
62,645
|
|
|||
|
Warranty liability
|
56,682
|
|
49,085
|
|
|||
|
Customer deposits
|
18,175
|
|
14,563
|
|
|||
|
Real estate and business taxes
|
14,370
|
|
14,255
|
|
|||
|
Other
|
10,336
|
|
13,027
|
|
|||
|
Total
|
$
|
550,996
|
|
$
|
608,730
|
|
|
|
(a)
|
As described in Note 15 – Commitments and Contingencies, in 2016, we reclassified estimated probable insurance and other recoveries from our self-insurance liability to receivables for all years presented.
|
|
(b)
|
Represents liabilities for inventory not owned associated with financing arrangements discussed in Note 8 – Variable Interest Entities, as well as liabilities for fixed or determinable amounts associated with TIFE assessments. As homes are delivered, the obligation to pay the remaining TIFE assessments associated with each underlying lot is transferred to the homebuyer. As such, these assessment obligations will be paid by us only to the extent we do not deliver homes on applicable lots before the related TIFE obligations mature.
|
66
|
Note 12.
|
Income Taxes
|
Income Tax Benefit (Expense).
The components of the income tax benefit (expense) in our consolidated statements of operations are as follows (in thousands):
|
Federal
|
State
|
Total
|
|||||||||
|
2016
|
|||||||||||
|
Current
|
$
|
(1,900
|
)
|
$
|
(1,000
|
)
|
$
|
(2,900
|
)
|
||
|
Deferred
|
(28,700
|
)
|
(12,100
|
)
|
(40,800
|
)
|
|||||
|
Income tax expense
|
$
|
(30,600
|
)
|
$
|
(13,100
|
)
|
$
|
(43,700
|
)
|
||
|
2015
|
|||||||||||
|
Current
|
$
|
(1,400
|
)
|
$
|
(2,000
|
)
|
$
|
(3,400
|
)
|
||
|
Deferred
|
(35,900
|
)
|
(3,100
|
)
|
(39,000
|
)
|
|||||
|
Income tax expense
|
$
|
(37,300
|
)
|
$
|
(5,100
|
)
|
$
|
(42,400
|
)
|
||
|
2014
|
|||||||||||
|
Current
|
$
|
100
|
|
$
|
(1,900
|
)
|
$
|
(1,800
|
)
|
||
|
Deferred
|
646,000
|
|
179,200
|
|
825,200
|
|
|||||
|
Income tax benefit
|
$
|
646,100
|
|
$
|
177,300
|
|
$
|
823,400
|
|
||
Our income tax expense for 2016 and 2015 reflected the favorable net impact of
$15.2 million
and
$5.6 million
, respectively, of federal energy tax credits we earned from building energy-efficient homes, resulting in effective tax rates of
29.3%
for 2016 and
33.4%
for 2015. The income tax benefit in 2014 was primarily due to the reversal of a substantial portion of our deferred tax asset valuation allowance at November 30, 2014. Due to the effects of our deferred tax asset valuation allowance and changes in our unrecognized tax benefits, our effective tax rate in 2014 was not a meaningful item as our income tax amount was not directly correlated to our pretax income for that period.
The majority of the federal energy tax credits for 2016 resulted from legislation enacted on December 18, 2015. Among other things, this legislation extended the availability of a business tax credit for building new energy-efficient homes through December 31, 2016. Prior to this legislation, the tax credit expired on December 31, 2014. The federal energy tax credits for 2015 were earned primarily from building energy-efficient homes in prior periods based on legislation enacted on December 19, 2014, which permitted retroactive application of the credits.
Deferred Tax Assets, Net.
Deferred income taxes result from temporary differences in the financial and tax basis of assets and liabilities. Significant components of our deferred tax liabilities and assets are as follows (in thousands):
|
|
November 30,
|
||||||
|
|
2016
|
2015
|
|||||
|
Deferred tax liabilities:
|
|||||||
|
Capitalized expenses
|
$
|
116,551
|
|
$
|
110,408
|
|
|
|
State taxes
|
65,766
|
|
68,866
|
|
|||
|
Other
|
286
|
|
196
|
|
|||
|
Total
|
$
|
182,603
|
|
$
|
179,470
|
|
|
67
|
|
November 30,
|
||||||
|
|
2016
|
2015
|
|||||
|
Deferred tax assets:
|
|||||||
|
NOLs from 2006 through 2016
|
$
|
350,329
|
|
$
|
423,274
|
|
|
|
Tax credits
|
197,766
|
|
186,169
|
|
|||
|
Inventory impairment and land option contract abandonment charges
|
176,555
|
|
179,828
|
|
|||
|
Employee benefits
|
102,321
|
|
93,395
|
|
|||
|
Warranty, legal and other accruals
|
51,448
|
|
49,655
|
|
|||
|
Capitalized expenses
|
36,950
|
|
34,887
|
|
|||
|
Partnerships and joint ventures
|
16,293
|
|
18,557
|
|
|||
|
Depreciation and amortization
|
8,530
|
|
9,146
|
|
|||
|
Other
|
6,196
|
|
4,537
|
|
|||
|
Total
|
946,388
|
|
999,448
|
|
|||
|
Valuation allowance
|
(24,800
|
)
|
(37,782
|
)
|
|||
|
Total
|
921,588
|
|
961,666
|
|
|||
|
Deferred tax assets, net
|
$
|
738,985
|
|
$
|
782,196
|
|
|
Reconciliation of Expected Income Tax Benefit (Expense).
The income tax benefit (expense) computed at the statutory U.S. federal income tax rate and the income tax benefit (expense) provided in our consolidated statements of operations differ as follows (dollars in thousands):
|
|
Years Ended November 30,
|
|||||||||||||||||||
|
|
2016
|
2015
|
2014
|
|||||||||||||||||
|
$
|
%
|
$
|
%
|
$
|
%
|
|||||||||||||||
|
Income tax expense computed at statutory rate
|
$
|
(52,260
|
)
|
(35.0
|
)%
|
$
|
(44,462
|
)
|
(35.0
|
)%
|
$
|
(33,232
|
)
|
(35.0
|
)%
|
|||||
|
Valuation allowance for deferred tax assets
|
12,982
|
|
8.7
|
|
3,356
|
|
2.6
|
|
825,232
|
|
869.1
|
|
||||||||
|
Tax credits
|
4,447
|
|
3.0
|
|
6,926
|
|
5.5
|
|
1,875
|
|
2.0
|
|
||||||||
|
Depreciation and amortization
|
1,842
|
|
1.2
|
|
3,183
|
|
2.5
|
|
15,765
|
|
16.6
|
|
||||||||
|
Basis in unconsolidated joint ventures
|
(86
|
)
|
(0.1
|
)
|
1,617
|
|
1.3
|
|
10,441
|
|
11.0
|
|
||||||||
|
NOL reconciliation
|
(3,691
|
)
|
(2.5
|
)
|
(3,379
|
)
|
(2.7
|
)
|
12,973
|
|
13.7
|
|
||||||||
|
State taxes, net of federal income tax benefit
|
(7,511
|
)
|
(5.0
|
)
|
(5,155
|
)
|
(4.1
|
)
|
(13,907
|
)
|
(14.7
|
)
|
||||||||
|
Other, net
|
577
|
|
.4
|
|
(4,486
|
)
|
(3.5
|
)
|
4,253
|
|
4.5
|
|
||||||||
|
Income tax benefit (expense)
|
$
|
(43,700
|
)
|
(29.3
|
)%
|
$
|
(42,400
|
)
|
(33.4
|
)%
|
$
|
823,400
|
|
867.2
|
%
|
|||||
Deferred Tax Asset Valuation Allowance.
We evaluate our deferred tax assets quarterly to determine if adjustments to our valuation allowance are required based on the consideration of all available positive and negative evidence using a “more likely than not” standard with respect to whether deferred tax assets will be realized. Our evaluation
considers, among other factors, our historical operating results, our expectation of future profitability, the duration of the applicable statutory carryforward periods, and conditions in the housing market and the broader economy.
In our evaluation, we give more significant weight to evidence that is objective in nature as compared to subjective evidence. Also, more significant weight is given to evidence that directly relates to our then-current financial performance as compared to indirect or less current evidence.
The ultimate realization of our deferred tax assets depends primarily on our ability to generate future taxable income during the periods in which the related temporary differences in the financial basis and the tax basis of the assets become deductible.
The value of our deferred tax assets in our consolidated balance sheets depends on applicable income tax rates.
Our deferred tax assets of
$763.8 million
at November 30, 2016 and
$820.0 million
at November 30, 2015 were partially offset by valuation allowances of
$24.8 million
and
$37.8 million
, respectively. The deferred tax asset valuation allowance at November 30, 2016 was primarily related to certain state NOLs that had not met the “more likely than not” realization standard at that date. The valuation allowance at November 30, 2015 was
mainly related to foreign tax credits and certain state NOLs that had not met the “more likely than not” realization standard as of that date. As of November 30, 2016, we needed to generate
68
approximately
$1.8 billion
of pretax income in future periods before 2036 to realize our deferred tax assets. Based on the evaluation of our deferred tax assets as of November 30, 2016, we determined that most of our deferred tax assets would be realized. In 2016, we reduced our valuation allowance by
$13.0 million
, which reflected the expiration of foreign tax credits and the release of a valuation allowance associated with state NOLs that met the “more likely than not” realization standard, partly offset by the establishment of a valuation allowance for state NOLs related to the wind down of our Metro Washington, D.C. operations. In 2015, the valuation allowance was reduced by
$3.4 million
to account for the expiration of foreign tax credits and state NOLs that were not utilized.
At November 30, 2014, we determined through our evaluation process that it was more likely than not that most of our deferred tax assets would be realized. As a result, we recognized an
$824.2 million
income tax benefit in the 2014 fourth quarter, which included the reversal of all but
$41.2 million
of our deferred tax asset valuation allowance. The principal positive evidence that led us to determine at November 30, 2014 that most of our deferred tax asset valuation allowance could be reversed included our emergence from a three-year cumulative pretax loss position in 2014 as well as the underlying momentum in our business and generally improved housing market and broader economic conditions that had enabled us to achieve and maintain a three-year cumulative pretax income position as of and after the 2014 third quarter; the significant pretax income we generated during 2014 and 2013, including six consecutive quarters of pretax income as of November 30, 2014; improvement in key financial metrics in 2014 when compared to the previous year (including in our revenues; housing gross profits; selling, general and administrative expenses as a percentage of housing revenues; net orders and backlog); our expectation of future profitability; our strong financial position; significant evidence that conditions in the U.S. housing industry at the time were more favorable than they had been in the then-recent past and our belief that such conditions would continue to be favorable over the long term; and our belief that we would be able to make operational adjustments to address any potential changes in market conditions to maintain long-term profitability and realize our deferred tax assets.
We will continue to evaluate both the positive and negative evidence on a quarterly basis in determining the need for a valuation allowance with respect to our deferred tax assets. The accounting for deferred tax assets is based upon estimates of future results. Changes in positive and negative evidence, including differences between estimated and actual results, could result in changes in the valuation of our deferred tax assets that could have a material impact on our consolidated financial statements. Changes in existing federal and state tax laws and corporate income tax rates could also affect actual tax results and the realization of deferred tax assets over time.
The majority of the tax benefits associated with our NOLs can be carried forward for
20
years (as we did not have taxable income in the allowable two-year carryback period) and applied to offset future taxable income. The federal NOL carryforwards of
$204.2 million
, if not utilized, will begin to expire in
2030
through
2033
. Depending on their applicable statutory period, the state NOL carryforwards of
$146.1 million
, if not utilized, will begin to expire between
2017
and
2036
. State NOL carryforwards of
$.5 million
and
$1.7 million
expired in 2016 and 2015, respectively.
In addition,
$104.9 million
of our tax credits, if not utilized, will begin to expire in
2026
through
2036
. Included in the
$104.9 million
are
$3.2 million
of investment tax credits, of which
$2.4 million
and
$.8 million
will expire in
2026
and
2027
, respectively.
Unrecognized Tax Benefits.
Gross unrecognized tax benefits are the differences between a tax position taken or expected to be taken in a tax return, and the benefit recognized for accounting purposes. A reconciliation of the beginning and ending balances of gross unrecognized tax benefits, excluding interest and penalties, is as follows (in thousands):
|
|
Years Ended November 30,
|
||||||||||
|
|
2016
|
2015
|
2014
|
||||||||
|
Balance at beginning of year
|
$
|
56
|
|
$
|
206
|
|
$
|
206
|
|
||
|
Reductions due to lapse of statute of limitations
|
—
|
|
(150
|
)
|
—
|
|
|||||
|
Balance at end of year
|
$
|
56
|
|
$
|
56
|
|
$
|
206
|
|
||
W
e recognize accrued interest and penalties related to unrecognized tax benefits in our consolidated financial statements as a component of the provision for or benefit from income taxes.
As of each of
November 30, 2016
,
2015
and
2014
, there was a balance of
$.1 million
of gross unrecognized tax benefits (including interest and penalties) that, if recognized, would affect our annual effective tax rate. Our liabilities for unrecognized tax benefits at
November 30, 2016
and 2015 are included in accrued expenses and other liabilities in our consolidated balance sheets.
As of
November 30, 2016
and 2015, there were
no
tax positions for which the ultimate deductibility is highly certain but the timing of such deductibility is uncertain. Our total accrued interest and penalties related to unrecognized income tax benefits was
zero
at both
November 30, 2016
and 2015. Because of the impact of deferred tax accounting, other than interest and penalties,
69
the disallowance of the shorter deductibility period would not affect our annual effective tax rate, but would accelerate the payment of cash to a tax authority to an earlier period.
As of
November 30, 2016
, our gross unrecognized tax benefits (including interest and penalties) totaled
$.1 million
. We anticipate that these gross unrecognized tax benefits will decrease by an amount ranging from
zero
to
$.1 million
during the 12 months from this reporting date due to the expiration of the applicable statute of limitations. The fiscal years ending
2013
and later remain open to federal examinations, while
2012
and later remain open to state examinations.
Notwithstanding the reversal of a substantial portion of our deferred tax asset valuation allowance at November 30, 2014, the benefits of our deferred tax assets, including our NOLs, built-in losses and tax credits would be reduced or potentially eliminated if we experienced an “ownership change” under Section 382. Based on our analysis performed as of
November 30, 2016
, we do not believe that we have experienced an ownership change as defined by Section 382, and, therefore, the NOLs, built-in losses and tax credits we have generated should not be subject to a Section 382 limitation as of this reporting date.
|
Note 13.
|
Notes Payable
|
Notes payable consisted of the following (in thousands):
|
|
November 30,
|
||||||
|
|
2016
|
2015
|
|||||
|
Mortgages and land contracts due to land sellers and other loans (at interest rates of 1% to 7% at November 30, 2016 and 4% to 7% at November 30, 2015)
|
$
|
66,927
|
|
$
|
35,664
|
|
|
|
9.10% Senior notes due September 15, 2017
|
263,932
|
|
262,570
|
|
|||
|
7 1/4% Senior notes due June 15, 2018
|
299,647
|
|
299,431
|
|
|||
|
4.75% Senior notes due May 15, 2019
|
397,364
|
|
396,309
|
|
|||
|
8.00% Senior notes due March 15, 2020
|
344,811
|
|
343,327
|
|
|||
|
7.00% Senior notes due December 15, 2021
|
445,911
|
|
445,079
|
|
|||
|
7.50% Senior notes due September 15, 2022
|
346,774
|
|
346,204
|
|
|||
|
7.625% Senior notes due May 15, 2023
|
247,404
|
|
247,000
|
|
|||
|
1.375% Convertible senior notes due February 1, 2019
|
227,379
|
|
226,170
|
|
|||
|
Total
|
$
|
2,640,149
|
|
$
|
2,601,754
|
|
|
The senior note and convertible senior note balances in the table above reflect our adoption of ASU 2015-03, as described in Note 1 – Summary of Significant Accounting Policies. Debt issuance costs that were deducted from the carrying amounts of the applicable senior notes totaled
$18.3 million
at November 30, 2016 and
$23.8 million
at November 30, 2015. The carrying amounts of the senior notes listed above are also net of any unamortized discounts.
Unsecured Revolving Credit Facility.
We have a
$275.0 million
Credit Facility that will mature on
August 7, 2019
. The Credit Facility contains an uncommitted accordion feature under which its aggregate principal amount of available loans can be increased to a maximum of
$450.0 million
under certain conditions, including obtaining additional bank commitments. The Credit Facility also contains a sublimit of
$137.5 million
for the issuance of letters of credit, which may be utilized in combination with, or to replace, the LOC Facility. Interest on amounts borrowed under the Credit Facility is payable quarterly in arrears at a rate based on either a Eurodollar or a base rate, plus a spread that depends on our Leverage Ratio, as defined under the Credit Facility. The Credit Facility also requires the payment of a commitment fee ranging from
.30%
to
.50%
of the unused commitment, based on our Leverage Ratio. The terms of the Credit Facility require us, among other things, to maintain compliance with various covenants, including financial covenants relating to our consolidated tangible net worth, Leverage Ratio, and either an Interest Coverage Ratio or a minimum level of liquidity, each as defined therein. The amount of the Credit Facility available for cash borrowings or the issuance of letters of credit depends on the total cash borrowings and letters of credit outstanding under the Credit Facility and the maximum available amount under the terms of the Credit Facility. As of
November 30, 2016
, we had
no
cash borrowings and
$31.0 million
of letters of credit outstanding under the Credit Facility. Therefore, as of
November 30, 2016
, we had
$244.0 million
available for cash borrowings under the Credit Facility, with up to
$106.5 million
of that amount available for the issuance of additional letters of credit.
LOC Facility.
We maintain the LOC Facility with a financial institution to obtain letters of credit from time to time in the ordinary course of operating our business. We had
no
letters of credit outstanding under the LOC Facility at November 30, 2016 and
$9.1 million
outstanding at November 30, 2015.
The LOC Facility requires us to deposit and maintain cash with the issuing financial institution as collateral for our letters of credit outstanding.
70
Mortgages and Land Contracts Due to Land Sellers and Other Loans.
As of
November 30, 2016
, inventories having a carrying value of
$181.8 million
were pledged to collateralize mortgages and land contracts due to land sellers and other loans.
Shelf Registration.
Issuances of debt and equity securities under our 2014 Shelf Registration require the filing of a prospectus supplement identifying the amount and terms of the securities to be issued. Our ability to issue equity and/or debt is subject to market conditions and other factors impacting our borrowing capacity.
Senior Notes.
All of our senior notes outstanding at
November 30, 2016
and 2015 represent senior unsecured obligations and rank equally in right of payment with all of our existing and future indebtedness. All of our outstanding senior notes were issued in underwritten public offerings.
The key terms of each of our senior notes outstanding as of
November 30, 2016
were as follows (dollars in thousands):
|
Redeemable Prior to Maturity
|
Effective Interest Rate
|
||||||||||||
|
Notes Payable
|
Principal
|
Issuance Date
|
Maturity Date
|
||||||||||
|
9.10% Senior notes
|
$
|
265,000
|
|
July 30, 2009
|
September 15, 2017
|
Yes (a)
|
9.6
|
%
|
|||||
|
7 1/4% Senior notes
|
300,000
|
|
April 3, 2006
|
June 15, 2018
|
Yes (a)
|
7.3
|
|
||||||
|
4.75% Senior notes
|
400,000
|
|
March 25, 2014
|
May 15, 2019
|
Yes (b)
|
5.0
|
|
||||||
|
8.00% Senior notes
|
350,000
|
|
February 7, 2012
|
March 15, 2020
|
Yes (a)
|
8.5
|
|
||||||
|
7.00% Senior notes
|
450,000
|
|
October 29, 2013
|
December 15, 2021
|
Yes (b)
|
7.2
|
|
||||||
|
7.50% Senior notes
|
350,000
|
|
July 31, 2012
|
September 15, 2022
|
Yes (a)
|
7.7
|
|
||||||
|
7.625% Senior notes
|
250,000
|
|
February 17, 2015
|
May 15, 2023
|
Yes (b)
|
7.8
|
|
||||||
|
1.375% Convertible senior notes
|
230,000
|
|
January 29, 2013
|
February 1, 2019
|
Yes (c)
|
1.9
|
|
||||||
|
(a)
|
At our option, these notes may be redeemed, in whole at any time or from time to time in part, at a redemption price equal to the greater of (i) 100% of the principal amount of the notes being redeemed and (ii) the sum of the present values of the remaining scheduled payments of principal and interest on the notes being redeemed (exclusive of interest accrued to the applicable redemption date), discounted to the redemption date at a defined rate, plus, in each case, accrued and unpaid interest on the notes being redeemed to the applicable redemption date.
|
|
(b)
|
At our option, these notes may be redeemed, in whole at any time or from time to time in part, at a redemption price equal to the greater of (i) 100% of the principal amount of the notes being redeemed and (ii) the sum of the present values of the remaining scheduled payments of principal and interest on the notes being redeemed (exclusive of interest accrued to the applicable redemption date), discounted to the redemption date at a defined rate, plus, in each case, accrued and unpaid interest on the notes being redeemed to, but excluding, the applicable redemption date, except that three months prior to the stated maturity dates for the 4.75% Senior Notes due 2019 and the 7.00% Senior Notes due 2021 and until their respective maturity, and six months prior to the stated maturity date for the 7.625% Senior Notes due 2023 and until their maturity, the redemption price will be equal to 100% of the principal amount of the notes being redeemed, plus, in each case, accrued and unpaid interest on the notes being redeemed to, but excluding, the applicable redemption date.
|
|
(c)
|
We may not redeem the notes prior to November 6, 2018. On or after November 6, 2018, and prior to the stated maturity date, we may, at our option, redeem all or part of the notes at a redemption price equal to
100%
of the principal amount of the notes being redeemed plus accrued and unpaid interest to, but excluding the redemption date.
|
If a change in control occurs as defined in the instruments governing our senior notes, we would be required to offer to purchase all of our outstanding senior notes (with the exception of the amount outstanding related to our 7 1/4% Senior Notes due 2018) at 101% of their principal amount, together with all accrued and unpaid interest, if any. If a fundamental change, as defined in the instruments governing the 1.375% Convertible Senior Notes due 2019, occurs prior to the stated maturity date, the holders may require us to purchase for cash all or any portion of their 1.375% Convertible Senior Notes due 2019 at
100%
of the principal amount of the notes, plus accrued and unpaid interest to, but not including, the fundamental change purchase date.
In 2015, we used a portion of the total net proceeds of
$245.4 million
from the issuance of the 7.625% Senior Notes due 2023 to retire the remaining
$199.9 million
in aggregate principal amount of our 6 1/4% Senior Notes due 2015 at their maturity on June 15, 2015. The remainder of the net proceeds was used for general corporate purposes, including working capital, land acquisition and land development.
71
In 2014, we used the
$394.6 million
in total net proceeds from the issuance of the 4.75% Senior Notes due 2019 together with the total net proceeds from a concurrent underwritten public offering of our common stock, which is discussed below in Note 17 – Stockholders’ Equity, for general corporate purposes, including land acquisition and land development.
At any time prior to the close of business on the business day immediately preceding the maturity date, holders may convert all or any portion of the 1.375% Convertible Senior Notes due 2019. These notes are initially convertible into shares of our common stock at a conversion rate of
36.5297
shares for each $1,000 principal amount of the notes, which represents an initial conversion price of approximately
$27.37
per share. This initial conversion rate equates to
8,401,831
shares of our common stock and is subject to adjustment upon the occurrence of certain events, including: subdivisions and combinations of our common stock; the issuance of stock dividends, or certain rights, options or warrants, capital stock, indebtedness, assets or cash dividends to all or substantially all holders of our common stock; and certain issuer tender or exchange offers. The conversion rate will not, however, be adjusted for other events, such as a third party tender or exchange offer or an issuance of common stock for cash or an acquisition, that may adversely affect the trading price of the notes or our common stock. On conversion, holders of the 1.375% Convertible Senior Notes due 2019 will not be entitled to receive cash in lieu of shares of our common stock, except for cash in lieu of fractional shares. We maintain
12,602,735
shares of our common stock to meet conversions if and when they occur. This represents the maximum number of shares of our common stock potentially deliverable upon conversion to holders of the 1.375% Convertible Senior Notes due 2019 based on the terms of their governing instruments. The maximum number of shares would potentially be deliverable to holders only in certain limited circumstances as set forth in the instruments governing these notes.
The indenture governing the senior notes does not contain any financial covenants. Subject to specified exceptions, the indenture contains certain restrictive covenants that, among other things, limit our ability to incur secured indebtedness, or engage in sale-leaseback transactions involving property or assets above a certain specified value.
In addition, the senior notes (with the exception of the 7 1/4% Senior Notes due 2018)
contain certain limitations related to mergers, consolidations, and sales of assets.
As of November 30, 2016,
we were in compliance with the applicable terms of all our covenants and other requirements under the Credit Facility, the senior notes, the indenture, and the mortgages and land contracts due to land sellers and other loans. Our ability to access the Credit Facility for cash borrowings and letters of credit and our ability to secure future debt financing depend, in part, on our ability to remain in such compliance.
There are no agreements that restrict our payment of dividends other than to maintain compliance with the financial covenant requirements under the Credit Facility, which would restrict our payment of dividends if a default under the Credit Facility exists at the time of any such payment, or if any such payment would result in such a default.
Principal payments on senior notes, mortgages and land contracts due to land sellers and other loans are due during each year ended November 30 as follows: 2017 —
$331.9 million
; 2018 —
$300.0 million
; 2019 —
$630.0 million
; 2020 —
$350.0 million
; 2021 —
$0
; and thereafter —
$1.05 billion
.
|
Note 14.
|
Fair Value Disclosures
|
Fair value measurements of assets and liabilities are categorized based on the following hierarchy:
|
Level 1
|
Fair value determined based on quoted prices in active markets for identical assets or liabilities.
|
|
Level 2
|
Fair value determined using significant observable inputs, such as quoted prices for similar assets or liabilities or quoted prices for identical or similar assets or liabilities in markets that are not active, inputs other than quoted prices that are observable for the asset or liability, or inputs that are derived principally from or corroborated by observable market data, by correlation or other means.
|
|
Level 3
|
Fair value determined using significant unobservable inputs, such as pricing models, discounted cash flows, or similar techniques.
|
Fair value measurements are used for inventories on a nonrecurring basis when events and circumstances indicate that their carrying value is not recoverable. The following table presents the fair value hierarchy and our assets measured at fair value on a nonrecurring basis (in thousands):
|
|
Fair Value Hierarchy
|
For the Years Ended November 30,
|
||||||||
|
Description
|
2016
|
2015
|
||||||||
|
Inventories (a)
|
Level 2
|
$
|
3,657
|
|
$
|
—
|
|
|||
|
Inventories (a)
|
Level 3
|
37,329
|
|
11,988
|
|
|||||
72
|
(a)
|
Amounts represent the aggregate fair value for real estate assets impacted by inventory impairment charges during the applicable period, as of the date that the fair value measurements were made. The carrying value for these real estate assets may have subsequently increased or decreased from the fair value reflected due to activity that has occurred since the measurement date.
|
Inventories with a carrying value of
$89.1 million
were written down to their fair value, less associated costs to sell (where applicable), of
$39.5 million
during the year ended
November 30, 2016
, resulting in inventory impairment charges of
$49.6 million
. Inventories with a carrying value of
$20.0 million
were written down to their fair value of
$12.0 million
during the year ended
November 30, 2015
, resulting in inventory impairment charges of
$8.0 million
.
The fair values for inventories that were determined using Level 2 inputs were based on bona fide letters of intent from outside parties or executed sales contracts. The fair values for inventories that were determined using Level 3 inputs were primarily based on the estimated future net cash flows discounted for inherent risk associated with each underlying asset, or, with respect to planned future land sales, were based on broker quotes.
The following table presents the fair value hierarchy, carrying values and estimated fair values of our financial instruments, except those for which the carrying values approximate fair values (in thousands):
|
|
November 30,
|
||||||||||||||||
|
|
2016
|
2015
|
|||||||||||||||
|
Fair Value Hierarchy
|
Carrying
Value
|
Estimated
Fair Value
|
Carrying
Value
|
Estimated
Fair Value
|
|||||||||||||
|
Financial Liabilities:
|
|||||||||||||||||
|
Senior notes (a)
|
Level 2
|
$
|
2,345,843
|
|
$
|
2,494,844
|
|
$
|
2,339,920
|
|
$
|
2,429,850
|
|
||||
|
Convertible senior notes (a)
|
Level 2
|
227,379
|
|
223,675
|
|
226,170
|
|
211,313
|
|
||||||||
|
(a)
|
The carrying values for the senior notes and convertible senior notes, as presented, include unamortized debt issuance costs. Debt issuance costs are not factored into the estimated fair values of these notes.
|
The fair values of our senior notes and convertible senior notes are generally estimated based on quoted market prices for these instruments. The carrying values reported for cash and cash equivalents, restricted cash, and mortgages and land contracts due to land sellers and other loans approximate fair values.
|
Note 15.
|
Commitments and Contingencies
|
Commitments and contingencies include typical obligations of homebuilders for the completion of contracts and those incurred in the ordinary course of business.
Warranty.
We
provide a limited warranty on all of our homes.
The specific terms and conditions of our limited warranty program vary depending upon the markets in which we do business. We generally provide a structural warranty of
10 years
, a warranty on electrical, heating, cooling, plumbing and certain other building systems each varying from
two
to
five years
based on geographic market and state law, and a warranty of
one year
for other components of the home. Our limited warranty program is ordinarily how we respond to and account for homeowners’ requests to local division offices seeking repairs of certain conditions or defects, including claims where we could have liability under applicable state statutes or tort law for a defective condition in or damages to a home. Our warranty liability covers our costs of repairs associated with homeowner claims made under our limited warranty program. These claims for repairs of certain conditions or defects are generally made directly by a homeowner and involve their individual home.
We estimate the costs that may be incurred under each limited warranty and record a liability in the amount of such costs at the time the revenue associated with the sale of each home is recognized.
Our primary assumption in estimating the amounts we accrue for warranty costs is that historical claims experience is a strong indicator of future claims experience. Factors that affect our warranty liability include the number of homes delivered, historical and anticipated rates of warranty claims, and cost per claim. We periodically assess the adequacy of our accrued warranty liability
, which is included in accrued expenses and other liabilities in our consolidated balance sheets,
and adjust the amount as necessary based on our assessment.
Our assessment includes the review of our actual warranty costs incurred to identify trends and changes in our warranty claims experience, and considers our home construction quality and customer service initiatives and outside events.
While we believe the warranty liability currently reflected in our consolidated balance sheets to be adequate, unanticipated changes or developments in the legal environment, local weather, land or environmental conditions, quality of materials or methods used in the construction of homes or customer service
73
practices and/or our warranty claims experience could have a significant impact on our actual warranty costs in future periods and such amounts could differ significantly from our current estimates.
The changes in our warranty liability are as follows (in thousands):
|
|
Years Ended November 30,
|
||||||||||
|
|
2016
|
2015
|
2014
|
||||||||
|
Balance at beginning of year
|
$
|
49,085
|
|
$
|
45,196
|
|
$
|
48,704
|
|
||
|
Warranties issued
|
30,135
|
|
23,018
|
|
18,479
|
|
|||||
|
Payments (a)
|
(23,190
|
)
|
(26,367
|
)
|
(39,458
|
)
|
|||||
|
Adjustments (b)
|
652
|
|
7,238
|
|
17,471
|
|
|||||
|
Balance at end of year
|
$
|
56,682
|
|
$
|
49,085
|
|
$
|
45,196
|
|
||
|
(a)
|
Payments for 2016, 2015 and 2014 included
$2.3 million
,
$8.4 million
and
$26.6 million
, respectively, to repair homes affected by water intrusion-related issues in certain of our communities in central and southwest Florida.
|
|
(b)
|
Adjustments for 2016, 2015 and 2014 included the reclassification of certain estimated minimum probable recoveries to receivables in connection with the above-noted water intrusion-related issues. Adjustments in 2014 also included the reclassification of estimated minimum probable recoveries to establish a separate accrual for a water intrusion-related inquiry, as described below. The adjustments for each year had no impact on our consolidated statements of operations. There were
no
estimated minimum probable recoveries netted against our warranty liability at November 30, 2016.
|
Florida Attorney General’s Office Inquiry.
In 2013, we were notified by the Florida Attorney General’s Office that it was making a preliminary inquiry into the status of our communities in Florida which were affected by water intrusion-related issues. We established an accrual for the estimated minimum probable loss with respect to this inquiry during 2014 and increased the accrual during 2015. This inquiry was resolved through an agreement with the Florida Attorney General’s Office that was approved by a Florida circuit court and became effective in February 2016. The amount accrued as of November 30, 2015 was adequate based on the terms of the approved agreement. We paid a stipulated amount to the Florida Attorney General’s Office under the agreement in March 2016.
Guarantees.
In the normal course of our business, we issue certain representations, warranties and guarantees related to our home and land sales. Based on historical experience, we do not believe any potential liability with respect to these representations, warranties or guarantees would be material to our consolidated financial statements.
Self-Insurance.
W
e maintain, and require the majority of our independent subcontractors to maintain, general liability insurance (including construction defect and bodily injury coverage) and workers’ compensation insurance. These insurance policies protect us against a portion of our risk of loss from claims related to our homebuilding activities, subject to certain self-insured retentions, deductibles and other coverage limits
. We also maintain certain other insurance policies.
In Arizona, California, Colorado and Nevada, our subcontractors’ general liability insurance primarily takes the form of a wrap-up policy under a program where eligible independent subcontractors are enrolled as insureds on each community. Enrolled subcontractors contribute toward the cost of the insurance and agree to pay a contractual amount in the future if there is a claim related to their work.
To the extent provided under the wrap-up program, we absorb the enrolled subcontractors’ general liability associated with the work performed on our homes within the applicable community as part of our overall general liability insurance and our self-insurance.
We self-insure a portion of our overall risk through the use of a captive insurance subsidiary, which provides coverage for our exposure to certain construction defect, bodily injury and property damage claims and related litigation or regulatory actions, up to certain limits. Our self-insurance liability generally covers the costs of settlements and/or repairs, if any, as well as our costs to defend and resolve the following types of claims:
|
•
|
Construction defect
: Construction defect claims, which represent the largest component of our self-insurance liability, typically originate through a legal or regulatory process rather than directly by a homeowner and involve the alleged occurrence of a condition affecting
two
or more homes within the same community, or they involve a common area or homeowners’ association property within a community. These claims typically involve higher costs to resolve than individual homeowner warranty claims, and the rate of claims is highly variable.
|
|
•
|
Bodily injury
: Bodily injury claims typically involve individuals (other than our employees) who claim they were injured while on our property or as a result of our operations.
|
74
|
•
|
Property damage
: Property damage claims generally involve claims by third parties for alleged damage to real or personal property as a result of our operations. Such claims may occasionally include those made against us by owners of property located near our communities.
|
Our self-insurance liability at each reporting date represents the estimated costs of reported claims, claims incurred but not yet reported, and claim adjustment expenses.
The amount of our self-insurance liability is based on an analysis performed by a third-party actuary that uses our historical claim and expense data, as well as industry data to estimate these overall costs.
Key assumptions used in developing these estimates include claim frequencies, severities and resolution patterns, which can occur over an extended period of time. These estimates are subject to variability due to the length of time between the delivery of a home to a homebuyer and when a construction defect claim is made, and the ultimate resolution of such claim; uncertainties regarding such claims relative to our markets and the types of product we build; and legal or regulatory actions and/or interpretations, among other factors. Due to the degree of judgment involved and the potential for variability in these underlying assumptions, our actual future costs could differ from those estimated. In addition, changes in the frequency and severity of reported claims and the estimates to resolve claims can impact the trends and assumptions used in the actuarial analysis, which could be material to our consolidated financial statements.
Though state regulations vary, construction defect claims are reported and resolved over a long period of time, which can extend for 10 years or more. As a result, the majority of the estimated self-insurance liability based on the actuarial analysis relates to claims incurred but not yet reported. Therefore, adjustments related to individual existing claims generally do not significantly impact the overall estimated liability. Adjustments to our liabilities related to homes delivered in prior years are recorded in the period in which a change in our estimate occurs.
Our self-insurance liability is presented on a gross basis for all years without consideration of insurance recoveries and amounts we have paid on behalf of and expect to recover from other parties, if any. To facilitate this, as of November 30, 2016, we changed the presentation of estimated probable insurance and other recoveries to reflect such amounts as receivables in our consolidated balance sheets, with no impact on our consolidated statements of operations. Previously, these amounts were presented on a net basis within our self-insurance liability. The estimated probable insurance and other recoveries that were reclassified to receivables totaled
$95.3 million
at November 30, 2015 and
$124.9 million
at November 30, 2014. We also reported estimated probable insurance and other recoveries of
$84.5 million
as receivables at November 30, 2016. The estimated probable recoveries for all periods presented are principally based on actuarially determined amounts and depend on various factors, including, among other things, the above-described claim cost estimates, our insurance policy coverage limits for the applicable policy year(s), historical third-party recovery rates, insurance industry practices, the regulatory environment, and legal precedent, and are subject to a high degree of variability from year to year. Because of the inherent uncertainty and variability in these assumptions, our actual insurance recoveries could differ significantly from amounts currently estimated.
The changes in our self-insurance liability were as follows (in thousands):
|
|
Years Ended November 30,
|
||||||||||
|
|
2016
|
2015
|
2014
|
||||||||
|
Balance at beginning of year
|
$
|
173,011
|
|
$
|
205,228
|
|
$
|
239,067
|
|
||
|
Self-insurance expense (a)
|
24,808
|
|
18,590
|
|
13,491
|
|
|||||
|
Payments
|
(28,395
|
)
|
(21,201
|
)
|
(21,045
|
)
|
|||||
|
Reclassification of estimated probable recoveries (b)
|
(10,840
|
)
|
(29,606
|
)
|
(26,285
|
)
|
|||||
|
Balance at end of year
|
$
|
158,584
|
|
$
|
173,011
|
|
$
|
205,228
|
|
||
|
(a)
|
These expenses are included in selling, general and administrative expenses and are largely offset by contributions from independent subcontractors participating in the wrap-up policy.
|
|
(b)
|
Amount for each period represents the year-over-year change in the estimated probable insurance and other recoveries that were reclassified to receivables to present our self-insurance liability on a gross basis.
|
For most of our claims, there is no interaction between our warranty liability and self-insurance liability. Typically, if a matter is identified at its outset as either a warranty or self-insurance claim, it remains as such through its resolution. However, there can be instances of interaction between the liabilities, such as where individual homeowners in a community separately request warranty repairs to their homes to address a similar condition or issue and subsequently join together to initiate, or potentially initiate, a legal process with respect to that condition or issue and/or the repair work we have undertaken. In these instances, the claims and related repair work generally are initially covered by our warranty liability, and the costs associated with resolving the legal matter (including any additional repair work) are covered by our self-insurance liability.
The payments we make in connection with claims and related repair work, whether covered within our warranty liability and/or our self-insurance liability, may be recovered from our insurers to the extent such payments exceed the self-insured retentions
75
or deductibles under our general liability insurance policies. There generally is a timing difference between when we make payments for claims and related repair work and our recovery of costs from applicable insurance carriers due to the insurance carriers’ lengthy claim evaluation process. Also, in certain instances, in the course of resolving a claim, we pay amounts in advance of and/or on behalf of a subcontractor(s) or their insurer(s) and believe we will be reimbursed for such payments. Estimates of all such amounts, if any, are recorded as receivables in our consolidated balance sheets when any such recovery is considered probable. Such receivables associated with our warranty and self-insurance matters totaled
$14.6 million
at November 30, 2016 and
$23.8 million
at November 30, 2015. We believe the collection of these receivables is probable based on our history of collections for similar claims.
Performance Bonds and Letters of Credit.
We are often required to provide to various municipalities and other government agencies performance bonds and/or letters of credit to secure the completion of our projects and/or in support of obligations to build community improvements such as roads, sewers, water systems and other utilities, and to support similar development activities by certain of our unconsolidated joint ventures. At
November 30, 2016
, we had
$535.7 million
of performance bonds and
$31.0 million
of letters of credit outstanding. At
November 30, 2015
, we had
$565.4 million
of performance bonds and
$33.4 million
of letters of credit outstanding. If any such performance bonds or letters of credit are called, we would be obligated to reimburse the issuer of the performance bond or letter of credit. We do not believe that a material amount of any currently outstanding performance bonds or letters of credit will be called. Performance bonds do not have stated expiration dates. Rather, we are released from the performance bonds as the underlying performance is completed. The expiration dates of some letters of credit issued in connection with community improvements coincide with the expected completion dates of the related projects or obligations. Most letters of credit, however, are issued with an initial term of one year and are typically extended on a year-to-year basis until the related performance obligations are completed.
Land Option Contracts and Other Similar Contracts.
In the ordinary course of business, we enter into land option contracts and other similar contracts to acquire rights to land for the construction of homes. At
November 30, 2016
, we had total cash deposits of
$42.8 million
to purchase land having an aggregate purchase price of
$1.07 billion
. Our land option contracts and other similar contracts generally do not contain provisions requiring our specific performance.
Leases.
We lease certain property and equipment under noncancelable operating leases. Office and equipment leases are typically for terms of
three
to
five
years and generally provide renewal options for terms up to an additional
five years
. In most cases, we expect that leases that expire will be renewed or replaced by other leases with similar terms. The future minimum rental payments under operating leases, which primarily consist of office leases having initial or remaining noncancelable lease terms in excess of
one year
, are as follows (in thousands):
|
Years Ending November 30,
|
||||
|
2017
|
$
|
7,660
|
|
|
|
2018
|
7,218
|
|
||
|
2019
|
6,653
|
|
||
|
2020
|
4,354
|
|
||
|
2021
|
2,592
|
|
||
|
Thereafter
|
7,644
|
|
||
|
Total minimum lease payments
|
$
|
36,121
|
|
|
Rental expense on our noncancelable operating leases was
$7.5 million
in
2016
,
$8.5 million
in
2015
and
$7.7 million
in
2014
.
|
Note 16.
|
Legal Matters
|
Nevada Development Contract Litigation.
KB HOME Nevada Inc., a wholly owned subsidiary of ours (“KB Nevada”), is a defendant in a case in the Eighth Judicial District Court in Clark County, Nevada entitled
Las Vegas Development Associates, LLC, Essex Real Estate Partners, LLC, et al. v. KB HOME Nevada Inc.
In 2007, Las Vegas Development Associates, LLC (“LVDA”) agreed to purchase from KB Nevada approximately
83
acres of land located near Las Vegas, Nevada. LVDA subsequently assigned its rights to Essex Real Estate Partners, LLC (“Essex”). KB Nevada and Essex entered into a development agreement relating to certain major infrastructure improvements. LVDA’s and Essex’s complaint, initially filed in 2008, alleged that KB Nevada breached the development agreement, and also alleged that KB Nevada fraudulently induced them to enter into the purchase and development agreements. LVDA’s and Essex’s lenders subsequently filed related actions that were consolidated into the LVDA/Essex matter. The consolidated plaintiffs sought rescission of the agreements or, in the alternative, compensatory damages of
$55 million
plus
76
unspecified punitive damages and other damages, and interest charges in excess of
$41 million
(“Claimed Damages”). KB Nevada has denied the allegations, and believes it has meritorious defenses to the consolidated plaintiffs’ claims. On March 15, 2013, the district court entered orders denying the consolidated plaintiffs’ motions for summary judgment and granting the majority of KB Nevada’s motions for summary judgment, eliminating, among other of the consolidated plaintiffs’ claims, those for fraud, negligent misrepresentation, and punitive damages. With the district court’s decisions, the only remaining claims against KB Nevada are for contract damages and rescission. In August 2013, the court granted motions that further narrowed the scope of the Claimed Damages. The lender plaintiffs filed an appeal from the district court’s summary judgment decisions with the Nevada Supreme Court and that court heard oral argument on June 6, 2016. On September 22, 2016, the Nevada Supreme Court rejected the lender plaintiffs’ appeal and upheld the district court’s summary judgment decisions against the lender plaintiffs in favor of KB Nevada. The district court scheduled a new trial date of February 28, 2017 for all remaining claims. While the ultimate outcome is uncertain — we believe it is reasonably possible that the loss in this matter could exceed the amount accrued by a range of
zero
to approximately
$55 million
plus prejudgment interest, which could be material to our consolidated financial statements — KB Nevada believes it will be successful in defending against the consolidated plaintiffs’ remaining claims and that the consolidated plaintiffs will not be awarded rescission or damages.
Wage and Hour Litigation.
In May 2011, a group of current and former sales representatives filed a collective action lawsuit in the United States District Court for the Southern District of Texas, Galveston Division entitled
Edwards, K. v. KB Home
. The lawsuit alleged that we misclassified sales representatives and failed to pay minimum and overtime wages in violation of the Fair Labor Standards Act (29 U.S.C. §§ 206-07). In September 2012, the
Edwards
court conditionally certified a nationwide class, and in May 2015, scheduled an initial trial involving a portion of the plaintiffs for December 2015. In September 2013, some of the plaintiffs in the
Edwards
case filed a lawsuit in Los Angeles Superior Court entitled
Andrea L. Bejenaru, et al. v. KB Home, et al
. The lawsuit alleged violations of California laws relating to overtime, meal period and rest break pay, itemized wage statements, waiting time penalties and unfair business practices for a class of sales representatives. Although the case involved a putative class of individuals who were our sales representatives from September 2009 forward, the
Bejenaru
case was not certified as a class action. In the second quarter of 2015, plaintiff representatives in the
Edwards
and the
Bejenaru
cases claimed
$66 million
in compensatory damages, penalties and interest, as well as injunctive relief, attorneys’ fees and costs for both matters. On November 18, 2015, we reached a tentative mediated settlement with the plaintiff representatives in both cases that remains subject to judicial approval. Under the terms of the tentative settlement, we agreed to pay
$7.5 million
to a settlement administrator for distribution to individual settling plaintiffs, subject to obtaining releases from, and a specified threshold of participation by, such individuals. On May 2, 2016, after further negotiations to resolve important details related to the claims submission process for individual settling plaintiffs, we reached final settlement terms with the plaintiff representatives. The final settlement terms did not change the settlement amount, which is intended to be inclusive of all payments to settling plaintiffs and all related fees and costs, or the required threshold participation level. On May 19, 2016, the
Edwards
court approved the final settlement terms with respect to the
Edwards
case and, with the
Bejenaru
court’s consent, preliminarily approved the final settlement terms with respect to the
Bejenaru
case. On September 15, 2016, the court approved the final settlement terms with respect to the
Bejenaru
case. In 2015, we established an accrual for these cases in the amount of
$7.5 million
, which we paid as of November 30, 2016.
San Diego Water Board Notice of Violation
. In August 2015, the California Regional Water Quality Control Board, San Diego Region (“RWQCB”) issued to us and another homebuilder a Notice of Violation (“NOV”) alleging violations of the California Water Code and waste discharge prohibitions of the water quality control plan for the San Diego Region (Basin Plan). According to the NOV, the alleged violations involved the unpermitted discharge of fill material into the waters of the United States/California during the grading of a required secondary access road for a community located in San Diego County, California, which was performed pursuant to a County-issued grading permit. In its NOV, the RWQCB requested to meet with us to discuss the alleged violations as part of its process to determine whether to bring any enforcement action, and we have met with the RWQCB in an effort to resolve the matters alleged in the NOV. An administrative hearing before the RWQCB originally scheduled for August 10, 2016 has been continued and a new hearing date has not yet been set. While the ultimate outcome is uncertain, we believe that any penalties and related corrective measures the RWQCB may impose under the NOV could exceed
$100,000
(the threshold for the required disclosure of this type of environmental proceeding) but they are not expected to be material to our consolidated financial statements.
Other Matters.
In addition to the specific proceedings described above, we are involved in other litigation and regulatory proceedings incidental to our business that are in various procedural stages. We believe that the accruals we have recorded for probable and reasonably estimable losses with respect to these proceedings are adequate and that, as of November 30, 2016, it was not reasonably possible that an additional material loss had been incurred in an amount in excess of the estimated amounts already recognized or disclosed in our consolidated financial statements. We evaluate our accruals for litigation and regulatory proceedings at least quarterly and, as appropriate, adjust them to reflect (a) the facts and circumstances known to us at the time, including information regarding negotiations, settlements, rulings and other relevant events and developments; (b) the advice and analyses of counsel; and (c) the assumptions and judgment of management. Similar factors and considerations are used in establishing new accruals for proceedings as to which losses have become probable and reasonably estimable at the time an
77
evaluation is made. Based on our experience, we believe that the amounts that may be claimed or alleged against us in these proceedings are not a meaningful indicator of our potential liability. The outcome of any of these proceedings, including the defense and other litigation-related costs and expenses we may incur, however, is inherently uncertain and could differ significantly from the estimate reflected in a related accrual, if made. Therefore, it is possible that the ultimate outcome of any proceeding, if in excess of a related accrual or if an accrual had not been made, could be material to our consolidated financial statements.
|
Note 17.
|
Stockholders’ Equity
|
Preferred Stock.
To help protect the benefits of our NOLs, built-in losses and tax credits from the impact of an ownership change under Section 382, on January 22, 2009, we adopted a Rights Agreement dated as of that date (“2009 Rights Agreement”), and we declared a dividend distribution of one preferred share purchase right for each outstanding share of common stock that was payable to stockholders of record as of the close of business on March 5, 2009. Subject to the terms, provisions and conditions of the 2009 Rights Agreement, if these rights become exercisable, each right would initially represent the right to purchase from us 1/100th of a share of our Series A Participating Cumulative Preferred Stock for a purchase price of
$85.00
(“Purchase Price”). If issued, each fractional share of preferred stock would generally give a stockholder approximately the same dividend, voting and liquidation rights as does one share of our common stock. However, prior to exercise, a right does not give its holder any rights as a stockholder, including without limitation any dividend, voting or liquidation rights. The rights will not be exercisable until the earlier of (a)
10
calendar days after a public announcement by us that a person or group has become an Acquiring Person (as defined under the 2009 Rights Agreement) and (b)
10
business days after the commencement of a tender or exchange offer by a person or group if upon consummation of the offer the person or group would beneficially own
4.9%
or more of our outstanding common stock.
Until these rights become exercisable (“Distribution Date”), common stock certificates and/or book-entry shares will evidence the rights and may contain a notation to that effect. Any transfer of shares of our common stock prior to the Distribution Date will constitute a transfer of the associated rights. After the Distribution Date, the rights may be transferred other than in connection with the transfer of the underlying shares of our common stock. If there is an Acquiring Person on the Distribution Date or a person or group becomes an Acquiring Person after the Distribution Date, each holder of a right, other than rights that are or were beneficially owned by an Acquiring Person, which will be void, will thereafter have the right to receive upon exercise of a right and payment of the Purchase Price, that number of shares of our common stock having a market value of two times the Purchase Price. After the later of the Distribution Date and the time we publicly announce that an Acquiring Person has become such, our board of directors may exchange the rights, other than rights that are or were beneficially owned by an Acquiring Person, which will be void, in whole or in part, at an exchange ratio of one share of common stock per right, subject to adjustment.
At any time prior to the later of the Distribution Date and the time we publicly announce that an Acquiring Person becomes such, our board of directors may redeem all of the then-outstanding rights in whole, but not in part, at a price of
$.001
per right, subject to adjustment (“Redemption Price”). The redemption will be effective immediately upon the board of directors’ action, unless the action provides that such redemption will be effective at a subsequent time or upon the occurrence or nonoccurrence of one or more specified events, in which case the redemption will be effective in accordance with the provisions of the action. Immediately upon the effectiveness of the redemption of the rights, the right to exercise the rights will terminate and the only right of the holders of rights will be to receive the Redemption Price, with interest thereon. The rights issued pursuant to the 2009 Rights Agreement will expire on the earliest of (a) the close of business on March 5, 2019, (b) the time at which the rights are redeemed, (c) the time at which the rights are exchanged, (d) the time at which our board of directors determines that a related provision in our Restated Certificate of Incorporation is no longer necessary, and (e) the close of business on the first day of a taxable year of ours to which our board of directors determines that no tax benefits may be carried forward. At our annual meeting of stockholders on April 2, 2009, our stockholders approved the 2009 Rights Agreement.
Common Stock.
In 2014, we issued
7,986,111
shares of our common stock, par value
$1.00
per share, in underwritten public offerings at a price of
$18.00
per share. We used shares of treasury stock for the issuance and received net proceeds of
$137.0 million
after underwriting discounts, commissions and transaction expenses.
Each share of our common stock issued in the 2014 offering includes a preferred share purchase right associated with and subject to the terms of the 2009 Rights Agreement. Any shares of our common stock delivered upon conversion to holders of the 1.375% Convertible Senior Notes due 2019 will also include such preferred share purchase rights.
In 2014, our board of directors amended the Director Plan to provide directors with a one-time opportunity to irrevocably elect to receive an equivalent value of shares of our common stock in lieu of the cash payments that are otherwise due upon the respective settlement of their Director Plan SARs under the terms of the plan. Concurrent with the amendment of the Director Plan, for the purpose of effecting any such settlements, our board of directors authorized the repurchase of not more than
680,000
shares of our common stock, and also authorized potential future grants of up to
680,000
stock payment awards under the KB Home 2014 Equity Incentive Plan (“2014 Plan”), in each case solely as necessary for director elections in respect of outstanding
78
Director Plan SARs. The 2014 Plan, which was amended in April 2016, is discussed in Note 19 – Employee Benefit and Stock Plans. During 2014, following the amendment of the Director Plan, directors made irrevocable elections to receive an aggregate of
679,815
shares of our common stock upon the respective settlement of their outstanding Director Plan SARs. As of November 30, 2016,
no
Director Plan SARs had been settled. In addition, we had not repurchased any shares and
no
stock payment awards had been granted under the 2014 Plan, as amended, pursuant to the respective board of directors authorizations or otherwise.
The above-described director elections made in 2014 changed only the method of settlement of the outstanding Director Plan SARs, and did not change any of the other terms of these awards or impact the value to the directors. As a result of the directors’ elections, the relevant outstanding Director Plan SARs were effectively converted to stock-settled awards, which are accounted for as equity awards, instead of cash-settled liability awards, thereby reducing the degree of variability in the expense associated with such awards in future quarters.
On January 12, 2016, our board of directors authorized us to repurchase a total of up to
10,000,000
shares of our outstanding common stock. This authorization reaffirmed and incorporated the then-current balance of
4,000,000
shares that remained under a prior board-approved share repurchase program. The amount and timing of shares purchased under this
10,000,000
share repurchase program are subject to market and business conditions and other factors, and purchases may be made from time to time and at any time through open market or privately negotiated transactions. This share repurchase authorization will continue in effect until fully used or earlier terminated or suspended by the board of directors. As of November 30, 2016, we had repurchased
8,373,000
shares of our common stock pursuant to this authorization, at a total cost of
$85.9 million
. All of these share repurchases were made in the 2016 first quarter. We did not repurchase any of our common stock under this program in 2015 or 2014.
Our board of directors declared four quarterly cash dividends of
$.0250
per share of common stock in 2016, 2015 and 2014.
All dividends declared during 2016, 2015 and 2014 were also paid during those years.
Treasury Stock.
In addition to the shares purchased in 2016 pursuant to our share repurchase program, we acquired
$2.5 million
,
$.6 million
and
$.5 million
of our common stock in 2016, 2015 and 2014, respectively. All of the common stock acquired in 2015 and 2014 and a portion of the common stock acquired in 2016 consisted of previously issued shares delivered to us by employees to satisfy their withholding tax obligations on the vesting of restricted stock awards or of forfeitures of previous restricted stock awards. Treasury stock is recorded at cost. Differences between the cost of treasury stock and the reissuance proceeds are recorded to paid-in capital. These transactions are not considered repurchases under the
10,000,000
share repurchase program described above.
|
Note 18.
|
Accumulated Other Comprehensive Loss
|
The following table presents the changes in the balances of each component of accumulated other comprehensive loss (in thousands):
|
Postretirement Benefit Plan Adjustments
|
Total Accumulated Other Comprehensive Loss
|
||||
|
Balance at November 30, 2014
|
$
|
(21,008
|
)
|
||
|
Other comprehensive income before reclassifications
|
3,745
|
|
|||
|
Amounts reclassified from accumulated other comprehensive loss
|
2,404
|
|
|||
|
Income tax expense related to items of other comprehensive income
|
(2,460
|
)
|
|||
|
Other comprehensive income, net of tax
|
3,689
|
|
|||
|
Balance at November 30, 2015
|
(17,319
|
)
|
|||
|
Other comprehensive income before reclassifications
|
468
|
|
|||
|
Amounts reclassified from accumulated other comprehensive loss
|
1,635
|
|
|||
|
Income tax expense related to items of other comprehensive income
|
(841
|
)
|
|||
|
Other comprehensive income, net of tax
|
1,262
|
|
|||
|
Balance at November 30, 2016
|
$
|
(16,057
|
)
|
||
79
The amounts reclassified from accumulated other comprehensive loss consisted of the following (in thousands):
|
Years Ended November 30,
|
||||||||||||
|
Details About Accumulated Other Comprehensive Loss Components
|
2016
|
2015
|
2014
|
|||||||||
|
Postretirement benefit plan adjustments
|
||||||||||||
|
Amortization of net actuarial loss
|
$
|
79
|
|
$
|
848
|
|
$
|
357
|
|
|||
|
Amortization of prior service cost
|
1,556
|
|
1,556
|
|
1,556
|
|
||||||
|
Total reclassifications (a)
|
$
|
1,635
|
|
$
|
2,404
|
|
$
|
1,913
|
|
|||
|
(a)
|
The accumulated other comprehensive loss components are included in the computation of net periodic benefit costs as further discussed in Note 20 – Postretirement Benefits.
|
The estimated net actuarial loss and prior service cost expected to be amortized from accumulated other comprehensive loss into net periodic benefit cost during 2017 are
$.1 million
and
$1.6 million
, respectively.
|
Note 19.
|
Employee Benefit and Stock Plans
|
Most of our employees are eligible to participate in the KB Home 401(k) Savings Plan (“401(k) Plan”) under which we partially match employee contributions. The aggregate cost of the 401(k) Plan to us was
$5.3 million
in
2016
,
$4.6 million
in
2015
and
$3.8 million
in
2014
. The assets of the 401(k) Plan are held by a third-party trustee. The 401(k) Plan participants may direct the investment of their funds among one or more of the several fund options offered by the 401(k) Plan. As of
November 30, 2016
,
2015
and
2014
, approximately
5%
,
5%
and
6%
, respectively, of the 401(k) Plan’s net assets were invested in our common stock.
Approval of Amended KB Home 2014 Plan.
At our Annual Meeting of Stockholders held on April 7, 2016, our stockholders approved the Amended KB Home 2014 Equity Incentive Plan (“Amended 2014 Plan”), authorizing, among other things, the issuance for grants of stock-based awards to our employees, non-employee directors and consultants of up to
7,500,000
additional shares above the original
4,800,000
shares our stockholders approved under the plan (or an aggregate issuance of
12,300,000
shares), plus any shares that were available for grant as of April 7, 2014 under our 2010 Equity Incentive Plan (“2010 Plan”), and any shares subject to then-outstanding awards under the 2010 Plan that subsequently expire or are canceled, forfeited, tendered or withheld to satisfy tax withholding obligations with respect to full value awards, or settled for cash.
No
new awards may be made under the 2010 Plan. Therefore, the Amended 2014 Plan is our only active equity compensation plan. Under the Amended 2014 Plan, grants of stock options and other similar awards reduce the Amended 2014 Plan’s share capacity on a
1
-for-1 basis, and grants of restricted stock and other similar “full value” awards reduce the Amended 2014 Plan’s share capacity on a
1.78
-for-1 basis. In addition, subject to the Amended 2014 Plan’s terms and conditions, a stock-based award may also be granted under the Amended 2014 Plan to replace an outstanding award granted under another plan of ours (subject to the terms of such other plan) with terms substantially identical to those of the award being replaced.
The Amended 2014 Plan provides that stock options and SARs may be awarded for periods of up to
10 years
. The Amended 2014 Plan also enables us to grant cash bonuses and other stock-based awards. As of November 30, 2016, 2015, and 2014, in addition to awards outstanding under the Amended 2014 Plan, we had awards outstanding under the 2010 Plan and our Amended and Restated 1999 Incentive Plan, both of which provided for generally the same types of awards as the Amended 2014 Plan. We also had awards outstanding under our Performance-Based Incentive Plan for Senior Management, which provided for generally the same types of awards as the Amended 2014 Plan, but stock option awards granted under this plan had terms of up to
15 years
years.
Stock-Based Compensation.
With the approval of the management development and compensation committee, consisting entirely of independent members of our board of directors, we have provided compensation benefits to certain of our employees in the form of stock options, restricted stock, PSUs and SARs. Certain stock-based compensation benefits are also provided to our non-employee directors pursuant to the Director Plan. Compensation expense related to equity-based awards is included in selling, general and administrative expenses in our consolidated statements of operations.
80
The following table presents our stock-based compensation expense (in thousands):
|
Years Ended November 30,
|
|||||||||||
|
2016
|
2015
|
2014
|
|||||||||
|
Stock options (a)
|
$
|
7,076
|
|
$
|
7,576
|
|
$
|
3,024
|
|
||
|
Restricted stock
|
2,630
|
|
2,499
|
|
1,750
|
|
|||||
|
PSUs
|
5,343
|
|
5,404
|
|
3,699
|
|
|||||
|
Director awards
|
1,801
|
|
1,664
|
|
(91
|
)
|
|||||
|
Total
|
$
|
16,850
|
|
$
|
17,143
|
|
$
|
8,382
|
|
||
|
(a)
|
Compensation expense associated with stock options was accelerated in 2015 as a result of retirement provisions being met for certain stock option recipients.
|
Stock Options.
Stock option transactions are summarized as follows:
|
|
Years Ended November 30,
|
|||||||||||||||||||
|
|
2016
|
2015
|
2014
|
|||||||||||||||||
|
|
Options
|
Weighted
Average
Exercise
Price
|
Options
|
Weighted
Average
Exercise
Price
|
Options
|
Weighted
Average
Exercise
Price
|
||||||||||||||
|
Options outstanding at beginning of year
|
12,635,644
|
|
$
|
19.39
|
|
11,735,042
|
|
$
|
20.45
|
|
10,531,938
|
|
$
|
21.11
|
|
|||||
|
Granted
|
1,012,686
|
|
16.21
|
|
1,262,000
|
|
14.92
|
|
1,273,647
|
|
14.62
|
|
||||||||
|
Exercised
|
(551,898
|
)
|
13.95
|
|
(76,164
|
)
|
9.69
|
|
(36,665
|
)
|
7.92
|
|
||||||||
|
Cancelled
|
(364,887
|
)
|
34.07
|
|
(285,234
|
)
|
45.80
|
|
(33,878
|
)
|
20.25
|
|
||||||||
|
Options outstanding at end of year
|
12,731,545
|
|
$
|
18.95
|
|
12,635,644
|
|
$
|
19.39
|
|
11,735,042
|
|
$
|
20.45
|
|
|||||
|
Options exercisable at end of year
|
10,506,810
|
|
$
|
19.70
|
|
10,389,722
|
|
$
|
20.35
|
|
10,103,739
|
|
$
|
21.32
|
|
|||||
|
Options available for grant at end of year
|
7,034,523
|
|
1,554,195
|
|
3,514,077
|
|
||||||||||||||
The total intrinsic value of stock options exercised was
$1.4 million
for the year ended
November 30, 2016
,
$.4 million
for the year ended November 30,
2015
and
$.3 million
for the year ended November 30,
2014
. The aggregate intrinsic value of stock options outstanding was
$24.5 million
,
$16.4 million
and
$35.8 million
at
November 30, 2016
,
2015
and
2014
, respectively. The intrinsic value of stock options exercisable was
$23.3 million
at
November 30, 2016
,
$16.4 million
at November 30,
2015
, and
$31.7 million
at November 30,
2014
. The intrinsic value of a stock option is the amount by which the market value of the underlying stock exceeds the price of the option.
Stock options outstanding and stock options exercisable at
November 30, 2016
are summarized as follows:
|
|
Options Outstanding
|
Options Exercisable
|
||||||||||||||||||
|
Range of Exercise Price
|
Options
|
Weighted
Average
Exercise
Price
|
Weighted
Average
Remaining
Contractual
Life
|
Options
|
Weighted
Average
Exercise
Price
|
Weighted
Average
Remaining
Contractual
Life
|
||||||||||||||
|
$ 6.32 to $11.06
|
2,771,667
|
|
$
|
8.33
|
|
4.3
|
|
2,771,667
|
|
$
|
8.33
|
|
||||||||
|
$11.07 to $14.95
|
2,595,011
|
|
14.60
|
|
8.1
|
|
1,370,933
|
|
14.41
|
|
||||||||||
|
$14.96 to $16.69
|
2,668,775
|
|
15.94
|
|
6.2
|
|
1,668,118
|
|
15.78
|
|
||||||||||
|
$16.70 to $28.10
|
2,609,550
|
|
23.24
|
|
1.2
|
|
2,609,550
|
|
23.24
|
|
||||||||||
|
$28.11 to $69.63
|
2,086,542
|
|
36.97
|
|
1.9
|
|
2,086,542
|
|
36.97
|
|
||||||||||
|
$ 6.32 to $69.63
|
12,731,545
|
|
$
|
18.95
|
|
4.4
|
|
10,506,810
|
|
$
|
19.70
|
|
3.5
|
|
||||||
81
The weighted average grant date fair value of stock options granted in
2016
,
2015
and
2014
was
$5.82
,
$5.49
and
$5.07
, respectively. The fair value of each stock option grant is estimated on the date of grant using the Black-Scholes option-pricing model with the following assumptions:
|
|
Years Ended November 30,
|
|||||||
|
|
2016
|
2015
|
2014
|
|||||
|
Risk-free interest rate
|
1.3
|
%
|
1.4
|
%
|
1.6
|
%
|
||
|
Expected volatility factor
|
41.3
|
%
|
43.6
|
%
|
41.0
|
%
|
||
|
Expected dividend yield
|
.6
|
%
|
.7
|
%
|
.7
|
%
|
||
|
Expected term
|
5 years
|
|
5 years
|
|
5 years
|
|
||
The risk-free interest rate assumption is determined based on observed interest rates appropriate for the stock options’ expected term. The expected volatility factor is based on a combination of the historical volatility of our common stock and the implied volatility of publicly traded options on our stock. The expected dividend yield assumption is based on our history of dividend payouts. The expected term of employee stock options is estimated using historical data.
As of
November 30, 2016
, there was
$4.4 million
of total unrecognized stock-based compensation expense related to unvested stock option awards. This expense is expected to be recognized over a weighted average period of
1.7 years
.
We record proceeds from the exercise of stock options as additions to common stock and paid-in capital. The tax shortfalls of
$2.2 million
in
2016
,
$1.7 million
in
2015
and
$1.2 million
in
2014
resulting from the cancellation of stock awards were reflected in paid-in capital. In both
2016
and 2015, the consolidated statement of cash flows reflected
$.2 million
of excess tax benefits associated with the exercise of stock options. In
2014
, the consolidated statement of cash flows reflected
no
excess tax benefit associated with the exercise of stock options.
Restricted Stock.
From time to time, we grant restricted stock to various employees as a compensation benefit. During the restriction periods, these employees are entitled to vote and to receive cash dividends on such shares. The restrictions imposed with respect to the shares granted lapse in installments within, or in full at the end of,
three
years after their grant date if certain conditions are met.
Restricted stock transactions are summarized as follows:
|
|
Years Ended November 30,
|
|||||||||||||||||||
|
|
2016
|
2015
|
2014
|
|||||||||||||||||
|
|
Shares
|
Weighted
Average
per Share
Grant Date
Fair Value
|
Shares
|
Weighted
Average
per Share
Grant Date
Fair Value
|
Shares
|
Weighted
Average
per Share
Grant Date
Fair Value
|
||||||||||||||
|
Outstanding at beginning of year
|
416,977
|
|
$
|
15.88
|
|
355,294
|
|
$
|
15.81
|
|
219,628
|
|
$
|
16.23
|
|
|||||
|
Granted
|
453,703
|
|
15.73
|
|
285,006
|
|
15.19
|
|
219,835
|
|
15.34
|
|
||||||||
|
Vested
|
(252,854
|
)
|
14.78
|
|
(204,663
|
)
|
14.83
|
|
(73,908
|
)
|
16.52
|
|
||||||||
|
Cancelled
|
(13,207
|
)
|
15.12
|
|
(18,660
|
)
|
15.45
|
|
(10,261
|
)
|
18.55
|
|
||||||||
|
Outstanding at end of year
|
604,619
|
|
$
|
16.24
|
|
416,977
|
|
$
|
15.88
|
|
355,294
|
|
$
|
15.81
|
|
|||||
As of
November 30, 2016
, we had
$7.6 million
of total unrecognized compensation cost related to restricted stock awards that will be recognized over a weighted average period of approximately
three
years.
Performance-Based Restricted Stock Units.
On October 6, 2016, we granted PSUs to certain employees. Each PSU grant corresponds to a target amount of our common stock (“Award Shares”). Each PSU entitles the recipient to receive a grant of between
0%
and
200%
of the recipient’s Award Shares, and will vest based on our achieving, over a three-year period commencing on December 1, 2016 and ending on November 30, 2019, specified levels of (a) adjusted cumulative earnings per share (b) average adjusted return on invested capital and (c) revenue growth performance relative to a peer group of high-production public homebuilding companies. The grant date fair value of each such PSU was
$16.21
. On October 8, 2015, we granted PSUs to certain employees with similar terms as the 2016 PSU grants, except that the applicable performance period commenced on December 1, 2015 and ends on November 30, 2018. The grant date fair value of each such PSU was
$14.92
. On October 9, 2014,
82
we granted PSUs to certain employees with similar terms as the 2016 PSU grants, except that the applicable performance period commenced on December 1, 2014 and ends on November 30, 2017. The grant date fair value of each such 2014 PSU was
$14.62
.
PSU transactions are summarized as follows:
|
|
Years Ended November 30,
|
|||||||||||||||||||
|
|
2016
|
2015
|
2014
|
|||||||||||||||||
|
|
Shares
|
Weighted
Average
per Share
Grant Date
Fair Value
|
Shares
|
Weighted
Average
per Share
Grant Date
Fair Value
|
Shares
|
Weighted
Average
per Share
Grant Date
Fair Value
|
||||||||||||||
|
Outstanding at beginning of year
|
820,209
|
|
$
|
15.52
|
|
628,209
|
|
$
|
15.70
|
|
385,049
|
|
$
|
16.39
|
|
|||||
|
Granted
|
369,281
|
|
13.81
|
|
192,000
|
|
14.92
|
|
243,160
|
|
14.62
|
|
||||||||
|
Vested
|
(374,630
|
)
|
10.21
|
|
—
|
|
—
|
|
—
|
|
—
|
|
||||||||
|
Cancelled
|
(5,000
|
)
|
16.21
|
|
—
|
|
—
|
|
—
|
|
—
|
|
||||||||
|
Outstanding at end of year
|
809,860
|
|
$
|
17.19
|
|
820,209
|
|
$
|
15.52
|
|
628,209
|
|
$
|
15.70
|
|
|||||
The number of shares of our common stock actually granted to a recipient, if any, when a PSU vests will depend on the degree of achievement of the applicable performance measures during the applicable three-year period. The shares of our common stock that were granted under the terms of PSUs that vested in 2016 included an aggregate of
147,581
additional shares above the target amount awarded to the eligible recipients based on our achieving certain levels of average return on equity performance and revenue growth performance relative to a peer group of high-production homebuilding companies from December 1, 2012 through November 30, 2015. The PSUs do not have dividend or voting rights during the performance period. Compensation cost for PSUs is initially estimated based on target performance achievement and adjusted as appropriate throughout the performance period. Accordingly, future compensation costs associated with outstanding PSUs may increase or decrease based on the probability and extent of achievement with respect to the applicable performance measures. At
November 30, 2016
, we had
$11.3 million
of total unrecognized compensation cost related to unvested PSUs, which is expected to be recognized over a weighted-average period of approximately
three
years.
Stock Appreciation Rights.
In 2008, we granted SARs to various employees. These cash-settled awards have been accounted for as liabilities in our consolidated financial statements. Each SAR represents a right to receive a cash payment equal to the positive difference, if any, between the grant price and the market value of a share of our common stock on the date of exercise. The SARs vested in equal annual installments over
three years
. At
November 30, 2016
,
2015
and
2014
, we had
29,939
SARs outstanding, which are fully vested and will expire in
July 2017
.
Director Awards.
We have granted Director Plan SARs and deferred common stock awards to our non-employee directors pursuant to the terms of the Director Plan and elections made by each director. All of these awards were fully vested as of November 30, 2016. Director Plan SARs, which have not been granted since April 2014 as they ceased being a component of non-employee director compensation after that date, are stock settled, have terms of up to
15 years
and may be exercised when a respective director leaves the board or earlier if applicable stock ownership requirements have been met. Deferred common stock awards will be paid out at the earlier of a change in control or the date a respective director leaves the board. All Director Plan SARs were granted at an exercise price equal to the closing price of our common stock on the date of grant. At November 30, 2016, 2015 and 2014, our non-employee directors had, in aggregate,
452,983
of outstanding Director Plan SARs, and
485,632
,
419,962
and
358,404
, respectively, of outstanding deferred common stock awards. In addition, beginning in 2015, we have granted common stock on an unrestricted basis to our non-employee directors on the grant date pursuant to the Director Plan and elections made by each director.
Grantor Stock Ownership Trust.
We have a grantor stock ownership trust (“Trust”), administered by a third-party trustee, that holds and distributes the shares of common stock acquired to support certain employee compensation and employee benefit obligations under our existing stock option plan, the 401(k) Plan and other employee benefit plans. The existence of the Trust does not impact the amount of benefits or compensation that is paid under these plans.
For financial reporting purposes, the Trust is consolidated with us, and therefore any dividend transactions between us and the Trust are eliminated. Acquired shares held by the Trust remain valued at the market price on the date of purchase and are shown as a reduction to stockholders’ equity in the consolidated balance sheets. The difference between the Trust share value and the market value on the date shares are released from the Trust is included in paid-in capital. Common stock held in the Trust is
83
not considered outstanding in the computations of earnings per share. The Trust held
9,431,756
and
10,135,461
shares of common stock at
November 30, 2016
and
2015
, respectively. The trustee votes shares held by the Trust in accordance with voting directions from eligible employees, as specified in a trust agreement with the trustee.
|
Note 20.
|
Postretirement Benefits
|
We have a supplemental non-qualified, unfunded retirement plan, the KB Home Retirement Plan (“Retirement Plan”), effective as of July 11, 2002, pursuant to which we have offered to pay supplemental pension benefits to certain designated individuals (consisting of current and former employees) in connection with their retirement. The Retirement Plan was closed to new participants in 2004. We also have an unfunded death benefit plan, the KB Home Death Benefit Only Plan (“DBO Plan”), implemented on November 1, 2001, for certain designated individuals (consisting of current and former employees). The DBO Plan was closed to new participants in 2006.
In connection with these plans, we have purchased cost recovery life insurance contracts on the lives of the designated individuals. The insurance contracts associated with the plans are held by a trust. The trust is the owner and beneficiary of such insurance contracts. The amount of the insurance coverage under the contracts is designed to provide sufficient funds to cover all costs of the plans if assumptions made as to employment term, mortality experience, policy earnings and other factors, as applicable, are realized. The cash surrender value of the Retirement Plan life insurance contracts was
$44.4 million
at
November 30, 2016
and
$45.5 million
at
November 30, 2015
. We recognized investment gains on the cash surrender value of the Retirement Plan life insurance contracts of
$.4 million
in
2016
and
$1.8 million
in
2014
, and an investment loss of
$1.3 million
in
2015
. In
2016
,
2015
, and
2014
, we paid
$1.4 million
,
$1.4 million
and
$1.2 million
, respectively, in benefits under the Retirement Plan to eligible former employees. The cash surrender value of the DBO Plan life insurance contracts was
$17.0 million
at
November 30, 2016
and
$16.8 million
at
November 30, 2015
. We recognized investment gains on the cash surrender value of the DBO Plan life insurance contracts of
$.2 million
in
2016
and
$.7 million
in
2014
, and an investment loss of
$.3 million
in
2015
. We have not paid out any benefits under the DBO Plan.
The net periodic benefit cost of our Retirement Plan and DBO Plan consisted of the following (in thousands):
|
Years Ended November 30,
|
||||||||||||
|
2016
|
2015
|
2014
|
||||||||||
|
Interest cost
|
$
|
2,285
|
|
$
|
2,270
|
|
$
|
2,456
|
|
|||
|
Amortization of prior service cost
|
1,556
|
|
1,556
|
|
1,556
|
|
||||||
|
Service cost
|
1,045
|
|
1,142
|
|
1,184
|
|
||||||
|
Amortization of net actuarial loss
|
79
|
|
848
|
|
357
|
|
||||||
|
Total
|
$
|
4,965
|
|
$
|
5,816
|
|
$
|
5,553
|
|
|||
The liabilities related to these plans were
$62.2 million
at
November 30, 2016
and
$60.8 million
at
November 30, 2015
, and are included in accrued expenses and other liabilities in the consolidated balance sheets. For each of the years ended
November 30,
2016
and
2015
, the discount rate we used for the plans was
3.6%
.
Benefit payments under our Retirement Plan and DBO Plan are expected to be paid during each year ended November 30 as follows: 2017 —
$1.8 million
; 2018 —
$2.0 million
; 2019 —
$2.5 million
; 2020 —
$2.8 million
; 2021 —
$3.5 million
; and for the five years ended November 30, 2026 —
$19.7 million
in the aggregate.
84
|
Note 21.
|
Supplemental Disclosure to Consolidated Statements of Cash Flows
|
The following are supplemental disclosures to the consolidated statements of cash flows (in thousands):
|
|
Years Ended November 30,
|
||||||||||
|
|
2016
|
2015
|
2014
|
||||||||
|
Summary of cash and cash equivalents at the end of the year:
|
|||||||||||
|
Homebuilding
|
$
|
592,086
|
|
$
|
559,042
|
|
$
|
356,366
|
|
||
|
Financial services
|
914
|
|
1,299
|
|
2,402
|
|
|||||
|
Total
|
$
|
593,000
|
|
$
|
560,341
|
|
$
|
358,768
|
|
||
|
Supplemental disclosure of cash flow information:
|
|||||||||||
|
Interest paid, net of amounts capitalized
|
$
|
1,134
|
|
$
|
22,486
|
|
$
|
13,037
|
|
||
|
Income taxes paid
|
3,307
|
|
3,612
|
|
1,619
|
|
|||||
|
Income taxes refunded
|
550
|
|
11
|
|
1,728
|
|
|||||
|
Supplemental disclosure of noncash activities:
|
|||||||||||
|
Reclassification of warranty recoveries to receivables
|
$
|
2,151
|
|
$
|
7,238
|
|
$
|
18,110
|
|
||
|
Increase (decrease) in consolidated inventories not owned
|
(59,413
|
)
|
106,807
|
|
(5,755
|
)
|
|||||
|
Increase in inventories due to distributions of land and land development from an unconsolidated joint venture
|
4,277
|
|
12,705
|
|
90,115
|
|
|||||
|
Inventories and inventory-related obligations associated with TIFE assessments tied to distribution of land from an unconsolidated joint venture
|
—
|
|
—
|
|
33,197
|
|
|||||
|
Inventories acquired through seller financing
|
99,108
|
|
20,291
|
|
61,553
|
|
|||||
|
Conversion of liability awards to equity awards
|
—
|
|
—
|
|
6,455
|
|
|||||
85
|
Note 22.
|
Supplemental Guarantor Information
|
Our obligations to pay principal, premium, if any, and interest on the senior notes and borrowings, if any, under the Credit Facility are guaranteed on a joint and several basis by certain of our subsidiaries (“Guarantor Subsidiaries”). The guarantees are full and unconditional and the Guarantor Subsidiaries are
100%
owned by us. Pursuant to the terms of the indenture governing the senior notes and the terms of the Credit Facility, if any of the Guarantor Subsidiaries ceases to be a “significant subsidiary” as defined by Rule 1-02 of Regulation S-X (as in effect on June 1, 1996) using a
5%
rather than a 10% threshold (provided that the assets of our non-guarantor subsidiaries do not in the aggregate exceed
10%
of an adjusted measure of our consolidated total assets), it will be automatically and unconditionally released and discharged from its guaranty of the senior notes and the Credit Facility so long as all guarantees by such Guarantor Subsidiary of any other of our or our subsidiaries’ indebtedness are terminated at or prior to the time of such release. We have determined that separate, full financial statements of the Guarantor Subsidiaries would not be material to investors and, accordingly, supplemental financial information for the Guarantor Subsidiaries is presented.
The supplemental financial information for all periods presented below reflects those subsidiaries that were Guarantor Subsidiaries as of
November 30, 2016
.
Condensed Consolidating Statements of Operations (in thousands)
|
|
Year Ended November 30, 2016
|
||||||||||||||||||
|
|
KB Home
Corporate
|
Guarantor
Subsidiaries
|
Non-Guarantor
Subsidiaries
|
Consolidating
Adjustments
|
Total
|
||||||||||||||
|
Revenues
|
$
|
—
|
|
$
|
3,169,545
|
|
$
|
425,101
|
|
$
|
—
|
|
$
|
3,594,646
|
|
||||
|
Homebuilding:
|
|||||||||||||||||||
|
Revenues
|
$
|
—
|
|
$
|
3,169,545
|
|
$
|
413,398
|
|
$
|
—
|
|
$
|
3,582,943
|
|
||||
|
Construction and land costs
|
—
|
|
(2,661,888
|
)
|
(379,213
|
)
|
—
|
|
(3,041,101
|
)
|
|||||||||
|
Selling, general and administrative expenses
|
(91,859
|
)
|
(251,384
|
)
|
(46,198
|
)
|
—
|
|
(389,441
|
)
|
|||||||||
|
Operating income (loss)
|
(91,859
|
)
|
256,273
|
|
(12,013
|
)
|
—
|
|
152,401
|
|
|||||||||
|
Interest income
|
470
|
|
55
|
|
4
|
|
—
|
|
529
|
|
|||||||||
|
Interest expense
|
(177,329
|
)
|
(3,958
|
)
|
(3,946
|
)
|
179,333
|
|
(5,900
|
)
|
|||||||||
|
Intercompany interest
|
301,432
|
|
(107,388
|
)
|
(14,711
|
)
|
(179,333
|
)
|
—
|
|
|||||||||
|
Equity in loss of unconsolidated joint ventures
|
—
|
|
(2,179
|
)
|
(2
|
)
|
—
|
|
(2,181
|
)
|
|||||||||
|
Homebuilding pretax income (loss)
|
32,714
|
|
142,803
|
|
(30,668
|
)
|
—
|
|
144,849
|
|
|||||||||
|
Financial services pretax income
|
—
|
|
—
|
|
4,466
|
|
—
|
|
4,466
|
|
|||||||||
|
Total pretax income (loss)
|
32,714
|
|
142,803
|
|
(26,202
|
)
|
—
|
|
149,315
|
|
|||||||||
|
Income tax benefit (expense)
|
17,200
|
|
(52,700
|
)
|
(8,200
|
)
|
—
|
|
(43,700
|
)
|
|||||||||
|
Equity in net income of subsidiaries
|
55,701
|
|
—
|
|
—
|
|
(55,701
|
)
|
—
|
|
|||||||||
|
Net income (loss)
|
$
|
105,615
|
|
$
|
90,103
|
|
$
|
(34,402
|
)
|
$
|
(55,701
|
)
|
$
|
105,615
|
|
||||
86
|
|
Year Ended November 30, 2015
|
||||||||||||||||||
|
|
KB Home
Corporate
|
Guarantor
Subsidiaries
|
Non-Guarantor
Subsidiaries
|
Consolidating
Adjustments
|
Total
|
||||||||||||||
|
Revenues
|
$
|
—
|
|
$
|
2,640,678
|
|
$
|
391,352
|
|
$
|
—
|
|
$
|
3,032,030
|
|
||||
|
Homebuilding:
|
|||||||||||||||||||
|
Revenues
|
$
|
—
|
|
$
|
2,640,678
|
|
$
|
380,309
|
|
$
|
—
|
|
$
|
3,020,987
|
|
||||
|
Construction and land costs
|
—
|
|
(2,196,228
|
)
|
(343,140
|
)
|
—
|
|
(2,539,368
|
)
|
|||||||||
|
Selling, general and administrative expenses
|
(86,053
|
)
|
(213,292
|
)
|
(43,653
|
)
|
—
|
|
(342,998
|
)
|
|||||||||
|
Operating income (loss)
|
(86,053
|
)
|
231,158
|
|
(6,484
|
)
|
—
|
|
138,621
|
|
|||||||||
|
Interest income
|
451
|
|
6
|
|
1
|
|
—
|
|
458
|
|
|||||||||
|
Interest expense
|
(180,701
|
)
|
(6,184
|
)
|
—
|
|
165,029
|
|
(21,856
|
)
|
|||||||||
|
Intercompany interest
|
289,727
|
|
(101,540
|
)
|
(23,158
|
)
|
(165,029
|
)
|
—
|
|
|||||||||
|
Equity in loss of unconsolidated joint ventures
|
—
|
|
(1,803
|
)
|
(1
|
)
|
—
|
|
(1,804
|
)
|
|||||||||
|
Homebuilding pretax income (loss)
|
23,424
|
|
121,637
|
|
(29,642
|
)
|
—
|
|
115,419
|
|
|||||||||
|
Financial services pretax income
|
—
|
|
—
|
|
11,624
|
|
—
|
|
11,624
|
|
|||||||||
|
Total pretax income (loss)
|
23,424
|
|
121,637
|
|
(18,018
|
)
|
—
|
|
127,043
|
|
|||||||||
|
Income tax benefit (expense)
|
2,000
|
|
(46,700
|
)
|
2,300
|
|
—
|
|
(42,400
|
)
|
|||||||||
|
Equity in net income of subsidiaries
|
59,219
|
|
—
|
|
—
|
|
(59,219
|
)
|
—
|
|
|||||||||
|
Net income (loss)
|
$
|
84,643
|
|
$
|
74,937
|
|
$
|
(15,718
|
)
|
$
|
(59,219
|
)
|
$
|
84,643
|
|
||||
|
|
Year Ended November 30, 2014
|
||||||||||||||||||
|
|
KB Home
Corporate
|
Guarantor
Subsidiaries
|
Non-Guarantor
Subsidiaries
|
Consolidating
Adjustments
|
Total
|
||||||||||||||
|
Revenues
|
$
|
—
|
|
$
|
2,017,170
|
|
$
|
383,779
|
|
$
|
—
|
|
$
|
2,400,949
|
|
||||
|
Homebuilding:
|
|||||||||||||||||||
|
Revenues
|
$
|
—
|
|
$
|
2,017,170
|
|
$
|
372,473
|
|
$
|
—
|
|
$
|
2,389,643
|
|
||||
|
Construction and land costs
|
—
|
|
(1,658,925
|
)
|
(326,726
|
)
|
—
|
|
(1,985,651
|
)
|
|||||||||
|
Selling, general and administrative expenses
|
(68,717
|
)
|
(176,795
|
)
|
(42,511
|
)
|
—
|
|
(288,023
|
)
|
|||||||||
|
Operating income (loss)
|
(68,717
|
)
|
181,450
|
|
3,236
|
|
—
|
|
115,969
|
|
|||||||||
|
Interest income
|
432
|
|
9
|
|
2
|
|
—
|
|
443
|
|
|||||||||
|
Interest expense
|
(165,485
|
)
|
(6,056
|
)
|
—
|
|
140,791
|
|
(30,750
|
)
|
|||||||||
|
Intercompany interest
|
287,017
|
|
(118,901
|
)
|
(27,325
|
)
|
(140,791
|
)
|
—
|
|
|||||||||
|
Equity in income (loss) of unconsolidated joint ventures
|
—
|
|
(2,549
|
)
|
3,290
|
|
—
|
|
741
|
|
|||||||||
|
Homebuilding pretax income (loss)
|
53,247
|
|
53,953
|
|
(20,797
|
)
|
—
|
|
86,403
|
|
|||||||||
|
Financial services pretax income
|
—
|
|
—
|
|
8,546
|
|
—
|
|
8,546
|
|
|||||||||
|
Total pretax income (loss)
|
53,247
|
|
53,953
|
|
(12,251
|
)
|
—
|
|
94,949
|
|
|||||||||
|
Income tax benefit
|
215,691
|
|
507,997
|
|
99,712
|
|
—
|
|
823,400
|
|
|||||||||
|
Equity in net income of subsidiaries
|
649,411
|
|
—
|
|
—
|
|
(649,411
|
)
|
—
|
|
|||||||||
|
Net income
|
$
|
918,349
|
|
$
|
561,950
|
|
$
|
87,461
|
|
$
|
(649,411
|
)
|
$
|
918,349
|
|
||||
87
Condensed Consolidating Statements of Comprehensive Income (Loss) (in thousands)
|
|
Year Ended November 30, 2016
|
||||||||||||||||||
|
|
KB Home
Corporate
|
Guarantor
Subsidiaries
|
Non-Guarantor
Subsidiaries
|
Consolidating
Adjustments
|
Total
|
||||||||||||||
|
Net income (loss)
|
$
|
105,615
|
|
$
|
90,103
|
|
$
|
(34,402
|
)
|
$
|
(55,701
|
)
|
$
|
105,615
|
|
||||
|
Other comprehensive income:
|
|||||||||||||||||||
|
Postretirement benefit plan adjustments
|
2,103
|
|
—
|
|
—
|
|
—
|
|
2,103
|
|
|||||||||
|
Other comprehensive income before tax
|
2,103
|
|
—
|
|
—
|
|
—
|
|
2,103
|
|
|||||||||
|
Income tax expense related to items of other comprehensive income
|
(841
|
)
|
—
|
|
—
|
|
—
|
|
(841
|
)
|
|||||||||
|
Other comprehensive income, net of tax
|
1,262
|
|
—
|
|
—
|
|
—
|
|
1,262
|
|
|||||||||
|
Comprehensive income (loss)
|
$
|
106,877
|
|
$
|
90,103
|
|
$
|
(34,402
|
)
|
$
|
(55,701
|
)
|
$
|
106,877
|
|
||||
|
|
Year Ended November 30, 2015
|
||||||||||||||||||
|
|
KB Home
Corporate
|
Guarantor
Subsidiaries
|
Non-Guarantor
Subsidiaries
|
Consolidating
Adjustments
|
Total
|
||||||||||||||
|
Net income (loss)
|
$
|
84,643
|
|
$
|
74,937
|
|
$
|
(15,718
|
)
|
$
|
(59,219
|
)
|
$
|
84,643
|
|
||||
|
Other comprehensive income:
|
|||||||||||||||||||
|
Postretirement benefit plan adjustments
|
6,149
|
|
—
|
|
—
|
|
—
|
|
6,149
|
|
|||||||||
|
Other comprehensive income before tax
|
6,149
|
|
—
|
|
—
|
|
—
|
|
6,149
|
|
|||||||||
|
Income tax expense related to items of other comprehensive income
|
(2,460
|
)
|
—
|
|
—
|
|
—
|
|
(2,460
|
)
|
|||||||||
|
Other comprehensive income, net of tax
|
3,689
|
|
—
|
|
—
|
|
—
|
|
3,689
|
|
|||||||||
|
Comprehensive income (loss)
|
$
|
88,332
|
|
$
|
74,937
|
|
$
|
(15,718
|
)
|
$
|
(59,219
|
)
|
$
|
88,332
|
|
||||
|
|
Year Ended November 30, 2014
|
||||||||||||||||||
|
|
KB Home
Corporate
|
Guarantor
Subsidiaries
|
Non-Guarantor
Subsidiaries
|
Consolidating
Adjustments
|
Total
|
||||||||||||||
|
Net income
|
$
|
918,349
|
|
$
|
561,950
|
|
$
|
87,461
|
|
$
|
(649,411
|
)
|
$
|
918,349
|
|
||||
|
Other comprehensive loss:
|
|||||||||||||||||||
|
Postretirement benefit plan adjustments
|
(1,888
|
)
|
—
|
|
—
|
|
—
|
|
(1,888
|
)
|
|||||||||
|
Other comprehensive loss before tax
|
(1,888
|
)
|
—
|
|
—
|
|
—
|
|
(1,888
|
)
|
|||||||||
|
Income tax expense related to items of other comprehensive income
|
(1,604
|
)
|
—
|
|
—
|
|
—
|
|
(1,604
|
)
|
|||||||||
|
Other comprehensive loss, net of tax
|
(3,492
|
)
|
—
|
|
—
|
|
—
|
|
(3,492
|
)
|
|||||||||
|
Comprehensive income
|
$
|
914,857
|
|
$
|
561,950
|
|
$
|
87,461
|
|
$
|
(649,411
|
)
|
$
|
914,857
|
|
||||
88
Condensed Consolidating Balance Sheets (in thousands)
|
|
November 30, 2016
|
||||||||||||||||||
|
|
KB Home
Corporate
|
Guarantor
Subsidiaries
|
Non-Guarantor
Subsidiaries
|
Consolidating
Adjustments
|
Total
|
||||||||||||||
|
Assets
|
|||||||||||||||||||
|
Homebuilding:
|
|||||||||||||||||||
|
Cash and cash equivalents
|
$
|
463,100
|
|
$
|
100,439
|
|
$
|
28,547
|
|
$
|
—
|
|
$
|
592,086
|
|
||||
|
Restricted cash
|
—
|
|
—
|
|
—
|
|
—
|
|
—
|
|
|||||||||
|
Receivables
|
4,807
|
|
135,915
|
|
90,943
|
|
—
|
|
231,665
|
|
|||||||||
|
Inventories
|
—
|
|
3,048,132
|
|
355,096
|
|
—
|
|
3,403,228
|
|
|||||||||
|
Investments in unconsolidated joint ventures
|
—
|
|
61,517
|
|
2,499
|
|
—
|
|
64,016
|
|
|||||||||
|
Deferred tax assets, net
|
276,737
|
|
318,077
|
|
144,171
|
|
—
|
|
738,985
|
|
|||||||||
|
Other assets
|
79,526
|
|
9,177
|
|
2,442
|
|
—
|
|
91,145
|
|
|||||||||
|
824,170
|
|
3,673,257
|
|
623,698
|
|
—
|
|
5,121,125
|
|
||||||||||
|
Financial services
|
—
|
|
—
|
|
10,499
|
|
—
|
|
10,499
|
|
|||||||||
|
Intercompany receivables
|
3,559,012
|
|
—
|
|
97,062
|
|
(3,656,074
|
)
|
—
|
|
|||||||||
|
Investments in subsidiaries
|
35,965
|
|
—
|
|
—
|
|
(35,965
|
)
|
—
|
|
|||||||||
|
Total assets
|
$
|
4,419,147
|
|
$
|
3,673,257
|
|
$
|
731,259
|
|
$
|
(3,692,039
|
)
|
$
|
5,131,624
|
|
||||
|
Liabilities and stockholders’ equity
|
|||||||||||||||||||
|
Homebuilding:
|
|||||||||||||||||||
|
Accounts payable, accrued expenses and other liabilities
|
$
|
131,530
|
|
$
|
397,605
|
|
$
|
237,192
|
|
$
|
—
|
|
$
|
766,327
|
|
||||
|
Notes payable
|
2,548,112
|
|
66,927
|
|
25,110
|
|
—
|
|
2,640,149
|
|
|||||||||
|
2,679,642
|
|
464,532
|
|
262,302
|
|
—
|
|
3,406,476
|
|
||||||||||
|
Financial services
|
—
|
|
—
|
|
2,003
|
|
—
|
|
2,003
|
|
|||||||||
|
Intercompany payables
|
16,360
|
|
3,208,725
|
|
430,989
|
|
(3,656,074
|
)
|
—
|
|
|||||||||
|
Stockholders’ equity
|
1,723,145
|
|
—
|
|
35,965
|
|
(35,965
|
)
|
1,723,145
|
|
|||||||||
|
Total liabilities and stockholders’ equity
|
$
|
4,419,147
|
|
$
|
3,673,257
|
|
$
|
731,259
|
|
$
|
(3,692,039
|
)
|
$
|
5,131,624
|
|
||||
89
|
|
November 30, 2015
|
||||||||||||||||||
|
|
KB Home
Corporate
|
Guarantor
Subsidiaries
|
Non-Guarantor
Subsidiaries
|
Consolidating
Adjustments
|
Total
|
||||||||||||||
|
Assets
|
|||||||||||||||||||
|
Homebuilding:
|
|||||||||||||||||||
|
Cash and cash equivalents
|
$
|
444,850
|
|
$
|
96,741
|
|
$
|
17,451
|
|
$
|
—
|
|
$
|
559,042
|
|
||||
|
Restricted cash
|
9,344
|
|
—
|
|
—
|
|
—
|
|
9,344
|
|
|||||||||
|
Receivables
|
39
|
|
145,022
|
|
102,937
|
|
—
|
|
247,998
|
|
|||||||||
|
Inventories
|
—
|
|
2,900,202
|
|
413,545
|
|
—
|
|
3,313,747
|
|
|||||||||
|
Investments in unconsolidated joint ventures
|
—
|
|
69,057
|
|
2,501
|
|
—
|
|
71,558
|
|
|||||||||
|
Deferred tax assets, net
|
190,770
|
|
465,105
|
|
126,321
|
|
—
|
|
782,196
|
|
|||||||||
|
Other assets
|
73,808
|
|
11,198
|
|
3,986
|
|
—
|
|
88,992
|
|
|||||||||
|
718,811
|
|
3,687,325
|
|
666,741
|
|
—
|
|
5,072,877
|
|
||||||||||
|
Financial services
|
—
|
|
—
|
|
14,028
|
|
—
|
|
14,028
|
|
|||||||||
|
Intercompany receivables
|
3,627,150
|
|
—
|
|
102,103
|
|
(3,729,253
|
)
|
—
|
|
|||||||||
|
Investments in subsidiaries
|
39,383
|
|
—
|
|
—
|
|
(39,383
|
)
|
—
|
|
|||||||||
|
Total assets
|
$
|
4,385,344
|
|
$
|
3,687,325
|
|
$
|
782,872
|
|
$
|
(3,768,636
|
)
|
$
|
5,086,905
|
|
||||
|
Liabilities and stockholders’ equity
|
|||||||||||||||||||
|
Homebuilding:
|
|||||||||||||||||||
|
Accounts payable, accrued expenses and other liabilities
|
$
|
136,352
|
|
$
|
417,315
|
|
$
|
238,833
|
|
$
|
—
|
|
$
|
792,500
|
|
||||
|
Notes payable
|
2,540,980
|
|
35,664
|
|
25,110
|
|
—
|
|
2,601,754
|
|
|||||||||
|
2,677,332
|
|
452,979
|
|
263,943
|
|
—
|
|
3,394,254
|
|
||||||||||
|
Financial services
|
—
|
|
—
|
|
1,817
|
|
—
|
|
1,817
|
|
|||||||||
|
Intercompany payables
|
17,178
|
|
3,234,346
|
|
477,729
|
|
(3,729,253
|
)
|
—
|
|
|||||||||
|
Stockholders’ equity
|
1,690,834
|
|
—
|
|
39,383
|
|
(39,383
|
)
|
1,690,834
|
|
|||||||||
|
Total liabilities and stockholders’ equity
|
$
|
4,385,344
|
|
$
|
3,687,325
|
|
$
|
782,872
|
|
$
|
(3,768,636
|
)
|
$
|
5,086,905
|
|
||||
90
Condensed Consolidating Statements of Cash Flows (in thousands)
|
|
Year Ended November 30, 2016
|
||||||||||||||||||
|
|
KB Home
Corporate
|
Guarantor
Subsidiaries
|
Non-Guarantor
Subsidiaries
|
Consolidating
Adjustments
|
Total
|
||||||||||||||
|
Net cash provided by (used in) operating activities
|
$
|
(40,277
|
)
|
$
|
188,372
|
|
$
|
40,560
|
|
$
|
—
|
|
$
|
188,655
|
|
||||
|
Cash flows from investing activities:
|
|||||||||||||||||||
|
Contributions to unconsolidated joint ventures
|
—
|
|
(4,852
|
)
|
(750
|
)
|
—
|
|
(5,602
|
)
|
|||||||||
|
Return of investments in unconsolidated joint ventures
|
—
|
|
4,307
|
|
—
|
|
—
|
|
4,307
|
|
|||||||||
|
Purchases of property and equipment, net
|
(4,052
|
)
|
(555
|
)
|
(177
|
)
|
—
|
|
(4,784
|
)
|
|||||||||
|
Intercompany
|
144,651
|
|
—
|
|
—
|
|
(144,651
|
)
|
—
|
|
|||||||||
|
Net cash provided by (used in) investing activities
|
140,599
|
|
(1,100
|
)
|
(927
|
)
|
(144,651
|
)
|
(6,079
|
)
|
|||||||||
|
Cash flows from financing activities:
|
|||||||||||||||||||
|
Change in restricted cash
|
9,344
|
|
—
|
|
—
|
|
—
|
|
9,344
|
|
|||||||||
|
Payments on mortgages and land contracts due to land sellers and other loans
|
—
|
|
(67,845
|
)
|
—
|
|
—
|
|
(67,845
|
)
|
|||||||||
|
Issuance of common stock under employee stock plans
|
5,343
|
|
—
|
|
—
|
|
—
|
|
5,343
|
|
|||||||||
|
Excess tax benefits from stock-based compensation
|
186
|
|
—
|
|
—
|
|
—
|
|
186
|
|
|||||||||
|
Payments of cash dividends
|
(8,586
|
)
|
—
|
|
—
|
|
—
|
|
(8,586
|
)
|
|||||||||
|
Stock repurchases
|
(88,359
|
)
|
—
|
|
—
|
|
—
|
|
(88,359
|
)
|
|||||||||
|
Intercompany
|
—
|
|
(115,729
|
)
|
(28,922
|
)
|
144,651
|
|
—
|
|
|||||||||
|
Net cash used in financing activities
|
(82,072
|
)
|
(183,574
|
)
|
(28,922
|
)
|
144,651
|
|
(149,917
|
)
|
|||||||||
|
Net increase in cash and cash equivalents
|
18,250
|
|
3,698
|
|
10,711
|
|
—
|
|
32,659
|
|
|||||||||
|
Cash and cash equivalents at beginning of year
|
444,850
|
|
96,741
|
|
18,750
|
|
—
|
|
560,341
|
|
|||||||||
|
Cash and cash equivalents at end of year
|
$
|
463,100
|
|
$
|
100,439
|
|
$
|
29,461
|
|
$
|
—
|
|
$
|
593,000
|
|
||||
91
|
|
Year Ended November 30, 2015
|
||||||||||||||||||
|
|
KB Home
Corporate
|
Guarantor
Subsidiaries
|
Non-Guarantor
Subsidiaries
|
Consolidating
Adjustments
|
Total
|
||||||||||||||
|
Net cash provided by operating activities
|
$
|
44,422
|
|
$
|
110,688
|
|
$
|
26,075
|
|
$
|
—
|
|
$
|
181,185
|
|
||||
|
Cash flows from investing activities:
|
|||||||||||||||||||
|
Contributions to unconsolidated joint ventures
|
—
|
|
(20,625
|
)
|
(1
|
)
|
—
|
|
(20,626
|
)
|
|||||||||
|
Return of investments in unconsolidated joint ventures
|
—
|
|
14,000
|
|
—
|
|
—
|
|
14,000
|
|
|||||||||
|
Purchases of property and equipment, net
|
(2,890
|
)
|
(1,271
|
)
|
(516
|
)
|
—
|
|
(4,677
|
)
|
|||||||||
|
Intercompany
|
45,470
|
|
—
|
|
—
|
|
(45,470
|
)
|
—
|
|
|||||||||
|
Net cash provided by (used in) investing activities
|
42,580
|
|
(7,896
|
)
|
(517
|
)
|
(45,470
|
)
|
(11,303
|
)
|
|||||||||
|
Cash flows from financing activities:
|
|||||||||||||||||||
|
Change in restricted cash
|
17,891
|
|
—
|
|
—
|
|
—
|
|
17,891
|
|
|||||||||
|
Proceeds from issuance of debt
|
250,000
|
|
—
|
|
—
|
|
—
|
|
250,000
|
|
|||||||||
|
Payment of debt issuance costs
|
(4,561
|
)
|
—
|
|
—
|
|
—
|
|
(4,561
|
)
|
|||||||||
|
Repayment of senior notes
|
(199,906
|
)
|
—
|
|
—
|
|
—
|
|
(199,906
|
)
|
|||||||||
|
Payments on mortgages and land contracts due to land sellers and other loans
|
—
|
|
(22,877
|
)
|
—
|
|
—
|
|
(22,877
|
)
|
|||||||||
|
Issuance of common stock under employee stock plans
|
740
|
|
—
|
|
—
|
|
—
|
|
740
|
|
|||||||||
|
Excess tax benefits from stock-based compensation
|
157
|
|
—
|
|
—
|
|
—
|
|
157
|
|
|||||||||
|
Payments of cash dividends
|
(9,186
|
)
|
—
|
|
—
|
|
—
|
|
(9,186
|
)
|
|||||||||
|
Stock repurchases
|
(567
|
)
|
—
|
|
—
|
|
—
|
|
(567
|
)
|
|||||||||
|
Intercompany
|
—
|
|
(19,586
|
)
|
(25,884
|
)
|
45,470
|
|
—
|
|
|||||||||
|
Net cash provided by (used in) financing activities
|
54,568
|
|
(42,463
|
)
|
(25,884
|
)
|
45,470
|
|
31,691
|
|
|||||||||
|
Net increase (decrease) in cash and cash equivalents
|
141,570
|
|
60,329
|
|
(326
|
)
|
—
|
|
201,573
|
|
|||||||||
|
Cash and cash equivalents at beginning of year
|
303,280
|
|
36,412
|
|
19,076
|
|
—
|
|
358,768
|
|
|||||||||
|
Cash and cash equivalents at end of year
|
$
|
444,850
|
|
$
|
96,741
|
|
$
|
18,750
|
|
$
|
—
|
|
$
|
560,341
|
|
||||
92
|
|
Year Ended November 30, 2014
|
||||||||||||||||||
|
|
KB Home
Corporate
|
Guarantor
Subsidiaries
|
Non-Guarantor
Subsidiaries
|
Consolidating
Adjustments
|
Total
|
||||||||||||||
|
Net cash provided by (used in) operating activities
|
$
|
82,629
|
|
$
|
(641,728
|
)
|
$
|
(71,592
|
)
|
$
|
—
|
|
$
|
(630,691
|
)
|
||||
|
Cash flows from investing activities:
|
|||||||||||||||||||
|
Contributions to unconsolidated joint ventures
|
—
|
|
(48,846
|
)
|
(251
|
)
|
—
|
|
(49,097
|
)
|
|||||||||
|
Proceeds from sale of investment in unconsolidated joint venture
|
—
|
|
—
|
|
10,110
|
|
—
|
|
10,110
|
|
|||||||||
|
Purchases of property and equipment, net
|
(208
|
)
|
(4,145
|
)
|
(1,442
|
)
|
—
|
|
(5,795
|
)
|
|||||||||
|
Intercompany
|
(794,624
|
)
|
—
|
|
—
|
|
794,624
|
|
—
|
|
|||||||||
|
Net cash provided by (used in) investing activities
|
(794,832
|
)
|
(52,991
|
)
|
8,417
|
|
794,624
|
|
(44,782
|
)
|
|||||||||
|
Cash flows from financing activities:
|
|||||||||||||||||||
|
Change in restricted cash
|
14,671
|
|
—
|
|
—
|
|
—
|
|
14,671
|
|
|||||||||
|
Proceeds from issuance of debt
|
400,000
|
|
—
|
|
—
|
|
—
|
|
400,000
|
|
|||||||||
|
Payment of debt issuance costs
|
(5,448
|
)
|
—
|
|
—
|
|
—
|
|
(5,448
|
)
|
|||||||||
|
Payments on mortgages and land contracts due to land sellers and other loans
|
—
|
|
(36,918
|
)
|
—
|
|
—
|
|
(36,918
|
)
|
|||||||||
|
Proceeds from issuance of common stock, net
|
137,045
|
|
—
|
|
—
|
|
—
|
|
137,045
|
|
|||||||||
|
Issuance of common stock under employee stock plans
|
1,896
|
|
—
|
|
—
|
|
—
|
|
1,896
|
|
|||||||||
|
Payments of cash dividends
|
(8,982
|
)
|
—
|
|
—
|
|
—
|
|
(8,982
|
)
|
|||||||||
|
Stock repurchases
|
(546
|
)
|
—
|
|
—
|
|
—
|
|
(546
|
)
|
|||||||||
|
Intercompany
|
—
|
|
730,719
|
|
63,905
|
|
(794,624
|
)
|
—
|
|
|||||||||
|
Net cash provided by financing activities
|
538,636
|
|
693,801
|
|
63,905
|
|
(794,624
|
)
|
501,718
|
|
|||||||||
|
Net increase (decrease) in cash and cash equivalents
|
(173,567
|
)
|
(918
|
)
|
730
|
|
—
|
|
(173,755
|
)
|
|||||||||
|
Cash and cash equivalents at beginning of year
|
476,847
|
|
37,330
|
|
18,346
|
|
—
|
|
532,523
|
|
|||||||||
|
Cash and cash equivalents at end of year
|
$
|
303,280
|
|
$
|
36,412
|
|
$
|
19,076
|
|
$
|
—
|
|
$
|
358,768
|
|
||||
93
|
Note 23.
|
Quarterly Results (unaudited)
|
The following tables present our consolidated quarterly results for the years ended
November 30, 2016
and
2015
(in thousands, except per share amounts):
|
First Quarter
|
Second Quarter
|
Third Quarter
|
Fourth Quarter
|
||||||||||||
|
2016
|
|||||||||||||||
|
Revenues
|
$
|
678,371
|
|
$
|
811,050
|
|
$
|
913,283
|
|
$
|
1,191,942
|
|
|||
|
Gross profits
|
108,694
|
|
121,465
|
|
151,902
|
|
167,667
|
|
|||||||
|
Inventory impairment and land option contract abandonment charges
|
1,966
|
|
11,740
|
|
3,052
|
|
36,054
|
|
|||||||
|
Pretax income
|
16,027
|
|
24,797
|
|
53,463
|
|
55,028
|
|
|||||||
|
Net income
|
13,127
|
|
15,597
|
|
39,363
|
|
37,528
|
|
|||||||
|
Earnings per share:
|
|||||||||||||||
|
Basic
|
$
|
.15
|
|
$
|
.18
|
|
$
|
.46
|
|
$
|
.44
|
|
|||
|
Diluted
|
.14
|
|
.17
|
|
.42
|
|
.40
|
|
|||||||
|
2015
|
|||||||||||||||
|
Revenues
|
$
|
580,121
|
|
$
|
622,969
|
|
$
|
843,157
|
|
$
|
985,783
|
|
|||
|
Gross profits
|
86,739
|
|
97,631
|
|
133,099
|
|
171,482
|
|
|||||||
|
Inventory impairment and land option contract abandonment charges
|
448
|
|
536
|
|
3,532
|
|
5,075
|
|
|||||||
|
Pretax income
|
10,499
|
|
12,673
|
|
33,954
|
|
69,917
|
|
|||||||
|
Net income
|
7,799
|
|
9,573
|
|
23,254
|
|
44,017
|
|
|||||||
|
Earnings per share:
|
|||||||||||||||
|
Basic
|
$
|
.08
|
|
$
|
.10
|
|
$
|
.25
|
|
$
|
.48
|
|
|||
|
Diluted
|
.08
|
|
.10
|
|
.23
|
|
.43
|
|
|||||||
Quarterly and year-to-date computations of per share amounts are made independently. Therefore, the sum of per share amounts for the quarters may not agree with per share amounts for the year.
|
Note 24.
|
Subsequent Event
|
On December 14, 2016, we elected to exercise our optional redemption rights under the terms of our
9.10%
Senior Notes due 2017, which mature on September 15, 2017. On January 13, 2017, we redeemed
$100.0 million
in aggregate principal amount of the notes outstanding at the redemption price calculated in accordance with the “make-whole” provisions of the notes. We used internally generated cash to fund this redemption. Upon this redemption,
$165.0 million
in aggregate principal amount of the notes remained outstanding. In connection with this early extinguishment of debt, we will recognize a charge of approximately
$5.4 million
in the 2017 first quarter. Additional information about the redemption is set forth in our Current Report on Form 8-K dated December 15, 2016.
94
REPORT OF INDEPENDENT REGISTERED PUBLIC ACCOUNTING FIRM
The Board of Directors and Stockholders of KB Home:
We have audited the accompanying consolidated balance sheets of KB Home as of
November 30, 2016
and
2015
, and the related consolidated statements of operations, comprehensive income, stockholders’ equity, and cash flows for each of the three years in the period ended
November 30, 2016
. These financial statements are the responsibility of the Company’s management. Our responsibility is to express an opinion on these financial statements based on our audits.
We conducted our audits in accordance with the standards of the Public Company Accounting Oversight Board (United States). Those standards require that we plan and perform the audit to obtain reasonable assurance about whether the financial statements are free of material misstatement. An audit includes examining, on a test basis, evidence supporting the amounts and disclosures in the financial statements. An audit also includes assessing the accounting principles used and significant estimates made by management, as well as evaluating the overall financial statement presentation. We believe that our audits provide a reasonable basis for our opinion.
In our opinion, the financial statements referred to above present fairly, in all material respects, the consolidated financial position of KB Home at
November 30, 2016
and
2015
, and the consolidated results of its operations and its cash flows for each of the three years in the period ended
November 30, 2016
, in conformity with U.S. generally accepted accounting principles.
We also have audited, in accordance with the standards of the Public Company Accounting Oversight Board (United States), KB Home’s internal control over financial reporting as of
November 30, 2016
, based on criteria established in Internal Control — Integrated Framework issued by the Committee of Sponsoring Organizations of the Treadway Commission (2013 Framework) and our report dated
January 27, 2017
expressed an unqualified opinion thereon.
As discussed in Note 1 to the Consolidated Financial Statements in this report, the Company changed its presentation of debt issuance costs as a result of the adoption of the amendments to the FASB Accounting Standards Codification resulting from Accounting Standards Update No. 2015-03, “Interest — Imputation of Interest (Subtopic 835-30): Simplifying the Presentation of Debt Issuance Costs,” effective November 30, 2016.
/s/ Ernst & Young LLP
Los Angeles, California
January 27, 2017
95
|
Item 9.
|
CHANGES IN AND DISAGREEMENTS WITH ACCOUNTANTS ON ACCOUNTING AND FINANCIAL DISCLOSURE
|
None.
|
Item 9A.
|
CONTROLS AND PROCEDURES
|
Disclosure Controls and Procedures
We have established disclosure controls and procedures to ensure that information we are required to disclose in the reports we file or submit under the Securities Exchange Act of 1934, as amended (“Exchange Act”), is recorded, processed, summarized and reported within the time periods specified in the SEC’s rules and forms, and accumulated and communicated to management, including our Chief Executive Officer (“Principal Executive Officer”) and Chief Financial Officer (“Principal Financial Officer”), as appropriate, to allow timely decisions regarding required disclosure. Under the supervision and with the participation of senior management, including our Principal Executive Officer and Principal Financial Officer, we evaluated our disclosure controls and procedures, as such term is defined under Rule 13a-15(e) promulgated under the Exchange Act. Based on this evaluation, our Principal Executive Officer and Principal Financial Officer concluded that our disclosure controls and procedures were effective as of
November 30, 2016
.
Internal Control Over Financial Reporting
|
(a)
|
Management’s Annual Report on Internal Control Over Financial Reporting
|
Our management is responsible for establishing and maintaining adequate internal control over financial reporting, as such term is defined in Rule 13a-15(f) under the Exchange Act. Under the supervision and with the participation of senior management, including our Principal Executive Officer and Principal Financial Officer, we evaluated the effectiveness of our internal control over financial reporting based on the
Internal Control — Integrated Framework (2013)
established by the Committee of Sponsoring Organizations of the Treadway Commission. Based on the evaluation under that framework and applicable SEC rules, our management concluded that our internal control over financial reporting was effective as of
November 30, 2016
.
Ernst & Young LLP, the independent registered public accounting firm that audited our consolidated financial statements included in this annual report, has issued its report on the effectiveness of our internal control over financial reporting as of
November 30, 2016
, which is presented below.
|
(b)
|
Report of Independent Registered Public Accounting Firm
|
The Board of Directors and Stockholders of KB Home:
We have audited KB Home’s internal control over financial reporting as of
November 30, 2016
, based on criteria established in
Internal Control — Integrated Framework
issued by the Committee of Sponsoring Organizations of the Treadway Commission (2013 Framework) (the COSO criteria). KB Home’s management is responsible for maintaining effective internal control over financial reporting, and for its assessment of the effectiveness of internal control over financial reporting included in the accompanying Management’s Annual Report on Internal Control Over Financial Reporting. Our responsibility is to express an opinion on the company’s internal control over financial reporting based on our audit.
We conducted our audit in accordance with the standards of the Public Company Accounting Oversight Board (United States). Those standards require that we plan and perform the audit to obtain reasonable assurance about whether effective internal control over financial reporting was maintained in all material respects. Our audit included obtaining an understanding of internal control over financial reporting, assessing the risk that a material weakness exists, testing and evaluating the design and operating effectiveness of internal control based on the assessed risk, and performing such other procedures as we considered necessary in the circumstances. We believe that our audit provides a reasonable basis for our opinion.
A company’s internal control over financial reporting is a process designed to provide reasonable assurance regarding the reliability of financial reporting and the preparation of financial statements for external purposes in accordance with generally accepted accounting principles. A company’s internal control over financial reporting includes those policies and procedures that (1) pertain to the maintenance of records that, in reasonable detail, accurately and fairly reflect the transactions and dispositions of the assets of the company; (2) provide reasonable assurance that transactions are recorded as necessary to permit preparation of financial statements in accordance with generally accepted accounting principles, and that receipts and expenditures of the company are being made only in accordance with authorizations of management and directors of the company; and (3) provide reasonable assurance regarding prevention or timely detection of unauthorized acquisition, use, or disposition of the company’s assets that could have a material effect on the financial statements.
96
Because of its inherent limitations, internal control over financial reporting may not prevent or detect misstatements. Also, projections of any evaluation of effectiveness to future periods are subject to the risk that controls may become inadequate because of changes in conditions, or that the degree of compliance with the policies or procedures may deteriorate.
In our opinion, KB Home maintained, in all material respects, effective internal control over financial reporting as of
November 30, 2016
, based on the COSO criteria.
We also have audited, in accordance with the standards of the Public Company Accounting Oversight Board (United States), the consolidated balance sheets of KB Home as of
November 30, 2016
and
2015
, and the related consolidated statements of operations, comprehensive income, stockholders’ equity, and cash flows for each of the three years in the period ended
November 30, 2016
of KB Home and our report dated
January 27, 2017
expressed an unqualified opinion thereon.
/s/ Ernst & Young LLP
Los Angeles, California
January 27, 2017
|
(c)
|
Changes in Internal Control Over Financial Reporting
|
There have been no changes in our internal control over financial reporting during the quarter ended
November 30, 2016
that have materially affected, or are reasonably likely to materially affect, our internal control over financial reporting.
|
Item 9B.
|
OTHER INFORMATION
|
None.
|
Item 10.
|
DIRECTORS, EXECUTIVE OFFICERS AND CORPORATE GOVERNANCE
|
The information for this item for executive officers is provided above in the “Executive Officers of the Registrant” section in this report. Except as stated below, the other information for this item will be provided to the extent applicable in the “Corporate Governance and Board Matters,” “Election of Directors,” “Ownership of KB Home Securities” and “Annual Meeting, Voting and Other Information” sections in our Proxy Statement for our 2017 Annual Meeting of Stockholders (“2017 Proxy Statement”) and is incorporated herein by this reference.
Ethics Policy
We have adopted an ethics policy for our directors, officers (including our principal executive officer, principal financial officer and principal accounting officer) and employees. The ethics policy is available on our investor relations website at http://investor.kbhome.com. Stockholders may request a free copy of the ethics policy from:
KB Home
Attention: Investor Relations
10990 Wilshire Boulevard
Los Angeles, California 90024
(310) 231-4000
investorrelations@kbhome.com
Within the time period required by the SEC and the New York Stock Exchange, we will post on our investor relations website any amendment to our ethics policy and any waiver applicable to our principal executive officer, principal financial officer or principal accounting officer, or persons performing similar functions, and our other executive officers or directors.
Corporate Governance Principles
We have adopted corporate governance principles, which are available on our investor relations website. Stockholders may request a free copy of the corporate governance principles from the address, phone number and e-mail address stated above under “Ethics Policy.”
97
|
Item 11.
|
EXECUTIVE COMPENSATION
|
The information for this item will be provided in the “Corporate Governance and Board Matters” and “Compensation Discussion and Analysis” sections in our 2017 Proxy Statement and is incorporated herein by this reference.
|
Item 12.
|
SECURITY OWNERSHIP OF CERTAIN BENEFICIAL OWNERS AND MANAGEMENT AND RELATED STOCKHOLDER MATTERS
|
Except as provided below, the information for this item will be provided in the“Ownership of KB Home Securities” section in our 2017 Proxy Statement and is incorporated herein by this reference.
The following table presents information as of
November 30, 2016
with respect to shares of our common stock that may be issued under our existing equity compensation plans:
|
Equity Compensation Plan Information
|
|
|||||||||||
|
Plan category
|
Number of
common shares to
be issued upon
exercise of
outstanding options,
warrants and
rights
(a)
|
Weighted-average
exercise price of
outstanding options,
warrants and rights
(b)
|
Number of common
shares remaining
available for future
issuance under equity
compensation plans
(excluding common
shares reflected in
column(a))
(c)
|
|
||||||||
|
Equity compensation plans approved by stockholders
|
12,731,545
|
|
$
|
18.95
|
|
7,034,523
|
|
|
||||
|
Equity compensation plans not approved by stockholders
|
—
|
|
—
|
|
—
|
|
(1
|
)
|
||||
|
Total
|
12,731,545
|
|
$
|
18.95
|
|
7,034,523
|
|
|
||||
|
(1)
|
Represents a prior non-employee directors compensation plan under which our non-employee directors received Director Plan SARs, which were initially granted as cash-settled instruments. As discussed in Note 17 – Stockholders’ Equity in the Notes to Consolidated Financial Statements in this report, all non-employee directors serving on our board of directors have elected to receive shares of our common stock in settlement of their Director Plan SARs under the terms of the plan. We consider this non-employee director compensation plan as having no available capacity to issue shares of our common stock.
|
|
Item 13.
|
CERTAIN RELATIONSHIPS AND RELATED TRANSACTIONS, AND DIRECTOR INDEPENDENCE
|
The information for this item will be provided in the “Corporate Governance and Board Matters” section in our 2017 Proxy Statement and is incorporated herein by this reference.
|
Item 14.
|
PRINCIPAL ACCOUNTING FEES AND SERVICES
|
The information for this item will be provided in the “Independent Auditor Fees and Services” section in our 2017 Proxy Statement and is incorporated herein by this reference.
98
|
Item 15.
|
EXHIBITS, FINANCIAL STATEMENT SCHEDULES
|
(a) 1. Financial Statements
Reference is made to the index set forth on page 46 of this Annual Report on Form 10-K.
2. Financial Statement Schedules
Financial statement schedules have been omitted because they are not applicable or the required information is provided in the consolidated financial statements or notes thereto.
3. Exhibits
|
Exhibit
Number
|
Description
|
|
|
3.1
|
Restated Certificate of Incorporation, as amended, filed as an exhibit to our Current Report on Form 8-K dated April 7, 2009 (File No. 001-09195), is incorporated by reference herein.
|
|
|
3.2
|
Amended and Restated By-Laws of KB Home, filed as an exhibit to our Current Report on Form 8-K dated July 18, 2014 (File No. 001-09195), is incorporated by reference herein.
|
|
|
4.1
|
Rights Agreement between us and Mellon Investor Services LLC, as rights agent, dated January 22, 2009, filed as an exhibit to our Current Report on Form 8-K/A dated January 28, 2009 (File No. 001-09195), is incorporated by reference herein.
|
|
|
4.2
|
Indenture relating to our Senior Notes among us, the Guarantors party thereto and Sun Trust Bank, Atlanta, dated January 28, 2004, filed as an exhibit to our Registration Statement No. 333-114761 on Form S-4, is incorporated by reference herein.
|
|
|
4.3
|
Fifth Supplemental Indenture, dated August 17, 2007, relating to our Senior Notes by and between us, the Guarantors named therein, and the Trustee, filed as an exhibit to our Current Report on Form 8-K dated August 22, 2007 (File No. 001-09195), is incorporated by reference herein.
|
|
|
4.4
|
Sixth Supplemental Indenture, dated as of January 30, 2012, relating to our Senior Notes by and between us, the Guarantors named therein, and the Trustee, filed as an exhibit to our Current Report on Form 8-K dated February 2, 2012 (File No. 001-09195), is incorporated by reference herein.
|
|
|
4.5
|
Se
venth Supplemental Indenture, dated as of January 11, 2013, relating to our Senior Notes by and among us, the Guarantors named therein, and the Trustee, filed as an exhibit to our Current Report on Form 8-K dated January 11, 2013 (File No. 001-09195), is incorporated by reference herein.
|
|
|
4.6
|
Specimen of 7 1/4% Senior Notes due 2018, filed as an exhibit to our Current Report on Form 8-K dated April 3, 2006 (File No. 001-09195), is incorporated by reference herein.
|
|
|
4.7
|
Form of officers’ certificates and guarantors’ certificates establishing the terms of the 7 1/4% Senior Notes due 2018, filed as an exhibit to our Current Report on Form 8-K dated April 3, 2006 (File No. 001-09195), is incorporated by reference herein.
|
|
|
4.8
|
Specimen of 9.100% Senior Notes due 2017, filed as an exhibit to our Current Report on Form 8-K dated July 30, 2009 (File No. 001-09195), is incorporated by reference herein.
|
|
|
4.9
|
Form of officers’ certificates and guarantors’ certificates establishing the terms of the 9.100% Senior Notes due 2017, filed as an exhibit to our Current Report on Form 8-K dated July 30, 2009 (File No. 001-09195), is incorporated by reference herein.
|
|
|
4.10
|
Specimen of 8.00% Senior Notes due 2020, filed as an exhibit to our Current Report on Form 8-K dated February 7, 2012 (File No. 001-09195), is incorporated by reference herein.
|
|
|
4.11
|
Form of officers’ certificates and guarantors’ certificates establishing the terms of the 8.00% Senior Notes due 2020, filed as an exhibit to our Current Report on Form 8-K dated February 7, 2012 (File No. 001-09195), is incorporated by reference herein.
|
|
99
|
Exhibit
Number
|
Description
|
|
|
4.12
|
Specimen of 7.50% Senior Notes due 2022, filed as an exhibit to our Current Report on Form 8-K dated July 31, 2012 (File No. 001-09195), is incorporated by reference herein.
|
|
|
4.13
|
Form of officers’ certificates and guarantors’ certificates establishing the terms of the 7.50% Senior Notes due 2022, filed as an exhibit to our Current Report on Form 8-K dated July 31, 2012 (File No. 001-09195), is incorporated by reference herein.
|
|
|
4.14
|
Form of officers’ certificate and guarantors’ officers’ certificates establishing the form and terms of the 1.375% Convertible Senior Notes due 2019, filed as an exhibit to our Current Report on Form 8-K dated January 29, 2013 (File No. 001-09195), is incorporated by reference herein.
|
|
|
4.15
|
Form of 1.375% Convertible Senior Notes due 2019, filed as an exhibit to our Current Report on Form 8-K dated January 29, 2013 (File No. 001-09195), is incorporated by reference herein.
|
|
|
4.16
|
Form of supplemental officers’ certificate and guarantors’ officers’ certificates establishing the form and terms of the 1.375% Convertible Senior Notes due 2019, filed as an exhibit to our Quarterly Report on Form 10-Q for the quarter ended February 28, 2013 (File No. 001-09195), is incorporated by reference herein.
|
|
|
4.17
|
Eighth Supplemental Indenture, dated as of March 12, 2013, by and among us, the Guarantors party thereto, the Additional Guarantors named therein and U.S. Bank National Association, as Trustee, filed as an exhibit to our Quarterly Report on Form 10-Q for the quarter ended May 31, 2013 (File No. 001-09195), is incorporated by reference herein.
|
|
|
4.18
|
Specimen of 7.00% Senior Notes due 2021, filed as an exhibit to our Current Report on Form 8-K dated October 29, 2013 (File No. 001-09195), is incorporated by reference herein.
|
|
|
4.19
|
Form of officers’ certificates and guarantors’ certificates establishing the terms of the 7.00% Senior Notes due 2021, filed as an exhibit to our Current Report on Form 8-K dated October 29, 2013 (File No. 001-09195), is incorporated by reference herein.
|
|
|
4.20
|
Ninth Supplemental Indenture, dated as of February 28, 2014, by and among us, the Guarantors party thereto, the Additional Guarantors named therein and U.S. Bank National Association, as Trustee, filed as an exhibit to our Post-Effective Amendment No. 4 to Form S-3 Registration Statement (No. 333-176930), is incorporated by reference herein.
|
|
|
4.21
|
Specimen of 4.75% Senior Notes due 2019, filed as an exhibit to our Current Report on Form 8-K dated March 25, 2014 (File No. 001-09195), is incorporated by reference herein.
|
|
|
4.22
|
Form of officers’ certificates and guarantors’ certificates establishing the terms of the 4.75% Senior Notes due 2019, filed as an exhibit to our Current Report on Form 8-K dated March 25, 2014 (File No. 001-09195), is incorporated by reference herein.
|
|
|
4.23
|
Form of 7.625% Senior Notes due 2023, filed as an exhibit to our Current Report on Form 8-K dated February 17, 2015 (File No. 001-09195), is incorporated by reference herein.
|
|
|
4.24
|
Form of officers’ certificates and guarantors’ certificates establishing the terms of the 7.625% Senior Notes due 2023, filed as an exhibit to our Current Report on Form 8-K dated February 17, 2015 (File No. 001-09195), is incorporated by reference herein.
|
|
|
10.1*
|
Kaufman and Broad, Inc. Executive Deferred Compensation Plan, effective as of July 11, 1985, filed as an exhibit to our 2007 Annual Report on Form 10-K (File No. 001-09195), is incorporated by reference herein.
|
|
|
10.2*
|
Amendment to Kaufman and Broad, Inc. Executive Deferred Compensation Plan for amounts earned or vested on or after January 1, 2005, effective January 1, 2009, filed as an exhibit to our 2008 Annual Report on Form 10-K (File No. 001-09195), is incorporated by reference herein.
|
|
|
10.3*
|
KB Home 1988 Employee Stock Plan, as amended and restated on October 2, 2008, filed as an exhibit to our 2008 Annual Report on Form 10-K (File No. 001-09195), is incorporated by reference herein.
|
|
|
10.4*
|
KB Home Performance-Based Incentive Plan for Senior Management, as amended and restated on October 2, 2008, filed as an exhibit to our 2008 Annual Report on Form 10-K (File No. 001-09195), is incorporated by reference herein.
|
|
100
|
Exhibit
Number
|
Description
|
|
|
10.5*
|
Form of Stock Option Agreement under KB Home Performance-Based Incentive Plan for Senior Management, filed as an exhibit to our 1995 Annual Report on Form 10-K (File No. 001-09195), is incorporated by reference herein.
|
|
|
10.6
|
KB Home Directors’ Legacy Program, as amended January 1, 1999, filed as an exhibit to our 1998 Annual Report on Form 10-K (File No. 001-09195), is incorporated by reference herein.
|
|
|
10.7
|
Trust Agreement between Kaufman and Broad Home Corporation and Wachovia Bank, N.A. as Trustee, dated as of August 27, 1999, filed as an exhibit to our 1999 Annual Report on Form 10-K (File No. 001-09195), is incorporated by reference herein.
|
|
|
10.8*
|
Amended and Restated KB Home 1999 Incentive Plan, as amended and restated on October 2, 2008, filed as an exhibit to our 2008 Annual Report on Form 10-K (File No. 001-09195), is incorporated by reference herein.
|
|
|
10.9*
|
Form of Non-Qualified Stock Option Agreement under our Amended and Restated 1999 Incentive Plan, filed as an exhibit to our 2011 Annual Report on Form 10-K (File No. 001-09195), is incorporated by reference herein.
|
|
|
10.10*
|
KB Home 2001 Stock Incentive Plan, as amended and restated on October 2, 2008, filed as an exhibit to our 2008 Annual Report on Form 10-K (File No. 001-09195), is incorporated by reference herein.
|
|
|
10.11*
|
Form of Stock Option Agreement under our 2001 Stock Incentive Plan, filed as an exhibit to our 2011 Annual Report on Form 10-K (File No. 001-09195), is incorporated by reference herein.
|
|
|
10.12*
|
KB Home Nonqualified Deferred Compensation Plan with respect to deferrals prior to January 1, 2005, effective March 1, 2001, filed as an exhibit to our 2001 Annual Report on Form 10-K (File No. 001-09195), is incorporated by reference herein.
|
|
|
10.13*
|
KB Home Nonqualified Deferred Compensation Plan with respect to deferrals on and after January 1, 2005, effective January 1, 2009 (File No. 001-09195), filed as an exhibit to our 2008 Annual Report on Form 10-K, is incorporated by reference herein.
|
|
|
10.14*
|
KB Home Change in Control Severance Plan, as amended and restated effective January 1, 2009, filed as an exhibit to our 2008 Annual Report on Form 10-K (File No. 001-09195), is incorporated by reference herein.
|
|
|
10.15*
|
KB Home Death Benefit Only Plan, filed as an exhibit to our 2001 Annual Report on Form 10-K (File No. 001-09195), is incorporated by reference herein.
|
|
|
10.16*
|
Amendment No. 1 to the KB Home Death Benefit Only Plan, effective as of January 1, 2009, filed as an exhibit to our 2008 Annual Report on Form 10-K (File No. 001-09195), is incorporated by reference herein.
|
|
|
10.17*
|
KB Home Retirement Plan, as amended and restated effective January 1, 2009, filed as an exhibit to our 2008 Annual Report on Form 10-K (File No. 001-09195), is incorporated by reference herein.
|
|
|
10.18*
|
Employment Agreement of Jeffrey T. Mezger, dated February 28, 2007, filed as an exhibit to our Current Report on Form 8-K dated March 6, 2007 (File No. 001-09195), is incorporated by reference herein.
|
|
|
10.19*
|
Amendment to the Employment Agreement of Jeffrey T. Mezger, dated December 24, 2008, filed as an exhibit to our 2008 Annual Report on Form 10-K (File No. 001-09195), is incorporated by reference herein.
|
|
|
10.20*
|
Form of Stock Option Agreement under the Employment Agreement between us and Jeffrey T. Mezger dated as of February 28, 2007, filed as an exhibit to our Current Report on Form 8-K dated July 18, 2007 (File No. 001-09195), is incorporated by reference herein.
|
|
|
10.21*
|
Form of Stock Option Agreement under the Amended and Restated 1999 Incentive Plan for stock option grant to Jeffrey T. Mezger, filed as an exhibit to our Quarterly Report on Form 10-Q for the quarter ended August 31, 2007 (File No. 001-09195), is incorporated by reference herein.
|
|
|
10.22*
|
Policy Regarding Stockholder Approval of Certain Severance Payments, adopted July 10, 2008, filed as an exhibit to our Current Report on Form 8-K dated July 15, 2008 (File No. 001-09195), is incorporated by reference herein.
|
|
|
10.23*
|
KB Home Executive Severance Plan, filed as an exhibit to our Quarterly Report on Form 10-Q for the quarter ended August 31, 2008 (File No. 001-09195), is incorporated by reference herein.
|
|
101
|
Exhibit
Number
|
Description
|
|
|
10.24
|
Amendment to Trust Agreement by and between KB Home and Wachovia Bank, N.A., dated August 24, 2009, filed as an exhibit to our Quarterly Report on Form 10-Q for the quarter ended August 31, 2009 (File No. 001-09195), is incorporated by reference herein.
|
|
|
10.25
|
Form of Indemnification Agreement, filed as an exhibit to our Current Report on Form 8-K dated April 2, 2010 (File No. 001-09195), is incorporated by reference herein.
|
|
|
10.26*
|
KB Home 2010 Equity Incentive Plan, filed as an exhibit to our Quarterly Report on Form 10-Q for the quarter ended February 28, 2010 (File No. 001-09195), is incorporated by reference herein.
|
|
|
10.27*
|
Form of Stock Option Award Agreement under the KB Home 2010 Equity Incentive Plan, filed as an exhibit to our Current Report on Form 8-K dated July 20, 2010 (File No. 001-09195), is incorporated by reference herein.
|
|
|
10.28*
|
Form of Restricted Stock Award Agreement under the KB Home 2010 Equity Incentive Plan, filed as an exhibit to our Current Report on Form 8-K dated July 20, 2010 (File No. 001-09195), is incorporated by reference herein.
|
|
|
10.29*
|
KB Home 2010 Equity Incentive Plan Stock Option Agreement for performance stock option grant to Jeffrey T. Mezger, filed as an exhibit to our 2010 Annual Report on Form 10-K (File No. 001-09195), is incorporated by reference herein.
|
|
|
10.30*
|
Amendment to the KB Home 2010 Equity Incentive Plan, filed as an exhibit to our Quarterly Report on Form 10-Q for the quarter ended February 28, 2011 (File No. 001-09195), is incorporated by reference herein.
|
|
|
10.31*
|
Executive Severance Benefit Decisions, filed as an exhibit to our Quarterly Report on Form 10-Q for the quarter ended February 28, 2011 (File No. 001-09195), is incorporated by reference herein.
|
|
|
10.32
|
Consensual agreement effective June 10, 2011, filed as an exhibit to our Quarterly Report on Form 10-Q for the quarter ended August 31, 2011 (File No. 001-09195), is incorporated by reference herein.
|
|
|
10.33*
|
KB Home 2010 Equity Incentive Plan Stock Option Agreement for performance stock option grant to Jeffrey T. Mezger, filed as an exhibit to our 2011 Annual Report on Form 10-K (File No. 001-09195), is incorporated by reference herein.
|
|
|
10.34*
|
Form of KB Home 2010 Equity Incentive Plan Performance-Based Restricted Stock Unit Award Agreement, filed as an exhibit to our 2012 Annual Report on Form 10-K (File No. 001-09195), is incorporated by reference herein.
|
|
|
10.35*
|
KB Home 2010 Equity Incentive Plan Performance-Based Restricted Stock Unit Award Agreement for performance-based restricted stock unit award to Jeffrey T. Mezger, filed as an exhibit to our 2012 Annual Report on Form 10-K (File No. 001-09195), is incorporated by reference herein.
|
|
|
10.36*
|
Form of KB Home 2010 Equity Incentive Plan Restricted Stock Unit Award Agreement, filed as an exhibit to our 2012 Annual Report on Form 10-K (File No. 001-09195), is incorporated by reference herein.
|
|
|
10.37*
|
KB Home 2014 Equity Incentive Plan, filed as an exhibit to our Quarterly Report on Form 10-Q for the quarter ended February 28, 2014 (File No. 001-09195), is incorporated by reference herein.
|
|
|
10.38*
|
Amendment to Amended and Restated KB Home 1999 Incentive Plan Non-Qualified Stock Option Agreement, effective July 17, 2014, filed as an exhibit to our Quarterly Report on Form 10-Q for the quarter ended August 31, 2014 (File No. 001-09195), is incorporated by reference herein.
|
|
|
10.39*
|
Amendment to KB Home 2001 Stock Incentive Plan Stock Option Agreement, effective July 17, 2014, filed as an exhibit to our Quarterly Report on Form 10-Q for the quarter ended August 31, 2014 (File No. 001-09195), is incorporated by reference herein.
|
|
|
10.40*
|
Amendment to KB Home Performance Based Incentive Plan for Senior Management Stock Option Agreement, effective July 17, 2014, filed as an exhibit to our Quarterly Report on Form 10-Q for the quarter ended August 31, 2014 (File No. 001-09195), is incorporated by reference herein.
|
|
|
10.41*
|
Form of Stock Option Agreement under the KB Home 2014 Equity Incentive Plan, filed as an exhibit to our Current Report on Form 8-K dated October 14, 2014 (File No. 001-09195), is incorporated by reference herein.
|
|
|
10.42*
|
Form of Performance-Based Restricted Stock Unit Award Agreement under the KB Home 2014 Equity Incentive Plan, filed as an exhibit to our Current Report on Form 8-K dated October 14, 2014 (File No. 001-09195), is incorporated by reference herein.
|
|
102
|
Exhibit
Number
|
Description
|
|
|
10.43*
|
Form of Performance Cash Award Agreement under the KB Home 2014 Equity Incentive Plan, filed as an exhibit to our Current Report on Form 8-K dated October 14, 2014 (File No. 001-09195), is incorporated by reference herein.
|
|
|
10.44*
|
Form of Restricted Cash Award Agreement under the KB Home 2014 Equity Incentive Plan, filed as an exhibit to our Current Report on Form 8-K dated October 14, 2014 (File No. 001-09195), is incorporated by reference herein.
|
|
|
10.45
|
Fourth Amended and Restated KB Home Non-Employee Directors Compensation Plan, effective as of October 9, 2014, filed as an exhibit to our 2014 Annual Report on Form 10-K (File No. 001-09195), is incorporated by reference herein.
|
|
|
10.46
|
Amended and Restated Revolving Loan Agreement, dated as of August 7, 2015, among us, the banks party thereto, and Citibank, N.A., as Administrative Agent, filed as an exhibit to our Quarterly Report on Form 10-Q for the quarter ended August 31, 2015 (File No. 001-09195), is incorporated by reference herein.
|
|
|
10.47*
|
Form of Restricted Stock Agreement under the KB Home 2014 Equity Incentive Plan, filed as an exhibit to our 2015 Annual Report on Form 10-K (File No. 001-09195), is incorporated by reference herein.
|
|
|
10.48*
|
Amended KB Home 2014 Equity Incentive Plan, effective April 7, 2016, filed as an exhibit to our Quarterly Report on Form 10-Q for the quarter ended May 31, 2016 (File No. 001-09195), is incorporated by reference herein.
|
|
|
12.1†
|
Computation of Ratio of Earnings to Fixed Charges.
|
|
|
21†
|
Subsidiaries of the Registrant.
|
|
|
23†
|
Consent of Independent Registered Public Accounting Firm.
|
|
|
31.1†
|
Certification of Jeffrey T. Mezger, Chairman, President and Chief Executive Officer of KB Home Pursuant to Section 302 of the Sarbanes-Oxley Act of 2002.
|
|
|
31.2†
|
Certification of Jeff J. Kaminski, Executive Vice President and Chief Financial Officer of KB Home Pursuant to Section 302 of the Sarbanes-Oxley Act of 2002.
|
|
|
32.1†
|
Certification of Jeffrey T. Mezger, Chairman, President and Chief Executive Officer of KB Home Pursuant to 18 U.S.C. Section 1350, as Adopted Pursuant to Section 906 of the Sarbanes-Oxley Act of 2002.
|
|
|
32.2†
|
Certification of Jeff J. Kaminski, Executive Vice President and Chief Financial Officer of KB Home Pursuant to 18 U.S.C. Section 1350, as Adopted Pursuant to Section 906 of the Sarbanes-Oxley Act of 2002.
|
|
|
101†
|
The following materials from KB Home’s Annual Report on Form 10-K for the year ended November 30, 2016, formatted in eXtensible Business Reporting Language (XBRL): (a) Consolidated Statements of Operations for the years ended November 30, 2016, 2015 and 2014, (b) Consolidated Statements of Comprehensive Income for the years ended November 30, 2016, 2015 and 2014, (c) Consolidated Balance Sheets as of November 30, 2016 and 2015, (d) Consolidated Statements of Stockholders’ Equity for the years ended November 30, 2016, 2015 and 2014, (e) Consolidated Statements of Cash Flows for the years ended November 30, 2016, 2015 and 2014, and (f) the Notes to Consolidated Financial Statements.
|
|
* Management contract or compensatory plan or arrangement in which executive officers are eligible to participate.
† Document filed with this Form 10-K.
|
Item 16.
|
FORM 10-K SUMMARY
|
None.
103
SIGNATURES
Pursuant to the requirements of Section 13 or 15(d) of the Securities Exchange Act of 1934, the registrant has duly caused this report to be signed on its behalf by the undersigned, thereunto duly authorized.
|
KB Home
|
|||
|
By:
|
/
S
/ JEFF J. KAMINSKI
|
||
|
Jeff J. Kaminski
|
|||
|
Executive Vice President and Chief Financial Officer
|
|||
|
Date:
|
January 27, 2017
|
||
Pursuant to the requirements of the Securities Exchange Act of 1934, this report has been signed below by the following persons on behalf of the registrant and in the capacities and on the dates indicated:
|
Signature
|
Title
|
Date
|
||
|
/
S
/ JEFFREY T. MEZGER
|
Chairman, President and
Chief Executive Officer
(Principal Executive Officer)
|
January 27, 2017
|
||
|
Jeffrey T. Mezger
|
||||
|
/
S
/ JEFF J. KAMINSKI
|
Executive Vice President and
Chief Financial Officer
(Principal Financial Officer)
|
January 27, 2017
|
||
|
Jeff J. Kaminski
|
||||
|
/
S
/ WILLIAM R. HOLLINGER
|
Senior Vice President and
Chief Accounting Officer
(Principal Accounting Officer)
|
January 27, 2017
|
||
|
William R. Hollinger
|
||||
|
/
S
/ TIMOTHY W. FINCHEM
|
Director
|
January 27, 2017
|
||
|
Timothy W. Finchem
|
||||
|
/
S
/ STUART A. GABRIEL
|
Director
|
January 27, 2017
|
||
|
Stuart A. Gabriel
|
||||
|
/
S
/ THOMAS W. GILLIGAN
|
Director
|
January 27, 2017
|
||
|
Thomas W. Gilligan
|
||||
|
/
S
/ KENNETH M. JASTROW, II
|
Director
|
January 27, 2017
|
||
|
Kenneth M. Jastrow, II
|
||||
|
/
S
/ ROBERT L. JOHNSON
|
Director
|
January 27, 2017
|
||
|
Robert L. Johnson
|
||||
|
/
S
/ MELISSA LORA
|
Director
|
January 27, 2017
|
||
|
Melissa Lora
|
||||
|
/s/ ROBERT L. PATTON, JR.
|
Director
|
January 27, 2017
|
||
|
Robert L. Patton, Jr.
|
||||
|
/
S
/ MICHAEL M. WOOD
|
Director
|
January 27, 2017
|
||
|
Michael M. Wood
|
||||
104
LIST OF EXHIBITS FILED
|
Exhibit
Number
|
Description
|
Sequential
Page
Number
|
||
|
3.1
|
Restated Certificate of Incorporation, as amended, filed as an exhibit to our Current Report on Form 8-K dated April 7, 2009 (File No. 001-09195), is incorporated by reference herein.
|
|||
|
3.2
|
Amended and Restated By-Laws of KB Home, filed as an exhibit to our Current Report on Form 8-K dated July 18, 2014 (File No. 001-09195), is incorporated by reference herein.
|
|||
|
4.1
|
Rights Agreement between us and Mellon Investor Services LLC, as rights agent, dated January 22, 2009, filed as an exhibit to our Current Report on Form 8-K/A dated January 28, 2009 (File No. 001-09195), is incorporated by reference herein.
|
|||
|
4.2
|
Indenture relating to our Senior Notes among us, the Guarantors party thereto and Sun Trust Bank, Atlanta, dated January 28, 2004, filed as an exhibit to our Registration Statement No. 333-114761 on Form S-4, is incorporated by reference herein.
|
|||
|
4.3
|
Fifth Supplemental Indenture, dated August 17, 2007, relating to our Senior Notes by and between us, the Guarantors named therein, and the Trustee, filed as an exhibit to our Current Report on Form 8-K dated August 22, 2007 (File No. 001-09195), is incorporated by reference herein.
|
|||
|
4.4
|
Sixth Supplemental Indenture, dated as of January 30, 2012, relating to our Senior Notes by and between us, the Guarantors named therein, and the Trustee, filed as an exhibit to our Current Report on Form 8-K dated February 2, 2012 (File No. 001-09195), is incorporated by reference herein.
|
|||
|
4.5
|
Seventh Supplemental Indenture, dated as of January 11, 2013, relating to our Senior Notes by and among us, the Guarantors named therein, and the Trustee, filed as an exhibit to our Current Report on Form 8-K dated January 11, 2013 (File No. 001-09195), is incorporated by reference herein.
|
|||
|
4.6
|
Specimen of 7 1/4% Senior Notes due 2018, filed as an exhibit to our Current Report on Form 8-K dated April 3, 2006 (File No. 001-09195), is incorporated by reference herein.
|
|||
|
4.7
|
Form of officers’ certificates and guarantors’ certificates establishing the terms of the 7 1/4% Senior Notes due 2018, filed as an exhibit to our Current Report on Form 8-K dated April 3, 2006 (File No. 001-09195), is incorporated by reference herein.
|
|||
|
4.8
|
Specimen of 9.100% Senior Notes due 2017, filed as an exhibit to our Current Report on Form 8-K dated July 30, 2009 (File No. 001-09195), is incorporated by reference herein.
|
|||
|
4.9
|
Form of officers’ certificates and guarantors’ certificates establishing the terms of the 9.100% Senior Notes due 2017, filed as an exhibit to our Current Report on Form 8-K dated July 30, 2009 (File No. 001-09195), is incorporated by reference herein.
|
|||
|
4.10
|
Specimen of 8.00% Senior Notes due 2020, filed as an exhibit to our Current Report on Form 8-K dated February 7, 2012 (File No. 001-09195), is incorporated by reference herein.
|
|||
|
4.11
|
Form of officers’ certificates and guarantors’ certificates establishing the terms of the 8.00% Senior Notes due 2020, filed as an exhibit to our Current Report on Form 8-K dated February 7, 2012 (File No. 001-09195), is incorporated by reference herein.
|
|||
|
4.12
|
Specimen of 7.50% Senior Notes due 2022, filed as an exhibit to our Current Report on Form 8-K dated July 31, 2012 (File No. 001-09195), is incorporated by reference herein.
|
|||
|
4.13
|
Form of officers’ certificates and guarantors’ certificates establishing the terms of the 7.50% Senior Notes due 2022, filed as an exhibit to our Current Report on Form 8-K dated July 31, 2012 (File No. 001-09195), is incorporated by reference herein.
|
|||
|
4.14
|
Form of officers’ certificate and guarantors’ officers’ certificates establishing the form and terms of the 1.375% Convertible Senior Notes due 2019, filed as an exhibit to our Current Report on Form 8-K dated January 29, 2013 (File No. 001-09195), is incorporated by reference herein.
|
|||
|
4.15
|
Form of 1.375% Convertible Senior Notes due 2019, filed as an exhibit to our Current Report on Form 8-K dated January 29, 2013 (File No. 001-09195), is incorporated by reference herein.
|
|||
|
4.16
|
Form of supplemental officers’ certificate and guarantors’ officers’ certificates establishing the form and terms of the 1.375% Convertible Senior Notes due 2019, filed as an exhibit to our Quarterly Report on Form 10-Q for the quarter ended February 28, 2013 (File No. 001-09195), is incorporated by reference herein.
|
|||
105
|
Exhibit
Number
|
Description
|
Sequential
Page
Number
|
||
|
4.17
|
Eighth Supplemental Indenture, dated as of March 12, 2013, by and among us, the Guarantors party thereto, the Additional Guarantors named therein and U.S. Bank National Association, as Trustee, filed as an exhibit to our Quarterly Report on Form 10-Q for the quarter ended May 31, 2013 (File No. 001-09195), is incorporated by reference herein.
|
|||
|
4.18
|
Specimen of 7.00% Senior Notes due 2021, filed as an exhibit to our Current Report on Form 8-K dated October 29, 2013 (File No. 001-09195), is incorporated by reference herein.
|
|||
|
4.19
|
Form of officers’ certificates and guarantors’ certificates establishing the terms of the 7.00% Senior Notes due 2021, filed as an exhibit to our Current Report on Form 8-K dated October 29, 2013 (File No. 001-09195), is incorporated by reference herein.
|
|||
|
4.20
|
Ninth Supplemental Indenture, dated as of February 28, 2014, by and among us, the Guarantors party thereto, the Additional Guarantors named therein and U.S. Bank National Association, as Trustee, filed as an exhibit to our Post-Effective Amendment No. 4 to Form S-3 Registration Statement (No. 333-176930), is incorporated by reference herein.
|
|||
|
4.21
|
Specimen of 4.75% Senior Notes due 2019, filed as an exhibit to our Current Report on Form 8-K dated March 25, 2014 (File No. 001-09195), is incorporated by reference herein.
|
|||
|
4.22
|
Form of officers’ certificates and guarantors’ certificates establishing the terms of the 4.75% Senior Notes due 2019, filed as an exhibit to our Current Report on Form 8-K dated March 25, 2014 (File No. 001-09195), is incorporated by reference herein.
|
|||
|
4.23
|
Form of 7.625% Senior Notes due 2023, filed as an exhibit to our Current Report on Form 8-K dated February 17, 2015 (File No. 001-09195), is incorporated by reference herein.
|
|||
|
4.24
|
Form of officers’ certificates and guarantors’ certificates establishing the terms of the 7.625% Senior Notes due 2023, filed as an exhibit to our Current Report on Form 8-K dated February 17, 2015 (File No. 001-09195), is incorporated by reference herein.
|
|||
|
10.1*
|
Kaufman and Broad, Inc. Executive Deferred Compensation Plan, effective as of July 11, 1985, filed as an exhibit to our 2007 Annual Report on Form 10-K (File No. 001-09195), is incorporated by reference herein.
|
|||
|
10.2*
|
Amendment to Kaufman and Broad, Inc. Executive Deferred Compensation Plan for amounts earned or vested on or after January 1, 2005, effective January 1, 2009, filed as an exhibit to our 2008 Annual Report on Form 10-K (File No. 001-09195), is incorporated by reference herein.
|
|||
|
10.3*
|
KB Home 1988 Employee Stock Plan, as amended and restated on October 2, 2008, filed as an exhibit to our 2008 Annual Report on Form 10-K (File No. 001-09195), is incorporated by reference herein.
|
|||
|
10.4*
|
KB Home Performance-Based Incentive Plan for Senior Management, as amended and restated on October 2, 2008, filed as an exhibit to our 2008 Annual Report on Form 10-K (File No. 001-09195), is incorporated by reference herein.
|
|||
|
10.5*
|
Form of Stock Option Agreement under KB Home Performance-Based Incentive Plan for Senior Management, filed as an exhibit to our 1995 Annual Report on Form 10-K (File No. 001-09195), is incorporated by reference herein.
|
|||
|
10.6
|
KB Home Directors’ Legacy Program, as amended January 1, 1999, filed as an exhibit to our 1998 Annual Report on Form 10-K (File No. 001-09195), is incorporated by reference herein.
|
|||
|
10.7
|
Trust Agreement between Kaufman and Broad Home Corporation and Wachovia Bank, N.A. as Trustee, dated as of August 27, 1999, filed as an exhibit to our 1999 Annual Report on Form 10-K (File No. 001-09195), is incorporated by reference herein.
|
|||
|
10.8*
|
Amended and Restated KB Home 1999 Incentive Plan, as amended and restated on October 2, 2008, filed as an exhibit to our 2008 Annual Report on Form 10-K (File No. 001-09195), is incorporated by reference herein.
|
|||
|
10.9*
|
Form of Non-Qualified Stock Option Agreement under our Amended and Restated 1999 Incentive Plan, filed as an exhibit to our 2011 Annual Report on Form 10-K (File No. 001-09195), is incorporated by reference herein.
|
|||
106
|
Exhibit
Number
|
Description
|
Sequential
Page
Number
|
||
|
10.10*
|
KB Home 2001 Stock Incentive Plan, as amended and restated on October 2, 2008, filed as an exhibit to our 2008 Annual Report on Form 10-K (File No. 001-09195), is incorporated by reference herein.
|
|||
|
10.11*
|
Form of Stock Option Agreement under our 2001 Stock Incentive Plan, filed as an exhibit to our 2011 Annual Report on Form 10-K (File No. 001-09195), is incorporated by reference herein.
|
|||
|
10.12*
|
KB Home Nonqualified Deferred Compensation Plan with respect to deferrals prior to January 1, 2005, effective March 1, 2001, filed as an exhibit to our 2001 Annual Report on Form 10-K (File No. 001-09195), is incorporated by reference herein.
|
|||
|
10.13*
|
KB Home Nonqualified Deferred Compensation Plan with respect to deferrals on and after January 1, 2005, effective January 1, 2009 (File No. 001-09195), filed as an exhibit to our 2008 Annual Report on Form 10-K, is incorporated by reference herein.
|
|||
|
10.14*
|
KB Home Change in Control Severance Plan, as amended and restated effective January 1, 2009, filed as an exhibit to our 2008 Annual Report on Form 10-K (File No. 001-09195), is incorporated by reference herein.
|
|||
|
10.15*
|
KB Home Death Benefit Only Plan, filed as an exhibit to our 2001 Annual Report on Form 10-K (File No. 001-09195), is incorporated by reference herein.
|
|||
|
10.16*
|
Amendment No. 1 to the KB Home Death Benefit Only Plan, effective as of January 1, 2009, filed as an exhibit to our 2008 Annual Report on Form 10-K (File No. 001-09195), is incorporated by reference herein.
|
|||
|
10.17*
|
KB Home Retirement Plan, as amended and restated effective January 1, 2009, filed as an exhibit to our 2008 Annual Report on Form 10-K (File No. 001-09195), is incorporated by reference herein.
|
|||
|
10.18*
|
Employment Agreement of Jeffrey T. Mezger, dated February 28, 2007, filed as an exhibit to our Current Report on Form 8-K dated March 6, 2007 (File No. 001-09195), is incorporated by reference herein.
|
|||
|
10.19*
|
Amendment to the Employment Agreement of Jeffrey T. Mezger, dated December 24, 2008, filed as an exhibit to our 2008 Annual Report on Form 10-K (File No. 001-09195), is incorporated by reference herein.
|
|||
|
10.20*
|
Form of Stock Option Agreement under the Employment Agreement between us and Jeffrey T. Mezger dated as of February 28, 2007, filed as an exhibit to our Current Report on Form 8-K dated July 18, 2007 (File No. 001-09195), is incorporated by reference herein.
|
|||
|
10.21*
|
Form of Stock Option Agreement under the Amended and Restated 1999 Incentive Plan for stock option grant to Jeffrey T. Mezger, filed as an exhibit to our Quarterly Report on Form 10-Q for the quarter ended August 31, 2007 (File No. 001-09195), is incorporated by reference herein.
|
|||
|
10.22*
|
Policy Regarding Stockholder Approval of Certain Severance Payments, adopted July 10, 2008, filed as an exhibit to our Current Report on Form 8-K dated July 15, 2008 (File No. 001-09195), is incorporated by reference herein.
|
|||
|
10.23*
|
KB Home Executive Severance Plan, filed as an exhibit to our Quarterly Report on Form 10-Q for the quarter ended August 31, 2008 (File No. 001-09195), is incorporated by reference herein.
|
|||
|
10.24
|
Amendment to Trust Agreement by and between KB Home and Wachovia Bank, N.A., dated August 24, 2009, filed as an exhibit to our Quarterly Report on Form 10-Q for the quarter ended August 31, 2009 (File No. 001-09195), is incorporated by reference herein.
|
|||
|
10.25
|
Form of Indemnification Agreement, filed as an exhibit to our Current Report on Form 8-K dated April 2, 2010 (File No. 001-09195), is incorporated by reference herein.
|
|||
|
10.26*
|
KB Home 2010 Equity Incentive Plan, filed as an exhibit to our Quarterly Report on Form 10-Q for the quarter ended February 28, 2010 (File No. 001-09195), is incorporated by reference herein.
|
|||
|
10.27*
|
Form of Stock Option Award Agreement under the KB Home 2010 Equity Incentive Plan, filed as an exhibit to our Current Report on Form 8-K dated July 20, 2010 (File No. 001-09195), is incorporated by reference herein.
|
|||
107
|
Exhibit
Number
|
Description
|
Sequential
Page
Number
|
||
|
10.28*
|
Form of Restricted Stock Award Agreement under the KB Home 2010 Equity Incentive Plan, filed as an exhibit to our Current Report on Form 8-K dated July 20, 2010 (File No. 001-09195), is incorporated by reference herein.
|
|||
|
10.29*
|
KB Home 2010 Equity Incentive Plan Stock Option Agreement for performance stock option grant to Jeffrey T. Mezger, filed as an exhibit to our 2010 Annual Report on Form 10-K (File No. 001-09195), is incorporated by reference herein.
|
|||
|
10.30*
|
Amendment to the KB Home 2010 Equity Incentive Plan, filed as an exhibit to our Quarterly Report on Form 10-Q for the quarter ended February 28, 2011 (File No. 001-09195), is incorporated by reference herein.
|
|||
|
10.31*
|
Executive Severance Benefit Decisions, filed as an exhibit to our Quarterly Report on Form 10-Q for the quarter ended February 28, 2011 (File No. 001-09195), is incorporated by reference herein.
|
|||
|
10.32
|
Consensual agreement effective June 10, 2011, filed as an exhibit to our Quarterly Report on Form 10-Q for the quarter ended August 31, 2011 (File No. 001-09195), is incorporated by reference herein.
|
|||
|
10.33*
|
KB Home 2010 Equity Incentive Plan Stock Option Agreement for performance stock option grant to Jeffrey T. Mezger, filed as an exhibit to our 2011 Annual Report on Form 10-K (File No. 001-09195), is incorporated by reference herein.
|
|||
|
10.34*
|
Form of KB Home 2010 Equity Incentive Plan Performance-Based Restricted Stock Unit Award Agreement, filed as an exhibit to our 2012 Annual Report on Form 10-K (File No. 001-09195), is incorporated by reference herein.
|
|||
|
10.35*
|
KB Home 2010 Equity Incentive Plan Performance-Based Restricted Stock Unit Award Agreement for performance-based restricted stock unit award to Jeffrey T. Mezger, filed as an exhibit to our 2012 Annual Report on Form 10-K (File No. 001-09195), is incorporated by reference herein.
|
|||
|
10.36*
|
Form of KB Home 2010 Equity Incentive Plan Restricted Stock Unit Award Agreement, filed as an exhibit to our 2012 Annual Report on Form 10-K (File No. 001-09195), is incorporated by reference herein.
|
|||
|
10.37*
|
KB Home 2014 Equity Incentive Plan, filed as an exhibit to our Quarterly Report on Form 10-Q for the quarter ended February 28, 2014 (File No. 001-09195), is incorporated by reference herein.
|
|||
|
10.38*
|
Amendment to Amended and Restated KB Home 1999 Incentive Plan Non-Qualified Stock Option Agreement, effective July 17, 2014, filed as an exhibit to our Quarterly Report on Form 10-Q for the quarter ended August 31, 2014 (File No. 001-09195), is incorporated by reference herein.
|
|||
|
10.39*
|
Amendment to KB Home 2001 Stock Incentive Plan Stock Option Agreement, effective July 17, 2014, filed as an exhibit to our Quarterly Report on Form 10-Q for the quarter ended August 31, 2014 (File No. 001-09195), is incorporated by reference herein.
|
|||
|
10.40*
|
Amendment to KB Home Performance Based Incentive Plan for Senior Management Stock Option Agreement, effective July 17, 2014, filed as an exhibit to our Quarterly Report on Form 10-Q for the quarter ended August 31, 2014 (File No. 001-09195), is incorporated by reference herein.
|
|||
|
10.41*
|
Form of Stock Option Agreement under the KB Home 2014 Equity Incentive Plan, filed as an exhibit to our Current Report on Form 8-K dated October 14, 2014 (File No. 001-09195), is incorporated by reference herein.
|
|||
|
10.42*
|
Form of Performance-Based Restricted Stock Unit Award Agreement under the KB Home 2014 Equity Incentive Plan, filed as an exhibit to our Current Report on Form 8-K dated October 14, 2014 (File No. 001-09195), is incorporated by reference herein.
|
|||
|
10.43*
|
Form of Performance Cash Award Agreement under the KB Home 2014 Equity Incentive Plan, filed as an exhibit to our Current Report on Form 8-K dated October 14, 2014 (File No. 001-09195), is incorporated by reference herein.
|
|||
|
10.44*
|
Form of Restricted Cash Award Agreement under the KB Home 2014 Equity Incentive Plan, filed as an exhibit to our Current Report on Form 8-K dated October 14, 2014 (File No. 001-09195), is incorporated by reference herein.
|
|||
108
|
Exhibit
Number
|
Description
|
Sequential
Page
Number
|
||
|
10.45
|
Fourth Amended and Restated KB Home Non-Employee Directors Compensation Plan, effective as of October 9, 2014, filed as an exhibit to our 2014 Annual Report on Form 10-K (File No. 001-09195), is incorporated by reference herein.
|
|||
|
10.46
|
Amended and Restated Revolving Loan Agreement, dated as of August 7, 2015, among us, the banks party thereto, and Citibank, N.A., as Administrative Agent, filed as an exhibit to our Quarterly Report on Form 10-Q for the quarter ended August 31, 2015 (File No. 001-09195), is incorporated by reference herein.
|
|||
|
10.47*
|
Form of Restricted Stock Agreement under the KB Home 2014 Equity Incentive Plan, filed as an exhibit to our 2015 Annual Report on Form 10-K (File No. 001-09195), is incorporated by reference herein.
|
|||
|
10.48*
|
Amended KB Home 2014 Equity Incentive Plan, effective April 7, 2016, filed as an exhibit to our Quarterly Report on Form 10-Q for the quarter ended May 31, 2016 (File No. 001-09195), is incorporated by reference herein.
|
|||
|
12.1†
|
Computation of Ratio of Earnings to Fixed Charges.
|
|||
|
21†
|
Subsidiaries of the Registrant.
|
|||
|
23†
|
Consent of Independent Registered Public Accounting Firm.
|
|||
|
31.1†
|
Certification of Jeffrey T. Mezger, Chairman, President and Chief Executive Officer of KB Home Pursuant to Section 302 of the Sarbanes-Oxley Act of 2002.
|
|||
|
31.2†
|
Certification of Jeff J. Kaminski, Executive Vice President and Chief Financial Officer of KB Home Pursuant to Section 302 of the Sarbanes-Oxley Act of 2002.
|
|||
|
32.1†
|
Certification of Jeffrey T. Mezger, Chairman, President and Chief Executive Officer of KB Home Pursuant to 18 U.S.C. Section 1350, as Adopted Pursuant to Section 906 of the Sarbanes-Oxley Act of 2002.
|
|||
|
32.2†
|
Certification of Jeff J. Kaminski, Executive Vice President and Chief Financial Officer of KB Home Pursuant to 18 U.S.C. Section 1350, as Adopted Pursuant to Section 906 of the Sarbanes-Oxley Act of 2002.
|
|||
|
101†
|
The following materials from KB Home’s Annual Report on Form 10-K for the year ended November 30, 2016, formatted in eXtensible Business Reporting Language (XBRL): (a) Consolidated Statements of Operations for the years ended November 30, 2016, 2015 and 2014, (b) Consolidated Statements of Comprehensive Income for the years ended November 30, 2016, 2015 and 2014, (c) Consolidated Balance Sheets as of November 30, 2016 and 2015, (d) Consolidated Statements of Stockholders’ Equity for the years ended November 30, 2016, 2015 and 2014, (e) Consolidated Statements of Cash Flows for the years ended November 30, 2016, 2015 and 2014, and (f) the Notes to Consolidated Financial Statements.
|
|||
* Management contract or compensatory plan or arrangement in which executive officers are eligible to participate.
† Document filed with this Form 10-K.
109
TABLE OF CONTENTS
Part IItem 1. BusinessItem 1A. Risk FactorsItem 1B. Unresolved Staff CommentsItem 2. PropertiesItem 3. Legal ProceedingsItem 4. Mine Safety DisclosuresPart IIItem 5. Market For Registrant S Common Equity, Related Stockholder Matters and Issuer Purchases Of Equity SecuritiesItem 6. Selected Financial DataItem 7. Management S Discussion and Analysis Of Financial Condition and Results Of OperationsItem 7A. Quantitative and Qualitative Disclosures About Market RiskItem 8. Financial Statements and Supplementary DataNote 1. Summary Of Significant Accounting PoliciesNote 2. Segment InformationNote 3. Financial ServicesNote 4. Earnings Per ShareNote 5. ReceivablesNote 6. InventoriesNote 7. Inventory Impairments and Land Option Contract AbandonmentsNote 8. Variable Interest EntitiesNote 9. Investments in Unconsolidated Joint VenturesNote 10. Other AssetsNote 11. Accrued Expenses and Other LiabilitiesNote 12. Income TaxesNote 13. Notes PayableNote 14. Fair Value DisclosuresNote 15. Commitments and ContingenciesNote 16. Legal MattersNote 17. Stockholders EquityNote 18. Accumulated Other Comprehensive LossNote 19. Employee Benefit and Stock PlansNote 20. Postretirement BenefitsNote 21. Supplemental Disclosure To Consolidated Statements Of Cash FlowsNote 22. Supplemental Guarantor InformationNote 23. Quarterly Results (unaudited)Note 24. Subsequent EventItem 9. Changes in and Disagreements with Accountants on Accounting and Financial DisclosureItem 9A. Controls and ProceduresItem 9B. Other InformationPart IIIItem 10. Directors, Executive Officers and Corporate GovernanceItem 11. Executive CompensationItem 12. Security Ownership Of Certain Beneficial Owners and Management and Related Stockholder MattersItem 13. Certain Relationships and Related Transactions, and Director IndependenceItem 14. Principal Accounting Fees and ServicesPart IVItem 15. Exhibits, Financial Statement SchedulesItem 16. Form 10-k Summary