KEURIG DR PEPPER INC.
10-Ks and 10-Qs
|
|
|
|
|
|
|
|
|
|
|
|
|
|
|
|
|
|
|
|
|
|
|
|
|
|
|
|
|
|
|
|
|
|
|
|
|
|
|
|
|
|
|
|
|
|
|
|
|
|
|
|
|
UNITED STATES SECURITIES AND EXCHANGE COMMISSION
Washington, D. C. 20549
Form 10-K
|
R
|
ANNUAL REPORT PURSUANT TO SECTION 13 OR 15(d) OF THE SECURITIES EXCHANGE ACT OF 1934
|
|
|
FOR THE FISCAL YEAR ENDED DECEMBER 31, 2011
|
|
or
|
|
|
£
|
TRANSITION REPORT PURSUANT TO SECTION 13 OR 15(d) OF THE SECURITIES EXCHANGE ACT OF 1934
|
|
|
For the transition period from to
|
Commission file number 001-33829

(Exact name of Registrant as specified in its charter)
|
Delaware
|
|
98-0517725
|
|
(State or other jurisdiction of
|
|
(I.R.S. employer
|
|
incorporation or organization)
|
|
identification number)
|
|
|
|
|
|
5301 Legacy Drive, Plano, Texas
|
|
75024
|
|
(Address of principal executive offices)
|
|
(Zip code)
|
Registrant's telephone number, including area code:
(972) 673-7000
Securities registered pursuant to Section 12(b) of the Act:
|
Title of Each Class
|
|
Name of Each Exchange on Which Registered
|
|
COMMON STOCK, $0.01 PAR VALUE
|
|
NEW YORK STOCK EXCHANGE
|
Securities registered pursuant to Section 12(g) of the Act: None
Indicate by check mark if the registrant is a well-known seasoned issuer, as defined in Rule 405 of the Securities Act. Yes
R
No
o
Indicate by check mark if the registrant is not required to file reports pursuant to Section 13 or Section 15(d) of the Exchange Act. Yes
o
No
R
Indicate by check mark whether the registrant (1) has filed all reports required to be filed by Section 13 or 15(d) of the Securities Exchange Act of 1934 during the preceding 12 months (or for such shorter period that the registrant was required to file such reports), and (2) has been subject to such filing requirements for the past 90 days. Yes
R
No
o
Indicate by check mark whether the registrant has submitted electronically and posted on its corporate Website, if any, every Interactive Data File required to be submitted and posted pursuant to Rule 405 of Regulation S-T during the preceding 12 months (or for such shorter period that the registrant was required to submit and post such files). Yes
R
No
o
Indicate by check mark if disclosure of delinquent filers pursuant to Item 405 of Regulation S-K is not contained herein, and will not be contained, to the best of the registrant's knowledge, in definitive proxy or information statements incorporated by reference in Part III of this Form 10-K or any amendment to this Form 10-K. Yes
o
No
R
Indicate by check mark whether the registrant is a large accelerated filer, an accelerated filer, a non-accelerated filer or a smaller reporting company. See the definitions of "large accelerated filer", "accelerated filer" and "smaller reporting company" in Rule 12b-2 of the Securities Exchange Act of 1934.
|
Large Accelerated Filer
R
|
Accelerated Filer
o
|
Non-Accelerated Filer
o
|
Smaller Reporting Company
o
|
Indicate by check mark whether the registrant is a shell company (as defined in Rule 12b-2 of the Securities Exchange Act of 1934). Yes
o
No
R
The aggregate market value of the common equity held by non-affiliates of the registrant (assuming for these purposes, but without conceding, that all executive officers and Directors are "affiliates" of the registrant) as of
June 30, 2011, the
last business day of the registrant's most recently completed second fiscal quarter, was
$9,097,082,652
(based on
the closing sale price of the registrant's Common Stock on that date as reported on the New York Stock Exchange).
As of
February 17, 2012
, there were
212,073,549
shares of the registrant's common stock, par value $0.01 per share, outstanding.
DOCUMENTS INCORPORATED BY REFERENCE
Portions of the registrant's Proxy Statement to be filed with the Securities and Exchange Commission in connection with the registrant's Annual Meeting of Stockholders to be held on
May 17, 2012, are
incorporated by reference in Part III.
DR PEPPER SNAPPLE GROUP, INC.
FORM 10-K
For the Year Ended
December 31, 2011
|
|
|
Page
|
|
|
||
|
|
||
|
Item 10.
|
Directors, Executive Officers of the Registrant and Corporate Governance
|
|
|
Item 11.
|
Executive Compensation
|
|
|
Item 12.
|
Security Ownership of Certain Beneficial Owners and Management and Related Stockholder Matters
|
|
|
Item 13.
|
Certain Relationships and Related Transactions and Director Independence
|
|
|
Item 14.
|
Principal Accounting Fees and Services
|
|
|
|
||
ii
SPECIAL NOTE REGARDING FORWARD-LOOKING STATEMENTS
This Annual Report on Form 10-K contains forward-looking statements including, in particular, statements about future events, future financial performance including earnings estimates, plans, strategies, expectations, prospects, competitive environment, regulation and availability of raw materials. Forward-looking statements include all statements that are not historical facts and can be identified by the use of forward-looking terminology such as the words "may," "will," "expect," "anticipate," "believe," "estimate," "plan," "intend" or the negative of these terms or similar expressions in this Annual Report on Form 10-K. We have based these forward-looking statements on our current views with respect to future events and financial performance. Our actual financial performance could differ materially from those projected in the forward-looking statements due to the inherent uncertainty of estimates, forecasts and projections, as well as a variety of other risks and uncertainties and other factors, and our financial performance may be better or worse than anticipated. Given these uncertainties, you should not put undue reliance on any forward-looking statements.
Forward-looking statements represent our estimates and assumptions only as of the date that they were made. We do not undertake any duty to update the forward-looking statements, and the estimates and assumptions associated with them after the date of this Annual Report on Form 10-K, except to the extent required by applicable securities laws. All of the forward-looking statements are qualified in their entirety by reference to the factors discussed in Item 1A, "Risk Factors" under "Risks Related to Our Business" and elsewhere in this Annual Report on Form 10-K. These risk factors may not be exhaustive as we operate in a continually changing business environment with new risks emerging from time to time that we are unable to predict or that we currently do not expect to have a material adverse effect on our business. You should carefully read this report in its entirety as it contains important information about our business and the risks we face.
Our forward-looking statements are subject to risks and uncertainties, including:
|
•
|
the highly competitive markets in which we operate and our ability to compete with companies that have significant financial resources;
|
|
•
|
changes in consumer preferences, trends and health concerns;
|
|
•
|
maintaining our relationships with our large retail customers;
|
|
•
|
dependence on third party bottling and distribution companies;
|
|
•
|
recession, financial and credit market disruptions and other economic conditions;
|
|
•
|
increases in the cost of commodities used in our business;
|
|
•
|
litigation claims or legal proceedings against us;
|
|
•
|
increases in the cost of employee benefits and withdrawal liabilities associated with multi-employer plans;
|
|
•
|
maintaining our relationships with our allied brand owners;
|
|
•
|
future impairment of our goodwill and other intangible assets;
|
|
•
|
the need to service a substantial amount of debt;
|
|
•
|
shortages of materials used in our business;
|
|
•
|
substantial disruption at our manufacturing or distribution facilities;
|
|
•
|
the need for substantial investment and restructuring at our production, distribution and other facilities;
|
|
•
|
strikes or work stoppages;
|
|
•
|
disruptions to our information systems and third-party service providers;
|
|
•
|
our products meeting health and safety standards or contamination of our products;
|
|
•
|
failure to comply with, or changes in, governmental regulations in the countries in which we operate;
|
|
•
|
infringement of our intellectual property rights by third parties, intellectual property claims against us or adverse events regarding licensed intellectual property;
|
|
•
|
our ability to retain or recruit qualified personnel;
|
|
•
|
weather and climate changes;
|
|
•
|
changes in accounting standards; and
|
|
•
|
other factors discussed in Item 1A, "Risk Factors" under "Risks Related to Our Business" and elsewhere in this Annual Report on Form 10-K.
|
ii
ITEM 1.
BUSINESS
Our Company
Dr Pepper Snapple Group, Inc. is a leading integrated brand owner, manufacturer and distributor of non-alcoholic beverages in the United States ("U.S."), Canada and Mexico with a diverse portfolio of flavored (non-cola) carbonated soft drinks ("CSDs") and non-carbonated beverages ("NCBs"), including ready-to-drink teas, juices, juice drinks and mixers. We have some of the most recognized beverage brands in North America, with significant consumer awareness levels and long histories that evoke strong emotional connections with consumers. References in this Annual Report on Form 10-K to "we", "our", "us", "DPS" or "the Company" refer to Dr Pepper Snapple Group, Inc. and its subsidiaries, unless the context requires otherwise.
The following provides highlights about our company:

|
•
|
#1 flavored CSD company in the U.S.
|
|
•
|
Approximately 84% of our volume from brands that are either #1 or #2 in their category
|
|
|
•
|
#3 North American liquid refreshment beverage ("LRB") business
|
|
|
•
|
$5.9 billion of net sales in 2011 from the U.S. (89%), Canada (4%) and Mexico and the Caribbean (7%)
|
|
History of Our Business
We have built our business over the last three decades through a series of strategic acquisitions. In the 1980's through the mid-1990’s, we began building on our then existing Schweppes business by adding brands such as Mott's, Canada Dry and A&W and a license for Sunkist soda. We also acquired the Peñafiel business in Mexico. In 1995, we acquired Dr Pepper/Seven Up, Inc., having previously made minority investments in the company. In 1999, we acquired a 40% interest in Dr Pepper/Seven Up Bottling Group, Inc., ("DPSUBG"), which was then our largest independent bottler, and increased our interest to 45% in 2005. In 2000, we acquired Snapple and other brands, significantly increasing our share of the U.S. NCB market segment. In 2003, we created Cadbury Schweppes Americas Beverages by integrating the way we managed our four North American businesses (Mott's, Snapple, Dr Pepper/Seven Up and Mexico). During 2006 and 2007, we acquired the remaining 55% of DPSUBG and several smaller bottlers and integrated them into our Packaged Beverages segment, thereby expanding our geographic coverage.
We were incorporated in Delaware on October 24, 2007. In 2008, Cadbury Schweppes plc ("Cadbury Schweppes") separated its beverage business in the U.S., Canada, Mexico and the Caribbean (the "Americas Beverages business") from its global confectionery business by contributing the subsidiaries that operated its Americas Beverages business to us.
Products and Distribution
We are a leading integrated brand owner, manufacturer and distributor of non-alcoholic beverages in the U.S, Mexico and Canada and we also distribute our products in the Caribbean. In
2011
,
89%
of our net sales were generated in the U.S.,
4%
in Canada and
7%
in Mexico and the Caribbean. We sold
1.6 billion
equivalent 288 fluid ounce cases in
2011
. The highlights about our significant brands are as follows:
|
CSDs
|
||

|
•
|
#1 in its flavor category and #2 overall flavored CSD in the U.S.
|
|
•
|
Distinguished by its unique blend of 23 flavors and loyal consumer following
|
|
|
•
|
Flavors include regular, diet, cherry and our newest innovation, Dr Pepper TEN
|
|
|
•
|
Oldest major soft drink in the U.S., introduced in 1885
|
|
|
Our Core 4 brands
|
||

|
•
|
#1 ginger ale in the U.S. and Canada
|
|
•
|
Brand includes club soda, tonic, green tea ginger ale and other mixers
|
|
|
•
|
Created in Toronto, Canada in 1904 and introduced in the U.S. in 1919
|
|
1
|
•
|
#2 lemon-lime CSD in the U.S.
|
|
•
|
Flavors include regular, diet and cherry antioxidant
|
|
|
•
|
The original "Un-Cola," created in 1929
|
|
|
•
|
#1 root beer in the U.S.
|
|
•
|
Flavors include regular, diet and cream soda
|
|
|
•
|
A classic all-American beverage first sold at a veteran’s parade in 1919
|
|

|
•
|
#1 orange CSD in the U.S.
|
|
•
|
Flavors include orange, diet and other fruits
|
|
|
•
|
Licensed to us as a CSD by the Sunkist Growers Association since 1986
|
|
|
Other CSD brands
|
||
|
•
|
#1 grapefruit CSD in the U.S. and a leading grapefruit CSD in Mexico
|
|
•
|
Founded in 1938
|
|

|
•
|
#2 orange CSD in the U.S.
|
|
•
|
Flavors include orange, diet and other fruits
|
|
|
•
|
Brand began as the all-natural orange flavor drink in 1906
|
|
|
•
|
#1 carbonated mineral water brand in Mexico
|
|
•
|
Brand includes Flavors, Twist and Naturel
|
|
|
•
|
Mexico’s oldest mineral water
|
|

|
•
|
Royal Crown Cola originated in Columbus, Ga.
|
|
•
|
Flavors include regular, diet and cherry
|
|

|
•
|
#2 ginger ale in the U.S. and Canada
|
|
•
|
Brand includes club soda, tonic and other mixers
|
|
|
•
|
First carbonated beverage in the world, invented in 1783
|
|
2

|
•
|
#2 citrus CSD in the U.S.
|
|
•
|
Flavors include regular, diet and cherry
|
|
|
•
|
Debuted in 1951
|
|
|
NCBs
|
||

|
•
|
A leading ready-to-drink tea in the U.S.
|
|
•
|
A full range of tea products including premium and value teas
|
|
|
•
|
Brand also includes premium juices and juice drinks
|
|
|
•
|
Founded in Brooklyn, New York in 1972
|
|

|
•
|
#1 fruit punch brand in the U.S.
|
|
•
|
Brand includes a variety of fruit flavored and reduced calorie juice drinks
|
|
|
•
|
Developed originally as an ice cream topping known as "Leo’s Hawaiian Punch" in 1934
|
|

|
•
|
#1 apple juice and #1 apple sauce brand in the U.S.
|
|
•
|
Juice products include apple and other fruit juices, Mott’s for Tots and Mott's Medleys
|
|
|
•
|
Apple sauce products include regular, unsweetened, flavored and organic
|
|
|
•
|
Brand began as a line of apple cider and vinegar offerings in 1842
|
|

|
•
|
Leading mineral water in Mexico
|
|
•
|
Brand includes Naturel, Frutal and Frutal Cero (Natural, Fruit and Fruit Zero)
|
|
|
•
|
Created in 1993 in Guadalajara, Mexico
|
|

|
•
|
A leading spicy tomato juice brand in the U.S., Canada and Mexico
|
|
•
|
Key ingredient in Canada’s popular cocktail, the Bloody Caesar
|
|
|
•
|
Created in 1969
|
|


|
•
|
#1 portfolio of mixer brands in the U.S.
|
|
•
|
#1 Bloody Mary brand (Mr & Mrs T) in the U.S.
|
|
|
•
|
Leading mixers (Margaritaville and Rose’s) in their flavor categories
|
The market and industry data in this Annual Report on Form 10-K is from independent industry sources, including The Nielsen Company ("Nielsen") and Beverage Digest. See "Market and Industry Data" below for further information.
The Sunkist soda, Rose’s and Margaritaville logos are registered trademarks of Sunkist Growers, Inc., Cadbury Ireland Limited, which was acquired by Kraft Foods, Inc. ("Kraft") on February 2, 2010, and Margaritaville Enterprises, LLC, respectively, and are in each case used by us under license. All other logos in the table above are registered trademarks of DPS or its subsidiaries.
3
In the CSD market in the U.S. and Canada, we participate primarily in the flavored CSD category. Our key brands are Dr Pepper, Canada Dry, 7UP, A&W, Sunkist soda, Crush and Sun Drop, and we also sell regional and smaller niche brands. In the CSD market we are primarily a manufacturer of beverage concentrates and fountain syrups. Beverage concentrates are highly concentrated proprietary flavors used to make syrup or finished beverages. We manufacture beverage concentrates that are used by our own Packaged Beverages and Latin America Beverages segments, as well as sold to third party bottling companies. According to Nielsen, we ha
d a
21.1%
s
hare of the U.S. CSD market in
2011
(measured by retail sales), whic
h decreased 0.2%
compared to
2010
. We also manufacture fountain syrup that we sell to the foodservice industry directly, through bottlers or through third parties.
In the NCB market segment in the U.S., we participate primarily in the ready-to-drink tea, juice, juice drinks and mixer categories. Our key NCB brands are Snapple, Hawaiian Punch, Mott’s, and Clamato, and we also sell regional and smaller niche brands. We manufacture most of our NCBs as ready-to-drink beverages and distribute them through our own distribution network and through third parties or direct to our customers’ warehouses. In addition to NCB beverages, we also manufacture Mott’s apple sauce as a finished product.
In Mexico and the Caribbean, we participate primarily in the carbonated mineral water, flavored CSD, bottled water and vegetable juice categories. Our key brands in Mexico include Squirt, Peñafiel, Aguafiel, Crush and Clamato. In Mexico, we manufacture and sell our brands through both our own manufacturing and distribution operations and third party bottlers. In the Caribbean, we distribute our products solely through third party distributors and bottlers.
In
2011
, we manufactured and/or distributed approximately
46%
of our total products sold in the U.S. (as measured by volume). In addition, our businesses manufacture and distribute a variety of brands owned by third parties in specified licensed geographic territories.
Our Strengths
The key strengths of our business are:
Strong portfolio of leading, consumer-preferred brands.
We own a diverse portfolio of well-known CSD and NCB brands. Many of our brands enjoy high levels of consumer awareness, preference and loyalty rooted in their rich heritage, which drive their market positions. Our diverse portfolio provides our bottlers, distributors and retailers with a wide variety of products and provides us with a platform for growth and profitability. We are th
e #1 fla
vored CSD company in the U.S. Our largest brand, Dr Pepper, is the
#2 f
lavored CSD in the U.S., according to Nielsen, and our Snapple brand is a leading ready-to-drink tea. Overall, in
2011
, approximately
84%
of our volume was generated by brands that hold either the #1 or #2 position in their category. The strength of our significant brands has allowed us to launch innovations and brand extensions such as Dr Pepper TEN, Blue Raspberry Crush, Snapple's Papaya Mango Tea and Tea Will Be Loved and Mott's Garden Blend in
2011
. During
2011
, we also launched Sun Drop, a popular regional brand within our portfolio of CSD brands, across the U.S.
Integrated business model.
Our integrated business model provides opportunities for net sales and profit growth through the alignment of the economic interests of our brand ownership and our manufacturing and distribution businesses. For example, we can focus on maximizing profitability for our company as a whole rather than focusing on profitability generated from either the sale of beverage concentrates or the bottling and distribution of our products. Additionally, our integrated business model enables us to be more flexible and responsive to the changing needs of our large retail customers by coordinating sales, service, distribution, promotions and product launches and allows us to more fully leverage our scale and reduce costs by creating greater geographic manufacturing and distribution coverage. Our manufacturing and distribution system also enables us to improve focus on our brands, especially certain of our brands such as 7UP, Sunkist soda, A&W, Squirt, Vernors, Canada Dry, Hawaiian Punch and Snapple, which do not have a large presence in the bottler systems affiliated with The Coca-Cola Company ("Coca-Cola") or PepsiCo, Inc. ("PepsiCo").
Strong customer relationships.
Our brands have enjoyed long-standing relationships with many of our top customers. We sell our products to a wide range of customers, from bottlers and distributors to national retailers, large food service and convenience store customers. We have strong relationships with some of the largest bottlers and distributors, including those affiliated with Coca-Cola and PepsiCo, some of the largest and most important retailers, including Wal-Mart Stores, Inc. ("Wal-Mart"), The Kroger Co., SUPERVALU, INC, Safeway Inc., Publix and Target Corporation, some of the largest food service customers, including McDonald’s Corporation, Yum! Brands, Inc., Burger King Corp., Sonic Corp., Wendy's/Arby's Group, Inc., Jack in the Box, Inc. and Subway Restaurants, and convenience store customers, including 7-Eleven, Inc. Our portfolio of strong brands, operational scale and experience across beverage segments has enabled us to maintain strong relationships with our customers.
4
Attractive positioning within a large and profitable market.
We hold the
#1
position in the U.S. flavored CSD beverage markets by volume according to Beverage Digest. We are also a leader in Canada and Mexico beverage markets. We believe that these markets are well-positioned to benefit from emerging consumer trends such as the need for convenience and the demand for products with health and wellness benefits. Our portfolio of products is biased toward flavored CSDs, which continue to gain market share versus cola CSDs, but also focuses on emerging categories such as teas, energy drinks and juices.
Broad geographic manufacturing and distribution coverage.
As of
December 31, 2011
, we had
18
manufacturing facilities and
116
principal distribution centers and warehouse facilities in the U.S., as well as
three
manufacturing facilities and seven principal distribution centers and warehouse facilities in Mexico. These facilities use a variety of manufacturing processes. We have strategically located manufacturing and distribution capabilities, enabling us to better align our operations with our customers, reduce transportation costs and have greater control over the timing and coordination of new product launches. In addition, our warehouses are generally located at or near bottling plants and geographically dispersed to ensure our products are available to meet consumer demand. We actively manage transportation of our products using our own fleet of approximately
6,000
delivery trucks, as well as third party logistics providers on a selected basis.
Strong operating margins and stable cash flows.
The breadth of our brand portfolio has enabled us to generate strong operating margins which have delivered stable cash flows. These cash flows enable us to consider a variety of alternatives, such as investing in our business, repurchasing shares of our common stock, paying dividends to our stockholders and reducing our debt.
Experienced executive management team.
Our executive management team has over
200
years of collective experience in the food and beverage industry. The team has broad experience in brand ownership, manufacturing and distribution, and enjoys strong relationships both within the industry and with major customers. In addition, our management team has diverse skills that support our operating strategies, including driving organic growth through targeted and efficient marketing, improving productivity of our operations, aligning manufacturing and distribution interests and executing strategic acquisitions.
Our Strategy
The key elements of our business strategy are to:
Build and enhance leading brands.
We have a well-defined portfolio strategy to allocate our marketing and sales resources. We use an on-going process of market and consumer analysis to identify key brands that we believe have the greatest potential for profitable sales growth. We intend to continue to invest most heavily in our key brands to drive profitable and sustainable growth by strengthening consumer awareness, developing innovative products and extending brands to take advantage of evolving consumer trends, improving distribution and increasing promotional effectiveness. We also focus on new distribution agreements for emerging, high-growth third party brands in new categories that can use our manufacturing and distribution network. We can provide these new brands with distribution capability and resources to grow, and they provide us with exposure to growing segments of the market with relatively low risk and capital investment.
Increase presence in high margin channels and packages.
We are focused on improving our product presence in high margin channels, such as convenience stores, vending machines and small independent retail outlets, through increased selling activity and significant investments in coolers and other cold drink equipment. We have continued the expanded placement program for our branded coolers and other cold drink equipment and intend to selectively increase the number of those types of equipment where we believe we can achieve an attractive return on investment. We also intend to increase demand for high margin products like single-serve packages for many of our key brands through increased promotional activity.
Leverage our integrated business model.
We believe our integrated brand ownership, manufacturing and distribution business model provides us opportunities for net sales and profit growth through the alignment of the economic interests of our brand ownership and our manufacturing and distribution businesses. We intend to continue leveraging our integrated business model to reduce costs by creating greater geographic manufacturing and distribution coverage and to be more flexible and responsive to the changing needs of our large retail customers by coordinating sales, service, distribution, promotions and product launches.
Strengthen our route-to-market.
Strengthening our route-to-market will ensure the ongoing health of our brands. We have rolled out handheld technology and are upgrading our information technology ("IT") infrastructure to improve route productivity and data integrity and standards. With third party bottlers, we continue to deliver programs that maintain priority for our brands in their systems.
5
Improve operating efficiency.
We have been able to create multi-product manufacturing facilities which provide a region with a wide variety of our products at reduced transportation and co-packing costs. In 2010, we launched our Rapid Continuous Improvement ("RCI") initiative, which uses Lean and Six Sigma tools to deliver customer value and improve productivity. We believe RCI should enable us to leverage top line growth to accelerate net income growth and improve free cash flow.
Our Business Operations
As of
December 31, 2011
, our operating structure consists of three business segments: Beverage Concentrates, Packaged Beverages and Latin America Beverages. Segment financial data for
2011
,
2010
and
2009
, including financial information about foreign and domestic operations, is included in Note 19 of the Notes to our Audited Consolidated Financial Statements.
Beverage Concentrates
Our Beverage Concentrates segment is principally a brand ownership business. In this segment we manufacture and sell beverage concentrates in the U.S. and Canada. Most of the brands in this segment are CSD brands. In
2011
, our Beverage Concentrates segment had net sales of approximately
$1.2 billion
. Key brands include Dr Pepper, Crush, Canada Dry, Sunkist soda, Schweppes, 7UP, A&W, RC Cola, Squirt, Sun Drop, Diet Rite, Welch's, Country Time, Vernors and the concentrate form of Hawaiian Punch.
We are the industry leader in flavored CSDs with a
40.0%
market share in the U.S. for
2011
, as measured by retail sales according to Nielsen. We are also the third largest CSD brand owner as measured by
2011
retail sales in the U.S. and Canada and we own a leading brand in most of the CSD categories in which we compete.
Almost all of our beverage concentrates are manufactured at our plant in St. Louis, Missouri.
Beverage concentrates are shipped to third party bottlers, as well as to our own manufacturing systems, who combine them with carbonation, water, sweeteners and other ingredients, package it in PET containers, glass bottles and aluminum cans, and sell it as a finished beverage to retailers. Beverage concentrates are also manufactured into syrup, which is shipped to fountain customers, such as fast food restaurants, who mix the syrup with water and carbonation to create a finished beverage at the point of sale to consumers. Dr Pepper represents most of our fountain channel volume. Concentrate prices historically have been reviewed and adjusted at least on an annual basis.
Our Beverage Concentrates brands are sold by our bottlers, including our own Packaged Beverages segment, through all major retail channels including supermarkets, fountains, mass merchandisers, club stores, vending machines, convenience stores, gas stations, small groceries, drug chains and dollar stores. Unlike the majority of our other CSD brands,
70%
of Dr Pepper volumes are distributed through the Coca-Cola affiliated and PepsiCo affiliated bottler systems.
PepsiCo and Coca-Cola are the two largest customers of the Beverage Concentrates segment, and constituted approximately
29%
and
20%
,
respectively, of the segment's net sales during
2011
.
Packaged Beverages
Our Packaged Beverages segment is principally a brand ownership, manufacturing and distribution business. In this segment, we primarily manufacture and distribute packaged beverages and other products, including our brands, third party owned brands and certain private label beverages, in the U.S. and Canada. In
2011
, our Packaged Beverages segment had net sales of approximately
$4.3 billion
. Key NCB brands in this segment include Hawaiian Punch, Snapple, Mott's, Yoo-Hoo, Clamato, Deja Blue, AriZona, FIJI, Mistic, Nantucket Nectars, ReaLemon, Mr and Mrs T, Rose's and Country Time. Key CSD brands in this segment include 7UP, Dr Pepper, A&W, Sunkist soda, Canada Dry, Squirt, RC Cola, Big Red, Sun Drop, Diet Rite, IBC and Vernors.
Approximately
87%
of our
2011
Packaged Beverages net sales of branded products come from our own brands, with the remaining from the distribution of third party brands such as Big Red, AriZona tea, FIJI mineral water, Neuro beverages, Vita Coco coconut water and Hydrive energy drinks. A portion of our sales also comes from bottling beverages and other products for private label owners or others, which is also referred to as contract manufacturing. Although the majority of our Packaged Beverages’ net sales relate to our brands, we also provide a route-to-market for third party brand owners seeking effective distribution for their new and emerging brands. These brands give us exposure in certain markets to fast growing segments of the beverage industry with minimal capital investment.
6
Our Packaged Beverages’ products are manufactured in multiple facilities across the U.S. and are sold or distributed to retailers and their warehouses by our own distribution network or by third party distributors. The raw materials used to manufacture our products include aluminum cans and ends, glass bottles, PET bottles and caps, paper products, sweeteners, juices, water and other ingredients.
We sell our Packaged Beverages’ products both through our Direct Store Delivery system ("DSD"), supported by a fleet of approximately
6,000
vehicles
and
12,000
employees, including sales representatives, merchandisers, drivers and warehouse workers, as well as through our Warehouse Direct delivery system ("WD"), both of which include the sales to all major retail channels, including supermarkets, fountain channel, mass merchandisers, club stores, vending machines, convenience stores, gas stations, small groceries, drug chains and dollar stores.
In
2011
, Wal-Mart, the largest customer of our Packaged Beverages segment, accounted for approximately
18%
of our net sales in this segment.
Latin America Beverages
Our Latin America Beverages segment is a brand ownership, manufacturing and distribution business. This segment participates mainly in the carbonated mineral water, flavored CSD, bottled water and vegetable juice categories, with particular strength in carbonated mineral water, vegetable juice categories and grapefruit flavored CSDs. In
2011
, our Latin America Beverages segment had net sales of
$418 million
with our operations in Mexico representing approximately
89%
of the net sales of this segment. Key brands include Squirt, Peñafiel, Aguafiel, Crush and Clamato.
In Mexico, we manufacture and distribute our products through our bottling operations and third party bottlers and distributors. In the Caribbean, we distribute our products through third party bottlers and distributors. In Mexico, we also participate in a joint venture to manufacture Aguafiel brand water with Acqua Minerale San Benedetto. We provide expertise in the Mexican beverage market and Acqua Minerale San Benedetto provides expertise in water production and new packaging technologies.
We sell our finished beverages through all major Mexican retail channels, including "mom and pop" stores, supermarkets, hypermarkets, and on premise channels.
Bottler and Distributor Agreements
In the U.S. and Canada, we generally grant perpetual, exclusive license agreements for CSD brands and packages to bottlers for specific geographic areas. These agreements prohibit bottlers from selling the licensed products outside their exclusive territory and selling any imitative products in that territory. Generally, we may terminate bottling agreements only for cause or change in control and the bottler may terminate without cause upon giving certain specified notice and complying with other applicable conditions. Fountain agreements for bottlers generally are not exclusive for a territory, but do restrict bottlers from carrying imitative product in the territory. Many of our brands such as Snapple, Mistic, Stewart’s, Nantucket Nectars, Yoo-Hoo and Orangina, are licensed for distribution in various territories to bottlers and a number of smaller distributors such as beer wholesalers, wine and spirit distributors, independent distributors and retail brokers. We may terminate some of these distribution agreements only for cause and the distributor may terminate without cause upon certain notice and other conditions. Either party may terminate some of the other distribution agreements without cause upon giving certain specified notice and complying with other applicable conditions.
Agreement with PepsiCo
On February 26, 2010, we completed the licensing of certain brands to PepsiCo following PepsiCo’s acquisition of Pepsi Bottling Group ("PBG") and PepsiAmericas, Inc. ("PAS").
Under the licensing agreements, PepsiCo began distributing Dr Pepper, Crush and Schweppes in the U.S. territories where these brands were previously being distributed by PBG and PAS. The same applies to Dr Pepper, Crush, Schweppes, Vernors and Sussex in Canada; and Squirt and Canada Dry in Mexico.
Additionally, in U.S. territories where it has a distribution footprint, we distribute certain owned and licensed brands, including Sunkist soda, Squirt, Vernors, Canada Dry and Hawaiian Punch, that were previously distributed by PBG and PAS.
Under the agreements, we received a one-time nonrefundable cash payment of $900 million. The new agreements have an initial period of 20 years with automatic 20-year renewal periods, and requires PepsiCo to meet certain performance conditions. The payment was recorded as deferred revenue and is recognized as net sales ratably over the estimated 25-year life of the customer relationship.
7
Agreement with Coca-Cola
On October 4, 2010, we completed the licensing of certain brands to Coca-Cola following Coca-Cola’s acquisition of Coca-Cola Enterprises' ("CCE") North American Bottling Business and executed separate agreements pursuant to which Coca-Cola began offering Dr Pepper and Diet Dr Pepper in local fountain accounts and the Freestyle fountain program.
Under the licensing agreements, Coca-Cola distributes Dr Pepper in the U.S. and Canada Dry in the Northeast territories where these brands were formerly distributed by CCE. The same applies to Canada Dry and C Plus in Canada. As part of the U.S. licensing agreement, Coca-Cola offers Dr Pepper and Diet Dr Pepper in its local fountain accounts. The agreements have an initial period of 20 years with automatic 20-year renewal periods, and requires Coca-Cola to meet certain performance conditions.
Under a separate agreement, Coca-Cola has agreed to include Dr Pepper and Diet Dr Pepper brands in its Freestyle fountain program. The Freestyle fountain program agreement has a period of 20 years. Additionally, in certain U.S. territories where it has a distribution footprint, we are selling certain owned and licensed brands, including Canada Dry, Schweppes, Squirt and Cactus Cooler, that were previously distributed by CCE.
Under these arrangements, we received a one-time nonrefundable cash payment of $715 million, which was recorded as deferred revenue and will be recognized as net sales ratably over the estimated 25-year life of the customer relationship.
Customers
We primarily serve two groups of customers: 1) bottlers and distributors and 2) retailers.
Bottlers buy beverage concentrates from us and, in turn, they manufacture, bottle, sell and distribute finished beverages. Bottlers also manufacture an
d distribute syrup for the fountain foodservice channel. In addition, bottlers and distributors purchase finished beverages from us and sell them to retail and other customers. We have strong relationships with bottlers affiliated with Coca-Cola and PepsiCo primarily because of the strength and market position of our key Dr Pepper brand.
Retailers also buy finished beverages directly from us. Our portfolio of strong brands, operational scale and experience in the beverage industry has enabled us to maintain strong relationships with major retailers in the U.S., Canada and Mexico. In
2011
, our largest retailer was Wal-Mart Stores, Inc., representing approximately
14%
of our consolidated net sales.
Seasonality
The beverage market is subject to some seasonal variations. Our beverage sales are generally higher during the warmer months and also can be influenced by the timing of holidays as well as weather fluctuations.
Competition
The LRB industry is highly competitive and continues to evolve in response to changing consumer preferences. Competition is generally based upon brand recognition, taste, quality, price, availability, selection and convenience. We compete with multinational corporations with significant financial resources. Our two largest competitors in the LRB market are Coca-Cola and PepsiCo, which collectively represent approximately
62% of
the U.S. LRB market by volume, according to Beverage Digest. We also compete against other large companies, including Nestlé, S.A. ("Nestle") and Kraft. These competitors can use their resources and scale to rapidly respond to competitive pressures and changes in consumer preferences by introducing new products, reducing prices or increasing promotional activities. As a bottler and manufacturer, we also compete with a number of smaller bottlers and distributors and a variety of smaller, regional and private label manufacturers, such as The Cott Corporation ("Cott"). Smaller companies may be more innovative, better able to bring new products to market and better able to quickly exploit and serve niche markets. We have lower exposure to some of the faster growing non-carbonated and the bottled water segments in the overall LRB market. In Canada, Mexico and the Caribbean, we compete with many of these same international companies as well as a number of regional competitors.
Although these bottlers and distributors are our competitors, many of these companies are also our customers as they purchase beverage concentrates from us.
8
Intellectual Property and Trademarks
Our Intellectual Property.
We possess a variety of intellectual property rights that are important to our business. We rely on a combination of trademarks, copyrights, patents and trade secrets to safeguard our proprietary rights, including our brands and ingredient and production formulas for our products.
Our Trademarks.
Our trademark portfolio includes approximately
2,400
registrations and applications in the U.S., Canada, Mexico and other countries. Brands we own through various subsidiaries in various jurisdictions include Dr Pepper, 7UP, A&W, Canada Dry, RC Cola, Schweppes, Squirt, Crush, Peñafiel, Sun Drop, Aguafiel, Snapple, Mott’s, Hawaiian Punch, Clamato, Mistic, Nantucket Nectars, Mr & Mrs T, ReaLemon, Venom and Deja Blue. We own trademark registrations for most of these brands in the U.S., and we own trademark registrations for some but not all of these brands in Canada, Mexico and other countries. We also own a number of smaller regional brands. Some of our other trademark registrations are in countries where we do not currently have any significant level of business. In addition, in many countries outside the U.S., Canada and Mexico, our rights to many of our brands, including our Dr Pepper trademark and formula, were sold by Cadbury Schweppes beginning over a decade ago to third parties including, in certain cases, to competitors such as Coca-Cola.
Trademarks Licensed from Others.
We license various trademarks from third parties, which generally allow us to manufacture and distribute throughout the U.S. and/or Canada and Mexico. For example, we license from third parties the Sunkist soda, Welch’s, Country Time, Orangina, Stewart’s, Rose’s, Holland House and Margaritaville trademarks. Although these licenses vary in length and other terms, they generally are long-term, cover the entire U.S. and/or Canada and Mexico and generally include a royalty payment to the licensor.
Licensed Distribution Rights.
We have rights in certain territories to bottle and/or distribute various brands we do not own, such as AriZona tea, FIJI mineral water, Neuro beverages and Vita Coco coconut water. Some of these arrangements are relatively shorter in term, are limited in geographic scope and the licensor may be able to terminate the agreement upon an agreed period of notice, in some cases without payment to us.
Intellectual Property We License to Others.
We license some of our intellectual property, including trademarks, to others. For example, we license the Dr Pepper trademark to certain companies for use in connection with food, confectionery and other products. We also license certain brands, such as Dr Pepper and Snapple, to third parties for use in beverages in certain countries where we own the brand but do not otherwise operate our business.
Marketing
Our marketing strategy is to grow our brands through continuously providing new solutions to meet consumers’ changing preferences and needs. We identify these preferences and needs and develop innovative solutions to address the opportunities. Solutions include new and reformulated products, improved packaging design, pricing and enhanced availability. We use advertising, media, sponsorships, merchandising, public relations and promotion to provide maximum impact for our brands and messages.
Manufacturing
As of
December 31, 2011
, we operated
20
manufacturing facilities across the U.S. and Mexico, excluding our manufacturing facility for our joint venture with Acqua Minerale San Benedetto. Almost all of our CSD beverage concentrates are manufactured at a single plant in St. Louis, Missouri. All of our manufacturing facilities are either regional manufacturing facilities, with the capacity and capabilities to manufacture many brands and packages, facilities with particular capabilities that are dedicated to certain brands or products, or smaller bottling plants with a more limited range of packaging capabilities.
We employed approximately
5,000
full-time manufacturing employees in our facilities as of
December 31, 2011
. We have a variety of production capabilities, including hot-fill, cold-fill and aseptic bottling processes, and we manufacture beverages in a variety of packaging materials, including aluminum, glass and PET cans and bottles and a variety of package formats, including single-serve and multi-serve packages and "bag-in-box" fountain syrup packaging.
In
2011
,
89%
of our manufactured volumes came from our brands and
11%
from third party and private-label products. We also use third party manufacturers to package our products for us on a limited basis.
We owned property, plant and equipment, net of accumulated depreciation, totaling
$1,080 million
and
$1,092 million
in the U.S. and
$72 million
and
$76 million
in international locations as of
December 31, 2011
and
2010
, respectively.
9
Warehousing and Distribution
As of
December 31, 2011
, our distribution network consisted of
116
principal
distribution centers and warehouses in the U.S. and seven
principal
distribution centers and warehouses in Mexico. Our warehouses are generally located at or near bottling plants and are geographically dispersed to ensure product is available to meet consumer demand. We actively manage the sale, merchandising and transportation of our products using combination of our own fleet of approximately
6,000
delivery vehicles, as well as third party logistics providers.
Raw Materials
The principal raw materials we use in our business are aluminum cans and ends, glass bottles, PET bottles and caps, paper products, sweeteners, juice, fruit, water and other ingredients. The cost of the raw materials can fluctuate substantially. In addition, we are significantly impacted by changes in fuel costs due to the large truck fleet we operate in our distribution businesses.
Under many of our supply arrangements for these raw materials, the price we pay fluctuates along with certain changes in underlying commodities costs, such as aluminum in the case of cans, natural gas in the case of glass bottles, resin in the case of PET bottles and caps, corn in the case of sweeteners and pulp in the case of paperboard packaging. Manufacturing costs for our Packaged Beverages segment, where we manufacture and bottle finished beverages, are higher as a percentage of our net sales than our Beverage Concentrates segment as the Packaged Beverages segment requires the purchase of a much larger portion of the packaging and ingredients. Although we have contracts with a relatively small number of suppliers, we have generally not experienced any difficulties in obtaining the required amount of raw materials.
When appropriate, we mitigate the exposure to volatility in the prices of certain commodities used in our production process through the use of forward contracts and supplier pricing agreements. The intent of the contracts and agreements is to provide a certain level of short-term predictability in our operating margins and our overall cost structure, while remaining in what we believe to be a competitive cost position.
Research and Development
Our research and development team is composed of scientists and engineers in the U.S. and Mexico who are focused on developing high quality products which have broad consumer appeal, can be sold at competitive prices and can be safely and consistently produced across a diverse manufacturing network. Our research and development team engages in activities relating to product development, microbiology, analytical chemistry, process engineering, sensory science, nutrition, knowledge management and regulatory compliance. We have particular expertise in flavors and sweeteners. Research and development costs are expensed when incurred and amounted to
$15 million
,
$16 million and $15 million for
2011
,
2010
and
2009
, respectively. Additionally, we incurred packaging engineering costs of
$6 million
for each of
2011
and
2010
.
Packaging engineering costs
for
2009
were $7 million. These expenses are recorded in selling, general and administrative expenses in our Consolidated Statements of Income.
Information Technology and Transaction Processing Services
We use a variety of IT systems and networks configured to meet our business needs. Our primary IT data center is hosted in Toronto, Canada by a third party provider. We also use a third party vendor for application support and maintenance, which is based in India and provides resources offshore and onshore.
We use a business process outsourcing provider located in India to provide certain back office transactional processing services, including accounting, order entry and other transactional services.
Employees
At
December 31, 2011
, we employed approximately
19,000
e
mployees.
In the U.S., we have approximately
16,000
full-time employees. We have many union collective bargaining agreements covering approximately
4,000
full-time employees. Several agreements cover multiple locations. These agreements often address working conditions as well as wage rates and benefits. In Mexico and the Caribbean, we employ approximately
3,000
fu
ll-time employees, with approximately
1,000
employees party to collective bargaining agreements. We do not have a significant number of employees in Canada.
We believe we have good relations with our employees.
10
Regulatory Matters
We are subject to a variety of federal, state and local laws and regulations in the countries in which we do business. Regulations apply to many aspects of our business including our products and their ingredients, manufacturing, safety, labeling, transportation, recycling, advertising and sale. For example, our products, and their manufacturing, labeling, marketing and sale in the U.S. are subject to various aspects of the Federal Food, Drug, and Cosmetic Act, the Federal Trade Commission Act, the Lanham Act, state consumer protection laws and state warning and labeling laws. In Canada and Mexico, the manufacture, distribution, marketing and sale of our many products are also subject to similar statutes and regulations.
We and our bottlers use various refillable and non-refillable, recyclable bottles and cans in the U.S. and other countries. Various states and other authorities require deposits, eco-taxes or fees on certain containers. Similar legislation or regulations may be proposed in the future at local, state and federal levels, both in the U.S. and elsewhere. In Mexico, the government has encouraged the soft drinks industry to comply voluntarily with collection and recycling programs of plastic material, and we are in compliance with these programs.
Environmental, Health and Safety Matters
In the normal course of our business, we are subject to a variety of federal, state and local environment, health and safety laws and regulations. We maintain environmental, health and safety policies and a quality, environmental, health and safety program designed to ensure compliance with applicable laws and regulations. The cost of such compliance measures does not have a material financial impact on our operations.
Available Information
Our web site address is www.drpeppersnapplegroup.com. Information on our web site is not incorporated by reference in this document. We make available, free of charge through this web site, our annual reports on Form 10-K, quarterly reports on Form 10-Q, current reports on Form 8-K and amendments to those reports filed or furnished pursuant to the Securities Exchange Act of 1934, as amended, as soon as reasonably practicable after such material is electronically filed with, or furnished to, the Securities and Exchange Commission.
Market and Industry Data
The market and industry data in this Annual Report on Form 10-K is from independent industry sources, including Nielsen and Beverage Digest. Although we believe that these independent sources are reliable, we have not verified the accuracy or completeness of this data or any assumptions underlying such data.
Nielsen is a marketing information provider, primarily serving consumer packaged goods manufacturers and retailers. We use Nielsen data as our primary management tool to track market performance because it has broad and deep data coverage, is based on consumer transactions at retailers, and is reported to us monthly. Nielsen data provides measurement and analysis of marketplace trends such as market share, retail pricing, promotional activity and distribution across various channels, retailers and geographies. Measured categories provided to us by Nielsen Scantrack include flavored (non-cola) CSDs, energy drinks, single-serve bottled water, non-alcoholic mixers and NCBs, including ready-to-drink teas, single-serve and multi-serve juice and juice drinks, and sports drinks. Nielsen also provides data on other food items such as apple sauce. Nielsen data we present in this report is from Nielsen's Scantrack service, which compiles data based on scanner transactions in certain sales channels, including grocery stores, mass merchandisers, drug chains, convenience stores and gas stations. However, this data does not include the fountain or vending channels, Wal-Mart or small independent retail outlets, which together represent a meaningful portion of the U.S. LRB market and of our net sales and volume.
Beverage Digest is an independent beverage research company that publishes an annual Beverage Digest Fact Book. We use Beverage Digest primarily to track market share information and broad beverage and channel trends. This annual publication provides a compilation of data supplied by beverage companies. Beverage Digest covers the following categories: CSDs, energy drinks, bottled water and NCBs (including ready-to-drink teas, juice and juice drinks and sports drinks). Beverage Digest data does not include multi-serve juice products or bottled water in packages of 1.5 liters or more. Data is reported for certain sales channels, including grocery stores, mass merchandisers, club stores, drug chains, convenience stores, gas stations, fountains, vending machines and the “up-and-down-the-street” channel consisting of small independent retail outlets.
11
We use both Nielsen and Beverage Digest to assess both our own and our competitors’ performance and market share in the U.S. Different market share rankings can result for a specific beverage category depending on whether data from Nielsen or Beverage Digest is used, in part because of the differences in the sales channels reported by each source. For example, because the fountain channel (where we have a relatively small business except for Dr Pepper) is not included in Nielsen data, our market share using Nielsen data is generally higher for our CSD portfolio than the Beverage Digest data, which does include the fountain channel.
In this Annual Report on Form 10-K, all information regarding the beverage market in the U.S. is from Beverage Digest, and, except as otherwise indicated, is from
2010
. All information regarding our brand market positions in the U.S. is from Nielsen and is based on retail dollar sales in
2011
.
ITEM 1A.
RISK FACTORS
Risks Related to Our Business
In addition to the other information set forth in this report, you should carefully consider the risks described below which could materially affect our business, financial condition, or future results. Any of the following risks, as well as other risks and uncertainties, could harm our business and financial condition.
We operate in highly competitive markets.
The LRB industry is highly competitive and continues to evolve in response to changing consumer preferences. Competition is generally based upon brand recognition, taste, quality, price, availability, selection and convenience. We compete with multinational corporations with significant financial resources. Our two largest competitors in the LRB market are Coca-Cola and PepsiCo, which represent approximately
62%
of the U.S. LRB market by volume, according to Beverage Digest. We also compete against other large companies, including Nestle and Kraft. These competitors can use their resources and scale to rapidly respond to competitive pressures and changes in consumer preferences by introducing new products, reducing prices or increasing promotional activities. As a bottler and manufacturer, we also compete with a number of smaller bottlers and distributors and a variety of smaller, regional and private label manufacturers, such as Cott. Smaller companies may be more innovative, better able to bring new products to market and better able to quickly exploit and serve niche markets. We have lower exposure to energy drinks, some of the faster growing non-carbonated and the bottled water segments in the overall LRB market. In Canada, Mexico and the Caribbean, we compete with many of these same international companies as well as a number of regional competitors.
Our inability to compete effectively could result in a decline in our sales. As a result, we may have to reduce our prices or increase our spending on marketing, advertising and product innovation. Any of these could negatively affect our business and financial performance.
We may not effectively respond to changing consumer preferences, trends, health concerns and other factors.
Consumers' preferences can change due to a variety of factors, including aging of the population, social trends, negative publicity, economic downturn or other factors. For example, consumers are increasingly concerned about health and wellness, and demand for regular CSDs has decreased as consumers have shifted towards low or no calorie soft drinks and, increasingly, to NCBs, such as water, ready-to-drink teas and sports drinks. If we do not effectively anticipate these trends and changing consumer preferences, then quickly develop new products in response, our sales could suffer. Developing and launching new products can be risky and expensive. We may not be successful in responding to changing markets and consumer preferences, and some of our competitors may be better able to respond to these changes, either of which could negatively affect our business and financial performance.
We depend on a small number of large retailers for a significant portion of our sales.
Food and beverage retailers in the U.S. have been consolidating, resulting in large, sophisticated retailers with increased buying power. They are in a better position to resist our price increases and demand lower prices. They also have leverage to require us to provide larger, more tailored promotional and product delivery programs. If we and our bottlers and distributors do not successfully provide appropriate marketing, product, packaging, pricing and service to these retailers, our product availability, sales and margins could suffer. Certain retailers make up a significant percentage of our products’ retail volume, including volume sold by our bottlers and distributors. Some retailers also offer their own private label products that compete with some of our brands. The loss of sales of any of our products in a major retailer could have a material adverse effect on our business and financial performance.
12
We depend on third party bottling and distribution companies for a portion of our business.
Net sales from our Beverage Concentrates segment represent sales of beverage concentrates to third party bottling companies that we do not own. The Beverage Concentrates segment's net sales generate a portion of our overall net sales. Some of these bottlers, PepsiCo and Coca-Cola, are our competitors. The majority of these bottlers’ business comes from selling either their own products or our competitors’ products. In addition, some of the products we manufacture are distributed by third parties. As independent companies, these bottlers and distributors make their own business decisions. They may have the right to determine whether, and to what extent, they produce and distribute our products, our competitors’ products and their own products. They may devote more resources to other products or take other actions detrimental to our brands. In most cases, they are able to terminate their bottling and distribution arrangements with us without cause. We may need to increase support for our brands in their territories and may not be able to pass on price increases to them. Their financial condition could also be adversely affected by conditions beyond our control and our business could suffer. Deteriorating economic conditions could negatively impact the financial viability of third party bottlers. Any of these factors could negatively affect our business and financial performance.
Our financial results may be negatively impacted by recession, financial and credit market disruptions and other economic conditions.
Customer and consumer demand for our products may be impacted by recession or other economic downturn in the U.S., Canada, Mexico or the Caribbean, which could result in a reduction in our sales volume and/or switching to lower price offerings. Similarly, disruptions in financial and credit markets may impact our ability to manage normal commercial relationships with our customers, suppliers and creditors. These disruptions could have a negative impact on the ability of our customers to timely pay their obligations to us, thus reducing our cash flow, or our vendors to timely supply materials.
We could also face increased counterparty risk for our cash investments and our hedge arrangements. Declines in the securities and credit markets could also affect our pension fund, which in turn could increase funding requirements.
Costs for commodities may increase substantially.
The principal raw materials we use in our business are aluminum cans and ends, glass bottles, PET bottles and caps, paperboard packaging, sweeteners, juice, fruit, water and other ingredients. Additionally, conversion of raw materials into our products for sale also uses electricity and natural gas. The cost of the raw materials can fluctuate substantially. We are significantly impacted by increases in fuel costs due to the large truck fleet we operate in our distribution businesses and our use of third party carriers. Under many of our supply arrangements, the price we pay for raw materials fluctuates along with certain changes in underlying commodities costs, such as aluminum in the case of cans, natural gas in the case of glass bottles, resin in the case of PET bottles and caps, corn in the case of sweeteners and pulp in the case of paperboard packaging. Continued price increases could exert pressure on our costs and we may not be able to pass along any such increases to our customers or consumers, which could negatively affect our business and financial performance.
Litigation or legal proceedings could expose us to significant liabilities and damage our reputation.
We are party to various litigation claims and legal proceedings which include employment, tort, real estate, commercial and other litigation. From time to time we are a defendant in class action litigation, including litigation regarding employment practices, product labeling, and wage and hour laws. Plaintiffs in class action litigation may seek to recover amounts which are large and may be indeterminable for some period of time. We evaluate litigation claims and legal proceedings to assess the likelihood of unfavorable outcomes and estimate, if possible, the amount of potential losses. We may establish a reserve as appropriate based upon assessments and estimates in accordance with our accounting policies. We base our assessments, estimates and disclosures on the information available to us at the time and rely on legal and management judgment. Actual outcomes or losses may differ materially from assessments and estimates. Costs to defend litigation claims and legal proceedings and the cost of actual settlements, judgments or resolutions of these claims and legal proceedings may negatively affect our business and financial performance. Any adverse publicity resulting from allegations made in litigation claims or legal proceedings may also adversely affect our reputation, which in turn could adversely affect our results.
Increases in our cost of benefits and multi-employer plan withdrawal liabilities in the future could reduce our profitability.
Our profitability is substantially affected by the costs of pension, postretirement, employee medical costs and other benefits. In recent years, these costs have increased significantly due to factors such as increases in health care costs, declines in investment returns on pension assets and changes in discount rates used to calculate pension and related liabilities. These factors plus the enactment of the Patient Protection and Affordable Care Act in March 2010 will continue to put pressure on our business and financial performance. Although we actively seek to control increases in costs, there can be no assurance that we will succeed in limiting future cost increases, and continued upward pressure in costs, could have a material adverse affect on our business and financial performance.
13
Additionally,
the Company currently participates in four multi-employer pension plans in the United States. Our pension expense for U.S. multi-employer plans totaled
$6 million
for the year ended December 31, 2011. The plans we participate in have collective bargaining agreements that extend into 2015. In the event that we or, in the case of one multi-employer pension plan, another large employer withdraw from participation in any of these plans, then applicable law could require us to record a withdrawal liability, which may be material and could negatively impact our financial performance in the applicable periods.
Our distribution agreements with our allied brands could be terminated.
Monster Beverage Corporation (formerly Hansen Natural Corporation) and glacéau terminated their distribution agreements with us in 2008 and 2007, respectively. We are subject to a risk of other allied brands, such as FIJI, AriZona, Neuro and Vita Coco, terminating their distribution agreements with us, which could negatively affect our business and financial performance.
Determinations in the future that a significant impairment of the value of our goodwill and other indefinite lived intangible assets has occurred and could have a material adverse effect on our results of operations.
As of
December 31, 2011
, we had
$9.3 billion
of total assets, of which approximately
$5.7 billion
were goodwill and other intangible assets. Intangible assets include both definite and indefinite intangible assets in connection with brands, bottler agreements, distribution rights and customer relationships. We conduct impairment tests on goodwill and all indefinite lived intangible assets annually, as of December 31, or more frequently if circumstances indicate that the carrying amount of an asset may not be recoverable. If the carrying amount of an intangible asset exceeds its fair value, an impairment loss is recognized in an amount equal to that excess. There was no impairment required based upon our annual impairment analysis performed as of
December 31, 2011
. For additional information about these intangible assets, see “Critical Accounting Estimates — Goodwill and Other Indefinite Lived Intangible Assets” in Item 7, "Management's Discussion and Analysis of Financial Condition and Results of Income," and our Audited Consolidated Financial Statements included in Item 8, “Financial Statements and Supplementary Data,” in this Annual Report on Form 10-K.
The impairment tests require us to make an estimate of the fair value of intangible assets. Since a number of factors may influence determinations of fair value of intangible assets, we are unable to predict whether impairments of goodwill or other indefinite lived intangibles will occur in the future. Any such impairment would result in us recognizing a non-cash charge in our Consolidated Statements of Income, which may adversely affect our results of operations.
Our total indebtedness could affect our operations and profitability.
We maintain levels of debt we consider prudent based on our actual and expected cash flows. As of
December 31, 2011
, our total indebtedness was
$2,712 million
.
This amount of debt could have important consequences to us and our investors, including:
|
•
|
requiring a portion of our cash flow from operations to make interest payments on this debt; and
|
|
•
|
increasing our vulnerability to general adverse economic and industry conditions, which could impact our debt maturity profile.
|
While we believe we will have the ability to service our debt and will have access to additional sources of capital in the future if and when needed, that will depend upon our results of operations and financial position at the time, the then-current state of the credit and financial markets, and other factors that may be beyond our control.
Certain raw materials we use are available from a limited number of suppliers and shortages could occur.
Some raw materials we use, such as aluminum cans and ends, glass bottles, PET bottles, sweeteners, juice and other ingredients, are sourced from industries characterized by a limited supply base. If our suppliers are unable or unwilling to meet our requirements, we could suffer shortages or substantial cost increases. Changing suppliers can require long lead times. The failure of our suppliers to meet our needs could occur for many reasons, including fires, natural disasters, weather, manufacturing problems, disease, crop failure, strikes, transportation interruption, government regulation, political instability and terrorism. A failure of supply could also occur due to suppliers’ financial difficulties, including bankruptcy. Some of these risks may be more acute where the supplier or its plant is located in riskier or less-developed countries or regions. Any significant interruption to supply or cost increase could substantially harm our business and financial performance.
14
Substantial disruption to production at our manufacturing and distribution facilities could occur.
A disruption in production at our beverage concentrates manufacturing facility, which manufactures almost all of our concentrates, could have a material adverse effect on our business. In addition, a disruption could occur at any of our other facilities or those of our suppliers, bottlers or distributors. The disruption could occur for many reasons, including fire, natural disasters, weather, water scarcity, manufacturing problems, disease, strikes, transportation interruption, government regulation or terrorism. Alternative facilities with sufficient capacity or capabilities may not be available, may cost substantially more or may take a significant time to start production, each of which could negatively affect our business and financial performance.
Our facilities and operations may require substantial investment and upgrading.
We have an ongoing program of investment and upgrading in our manufacturing, distribution and other facilities. We expect to incur substantial costs to upgrade or keep up-to-date various facilities and equipment or restructure our operations, including closing existing facilities or opening new ones. If our investment and restructuring costs are higher than anticipated or our business does not develop as anticipated to appropriately utilize new or upgraded facilities, our costs and financial performance could be negatively affected.
We may not be able to renew collective bargaining agreements on satisfactory terms, or we could experience strikes.
As of
December 31, 2011
, approximately
5,000
of
our employees, many of whom are at our key manufacturing locations, were covered by collective bargaining agreements. These agreements typically expire every three to four years at various dates. We may not be able to renew our collective bargaining agreements on satisfactory terms or at all. This could result in strikes or work stoppages, which could impair our ability to manufacture and distribute our products and result in a substantial loss of sales. The terms of existing or renewed agreements could also significantly increase our costs or negatively affect our ability to increase operational efficiency.
We depend on key information systems and third party service providers.
We depend on key information systems to accurately and efficiently transact our business, provide information to management and prepare financial reports. We rely on third party providers for a number of key information systems and business processing services, including hosting our primary data center and processing various accounting, order entry and other transactional services. These systems and services are vulnerable to interruptions or other failures resulting from, among other things, natural disasters, terrorist attacks, software, equipment or telecommunications failures, processing errors, computer viruses, hackers, other security issues or supplier defaults. Security, backup and disaster recovery measures may not be adequate or implemented properly to avoid such disruptions or failures. Any disruption or failure of these systems or services could cause substantial errors, processing inefficiencies, security breaches, inability to use the systems or process transactions, loss of customers or other business disruptions, all of which could negatively affect our business and financial performance.
Our products may not meet health and safety standards or could become contaminated.
We have adopted various quality, environmental, health and safety standards. However, our products may still not meet these standards or could otherwise become contaminated. A failure to meet these standards or contamination could occur in our operations or those of our bottlers, distributors or suppliers. This could result in expensive production interruptions, recalls and liability claims. Moreover, negative publicity could be generated from false, unfounded or nominal liability claims or limited recalls. Any of these failures or occurrences could negatively affect our business and financial performance.
We may not comply with applicable government laws and regulations and they could change.
We are subject to a variety of federal, state and local laws and regulations in the U.S., Canada, Mexico and other countries in which we do business. These laws and regulations apply to many aspects of our business including the manufacture, safety, labeling, transportation, advertising and sale of our products. See "Regulatory Matters" in Item 1, "Business," of this Annual Report on Form 10-K for more information regarding many of these laws and regulations. Violations of these laws or regulations could damage our reputation and/or result in regulatory actions with substantial penalties. In addition, any significant change in such laws or regulations or their interpretation, or the introduction of higher standards or more stringent laws or regulations could result in increased compliance costs or capital expenditures. For example, changes in recycling and bottle deposit laws or special taxes on soft drinks or ingredients could increase our costs. Regulatory focus on the health, safety and marketing of food products is increasing. Certain state warning and labeling laws, such as California's "Prop 65," which requires warnings on any product with substances that the state lists as potentially causing cancer or birth defects, could become applicable to our products.
15
Some local and regional governments and school boards have enacted, or have proposed to enact, regulations restricting the sale of certain types of soft drinks in schools. Any violations or changes of regulations could have a material adverse effect on our profitability, or disrupt the production or distribution of our products, and negatively affect our business and financial performance. In addition, taxes imposed on the sale of certain of our products by federal, state, local and foreign governments could cause consumers to shift away from purchasing our products.
Our intellectual property rights could be infringed or we could infringe the intellectual property rights of others and adverse events regarding licensed intellectual property, including termination of distribution rights, could harm our business.
We possess intellectual property that is important to our business. This intellectual property includes ingredient formulas, trademarks, copyrights, patents, business processes and other trade secrets. See “Intellectual Property and Trademarks” in Item 1, “Business,” of this Annual Report on Form 10-K for more information. We and third parties, including competitors, could come into conflict over intellectual property rights. Litigation could disrupt our business, divert management attention and cost a substantial amount to protect our rights or defend ourselves against claims. We cannot be certain that the steps we take to protect our rights will be sufficient or that others will not infringe or misappropriate our rights. If we are unable to protect our intellectual property rights, our brands, products and business could be harmed.
We also license various trademarks from third parties and license our trademarks to third parties. In some countries, other companies own a particular trademark which we own in the U.S., Canada or Mexico. For example, the Dr Pepper trademark and formula is owned by Coca-Cola in certain other countries. Adverse events affecting those third parties or their products could affect our use of the trademark and negatively impact our brands.
In some cases, we license products from third parties which we distribute. The licensor may be able to terminate the license arrangement upon an agreed period of notice, in some cases without payment to us of any termination fee. The termination of any material license arrangement could adversely affect our business and financial performance.
We could lose key personnel or may be unable to recruit qualified personnel.
Our performance significantly depends upon the continued contributions of our executive officers and key employees, both individually and as a group, and our ability to retain and motivate them. Our officers and key personnel have many years of experience with us and in our industry and it may be difficult to replace them. If we lose key personnel or are unable to recruit qualified personnel, our operations and ability to manage our business may be adversely affected. We do not have “key person” life insurance for any of our executive officers or key employees.
Weather and climate changes could adversely affect our business.
Unseasonable or unusual weather or long-term climate changes may negatively impact the price or availability of raw materials, energy and fuel, and demand for our products. Unusually cool weather during the summer months may result in reduced demand for our products and have a negative effect on our business and financial performance.
There is growing political and scientific sentiment that increased concentrations of carbon dioxide and other greenhouse gases in the atmosphere are influencing global weather patterns ("global warming"). Changing weather patterns, along with the increased frequency or duration of extreme weather conditions, could negatively impact the availability or increase the cost of key raw materials that we use to produce our products. Additionally, the sale of our products can be negatively impacted by weather conditions.
Concern over climate change, including global warming, has led to legislative and regulatory initiatives directed at limiting greenhouse gas (GHG) emissions. For example, proposals that would impose mandatory requirements on GHG emissions continue to be considered by policy makers in the countries that we operate. Laws enacted that directly or indirectly affect our production, distribution, packaging, cost of raw materials, fuel, ingredients, and water could all negatively impact our business and financial results.
Changes in accounting standards could affect our reported financial results.
The number of new accounting standards or pronouncements is increasing as the Financial Accounting Standards Board and the International Accounting Standards Board work towards a convergence of accounting standards. Certain standards may become applicable for us and change the interpretation of existing standards and pronouncements, which could have a significant effect on our reported results or financial position for the affected periods.
ITEM 1B.
UNRESOLVED STAFF COMMENTS
None.
16
ITEM 2.
PROPERTIES
As of
December 31, 2011
, we owned or leased
159
administrative, manufacturing, and principal distribution centers and warehouse facilities operating across the Americas. Our corporate headquarters are located in Plano, Texas, in a facility that we own.
The following table summarizes our significant properties by geography and by operating segment:
|
Packaged
|
Beverage
|
Latin America
|
|||||||||||||||
|
Beverages
|
Concentrates
|
Beverages
|
|||||||||||||||
|
Owned
|
Leased
|
Owned
|
Owned
|
Leased
|
Total
|
||||||||||||
|
United States:
|
|||||||||||||||||
|
Office buildings
(1)
|
2
|
|
9
|
|
—
|
|
—
|
|
—
|
|
11
|
|
|||||
|
Manufacturing facilities
|
11
|
|
6
|
|
1
|
|
—
|
|
—
|
|
18
|
|
|||||
|
Principal distribution centers and warehouse facilities
|
39
|
|
77
|
|
—
|
|
—
|
|
—
|
|
116
|
|
|||||
|
52
|
|
92
|
|
1
|
|
—
|
|
—
|
|
145
|
|
||||||
|
Mexico and Canada:
|
|||||||||||||||||
|
Office buildings
|
—
|
|
2
|
|
—
|
|
—
|
|
2
|
|
4
|
|
|||||
|
Manufacturing facilities
(2)
|
—
|
|
—
|
|
—
|
|
3
|
|
—
|
|
3
|
|
|||||
|
Principal distribution centers and warehouse facilities
|
—
|
|
—
|
|
—
|
|
3
|
|
4
|
|
7
|
|
|||||
|
—
|
|
2
|
|
—
|
|
6
|
|
6
|
|
14
|
|
||||||
|
Total
|
52
|
|
94
|
|
1
|
|
6
|
|
6
|
|
159
|
|
|||||
____________________________
(1) The two office buildings owned by our Packaged Beverages operating segment includes our corporate headquarters located in Plano, Texas.
(2) The three manufacturing facilities owned by Latin America Beverages operating segment includes the manufacturing facility for our joint venture
with Acqua Minerale San Benedetto.
The properties presentation provided in Item 2 of our Annual Report on Form 10-K for the year ended December 31, 2010 included all distribution centers and warehouses. The properties presentation provided herein presents our principal distribution centers and warehouse facilities.
We believe our facilities in the U.S. and Mexico are well-maintained and adequate, that they are being appropriately utilized in line with past experience, and that they have sufficient production capacity for their present intended purposes. The extent of utilization of such facilities varies based on seasonal demand of our products. It is not possible to measure with any degree of certainty or uniformity the productive capacity and extent of utilization of these facilities. We periodically review our space requirements, and we believe we will be able to acquire new space and facilities as and when needed on reasonable terms. We also look to consolidate and dispose or sublet facilities we no longer need, as and when appropriate.
ITEM 3.
LEGAL PROCEEDINGS
We are occasionally subject to litigation or other legal proceedings relating to our business. See Note 18 of the Notes to our Audited Consolidated Financial Statements for more information related to commitments and contingencies, which are incorporated herein by reference.
ITEM 4.
MINE SAFETY DISCLOSURES
Not applicable.
17
ITEM 5.
MARKET FOR REGISTRANT’S COMMON EQUITY, RELATED STOCKHOLDER MATTERS AND ISSUER PURCHASES OF EQUITY SECURITIES
In the United States, our common stock is listed and traded on the New York Stock Exchange under the symbol "DPS". Information as to the high and low sales prices of our stock for the two years ended
December 31, 2011
, and the frequency and amount of dividends declared on our stock during these periods, is set forth in Note 23 of the Notes to our Audited Consolidated Financial Statements.
As of
February 17, 2012
, there were approximately
22,000
stockholders of record of our common stock. This figure does not include a substantially greater number of "street name" holders or beneficial holders of our common stock, whose shares are held of record by banks, brokers, and other financial institutions.
The information under the principal heading "Equity Compensation Plan Information" in our definitive Proxy Statement for the Annual Meeting of Stockholders to be hel
d on May 17, 2012, to be f
iled with the Securities and Exchange Commission, is incorporated herein by reference.
During the fiscal years ended
December 31, 2011
,
2010
, and
2009
, we did not sell any equity securities that were not registered under the Securities Act of 1933, as amended.
Dividend Policy
On November 20, 2009, our Board
of Directors (the "Board")
declared our first dividend of
$0.15
per share on outstanding common stock, which was paid on January 8, 2010 to stockholders of record at the close of business on December 21, 2009. Prior to that declaration, we had not paid a cash dividend on our common stock since our demerger on May 7, 2008.
Our Board declared dividends of
$1.21
and
$0.90
per share on outstanding common stock during the
years ended
December 31, 2011
and
2010
, respectively.
We expect to return our excess cash flow to our stockholders, from time to time through our common stock repurchase program described below or the payment of dividends. However, there can be no assurance that share repurchases will occur or future dividends will be declared and paid. The share repurchase programs and declaration and payment of future dividends, the amount of any such share repurchases or dividends, and the establishment of record and payment dates for dividends, if any, are subject to final determination by our Board after its review of the then current strategy and financial performance and position, among other things.
Common Stock Repurchases
During the years ended
December 31, 2011
,
2010
, and
2009
, the Board authorized the repurchase of an aggregate amount of up to $3 billion of the Company's outstanding common stock through
the following Board actions:
|
•
|
$200 million of share repurchases were authorized on November 20, 2009
|
|
•
|
$800 million of share repurchases were authorized on February 24, 2010
|
|
•
|
$1 billion of share repurchases were authorized on July 12, 2010
|
|
•
|
$1 billion
of share repurchases were authorized on November 17, 2011
|
18
We repurchased approximately
14 million
shares of our common stock valued at approximately
$522 million
in the year ended
December 31, 2011
. Our share repurchase activity for each of the three months and the quarter ended
December 31, 2011
was as follows (in thousands, except per share data):
|
Period
|
Number of Shares Purchased
|
Average Price Paid per Share
|
Total Number of Shares Purchased as Part of Publicly Announced Plans or Programs
(2)
|
Maximum Dollar Value of Shares that May Yet be Purchased Under Publicly Announced Plans or Programs
|
||||||||||
|
October 1, 2011 – October 31, 2011
|
—
|
|
$
|
—
|
|
—
|
|
$
|
469,659
|
|
||||
|
November 1, 2011 – November 30, 2011
(1)
|
1,296
|
|
36.74
|
|
1,296
|
|
1,422,031
|
|
||||||
|
December 1, 2011 – December 31, 2011
|
1,311
|
|
38.00
|
|
1,311
|
|
1,372,220
|
|
||||||
|
For the quarter ended December 31, 2011
|
2,607
|
|
37.37
|
|
2,607
|
|
|
|||||||
____________________________
|
(1)
|
On November 17, 2011, the Board authorized the repurchase of an additional $1 billion of our outstanding common stock.
|
(2) As previously announced, on November 20, 2009, our Board authorized the repurchase of up to $200 million of the Company's outstanding common stock during 2010, 2011 and 2012. On February 24, 2010, the Board approved the repurchase of up to an additional $800 million of the Company's outstanding common stock, bringing the total aggregate share repurchase authorization up to $1 billion. On July 12, 2010, the Board authorized the repurchase of an additional $1 billion of the Company's outstanding common stock over the next three years, for a total of $2 billion authorized. On November 17, 2011, the Board authorized the repurchase of an additional $1 billion of the Company's outstanding common stock, for a total of $3 billion authorized. This column discloses the number of shares purchased pursuant to these programs during the indicated time periods.
19
Comparison of Total Stockholder Return
The following performance graph compares our cumulative total returns with the cumulative total returns of the Standard & Poor's 500 and a peer group index. The graph assumes that $100 was invested on May 7, 2008, the day we became a publicly traded company on the New York Stock Exchange, with dividends reinvested.
Comparison of Total Returns
Assumes Initial Investment of $100
December
2011
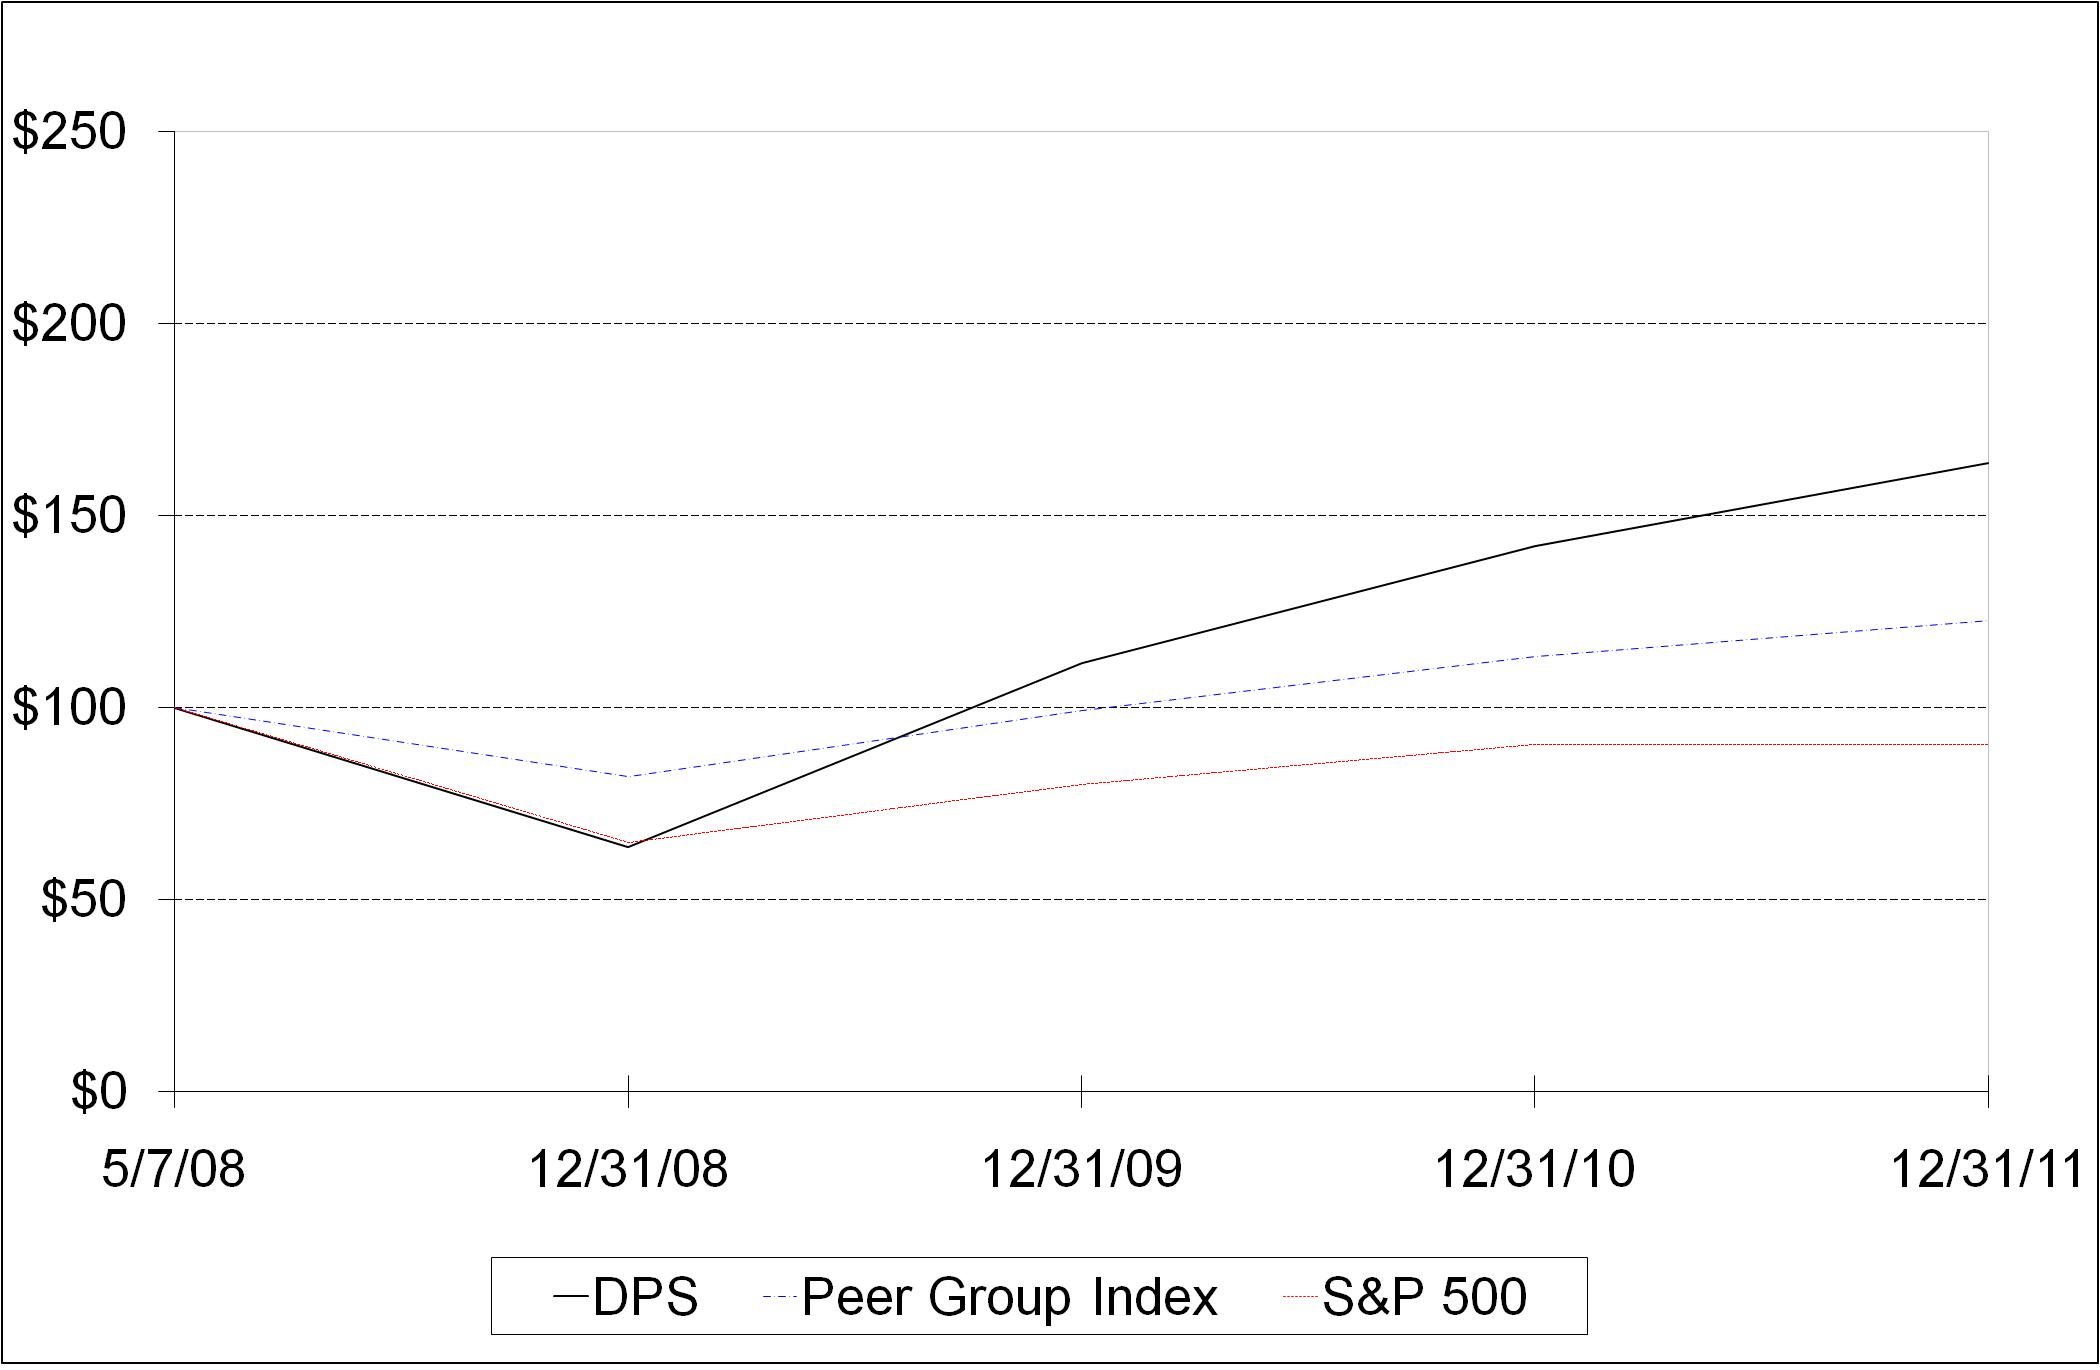
The Peer Group Index consists of the following companies: The Coca-Cola Company ("Coca-Cola"), PepsiCo, Inc. ("PepsiCo"), Monster Beverage Corporation (formerly Hansen Natural Corporation), The Cott Corporation, Jones Soda Co., and National Beverage Corporation. We believe that these companies help to convey an accurate comparison of our performance with the industry.
ITEM 6.
SELECTED FINANCIAL DATA
The following table presents selected historical financial data as of
December 31, 2011
,
2010
,
2009
,
2008
and
2007
. All the selected historical financial data has been derived from our Audited Consolidated Financial Statements and is stated in millions of dollars except for per share information.
For periods prior to May 7, 2008, our financial data has been prepared on a "carve-out" basis from the consolidated financial statements of Cadbury Schweppes plc ("Cadbury") using the historical results of operations, assets and liabilities attributable to Cadbury’s Americas Beverages business and including allocations of expenses from Cadbury. The historical Cadbury's Americas Beverages information is our predecessor financial information. The results included below and elsewhere in this document are not necessarily indicative of our future performance and do not reflect our financial performance had we been an independent, publicly-traded company during the periods prior to May 7, 2008.
20
You should read this information along with the information included in Item 7, "Management's Discussion and Analysis of Financial Condition and Results of Operations," and our Audited Consolidated Financial Statements and the related notes thereto included elsewhere in this Annual Report on Form 10-K.
We made one bottler acquisition in
2007
. The acquisition is included in our consolidated financial statements beginning on its date of acquisition. As a result, our financial data is not comparable on a period-to-period basis.
|
|
Fiscal Year
|
||||||||||||||||||
|
|
2011
|
2010
|
2009
|
2008
(4)
|
2007
(4)
|
||||||||||||||
|
(in millions, except per share data)
|
|||||||||||||||||||
|
Statements of Income Data:
|
|
|
|
|
|
|
|
|
|
|
|||||||||
|
Net sales
|
$
|
5,903
|
|
$
|
5,636
|
|
$
|
5,531
|
|
$
|
5,710
|
|
$
|
5,695
|
|
||||
|
Gross profit
|
3,418
|
|
3,393
|
|
3,297
|
|
3,120
|
|
3,131
|
|
|||||||||
|
Income (loss) from operations
(1)
|
1,024
|
|
1,025
|
|
1,085
|
|
(168
|
)
|
1,004
|
|
|||||||||
|
Net income (loss)
(1)
|
606
|
|
528
|
|
555
|
|
(312
|
)
|
497
|
|
|||||||||
|
Basic earnings (loss) per share
(2)
|
$
|
2.77
|
|
$
|
2.19
|
|
$
|
2.18
|
|
$
|
(1.23
|
)
|
$
|
1.96
|
|
||||
|
Diluted earnings (loss) per share
(2)
|
2.74
|
|
2.17
|
|
2.17
|
|
(1.23
|
)
|
1.96
|
|
|||||||||
|
Dividends declared per share
|
1.21
|
|
0.90
|
|
0.15
|
|
—
|
|
—
|
|
|||||||||
|
Balance Sheet Data:
|
|
|
|
|
|
||||||||||||||
|
Total assets
|
$
|
9,283
|
|
$
|
8,859
|
|
$
|
8,776
|
|
$
|
8,638
|
|
$
|
10,528
|
|
||||
|
Current portion of long-term obligations
|
452
|
|
404
|
|
—
|
|
—
|
|
126
|
|
|||||||||
|
Long-term obligations
|
2,256
|
|
1,687
|
|
2,960
|
|
3,522
|
|
2,912
|
|
|||||||||
|
Other non-current liabilities
(3)
|
2,849
|
|
3,375
|
|
1,775
|
|
1,708
|
|
1,460
|
|
|||||||||
|
Total stockholders’ equity
|
2,263
|
|
2,459
|
|
3,187
|
|
2,607
|
|
5,021
|
|
|||||||||
|
Statements of Cash Flows:
|
|
|
|
|
|
||||||||||||||
|
Cash provided by (used in):
|
|
|
|
|
|
||||||||||||||
|
Operating activities
|
$
|
760
|
|
$
|
2,535
|
|
$
|
865
|
|
$
|
709
|
|
$
|
603
|
|
||||
|
Investing activities
|
(217
|
)
|
(225
|
)
|
(251
|
)
|
1,074
|
|
(1,087
|
)
|
|||||||||
|
Financing activities
|
(152
|
)
|
(2,280
|
)
|
(554
|
)
|
(1,625
|
)
|
515
|
|
|||||||||
____________________________
|
(1)
|
The
2008
loss from operations and net loss reflect non-cash impairment charges of $1,039 million and $696 million ($1,039 million net of tax benefit of $343 million), respectively.
|
|
(2)
|
Earnings (loss) per share ("EPS") are computed by dividing net income (loss) by the weighted average number of common shares outstanding for the period. For all periods prior to May 7, 2008, the number of basic shares used is the number of shares outstanding on May 7, 2008, as no common stock of DPS was traded prior to May 7, 2008 and no DPS equity awards were outstanding for the prior periods. Subsequent to May 7, 2008, the number of basic shares includes approximately 500,000 shares related to former Cadbury Schweppes benefit plans converted to DPS shares on a daily volume weighted average.
|
|
(3)
|
The 2010 other non-current liabilities reflects non-current deferred revenue of $1,515 million due to the receipt of separate one-time nonrefundable cash payments from PepsiCo and Coca-Cola recorded as deferred revenue.
|
|
(4)
|
Upon separation, effective May 7, 2008, DPS became an independent company, which established a new consolidated reporting structure. For the periods prior to May 7, 2008, the consolidated financial statements have been prepared on a "carve-out" basis from Cadbury's consolidated financial statements using historical results of operations, assets and liabilities attributable to Cadbury's Americas Beverages business and including allocations of expenses from Cadbury. The historical Cadbury's Americas Beverages information is the Company’s predecessor financial information. The Company eliminates from its financial results all intercompany transactions between entities included in the consolidation and the intercompany transactions with its equity method investees.
|
21
ITEM 7.
MANAGEMENT'S DISCUSSION AND ANALYSIS OF FINANCIAL CONDITION AND RESULTS OF OPERATIONS
You should read the following discussion in conjunction with our audited financial statements and the related notes thereto included elsewhere in this Annual Report on Form 10-K. This discussion contains forward-looking statements that are based on management's current expectations, estimates and projections about our business and operations. Our actual results may differ materially from those currently anticipated and expressed in such forward-looking statements as a result of various factors including the factors we describe under "Special Note Regarding Forward-Looking Statements", "Risk Factors," and elsewhere in this Annual Report on Form 10-K.
References in this Annual Report on Form 10-K to "we", "our", "us", "DPS" or "the Company" refer to Dr Pepper Snapple Group, Inc. and all entities included in our Audited Consolidated Financial Statements. Cadbury plc and Cadbury Schweppes plc are hereafter collectively referred to as "Cadbury" unless otherwise indicated. Kraft Foods Inc., which acquired Cadbury on February 2, 2010, is hereafter referred to as "Kraft".
The periods presented in this section are the years ended
December 31, 2011
,
2010
and
2009
, which we refer to as "
2011
", "
2010
" and "
2009
", respectively.
Business Overview
We are a leading integrated brand owner, manufacturer and distributor of non-alcoholic beverages in the United States ("U.S."), Canada and Mexico with a diverse portfolio of flavored carbonated soft drinks ("CSDs") and non-carbonated beverages ("NCBs"), including ready-to-drink teas, juices, juice drinks and mixers. Our brand portfolio includes popular CSD brands such as Dr Pepper, Sunkist soda, 7UP, A&W, Canada Dry, Crush, Squirt, Peñafiel and Schweppes, and NCB brands such as Snapple, Mott’s, Hawaiian Punch, Clamato, Rose’s and Mr & Mrs T mixers. Our largest brand, Dr Pepper, is a leading flavored CSD in the United States according to The Nielsen Company. We have some of the most recognized beverage brands in North America, with significant consumer awareness levels and long histories that evoke strong emotional connections with consumers.
We operate primarily in the U.S., Mexico and Canada and we also distribute our products in the Caribbean. In
2011
,
89%
of our net sales were generated in the United States,
4%
in Canada and
7%
in Mexico and the Caribbean.
Our Business Model
Our Brand Ownership Businesses.
As a brand owner, we build our brands by promoting brand awareness through marketing, advertising and promotion and by developing new and innovative products and product line extensions that address consumer preferences and needs. As the owner of the formulas and proprietary know-how required for the preparation of beverages, we manufacture, sell and distribute beverage concentrates and syrups used primarily to produce CSDs and we manufacture, sell and distribute primarily finished NCBs. Most of our sales of beverage concentrates are to bottlers who manufacture, bottle, sell and distribute our branded products into retail channels. We also manufacture, sell and distribute syrups for use in beverage fountain dispensers to restaurants and retailers, as well as to fountain wholesalers, who resell it to restaurants and retailers. In addition, we distribute finished NCBs through company-owned and third party distributors.
Our beverage concentrates and brand ownership businesses are characterized by relatively low capital investment, raw materials and employee costs. Although the cost of building or acquiring an established brand can be significant, established brands typically do not require significant ongoing expenditures, other than marketing, and therefore generate relatively high margins. Our packaged beverages brand ownership businesses have characteristics of both of our brand ownership businesses as well as our manufacturing and distribution businesses discussed below.
Our Manufacturing and Distribution Businesses.
We manufacture, sell and distribute finished CSDs from concentrates and finished NCBs and products mostly from ingredients other than concentrates. We sell and distribute packaged beverages and other products primarily into retail channels either directly to retail shelves or to warehouses through our large fleet of delivery trucks or through third party logistics providers.
Our manufacturing and distribution businesses are characterized by relatively high capital investment, raw material, selling and distribution costs, in each case compared to our beverage concentrates and brand ownership businesses. Our capital costs include investing in, and maintaining, our company-owned fleet, facilities and manufacturing and warehouse equipment. Our raw material costs include purchasing beverage concentrates, ingredients and packaging materials from a variety of suppliers. Our selling and distribution costs include significant costs related to operating our large fleet of delivery trucks and employing a significant number of employees to sell and deliver finished beverages and other products to retailers. As a result of the high fixed costs associated with these types of businesses, we are focused on maintaining an adequate level of volumes as well as controlling
22
capital expenditures, raw material, selling and distribution costs. In addition, geographic proximity to our customers is a critical component of managing the high cost of transporting finished beverages relative to their retail price. The profitability of the manufacturing and distribution businesses is also dependent upon our ability to sell our products into higher margin channels. As a result of these factors, the margins of our manufacturing and distribution businesses are significantly lower than those of our brand ownership businesses. In light of the largely fixed cost nature of the manufacturing and distribution businesses, increases in costs, for example raw materials tied to commodity prices, could have a significant negative impact on the margins of our businesses.
Approximately
87%
of our
2011
Packaged Beverages net sales of branded products come from our own brands, with the remaining from the distribution of third party brands such as Big Red, AriZona tea, FIJI mineral water, Neuro beverages, Vita Coco coconut water and Hydrive energy drinks. In addition, a small portion of our Packaged Beverages sales come from fees charged for bottling beverages and other products for private label owners or others.
Integrated Business Model.
We believe our integrated business model:
|
•
|
Strengthens our route-to-market by creating a third consolidated bottling system. By owning a significant portion of our manufacturing and distribution network we are able to improve focus on our owned and licensed brands, especially brands such as 7UP, Sunkist soda, A&W, Sun Drop and Snapple , which do not have a large presence in Coca-Cola and PepsiCo affiliated bottler systems.
|
|
•
|
Provides opportunities for net sales and profit growth through the alignment of the economic interests of our brand ownership and our manufacturing and distribution businesses. For example, we can focus on maximizing profitability for our company as a whole rather than focusing on profitability generated from either the sale of concentrates or the manufacturing and distribution of our products.
|
|
•
|
Enables us to be more flexible and responsive to the changing needs of our large retail customers, including coordinating sales, service, distribution, promotions and product launches.
|
|
•
|
Allows us to more fully leverage our scale and reduce costs by creating greater geographic manufacturing and distribution coverage.
|
Trends Affecting our Business
We believe the key trends influencing the North American LRB market include:
|
•
|
Changes in economic factors.
We believe changes in economic factors could impact consumers' purchasing power which may result in a decrease in purchases of our premium beverages and single-serve packages.
|
|
•
|
Increased health consciousness.
We believe the main beneficiaries of this trend include diet and low calorie drinks, ready-to-drink teas and bottled waters.
|
|
•
|
Changes in lifestyle.
We believe changes in lifestyle will continue to drive increased sales of single-serve beverages, which typically have higher margins.
|
|
•
|
Growing demographic segments in the U.S.
We believe marketing and product innovations that target fast growing population segments, such as the Hispanic community in the U.S., will drive further market growth.
|
|
•
|
Product and packaging innovation.
We believe brand owners and bottling companies will continue to create new products and packages such as beverages with new ingredients and new premium flavors, as well as innovative convenient packaging that address changes in consumer tastes and preferences.
|
|
•
|
Changing retailer landscape.
As retailers continue to consolidate, we believe retailers will support consumer product companies that can provide an attractive portfolio of products, a strong value proposition and efficient delivery.
|
|
•
|
Volatility in the costs of commodities.
The costs of a substantial portion of the commodities used in the beverage industry are dependent on commodity prices for aluminum, natural gas, fuel, resins, corn, pulp and other commodities. Commodity price volatility has exerted pressure on industry margins and operating results.
|
23
Seasonality
The beverage market is subject to some seasonal variations. Our beverage sales are generally higher during the warmer months and also can be influenced by the timing of holidays as well as weather fluctuations.
Segments
We report our business in three operating segments: Beverage Concentrates, Packaged Beverages and Latin America Beverages.
The key financial measures management uses to assess the performance of our segments are net sales and segment operating profit ("SOP").
Beverage Concentrates
Our Beverage Concentrates segment is principally a brand ownership business. In this segment we manufacture and sell beverage concentrates in the U.S. and Canada. Most of the brands in this segment are CSD brands. In
2011
, our Beverage Concentrates segment had net sales of approximately
$1.2 billion
. Key brands include Dr Pepper, Canada Dry, Crush, Schweppes, 7UP, Sunkist soda, A&W, Sun Drop, RC Cola, Diet Rite, Squirt, Welch's, Country Time, Vernors and the concentrate form of Hawaiian Punch.
We are the industry leader in flavored CSDs with a
40.0%
market share in the United States for
2011
, as measured by retail sales according to Nielsen. We are also the third largest CSD brand owner as measured by
2011
retail sales in the U.S. and Canada and we own a leading brand in most of the CSD categories in which we compete.
Almost all of our beverage concentrates are manufactured at our plant in St. Louis, Missouri.
The beverage concentrates are shipped to third party bottlers, as well as to our own manufacturing systems, who combine them with carbonation, water, sweeteners and other ingredients, package it in PET containers, glass bottles and aluminum cans, and sell it as a finished beverage to retailers. Beverage concentrates are also manufactured into syrup, which is shipped to fountain customers, such as fast food restaurants, who mix the syrup with water and carbonation to create a finished beverage at the point of sale to consumers. Dr Pepper represents most of our fountain channel volume. Concentrate prices historically have been reviewed and adjusted at least on an annual basis.
Our Beverage Concentrates brands are sold by bottlers, including our own Packaged Beverages segment, through all major retail channels including supermarkets, fountains, mass merchandisers, club stores, vending machines, convenience stores, gas stations, small groceries, drug chains and dollar stores. Unlike the majority of our other CSD brands,
70%
of Dr Pepper volumes are distributed through the Coca-Cola affiliated and PepsiCo affiliated bottler systems.
PepsiCo and Coca-Cola are the two largest customers of the Beverage Concentrates segment, and constituted approximately
29%
and
20%
, respectively, of the segment's net sales during
2011
.
Packaged Beverages
Our Packaged Beverages segment is principally a brand ownership, manufacturing and distribution business. In this segment, we primarily manufacture and distribute packaged beverages and other products, including our brands, third party owned brands and certain private label beverages, in the United States and Canada. In
2011
, our Packaged Beverages segment had net sales of approximately
$4.3 billion
. Key NCB brands in this segment include Snapple, Hawaiian Punch, Mott's, Yoo-Hoo, Clamato, Deja Blue, AriZona, FIJI, Mistic, Nantucket Nectars, ReaLemon, Mr and Mrs T, Rose's and Country Time. Key CSD brands in this segment include 7UP, Dr Pepper, A&W, Sunkist soda, Canada Dry, Squirt, RC Cola, Big Red, Sun Drop, Diet Rite, IBC and Vernors.
Approximately
87%
of our
2011
Packaged Beverages net sales of branded products come from our own brands, with the remaining from the distribution of third party brands such as Big Red, AriZona tea, FIJI mineral water, Neuro beverages, Vita Coco coconut water and Hydrive energy drinks. A portion of our sales also comes from bottling beverages and other products for private label owners or others for a fee. Although the majority of our Packaged Beverages' net sales relate to our brands, we also provide a route-to-market for third party brand owners seeking effective distribution for their new and emerging brands. These brands give us exposure in certain markets to fast growing segments of the beverage industry with minimal capital investment.
24
Our Packaged Beverages' products are manufactured in multiple facilities across the U.S. and are sold or distributed to retailers and their warehouses by our own distribution network or by third party distributors. The raw materials used to manufacture our products include aluminum cans and ends, glass bottles, PET bottles and caps, paper products, sweeteners, juices, water and other ingredients.
We sell our Packaged Beverages' products both through our Direct Store Delivery system ("DSD"), supported by a fleet of approximately
6,000
trucks and
12,000
employees, including sales representatives, merchandisers, drivers and warehouse workers, as well as through our Warehouse Direct delivery system ("WD"), both of which include the sales to all major retail channels, including supermarkets, fountain channel, mass merchandisers, club stores, vending machines, convenience stores, gas stations, small groceries, drug chains and dollar stores.
In
2011
, Wal-Mart Stores, Inc., the largest customer of our Packaged Beverages segment, accounted for approximately
18%
of our net sales in this segment.
Latin America Beverages
Our Latin America Beverages segment is a brand ownership, manufacturing and distribution business. This segment participates mainly in the carbonated mineral water, flavored CSD, bottled water and vegetable juice categories, with particular strength in carbonated mineral water and grapefruit flavored CSDs. In
2011
, our Latin America Beverages segment had net sales of
$418 million
with our operations in Mexico representing approximately
89%
of the net sales of this segment. Key brands include Peñafiel, Squirt, Clamato and Aguafiel.
In Mexico, we manufacture and distribute our products through our bottling operations and third party bottlers and distributors. In the Caribbean, we distribute our products through third party bottlers and distributors. In Mexico, we also participate in a joint venture to manufacture Aguafiel brand water with Acqua Minerale San Benedetto. We provide expertise in the Mexican beverage market and Acqua Minerale San Benedetto provides expertise in water production and new packaging technologies.
We sell our finished beverages through all major Mexican retail channels, including "mom and pop" stores, supermarkets, hypermarkets, and on premise channels.
Volume
In evaluating our performance, we consider different volume measures depending on whether we sell beverage concentrates or finished beverages.
Beverage Concentrates Sales Volume
In our Beverage Concentrates segment, we measure our sales volume in two ways: 1) "concentrates case sales" and 2) "bottler case sales." The unit of measurement for both concentrates case sales and bottler case sales equals 288 fluid ounces of finished beverage, or 24 twelve ounce servings.
Concentrates case sales represent units of measurement for concentrates sold by us to our bottlers and distributors. A concentrates case is the amount of concentrate needed to make one case of 288 fluid ounces of finished beverage. It does not include any other component of the finished beverage other than concentrate. Our net sales in our concentrates businesses are based on concentrates cases sold.
Although our net sales in our concentrates businesses are based on concentrates case sales, we believe that bottler case sales, as defined below, are also a significant measure of our performance because they measure sales, both by us and our bottlers, of our finished beverages into retail channels.
Packaged Beverages Sales Volume
In our Packaged Beverages segment, we measure volume as case sales to customers. A case sale represents a unit of measurement equal to 288 fluid ounces of packaged beverage sold by us. Case sales include both our owned-brands and certain brands licensed to and/or distributed by us.
25
Volume in Bottler Case Sales
In addition to sales volume, we also measure volume in bottler case sales ("volume (BCS)") as sales of packaged beverages, in equivalent 288 fluid ounce cases, sold by us and our bottlers to retailers and independent distributors.
Bottler case sales and concentrates and packaged beverage sales volumes are not equal during any given period due to changes in bottler concentrates inventory levels, which can be affected by seasonality, bottler inventory and manufacturing practices, and the timing of price increases and new product introductions.
Results of Operations
Executive Summary —
2011
Financial Overview and Recent Developments
|
•
|
Net sales totaled
$5.90 billion
for the year ended
December 31, 2011
, an
increase
of
$267 million
, or
5%
, from the year ended
December 31, 2010
.
|
|
•
|
Net income for the year ended
December 31, 2011
, was
$606 million
, compared to
$528 million
for the year ended
December 31, 2010
, an
increase
of
$78 million
, or
15%
.
|
|
•
|
Diluted earnings per share was
$2.74
for the year ended
December 31, 2011
and
$2.17
for the year ended
December 31, 2010
. The diluted earnings per share for the year ended
December 31, 2011
increased by
26%
.
|
|
•
|
During
2011
, our Board declared dividends of
$1.21
per share on outstanding common stock, as compared to
$0.90
per share on outstanding common stock during
2010
.
|
|
•
|
During the three and twelve months ended
December 31, 2011
, respectively, we repurchased
2.6 million
and
13.7 million
shares of our common stock valued at approximately
$97 million
and
$522 million
.
|
|
•
|
In January 2011, we completed the issuance of
$500 million
aggregate principal amount of
2.90%
senior notes due January 15, 2016 (the "2016 Notes").
|
|
•
|
On November 15, 2011, we completed the issuance of
$500 million
aggregate principal amount of senior unsecured notes consisting of
$250 million
aggregate principal amount of
2.60%
senior notes due January 15, 2019 (the "2019 Notes") and
$250 million
aggregate principal amount of
3.20%
senior notes due November 15, 2021 (the "2021 Notes"). The net proceeds from the issuance were used to repay
$400 million
aggregate principal amount of
1.70%
senior notes due December 21, 2011 (the "2011 Notes") at maturity and for general corporate purposes.
|
|
•
|
On November 17, 2011, our Board authorized an additional $1 billion of share repurchases, raising the total aggregate share repurchase authorization to $3 billion since inception of the share repurchase program.
|
|
•
|
On October 10, 2011, we introduced our newest product innovation, Dr Pepper TEN, which uses a unique blend of sweeteners developed by us to achieve a low-calorie option with the full flavor of regular Dr Pepper.
|
References in the financial tables to percentage changes that are not meaningful are denoted by "NM."
26
Year Ended
December 31, 2011
Compared to Year Ended
December 31, 2010
Consolidated Operations
The following table sets forth our consolidated results of operation for the years ended
December 31, 2011
and
2010
(dollars in millions, except per share data).
|
|
For the Year Ended December 31,
|
|
||||||||||||||
|
|
2011
|
2010
|
Percentage
|
|||||||||||||
|
|
Dollars
|
Percent
|
Dollars
|
Percent
|
Change
|
|||||||||||
|
Net sales
|
$
|
5,903
|
|
100.0
|
%
|
$
|
5,636
|
|
100.0
|
%
|
5
|
%
|
||||
|
Cost of sales
|
2,485
|
|
42.1
|
|
2,243
|
|
39.8
|
|
|
|
||||||
|
Gross profit
|
3,418
|
|
57.9
|
|
3,393
|
|
60.2
|
|
1
|
|
||||||
|
Selling, general and administrative expenses
|
2,257
|
|
38.3
|
|
2,233
|
|
39.6
|
|
|
|
||||||
|
Depreciation and amortization
|
126
|
|
2.1
|
|
127
|
|
2.3
|
|
|
|
||||||
|
Other operating expense (income), net
|
11
|
|
0.2
|
|
8
|
|
0.1
|
|
|
|
||||||
|
Income from operations
|
1,024
|
|
17.3
|
|
1,025
|
|
18.2
|
|
—
|
|
||||||
|
Interest expense
|
114
|
|
1.9
|
|
128
|
|
2.3
|
|
|
|
||||||
|
Interest income
|
(3
|
)
|
(0.1
|
)
|
(3
|
)
|
(0.1
|
)
|
|
|
||||||
|
Loss on early extinguishment of debt
|
—
|
|
—
|
|
100
|
|
1.8
|
|
||||||||
|
Other income, net
|
(12
|
)
|
(0.2
|
)
|
(21
|
)
|
(0.4
|
)
|
|
|
||||||
|
Income before provision for income taxes and equity in earnings of unconsolidated subsidiaries
|
925
|
|
15.7
|
|
821
|
|
14.6
|
|
13
|
|
||||||
|
Provision for income taxes
|
320
|
|
5.5
|
|
294
|
|
5.3
|
|
|
|
||||||
|
Income before equity in earnings of unconsolidated subsidiaries
|
605
|
|
10.2
|
|
527
|
|
9.4
|
|
|
|
||||||
|
Equity in earnings of unconsolidated subsidiaries, net of tax
|
1
|
|
—
|
|
1
|
|
—
|
|
||||||||
|
Net income
|
$
|
606
|
|
10.3
|
%
|
$
|
528
|
|
9.4
|
%
|
15
|
%
|
||||
|
Earnings per common share:
|
||||||||||||||||
|
Basic
|
$
|
2.77
|
|
NM
|
|
$
|
2.19
|
|
NM
|
|
26
|
%
|
||||
|
Diluted
|
2.74
|
|
NM
|
|
2.17
|
|
NM
|
|
26
|
%
|
||||||
Volume (BCS)
Volume (BCS) decreased
1%
for the
year ended
December 31, 2011
, compared with the
year ended
December 31,
2010
. In the U.S. and Canada, volume decreased
1%
and in Mexico and the Caribbean, volume increased
4%
compared with the year ago period. CSD volume remained
flat
, while NCB volume decreased
2%
. In CSDs, Sun Drop increased
9 million cases
compared with the year ago period due to the national launch of the brand. As a result of growth in our Latin America Beverages segment, Peñafiel and Squirt increased
4%
and
3%
, respectively. Dr Pepper volume was
flat
as sales volume in the prior year was driven by higher volumes a year ago caused by low holiday and summer pricing by a national account that did not recur in 2011 and higher retail pricing in the second half of 2011, which was offset in part by the impact of additional fountain availability and the launch of Dr Pepper TEN in the fourth quarter of 2011. Crush declined
9%
compared with the year ago period due to decreased promotional activity. Canada Dry, 7UP, A&W and Sunkist soda (our "Core 4 brands") were down
2%
compared to the year ago period as a double-digit decline in Sunkist soda, mid single-digit decline in 7UP and low single-digit decline in A&W were partially offset by a double-digit increase in Canada Dry due to targeted marketing programs. Decreases in NCBs were driven by a
9%
decrease in Mott's due to larger-than-normal price increases as a result of the significant increase in the cost of apple juice concentrate, promotional activities that did not recur in 2011 and a
5%
decrease for Hawaiian Punch as a result of the impact from higher pricing that was partially offset by increased sales volume from package innovation. These decreases were partially offset by a
7%
increase for Snapple as a result of distribution gains and package innovation and an
11%
increase for Clamato driven primarily by growth in our Latin America Beverages segment.
27
Net Sales
Net sales increased
$267 million
, or approximately
5%
, for the
year ended
December 31, 2011
, compared with the
year ended
December 31,
2010
. The increase was attributable to price increases,
$61 million
as a result of a higher net sales value per case driven by the repatriation of certain brands under the licensing arrangements with PepsiCo and Coca-Cola,
$27 million
of incremental revenue recognized under the PepsiCo and Coca-Cola license arrangements and increased volume in our contract manufacturing.
Gross Profit
Gross profit increased
$25 million
for the
year ended
December 31, 2011
, compared with the
year ended
December 31,
2010
. Gross margin of
57.9%
for the
year ended
December 31, 2011
, was lower than the
60.2%
gross margin for the
year ended
December 31,
2010
, primarily due to higher costs for packaging materials, sweeteners, apple juice concentrate and other commodities. The cost of inflation also contributed to a
$12 million
LIFO inventory provision recorded in the current year compared to a
$2 million
inventory provision in the prior year. In addition to the effect of this cost inflation, we recorded
$22 million
of unrealized losses during the
year ended
December 31, 2011
for the mark-to-market activity on commodity derivative contracts versus
$1 million
of unrealized gains in the prior year. These reductions in our gross margin were partially offset by increases in our product prices and ongoing productivity savings.
The change in the gross margin was also impacted by the favorable comparison of
$19 million
of expenses associated with labor, co-packing, unfavorable yield, and an underabsorption of manufacturing overhead as a result of the strike at our Williamson, New York manufacturing facility in the prior year.
Income from Operations
Income from operations decreased
$1 million
to
$1,024 million
for the
year ended
December 31, 2011
, compared with the year ago period. The decrease was primarily attributable to increased selling, general and administrative ("SG&A") expenses and other operating expense (income), net, partially offset by the
$25 million
increase in gross profit discussed above. SG&A expenses increased by
$24 million
primarily due to higher transportation costs principally due to rising fuel prices partially offset by RCI-related and other productivity savings, an
$18 million
legal provision associated with litigation against The American Bottling Company and incremental costs associated with the repatriation of brands. Favorable items affecting the comparison include the transaction costs associated with the PepsiCo and Coca-Cola licensing agreements that did not recur, the reclassification of certain transportation allowances to our customers from SG&A expenses to net sales and a reduction in our information technology ("IT") investments.
Interest Expense and Other Income, net
Interest expense
decreased
$14 million
compared with the year ago period, reflecting lower interest rates on our outstanding debt obligations during 2010 and the repayment of our revolving credit facility (the "Revolver") in February 2010.
Other income, net of
$12 million
and
$21 million
for the years ended
December 31, 2011
and
2010
, respectively, was related primarily to indemnity income associated with the Tax Sharing and Indemnification Agreement ("Tax Indemnity Agreement") with Kraft. For the
year ended
December 31,
2010
, indemnity income of
$19 million
included
$10 million
of benefits not expected to recur driven by our separation related tax losses and the impact of a Canadian audit in 2010.
Loss on Early Extinguishment of Debt
In December 2010, the Company completed a tender offer on a portion of the 2018 Notes and retired, at a premium, an aggregate principal amount of approximately $476 million. The loss on early extinguishment of debt included the $96 million premium for the tender offer, a $3 million write-off of a portion of the debt issuance costs and unamortized discount associated with the 2018 Notes and $1 million of associated reacquisition costs. There was no loss on early extinguishment of debt in 2011.
Provision for Income Taxes
The effective tax rates for the years ended
December 31, 2011
and
2010
were
34.6%
and
35.8%
, respectively. The decrease in the effective tax rate for the
year ended
December 31, 2011
, was primarily driven by certain state and federal income tax benefits, principally the domestic manufacturing deduction, related to the PepsiCo and Coca-Cola licensing agreements executed in 2010. The impact of these benefits decreased the provision for income taxes and the effective tax rate by
$19 million
and
2.1%
, respectively. These benefits will not recur beyond 2011. The provision for income taxes for the
year ended
December 31,
2010
, also included a
$14 million
benefit due to a favorable change of Mexican tax law.
28
Results of Operations by Segment
We report our business in three segments: Beverage Concentrates, Packaged Beverages and Latin America Beverages. The key financial measures management uses to assess the performance of our segments are net sales and SOP. The following tables set forth net sales and SOP for our segments for
2011
and
2010
, as well as the other amounts necessary to reconcile our total segment results to our consolidated results presented in accordance with accounting principles generally accepted in the United States of America ("U.S. GAAP") (in millions):
|
|
For the Year Ended December 31,
|
||||||
|
|
2011
|
2010
|
|||||
|
Segment Results — Net sales
|
|
|
|||||
|
Beverage Concentrates
|
$
|
1,193
|
|
$
|
1,156
|
|
|
|
Packaged Beverages
|
4,292
|
|
4,098
|
|
|||
|
Latin America Beverages
|
418
|
|
382
|
|
|||
|
Net sales
|
$
|
5,903
|
|
$
|
5,636
|
|
|
|
For the Year Ended December 31,
|
|||||||
|
2011
|
2010
|
||||||
|
Segment Results — SOP
|
|
|
|||||
|
Beverage Concentrates
|
$
|
779
|
|
$
|
745
|
|
|
|
Packaged Beverages
|
519
|
|
536
|
|
|||
|
Latin America Beverages
|
43
|
|
40
|
|
|||
|
Total SOP
|
1,341
|
|
1,321
|
|
|||
|
Unallocated corporate costs
|
306
|
|
288
|
|
|||
|
Other operating expense (income), net
|
11
|
|
8
|
|
|||
|
Income from operations
|
1,024
|
|
1,025
|
|
|||
|
Interest expense, net
|
111
|
|
125
|
|
|||
|
Loss on early extinguishment of debt
|
—
|
|
100
|
|
|||
|
Other income, net
|
(12
|
)
|
(21
|
)
|
|||
|
Income before provision for income taxes and equity in earnings of unconsolidated subsidiaries
|
$
|
925
|
|
$
|
821
|
|
|
29
Beverage Concentrates
The following table details our Beverage Concentrates segment's net sales and SOP for the
year ended
December 31, 2011
and
2010
(in millions):
|
|
For the Year Ended December 31,
|
||||||||||
|
|
2011
|
2010
|
Change
|
||||||||
|
Net sales
|
$
|
1,193
|
|
$
|
1,156
|
|
$
|
37
|
|
||
|
SOP
|
779
|
|
745
|
|
34
|
|
|||||
Net sales increased
$37 million
, or approximately
3%
, for the
year ended
December 31, 2011
, compared with the
year ended
December 31,
2010
. The increase was primarily due to higher net price realization,
$27 million
in revenue recognized under the PepsiCo and Coca-Cola licensing arrangements and a slight increase in concentrate case sales, excluding the impact of the repatriation of brands. The increase was partially offset by a
2%
decline in concentrate case sales as a result of the repatriation of brands to our Packaged Beverages segment.
SOP increased
$34 million
, or approximately
5%
, for the
year ended
December 31, 2011
, as compared with the year ago period, primarily driven by the increase in net sales and a reduction in employee costs, partially offset by an increase in marketing investments.
Volume (BCS) decreased
2%
for the
year ended
December 31, 2011
, as compared with the year ago period, as a result of the repatriation of brands to our Packaged Beverages segment under the licensing arrangements with PepsiCo and Coca-Cola. Excluding the repatriation, volume (BCS) increased slightly. Sun Drop had a double-digit increase due to the national launch of the brand. Our Core 4 brands decreased low single digits, resulting from a high single-digit decline in Sunkist soda and mid single-digit declines in A&W and 7UP, which was slightly offset by a high single-digit increase in Canada Dry. Other drivers of the change included a high single-digit decline in Crush due to decreased promotional activity, as well as a mid single-digit decline in Squirt. Dr Pepper increased low single digits due to increases in fountain food service due to additional restaurant availability, as well as the launch of Dr Pepper TEN in the second half of 2011, offset by higher volumes a year ago caused by low holiday and summer pricing by a national account that did not recur in 2011 and higher retail pricing in the second half of 2011.
Packaged Beverages
The following table details our Packaged Beverages segment's net sales and SOP for the
year ended
December 31, 2011
and
2010
(in millions):
|
|
For the Year Ended December 31,
|
||||||||||
|
|
2011
|
2010
|
Change
|
||||||||
|
Net sales
|
$
|
4,292
|
|
$
|
4,098
|
|
$
|
194
|
|
||
|
SOP
|
519
|
|
536
|
|
(17
|
)
|
|||||
Sales volume
in
creased
2%
for the
year ended
December 31, 2011
, compared with the
year ended
December 31,
2010
. Total sales volume
in
creased
2%
due to the repatriation of certain brands under the PepsiCo and Coca-Cola licensing arrangements and
2%
due to an
in
crease in contract manufacturing. These increases were partially offset by a
1%
decline in total sales volume in each of our NCB category as well as our CSD category excluding the impact of repatriation.
Total CSD volume
in
creased
3%
, led by the repatriation of certain brands including Canada Dry and Squirt. The repatriation of those brands favorably impacted the CSD volume by
5%
. The national launch of Sun Drop added approximately
7 million
cases during the
year ended
December 31, 2011
. Volume for our Core 4 brands, excluding the repatriation of Canada Dry and Sunkist soda,
de
creased
3%
. Dr Pepper volumes
de
clined
4%
for the
year ended
December 31, 2011
, as sales volume in the prior year was driven by low holiday and summer pricing by a national account that did not recur in 2011 and higher retail pricing in the second half of 2011.
30
Total NCB volume
de
creased
1%
compared to the
year ended
December 31, 2010
.
De
clines in Mott's of
9%
and Hawaiian Punch of
4%
drove the decrease in the NCB category. Mott's decline was a result of larger-than-normal price increases associated with the significant increase in the cost of apple juice concentrate and promotional activities in the prior year that did not recur in 2011. Hawaiian Punch's decline was due to price increases partially offset by favorability due to new package innovation. These decreases were partially offset by an
8%
in
crease in Snapple as a result of distribution gains and package innovation.
Net sales
in
creased
$194 million
for the
year ended
December 31, 2011
, compared with the
year ended
December 31,
2010
. Net sales were favorably impacted by price increases,
$83 million
due to the repatriation of certain brands and favorable package mix and increases in contract manufacturing, partially offset by volume declines previously discussed.
SOP
de
creased
$17 million
for the
year ended
December 31, 2011
, compared with the
year ended
December 31,
2010
, primarily due to higher costs for packaging materials, sweeteners, apple juice concentrate, fuel and other commodities, incremental costs associated with the repatriation of brands, and an
$18 million
legal provision associated with the litigation against The American Bottling Company. These cost increases were partially offset by the increase in net sales, ongoing RCI-related and other productivity savings, lower warehouse costs and a reduction in our IT investments in the current year. Additionally, the favorable comparison of
$19 million
of higher expenses associated with labor, co-packing, unfavorable yield, and an underabsorption of manufacturing overhead as a result of the strike at our Williamson, New York manufacturing facility in the prior year further offset the costs increases in the current year.
Latin America Beverages
The following table details our Latin America Beverages segment's net sales and SOP for the
year ended
December 31, 2011
and
2010
(in millions):
|
|
For the Year Ended December 31,
|
||||||||||
|
|
2011
|
2010
|
Change
|
||||||||
|
Net sales
|
$
|
418
|
|
$
|
382
|
|
$
|
36
|
|
||
|
SOP
|
43
|
|
40
|
|
3
|
|
|||||
Sales volume
in
creased
4%
for the
year ended
December 31, 2011
, as compared with the
year ended
December 31,
2010
. The
in
crease in volume was driven by a
7%
in
crease in Squirt volume due to higher sales to third party bottlers, a
5%
in
crease in Peñafiel and a
26%
in
crease in Clamato due to targeted marketing programs and distribution gains. These volume increases were partially offset by a
18%
decrease in Crush volume driven by price increases.
Net sales
in
creased
9%
for the
year ended
December 31, 2011
, compared with
year ended
December 31,
2010, primarily due to favorable product mix, increases in sales volume and price increases. The favorable impact of $7 million in foreign currency changes was partially offset by the $6 million reclassification of certain transportation allowances to our customers from selling, general and administrative expenses to net sales.
SOP
in
creased
8%
for the
year ended
December 31, 2011
, compared with
year ended
December 31,
2010
, primarily due to the increase in net sales partially offset by higher costs for packaging materials, sweeteners, and other commodities. This increase was further reduced by the unfavorable impact of changes in foreign currency on our expenses, increased logistic costs, higher depreciation expense and higher compensation costs.
31
Year Ended
December 31, 2010
Compared to Year Ended
December 31, 2009
Consolidated Operations
The following table sets forth our consolidated results of operation for the years ended
December 31, 2010
and
2009
(dollars in millions).
|
|
For the year ended December 31,
|
|
||||||||||||
|
|
2010
|
2009
|
Percentage
|
|||||||||||
|
|
Dollars
|
Percent
|
Dollars
|
Percent
|
Change
|
|||||||||
|
Net sales
|
$
|
5,636
|
|
100.0
|
%
|
$
|
5,531
|
|
100.0
|
%
|
2%
|
|||
|
Cost of sales
|
2,243
|
|
39.8
|
|
2,234
|
|
40.4
|
|
|
|||||
|
Gross profit
|
3,393
|
|
60.2
|
|
3,297
|
|
59.6
|
|
3
|
|||||
|
Selling, general and administrative expenses
|
2,233
|
|
39.6
|
|
2,135
|
|
38.6
|
|
|
|||||
|
Depreciation and amortization
|
127
|
|
2.3
|
|
117
|
|
2.1
|
|
|
|||||
|
Other operating expense (income), net
|
8
|
|
0.1
|
|
(40
|
)
|
(0.7
|
)
|
|
|||||
|
Income from operations
|
1,025
|
|
18.2
|
|
1,085
|
|
19.6
|
|
(6)
|
|||||
|
Interest expense
|
128
|
|
2.3
|
|
243
|
|
4.4
|
|
|
|||||
|
Interest income
|
(3
|
)
|
(0.1
|
)
|
(4
|
)
|
(0.1
|
)
|
|
|||||
|
Loss on early extinguishment of debt
|
100
|
|
1.8
|
|
—
|
|
—
|
|
||||||
|
Other income, net
|
(21
|
)
|
(0.4
|
)
|
(22
|
)
|
(0.4
|
)
|
|
|||||
|
Income before provision for income taxes and equity in earnings of unconsolidated subsidiaries
|
821
|
|
14.6
|
|
868
|
|
15.7
|
|
(5)
|
|||||
|
Provision for income taxes
|
294
|
|
5.2
|
|
315
|
|
5.7
|
|
|
|||||
|
Income before equity in earnings of unconsolidated subsidiaries
|
527
|
|
9.4
|
|
553
|
|
10.0
|
|
|
|||||
|
Equity in earnings of unconsolidated subsidiaries, net of tax
|
1
|
|
—
|
|
2
|
|
—
|
|
|
|||||
|
Net income
|
$
|
528
|
|
9.4
|
%
|
$
|
555
|
|
10.0
|
%
|
(5)%
|
|||
Volume (BCS)
Volume (BCS) increased approximately 2% for the year ended December 31, 2010 compared with the year ended December 31, 2009. CSDs increased 2% and NCBs increased 3%. In CSDs, Crush increased 18% compared with the year ago period due to expanded distribution, the launch of Cherry Crush during the first quarter of 2010 and the limited time offering of the Lime extension. Dr Pepper volume increased 3% compared with the year ago period, which resulted from increases in our regular and diet extensions partially offset by decreases in Dr Pepper Cherry and Cherry Vanilla. Our Core 4 brands were down 1% compared to the year ago period as a high single-digit decline in Sunkist soda, a mid single-digit decline in 7UP and a low single-digit decline in A&W were partially offset by a double-digit increase in Canada Dry. Peñafiel volume decreased 8% due to decreased sales to third party distributors. Squirt volume increased 5%. In NCBs, 10% growth in Snapple was due to the successful restage of the brand, the growth of value offerings and increased marketing. A 3% increase in Mott's was the result of new distribution and strong brand support. Additionally, a 6% increase in Hawaiian Punch was partially offset by declines in third party NCB brands, such as AriZona.
Although volume (BCS) increased 2% for the year ended December 31, 2010, compared with the year ended December 31, 2009, sales volume was flat for the same period. The sales volume decreased as a result of a decline in contract manufacturing, which is not included in volume (BCS) and lower concentrate sales as third-party bottlers purchased higher levels of concentrate during the fourth quarter of 2009.
In both the U.S. and Canada and in Mexico and the Caribbean, volume increased 2% compared with the year ago period.
32
Net Sales
Net sales
increase
d
$105 million
, or
2%
, for the year ended
December 31, 2010
compared with the year ended
December 31, 2009
. The increase was primarily attributable to volume increases in NCBs, the favorable impact of foreign currency, concentrate price increases, and $37 million in revenue recognized under the PepsiCo and Coca-Cola licenses. These increases were partially offset by a $53 million decline in contract manufacturing, decreases in price/mix primarily attributable to CSDs, and an unfavorable product mix.
Gross Profit
Gross profit increased
$96 million
, or
3%
, for the year ended
December 31, 2010
compared with the year ended
December 31, 2009
.
Gross margin of approximately 60% for the year ended December 31, 2010, was higher than the approximately 59% gross margin for the year ended December 31, 2009, primarily due to the favorable product mix as a result of the decline in contract manufacturing and ongoing supply chain efficiencies, partially offset by $19 million of higher expenses associated with labor, co-packing, unfavorable yield, and an underabsorption of manufacturing overhead as a result of the strike at our Williamson, New York manufacturing facility as we continued to produce product and service customers during this work stoppage, which ended on September 13, 2010 and higher commodity costs.
Income from Operations
Income from operations
decrease
d
$60 million
for the year ended
December 31, 2010
compared with the year ended
December 31, 2009
. The year ended
December 31, 2009
included one-time gains of $62 million primarily related to the termination of certain distribution agreements.
Our annual impairment analysis, performed as of
December 31, 2010
and
2009
, did not result in an impairment charge for
2010
and
2009
.
There were no restructuring costs for the years ended
December 31, 2010
and
2009
.
SG&A expenses
increased $98 million for the year
ended
December 31, 2010
compared with the year ended
December 31, 2009
. Significant drivers of the increase were primarily due to higher marketing spend related to targeted marketing, changes in foreign currency, unfavorable comparison of the changes in fair value of commodity derivatives used in the distribution process, higher benefit costs, the one-time transaction costs associated with PepsiCo and Coca-Cola agreements, increased stock-based compensation costs,
an unfavorable comparison of the actuarial adjustments for certain insurance plans and higher productivity office investments. These increases were partially offset by lower compensation costs and a one-time curtailment gain on certain U.S. postretirement medical plans.
Loss on Early Extinguishment of Debt
In December 2010, the Company completed a tender offer on a portion of the 2018 Notes and retired, at a premium, an aggregate principal amount of approximately $476 million. The loss on early extinguishment of debt included the $96 million premium for the tender offer, a $3 million write-off of a portion of the debt issuance costs and unamortized discount associated with the 2018 Notes and $1 million of associated reacquisition costs.
Interest Expense and Other Income, net
Interest expense decreased $115 million compared with the year ago period, reflecting the repayment of our Term Loan A during December 2009 and our Revolver in February 2010 combined with lower interest rates on our outstanding debt obligations during 2010.
Other income, net of
$21 million
and $22 million in
2010
and
2009
, respectively, is primarily comprised of indemnity income associated with the Tax
Indemnity Agreement with Kraft. For the year ended December 31, 2010, indemnity income of $19 million included $10 million of benefits not expected to recur driven by our separation related tax losses and the impact of a Canadian audit in 2010. For the year ended December 31, 2009,
other income, net
included $6 million related to indemnity income associated with the Tax Indemnity Agreement and an additional $16 million of one-time separation related items resulting from an audit settlement during the third quarter of 2009.
33
Provision for Income Taxes
The effective tax rates for 2010 and 2009 were 35.8% and 36.3%, respectively. The most significant factor affecting this comparison of the effective tax rate between the periods was a favorable change of Mexican law, which allowed DPS to release in 2010 $14 million of tax accrued in 2009 when the law was enacted. The decrease associated with the change of Mexican law was partially offset by increased state tax rates, which increased our deferred tax liabilities. Adjustments made to deferred tax, including the adjustment to deferred tax related to a Canadian change of law recognized and disclosed in the quarter ended March 31, 2010, were not a significant driver for the reduction in the effective tax rate from 2009.
Results of Operations by Segment
We report our business in three segments: Beverage Concentrates, Packaged Beverages and Latin America Beverages. The key financial measures management uses to assess the performance of our segments are net sales and SOP. The following tables set forth net sales and SOP for our segments for
2010
and
2009
, as well as the adjustments necessary to reconcile our total segment results to our consolidated results presented in accordance with U.S. GAAP (dollars in millions).
|
|
For the year ended
|
||||||
|
|
December 31,
|
||||||
|
|
2010
|
2009
|
|||||
|
Net sales
|
|
|
|
|
|||
|
Beverage Concentrates
|
$
|
1,156
|
|
$
|
1,063
|
|
|
|
Packaged Beverages
|
4,098
|
|
4,111
|
|
|||
|
Latin America Beverages
|
382
|
|
357
|
|
|||
|
Net sales
|
$
|
5,636
|
|
$
|
5,531
|
|
|
|
|
For the year ended
|
||||||
|
|
December 31,
|
||||||
|
|
2010
|
2009
|
|||||
|
SOP
|
|
|
|
|
|||
|
Beverage Concentrates
|
$
|
745
|
|
$
|
683
|
|
|
|
Packaged Beverages
|
536
|
|
573
|
|
|||
|
Latin America Beverages
|
40
|
|
54
|
|
|||
|
Total SOP
|
1,321
|
|
1,310
|
|
|||
|
Unallocated corporate costs
|
288
|
|
265
|
|
|||
|
Other operating expense (income), net
|
8
|
|
(40
|
)
|
|||
|
Income from operations
|
1,025
|
|
1,085
|
|
|||
|
Interest expense, net
|
125
|
|
239
|
|
|||
|
Loss on early extinguishment of debt
|
100
|
|
—
|
|
|||
|
Other income, net
|
(21
|
)
|
(22
|
)
|
|||
|
Income before provision for income taxes and equity in earnings of unconsolidated subsidiaries
|
$
|
821
|
|
$
|
868
|
|
|
34
Beverage Concentrates
The following table details our Beverage Concentrates segment's net sales and SOP for
2010
and
2009
(dollars in millions):
|
|
For the year ended
|
|
|||||||||
|
|
December 31,
|
||||||||||
|
|
2010
|
2009
|
Change
|
||||||||
|
Net sales
|
$
|
1,156
|
|
$
|
1,063
|
|
$
|
93
|
|
||
|
SOP
|
745
|
|
683
|
|
62
|
|
|||||
Net sales
increased
$93 million
, or approximately
9%
, for the year ended
December 31, 2010
, compared with the year ended
December 31, 2009
. The
increase
was primarily due to concentrate price increases,
$37
million in revenue recognized under the PepsiCo and Coca-Cola licenses, as well as a favorable impact of foreign currency. Concentrate price increases, which were effective in
January 2010
, added an incremental
$41
million to net sales during the year ended
December 31, 2010
.
These increases were partially offset by the loss of concentrate sales which resulted from the repatriation of brands associated with the PepsiCo transaction and transfer of concentrate sales in the Caribbean to our Latin America Beverages segment.
SOP
increased
$62 million
, or approximately
9%
, for the year ended
December 31, 2010
, compared with the year ended
December 31, 2009
,
primarily driven by the increase in net sales and lower compensation costs. The increase in net sales was partially offset by an increase in marketing spend primarily related to targeted marketing programs for Dr Pepper, Sunkist soda and Canada Dry.
Volume (BCS) increased 1% for the year ended December 31, 2010, compared with the year ended December 31, 2009, primarily driven by a 3% increase in Dr Pepper, primarily led by Diet and regular Dr Pepper. Crush increased 18%, primarily driven by expanded distribution, the launch of Cherry Crush in the first quarter of 2010 and the limited time offering of the Lime extension. These increases were partially offset by a double-digit decline in Hawaiian Punch, Squirt, and Vernors, as well as a 4% decrease in our Core 4 brands. The decrease in our Core 4 brands was primarily driven by a double-digit decline in 7UP and Sunkist soda, which was partially offset by a high single-digit increase in Canada Dry. The decreases in 7UP, Sunkist soda, Hawaiian Punch, Squirt, and Vernors were primarily driven by the repatriation of the brands to our Packaged Beverages segment and transfer of concentrate sales in the Caribbean to our Latin America Beverages segment.
Packaged Beverages
The following table details our Packaged Beverages segment's net sales and SOP for
2010
and
2009
(dollars in millions):
|
|
For the year ended
|
|
|||||||||
|
|
December 31,
|
||||||||||
|
|
2010
|
2009
|
Change
|
||||||||
|
Net sales
|
$
|
4,098
|
|
$
|
4,111
|
|
$
|
(13
|
)
|
||
|
SOP
|
536
|
|
573
|
|
(37
|
)
|
|||||
Sales volumes decreased
1%
for the year ended
December 31, 2010
, compared with the year ended
December 31, 2009
. The majority of the decrease was the result of a decline in contract manufacturing, which negatively impacted total volume by approximately
3%
. The decline in contract manufacturing was partially offset by volume growth in our NCB category. Repatriation of brands associated with the PepsiCo transaction increased total volume by
1%
.
Total CSD volume was flat for the year ended December 31, 2010
, compared with the year ended
December 31, 2009
.
Volume from the repatriation of the Vernors and Squirt brands associated with the PepsiCo transaction increased our CSD volume 1%. Volume for our Core 4 brands decreased 1%, due to a mid single-digit decline and low single-digit declines in 7UP, A&W and Sunkist soda, respectively. These decreases were partially offset by a double-digit increase in Canada Dry due to targeted marketing programs. Dr Pepper volumes declined 1%.
Total NCB volume increased 6% as a result of a 12% increase in Snapple due to the successful restage of the brand, growth of value offerings and increased marketing. Hawaiian Punch and Mott's increased 11% and 3%, respectively, as a result of increased promotional activity and distribution gains.
35
Net sales
decreased $13 million
for the year ended
December 31, 2010
, compared with the year ended
December 31, 2009
, primarily as a result of the
$53 million
decline in contract manufacturing. Additionally, net sales were favorably impacted by volume increases in NCBs and changes in foreign currency, partially offset by the unfavorable impact of product mix and decreases in price/mix primarily attributable to CSDs.
SOP
decreased $37 million
for the year ended
December 31, 2010
, compared with the year ended
December 31, 2009
. The decrease was driven primarily by
$19 million
of higher expenses associated with labor, co-packing, unfavorable yield, and an underabsorption of manufacturing overhead as a result of our strike at our Williamson, New York manufacturing facility as we continued to produce product and service customers during this work stoppage, which ended on September 13, 2010.
Other factors negatively affecting this comparison include decreases in price/mix primarily attributable to CSDs, costs and depreciation associated with the startup of our manufacturing facility in Victorville, California, higher transportation costs, higher benefit costs, higher commodity costs, an unfavorable comparison of the actuarial adjustments for certain insurance plans, and a $5 million unfavorable non-cash adjustment to rent expense for certain leases. These items were partially offset by volume growth in our NCB category, ongoing supply chain efficiencies and changes in foreign currency.
Latin America Beverages
The following table details our Latin America Beverages segment's net sales and SOP for year ended December 31,
2010
and
2009
(in millions):
|
|
For the year ended
|
|
|||||||||
|
|
December 31,
|
||||||||||
|
|
2010
|
2009
|
Change
|
||||||||
|
Net sales
|
$
|
382
|
|
$
|
357
|
|
$
|
25
|
|
||
|
SOP
|
40
|
|
54
|
|
(14
|
)
|
|||||
Sales volumes increased
6%
for the year ended
December 31, 2010
, compared with the year ended
December 31, 2009
.
The increase in volume was driven by a transfer of concentrates sales of certain brands in the Caribbean from our Beverage Concentrates segment, a 10% increase in Squirt due to higher sales to third party bottlers, a 31% increase in Crush with the continued growth from the introduction of new flavors in a 2.3 liter value offering, as well as additional distribution routes added throughout 2009 and 2010. These volume increases were partially offset by an 8% decrease in Peñafiel due to decreased sales to third party distributors driven by increased competition.
Net sales increased
$25 million
for the year ended
December 31, 2010
, compared with the year ago period,
primarily due to a $21 million favorable impact of changes in foreign currency and an increase in sales volumes, partially offset by an unfavorable impact related to product mix and higher discounts.
SOP
decreased
$14 million
for the year ended
December 31, 2010
,
compared with the year ended December 31, 2009, as a result of higher discounts, higher marketing investments, route expansion costs, investments in information technology infrastructure and increase in commodity costs, partially offset by increases in sales volumes and the favorable impact of changes in foreign currency.
The following transactions related to the Company's separation from Cadbury were included in the Consolidated Statements of Income for the years ended
December 31, 2010
and
2009
(in millions):
|
|
For the year ended
|
||||||
|
December 31,
|
|||||||
|
|
2010
|
2009
|
|||||
|
Incremental tax expense (benefit) related to separation, excluding indemnified taxes
|
$
|
4
|
|
$
|
(5
|
)
|
|
|
Impact of Cadbury tax election
|
(1
|
)
|
—
|
|
|||
36
Items Impacting Income Taxes
The consolidated financial statements present the taxes of our stand alone business and contain certain taxes transferred to us at separation in accordance with the Tax Indemnity Agreement. This agreement provides for the transfer to us of taxes related to an entity that was part of Cadbury's confectionery business and therefore not part of our historical consolidated financial statements. The consolidated financial statements also reflect that the Tax Indemnity Agreement requires Cadbury to indemnify us for these taxes. These taxes and the associated indemnity may change over time as estimates of the amounts change. Changes in estimates will be reflected when facts change and those changes in estimates will be reflected in our Consolidated Statements of Income at the time of the estimate change. In addition, pursuant to the terms of the Tax Indemnity Agreement, if we breach certain covenants or other obligations or we are involved in certain change-in-control transactions, Cadbury may not be required to indemnify us for any of these unrecognized tax benefits that are subsequently realized.
Kraft acquired Cadbury on February 2, 2010 and, therefore, assumes responsibility for Cadbury's indemnity obligations under the terms of the Tax Indemnity Agreement.
Refer to Note 11 of the Notes to our Audited Consolidated Financial Statements for further information regarding the tax impact of the separation.
Liquidity and Capital Resources
Trends and Uncertainties Affecting Liquidity
Customer and consumer demand for the Company's products may be impacted by recession or other economic downturn in the United States, Canada, Mexico or the Caribbean, which could result in a reduction in our sales volume. Similarly, disruptions in financial and credit markets may impact the Company's ability to manage normal commercial relationships with its customers, suppliers and creditors. These disruptions could have a negative impact on the ability of our customers to timely pay their obligations to us, thus reducing our cash flow, or our vendors to timely supply materials.
The Company could also face increased counterparty risk for our cash investments and our hedge arrangements. Declines in the securities and credit markets could also affect the Company's pension fund, which in turn could increase funding requirements.
We believe that the following trends and uncertainties may also impact liquidity:
|
•
|
changes in economic factors could impact consumers' purchasing powers;
|
|
•
|
continued capital expenditures to upgrade our existing plants and distribution fleet of trucks, replace and expand our cold drink equipment and make investments in IT systems;
|
|
•
|
continued repurchases of our outstanding common stock and payment of dividends;
|
|
•
|
seasonality of our operating cash flows could impact short-term liquidity;
|
|
•
|
ability to issue unsecured commercial paper notes (the "Commercial Paper") on a private placement basis up to a maximum aggregate amount outstanding at any time of
$500 million
;
|
|
•
|
ability to refinance our
$450 million
of
2.35%
senior notes due December 21, 2012 (the "2012 Notes");
|
|
•
|
tax payments of approximately $531 million due primarily in the first quarter of 2012 as a result of the agreements with PepsiCo and Coca-Cola.
|
Financing Arrangements
The following is a description of our current financing arrangements as of
December 31, 2011
. The summaries of the senior unsecured notes, the senior unsecured credit facility and the commercial paper program are qualified in their entirety by the specific terms and provisions of the indentures governing the senior unsecured notes, the senior unsecured credit agreement and the commercial paper program dealer agreement, copies of which are included as exhibits herein.
Senior Unsecured Notes
The indentures governing the senior unsecured notes, among other things, limit our ability to incur indebtedness secured by principal properties, to enter into certain sale and leaseback transactions and to enter into certain mergers or transfers of substantially all of our assets. The senior unsecured notes are guaranteed by substantially all of our existing and future direct and indirect domestic subsidiaries. As of
December 31, 2011
, we were in compliance with all covenant requirements.
37
The 2019 and 2021 Notes
On November 15, 2011, we completed the issuance of
$500 million
aggregate principal amount of senior unsecured notes consisting of
$250 million
aggregate principal amount of the 2019 Notes and
$250 million
aggregate principal amount of the 2021 Notes. The discount associated with the issuance of the 2019 and 2021 Notes was approximately
$1 million
. The net proceeds from the issuance were used to repay
$400 million
aggregate principal amount of the 2011 Notes at maturity on December 21, 2011 and for general corporate purposes.
The 2016 Notes
On January 11, 2011, we completed the issuance of
$500 million
aggregate principal amount of the 2016 Notes at a discount of
$1 million
. The net proceeds from the issuance were used to
replace a portion of the cash used to purchase the
6.82%
senior notes due May 1, 2018 (the "2018 Notes") tendered pursuant to the tender offer described below.
The 2011 and 2012 Notes
On December 21, 2009, we completed the issuance of
$850 million
aggregate principal amount of senior unsecured notes consisting of
$400 million
of the 2011 Notes and
$450 million
of the 2012 Notes, respectively.
The net proceeds from the sale of the debentures were used for repayment of existing indebtedness under the Term Loan A facility described below.
The repayment of the 2011 Notes occurred on December 21, 2011, at maturity.
The 2013, 2018 and 2038 Notes
On April 30, 2008, we completed the issuance of
$1,700 million
aggregate principal amount of senior unsecured notes consisting of
$250 million
aggregate principal amount of
6.12%
senior notes due May 1, 2013,
$1,200 million
aggregate principal amount of the 2018 Notes, and
$250 million
aggregate principal amount of
7.45%
senior notes due May 1, 2038 (the "2038 Notes").
In December 2010, we completed a tender offer for a portion of the 2018 Notes and retired, at a premium, an aggregate principal amount of approximately
$476 million
. The aggregate principal amount of the outstanding 2018 Notes was
$724 million
as of
December 31, 2011
and
2010
.
Senior Unsecured Credit Facility
Our senior unsecured credit agreement, which was amended and restated on April 11, 2008 (the "senior unsecured credit facility"),
provides for the Revolver in an aggregate principal amount of
$500 million
with a maturity in 2013. There were no principal borrowings under the Revolver outstanding as of
December 31, 2011
and
2010
.
Up to
$75 million
of the Revolver is available for the issuance of letters of credit, of which
$7 million
and
$12 million
was utilized as of
December 31, 2011
and
2010
, respectively. Balances available for additional borrowings and letters of credit were
$493 million
and
$68 million
, respectively, as of
December 31, 2011
.
Borrowings under the senior unsecured credit facility bear interest at a floating rate per annum based upon the London interbank offered rate for dollars ("LIBOR") or the alternate base rate ("ABR"), in each case plus an applicable margin which varies based upon our debt ratings, from
1.00%
to
2.50%
, in the case of LIBOR loans, and
0.00%
to
1.50%
in the case of ABR loans. The alternate base rate means the greater of (a) JPMorgan Chase Bank's prime rate and (b) the federal funds effective rate plus
0.50%
. Interest is payable on the last day of the interest period, but not less than quarterly, in the case of any LIBOR loan, and on the last day of March, June, September and December of each year in the case of any ABR loan. There were no borrowings during the
year ended
December 31, 2011
.
The average interest rate for borrowings during the year was
2.25%
for the
year ended
December 31, 2010
.
An unused commitment fee is payable quarterly to the lenders on the unused portion of the commitments in respect of the Revolver equal to
0.15%
to
0.50%
per annum, depending upon our debt ratings.
Any principal amounts outstanding under the Revolver are due and payable in full at maturity.
All obligations under the senior unsecured credit facility are guaranteed by substantially all of our existing and future direct and indirect domestic subsidiaries.
The senior unsecured credit facility requires us to comply with a maximum total leverage ratio covenant and a minimum interest coverage ratio covenant, as defined in the senior unsecured credit agreement. The senior unsecured credit facility also contains certain usual and customary representations and warranties, affirmative covenants and events of default. As of
December 31, 2011
, we were in compliance with all covenant requirements.
38
Commercial Paper Program
On December 10, 2010, we entered into a commercial paper program under which we may issue Commercial Paper on a private placement basis up to a maximum aggregate amount outstanding at any time of
$500 million
. The maturities of the Commercial Paper will vary, but may not exceed 364 days from the date of issue. We may issue Commercial Paper from time to time for general corporate purposes, and the program is supported by the Revolver. Outstanding Commercial Paper reduces the amount of borrowing capacity available under the Revolver and outstanding amounts under the Revolver reduce the Commercial Paper availability. As of
December 31, 2011
and
2010
, we had no outstanding Commercial Paper.
Capital Lease Obligations
Long-term capital lease obligations totaled
$7 million
and
$10 million
as of
December 31, 2011
and
2010
, respectively. Current obligations related to our capital leases were
$4 million
and
$3 million
as of
December 31, 2011
and
2010
, respectively, and were included as a component of other current liabilities.
Shelf Registration Statement
On November 20, 2009, our Board authorized us to issue up to
$1,500 million
of debt securities. Subsequently, we filed a "well-known seasoned issuer" shelf registration statement with the Securities and Exchange Commission, effective December 14, 2009, which registers an indeterminable amount of debt securities for future sales. We
issued senior unsecured notes of
$850 million
in 2009, as described in the section
"Senior Unsecured Notes — The 2011 and 2012 Notes"
above. On January 11, 2011
we issued senior unsecured notes of
$500 million
, as described in the section
"
Senior Unsecured Notes — The 2016 Notes"
above
.
On November 15, 2011
we issued senior unsecured notes of
$500 million
, as described in the section
"
Senior Unsecured Notes — The 2019 and 2021 Notes"
above
.
On May 18, 2011, the Board authorized an additional
$1,350 million
of debt securities. As a result,
$1,000 million
is available for issuance as of
December 31, 2011
.
Letters of Credit Facilities
In June 2010 and July 2011, we entered into letter of credit facilities in addition to the portion of the Revolver reserved for issuance of letters of credit. Under these letter of credit facilities,
$125 million
is available for the issuance of letters of credit, of which
$55 million
and
$39 million
was utilized as of
December 31, 2011
and
2010
, respectively. The balance available for additional letters of credit was
$70 million
as of
December 31, 2011
.
Liquidity
Based on our current and anticipated level of operations, we believe that our operating cash flows will be sufficient to meet our anticipated obligations for the next twelve months. To the extent that our operating cash flows are not sufficient to meet our liquidity needs, we may utilize cash on hand or amounts available under our financing arrangements, if necessary.
The following table summarizes our cash activity for the
year ended
December 31, 2011
,
2010
and
2009
(in millions):
|
|
For the Year Ended December 31,
|
||||||||||
|
|
2011
|
2010
|
2009
|
||||||||
|
Net cash provided by operating activities
|
$
|
760
|
|
|
$
|
2,535
|
|
$
|
865
|
|
|
|
Net cash used in investing activities
|
(217
|
)
|
(225
|
)
|
(251
|
)
|
|||||
|
Net cash used in financing activities
|
(152
|
)
|
(2,280
|
)
|
(554
|
)
|
|||||
39
Net Cash Provided by Operating Activities
Net cash provided by operating activities decreased
$1,775 million
for the
year ended
December 31, 2011
, compared with the year ago period, primarily due to the receipt in 2010 of separate one-time nonrefundable cash payments of $900 million from PepsiCo and $715 million from Coca-Cola, which were recorded as deferred revenue. For the
year ended
December 31, 2011
, net cash provided was
$760 million
, primarily due to net income adjusted for deferred income taxes and non-cash depreciation and amortization. Inventory provided
$29 million
as a result of a reduction in the inventory on-hand as of
December 31, 2011
. Trade receivables used
$55 million
as a result of increased sales in
2011
and accounts payable used
$30 million
due to the timing of payments. In addition, net cash provided by operating activities was reduced as a result of $54 million of income tax payments resulting from the licensing agreements with PepsiCo and Coca-Cola.
Net cash provided by operating activities increased
$1,670 million
for the year ended
December 31, 2010
, compared with the year ended
December 31, 2009
. The $1,665 million increase in net operating assets was primarily due to the receipt of separate one-time nonrefundable cash payments of
$900 million
from PepsiCo and
$715 million
from Coca-Cola, both recorded as deferred revenue.
Net Cash Used in Investing Activities
The decrease of
$8 million
in cash used in investing activities for the
year ended
December 31, 2011
,
compared with the year ended
December 31, 2010
was primarily attributable to lower capital expenditures of $31 million and lower proceeds of $15 million from disposal of property, plant and equipment in 2011.
The decrease of
$26 million
in cash used in investing activities for the year ended
December 31, 2010
, compared with the year ended
December 31, 2009
, was primarily attributable to
lower capital expenditures of $71 million and higher proceeds of $13 million from disposal of property, plant and equipment in 2010, partially offset by the absence of the one-time cash receipts in 2009 of $68 million primarily from the termination of certain distribution agreements.
Net Cash Used in Financing Activities
2011
Cash used in financing activities for the
year ended
December 31, 2011
, consisted of stock repurchases of
$522 million
and dividend payments of
$251 million
.
On January 11, 2011, the Company completed the issuance of
$500 million
aggregate principal amount of the 2016 Notes.
On November 15, 2011, the Company completed the issuance of
$500 million
aggregate principal amount of senior unsecured notes consisting of
$250 million
aggregate principal amount of the 2019 Notes and
$250 million
aggregate principal amount of the 2021 Notes.
On December 21, 2011, the Company repaid
$400 million
of the 2011 Notes at maturity.
2010
Net cash flow used in financing activities for the year ended
December 31, 2010
primarily consisted of common
stock repurchases of
$1,113 million
, the $573 million aggregate principal and premium payment made to holders of the 2018 Notes in connection with the tender offer described below, the $405 million repayment of the Revolver included in our senior unsecured credit facility and dividend payments of
$194 million
.
On December 1, 2010, we announced a tender offer to repurchase up to $600 million of our outstanding 2018 Notes. On December 29, 2010, we completed a tender offer and retired at a premium approximately $476 million of aggregate principal of the 2018 Notes
.
40
2009
Net cash flow used in financing activities for the year ended
December 31, 2009
consisted primarily of net debt repayments of $550 million.
On December 21, 2009, we completed the issuance of $850 million aggregate principal amount of senior unsecured notes consisting of the 2011 and 2012 Notes due December 21, 2011 and December 21, 2012, respectively.
On December 30, 2009, we borrowed $405 million from the Revolver.
On December 31, 2009, we fully repaid the principal balance on the Term Loan A prior to its maturity.
Debt Ratings
As of
December 31, 2011
, our debt ratings were Baa1 with a stable outlook from Moody's and BBB with a stable outlook from Standard & Poor's ("S&P"). Our commercial paper ratings were P-2/A-2 from Moody's and S&P.
These debt and commercial paper ratings impact the interest we pay on our financing arrangements. A downgrade of one or both of our debt and commercial paper ratings could increase our interest expense and decrease the cash available to fund anticipated obligations.
Cash Management
We fund our liquidity needs from cash flow from operations, cash on hand or amounts available under our financing arrangements, if necessary.
Capital Expenditures
Capital expenditures were
$215 million
,
$246 million
and
$317 million
for
2011
,
2010
, and
2009
, respectively. Capital expenditures for all periods primarily consisted of expansion of our capabilities in existing facilities, cold drink equipment and IT investments for new systems. The decrease in expenditures for
2010
compared with 2009 was primarily related to the significant investment in 2009 in our new Victorville, California facility, partially offset by expansion and replacement of existing cold drink equipment. We expect to incur discretionary annual capital expenditures in an amount equal to approximately 4% of our net sales which we expect to fund through cash provided by operating activities.
Cash and Cash Equivalents
As a result of the above items, cash and cash equivalents increased
$386 million
since
December 31, 2010
to
$701 million
as of
December 31, 2011
.
Our cash balances are used to fund working capital requirements, scheduled debt and interest payments, capital expenditures, income tax obligations, dividend payments and repurchases of our common stock. Cash available in our foreign operations may not be immediately available for these purposes. Foreign cash balances constitute approximately
9%
of our total cash position as of
December 31, 2011
.
Dividends
On November 20, 2009, our Board declared our first dividend of
$0.15
per share on outstanding common stock, which was paid on January 8, 2010 to stockholders of record at the close of business on December 21, 2009. Prior to that declaration, we had not paid a cash dividend on our common stock since our demerger on May 7, 2008.
Our Board declared dividends of
$1.21
and
$0.90
per share on outstanding common stock during the years ended
December 31, 2011
and
2010
, respectively.
Common Stock Repurchases
During the years ended
December 31, 2010
and
2009
, our Board authorized the repurchase of up to
$2 billion
of the Company's outstanding common stock during 2010, 2011 and 2012. On November 17, 2011, the Board authorized the repurchase of an additional
$1 billion
of our outstanding common stock, increasing the total aggregate share repurchase plan to
$3 billion
. For the
year ended
December 31, 2011
and
2010
, the Company repurchased and retired approximately
14 million
and
31 million
shares of common stock valued at approximately
$522 million
and
$1,113 million
, respectively. Refer to Part II, Item 5 of this Annual Report on Form 10-K for additional information regarding these repurchases.
41
Contractual Commitments and Obligations
We enter into various contractual obligations that impact, or could impact, our liquidity. The following table summarizes our contractual obligations and contingencies as of
December 31, 2011
. Based on our current and anticipated level of operations, we believe that our proceeds from operating cash flows will be sufficient to meet our anticipated obligations. To the extent that our operating cash flows are not sufficient to meet our liquidity needs, we may utilize cash on hand or amounts available under our financing arrangements, if necessary. Refer to Note 8 of the Notes to our Audited Consolidated Financial Statements for additional information regarding the senior unsecured notes payments described in this table.
|
|
|
Payments due in year
|
|||||||||||||||||||||||||
|
|
|
(in millions)
|
|||||||||||||||||||||||||
|
|
Total
|
2012
|
2013
|
2014
|
2015
|
2016
|
After 2016
|
||||||||||||||||||||
|
Senior unsecured notes payments
(1)
|
$
|
2,674
|
|
$
|
450
|
|
$
|
250
|
|
$
|
—
|
|
$
|
—
|
|
$
|
500
|
|
$
|
1,474
|
|
||||||
|
Capital leases
(4)
|
18
|
|
5
|
|
6
|
|
3
|
|
1
|
|
—
|
|
3
|
|
|||||||||||||
|
Interest payments
(2)
|
1,011
|
|
118
|
|
99
|
|
92
|
|
94
|
|
88
|
|
520
|
|
|||||||||||||
|
Operating leases
(5)
|
292
|
|
58
|
|
53
|
|
44
|
|
36
|
|
28
|
|
73
|
|
|||||||||||||
|
Purchase obligations
(3)
|
826
|
|
590
|
|
129
|
|
51
|
|
22
|
|
12
|
|
22
|
|
|||||||||||||
|
Current tax reserve
|
5
|
|
5
|
|
—
|
|
—
|
|
—
|
|
—
|
|
—
|
|
|||||||||||||
|
Payable to Kraft
|
109
|
|
7
|
|
7
|
|
7
|
|
7
|
|
7
|
|
74
|
|
|||||||||||||
|
Total
|
$
|
4,935
|
|
$
|
1,233
|
|
$
|
544
|
|
$
|
197
|
|
$
|
160
|
|
$
|
635
|
|
$
|
2,166
|
|
||||||
____________________________
|
(1)
|
Amounts represent payment for the senior unsecured notes issued by the Company. Please refer to Note 8 of the Notes to our Audited Consolidated Financial Statements for further information.
|
|
(2)
|
Amounts represent our estimated interest payments based on (a) specified interest rates for fixed rate debt, (b) capital lease amortization schedules and (c) debt amortization schedules.
|
|
(3)
|
Amounts represent payments under agreements to purchase goods or services that are legally binding and that specify all significant terms, including capital obligations and long-term contractual obligations.
|
|
(4)
|
Amounts represent capitalized lease obligations, net of interest, plus anticipated contingent rentals based on current payment levels. Interest in respect of capital leases is included under the caption "Interest payments" on this table.
|
|
(5)
|
Amounts represent minimum rental commitment under non-cancelable operating leases.
|
In accordance with U.S. GAAP, we had
$567 million
of non-current unrecognized tax benefits, related interest and penalties as of
December 31, 2011
, classified as a long-term liability. The table above does not reflect any payments related to tax reserves if it is not possible to make a reasonable estimate of the amount or timing of the payment.
The total accrued benefit liability for pension and other postretirement benefit plans recognized as of
December 31, 2011
, was approximately
$40 million
. Refer to Note 13 of Notes to Consolidated Financial Statements. This amount is impacted by, among other items, pension expense, funding levels, plan amendments, changes in plan demographics and assumptions, and the investment return on plan assets. We did not include estimated payments related to accrued our total accrued benefit liability in the table above.
The Pension Protection Act of 2006 was enacted in August 2006 and established, among other things, new standards for funding of U.S. defined benefit pension plans. We generally expect to fund all future contributions with cash flows from operating activities. Our international pension plans are generally funded in accordance with local laws and income tax regulations. Refer to Note 13 of Notes to Consolidated Financial Statements. We did not include our estimated contributions to our various single employer plans in the table above.
In general, we are self-insured for large portions of many different types of claims. Our reserves for the Company's self-insured losses are estimated through actuarial procedures of the insurance industry and by using industry assumptions, adjusted for our specific expectations based on our claim history. As of
December 31, 2011
, our self-insurance reserves totaled approximately
$89 million
. Refer to Notes 7 and 10 of Notes to Consolidated Financial Statements. We did not include estimated payments related to our self-insurance reserves in the table above.
42
Off-Balance Sheet Arrangements
We participate in four multi-employer pension plans. In the event that we or, in the case of one multi-employer pension plan, another large employer withdraw from participation in any of these plans, then applicable law could require us to make an additional lump-sum contribution to the plan, and we would have to reflect that as an expense in our consolidated statement of income and as a liability on our condensed consolidated balance sheets. We presently have no intention of withdrawing from any of these multi-employer pension plans.
There are no other off-balance sheet arrangements that have or are reasonably likely to have a current or future material effect on our results of operations, financial condition, liquidity, capital expenditures or capital resources other than letters of credit outstanding. Refer to Note 8 of the Notes to our Audited Consolidated Financial Statements for additional information regarding outstanding letters of credit.
Other Matters
Agreement with PepsiCo
On February 26, 2010, the Company completed the licensing of certain brands to PepsiCo following PepsiCo's acquisitions of PBG and PAS.
Under the licensing agreements, PepsiCo began distributing Dr Pepper, Crush and Schweppes in the U.S. territories where these brands were previously being distributed by PBG and PAS. The same applies to Dr Pepper, Crush, Schweppes, Vernors and Sussex in Canada; and Squirt and Canada Dry in Mexico.
Additionally, in U.S. territories where it has a distribution footprint, DPS is selling certain owned and licensed brands, including Sunkist soda, Squirt, Vernors and Hawaiian Punch, that were previously distributed by PBG and PAS.
Under the agreements, DPS received a one-time nonrefundable cash payment of
$900 million
. The agreements have an initial period of
20
years with automatic
20
-year renewal periods
, and require PepsiCo to meet certain performance conditions. The payment was recorded as deferred revenue and recognized as net sales ratably over the estimated
25
-year life of the customer relationship.
Agreement with The Coca-Cola Company
On October 4, 2010, the Company received a one-time nonrefundable cash payment of
$715 million
, completed the licensing of certain brands to Coca-Cola following Coca-Cola's acquisition of CCE's North American Bottling Business and executed separate agreements pursuant to which Coca-Cola began offering Dr Pepper and Diet Dr Pepper in local fountain accounts and the Freestyle fountain program.
Under the licensing agreements, Coca-Cola distributes Dr Pepper in the U.S. and Canada Dry in the Northeast U.S. where these brands were previously being distributed by CCE. The same applies to Canada Dry and C Plus in Canada. As part of the U.S. licensing agreement, Coca-Cola offers Dr Pepper and Diet Dr Pepper in its local fountain accounts. The agreements have an initial period of
20
years with automatic
20
-year renewal periods, and require Coca-Cola to meet certain performance conditions.
Under a separate agreement, Coca-Cola has agreed to include Dr Pepper and Diet Dr Pepper brands in its Freestyle fountain program. The Freestyle fountain program agreement has a period of
20
years. Additionally, in certain U.S. territories where it has a distribution footprint, DPS is selling certain owned and licensed brands, including Canada Dry, Schweppes, Squirt and Cactus Cooler, that were previously distributed by CCE.
Under these arrangements, DPS received a one-time nonrefundable cash payment of
$715 million
, which was recorded net, as no competent or verifiable evidence of fair value could be determined for the significant elements in this arrangement. The total cash consideration was recorded as deferred revenue and recognized as net sales ratably over the estimated
25
-year life of the customer relationship.
43
Critical Accounting Estimates
The process of preparing our consolidated financial statements in conformity with U.S. GAAP requires the use of estimates and judgments that affect the reported amounts of assets, liabilities, revenue, and expenses. Critical accounting estimates are both fundamental to the portrayal of a company’s financial condition and results and require difficult, subjective or complex estimates and assessments. These estimates and judgments are based on historical experience, future expectations and other factors and assumptions we believe to be reasonable under the circumstances. The most significant estimates and judgments are reviewed on an ongoing basis and revised when necessary. Actual amounts may differ from these estimates and judgments. We have identified the policies described below as our critical accounting estimates. See Note 2 of the Notes to our Audited Consolidated Financial Statements for a discussion of these and other accounting policies.
Revenue Recognition
We recognize sales revenue when all of the following have occurred: (1) delivery; (2) persuasive evidence of an agreement exists; (3) pricing is fixed or determinable; and (4) collection is reasonably assured. Delivery is not considered to have occurred until the title and the risk of loss passes to the customer according to the terms of the contract between the customer and us. The timing of revenue recognition is largely dependent on contract terms. For sales to customers that are designated in the contract as free-on-board destination, revenue is recognized when the product is delivered to and accepted at the customer’s delivery site. Net sales are reported net of costs associated with customer marketing programs and incentives, as described below, as well as sales taxes and other similar taxes.
Multiple deliverables were included in the arrangements entered into with PepsiCo and Coca-Cola during 2010. In this case, we first determined whether each deliverable met the separation criteria under U.S. GAAP. The primary requirement for a deliverable to meet the separation criteria is if the deliverable has standalone value to the customer. Each deliverable that meets the separation criteria is considered a separate "unit of accounting". As the sale of the manufacturing and distribution rights and the ongoing sales of concentrate would not have standalone value to the customer, both deliverables represent a single element of accounting for purposes of revenue recognition. The one-time nonrefundable cash receipts from PepsiCo and Coca-Cola were therefore recorded as deferred revenue and will be recognized as net sales ratably over the estimated
25
-year life of the customer relationship.
Customer Marketing Programs and Incentives
The Company offers a variety of incentives and discounts to bottlers, customers and consumers through various programs to support the distribution of its products. These incentives and discounts include cash discounts, price allowances, volume based rebates, product placement fees and other financial support for items such as trade promotions, displays, new products, consumer incentives and advertising assistance. These incentives and discounts are reflected as a reduction of gross sales to arrive at net sales. The aggregate deductions from gross sales recorded in relation to these programs were approximately
$3,733 million
,
$3,686 million
and
$3,419 million
for the years ended
December 31, 2011
,
2010
and
2009
, respectively. During 2009, the Company upgraded its SAP platform in DSD. As part of the upgrade, DPS harmonized its gross list price structure across locations. The impact of the change increased gross sales and related discounts by equal amounts on customer invoices. Net sales were not affected. The amounts of trade spend are larger in our Packaged Beverages segment than those related to other parts of our business. Accruals are established for the expected payout based on contractual terms, volume-based metrics and/or historical trends and require management judgment with respect to estimating customer participation and performance levels.
Goodwill and Other Indefinite Lived Intangible Assets
In accordance with U.S. GAAP we classify intangible assets into three categories: (1) intangible assets with definite lives subject to amortization; (2) intangible assets with indefinite lives not subject to amortization; and (3) goodwill. The majority of our intangible asset balance is made up of brands which we have determined to have indefinite useful lives. In arriving at the conclusion that a brand has an indefinite useful life, management reviews factors such as size, diversification and market share of each brand. Management expects to acquire, hold and support brands for an indefinite period through consumer marketing and promotional support. We also consider factors such as our ability to continue to protect the legal rights that arise from these brand names indefinitely or the absence of any regulatory, economic or competitive factors that could truncate the life of the brand name. If the criteria are not met to assign an indefinite life, the brand is amortized over its expected useful life.
We conduct tests for impairment in accordance with U.S. GAAP. For intangible assets with definite lives, we conduct tests for impairment if conditions indicate the carrying value may not be recoverable. For goodwill and intangible assets with indefinite lives, we conduct tests for impairment annually, as of December 31, or more frequently if events or circumstances indicate the carrying amount may not be recoverable. We use present value and other valuation techniques to make this assessment. If the carrying amount of goodwill or an intangible asset exceeds its fair value, an impairment loss is recognized in an amount equal to that excess. For purposes of impairment testing we assign goodwill to the reporting unit that benefits from the synergies arising
44
from each business combination and also assign indefinite lived intangible assets to our reporting units. We define reporting units as Beverage Concentrates, Latin America Beverages, and Packaged Beverages’ two reporting units, DSD and WD.
The impairment test for indefinite lived intangible assets encompasses calculating a fair value of an indefinite lived intangible asset and comparing the fair value to its carrying value. If the carrying value exceeds the estimated fair value, impairment is recorded. The impairment tests for goodwill include comparing a fair value of the respective reporting unit with its carrying value, including goodwill and considering any indefinite lived intangible asset impairment charges ("Step 1"). If the carrying value exceeds the estimated fair value, impairment is indicated and a second step ("Step 2") analysis must be performed.
The tests for impairment include significant judgment in estimating the fair value of the reporting units and intangible assets primarily by analyzing forecasts of future revenues and profit performance. Fair value is based on what the reporting units and intangible assets would be worth to a third party market participant. Discount rates are based on a weighted average cost of equity and cost of debt, adjusted with various risk premiums. These assumptions could be negatively impacted by various of the risks discussed in "Risk Factors" in this Annual Report on Form 10-K.
2011 Impairment Analysis
Based on our review of the facts and circumstances and updated assumptions, we did not recalculate the fair values for the annual impairment analysis of our goodwill, brands or distribution rights during 2011. We employed a carryforward approach, in accordance with U.S. GAAP, since we concluded it was remote that changes in the facts and circumstances would have caused the fair value of these assets to fall below their carrying amounts. This conclusion was based on the following factors: (1) the fair value of our goodwill, brands and distribution rights exceeded their carrying amounts by a substantial margin in the 2010 annual impairment analysis performed; (2) our business performance during 2011 was in line with our forecast used to estimate fair value in the impairment analysis performed during 2010; (3) our outlook for 2012 and beyond is in line with the forecast used to estimate fair value in the impairment analysis performed during 2010; (4) other significant assumptions used in estimating fair value, such as our weighted average cost of capital, have improved since the 2010 impairment analysis performed; (5) the assets and liabilities that make up the reporting units have not changed significantly since the 2010 fair value determination; and (6) we have experienced significant appreciation in our market capitalization. As such, no impairment was required for our indefinite lived intangible assets and goodwill as of
December 31, 2011
.
2010 and 2009 Impairment Analyses
Fair value is measured based on what each intangible asset or reporting unit would be worth to a third party market participant. For our annual impairment analysis performed as of December 31,
2010
and
2009
, methodologies used to determine the fair values of the assets included an income based approach, as well as an overall consideration of market capitalization and our enterprise value. Management's estimates of fair value, which fall under Level 3, are based on historical and projected operating performance. Discount rates were based on a weighted average cost of equity and cost of debt and were adjusted with various risk premiums.
As of December 31,
2010
and
2009
, the results of the Step 1 analysis indicated that the estimated fair value of our indefinite lived intangible assets and goodwill substantially exceeded their carrying values and, therefore, were not impaired.
Pension and Postretirement Benefits
We have several pension and postretirement plans covering employees who satisfy age and length of service requirements. There are five stand-alone non-contributory defined benefit pension plans and six stand-alone postretirement plans. Depending on the plan, pension and postretirement benefits are based on a combination of factors, which may include salary, age and years of service.
Pension expense has been determined in accordance with the principles of U.S. GAAP. Our policy is to fund pension plans in accordance with the requirements of the Employee Retirement Income Security Act. Employee benefit plan obligations and expenses included in our Consolidated Financial Statements are determined from actuarial analyses based on plan assumptions, employee demographic data, years of service, compensation, benefits and claims paid and employer contributions.
The expense related to the postretirement plans has been determined in accordance with U.S. GAAP. We accrue the cost of these benefits during the years that employees render service to us.
The calculation of pension and postretirement plan obligations and related expenses is dependent on several assumptions used to estimate the present value of the benefits earned while the employee is eligible to participate in the plans. The key assumptions we use in determining the plan obligations and related expenses include: (1) the discount rate used to calculate the present value of the plan liabilities; (2) employee turnover, retirement age and mortality; and (3) the expected return on plan assets. Our assumptions reflect our historical experience and our best judgment regarding future performance. Due to the significant judgment
45
required, our assumptions could have a material impact on the measurement of our pension and postretirement obligations and expenses. Refer to Note 13 of the Notes to our Audited Consolidated Financial Statements for further information.
The effect of a 1% increase or decrease in the weighted-average discount rate used to determine the pension benefit obligations for U.S. plans would change the benefit obligation as of
December 31, 2011
, by approximately
$27 million
and
$30 million
, respectively. The effect of a 1% increase or decrease in the weighted-average discount rate used to determine the net periodic pension costs would change the costs for the year ended
December 31, 2011
, by approximately
$1 million
ea
ch. The effect of a 1% increase or decrease in the expected return on plan assets used to determine the net periodic pension costs would change the costs for the year ended
December 31, 2011
by approximately
$2 million
each.
Risk Management Programs
We retain selected levels of property, casualty, workers' compensation, health and other business risks. Many of these risks are covered under conventional insurance programs with high deductibles or self-insured retentions. Accrued liabilities related to the retained casualty and health risks are calculated based on loss experience and development factors, which contemplate a number of variables including claim history and expected trends. These loss development factors are established in consultation with external insurance brokers and actuaries. At
December 31, 2011
and
2010
, we had accrued liabilities related to the retained risks of
$89 million
and
$80 million
, respectively, including both current and long-term liabilities.
We believe the use of actuarial methods to estimate our future losses provides a consistent and effective way to measure our self-insured liabilities. However, the estimation of our liability is judgmental and uncertain given the nature of claims involved and length of time until their ultimate cost is known. The final settlement amount of claims can differ materially from our estimate as a result of changes in factors such as the frequency and severity of accidents, medical cost inflation, legislative actions, uncertainty around jury verdicts and awards and other factors outside of our control.
Income Taxes
Income taxes are accounted for using the asset and liability approach under U.S. GAAP. This method involves determining the temporary differences between assets and liabilities recognized for financial reporting and the corresponding amounts recognized for tax purposes and computing the tax-related carryforwards at the enacted tax rates expected to apply to taxable income in the years in which those temporary differences are expected to be recovered or settled. The resulting amounts are deferred tax assets or liabilities and the net changes represent the deferred tax expense or benefit for the year. The total of taxes currently payable per the tax return and the deferred tax expense or benefit represents the income tax expense or benefit for the year for financial reporting purposes.
We periodically assess the likelihood of realizing our deferred tax assets based on the amount of deferred tax assets that we believe is more likely than not to be realized. We base our judgment of the recoverability of our deferred tax asset primarily on historical earnings, our estimate of current and expected future earnings, prudent and feasible tax planning strategies, and current and future ownership changes.
As of
December 31, 2011
and
2010
, undistributed earnings considered to be permanently reinvested in non-U.S. subsidiaries totaled approximately
$244 million
a
nd
$203 million
, respectively. Deferred income taxes have not been provided on this income as the Company believes these earnings to be permanently reinvested. It is not practicable to estimate the amount of additional tax that might be payable on these undistributed foreign earnings.
Our effective income tax rate may fluctuate on a quarterly basis due to various factors, including, but not limited to, total earnings and the mix of earnings by jurisdiction, the timing of changes in tax laws, and the amount of tax provided for uncertain tax positions.
We establish income tax reserves to remove some or all of the income tax benefit of any of our income tax positions at the time we determine that the positions become uncertain based upon one of the following: (1) the tax position is not "more likely than not" to be sustained, (2) the tax position is "more likely than not" to be sustained, but for a lesser amount, or (3) the tax position is "more likely than not" to be sustained, but not in the financial period in which the tax position was originally taken. Our evaluation of whether or not a tax position is uncertain is based on the following: (1) we presume the tax position will be examined by the relevant taxing authority that has full knowledge of all relevant information, (2) the technical merits of a tax position are derived from authorities such as legislation and statutes, legislative intent, regulations, rulings and case law and their applicability to the facts and circumstances of the tax position, and (3) each tax position is evaluated without considerations of the possibility of offset or aggregation with other tax positions taken. We adjust these income tax reserves when our judgment changes as a result of new information. Any change will impact income tax expense in the period in which such determination is made.
46
Effect of Recent Accounting Pronouncements
Refer to Note 2 of the Notes to our Audited Consolidated Financial Statements in Item 8, "Financial Statements and Supplementary Data" of this Annual Report on Form 10-K for a discussion of recent accounting standards and pronouncements.
Acquisitions
We may make future acquisitions. For example, we may make acquisitions of regional bottling companies, distributors, and distribution rights to further extend our geographic coverage. Any acquisitions may require future capital expenditures and restructuring expenses.
ITEM 7A.
QUANTITATIVE AND QUALITATIVE DISCLOSURES ABOUT MARKET RISK
We are exposed to market risks arising from changes in market rates and prices, including movements in foreign currency exchange rates, interest rates, and commodity prices. We do not enter into derivatives or other financial instruments for trading purposes.
Foreign Exchange Risk
The majority of our net sales, expenses, and capital purchases are transacted in U.S. dollars. However, we have some exposure with respect to foreign exchange rate fluctuations. Our primary exposure to foreign exchange rates is the Canadian dollar and Mexican peso against the U.S. dollar. Exchange rate gains or losses related to foreign currency transactions are recognized as transaction gains or losses in our income statement as incurred. As of
December 31, 2011
, the impact to net income of a 10% change (up or down) in exchange rates is estimated to be an increase or decrease of approximately
$19 million
on an annual basis.
We use derivative instruments such as foreign exchange forward contracts to manage a portion of our exposure to changes in foreign exchange rates. For the period ending
December 31, 2011
, we had contracts outstanding with a notional value of
$135 million
maturing at various dates through December 15, 2014.
Interest Rate Risk
We centrally manage our debt portfolio and monitor our mix of fixed-rate and variable rate debt. At
December 31, 2011
, the carrying value of our debt, excluding capital leases, was
$2,701 million
, of which $350 million of the 2019, 2021 and 2038 Notes are designated as fair value hedges and are exposed to variability in interest rates.
The following table is an estimate of the impact to the fair value hedges on the 2019, 2021 and 2038 Notes that could result from hypothetical interest rate changes during the twelve months ending
December 31,
2012
, based on debt levels as of
December 31, 2011
:
|
Sensitivity Analysis
|
|||||||||
|
Change in Fair Value
|
|||||||||
|
Hypothetical Change in Interest Rates
|
Annual Impact to Interest Expense
|
Other Current and Non-current Assets
|
Other Non-current Liabilities
|
Total Debt
|
|||||
|
1-percent decrease
(1)
|
$1 million decrease
|
$67 million increase
|
—
|
|
$67 million increase
|
||||
|
1-percent increase
|
$6 million increase
|
$7 million increase
|
$21 million increase
|
|
$14 million decrease
|
||||
____________________________
(1) We pay an average floating rate, which fluctuates periodically, based on LIBOR and a credit spread, as a result of designated fair value hedges on certain debt instruments. See Note 9 for further information. Our weighted average LIBOR rate as of
December 31, 2011
was 0.74%. As LIBOR has not historically fallen below 0.25%, our estimate of the annual impact to interest expense reflects this assumption if our hypothetical change in the interest rate fell below the historical threshold.
47
Commodity Risks
We are subject to market risks with respect to commodities because our ability to recover increased costs through higher pricing may be limited by the competitive environment in which we operate. Our principal commodities risks relate to our purchases of PET, diesel fuel, corn (for high fructose corn syrup), aluminum, sucrose, apple juice concentrate, and natural gas (for use in processing and packaging).
We utilize commodities forward contracts and supplier pricing agreements to hedge the risk of adverse movements in commodity prices for limited time periods for certain commodities. The fair market value of these contracts as of
December 31, 2011
, was a net
liability
of
$12 million
.
As of
December 31, 2011
, the impact to net income of a 10% change (up or down) in market prices of these commodities is estimated to be an increase or decrease of approximately
$32 million
on an annual basis.
48
ITEM 8.
FINANCIAL STATEMENTS AND SUPPLEMENTARY DATA
|
Audited Financial Statements:
|
|
49
REPORT OF INDEPENDENT REGISTERED PUBLIC ACCOUNTING FIRM
To the Board of Directors and Stockholders of
Dr Pepper Snapple Group, Inc.
We have audited the accompanying consolidated balance sheets of Dr Pepper Snapple Group, Inc. and subsidiaries (the "Company") as of December 31, 2011 and 2010, and the related consolidated statements of income, changes in stockholders' equity, and cash flows for each of the three years in the period ended December 31, 2011. These financial statements are the responsibility of the Company's management. Our responsibility is to express an opinion on these financial statements based on our audits.
We conducted our audits in accordance with the standards of the Public Company Accounting Oversight Board (United States). Those standards require that we plan and perform the audit to obtain reasonable assurance about whether the financial statements are free of material misstatement. An audit includes examining, on a test basis, evidence supporting the amounts and disclosures in the financial statements. An audit also includes assessing the accounting principles used and significant estimates made by management, as well as evaluating the overall financial statement presentation. We believe that our audits provide a reasonable basis for our opinion.
In our opinion, such consolidated financial statements present fairly, in all material respects, the financial position of Dr Pepper Snapple Group, Inc. and subsidiaries at December 31, 2011 and 2010, and the results of their operations and their cash flows for each of the three years in the period ended December 31, 2011, in conformity with accounting principles generally accepted in the United States of America.
We have also audited, in accordance with the standards of the Public Company Accounting Oversight Board (United States), the Company's internal control over financial reporting as of December 31, 2011, based on the criteria established in
Internal Control-Integrated Framework
issued by the Committee of Sponsoring Organizations of the Treadway Commission and our report dated February 22, 2012 expressed an unqualified opinion on the Company's internal control over financial reporting.
/s/ Deloitte & Touche LLP
Dallas, Texas
February 22, 2012
50
REPORT OF INDEPENDENT REGISTERED PUBLIC ACCOUNTING FIRM
To the Board of Directors and Stockholders of
Dr Pepper Snapple Group, Inc.
We have audited the internal control over financial reporting of Dr Pepper Snapple Group, Inc. (the "Company") as of December 31, 2011, based on criteria established in
Internal Control
-
Integrated Framework
issued by the Committee of Sponsoring Organizations of the Treadway Commission. The Company's management is responsible for maintaining effective internal control over financial reporting and for its assessment of the effectiveness of internal control over financial reporting, included in the accompanying Management's Annual Report on Internal Control over Financial Reporting appearing under Item 9A. Our responsibility is to express an opinion on the Company's internal control over financial reporting based on our audit.
We conducted our audit in accordance with the standards of the Public Company Accounting Oversight Board (United States). Those standards require that we plan and perform the audit to obtain reasonable assurance about whether effective internal control over financial reporting was maintained in all material respects. Our audit included obtaining an understanding of internal control over financial reporting, assessing the risk that a material weakness exists, testing and evaluating the design and operating effectiveness of internal control based on the assessed risk, and performing such other procedures as we considered necessary in the circumstances. We believe that our audit provides a reasonable basis for our opinion.
A company's internal control over financial reporting is a process designed by, or under the supervision of, the company's principal executive and principal financial officers, or persons performing similar functions, and effected by the company's board of directors, management, and other personnel to provide reasonable assurance regarding the reliability of financial reporting and the preparation of financial statements for external purposes in accordance with generally accepted accounting principles. A company's internal control over financial reporting includes those policies and procedures that (1) pertain to the maintenance of records that, in reasonable detail, accurately and fairly reflect the transactions and dispositions of the assets of the company; (2) provide reasonable assurance that transactions are recorded as necessary to permit preparation of financial statements in accordance with generally accepted accounting principles, and that receipts and expenditures of the company are being made only in accordance with authorizations of management and directors of the company; and (3) provide reasonable assurance regarding prevention or timely detection of unauthorized acquisition, use, or disposition of the company's assets that could have a material effect on the financial statements.
Because of the inherent limitations of internal control over financial reporting, including the possibility of collusion or improper management override of controls, material misstatements due to error or fraud may not be prevented or detected on a timely basis. Also, projections of any evaluation of the effectiveness of the internal control over financial reporting to future periods are subject to the risk that the controls may become inadequate because of changes in conditions, or that the degree of compliance with the policies or procedures may deteriorate.
In our opinion, the Company maintained, in all material respects, effective internal control over financial reporting as of December 31, 2011, based on the criteria established in
Internal Control-Integrated Framework
issued by the Committee of Sponsoring Organizations of the Treadway Commission.
We have also audited, in accordance with the standards of the Public Company Accounting Oversight Board (United States), the consolidated financial statements as of and for the year ended December 31, 2011 of the Company and our report dated February 22, 2012 expressed
an unqualified opinion on those financial statements.
/s/ Deloitte & Touche LLP
Dallas, Texas
February 22, 2012
51
DR PEPPER SNAPPLE GROUP, INC.
CONSOLIDATED STATEMENTS OF INCOME
For the Years Ended
December 31, 2011
,
2010
and
2009
(In millions, except per share data)
|
|
For the year ended December 31,
|
|||||||||||
|
|
2011
|
2010
|
2009
|
|||||||||
|
Net sales
|
$
|
5,903
|
|
$
|
5,636
|
|
$
|
5,531
|
|
|||
|
Cost of sales
|
2,485
|
|
2,243
|
|
2,234
|
|
||||||
|
Gross profit
|
3,418
|
|
3,393
|
|
3,297
|
|
||||||
|
Selling, general and administrative expenses
|
2,257
|
|
2,233
|
|
2,135
|
|
||||||
|
Depreciation and amortization
|
126
|
|
127
|
|
117
|
|
||||||
|
Other operating expense (income), net
|
11
|
|
8
|
|
(40
|
)
|
||||||
|
Income from operations
|
1,024
|
|
1,025
|
|
1,085
|
|
||||||
|
Interest expense
|
114
|
|
128
|
|
243
|
|
||||||
|
Interest income
|
(3
|
)
|
(3
|
)
|
(4
|
)
|
||||||
|
Loss on early extinguishment of debt
|
—
|
|
100
|
|
—
|
|
||||||
|
Other income, net
|
(12
|
)
|
(21
|
)
|
(22
|
)
|
||||||
|
Income before provision for income taxes and equity in earnings of unconsolidated subsidiaries
|
925
|
|
821
|
|
868
|
|
||||||
|
Provision for income taxes
|
320
|
|
294
|
|
315
|
|
||||||
|
Income before equity in earnings of unconsolidated subsidiaries
|
605
|
|
527
|
|
553
|
|
||||||
|
Equity in earnings of unconsolidated subsidiaries, net of tax
|
1
|
|
1
|
|
2
|
|
||||||
|
Net income
|
$
|
606
|
|
$
|
528
|
|
$
|
555
|
|
|||
|
Earnings per common share:
|
|
|
||||||||||
|
Basic
|
$
|
2.77
|
|
$
|
2.19
|
|
$
|
2.18
|
|
|||
|
Diluted
|
2.74
|
|
2.17
|
|
2.17
|
|
||||||
|
Weighted average common shares outstanding:
|
|
|
||||||||||
|
Basic
|
218.7
|
|
240.4
|
|
254.2
|
|
||||||
|
Diluted
|
221.2
|
|
242.6
|
|
255.2
|
|
||||||
|
Cash dividends declared per common share
|
$
|
1.21
|
|
$
|
0.90
|
|
$
|
0.15
|
|
|||
The accompanying notes are an integral part of these consolidated financial statements.
52
DR PEPPER SNAPPLE GROUP, INC.
As of
December 31, 2011
and
2010
(In millions, except share and per share data)
|
|
December 31,
|
December 31,
|
|||||
|
|
2011
|
2010
|
|||||
|
Assets
|
|||||||
|
Current assets:
|
|
|
|||||
|
Cash and cash equivalents
|
$
|
701
|
|
$
|
315
|
|
|
|
Accounts receivable:
|
|
|
|||||
|
Trade, net
|
585
|
|
536
|
|
|||
|
Other
|
50
|
|
35
|
|
|||
|
Inventories
|
212
|
|
244
|
|
|||
|
Deferred tax assets
|
96
|
|
57
|
|
|||
|
Prepaid expenses and other current assets
|
113
|
|
122
|
|
|||
|
Total current assets
|
1,757
|
|
1,309
|
|
|||
|
Property, plant and equipment, net
|
1,152
|
|
1,168
|
|
|||
|
Investments in unconsolidated subsidiaries
|
13
|
|
11
|
|
|||
|
Goodwill
|
2,980
|
|
2,984
|
|
|||
|
Other intangible assets, net
|
2,677
|
|
2,691
|
|
|||
|
Other non-current assets
|
573
|
|
552
|
|
|||
|
Non-current deferred tax assets
|
131
|
|
144
|
|
|||
|
Total assets
|
$
|
9,283
|
|
$
|
8,859
|
|
|
|
Liabilities and Stockholders' Equity
|
|||||||
|
Current liabilities:
|
|
|
|||||
|
Accounts payable
|
$
|
265
|
|
$
|
298
|
|
|
|
Deferred revenue
|
65
|
|
65
|
|
|||
|
Current portion of long-term obligations
|
452
|
|
404
|
|
|||
|
Income taxes payable
|
530
|
|
18
|
|
|||
|
Other current liabilities
|
603
|
|
|
553
|
|
||
|
Total current liabilities
|
1,915
|
|
1,338
|
|
|||
|
Long-term obligations
|
2,256
|
|
1,687
|
|
|||
|
Non-current deferred tax liabilities
|
586
|
|
1,083
|
|
|||
|
Non-current deferred revenue
|
1,449
|
|
1,515
|
|
|||
|
Other non-current liabilities
|
814
|
|
777
|
|
|||
|
Total liabilities
|
7,020
|
|
6,400
|
|
|||
|
Commitments and contingencies
|
|
|
|||||
|
Stockholders' equity:
|
|
|
|||||
|
Preferred stock, $.01 par value, 15,000,000 shares authorized, no shares issued
|
—
|
|
—
|
|
|||
|
Common stock, $.01 par value, 800,000,000 shares authorized, 212,130,239 and 223,936,156 shares issued and outstanding for 2011 and 2010, respectively
|
2
|
|
2
|
|
|||
|
Additional paid-in capital
|
1,631
|
|
2,085
|
|
|||
|
Retained earnings
|
740
|
|
400
|
|
|||
|
Accumulated other comprehensive loss
|
(110
|
)
|
(28
|
)
|
|||
|
Total stockholders' equity
|
2,263
|
|
2,459
|
|
|||
|
Total liabilities and stockholders' equity
|
$
|
9,283
|
|
$
|
8,859
|
|
|
The accompanying notes are an integral part of these consolidated financial statements.
53
DR PEPPER SNAPPLE GROUP, INC
.
For the Years Ended
December 31, 2011
,
2010
and
2009
(In millions)
|
|
For the Year Ended December 31,
|
||||||||||
|
|
2011
|
2010
|
2009
|
||||||||
|
Operating activities:
|
|
|
|||||||||
|
Net income
|
$
|
606
|
|
$
|
528
|
|
$
|
555
|
|
||
|
Adjustments to reconcile net income to net cash provided by operating activities:
|
|
|
|||||||||
|
Depreciation expense
|
198
|
|
185
|
|
167
|
|
|||||
|
Amortization expense
|
34
|
|
43
|
|
57
|
|
|||||
|
Amortization of deferred revenue
|
(65
|
)
|
(37
|
)
|
—
|
|
|||||
|
Employee stock-based compensation expense
|
34
|
|
29
|
|
19
|
|
|||||
|
Deferred income taxes
|
(498
|
)
|
37
|
|
103
|
|
|||||
|
Loss on early extinguishment of debt
|
—
|
|
100
|
|
—
|
|
|||||
|
Other, net
|
24
|
|
7
|
|
(14
|
)
|
|||||
|
Changes in assets and liabilities:
|
|
|
|||||||||
|
Trade accounts receivable
|
(55
|
)
|
8
|
|
(24
|
)
|
|||||
|
Other accounts receivable
|
(18
|
)
|
(10
|
)
|
29
|
|
|||||
|
Inventories
|
29
|
|
19
|
|
3
|
|
|||||
|
Other current and non-current assets
|
(21
|
)
|
(20
|
)
|
(58
|
)
|
|||||
|
Trade accounts payable
|
(30
|
)
|
37
|
|
4
|
|
|||||
|
Income taxes payable
|
521
|
|
22
|
|
(2
|
)
|
|||||
|
Current and non-current deferred revenue
|
—
|
|
1,614
|
|
—
|
|
|||||
|
Other current and non-current liabilities
|
1
|
|
(27
|
)
|
26
|
|
|||||
|
Net cash provided by operating activities
|
760
|
|
2,535
|
|
865
|
|
|||||
|
Investing activities:
|
|
|
|||||||||
|
Purchase of property, plant and equipment
|
(215
|
)
|
(246
|
)
|
(317
|
)
|
|||||
|
Purchase of intangible assets
|
(3
|
)
|
—
|
|
(8
|
)
|
|||||
|
Investments in unconsolidated subsidiaries
|
(2
|
)
|
(1
|
)
|
—
|
|
|||||
|
Proceeds from disposals of property, plant and equipment
|
3
|
|
18
|
|
5
|
|
|||||
|
Proceeds from disposals of intangible assets
|
—
|
|
—
|
|
69
|
|
|||||
|
Other, net
|
—
|
|
4
|
|
—
|
|
|||||
|
Net cash used in investing activities
|
(217
|
)
|
(225
|
)
|
(251
|
)
|
|||||
|
Financing activities:
|
|
|
|||||||||
|
Proceeds from senior unsecured notes and senior unsecured credit facility
|
1,000
|
|
—
|
|
1,255
|
|
|||||
|
Repayment of senior unsecured notes and senior unsecured credit facility
|
(400
|
)
|
(978
|
)
|
(1,805
|
)
|
|||||
|
Repurchase of shares of common stock
|
(522
|
)
|
(1,113
|
)
|
—
|
|
|||||
|
Dividends paid
|
(251
|
)
|
(194
|
)
|
—
|
|
|||||
|
Proceeds from stock options exercised
|
20
|
|
6
|
|
1
|
|
|||||
|
Excess tax benefit on stock-based compensation
|
10
|
|
3
|
|
—
|
|
|||||
|
Other, net
|
(9
|
)
|
(4
|
)
|
(5
|
)
|
|||||
|
Net cash used in financing activities
|
(152
|
)
|
(2,280
|
)
|
(554
|
)
|
|||||
|
Cash and cash equivalents — net change from:
|
|
|
|||||||||
|
Operating, investing and financing activities
|
391
|
|
30
|
|
60
|
|
|||||
|
Effect of exchange rate changes on cash and cash equivalents
|
(5
|
)
|
5
|
|
6
|
|
|||||
|
Cash and cash equivalents at beginning of year
|
315
|
|
280
|
|
214
|
|
|||||
|
Cash and cash equivalents at end of year
|
$
|
701
|
|
$
|
315
|
|
$
|
280
|
|
||
See Note 17 for supplemental cash flow disclosures.
The accompanying notes are an integral part of these consolidated financial statements.
54
DR PEPPER SNAPPLE GROUP, INC.
CONSOLIDATED STATEMENTS OF CHANGES IN STOCKHOLDERS’ EQUITY
For the Years Ended
December 31, 2011
,
2010
and
2009
(In millions, except per share data)
|
|
|
|
|
|
Accumulated
|
|
|
|||||||||||||||||||
|
|
Common Stock
|
Additional
|
Retained
|
Other
|
|
|
||||||||||||||||||||
|
|
Issued
|
Paid-In
|
Earnings
|
Comprehensive
|
Total
|
Comprehensive
|
||||||||||||||||||||
|
|
Shares
|
Amount
|
Capital
|
(Deficit)
|
Loss
|
Equity
|
Income
|
|||||||||||||||||||
|
Balance as of December 31, 2008
|
253.7
|
|
$
|
3
|
|
$
|
3,140
|
|
$
|
(430
|
)
|
$
|
(106
|
)
|
$
|
2,607
|
|
|
|
|||||||
|
Shares issued under employee stock-based compensation plans and other
|
0.4
|
|
—
|
|
—
|
|
—
|
|
—
|
|
—
|
|
$
|
—
|
|
|||||||||||
|
Net income
|
—
|
|
—
|
|
—
|
|
555
|
|
—
|
|
555
|
|
555
|
|
||||||||||||
|
Dividends declared, $0.15 per share
|
—
|
|
—
|
|
—
|
|
(38
|
)
|
—
|
|
(38
|
)
|
—
|
|
||||||||||||
|
Stock options exercised and stock-based compensation expense, net of tax of $4 million
|
—
|
|
—
|
|
16
|
|
—
|
|
—
|
|
16
|
|
—
|
|
||||||||||||
|
Net change in pension liability, net of tax benefit of $3
|
—
|
|
—
|
|
—
|
|
—
|
|
7
|
|
7
|
|
7
|
|
||||||||||||
|
Cash flow hedges, net of tax benefit of $11
|
—
|
|
—
|
|
—
|
|
—
|
|
18
|
|
18
|
|
18
|
|
||||||||||||
|
Foreign currency translation adjustment
|
—
|
|
—
|
|
—
|
|
—
|
|
22
|
|
22
|
|
22
|
|
||||||||||||
|
Balance as of December 31, 2009
|
254.1
|
|
3
|
|
3,156
|
|
87
|
|
(59
|
)
|
3,187
|
|
$
|
602
|
|
|||||||||||
|
Shares issued under employee stock-based compensation plans and other
|
0.6
|
|
—
|
|
—
|
|
—
|
|
—
|
|
—
|
|
$
|
—
|
|
|||||||||||
|
Net income
|
—
|
|
—
|
|
—
|
|
528
|
|
—
|
|
528
|
|
528
|
|
||||||||||||
|
Dividends declared, $0.90 per share
|
—
|
|
—
|
|
3
|
|
(215
|
)
|
—
|
|
(212
|
)
|
—
|
|
||||||||||||
|
Stock options exercised and stock-based compensation expense, net of tax benefit of $3
|
—
|
|
—
|
|
38
|
|
—
|
|
—
|
|
38
|
|
—
|
|
||||||||||||
|
Net change in pension liability, net of tax benefit of $9
|
—
|
|
—
|
|
—
|
|
—
|
|
14
|
|
14
|
|
14
|
|
||||||||||||
|
Cash flow hedges, net of tax of $1
|
—
|
|
—
|
|
—
|
|
—
|
|
(2
|
)
|
(2
|
)
|
(2
|
)
|
||||||||||||
|
Common stock repurchases
|
(30.8
|
)
|
(1
|
)
|
(1,112
|
)
|
—
|
|
—
|
|
(1,113
|
)
|
—
|
|
||||||||||||
|
Foreign currency translation adjustment
|
—
|
|
—
|
|
—
|
|
—
|
|
19
|
|
19
|
|
19
|
|
||||||||||||
|
Balance as of December 31, 2010
|
223.9
|
|
2
|
|
2,085
|
|
400
|
|
(28
|
)
|
2,459
|
|
$
|
559
|
|
|||||||||||
|
Shares issued under employee stock-based compensation plans and other
|
1.9
|
|
—
|
|
—
|
|
—
|
|
—
|
|
—
|
|
$
|
—
|
|
|||||||||||
|
Net income
|
—
|
|
—
|
|
—
|
|
606
|
|
—
|
|
606
|
|
606
|
|
||||||||||||
|
Dividends declared, $1.21 per share
|
—
|
|
—
|
|
4
|
|
(266
|
)
|
—
|
|
(262
|
)
|
—
|
|
||||||||||||
|
Stock options exercised and stock-based compensation expense, net of tax benefit of $10
|
—
|
|
—
|
|
64
|
|
—
|
|
—
|
|
64
|
|
—
|
|
||||||||||||
|
Net change in pension liability, net of tax benefit of $9
|
—
|
|
—
|
|
—
|
|
—
|
|
(17
|
)
|
(17
|
)
|
(17
|
)
|
||||||||||||
|
Cash flow hedges, net of tax of $20
|
—
|
|
—
|
|
—
|
|
—
|
|
(31
|
)
|
(31
|
)
|
(31
|
)
|
||||||||||||
|
Common stock repurchases
|
(13.7
|
)
|
—
|
|
(522
|
)
|
—
|
|
—
|
|
(522
|
)
|
—
|
|
||||||||||||
|
Foreign currency translation adjustment
|
—
|
|
—
|
|
—
|
|
—
|
|
(34
|
)
|
(34
|
)
|
(34
|
)
|
||||||||||||
|
Balance as of December 31, 2011
|
212.1
|
|
$
|
2
|
|
$
|
1,631
|
|
$
|
740
|
|
$
|
(110
|
)
|
$
|
2,263
|
|
$
|
524
|
|
||||||
The accompanying notes are an integral part of these consolidated financial statements.
55
|
1.
|
Business and Basis of Presentation
|
References in this Annual Report on Form 10-K to "we", "our", "us", "DPS" or "the Company" refer to Dr Pepper Snapple Group, Inc. and all entities included in our Audited Consolidated Financial Statements. Cadbury plc and Cadbury Schweppes plc are hereafter collectively referred to as "Cadbury" unless otherwise indicated. Kraft Foods Inc., which acquired Cadbury on February 2, 2010, is hereafter referred to as "Kraft".
This Annual Report on Form 10-K refers to some of DPS' owned or licensed trademarks, trade names and service marks, which are referred to as the Company's brands. All of the product names included in this Annual Report on Form 10-K are either DPS' registered trademarks or those of the Company's licensors.
Nature of Operations
DPS is a leading integrated brand owner, manufacturer and distributor of non-alcoholic beverages in the United States ("U.S."), Canada, and Mexico with a diverse portfolio of flavored (non-cola) carbonated soft drinks ("CSDs") and non-carbonated beverages ("NCBs"), including ready-to-drink teas, juices, juice drinks and mixers. The Company’s brand portfolio includes popular CSD brands such as Dr Pepper, Canada Dry, 7UP, Squirt, Crush, A&W, Sunkist soda, Peñafiel, Schweppes, and Sun Drop, and NCB brands such as Snapple, Hawaiian Punch, Mott's, Clamato, Rose’s and Mr & Mrs T mixers.
We were incorporated in Delaware on October 24, 2007. In 2008, Cadbury separated its beverage business in the U.S., Canada, Mexico and the Caribbean (the "Americas Beverages business") from its global confectionery business by contributing the subsidiaries that operated its Americas Beverages business to us.
Principles of Consolidation
DPS consolidates all wholly-owned subsidiaries. The Company uses the equity method to account for investments in companies if the investment provides the Company with the ability to exercise significant influence over operating and financial policies of the investee. Consolidated net income includes DPS' proportionate share of the net income or loss of these companies. Judgment regarding the level of influence over each equity method investment includes considering key factors such as ownership interest, representation on the board of directors, participation in policy-making decisions and material intercompany transactions.
The Company eliminates all significant intercompany transactions, including the intercompany portion of transactions with equity method investees, from the financial results.
Basis of Presentation
The accompanying consolidated financial statements have been prepared in accordance with accounting principles generally accepted in the United States of America ("U.S. GAAP"). In the opinion of management, all adjustments, consisting principally of normal recurring adjustments, considered necessary for a fair presentation have been included. The preparation of financial statements in conformity with U.S. GAAP requires management to make estimates and assumptions that affect the amounts reported in the financial statements and the accompanying notes. Actual results could differ from these estimates.
The consolidated financial statements may not be indicative of the Company's future performance and may not reflect what its consolidated results of operations, financial position and cash flows would have been had the Company operated as an independent company during all of the periods presented. To the extent that an asset, liability, revenue or expense is directly associated with the Company, it is reflected in the accompanying consolidated financial statements.
The Company has evaluated subsequent events through the date of issuance of the Company's Audited Consolidated Financial Statements.
Reclassifications
The prior year accounts payable and other current liabilities have been reclassified in the Consolidated Balance Sheets to conform to the current year's presentation with corresponding changes in prior years' Consolidated Statements of Cash Flows with no impact to total cash provided by (used in) operating, investing or financing activities. The reclassifications to the Consolidated Balance Sheets also resulted in changes to certain items in prior years' Notes 7, 8, 9 and 20. Other changes have been made to Consolidated Statements of Cash Flows for prior years to reflect changes made in the fourth quarter of 2011 with no impact to total cash provided by (used in) operating, investing or financing activities.
56
DR PEPPER SNAPPLE GROUP, INC.
NOTES TO AUDITED CONSOLIDATED FINANCIAL STATEMENTS - (Continued)
|
2.
|
Significant Accounting Policies
|
Use of Estimates
The process of preparing financial statements in conformity with U.S. GAAP requires the use of estimates and judgments that affect the reported amount of assets, liabilities, revenue and expenses. These estimates and judgments are based on historical experience, future expectations and other factors and assumptions the Company believes to be reasonable under the circumstances. These estimates and judgments are reviewed on an ongoing basis and are revised when necessary. Actual amounts may differ from these estimates. Changes in estimates are recorded in the period of change.
Cash and Cash Equivalents
Cash and cash equivalents include cash and investments in short-term, highly liquid securities, with original maturities of three months or less.
The Company is exposed to potential risks associated with its cash and cash equivalents. DPS places its cash and cash equivalents with high credit quality financial institutions. Deposits with these financial institutions may exceed the amount of insurance provided; however, these deposits typically are redeemable upon demand and, therefore, the Company believes the financial risks associated with these financial instruments are minimal.
Accounts Receivable and Allowance for Doubtful Accounts
Trade accounts receivable are recorded at the invoiced amount and do not bear interest. The Company determines the required allowance for doubtful collections using information such as its customer credit history and financial condition, industry and market segment information, economic trends and conditions and credit reports. Allowances can be affected by changes in the industry, customer credit issues or customer bankruptcies. Account balances are charged against the allowance when it is determined that the receivable will not be recovered.
Activity in the allowance for doubtful accounts was as follows (in millions):
|
|
2011
|
2010
|
2009
|
||||||||
|
Balance, beginning of the year
|
$
|
5
|
|
$
|
7
|
|
$
|
13
|
|
||
|
Net charge to costs and expenses
|
4
|
|
1
|
|
3
|
|
|||||
|
Write-offs and adjustments
|
(6
|
)
|
(3
|
)
|
(9
|
)
|
|||||
|
Balance, end of the year
|
$
|
3
|
|
$
|
5
|
|
$
|
7
|
|
||
The Company is exposed to potential credit risks associated with its accounts receivable. DPS performs ongoing credit evaluations of its customers, and generally does not require collateral on its accounts receivable. The Company has not experienced significant credit related losses to date.
As of
December 31, 2011
and
2010
, Wal-Mart Stores, Inc. ("Wal-Mart") accounted for approximately
$71 million
and
$72 million
of the Company's trade accounts receivable.
Inventories
Inventories are stated at the lower of cost or market value. Cost is determined for inventories of the Company's subsidiaries in the U.S. substantially by the last-in, first-out ("LIFO") valuation method and for inventories of the Company's international subsidiaries by the first-in, first-out ("FIFO") valuation method. The costs of finished goods inventories include raw materials, direct labor and indirect production and overhead costs. Reserves for excess and obsolete inventories are based on an assessment of slow-moving and obsolete inventories, determined by historical usage and demand. Excess and obsolete inventory reserves were
$3 million
and
$4 million
as of
December 31, 2011
and
2010
, respectively. Refer to Note 3 for further information.
57
DR PEPPER SNAPPLE GROUP, INC.
NOTES TO AUDITED CONSOLIDATED FINANCIAL STATEMENTS - (Continued)
Property, Plant and Equipment
Property, plant and equipment is stated at cost plus capitalized interest on borrowings during the actual construction period of major capital projects, net of accumulated depreciation. Significant improvements which substantially extend the useful lives of assets are capitalized. The costs of major rebuilds and replacements of plant and equipment are capitalized and expenditures for repairs and maintenance which do not improve or extend the life of the assets are expensed as incurred. When property, plant and equipment is sold or retired, the costs and the related accumulated depreciation are removed from the accounts, and any net gain or loss is recorded in other operating expense (income), net in the Consolidated Statements of Income. Refer to Note 4 for further information.
For financial reporting purposes, depreciation is computed on the straight-line method over the estimated useful asset lives as follows:
|
Type of Asset
|
Useful Life
|
||||
|
Buildings
|
40
|
years
|
|||
|
Building improvements
|
10
|
|
to
|
25
|
years
|
|
Machinery and equipment
|
3
|
|
to
|
20
|
years
|
|
Vehicles
|
5
|
|
to
|
10
|
years
|
|
Cold drink equipment
|
4
|
|
to
|
7
|
years
|
|
Computer software
|
3
|
|
to
|
5
|
years
|
Leasehold improvements are depreciated over the shorter of the estimated useful life of the assets or the lease term. Estimated useful lives are periodically reviewed and, when warranted, are updated.
The Company periodically reviews long-lived assets for impairment whenever events or changes in circumstances indicate that their carrying amount may not be recoverable. In order to assess recoverability, DPS compares the estimated undiscounted future pre-tax cash flows from the use of the asset or group of assets, as defined, to the carrying amount of such assets. Measurement of an impairment loss is based on the excess of the carrying amount of the asset or group of assets over the long-lived asset's fair value. As of
December 31, 2011
and
2010
, no analysis was warranted.
Goodwill and Other Intangible Assets
The Company classifies intangible assets into two categories: (1) intangible assets with definite lives subject to amortization and (2) intangible assets with indefinite lives not subject to amortization. The majority of the Company's intangible asset balance is made up of brands which the Company has determined to have indefinite useful lives. In arriving at the conclusion that a brand has an indefinite useful life, management reviews factors such as size, diversification and market share of each brand. Management expects to acquire, hold and support brands for an indefinite period through consumer marketing and promotional support. The Company also considers factors such as its ability to continue to protect the legal rights that arise from these brand names indefinitely or the absence of any regulatory, economic or competitive factors that could truncate the life of the brand name. If the criteria are not met to assign an indefinite life, the brand is amortized over its expected useful life.
Identifiable intangible assets deemed by the Company to have determinable finite useful lives are amortized on a straight-line basis over their estimated useful lives as follows:
|
Type of Intangible Asset
|
Useful Life
|
||||
|
Brands
|
10
|
|
to
|
15
|
years
|
|
Bottler agreements
|
10
|
|
to
|
15
|
years
|
|
Customer relationships
|
5
|
|
to
|
10
|
years
|
|
Distribution rights
|
5
|
years
|
|||
DPS conducts tests for impairment in accordance with U.S. GAAP. For intangible assets with definite lives, tests for impairment must be performed if conditions exist that indicate the carrying value may not be recoverable. For goodwill and indefinite lived intangible assets, the Company conducts tests for impairment annually, as of December 31, or more frequently if events or circumstances indicate the carrying amount may not be recoverable. We use present value and other valuation techniques to make this assessment.
58
DR PEPPER SNAPPLE GROUP, INC.
NOTES TO AUDITED CONSOLIDATED FINANCIAL STATEMENTS - (Continued)
The tests for impairment include significant judgment in estimating the fair value of reporting units and intangible assets primarily by analyzing forecasts of future revenues and profit performance. Fair value is based on what the reporting units and intangible assets would be worth to a third party market participant. Discount rates are based on a weighted average cost of equity and cost of debt, adjusted with various risk premiums. Management's estimates of fair value, which fall under Level 3, are based on historical and projected operating performance. Refer to Note 6 for additional information.
Other Assets
The Company provides support to certain customers to cover various programs and initiatives to increase net sales, including contributions to customers or vendors for cold drink equipment used to market and sell the Company's products. These programs and initiatives generally directly benefit the Company over a period of time. Accordingly, costs of these programs and initiatives are recorded in prepaid expenses and other current assets and other non-current assets in the Consolidated Balance Sheets. The costs for these programs are amortized over the period to be directly benefited based upon a methodology consistent with the Company's contractual rights under these arrangements.
The long-term portion of these programs and initiatives recorded in the Consolidated Balance Sheets were $
82 million
and
$84 million
, net of accumulated amortization, as of
December 31, 2011
and
2010
, respectively. The amortization charge for the cost of contributions to customers or vendors for cold drink equipment was
$6 million
,
$7 million
and
$8 million
during the years ended
December 31, 2011
,
2010
and
2009
, respectively, and was recorded in selling, general and administrative expenses in the Consolidated Statements of Income. The amortization charge for the cost of other programs and incentives was
$15 million
,
$11 million
and
$10 million
during the years ended
December 31, 2011
,
2010
and
2009
, respectively, and was recorded as a deduction from gross sales.
Derivatives
The Company formally designates and accounts for certain interest rate contracts and foreign exchange forward contracts that meet established accounting criteria under U.S. GAAP as either fair value or cash flow hedges. For derivative instruments that are designated and qualify as cash flow hedges, the effective portion of the gain or loss on the derivative instruments is recorded, net of applicable taxes, in Accumulated Other Comprehensive Loss ("AOCL"), a component of Stockholders' Equity in the Consolidated Balance Sheets. When net income is affected by the variability of the underlying transaction, the applicable offsetting amount of the gain or loss from the derivative instrument deferred in AOCL is reclassified to net income and is reported as a component of the Consolidated Statements of Income. For derivative instruments that are designated and qualify as fair value hedges, the effective change in the fair value of the instrument as well as the offsetting gain or loss on the hedged item attributable to the hedged risk, are recognized immediately in current-period earnings. For derivatives that are not designated as a hedging instrument, which creates an economic hedge, or de-designated as a hedging instrument, the gain or loss on the instrument is recognized in earnings in the period of change.
Certain interest rate swap agreements qualify for the shortcut method of accounting for hedges under U.S. GAAP. Under the shortcut method, the hedges are assumed to be perfectly effective and no ineffectiveness is recorded in earnings. For all other designated hedges, t
he Company assesses at the time the derivative contract is entered into, and at least quarterly thereafter, whether the derivative instrument is effective in offsetting the changes in fair value or cash flows. DPS also measures hedge ineffectiveness on a quarterly basis throughout the designated period.
Changes in the fair value of the derivative instrument that do not effectively offset changes in the fair value of the underlying hedged item throughout the designated hedge period are recorded in earnings each period.
If a fair value or cash flow hedge were to cease to qualify for hedge accounting, or were terminated, it would continue to be carried on the balance sheet at fair value until settled, but hedge accounting would be discontinued prospectively. If the underlying hedged transaction ceases to exist, any associated amounts reported in AOCL are reclassified to earnings at that time.
Refer to Note 9 for additional information.
59
DR PEPPER SNAPPLE GROUP, INC.
NOTES TO AUDITED CONSOLIDATED FINANCIAL STATEMENTS - (Continued)
Fair Value of Financial Instruments
The carrying amounts reflected in the Consolidated Balance Sheets of cash and cash equivalents, accounts receivable, net, accounts payable and other current liabilities approximate their fair values due to their short-term nature. The fair value of long term debt as of
December 31, 2011
and
2010
, is based on quoted market prices for publicly traded securities.
The Company estimates fair values of financial instruments measured at fair value in the financial statements on a recurring basis to ensure they are calculated based on market rates to settle the instruments. These values represent the estimated amounts DPS would pay or receive to terminate agreements, taking into consideration current market rates and creditworthiness. The fair value for financial instruments categorized as Level 1 is based on quoted prices in active markets for identical assets or liabilities. The fair value of financial instruments categorized as Level 2 is determined using
valuation techniques based on inputs derived from observable market data, quoted market prices for similar instruments, or pricing models, such as discounted cash flow techniques.
Refer to Notes 12 and 13 for additional information.
Transfers between levels are recognized at the end of each reporting period.
Pension and Postretirement Benefits
The Company has U.S. and foreign pension and postretirement benefit plans which provide benefits to a defined group of employees who satisfy age and length of service requirements at the discretion of the Company. As of
December 31, 2011
, the Company has several stand-alone non-contributory defined benefit plans and postretirement medical plans. Depending on the plan, pension and postretirement benefits are based on a combination of factors, which may include salary, age and years of service.
Pension expense has been determined in accordance with the principles of U.S. GAAP. The Company's policy is to fund pension plans in accordance with the requirements of the Employee Retirement Income Security Act of 1974, as amended. Employee benefit plan obligations and expenses included in the Consolidated Financial Statements are determined from actuarial analyses based on plan assumptions, employee demographic data, years of service, compensation, benefits and claims paid and employer contributions.
The expense related to the postretirement plans has been determined in accordance with U.S. GAAP and the Company accrues the cost of these benefits during the years that employees render service. Refer to Note 13 for additional information.
Risk Management Programs
The Company retains selected levels of property, casualty, workers' compensation, health and other business risks. Many of these risks are covered under conventional insurance programs with high deductibles or self-insured retentions. Accrued liabilities related to the retained casualty and health risks are calculated based on loss experience and development factors, which contemplate a number of variables including claim history and expected trends. These loss development factors are established in consultation with external insurance brokers and actuaries. As of
December 31, 2011
and
2010
, the Company had accrued liabilities related to the retained risks of
$89 million
and
$80 million
, respectively, including both current and long-term liabilities.
Income Taxes
Income taxes are accounted for using the asset and liability approach under U.S. GAAP. This method involves determining the temporary differences between assets and liabilities recognized for financial reporting and the corresponding amounts recognized for tax purposes and computing the tax-related carryforwards at the enacted tax rates expected to apply to taxable income in the years in which those temporary differences are expected to be recovered or settled. The resulting amounts are deferred tax assets or liabilities and the net changes represent the deferred tax expense or benefit for the year. The total of taxes currently payable per the tax return and the deferred tax expense or benefit represents the income tax expense or benefit for the year for financial reporting purposes.
The Company periodically assesses the likelihood of realizing its deferred tax assets based on the amount of deferred tax assets that the Company believes is more likely than not to be realized. The Company bases its judgment of the recoverability of its deferred tax asset primarily on historical earnings, its estimate of current and expected future earnings, prudent and feasible tax planning strategies, and current and future ownership changes. Refer to Note 11 for additional information.
Deferred income taxes have not been provided on this income as the Company believes these earnings to be permanently reinvested. It is not practicable to estimate the amount of additional tax that might be payable on these undistributed foreign earnings.
60
DR PEPPER SNAPPLE GROUP, INC.
NOTES TO AUDITED CONSOLIDATED FINANCIAL STATEMENTS - (Continued)
DPS' effective income tax rate may fluctuate on a quarterly basis due to various factors, including, but not limited to, total earnings and the mix of earnings by jurisdiction, the timing of changes in tax laws, and the amount of tax provided for uncertain tax positions.
The Company establishes income tax reserves to remove some or all of the income tax benefit of any of the Company's income tax positions at the time DPS determines that the positions become uncertain based upon one of the following: (1) the tax position is not "more likely than not" to be sustained, (2) the tax position is "more likely than not" to be sustained, but for a lesser amount, or (3) the tax position is "more likely than not" to be sustained, but not in the financial period in which the tax position was originally taken. The Company's evaluation of whether or not a tax position is uncertain is based on the following: (1) DPS presumes the tax position will be examined by the relevant taxing authority that has full knowledge of all relevant information, (2) the technical merits of a tax position are derived from authorities such as legislation and statutes, legislative intent, regulations, rulings and case law and their applicability to the facts and circumstances of the tax position, and (3) each tax position is evaluated without considerations of the possibility of offset or aggregation with other tax positions taken. The Company adjusts these income tax reserves when the Company's judgment changes as a result of new information. Any change will impact income tax expense in the period in which such determination is made.
Revenue Recognition
The Company recognizes sales revenue when all of the following have occurred: (1) delivery; (2) persuasive evidence of an agreement exists; (3) pricing is fixed or determinable; and (4) collection is reasonably assured. Delivery is not considered to have occurred until the title and the risk of loss passes to the customer according to the terms of the contract between the Company and the customer. The timing of revenue recognition is largely dependent on contract terms. For sales to other customers that are designated in the contract as free-on-board destination, revenue is recognized when the product is delivered to and accepted at the customer's delivery site. Net sales are reported net of costs associated with customer marketing programs and incentives, as described below, as well as sales taxes and other similar taxes.
Multiple deliverables were included in the arrangements entered into with PepsiCo, Inc. ("PepsiCo") and The Coca-Cola Company ("Coca-Cola") during 2010. In these cases, we first determined whether each deliverable met the separation criteria under U.S. GAAP. The primary requirement for a deliverable to meet the separation criteria is if the deliverable has standalone value to the customer. Each deliverable that meets the separation criteria is considered a separate "unit of accounting". As the sale of the manufacturing and distribution rights and the ongoing sales of concentrate would not have standalone value to the customer, both deliverables were determined to represent a single element of accounting for purposes of revenue recognition. The one-time nonrefundable cash receipts from PepsiCo and Coca-Cola were therefore recorded as deferred revenue and will be recognized as net sales ratably over the estimated
25
-year life of the customer relationship.
Customer Marketing Programs and Incentives
The Company offers a variety of incentives and discounts to bottlers, customers and consumers through various programs to support the distribution of its products. These incentives and discounts include cash discounts, price allowances, volume based rebates, product placement fees and other financial support for items such as trade promotions, displays, new products, consumer incentives and advertising assistance. These incentives and discounts are reflected as a reduction of gross sales to arrive at net sales. The aggregate deductions from gross sales recorded in relation to these programs, excluding contract manufacturing customers, were approximately
$3,733 million
,
$3,686 million
and
$3,419 million
during the years ended
December 31, 2011
,
2010
and
2009
, respectively. During 2009, the Company upgraded its SAP platform in the Direct Store Delivery system ("DSD"). As part of the upgrade, DPS harmonized its gross list price structure across locations. The impact of the change increased gross sales and related discounts by equal amounts on customer invoices. Net sales to the customers were not affected. The amounts of trade spend are larger in the Packaged Beverages segment than those related to other parts of our business. Accruals are established for the expected payout based on contractual terms, volume-based metrics and/or historical trends and require management judgment with respect to estimating customer participation and performance levels.
Transportation and Warehousing Costs
The Company incurred
$794 million
,
$754 million
and
$706 million
of transportation and warehousing costs during the years ended
December 31, 2011
,
2010
and
2009
, respectively. These amounts, which primarily relate to shipping and handling costs, are recorded in selling, general and administrative expenses in the Consolidated Statements of Income.
61
DR PEPPER SNAPPLE GROUP, INC.
NOTES TO AUDITED CONSOLIDATED FINANCIAL STATEMENTS - (Continued)
Advertising and Marketing Expense
Advertising and marketing production costs related to television, print, and radio are expensed as of the first date the advertisement takes place and amounted to approximately
$460 million
,
$445 million
and
$409 million
during the years ended
December 31, 2011
,
2010
and
2009
, respectively. These expenses are recorded in selling, general and administrative expenses in the Consolidated Statements of Income. As of
December 31, 2011
and
2010
, advertising and marketing costs of approximately
$44 million
and
$32 million
, respectively, were recorded as prepaid expenses and other current assets in the Consolidated Balance Sheets.
Research and Development
Research and development costs are expensed when incurred and amounted to
$15 million
,
$16 million
and
$15 million
during the years ended
December 31, 2011
,
2010
and
2009
, respectively. Additionally, the Company incurred packaging engineering costs of
$6 million
,
$6 million
and
$7 million
during the years ended
December 31, 2011
,
2010
and
2009
, respectively. These expenses when incurred are recorded in selling, general and administrative expenses in the Consolidated Statements of Income.
Stock-Based Compensation
The Company accounts for its stock-based compensation plans in accordance with U.S. GAAP, which requires the recognition of compensation expense in the Consolidated Statements of Income related to the fair value of employee share-based awards. Compensation cost is based on the grant-date fair value, which is estimated using the Black-Scholes option pricing model for stock options. The fair value of restricted stock units ("RSUs") and performance-based restricted stock units ("PSUs") is determined based on the number of units granted and the grant date price of common stock. Stock-based compensation expense is recognized ratably, less estimated forfeitures, over the vesting period in the Consolidated Statements of Income.
The stock-based compensation plans in which the Company's employees participate are described further in Note 14.
Nonmonetary Transactions
The Company accounts for nonmonetary transactions in accordance with U.S. GAAP, which requires transactions with commercial substance to be recorded at the estimated fair value of the products exchanged, unless the products received have a more readily determinable estimated fair value. During the year ended December 31, 2011, the Company entered into two barter agreements where
$6 million
of real estate was exchanged for certain advertising credits. To account for the exchange, the Company recorded a gain of
$2 million
in the Company's Consolidated Statements of Income. The advertising credits received are to be used over the next five years following 2011.
Restructuring Costs
The Company periodically records significant facility closing and reorganization charges as restructuring costs when a facility for closure or other reorganization opportunity has been identified, a closure plan has been developed and the affected employees notified, all in accordance with U.S. GAAP.
Foreign Currency Translation
The functional currency of the Company's operations outside the U.S. is generally the local currency of the country where the operations are located. The balance sheets of operations outside the U.S. are translated into U.S. Dollars at the end of year rates. The results of operations were translated into U.S. Dollars at a monthly average rate, calculated using daily exchange rates.
62
DR PEPPER SNAPPLE GROUP, INC.
NOTES TO AUDITED CONSOLIDATED FINANCIAL STATEMENTS - (Continued)
The following table sets forth exchange rate information for the periods and currencies indicated:
|
Mexican Peso to U.S. Dollar Exchange Rate
|
End of Year Rates
|
Annual Average Rates
|
|||
|
2011
|
13.95
|
|
12.43
|
|
|
|
2010
|
12.35
|
|
12.63
|
|
|
|
2009
|
13.07
|
|
13.61
|
|
|
|
Canadian Dollar to U.S. Dollar Exchange Rate
|
End of Year Rates
|
Annual Average Rates
|
|||
|
2011
|
1.02
|
|
0.99
|
|
|
|
2010
|
1.00
|
|
1.03
|
|
|
|
2009
|
1.05
|
|
1.15
|
|
|
Differences on exchange arising from the translation of opening balance sheets of these entities to the rate ruling at the end of the financial year are recognized in accumulated other comprehensive income. The exchange differences arising from the translation of foreign results from the average rate to the closing rate are also recognized in AOCL. Such translation differences are recognized as income or expense in the period in which the Company disposes of the operations.
Transactions in foreign currencies are recorded at the approximate rate of exchange at the transaction date. Assets and liabilities resulting from these transactions are translated at the rate of exchange in effect at the balance sheet date. All such differences are recorded in results of operations and amounted to
$8 million
,
$14 million
and
$19 million
during the years ended
December 31, 2011
,
2010
and
2009
, respectively.
Recently Issued Accounting Standards
In May 2011, the Financial Accounting Standards Board ("FASB") issued Accounting Standard Update ("ASU") 2011-04,
Amendments to Achieve Common Fair Value Measurement and Disclosure Requirements in U.S. GAAP and IFRSs
("ASU 2011-04"). The amendments in ASU 2011-04 change the wording used to describe many of the requirements in U.S. GAAP for measuring fair value and for disclosing information about fair value measurements. ASU 2011-04 is effective during interim and annual periods beginning after December 15, 2011. The Company will reflect the impact of these amendments beginning with the Company's Quarterly Report on Form 10-Q for the period ending March 31, 2012. The Company does not anticipate a material impact to the Company's financial position, results of operations or cash flows as a result of this change.
In June and December 2011, the FASB issued ASU 2011-05 and ASU 2011-12,
Presentation of Comprehensive Income
("ASU 2011-05" and "ASU 2011-12"). ASU 2011-05 requires registrants to present the total of comprehensive income, the components of net income, and the components of other comprehensive income ("OCI") either in a single continuous statement of comprehensive income or in two separate but consecutive statements. ASU 2011-12 defers the ASU 2011-05 requirement for registrants to present on the face of the financial statements reclassification adjustments for items that are reclassified from other comprehensive income to net income in the statements where the components of net income and the components of other comprehensive income are presented. ASU 2011-05 and ASU 2011-12 are effective for fiscal years, and interim periods within those years, beginning after December 15, 2011. The Company will present comprehensive income in two separate but consecutive statements beginning with the Company's Quarterly Report on Form 10-Q for the period ending March 31, 2012. As the new standard does not change the items that must be reported in other comprehensive income or when an item of other comprehensive income must be reclassified to net income, the Company's financial position, results of operations or cash flows will not be impacted.
In September 2011, the FASB issued ASU 2011-08,
Intangibles—Goodwill and Other: Testing Goodwill for Impairment
("ASU 2011-08"). The intent of ASU 2011-08 is to simplify how registrants test goodwill for impairment. ASU 2011-08 permits registrants to first assess qualitative factors to determine whether it is more likely than not that the fair value of a reporting unit is less than its carrying amount as a basis for determining whether it is necessary to perform the two-step goodwill impairment test included in U.S. GAAP. A registrant would not be required to calculate the fair value of a reporting unit unless the registrant determines that it is more likely than not that its fair value is less than its carrying amount. ASU 2011-08 is effective for annual and interim goodwill impairment tests performed for years beginning after December 15, 2011. Early adoption is permitted. Management will adopt this guidance for its annual and interim goodwill impairment testing during 2012.
63
DR PEPPER SNAPPLE GROUP, INC.
NOTES TO AUDITED CONSOLIDATED FINANCIAL STATEMENTS - (Continued)
Recently Adopted Provisions of U.S. GAAP
In accordance with U.S. GAAP, certain fair value measurement disclosure requirements specific to the different classes of assets and liabilities, valuation techniques and inputs used, as well as Level 3 activity, were effective as of January 1, 2011. The fair value measurement disclosure requirements had no material impact on the Company's financial position, results of operations or cash flows.
In accordance with U.S. GAAP and effective December 31, 2011, the Company adopted additional disclosure requirements about an employer's participation in a multi-employer pension plan, which had no material impact on the Company's financial position, results of operations or cash flows. The additional disclosures are included within the section "
Multi-employer Plans
" in Note 13.
|
3.
|
Inventories
|
Inventories as of
December 31, 2011
and
2010
consisted of the following (in millions):
|
|
December 31,
|
December 31,
|
|||||
|
2011
|
2010
|
||||||
|
Raw materials
|
$
|
91
|
|
$
|
97
|
|
|
|
Work in process
|
4
|
|
5
|
|
|||
|
Finished goods
|
171
|
|
184
|
|
|||
|
Inventories at FIFO cost
|
266
|
|
286
|
|
|||
|
Reduction to LIFO cost
|
(54
|
)
|
(42
|
)
|
|||
|
Inventories
|
$
|
212
|
|
$
|
244
|
|
|
|
4.
|
Property, Plant and Equipment
|
Net property, plant and equipment consisted of the following as of
December 31, 2011
and
2010
(in millions):
|
|
December 31,
|
December 31,
|
|||||
|
|
2011
|
2010
|
|||||
|
Land
|
$
|
80
|
|
$
|
81
|
|
|
|
Buildings and improvements
|
422
|
|
408
|
|
|||
|
Machinery and equipment
|
1,165
|
|
1,084
|
|
|||
|
Cold drink equipment
|
284
|
|
265
|
|
|||
|
Software
|
181
|
|
153
|
|
|||
|
Construction in progress
|
58
|
|
90
|
|
|||
|
Gross property, plant and equipment
|
2,190
|
|
2,081
|
|
|||
|
Less: accumulated depreciation and amortization
|
(1,038
|
)
|
(913
|
)
|
|||
|
Net property, plant and equipment
|
$
|
1,152
|
|
$
|
1,168
|
|
|
Land, buildings and improvements included
$21 million
of assets at cost under capital lease as of
December 31, 2011
and
2010
. Machinery and equipment included
$1 million
of assets at cost under capital lease as of
December 31, 2011
and
2010
. The net book value of assets under capital lease was
$13 million
and
$14 million
as of
December 31, 2011
and
2010
, respectively.
Depreciation expense amounted to
$198 million
,
$185 million
and
$167 million
in
2011
,
2010
and
2009
, respectively. Depreciation expense was comprised of
$81 million
,
$74 million
and
$67 million
in cost of sales and
$117 million
,
$111 million
and
$100 million
in depreciation and amortization on the Consolidated Statements of Income in
2011
,
2010
and
2009
, respectively. The depreciation expense above also includes the charge to income resulting from amortization of assets recorded under capital leases.
Capitalized interest was
$3 million
during
2011
and
2010
and
$8 million
during
2009
.
64
DR PEPPER SNAPPLE GROUP, INC.
NOTES TO AUDITED CONSOLIDATED FINANCIAL STATEMENTS - (Continued)
|
5.
|
Investments in Unconsolidated Subsidiaries
|
The Company has an investment in a
50%
owned Mexican joint venture with Acqua Minerale San Benedetto which gives it the ability to exercise significant influence over operating and financial policies of the investee. The joint venture is not a variable interest entity and the investment represents a noncontrolling ownership interest and is accounted for under the equity method of accounting. The carrying value of the investment was
$11 million
as of
December 31, 2011
and
2010
. The Company's equity investment does not have a readily determinable fair value as the joint venture is not publicly traded. The Company's proportionate share of the net income resulting from its investment in the joint venture is reported under the line item captioned equity in earnings of unconsolidated subsidiaries, net of tax, in the Consolidated Statements of Income. During the fourth quarter of 2009, the Company received
$5 million
from the joint venture as its share of dividends declared by the Board of Directors of the Mexican joint venture. The dividends received were recorded as a reduction of the Company's investment in the joint venture, consistent with the equity method of accounting.
Additionally, the Company maintains certain investments accounted for under the cost method of accounting that have a zero cost basis in companies that it does not control and for which it does not have the ability to exercise significant influence over operating and financial policies.
During the third quarter of 2010, the Company contributed approximately
$1 million
to one of those investments, Hydrive Energy, LLC ("Hydrive"), a beverage manufacturer, whose co-founder and significant equity holder is a member of the Company's Board of Directors (the "Board"). As a result of this contribution, the Company increased its interest from
13.4%
as of
December 31, 2009
to
20.4%
, thereby causing the investment to be accounted for under the equity method of accounting. There was no retroactive impact to retained earnings as a result of the change in the method of accounting. During the fourth quarter of 2011, the Company contributed an additional
$2 million
, which increased its interest in Hydrive to
40.4%
as of
December 31, 2011
. The carrying value of the investment was
$2 million
and zero as of
December 31, 2011
and
2010
, respectively. The Company's equity investment does not have a readily determinable fair value as Hydrive is not publicly traded. The Company's proportionate share of the net loss resulting from its investment is reported under the line item captioned equity in earnings of unconsolidated subsidiaries, net of tax, in the Consolidated Statements of Income.
|
6.
|
Goodwill and Other Intangible Assets
|
Changes in the carrying amount of goodwill for the years ended
December 31, 2011
, and
2010
, by reporting unit are as follows (in millions):
|
|
Beverage Concentrates
|
WD
Reporting Unit
(1)
|
DSD Reporting Unit
(1)
|
Latin America Beverages
|
Total
|
||||||||||||||
|
Balance as of December 31, 2009
|
|
|
|
|
|
||||||||||||||
|
Goodwill
|
$
|
1,732
|
|
$
|
1,220
|
|
$
|
180
|
|
$
|
31
|
|
$
|
3,163
|
|
||||
|
Accumulated impairment losses
|
—
|
|
—
|
|
(180
|
)
|
—
|
|
(180
|
)
|
|||||||||
|
|
1,732
|
|
1,220
|
|
—
|
|
31
|
|
2,983
|
|
|||||||||
|
Foreign currency impact
|
—
|
|
—
|
|
—
|
|
1
|
|
1
|
|
|||||||||
|
Balance as of December 31, 2010
|
|
|
|
|
|
||||||||||||||
|
Goodwill
|
1,732
|
|
1,220
|
|
180
|
|
32
|
|
3,164
|
|
|||||||||
|
Accumulated impairment losses
|
—
|
|
—
|
|
(180
|
)
|
—
|
|
(180
|
)
|
|||||||||
|
|
1,732
|
|
1,220
|
|
—
|
|
32
|
|
2,984
|
|
|||||||||
|
Foreign currency impact
|
—
|
|
—
|
|
—
|
|
(4
|
)
|
(4
|
)
|
|||||||||
|
Balance as of December 31, 2011
|
|
|
|
|
|
||||||||||||||
|
Goodwill
|
1,732
|
|
1,220
|
|
180
|
|
28
|
|
3,160
|
|
|||||||||
|
Accumulated impairment losses
|
—
|
|
—
|
|
(180
|
)
|
—
|
|
(180
|
)
|
|||||||||
|
|
$
|
1,732
|
|
$
|
1,220
|
|
$
|
—
|
|
$
|
28
|
|
$
|
2,980
|
|
||||
____________________________
|
(1)
|
The Packaged Beverages segment is comprised of two reporting units, the Direct Store Delivery ("DSD") system and the Warehouse Direct ("WD") system.
|
DR PEPPER SNAPPLE GROUP, INC.
NOTES TO AUDITED CONSOLIDATED FINANCIAL STATEMENTS - (Continued)
The net carrying amounts of intangible assets other than goodwill as of
December 31, 2011
, and
2010
, are as follows (in millions):
|
|
December 31, 2011
|
December 31, 2010
|
|||||||||||||||||||||
|
|
Gross
|
Accumulated
|
Net
|
Gross
|
Accumulated
|
Net
|
|||||||||||||||||
|
|
Amount
|
Amortization
|
Amount
|
Amount
|
Amortization
|
Amount
|
|||||||||||||||||
|
Intangible assets with indefinite lives:
|
|
|
|
|
|
|
|||||||||||||||||
|
Brands
(1)
|
$
|
2,648
|
|
$
|
—
|
|
$
|
2,648
|
|
$
|
2,656
|
|
$
|
—
|
|
$
|
2,656
|
|
|||||
|
Distribution Rights
|
8
|
|
—
|
|
8
|
|
8
|
|
—
|
|
8
|
|
|||||||||||
|
Intangible assets with finite lives:
|
|
|
|
|
|
|
|||||||||||||||||
|
Brands
|
29
|
|
(24
|
)
|
5
|
|
29
|
|
(23
|
)
|
6
|
|
|||||||||||
|
Distribution Rights
|
3
|
|
—
|
|
3
|
|
—
|
|
—
|
|
—
|
|
|||||||||||
|
Customer relationships
|
76
|
|
(64
|
)
|
12
|
|
76
|
|
(57
|
)
|
19
|
|
|||||||||||
|
Bottler agreements
|
19
|
|
(18
|
)
|
1
|
|
19
|
|
(17
|
)
|
2
|
|
|||||||||||
|
Total
|
$
|
2,783
|
|
$
|
(106
|
)
|
$
|
2,677
|
|
$
|
2,788
|
|
$
|
(97
|
)
|
$
|
2,691
|
|
|||||
____________________________
|
(1)
|
In
2011
, intangible brands with indefinite lives decreased due to a
$8 million
change in foreign currency translation rates.
|
As of
December 31, 2011
, the weighted average useful life of intangible assets with finite lives was
9
years in total, consisting of
5
years for distribution rights,
10
years for both brands and customer relationships and
15
years for bottler agreements. Amortization expense for intangible assets was
$9 million
,
$16 million
and
$17 million
for the years ended
December 31, 2011
,
2010
and
2009
, respectively.
Amortization expense of these intangible assets over the the next five years is expected to be the following (in millions):
|
Year
|
Aggregate Amortization Expense
|
||
|
2012
|
$
|
5
|
|
|
2013
|
5
|
|
|
|
2014
|
5
|
|
|
|
2015
|
4
|
|
|
|
2016
|
2
|
|
|
In accordance with U.S. GAAP, the Company conducts impairment tests of goodwill and indefinite lived intangible assets annually, as of December 31, or more frequently if circumstances indicate that the carrying amount of an asset may not be recoverable. For purposes of impairment testing, DPS assigns goodwill to the reporting unit that benefits from the synergies arising from each business combination and also assigns indefinite lived intangible assets to its reporting units. The Company defines reporting units as Beverage Concentrates, Latin America Beverages and Packaged Beverages' two reporting units, DSD and WD.
The impairment test for indefinite lived intangible assets encompasses calculating a fair value of an indefinite lived intangible asset and comparing the fair value to its carrying value. If the carrying value exceeds the estimated fair value, impairment is recorded. The impairment tests for goodwill include comparing a fair value of the respective reporting unit with its carrying value, including goodwill and considering any indefinite lived intangible asset impairment charges ("Step 1"). If the carrying value exceeds the estimated fair value, impairment is indicated and a second step analysis ("Step 2") must be performed.
66
DR PEPPER SNAPPLE GROUP, INC.
NOTES TO AUDITED CONSOLIDATED FINANCIAL STATEMENTS - (Continued)
2011 Impairment Analysis
Based on the Company's review of the facts and circumstances and updated assumptions, the Company did not recalculate the fair values for the annual impairment analysis for goodwill, brands or distribution rights during 2011. The Company employed a carryforward approach, in accordance with U.S. GAAP, since DPS concluded it was remote that changes in the facts and circumstances would have caused the fair value of these assets to fall below their carrying amounts. This conclusion was based on the following factors: (1) the fair value of goodwill, brands and distribution rights exceeded their carrying amounts by a substantial margin in the 2010 annual impairment analyses performed; (2) the Company's business performance during 2011 was in line with the forecast used to estimate fair value in the impairment analysis performed during 2010; (3) the Company's outlook for 2012 and beyond is in line with the forecast used to estimate fair value in the impairment analysis performed during 2010; (4) other significant assumptions used in estimating fair value, such as the Company's weighted average cost of capital, have improved since the 2010 impairment analysis performed; (5) the assets and liabilities that make up the reporting units have not changed significantly since the 2010 fair value determination; and (6) DPS has experienced significant appreciation in the Company's market capitalization. As such, no impairment was recorded for the indefinite lived intangible assets and goodwill as of
December 31, 2011
.
2010 and 2009 Impairment Analyses
Fair value is measured based on what each intangible asset or reporting unit would be worth to a third party market participant. For our annual impairment analysis performed as of December 31,
2010
and
2009
, methodologies used to determine the fair values of the assets included an income based approach, as well as an overall consideration of market capitalization and our enterprise value. Management's estimates of fair value, which fall under Level 3, are based on historical and projected operating performance. Discount rates were based on a weighted average cost of equity and cost of debt and were adjusted with various risk premiums.
As of December 31,
2010
and
2009
, the results of the Step 1 analysis indicated that the estimated fair value of our indefinite lived intangible assets and goodwill substantially exceeded their carrying values and, therefore, are not impaired.
|
7.
|
Other Current Liabilities
|
Other current liabilities consisted of the following as of
December 31, 2011
, and
2010
(in millions):
|
|
December 31,
|
December 31,
|
|||||
|
2011
|
2010
|
||||||
|
Customer rebates and incentives
|
$
|
225
|
|
$
|
224
|
|
|
|
Accrued compensation
|
98
|
|
102
|
|
|||
|
Insurance reserves
|
35
|
|
29
|
|
|||
|
Interest accrual and interest rate swap liability
|
52
|
|
16
|
|
|||
|
Dividends payable
|
68
|
|
56
|
|
|||
|
Other
|
125
|
|
126
|
|
|||
|
Total other current liabilities
|
$
|
603
|
|
$
|
553
|
|
|
67
DR PEPPER SNAPPLE GROUP, INC.
NOTES TO AUDITED CONSOLIDATED FINANCIAL STATEMENTS - (Continued)
|
8.
|
Long-term Obligations
|
The following table summarizes the Company's long-term debt obligations as of
December 31, 2011
and
2010
(in millions):
|
|
December 31,
|
December 31,
|
|||||
|
2011
|
2010
|
||||||
|
Senior unsecured notes
(1)
|
$
|
2,701
|
|
$
|
2,081
|
|
|
|
Revolving credit facility
|
—
|
|
—
|
|
|||
|
Less — current portion
(2)
|
(452
|
)
|
(404
|
)
|
|||
|
Subtotal
|
2,249
|
|
1,677
|
|
|||
|
Long-term capital lease obligations
|
7
|
|
10
|
|
|||
|
Long-term obligations
|
$
|
2,256
|
|
$
|
1,687
|
|
|
____________________________
|
(1)
|
The carrying amount includes an adjustment of
$29 million
and
$7 million
related to the change in the fair value of interest rate swaps designated as fair value hedges or the unamortized value of de-designated fair value hedges.
|
The adjustment as of
December 31, 2011
included the change in the fair value for the fair value hedges on the
2.60%
senior notes due January 15, 2019 (the "2019 Notes"),
3.20%
senior notes due November 15, 2021 (the "2021 Notes")
and
7.45%
senior notes due May 1, 2038 (the "2038 Notes") and the unamortized value of the de-designated fair value hedge on
the
2.35%
senior notes due December 21, 2012 (the "2012 Notes").
The adjustment as of December 31,
2010
included the same items except for the exclusion of the fair value hedges on the 2019 and 2021 Notes and the addition of the fair value hedge on the
1.70%
senior notes due December 21, 2011 (the "2011 Notes")
. See Note 9 for further information regarding derivatives.
|
(2)
|
The carrying amount includes an adjustment of
$2 million
and
$4 million
related to the change in the fair value of the interest rate swap designated as a fair value hedge or the unamortized value of de-designated fair value hedges. The adjustment as of
December 31, 2011
included the unamortized value of the de-designated hedge on the 2012 Notes. The adjustment as of December 31,
2010
, included the change in the fair value for the fair value hedge on the 2011 Notes. See Note 9 for further information regarding derivatives.
|
The following is a description of the senior unsecured notes, the senior unsecured credit facility and the commercial paper program. The summaries of the senior unsecured notes, the senior unsecured credit facility and the commercial paper program are qualified in their entirety by the specific terms and provisions of the indentures governing the senior unsecured notes, the senior unsecured credit agreement and the commercial paper program dealer agreements, respectively.
Senior Unsecured Notes
The indentures governing the senior unsecured notes, among other things, limit the Company's ability to incur indebtedness secured by principal properties, to enter into certain sale and leaseback transactions and to enter into certain mergers or transfers of substantially all of DPS' assets. The senior unsecured notes are guaranteed by substantially all of the Company's existing and future direct and indirect domestic subsidiaries. As of
December 31, 2011
, the Company was in compliance with all financial covenant requirements.
The 2019 and 2021 Notes
On November 15, 2011, the Company completed the issuance of
$500 million
aggregate principal amount of senior unsecured notes consisting of
$250 million
aggregate principal amount of the 2019 Notes and
$250 million
aggregate principal amount of the 2021 Notes. The discount associated with these Notes was approximately
$1 million
. The net proceeds from the issuance were used to repay
$400 million
aggregate principal amount of the 2011 Notes at maturity and general corporate purposes.
68
DR PEPPER SNAPPLE GROUP, INC.
NOTES TO AUDITED CONSOLIDATED FINANCIAL STATEMENTS - (Continued)
The 2016 Notes
On January 11, 2011, the Company completed the issuance of
$500 million
aggregate principal amount of
2.90%
senior notes due January 15, 2016 (the "2016 Notes") at a discount of
$1 million
. The net proceeds from the issuance were used to
replace a portion of the cash used to purchase the
6.82%
senior notes due May 1, 2018 (the "2018 Notes") tendered pursuant to the tender offer described below.
The 2011 and 2012 Notes
On December 21, 2009, the Company completed the issuance of
$850 million
aggregate principal amount of senior unsecured notes consisting of
$400 million
of the 2011 Notes and
$450 million
of the 2012 Notes.
The net proceeds from the sale of the debentures were used for repayment of existing indebtedness under the Term Loan A facility described below. The repayment of the 2011 Notes occurred on December 21, 2011, at maturity.
The 2013, 2018 and 2038 Notes
On April 30, 2008, the Company completed the issuance of
$1,700 million
aggregate principal amount of senior unsecured notes consisting of
$250 million
aggregate principal amount of
6.12%
senior notes due May 1, 2013 (the "2013 Notes"),
$1,200 million
aggregate principal amount of the 2018 Notes and
$250 million
aggregate principal amount of the 2038 Notes.
In December 2010, the Company completed a tender offer for a portion of the 2018 Notes and retired, at a premium, an aggregate principal amount of approximately
$476 million
. The aggregate principal amount of the outstanding 2018 Notes was
$724 million
as of
December 31, 2011
and
2010
.
Senior Unsecured Credit Facility
The Company's senior unsecured credit agreement, which was amended and restated on April 11, 2008 (the "senior unsecured credit facility"), provided senior unsecured financing consisting of
the Term Loan A facility (the "Term Loan A") with an aggregate principal amount of
$2,200 million
and a term of five years, which was fully repaid in December 2009 prior to its maturity and terminated. In addition, the Company's senior unsecured credit facility provides for the revolving credit facility (the "Revolver") in an aggregate principal amount of
$500 million
with a maturity in 2013. There were no principal borrowings under the Revolver outstanding as of
December 31, 2011
and
2010
. Up to
$75 million
of the Revolver is available for the issuance of letters of credit, of which
$7 million
and
$12 million
was utilized as of
December 31, 2011
and
2010
, respectively. Balances available for additional borrowings and letters of credit were
$493 million
and
$68 million
, respectively, as of
December 31, 2011
.
Borrowings under the senior unsecured credit facility bear interest at a floating rate per annum based upon the London interbank offered rate for dollars ("LIBOR") or the alternate base rate ("ABR"), in each case plus an applicable margin which varies based upon the Company’s debt ratings, from
1.00%
to
2.50%
, in the case of LIBOR loans, and
0.00%
to
1.50%
in the case of ABR loans. The alternate base rate means the greater of (a) JPMorgan Chase Bank’s prime rate and (b) the federal funds effective rate plus
0.50%
. Interest is payable on the last day of the interest period, but not less than quarterly, in the case of any LIBOR loan, and on the last day of March, June, September and December of each year in the case of any ABR loan. There were no borrowings under the senior unsecured credit facility during the year ended
December 31, 2011
.
The average interest rate for borrowings during the year was
2.25%
for the
year ended
December 31, 2010
.
An unused commitment fee is payable quarterly to the lenders on the unused portion of the commitments in respect of the Revolver equal to
0.15%
to
0.50%
per annum, depending upon the Company's debt ratings. The
Company incurred
$1 million
in
unused commitment fees during the years ended
December 31, 2011
and
2010
.
Any principal amounts outstanding under the Revolver are due and payable in full at maturity.
All obligations under the senior unsecured credit facility are guaranteed by substantially all of the Company's existing and future direct and indirect domestic subsidiaries.
The senior unsecured credit facility requires the Company to comply with a maximum total leverage ratio covenant and a minimum interest coverage ratio covenant, as defined in the senior unsecured credit agreement. The senior unsecured credit facility also contains certain usual and customary representations and warranties, affirmative covenants and events of default. As of
December 31, 2011
, the Company was in compliance with all financial covenant requirements.
69
DR PEPPER SNAPPLE GROUP, INC.
NOTES TO AUDITED CONSOLIDATED FINANCIAL STATEMENTS - (Continued)
Commercial Paper Program
On December 10, 2010, the Company entered into a commercial paper program under which the Company may issue unsecured commercial paper notes (the "Commercial Paper") on a private placement basis up to a maximum aggregate amount outstanding at any time of
$500 million
. The maturities of the Commercial Paper will vary, but may not exceed 364 days from the date of issue. The Company may issue Commercial Paper from time to time for general corporate purposes, and the program is supported by the Revolver. Outstanding Commercial Paper reduces the amount of borrowing capacity available under the Revolver and outstanding amounts under the Revolver reduce the Commercial Paper availability. As of
December 31, 2011
and
2010
, the Company had no outstanding Commercial Paper.
As of
December 31, 2011
, the aggregate amounts of required principal payments on long-term obligations, excluding capital leases, are as follows (in millions):
|
2012
|
$
|
450
|
|
|
2013
|
250
|
|
|
|
2014
|
—
|
|
|
|
2015
|
—
|
|
|
|
2016
|
500
|
|
|
|
Thereafter
|
1,474
|
|
|
Capital Lease Obligations
Long-term capital lease obligations totaled
$7 million
and
$10 million
as of
December 31, 2011
and
2010
,
respectively
. Current obligations related to the Company's capital leases were
$4 million
and
$3 million
as of
December 31, 2011
and
2010
, respectively, and were included as a component of other current liabilities.
Shelf Registration Statement
On November 20, 2009, the Board authorized the Company to issue up to
$1,500 million
of debt securities. Subsequently, the Company filed a "well-known seasoned issuer" shelf registration statement with the Securities and Exchange Commission, effective December 14, 2009, which registers an indeterminable amount of debt securities for future sales.
The Company issued senior unsecured notes of
$850 million
in 2009, as described in the section
"Senior Unsecured Notes — The 2011 and 2012 Notes"
above. On January 11, 2011
the Company issued senior unsecured notes of
$500 million
, as described in the section
"
Senior Unsecured Notes — The 2016 Notes"
above.
On May 18, 2011, the Board authorized an additional
$1,350 million
of debt securities. On November 15, 2011, the Company issued senior unsecured notes of
$500 million
, as described in the section "
Senior Unsecured Notes
— The 2019 and 2021 Notes"
above.
As a result,
$1,000 million
remains available for issuance.
Letters of Credit Facilities
In June 2010 and July 2011, the Company entered into letter of credit facilities in addition to the portion of the Revolver reserved for issuance of letters of credit. Under these letter of credit facilities,
$125 million
is available for the issuance of letters of credit, of which
$55 million
and
$39 million
was utilized as of
December 31, 2011
and
2010
, respectively. The balance available for additional letters of credit was
$70 million
as of
December 31, 2011
.
70
DR PEPPER SNAPPLE GROUP, INC.
NOTES TO AUDITED CONSOLIDATED FINANCIAL STATEMENTS - (Continued)
|
9.
|
Derivatives
|
DPS is exposed to market risks arising from adverse changes in:
•
interest rates;
•
foreign exchange rates; and
•
commodity prices, affecting the cost of raw materials and fuels.
The Company manages these risks through a variety of strategies, including the use of interest rate contracts, foreign exchange forward contracts, commodity forward contracts and supplier pricing agreements. DPS does not hold or issue derivative financial instruments for trading or speculative purposes.
Interest Rates
Cash Flow Hedges
During the second quarter of 2011, in order to hedge the variability in cash flows from interest rate changes associated with the Company's planned issuances of long-term debt, the Company entered into two forward starting swap agreements with an aggregate notional value of
$150 million
and one forward starting swap agreement with a notional value of
$100 million
in order to fix the rate for a portion of future seven and ten year unsecured debt issuance in 2011, respectively. These forward starting swaps were terminated during the fourth quarter of 2011 in connection with the Company's issuance of the 2019 and 2021 Notes. Upon termination, the Company paid
$25 million
to the counterparties, which will be amortized to interest expense over the life of the issued debt.
During the second quarter of 2011, the Company also entered into a forward starting swap agreement with a notional value of
$100 million
in order to fix the rate for a portion of future ten year unsecured debt issuance in 2012. This forward starting swap is expected to be unwound during 2012.
During the third quarter of 2011, in order to hedge the variability in cash flows from interest rate changes associated with the Company's planned issuances of long-term debt, the Company entered into two additional forward starting swap agreements with a notional value of
$100 million
each in order to fix the rate for a portion of future seven and ten year unsecured debt issuance in 2012. These forward starting swaps are expected to be unwound during 2012.
The effective portion of changes in the fair value of the derivative that is designated as a cash flow hedge is being recorded in AOCL and will be subsequently reclassified into earnings during the period in which the hedged forecasted transaction affects earnings. Ineffectiveness, if any, related to the Company's changes in estimates about the debt issuance related to the forward starting swap would be recognized directly in earnings as a component of interest expense during the period incurred. During the
year ended
December 31, 2011
, the Company realized no ineffectiveness as a result of these hedging relationships.
Fair Value Hedges
The Company is exposed to the risk of changes in the fair value of certain fixed-rate debt attributable to changes in interest rates and manages these risks through the use of receive-fixed, pay-variable interest rate swaps.
In December 2009, the Company entered into two interest rate swaps having an aggregate notional amount of
$850 million
and durations ranging from two to three years in order to convert fixed-rate, long-term debt to floating rate debt. These swaps were entered into upon the issuance of the 2011 and 2012 Notes, and were originally accounted for as fair value hedges and qualified for the shortcut method of accounting under U.S. GAAP.
Effective March 10, 2010,
$225 million
notional of the interest rate swap linked to the 2012 Notes was restructured to reflect a change in the variable interest rate to be paid by the Company. This change triggered the de-designation of the
$225 million
notional fair value hedge and the corresponding hedging relationship was discontinued. With the fair value hedge discontinued, the Company ceased adjusting the carrying value of the 2012 Notes corresponding to the restructured notional amounts. The
$1 million
adjustment of the carrying value of the 2012 Notes that resulted from de-designation will continue to be carried on the balance sheet and will be amortized over the remaining term of the 2012 Notes.
71
DR PEPPER SNAPPLE GROUP, INC.
NOTES TO AUDITED CONSOLIDATED FINANCIAL STATEMENTS - (Continued)
Effective September 21, 2010, the remaining
$225 million
notional interest rate swap linked to the 2012 Notes was terminated and settled, thus the corresponding hedging relationship was discontinued. With the fair value hedge discontinued, the Company ceased adjusting the carrying value of the 2012 Notes corresponding to the remaining notional amount. The
$4 million
adjustment to the carrying value of the 2012 Notes that resulted from this de-designation will continue to be carried on the balance sheet and will be amortized over the remaining term of the 2012 Notes.
As of
December 31, 2011
and
2010
, the carrying value of the 2012 Notes increased by
$2 million
and
$5 million
, respectively, which represents the unamortized value of the de-designated fair value hedges discussed above.
As of December 31,
2010
, the carrying value of the 2011 Notes increased by
$4 million
to reflect the change in value of the Company's interest rate swap agreements. Effective December 21, 2011, the
$400 million
notional interest rate swap linked to the 2011 Notes expired, thus the corresponding hedging relationship was discontinued.
In December 2010, the Company entered into an interest rate swap having a notional amount of
$100 million
and maturing in May 2038 in order to effectively convert a portion of the 2038 Notes from fixed-rate debt to floating-rate debt and designated it as a fair value hedge. The assessment of hedge effectiveness is made by comparing the cumulative change in the fair value of the hedged item attributable to changes in the benchmark interest rate with the cumulative changes in the fair value of the interest rate swap, with any ineffectiveness recorded in earnings as interest expense during the period incurred. As of
December 31, 2011
, the carrying value of the 2038 Notes increased by
$27 million
. As of December 31,
2010
, the carrying value of the 2038 Notes decreased by
$2 million
.
In November 2011, the Company entered into four interest rate swaps having an aggregate notional amount of
$250 million
and durations ranging from seven to ten years in order to convert fixed-rate, long-term debt to floating rate debt. These swaps were entered into upon the issuance of the 2019 and 2021 Notes, and were accounted for as fair value hedges and qualified for the shortcut method of accounting under U.S. GAAP.
Economic Hedges
In addition to derivative instruments that qualify for and are designated as hedging instruments under U.S. GAAP, the Company utilized various interest rate derivative contracts that were not designated as cash flow or fair value hedges to manage interest rate risk. Gains or losses on these derivative instruments were recognized in earnings during the period the instruments were outstanding.
In February 2009, the Company entered into an interest rate swap to manage its exposure to volatility in the floating interest rates on borrowings under the Term Loan A. As the Term Loan A was fully repaid
in December 2009, the underlying forecasted transaction ceased to exist and the Company de-designated the cash flow hedge as it no longer qualified for hedge accounting treatment. A portion of the original notional amount was terminated which left an interest rate swap with a
$405 million
notional amount used to economically hedge the volatility in the floating interest rate associated with borrowings under the Revolver during the first quarter of 2010. The Company terminated this interest rate swap instrument once the outstanding balance under the Revolver was fully repaid during the first quarter of 2010.
As discussed above under
"Fair Value Hedges"
, effective March 10, 2010,
$225 million
notional of the interest rate swap linked to the 2012 Notes was restructured to reflect a change in the variable interest rate to be paid by the Company. This resulted in the de-designation of the
$225 million
notional fair value hedge and the discontinuance of the corresponding fair value hedging relationship. The
$225 million
notional restructured interest rate swap was subsequently accounted for as an economic hedge. Effective September 21, 2010, the interest rate swap was terminated and settled.
In December 2010, with the expected issuance of long-term fixed rate debt, the Company entered into a treasury lock agreement with a notional value of
$200 million
and a maturity date of January 2011 to economically hedge the exposure to the possible rise in the benchmark interest rate prior to a future issuance of senior unsecured notes. This treasury lock was cash settled for approximately
$1 million
coincident with the issuance of the 2016 Notes in January 2011.
72
DR PEPPER SNAPPLE GROUP, INC.
NOTES TO AUDITED CONSOLIDATED FINANCIAL STATEMENTS - (Continued)
Foreign Exchange
Cash Flow Hedges
The Company's Canadian business purchases its inventory through transactions denominated and settled in U.S. Dollars, a currency different from the functional currency of the Canadian business. These inventory purchases are subject to exposure from movements in exchange rates. During the years ended
December 31, 2011
and
2010
, the Company utilized foreign exchange forward contracts designated as cash flow hedges to manage the exposures resulting from changes in these foreign currency exchange rates. The intent of these foreign exchange contracts is to provide predictability in the Company's overall cost structure. These foreign exchange contracts, carried at fair value, have maturities between
one
and
36
months as of
December 31, 2011
. The Company had outstanding foreign exchange forward contracts with notional amounts of
$135 million
as of
December 31, 2011
and
2010
.
Economic Hedges
During the second quarter of 2010, the Company entered into foreign exchange forward contracts not designated as cash flow hedges to manage foreign currency exposure and economically hedge the exposure from movements in exchange rates. DPS did not have any of these contracts as of
December 31, 2011
. The Company had outstanding foreign exchange forward contracts with a notional amount of
$12 million
as of
December 31, 2010
.
Commodities
DPS centrally manages the exposure to volatility in the prices of certain commodities used in its production process through forward contracts. The intent of these contracts is to provide a certain level of predictability in the Company's overall cost structure. During the years ended
December 31, 2011
and
2010
, the Company held forward contracts that economically hedged certain of its risks. In these cases, a natural hedging relationship exists in which changes in the fair value of the instruments act as an economic offset to changes in the fair value of the underlying items. Changes in the fair value of these instruments are recorded in net income throughout the term of the derivative instrument and are reported in the same line item of the Consolidated Statements of Income as the hedged transaction. Gains and losses are recognized as a component of unallocated corporate costs until the Company's operating segments are affected by the completion of the underlying transaction, at which time the gain or loss is reflected as a component of the respective segment’s operating profit ("SOP").
73
DR PEPPER SNAPPLE GROUP, INC.
NOTES TO AUDITED CONSOLIDATED FINANCIAL STATEMENTS - (Continued)
The following table summarizes the location of the fair value of the Company's derivative instruments within the Consolidated Balance Sheets as of
December 31, 2011
, and
2010
(in millions):
|
|
Balance Sheet Location
|
December 31, 2011
|
December 31, 2010
|
||||||
|
Assets:
|
|
|
|
||||||
|
Derivative instruments designated as hedging instruments under U.S. GAAP:
|
|
|
|
||||||
|
Interest rate contracts
|
Prepaid expenses and other current assets
|
$
|
8
|
|
$
|
8
|
|
||
|
Interest rate contracts
|
Other non-current assets
|
22
|
|
—
|
|
||||
|
Foreign exchange forward contracts
|
Other non-current assets
|
1
|
|
—
|
|
||||
|
Derivative instruments not designated as hedging instruments under U.S. GAAP:
|
|
|
|
||||||
|
Commodity contracts
|
Prepaid expenses and other current assets
|
—
|
|
13
|
|
||||
|
Total assets
|
|
$
|
31
|
|
$
|
21
|
|
||
|
Liabilities:
|
|
|
|
||||||
|
Derivative instruments designated as hedging instruments under U.S. GAAP:
|
|
|
|
||||||
|
Interest rate contracts
|
Other current liabilities
|
$
|
30
|
|
$
|
—
|
|
||
|
Foreign exchange forward contracts
|
Other current liabilities
|
1
|
|
2
|
|
||||
|
Interest rate contracts
|
Other non-current liabilities
|
3
|
|
6
|
|
||||
|
Derivative instruments not designated as hedging instruments under U.S. GAAP:
|
|
|
|
||||||
|
Interest rate contracts
|
Other current liabilities
|
—
|
|
1
|
|
||||
|
Commodity contracts
|
Other current liabilities
|
12
|
|
2
|
|
||||
|
Foreign exchange forward contracts
|
Other non-current liabilities
|
—
|
|
2
|
|
||||
|
Commodity contracts
|
Other non-current liabilities
|
—
|
|
1
|
|
||||
|
Total liabilities
|
|
$
|
46
|
|
$
|
14
|
|
||
74
DR PEPPER SNAPPLE GROUP, INC.
NOTES TO AUDITED CONSOLIDATED FINANCIAL STATEMENTS - (Continued)
The following table presents the impact of derivative instruments designated as cash flow hedging instruments under U.S. GAAP to the Consolidated Statements of Income and OCI for the years ended
December 31, 2011
,
2010
and
2009
(in millions):
|
|
Amount of Gain (Loss) Recognized in OCI
|
Amount of Loss Reclassified from AOCL into Income
|
Location of Loss Reclassified from AOCL into Income
|
|||||||
|
For the year ended December 31, 2011:
|
||||||||||
|
Interest rate contracts
|
$
|
(55
|
)
|
$
|
—
|
|
Interest expense
|
|||
|
Foreign exchange forward contracts
|
2
|
|
(2
|
)
|
Cost of sales
|
|||||
|
Total
|
$
|
(53
|
)
|
$
|
(2
|
)
|
||||
|
For the year ended December 31, 2010:
|
|
|
|
|||||||
|
Foreign exchange forward contracts
|
$
|
(4
|
)
|
$
|
(3
|
)
|
Cost of sales
|
|||
|
Total
|
$
|
(4
|
)
|
$
|
(3
|
)
|
|
|||
|
For the year ended December 31, 2009:
|
||||||||||
|
Interest rate contracts
|
$
|
(14
|
)
|
$
|
(46
|
)
|
Interest expense
|
|||
|
Foreign exchange forward contracts
|
(6
|
)
|
(3
|
)
|
Cost of sales
|
|||||
|
Total
|
$
|
(20
|
)
|
$
|
(49
|
)
|
||||
There was no hedge ineffectiveness recognized in earnings for the years ended
December 31, 2011
,
2010
and 2009 with respect to derivative instruments designated as cash flow hedges. During the next 12 months, the Company expects to reclassify net losses of
$3 million
from AOCL into net income.
The following table presents the impact of derivative instruments designated as fair value hedging instruments under U.S. GAAP to the Consolidated Statements of Income for the years ended
December 31, 2011
,
2010
and 2009 (in millions):
|
|
Amount of Gain
|
Location of Gain
|
||||
|
|
Recognized in Income
|
Recognized in Income
|
||||
|
For the year ended December 31, 2011:
|
||||||
|
Interest rate contracts
|
$
|
11
|
|
Interest expense
|
||
|
Total
|
$
|
11
|
|
|
||
|
For the year ended December 31, 2010:
|
||||||
|
Interest rate contracts
|
$
|
6
|
|
Interest expense
|
||
|
Total
|
$
|
6
|
|
|||
|
For the year ended December 31, 2009:
|
||||||
|
Interest rate contracts
|
$
|
—
|
|
Interest expense
|
||
|
Total
|
$
|
—
|
|
|||
For the
year ended
December 31, 2011
,
$1 million
of hedge ineffectiveness was recorded in earnings for the period. For the years ended
December 31, 2010
and 2009, there was no ineffectiveness recorded in earnings for the period.
75
DR PEPPER SNAPPLE GROUP, INC.
NOTES TO AUDITED CONSOLIDATED FINANCIAL STATEMENTS - (Continued)
The following table presents the impact of derivative instruments not designated as hedging instruments under U.S. GAAP to the Consolidated Statements of Income for the years ended
December 31, 2011
,
2010
and
2009
(in millions):
|
|
Amount of Gain (Loss)
|
Location of Gain (Loss)
|
||||
|
|
Recognized in Income
|
Recognized in Income
|
||||
|
For the year ended December 31, 2011:
|
||||||
|
Commodity contracts
|
$
|
(15
|
)
|
Cost of sales
|
||
|
Commodity contracts
|
2
|
|
Selling, general and administrative expenses
|
|||
|
Total
|
$
|
(13
|
)
|
|
||
|
For the year ended December 31, 2010:
|
||||||
|
Interest rate contracts
|
$
|
7
|
|
Interest expense
|
||
|
Commodity contracts
|
(2
|
)
|
Cost of sales
|
|||
|
Commodity contracts
|
2
|
|
Selling, general and administrative expenses
|
|||
|
Total
|
$
|
7
|
|
|
||
|
For the year ended December 31, 2009:
|
||||||
|
Commodity contracts
|
$
|
5
|
|
Cost of sales
|
||
|
Commodity contracts
|
2
|
|
Selling, general and administrative expenses
|
|||
|
Total
|
$
|
7
|
|
|||
Refer to Note 12 for more information on the valuation of derivative instruments. The Company has exposure to credit losses from derivative instruments in an asset position in the event of nonperformance by the counterparties to the agreements. Historically, DPS has not experienced credit losses as a result of counterparty nonperformance. The Company selects and periodically reviews counterparties based on credit ratings, limits its exposure to a single counterparty under defined guidelines, and monitors the market position of the programs at least on a quarterly basis.
76
DR PEPPER SNAPPLE GROUP, INC.
NOTES TO AUDITED CONSOLIDATED FINANCIAL STATEMENTS - (Continued)
|
10.
|
Other Non-Current Assets and Other Non-Current Liabilities
|
The table below details the components of other non-current assets and other non-current liabilities as of
December 31, 2011
, and
2010
(in millions):
|
|
December 31,
|
December 31,
|
|||||
|
2011
|
2010
|
||||||
|
Other non-current assets:
|
|
|
|||||
|
Long-term receivables from Kraft
|
$
|
430
|
|
$
|
419
|
|
|
|
Deferred financing costs, net
|
15
|
|
15
|
|
|||
|
Customer incentive programs
|
82
|
|
84
|
|
|||
|
Derivative instruments
|
23
|
|
—
|
|
|||
|
Other
|
23
|
|
34
|
|
|||
|
Total other non-current assets
|
$
|
573
|
|
$
|
552
|
|
|
|
Other non-current liabilities:
|
|
|
|||||
|
Long-term payables due to Kraft
|
$
|
102
|
|
$
|
112
|
|
|
|
Liabilities for unrecognized tax benefits and other tax related items
|
567
|
|
561
|
|
|||
|
Long-term pension and postretirement liability
|
44
|
|
19
|
|
|||
|
Insurance reserves
|
54
|
|
51
|
|
|||
|
Other
|
47
|
|
34
|
|
|||
|
Total other non-current liabilities
|
$
|
814
|
|
$
|
777
|
|
|
|
11.
|
Income Taxes
|
Income before provision for income taxes and equity in earnings of unconsolidated subsidiaries was as follows (in millions):
|
|
For the Year Ended December 31,
|
||||||||||
|
|
2011
|
2010
|
2009
|
||||||||
|
U.S.
|
$
|
832
|
|
$
|
748
|
|
$
|
784
|
|
||
|
Non-U.S.
|
93
|
|
73
|
|
84
|
|
|||||
|
Total
|
$
|
925
|
|
$
|
821
|
|
$
|
868
|
|
||
The provision for income taxes attributable to continuing operations has the following components (in millions):
111
|
|
For the Year Ended December 31,
|
||||||||||
|
|
2011
|
2010
|
2009
|
||||||||
|
Current:
|
|
|
|
|
|
|
|||||
|
Federal
|
$
|
686
|
|
$
|
192
|
|
$
|
194
|
|
||
|
State
|
114
|
|
28
|
|
22
|
|
|||||
|
Non-U.S.
|
18
|
|
30
|
|
12
|
|
|||||
|
Total current provision
|
818
|
|
250
|
|
228
|
|
|||||
|
Deferred:
|
|
|
|
||||||||
|
Federal
|
(425
|
)
|
33
|
|
71
|
|
|||||
|
State
|
(83
|
)
|
22
|
|
(1
|
)
|
|||||
|
Non-U.S.
|
10
|
|
(11
|
)
|
17
|
|
|||||
|
Total deferred provision
|
(498
|
)
|
44
|
|
87
|
|
|||||
|
Total provision for income taxes
|
$
|
320
|
|
$
|
294
|
|
$
|
315
|
|
||
77
DR PEPPER SNAPPLE GROUP, INC.
NOTES TO AUDITED CONSOLIDATED FINANCIAL STATEMENTS - (Continued)
The following is a reconciliation of provision for income taxes computed at the U.S. federal statutory tax rate to the provision for income taxes reported in the Consolidated Statements of Income (in millions):
|
|
For the Year Ended December 31,
|
||||||||||
|
|
2011
|
2010
|
2009
|
||||||||
|
Statutory federal income tax of 35%
|
$
|
324
|
|
$
|
287
|
|
$
|
304
|
|
||
|
State income taxes, net
|
25
|
|
30
|
|
30
|
|
|||||
|
U.S. federal domestic manufacturing benefit
|
(30
|
)
|
(18
|
)
|
(9
|
)
|
|||||
|
Impact of non-U.S. operations
|
(5
|
)
|
(8
|
)
|
(14
|
)
|
|||||
|
Indemnified taxes
(1)
|
11
|
|
10
|
|
17
|
|
|||||
|
Other
(2)
|
(5
|
)
|
(7
|
)
|
(13
|
)
|
|||||
|
Total provision for income taxes
|
$
|
320
|
|
$
|
294
|
|
$
|
315
|
|
||
|
Effective tax rate
|
34.6
|
%
|
35.8
|
%
|
36.3
|
%
|
|||||
____________________________
|
(1)
|
Amounts represent tax expense recorded by the Company for which Kraft is obligated to indemnify DPS under the Tax Indemnity Agreement.
|
|
(2)
|
Included in other items was
$3 million
and
$(5) million
of non-indemnified tax expense (benefit) the Company recorded in the years ended
December 31, 2010
and
2009
, respectively, driven by separation related transactions. There was no non-indemnified tax expense or benefit recorded for the year ended
December 31, 2011
.
|
The effective tax rates for
2011
and
2010
were
34.6%
and
35.8%
, respectively. The decrease in the effective tax rate for the year ended
December 31, 2011
was primarily driven by certain state and federal income tax benefits, principally the domestic manufacturing deduction, related to the PepsiCo and Coca-Cola licensing agreements executed in
2010
. The impact of these benefits decreased the provision for income taxes and the effective tax rate by
$19 million
and
2.1%
, respectively. These benefits will not recur beyond
2011
. The provision for income taxes for the year ended
December 31, 2010
included a
$14 million
benefit due to a favorable change of Mexican tax law.
Deferred income taxes reflect the tax consequences on future years of temporary differences between the tax basis of assets and liabilities and their financial reporting basis using enacted tax rates in effect for the year in which the temporary differences are expected to reverse.
78
DR PEPPER SNAPPLE GROUP, INC.
NOTES TO AUDITED CONSOLIDATED FINANCIAL STATEMENTS - (Continued)
Deferred tax assets (liabilities), as determined under U.S. GAAP, were comprised of the following as of
December 31, 2011
and
2010
(in millions):
|
|
December 31,
|
December 31,
|
|||||
|
|
2011
|
2010
|
|||||
|
Deferred income tax assets:
|
|
|
|
|
|||
|
Deferred revenue
|
$
|
580
|
|
$
|
13
|
|
|
|
Accrued liabilities
|
88
|
|
73
|
|
|||
|
Net operating loss and credit carryforwards
|
32
|
|
18
|
|
|||
|
Compensation
|
22
|
|
23
|
|
|||
|
Pension and postretirement benefits
|
14
|
|
4
|
|
|||
|
Inventory
|
14
|
|
11
|
|
|||
|
Other
|
67
|
|
53
|
|
|||
|
|
817
|
|
195
|
|
|||
|
Deferred income tax liabilities:
|
|
|
|||||
|
Intangible assets
|
(942
|
)
|
(888
|
)
|
|||
|
Fixed assets
|
(197
|
)
|
(164
|
)
|
|||
|
Other
|
(5
|
)
|
(9
|
)
|
|||
|
|
(1,144
|
)
|
(1,061
|
)
|
|||
|
Valuation allowance
|
(32
|
)
|
(16
|
)
|
|||
|
Net deferred income tax liability
|
$
|
(359
|
)
|
$
|
(882
|
)
|
|
The Company recorded a significant U.S. deferred tax asset of
$568 million
during
2011
with respect to the PepsiCo and Coca-Cola deferred revenue balance as of
December 31, 2011
. This deferred revenue was recognized in total in
2011
for income tax purposes, while it is being amortized into revenue over the the remaining estimated life of the customer relationship under U.S. GAAP. Conversely, the income tax recognition of this deferred revenue significantly increased our current tax expense and taxes payable. The majority of the Company's income taxes payable at
December 31, 2011
will be paid in the first quarter of 2012.
The Company's Canadian deferred tax assets included a separation related balance of
$118 million
that was offset by a liability due to Cadbury o
f
$109 million
driven by the Tax Indemnity Agreement. Anticipated legislation in Canada could result in a future partial write down of tax assets which would be offset to some extent by a partial write down of the liability due to Cadbury.
As of
December 31, 2011
, the Company had
$32 million
in tax effected credit carryforwards and net operating loss carryforwards. Net operating loss and credit carryforwards will expire in periods beyond the next five years.
The Company had a deferred tax valuation allowance of
$32 million
and
$16 million
as of
December 31, 2011
and
2010
, respectively.
A valuation allowance of
$13 million
relates to a foreign operation and was established as part of the separation transaction. The remaining
$19 million
valuation allowance relates to foreign tax credits generated in
2011
. The Company provided a full valuation allowance on the deferred tax asset related to the foreign tax credits as the Company does not believe that the benefits will be realized in future years.
As of
December 31, 2011
and
2010
, undistributed earnings considered to be permanently reinvested in non-U.S. subsidiaries totaled approximately
$244 million
and
$203 million
, respectively. Deferred income taxes have not been provided on this income as the Company believes these earnings to be permanently reinvested. It is not practicable to estimate the amount of additional tax that might be payable on these undistributed foreign earnings.
The Company files income tax returns for U.S. federal purposes and in various state jurisdictions. The Company also files income tax returns in various foreign jurisdictions, principally Canada and Mexico. The U.S. and most state income tax returns for years prior to 2006 are considered closed to examination by applicable tax authorities. Federal income tax returns for 2006, 2007 and 2008 are currently under examination by the Internal Revenue Service. Canadian income tax returns are open for audit for tax years 2008 and forward and Mexican income tax returns are open for tax years 2000 and forward.
79
DR PEPPER SNAPPLE GROUP, INC.
NOTES TO AUDITED CONSOLIDATED FINANCIAL STATEMENTS - (Continued)
Kraft acquired Cadbury on February 2, 2010 and, therefore, assumes responsibility for Cadbury's indemnity obligations under the terms of the Tax Indemnity Agreement. Under the Tax Indemnity Agreement, Kraft will indemnify DPS for net unrecognized tax benefits and other tax related items of
$430 million
. This balance increased by
$11 million
during
2011
and was offset by indemnity income recorded as a component of other income, net in the Consolidated Statements of Income. In addition, pursuant to the terms of the Tax Indemnity Agreement, if DPS breaches certain covenants or other obligations or DPS is involved in certain change-in-control transactions, Kraft may not be required to indemnify the Company.
The following is a reconciliation of the changes in the gross balance of unrecognized tax benefits for the three years ended
December 31, 2011
,
2010
and
2009
(in millions):
|
December 31,
|
December 31,
|
December 31,
|
|||||||||
|
2011
|
2010
|
2009
|
|||||||||
|
Beginning Balance
|
$
|
490
|
|
$
|
483
|
|
$
|
483
|
|
||
|
Increases related to tax positions taken during the current year
|
—
|
|
3
|
|
5
|
|
|||||
|
Increases related to tax positions taken during the prior year
|
1
|
|
18
|
|
21
|
|
|||||
|
Decreases related to tax positions taken during the prior year
|
(7
|
)
|
(6
|
)
|
(14
|
)
|
|||||
|
Decreases related to settlements with taxing authorities
|
—
|
|
—
|
|
(4
|
)
|
|||||
|
Decreases related to lapse of applicable statute of limitations
|
(4
|
)
|
(8
|
)
|
(8
|
)
|
|||||
|
Ending Balance
|
$
|
480
|
|
$
|
490
|
|
$
|
483
|
|
||
The gross balance of unrecognized tax benefits of
$480 million
excluded
$38 million
of offsetting state tax benefits and timing adjustments. Depending on how associated issues are resolved, the net unrecognized tax benefits of
$442 million
, if recognized, may reduce the effective income tax rate. It is reasonably possible that the unrecognized tax benefits will be impacted by the resolution of some matters audited by various taxing authorities within the next twelve months, but a reasonable estimate of such impact can not be made at this time.
The Company accrues interest and penalties on its uncertain tax positions as a component of its provision for income taxes. The amount of interest and penalties recognized in the Consolidated Statements of Income for uncertain tax positions was
$21 million
,
$20 million
and
$19 million
for
2011
,
2010
and
2009
, respectively. The Company had a total of
$92 million
and
$71 million
accrued for interest and penalties for its uncertain tax positions reported as part of other non-current liabilities as of
December 31, 2011
and
2010
, respectively.
80
DR PEPPER SNAPPLE GROUP, INC.
NOTES TO AUDITED CONSOLIDATED FINANCIAL STATEMENTS - (Continued)
|
12.
|
Fair Value of Financial Instruments
|
Under U.S. GAAP, fair value is defined as the price that would be received to sell an asset or paid to transfer a liability in an orderly transaction between market participants at the measurement date. U.S. GAAP provides a framework for measuring fair value and establishes a three-level hierarchy for fair value measurements based upon the transparency of inputs to the valuation of an asset or liability. The three-level hierarchy for disclosure of fair value measurements is as follows:
Level 1
- Quoted market prices in active markets for identical assets or liabilities.
Level 2
- Observable inputs such as quoted prices for similar assets or liabilities in active markets; quoted prices for identical or similar assets or liabilities in markets that are not active; and model-derived valuations in which all significant inputs and significant value drivers are observable in active markets.
Level 3
- Valuations with one or more unobservable significant inputs that reflect the reporting entity's own assumptions.
The following table presents the fair value hierarchy for those assets and liabilities measured at fair value on a recurring basis as of
December 31, 2011
(in millions):
|
|
Fair Value Measurements at Reporting Date Using
|
||||||||||
|
|
Quoted Prices in Active Markets for Identical Assets
|
Significant Other Observable Inputs
|
Significant Unobservable Inputs
|
||||||||
|
|
Level 1
|
Level 2
|
Level 3
|
||||||||
|
Interest rate contracts
|
$
|
—
|
|
$
|
30
|
|
$
|
—
|
|
||
|
Foreign exchange forward contracts
|
—
|
|
1
|
|
—
|
|
|||||
|
Total assets
|
$
|
—
|
|
$
|
31
|
|
$
|
—
|
|
||
|
Commodity contracts
|
$
|
—
|
|
$
|
12
|
|
$
|
—
|
|
||
|
Interest rate contracts
|
—
|
|
33
|
|
—
|
|
|||||
|
Foreign exchange forward contracts
|
—
|
|
1
|
|
—
|
|
|||||
|
Total liabilities
|
$
|
—
|
|
$
|
46
|
|
$
|
—
|
|
||
81
DR PEPPER SNAPPLE GROUP, INC.
NOTES TO AUDITED CONSOLIDATED FINANCIAL STATEMENTS - (Continued)
The following table presents the fair value hierarchy for those assets and liabilities measured at fair value on a recurring basis as of
December 31, 2010
(in millions):
|
|
Fair Value Measurements at Reporting Date Using
|
||||||||||
|
|
Quoted Prices in Active Markets for Identical Assets
|
Significant Other Observable Inputs
|
Significant Unobservable Inputs
|
||||||||
|
|
Level 1
|
Level 2
|
Level 3
|
||||||||
|
Commodity contracts
|
$
|
—
|
|
$
|
13
|
|
$
|
—
|
|
||
|
Interest rate contracts
|
—
|
|
8
|
|
—
|
|
|||||
|
Total assets
|
$
|
—
|
|
$
|
21
|
|
$
|
—
|
|
||
|
Commodity contracts
|
$
|
—
|
|
$
|
3
|
|
$
|
—
|
|
||
|
Interest rate contracts
|
—
|
|
7
|
|
—
|
|
|||||
|
Foreign exchange forward contracts
|
—
|
|
4
|
|
—
|
|
|||||
|
Total liabilities
|
$
|
—
|
|
$
|
14
|
|
$
|
—
|
|
||
The fair values of commodity forward contracts, interest rate swap contracts and foreign currency forward contracts are determined based on inputs that are readily available in public markets or can be derived from information available in publicly quoted markets. The fair value of commodity forward contracts are valued using the market approach based on observable market transactions at the reporting date. Interest rate swap contracts are valued using models based on readily observable market parameters for all substantial terms of the Company's contracts and credit risk of the counterparties. The fair value of foreign currency forward contracts are valued using quoted forward foreign exchange prices at the reporting date. Therefore, the Company has categorized these contracts as Level 2.
As of
December 31, 2011
, and
2010
, the Company did not have any assets or liabilities without observable market values that would require a high level of judgment to determine fair value (Level 3).
There were no transfers of financial instruments between the three levels of fair value hierarchy during the
year ended
December 31, 2011
.
The estimated fair values of other financial liabilities not measured at fair value on a recurring basis as of
December 31, 2011
, and
2010
, are as follows (in millions):
|
|
December 31, 2011
|
December 31, 2010
|
|||||||||||||
|
|
Carrying Amount
|
Fair Value
|
Carrying Amount
|
Fair Value
|
|||||||||||
|
Long term debt – 2011 Notes
(1)
|
$
|
—
|
|
$
|
—
|
|
$
|
404
|
|
$
|
403
|
|
|||
|
Long term debt – 2012 Notes
(1)
|
452
|
|
457
|
|
455
|
|
460
|
|
|||||||
|
Long term debt – 2013 Notes
|
250
|
|
267
|
|
250
|
|
276
|
|
|||||||
|
Long term debt – 2016 Notes
|
500
|
|
521
|
|
—
|
|
—
|
|
|||||||
|
Long term debt – 2018 Notes
|
724
|
|
882
|
|
724
|
|
861
|
|
|||||||
|
Long term debt – 2019 Notes
(1)
|
250
|
|
249
|
|
—
|
|
—
|
|
|||||||
|
Long term debt – 2021 Notes
(1)
|
249
|
|
250
|
|
—
|
|
—
|
|
|||||||
|
Long term debt – 2038 Notes
(1)
|
276
|
|
353
|
|
248
|
|
308
|
|
|||||||
____________________________
|
(1)
|
The carrying amount includes adjustments related to the change in the fair value of interest rate swaps designated as fair value hedges on the 2011, 2012, 2019, 2021 and 2038 Notes. See Note 9 for further information regarding derivatives.
|
Capital leases have been excluded from the calculation of fair value for both
2011
and
2010
.
82
DR PEPPER SNAPPLE GROUP, INC.
NOTES TO AUDITED CONSOLIDATED FINANCIAL STATEMENTS - (Continued)
The fair value of long term debt as of
December 31, 2011
and
2010
was estimated based on quoted market prices for publicly traded securities. The difference between the fair value and the carrying value represents the theoretical net premium or discount that would be paid or received to retire all debt at such date.
|
13.
|
Employee Benefit Plans
|
Pension and Postretirement Plans
Overview
The Company has U.S. and foreign pension and postretirement medical plans which provide benefits to a defined group of employees. The Company has several non-contributory defined benefit plans and postretirement medical plans, each having a measurement date of December 31. To participate in the defined benefit plans, eligible employees must have been employed by the Company for at least one year. The postretirement benefits are limited to qualified expenses and are subject to deductibles, co-payment provisions, and other provisions. Employee benefit plan obligations and expenses included in our Audited Consolidated Financial Statements are determined using actuarial analyses based on plan assumptions including employee demographic data such as years of service and compensation, benefits and claims paid and employer contributions, among others. The Company also participates in various multi-employer defined benefit plans.
In 2008, DPS' Compensation Committee approved the suspension of two of the Company's principal defined benefit pension plans, which are cash balance plans. The cash balance plans maintain individual recordkeeping accounts for each participant which are annually credited with interest credits equal to the 12-month average of one-year U.S. Treasury Bill rates, plus
1%
, with a required minimum rate of
5%
. Effective December 31, 2008, participants in the plans no longer earned additional benefits for future services or salary increases. However, effective January 1, 2009, current participants were eligible for an enhanced defined contribution (the "EDC") within DPS’ Savings Incentive Plan (the "SIP").
During 2010, the Company approved and communicated various changes to certain U.S. postretirement medical plans. The Company provides a subsidy to eligible participants who have reached the age of 65, which replaced certain current retiree medical plans and could be used to help pay for qualified medical expenses. These changes were effective beginning January 1, 2011, for all Medicare eligible retirees and their Medicare eligible dependents formerly covered by certain postretirement medical plans sponsored by the Company. As a result of these changes, the Company recognized a one-time curtailment gain of
$8 million
during the year ended December 31, 2010, representing the immediate recognition of previously unamortized prior service credits.
During the years ended
December 31, 2011
,
2010
and
2009
,
the total amount of lump sum payments made to participants of various U.S. defined pension plans exceeded the estimated annual interest and service costs. As a result, non-cash settlement charges of
$3 million
,
$5 million
and
$3 million
were recognized for the years ended
December 31, 2011
,
2010
and
2009
, respectively.
U.S. GAAP Changes
On December 31, 2009, the Company adopted the enhanced disclosure requirements required by U.S. GAAP related to employers' disclosures about pensions and other postretirement benefits. This requirement includes enhanced disclosures about the plan assets of a company's defined benefit pension and other postretirement medical plans. These disclosures are intended to provide users of financial statements with a greater understanding of: (1) how investment allocation decisions are made, including the factors that are pertinent to an understanding of investment policies and strategies; (2) the major categories of plan assets; (3) the inputs and valuation techniques used to measure the fair value of plan assets; (4) the effect of fair value measurements using significant unobservable inputs (Level 3) on changes in plan assets for the period; and (5) significant concentrations of credit risk within plan assets. The adoption of the guidance is disclosure related only, therefore it did not impact the Company's results of operations or financial position. The plans do not currently hold any assets that are Level 3 and there are no significant concentrations of credit risk within the plan assets as of
December 31, 2011
and
2010
. Refer to Note 12 for a description of the fair value hierarchy levels 1, 2, and 3.
83
DR PEPPER SNAPPLE GROUP, INC.
NOTES TO AUDITED CONSOLIDATED FINANCIAL STATEMENTS - (Continued)
Effective December 31, 2009, the Company also adopted the U.S. GAAP guidance on how companies should estimate the fair value of certain alternative investments and allows companies to use Net Asset Value (NAV) as a practical expedient in determining fair value. Approximately
$66 million
and
$87 million
of pension and postretirement benefit plan assets reflected were valued using NAV as of
December 31, 2011
and
2010
, respectively.
Effective December 31, 2011, the Company adopted the additional disclosure requirements required by U.S. GAAP related to
an employer's participation in a multi-employer pension plan. Those additional disclosure requirements provide more detailed information about multi-employer plans, including: (1) the significant multi-employer plans in which an employer participates; (2) the level of an employer's participation in the significant multi-employer plans; (3) the financial health of the significant multi-employer plans; and (4) the nature of the employer commitments to the significant multi-employer plans.
The adoption of the guidance is disclosure related only, therefore it did not impact the Company's results of operations or financial position.
The total pension and postretirement net periodic benefit costs recorded in the Company's Consolidated Statements of Income for the years ended
December 31, 2011
,
2010
and
2009
were as follows (in millions):
|
|
For the Year Ended December 31,
|
||||||||||
|
|
2011
|
2010
|
2009
|
||||||||
|
Total net periodic benefit costs
|
|
|
|
|
|
|
|||||
|
Pension plans
|
$
|
7
|
|
$
|
9
|
|
$
|
11
|
|
||
|
Postretirement medical plans
|
(1
|
)
|
(7
|
)
|
3
|
|
|||||
|
Total
|
$
|
6
|
|
$
|
2
|
|
$
|
14
|
|
||
84
DR PEPPER SNAPPLE GROUP, INC.
NOTES TO AUDITED CONSOLIDATED FINANCIAL STATEMENTS - (Continued)
The following tables set forth amounts recognized in the Company's financial statements and the plans' funded status for the years ended
December 31, 2011
and
2010
(in millions):
|
|
|
Postretirement
|
|||||||||||||
|
|
Pension Plans
|
Medical Plans
|
|||||||||||||
|
|
2011
|
2010
|
2011
|
2010
|
|||||||||||
|
Projected Benefit Obligations
|
|
|
|
|
|
|
|
|
|||||||
|
As of beginning of year
|
$
|
245
|
|
$
|
253
|
|
$
|
9
|
|
$
|
24
|
|
|||
|
Service cost
|
2
|
|
2
|
|
—
|
|
1
|
|
|||||||
|
Interest cost
|
14
|
|
14
|
|
1
|
|
1
|
|
|||||||
|
Actuarial loss (gain)
|
35
|
|
4
|
|
1
|
|
(1
|
)
|
|||||||
|
Benefits paid
|
(9
|
)
|
(8
|
)
|
(1
|
)
|
(2
|
)
|
|||||||
|
Currency exchange adjustments
|
(2
|
)
|
1
|
|
—
|
|
—
|
|
|||||||
|
Plan mergers
|
6
|
|
—
|
|
—
|
|
—
|
|
|||||||
|
Plan amendments
|
—
|
|
—
|
|
—
|
|
(14
|
)
|
|||||||
|
Settlements
|
(13
|
)
|
(21
|
)
|
—
|
|
—
|
|
|||||||
|
As of end of year
|
$
|
278
|
|
$
|
245
|
|
$
|
10
|
|
$
|
9
|
|
|||
|
Fair Value of Plan Assets
|
|
|
|
|
|||||||||||
|
As of beginning of year
|
$
|
234
|
|
$
|
223
|
|
$
|
5
|
|
$
|
5
|
|
|||
|
Actual return on plan assets
|
23
|
|
25
|
|
—
|
|
1
|
|
|||||||
|
Employer contributions
|
2
|
|
14
|
|
1
|
|
1
|
|
|||||||
|
Benefits paid
|
(9
|
)
|
(8
|
)
|
(1
|
)
|
(2
|
)
|
|||||||
|
Currency exchange adjustments
|
(1
|
)
|
1
|
|
—
|
|
—
|
|
|||||||
|
Plan mergers
|
3
|
|
—
|
|
—
|
|
—
|
|
|||||||
|
Settlements
|
(13
|
)
|
(21
|
)
|
—
|
|
—
|
|
|||||||
|
As of end of year
|
$
|
239
|
|
$
|
234
|
|
$
|
5
|
|
$
|
5
|
|
|||
|
Funded status of plan / net amount recognized
|
$
|
(39
|
)
|
$
|
(11
|
)
|
$
|
(5
|
)
|
$
|
(4
|
)
|
|||
|
Funded status — overfunded
|
$
|
1
|
|
$
|
2
|
|
$
|
2
|
|
$
|
2
|
|
|||
|
Funded status — underfunded
|
(40
|
)
|
(13
|
)
|
(7
|
)
|
(6
|
)
|
|||||||
|
Net amount recognized consists of:
|
|
|
|
|
|||||||||||
|
Non-current assets
|
$
|
1
|
|
$
|
2
|
|
$
|
2
|
|
$
|
2
|
|
|||
|
Current liabilities
|
(1
|
)
|
(1
|
)
|
(1
|
)
|
—
|
|
|||||||
|
Non-current liabilities
|
(39
|
)
|
(12
|
)
|
(6
|
)
|
(6
|
)
|
|||||||
|
Net amount recognized
|
$
|
(39
|
)
|
$
|
(11
|
)
|
$
|
(5
|
)
|
$
|
(4
|
)
|
|||
The accumulated benefit obligations for the defined benefit pension plans were
$273 million
and
$240 million
as of
December 31, 2011
and
2010
, respectively. The pension plan assets and the projected benefit obligations of DPS' U.S. plans represent approximately
94%
and
92%
of the total plan assets and the total projected benefit obligation, respectively, of all plans combined as of
December 31, 2011
. The following table summarizes key pension plan information regarding plans whose accumulated benefit obligations exceed the fair value of their respective plan assets (in millions):
|
|
2011
|
2010
|
|||||
|
Aggregate projected benefit obligation
|
$
|
275
|
|
$
|
241
|
|
|
|
Aggregate accumulated benefit obligation
|
273
|
|
240
|
|
|||
|
Aggregate fair value of plan assets
|
236
|
|
230
|
|
|||
85
DR PEPPER SNAPPLE GROUP, INC.
NOTES TO AUDITED CONSOLIDATED FINANCIAL STATEMENTS - (Continued)
The following table summarizes the components of the net periodic benefit cost and changes in plan assets and benefit obligations recognized in OCI for the stand alone U.S. and foreign plans for the years ended
December 31, 2011
,
2010
and
2009
(in millions):
|
|
|
Postretirement
|
|||||||||||||||||||||
|
|
Pension Plans
|
Medical Plans
|
|||||||||||||||||||||
|
|
For the Year Ended December 31,
|
||||||||||||||||||||||
|
|
2011
|
2010
|
2009
|
2011
|
2010
|
2009
|
|||||||||||||||||
|
Net Periodic Benefit Costs
|
|
|
|
|
|
|
|
|
|
|
|
|
|||||||||||
|
Service cost
|
$
|
2
|
|
$
|
2
|
|
$
|
1
|
|
$
|
—
|
|
$
|
1
|
|
$
|
1
|
|
|||||
|
Interest cost
|
14
|
|
14
|
|
15
|
|
1
|
|
1
|
|
2
|
|
|||||||||||
|
Expected return on assets
|
(15
|
)
|
(16
|
)
|
(13
|
)
|
—
|
|
—
|
|
—
|
|
|||||||||||
|
Amortization of actuarial loss
|
3
|
|
4
|
|
5
|
|
—
|
|
—
|
|
—
|
|
|||||||||||
|
Amortization of prior service cost
|
—
|
|
—
|
|
—
|
|
(2
|
)
|
(1
|
)
|
—
|
|
|||||||||||
|
Curtailments
|
—
|
|
—
|
|
—
|
|
—
|
|
(8
|
)
|
—
|
|
|||||||||||
|
Settlements
|
3
|
|
5
|
|
3
|
|
—
|
|
—
|
|
—
|
|
|||||||||||
|
Net periodic benefit costs
|
$
|
7
|
|
$
|
9
|
|
$
|
11
|
|
$
|
(1
|
)
|
$
|
(7
|
)
|
$
|
3
|
|
|||||
|
Changes Recognized in OCI
|
|
|
|
|
|
|
|||||||||||||||||
|
Curtailment effects
|
$
|
—
|
|
$
|
—
|
|
$
|
—
|
|
$
|
—
|
|
$
|
8
|
|
$
|
—
|
|
|||||
|
Settlement effects
|
(3
|
)
|
(5
|
)
|
(3
|
)
|
—
|
|
—
|
|
—
|
|
|||||||||||
|
Current year actuarial (gain) loss
|
27
|
|
(5
|
)
|
—
|
|
—
|
|
(1
|
)
|
(3
|
)
|
|||||||||||
|
Recognition of actuarial loss
|
(3
|
)
|
(4
|
)
|
(4
|
)
|
—
|
|
—
|
|
—
|
|
|||||||||||
|
Recognition of current year prior service credit
|
—
|
|
—
|
|
—
|
|
—
|
|
(14
|
)
|
—
|
|
|||||||||||
|
Recognition of prior service cost
|
—
|
|
—
|
|
—
|
|
2
|
|
1
|
|
—
|
|
|||||||||||
|
Plan merger
|
3
|
|
—
|
|
—
|
|
—
|
|
—
|
|
—
|
|
|||||||||||
|
Total recognized in OCI
|
$
|
24
|
|
$
|
(14
|
)
|
$
|
(7
|
)
|
$
|
2
|
|
$
|
(6
|
)
|
$
|
(3
|
)
|
|||||
The estimated net actuarial loss for the defined benefit plans that will be amortized from AOCL into periodic benefit cost in
2012
is approximately
$4 million
.
The estimated prior service cost for the defined benefit plans that will be amortized from AOCL into periodic benefit costs in
2012
is a benefit of approximately
$1 million
.
The following table summarizes amounts included in AOCL for the plans as of
December 31, 2011
and
2010
(in millions):
|
|
|
Postretirement
|
|||||||||||||
|
|
Pension Plans
|
Medical Plans
|
|||||||||||||
|
|
2011
|
2010
|
2011
|
2010
|
|||||||||||
|
Prior service cost (gains)
|
$
|
3
|
|
$
|
1
|
|
$
|
(6
|
)
|
$
|
(7
|
)
|
|||
|
Net losses
|
70
|
|
48
|
|
5
|
|
4
|
|
|||||||
|
Amounts in AOCL
|
$
|
73
|
|
$
|
49
|
|
$
|
(1
|
)
|
$
|
(3
|
)
|
|||
The following table summarizes the contributions made to the Company's pension and other postretirement benefit plans for the years ended
December 31, 2011
and
2010
, as well as the projected contributions for the year ending December 31, 2012 (in millions):
|
|
Projected
|
Actual
|
|||||||||
|
|
2012
|
2011
|
2010
|
||||||||
|
Pension plans
|
$
|
1
|
|
$
|
2
|
|
$
|
14
|
|
||
|
Postretirement medical plans
|
1
|
|
1
|
|
1
|
|
|||||
|
Total
|
$
|
2
|
|
$
|
3
|
|
$
|
15
|
|
||
86
DR PEPPER SNAPPLE GROUP, INC.
NOTES TO AUDITED CONSOLIDATED FINANCIAL STATEMENTS - (Continued)
The following table summarizes the expected future benefit payments cash activity for the Company's pension and postretirement medical plans in the future (in millions):
|
|
2012
|
2013
|
2014
|
2015
|
2016
|
2017-2021
|
|||||||||||||||||
|
Pension plans
|
$
|
16
|
|
$
|
18
|
|
$
|
18
|
|
$
|
19
|
|
$
|
17
|
|
$
|
104
|
|
|||||
|
Postretirement medical plans
|
1
|
|
1
|
|
1
|
|
1
|
|
1
|
|
3
|
|
|||||||||||
Actuarial Assumptions
The Company's pension expense was calculated based upon a number of actuarial assumptions including discount rate, retirement age, compensation rate increases, expected long-term rate of return on plan assets for pension benefits and the healthcare cost trend rate related to its postretirement medical plans.
The discount rate utilized to determine the Company's projected benefit obligations as of
December 31, 2011
and
2010
, as well as projected
2012
net periodic benefit cost for U.S. plans, reflects the current rate at which the associated liabilities could be effectively settled as of the end of the year. The Company set its rate to reflect the yield of a portfolio of high quality, fixed-income debt instruments that would produce cash flows sufficient in timing and amount to settle projected future benefits.
For the year ended
December 31, 2011
and
2010
, the expected long-term rate of return on U.S. pension fund assets held by the Company's pension trusts was determined based on several factors, including the impact of active portfolio management and projected long-term returns of broad equity and bond indices. The plans' historical returns were also considered. The expected long-term rate of return on the assets in the plans was based on an asset allocation assumption of approximately
25%
with equity managers, with expected long-term rates of return of approximately
8.90%
, and approximately
75%
with fixed income managers, with an expected long-term rate of return of approximately
5.90%
for the year ended
December 31, 2011
. The expected long-term rate of return on the assets in the plans was based on an asset allocation assumptions of approximately
25%
with equity managers, with expected long-term rates of return of approximately
9.40%
, and approximately
75%
with fixed income managers, with an expected rate of return of approximately
5.50%
for the year ended
December 31, 2010
.
The following table summarizes the weighted-average assumptions used to determine benefit obligations at the plan measurement dates for U.S. plans:
|
|
|
Postretirement
|
|||||||||
|
|
Pension Plans
|
Medical Plans
|
|||||||||
|
|
2011
|
2010
|
2011
|
2010
|
|||||||
|
Weighted-average discount rate
|
5.00
|
%
|
5.60
|
%
|
5.00
|
%
|
5.60
|
%
|
|||
|
Rate of increase in compensation levels
|
3.00
|
%
|
3.50
|
%
|
N/A
|
|
N/A
|
|
|||
The following table summarizes the weighted average actuarial assumptions used to determine the net periodic benefit costs for U.S. plans for the years ended
December 31, 2011
,
2010
and
2009
:
|
|
|
Postretirement
|
|||||||||||||||
|
|
Pension Plans
|
Medical Plans
|
|||||||||||||||
|
|
2011
|
2010
|
2009
|
2011
|
2010
|
2009
|
|||||||||||
|
Weighted-average discount rate
|
5.57
|
%
|
5.52
|
%
|
6.50
|
%
|
5.60
|
%
|
5.57
|
%
|
6.50
|
%
|
|||||
|
Expected long-term rate of return on assets
|
6.50
|
%
|
7.00
|
%
|
7.30
|
%
|
6.50
|
%
|
7.00
|
%
|
7.30
|
%
|
|||||
|
Rate of increase in compensation levels
|
3.50
|
%
|
3.50
|
%
|
3.50
|
%
|
N/A
|
|
N/A
|
|
N/A
|
|
|||||
87
DR PEPPER SNAPPLE GROUP, INC.
NOTES TO AUDITED CONSOLIDATED FINANCIAL STATEMENTS - (Continued)
The following table summarizes the weighted-average assumptions used to determine benefit obligations at the plan measurement dates for foreign plans:
|
|
Pension Plans
|
Postretirement Medical Plans
|
|||||||||
|
|
2011
|
2010
|
2011
|
2010
|
|||||||
|
Weighted-average discount rate
|
5.20
|
%
|
6.06
|
%
|
4.00
|
%
|
4.75
|
%
|
|||
|
Rate of increase in compensation levels
|
3.80
|
%
|
3.83
|
%
|
N/A
|
|
N/A
|
|
|||
The following table summarizes the weighted average actuarial assumptions used to determine the net periodic benefit costs for foreign plans for the years ended
December 31, 2011
,
2010
and
2009
:
|
|
|
Postretirement
|
|||||||||||||||
|
|
Pension Plans
|
Medical Plans
|
|||||||||||||||
|
|
2011
|
2010
|
2009
|
2011
|
2010
|
2009
|
|||||||||||
|
Weighted-average discount rate
|
7.14
|
%
|
7.04
|
%
|
6.99
|
%
|
4.75
|
%
|
5.50
|
%
|
6.25
|
%
|
|||||
|
Expected long-term rate of return on assets
|
7.91
|
%
|
7.95
|
%
|
7.62
|
%
|
N/A
|
|
N/A
|
|
N/A
|
|
|||||
|
Rate of increase in compensation levels
|
4.16
|
%
|
4.10
|
%
|
4.06
|
%
|
N/A
|
|
N/A
|
|
N/A
|
|
|||||
The following table summarizes the health care cost trend rate assumptions used to determine the postretirement medical plan obligation for U.S. plans:
|
Health care cost trend rate assumed for 2012 (Initial Rate)
|
9.00
|
%
|
|
Rate to which the cost trend rate is assumed to decline (Ultimate Rate)
|
5.00
|
%
|
|
Year that the rate reaches the ultimate trend rate
|
2016
|
|
The effect of a 1% increase or decrease in health care trend rates on the U.S. and foreign postretirement medical plans would not significantly change the net periodic benefit costs or the benefit obligation at the end of the year.
The pension assets of DPS' U.S. plans represent approximately
94%
of the total pension plan assets as of
December 31, 2011
. The asset allocation for the U.S. defined benefit pension plans for
December 31, 2011
and
2010
are as follows:
|
|
Target
|
Actual
|
||||||
|
Asset Category
|
2012
|
2011
|
2010
|
|||||
|
Equity securities
|
25
|
%
|
25
|
%
|
34
|
%
|
||
|
Fixed income
|
75
|
%
|
75
|
%
|
66
|
%
|
||
|
Total
|
100
|
%
|
100
|
%
|
100
|
%
|
||
Investment Policy and Strategy
DPS has established formal investment policies for the assets associated with defined benefit plans. The Company's investment policy and strategy are mandated by the Company's Investment Committee. The overriding investment objective is to provide for the availability of funds for pension obligations as they become due, to maintain an overall level of financial asset adequacy, and to maximize long-term investment return consistent with a reasonable level of risk. DPS' pension plan investment strategy includes the use of actively-managed securities. The Investment Committee periodically reviews investment performance both by investment manager and asset class, as well as overall market conditions with consideration of the long-term investment objectives. None of the plan assets are invested directly in equity or debt instruments issued by DPS. It is possible that insignificant indirect investments exist through its equity holdings. The equity and fixed income investments under DPS sponsored pension plan assets are currently well diversified across all areas of the equity market and consist of both corporate and U.S. government bonds. The pension plans do not currently invest directly in any derivative investments.
88
DR PEPPER SNAPPLE GROUP, INC.
NOTES TO AUDITED CONSOLIDATED FINANCIAL STATEMENTS - (Continued)
The Plans' asset allocation policy is reviewed at least annually. Factors considered when determining the appropriate asset allocation include changes in plan liabilities, an evaluation of market conditions, tolerance for risk and cash requirements for benefit payments. The investment policy contains allowable ranges in asset mix as outlined in the table below:
|
Asset Category
|
Target Range
|
|
U.S. equity securities
|
15% - 25%
|
|
International equity securities
|
5%-10%
|
|
U.S. fixed income
|
65%-85%
|
Fair Value of Plan Assets
The following tables present the major categories of plan assets and the respective fair value hierarchy for the pension plan assets as of
December 31, 2011
and
2010
(in millions):
|
|
Fair Value Measurements at December 31, 2011
|
||||||||||||||
|
|
|
Quoted Prices in
|
Significant
|
Significant
|
|||||||||||
|
|
|
Active Markets for
|
Observable
|
Unobservable
|
|||||||||||
|
|
|
Identical Assets
|
Inputs
|
Inputs
|
|||||||||||
|
|
Total
|
(Level 1)
|
(Level 2)
|
(Level 3)
|
|||||||||||
|
|
|||||||||||||||
|
Cash and cash equivalents
|
$
|
4
|
|
$
|
4
|
|
$
|
—
|
|
$
|
—
|
|
|||
|
Equity securities
(1)
|
|
|
|
||||||||||||
|
U.S. Large-Cap equities
(2)
|
39
|
|
—
|
|
39
|
|
—
|
|
|||||||
|
International equities
(2)
|
21
|
|
—
|
|
21
|
|
—
|
|
|||||||
|
Fixed income securities
|
|
|
|
||||||||||||
|
U.S. Treasuries
|
1
|
|
1
|
|
—
|
|
—
|
|
|||||||
|
U.S. Municipal bonds
|
6
|
|
—
|
|
6
|
|
—
|
|
|||||||
|
U.S. Corporate bonds
|
138
|
|
—
|
|
138
|
|
—
|
|
|||||||
|
International bonds
(2)
|
30
|
|
—
|
|
30
|
|
—
|
|
|||||||
|
Total
|
$
|
239
|
|
$
|
5
|
|
$
|
234
|
|
$
|
—
|
|
|||
89
DR PEPPER SNAPPLE GROUP, INC.
NOTES TO AUDITED CONSOLIDATED FINANCIAL STATEMENTS - (Continued)
|
|
Fair Value Measurements at December 31, 2010
|
||||||||||||||
|
|
|
Quoted Prices in
|
Significant
|
Significant
|
|||||||||||
|
|
|
Active Markets for
|
Observable
|
Unobservable
|
|||||||||||
|
|
|
Identical Assets
|
Inputs
|
Inputs
|
|||||||||||
|
|
Total
|
(Level 1)
|
(Level 2)
|
(Level 3)
|
|||||||||||
|
|
|||||||||||||||
|
Cash and cash equivalents
|
$
|
6
|
|
$
|
6
|
|
$
|
—
|
|
$
|
—
|
|
|||
|
Equity securities
(1)
|
|
|
|
|
|||||||||||
|
U.S. Large-Cap equities
(2)
|
51
|
|
—
|
|
51
|
|
—
|
|
|||||||
|
International equities
(2)
|
29
|
|
—
|
|
29
|
|
—
|
|
|||||||
|
Fixed income securities
|
|
|
|
|
|||||||||||
|
U.S. Treasuries
|
1
|
|
1
|
|
—
|
|
—
|
|
|||||||
|
U.S. Municipal bonds
(3)
|
5
|
|
—
|
|
5
|
|
—
|
|
|||||||
|
U.S. Corporate bonds
(3)
|
110
|
|
—
|
|
110
|
|
—
|
|
|||||||
|
International bonds
(2)(3)
|
32
|
|
—
|
|
32
|
|
—
|
|
|||||||
|
Total
|
$
|
234
|
|
$
|
7
|
|
$
|
227
|
|
$
|
—
|
|
|||
|
(1)
|
Equity securities are comprised of actively managed U.S. index funds and Europe, Australia, Far East ("EAFE") index funds.
|
|
(2)
|
The NAV is based on the fair value of the underlying assets owned by the equity index fund or fixed income investment vehicle per share multiplied by the number of units held as of the measurement date and are classified as Level 2 assets.
|
|
(3)
|
The assets for 2010 were previously mischaracterized as Level 1 and moved to Level 2 based upon further analysis in 2011.
|
The following tables present the major categories of plan assets and the respective fair value hierarchy for the postretirement medical plan assets as of
December 31, 2011
and
2010
(in millions):
|
|
Fair Value Measurements at December 31, 2011
|
||||||||||||||
|
|
|
Quoted Prices in
|
Significant
|
Significant
|
|||||||||||
|
|
|
Active Markets for
|
Observable
|
Unobservable
|
|||||||||||
|
|
|
Identical Assets
|
Inputs
|
Inputs
|
|||||||||||
|
|
Total
|
(Level 1)
|
(Level 2)
|
(Level 3)
|
|||||||||||
|
|
|||||||||||||||
|
Equity securities
(1)
|
|
|
|
|
|||||||||||
|
U.S. Large-Cap equities
(2)
|
$
|
1
|
|
$
|
—
|
|
$
|
1
|
|
$
|
—
|
|
|||
|
International equities
(2)
|
—
|
|
—
|
|
—
|
|
—
|
|
|||||||
|
Fixed income securities
|
|
|
|
|
|||||||||||
|
U.S. Corporate bonds
|
3
|
|
—
|
|
3
|
|
—
|
|
|||||||
|
International bonds
(2)
|
1
|
|
—
|
|
1
|
|
—
|
|
|||||||
|
Total
|
$
|
5
|
|
$
|
—
|
|
$
|
5
|
|
$
|
—
|
|
|||
90
DR PEPPER SNAPPLE GROUP, INC.
NOTES TO AUDITED CONSOLIDATED FINANCIAL STATEMENTS - (Continued)
|
|
Fair Value Measurements at December 31, 2010
|
||||||||||||||
|
|
|
Quoted Prices in
|
Significant
|
Significant
|
|||||||||||
|
|
|
Active Markets for
|
Observable
|
Unobservable
|
|||||||||||
|
|
|
Identical Assets
|
Inputs
|
Inputs
|
|||||||||||
|
|
Total
|
(Level 1)
|
(Level 2)
|
(Level 3)
|
|||||||||||
|
|
|||||||||||||||
|
Equity securities
(1)
|
|
|
|
|
|
|
|
|
|||||||
|
U.S. Large-Cap equities
(2)
|
$
|
1
|
|
$
|
—
|
|
$
|
1
|
|
$
|
—
|
|
|||
|
International equities
(2)
|
1
|
|
—
|
|
1
|
|
—
|
|
|||||||
|
Fixed income securities
|
|
|
|
|
|||||||||||
|
U.S. Corporate bonds
(3)
|
2
|
|
—
|
|
2
|
|
—
|
|
|||||||
|
International bonds
(3)
|
1
|
|
—
|
|
1
|
|
—
|
|
|||||||
|
Total
|
$
|
5
|
|
$
|
—
|
|
$
|
5
|
|
$
|
—
|
|
|||
____________________________
|
(1)
|
Equity securities are comprised of actively managed U.S. index funds and EAFE index funds.
|
|
(2)
|
The NAV is based on the fair value of the underlying assets owned by the equity index fund or fixed income investment vehicle per share multiplied by the number of units held as of the measurement date and are classified as Level 2 assets.
|
|
(3)
|
The assets for 2010 were previously mischaracterized as Level 1 and moved to Level 2 based upon further analysis in 2011.
|
Multi-employer Plans
The Company participates in a number of trustee-managed multi-employer defined benefit pension plans for union-represented employees under certain collective bargaining agreements. The risks of participating in these multi-employer plans are different from single-employer plans due to the following:
|
•
|
Assets contributed to the multi-employer plan by one employer may be used to provide benefits to employees of other participating employers.
|
|
•
|
If a participating employer stops contributing to the plan, the unfunded obligations of the plan may be borne by the remaining participating employers.
|
|
•
|
If the Company chooses to stop participating in some of its multi-employer plans, the Company may be required to pay those plans an amount based on the underfunded status of the plan, referred to as a withdrawal liability.
|
Contributions paid into the multi-employer plans are expensed as incurred and were as follows
for the years ended
December 31, 2011
,
2010
and
2009
(in millions):
|
|
For the Year Ended December 31,
|
||||||||||
|
|
2011
|
2010
|
2009
|
||||||||
|
Multi-employer Plan Expense
|
|
|
|
|
|
|
|||||
|
Contributions to individually significant multi-employer plans
|
$
|
2
|
|
$
|
2
|
|
$
|
2
|
|
||
|
Contributions to all other multi-employer plans
|
3
|
|
2
|
|
3
|
|
|||||
|
Withdrawal liabilities from all other multi-employer plans
(1)
|
1
|
|
—
|
|
3
|
|
|||||
|
Total
|
$
|
6
|
|
$
|
4
|
|
$
|
8
|
|
||
____________________________
(1) During the second quarter of 2011, a trustee-approved mass withdrawal under one multi-employer plan was triggered. As a result of this action, the Company recognized additional expense of
$1 million
for the year ended December 31, 2011. During the third quarter of 2009, a trustee-approved mass withdrawal under one multi-employer plan was triggered and the trustee estimated the unfunded vested liability for the Company. As a result of this action, the Company recognized additional expense of approximately
$3 million
for the year ended December 31, 2009.
91
DR PEPPER SNAPPLE GROUP, INC.
NOTES TO AUDITED CONSOLIDATED FINANCIAL STATEMENTS - (Continued)
Individually Significant Multi-employer Plans
The Company participates in the following individually significant multi-employer plans as of December 31, 2011:
|
Legal name of the plan
|
Soft Drink Industry Local Union 710 Pension Fund ("Local 710")
|
Central States, Southeast and Southwest Areas Pension Fund ("Central States")
|
|
|
Plan's Employee Identification Number
|
36-6051352
|
36-6044243
|
|
|
Plan Number
|
001
|
001
|
|
|
Expiration dates of the collective bargain agreement
(2) (3)
|
April 30, 2013 - April 30, 2014
|
October 31, 2012 - June 21, 2015
|
|
|
FIP/RP Status Pending/Implemented
(1)
|
Yes
|
Yes
|
|
|
PPA zone status as of December 31, 2011
|
Red
|
Red
|
|
|
PPA zone status as of December 31, 2010
|
Red
|
Red
|
|
|
Surcharge imposed
|
Yes
|
Yes
|
|
____________________________
(1) FIP/RP Status Pending/Implemented indicate those plans for which a financial improvement plan ("FIP") or a rehabilitation plan ("RP") is either pending or implemented.
(2) One collective bargaining agreement applies to the Local 710, of which approximately 58% of the employees are covered by the largest collective bargaining agreement which is set to expire April 30, 2014.
(3) One collective bargaining agreement applies to the Central States, of which approximately 44% of the employees are covered by the largest collective bargaining agreement which is set to expire June 21, 2015. Approximately 68% of the employees are covered by three collective bargaining agreements set to expire during 2015.
The most recent Pension Protection Act ("PPA") zone status available as of December 31, 2011 and 2010 is for the plan's year-end as of December 31, 2010 and 2009. Neither plan has utilized any extended amortization provisions that affect the calculation of the zone status.
The Company's contributions to the Local 710 exceeded 5% of the total contributions made to the Local 710. The Company's contributions to Central States did not exceed 5% of the total contributions made to Central States.
Future estimated contributions for Local 710 and Central States based on the number of covered employees and the terms of the collective bargaining agreements are as follows (in millions):
|
2012
|
$
|
3
|
|
|
2013
|
3
|
|
|
|
2014
|
2
|
|
|
|
2015
|
1
|
|
|
Defined Contribution Plans
The Company sponsors the SIP, which is a qualified 401(k) Retirement Plan that covers substantially all U.S.-based employees who meet certain eligibility requirements. This plan permits both pre-tax and after-tax contributions, which are subject to limitations imposed by Internal Revenue Code (the "Code") regulations. The Company matches employees' contributions up to specified levels.
The Company also sponsors a supplemental savings plan (the "SSP"), which is a non-qualified defined contribution plan for employees who are actively enrolled in the SIP and whose after-tax contributions under the SIP are limited by the Code compensation limitations.
92
DR PEPPER SNAPPLE GROUP, INC.
NOTES TO AUDITED CONSOLIDATED FINANCIAL STATEMENTS - (Continued)
Additionally, current participants in the SIP and SSP are eligible for an EDC which vests after three years of service with the Company. The EDC was adopted by the Company during the fourth quarter of 2006 and contributions began accruing for plan participants effective January 1, 2008 after a one-year waiting period for participant entry into the plan. The Company made contributions of
$16 million
,
$17 million
and
$12 million
to the EDC for the each of the plan years ended
December 31, 2011
,
2010
and
2009
, respectively.
The Company's employer matching contributions to the SIP and SSP plans were approximately
$14 million
in
2011
,
2010
and
2009
.
|
14.
|
Stock-Based Compensation
|
The components of stock-based compensation expense for the years ended
December 31, 2011
,
2010
and
2009
, are presented below (in millions):
|
For the Year Ended December 31,
|
||||||||||||
|
|
2011
|
2010
|
2009
|
|||||||||
|
Total stock-based compensation expense
|
$
|
34
|
|
$
|
29
|
|
$
|
19
|
|
|||
|
Income tax benefit recognized in the income statement
|
(11
|
)
|
(10
|
)
|
(7
|
)
|
||||||
|
Net stock-based compensation expense
|
$
|
23
|
|
$
|
19
|
|
$
|
12
|
|
|||
Description of Stock-Based Compensation Plans
Omnibus Stock Incentive Plan of 2009
During 2009, the Company adopted the Omnibus Stock Incentive Plan of 2009 (the "2009 Stock Plan") under which employees, consultants, and non-employee directors may be granted stock options, stock appreciation rights, stock awards, RSUs or PSUs. This plan provides for the issuance of up to
20,000,000
shares of the Company's common stock. Subsequent to adoption, the Company's Compensation Committee granted RSUs and PSUs, which vest after three years and stock options, which vest ratably over three years. Each RSU is to be settled for one share of the Company's common stock on the respective vesting date of the RSU. No other types of stock-based awards have been granted under the 2009 Stock Plan. Approximately
16,000,000
shares of the Company's common stock were available for future grant at
December 31, 2011
.
Omnibus Stock Incentive Plan of 2008
In connection with the separation from Cadbury, on May 5, 2008, Cadbury Schweppes Limited, the Company's sole stockholder, approved the Company's Omnibus Stock Incentive Plan of 2008 (the "2008 Stock Plan") and authorized up to
9,000,000
shares of the Company's common stock to be issued under the Stock Plan. Subsequent to May 7, 2008, the Compensation Committee granted under the 2008 Stock Plan (a) options to purchase shares of the Company's common stock, which vest ratably over three years commencing with the first anniversary date of the option grant, and (b) RSUs, with a substantial portion of RSUs vesting over a three year period. Each RSU is to be settled for one share of the Company's common stock on the respective vesting date of the RSU. The stock options issued under the 2008 Stock Plan have a maximum option term of
10
years.
Stock Options
The tables below summarize information about the Company's stock options granted during the years ended
December 31, 2011
,
2010
and
2009
.
The fair value of each stock option is estimated on the date of grant using the Black-Scholes option-pricing model. Because the Company lacks a meaningful set of historical data upon which to develop certain valuation assumptions, including expected term and volatility of options granted, DPS has elected to develop these valuation assumptions based on information disclosed by similarly-situated companies, including multi-national consumer goods companies of similar market capitalization.
The risk-free interest rate used in the option valuation model is based on zero-coupon yields implied by U.S. Treasury issues with remaining terms similar to the expected term on the options. The Company's expected dividend yield is based on historical dividends declared.
93
DR PEPPER SNAPPLE GROUP, INC.
NOTES TO AUDITED CONSOLIDATED FINANCIAL STATEMENTS - (Continued)
DPS is required to estimate forfeitures at the time of grant and revise those estimates in subsequent periods if actual forfeitures differ from those estimates. The Company uses historical data to estimate pre-vesting option forfeitures and record stock-based compensation expense only for those awards that are expected to vest.
The weighted average assumptions used to value grant options are detailed below:
|
|
For the Year Ended December 31,
|
|||||||||||
|
|
2011
|
2010
|
2009
|
|||||||||
|
Fair value of options at grant date
|
$
|
6.59
|
|
$
|
6.99
|
|
$
|
3.57
|
|
|||
|
Risk free interest rate
|
2.51
|
%
|
2.65
|
%
|
2.23
|
%
|
||||||
|
Expected term of options (in years)
|
6.0
|
|
6.0
|
|
6.1
|
|
||||||
|
Dividend yield
(1)
|
2.75
|
%
|
1.90
|
%
|
—
|
%
|
||||||
|
Expected volatility
|
22.70
|
%
|
24.00
|
%
|
21.46
|
%
|
||||||
____________________________
|
(1)
|
The dividend yield is the calculated yield on the Company's stock at the time of the grant. During the fourth quarter of 2009, the Company declared its first dividend; therefore, dividend yield is included as a valuation assumption for stock based compensation awards for the years ended
December 31, 2011
and
2010
.
|
The table below summarizes stock option activity for the
year ended
December 31, 2011
:
|
|
Stock Options
|
Weighted Average Exercise Price
|
Weighted Average Remaining Contractual Term (Years)
|
Aggregate Intrinsic Value (in millions)
|
||||||||||
|
Outstanding as of December 31, 2010
|
2,632,935
|
|
$
|
23.14
|
|
8.22
|
|
$
|
32
|
|
||||
|
Granted
|
737,701
|
|
36.42
|
|
|
|
||||||||
|
Exercised
|
(992,070
|
)
|
20.83
|
|
|
19
|
|
|||||||
|
Forfeited or expired
|
(61,224
|
)
|
28.32
|
|
|
|
||||||||
|
Outstanding as of December 31, 2011
|
2,317,342
|
|
28.25
|
|
8.04
|
|
26
|
|
||||||
|
Exercisable as of December 31, 2011
|
707,846
|
|
23.54
|
|
7.19
|
|
11
|
|
||||||
As of
December 31, 2011
, there were
2,280,033
stock options vested or expected to vest. The weighted average exercise price of stock options granted for the years ended
December 31, 2010
and
2009
was
$32.36
and
$13.48
, respectively. As of
December 31, 2011
, there was
$6 million
of unrecognized compensation cost related to the nonvested stock options granted under the DPS stock plans that is expected to be recognized over a weighted average period of
0.86
years.
Restricted Stock Units and Performance Share Units
In 2011, the Compensation Committee of the Board approved a PSU plan. Each PSU is equivalent in value to one share of the Company's common stock. PSUs will vest three years from the beginning date of a pre-determined performance period to the extent the Company has met two performance criteria during the performance period: (i) the percentage growth of net income and (ii) the percentage yield from operating free cash flow.
94
DR PEPPER SNAPPLE GROUP, INC.
NOTES TO AUDITED CONSOLIDATED FINANCIAL STATEMENTS - (Continued)
The table below summarizes RSU and PSU activity for the year ended
December 31, 2011
. The fair value of restricted stock units is determined based on the number of units granted and the grant date price of common stock.
|
|
RSUs/PSUs
|
Weighted Average Grant Date Fair Value
|
Weighted Average Remaining Contractual Term (Years)
|
Aggregate Intrinsic Value (in millions)
|
||||||||||
|
Outstanding as of December 31, 2010
|
3,380,616
|
|
$
|
21.45
|
|
1.31
|
|
$
|
119
|
|
||||
|
Granted
|
942,212
|
|
36.43
|
|
|
|
||||||||
|
Vested and released
|
(840,518
|
)
|
25.40
|
|
|
|
||||||||
|
Forfeited
|
(161,055
|
)
|
25.23
|
|
|
|
||||||||
|
Outstanding as of December 31, 2011
|
3,321,255
|
|
25.41
|
|
1.02
|
|
131
|
|
||||||
The total fair value of RSUs vested for the years ended
December 31, 2011
,
2010
and
2009
was
$21 million
,
$5 million
and
$1 million
, respectively. As of
December 31, 2011
, there was
$38 million
of unrecognized compensation costs related to nonvested
RSUs and PSUs granted under the DPS stock plans
. That cost is expected to be recognized over a weighted-average period of
1.00
y
ears.
Modifications of Share-Based Awards
On October 26, 2009, the Company's Compensation Committee approved a letter agreement between the Company and a former officer of the Company regarding his early retirement and separation from the Company. Under the terms of the letter agreement, the vesting of a portion of the officer's remaining unvested stock options and RSUs granted under the 2008 Stock Plan was accelerated and became fully vested in 2010. There was no incremental compensation cost associated with the modification.
During the fourth quarter of 2009, DPS' Compensation Committee approved a modification to amend all outstanding individual RSU agreements as of November 19, 2009, to allow for individual RSU awards to participate in dividends in the event of a dividend declaration, which affected approximately
600
employees. As a result of the modification, the Company recorded an additional
$1 million
in stock-based compensation expense during the fourth quarter of 2009.
|
15.
|
Earnings Per Share
|
Basic earnings per share ("EPS") is computed by dividing net income by the weighted average number of common shares outstanding for the period. Diluted EPS reflects the assumed conversion of all dilutive securities. The following table presents the basic and diluted EPS and the Company's basic and diluted shares outstanding (in millions, except per share data):
|
|
For the Year Ended December 31,
|
|||||||||||
|
|
2011
|
2010
|
2009
|
|||||||||
|
Basic EPS:
|
|
|
||||||||||
|
Net income
|
$
|
606
|
|
$
|
528
|
|
$
|
555
|
|
|||
|
Weighted average common shares outstanding
|
218.7
|
|
240.4
|
|
254.2
|
|
||||||
|
Earnings per common share — basic
|
$
|
2.77
|
|
$
|
2.19
|
|
$
|
2.18
|
|
|||
|
Diluted EPS:
|
|
|
||||||||||
|
Net income
|
$
|
606
|
|
$
|
528
|
|
$
|
555
|
|
|||
|
Weighted average common shares outstanding
|
218.7
|
|
240.4
|
|
254.2
|
|
||||||
|
Effect of dilutive securities:
|
|
|
||||||||||
|
Stock options, RSUs, PSUs and dividend equivalent units
|
2.5
|
|
2.2
|
|
1.0
|
|
||||||
|
Weighted average common shares outstanding and common stock equivalents
|
221.2
|
|
242.6
|
|
255.2
|
|
||||||
|
Earnings per common share — diluted
|
$
|
2.74
|
|
$
|
2.17
|
|
$
|
2.17
|
|
|||
95
DR PEPPER SNAPPLE GROUP, INC.
NOTES TO AUDITED CONSOLIDATED FINANCIAL STATEMENTS - (Continued)
Stock options, RSUs, PSUs and dividend equivalent units totaling
0.7 million
and
0.4 million
shares were excluded from the diluted weighted average shares outstanding for the years ended
December 31, 2011
, and
2010
, respectively, as they were not dilutive. Stock options and RSUs totaling
1.1 million
were excluded from the diluted weighted average shares outstanding for the years ended
December 31, 2009
, as they were not dilutive.
Under the terms of our RSU agreements, unvested RSU awards contain forfeitable rights to dividends and dividend equivalent units. Because the dividend equivalent units are forfeitable, they are defined as non-participating securities. As of
December 31, 2011
, there were
145,001
dividend equivalent units which will vest at the time that the underlying RSU vests.
During the years ended
December 31, 2010
and
2009
, the Board authorized a total aggregate share repurchase plan of
$2 billion
. The Company repurchased and retired approximately
14 million
shares of common stock valued at approximately
$522 million
in the
year ended
December 31, 2011
. The Company repurchased and retired
31 million
shares of common stock valued at approximately
$1,113 million
in the
year ended
December 31, 2010
. These amounts were recorded as a reduction of equity, primarily additional paid-in capital.
On November 17, 2011, the Board authorized an additional
$1 billion
of share repurchases, increasing the total aggregate share repurchase plan to
$3 billion
. As of
December 31, 2011
,
$1,372 million
was available for future share repurchases under the existing Board authorizations.
|
16.
|
Accumulated Other Comprehensive Loss
|
The following table provides a summary of changes in the balances of each component of AOCL, net of taxes, for the years ended
December 31, 2011
,
2010
and
2009
(in millions):
|
|
Foreign Currency Translation
|
Change in Pension Liability
|
Cash Flow Hedges
|
Accumulated Other Comprehensive Loss
|
||||||||||||
|
Balance as of December 31, 2008
|
$
|
(34
|
)
|
$
|
(52
|
)
|
$
|
(20
|
)
|
$
|
(106
|
)
|
||||
|
Current period other comprehensive income
|
22
|
|
7
|
|
18
|
|
47
|
|
||||||||
|
Balance as of December 31, 2009
|
(12
|
)
|
(45
|
)
|
(2
|
)
|
(59
|
)
|
||||||||
|
Current period other comprehensive income
|
19
|
|
14
|
|
(2
|
)
|
31
|
|
||||||||
|
Balance as of December 31, 2010
|
7
|
|
(31
|
)
|
(4
|
)
|
(28
|
)
|
||||||||
|
Current period other comprehensive income
|
(34
|
)
|
(17
|
)
|
(31
|
)
|
(82
|
)
|
||||||||
|
Balance as of December 31, 2011
|
$
|
(27
|
)
|
$
|
(48
|
)
|
$
|
(35
|
)
|
$
|
(110
|
)
|
||||
|
17.
|
Supplemental Cash Flow Information
|
The following table details supplemental cash flow disclosures of the net change in operating assets and liabilities, non-cash investing and financing activities and other supplemental cash flow disclosures for the years ended
December 31, 2011
,
2010
and
2009
(in millions):
|
|
For the Year Ended December 31,
|
||||||||||
|
|
2011
|
2010
|
2009
|
||||||||
|
Supplemental cash flow disclosures of non-cash investing and financing activities:
|
|
|
|
|
|
|
|||||
|
Capital expenditures included in accounts payable
|
$
|
53
|
|
$
|
59
|
|
$
|
39
|
|
||
|
Dividends declared but not yet paid
|
68
|
|
56
|
|
38
|
|
|||||
|
Transfer of property, plant, and equipment for note receivable
|
—
|
|
—
|
|
4
|
|
|||||
|
Supplemental cash flow disclosures:
|
|
|
|
|
|
|
|||||
|
Interest paid
|
$
|
104
|
|
$
|
125
|
|
$
|
152
|
|
||
|
Income taxes paid
|
278
|
|
188
|
|
233
|
|
|||||
96
DR PEPPER SNAPPLE GROUP, INC.
NOTES TO AUDITED CONSOLIDATED FINANCIAL STATEMENTS - (Continued)
|
18.
|
Commitments and Contingencies
|
Lease Commitments
The Company has leases for certain facilities and equipment which expire at various dates through 2020. Operating lease expense was
$80 million
,
$82 million
, and
$79 million
for the years ended
December 31, 2011
,
2010
and
2009
, respectively. Future minimum lease payments under capital and operating leases with initial or remaining noncancellable lease terms in excess of one year as of
December 31, 2011
are as follows (in millions):
|
|
Operating Leases
|
Capital Leases
|
||||||
|
2012
|
$
|
58
|
|
$
|
4
|
|
||
|
2013
|
53
|
|
4
|
|
||||
|
2014
|
44
|
|
3
|
|
||||
|
2015
|
36
|
|
1
|
|
||||
|
2016
|
28
|
|
—
|
|
||||
|
Thereafter
|
73
|
|
—
|
|
||||
|
Total minimum lease payments
|
$
|
292
|
|
12
|
|
|||
|
Less imputed interest at rates ranging from 9.89% to 15.42%
|
|
(1
|
)
|
|||||
|
Present value of minimum lease payments
|
|
$
|
11
|
|
||||
Of the
$11 million
in capital lease obligations above,
$7 million
is included in long-term debt payable to third parties and
$4 million
is included in other current liabilities on the Consolidated Balance Sheet as of
December 31, 2011
.
Legal Matters
The Company is occasionally subject to litigation or other legal proceedings as set forth below. The Company does not believe that the outcome of these, or any other, pending legal matters, individually or collectively, will have a material adverse effect on the business or financial condition of the Company.
Robert M. Ward, et al. v. The American Bottling Company
In March 2009, Robert M. Ward, et al., as plaintiffs, commenced litigation in the United States District Court, Central District of California, Western Division alleging age discrimination against Cadbury Schweppes Bottling Group, Inc. (now The American Bottling Company), et al., as defendants. The defendants are subsidiaries of the Company. The complaint related to activities which principally occurred before the Company's spin off from Cadbury plc in 2008. On December 7, 2011, the jury returned a verdict in favor of the six plaintiffs and awarded damages of approximately
$18 million
, which amount was accrued as of December 31, 2011. The Company plans to appeal this decision.
Robert Jones v. Seven Up/RC Bottling Company of Southern California, Inc.
In 2007, one of the Company's subsidiaries, Seven Up/RC Bottling Company Inc., was sued by Robert Jones in the Superior Court in the State of California (Orange County), alleging that its subsidiary failed to provide meal and rest periods and itemized wage statements in accordance with applicable California wage and hour law. The case was filed as a class action. The parties have reached a settlement in the case, pursuant to which the Company denied any liability or wrongdoing and reserved all rights, but agreed to a compromise to end litigation and to pay approximately
$4 million
, which amount was accrued as of June 30, 2010. The termination of the case is subject to the satisfaction of the terms and conditions of the settlement agreement.
97
DR PEPPER SNAPPLE GROUP, INC.
NOTES TO AUDITED CONSOLIDATED FINANCIAL STATEMENTS - (Continued)
Environmental, Health and Safety Matters
The Company operates many manufacturing, bottling and distribution facilities. In these and other aspects of the Company's business, it is subject to a variety of federal, state and local environment, health and safety laws and regulations. The Company maintains environmental, health and safety policies and a quality, environmental, health and safety program designed to ensure compliance with applicable laws and regulations. However, the nature of the Company's business exposes it to the risk of claims with respect to environmental, health and safety matters, and there can be no assurance that material costs or liabilities will not be incurred in connection with such claims.
The federal Comprehensive Environmental Response, Compensation and Liability Act of 1980, also known as the Superfund law, as well as similar state laws, generally impose joint and several liability for cleanup and enforcement costs on current and former owners and operators of a site without regard to fault or the legality of the original conduct. In October 2008, DPS was notified by the Environmental Protection Agency that it is a potentially responsible party for study and cleanup costs at a Superfund site in New Jersey. Investigation and remediation costs are yet to be determined, but through
December 31, 2011
, the Company paid approximately
$425,000
since the notification for DPS' allocation of costs related to the study for this site.
|
19.
|
Segments
|
The Company presents segment information in accordance with U.S. GAAP, which established reporting and disclosure standards for an enterprise's operating segments. Operating segments are defined as components of an enterprise that are businesses, for which separate financial information is available, and for which the financial information is regularly reviewed by the Company's leadership team.
As of
December 31, 2011
, the Company's operating structure consisted of the following three operating segments:
|
•
|
The Beverage Concentrates segment reflects sales of the Company's branded concentrates and syrup to third party bottlers primarily in the U.S. and Canada. Most of the brands in this segment are carbonated soft drink brands.
|
|
•
|
The Packaged Beverages segment reflects sales in the United States and Canada from the manufacture and distribution of finished beverages and other products, including sales of the Company's own brands and third party brands, through both DSD and WD.
|
|
•
|
The Latin America Beverages segment reflects sales in the Mexico and Caribbean markets from the manufacture and distribution of concentrates, syrup and finished beverages.
|
Segment results are based on management reports. Net sales and SOP are the significant financial measures used to assess the operating performance of the Company's operating segments.
Information about the Company's operations by operating segment for the years ended
December 31, 2011
,
2010
and
2009
is as follows (in millions):
|
|
For the Year Ended December 31,
|
|||||||||||
|
|
2011
|
2010
|
2009
|
|||||||||
|
Segment Results – Net sales
|
|
|
||||||||||
|
Beverage Concentrates
|
$
|
1,193
|
|
$
|
1,156
|
|
$
|
1,063
|
|
|||
|
Packaged Beverages
|
4,292
|
|
4,098
|
|
4,111
|
|
||||||
|
Latin America Beverages
|
418
|
|
382
|
|
357
|
|
||||||
|
Net sales
|
$
|
5,903
|
|
$
|
5,636
|
|
$
|
5,531
|
|
|||
98
DR PEPPER SNAPPLE GROUP, INC.
NOTES TO AUDITED CONSOLIDATED FINANCIAL STATEMENTS - (Continued)
|
|
For the Year Ended December 31,
|
|||||||||||
|
|
2011
|
2010
|
2009
|
|||||||||
|
Segment Results – SOP
|
|
|
||||||||||
|
Beverage Concentrates
|
$
|
779
|
|
$
|
745
|
|
$
|
683
|
|
|||
|
Packaged Beverages
|
519
|
|
536
|
|
573
|
|
||||||
|
Latin America Beverages
|
43
|
|
40
|
|
54
|
|
||||||
|
Total SOP
|
1,341
|
|
1,321
|
|
1,310
|
|
||||||
|
Unallocated corporate costs
|
306
|
|
288
|
|
265
|
|
||||||
|
Other operating expense (income), net
|
11
|
|
8
|
|
(40
|
)
|
||||||
|
Income from operations
|
1,024
|
|
1,025
|
|
1,085
|
|
||||||
|
Interest expense, net
|
111
|
|
125
|
|
239
|
|
||||||
|
Loss on early extinguishment of debt
|
—
|
|
100
|
|
—
|
|
||||||
|
Other income, net
|
(12
|
)
|
(21
|
)
|
(22
|
)
|
||||||
|
Income before provision for income taxes and equity in earnings of unconsolidated subsidiaries
|
$
|
925
|
|
$
|
821
|
|
$
|
868
|
|
|||
|
|
For the Year Ended December 31,
|
||||||||||
|
|
2011
|
2010
|
2009
|
||||||||
|
Amortization
|
|
|
|
||||||||
|
Beverage Concentrates
|
$
|
19
|
|
$
|
15
|
|
$
|
15
|
|
||
|
Packaged Beverages
|
10
|
|
19
|
|
20
|
|
|||||
|
Latin America Beverages
|
—
|
|
—
|
|
—
|
|
|||||
|
Segment total
|
29
|
|
34
|
|
35
|
|
|||||
|
Corporate and other
|
5
|
|
9
|
|
22
|
|
|||||
|
Amortization as reported
|
$
|
34
|
|
$
|
43
|
|
$
|
57
|
|
||
|
|
For the Year Ended December 31,
|
||||||||||
|
|
2011
|
2010
|
2009
|
||||||||
|
Depreciation
|
|
|
|
||||||||
|
Beverage Concentrates
|
$
|
15
|
|
$
|
15
|
|
$
|
14
|
|
||
|
Packaged Beverages
|
165
|
|
151
|
|
134
|
|
|||||
|
Latin America Beverages
|
11
|
|
10
|
|
9
|
|
|||||
|
Segment total
|
191
|
|
176
|
|
157
|
|
|||||
|
Corporate and other
|
7
|
|
9
|
|
10
|
|
|||||
|
Depreciation as reported
|
$
|
198
|
|
$
|
185
|
|
$
|
167
|
|
||
99
DR PEPPER SNAPPLE GROUP, INC.
NOTES TO AUDITED CONSOLIDATED FINANCIAL STATEMENTS - (Continued)
|
|
|||||||||||
|
|
As of December 31,
|
||||||||||
|
|
2011
|
2010
|
2009
|
||||||||
|
Total assets
|
|
|
|
|
|
|
|||||
|
Beverage Concentrates
|
$
|
69
|
|
$
|
79
|
|
$
|
91
|
|
||
|
Packaged Beverages
|
967
|
|
973
|
|
911
|
|
|||||
|
Latin America Beverages
|
72
|
|
76
|
|
64
|
|
|||||
|
Segment total
|
1,108
|
|
1,128
|
|
1,066
|
|
|||||
|
Corporate and other
|
44
|
|
40
|
|
43
|
|
|||||
|
Property, plant and equipment, net as reported
|
1,152
|
|
1,168
|
|
1,109
|
|
|||||
|
Current assets as reported
|
1,757
|
|
1,309
|
|
1,279
|
|
|||||
|
All other non-current assets as reported
|
6,374
|
|
6,382
|
|
6,388
|
|
|||||
|
Total assets as reported
|
$
|
9,283
|
|
$
|
8,859
|
|
$
|
8,776
|
|
||
See Note 6 for further information regarding the assignment of goodwill to the Company's operating segments. The majority of the Company's other intangible assets are assigned to the Beverage Concentrates operating segment.
Geographic Data
The Company utilizes separate legal entities for transactions with customers outside of the United States. Information about the Company's operations by geographic region for
the years ended
December 31, 2011
,
2010
and
2009
is below:
|
|
For the Year Ended December 31,
|
||||||||||
|
|
2011
|
2010
|
2009
|
||||||||
|
Net sales
|
|
|
|
|
|
|
|||||
|
U.S.
|
$
|
5,243
|
|
$
|
5,029
|
|
$
|
4,968
|
|
||
|
International
|
660
|
|
607
|
|
563
|
|
|||||
|
Net sales as reported
|
$
|
5,903
|
|
$
|
5,636
|
|
$
|
5,531
|
|
||
|
|
As of December 31,
|
||||||||||
|
|
2011
|
2010
|
2009
|
||||||||
|
Property, plant and equipment, net
|
|
|
|
|
|
|
|||||
|
U.S.
|
$
|
1,080
|
|
$
|
1,092
|
|
$
|
1,044
|
|
||
|
International
|
72
|
|
76
|
|
65
|
|
|||||
|
Property, plant and equipment, net as reported
|
$
|
1,152
|
|
$
|
1,168
|
|
$
|
1,109
|
|
||
Major Customer
Wal-Mart represents one of our major customers and accounted for more than
10%
of our total net sales. For the years ended
December 31, 2011
,
2010
and
2009
, we recorded net sales to Wal-Mart of
$799 million
,
$772 million
and
$733 million
, respectively. These represent direct sales from us to Wal-Mart and were reported in our Packaged Beverages and Latin America Beverages segments.
Additionally, customers in our Beverage Concentrates segment buy concentrate from us which is used in finished goods sold by our third party bottlers to Wal-Mart. These indirect sales further increase the concentration of risk associated with DPS' consolidated net sales as it relates to Wal-Mart.
100
DR PEPPER SNAPPLE GROUP, INC.
NOTES TO AUDITED CONSOLIDATED FINANCIAL STATEMENTS - (Continued)
|
20.
|
Guarantor and Non-Guarantor Financial Information
|
The Company's 2012, 2013, 2016, 2018, 2019, 2021 and 2038 Notes (collectively, the "Notes") are fully and unconditionally guaranteed by substantially all of the Company's existing and future direct and indirect domestic subsidiaries (except two immaterial subsidiaries associated with the Company's charitable foundations) (the "Guarantors"), as defined in the indentures governing the Notes. The Guarantors are wholly-owned either directly or indirectly by the Company and jointly and severally guarantee the Company's obligations under the Notes. None of the Company's subsidiaries organized outside of the U.S. (collectively, the "Non-Guarantors") guarantee the Notes.
The following schedules present the financial information for the years ended
December 31, 2011
,
2010
and
2009
, and as of
December 31, 2011
, and
2010
, for Dr Pepper Snapple Group, Inc. (the "Parent"), Guarantors and Non-Guarantors. The consolidating schedules are provided in accordance with the reporting requirements for guarantor subsidiaries (in millions).
|
|
Condensed Consolidating Statement of Income
|
||||||||||||||||||
|
|
For the Year Ended December 31, 2011
|
||||||||||||||||||
|
|
Parent
|
Guarantors
|
Non-Guarantors
|
Eliminations
|
Total
|
||||||||||||||
|
Net sales
|
$
|
—
|
|
$
|
5,350
|
|
$
|
579
|
|
$
|
(26
|
)
|
$
|
5,903
|
|
||||
|
Cost of sales
|
—
|
|
2,248
|
|
263
|
|
(26
|
)
|
2,485
|
|
|||||||||
|
Gross profit
|
—
|
|
3,102
|
|
316
|
|
—
|
|
3,418
|
|
|||||||||
|
Selling, general and administrative expenses
|
—
|
|
2,037
|
|
220
|
|
—
|
|
2,257
|
|
|||||||||
|
Depreciation and amortization
|
—
|
|
119
|
|
7
|
|
—
|
|
126
|
|
|||||||||
|
Other operating expense (income), net
|
—
|
|
13
|
|
(2
|
)
|
—
|
|
11
|
|
|||||||||
|
Income from operations
|
—
|
|
933
|
|
91
|
|
—
|
|
1,024
|
|
|||||||||
|
Interest expense
|
112
|
|
80
|
|
—
|
|
(78
|
)
|
114
|
|
|||||||||
|
Interest income
|
(74
|
)
|
(2
|
)
|
(5
|
)
|
78
|
|
(3
|
)
|
|||||||||
|
Loss on early extinguishment of debt
|
—
|
|
—
|
|
—
|
|
—
|
|
—
|
|
|||||||||
|
Other (income) expense, net
|
(12
|
)
|
(3
|
)
|
3
|
|
—
|
|
(12
|
)
|
|||||||||
|
Income (loss) before provision for income taxes and equity in earnings of subsidiaries
|
(26
|
)
|
858
|
|
93
|
|
—
|
|
925
|
|
|||||||||
|
Provision for income taxes
|
(14
|
)
|
306
|
|
28
|
|
—
|
|
320
|
|
|||||||||
|
Income (loss) before equity in earnings of subsidiaries
|
(12
|
)
|
552
|
|
65
|
|
—
|
|
605
|
|
|||||||||
|
Equity in earnings of consolidated subsidiaries
|
618
|
|
66
|
|
—
|
|
(684
|
)
|
—
|
|
|||||||||
|
Equity in earnings of unconsolidated subsidiaries, net of tax
|
—
|
|
—
|
|
1
|
|
—
|
|
1
|
|
|||||||||
|
Net income
|
$
|
606
|
|
$
|
618
|
|
$
|
66
|
|
$
|
(684
|
)
|
$
|
606
|
|
||||
101
DR PEPPER SNAPPLE GROUP, INC.
NOTES TO AUDITED CONSOLIDATED FINANCIAL STATEMENTS - (Continued)
|
|
Condensed Consolidating Statement of Income
|
||||||||||||||||||
|
|
For the Year Ended December 31, 2010
|
||||||||||||||||||
|
|
Parent
|
Guarantors
|
Non-Guarantors
|
Eliminations
|
Total
|
||||||||||||||
|
Net sales
|
$
|
—
|
|
$
|
5,129
|
|
$
|
534
|
|
$
|
(27
|
)
|
$
|
5,636
|
|
||||
|
Cost of sales
|
—
|
|
2,026
|
|
244
|
|
(27
|
)
|
2,243
|
|
|||||||||
|
Gross profit
|
—
|
|
3,103
|
|
290
|
|
—
|
|
3,393
|
|
|||||||||
|
Selling, general and administrative expenses
|
—
|
|
2,019
|
|
214
|
|
—
|
|
2,233
|
|
|||||||||
|
Depreciation and amortization
|
—
|
|
122
|
|
5
|
|
—
|
|
127
|
|
|||||||||
|
Other operating expense (income), net
|
—
|
|
8
|
|
—
|
|
—
|
|
8
|
|
|||||||||
|
Income from operations
|
—
|
|
954
|
|
71
|
|
—
|
|
1,025
|
|
|||||||||
|
Interest expense
|
128
|
|
78
|
|
—
|
|
(78
|
)
|
128
|
|
|||||||||
|
Interest income
|
(75
|
)
|
(2
|
)
|
(4
|
)
|
78
|
|
(3
|
)
|
|||||||||
|
Loss on early extinguishment of debt
|
100
|
|
—
|
|
—
|
|
—
|
|
100
|
|
|||||||||
|
Other (income) expense, net
|
(20
|
)
|
(3
|
)
|
2
|
|
—
|
|
(21
|
)
|
|||||||||
|
Income (loss) before provision for income taxes and equity in earnings of subsidiaries
|
(133
|
)
|
881
|
|
73
|
|
—
|
|
821
|
|
|||||||||
|
Provision for income taxes
|
(52
|
)
|
327
|
|
19
|
|
—
|
|
294
|
|
|||||||||
|
Income (loss) before equity in earnings of subsidiaries
|
(81
|
)
|
554
|
|
54
|
|
—
|
|
527
|
|
|||||||||
|
Equity in earnings of consolidated subsidiaries
|
609
|
|
55
|
|
—
|
|
(664
|
)
|
—
|
|
|||||||||
|
Equity in earnings of unconsolidated subsidiaries, net of tax
|
—
|
|
—
|
|
1
|
|
—
|
|
1
|
|
|||||||||
|
Net income
|
$
|
528
|
|
$
|
609
|
|
$
|
55
|
|
$
|
(664
|
)
|
$
|
528
|
|
||||
102
DR PEPPER SNAPPLE GROUP, INC.
NOTES TO AUDITED CONSOLIDATED FINANCIAL STATEMENTS - (Continued)
|
|
Condensed Consolidating Statement of Income
|
||||||||||||||||||
|
|
For the Year Ended December 31, 2009
|
||||||||||||||||||
|
|
Parent
|
Guarantors
|
Non-Guarantors
|
Eliminations
|
Total
|
||||||||||||||
|
Net sales
|
$
|
—
|
|
$
|
5,037
|
|
$
|
494
|
|
$
|
—
|
|
$
|
5,531
|
|
||||
|
Cost of sales
|
—
|
|
2,028
|
|
206
|
|
—
|
|
2,234
|
|
|||||||||
|
Gross profit
|
—
|
|
3,009
|
|
288
|
|
—
|
|
3,297
|
|
|||||||||
|
Selling, general and administrative expenses
|
—
|
|
1,954
|
|
181
|
|
—
|
|
2,135
|
|
|||||||||
|
Depreciation and amortization
|
—
|
|
114
|
|
3
|
|
—
|
|
117
|
|
|||||||||
|
Other operating expense (income), net
|
—
|
|
(38
|
)
|
(2
|
)
|
—
|
|
(40
|
)
|
|||||||||
|
Income from operations
|
—
|
|
979
|
|
106
|
|
—
|
|
1,085
|
|
|||||||||
|
Interest expense
|
247
|
|
112
|
|
—
|
|
(116
|
)
|
243
|
|
|||||||||
|
Interest income
|
(116
|
)
|
(1
|
)
|
(3
|
)
|
116
|
|
(4
|
)
|
|||||||||
|
Loss on early extinguishment of debt
|
—
|
|
—
|
|
—
|
|
—
|
|
—
|
|
|||||||||
|
Other (income) expense, net
|
(23
|
)
|
(24
|
)
|
25
|
|
—
|
|
(22
|
)
|
|||||||||
|
Income (loss) before provision for income taxes and equity in earnings of subsidiaries
|
(108
|
)
|
892
|
|
84
|
|
—
|
|
868
|
|
|||||||||
|
Provision for income taxes
|
(50
|
)
|
336
|
|
29
|
|
—
|
|
315
|
|
|||||||||
|
Income (loss) before equity in earnings of subsidiaries
|
(58
|
)
|
556
|
|
55
|
|
—
|
|
553
|
|
|||||||||
|
Equity in earnings of consolidated subsidiaries
|
613
|
|
57
|
|
—
|
|
(670
|
)
|
—
|
|
|||||||||
|
Equity in earnings of unconsolidated subsidiaries, net of tax
|
—
|
|
—
|
|
2
|
|
—
|
|
2
|
|
|||||||||
|
Net income
|
$
|
555
|
|
$
|
613
|
|
$
|
57
|
|
$
|
(670
|
)
|
$
|
555
|
|
||||
103
DR PEPPER SNAPPLE GROUP, INC.
NOTES TO AUDITED CONSOLIDATED FINANCIAL STATEMENTS - (Continued)
|
|
Condensed Consolidating Balance Sheet
|
||||||||||||||||||
|
|
As of December 31, 2011
|
||||||||||||||||||
|
|
Parent
|
Guarantors
|
Non-Guarantors
|
Eliminations
|
Total
|
||||||||||||||
|
Current assets:
|
|
|
|
|
|
||||||||||||||
|
Cash and cash equivalents
|
$
|
—
|
|
$
|
641
|
|
$
|
60
|
|
$
|
—
|
|
$
|
701
|
|
||||
|
Accounts receivable:
|
|
|
|
|
|
||||||||||||||
|
Trade, net
|
—
|
|
528
|
|
57
|
|
—
|
|
585
|
|
|||||||||
|
Other
|
2
|
|
28
|
|
20
|
|
—
|
|
50
|
|
|||||||||
|
Related party receivable
|
12
|
|
9
|
|
—
|
|
(21
|
)
|
—
|
|
|||||||||
|
Inventories
|
—
|
|
192
|
|
20
|
|
—
|
|
212
|
|
|||||||||
|
Deferred tax assets
|
12
|
|
79
|
|
5
|
|
—
|
|
96
|
|
|||||||||
|
Prepaid expenses and other current assets
|
145
|
|
82
|
|
25
|
|
(139
|
)
|
113
|
|
|||||||||
|
Total current assets
|
171
|
|
1,559
|
|
187
|
|
(160
|
)
|
1,757
|
|
|||||||||
|
Property, plant and equipment, net
|
—
|
|
1,080
|
|
72
|
|
—
|
|
1,152
|
|
|||||||||
|
Investments in consolidated subsidiaries
|
3,602
|
|
530
|
|
—
|
|
(4,132
|
)
|
—
|
|
|||||||||
|
Investments in unconsolidated subsidiaries
|
2
|
|
—
|
|
11
|
|
—
|
|
13
|
|
|||||||||
|
Goodwill
|
—
|
|
2,961
|
|
19
|
|
—
|
|
2,980
|
|
|||||||||
|
Other intangible assets, net
|
—
|
|
2,602
|
|
75
|
|
—
|
|
2,677
|
|
|||||||||
|
Long-term receivable, related parties
|
2,917
|
|
1,970
|
|
175
|
|
(5,062
|
)
|
—
|
|
|||||||||
|
Other non-current assets
|
467
|
|
100
|
|
6
|
|
—
|
|
573
|
|
|||||||||
|
Non-current deferred tax assets
|
9
|
|
—
|
|
131
|
|
(9
|
)
|
131
|
|
|||||||||
|
Total assets
|
$
|
7,168
|
|
$
|
10,802
|
|
$
|
676
|
|
$
|
(9,363
|
)
|
$
|
9,283
|
|
||||
|
Current liabilities:
|
|
|
|
|
|
||||||||||||||
|
Accounts payable
|
$
|
—
|
|
$
|
237
|
|
$
|
28
|
|
$
|
—
|
|
$
|
265
|
|
||||
|
Related party payable
|
—
|
|
12
|
|
9
|
|
(21
|
)
|
—
|
|
|||||||||
|
Deferred revenue
|
—
|
|
63
|
|
2
|
|
—
|
|
65
|
|
|||||||||
|
Current portion of long-term obligations
|
452
|
|
—
|
|
—
|
|
—
|
|
452
|
|
|||||||||
|
Income taxes payable
|
—
|
|
668
|
|
1
|
|
(139
|
)
|
530
|
|
|||||||||
|
Other current liabilities
|
128
|
|
432
|
|
43
|
|
—
|
|
603
|
|
|||||||||
|
Total current liabilities
|
580
|
|
1,412
|
|
83
|
|
(160
|
)
|
1,915
|
|
|||||||||
|
Long-term obligations to third parties
|
2,249
|
|
7
|
|
—
|
|
—
|
|
2,256
|
|
|||||||||
|
Long-term obligations to related parties
|
1,970
|
|
3,092
|
|
—
|
|
(5,062
|
)
|
—
|
|
|||||||||
|
Non-current deferred tax liabilities
|
—
|
|
595
|
|
—
|
|
(9
|
)
|
586
|
|
|||||||||
|
Non-current deferred revenue
|
1
|
|
1,404
|
|
44
|
|
—
|
|
1,449
|
|
|||||||||
|
Other non-current liabilities
|
105
|
|
690
|
|
19
|
|
—
|
|
814
|
|
|||||||||
|
Total liabilities
|
4,905
|
|
7,200
|
|
146
|
|
(5,231
|
)
|
7,020
|
|
|||||||||
|
Total stockholders' equity
|
2,263
|
|
3,602
|
|
530
|
|
(4,132
|
)
|
2,263
|
|
|||||||||
|
Total liabilities and stockholders' equity
|
$
|
7,168
|
|
$
|
10,802
|
|
$
|
676
|
|
$
|
(9,363
|
)
|
$
|
9,283
|
|
||||
104
DR PEPPER SNAPPLE GROUP, INC.
NOTES TO AUDITED CONSOLIDATED FINANCIAL STATEMENTS - (Continued)
|
|
Condensed Consolidating Balance Sheet
|
||||||||||||||||||
|
|
As of December 31, 2010
|
||||||||||||||||||
|
|
Parent
|
Guarantors
|
Non-Guarantors
|
Eliminations
|
Total
|
||||||||||||||
|
Current assets:
|
|
|
|
|
|
||||||||||||||
|
Cash and cash equivalents
|
$
|
—
|
|
$
|
252
|
|
$
|
63
|
|
$
|
—
|
|
$
|
315
|
|
||||
|
Accounts receivable:
|
|
|
|
|
|
||||||||||||||
|
Trade, net
|
—
|
|
480
|
|
56
|
|
—
|
|
536
|
|
|||||||||
|
Other
|
—
|
|
19
|
|
16
|
|
—
|
|
35
|
|
|||||||||
|
Related party receivable
|
11
|
|
2
|
|
—
|
|
(13
|
)
|
—
|
|
|||||||||
|
Inventories
|
—
|
|
220
|
|
24
|
|
—
|
|
244
|
|
|||||||||
|
Deferred tax assets
|
—
|
|
52
|
|
5
|
|
—
|
|
57
|
|
|||||||||
|
Prepaid expenses and other current assets
|
133
|
|
81
|
|
20
|
|
(112
|
)
|
122
|
|
|||||||||
|
Total current assets
|
144
|
|
1,106
|
|
184
|
|
(125
|
)
|
1,309
|
|
|||||||||
|
Property, plant and equipment, net
|
—
|
|
1,093
|
|
75
|
|
—
|
|
1,168
|
|
|||||||||
|
Investments in consolidated subsidiaries
|
3,769
|
|
513
|
|
—
|
|
(4,282
|
)
|
—
|
|
|||||||||
|
Investments in unconsolidated subsidiaries
|
—
|
|
—
|
|
11
|
|
—
|
|
11
|
|
|||||||||
|
Goodwill
|
—
|
|
2,961
|
|
23
|
|
—
|
|
2,984
|
|
|||||||||
|
Other intangible assets, net
|
—
|
|
2,608
|
|
83
|
|
—
|
|
2,691
|
|
|||||||||
|
Long-term receivable, related parties
|
2,845
|
|
2,453
|
|
138
|
|
(5,436
|
)
|
—
|
|
|||||||||
|
Other non-current assets
|
434
|
|
110
|
|
8
|
|
—
|
|
552
|
|
|||||||||
|
Non-current deferred tax assets
|
—
|
|
—
|
|
144
|
|
—
|
|
144
|
|
|||||||||
|
Total assets
|
$
|
7,192
|
|
$
|
10,844
|
|
$
|
666
|
|
$
|
(9,843
|
)
|
$
|
8,859
|
|
||||
|
Current liabilities:
|
|
|
|
|
|
||||||||||||||
|
Accounts payable
|
$
|
—
|
|
$
|
276
|
|
$
|
22
|
|
$
|
—
|
|
$
|
298
|
|
||||
|
Related party payable
|
—
|
|
11
|
|
2
|
|
(13
|
)
|
—
|
|
|||||||||
|
Deferred revenue
|
—
|
|
63
|
|
2
|
|
—
|
|
65
|
|
|||||||||
|
Current portion of long-term obligations
|
404
|
|
—
|
|
—
|
|
—
|
|
404
|
|
|||||||||
|
Income taxes payable
|
—
|
|
113
|
|
17
|
|
(112
|
)
|
18
|
|
|||||||||
|
Other current liabilities
|
80
|
|
429
|
|
44
|
|
—
|
|
553
|
|
|||||||||
|
Total current liabilities
|
484
|
|
892
|
|
87
|
|
(125
|
)
|
1,338
|
|
|||||||||
|
Long-term obligations to third parties
|
1,677
|
|
10
|
|
—
|
|
—
|
|
1,687
|
|
|||||||||
|
Long-term obligations to related parties
|
2,454
|
|
2,982
|
|
—
|
|
(5,436
|
)
|
—
|
|
|||||||||
|
Non-current deferred tax liabilities
|
—
|
|
1,083
|
|
—
|
|
—
|
|
1,083
|
|
|||||||||
|
Non-current deferred revenue
|
—
|
|
1,467
|
|
48
|
|
—
|
|
1,515
|
|
|||||||||
|
Other non-current liabilities
|
118
|
|
641
|
|
18
|
|
—
|
|
777
|
|
|||||||||
|
Total liabilities
|
4,733
|
|
7,075
|
|
153
|
|
(5,561
|
)
|
6,400
|
|
|||||||||
|
Total stockholders' equity
|
2,459
|
|
3,769
|
|
513
|
|
(4,282
|
)
|
2,459
|
|
|||||||||
|
Total liabilities and stockholders' equity
|
$
|
7,192
|
|
$
|
10,844
|
|
$
|
666
|
|
$
|
(9,843
|
)
|
$
|
8,859
|
|
||||
105
DR PEPPER SNAPPLE GROUP, INC.
NOTES TO AUDITED CONSOLIDATED FINANCIAL STATEMENTS - (Continued)
|
|
Condensed Consolidating Statement of Cash Flows
|
||||||||||||||||||
|
|
For the Year Ended December 31, 2011
|
||||||||||||||||||
|
|
Parent
|
Guarantors
|
Non-Guarantors
|
Eliminations
|
Total
|
||||||||||||||
|
Operating activities:
|
|
|
|
|
|
||||||||||||||
|
Net cash provided by (used in) operating activities
|
$
|
(156
|
)
|
$
|
844
|
|
$
|
72
|
|
$
|
—
|
|
$
|
760
|
|
||||
|
Investing activities:
|
|
|
|
|
|
||||||||||||||
|
Purchase of property, plant and equipment
|
—
|
|
(194
|
)
|
(21
|
)
|
—
|
|
(215
|
)
|
|||||||||
|
Purchase of intangible assets
|
—
|
|
(3
|
)
|
—
|
|
—
|
|
(3
|
)
|
|||||||||
|
Investments in unconsolidated subsidiaries
|
(2
|
)
|
—
|
|
—
|
|
—
|
|
(2
|
)
|
|||||||||
|
Proceeds from disposals of property, plant and equipment
|
—
|
|
2
|
|
1
|
|
—
|
|
3
|
|
|||||||||
|
Proceeds from disposals of intangible assets
|
—
|
|
—
|
|
—
|
|
—
|
|
—
|
|
|||||||||
|
Return of capital
|
—
|
|
10
|
|
(10
|
)
|
—
|
|
—
|
|
|||||||||
|
Issuance of related party notes receivable
|
—
|
|
(916
|
)
|
(39
|
)
|
955
|
|
—
|
|
|||||||||
|
Repayment of related party notes receivable
|
400
|
|
1,000
|
|
—
|
|
(1,400
|
)
|
—
|
|
|||||||||
|
Other, net
|
—
|
|
—
|
|
—
|
|
—
|
|
—
|
|
|||||||||
|
Net cash provided by (used in) investing activities
|
398
|
|
(101
|
)
|
(69
|
)
|
(445
|
)
|
(217
|
)
|
|||||||||
|
Financing activities:
|
|
|
|
|
|
||||||||||||||
|
Proceeds from issuance of related party long-term debt
|
916
|
|
39
|
|
—
|
|
(955
|
)
|
—
|
|
|||||||||
|
Proceeds from repayment of related party long-term debt
|
—
|
|
—
|
|
—
|
|
—
|
|
—
|
|
|||||||||
|
Proceeds from senior unsecured notes and senior unsecured credit facility
|
1,000
|
|
—
|
|
—
|
|
—
|
|
1,000
|
|
|||||||||
|
Repayment of related party long-term debt
|
(1,000
|
)
|
(400
|
)
|
—
|
|
1,400
|
|
—
|
|
|||||||||
|
Repayment of senior unsecured notes and senior unsecured credit facility
|
(400
|
)
|
—
|
|
—
|
|
—
|
|
(400
|
)
|
|||||||||
|
Repurchase of shares of common stock
|
(522
|
)
|
—
|
|
—
|
|
—
|
|
(522
|
)
|
|||||||||
|
Dividends paid
|
(251
|
)
|
—
|
|
—
|
|
—
|
|
(251
|
)
|
|||||||||
|
Proceeds from stock options exercised
|
20
|
|
—
|
|
—
|
|
—
|
|
20
|
|
|||||||||
|
Excess tax benefit on stock-based compensation
|
—
|
|
10
|
|
—
|
|
—
|
|
10
|
|
|||||||||
|
Other, net
|
(5
|
)
|
(4
|
)
|
—
|
|
—
|
|
(9
|
)
|
|||||||||
|
Net cash provided by (used in) financing activities
|
(242
|
)
|
(355
|
)
|
—
|
|
445
|
|
(152
|
)
|
|||||||||
|
Cash and cash equivalents — net change from:
|
|
|
|
|
|
||||||||||||||
|
Operating, investing and financing activities
|
—
|
|
388
|
|
3
|
|
—
|
|
391
|
|
|||||||||
|
Effect of exchange rate changes on cash and cash equivalents
|
—
|
|
1
|
|
(6
|
)
|
—
|
|
(5
|
)
|
|||||||||
|
Cash and cash equivalents at beginning of year
|
—
|
|
252
|
|
63
|
|
—
|
|
315
|
|
|||||||||
|
Cash and cash equivalents at end of year
|
$
|
—
|
|
$
|
641
|
|
$
|
60
|
|
$
|
—
|
|
$
|
701
|
|
||||
106
DR PEPPER SNAPPLE GROUP, INC.
NOTES TO AUDITED CONSOLIDATED FINANCIAL STATEMENTS - (Continued)
|
|
Condensed Consolidating Statement of Cash Flows
|
||||||||||||||||||
|
|
For the Year Ended December 31, 2010
|
||||||||||||||||||
|
|
Parent
|
Guarantors
|
Non-Guarantors
|
Eliminations
|
Total
|
||||||||||||||
|
Operating activities:
|
|
|
|
|
|
||||||||||||||
|
Net cash provided by (used in) operating activities
|
$
|
(144
|
)
|
$
|
2,559
|
|
$
|
120
|
|
$
|
—
|
|
$
|
2,535
|
|
||||
|
Investing activities:
|
|
|
|
|
|||||||||||||||
|
Purchase of property, plant and equipment
|
—
|
|
(226
|
)
|
(20
|
)
|
—
|
|
(246
|
)
|
|||||||||
|
Purchase of intangible assets
|
—
|
|
—
|
|
—
|
|
—
|
|
—
|
|
|||||||||
|
Investments in unconsolidated subsidiaries
|
(1
|
)
|
—
|
|
—
|
|
—
|
|
(1
|
)
|
|||||||||
|
Proceeds from disposals of property, plant and equipment
|
—
|
|
18
|
|
—
|
|
—
|
|
18
|
|
|||||||||
|
Proceeds from disposals of intangible assets
|
—
|
|
—
|
|
—
|
|
—
|
|
—
|
|
|||||||||
|
Return of capital
|
—
|
|
41
|
|
(41
|
)
|
—
|
|
—
|
|
|||||||||
|
Issuance of related party notes receivable
|
—
|
|
(2,020
|
)
|
(204
|
)
|
2,224
|
|
—
|
|
|||||||||
|
Repayment of related party notes receivable
|
405
|
|
—
|
|
—
|
|
(405
|
)
|
—
|
|
|||||||||
|
Other, net
|
—
|
|
4
|
|
—
|
|
—
|
|
4
|
|
|||||||||
|
Net cash provided by (used in) investing activities
|
404
|
|
(2,183
|
)
|
(265
|
)
|
1,819
|
|
(225
|
)
|
|||||||||
|
Financing activities:
|
|
|
|
|
|
||||||||||||||
|
Proceeds from issuance of related party long-term debt
|
2,020
|
|
204
|
|
—
|
|
(2,224
|
)
|
—
|
|
|||||||||
|
Proceeds from repayment of related party long-term debt
|
—
|
|
—
|
|
113
|
|
(113
|
)
|
—
|
|
|||||||||
|
Proceeds from senior unsecured notes and senior unsecured credit facility
|
—
|
|
—
|
|
—
|
|
—
|
|
—
|
|
|||||||||
|
Repayment of related party long-term debt
|
—
|
|
(518
|
)
|
—
|
|
518
|
|
—
|
|
|||||||||
|
Repayment of senior unsecured notes and senior unsecured credit facility
|
(978
|
)
|
—
|
|
—
|
|
—
|
|
(978
|
)
|
|||||||||
|
Repurchase of shares of common stock
|
(1,113
|
)
|
—
|
|
—
|
|
—
|
|
(1,113
|
)
|
|||||||||
|
Dividends paid
|
(194
|
)
|
—
|
|
—
|
|
—
|
|
(194
|
)
|
|||||||||
|
Proceeds from stock options exercised
|
6
|
|
—
|
|
—
|
|
—
|
|
6
|
|
|||||||||
|
Excess tax benefit on stock-based compensation
|
—
|
|
3
|
|
—
|
|
—
|
|
3
|
|
|||||||||
|
Other, net
|
(1
|
)
|
(3
|
)
|
—
|
|
—
|
|
(4
|
)
|
|||||||||
|
Net cash provided by (used in) financing activities
|
(260
|
)
|
(314
|
)
|
113
|
|
(1,819
|
)
|
(2,280
|
)
|
|||||||||
|
Cash and cash equivalents — net change from:
|
|
|
|
|
|
||||||||||||||
|
Operating, investing and financing activities
|
—
|
|
62
|
|
(32
|
)
|
—
|
|
30
|
|
|||||||||
|
Effect of exchange rate changes on cash and cash equivalents
|
—
|
|
(1
|
)
|
6
|
|
—
|
|
5
|
|
|||||||||
|
Cash and cash equivalents at beginning of year
|
—
|
|
191
|
|
89
|
|
—
|
|
280
|
|
|||||||||
|
Cash and cash equivalents at end of year
|
$
|
—
|
|
$
|
252
|
|
$
|
63
|
|
$
|
—
|
|
$
|
315
|
|
||||
107
DR PEPPER SNAPPLE GROUP, INC.
NOTES TO AUDITED CONSOLIDATED FINANCIAL STATEMENTS - (Continued)
|
|
Condensed Consolidating Statement of Cash Flows
|
||||||||||||||||||
|
|
For the Year Ended December 31, 2009
|
||||||||||||||||||
|
|
Parent
|
Guarantors
|
Non-Guarantors
|
Eliminations
|
Total
|
||||||||||||||
|
Operating activities:
|
|
|
|
|
|
||||||||||||||
|
Net cash provided by (used in) operating activities
|
$
|
(215
|
)
|
$
|
1,023
|
|
$
|
57
|
|
$
|
—
|
|
$
|
865
|
|
||||
|
Investing activities:
|
|
|
|
|
|
||||||||||||||
|
Purchase of property, plant and equipment
|
—
|
|
(302
|
)
|
(15
|
)
|
—
|
|
(317
|
)
|
|||||||||
|
Purchase of intangible assets
|
—
|
|
(8
|
)
|
—
|
|
—
|
|
(8
|
)
|
|||||||||
|
Investments in unconsolidated subsidiaries
|
—
|
|
—
|
|
—
|
|
—
|
|
—
|
|
|||||||||
|
Proceeds from disposals of property, plant and equipment
|
—
|
|
5
|
|
—
|
|
—
|
|
5
|
|
|||||||||
|
Proceeds from disposals of intangible assets
|
—
|
|
63
|
|
6
|
|
—
|
|
69
|
|
|||||||||
|
Return of capital
|
—
|
|
—
|
|
—
|
|
—
|
|
—
|
|
|||||||||
|
Issuance of related party notes receivable
|
—
|
|
(370
|
)
|
(35
|
)
|
405
|
|
—
|
|
|||||||||
|
Repayment of related party notes receivable
|
398
|
|
—
|
|
—
|
|
(398
|
)
|
—
|
|
|||||||||
|
Other, net
|
—
|
|
—
|
|
—
|
|
—
|
|
—
|
|
|||||||||
|
Net cash provided by (used in) investing activities
|
398
|
|
(612
|
)
|
(44
|
)
|
7
|
|
(251
|
)
|
|||||||||
|
Financing activities:
|
|
|
|
|
|
||||||||||||||
|
Proceeds from issuance of related party long-term debt
|
370
|
|
35
|
|
—
|
|
(405
|
)
|
—
|
|
|||||||||
|
Proceeds from repayment of related party long-term debt
|
—
|
|
—
|
|
—
|
|
—
|
|
—
|
|
|||||||||
|
Proceeds from senior unsecured notes and senior unsecured credit facility
|
1,255
|
|
—
|
|
—
|
|
—
|
|
1,255
|
|
|||||||||
|
Repayment of related party long-term debt
|
—
|
|
(398
|
)
|
—
|
|
398
|
|
—
|
|
|||||||||
|
Repayment of senior unsecured notes and senior unsecured credit facility
|
(1,805
|
)
|
—
|
|
—
|
|
—
|
|
(1,805
|
)
|
|||||||||
|
Repurchase of shares of common stock
|
—
|
|
—
|
|
—
|
|
—
|
|
—
|
|
|||||||||
|
Dividends paid
|
—
|
|
—
|
|
—
|
|
—
|
|
—
|
|
|||||||||
|
Proceeds from stock options exercised
|
1
|
|
—
|
|
—
|
|
—
|
|
1
|
|
|||||||||
|
Excess tax benefit on stock-based compensation
|
—
|
|
—
|
|
—
|
|
—
|
|
—
|
|
|||||||||
|
Other, net
|
(2
|
)
|
(3
|
)
|
—
|
|
—
|
|
(5
|
)
|
|||||||||
|
Net cash provided by (used in) financing activities
|
(181
|
)
|
(366
|
)
|
—
|
|
(7
|
)
|
(554
|
)
|
|||||||||
|
Cash and cash equivalents — net change from:
|
|
|
|
|
|
||||||||||||||
|
Operating, investing and financing activities
|
2
|
|
45
|
|
13
|
|
—
|
|
60
|
|
|||||||||
|
Effect of exchange rate changes on cash and cash equivalents
|
(2
|
)
|
1
|
|
7
|
|
—
|
|
6
|
|
|||||||||
|
Cash and cash equivalents at beginning of year
|
—
|
|
145
|
|
69
|
|
—
|
|
214
|
|
|||||||||
|
Cash and cash equivalents at end of year
|
$
|
—
|
|
$
|
191
|
|
$
|
89
|
|
$
|
—
|
|
$
|
280
|
|
||||
108
DR PEPPER SNAPPLE GROUP, INC.
NOTES TO AUDITED CONSOLIDATED FINANCIAL STATEMENTS - (Continued)
|
21.
|
Agreement with PepsiCo
|
On February 26, 2010, the Company completed the licensing of certain brands to PepsiCo following PepsiCo's acquisitions of The Pepsi Bottling Group, Inc. ("PBG") and PepsiAmericas, Inc. ("PAS").
Under the licensing agreements, PepsiCo began distributing Dr Pepper, Crush and Schweppes in the U.S. territories where these brands were previously being distributed by PBG and PAS. The same applies to Dr Pepper, Crush, Schweppes, Vernors and Sussex in Canada; and Squirt and Canada Dry in Mexico.
Additionally, in U.S. territories where it has a distribution footprint, DPS is selling certain owned and licensed brands, including Sunkist soda, Squirt, Vernors and Hawaiian Punch, that were previously distributed by PBG and PAS.
Under the agreements, DPS received a one-time nonrefundable cash payment of
$900 million
. The agreements have an initial period of
20
years with automatic
20
-year renewal periods, and requires PepsiCo to meet certain performance conditions. The payment was recorded as deferred revenue and recognized as net sales ratably over the estimated
25
-year life of the customer relationship.
|
22.
|
Agreement with Coca-Cola
|
On October 4, 2010, the Company completed the licensing of certain brands to Coca-Cola following Coca-Cola's acquisition of Coca-Cola Enterprises' ("CCE") North American Bottling Business and executed separate agreements pursuant to which Coca-Cola began offering Dr Pepper and Diet Dr Pepper in local fountain accounts and the Freestyle fountain program.
Under the licensing agreements, Coca-Cola distributes Dr Pepper in the U.S. and Canada Dry in the Northeast U.S. where these brands were previously being distributed by CCE. The same applies to Canada Dry and C Plus in Canada. As part of the U.S. licensing agreement, Coca-Cola has agreed to offer Dr Pepper and Diet Dr Pepper in its local fountain accounts. The agreements have an initial period of
20
years with automatic
20
-year renewal periods, and requires Coca-Cola to meet certain performance conditions.
Under a separate agreement, Coca-Cola has agreed to include Dr Pepper and Diet Dr Pepper brands in its Freestyle fountain program. The Freestyle fountain program agreement has a period of
20
years. Additionally, in certain U.S. territories where it has a distribution footprint, DPS is selling certain owned and licensed brands, including Canada Dry, Schweppes, Squirt and Cactus Cooler, that were previously distributed by CCE.
Under this arrangement, DPS received a one-time nonrefundable cash payment of
$715 million
, which was recorded net, as no competent or verifiable evidence of fair value could be determined for the significant elements in this arrangement. The total cash consideration was recorded as deferred revenue and recognized as net sales ratably over the estimated
25
-year life of the customer relationship.
109
DR PEPPER SNAPPLE GROUP, INC.
NOTES TO AUDITED CONSOLIDATED FINANCIAL STATEMENTS - (Continued)
|
23.
|
Selected Quarterly Financial Data (unaudited)
|
The following table summarizes the Company's information on net sales, gross profit, net income and earnings per share by quarter for the years ended
December 31, 2011
and
2010
. This data was derived from the Company's unaudited consolidated financial statements (in millions, except per share data).
|
|
First
|
Second
|
Third
|
Fourth
|
|||||||||||
|
For the Year Ended December 31,
|
Quarter
|
Quarter
|
Quarter
|
Quarter
|
|||||||||||
|
2011
|
|
|
|
|
|
|
|
|
|||||||
|
Net sales
|
$
|
1,331
|
|
$
|
1,582
|
|
$
|
1,529
|
|
$
|
1,461
|
|
|||
|
Gross profit
|
784
|
|
920
|
|
857
|
|
857
|
|
|||||||
|
Net income
|
114
|
|
172
|
|
154
|
|
166
|
|
|||||||
|
Earnings per common share — basic
|
$
|
0.51
|
|
$
|
0.78
|
|
$
|
0.71
|
|
$
|
0.78
|
|
|||
|
Earnings per common share — diluted
|
0.50
|
|
0.77
|
|
0.71
|
|
0.77
|
|
|||||||
|
Dividend declared per share
|
0.25
|
|
0.32
|
|
0.32
|
|
0.32
|
|
|||||||
|
Common stock price
|
|||||||||||||||
|
High
|
$
|
37.97
|
|
$
|
42.28
|
|
$
|
42.81
|
|
$
|
40.12
|
|
|||
|
Low
|
33.73
|
|
37.41
|
|
35.01
|
|
34.78
|
|
|||||||
|
2010
|
|
|
|
|
|
|
|
|
|||||||
|
Net sales
|
$
|
1,248
|
|
$
|
1,519
|
|
$
|
1,457
|
|
$
|
1,412
|
|
|||
|
Gross profit
|
752
|
|
926
|
|
857
|
|
858
|
|
|||||||
|
Net income
|
89
|
|
183
|
|
144
|
|
112
|
|
|||||||
|
Earnings per common share — basic
|
$
|
0.35
|
|
$
|
0.75
|
|
$
|
0.61
|
|
$
|
0.49
|
|
|||
|
Earnings per common share — diluted
|
0.35
|
|
0.74
|
|
0.60
|
|
0.49
|
|
|||||||
|
Dividend declared per share
|
0.15
|
|
0.25
|
|
0.25
|
|
0.25
|
|
|||||||
|
Common stock price
|
|||||||||||||||
|
High
|
$
|
36.80
|
|
$
|
38.24
|
|
$
|
40.10
|
|
$
|
38.08
|
|
|||
|
Low
|
26.84
|
|
32.73
|
|
33.94
|
|
33.89
|
|
|||||||
110
ITEM 9.
CHANGES IN AND DISAGREEMENTS WITH ACCOUNTANTS ON ACCOUNTING AND FINANCIAL DISCLOSURE
Not applicable.
ITEM 9A.
CONTROLS AND PROCEDURES
Disclosure Controls and Procedures
Based on evaluation of the effectiveness of our disclosure controls and procedures (as defined in Rule 13a-15(e) and 15d-15(e) of the Exchange Act) our management, including our Chief Executive Officer and Chief Financial Officer, has concluded that, as of
December 31, 2011
, our disclosure controls and procedures are effective to (i) provide reasonable assurance that information required to be disclosed in the Exchange Act filings is recorded, processed, summarized and reported within the time periods specified by the Securities and Exchange Commission's rules and forms, and (ii) ensure that information required to be disclosed by us in the reports we file or submit under the Exchange Act are accumulated and communicated to our management, including our Chief Executive Officer and Chief Financial Officer, as appropriate to allow timely decisions regarding required disclosure.
Management's Annual Report on Internal Control Over Financial Reporting
Our management is responsible for establishing and maintaining adequate internal control over financial reporting, as such term is defined in Rule 13a-15(f) and 15d-15(f)of the Exchange Act. Under the supervision of our management, including our Chief Executive Officer and Chief Financial Officer, we conducted an evaluation of the effectiveness of our internal control over financial reporting. In making its assessment of internal control over financial reporting, management used criteria issued by the Committee of Sponsoring Organizations of the Treadway Commission (COSO) in
Internal Control-Integrated Framework
. Based on that evaluation, our management concluded that our internal control over financial reporting is effective as of
December 31, 2011
.
Attestation Report of the Independent Registered Public Accounting Firm
The effectiveness of our internal control over financial reporting as of
December 31, 2011
, has been audited by Deloitte & Touche LLP, our independent registered public accounting firm, as stated in their attestation report, which is included in Item 8, "Financial Statements and Supplementary Data," of the Annual Report on Form 10-K.
Changes in Internal Control Over Financial Reporting
As of
December 31, 2011
, management has concluded that there have been no changes in our internal controls over financial reporting that occurred during our fourth quarter that have materially affected, or are reasonably likely to materially affect, our internal control over financial reporting.
ITEM 9B.
OTHER INFORMATION
None.
Pursuant to Instruction G(3) to Form 10-K, the information required in Items 10 through 14 is incorporated by reference from our definitive proxy statement, which is incorporated herein by reference.
111
ITEM 15.
EXHIBITS, FINANCIAL STATEMENT SCHEDULES
Financial Statements
The following financial statements are included in Part II, Item 8, "Financial Statements and Supplementary Data," in this Annual Report on Form 10-K:
|
•
|
Consolidated Statements of Income for the years ended
December 31, 2011
,
2010
and
2009
|
|
•
|
Consolidated Balance Sheets as of
December 31, 2011
and
2010
|
|
•
|
Consolidated Statements of Cash Flows for the years ended
December 31, 2011
,
2010
and
2009
|
|
•
|
Consolidated Statements of Changes in Stockholders' Equity for the years ended
December 31, 2011
,
2010
and
2009
|
|
•
|
Notes to Consolidated Financial Statements for the years ended
December 31, 2011
,
2010
and
2009
|
Schedules
Schedules are omitted because they are not required or applicable, or the required information is included in the Consolidated Financial Statements or related notes.
Exhibits
See Index to Exhibits.
112
EXHIBIT INDEX
|
2.1
|
Separation and Distribution Agreement between Cadbury Schweppes plc and Dr Pepper Snapple Group, Inc. and, solely for certain provisions set forth therein, Cadbury plc, dated as of May 1, 2008 (filed as Exhibit 2.1 to the Company's Current Report on Form 8-K (filed on May 5, 2008) and incorporated herein by reference).
|
|
3.1
|
Amended and Restated Certificate of Incorporation of Dr Pepper Snapple Group, Inc. (filed as Exhibit 3.1 to the Company's Current Report on Form 8-K (filed on May 12, 2008) and incorporated herein by reference).
|
|
3.2
|
Amended and Restated By-Laws of Dr Pepper Snapple Group, Inc. (filed as Exhibit 3.1 to the Company's Current Report on Form 8-K (filed on July 16, 2009) and incorporated herein by reference).
|
|
4.1
|
Indenture, dated April 30, 2008, between Dr Pepper Snapple Group, Inc. and Wells Fargo Bank, N.A. (filed an Exhibit 4.1 to the Company's Current Report on Form 8-K (filed on May 1, 2008) and incorporated herein by reference).
|
|
4.2
|
Form of 6.12% Senior Notes due 2013 (filed as Exhibit 4.2 to the Company's Current Report on Form 8-K (filed on May 1, 2008) and incorporated herein by reference).
|
|
4.3
|
Form of 6.82% Senior Notes due 2013 (filed as Exhibit 4.3 to the Company's Current Report on Form 8-K (filed on May 1, 2008) and incorporated herein by reference).
|
|
4.4
|
Form of 7.45% Senior Notes due 2013 (filed as Exhibit 4.4 to the Company's Current Report on Form 8-K (filed on May 1, 2008) and incorporated herein by reference).
|
|
4.5
|
Registration Rights Agreement, dated April 30, 2008, between Dr Pepper Snapple Group, Inc., J.P. Morgan Securities Inc., Banc of America Securities LLC, Goldman, Sachs & Co., Morgan Stanley & Co. Incorporated, UBS Securities LLC, BNP Paribas Securities Corp., Mitsubishi UFJ Securities International plc, Scotia Capital (USA) Inc., SunTrust Robinson Humphrey, Inc., Wachovia Capital Markets, LLC and TD Securities (USA) LLC (filed as Exhibit 4.5 to the Company's Current Report on Form 8-K (filed on May 1, 2008) and incorporated herein by reference).
|
|
4.6
|
Registration Rights Agreement Joinder, dated May 7, 2008, by the subsidiary guarantors named therein (filed as Exhibit 4.2 to the Company's Current Report on Form 8-K (filed on May 12, 2008) and incorporated herein by reference).
|
|
4.7
|
Supplemental Indenture, dated May 7, 2008, among Dr Pepper Snapple Group, Inc., the subsidiary guarantors named therein and Wells Fargo Bank, N.A., as trustee (filed as Exhibit 4.1 to the Company's Current Report on Form 8-K (filed on May 12, 2008) and incorporated herein by reference).
|
|
4.8
|
Second Supplemental Indenture dated March 17, 2009, to be effective as of December 31, 2008, among Splash Transport, Inc., as a subsidiary guarantor, Dr Pepper Snapple Group, Inc., and Wells Fargo Bank, N.A., as trustee (filed as Exhibit 4.8 to the Company's Annual Report on Form 10-K (filed on March 26, 2009) and incorporated herein by reference).
|
|
4.9
|
Third Supplemental Indenture, dated October 19, 2009, among 234DP Aviation, LLC, as a subsidiary guarantor; Dr Pepper Snapple Group, Inc., and Wells Fargo Bank, N.A., as trustee (filed as Exhibit 4.9 to the Company's Quarterly Report on Form 10-Q (filed November 5, 2009) and incorporated herein by reference).
|
|
4.10
|
Indenture, dated as of December 15, 2009, between Dr Pepper Snapple Group, Inc. and Wells Fargo Bank, N.A., as trustee (filed as Exhibit 4.1 to the Company's Current Report on Form 8-K (filed on December 23, 2009) and incorporated herein by reference).
|
|
4.11
|
First Supplemental Indenture, dated as of December 21, 2009, among Dr Pepper Snapple Group, Inc., the guarantors party thereto and Wells Fargo Bank, N.A., as trustee (filed as Exhibit 4.2 to the Company's Current Report on Form 8-K (filed on December 23, 2009) and incorporated herein by reference).
|
|
4.12
|
1.70% Senior Notes due 2011 (in global form) (filed as Exhibit 4.3 to the Company’s Current Report on Form 8-K (filed on December 23, 2009) and incorporated herein by reference).
|
|
4.13
|
2.35% Senior Notes due 2012 (in global form) (filed as Exhibit 4.4 to the Company's Current Report on Form 8-K (filed on December 23, 2009) and incorporated herein by reference).
|
|
4.14
|
Second Supplemental Indenture, dated as of January 11, 2011, among Dr Pepper Snapple Group, Inc., the guarantors party thereto and Wells Fargo Bank, N.A., as trustee (filed as Exhibit 4.1 to the Company's Current Report on Form 8-K (filed on January 11, 2011) and incorporated herein by reference).
|
|
4.15
|
2.90% Senior Note due 2016 (in global form), dated January 11, 2011, in the principal amount of $500 million (filed as Exhibit 4.2 to the Company's Current Report on Form 8-K (filed on January 11, 2011) and incorporated herein by reference).
|
|
4.16
|
Third Supplemental Indenture, dated as of November 15, 2011, among Dr Pepper Snapple Group, Inc., the guarantors party thereto and Wells Fargo Bank, N.A., as trustee (filed as Exhibit 4.1 to the Company's Current Report on Form 8-K (filed on November 15, 2011) and incorporated herein by reference).
|
|
4.17
|
2.60% Senior Note due 2019 (in global form), dated November 15, 2011, in the principal amount of $250 million (filed as Exhibit 4.2 to the Company's Current Report on Form 8-K (filed on November 15, 2011) and incorporated herein by reference).
|
113
|
4.18
|
3.20% Senior Note due 2021 (in global form), dated November 15, 2011, in the principal amount of $250 million (filed as Exhibit 4.3 to the Company's Current Report on Form 8-K (filed on November 15, 2011) and incorporated herein by reference).
|
|
10.1
|
Transition Services Agreement between Cadbury Schweppes plc and Dr Pepper Snapple Group, Inc., dated as of May 1, 2008 (initially filed as Exhibit 10.1 to the Company’s Current Report on Form 8-K (filed on May 5, 2008), refiled as Exhibit 10.1 to the Company's Quarterly Report on Form 10-Q (filed on May 6, 2010) solely for the purpose of including previously omitted exhibits and incorporated herein by reference).
|
|
10.2
|
Tax Sharing and Indemnification Agreement between Cadbury Schweppes plc and Dr Pepper Snapple Group, Inc. and, solely for the certain provision set forth therein, Cadbury plc, dated as of May 1, 2008 (initially filed as Exhibit 10.2 to the Company’s Current Report on Form 8-K (initially filed on May 5, 2008), refiled as Exhibit 10.2 to the Company's Quarterly Report on Form 10-Q (filed on May 6, 2010) solely for the purpose of including previously omitted exhibits and incorporated herein by reference).
|
|
10.3
|
Employee Matters Agreement between Cadbury Schweppes plc and Dr Pepper Snapple Group, Inc. and, solely for certain provisions set forth therein, Cadbury plc, dated as of May 1, 2008 (initially filed as Exhibit 10.3 to the Company’s Current Report on Form 8-K (filed on May 5, 2008), refiled as Exhibit 10.3 to the Company's Quarterly Report on Form 10-Q (filed on May 6, 2010) solely for the purpose of including previously omitted exhibits and incorporated herein by reference).
|
|
10.4
|
Agreement, dated June 15, 2004, between Cadbury Schweppes Bottling Group, Inc. (which was merged into The American Bottling Group) and CROWN Cork & Seal USA, Inc. (filed as Exhibit 10.4 to Amendment No. 2 to the Company’s Registration Statement on Form 10 (filed on February 12, 2008).
|
|
10.5
|
First Amendment to the Agreement between Cadbury Schweppes Bottling Group, Inc. (which was merged into The American Bottling Group) and CROWN Cork & Seal USA, Inc., dated August 25, 2005 (filed as Exhibit 10.5 to Amendment No. 2 to the Company’s Registration Statement on Form 10 (filed on February 12, 2008).
|
|
10.6
|
Second Amendment to the Agreement between Cadbury Schweppes Bottling Group, Inc. (now known as The American Bottling Company) and CROWN Cork & Seal USA, Inc., dated June 21, 2006 (filed as Exhibit 10.6 to Amendment No. 2 to the Company’s Registration Statement on Form 10 (filed on February 12, 2008).
|
|
10.7
|
Third Amendment to the Agreement between Cadbury Schweppes Bottling Group, Inc. (now known as The American Bottling Company) and CROWN Cork & Seal USA, Inc., dated April 4, 2007 (filed as Exhibit 10.7 to Amendment No. 2 to the Company’s Registration Statement on Form 10 (filed on February 12, 2008).
|
|
10.8
|
Fourth Amendment to the Agreement between Cadbury Schweppes Bottling Group, Inc. (now known as The American Bottling Company) and CROWN Cork & Seal USA, Inc., dated September 27, 2007 (filed as Exhibit 10.8 to Amendment No. 2 to the Company’s Registration Statement on Form 10 (filed on February 12, 2008).
|
|
10.9
|
Agreement dated April 8, 2009, between The American Bottling Company and CROWN Cork & Seal USA, Inc. (filed as Exhibit 10.3 to the Company’s Quarterly Report on Form 10-Q (filed on May 13, 2009).
|
|
10.10
|
Form of Dr Pepper License Agreement for Bottles, Cans and Pre-mix (filed as Exhibit 10.9 to Amendment No. 2 to the Company’s Registration Statement on Form 10 (filed on February 12, 2008) and incorporated herein by reference).
|
|
10.11
|
Form of Dr Pepper Fountain Concentrate Agreement (filed as Exhibit 10.10 to Amendment No. 3 to the Company’s Registration Statement on Form 10 (filed on March 20, 2008) and incorporated herein by reference).
|
|
10.12
|
Executive Employment Agreement, dated as of October 15, 2007, between CBI Holdings Inc. (now known as DPS Holdings Inc.) and Larry D. Young (1) (filed as Exhibit 10.11 to Amendment No. 2 to the Company’s Registration Statement on Form 10 (filed on February 12, 2008) and incorporated herein by reference).
|
|
10.13
|
First Amendment to Executive Employment Agreement, effective as of February 11, 2009, between DPS Holdings, Inc. and Larry D. Young (filed as Exhibit 99.2 to the Company’s Current Report on Form 8-K (filed on February 18, 2009) and incorporated herein by reference).
|
|
10.14
|
Second Amendment to Executive Employment Agreement, effective as of August 11, 2009, between DPS Holdings, Inc. and Larry D. Young (filed as Exhibit 10.3 to the Company’s Quarterly Report on Form 10-Q (filed on August 13, 2009) and incorporated herein by reference).
|
|
10.15
|
Executive Employment Agreement, dated as of October 13, 2007, between CBI Holdings Inc. (now known as DPS Holdings Inc.) and John O. Stewart (1) (filed as Exhibit 10.12 to Amendment No. 2 to the Company’s Registration Statement on Form 10 (filed on February 12, 2008) and incorporated herein by reference).
|
|
10.16
|
Letter Agreement dated October 26, 2009, between Dr Pepper Snapple Group, Inc., DPS Holdings, Inc. and John O. Stewart, (filed as Exhibit 10.1 to the Company’s Current Report on Form 8-K (filed on October 27, 2009) and incorporated herein by reference).
|
|
10.17
|
First Amendment to the Letter Agreement, effective as of February 26, 2010, between Dr Pepper Snapple Group, Inc., DPS Holding, Inc. and John O. Stewart (filed as Exhibit 10.17 to the Company's Form 10-K (filed on February 26, 2010) and incorporated herein by reference).
|
|
10.18
|
Letter Agreement, effective as of November 23, 2008, between Dr Pepper Snapple Group, Inc. and James J. Johnston (filed as Exhibit 10.20 to the Company's Form 10-K (filed on February 26, 2010) and incorporated herein by reference).
|
114
|
10.19
|
Executive Employment Agreement, dated as of October 15, 2007, between CBI Holdings Inc. (now known as DPS Holdings Inc.) and Lawrence Solomon (filed as Exhibit 10.23 to the Company's Form 10-K (filed on February 26, 2010) and incorporated herein by reference).
|
|
10.20
|
Letter Agreement, effective as of November 23, 2008, between Dr Pepper Snapple Group, Inc. and Rodger L. Collins (filed as Exhibit 10.24 to the Company's Form 10-K (filed on February 26, 2010) and incorporated herein by reference).
|
|
10.21
|
Letter Agreement, effective as of April 1, 2010, between Dr Pepper Snapple Group, Inc. and Martin M. Ellen (filed as Exhibit 10.25 to the Company's Form 10-K (filed on February 26, 2010) and incorporated herein by reference).
|
|
10.22
|
Dr Pepper Snapple Group, Inc. Omnibus Stock Incentive Plan of 2008 (filed as Exhibit 10.2 to the Company’s Current Report on Form 8-K (filed on May 12, 2008) and incorporated herein by reference).
|
|
10.23
|
Dr Pepper Snapple Group, Inc. Employee Stock Purchase Plan (filed as Exhibit 10.4 to the Company’s Current Report on Form 8-K (filed on May 12, 2008) and incorporated herein by reference).
|
|
10.24
|
Dr Pepper Snapple Group, Inc. Omnibus Stock Incentive Plan of 2009 approved by the Stockholders on May 19, 2009 (filed as Exhibit 10.1 to the Company’s Current Report on Form 8-K (filed May 21, 2009) and incorporated herein by reference).
|
|
10.25
|
Dr Pepper Snapple Group, Inc. Management Incentive Plan of 2009 approved by the Stockholders on May 19, 2009 (filed as Exhibit 10.2 to the Company’s Current Report on Form 8-K (filed May 21, 2009) and incorporated herein by reference).
|
|
10.26
|
Amended and Restated Credit Agreement among Dr Pepper Snapple Group, Inc., various lenders and JPMorgan Chase Bank, N.A., as administrative agent, dated April 11, 2008 (filed as Exhibit 10.22 to Amendment No. 4 to the Company’s Registration Statement on Form 10 (filed on April 16, 2008) and incorporated herein by reference).
|
|
10.27
|
Guaranty Agreement, dated May 7, 2008, among the subsidiary guarantors named therein and JPMorgan Chase Bank, N.A., as administrative agent (filed as Exhibit 10.1 to the Company’s Current Report on Form 8-K (filed on May 12, 2008) and incorporated herein by reference).
|
|
10.28
|
Amendment No. 1 to Guaranty Agreement dated as of November 12, 2008, among Dr Pepper Snapple Group, Inc., the subsidiary guarantors named therein and JPMorgan Chase Bank, N.A., as administrative agent (which amends the Guaranty Agreement, dated May 7, 2008, referred hereto as Exhibit 10.24) (filed as Exhibit 10.4 to the Company’s Quarterly Report on Form 10-Q (filed on November 13, 2008) and incorporated herein by reference).
|
|
10.29
|
Underwriting Agreement dated December 14, 2009, among Morgan Stanley & Co. Incorporated and UBS Securities LLC, as managers of the several underwriters named in Schedule II thereto, and Dr Pepper Snapple Group, Inc. (filed as Exhibit 10.1 to the Company’s Current Report on Form 8-K (filed on December 17, 2009) and incorporated herein by reference).
|
|
10.30
|
Dr Pepper Snapple Group, Inc. 2008 Legacy Long Term Incentive Plan (filed as Exhibit 4.4 to the Company’s Registration Statement on Form S-8 (filed on September 16, 2008) and incorporated herein by reference).
|
|
10.31
|
Dr Pepper Snapple Group, Inc. 2008 Legacy Bonus Share Retention Plan, dated as of May 7, 2008 (filed as Exhibit 4.5 to the Company’s Registration Statement on Form S-8 (filed on September 16, 2008) and incorporated herein by reference).
|
|
10.32
|
Dr Pepper Snapple Group, Inc. 2008 Legacy International Share Award Plan, dated as of May 7, 2008 (filed as Exhibit 4.6 to the Company’s Registration Statement on Form S-8 (filed on September 16, 2008) and incorporated herein by reference).
|
|
10.33
|
Dr Pepper Snapple Group, Inc. Change in Control Severance Plan adopted on February 11, 2009 (filed as Exhibit 99.1 to the Company’s Current Report on Form 8-K (filed February 18, 2009) and incorporated herein by reference).
|
|
10.34
|
First Amendment to the Dr Pepper Snapple Group, Inc. Change in Control Severance Plan, effective as of February 24, 2010 (filed as Exhibit 10.40 to the Company's Form 10-K (filed on February 26, 2010) and incorporated herein by reference).
|
|
10.35
|
Letter Agreement, dated December 7, 2009, between Dr Pepper Snapple Group, Inc. and PepsiCo, Inc. (filed as Exhibit 10.1 to the Company’s Current Report on Form 8-K (filed on December 8, 2009) and incorporated herein by reference).
|
|
10.36
|
Letter Agreement, dated June 7, 2010, between Dr Pepper/Seven Up, Inc. and The Coca-Cola Company (filed as Exhibit 10.1 to the Company's Current Report on Form 8-K (filed on June 7, 2010) and incorporated herein by reference).
|
|
10.37
|
Amendment No. 1 to Amended and Restated Credit Agreement, dated as of November 4, 2010, by and among the Loan Parties and the Administrative Agent for itself and on behalf of the Lenders (filed as Exhibit 10.1 to the Company’s Current Report on Form 8-K (filed on November 8, 2010) and incorporated herein by reference).
|
|
10.38
|
Commercial Paper Dealer Agreement between Dr Pepper Snapple Group, Inc. and J.P. Morgan Securities LLC, dated as of December 10, 2010 (filed as Exhibit 10.1 to the Company’s Current Report on Form 8-K (filed on December 13, 2010) and incorporated herein by reference). In accordance with Instruction 2 to Item 601 of Regulation S-K, the Company has filed only one Dealer Agreement, as the other Dealer Agreements are substantially identical in all material respects except as to the parties thereto and the notice provisions.
|
115
|
10.39
|
Underwriting Agreement dated January 6, 2011, among J.P. Morgan Securities LLC , Merrill Lynch, Pierce Fenner & Smith Incorporated and UBS Securities LLC, as joint bookrunning managers and on behalf of the several underwriters named in Schedule II thereto, and Dr Pepper Snapple Group, Inc. filed as Exhibit 10.1 to the Company's Current Report on Form 8-K (filed on January 6, 2011) and incorporated herein by reference).
|
|
10.40
|
Underwriting Agreement dated November 7, 2011, among Deutsche Bank Securities Inc. and Morgan Stanley & Co. LLC, as joint book-running managers and on behalf of the other underwriters named therein, and Dr Pepper Snapple Group, Inc. (filed as Exhibit 10.1 to the Company's Current Report on Form 8-K (filed on November 7, 2011) and incorporated herein by reference).
|
|
12.1*
|
Computation of Ratio of Earnings to Fixed Charges.
|
|
21.1*
|
List of Subsidiaries (as of December 31, 2011).
|
|
23.1*
|
Consent of Deloitte & Touche LLP.
|
|
31.1*
|
Certification of Chief Executive Officer of Dr Pepper Snapple Group, Inc. pursuant to Rule 13a-14(a) or 15d-14(a) promulgated under the Exchange Act .
|
|
31.2*
|
Certification of Chief Financial Officer of Dr Pepper Snapple Group, Inc. pursuant to Rule 13a-14(a) or 15d-14(a) promulgated under the Exchange Act.
|
|
32.1**
|
Certification of Chief Executive Officer of Dr Pepper Snapple Group, Inc. pursuant to Rule 13a-14(b) or 15d-14(b) promulgated under the Exchange Act, and Section 1350 of Chapter 63 of Title 18 of the United States Code.
|
|
32.2**
|
Certification of Chief Financial Officer of Dr Pepper Snapple Group, Inc. pursuant to Rule 13a-14(b) or 15d-14(b) promulgated under the Exchange Act, and Section 1350 of Chapter 63 of Title 18 of the United States Code.
|
|
101**
|
The following financial information from Dr Pepper Snapple Group, Inc.'s Annual Report on Form 10-K for the year ended December 31, 2011, formatted in XBRL (eXtensible Business Reporting Language): (i) Consolidated Statements of Income for the years ended December 31, 2011, 2010 and 2009, (ii) Consolidated Balance Sheets as of December 31, 2011 and 2010, (iii) Consolidated Statements of Cash Flows for the years ended December 31, 2011, 2010 and 2009, (iv) Consolidated Statements of Changes in Stockholders' Equity and Other Comprehensive Income for the years ended December 31, 2011, 2010 and 2009, and (v) the Notes to Consolidated Financial Statements.
|
* Filed herewith.
** Furnished herewith.
116
SIGNATURES
Pursuant to the requirements of Section 13 or 15(d) of the Securities Exchange Act of 1934, the registrant has duly caused this report to be signed on its behalf by the undersigned thereunto duly authorized.
|
|
Dr Pepper Snapple Group, Inc.
|
||
|
|
|
|
|
|
|
By:
|
/s/ Martin M. Ellen
|
|
|
Date: February 22, 2012
|
|
Name:
|
Martin M. Ellen
|
|
|
|
Title:
|
Executive Vice President and Chief
Financial Officer
|
Pursuant to the requirements of the Securities Exchange Act of 1934, this report has been signed below by the following persons on behalf of the registrant and in the capacities and on the dates indicated.
|
|
By:
|
/s/ Larry D. Young
|
|
|
Date: February 22, 2012
|
|
Name:
|
Larry D. Young
|
|
|
|
Title:
|
President, Chief Executive Officer and
Director
|
|
|
|
|
|
|
|
|
|
|
|
|
By:
|
/s/ Martin M. Ellen
|
|
|
Date: February 22, 2012
|
|
Name:
|
Martin M. Ellen
|
|
|
|
Title:
|
Executive Vice President and Chief
Financial Officer |
|
|
|
|
|
|
|
|
|
|
|
|
By:
|
/s/ Angela A. Stephens
|
|
|
Date: February 22, 2012
|
|
Name:
|
Angela A. Stephens
|
|
|
|
Title:
|
Senior Vice President and Controller
(Principal Accounting Officer)
|
|
|
|
|
|
|
|
|
|
|
|
|
By:
|
/s/ Wayne R. Sanders
|
|
|
Date: February 22, 2012
|
|
Name:
|
Wayne R. Sanders
|
|
|
|
Title:
|
Chairman
|
|
|
|
|
|
|
|
|
|
|
|
|
By:
|
/s/ John L. Adams
|
|
|
Date: February 22, 2012
|
|
Name:
|
John L. Adams
|
|
|
|
Title:
|
Director
|
|
|
|
|
|
|
|
|
|
|
|
|
By:
|
/s/ David E. Alexander
|
|
|
Date: February 22, 2012
|
|
Name:
|
David E. Alexander
|
|
|
|
Title:
|
Director
|
|
|
|
|
|
|
|
|
|
|
117
|
|
By:
|
/s/ Terence D. Martin
|
|
|
Date: February 22, 2012
|
|
Name:
|
Terence D. Martin
|
|
|
|
Title:
|
Director
|
|
|
|
|
|
|
|
|
|
|
|
|
By:
|
/s/ Pamela H. Patsley
|
|
|
Date: February 22, 2012
|
|
Name:
|
Pamela H. Patsley
|
|
|
|
Title:
|
Director
|
|
|
|
|
|
|
|
|
|
|
|
|
By:
|
/s/ Joyce M. Roché
|
|
|
Date: February 22, 2012
|
|
Name:
|
Joyce M. Roché
|
|
|
|
Title:
|
Director
|
|
|
|
|
|
|
|
|
|
|
|
|
By:
|
/s/ Ronald G. Rogers
|
|
|
Date: February 22, 2012
|
|
Name:
|
Ronald G. Rogers
|
|
|
|
Title:
|
Director
|
|
|
|
|
|
|
|
|
|
|
|
|
By:
|
/s/ Jack L. Stahl
|
|
|
Date: February 22, 2012
|
|
Name:
|
Jack L. Stahl
|
|
|
|
Title:
|
Director
|
|
|
|
|
|
|
|
|
|
|
|
|
By:
|
/s/ M. Anne Szostak
|
|
|
Date: February 22, 2012
|
|
Name:
|
M. Anne Szostak
|
|
|
|
Title:
|
Director
|
|
|
By:
|
/s/ Mike Weinstein
|
|
|
Date: February 22, 2012
|
|
Name:
|
Mike Weinstein
|
|
|
|
Title:
|
Director
|
118
TABLE OF CONTENTS
Part IItem 1. BusinessItem 1A. Risk FactorsItem 1B. Unresolved Staff CommentsItem 2. PropertiesItem 3. Legal ProceedingsItem 4. Mine Safety DisclosuresPart IIItem 5. Market For Registrant S Common Equity, Related Stockholder Matters and Issuer Purchases Of Equity SecuritiesItem 6. Selected Financial DataItem 7. Management's Discussion and Analysis Of Financial Condition and Results Of OperationsItem 7A. Quantitative and Qualitative Disclosures About Market RiskItem 8. Financial Statements and Supplementary DataItem 9. Changes in and Disagreements with Accountants on Accounting and Financial DisclosureItem 9A. Controls and ProceduresItem 9B. Other InformationPart IIIPart IVItem 15. Exhibits, Financial Statement Schedules