KEURIG DR PEPPER INC.
10-Qs and 10-Ks
PROXIES
SECURITIES AND EXCHANGE COMMISSION
WASHINGTON, D.C. 20549
FORM
10-Q
FOR THE QUARTERLY PERIOD ENDED
MARCH 31, 2024
OR
FOR THE TRANSITION PERIOD FROM TO
Commission file number
001-33829

(Exact name of registrant as specified in its charter)
|
|
|
||||||||||
| (State or other jurisdiction of incorporation or organization) | (I.R.S. employer identification number) | ||||||||||
(Address of principal executive offices)
(Registrant's telephone number, including area code)
Securities registered pursuant to Section 12(b) of the Act:
| Title of each class | Trading Symbol | Name of each exchange on which registered | ||||||||||||
|
|
|
|
||||||||||||
Indicate by check mark whether the registrant (1) has filed all reports required to be filed by Section 13 or 15(d) of the Securities Exchange Act of 1934 during the preceding 12 months (or for such shorter period that the registrant was required to file such reports), and (2) has been subject to such filing requirements for the past 90 days.
Yes
☒
No ☐
Indicate by check mark whether the registrant has submitted electronically every Interactive Data File required to be submitted pursuant to Rule 405 of Regulation S-T (§232.405 of this chapter) during the preceding 12 months (or for such shorter period that the registrant was required to submit such files).
Yes
☒
No ☐
Indicate by check mark whether the registrant is a large accelerated filer, an accelerated filer, a non-accelerated filer, a smaller reporting company, or an emerging growth company. See the definitions of "large accelerated filer", "accelerated filer", "smaller reporting company", and "emerging growth company" in Rule 12b-2 of the Securities Exchange Act of 1934.
If an emerging growth company, indicate by check mark if the registrant has elected not to use the extended transition period for complying with any new or revised financial accounting standards provided pursuant to Section 13(a) of the Exchange Act. ☐
Indicate by check mark whether the registrant is a shell company (as defined in Rule 12b-2 of the Securities Exchange Act of 1934). Yes
☐
No
☒
As of April 23, 2024, there were
1,355,574,275
shares of the registrant's common stock, par value $0.01 per share, outstanding.
KEURIG DR PEPPER INC.
FORM 10-Q
TABLE OF CONTENTS
| Page | ||||||||||||||
s-i
KEURIG DR PEPPER INC.
FORM 10-Q
MASTER GLOSSARY
| Term | Definition | |||||||
| Annual Report |
Annual Report on Form 10-K for the year ended December 31, 2023
|
|||||||
| AOCI | Accumulated other comprehensive income or loss | |||||||
| Athletic Brewing | Athletic Brewing Holding Company, LLC, an equity method investment of KDP | |||||||
| Board | The Board of Directors of KDP | |||||||
| bps | Basis points | |||||||
| CEO | Chief Executive Officer | |||||||
| Chobani | FHU US Holdings LLC, an equity method investment of KDP | |||||||
| Circana | Circana, Inc., a market information provider | |||||||
| DIO | Days inventory outstanding | |||||||
| DPO | Days of payables outstanding | |||||||
| DPS | Dr Pepper Snapple Group, Inc. | |||||||
| DPS Merger | The combination of the business operations of Keurig and DPS as of July 9, 2018 | |||||||
| DSD | Direct Store Delivery, KDP’s route-to-market whereby finished beverages are delivered directly to retailers | |||||||
| DSO | Days sales outstanding | |||||||
| EPS | Earnings per share | |||||||
| Exchange Act | Securities Exchange Act of 1934, as amended | |||||||
| FX | Foreign exchange | |||||||
| JAB | JAB Holding Company S.a.r.l. and affiliates | |||||||
| KDP | Keurig Dr Pepper Inc. | |||||||
| Keurig | Keurig Green Mountain, Inc., a wholly-owned subsidiary of KDP, and the brand of our brewers | |||||||
| LRB | Liquid refreshment beverages | |||||||
| Notes | Collectively, the Company's senior unsecured notes | |||||||
| Nutrabolt | Woodbolt Holdings LLC, d/b/a Nutrabolt, an equity method investment of KDP | |||||||
| Revolving Credit Agreement | KDP’s $4 billion revolving credit agreement, which was executed in February 2022 | |||||||
| RSU | Restricted share unit | |||||||
| RTD | Ready to drink | |||||||
| Tractor | Tractor Beverages, Inc., an equity method investment of KDP | |||||||
| SEC | Securities and Exchange Commission | |||||||
| SG&A | Selling, general and administrative | |||||||
| SOFR | Secured Overnight Financing Rate | |||||||
| U.S. GAAP | Accounting principles generally accepted in the U.S. | |||||||
| Vita Coco | The Vita Coco Company, Inc. | |||||||
| WD | Warehouse Direct, KDP’s route-to-market whereby finished beverages are shipped to retailer warehouses, and then delivered by the retailer through its own delivery system to its stores | |||||||
s-ii
PART I - FINANCIAL INFORMATION
ITEM 1. Financial Statements (Unaudited)
KEURIG DR PEPPER INC.
CONDENSED CONSOLIDATED STATEMENTS OF INCOME
(
UNAUDITED
)
| First Quarter | |||||||||||
| (in millions, except per share data) | 2024 | 2023 | |||||||||
| Net sales | $ |
|
$ |
|
|||||||
| Cost of sales |
|
|
|||||||||
| Gross profit |
|
|
|||||||||
| Selling, general and administrative expenses |
|
|
|||||||||
| Other operating income, net |
(
|
(
|
|||||||||
| Income from operations |
|
|
|||||||||
| Interest expense, net |
|
|
|||||||||
| Other income, net |
(
|
(
|
|||||||||
| Income before provision for income taxes |
|
|
|||||||||
| Provision for income taxes |
|
|
|||||||||
| Net income | $ |
|
$ |
|
|||||||
| Earnings per common share: | |||||||||||
| Basic | $ |
|
$ |
|
|||||||
| Diluted |
|
|
|||||||||
| Weighted average common shares outstanding: | |||||||||||
| Basic |
|
|
|||||||||
| Diluted |
|
|
|||||||||
The accompanying notes are an integral part of these unaudited condensed consolidated financial statements.
1
KEURIG DR PEPPER INC.
CONDENSED CONSOLIDATED STATEMENTS OF COMPREHENSIVE INCOME
(
UNAUDITED
)
| First Quarter | |||||||||||
| (in millions) | 2024 | 2023 | |||||||||
| Net income | $ |
|
$ |
|
|||||||
| Other comprehensive (loss) income: | |||||||||||
| Foreign currency translation adjustments |
(
|
|
|||||||||
|
Net change in cash flow hedges, net of tax of $
|
(
|
(
|
|||||||||
| Total other comprehensive (loss) income |
(
|
|
|||||||||
| Comprehensive income | $ |
|
$ |
|
|||||||
The accompanying notes are an integral part of these unaudited condensed consolidated financial statements.
2
KEURIG DR PEPPER INC.
CONDENSED CONSOLIDATED BALANCE SHEETS
(
UNAUDITED
)
| March 31, | December 31, | |||||||||||||
| (in millions, except share and per share data) | 2024 | 2023 | ||||||||||||
| Assets | ||||||||||||||
| Current assets: | ||||||||||||||
| Cash and cash equivalents | $ |
|
$ |
|
||||||||||
| Trade accounts receivable, net |
|
|
||||||||||||
| Inventories |
|
|
||||||||||||
| Prepaid expenses and other current assets |
|
|
||||||||||||
| Total current assets |
|
|
||||||||||||
| Property, plant and equipment, net |
|
|
||||||||||||
| Investments in unconsolidated affiliates |
|
|
||||||||||||
| Goodwill |
|
|
||||||||||||
| Other intangible assets, net |
|
|
||||||||||||
| Other non-current assets |
|
|
||||||||||||
| Deferred tax assets |
|
|
||||||||||||
| Total assets | $ |
|
$ |
|
||||||||||
| Liabilities and Stockholders' Equity | ||||||||||||||
| Current liabilities: | ||||||||||||||
| Accounts payable | $ |
|
$ |
|
||||||||||
| Accrued expenses |
|
|
||||||||||||
| Structured payables |
|
|
||||||||||||
| Short-term borrowings and current portion of long-term obligations |
|
|
||||||||||||
| Other current liabilities |
|
|
||||||||||||
| Total current liabilities |
|
|
||||||||||||
| Long-term obligations |
|
|
||||||||||||
| Deferred tax liabilities |
|
|
||||||||||||
| Other non-current liabilities |
|
|
||||||||||||
| Total liabilities |
|
|
||||||||||||
| Commitments and contingencies |
|
|
||||||||||||
| Stockholders' equity: | ||||||||||||||
|
Preferred stock, $
|
|
|
||||||||||||
|
Common stock, $
|
|
|
||||||||||||
| Additional paid-in capital |
|
|
||||||||||||
| Retained earnings |
|
|
||||||||||||
| Accumulated other comprehensive income |
|
|
||||||||||||
| Total stockholders' equity |
|
|
||||||||||||
| Total liabilities and stockholders’ equity | $ |
|
$ |
|
||||||||||
The accompanying notes are an integral part of these unaudited condensed consolidated financial statements.
3
KEURIG DR PEPPER INC.
CONDENSED CONSOLIDATED STATEMENTS OF CASH FLOWS
(
UNAUDITED
)
| First Quarter | |||||||||||
| (in millions) | 2024 | 2023 | |||||||||
| Operating activities: | |||||||||||
| Net income | $ |
|
$ |
|
|||||||
| Adjustments to reconcile net income to net cash provided by operating activities: | |||||||||||
| Depreciation expense |
|
|
|||||||||
| Amortization of intangibles |
|
|
|||||||||
| Other amortization expense |
|
|
|||||||||
| Provision for sales returns |
|
|
|||||||||
| Deferred income taxes |
|
|
|||||||||
| Employee stock-based compensation expense |
|
|
|||||||||
| Loss (gain) on disposal of property, plant and equipment |
|
(
|
|||||||||
| Unrealized loss (gain) on foreign currency |
|
(
|
|||||||||
| Unrealized loss (gain) on derivatives |
|
(
|
|||||||||
| Equity in earnings of unconsolidated affiliates |
(
|
(
|
|||||||||
| Earned equity |
(
|
(
|
|||||||||
| Other, net |
|
(
|
|||||||||
| Changes in assets and liabilities: | |||||||||||
| Trade accounts receivable |
|
|
|||||||||
| Inventories |
(
|
(
|
|||||||||
| Income taxes receivable and payables, net |
(
|
|
|||||||||
| Other current and non-current assets |
(
|
(
|
|||||||||
| Accounts payable and accrued expenses |
(
|
(
|
|||||||||
| Other current and non-current liabilities |
(
|
|
|||||||||
| Net change in operating assets and liabilities |
(
|
(
|
|||||||||
| Net cash provided by operating activities |
|
|
|||||||||
| Investing activities: | |||||||||||
| Purchases of property, plant and equipment |
(
|
(
|
|||||||||
| Proceeds from sales of property, plant and equipment |
|
|
|||||||||
| Purchases of intangibles |
(
|
(
|
|||||||||
| Investments in unconsolidated affiliates |
(
|
|
|||||||||
| Other, net |
|
|
|||||||||
| Net cash used in investing activities | $ |
(
|
$ |
(
|
|||||||
The accompanying notes are an integral part of these unaudited condensed consolidated financial statements.
4
KEURIG DR PEPPER INC.
CONDENSED CONSOLIDATED STATEMENTS OF CASH FLOWS
(
UNAUDITED, CONTINUED)
| First Quarter | |||||||||||
| (in millions) | 2024 | 2023 | |||||||||
| Financing activities: | |||||||||||
|
Proceeds from issuance of Notes
|
$ |
|
$ |
|
|||||||
|
Repayments of Notes
|
(
|
|
|||||||||
| Net (repayment) issuance of commercial paper |
(
|
|
|||||||||
| Proceeds from structured payables |
|
|
|||||||||
| Repayments of structured payables |
(
|
(
|
|||||||||
| Cash dividends paid |
(
|
(
|
|||||||||
| Repurchases of common stock |
(
|
(
|
|||||||||
| Tax withholdings related to net share settlements |
(
|
(
|
|||||||||
| Payments on finance leases |
(
|
(
|
|||||||||
| Other, net |
(
|
(
|
|||||||||
| Net cash provided by (used in) financing activities |
|
(
|
|||||||||
| Cash and cash equivalents: | |||||||||||
| Net change from operating, investing and financing activities |
|
(
|
|||||||||
| Effect of exchange rate changes |
|
|
|||||||||
| Beginning balance |
|
|
|||||||||
| Ending balance | $ |
|
$ |
|
|||||||
| Supplemental cash flow disclosures of non-cash investing activities: | |||||||||||
| Capital expenditures included in accounts payable and accrued expenses | $ |
|
$ |
|
|||||||
| Earned equity |
|
|
|||||||||
| Transaction costs included in accounts payable and accrued expenses |
|
|
|||||||||
| Supplemental cash flow disclosures of non-cash financing activities: | |||||||||||
| Dividends declared but not yet paid |
|
|
|||||||||
| Accrued excise tax on net share repurchases |
|
|
|||||||||
| Supplemental cash flow disclosures: | |||||||||||
| Cash paid for interest |
|
|
|||||||||
| Cash paid for income taxes |
|
|
|||||||||
The accompanying notes are an integral part of these unaudited condensed consolidated financial statements.
5
KEURIG DR PEPPER INC.
CONDENSED CONSOLIDATED STATEMENTS OF CHANGES IN STOCKHOLDERS' EQUITY
(
UNAUDITED
)
| Common Stock Issued |
Additional
Paid-In Capital |
Retained Earnings | Accumulated Other Comprehensive Income | Total Stockholders' Equity | |||||||||||||||||||||||||||||||
| (in millions, except per share data) | Shares | Amount | |||||||||||||||||||||||||||||||||
| Balance as of January 1, 2024 |
|
$ |
|
$ |
|
$ |
|
$ |
|
$ |
|
||||||||||||||||||||||||
| Net income | — | — | — |
|
— |
|
|||||||||||||||||||||||||||||
| Other comprehensive income | — | — | — | — |
(
|
(
|
|||||||||||||||||||||||||||||
|
Dividends declared, $
|
— | — | — |
(
|
— |
(
|
|||||||||||||||||||||||||||||
| Repurchases of common stock, inclusive of excise tax obligation |
(
|
— |
(
|
— | — |
(
|
|||||||||||||||||||||||||||||
| Shares issued under employee stock-based compensation plans and other |
|
— | — | — | — | — | |||||||||||||||||||||||||||||
| Tax withholdings related to net share settlements | — | — |
(
|
— | — |
(
|
|||||||||||||||||||||||||||||
| Stock-based compensation and stock options exercised | — | — |
|
— | — |
|
|||||||||||||||||||||||||||||
|
Balance as of March 31, 2024
|
|
$ |
|
$ |
|
$ |
|
$ |
|
$ |
|
||||||||||||||||||||||||
| Common Stock Issued |
Additional
Paid-In Capital |
Retained Earnings | Accumulated Other Comprehensive Income (Loss) | Total Stockholders' Equity | Non-controlling Interest | Total Equity | |||||||||||||||||||||||||||||||||||||||||
| (in millions, except per share data) | Shares | Amount | |||||||||||||||||||||||||||||||||||||||||||||
|
Balance as of January 1, 2023
|
|
$ |
|
$ |
|
$ |
|
$ |
|
$ |
|
$ |
(
|
$ |
|
||||||||||||||||||||||||||||||||
| Net income | — | — | — |
|
— |
|
— |
|
|||||||||||||||||||||||||||||||||||||||
| Other comprehensive income | — | — | — | — |
|
|
|
||||||||||||||||||||||||||||||||||||||||
|
Dividends declared, $
|
— | — | — |
(
|
— |
(
|
— |
(
|
|||||||||||||||||||||||||||||||||||||||
| Repurchases of common stock, inclusive of excise tax obligation |
(
|
— |
(
|
— | — |
(
|
— |
(
|
|||||||||||||||||||||||||||||||||||||||
| Shares issued under employee stock-based compensation plans and other |
|
— | — | — | — | — | — | — | |||||||||||||||||||||||||||||||||||||||
| Tax withholdings related to net share settlements | — | — |
(
|
— | — |
(
|
— |
(
|
|||||||||||||||||||||||||||||||||||||||
| Stock-based compensation and stock options exercised | — | — |
|
— | — |
|
— |
|
|||||||||||||||||||||||||||||||||||||||
|
Balance as of March 31, 2023
|
|
$ |
|
$ |
|
$ |
|
$ |
|
$ |
|
$ |
(
|
$ |
|
||||||||||||||||||||||||||||||||
The accompanying notes are an integral part of these unaudited condensed consolidated financial statements.
6
KEURIG DR PEPPER INC.
NOTES TO CONDENSED CONSOLIDATED FINANCIAL STATEMENTS
(UNAUDITED)
1.
General
ORGANIZATION
References in this Quarterly Report on Form 10-Q to "KDP", "the Company", "we", or "our", refer to Keurig Dr Pepper Inc. and all wholly-owned subsidiaries included in the unaudited condensed consolidated financial statements. Definitions of terms used in this Quarterly Report on Form 10-Q are included within the Master Glossary.
This Quarterly Report on Form 10-Q refers to some of our owned or licensed trademarks, trade names and service marks, which are referred to as our brands. All of the product names included herein are either KDP registered trademarks or those of our licensors.
BASIS OF PRESENTATION
The accompanying unaudited condensed consolidated financial statements have been prepared in accordance with U.S. GAAP for interim financial information and in accordance with the instructions to Form 10-Q and Article 10 of Regulation S-X. Accordingly, they do not include all of the information and footnotes required by U.S. GAAP for complete consolidated financial statements. In the opinion of management, all adjustments, consisting principally of normal recurring adjustments, considered necessary for a fair presentation have been included. These unaudited condensed consolidated financial statements should be read in conjunction with our consolidated financial statements and accompanying notes included in our Annual Report.
USE OF ESTIMATES
RECLASSIFICATIONS
We reclassified amounts in the Financing Activities section of the unaudited condensed consolidated Statement of Cash Flows for the first quarter of 2023 in order to conform to current year presentation, as maturities for the Company’s commercial paper program in both periods are 90 days or less.
| (in millions) | Prior Presentation | First Quarter of 2023 | ||||||||||||
| Net (repayment) issuance of commercial paper | Proceeds from issuance of commercial paper | $ |
|
|||||||||||
| Net (repayment) issuance of commercial paper | Repayments of commercial paper |
(
|
||||||||||||
2.
Long-term Obligations and Borrowing Arrangements
The following table summarizes our long-term obligations:
| (in millions) | March 31, 2024 | December 31, 2023 | |||||||||
|
Notes
|
$ |
|
$ |
|
|||||||
| Less: current portion of long-term obligations |
|
(
|
|||||||||
| Long-term obligations | $ |
|
$ |
|
|||||||
7
KEURIG DR PEPPER INC.
NOTES TO CONDENSED CONSOLIDATED FINANCIAL STATEMENTS
(UNAUDITED, CONTINUED)
The following table summarizes our short-term borrowings and current portion of long-term obligations:
| (in millions) | March 31, 2024 | December 31, 2023 | |||||||||
| Commercial paper notes | $ |
|
$ |
|
|||||||
| Current portion of long-term obligations |
|
|
|||||||||
| Short-term borrowings and current portion of long-term obligations | $ |
|
$ |
|
|||||||
SENIOR UNSECURED NOTES
Our Notes consisted of the following:
| (in millions, except %) | Maturity Date | Rate | March 31, 2024 | December 31, 2023 | ||||||||||||||||||||||
| 2024 Notes | March 15, 2024 |
|
|
|
||||||||||||||||||||||
| 2025 Merger Notes | May 25, 2025 |
|
|
|
||||||||||||||||||||||
| 2025 Notes | November 15, 2025 |
|
|
|
||||||||||||||||||||||
| 2026 Notes | September 15, 2026 |
|
|
|
||||||||||||||||||||||
| 2027-B Notes | March 15, 2027 |
|
|
|
||||||||||||||||||||||
| 2027-C Notes | March 15, 2027 |
|
|
|
||||||||||||||||||||||
| 2027 Notes | June 15, 2027 |
|
|
|
||||||||||||||||||||||
| 2028 Merger Notes | May 25, 2028 |
|
|
|
||||||||||||||||||||||
| 2029-B Notes | March 15, 2029 |
|
|
|
||||||||||||||||||||||
| 2029 Notes | April 15, 2029 |
|
|
|
||||||||||||||||||||||
| 2030 Notes | May 1, 2030 |
|
|
|
||||||||||||||||||||||
| 2031 Notes | March 15, 2031 |
|
|
|
||||||||||||||||||||||
| 2031-B Notes | March 15, 2031 |
|
|
|
||||||||||||||||||||||
| 2032 Notes | April 15, 2032 |
|
|
|
||||||||||||||||||||||
| 2034 Notes | March 15, 2034 |
|
|
|
||||||||||||||||||||||
| 2038 Merger Notes | May 25, 2038 |
|
|
|
||||||||||||||||||||||
| 2045 Notes | November 15, 2045 |
|
|
|
||||||||||||||||||||||
| 2046 Notes | December 15, 2046 |
|
|
|
||||||||||||||||||||||
| 2048 Merger Notes | May 25, 2048 |
|
|
|
||||||||||||||||||||||
| 2050 Notes | May 1, 2050 |
|
|
|
||||||||||||||||||||||
| 2051 Notes | March 15, 2051 |
|
|
|
||||||||||||||||||||||
| 2052 Notes | April 15, 2052 |
|
|
|
||||||||||||||||||||||
| Principal amount |
|
|
||||||||||||||||||||||||
|
Adjustment from principal amount to carrying amount
(1)
|
(
|
(
|
||||||||||||||||||||||||
| Carrying amount | $ |
|
$ |
|
||||||||||||||||||||||
(1)
The carrying amount includes unamortized discounts, debt issuance costs and fair value adjustments related to the DPS Merger.
(2)
The 2027-B Notes bear interest at a rate equal to Compounded SOFR (as defined in the respective indenture) plus
0.88
% per annum, and the rate is reassessed quarterly.
On March 7, 2024, we completed the issuance of the 2027-B Notes, the 2027-C Notes, the 2029-B Notes, the 2031-B Notes, and the 2034 Notes, with an aggregate principal amount of $
3
billion. The discount associated with these notes was approximately $
5
million, and the Company incurred $
16
million in debt issuance costs. The proceeds from the issuance were used for our share repurchase program, to repay outstanding commercial paper, and to repay the 2024 Notes at maturity, with the remainder intended for general corporate purposes.
8
KEURIG DR PEPPER INC.
NOTES TO CONDENSED CONSOLIDATED FINANCIAL STATEMENTS
(UNAUDITED, CONTINUED)
VARIABLE-RATE BORROWING ARRANGEMENTS
Revolving Credit Agreement
The following table summarizes information about the Revolving Credit Agreement:
| Amounts Outstanding | ||||||||||||||||||||||||||
| (in millions) | Maturity Date | Capacity | March 31, 2024 | December 31, 2023 | ||||||||||||||||||||||
|
Revolving Credit Agreement
(1)
|
February 23, 2027 | $ |
|
$ |
|
$ |
|
|||||||||||||||||||
(1)
The Revolving Credit Agreement has $
200
million letters of credit available,
none
of which were utilized as of March 31, 2024.
As of March 31, 2024,
KDP
was in compliance with its minimum interest coverage ratio relating to the
Revolving Credit Agreement
.
Commercial Paper Program
The following table provides information about our
weighted average borrowings under our commercial paper program:
| First Quarter | |||||||||||
| (in millions, except %) | 2024 | 2023 | |||||||||
| Weighted average commercial paper borrowings | $ |
|
$ |
|
|||||||
| Weighted average borrowing rates |
|
% |
|
% | |||||||
Letter of Credit Facility
In addition to the portion of the Revolving Credit Agreement reserved for issuance of letters of credit, KDP has an incremental letter of credit facility. Under this facility, $
150
million is available for the issuance of letters of credit, $
57
million of which was utilized as of
March 31, 2024
and $
93
million of which remains available for use.
FAIR VALUE DISCLOSURES
The fair value of our commercial paper approximates the carrying value and is considered Level 2 within the fair value hierarchy.
3.
Goodwill and Other Intangible Assets
GOODWILL
Changes in the carrying amount of goodwill by reportable segment are as follows:
| (in millions) | U.S. Refreshment Beverages | U.S. Coffee | International | Total | |||||||||||||||||||
| Balance as of January 1, 2024 | $ |
|
$ |
|
$ |
|
$ |
|
|||||||||||||||
| Foreign currency translation |
|
|
(
|
(
|
|||||||||||||||||||
| Balance as of March 31, 2024 | $ |
|
$ |
|
$ |
|
$ |
|
|||||||||||||||
9
KEURIG DR PEPPER INC.
NOTES TO CONDENSED CONSOLIDATED FINANCIAL STATEMENTS
(UNAUDITED, CONTINUED)
INTANGIBLE ASSETS OTHER THAN GOODWILL
The net carrying amounts of intangible assets other than goodwill with indefinite lives are as follows:
| (in millions) | March 31, 2024 | December 31, 2023 | |||||||||
|
Brands
(1)
|
$ |
|
$ |
|
|||||||
| Trade names |
|
|
|||||||||
|
Distribution rights
(2)
|
|
|
|||||||||
| Total | $ |
|
$ |
|
|||||||
(1)
The change in brands with indefinite lives was primarily driven by foreign currency translation of $
33
million during the first quarter of 2024.
(2)
The change in distribution rights with indefinite lives was primarily driven by acquired distribution rights related to Electrolit of $
31
million.
The net carrying amounts of intangible assets other than goodwill with definite lives are as follows:
| March 31, 2024 | December 31, 2023 | ||||||||||||||||||||||||||||||||||
| (in millions) | Gross Amount | Accumulated Amortization | Net Amount | Gross Amount | Accumulated Amortization | Net Amount | |||||||||||||||||||||||||||||
| Acquired technology | $ |
|
$ |
(
|
$ |
|
$ |
|
$ |
(
|
$ |
|
|||||||||||||||||||||||
| Customer relationships |
|
(
|
|
|
(
|
|
|||||||||||||||||||||||||||||
| Contractual arrangements |
|
(
|
|
|
(
|
|
|||||||||||||||||||||||||||||
| Trade names |
|
(
|
|
|
(
|
|
|||||||||||||||||||||||||||||
| Brands |
|
(
|
|
|
(
|
|
|||||||||||||||||||||||||||||
| Distribution rights |
|
(
|
|
|
(
|
|
|||||||||||||||||||||||||||||
| Total | $ |
|
$ |
(
|
$ |
|
$ |
|
$ |
(
|
$ |
|
|||||||||||||||||||||||
Amortization expense for intangible assets with definite lives was as follows:
| First Quarter | |||||||||||
| (in millions) | 2024 | 2023 | |||||||||
| Amortization expense | $ |
|
$ |
|
|||||||
4.
Derivatives
KDP is exposed to market risks arising from adverse changes in interest rates, commodity prices, and FX rates. KDP manages these risks through a variety of strategies, including the use of interest rate contracts, FX forward contracts, commodity forward, future, swap and option contracts and supplier pricing agreements. KDP does not hold or issue derivative financial instruments for trading or speculative purposes.
We formally designate and account for certain foreign exchange forward contracts and interest rate contracts that meet established accounting criteria under U.S. GAAP as cash flow hedges. For such contracts, the effective portion of the gain or loss on the derivative instruments is recorded, net of applicable taxes, in AOCI. When net income is affected by the variability of the underlying transaction, the applicable offsetting amount of the gain or loss from the derivative instrument deferred in AOCI is reclassified to net income. Cash flows from derivative instruments designated in a qualifying hedging relationship are classified in the same category as the cash flows from the hedged items. If a cash flow hedge were to cease to qualify for hedge accounting, or were terminated, the derivatives would continue to be carried on the balance sheet at fair value until settled, and hedge accounting would be discontinued prospectively. If the underlying hedged transaction ceases to exist, any associated amounts reported in AOCI would be reclassified to earnings at that time.
For derivatives that are not designated or for which the designated hedging relationship is discontinued, the gain or loss on the instrument is recognized in earnings in the period of change.
10
KEURIG DR PEPPER INC.
NOTES TO CONDENSED CONSOLIDATED FINANCIAL STATEMENTS
(UNAUDITED, CONTINUED)
We have exposure to credit losses from derivative instruments in an asset position in the event of nonperformance by the counterparties to the agreements. Historically, we have not experienced material credit losses as a result of counterparty nonperformance. We select and periodically review counterparties based on credit ratings, limit our exposure to a single counterparty under defined guidelines, and monitor the market position of the programs upon execution of a hedging transaction and at least on a quarterly basis.
INTEREST RATES
Economic Hedges
We are exposed to interest rate risk related to our borrowing arrangements and obligations. We enter into interest rate contracts to provide predictability in our overall cost structure and to manage the balance of fixed-rate and variable-rate debt. We primarily enter into receive-fixed, pay-variable and receive-variable, pay-fixed swaps and swaption contracts.
A natural hedging relationship exists in which changes in the fair value of the instruments act as an economic offset to changes in the fair value of the underlying items. Changes in the fair value of these instruments are recorded in earnings throughout the term of the derivative instrument and are generally reported in interest expense in the unaudited Condensed Consolidated Statements of Income. As of March 31, 2024, economic interest rate derivative instruments have maturities ranging from April 2024 to July 2043.
Cash Flow Hedges
As of December 31, 2023, we had $
500
million of notional amount of forward starting swaps which had been de-designated and terminated; however, as the forecasted debt transaction was still considered probable, the fair value of the instruments as of the de-designation remained within AOCI. In March 2024, the forecasted debt transaction took place with the issuance of the 2034 Notes, and the fair value of the instruments began amortizing to Interest expense, net over the term of the 2034 Notes.
FOREIGN EXCHANGE
We are exposed to foreign exchange risk in our international subsidiaries or with certain counterparties in foreign jurisdictions, which may transact in currencies that are different from the functional currencies of our legal entities. Additionally, the balance sheets of our Canadian and Mexican businesses are subject to exposure from movements in exchange rates.
Economic Hedges
We hold FX forward contracts to economically manage the balance sheet exposures resulting from changes in the FX rates described above. The intent of these FX contracts is to minimize the impact of FX risk associated with balance sheet positions not in local currency. In these cases, a hedging relationship exists in which changes in the fair value of the instruments act as an economic offset to changes in the fair value of the underlying items. Changes in the fair value of these instruments are recorded in earnings throughout the term of the derivative instrument and are reported in the same caption of the unaudited Condensed Consolidated Statements of Income as the associated risk. As of March 31, 2024, these FX contracts have maturities ranging from April 2024 to February 2025.
Cash Flow Hedges
We designate certain FX forward contracts as cash flow hedges in order to manage the exposures resulting from changes in the FX rates described above. These designated FX forward contracts relate to forecasted inventory purchases in U.S. dollars of our Canadian and Mexican businesses. The intent of these FX contracts is to provide predictability in the Company's overall cost structure. As of March 31, 2024, these FX contracts have maturities ranging from April 2024 to June 2025.
11
KEURIG DR PEPPER INC.
NOTES TO CONDENSED CONSOLIDATED FINANCIAL STATEMENTS
(UNAUDITED, CONTINUED)
COMMODITIES
Economic Hedges
We centrally manage the exposure to volatility in the prices of certain commodities used in our production process and transportation through various derivative contracts. We generally hold some combination of future, swap and option contracts that economically hedge certain of our risks. In these cases, a hedging relationship exists in which changes in the fair value of the instruments act as an economic offset to changes in the fair value of the underlying items or as an offset to certain costs of production. Changes in the fair value of these instruments are recorded in earnings throughout the term of the derivative instrument and are reported in the same line item of the unaudited Condensed Consolidated Statements of Income as the hedged transaction. Unrealized gains and losses are recognized as a component of unallocated corporate costs until our reportable segments are affected by the completion of the underlying transaction, at which time the gain or loss is reflected as a component of the respective segment's income from operations. As of March 31, 2024, these commodity contracts have maturities ranging from April 2024 to January 2026.
NOTIONAL AMOUNTS OF DERIVATIVE INSTRUMENTS
The following table presents the notional amounts of our outstanding derivative instruments by type:
| (in millions) | March 31, 2024 | December 31, 2023 | |||||||||
| Interest rate contracts | |||||||||||
| Forward starting swaps, not designated as hedging instruments | $ |
|
$ |
|
|||||||
| Swaptions, not designated as hedging instruments |
|
|
|||||||||
| FX contracts | |||||||||||
| Forward contracts, not designated as hedging instruments |
|
|
|||||||||
| Forward contracts, designated as cash flow hedges |
|
|
|||||||||
|
Commodity contracts, not designated as hedging instruments
(1)
|
|
|
|||||||||
(1)
Notional value for commodity contracts is calculated as the expected volume times strike price per unit on a gross basis.
FAIR VALUE OF DERIVATIVE INSTRUMENTS
The fair values of commodity contracts, interest rate contracts and FX forward contracts are determined based on inputs that are readily available in public markets or can be derived from information available in publicly quoted markets. The fair value of commodity contracts are valued using the market approach based on observable market transactions, primarily underlying commodities futures or physical index prices, at the reporting date. Interest rate contracts are valued using models based primarily on readily observable market parameters, such as SOFR forward rates, for all substantial terms of our contracts and credit risk of the counterparties. The fair value of FX forward contracts are valued using quoted forward FX prices at the reporting date. Therefore, we have categorized these contracts as Level 2.
12
KEURIG DR PEPPER INC.
NOTES TO CONDENSED CONSOLIDATED FINANCIAL STATEMENTS
(UNAUDITED, CONTINUED)
Not Designated as Hedging Instruments
The following table summarizes the location of the fair value of our derivative instruments which are not designated as hedging instruments within the unaudited Condensed Consolidated Balance Sheets. All such instruments are considered level 2 within the fair value hierarchy.
| (in millions) | Balance Sheet Location | March 31, 2024 | December 31, 2023 | ||||||||||||||
| Assets: | |||||||||||||||||
| FX contracts | Prepaid expenses and other current assets | $ |
|
$ |
|
||||||||||||
| Commodity contracts | Prepaid expenses and other current assets |
|
|
||||||||||||||
| FX contracts | Other non-current assets |
|
|
||||||||||||||
| Commodity contracts | Other non-current assets |
|
|
||||||||||||||
| Liabilities: | |||||||||||||||||
| Interest rate contracts | Other current liabilities |
|
|
||||||||||||||
| FX contracts | Other current liabilities |
|
|
||||||||||||||
| Commodity contracts | Other current liabilities |
|
|
||||||||||||||
| Interest rate contracts | Other non-current liabilities |
|
|
||||||||||||||
| FX contracts | Other non-current liabilities |
|
|
||||||||||||||
| Commodity contracts | Other non-current liabilities |
|
|
||||||||||||||
Designated as Hedging Instruments
The following table summarizes the location of the fair value of our derivative instruments which are designated as hedging instruments within the unaudited Condensed Consolidated Balance Sheets. All such instruments are designated level 2 within the fair value hierarchy.
| (in millions) | Balance Sheet Location | March 31, 2024 | December 31, 2023 | ||||||||||||||
| Assets: | |||||||||||||||||
| FX contracts | Prepaid expenses and other current assets | $ |
|
$ |
|
||||||||||||
| Liabilities: | |||||||||||||||||
| FX contracts | Other current liabilities |
|
|
||||||||||||||
| FX contracts | Other non-current liabilities |
|
|
||||||||||||||
IMPACT OF DERIVATIVE INSTRUMENTS NOT DESIGNATED AS HEDGING INSTRUMENTS
The following table presents the amount of (gains) losses, net, recognized in the unaudited Condensed Consolidated Statements of Income related to derivative instruments not designated as hedging instruments under U.S. GAAP during the periods presented. Amounts include both realized and unrealized gains and losses.
| First Quarter | |||||||||||||||||
| (in millions) | Income Statement Location | 2024 | 2023 | ||||||||||||||
| Interest rate contracts | Interest expense, net | $ |
|
$ |
(
|
||||||||||||
| FX contracts | Cost of sales |
(
|
|
||||||||||||||
| FX contracts | Other income, net |
(
|
|
||||||||||||||
| Commodity contracts | Cost of sales |
|
(
|
||||||||||||||
| Commodity contracts | SG&A expenses |
(
|
|
||||||||||||||
13
KEURIG DR PEPPER INC.
NOTES TO CONDENSED CONSOLIDATED FINANCIAL STATEMENTS
(UNAUDITED, CONTINUED)
IMPACT OF CASH FLOW HEDGES
The following table presents the amount of (gains) losses, net, reclassified from AOCI into the unaudited Condensed Consolidated Statements of Income related to derivative instruments designated as cash flow hedging instruments during the periods presented:
| First Quarter | |||||||||||||||||
| (in millions) | Income Statement Location | 2024 | 2023 | ||||||||||||||
| Interest rate contracts | Interest expense, net | $ |
(
|
$ |
(
|
||||||||||||
| FX contracts | Cost of sales |
|
(
|
||||||||||||||
We expect to reclassify approximately $
13
million of pre-tax net gains and $
10
million of pre-tax net losses from AOCI into net income during the next twelve months related to interest rate contracts and FX contracts, respectively.
5.
Leases
The following table presents the components of lease cost:
| First Quarter | |||||||||||
| (in millions) | 2024 | 2023 | |||||||||
| Operating lease cost | $ |
|
$ |
|
|||||||
| Finance lease cost | |||||||||||
| Amortization of right-of-use assets |
|
|
|||||||||
| Interest on lease liabilities |
|
|
|||||||||
|
Variable lease cost
(1)
|
|
|
|||||||||
| Short-term lease cost |
|
|
|||||||||
| Total lease cost | $ |
|
$ |
|
|||||||
(1)
Variable lease cost primarily consists of common area maintenance costs, property taxes, and adjustments for inflation.
The following table presents supplemental cash flow and other information about our leases:
| First Quarter | |||||||||||
| (in millions) | 2024 | 2023 | |||||||||
| Cash paid for amounts included in the measurement of lease liabilities: | |||||||||||
| Operating cash flows from operating leases | $ |
|
$ |
|
|||||||
| Operating cash flows from finance leases |
|
|
|||||||||
| Financing cash flows from finance leases |
|
|
|||||||||
| Right-of-use assets obtained in exchange for lease obligations: | |||||||||||
| Operating leases |
|
|
|||||||||
| Finance leases |
|
|
|||||||||
The following table presents information about our weighted average discount rate and remaining lease term:
| March 31, 2024 | December 31, 2023 | ||||||||||
| Weighted average discount rate | |||||||||||
| Operating leases |
|
% |
|
% | |||||||
| Finance leases |
|
% |
|
% | |||||||
| Weighted average remaining lease term | |||||||||||
| Operating leases |
|
|
|||||||||
| Finance leases |
|
|
|||||||||
14
KEURIG DR PEPPER INC.
NOTES TO CONDENSED CONSOLIDATED FINANCIAL STATEMENTS
(UNAUDITED, CONTINUED)
Future minimum lease payments for non-cancellable leases that have commenced and are reflected on the unaudited Condensed Consolidated Balance Sheets as of March 31, 2024 were as follows:
| (in millions) | Operating Leases | Finance Leases | |||||||||
| Remainder of 2024 | $ |
|
$ |
|
|||||||
| 2025 |
|
|
|||||||||
| 2026 |
|
|
|||||||||
| 2027 |
|
|
|||||||||
| 2028 |
|
|
|||||||||
| 2029 |
|
|
|||||||||
| Thereafter |
|
|
|||||||||
| Total future minimum lease payments |
|
|
|||||||||
| Less: imputed interest |
(
|
(
|
|||||||||
| Present value of minimum lease payments | $ |
|
$ |
|
|||||||
SIGNIFICANT LEASES THAT HAVE NOT YET COMMENCED
As of March 31, 2024, we have entered into leases that have not yet commenced with estimated aggregated future lease payments of approximately $
197
million. These leases are expected to commence between the third quarter of 2024 through 2027, with initial lease terms ranging from
5
years to
10
years.
6.
Segments
Our operating and reportable segments consist of the following:
•
The U.S. Refreshment Beverages segment reflects sales in the U.S. from the manufacture and distribution of branded concentrates, syrup and finished beverages, including the sales of our own brands and third-party brands, to third-party bottlers, distributors and retailers.
•
The U.S. Coffee segment reflects sales in the U.S. from the manufacture and distribution of finished goods relating to our K-Cup pods, single-serve brewers and accessories, and other coffee products to partners, retailers and directly to consumers through the Keurig.com website.
•
The International segment reflects sales in international markets, including the following:
◦
Sales in Canada, Mexico, the Caribbean and other international markets from the manufacture and distribution of branded concentrates, syrup and finished beverages, including sales of our own brands and third-party brands, to third-party bottlers, distributors and retailers.
◦
Sales in Canada from the manufacture and distribution of finished goods relating to our single-serve brewers, K-Cup pods and other coffee products.
Segment results are based on management reports. Net sales and income from operations are the significant financial measures used to assess the operating performance of our operating segments. Intersegment sales are recorded at cost and are eliminated in the unaudited Condensed Consolidated Statements of Income. “Unallocated corporate costs” are excluded from our measurement of segment performance and include unrealized commodity derivative gains and losses, and certain general corporate expenses.
15
KEURIG DR PEPPER INC.
NOTES TO CONDENSED CONSOLIDATED FINANCIAL STATEMENTS
(UNAUDITED, CONTINUED)
Information about our operations by reportable segment is as follows:
| First Quarter | |||||||||||
| (in millions) | 2024 | 2023 | |||||||||
| Segment Results – Net sales | |||||||||||
| U.S. Refreshment Beverages | $ |
|
$ |
|
|||||||
| U.S. Coffee |
|
|
|||||||||
| International |
|
|
|||||||||
| Net sales | $ |
|
$ |
|
|||||||
| Segment Results – Income from operations | |||||||||||
| U.S. Refreshment Beverages | $ |
|
$ |
|
|||||||
| U.S. Coffee |
|
|
|||||||||
| International |
|
|
|||||||||
| Unallocated corporate costs |
(
|
(
|
|||||||||
| Income from operations | $ |
|
$ |
|
|||||||
7.
Revenue Recognition
We recognize revenue when obligations under the terms of a contract with the customer are satisfied. Branded product sales, which include LRB, K-Cup pods and appliances, occur once control is transferred upon delivery to the customer. Revenue is measured as the amount of consideration that we expect to receive in exchange for transferring goods. The amount of consideration we receive, and revenue we recognize, varies with changes in customer incentives that we offer our customers and end consumers. Sales taxes and other similar taxes are excluded from revenue. Costs associated with shipping and handling activities, such as merchandising, are included in SG&A expenses as revenue is recognized.
The following table disaggregates our revenue by product portfolio and by reportable segment:
| (in millions) | U.S. Refreshment Beverages | U.S. Coffee | International | Total | |||||||||||||||||||
| For the first quarter of 2024: | |||||||||||||||||||||||
|
LRB
|
$ |
|
$ |
|
$ |
|
$ |
|
|||||||||||||||
| K-Cup pods |
|
|
|
|
|||||||||||||||||||
| Appliances |
|
|
|
|
|||||||||||||||||||
| Other |
|
|
|
|
|||||||||||||||||||
| Net sales | $ |
|
$ |
|
$ |
|
$ |
|
|||||||||||||||
| For the first quarter of 2023: | |||||||||||||||||||||||
|
LRB
|
$ |
|
$ |
|
$ |
|
$ |
|
|||||||||||||||
| K-Cup pods |
|
|
|
|
|||||||||||||||||||
| Appliances |
|
|
|
|
|||||||||||||||||||
| Other |
|
|
|
|
|||||||||||||||||||
| Net sales | $ |
|
$ |
|
$ |
|
$ |
|
|||||||||||||||
LRB represents net sales of owned, licensed, and partner brands within our portfolio and includes branded concentrates, syrup, and finished beverages, including contract manufacturing of our branded products for our bottlers and distributors. K-Cup pods represents net sales from owned, licensed, and partner brands and private label owners. Net sales for partner brands and private label owners are contractual and long-term in nature.
16
KEURIG DR PEPPER INC.
NOTES TO CONDENSED CONSOLIDATED FINANCIAL STATEMENTS
(UNAUDITED, CONTINUED)
8.
Earnings Per Share
The following table presents basic and diluted EPS and shares outstanding.
| First Quarter | |||||||||||
| (in millions, except per share data) | 2024 | 2023 | |||||||||
| Net income | $ |
|
$ |
|
|||||||
| Weighted average common shares outstanding |
|
|
|||||||||
| Dilutive effect of stock-based awards |
|
|
|||||||||
| Weighted average common shares outstanding and common stock equivalents |
|
|
|||||||||
| Basic EPS | $ |
|
$ |
|
|||||||
| Diluted EPS |
|
|
|||||||||
| Anti-dilutive shares excluded from the diluted weighted average shares outstanding calculation |
|
|
|||||||||
9.
Stock-Based Compensation
The components of stock-based compensation expense are presented below:
| First Quarter | |||||||||||
| (in millions) | 2024 | 2023 | |||||||||
| Total stock-based compensation expense | $ |
|
$ |
|
|||||||
| Income tax benefit |
(
|
(
|
|||||||||
| Stock-based compensation expense, net of tax | $ |
|
$ |
|
|||||||
RESTRICTED SHARE UNITS
The table below summarizes RSU activity
:
| RSUs | Weighted Average Grant Date Fair Value | Weighted Average Remaining Contractual Term (Years) |
Aggregate Intrinsic Value
(in millions) |
||||||||||||||||||||
| Outstanding as of December 31, 2023 |
|
$ |
|
|
$ |
|
|||||||||||||||||
| Granted |
|
|
|||||||||||||||||||||
| Vested and released |
(
|
|
|
||||||||||||||||||||
| Forfeited |
(
|
|
|||||||||||||||||||||
| Outstanding as of March 31, 2024 |
|
$ |
|
|
$ |
|
|||||||||||||||||
As of March 31, 2024, there was $
233
million of unrecognized compensation cost related to unvested RSUs that is expected to be recognized over a weighted average period of
3.5
years.
17
KEURIG DR PEPPER INC.
NOTES TO CONDENSED CONSOLIDATED FINANCIAL STATEMENTS
(UNAUDITED, CONTINUED)
10.
Investments
The following table summarizes our investments in unconsolidated affiliates:
| March 31, | December 31, | ||||||||||
| (in millions) | 2024 | 2023 | |||||||||
|
Nutrabolt
(1)
|
$ |
|
$ |
|
|||||||
| Chobani |
|
|
|||||||||
| Tractor |
|
|
|||||||||
| Athletic Brewing |
|
|
|||||||||
| Beverage startup companies |
|
|
|||||||||
| Other |
|
|
|||||||||
| Investments in unconsolidated affiliates | $ |
|
$ |
|
|||||||
(1)
We hold a
33.6
% interest on an as-converted basis in Nutrabolt, consisting of
30.8
% in Class A preferred shares acquired through our December 2022 investment, which are treated as in-substance common stock, and
2.8
% in Class B common shares earned through the achievement of certain milestones included in our distribution agreement with Nutrabolt.
11.
Income Taxes
Our
effective tax rates were as follows:
| First Quarter | ||||||||||||||
| 2024 | 2023 | |||||||||||||
| Effective tax rate |
|
% |
|
% | ||||||||||
The change in the effective tax rate was largely driven by a shift in the mix of income from lower tax jurisdictions to higher tax jurisdictions and the unfavorable comparison to the prior year tax benefit received from favorable adjustments upon foreign tax return filing.
12.
Accumulated Other Comprehensive Income
The following table provides a summary of changes in AOCI, net of taxes:
| (in millions) | Foreign Currency Translation Adjustments | Pension and Post-Retirement Benefit Liabilities | Cash Flow Hedges | Accumulated Other Comprehensive Income | |||||||||||||||||||
| For the first quarter of 2024: | |||||||||||||||||||||||
| Beginning balance | $ |
|
$ |
(
|
$ |
|
$ |
|
|||||||||||||||
| Other comprehensive loss |
(
|
|
|
(
|
|||||||||||||||||||
| Amounts reclassified from AOCI |
|
|
(
|
(
|
|||||||||||||||||||
| Total other comprehensive loss |
(
|
|
(
|
(
|
|||||||||||||||||||
| Balance as of March 31, 2024 | $ |
|
$ |
(
|
$ |
|
$ |
|
|||||||||||||||
| For the first quarter of 2023: | |||||||||||||||||||||||
| Beginning balance | $ |
(
|
$ |
(
|
$ |
|
$ |
|
|||||||||||||||
| Other comprehensive income (loss) |
|
|
(
|
|
|||||||||||||||||||
| Amounts reclassified from AOCI |
|
|
(
|
(
|
|||||||||||||||||||
| Total other comprehensive income (loss) |
|
|
(
|
|
|||||||||||||||||||
| Balance as of March 31, 2023 | $ |
|
$ |
(
|
$ |
|
$ |
|
|||||||||||||||
18
KEURIG DR PEPPER INC.
NOTES TO CONDENSED CONSOLIDATED FINANCIAL STATEMENTS
(UNAUDITED, CONTINUED)
The following table presents the amount of (gains) losses reclassified from AOCI into the unaudited Condensed Consolidated Statements of Income:
| First Quarter | |||||||||||||||||
| (in millions) | Income Statement Caption | 2024 | 2023 | ||||||||||||||
| Cash Flow Hedges: | |||||||||||||||||
|
Interest rate contracts
(1)
|
Interest expense | $ |
(
|
$ |
(
|
||||||||||||
| Income tax expense |
|
|
|||||||||||||||
| Total, net of tax | $ |
(
|
$ |
(
|
|||||||||||||
(1)
Amounts reclassified from AOCI into interest expense during the first quarter of 2023 include the realized gains associated with the termination of forward starting swaps designated as cash flow hedges of approximately $
66
million.
13.
Other Financial Information
SELECTED BALANCE SHEET INFORMATION
The tables below provide selected financial information from the unaudited Condensed Consolidated Balance Sheets:
| March 31, | December 31, | ||||||||||
| (in millions) | 2024 | 2023 | |||||||||
| Inventories: | |||||||||||
| Raw materials | $ |
|
$ |
|
|||||||
| Work-in-progress |
|
|
|||||||||
| Finished goods |
|
|
|||||||||
| Total |
|
|
|||||||||
| Allowance for excess and obsolete inventories |
(
|
(
|
|||||||||
| Total Inventories | $ |
|
$ |
|
|||||||
| Prepaid expenses and other current assets: | |||||||||||
| Other receivables | $ |
|
$ |
|
|||||||
| Prepaid income taxes |
|
|
|||||||||
| Customer incentive programs |
|
|
|||||||||
| Derivative instruments |
|
|
|||||||||
| Prepaid marketing |
|
|
|||||||||
| Spare parts |
|
|
|||||||||
| Income tax receivable |
|
|
|||||||||
| Other |
|
|
|||||||||
| Total prepaid expenses and other current assets | $ |
|
$ |
|
|||||||
| Other non-current assets: | |||||||||||
| Operating lease right-of-use assets | $ |
|
$ |
|
|||||||
| Customer incentive programs |
|
|
|||||||||
| Derivative instruments |
|
|
|||||||||
|
Equity securities
(1)
|
|
|
|||||||||
| Other |
|
|
|||||||||
| Total other non-current assets | $ |
|
$ |
|
|||||||
(1)
Fair values of these equity securities are determined using quoted market prices from daily exchange traded markets, based on the closing price as of the balance sheet date, and are classified as Level 1. Unrealized mark-to-market gains and losses are recorded to Other income, net. For the first quarter of 2024 and 2023, we recorded unrealized mark-to-market losses of $
2
million and gains of $
8
million, respectively, on our investment in Vita Coco
.
19
KEURIG DR PEPPER INC.
NOTES TO CONDENSED CONSOLIDATED FINANCIAL STATEMENTS
(UNAUDITED, CONTINUED)
| March 31, | December 31, | ||||||||||
| (in millions) | 2024 | 2023 | |||||||||
| Accrued expenses: | |||||||||||
| Accrued customer trade | $ |
|
$ |
|
|||||||
| Accrued compensation |
|
|
|||||||||
| Insurance reserve |
|
|
|||||||||
| Accrued interest |
|
|
|||||||||
| Other accrued expenses |
|
|
|||||||||
| Total accrued expenses | $ |
|
$ |
|
|||||||
| Other current liabilities: | |||||||||||
| Dividends payable | $ |
|
$ |
|
|||||||
| Income taxes payable |
|
|
|||||||||
|
|
|
||||||||||
|
|
|
||||||||||
| Derivative instruments |
|
|
|||||||||
| Other |
|
|
|||||||||
| Total other current liabilities | $ |
|
$ |
|
|||||||
| Other non-current liabilities: | |||||||||||
| $ |
|
$ |
|
||||||||
|
|
|
||||||||||
| Pension and post-retirement liability |
|
|
|||||||||
| Insurance reserves |
|
|
|||||||||
| Derivative instruments |
|
|
|||||||||
| Deferred compensation liability |
|
|
|||||||||
| Other |
|
|
|||||||||
| Total other non-current liabilities | $ |
|
$ |
|
|||||||
ACCOUNTS PAYABLE
20
KEURIG DR PEPPER INC.
NOTES TO CONDENSED CONSOLIDATED FINANCIAL STATEMENTS
(UNAUDITED, CONTINUED)
14.
Commitments and Contingencies
KDP is occasionally subject to litigation or other legal proceedings. Reserves are recorded for specific legal proceedings when the Company determines that the likelihood of an unfavorable outcome is probable and the amount of loss can be reasonably estimated. We had litigation reserves of $
8
million and $
12
million, respectively, as of March 31, 2024 and December 31, 2023. We have also identified certain other legal matters where we believe an unfavorable outcome is reasonably possible and/or for which no estimate of possible losses can be made. We do not believe that the outcome of these, or any other, pending legal matters, individually or collectively, will have a material adverse effect on our results of operations, financial condition, or liquidity.
ANTITRUST LITIGATION
In February 2014, TreeHouse Foods, Inc. and certain affiliated entities filed suit against KDP’s wholly-owned subsidiary, Keurig (formerly known as Green Mountain Coffee Roasters, Inc.), in the U.S. District Court for the Southern District of New York (“SDNY”) (TreeHouse Foods, Inc. et al. v. Green Mountain Coffee Roasters, Inc. et al.). The TreeHouse complaint asserted claims under the federal antitrust laws and various state laws, contending that Keurig had monopolized alleged markets for single serve coffee brewers and single serve coffee pods. The TreeHouse complaint sought treble monetary damages, declaratory relief, injunctive relief and attorneys’ fees. In the months that followed, a number of additional actions, including claims from another coffee manufacturer (JBR, Inc.), as well as putative class actions on behalf of direct and indirect purchasers of Keurig’s products, were filed in various federal district courts, asserting claims and seeking relief substantially similar to the claims asserted and relief sought in the TreeHouse complaint. Additional similar actions were filed by individual direct purchasers (including McLane Company, Inc., BJ’s Wholesale Club, Inc., Winn-Dixie Stores Inc. and Bi-Lo Holding LLC) in 2019 and in 2021. All of these actions were transferred to the SDNY for coordinated pre-trial proceedings (In re: Keurig Green Mountain Single-Serve Coffee Antitrust Litigation) (the “Multidistrict Antitrust Litigation”).
In July 2020, Keurig reached an agreement with one of the plaintiff groups in the Multidistrict Antitrust Litigation, the putative indirect purchaser class, to settle the claims asserted for $
31
million. The settlement class consisted of individuals and entities in the United States that purchased, from persons other than Keurig and not for purposes of resale, Keurig manufactured or licensed single serve beverage portion packs during the applicable class period (beginning in September 2010 for most states). The settlement was approved and paid, and the indirect purchasers’ claims have been dismissed.
Discovery in all remaining matters pending in the Multidistrict Antitrust Litigation is concluded, with the plaintiffs collectively claiming more than $
5
billion of monetary damages. Keurig strongly disputes the merits of the claims and the calculation of damages. As a result, Keurig has fully briefed summary judgment motions that, if successful, would end the cases entirely. Keurig has also fully briefed other significant motions, including challenges to the validity of plaintiffs’ damages calculations. Keurig is also pursuing its opposition to direct purchaser plaintiffs’ motion for class certification. Certain of Keurig’s motions and opposition have been pending in the SDNY since 2021, with others pending since 2023.
Keurig intends to continue vigorously defending the remaining lawsuits. At this time, we are unable to predict the outcome of these lawsuits, the potential loss or range of loss, if any, associated with the resolution of these lawsuits or any potential effect they may have on us or our results of operations. Accordingly, we have not accrued for a loss contingency. Additionally, as the timelines in these cases may be beyond our control, we can provide no assurance as to whether or when there will be material developments in these matters.
21
KEURIG DR PEPPER INC.
NOTES TO CONDENSED CONSOLIDATED FINANCIAL STATEMENTS
(UNAUDITED, CONTINUED)
15.
Restructuring
RESTRUCTURING PROGRAMS
2023 CEO Succession and Associated Realignment
In 2023, we began to enact several organization movements to ensure succession plans, to reinforce enterprise capabilities to support growth, and to control costs. A key component of the program was the appointment of Tim Cofer as Chief Operating Officer, effective November 6, 2023, with the expectation that Mr. Cofer will succeed Robert Gamgort as our CEO during the second quarter of 2024. We are also realigning our executive and operating leadership structure to enable faster decision making and to better support various strategic initiatives. The program is expected to incur charges of approximately $
52
million, primarily driven by severance costs, which are expected to be incurred through 2024, and the sign-on bonus for Mr. Cofer as our new Chief Operating Officer.
2024 Network Optimization
In March 2024, we announced the closure of our manufacturing facility in Williston, Vermont, with operations and employees to be relocated to other existing manufacturing locations, in order to more effectively and efficiently meet the needs of consumers and customers. The relocation is expected to take place during the second and third quarters of 2024, and the restructuring program is expected to incur pre-tax restructuring charges in an estimated range of
$
30
million to
$
40
million
, primarily comprised of asset related costs.
RESTRUCTURING CHARGES
Restructuring and integration expenses for the defined programs during the periods presented were as follows:
| First Quarter | |||||||||||
| (in millions) | 2024 | 2023 | |||||||||
| 2023 CEO Succession and Associated Realignment | $ |
|
$ |
|
|||||||
| 2024 Network Optimization |
|
|
|||||||||
RESTRUCTURING LIABILITIES
Restructuring liabilities that qualify as exit and disposal costs under U.S. GAAP are included in accounts payable and accrued expenses on the unaudited condensed consolidated financial statements.
Restructuring liabilities, primarily consisting of workforce reduction costs, were as follows:
| (in millions) | Restructuring Liabilities | ||||
| Balance as of January 1, 2024 | $ |
|
|||
| Charges (credits) to expense |
(
|
||||
| Cash payments |
(
|
||||
| Balance as of March 31, 2024 | $ |
|
|||
16.
Transactions with Related Parties
REPURCHASE OF KDP COMMON STOCK
22
ITEM 2. Management's Discussion and Analysis of Financial Condition and Results of Operations
The following discussion should be read in conjunction with our audited consolidated financial statements and notes thereto in our Annual Report.
This Quarterly Report on Form 10-Q contains forward-looking statements within the meaning of Section 27A of the Securities Act of 1933, as amended, and Section 21E of the Exchange Act, including, in particular, statements about the impact of future events, future financial performance, plans (including our executive succession plan), strategies, expectations, prospects, competitive environment, regulation, labor matters, supply chain issues, inflation, and availability of raw materials. Forward-looking statements include all statements that are not historical facts and can be identified by the use of forward-looking terminology such as “outlook,” “guidance,” “anticipate,” “expect,” “believe,” “could,” “estimate,” “feel,” “forecast,” “intend,” “may,” “plan,” “potential,” “project,” “should,” “target,” “will,” “would,” and similar words, phrases or expressions and variations or negatives of these words in this Quarterly Report on Form 10-Q. We have based these forward-looking statements on our current views with respect to future events and financial performance. Our actual financial performance could differ materially from those projected in the forward-looking statements due to the inherent uncertainty of estimates, forecasts and projections, and our financial performance may be better or worse than anticipated. Given these uncertainties, you should not put undue reliance on any forward-looking statements. All of the forward-looking statements are qualified in their entirety by reference to the factors discussed under "Risk Factors" in Part I, Item 1A of our Annual Report, as well as our subsequent filings with the SEC. Forward-looking statements represent our estimates and assumptions only as of the date that they were made. We do not undertake any duty to update the forward-looking statements, and the estimates and assumptions associated with them, after the date of this Quarterly Report on Form 10-Q, except to the extent required by applicable securities laws.
This Quarterly Report on Form 10-Q contains the names of some of our owned or licensed trademarks, trade names and service marks, which we refer to as our brands. All of the product names included in this Quarterly Report on Form 10-Q are either our registered trademarks or those of our licensors.
OVERVIEW
KDP is a leading beverage company in North America that manufactures, markets, distributes, and sells hot and cold beverages and single serve brewing systems. We have a broad portfolio of iconic beverage brands, including Dr Pepper, Canada Dry, Mott's, A&W, Snapple, Peñafiel, 7UP, Green Mountain Coffee Roasters, Core Hydration, and The Original Donut Shop, as well as the Keurig brewing system. KDP has some of the most recognized beverage brands in North America, with significant consumer awareness levels and long histories that evoke strong emotional connections with consumers. We offer more than 125 owned, licensed, and partner brands, available nearly everywhere people shop and consume beverages through our sales and distribution network.
KDP operates as an integrated brand owner, manufacturer, and distributor. We believe our integrated business model strengthens our route-to-market and provides opportunities for net sales and profit growth through the alignment of the economic interests of our brand ownership and our manufacturing and distribution businesses through both our DSD system and our WD system. We market and sell our products to retailers, including supermarkets, mass merchandisers, club stores, pure-play e-commerce retailers, and office superstores; to restaurants, hotel chains, office product and coffee distributors, and partner brand owners; and directly to consumers through our website. Our integrated business model enables us to be more flexible and responsive to the changing needs of our large retail customers and allows us to more fully leverage our scale and reduce costs by creating greater geographic manufacturing and distribution coverage.
23
Our operating and reportable segments are as follows:
•
The U.S. Refreshment Beverages segment reflects sales in the U.S. from the manufacture and distribution of branded concentrates, syrup and finished beverages, including the sales of the Company's own brands and third-party brands, to third-party bottlers, distributors and retailers.
•
The U.S. Coffee segment reflects sales in the U.S. from the manufacture and distribution of finished goods relating to the Company's K-Cup pods, single-serve brewers and other coffee products to partners, retailers and directly to consumers through our Keurig.com website.
•
The International segment reflects sales in international markets, including the following:
◦
Sales in Canada, Mexico, the Caribbean, and other international markets from the manufacture and distribution of branded concentrates, syrup, and finished beverages, including sales of the Company's own brands and third-party brands, to third-party bottlers, distributors, and retailers.
◦
Sales in Canada from the manufacture and distribution of finished goods relating to the Company’s single-serve brewers, K-Cup pods, and other coffee products.
COMPARABLE RESULTS OF OPERATIONS
We eliminate from our financial results all applicable intercompany transactions between entities included in our consolidated financial statements and the intercompany transactions with our equity method investees. References in tables below to percentage changes that are not meaningful are denoted by "NM".
EXECUTIVE SUMMARY
Financial Overview - First Quarter of 2024 as compared to First Quarter of 2023
As Reported, in millions (except EPS)

Key Events During the First Quarter of 2024
March 2024 Debt Issuance
In March 2024, we completed the issuance of an aggregate principal amount of $3 billion of senior unsecured notes. The proceeds were used to repay the 2024 Notes at maturity, to repurchase KDP shares as described below, to repay outstanding commercial paper, and for general corporate purposes.
Repurchase of KDP Shares
In March 2024, JAB BevCo B.V., a subsidiary of JAB, sold 100 million shares of KDP’s common stock through an underwritten secondary offering. In connection with this offering, we repurchased 35 million shares at the per-share price paid by the underwriter, for a total of $1,012 million, which was effected under our existing share repurchase program.
24
RESULTS OF OPERATIONS
First Quarter of 2024 Compared to First Quarter of 2023
Consolidated Operations
The following table sets forth our unaudited condensed consolidated results of operations for the first quarter of 2024 and 2023:
| First Quarter | Dollar Change | Percentage Change | |||||||||||||||||||||
| ($ in millions, except per share amounts) | 2024 | 2023 | |||||||||||||||||||||
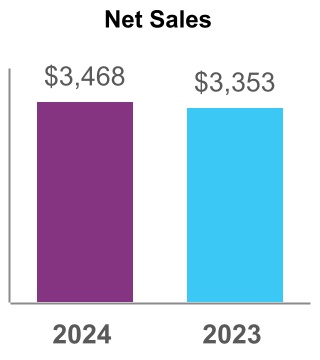
| Net sales | $ | 3,468 | $ | 3,353 | $ | 115 | 3.4 | % | |||||||||||||||
| Cost of sales | 1,528 | 1,609 | (81) | (5.0) | |||||||||||||||||||
| Gross profit | 1,940 | 1,744 | 196 | 11.2 | |||||||||||||||||||
| Selling, general and administrative expenses | 1,176 | 1,165 | 11 | 0.9 | |||||||||||||||||||
| Other operating income, net | (1) | (5) | 4 | NM | |||||||||||||||||||
| Income from operations | 765 | 584 | 181 | 31.0 | |||||||||||||||||||
| Interest expense | 178 | 23 | 155 | NM | |||||||||||||||||||
| Other income, net | (7) | (20) | 13 | NM | |||||||||||||||||||
| Income before provision for income taxes | 594 | 581 | 13 | 2.2 | |||||||||||||||||||
| Provision for income taxes | 140 | 114 | 26 | 22.8 | |||||||||||||||||||
| Net income | $ | 454 | $ | 467 | (13) | (2.8) | |||||||||||||||||
| Earnings per common share: | |||||||||||||||||||||||
| Basic | $ | 0.33 | $ | 0.33 | $ | — | — | % | |||||||||||||||
| Diluted | 0.33 | 0.33 | — | — | |||||||||||||||||||
| Gross margin | 55.9 | % | 52.0 | % | 390 bps | ||||||||||||||||||
| Operating margin | 22.1 | % | 17.4 | % | 470 bps | ||||||||||||||||||
| Effective tax rate | 23.6 | % | 19.6 | % | 400 bps | ||||||||||||||||||
Sales Volume.
The following table provides the percentage change in sales volume compared to the prior year period:
| Percentage Change | ||||||||
| LRB | (0.7) | % | ||||||
| K-Cup pods | (0.6) | |||||||
|
Appliances
|
21.7 | |||||||
Net Sales.
Net sales increased $115 million, or 3.4%, to $3,468 million for the first quarter of 2024 compared to $3,353 million in the prior year period. This performance reflected favorable net price realization (3.1%) and favorable FX translation (0.6%), slightly offset by unfavorable volume/mix (0.3%).
Gross Profit.
Gross profit increased $196 million, or 11.2%, to $1,940 million for the first quarter of 2024 compared to $1,744 million in the prior year period. This performance primarily reflected the impact to gross profit of the strong growth in net sales (6 percentage points), the benefit from the earned equity from the achievement of milestones associated with certain distribution agreements (3 percentage points), and a net benefit from changes in ingredients, materials, and productivity (2 percentage points). Gross margin increased 390 bps versus the prior year period to 55.9%.
Income from Operations.
Income from operations increased $181 million, or 31.0%, to $765 million for the first quarter of 2024 compared to $584 million in the prior year period, primarily driven by increased gross profit. Operating margin increased 470 bps from the prior year period to 22.1%.
25
Interest Expense.
Interest expense increased $155 million to $178 million for the first quarter of 2024 compared to $23 million for the prior year period, primarily driven by the unfavorable change in unrealized mark-to-market activity on interest rate contracts, resulting from increasing interest rates.
Effective Tax Rate.
The effective tax rate increased 400 bps to 23.6% for the first quarter of 2024, compared to 19.6% in the prior year period, driven by a shift in the mix of income from lower tax jurisdictions to higher tax jurisdictions (210 bps) and the unfavorable comparison to the prior year tax benefit received from favorable adjustments upon foreign tax return filing (150 bps).
Net Income.
Net income decreased $13 million, or 2.8%, to $454 million for the first quarter of 2024 as compared to $467 million in the prior year period, as increased interest expense and unfavorable changes in our effective tax rate offset our increased income from operations.
Diluted EPS.
Diluted EPS was flat relative to the prior year period at $0.33 per diluted share.
Results of Operations by Segment
The following tables provide net sales and income from operations for our reportable segments for the first quarter of 2024 and 2023, as well as the other amounts necessary to reconcile our total segment results to our consolidated results presented in accordance with U.S. GAAP.
| First Quarter | |||||||||||
| (in millions) | 2024 | 2023 | |||||||||
| Net sales | |||||||||||
| U.S. Refreshment Beverages | $ | 2,093 | $ | 2,007 | |||||||
| U.S. Coffee | 911 | 931 | |||||||||
| International | 464 | 415 | |||||||||
| Total net sales | $ | 3,468 | $ | 3,353 | |||||||
| Income from operations | |||||||||||
| U.S. Refreshment Beverages | $ | 615 | $ | 490 | |||||||
| U.S. Coffee | 248 | 232 | |||||||||
| International | 112 | 80 | |||||||||
| Unallocated corporate costs | (210) | (218) | |||||||||
| Total income from operations | $ | 765 | $ | 584 | |||||||
26
U.S. REFRESHMENT BEVERAGES
The following table provides selected information about our U.S. Refreshment Beverages segment's results:
| First Quarter | Dollar Change | Percentage Change | |||||||||||||||||||||
| (in millions) | 2024 | 2023 | |||||||||||||||||||||
| Net sales | $ | 2,093 | $ | 2,007 | $ | 86 | 4.3 | % | |||||||||||||||
| Income from operations | 615 | 490 | 125 | 25.5 | |||||||||||||||||||
| Operating margin | 29.4 | % | 24.4 | % | 500 bps | ||||||||||||||||||
Sales Volume.
Sales volume for the first quarter of 2024 decreased approximately 1.7% compared to the prior year period, as growth in Canada Dry and C4 Energy, combined with the launch of Electrolit within our distribution network, was more than offset by softness in the remainder of our portfolio.
Net Sales.
Net sales increased 4.3% to $2,093 million in the first quarter of 2024, compared to $2,007 million in the prior year period, driven by favorable net price realization (5.6%), which was partially offset by unfavorable volume/mix (1.3%).
Income from Operations.
Income from operations increased $125 million, or 25.5%, to $615 million for the first quarter of 2024 compared to $490 million for the prior year period. This performance was led by the benefits to gross profit from net sales growth (17 percentage points) and earned equity from the achievement of milestones associated with certain distribution agreements (9 percentage points), as well as a net benefit from changes in ingredients, materials, and productivity (2 percentage points). Operating margin improved 500 bps versus the year ago period to 29.4%.
U.S. COFFEE
The following table provides selected information about our U.S. Coffee segment's results:
| First Quarter | Dollar Change | Percentage Change | |||||||||||||||||||||
| (in millions) | 2024 | 2023 | |||||||||||||||||||||
| Net sales | $ | 911 | $ | 931 | $ | (20) | (2.1) | % | |||||||||||||||
| Income from operations | 248 | 232 | 16 | 6.9 | |||||||||||||||||||
| Operating margin | 27.2 | % | 24.9 | % | 230 bps | ||||||||||||||||||
Sales Volume.
K-Cup pod volume decreased 1.1% for the first quarter of 2024 compared to the prior year period, reflecting softer at-home coffee category trends. Appliance volume increased 26.1% in the first quarter of 2024, driven by Keurig market share momentum.
Net Sales.
Net sales decreased 2.1% to $911 million for the first quarter of 2024 compared to $931 million in the prior year period, driven by unfavorable volume/mix (1.8%) and net price realization (0.3%).
Income from Operations.
Income from operations increased $16 million, or 6.9%, to $248 million for the first quarter of 2024, compared to $232 million in the prior year period, driven by a net benefit from changes in ingredients, materials, and productivity (10 percentage points) and reduced costs associated with productivity projects (6 percentage points), partially offset by the impact to gross profit of the decrease in net sales (8 percentage points). Operating margin improved 230 bps versus the year ago period to 27.2%.
27
INTERNATIONAL
The following table provides selected information about our International segment's results:
| First Quarter | Dollar Change | Percentage Change | |||||||||||||||||||||
| (in millions) | 2024 | 2023 | |||||||||||||||||||||
| Net sales | $ | 464 | $ | 415 | $ | 49 | 11.8 | % | |||||||||||||||
| Income from operations | 112 | 80 | 32 | 40.0 | |||||||||||||||||||
| Operating margin | 24.1 | % | 19.3 | % | 480 bps | ||||||||||||||||||
Sales Volume.
The following table provides the percentage change in sales volume for the International segment compared to the prior year period:
| Percentage Change | ||||||||
| LRB | 4.0 | % | ||||||
| K-Cup pods | 2.8 | |||||||
|
Appliances
|
(4.2) | |||||||
Net Sales.
Net sales increased 11.8% to $464 million in the first quarter of 2024, compared to $415 million in the prior year period, reflecting volume/mix growth (4.8%), favorable FX translation (4.8%), and higher net price realization (2.2%).
Income from Operations.
Income from operations increased $32 million, or 40.0%, to $112 million for the first quarter of 2024 compared to $80 million in the prior year period. This performance reflected the impact to gross profit of higher net price realization and volume/mix growth (30 percentage points) and favorable FX impacts (9 percentage points). Operating margin improved 480 bps versus the year ago period to 24.1%.
CRITICAL ACCOUNTING ESTIMATES
The process of preparing our consolidated financial statements in conformity with U.S. GAAP requires the use of estimates and judgments that affect the reported amounts of assets, liabilities, revenue and expenses. Critical accounting estimates are both fundamental to the portrayal of a company’s financial condition and results and require difficult, subjective or complex estimates and assessments. These estimates and judgments are based on historical experience, future expectations and other factors and assumptions we believe to be reasonable under the circumstances. The most significant estimates and judgments are reviewed on an ongoing basis and revised when necessary. These critical accounting estimates are discussed in greater detail in Part II, Item 7 of our
Annual Report
.
28
LIQUIDITY AND CAPITAL RESOURCES
Overview
We believe our financial condition and liquidity remain strong. We continue to manage all aspects of our business, including, but not limited to, monitoring the financial health of our customers, suppliers and other third-party relationships, implementing gross margin enhancement strategies through our productivity initiatives, and developing new opportunities for growth such as innovation and agreements with partners to distribute brands that are accretive to our portfolio.
Cash generated by our foreign operations is generally repatriated to the U.S. periodically as working capital funding requirements, where allowed. We do not expect restrictions or taxes on repatriation of cash held outside the U.S. to have a material effect on our overall business, liquidity, financial condition or results of operations for the foreseeable future.
The following summarizes our cash activity for the first quarter of 2024 and 2023:
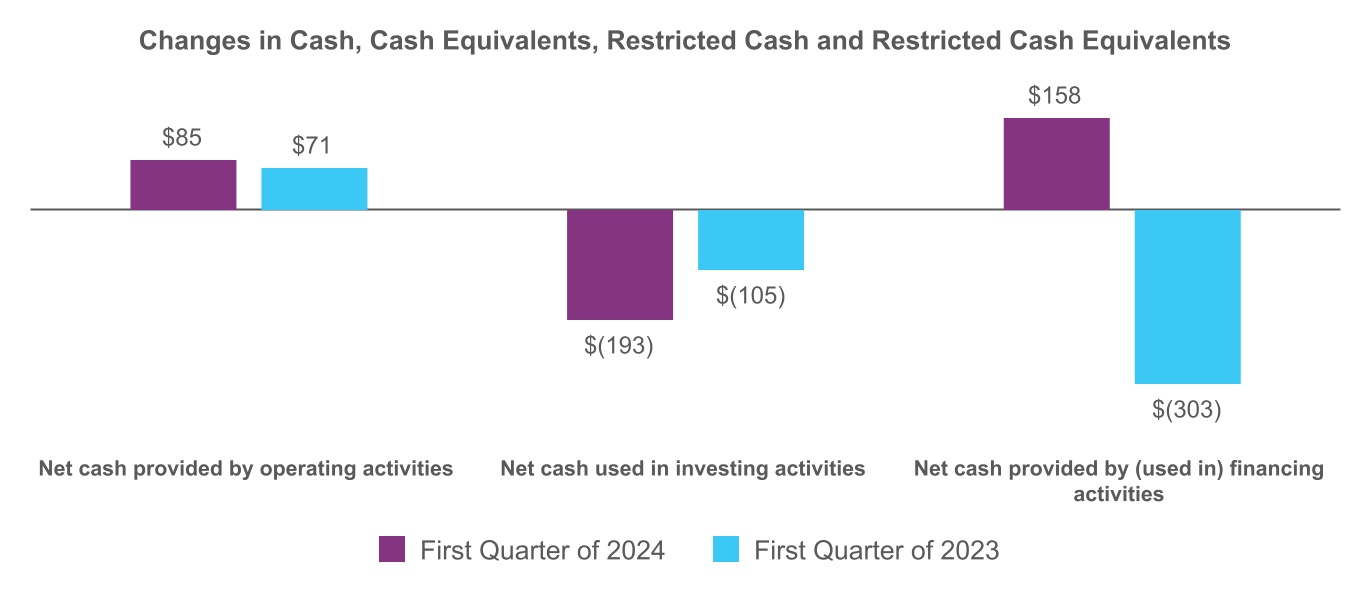
Principal Sources of Capital Resources
Our principal sources of liquidity are our existing cash and cash equivalents, cash generated from our operations, and borrowing capacity currently available under our Revolving Credit Agreement. Additionally, we have an uncommitted commercial paper program where we can issue unsecured commercial paper notes on a private placement basis. Based on our current and anticipated level of operations, we believe that our operating cash flows will be sufficient to meet our anticipated obligations for the next twelve months and thereafter for the foreseeable future. To the extent that our operating cash flows are not sufficient to meet our liquidity needs, we may utilize cash on hand or amounts available under our financing arrangements, if necessary. At any time, and from time to time, we may seek additional deleveraging, refinancing or liquidity enhancing transactions, including entering into transactions to repurchase or redeem outstanding indebtedness or otherwise seek transactions to reduce interest expense, extend debt maturities and improve our capital and liquidity structure
.
29
Sources of Liquidity - Operations
Net cash provided by operating activities increased $14 million for the first quarter of 2024, as compared to the first quarter of 2023, driven by an increase in working capital.
Cash Conversion Cycle
Our cash conversion cycle is defined as DIO and DSO less DPO. The calculation of each component of the cash conversion cycle is provided below:
| Component | Calculation (on a trailing twelve month basis) | |||||||
| DIO | (Average inventory divided by cost of sales) * Number of days in the period | |||||||
| DSO | (Accounts receivable divided by net sales) * Number of days in the period | |||||||
| DPO | (Accounts payable * Number of days in the period) divided by cost of sales and SG&A expenses | |||||||
The following table summarizes our cash conversion cycle:
| March 31, | ||||||||||||||
| 2024 | 2023 | |||||||||||||
| DIO | 70 | 71 | ||||||||||||
| DSO | 32 | 37 | ||||||||||||
| DPO | 100 | 154 | ||||||||||||
| Cash conversion cycle | 2 | (46) | ||||||||||||
Our cash conversion cycle increased 48 days to approximately 2 days as of March 31, 2024 as compared to (46) days as of March 31, 2023, which was primarily driven by the decrease in DPO, reflecting the reduction of payment terms for certain suppliers.
Accounts Payable Program
As part of our ongoing efforts to improve our cash flow and related liquidity, we work with our suppliers to optimize our terms and conditions, which includes payment terms. Excluding our suppliers who require cash at date of purchase or sale, our current payment terms with our suppliers generally range from 10 to 360 days. We also enter into agreements with third party administrators to allow participating suppliers to track payment obligations from us, and, if voluntarily elected by the supplier, sell payment obligations from us to financial institutions. Suppliers can sell one or more of our payment obligations at their sole discretion and our rights and obligations to our suppliers are not impacted. We have no economic interest in a supplier’s decision to enter into these agreements and no direct financial relationship with the financial institutions. Our obligations to our suppliers, including amounts due and scheduled payment terms, are not impacted.
30
Sources of Liquidity - Financing
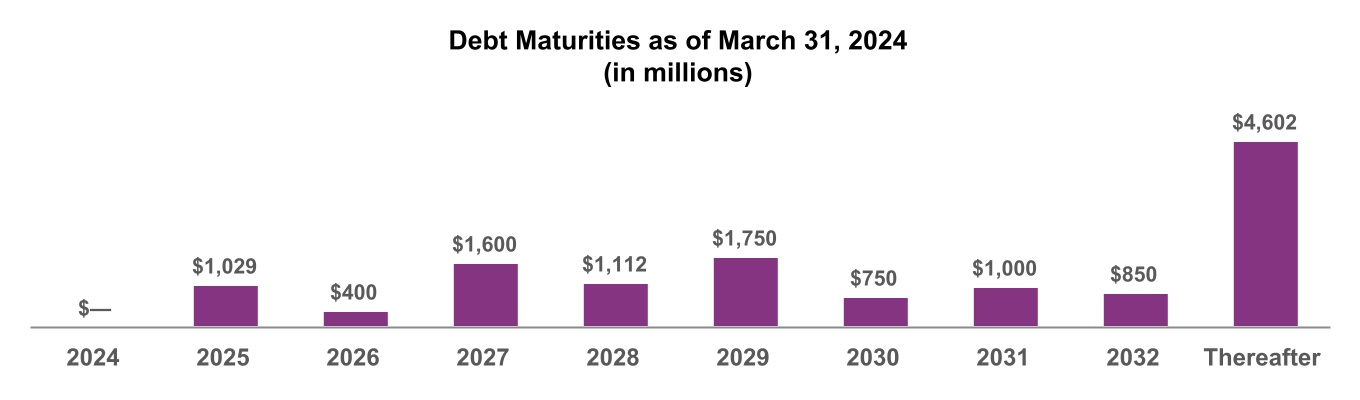
Refer to
Note 2 of the Notes to our Unaudited Condensed Consolidated Financial Statements for management's discussion of our financing arrangements.
We also have an active shelf registration statement, filed with the SEC on August 19, 2022, which allows us to issue an indeterminate number or amount of common stock, preferred stock, debt securities and warrants from time to time in one or more offerings at the direction of our Board.
Debt Ratings
Our credit ratings are as follows:
| Rating Agency | Long-Term Debt Rating | Commercial Paper Rating | Outlook | |||||||||||||||||
| Moody's | Baa1 | P-2 | Stable | |||||||||||||||||
| S&P | BBB | A-2 | Stable | |||||||||||||||||
These debt and commercial paper ratings impact the interest we pay on our financing arrangements. A downgrade of one or both of our debt and commercial paper ratings could increase our interest expense and decrease the cash available to fund anticipated obligations.
As of March 31, 2024, we were in compliance with all debt covenants and we have no reason to believe that we will be unable to satisfy these covenants.
Principal Uses of Capital Resources
Our capital allocation priorities are investing to grow our business both organically and inorganically, continuing to strengthen our balance sheet, and returning cash to shareholders through regular quarterly dividends and opportunistic share repurchases. We dynamically adjust our cash deployment plans based on the specific opportunities available in a given period, but over time we allocate capital to balance each of these priorities.
Regular Quarterly Dividends
We have declared total dividends of $0.215 per share and $0.20 per share for the first quarter of 2024 and 2023, respectively.
Repurchases of Common Stock
Our Board authorized a four-year share repurchase program, ending December 31, 2025, of up to $4 billion of our outstanding common stock. We repurchased and retired $1,105 million of common stock during the first quarter of 2024. As of March 31, 2024, $1,810 million
remained available for repurchase under the authorized share repurchase program.
31
Capital Expenditures
We continue to invest in state-of-the-art manufacturing and warehousing facilities, including expansive investments in facilities in Spartanburg, South Carolina, in order to optimize our supply chain network.
Purchases of property, plant and equipment were $158 million and $62 million for the first quarter of 2024 and 2023, respectively.
Capital expenditures, which includes both purchases of property, plant and equipment and amounts included in accounts payable and accrued expenses, for the first quarter of 2024 and 2023 primarily related to investments in manufacturing capabilities. Capital expenditures included in accounts payable and accrued expenses were $189 million and $222 million for the first quarter of 2024 and 2023, respectively, which primarily related to these investments.
Investments in Unconsolidated Affiliates
From time to time, we expect to invest in beverage startup companies or in brand ownership companies to grow our presence in certain product categories, or enter into various licensing and distribution agreements to expand our product portfolio. Our investments generally involve acquiring a minority interest in equity securities of a company, in certain cases with a protected path to ownership at our future option.
Purchases of Intangible Assets
We have invested in the expansion of our DSD network through transactions with strategic independent bottlers or third-party brand ownership companies to ensure competitive distribution scale. From time to time, we additionally acquire brand ownership companies to expand our portfolio. These transactions are generally accounted for as an asset acquisition, as the majority of the transaction price represents the acquisition of an intangible asset. Purchases of intangible assets were $31 million and $51 million for the first quarter of 2024 and 2023, respectively.
Uncertainties and Trends Affecting Liquidity
Disruptions in financial and credit markets, including those caused by inflation, global economic uncertainty and rising interest rates, may impact our ability to manage normal commercial relationships with our customers, suppliers and creditors. These disruptions could have a negative impact on the ability of our customers to timely pay their obligations to us, thus reducing our cash flow, or the ability of our vendors to timely supply materials.
Customer and consumer demand for our products may also be impacted by the risk factors discussed under "Risk Factors" in Part 1, Item 1A of our Annual Report, as well as subsequent filings with the SEC, that could have a material effect on production, delivery and consumption of our products, which could result in a reduction in our sales volume.
SUPPLEMENTAL GUARANTOR FINANCIAL INFORMATION
The Notes are fully and unconditionally guaranteed by certain of our direct and indirect subsidiaries (the "Guarantors"), as defined in the indentures governing the Notes. The Guarantors are 100% owned either directly or indirectly by us and jointly and severally guarantee, subject to the release provisions described below, our obligations under the Notes. None of our subsidiaries organized outside of the U.S., any of the subsidiaries held by Maple Parent Holdings Corp. prior to the DPS Merger or any of the subsidiaries acquired after the DPS Merger (collectively, the "Non-Guarantors") guarantee the Notes. The subsidiary guarantees with respect to the Notes are subject to release upon the occurrence of certain events, including the sale of all or substantially all of a subsidiary's assets, the release of the subsidiary's guarantee of our other indebtedness, our exercise of the legal defeasance option with respect to the Notes and the discharge of our obligations under the applicable indenture.
The following schedules present the summarized financial information for Keurig Dr Pepper Inc. (the “Parent”) and the Guarantors on a combined basis after intercompany eliminations; the Parent and the Guarantors' amounts due from and amounts due to Non-Guarantors are disclosed separately. The consolidating schedules are provided in accordance with the reporting requirements of Rule 13-01 under SEC Regulation S-X for the issuer and guarantor subsidiaries.
32
The summarized financial information for the Parent and Guarantors were as follows:
| (in millions) | For the First Quarter of 2024 | ||||
| Net sales | $ | 2,180 | |||
| Gross profit | 1,227 | ||||
| Income from operations | 390 | ||||
| Net income | 454 | ||||
| (in millions) | March 31, 2024 | December 31, 2023 | |||||||||
| Current assets | $ | 2,227 | $ | 1,957 | |||||||
| Non-current assets | 48,191 | 48,029 | |||||||||
|
Total assets
(1)
|
$ | 50,418 | $ | 49,986 | |||||||
| Current liabilities | $ | 5,102 | $ | 6,749 | |||||||
| Non-current liabilities | 19,791 | 16,689 | |||||||||
|
Total liabilities
(2)
|
$ | 24,893 | $ | 23,438 | |||||||
(1)
Includes $157 million and $56 million of intercompany receivables due to the Parent and Guarantors from the Non-Guarantors as of March 31, 2024 and December 31, 2023, respectively.
(2)
Includes $1,388 million and $1,399 million of intercompany payables due to the Non-Guarantors from the Parent and Guarantors as of March 31, 2024 and December 31, 2023, respectively.
ITEM 3. Quantitative and Qualitative Disclosures About Market Risk
There have been no material changes to the disclosures on market risk made in our Annual Report.
ITEM 4. Controls and Procedures
EVALUATION OF DISCLOSURE CONTROLS AND PROCEDURES
Based on evaluation of the effectiveness of our disclosure controls and procedures (as defined in Rule 13a-15(e) and 15d-15(e) of the
Exchange Act
) our management, including our Chief Executive Officer and Chief Financial Officer, has concluded that, as of March 31, 2024, our disclosure controls and procedures are effective to (i) provide reasonable assurance that information required to be disclosed in the
Exchange Act
filings is recorded, processed, summarized and reported within the time periods specified by the
SEC
's rules and forms, and (ii) ensure that information required to be disclosed by us in the reports we file or submit under the
Exchange Act
are accumulated and communicated to our management, including our Chief Executive Officer and Chief Financial Officer, as appropriate to allow timely decisions regarding required disclosure.
No change in our internal control over financial reporting (as defined in Rule 13a-15(f) of the Exchange Act) occurred during the quarter ended
March 31, 2024 that materially affected, or is reasonably likely to materially affect, our internal control over financial reporting.
33
PART II – OTHER INFORMATION
ITEM 1. Legal Proceedings
We are occasionally subject to litigation or other legal proceedings relating to our business. See Note 14 of the Notes to our Unaudited Condensed Consolidated Financial Statements for more information related to commitments and contingencies, which is incorporated herein by reference.
The Staff of the SEC (the “Staff”) has been investigating certain statements by the Company in its prior Exchange Act reports regarding the recyclability of our K-Cup pods. We have been cooperating with this investigation and have now reached what we believe to be an agreement in principle with the Staff to resolve the matter. This agreement is subject to finalizing documentation and must be approved by the SEC. If approved, this agreement, which includes a $1.5 million penalty, would not have a material impact on the Company.
ITEM 1A. Risk Factors
There have been no material changes from the risk factors set forth in Part I, Item 1A in our Annual Report.
ITEM 2. Unregistered Sales of Equity Securities and Use of Proceeds
On October 1, 2021, our Board authorized a share repurchase program of up to $4 billion of our outstanding common stock, enabling us to opportunistically return value to shareholders. The $4 billion authorization is effective for four years, beginning on January 1, 2022 and expiring on December 31, 2025, and does not require the purchase of any minimum number of shares. The following table summarizes shares repurchased by us under this program during the first quarter of 2024:
| Period | Total Number of Shares Purchased | Average Price Paid per Share | Total Number of Shares Purchased as Part of Publicly Announced Program | Maximum Amount of Dollars that May Yet be Used to Purchase Shares Under the Program | ||||||||||||||||||||||
| January 1 to January 31 | 1,000,000 | $ | 31.46 | 1,000,000 | $ | 2,883,705,022 | ||||||||||||||||||||
| February 1 to February 29 | 2,000,000 | 30.94 | 2,000,000 | 2,821,831,184 | ||||||||||||||||||||||
| March 1 to March 31 | 35,000,000 | 28.90 | 35,000,000 | 1,810,331,184 | ||||||||||||||||||||||
| Total | 38,000,000 | $ | 29.07 | 38,000,000 | $ | 1,810,331,184 | ||||||||||||||||||||
In March 2024, JAB BevCo B.V., a subsidiary of JAB, sold 100 million shares of KDP’s common stock through an underwritten secondary offering. In connection with this offering, we repurchased 35 million shares at the per-share price paid by the underwriter, which was effected under our existing share repurchase program.
ITEM 5. Other Information
During the first quarter of 2024, no directors or executive officers of the Company
adopted
or
terminated
any contract, instruction or written plan for the purchase or sale of Company securities that was intended to satisfy the affirmative defense conditions of Rule 10b5-1(c) or any “non-Rule 10b5-1 trading arrangement,” as defined in Item 408 of Regulation S-K.
34
ITEM 6. Exhibits
| No. | Exhibit Description | |||||||
| Amended and Restated Certificate of Incorporation of Dr Pepper Snapple Group, Inc. (filed as Exhibit 3.1 to the Company's Current Report on Form 8-K (filed on May 12, 2008) and incorporated herein by reference). | ||||||||
| Certificate of Amendment to Amended and Restated Certificate of Incorporation of Dr Pepper Snapple Group, Inc. effective as of May 17, 2012 (filed as Exhibit 3.2 to the Company's Quarterly Report on Form 10-Q (filed July 26, 2012) and incorporated herein by reference). | ||||||||
| Certificate of Second Amendment to Amended and Restated Certificate of Incorporation of Dr Pepper Snapple Group, Inc. effective as of May 19, 2016 (filed as Exhibit 3.1 to the Company's Current Report on Form 8-K (filed May 20, 2016) and incorporated herein by reference). | ||||||||
| Certificate of Third Amendment to the Amended and Restated Certificate of Incorporation of Dr Pepper Snapple Group, Inc. effective as of July 9, 2018 (filed as Exhibit 3.1 to the Company's Current Report on Form 8-K (filed July 9, 2018) and incorporated herein by reference). | ||||||||
| Amended and Restated By-Laws of Keurig Dr Pepper Inc. effective as of July 9, 2018 (filed as Exhibit 3.2 to the Company's Current Report on Form 8-K (filed July 9, 2018) and incorporated herein by reference). | ||||||||
| Base Indenture, dated as of March 7, 2024, among Keurig Dr Pepper Inc., the guarantors party thereto and U.S. Bank Trust Company, National Association, as trustee (filed as Exhibit 4.1 to the Company’s Current Report on Form 8-K (filed March 7, 2024) and incorporated herein by reference). | ||||||||
| First Supplemental Indenture, dated as of March 7, 2024, among Keurig Dr Pepper Inc., the guarantors party thereto and U.S. Bank Trust Company, National Association, as trustee (filed as Exhibit 4.2 to the Company’s Current Report on Form 8-K (filed March 7, 2024) and incorporated herein by reference). | ||||||||
| Form of Floating Rate Senior Note due 2027 (included in Exhibit 4.2 to the Company’s Current Report on Form 8-K (filed March 7, 2024) and incorporated herein by reference). | ||||||||
| Form of 5.100% Senior Note due 2027 (included in Exhibit 4.2 to the Company’s Current Report on Form 8-K (filed March 7, 2024) and incorporated herein by reference). | ||||||||
| Form of 5.050% Senior Note due 2029 (included in Exhibit 4.2 to the Company’s Current Report on Form 8-K (filed March 7, 2024) and incorporated herein by reference). | ||||||||
| Form of 5.200% Senior Note due 2031 (included in Exhibit 4.2 to the Company’s Current Report on Form 8-K (filed March 7, 2024) and incorporated herein by reference). | ||||||||
| Form of 5.300% Senior Note due 2034 (included in Exhibit 4.2 to the Company’s Current Report on Form 8-K (filed March 7, 2024) and incorporated herein by reference). | ||||||||
|
31.1
*
|
Certification of Chief Executive Officer of Keurig Dr Pepper Inc. pursuant to Rule 13a-14(a) or 15d-14(a) promulgated under the Exchange Act. | |||||||
|
31.2
*
|
Certification of Chief Financial Officer of Keurig Dr Pepper Inc. pursuant to Rule 13a-14(a) or 15d-14(a) promulgated under the Exchange Act. | |||||||
|
32.1
**
|
Certification of Chief Executive Officer of Keurig Dr Pepper Inc. pursuant to Rule 13a-14(b) or 15d-14(b) promulgated under the Exchange Act, and Section 1350 of Chapter 63 of Title 18 of the United States Code. | |||||||
|
32.2
**
|
Certification of Chief Financial Officer of Keurig Dr Pepper Inc. pursuant to Rule 13a-14(b) or 15d-14(b) promulgated under the Exchange Act, and Section 1350 of Chapter 63 of Title 18 of the United States Code. | |||||||
| 101* |
The following financial information from Keurig Dr Pepper Inc.'s Quarterly Report on Form 10-Q for the quarter ended March 31, 2024, formatted in Inline XBRL: (i) Condensed Consolidated Statements of Income, (ii) Condensed Consolidated Statements of Comprehensive Income, (iii) Condensed Consolidated Balance Sheets, (iv) Condensed Consolidated Statements of Cash Flows, (v) Condensed Consolidated Statement of Changes in Stockholders' Equity, and (vi) the Notes to Condensed Consolidated Financial Statements. The Instance document does not appear in the Interactive Data File because its XBRL tags are embedded within the Inline XBRL document.
|
|||||||
| 104* | The cover page from this Quarterly Report on Form 10-Q, formatted as Inline XBRL. | |||||||
* Filed herewith.
** Furnished herewith.
++ Indicates a management contract or compensatory plan or arrangement.
35
SIGNATURES
Pursuant to the requirements of the Securities Exchange Act of 1934, the registrant has duly caused this report to be signed on its behalf by the undersigned thereunto duly authorized.
| Keurig Dr Pepper Inc. | |||||||||||
| By: | /s/ Sudhanshu Priyadarshi | ||||||||||
| Name: | Sudhanshu Priyadarshi | ||||||||||
| Title: | Chief Financial Officer | ||||||||||
| (Principal Financial Officer) | |||||||||||
| Date: April 25, 2024 | |||||||||||
36
TABLE OF CONTENTS
Part I - Financial InformationprintItem 1. Financial Statements (unaudited)printItem 2. Management's Discussion and Analysis Of Financial Condition and Results Of OperationsprintItem 3. Quantitative and Qualitative Disclosures About Market RiskprintItem 4. Controls and ProceduresprintPart II Other InformationprintItem 1. Legal ProceedingsprintItem 1A. Risk FactorsprintItem 2. Unregistered Sales Of Equity Securities and Use Of ProceedsprintItem 5. Other InformationprintItem 6. Exhibitsprint