KELLY SERVICES INC
10-Ks and 10-Qs
|
|
|
|
|
|
|
|
|
|
|
|
|
|
|
|
|
|
|
|
|
|
|
|
|
|
|
|
|
|
|
|
|
|
|
|
|
|
|
|
|
|
|
|
|
|
|
|
|
|
|
|
|
|
|
|
|
|
|
UNITED STATES
SECURITIES AND EXCHANGE COMMISSION
Washington, D.C. 20549
FORM 10-K
[X] ANNUAL REPORT PURSUANT TO SECTION 13 OR 15(d) OF THE SECURITIES
EXCHANGE ACT OF 1934
For the fiscal year ended
January 3, 2016
OR
[ ]
TRANSITION REPORT PURSUANT TO SECTION 13 OR 15(d) OF THE SECURITIES
EXCHANGE ACT OF 1934
For the transition period from _________ to __________
Commission file number 0-1088
|
|
KELLY SERVICES, INC.
|
|
|
|
(Exact Name of Registrant as specified in its Charter)
|
|
|
|
Delaware
|
|
38-1510762
|
|
|
|
(State or other jurisdiction of
|
|
(IRS Employer Identification Number)
|
|
|
|
incorporation or organization)
|
|
|
|
|
999 West Big Beaver Road, Troy, Michigan
|
48084
|
|
|
(Address of Principal Executive Office)
|
(Zip Code)
|
|
|
|
(248) 362-4444
|
|
|
|
(Registrant’s Telephone Number, Including Area Code)
|
|
|
Securities Registered Pursuant to Section 12(b) of the Act:
|
||||
|
|
Title of each class
|
|
Name of each exchange on which registered
|
|
|
|
Class A Common
|
|
NASDAQ Global Market
|
|
|
|
Class B Common
|
|
NASDAQ Global Market
|
|
Securities Registered Pursuant to Section 12(g) of the Act: None
Indicate by check mark if the registrant is a well-known seasoned issuer, as defined in Rule 405 of the Securities Act. Yes
[ ]
No
[X]
Indicate by check mark if the registrant is not required to file reports pursuant to Section 13 or Section 15(d) of the Act. Yes
[ ]
No
[X]
Indicate by check mark whether the registrant (1) has filed all reports required to be filed by Section 13 or 15(d) of the Securities Exchange Act of 1934 during the preceding 12 months (or for such shorter period that the registrant was required to file such reports), and (2) has been subject to such filing requirements for the past 90 days. Yes
[X]
No
[ ]
Indicate by check mark whether the registrant has submitted electronically and posted on its corporate Web site, if any, every Interactive Data File required to be submitted and posted pursuant to Rule 405 of Regulation S-T (§232.405 of this chapter) during the preceding 12 months (or for shorter period that the registrant was required to submit and post such files). Yes [X] No [ ]
Indicate by check mark if disclosure of delinquent filers pursuant to Item 405 of Regulation S-K is not contained herein, and will not be contained, to the best of registrant’s knowledge, in definitive proxy or information statements incorporated by reference in Part III of this Form 10-K or any amendment to this Form 10-K.
[X]
1
Indicate by check mark whether the registrant is a large accelerated filer, an accelerated filer, a non-accelerated filer, or a smaller reporting company. See the definitions of “large accelerated filer,” “accelerated filer” and “smaller reporting company” in Rule 12b-2 of the Exchange Act.
|
Large accelerated filer [ ]
|
Accelerated filer [X]
|
|
Non-accelerated filer [ ] (Do not check if a smaller reporting company)
|
Smaller reporting company [ ]
|
Indicate by check mark whether the registrant is a shell company (as defined in Rule 12b-2 of the Act). Yes [ ] No [X]
The aggregate market value of the voting and non-voting common equity held by non-affiliates computed by reference to the price at which the common equity was last sold, or the average bid and asked price of such common equity, as of the last business day of the registrant’s most recently completed second fiscal quarter, was approximately
$486,699,653
.
Registrant had
34,551,823
shares of Class A and
3,439,161
of Class B common stock, par value $1.00, outstanding as of
February 7, 2016
.
Documents Incorporated by Reference
The proxy statement of the registrant with respect to its 2016 Annual Meeting of Stockholders is incorporated by reference in Part III.
2
Unless the context otherwise requires, throughout this Annual Report on Form 10-K the words “Kelly,” “Kelly Services,” “the Company,” “we,” “us” and “our” refer to Kelly Services, Inc. and its consolidated subsidiaries.
History and Development of Business
Founded by William R. Kelly in 1946, Kelly Services
®
has developed innovative workforce solutions for customers in a variety of industries throughout our 69-year history. Our range of solutions has grown steadily over the years to match the changing needs of our customers.
We have evolved from a United States-based company concentrating primarily on traditional office staffing into a global workforce solutions leader offering a full breadth of specialty services. While ranking as one of the world’s largest scientific staffing providers, we also place professional and technical employees at all levels in engineering, IT, law, healthcare and finance. These specialty services complement our expertise in office services, education, contact center, light industrial and electronic assembly staffing. As the human capital arena has become more complex, we have also developed a talent supply chain management approach to help many of the world’s largest companies plan for and manage their workforce. Innovative solutions supporting this approach span outsourcing, consulting, recruitment, career transition and vendor management services.
Geographic Breadth of Services
Headquartered in Troy, Michigan, we provide employment for approximately 550,000 employees annually to a variety of customers around the globe—including 93 of the
Fortune 100™
companies.
Kelly provides workforce solutions to a diversified group of customers in three regions: the
Americas
;
Europe, the Middle East
,
and Africa (“EMEA”)
; and
Asia Pacific
(“APAC”)
.
Description of Business Segments
Our operations are divided into seven principal business segments:
Americas Commercial
, Americas Professional and Technical
(“Americas PT”)
,
EMEA Commercial
, EMEA Professional and Technical
(“EMEA PT”)
,
APAC Commercial
, APAC Professional and Technical
(“APAC PT”)
and Outsourcing and Consulting Group
(“OCG”)
.
Americas Commercial
Our Americas Commercial segment specialties include: Office, providing trained employees for data entry, clerical and administrative support roles across numerous industries; Contact Center, providing staff for contact centers, technical support hotlines and telemarketing units; Education, supplying schools nationwide with instructional and non-instructional employees; Marketing, providing support staff for seminars, sales and trade shows; Electronic Assembly, providing assemblers, quality control inspectors and technicians; and Light Industrial, placing maintenance workers, material handlers and assemblers. We also offer a temporary-to-hire service that provides customers and temporary staff the opportunity to evaluate their relationship before making a full-time employment decision, as well as a direct-hire placement service and vendor on-site management.
Americas PT
Our Americas PT segment includes a number of specialty staffing services: Science, providing all levels of scientists and scientific and clinical research workforce solutions; Engineering, supplying engineering professionals across all disciplines, including aeronautical, chemical, civil/structural, electrical/instrumentation, environmental, industrial, mechanical, petroleum, pharmaceutical, quality and telecommunications; Information Technology, placing IT specialists across all disciplines; Creative Services, placing creative talent in the spectrum of creative services positions; Finance and Accounting, serving the needs of corporate finance departments, accounting firms and financial institutions with all levels of financial professionals; Healthcare, providing all levels of healthcare specialists and professionals; and Law, placing legal professionals including attorneys, paralegals, contract administrators, compliance specialists and legal administrators. Our temporary-to-hire service, direct-hire placement service and vendor on-site management are also offered in this segment.
3
EMEA Commercial
Our EMEA Commercial segment provides a similar range of staffing services as described for our Americas Commercial segment above, including: Office, Contact Center and our temporary-to-hire service. Additional service areas include: Catering and Hospitality, providing chefs, porters and hospitality representatives; and Industrial
,
supplying manual workers to semi-skilled professionals in a variety of trade, non-trade and operational positions.
EMEA PT
Our EMEA PT segment provides many of the same services as described for our Americas PT segment, including: Engineering, Finance and Accounting, Healthcare, IT and Science.
APAC Commercial
Our APAC Commercial segment offers a similar range of commercial staffing services as described for our Americas and EMEA Commercial segments above, through staffing solutions that include permanent placement, temporary staffing and temporary to full-time staffing.
APAC PT
Our APAC PT segment provides many of the same services as described for our Americas and EMEA PT segments, including: Engineering, IT and Science.
OCG
Our OCG segment delivers integrated talent management solutions to meet customer needs across multiple regions, skill sets and the entire spectrum of talent categories. Using talent supply chain strategies, we help customers manage their full-time and contingent labor spend, and gain access to service providers and quality talent at competitive rates with minimized risk. Services in this segment include:
Contingent Workforce Outsourcing (“CWO”)
, providing globally managed service solutions that integrate supplier and vendor management technology partners to optimize contingent workforce spend;
Business Process Outsourcing (“BPO”)
, offering full staffing and operational management of non-core functions or departments;
Recruitment Process Outsourcing (“RPO”)
, offering end-to-end talent acquisition solutions, including customized recruitment projects;
Independent Contractor Solutions
, delivering evaluation, classification and risk management services that enable safe access to this critical talent pool;
Payroll Process Outsourcing (“PPO”)
, providing centralized payroll processing solutions globally for our customers;
Career Transition and Executive Coaching and Development
; and
Executive Search
, providing leadership in executive placement in various regions throughout the world.
Financial information regarding our industry segments is included in the Segment Disclosures note to our consolidated financial statements presented in Part II, Item 8 of this report.
Business Objectives
Kelly’s philosophy is rooted in our conviction that we can and do make a difference on a daily basis — for our customers, in the lives of our employees, in the local communities we serve and in our industry. Our vision is “to provide the world’s best workforce solutions.” We aspire to be a strategic business partner to our customers and strive to assist them in operating more efficient and profitable organizations. Our solutions are customized to benefit any scope or scale customers require.
As the use of contingent labor, consultants and independent contractors becomes more prevalent and critical to the ongoing success of our customer base, our core competencies are refined to help them realize their respective business objectives. Kelly offers a comprehensive array of outsourcing and consulting services, as well as world-class staffing on a temporary, temporary-to-hire and direct placement basis. Kelly will continue to deliver the strategic expertise our customers need to transform their workforce challenges into opportunities.
4
Business Operations
Service Marks
We own numerous service marks that are registered with the United States Patent and Trademark Office, the European Union Community Trademark Office and numerous individual country trademark offices.
Seasonality
Our quarterly operating results are affected by the seasonality of our customers’ businesses. Demand for staffing services historically has been lower during the first quarter, and typically increases during the remainder of the year.
Working Capital
Our working capital requirements are primarily generated from temporary employee payroll and customer accounts receivable. Since receipts from customers generally lag payroll to temporary employees, working capital requirements increase substantially in periods of growth.
Customers
We are not dependent on any single customer or a limited segment of customers. In 2015, an estimated 51% of total Company revenue was attributed to 100 large customers. Our largest single customer accounted for approximately five percent of total revenue in 2015.
Government Contracts
Although we conduct business under various federal, state, and local government contracts, no single one accounts for more than three percent of total Company revenue in 2015.
Competition
The worldwide temporary staffing industry is competitive and highly fragmented. In the United States, approximately 100 competitors operate nationally, and approximately 10,000 smaller companies compete in varying degrees at local levels. Additionally, several similar staffing companies compete globally. In 2015, our largest competitors were Adecco S.A., Randstad Holding N.V., ManpowerGroup Inc., Allegis Group and Recruit Holdings.
Key factors that influence our success are quality of service, price and breadth of service.
Quality of service is highly dependent on the availability of qualified, competent talent, and our ability to recruit, screen, train, retain and manage a pool of employees who match the skills required by particular customers. During an economic downturn, we must balance competitive pricing pressures with the need to retain a qualified workforce. Price competition in the staffing industry is intense, particularly for office clerical and light industrial personnel, and pricing pressure from customers and competitors continues to be significant.
Breadth of service, or ability to manage staffing suppliers, has become more critical as customers seek a single supplier to manage all their staffing needs. Kelly’s talent supply chain management approach seeks to address this requirement for our larger customers, enabling us to deliver talent wherever and whenever they need it around the world.
Environmental Concerns
Because we are involved in a service business, federal, state or local laws that regulate the discharge of materials into the environment do not materially impact us.
Employees
We employ approximately 1,100 people at our corporate headquarters in Troy, Michigan, and approximately 7,000 staff members in our U.S. and international network of branch offices. In 2015, we assigned approximately 550,000 temporary employees to a variety of customers around the globe.
While services may be provided inside the facilities of customers, we remain the employer of record for our temporary employees. We retain responsibility for employee assignments, the employer’s share of all applicable payroll taxes and the administration of the employee’s share of these taxes.
5
Foreign Operations
For information regarding sales, earnings from operations and long-lived assets by domestic and foreign operations, please refer to the information presented in the Segment Disclosures note to our consolidated financial statements, presented in Part II, Item 8 of this report.
Access to Company Information
We electronically file our annual report on Form 10-K, quarterly reports on Form 10-Q, current reports on Form 8-K and all amendments to those reports with the Securities and Exchange Commission (“SEC”). The public may read and copy any of the reports that are filed with the SEC at the SEC’s Public Reference Room at 100 F Street, NE, Washington, DC 20549. The public may obtain information on the operation of the Public Reference Room by calling the SEC at 1-800-SEC-0330. The SEC also maintains an Internet website at
www.sec.gov
that contains reports, proxy and information statements and other information regarding issuers that file electronically.
We make available, free of charge, through our website, and by responding to requests addressed to our vice president of investor relations, our annual report on Form 10-K, quarterly reports on Form 10-Q, current reports on Form 8-K and all amendments to those reports. These reports are available as soon as reasonably practicable after such material is electronically filed with or furnished to the SEC. Our website address is: www.kellyservices.com. The information contained on our website, or on other websites linked to our website, is not part of this report.
6
We operate in a highly competitive industry with low barriers to entry and may be unable to compete successfully against existing or new competitors.
The worldwide staffing services market is highly competitive with limited barriers to entry. We compete in global, national, regional and local markets with full-service and specialized temporary staffing and consulting companies. While the majority of our competitors are significantly smaller than us, several competitors, including Adecco S.A., Randstad Holding N.V., ManpowerGroup Inc., Allegis Group and Recruit Holdings are considerably larger than we are and have substantial marketing and financial resources. Additionally, the emergence of online staffing platforms or other forms of disintermediation may pose a competitive threat to our services, which operate under a more traditional staffing business model. Price competition in the staffing industry is intense, particularly for the provision of office clerical and light industrial personnel. We expect that the level of competition will remain high, which could limit our ability to maintain or increase our market share or profitability.
The number of customers distributing their staffing service purchases among a broader group of competitors continues to increase which, in some cases, may make it more difficult for us to obtain new customers, or to retain or maintain our current share of business, with existing customers. We also face the risk that our current or prospective customers may decide to provide similar services internally. As a result, there can be no assurance that we will not encounter increased competition in the future.
Our business is significantly affected by fluctuations in general economic conditions.
Demand for staffing services is significantly affected by the general level of economic activity and employment in the United States and the other countries in which we operate. When economic activity increases, temporary employees are often added before full-time employees are hired. As economic activity slows, however, many companies reduce their use of temporary employees before laying off full-time employees. Significant swings in economic activity historically have had a disproportionate impact on staffing industry volumes. We may also experience more competitive pricing pressure during periods of economic downturn. A substantial portion of our revenues and earnings are generated by our business operations in the United States. Any significant economic downturn in the United States or certain other countries in which we operate could have a material adverse effect on our business, financial condition and results of operations.
We may not achieve the intended effects of our business strategy.
As discussed in the Management’s Discussion and Analysis of Financial Condition and Results of Operations, our business strategy focuses on driving growth in higher margin specialties — in Americas PT and also within our growing OCG segment. During 2014 we made targeted investments which included adjusting our operating models and increasing the resources necessary for driving growth in higher margin specialties and solutions business. These investments were intended to achieve strong sales growth in 2015 and beyond in both our OCG and Americas PT segments. If we are not successful in the execution of our strategy, we may not achieve either our stated goal of strong revenue growth in those segments or the intended productivity improvements, therefore negatively impacting future profitability.
We are at risk of damage to our brand, which is important to our success.
Our success depends, in part, on the goodwill associated with our brand. Because we assign employees to work under the direction and supervision of our customer at work locations not under Kelly’s control, we are at risk of our employees engaging in unauthorized conduct that could harm our reputation. Our Kelly Educational Staffing product is particularly susceptible to this exposure. Although we take appropriate steps to manage this risk, we cannot eliminate the potential of an adverse event. An occurrence that damages Kelly’s reputation could cause the loss of current and future customers, additional regulatory scrutiny and liability to third parties.
Our intellectual assets could be infringed upon or compromised, and there are limitations to our ability to protect against such events.
Our success is dependent in part on our proprietary business processes, our intellectual property and our thought leadership. To protect those rights, we depend upon protections afforded by the laws of the various countries in which we operate, as well as contractual language and our own enforcement initiatives. These defenses may not be sufficient to fully protect us or to deter infringement or other misappropriation of our trade secrets and other intellectual property. In addition, third parties may challenge the validity or enforceability of our intellectual property rights. We also face the risk that third parties may allege that the operation of our business infringes or otherwise misappropriates intellectual property rights that they own or license. Losses or claims of this nature could cause us to incur significant expense, harm our reputation, reduce our competitive
7
advantages or prevent us from offering certain services or solutions. The remedies available to us may be limited or leave us without full compensation.
If we fail to successfully develop new service offerings, we may be unable to retain our current customers and gain new customers and our revenues would decline.
The process of developing new service offerings requires accurate anticipation of customers’ changing needs and emerging technological trends. This may require that we make long-term investments and commit significant resources before knowing whether these investments will eventually result in service offerings that achieve customer acceptance and generate the revenues required to provide desired returns. If we fail to accurately anticipate and meet our customers’ needs through the development of new service offerings, our competitive position could be weakened and that could materially adversely affect our results of operations and financial condition.
As we increasingly offer services outside the realm of traditional staffing, including business process outsourcing, we are exposed to additional risks which could have a material adverse effect on our business.
Our business strategy focuses on growing our outsourcing and consulting business, including business process outsourcing, where we provide operational management of our customers’ non-core functions or departments. This could expose us to certain risks unique to that business, including product liability or product recalls. Although we have internal vetting processes to control such risks, there is no assurance that these processes will be effective. Additionally, while we maintain insurance in types and amounts we believe are appropriate in light of the aforementioned exposures, there can also be no assurance that such insurance policies will remain available on reasonable terms or be sufficient in amount or scope of coverage.
We are increasingly dependent on third parties for the execution of critical functions.
We do not maintain our own vendor management technology, and we have outsourced certain other critical applications or business processes to external providers including cloud-based services. We have elected to enter into supplier partnerships rather than establishing our own operations in some of the territories where our customers require our services. We exercise care in the selection and oversight of these providers and partners, and we take steps to ensure suitable replacement services are available. However, the failure or inability to perform on the part of one or more of these critical suppliers or partners could cause significant disruptions and increased costs.
Past and future acquisitions may not be successful.
From time to time, we acquire and invest in companies throughout the world. Acquisitions involve a number of risks, including the diversion of management’s attention from its existing operations, the failure to retain key personnel or customers of an acquired business, the failure to realize anticipated benefits such as cost savings and revenue enhancements, the potentially substantial transaction costs associated with acquisitions, the assumption of unknown liabilities of the acquired business and the inability to successfully integrate the business into our operations. Potential impairment losses could result if we overpay for an acquisition. There can be no assurance that any past or future acquired businesses will generate anticipated revenues or earnings.
Investments in equity affiliates expose us to additional risks and uncertainties.
We participate, or may participate in the future, in certain investments in equity affiliates, such as joint ventures or other equity investments with strategic partners. These arrangements expose us to a number of risks, including the risk that the management of the combined venture may not be able to fulfill their performance obligations under the management agreements or that the joint venture parties may be incapable of providing the required financial support. Additionally, improper, illegal or unethical actions by the venture management could have a negative impact on the reputation of the venture and our company.
A loss of major customers could have a material adverse effect on our business.
Our business strategy is focused on serving large corporate customers through high volume global service agreements. While our strategy is intended to enable us to increase our revenues and earnings from our major corporate customers, the strategy also exposes us to increased risks arising from the possible loss of major customer accounts. The deterioration of the financial condition or business prospects of these customers could reduce their need for staffing and OCG services and result in a significant decrease in the revenues and earnings we derive from these customers. Merger and acquisition activity involving our large corporate customers could put existing business at risk or impose additional pricing pressures. Since receipts from customers generally lag payroll to temporary employees, the bankruptcy of a major customer could have a material adverse impact on our ability to meet our working capital requirements. Additionally, most of our customer contracts can be terminated by the customer on short notice without penalty. This creates uncertainty with respect to the revenues and earnings we may recognize with respect to our customer contracts.
8
Our business with the federal government and government contractors presents additional risk considerations. We must comply with laws and regulations relating to the formation, administration and performance of federal government contracts. Failure to meet these obligations could result in civil penalties, fines, suspension of payments, reputational damage, disqualification from doing business with government agencies and other sanctions or adverse consequences. Government procurement practices may change in ways that impose additional costs or risks upon us or pose a competitive disadvantage. Our employees may be unable to obtain or retain the security clearances necessary to conduct business under certain contracts, or we could lose or be unable to secure or retain a necessary facility clearance. Government agencies may temporarily or permanently lose funding for awarded contracts, or there could be delays in the start-up of projects already awarded and funded.
We conduct a significant portion of our operations outside of the United States and we are subject to risks relating to our international business activities, including fluctuations in currency exchange rates and numerous legal and regulatory requirements.
We conduct our business in most major staffing markets throughout the world. Our operations outside the United States are subject to risks inherent in international business activities, including:
|
•
|
fluctuations in currency exchange rates;
|
|
•
|
restrictions or limitations on the transfer of funds;
|
|
•
|
government intrusions including asset seizures, expropriations or de facto control;
|
|
•
|
varying economic and political conditions;
|
|
•
|
differences in cultures and business practices;
|
|
•
|
differences in employment and tax laws and regulations;
|
|
•
|
differences in accounting and reporting requirements;
|
|
•
|
differences in labor and market conditions;
|
|
•
|
changing and, in some cases, complex or ambiguous laws and regulations;
|
|
•
|
violations of U.S. Foreign Corrupt Practices Act and similar anti-corruption laws; and
|
|
•
|
litigation and claims.
|
Our operations outside the United States are reported in the applicable local currencies and then translated into U.S. dollars at the applicable currency exchange rates for inclusion in our consolidated financial statements. Exchange rates for currencies of these countries may fluctuate in relation to the U.S. dollar and these fluctuations may have an adverse or favorable effect on our operating results when translating foreign currencies into U.S. dollars.
We depend on our ability to attract and retain qualified permanent full-time employees to lead complex talent supply chain sales solutions.
As we aim to expand the number of clients adopting a talent supply chain management approach in order to support our OCG growth strategy, we are highly reliant on individuals who possess specialized knowledge and skills to lead complex talent supply chain sales and operations. There can be no assurance that qualified personnel will continue to be available. Our success is increasingly dependent on our ability to attract and retain these experts.
We depend on our ability to attract and retain qualified temporary personnel (employed directly by us or through third-party suppliers).
We depend on our ability to attract qualified temporary personnel who possess the skills and experience necessary to meet the staffing requirements of our customers. We must continually evaluate our base of available qualified personnel to keep pace with changing customer needs. Competition for individuals with proven professional skills is intense, and demand for these individuals is expected to remain strong for the foreseeable future. There can be no assurance that qualified personnel will continue to be available in sufficient numbers and on terms of employment acceptable to us and our customers. Our success is substantially dependent on our ability to recruit and retain qualified temporary personnel.
9
We may be exposed to employment-related claims and losses, including class action lawsuits and collective actions, which could have a material adverse effect on our business.
We employ and assign personnel in the workplaces of other businesses. The risks of these activities include possible claims relating to:
|
•
|
discrimination and harassment;
|
|
•
|
wrongful termination or retaliation;
|
|
•
|
violations of employment rights related to employment screening or privacy issues;
|
|
•
|
apportionment between us and our customer of legal obligations as an employer of temporary employees;
|
|
•
|
classification of workers as employees or independent contractors;
|
|
•
|
employment of unauthorized workers;
|
|
•
|
violations of wage and hour requirements;
|
|
•
|
retroactive entitlement to employee benefits, including health insurance;
|
|
•
|
failure to comply with leave policy requirements; and
|
|
•
|
errors and omissions by our temporary employees, particularly for the actions of professionals such as attorneys, accountants, teachers and scientists.
|
We are also subject to potential risks relating to misuse of customer proprietary information, misappropriation of funds, death or injury to our employees, damage to customer facilities due to negligence of temporary employees, criminal activity and other similar occurrences. We may incur fines and other losses or negative publicity with respect to these risks. In addition, these occurrences may give rise to litigation, which could be time-consuming and expensive. In the U.S. and certain other countries in which we operate, new employment and labor laws and regulations have been proposed or adopted that may increase the potential exposure of employers to employment-related claims and litigation. Such laws and regulations are also arising with increasing frequency at the state and local level in the U.S. There can be no assurance that the corporate policies and practices we have in place to help reduce our exposure to these risks will be effective or that we will not experience losses as a result of these risks. Although we maintain insurance in types and amounts we believe are appropriate in light of the aforementioned exposures, there can also be no assurance that such insurance policies will remain available on reasonable terms or be sufficient in amount or scope of coverage. Additionally, should we have a material inability to produce records as a consequence of litigation or a government investigation, the cost or consequences of such matters could become much greater.
Cyber attacks or other breaches of network or information technology security, as well as risks associated with compliance on data privacy, could have an adverse
effect on our systems, services, reputation and financial results.
We rely upon multiple information technology systems and networks, some of which are cloud-based or managed by third parties, to process, transmit and store electronic information and to manage or support a variety of critical business processes and activities. In the course of these activities we may store or process proprietary or confidential information concerning current, past or prospective employees as well as customers, vendors and suppliers. The secure operation of these systems, networks and processes is critical to our business operations. Moreover, our temporary employees may be exposed to, or have access to, similar information in the course of their customer assignments. We routinely experience cyber attacks, which may include the use of malware, computer viruses, social engineering schemes and other means of disruption or unauthorized access.
The actions we take to reduce the risk of impairments to our operations or systems and breaches of confidential, private or proprietary data may not be sufficient to prevent or repel future cyber events or other impairments of our networks or information technologies. An event involving the destruction of or accidental or unauthorized release of sensitive information from systems related to our business (including cyber attacks or other security breaches as well as unauthorized actions by our employees, or a failure to comply with our obligations under various privacy laws and regulations) could result in damage to our reputation, fines, regulatory sanctions or interventions, contractual or financial liabilities, additional compliance costs, loss of employees or customers, and other forms of costs, losses or reimbursements, any of which could materially adversely affect our operations or financial condition. Our insurance coverage may not be sufficient to cover all such costs or consequences.
10
Damage to our key data centers could affect our ability to sustain critical business applications.
Many business processes critical to our continued operation are housed in our data center situated within the corporate headquarters complex as well as regional data centers in Asia-Pacific and Europe. Those processes include, but are not limited to, payroll, customer reporting and order management. While we have taken steps to protect these operations and have developed remote recovery capabilities, the loss of a data center would create a substantial risk of business interruption which could have a material adverse effect on our business, financial condition and results of operations.
Our information technology projects may not yield their intended results.
At the present time, we have a number of information technology projects in process or in the planning stages, including improvements to applicant onboarding and tracking systems, order management, billing and customer data analytics. Although the technology is intended to increase productivity and operating efficiencies, these projects may not yield their intended results. Any delays in completing, or an inability to successfully complete, these technology initiatives or an inability to achieve the anticipated efficiencies could adversely affect our operations, liquidity and financial condition. In addition, our information technology investments and strategy may not provide the ability to keep up with evolving industry trends and customer expectations which could weaken our competitive position.
Failure to maintain adequate financial and management processes and controls could lead to errors in our financial reporting.
Failure to maintain adequate financial and management processes and controls could lead to errors in our financial reporting. If our management is unable to certify the effectiveness of our internal controls or if our independent registered public accounting firm cannot render an opinion on the effectiveness of our internal controls over financial reporting, or if material weaknesses in our internal controls are identified, we could be subject to regulatory scrutiny and a loss of public confidence. In addition, if we do not maintain adequate financial and management personnel, processes and controls, we may not be able to accurately report our financial performance on a timely basis, which could have a negative effect on our stock price.
Impairment charges relating to our goodwill and long-lived assets could adversely affect our results of operations.
We regularly monitor our goodwill and long-lived assets for impairment indicators. In conducting our goodwill impairment testing, we compare the fair value of each of our reporting units with goodwill to the related net book value. In conducting our impairment analysis of long-lived assets, we compare the undiscounted cash flows expected to be generated from the long-lived assets to the related net book values. Changes in economic or operating conditions impacting our estimates and assumptions could result in the impairment of our goodwill or long-lived assets. In the event that we determine that our goodwill or long-lived assets are impaired, we may be required to record a significant non-cash charge to earnings that could adversely affect our results of operations.
Unexpected changes in claim trends on our workers’ compensation, disability and medical benefit plans may negatively impact our financial condition.
We self-insure, or otherwise bear financial responsibility for, a significant portion of expected losses under our workers’ compensation program, disability and medical benefits claims. Unexpected changes in claim trends, including the severity and frequency of claims, actuarial estimates and medical cost inflation, could result in costs that are significantly different than initially reported. If future claims-related liabilities increase due to unforeseen circumstances, or if we must make unfavorable adjustments to accruals for prior accident years, our costs could increase significantly. There can be no assurance that we will be able to increase the fees charged to our customers in a timely manner and in a sufficient amount to cover increased costs as a result of any changes in claims-related liabilities.
The impact of recent U.S. healthcare legislation on our results of operations could be significant.
In March 2010, the Patient Protection and Affordable Care Act and the Health Care and Education Reconciliation Act of 2010 (collectively, the “Acts”) were signed into U.S. law. The Acts represent comprehensive U.S. healthcare reform legislation that, in addition to other provisions, subjects us to potential penalties unless we offer to our employees minimum essential healthcare coverage that is affordable and provides minimum value. In order to comply with the employer mandate provision of the Acts, we have begun offering health care coverage to all temporary and permanent employees eligible for coverage under the Acts. Designating employees as eligible is complex, and is subject to challenge by employees and the Internal Revenue Service. While we believe we have properly identified eligible employees, a later determination that we failed to offer the required health coverage to eligible employees could result in penalties that may materially harm our business. We cannot be certain that compliant insurance coverage will remain available to us on reasonable terms, and we could face additional risks arising from future changes to the Acts or changed interpretations of our obligations under the Acts. There can be no assurance that we
11
will be able to recover all related costs through increased pricing to our customers or that they will be recovered in the period in which costs are incurred, and the net financial impact on our results of operations could be significant.
Our business is subject to extensive government regulation, which may restrict the types of employment services we are permitted to offer or result in additional or increased taxes, including payroll taxes or other costs that reduce our revenues and earnings.
The temporary employment industry is heavily regulated in many of the countries in which we operate. Changes in laws or government regulations may result in prohibition or restriction of certain types of employment services we are permitted to offer or the imposition of new or additional benefit, licensing or tax requirements that could reduce our revenues and earnings. In particular, we are subject to state unemployment taxes in the U.S., which typically increase during periods of increased levels of unemployment. We also receive benefits, such as the work opportunity income tax credit in the U.S., that regularly expire and may not be reinstated. There can be no assurance that we will be able to increase the fees charged to our customers in a timely manner and in a sufficient amount to fully cover increased costs as a result of any changes in laws or government regulations. Any future changes in laws or government regulations, or interpretations thereof, may make it more difficult or expensive for us to provide staffing services and could have a material adverse effect on our business, financial condition and results of operations.
We may have additional tax or unclaimed property liabilities that exceed our estimates.
We are subject to federal taxes and a multitude of state and local taxes in the U.S. and taxes in foreign jurisdictions. Our tax expense could be materially impacted by changes in tax laws in these jurisdictions, changes in the valuation of deferred tax assets and liabilities or changes in the mix of income by country. We are also subject to unclaimed or abandoned property (escheat) laws which require us to remit to certain U.S. government authorities the property of others held by us that has been unclaimed for a specified period of time, such as payroll checks issued to temporary employees. The demographics of our workforce and the visibility of our industry may make it more likely we become a target of government investigations, and we are regularly subject to audit by tax authorities. Although we believe our tax and unclaimed property estimates are reasonable, the final determination of audits and any related litigation could be materially different from our historical tax provisions and accruals. The results of an audit or litigation could materially harm our business.
Failure to maintain specified financial covenants in our bank credit facilities, or credit market events beyond our control, could adversely restrict our financial and operating flexibility and subject us to other risks, including risk of loss of access to capital markets.
Our bank credit facilities contain covenants that require us to maintain specified financial ratios and satisfy other financial conditions. During 2015, we met all of the covenant requirements. Our ability to continue to meet these financial covenants, particularly with respect to interest coverage (see Debt footnote in the notes to our consolidated financial statements), may not be assured. If we default under this or any other of these requirements, the lenders could declare all outstanding borrowings, accrued interest and fees to be due and payable or significantly increase the cost of the facility. In these circumstances, there can be no assurance that we would have sufficient liquidity to repay or refinance this indebtedness at favorable rates or at all. Events beyond our control could result in the failure of one or more of our banks, reducing our access to liquidity and potentially resulting in reduced financial and operating flexibility. If broader credit markets were to experience dislocation, our potential access to other funding sources would be limited.
Our controlling stockholder exercises voting control over our company and has the ability to elect or remove from office all of our directors.
Terence E. Adderley, the Executive Chairman and Chairman of the Board of our board of directors, and certain trusts with respect to which he acts as trustee or co-trustee, control approximately 93% of the outstanding shares of Kelly Class B common stock, which is the only class of our common stock entitled to voting rights. Mr. Adderley is therefore able to exercise voting control with respect to all matters requiring stockholder approval, including the election or removal from office of all members of the Board of Directors.
We are not subject to certain of the listing standards that normally apply to companies whose shares are quoted on the NASDAQ Global Market.
Our Class A and Class B common stock are quoted on the NASDAQ Global Market. Under the listing standards of the NASDAQ Global Market, we are deemed to be a “controlled company” by virtue of the fact that Terence E. Adderley, the Executive Chairman and Chairman of the Board of our board of directors, and certain trusts of which he acts as trustee or co-trustee have voting power with respect to more than fifty percent of our outstanding voting stock. A controlled company is not required to have a majority of its board of directors comprised of independent directors. Director nominees are not required to
12
be selected or recommended for the board’s selection by a majority of independent directors or a nominations committee comprised solely of independent directors, nor do the NASDAQ Global Market listing standards require a controlled company to certify the adoption of a formal written charter or board resolution, as applicable, addressing the nominations process. A controlled company is also exempt from NASDAQ Global Market’s requirements regarding the determination of officer compensation by a majority of independent directors or a compensation committee comprised solely of independent directors. A controlled company is required to have an audit committee composed of at least three directors who are independent as defined under the rules of both the Securities and Exchange Commission and the NASDAQ Global Market. The NASDAQ Global Market further requires that all members of the audit committee have the ability to read and understand fundamental financial statements and that at least one member of the audit committee possess financial sophistication. The independent directors must also meet at least twice a year in meetings at which only they are present.
We currently comply with certain of the listing standards of the NASDAQ Global Market that do not apply to controlled companies. Our compliance is voluntary, however, and there can be no assurance that we will continue to comply with these standards in the future.
Provisions in our certificate of incorporation and bylaws and Delaware law may delay or prevent an acquisition of our company.
Our restated certificate of incorporation and bylaws contain provisions that could make it harder for a third party to acquire us without the consent of our board of directors. For example, if a potential acquirer were to make a hostile bid for us, the acquirer would not be able to call a special meeting of stockholders to remove our board of directors or act by written consent without a meeting. The acquirer would also be required to provide advance notice of its proposal to replace directors at any annual meeting, and would not be able to cumulate votes at a meeting, which would require the acquirer to hold more shares to gain representation on the board of directors than if cumulative voting were permitted.
Our board of directors also has the ability to issue additional shares of common stock which could significantly dilute the ownership of a hostile acquirer. In addition, Section 203 of the Delaware General Corporation Law limits mergers and other business combination transactions involving 15 percent or greater stockholders of Delaware corporations unless certain board or stockholder approval requirements are satisfied. These provisions and other similar provisions make it more difficult for a third party to acquire us without negotiation.
Our board of directors could choose not to negotiate with an acquirer that it did not believe was in our strategic interests. If an acquirer is discouraged from offering to acquire us or prevented from successfully completing a hostile acquisition by these or other measures, our shareholders could lose the opportunity to sell their shares at a favorable price.
The holders of shares of our Class A common stock are not entitled to voting rights.
Under our certificate of incorporation, the holders of shares of our Class A common stock are not entitled to voting rights, except as otherwise required by Delaware law. As a result, Class A common stock holders do not have the right to vote for the election of directors or in connection with most other matters submitted for the vote of our stockholders.
13
Our stock price may be subject to significant volatility and could suffer a decline in value.
The market price of our common stock may be subject to significant volatility. We believe that many factors, including several which are beyond our control, have a significant effect on the market price of our common stock. These include:
|
•
|
actual or anticipated variations in our quarterly operating results;
|
|
•
|
announcements of new services by us or our competitors;
|
|
•
|
announcements relating to strategic relationships or acquisitions;
|
|
•
|
changes in financial estimates by securities analysts;
|
|
•
|
changes in general economic conditions;
|
|
•
|
actual or anticipated changes in laws and government regulations;
|
|
•
|
commencement of, or involvement in, litigation;
|
|
•
|
any major change in our board or management;
|
|
•
|
changes in industry trends or conditions; and
|
|
•
|
sales of significant amounts of our common stock or other securities in the market.
|
In addition, the stock market in general, and the NASDAQ Global Market in particular, have experienced significant price and volume fluctuations that have often been unrelated or disproportionate to the operating performance of listed companies. These broad market and industry factors may seriously harm the market price of our common stock, regardless of our operating performance. In the past, securities class action litigation has often been instituted following periods of volatility in the market price of a company’s securities. A securities class action suit against us could result in substantial costs, potential liabilities and the diversion of our management’s attention and resources. Further, our operating results may be below the expectations of securities analysts or investors. In such event, the price of our common stock may decline.
None.
14
We own our headquarters in Troy, Michigan, where corporate, subsidiary and divisional offices are currently located. The original headquarters building was purchased in 1977. Headquarters operations were expanded into additional buildings purchased in 1991, 1997 and 2001.
The combined usable floor space in the headquarters complex is approximately 345,000 square feet. Our buildings are in good condition and are currently adequate for their intended purpose and use. We also own undeveloped land in Troy and northern Oakland County, Michigan.
Branch office business is conducted in leased premises with the majority of leases being fixed for terms of generally three to five years in the U.S. and Canada and five to ten years outside the U.S. and Canada. We own virtually all of the office furniture and the equipment used in our corporate headquarters and branch offices.
The Company is a party to a pending nationwide class action lawsuit entitled Hillson et.al. v Kelly Services. The suit alleges that current and former temporary employees of Kelly Services are entitled to monetary damages for violation of the Fair Credit Reporting Act requirement that the notice and disclosure form provided to employees for purposes of conducting a background screening be a standalone document. On January 16, 2016, Kelly and plaintiffs agreed to settle the case. The parties still must agree to the settlement structure and secure court approval of the settlement. In light of amounts previously expensed and anticipated recoveries from third parties, Kelly recorded an accrual in the fourth quarter of $4.1 million to reflect the expected cost of the tentative settlement.
The Company is continuously engaged in litigation arising in the ordinary course of its business, such as matters alleging employment discrimination, alleging wage and hour violations or enforcing the restrictive covenants in the Company’s employment agreements. While there is no expectation that any of these matters will have a material adverse effect on the Company’s results of operations, financial position or cash flows, litigation is always subject to inherent uncertainty and the Company is not able to reasonably predict if any matter will be resolved in a manner that is materially adverse to the Company.
Not applicable.
15
Market Information and Dividends
Our Class A and Class B common stock is traded on the NASDAQ Global Market under the symbols “KELYA” and “KELYB,” respectively. The high and low selling prices for our Class A common stock and Class B common stock as quoted by the NASDAQ Global Market and the dividends paid on the common stock for each quarterly period in the last two fiscal years are reported in the table below. Our ability to pay dividends is subject to compliance with certain financial covenants contained in our debt facilities, as described in the Debt footnote in the notes to our consolidated financial statements.
|
|
Per share amounts (in dollars)
|
||||||||||||||||||
|
First
Quarter
|
Second
Quarter
|
Third
Quarter
|
Fourth
Quarter
|
Year
|
|||||||||||||||
|
2015
|
|
|
|
|
|
||||||||||||||
|
Class A common
|
|
|
|
|
|
||||||||||||||
|
High
|
$
|
18.22
|
|
$
|
17.86
|
|
$
|
15.82
|
|
$
|
17.51
|
|
$
|
18.22
|
|
||||
|
Low
|
15.10
|
|
14.66
|
|
13.47
|
|
13.67
|
|
13.47
|
|
|||||||||
|
Class B common
|
|||||||||||||||||||
|
High
|
17.96
|
|
N/A
|
|
(1)
|
15.38
|
|
17.42
|
|
17.96
|
|
||||||||
|
Low
|
15.85
|
|
N/A
|
|
(1)
|
13.20
|
|
12.24
|
|
12.24
|
|
||||||||
|
Dividends
|
0.05
|
|
0.05
|
|
0.05
|
|
0.05
|
|
0.20
|
|
|||||||||
|
2014
|
|
|
|
|
|
||||||||||||||
|
Class A common
|
|
|
|
|
|
||||||||||||||
|
High
|
$
|
26.17
|
|
$
|
25.31
|
|
$
|
18.00
|
|
$
|
17.81
|
|
$
|
26.17
|
|
||||
|
Low
|
22.50
|
|
17.05
|
|
14.86
|
|
14.74
|
|
14.74
|
|
|||||||||
|
Class B common
|
|
|
|
|
|
||||||||||||||
|
High
|
30.00
|
|
25.71
|
|
17.49
|
|
17.26
|
|
30.00
|
|
|||||||||
|
Low
|
21.56
|
|
17.00
|
|
16.04
|
|
14.33
|
|
14.33
|
|
|||||||||
|
Dividends
|
0.05
|
|
0.05
|
|
0.05
|
|
0.05
|
|
0.20
|
|
|||||||||
(1)
No trading in the Company’s Class B common shares was reported for the applicable period.
Holders
The number of holders of record of our Class A and Class B common stock were approximately 8,400 and 300, respectively, as of February 5, 2016.
Recent Sales of Unregistered Securities
None.
16
Issuer Purchases of Equity Securities
During the fourth quarter of
2015
, we reacquired shares of our Class A common stock as follows:
|
Period
|
Total Number
of Shares
(or Units)
Purchased
|
Average
Price Paid
per Share
(or Unit)
|
Total Number
of Shares (or
Units) Purchased
as Part of Publicly
Announced Plans
or Programs
|
Maximum Number
(or Approximate
Dollar Value) of
Shares (or Units)
That May Yet Be
Purchased Under the
Plans or Programs
|
||||||||||
|
|
|
|
|
(in millions of dollars)
|
||||||||||
|
September 28, 2015 through November 1, 2015
|
63,447
|
|
$
|
14.21
|
|
—
|
|
$
|
—
|
|
||||
|
November 2, 2015 through November 29, 2015
|
1,777
|
|
16.90
|
|
—
|
|
—
|
|
||||||
|
November 30, 2015 through January 3, 2016
|
647
|
|
16.15
|
|
—
|
|
—
|
|
||||||
|
Total
|
65,871
|
|
$
|
14.31
|
|
—
|
|
|
|
|||||
We may reacquire shares sold to cover taxes due upon the vesting of restricted stock held by employees. Accordingly,
65,871
shares were reacquired during the Company’s fourth quarter.
17
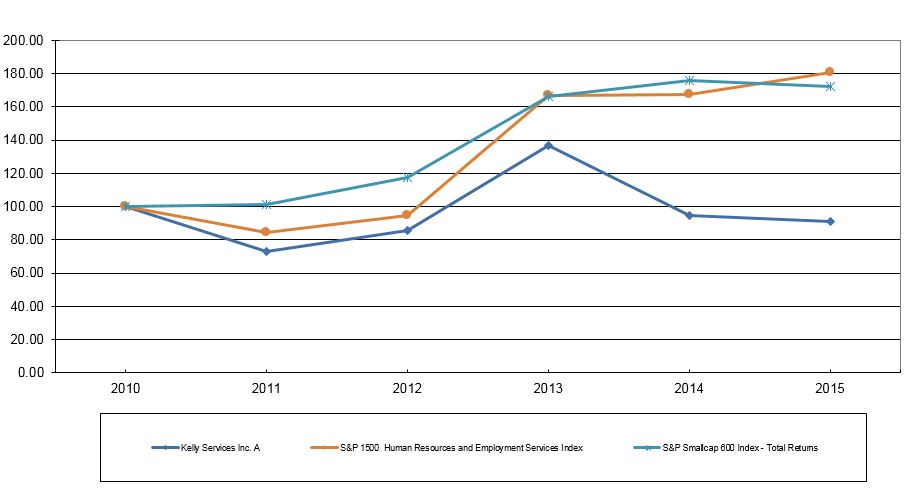
Performance Graph
The following graph compares the cumulative total return of our Class A common stock with that of the S&P 600 SmallCap Index and the S&P 1500 Human Resources and Employment Services Index for the five years ended December 31,
2015
. The graph assumes an investment of $100 on December 31, 2010 and that all dividends were reinvested.
COMPARISON OF 5 YEAR CUMULATIVE TOTAL RETURN
Assumes Initial Investment of $100
December 31, 2010 – December 31, 2015
|
|
2010
|
2011
|
2012
|
2013
|
2014
|
2015
|
||||||||||||
|
Kelly Services, Inc.
|
$
|
100.00
|
|
$
|
73.24
|
|
$
|
85.52
|
|
$
|
136.98
|
|
$
|
94.53
|
|
$
|
90.80
|
|
|
S&P SmallCap 600 Index
|
$
|
100.00
|
|
$
|
101.02
|
|
$
|
117.51
|
|
$
|
166.05
|
|
$
|
175.61
|
|
$
|
172.15
|
|
|
S&P 1500 Human Resources and Employment Services Index
|
$
|
100.00
|
|
$
|
84.50
|
|
$
|
94.60
|
|
$
|
166.95
|
|
$
|
167.56
|
|
$
|
180.89
|
|
18
The following table summarizes selected financial information of Kelly Services, Inc. and its subsidiaries for each of the most recent five fiscal years. This table should be read in conjunction with the other financial information, including “Management’s Discussion and Analysis of Financial Condition and Results of Operations” and the consolidated financial statements included elsewhere in this report. The statement of earnings data for the
2012
and
2011
fiscal years as well as the balance sheet data as of
2013
,
2012
and
2011
are derived from consolidated financial statements previously on file with the SEC.
|
(In millions except per share amounts)
|
2015
(1)
|
2014
|
2013
|
2012
|
2011
|
|||||||||||||||
|
Revenue from services
|
$
|
5,518.2
|
|
$
|
5,562.7
|
|
$
|
5,413.1
|
|
$
|
5,450.5
|
|
$
|
5,551.0
|
|
|||||
|
Earnings from continuing operations
(2)
|
53.8
|
|
23.7
|
|
58.9
|
|
49.7
|
|
64.9
|
|
||||||||||
|
Earnings (loss) from discontinued operations, net of tax
(3)
|
—
|
|
—
|
|
—
|
|
0.4
|
|
(1.2
|
)
|
||||||||||
|
Net earnings
|
53.8
|
|
23.7
|
|
58.9
|
|
50.1
|
|
63.7
|
|
||||||||||
|
Basic earnings per share:
|
|
|
|
|
|
|||||||||||||||
|
Earnings from continuing operations
|
1.39
|
|
0.61
|
|
1.54
|
|
1.31
|
|
1.72
|
|
||||||||||
|
Earnings (loss) from discontinued operations
|
—
|
|
—
|
|
—
|
|
0.01
|
|
(0.03
|
)
|
||||||||||
|
Net earnings
|
1.39
|
|
0.61
|
|
1.54
|
|
1.32
|
|
1.69
|
|
||||||||||
|
Diluted earnings per share:
|
|
|
|
|
|
|||||||||||||||
|
Earnings from continuing operations
|
1.39
|
|
0.61
|
|
1.54
|
|
1.31
|
|
1.72
|
|
||||||||||
|
Earnings (loss) from discontinued operations
|
—
|
|
—
|
|
—
|
|
0.01
|
|
(0.03
|
)
|
||||||||||
|
Net earnings
|
1.39
|
|
0.61
|
|
1.54
|
|
1.32
|
|
1.69
|
|
||||||||||
|
Dividends per share
|
|
|
|
|
|
|||||||||||||||
|
Classes A and B common
|
0.20
|
|
0.20
|
|
0.20
|
|
0.20
|
|
0.10
|
|
||||||||||
|
Working capital
(4)
|
411.3
|
|
428.1
|
|
474.5
|
|
470.3
|
|
417.0
|
|
||||||||||
|
Total assets
|
1,939.6
|
|
1,917.9
|
|
1,798.6
|
|
1,635.7
|
|
1,541.7
|
|
||||||||||
|
Total noncurrent liabilities
|
228.4
|
|
224.1
|
|
214.0
|
|
172.4
|
|
168.3
|
|
||||||||||
|
(1)
|
Fiscal year included 53 weeks.
|
|
(2)
|
Included in results of continuing operations are asset impairments of $1.7 million in 2013 and $3.1 million in 2012.
|
|
(3)
|
Discontinued operations represent adjustments to assets and liabilities retained from the 2007 sale of Kelly Home Care.
|
|
(4)
|
Working capital is calculated as current assets minus current liabilities.
|
19
Executive Overview
The Workforce Solutions Industry
The staffing industry has changed dramatically over the last decade — transformed by globalization, competitive consolidation and secular shifts in labor supply and demand. Global employment trends are reshaping and redefining traditional employment models, sourcing strategies and human resource capability requirements. In response, the industry has accelerated its evolution from commercial into professional/technical and outsourced solutions.
The broader workforce solutions industry has continued to evolve to meet businesses’ growing demand for total workforce or talent supply chain management (“TSCM”) solutions. As clients’ workforce solutions strategies move up the maturity model, the TSCM concept seeks to manage all categories of talent (temporary, project-based, outsourced and full-time) and thus represents significant market potential.
Strategic clients are increasingly looking for global, flexible and holistic talent solutions that encompass all worker categories, driving adoption of our TSCM approach covering temporary staffing, Contingent Workforce Outsourcing (“CWO”), Recruitment Process Outsourcing (“RPO”), Business Process Outsourcing (“BPO”), independent contractor management, strategic workforce planning and more.
Across all regions, the structural shifts toward higher-skilled, project-based professional/technical talent continue to represent long-term opportunities for the industry. In fact, professional/technical staffing is projected to steadily increase as a percent of the global market, with demand for specialty staffing projected to outpace commercial.
Our Business
Kelly Services is a global workforce solutions company, serving customers of all sizes in a variety of industries. Our staffing operations are divided into three regions (Americas, EMEA and APAC), with commercial and professional/technical staffing businesses in each region. As the human capital arena has become more complex, we have also developed a suite of innovative solutions within our global Outsourcing & Consulting Group (OCG). OCG delivers integrated talent management solutions to meet customer needs across the entire spectrum of talent categories. Using talent supply chain strategies, we help customers plan for and manage their acquisition of contingent and full-time labor, and gain access to service providers and quality talent at competitive rates with minimized risk.
We earn revenues from the hourly sales of services by our temporary employees to customers, as a result of recruiting permanent employees for our customers, and through our outsourcing activities. Our working capital requirements are primarily generated from temporary employee payroll and customer accounts receivable. The nature of our business is such that trade accounts receivable are our most significant financial asset. Average days sales outstanding varies within and outside the U.S., but is 54 days on a global basis as of the 2015 year end. Since receipts from customers generally lag temporary employee payroll, working capital requirements increase substantially in periods of growth.
Our Strategy and Outlook
Our long-term strategic objective is to create shareholder value by delivering a competitive profit from the best workforce solutions and talent in the industry. To achieve this, we are focused on the following key areas:
|
•
|
Maintain our core strengths in commercial staffing in key markets;
|
|
•
|
Grow our professional and technical solutions;
|
|
•
|
Enhance our position as a market-leading provider of talent supply chain management in our OCG segment; and
|
|
•
|
Lower our costs through deployment of efficient service delivery models.
|
In order to accelerate our strategy, execute our commitment to growth, and work toward our long-term goal, we made targeted investments in 2014, which included adjusting our operating models and increasing the resources necessary for driving growth in higher-margin specialties and solutions. Specifically, we designed our investments to align with our long-term strategic objectives including growing Americas PT staffing and expanding our global OCG solutions. These investments are intended to achieve strong sales growth in both OCG and our Americas PT segments.
20
To bring additional efficiency to our operating models across the organization, on September 15, 2014, the Board of Directors of the Company approved a management simplification restructuring plan (“Plan”) that we completed during the fourth quarter of 2014. With our new delivery models in place, we entered 2015 focused on executing our strategy, and we made progress on several fronts:
|
•
|
Earnings from operations for the full year of 2015 totaled $66.7 million compared to $21.9 million in 2014. Included in the results from operations for 2014 are restructuring charges of $12.0 million. Excluding this item, earnings from operations were $33.9 million in 2014.
|
|
•
|
Our OCG segment earned a full-year operating profit of $28.5 million, a 76% increase compared to last year. OCG delivered good bottom-line leverage as top-line revenue growth continues to confirm the increased market demand for outsourced solutions. Growth was particularly strong in BPO and CWO, which continue to be key drivers of our strategic and financial progress.
|
|
•
|
Though overall Americas PT revenue grew just 2% year-over-year in both reported and constant currency, accounts serviced through our U.S. branch network delivered strong growth of 16% in our PT specialties. Our expanded salesforce is pursuing and winning new business, while our PT recruiting centers are efficiently connecting U.S. clients with specialized talent. We will need to continue to accelerate PT growth, particularly within accounts serviced through our centralized delivery model, to fully realize the expected benefit of our investments. The success of these investments are impacted by the shifting of some of our large account customers from single-sourced arrangements to a more competitively sourced model. While this places additional pressure on growth in these PT accounts, competitively sourced arrangements create additional opportunities in our OCG business.
|
|
•
|
Despite foreign currency exchange rates negatively impacting the total year-over-year change in gross profit, on a constant currency basis, Kelly delivered strong operating leverage. For the full year, growth in constant currency earnings from operations excluding the 2014 restructuring charges represented nearly 70% of our constant currency gross profit growth.
|
Kelly remains focused on executing a well-formed strategy with increased speed and precision, making the necessary investments to advance that strategy. We have set our sights on becoming an even more competitive, consultative, and profitable company, and we are reshaping our business to make that vision a reality. With our new operating models in place, we are working to rebalance our resources to align with our goals for growth, intentionally rebalancing our workforce toward roles that drive increased revenue and GP for the company.
As we measure our progress against both revenue growth and improved operating leverage, we believe “conversion rate” (earnings from operations as a percentage of gross profit) is an important metric that will provide useful insight as we execute our plans. The goals we have established are based on the current economic and business environment, and may change as conditions warrant:
|
•
|
We expect to grow PT and OCG revenue, creating a more balanced portfolio that yields benefits from an improved mix.
|
|
•
|
We expect Commercial to remain a core component of our strategy.
|
|
•
|
We expect to exercise strict control over our cost base, delivering structural improvements that create strong operating leverage.
|
|
•
|
And, as a result, we expect our conversion rate to continue to improve.
|
Looking ahead, we anticipate a stable U.S. labor market and an increasing demand for skilled workers. Companies are relying more heavily on the use of flexible staffing models; there is growing acceptance of free agents and contractual employment by companies and talent alike; and companies are seeking more comprehensive workforce management solutions that lend themselves to Kelly’s talent supply chain management approach. This shift in demand for contingent labor and strategic solutions plays to our strengths and experience — particularly serving large companies whose needs span the globe and cross multiple labor categories.
21
Financial Measures
Return on sales (earnings from operations divided by revenue from services) and conversion rate in the following tables are ratios used to measure the Company’s pricing strategy and operating efficiency.
Constant currency (“CC”) change amounts are non-GAAP (Generally Accepted Accounting Principles) measures. The CC change amounts in the following tables refer to the year-over-year percentage changes resulting from translating 2015 financial data into U.S. dollars using the same foreign currency exchange rates used to translate financial data for 2014. These measures may be different from non-GAAP financial measures used by other companies, limiting their usefulness for comparison purposes. We believe that CC measurements are an important analytical tool to aid in understanding underlying operating trends without distortion due to currency fluctuations. Additionally, substantially all of our foreign subsidiaries derive revenues and incur cost of services and selling, general and administrative expenses (“SG&A”) within a single country and currency which, as a result, provide a natural hedge against currency risks in connection with their normal business operations. Non-GAAP measures should not be considered a substitute for, or superior to, measures of financial performance prepared in accordance with GAAP.
Staffing Fee-Based Income
Staffing fee-based income, which is included in revenue from services in the following tables, has a significant impact on gross profit rates. There are very low direct costs of services associated with staffing fee-based income. Therefore, increases or decreases in staffing fee-based income can have a disproportionate impact on gross profit rates.
22
Results of Operations
2015 versus 2014
Total Company
(Dollars in millions)
|
|
2015
(53 Weeks) |
2014
(52 Weeks) |
Change
|
CC
Change
|
||||||||||
|
Revenue from services
|
$
|
5,518.2
|
|
$
|
5,562.7
|
|
(0.8
|
)%
|
4.7
|
%
|
||||
|
Staffing fee-based income
|
65.3
|
|
76.5
|
|
(14.5
|
)
|
(4.8
|
)
|
||||||
|
Gross profit
|
920.3
|
|
908.4
|
|
1.3
|
|
6.4
|
|
||||||
|
SG&A expenses excluding restructuring charges
|
853.6
|
|
874.5
|
|
(2.4
|
)
|
2.2
|
|
||||||
|
Restructuring charges
|
—
|
|
12.0
|
|
(100.0
|
)
|
(100.0
|
)
|
||||||
|
Total SG&A expenses
|
853.6
|
|
886.5
|
|
(3.7
|
)
|
0.8
|
|
||||||
|
Earnings from operations
|
66.7
|
|
21.9
|
|
206.2
|
|
|
|
||||||
|
Gross profit rate
|
16.7
|
%
|
16.3
|
%
|
0.4
|
|
pts.
|
|
||||||
|
Expense rates (excluding restructuring charges):
|
|
|
||||||||||||
|
% of revenue
|
15.5
|
|
15.7
|
|
(0.2
|
)
|
|
|
||||||
|
% of gross profit
|
92.8
|
|
96.3
|
|
(3.5
|
)
|
|
|
||||||
|
Return on sales
|
1.2
|
|
0.4
|
|
0.8
|
|
|
|
||||||
|
Conversion rate
|
7.2
|
|
2.4
|
|
4.8
|
|
||||||||
Total Company revenue from services for 2015 was down 0.8% in comparison to the prior year, primarily as a result of currency fluctuations. During 2015, the U.S. dollar strengthened against certain currencies, primarily the Euro, Russian ruble and the Australian dollar, compared to 2014. On a CC basis, total Company revenue increased 4.7% year over year, as more fully described in the following discussions. The 2015 fiscal year included a 53rd week. This fiscal leap year occurs every five or six years and is necessary to align the fiscal and calendar periods. The 53rd week added approximately 1% to 2015 reported and CC revenue.
The gross profit rate increased 40 basis points on a year-over-year basis. As more fully described in the following discussions, an increase in the Americas region gross profit rate was partially offset by declines in the gross profit rate in EMEA, APAC and OCG.
SG&A expenses excluding restructuring costs decreased 2.4% year over year, reflecting the impact of changes in foreign currency exchange rates. On a CC basis, SG&A expenses increased 2.2% due to higher expenses in our U.S. branch-based and OCG businesses and higher corporate litigation-related expenses. These increases were partially offset by the cost savings of our Plan, and continued cost management efforts in EMEA and APAC. Restructuring charges in 2014 include $9.9 million related to the Plan, $0.8 million of costs incurred for exiting the staffing business in Sweden and $1.3 million related to closing branches in Australia and consolidating back office functions in Australia and New Zealand.
Income tax expense for 2015 was $8.7 million, compared to a benefit of $7.1 million for 2014. Our tax expense is affected by recurring items, such as the amount of pretax income and its mix by jurisdiction, U.S. work opportunity credits, and the change in cash surrender value of non-taxable investments in life insurance policies. It is also affected by discrete items that may occur in any given year but are not consistent from year to year, such as tax law changes, or changes in judgment regarding the realizability of deferred tax assets. The 2015 year-over-year increase in income tax expense is primarily due to increased pretax income. The work opportunity credit program was extended through 2019 in the fourth quarter of 2015 and retroactively applied to 2015, providing stability for this item.
Diluted earnings per share for 2015 were $1.39, as compared to $0.61 for 2014.
23
Total Americas
(Dollars in millions)
|
|
2015
(53 Weeks) |
2014
(52 Weeks) |
Change
|
CC
Change
|
||||||||||
|
Revenue from services
|
$
|
3,576.2
|
|
$
|
3,565.6
|
|
0.3
|
%
|
2.0
|
%
|
||||
|
Staffing fee-based income
|
32.1
|
|
30.0
|
|
7.2
|
|
9.0
|
|
||||||
|
Gross profit
|
565.3
|
|
535.5
|
|
5.5
|
|
7.1
|
|
||||||
|
Total SG&A expenses
|
456.6
|
|
446.8
|
|
2.2
|
|
3.7
|
|
||||||
|
Earnings from operations
|
108.7
|
|
88.7
|
|
22.7
|
|
|
|
||||||
|
Gross profit rate
|
15.8
|
%
|
15.0
|
%
|
0.8
|
|
pts.
|
|
||||||
|
Expense rates:
|
|
|
||||||||||||
|
% of revenue
|
12.8
|
|
12.5
|
|
0.3
|
|
|
|
||||||
|
% of gross profit
|
80.8
|
|
83.5
|
|
(2.7
|
)
|
|
|
||||||
|
Return on sales
|
3.0
|
|
2.5
|
|
0.5
|
|
|
|
||||||
The increase in reported Americas revenue from services was due to a 2% increase in hours worked, offset by a 2% decrease in average bill rates. Average bill rates were flat on a constant currency basis. The increase in hours worked was due to increases in our local branch network customer activity. Americas represented 65% of total Company revenue in 2015 and 64% in 2014. The 53rd week added approximately 1% to 2015 reported and CC revenue in Americas.
Revenue in our Commercial segment was flat and up 2% on a CC basis in comparison to the prior year. The increase in CC revenue in Commercial was primarily due to increases in our educational staffing business, as a result of new customer wins, and in our light industrial product, due to increased demand at existing customer locations, coupled with additional new customer wins. Light industrial business is up primarily in accounts serviced through our branch-based delivery model. Volume in our large accounts using our centralized delivery model is down as a result of our exit from certain large accounts due to pricing discipline and the reduced revenue from our natural resources customers related to lower oil prices.
In the PT segment, reported and CC revenue was up 2% in comparison to the prior year. Increases in accounts serviced through our branch delivery model more than offset the decreases in accounts for customers services through the centralized delivery model. Revenue has increased in our science and finance products, while revenue in our engineering product decreased primarily due to the completion of certain projects. IT revenue, specifically in the centralized delivery model, is down mainly due to customers moving from a traditional staffing model to an outsourced model delivered by our OCG business. On an overall basis, we have seen a shift in the buying behavior of our large centrally delivered customers from single-sourced arrangements to a more competitively sourced model, which puts pressure on revenue in accounts serviced in our centralized delivery model.
The increase in the gross profit rate was primarily due to improved management of our payroll taxes and employee benefit costs, coupled with improved pricing in our U.S. branch network and overall customer mix.
The increase in SG&A expenses is attributable to the increased incentive costs and compensation in our local branch network, partially offset by the impact of the Plan we implemented in the fourth quarter of last year.
24
Total EMEA
(Dollars in millions)
|
|
2015
(53 Weeks) |
2014
(52 Weeks) |
Change
|
CC
Change
|
||||||||||
|
Revenue from services
|
$
|
945.0
|
|
$
|
1,085.0
|
|
(12.9
|
)%
|
3.4
|
%
|
||||
|
Staffing fee-based income
|
23.3
|
|
30.8
|
|
(24.5
|
)
|
(7.1
|
)
|
||||||
|
Gross profit
|
143.2
|
|
173.5
|
|
(17.5
|
)
|
(1.7
|
)
|
||||||
|
SG&A expenses excluding restructuring charges
|
129.2
|
|
160.6
|
|
(19.6
|
)
|
(5.0
|
)
|
||||||
|
Restructuring charges
|
—
|
|
0.8
|
|
(100.0
|
)
|
(100.0
|
)
|
||||||
|
Total SG&A expenses
|
129.2
|
|
161.4
|
|
(20.0
|
)
|
(5.5
|
)
|
||||||
|
Earnings from operations
|
14.0
|
|
12.1
|
|
16.1
|
|
|
|
||||||
|
Gross profit rate
|
15.2
|
%
|
16.0
|
%
|
(0.8
|
)
|
pts.
|
|
|
|||||
|
Expense rates (excluding restructuring charges):
|
|
|
|
|
||||||||||
|
% of revenue
|
13.7
|
|
14.8
|
|
(1.1
|
)
|
|
|
||||||
|
% of gross profit
|
90.2
|
|
92.5
|
|
(2.3
|
)
|
|
|
||||||
|
Return on sales
|
1.5
|
|
1.1
|
|
0.4
|
|
|
|
||||||
The decrease in reported EMEA revenue from services was primarily due to the impact of changes in foreign currency exchange rates. The increase in CC revenue from services was due to a 7% increase in hours, partially offset by a 3% decrease in average bill rates on a CC basis, combined with a decrease in staffing fee-based income. The increase in hours was due primarily to higher hours volume in Portugal and France, partially offset by a reduction of hours volume with larger customers in Switzerland. The decrease in average bill rates was due primarily to increasing revenue in Portugal, a country with lower average bill rates. EMEA represented 17% of total Company revenue in 2015 and 20% in 2014. The 53rd week added approximately 1% to 2015 reported and CC revenue in EMEA.
The EMEA gross profit rate decreased primarily due to a decline in the temporary gross profit rate and a decline in staffing fee-based income. Staffing fee-based income declined in both Commercial and PT, primarily in Russia, partially offset by increases in staffing fee-based income in some other countries. Economic conditions in Russia continue to be challenging, resulting in the decline in staffing fee-based income. The decrease in the temporary gross profit rate was primarily driven by unfavorable country mix, as described above.
SG&A expenses decreased due to cost saving actions taken in 2015, primarily in Switzerland, Norway and the U.K., and the exit of staffing operations in Sweden. Restructuring costs recorded in 2014 reflect costs incurred for exiting the staffing business in Sweden.
25
Total APAC
(Dollars in millions)
|
|
2015
(53 Weeks) |
2014
(52 Weeks) |
Change
|
CC
Change
|
||||||||||
|
Revenue from services
|
$
|
387.7
|
|
$
|
392.2
|
|
(1.1
|
)%
|
12.9
|
%
|
||||
|
Staffing fee-based income
|
11.6
|
|
15.7
|
|
(25.5
|
)
|
(16.3
|
)
|
||||||
|
Gross profit
|
55.8
|
|
60.2
|
|
(7.4
|
)
|
5.2
|
|
||||||
|
SG&A expenses excluding restructuring charges
|
46.7
|
|
56.4
|
|
(17.0
|
)
|
(5.9
|
)
|
||||||
|
Restructuring charges
|
—
|
|
1.3
|
|
(100.0
|
)
|
(100.0
|
)
|
||||||
|
Total SG&A expenses
|
46.7
|
|
57.7
|
|
(19.0
|
)
|
(8.1
|
)
|
||||||
|
Earnings from operations
|
9.1
|
|
2.5
|
|
261.6
|
|
|
|
||||||
|
Gross profit rate
|
14.4
|
%
|
15.4
|
%
|
(1.0
|
)
|
pts.
|
|
|
|||||
|
Expense rates (excluding restructuring charges):
|
|
|
|
|||||||||||
|
% of revenue
|
12.1
|
|
14.4
|
|
(2.3
|
)
|
|
|
||||||
|
% of gross profit
|
83.9
|
|
93.6
|
|
(9.7
|
)
|
|
|
||||||
|
Return on sales
|
2.3
|
|
0.6
|
|
1.7
|
|
|
|
||||||
The reported change in total APAC revenue from services was primarily due to the impact of changes in foreign currency exchange rates. The increase in revenue from services on a CC basis was primarily due to a 13% increase in hours worked, primarily in India. Average bill rates declined 11% on a reported basis and increased 1% on a CC basis. APAC revenue represented 7% of total Company revenue in both 2015 and 2014. The 53rd week in fiscal 2015 did not have a material impact on reported and CC revenue in APAC.
The gross profit rate declined due to decreases in the staffing fee-based income and the temporary gross profit rate, partially offset by higher-than-expected wage credits in Singapore. The reduction in the temporary gross profit rate was due to an increased proportion of large accounts with lower margins. Staffing fee-based income decreased due mainly to a weaker hiring climate in Australia and Singapore. Singapore wage credits include additional prior year credits received in the current year, and totaled $5.2 million in 2015 and $2.2 million in 2014.
The decrease in SG&A expenses excluding restructuring charges was due to continuing productivity improvements primarily achieved by consolidating the Australia and New Zealand operations in the prior year. Restructuring charges in 2014 relate to costs for exiting branches in Australia and consolidating back office functions in Australia and New Zealand.
26
OCG
(Dollars in millions)
|
|
2015
(53 Weeks) |
2014
(52 Weeks) |
Change
|
CC
Change
|
||||||||||
|
Revenue from services
|
$
|
673.8
|
|
$
|
586.8
|
|
14.8
|
%
|
16.6
|
%
|
||||
|
Gross profit
|
160.6
|
|
143.6
|
|
11.9
|
|
14.2
|
|
||||||
|
Total SG&A expenses
|
132.1
|
|
127.3
|
|
3.7
|
|
6.4
|
|
||||||
|
Earnings from operations
|
28.5
|
|
16.3
|
|
75.8
|
|
|
|
||||||
|
Gross profit rate
|
23.8
|
%
|
24.5
|
%
|
(0.7
|
)
|
pts.
|
|
||||||
|
Expense rates:
|
|
|
||||||||||||
|
% of revenue
|
19.6
|
|
21.7
|
|
(2.1
|
)
|
|
|
||||||
|
% of gross profit
|
82.2
|
|
88.7
|
|
(6.5
|
)
|
|
|
||||||
|
Return on sales
|
4.2
|
|
2.8
|
|
1.4
|
|
|
|
||||||
Revenue from services in the OCG segment increased during 2015 due primarily to growth in the BPO and CWO practice areas. Revenue in BPO grew by 25% year over year and CWO, which includes PPO, grew by 17% year over year. The revenue growth in BPO and CWO was due to the expansion of programs with existing customers and, to a lesser extent, new customers. OCG revenue represented 12% of total Company revenue in 2015 and 11% in 2014. The 53rd week added approximately 1% to 2015 reported and CC revenue in OCG.
The OCG gross profit rate decrease is due to practice area mix, as our lower margin BPO and PPO businesses experienced strong volume growth. While both BPO and PPO experienced margin increases in addition to strong revenue growth, it was insufficient to offset the margin decline and volume contraction in the higher margin RPO business. RPO experienced volume and margin decline mainly due to customers in the oil and gas industry.
The increase in SG&A expenses was primarily a result of costs associated with increased volume with existing customers and implementation costs of new customers mainly in our CWO and KellyConnect practice areas.
27
Results of Operations
2014 versus 2013
Total Company
(Dollars in millions)
|
|
2014
|
2013
|
Change
|
CC
Change
|
||||||||||
|
Revenue from services
|
$
|
5,562.7
|
|
$
|
5,413.1
|
|
2.8
|
%
|
3.8
|
%
|
||||
|
Staffing fee-based income
|
76.5
|
|
80.5
|
|
(5.2
|
)
|
(2.3
|
)
|
||||||
|
Gross profit
|
908.4
|
|
889.5
|
|
2.1
|
|
3.2
|
|
||||||
|
SG&A expenses excluding restructuring charges
|
874.5
|
|
832.9
|
|
5.0
|
|
6.0
|
|
||||||
|
Restructuring charges
|
12.0
|
|
1.6
|
|
NM
|
|
NM
|
|
||||||
|
Total SG&A expenses
|
886.5
|
|
834.5
|
|
6.2
|
|
7.3
|
|
||||||
|
Asset impairments
|
—
|
|
1.7
|
|
(100.0
|
)
|
|
|
||||||
|
Earnings from operations
|
21.9
|
|
53.3
|
|
(59.1
|
)
|
|
|
||||||
|
Gross profit rate
|
16.3
|
%
|
16.4
|
%
|
(0.1
|
)
|
pts.
|
|
||||||
|
Expense rates (excluding restructuring charges):
|
|
|
|
|
||||||||||
|
% of revenue
|
15.7
|
|
15.4
|
|
0.3
|
|
|
|
||||||
|
% of gross profit
|
96.3
|
|
93.6
|
|
2.7
|
|
|
|
||||||
|
Return on sales
|
0.4
|
|
1.0
|
|
(0.6
|
)
|
|
|
||||||
|
Conversion rate
|
2.4
|
|
6.0
|
|
(3.6
|
)
|
||||||||
Total Company revenue from services for 2014 was up 2.8% in comparison to 2013, and 3.8% on a constant currency basis. This reflected growth in OCG, as well as increased bill rates in Americas Commercial and hours worked in the EMEA and APAC regions. CC changes in revenue during 2014 were largely driven by changes in the Russian ruble, Canadian dollar, Australian dollar and Brazilian real.
The gross profit rate was down 10 basis points on a year-over-year basis. Decreases in the gross profit rate in EMEA, APAC and OCG were partially offset by an increase in the Americas gross profit rate.
SG&A expenses excluding restructuring costs increased 5.0% year over year as a result of investments in our PT and OCG businesses, as well as merit increases. Included in SG&A expenses for 2013 is $3.0 million for a settlement with the state of Delaware related to an unclaimed property examination. Restructuring costs in 2014 include $9.9 million related to the Plan completed in the fourth quarter of 2014, $0.8 million of costs incurred for exiting the staffing business in Sweden, and $1.3 million related to closing branches in Australia and consolidating back office functions in Australia and New Zealand. Restructuring costs in 2013 primarily relate to severance costs incurred from the Company’s decision to exit the OCG executive search business operating in Germany.
Asset impairments in 2013 represent the write-off of the carrying value of long-lived assets related to the decision to exit the executive search business operating in Germany.
Income tax benefit for 2014 was $7.1 million, compared to a benefit of $10.1 million for 2013. The decrease in income tax benefit is primarily due to U.S. work opportunity credits, with 2013 including credits related to employees hired in 2012 due to the expiration of the credit for most employees hired after 2011, and retroactive reinstatement in January, 2013. Accordingly, we did not record work opportunity credits for most employees hired in 2012 until 2013, increasing 2013 credits by $9.3 million. 2014 income taxes were also impacted by lower pretax earnings.
Diluted earnings per share for 2014 were $0.61, as compared to $1.54 for 2013.
28
Total Americas
(Dollars in millions)
|
|
2014
|
2013
|
Change
|
CC
Change
|
||||||||||
|
Revenue from services
|
$
|
3,565.6
|
|
$
|
3,513.4
|
|
1.5
|
%
|
2.2
|
%
|
||||
|
Staffing fee-based income
|
30.0
|
|
27.7
|
|
8.0
|
|
9.1
|
|
||||||
|
Gross profit
|
535.5
|
|
525.3
|
|
2.0
|
|
2.6
|
|
||||||
|
Total SG&A expenses
|
446.8
|
|
419.8
|
|
6.5
|
|
7.1
|
|
||||||
|
Earnings from operations
|
88.7
|
|
105.5
|
|
(15.9
|
)
|
|
|
||||||
|
Gross profit rate
|
15.0
|
%
|
14.9
|
%
|
0.1
|
|
pts.
|
|
||||||
|
Expense rates:
|
|
|
|
|
||||||||||
|
% of revenue
|
12.5
|
|
11.9
|
|
0.6
|
|
|
|
||||||
|
% of gross profit
|
83.5
|
|
79.9
|
|
3.6
|
|
|
|
||||||
|
Return on sales
|
2.5
|
|
3.0
|
|
(0.5
|
)
|
|
|
||||||
The change in Americas revenue is primarily the result of a 2% increase in average bill rates. Americas represented 64% of total Company revenue for 2014 and 65% for 2013.
Revenue in our Commercial segment was up 3% and our PT revenue was down 1% in comparison to 2013. The increase in revenue in Commercial was due to increased revenue in our educational staffing business as a result of new customer wins, partially offset by revenue decreases in our office clerical and light industrial businesses. In the PT segment, we continued to see declines in revenue in our IT and finance products, partially offset by growth in revenue in our science and engineering products.
The increase in the gross profit rate was due to customer mix in Commercial and improved pricing in PT, partially offset by higher workers’ compensation cost. In Commercial, higher margin local business grew at a faster rate than large accounts. In PT, positive pricing adjustments for certain large customers drove an improvement in the gross profit rate.
SG&A expenses were up 6.5% in comparison to 2013. This increase is attributable to last year’s annual salary increases, increased incentive payments, additional recruiting and sourcing costs, and the planned investments for additional headcount in sales and recruiting staff, primarily for our PT segment. All of these increases were partially offset by the early benefits of our Plan. Included in SG&A expenses for 2013 is $3.0 million for a settlement with the state of Delaware related to an unclaimed property examination.
29
Total EMEA
(Dollars in millions)
|
|
2014
|
2013
|
Change
|
CC
Change
|
||||||||||
|
Revenue from services
|
$
|
1,085.0
|
|
$
|
1,057.2
|
|
2.6
|
%
|
4.0
|
%
|
||||
|
Staffing fee-based income
|
30.8
|
|
34.8
|
|
(11.4
|
)
|
(7.3
|
)
|
||||||
|
Gross profit
|
173.5
|
|
176.2
|
|
(1.6
|
)
|
0.1
|
|
||||||
|
SG&A expenses excluding restructuring charges
|
160.6
|
|
164.3
|
|
(2.3
|
)
|
(0.4
|
)
|
||||||
|
Restructuring charges
|
0.8
|
|
0.4
|
|
60.5
|
|
62.7
|
|
||||||
|
Total SG&A expenses
|
161.4
|
|
164.7
|
|
(2.1
|
)
|
(0.1
|
)
|
||||||
|
Earnings from operations
|
12.1
|
|
11.5
|
|
5.5
|
|
|
|
||||||
|
Gross profit rate
|
16.0
|
%
|
16.7
|
%
|
(0.7
|
)
|
pts.
|
|
|
|||||
|
Expense rates (excluding restructuring charges):
|
|
|
|
|
||||||||||
|
% of revenue
|
14.8
|
|
15.5
|
|
(0.7
|
)
|
|
|
||||||
|
% of gross profit
|
92.5
|
|
93.2
|
|
(0.7
|
)
|
|
|
||||||
|
Return on sales
|
1.1
|
|
1.1
|
|
—
|
|
|
|
||||||
The change in EMEA revenue from services reflected a 5% increase in hours worked, partially offset by a 1% decrease in average bill rates on a CC basis. The increase in hours was due primarily to Portugal, reflecting improved volume with existing customers, new customers and targeted investments. EMEA represented 20% of total Company revenue for both 2014 and 2013.
The EMEA gross profit rate decreased primarily due to a decline in staffing fee-based income and a decline in the temporary gross profit rates. These declines each negatively impacted the gross profit rate by approximately 45 basis points. Staffing fee-based income declined in both Commercial and PT due to the weak economic environment, especially during the second half of the year. Most countries posted declines, with the exception of France and Italy. The decline in the temporary gross profit rate was driven by unfavorable country mix and, to a lesser extent, customer mix, as well as the reversal of previously accrued training costs for temporary employees in the Netherlands in the second quarter of 2013. The effect of this reversal accounted for approximately 10 basis points. These declines were partially offset by the effect of the CICE tax credit in France. This credit, which is recorded in cost of services and totaled $8.3 million in 2014 and $5.5 million in 2013, improved the year-over-year gross profit rate by approximately 25 basis points.
SG&A expenses excluding restructuring declined due to headquarters cost reduction and operational productivity, partially offset by targeted PT investments in selected countries. Restructuring costs recorded in 2014 reflect costs incurred for exiting the staffing business in Sweden. Restructuring costs recorded in 2013 reflect favorable adjustments to prior restructuring costs, primarily in France and Italy.
30
Total APAC
(Dollars in millions)
|
|
2014
|
2013
|
Change
|
CC
Change
|
||||||||||
|
Revenue from services
|
$
|
392.2
|
|
$
|
382.7
|
|
2.5
|
%
|
6.0
|
%
|
||||
|
Staffing fee-based income
|
15.7
|
|
18.0
|
|
(13.1
|
)
|
(9.8
|
)
|
||||||
|
Gross profit
|
60.2
|
|
63.3
|
|
(4.8
|
)
|
(1.4
|
)
|
||||||
|
SG&A expenses excluding restructuring charges
|
56.4
|
|
60.2
|
|
(6.3
|
)
|
(2.8
|
)
|
||||||
|
Restructuring charges
|
1.3
|
|
0.3
|
|
373.4
|
|
387.1
|
|
||||||
|
Total SG&A expenses
|
57.7
|
|
60.5
|
|
(4.5
|
)
|
(0.8
|
)
|
||||||
|
Earnings from operations
|
2.5
|
|
2.8
|
|
(11.0
|
)
|
|
|
||||||
|
Gross profit rate
|
15.4
|
%
|
16.5
|
%
|
(1.1
|
)
|
pts.
|
|
|
|||||
|
Expense rates (excluding restructuring charges):
|
|
|
|
|
||||||||||
|
% of revenue
|
14.4
|
|
15.7
|
|
(1.3
|
)
|
|
|
||||||
|
% of gross profit
|
93.6
|
|
95.1
|
|
(1.5
|
)
|
|
|
||||||
|
Return on sales
|
0.6
|
|
0.7
|
|
(0.1
|
)
|
|
|
||||||
The change in total APAC revenue from services reflected a 10% increase in hours worked, partially offset by a 3% decrease in average bill rates on a CC basis. The increase in hours worked was due to higher hours in India. The decrease in average bill rates was mainly due to country mix, with bill rates in India lower than the region’s average. APAC revenue represented 7% of total Company revenue for both 2014 and 2013.
The decrease in the gross profit rate was due to decreases in temporary margins and staffing fee-based income, which reduced the gross profit rate by approximately 65 and 70 basis points, respectively. Staffing fee-based income decreased by 11% in Singapore, due to high staff turnover, and by 20% in Australia, due to the weaker economic climate. The reduction in temporary margins is due to the increasing proportion of large accounts that have lower margins, as well as the effect of favorable adjustments to workers’ compensation reserves in Australia recorded in 2013. The favorable adjustments to workers’ compensation reserves, which were recorded in cost of services, totaled $1.3 million and accounted for 30 basis points of the year-over-year decline in the APAC region gross profit rate. These decreases were partially offset by the effect of a wage credit in Singapore, which totaled $2.2 million in 2014 and $0.7 million in 2013. This amount, which was recorded in cost of services and represents additional credits received for 2013 and 2014, partially offset the year-over-year decline in the APAC region gross profit rate by approximately 40 basis points.
Restructuring charges in 2014 relate to costs for exiting branches in Australia and consolidating back office functions in Australia and New Zealand. The decline in SG&A expenses excluding restructuring costs was the result of consolidating the Australia and New Zealand management in the prior year and lower country headquarters costs across the region, partially offset by investments in Singapore, Malaysia and India.
31
OCG
(Dollars in millions)
|
|
2014
|
2013
|
Change
|
CC
Change
|
||||||||||
|
Revenue from services
|
$
|
586.8
|
|
$
|
509.5
|
|
15.2
|
%
|
15.7
|
%
|
||||
|
Gross profit
|
143.6
|
|
128.2
|
|
12.0
|
|
12.4
|
|
||||||
|
SG&A expenses excluding restructuring charges
|
127.3
|
|
110.6
|
|
15.1
|
|
15.8
|
|
||||||
|
Restructuring charges
|
—
|
|
0.9
|
|
(100.0
|
)
|
(100.0
|
)
|
||||||
|
Total SG&A expenses
|
127.3
|
|
111.5
|
|
14.3
|
|
15.0
|
|
||||||
|
Asset impairments
|
—
|
|
1.7
|
|
(100.0
|
)
|
|
|
||||||
|
Earnings from operations
|
16.3
|
|
15.0
|
|
7.3
|
|
|
|
||||||
|
Gross profit rate
|
24.5
|
%
|
25.2
|
%
|
(0.7
|
)
|
pts.
|
|
||||||
|
Expense rates (excluding restructuring charges):
|
|
|
|
|
||||||||||
|
% of revenue
|
21.7
|
|
21.7
|
|
—
|
|
|
|
||||||
|
% of gross profit
|
88.7
|
|
86.3
|
|
2.4
|
|
|
|
||||||
|
Return on sales
|
2.8
|
|
3.0
|
|
(0.2
|
)
|
|
|
||||||
Revenue from services in the OCG segment increased during 2014 due to growth in all key practice areas: CWO, RPO and BPO practice areas. Revenue in CWO, which includes PPO, grew by 16% year over year, RPO revenue increased by 17% and BPO revenue grew by 16% year over year. The revenue growth was due to expansion of programs with existing and the acquisition of new customers. OCG revenue represented 11% of total Company revenue for 2014 and 9% for 2013.
The OCG gross profit rate decreased primarily in CWO and BPO, partially offset by an increase in RPO. CWO experienced growth in PPO, a lower margin business. The BPO gross profit rate declined due to a price decrease in one of our large accounts and customer mix in our legal managed project business, partly offset by improved gross profit rates in KellyConnect. The increase in the gross profit rate in RPO is due to favorable customer mix.
The increase in SG&A expenses excluding restructuring is primarily a result of costs associated with increased volume with existing customers, implementation costs of new customers and planned investments. Asset impairments and restructuring charges in 2013 represent costs associated with the Company’s decision to exit the executive search business operating in Germany.
32
Results of Operations
Financial Condition
Historically, we have financed our operations through cash generated by operating activities and access to credit markets. Our working capital requirements are primarily generated from temporary employee payroll and customer accounts receivable. Since receipts from customers generally lag payroll to temporary employees, working capital requirements increase substantially in periods of growth. Conversely, when economic activity slows, working capital requirements may substantially decrease. As highlighted in the consolidated statements of cash flows, our liquidity and available capital resources are impacted by four key components: cash and equivalents, operating activities, investing activities and financing activities.
Cash and Equivalents
Cash and equivalents totaled
$42.2 million
at year-end
2015
, compared to
$83.1 million
at year-end
2014
. As further described below, during
2015
, we
generated
$23.5 million
of cash from operating activities,
used
$17.6 million
of cash for investing activities and
used
$42.2 million
in cash for financing activities. The decrease in balance of cash and equivalents from 2014 to 2015 is due to effective cash management.
Operating Activities
In
2015
, we generated
$23.5 million
of net cash from operating activities, as compared to using
$70.0 million
in
2014
and
generating
$115.3 million
in
2013
. The change from
2014
to
2015
was primarily due to lower growth in trade accounts receivable and improving net earnings. The change from 2013 to 2014 was primarily due to growth in trade accounts receivable, along with the negative impact of $20.0 million related to supplier payments received at year-end 2013 which were paid out to suppliers during the first quarter of 2014. Included in operating assets and liabilities and net cash from operating activities for 2013 is an increase of $4.8 million related to the correction of an error from prior periods.
Trade accounts receivable totaled
$1.1 billion
at year-end
2015
and
2014
. Global days sales outstanding (“DSO”) for the fourth quarter were 54 days for
2015
and
2014
.
Our working capital position was $411.3 million at year-end
2015
, a decrease of $16.8 million from year-end
2014
. The reclassification of current deferred taxes to noncurrent deferred taxes as of the 2015 year end in accordance with the early adoption of new accounting guidance contributed to the decrease in working capital from 2014. The current ratio (total current assets divided by total current liabilities) was 1.5 at year-end
2015
and
2014
.
Investing Activities
In
2015
, we
used
$17.6 million
of net cash for investing activities, compared to
$27.2 million
in
2014
and
$20.8 million
in
2013
. Capital expenditures, which totaled
$16.9 million
in
2015
,
$21.7 million
in
2014
and
$20.0 million
in
2013
, primarily related to the Company’s technology programs.
Investment in equity affiliate represents cash contributions to TS Kelly, our equity affiliate in which we have a 49% ownership interest. In 2014, investment in equity affiliate includes $4.8 million for the acquisition of a China-based staffing company.
In 2013, a cash payment of $1.4 million to TS Kelly was improperly classified in operating activities in the consolidated statements of cash flows, resulting in the understatement of operating activities and overstatement of investing activities in the consolidated statements of cash flows for 2013.
Financing Activities
In
2015
, we
used
$42.2 million
of cash for financing activities, as compared to
generating
$56.6 million
in
2014
and
using
$43.7 million
in
2013
. Changes in net cash from financing activities are primarily related to short-term borrowing activities. Debt totaled
$55.5 million
at year-end
2015
compared to
$91.9 million
at year-end
2014
. Debt-to-total capital is a common ratio to measure the relative capital structure and leverage of the Company. Our ratio of debt-to-total capital (total debt reported on the balance sheet divided by total debt plus stockholders’ equity) was 5.8% at year-end
2015
and 9.9% at year-end
2014
.
In
2015
, the net change in short-term borrowings was primarily due to payments on our U.S. securitization facility. In
2014
, the net change in short-term borrowings was primarily due to $60.0 million in additional borrowings on our securitization facility, used to fund our everyday operations, and $3.5 million in borrowings under the revolving line of credit in Brazil. In
2013
, the net change in short-term borrowings was primarily due to repayments on the securitization facility funded with net cash generated from operating activities.
33
Dividends paid per common share were $0.20 in
2015
,
2014
and
2013
. Payments of dividends are restricted by the financial covenants contained in our debt facilities. Details of this restriction are contained in the Debt footnote in the notes to our consolidated financial statements.
Contractual Obligations and Commercial Commitments
Summarized below are our obligations and commitments to make future payments as of year-end
2015
:
|
|
|
Payment due by period
|
|||||||||||||||||
|
|
Total
|
Less than
1 year
|
1-3 Years
|
3-5 Years
|
More than
5 years
|
||||||||||||||
|
|
(In millions of dollars)
|
||||||||||||||||||
|
Operating leases
|
$
|
83.0
|
|
$
|
32.4
|
|
$
|
36.6
|
|
$
|
12.3
|
|
$
|
1.7
|
|
||||
|
Short-term borrowings
|
55.5
|
|
55.5
|
|
—
|
|
—
|
|
—
|
|
|||||||||
|
Accrued insurance
|
66.7
|
|
26.7
|
|
18.7
|
|
6.7
|
|
14.6
|
|
|||||||||
|
Accrued retirement benefits
|
154.5
|
|
14.1
|
|
27.7
|
|
27.9
|
|
84.8
|
|
|||||||||
|
Other long-term liabilities
|
8.1
|
|
1.4
|
|
2.9
|
|
2.5
|
|
1.3
|
|
|||||||||
|
Uncertain income tax positions
|
1.9
|
|
0.6
|
|
0.4
|
|
0.2
|
|
0.7
|
|
|||||||||
|
Purchase obligations
|
40.6
|
|
25.8
|
|
14.8
|
|
—
|
|
—
|
|
|||||||||
|
Total
|
$
|
410.3
|
|
$
|
156.5
|
|
$
|
101.1
|
|
$
|
49.6
|
|
$
|
103.1
|
|
||||
Purchase obligations above represent unconditional commitments relating primarily to voice and data communications services and online tools which we expect to utilize generally within the next two fiscal years, in the ordinary course of business. We have no material, unrecorded commitments, losses, contingencies or guarantees associated with any related parties or unconsolidated entities.
Liquidity
We expect to meet our ongoing short-term and long-term cash requirements principally through cash generated from operations, available cash and equivalents, securitization of customer receivables and committed unused credit facilities. Additional funding sources could include public or private bonds, asset-based lending, additional bank facilities, issuance of equity or other sources.
We utilize intercompany loans, dividends, capital contributions and redemptions to effectively manage our cash on a global basis. We periodically review our foreign subsidiaries’ cash balances and projected cash needs. As part of those reviews, we may identify cash that we feel should be repatriated to optimize the Company’s overall capital structure. At the present time, these reviews have not resulted in any specific plans to repatriate a majority of our international cash balances. We expect much of our international cash will be needed to fund working capital growth in our local operations. The majority of our international cash is concentrated in a cash pooling arrangement (the “Cash Pool”) and is available to fund general corporate needs internationally. The Cash Pool is a set of cash accounts maintained with a single bank that must, as a whole, maintain at least a zero balance; individual accounts may be positive or negative. This allows countries with excess cash to invest and countries with cash needs to utilize the excess cash.
We manage our cash and debt very closely to optimize our capital structure. As our cash balances build, we tend to pay down debt as appropriate. Conversely, when working capital needs grow, we tend to use corporate cash and cash available in the Cash Pool first, and then access our borrowing facilities.
At year-end
2015
, we had $200.0 million of available capacity on our $200.0 million revolving credit facility and $51.0 million of available capacity on our $150.0 million securitization facility. The securitization facility carried $50.0 million of short-term borrowings and $49.0 million of standby letters of credit related to workers’ compensation. Together, the revolving credit and securitization facilities provide the Company with committed funding capacity that may be used for general corporate purposes. While we believe these facilities will cover our working capital needs over the short term, if economic conditions or operating results change significantly, we may need to seek additional sources of funds. Throughout
2015
and as of the
2015
year end, we met the debt covenants related to our revolving credit facility and securitization facility. We intend to refinance our securitization facility, which expires on December 9, 2016, on or before the due date.
34
At year-end
2015
, we also had additional unsecured, uncommitted short-term credit facilities totaling $16.3 million, under which we had borrowed $5.5 million. Details of our debt facilities as of the
2015
year end are contained in the Debt footnote in the notes to our consolidated financial statements.
We monitor the credit ratings of our major banking partners on a regular basis and have regular discussions with them. Based on our reviews and communications, we believe the risk of one or more of our banks not being able to honor commitments is insignificant. We also review the ratings and holdings of our money market funds and other investment vehicles regularly to ensure high credit quality and access to our invested cash.
Critical Accounting Estimates
We prepare our consolidated financial statements in conformity with accounting principles generally accepted in the United States. In this process, it is necessary for us to make certain assumptions and related estimates affecting the amounts reported in the consolidated financial statements and the attached notes. Actual results can differ from assumed and estimated amounts.
Critical accounting estimates are those that we believe require the most difficult, subjective or complex judgments, often as a result of the need to make estimates about the effect of matters that are inherently uncertain. We base our estimates on historical experience and on various other assumptions we believe to be reasonable under the circumstances, the results of which form the basis for making judgments about the carrying value of assets and liabilities that are not readily apparent from other sources. Judgments and uncertainties affecting the application of those estimates may result in materially different amounts being reported under different conditions or using different assumptions. We consider the following estimates to be most critical in understanding the judgments involved in preparing our consolidated financial statements.
Workers’ Compensation
In the U.S., we have a combination of insurance and self-insurance contracts under which we effectively bear the first $1.0 million of risk per single accident. There is no aggregate limitation on our per-risk exposure under these insurance and self-insurance programs. We establish accruals for workers’ compensation utilizing actuarial methods to estimate the undiscounted future cash payments that will be made to satisfy the claims, including an allowance for incurred-but-not-reported claims. This process includes establishing loss development factors, based on our historical claims experience as well as industry experience, and applying those factors to current claims information to derive an estimate of our ultimate claims liability. In preparing the estimates, we also consider the nature, frequency and severity of the claims; reserving practices of our third party claims administrators; performance of our medical cost management and return to work programs; changes in our territory and business line mix; and current legal, economic and regulatory factors such as industry estimates of medical cost trends. Where appropriate, multiple generally accepted actuarial techniques are applied and tested in the course of preparing our estimates. When claims exceed the applicable loss limit or self-insured retention and realization of recovery of the claim from existing insurance policies is deemed probable, we record a receivable from the insurance company for the excess amount.
We evaluate the accrual, and the underlying assumptions, regularly throughout the year and make adjustments as needed. The ultimate cost of these claims may be greater than or less than the established accrual. While we believe that the recorded amounts are reasonable, there can be no assurance that changes to our estimates will not occur due to limitations inherent in the estimation process. In the event we determine that a smaller or larger accrual is appropriate, we would record a credit or a charge to cost of services in the period in which we made such a determination. The accrual for workers’ compensation, net of related receivables which are included in prepaid expenses and other current assets and other assets in the consolidated balance sheet, was $57.3 million and $57.6 million at year-end
2015
and
2014
, respectively.
Income Taxes
Income tax expense is based on expected income and statutory tax rates in the various jurisdictions in which we operate. Judgment is required in determining our income tax expense. We establish accruals for uncertain tax positions under generally accepted accounting principles, which require that a position taken or expected to be taken in a tax return be recognized in the consolidated financial statements when it is more likely than not (i.e., a likelihood of more than fifty percent) the position would be sustained upon examination by tax authorities who have full knowledge of all relevant information. A recognized tax position is then measured at the largest amount of benefit that is greater than fifty percent likely of being realized upon ultimate settlement.
Our effective tax rate includes the impact of accruals and changes to accruals that we consider appropriate, as well as related interest and penalties. A number of years may lapse before a particular matter, for which we have or have not established an accrual, is audited and finally resolved. While it is often difficult to predict the final outcome or the timing of resolution of any particular tax matter, we believe that our accruals are appropriate under generally accepted accounting principles. Favorable or unfavorable adjustments of the accrual for any particular issue would be recognized as an increase or decrease to our income
35
tax expense in the period of a change in facts and circumstances. Our current tax accruals are presented in the consolidated balance sheet within income and other taxes and long-term tax accruals are presented in the consolidated balance sheet within other long-term liabilities.
Tax laws require items to be included in the tax return at different times than the items are reflected in the consolidated financial statements. As a result, the income tax expense reflected in our consolidated financial statements is different than the liability reported in our tax return. Some of these differences are permanent, which are not deductible or taxable on our tax return, and some are temporary differences, which give rise to deferred tax assets and liabilities. Deferred tax assets generally represent items that can be used as a tax deduction or credit in our tax return in future years for which we have already recorded the tax benefit in our consolidated income statement. We establish valuation allowances for our deferred tax assets when the amount of expected future taxable income is not likely to support the use of the deduction or credit. Deferred tax liabilities generally represent items for which we have already taken a deduction on our tax return, but have not yet recognized as expense in our consolidated financial statements. Our net deferred tax asset is recorded using currently enacted tax laws, and may need to be adjusted in the event tax laws change.
The U.S. work opportunity credit is allowed for wages earned by employees in certain targeted groups. The actual amount of creditable wages in a particular period is estimated, since the credit is only available once an employee reaches a minimum employment period and the employee’s inclusion in a targeted group is certified by the applicable state. As these events often occur after the period the wages are earned, judgment is required in determining the amount of work opportunity credits accrued for in each period. We evaluate the accrual regularly throughout the year and make adjustments as needed.
Goodwill
We test goodwill for impairment annually and whenever events or circumstances make it more likely than not that an impairment may have occurred. Generally accepted accounting principles require that goodwill be tested for impairment at a reporting unit level. We have determined that our reporting units are the same as our operating and reportable segments. If we have determined it is more likely than not the fair value for one or more reporting units is greater than their carrying value, we may use a qualitative assessment for the annual impairment test.
In conducting the qualitative assessment, we assess the totality of relevant events and circumstances that affect the fair value or carrying value of the reporting unit. Such events and circumstances may include macroeconomic conditions, industry and competitive environment conditions, overall financial performance, reporting unit specific events and market considerations. We may also consider recent valuations of the reporting unit, including the magnitude of the difference between the most recent fair value estimate and the carrying value, as well as both positive and adverse events and circumstances, and the extent to which each of the events and circumstances identified may affect the comparison of a reporting unit’s fair value with its carrying value.
For reporting units where the qualitative assessment is not used, goodwill is tested for impairment using a two-step process. In the first step, the estimated fair value of a reporting unit is compared to its carrying value. If the estimated fair value of a reporting unit exceeds the carrying value of the net assets assigned to a reporting unit, goodwill is not considered impaired and no further testing is required. To derive the estimated fair value of reporting units, we primarily relied on an income approach. Under the income approach, estimated fair value is determined based on estimated future cash flows discounted by an estimated weighted-average cost of capital, which reflects the overall level of inherent risk of the reporting unit being measured. Estimated future cash flows are based on our internal projection model. Assumptions and estimates about future cash flows and discount rates are complex and often subjective. They can be affected by a variety of factors, including external factors such as industry and economic trends, and internal factors such as changes in our business strategy and our internal forecasts.
If the carrying value of the net assets assigned to a reporting unit exceeds the estimated fair value of a reporting unit, a second step of the impairment test is performed in order to determine the implied fair value of a reporting unit’s goodwill. Determining the implied fair value of goodwill requires valuation of a reporting unit’s tangible and intangible assets and liabilities in a manner similar to the allocation of purchase price in a business combination. If the carrying value of a reporting unit’s goodwill exceeds its implied fair value, goodwill is deemed impaired and is written down to the extent of the difference.
We completed our annual impairment test for all reporting units with goodwill in the fourth quarter for the fiscal year ended
2015
and
2014
and determined that goodwill was not impaired. In both
2015
and 2014, we elected to perform a step one quantitative assessment for the Americas Commercial, Americas PT, OCG and APAC PT reporting units.
Our step one analysis used significant assumptions by segment, including: expected future revenue and expense growth rates, profit margins, cost of capital, discount rate and forecasted capital expenditures. Although we believe the assumptions and estimates we have made are reasonable and appropriate, different assumptions and estimates could materially impact our
36
reported financial results. Different assumptions of the anticipated future results and growth from these businesses could result in an impairment charge, which would decrease operating income and result in lower asset values on our consolidated balance sheet. As a measure of sensitivity, all four reporting units have an estimated fair value that is at least double the carrying value in 2015. In addition, reducing our revenue growth rate assumptions by more than 60% would not result in the estimated fair value falling below book value for all four reporting units.
At year-end
2015
and
2014
, total goodwill amounted to
$90.3 million
for each year (see the Goodwill footnote in the notes to our consolidated financial statements).
Litigation
Kelly is subject to legal proceedings and claims arising out of the normal course of business. Kelly routinely assesses the likelihood of any adverse judgments or outcomes to these matters, as well as ranges of probable losses. A determination of the amount of the accruals required, if any, for these contingencies is made after analysis of each known issue. Development of the analysis includes consideration of many factors including: potential exposure, the status of proceedings, negotiations, discussions with our outside counsel, results of similar litigation and, in the case of class action lawsuits, participation rates. The required accruals may change in the future due to new developments in each matter. For further discussion, see the Contingencies footnote in the notes to our consolidated financial statements. At year-end
2015
and
2014
, the gross accrual for litigation costs amounted to
$9.9 million
and
$5.7 million
, respectively, which are included in accounts payable and accrued liabilities in the consolidated balance sheet.
Allowance for Uncollectible Accounts Receivable
We make ongoing estimates relating to the collectibility of our trade accounts receivable and maintain an allowance for estimated losses resulting from the inability of our customers to make required payments. In determining the amount of the allowance, we consider our historical level of credit losses and apply percentages to certain aged receivable categories. We also make judgments about the creditworthiness of significant customers based on ongoing credit evaluations, and we monitor historical trends that might impact the level of credit losses in the future. Historically, losses from uncollectible accounts have not exceeded our allowance. Since we cannot predict with certainty future changes in the financial stability of our customers, actual future losses from uncollectible accounts may differ from our estimates. If the financial condition of our customers were to deteriorate, resulting in their inability to make payments, a larger allowance may be required.
In the event we determined that a smaller or larger allowance was appropriate, we would record a credit or a charge to SG&A expenses in the period in which we made such a determination. In addition, for billing adjustments related to errors, service issues and compromises on billing disputes, we also include a provision for sales allowances, based on our historical experience, in our allowance for uncollectible accounts receivable. If sales allowances vary from our historical experience, an adjustment to the allowance may be required, and we would record a credit or charge to revenue from services in the period in which we made such a determination. As of year-end
2015
and
2014
, the allowance for uncollectible accounts receivable was
$10.5 million
and
$10.7 million
, respectively.
37
NEW ACCOUNTING PRONOUNCEMENTS
See New Accounting Pronouncements footnote in the notes to our consolidated financial statements presented in Part II, Item 8 of this report for a description of new accounting pronouncements.
CAUTIONARY NOTE REGARDING FORWARD-LOOKING STATEMENTS
Certain statements contained in this report are “forward-looking” statements within the meaning of the Private Securities Litigation Reform Act of 1995. Forward-looking statements include statements which are predictive in nature, which depend upon or refer to future events or conditions, or which include words such as “expects,” “anticipates,” “intends,” “plans,” “believes,” “estimates,” or variations or negatives thereof or by similar or comparable words or phrases. In addition, any statements concerning future financial performance (including future revenues, earnings or growth rates), ongoing business strategies or prospects, and possible future actions by us that may be provided by management, including oral statements or other written materials released to the public, are also forward-looking statements. Forward-looking statements are based on current expectations and projections about future events and are subject to risks, uncertainties and assumptions about our Company and economic and market factors in the countries in which we do business, among other things. These statements are not guarantees of future performance, and we have no specific intention to update these statements.
Actual events and results may differ materially from those expressed or forecasted in forward-looking statements due to a number of factors. The principal important risk factors that could cause our actual performance and future events and actions to differ materially from such forward-looking statements include, but are not limited to, competitive market pressures including pricing and technology introductions, changing market and economic conditions, our ability to achieve our business strategy, the risk of damage to our brand, the risk our intellectual assets could be infringed upon or compromised, our ability to successfully develop new service offerings, our exposure to risks associated with services outside traditional staffing, including business process outsourcing, our increasing dependency on third parties for the execution of critical functions, the risks associated with past and future acquisitions, exposure to risks associated with investments in equity affiliates, material changes in demand from or loss of large corporate customers, risks associated with conducting business in foreign countries, including foreign currency fluctuations, availability of full-time employees to lead complex talent supply chain sales and operations, availability of temporary workers with appropriate skills required by customers, liabilities for employment-related claims and losses, including class action lawsuits and collective actions, the risk of cyber attacks or other breaches of network or information technology security as well as risks associated with compliance on data privacy, our ability to sustain critical business applications through our key data centers, our ability to effectively implement and manage our information technology programs, our ability to maintain adequate financial and management processes and controls, impairment charges triggered by adverse industry developments or operational circumstances, unexpected changes in claim trends on workers’ compensation, disability and medical benefit plans, the impact of the Patient Protection and Affordable Care Act on our business, the impact of changes in laws and regulations (including federal, state and international tax laws), the risk of additional tax or unclaimed property liabilities in excess of our estimates, our ability to maintain specified financial covenants in our bank facilities to continue to access credit markets, and other risks, uncertainties and factors discussed in this report and in our other filings with the Securities and Exchange Commission. Actual results may differ materially from any forward looking statements contained herein, and we have no intention to update these statements. Certain risk factors are discussed more fully under “Risk Factors” in Part I, Item 1A of this report.
38
We are exposed to foreign currency risk primarily related to our foreign subsidiaries. Exchange rates impact the U.S. dollar value of our reported earnings, our investments in subsidiaries, local currency denominated borrowings and intercompany transactions with and between subsidiaries. Our foreign subsidiaries primarily derive revenues and incur expenses within a single country and currency which, as a result, provide a natural hedge against currency risks in connection with normal business operations. Accordingly, changes in foreign currency rates vs. the U.S. dollar generally do not impact local cash flows. Intercompany transactions which create foreign currency risk include services, royalties, loans, contributions and distributions.
In addition, we are exposed to interest rate risks through our use of the multi-currency line of credit and other borrowings. A hypothetical fluctuation of 10% of market interest rates would not have had a material impact on
2015
earnings.
Marketable equity investments, representing our available-for-sale investment in Temp Holdings, are stated at fair value and marked to market through stockholders’ equity, net of tax. Impairments in value below historical cost, if any, deemed to be other than temporary, would be expensed in the consolidated statement of earnings. See the Fair Value Measurements footnote in the notes to our consolidated financial statements of this Annual Report on Form 10-K for further discussion.
We are exposed to market risk as a result of our obligation to pay benefits under our nonqualified deferred compensation plan and our related investments in company-owned variable universal life insurance policies. The obligation to employees increases and decreases based on movements in the equity and debt markets. The investments in mutual funds, as part of the company-owned variable universal life insurance policies, are designed to mitigate, but not eliminate, this risk with offsetting gains and losses.
Overall, our holdings and positions in market risk-sensitive instruments do not subject us to material risk.
39
The financial statements and supplementary data required by this Item are set forth in the accompanying index on page 46 of this filing and are presented in pages 47-75.
None.
Conclusion Regarding the Effectiveness of Disclosure Controls and Procedures
Based on their evaluation as of the end of the period covered by this report, our Chief Executive Officer and Chief Financial Officer have concluded that our disclosure controls and procedures (as defined in Rules 13a-15(e) and 15d-15(e) under the Securities Exchange Act of 1934) are effective at a reasonable assurance level.
Management’s Report on Internal Control Over Financial Reporting
Management’s report on internal control over financial reporting is presented preceding the consolidated financial statements on page 47 of this report.
Attestation Report of Independent Registered Public Accounting Firm
PricewaterhouseCoopers LLP, independent registered public accounting firm, has audited the effectiveness of our internal control over financial reporting as of
January 3, 2016
, as stated in their report which appears herein.
Changes in Internal Control Over Financial Reporting
There were no changes in our internal control over financial reporting that occurred during our fourth fiscal quarter that have materially affected, or are reasonably likely to materially affect, our internal control over financial reporting.
None.
40
Information required by Part III with respect to Directors, Executive Officers and Corporate Governance (Item 10), Executive Compensation (Item 11), Security Ownership of Certain Beneficial Owners and Management and Related Stockholder Matters (Item 12), Certain Relationships and Related Transactions, and Director Independence (Item 13) and Principal Accounting Fees and Services (Item 14), except as set forth under the titles “Executive Officers of the Registrant”, which is included on page 41, and “Code of Business Conduct and Ethics,” which is included on page 42, (Item 10), and except as set forth under the title “Equity Compensation Plan Information,” which is included on page 42, (Item 12), is to be included in a definitive proxy statement filed not later than 120 days after the close of our fiscal year and the proxy statement, when filed, is incorporated in this report by reference.
The following individuals serve as executive officers of the Company as of January 3, 2016:
|
Name/Office
|
Age
|
Served as an
Officer Since
|
Business Experience
During Last 5 Years
|
|||
|
Carl T. Camden
President and
Chief Executive Officer
|
61
|
1995
|
Served as officer of the Company.
|
|||
|
George S. Corona
Executive Vice President and
Chief Operating Officer
|
57
|
2000
|
Served as officer of the Company.
|
|||
|
Teresa S. Carroll
Senior Vice President and General
Manager, Global Talent Solutions
|
50
|
2000
|
Served as officer of the Company.
|
|||
|
Peter W. Quigley
Senior Vice President,
General Counsel and
Chief Administrative Officer
|
54
|
2004
|
Served as officer of the Company.
|
|||
|
Antonina M. Ramsey
Senior Vice President
|
61
|
1992
|
Served as officer of the Company.
|
|||
|
Natalia A. Shuman
Senior Vice President and
General Manager,
EMEA / APAC
|
42
|
2007
|
Served as officer of the Company.
|
|||
|
Olivier G. Thirot
Senior Vice President and
and Chief Financial Officer
|
54
|
2008
|
Served as officer of the Company.
|
|||
|
Laura S. Lockhart
Vice President, Corporate Controller
and Chief Accounting Officer
|
46
|
2008
|
Served as officer of the Company.
|
|||
41
CODE OF BUSINESS CONDUCT AND ETHICS.
We have adopted a Code of Business Conduct and Ethics that applies to our directors, officers and employees, including our principal executive officer, principal financial officer and principal accounting officer or controller or persons performing similar functions. The Code of Business Conduct and Ethics is included as Exhibit 14 in the Index to Exhibits on page 77. We have posted our Code of Business Conduct and Ethics on our website at
www.kellyservices.com
. We intend to post any changes in or waivers from our Code of Business Conduct and Ethics applicable to any of these officers on our website.
Equity Compensation Plan Information
The following table shows the number of shares of our Class A common stock that may be issued upon the exercise of outstanding options, warrants and rights, the weighted-average exercise price of outstanding options, warrants and rights, and the number of securities remaining available for future issuance under our equity compensation plans as of the fiscal year end for
2015
.
|
|
Number of securities to be issued upon exercise of outstanding options, warrants and rights
|
Weighted-average exercise price of outstanding options, warrants and rights
|
Number of securities remaining available for future issuance under equity compensation plans (excluding securities reflected in the first column)
(2)
|
|||||||
|
Equity compensation plans approved by security holders
(1)
|
12,000
|
|
$
|
27.24
|
|
3,038,033
|
|
|||
|
Equity compensation plans not approved by security holders
(3)
|
—
|
|
—
|
|
—
|
|
||||
|
Total
|
12,000
|
|
$
|
27.24
|
|
3,038,033
|
|
|||
|
(1)
|
The equity compensation plans approved by our stockholders include our Equity Incentive Plan, Non-Employee Directors Stock Option Plan and Non-Employee Directors Stock Plan.
|
The number of shares to be issued upon exercise of outstanding options, warrants and rights excludes 885,882 shares of restricted stock, 287,896 shares of financial measure performance awards earned but not yet vested and 250,000 shares of total shareholder return performance awards at maximum level (200%) granted to employees and not yet earned or vested at January 3, 2016.
|
(2)
|
The Equity Incentive Plan provides that the maximum number of shares available for grants, including stock options and restricted stock, is 15 percent of the outstanding Class A common stock, adjusted for plan activity over the preceding five years.
|
The Non-Employee Directors Stock Option Plan provides that the maximum number of shares available for settlement of options is 250,000 shares of Class A common stock.
The Non-Employee Directors Stock Plan provides that the maximum number of shares available for awards is one-quarter of one percent of the outstanding Class A common stock.
|
(3)
|
We have no equity compensation plans that have not been approved by our stockholders.
|
42
|
(a)
|
The following documents are filed as part of this report:
|
|
(1)
|
Financial statements:
|
Management’s Report on Internal Control Over Financial Reporting
Report of Independent Registered Public Accounting Firm
Consolidated Statements of Earnings for the three fiscal years ended
January 3, 2016
Consolidated Statements of Comprehensive Income for the three fiscal years ended
January 3, 2016
Consolidated Balance Sheets at
January 3, 2016
and
December 28, 2014
Consolidated Statements of Stockholders’ Equity for the three fiscal years ended
January 3, 2016
Consolidated Statements of Cash Flows for the three fiscal years ended
January 3, 2016
Notes to Consolidated Financial Statements
|
(2)
|
Financial Statement Schedule -
|
For the three fiscal years ended
January 3, 2016
:
Schedule II - Valuation Reserves
All other schedules are omitted because they are not applicable or the required information is shown in the financial statements or notes thereto.
|
(3)
|
The Exhibits are listed in the Index to Exhibits included beginning at page 76, which is incorporated herein by reference.
|
|
(b)
|
The Index to Exhibits and required Exhibits are included following the Financial Statement Schedule beginning at page 76
of this filing.
|
|
(c)
|
None.
|
43
SIGNATURES
Pursuant to the requirements of Section 13 or 15(d) of the Securities Exchange Act of 1934, registrant has duly caused this report to be signed on its behalf by the undersigned, thereunto duly authorized.
|
Date: February 18, 2016
|
|
KELLY SERVICES, INC.
|
|
|
|
Registrant
|
|
|
|
|
|
|
By
|
/s/ Olivier G. Thirot
|
|
|
|
Olivier G. Thirot
|
|
|
|
Senior Vice President and Chief Financial Officer
|
Pursuant to the requirements of the Securities Exchange Act of 1934, this report has been signed below by the following persons on behalf of the registrant and in the capacities and on the dates indicated.
|
Date: February 18, 2016
|
*
|
/s/ T. E. Adderley
|
|
|
|
T. E. Adderley
|
|
|
|
Executive Chairman and Chairman of the Board and Director
|
|
|
|
|
|
Date: February 18, 2016
|
*
|
/s/ C. T. Camden
|
|
|
|
C. T. Camden
|
|
|
|
President, Chief Executive Officer and Director
|
|
|
|
(Principal Executive Officer)
|
|
|
|
|
|
Date: February 18, 2016
|
*
|
/s/ C. M. Adderley
|
|
|
|
C. M. Adderley
|
|
|
|
Director
|
|
|
|
|
|
Date: February 18, 2016
|
*
|
/s/ R. S. Cubbin
|
|
|
|
R. S. Cubbin
|
|
|
|
Director
|
|
Date: February 18, 2016
|
*
|
/s/ J. E. Dutton
|
|
|
|
J. E. Dutton
|
|
|
|
Director
|
|
|
|
|
|
Date: February 18, 2016
|
*
|
/s/ T. B. Larkin
|
|
|
|
T. B. Larkin
|
|
|
|
Director
|
|
|
|
|
|
Date: February 18, 2016
|
*
|
/s/ C. L. Mallett, Jr.
|
|
|
|
C. L. Mallett, Jr.
|
|
|
|
Director
|
|
|
|
|
|
Date: February 18, 2016
|
*
|
/s/ L. A. Murphy
|
|
|
|
L. A. Murphy
|
|
|
|
Director
|
|
|
|
|
|
Date: February 18, 2016
|
*
|
/s/ D. R. Parfet
|
|
|
|
D. R. Parfet
|
|
|
|
Director
|
|
Date: February 18, 2016
|
*
|
/s/ H. Takahashi
|
|
H. Takahashi
|
||
|
Director
|
||
|
|
|
|
|
Date: February 18, 2016
|
*
|
/s/ B. J. White
|
|
|
|
B. J. White
|
|
|
|
Director
|
44
SIGNATURES (continued)
|
Date: February 18, 2016
|
|
/s/ O. G. Thirot
|
|
|
|
O. G. Thirot
|
|
|
|
Senior Vice President and Chief Financial Officer
|
|
|
|
(Principal Financial Officer)
|
|
|
|
|
|
Date: February 18, 2016
|
|
/s/ L. S. Lockhart
|
|
|
|
L. S. Lockhart
|
|
|
|
Vice President, Corporate Controller and Chief Accounting Officer
|
|
|
|
(Principal Accounting Officer)
|
|
|
|
|
|
Date: February 18, 2016
|
*By
|
/s/ O.G. Thirot
|
|
|
|
O.G. Thirot
|
|
|
|
Attorney-in-Fact
|
45
KELLY SERVICES, INC. AND SUBSIDIARIES
INDEX TO FINANCIAL STATEMENTS AND
SUPPLEMENTAL SCHEDULE
|
|
Page Reference
in Report on
Form 10-K
|
|
|
|
|
|
|
|
|
|
|
|
|
|
|
|
|
|
|
|
|
|
|
|
|
|
|
|
46
Management’s Report on Internal Control Over Financial Reporting
The management of Kelly Services, Inc. (the “Company”), is responsible for establishing and maintaining adequate internal control over financial reporting. Internal control over financial reporting is defined in Rules 13a-15(f) and 15d-15(f) promulgated under the Securities Exchange Act of 1934 as a process designed by, or under the supervision of, the Company’s principal executive and principal financial officers and effected by the Company’s board of directors, management and other personnel, to provide reasonable assurance regarding the reliability of financial reporting and the preparation of financial statements for external purposes in accordance with generally accepted accounting principles and includes those policies and procedures that:
|
•
|
Pertain to the maintenance of records that in reasonable detail accurately and fairly reflect the transactions and dispositions of the assets of the Company;
|
|
•
|
Provide reasonable assurance that transactions are recorded as necessary to permit preparation of financial statements in accordance with generally accepted accounting principles, and that receipts and expenditures of the Company are being made only in accordance with authorizations of management and directors of the Company;
|
|
•
|
Provide reasonable assurance regarding prevention or timely detection of unauthorized acquisition, use or disposition of the Company’s assets that could have a material effect on the financial statements.
|
Because of its inherent limitations, internal control over financial reporting may not prevent or detect misstatements. Also, projections of any evaluation of effectiveness to future periods are subject to the risk that controls may become inadequate because of changes in conditions, or that the degree of compliance with the policies or procedures may change.
The Company’s management assessed the effectiveness of the Company’s internal control over financial reporting as of
January 3, 2016
. In making this assessment, the Company’s management used the criteria set forth by the Committee of Sponsoring Organizations of the Treadway Commission (COSO) in Internal Control-Integrated Framework (2013).
Based on our assessment, management determined that, as of
January 3, 2016
, the Company’s internal control over financial reporting was effective based on those criteria.
The effectiveness of the Company’s internal control over financial reporting as of
January 3, 2016
has been audited by PricewaterhouseCoopers LLP, an independent registered public accounting firm, as stated in their report which appears on page 48.
47
Report of Independent Registered Public Accounting Firm
To the Stockholders and Board of Directors of Kelly Services, Inc.:
In our opinion, the consolidated financial statements listed in the accompanying index appearing under Item 15(a)(1) present fairly, in all material respects, the financial position of Kelly Services, Inc. and its subsidiaries at January 3, 2016 and December 28, 2014, and the results of their operations and their cash flows for each of the three fiscal years in the period ended January 3, 2016 in conformity with accounting principles generally accepted in the United States of America. In addition, in our opinion, the financial statement schedule listed in the accompanying index under Item 15(a)(2) presents fairly, in all material respects, the information set forth therein when read in conjunction with the related consolidated financial statements. Also in our opinion, the Company maintained, in all material respects, effective internal control over financial reporting as of January 3, 2016, based on criteria established in
Internal Control - Integrated Framework (2013)
issued by the Committee of Sponsoring Organizations of the Treadway Commission (COSO). The Company’s management is responsible for these financial statements and financial statement schedule, for maintaining effective internal control over financial reporting and for its assessment of the effectiveness of internal control over financial reporting, included in the accompanying Management’s Report on Internal Control over Financial Reporting. Our responsibility is to express opinions on these financial statements, on the financial statement schedule, and on the Company’s internal control over financial reporting based on our integrated audits. We conducted our audits in accordance with the standards of the Public Company Accounting Oversight Board (United States). Those standards require that we plan and perform the audits to obtain reasonable assurance about whether the financial statements are free of material misstatement and whether effective internal control over financial reporting was maintained in all material respects. Our audits of the financial statements included examining, on a test basis, evidence supporting the amounts and disclosures in the financial statements, assessing the accounting principles used and significant estimates made by management, and evaluating the overall financial statement presentation. Our audit of internal control over financial reporting included obtaining an understanding of internal control over financial reporting, assessing the risk that a material weakness exists, and testing and evaluating the design and operating effectiveness of internal control based on the assessed risk. Our audits also included performing such other procedures as we considered necessary in the circumstances. We believe that our audits provide a reasonable basis for our opinions.
As discussed in Note 13 to the financial statements, Income Taxes, the company has changed its method of accounting for deferred tax assets and liabilities for the year ended January 3, 2016 due to the adoption of ASU 2017-15, Income Taxes (Topic 740): Balance Sheet Classification of Deferred Taxes.
A company’s internal control over financial reporting is a process designed to provide reasonable assurance regarding the reliability of financial reporting and the preparation of financial statements for external purposes in accordance with generally accepted accounting principles. A company’s internal control over financial reporting includes those policies and procedures that (i) pertain to the maintenance of records that, in reasonable detail, accurately and fairly reflect the transactions and dispositions of the assets of the company; (ii) provide reasonable assurance that transactions are recorded as necessary to permit preparation of financial statements in accordance with generally accepted accounting principles, and that receipts and expenditures of the company are being made only in accordance with authorizations of management and directors of the company; and (iii) provide reasonable assurance regarding prevention or timely detection of unauthorized acquisition, use, or disposition of the company’s assets that could have a material effect on the financial statements.
Because of its inherent limitations, internal control over financial reporting may not prevent or detect misstatements. Also, projections of any evaluation of effectiveness to future periods are subject to the risk that controls may become inadequate because of changes in conditions, or that the degree of compliance with the policies or procedures may deteriorate.
/s/PricewaterhouseCoopers LLP
PricewaterhouseCoopers LLP
Detroit, Michigan
February 18, 2016
48
KELLY SERVICES, INC. AND SUBSIDIARIES
CONSOLIDATED STATEMENTS OF EARNINGS
|
|
2015
(1)
|
2014
|
2013
|
||||||||
|
|
(In millions of dollars except per share items)
|
||||||||||
|
Revenue from services
|
$
|
5,518.2
|
|
$
|
5,562.7
|
|
$
|
5,413.1
|
|
||
|
Cost of services
|
4,597.9
|
|
4,654.3
|
|
4,523.6
|
|
|||||
|
Gross profit
|
920.3
|
|
908.4
|
|
889.5
|
|
|||||
|
Selling, general and administrative expenses
|
853.6
|
|
886.5
|
|
834.5
|
|
|||||
|
Asset impairments
|
—
|
|
—
|
|
1.7
|
|
|||||
|
Earnings from operations
|
66.7
|
|
21.9
|
|
53.3
|
|
|||||
|
Other expense, net
|
4.2
|
|
5.3
|
|
4.5
|
|
|||||
|
Earnings from operations
before taxes
|
62.5
|
|
16.6
|
|
48.8
|
|
|||||
|
Income tax expense (benefit)
|
8.7
|
|
(7.1
|
)
|
(10.1
|
)
|
|||||
|
Net earnings
|
$
|
53.8
|
|
$
|
23.7
|
|
$
|
58.9
|
|
||
|
Basic earnings per share
|
$
|
1.39
|
|
$
|
0.61
|
|
$
|
1.54
|
|
||
|
Diluted earnings per share
|
$
|
1.39
|
|
$
|
0.61
|
|
$
|
1.54
|
|
||
|
Dividends per share
|
$
|
0.20
|
|
$
|
0.20
|
|
$
|
0.20
|
|
||
|
Average shares outstanding (millions):
|
|
|
|
||||||||
|
Basic
|
37.8
|
|
37.5
|
|
37.3
|
|
|||||
|
Diluted
|
37.9
|
|
37.5
|
|
37.3
|
|
|||||
|
(1)
|
Fiscal year included 53 weeks.
|
See accompanying Notes to Consolidated Financial Statements.
49
KELLY SERVICES, INC. AND SUBSIDIARIES
|
|
2015
(1)
|
2014
|
2013
|
||||||||
|
|
(In millions of dollars)
|
||||||||||
|
Net earnings
|
$
|
53.8
|
|
$
|
23.7
|
|
$
|
58.9
|
|
||
|
Other comprehensive income, net of tax:
|
|
|
|
||||||||
|
Foreign currency translation adjustments, net of tax expense of $0.4 million and $0.6 million and tax benefit of $0.0 million, respectively
|
(19.4
|
)
|
(20.2
|
)
|
(6.7
|
)
|
|||||
|
Less: Reclassification adjustments included in net earnings
|
(0.2
|
)
|
(0.9
|
)
|
(0.1
|
)
|
|||||
|
Foreign currency translation adjustments
|
(19.6
|
)
|
(21.1
|
)
|
(6.8
|
)
|
|||||
|
Unrealized gains on investment, net of tax expense of $15.8 million, $8.2 million and $16.2 million, respectively
|
28.6
|
|
11.5
|
|
31.2
|
|
|||||
|
Pension liability adjustments, net of tax expense of $0.0 million, $0.0 million and $0.2 million, respectively
|
0.5
|
|
(0.8
|
)
|
1.4
|
|
|||||
|
Less: Reclassification adjustments included in net earnings
|
0.1
|
|
0.1
|
|
0.2
|
|
|||||
|
Pension liability adjustments
|
0.6
|
|
(0.7
|
)
|
1.6
|
|
|||||
|
Other comprehensive income (loss)
|
9.6
|
|
(10.3
|
)
|
26.0
|
|
|||||
|
Comprehensive Income
|
$
|
63.4
|
|
$
|
13.4
|
|
$
|
84.9
|
|
||
|
(1)
|
Fiscal year included 53 weeks.
|
See accompanying Notes to Consolidated Financial Statements.
50
KELLY SERVICES, INC. AND SUBSIDIARIES
|
|
2015
|
2014
|
|||||
|
|
(In millions of dollars)
|
||||||
|
ASSETS
|
|
|
|||||
|
Current Assets:
|
|
|
|||||
|
Cash and equivalents
|
$
|
42.2
|
|
$
|
83.1
|
|
|
|
Trade accounts receivable, less allowances of $10.5 million and $10.7 million, respectively
|
1,139.1
|
|
1,122.8
|
|
|||
|
Prepaid expenses and other current assets
|
45.8
|
|
47.9
|
|
|||
|
Deferred taxes
|
—
|
|
34.4
|
|
|||
|
Total current assets
|
1,227.1
|
|
1,288.2
|
|
|||
|
Property and Equipment:
|
|
|
|||||
|
Property and equipment
|
361.8
|
|
360.0
|
|
|||
|
Accumulated depreciation
|
(272.9
|
)
|
(267.0
|
)
|
|||
|
Net property and equipment
|
88.9
|
|
93.0
|
|
|||
|
Noncurrent Deferred Taxes
|
189.3
|
|
146.3
|
|
|||
|
Goodwill, Net
|
90.3
|
|
90.3
|
|
|||
|
Other Assets
|
344.0
|
|
300.1
|
|
|||
|
Total Assets
|
$
|
1,939.6
|
|
$
|
1,917.9
|
|
|
|
LIABILITIES AND STOCKHOLDERS’ EQUITY
|
|
|
|||||
|
Current Liabilities:
|
|
|
|||||
|
Short-term borrowings
|
$
|
55.5
|
|
$
|
91.9
|
|
|
|
Accounts payable and accrued liabilities
|
405.5
|
|
364.0
|
|
|||
|
Accrued payroll and related taxes
|
268.1
|
|
308.5
|
|
|||
|
Accrued insurance
|
26.7
|
|
26.9
|
|
|||
|
Income and other taxes
|
60.0
|
|
68.8
|
|
|||
|
Total current liabilities
|
815.8
|
|
860.1
|
|
|||
|
Noncurrent Liabilities:
|
|
|
|||||
|
Accrued insurance
|
40.0
|
|
43.9
|
|
|||
|
Accrued retirement benefits
|
141.0
|
|
140.8
|
|
|||
|
Other long-term liabilities
|
47.4
|
|
39.4
|
|
|||
|
Total noncurrent liabilities
|
228.4
|
|
224.1
|
|
|||
|
Commitments and contingencies (See Commitments and Contingencies footnotes)
|
|
|
|||||
|
Stockholders’ Equity:
|
|
|
|||||
|
Capital stock, $1.00 par value
|
|
|
|||||
|
Class A common stock, shares issued 36.6 million at 2015 and 2014
|
36.6
|
|
36.6
|
|
|||
|
Class B common stock, shares issued 3.5 million at 2015 and 2014
|
3.5
|
|
3.5
|
|
|||
|
Treasury stock, at cost
|
|
|
|||||
|
Class A common stock, 2.1 million shares at 2015 and 2.4 million at 2014
|
(43.7
|
)
|
(49.2
|
)
|
|||
|
Class B common stock
|
(0.6
|
)
|
(0.6
|
)
|
|||
|
Paid-in capital
|
25.4
|
|
24.9
|
|
|||
|
Earnings invested in the business
|
813.5
|
|
767.4
|
|
|||
|
Accumulated other comprehensive income
|
60.7
|
|
51.1
|
|
|||
|
Total stockholders’ equity
|
895.4
|
|
833.7
|
|
|||
|
Total Liabilities and Stockholders’ Equity
|
$
|
1,939.6
|
|
$
|
1,917.9
|
|
|
See accompanying Notes to Consolidated Financial Statements.
51
KELLY SERVICES, INC. AND SUBSIDIARIES
CONSOLIDATED STATEMENTS OF STOCKHOLDERS’ EQUITY
|
|
2015
(1)
|
2014
|
2013
|
||||||||
|
|
(In millions of dollars)
|
||||||||||
|
Capital Stock
|
|
|
|
||||||||
|
Class A common stock
|
|
|
|
||||||||
|
Balance at beginning of year
|
$
|
36.6
|
|
$
|
36.6
|
|
$
|
36.6
|
|
||
|
Conversions from Class B
|
—
|
|
—
|
|
—
|
|
|||||
|
Balance at end of year
|
36.6
|
|
36.6
|
|
36.6
|
|
|||||
|
Class B common stock
|
|
|
|
||||||||
|
Balance at beginning of year
|
3.5
|
|
3.5
|
|
3.5
|
|
|||||
|
Conversions to Class A
|
—
|
|
—
|
|
—
|
|
|||||
|
Balance at end of year
|
3.5
|
|
3.5
|
|
3.5
|
|
|||||
|
Treasury Stock
|
|
|
|
||||||||
|
Class A common stock
|
|
|
|
||||||||
|
Balance at beginning of year
|
(49.2
|
)
|
(55.6
|
)
|
(61.0
|
)
|
|||||
|
Issuance of restricted stock and other
|
5.5
|
|
6.4
|
|
5.4
|
|
|||||
|
Balance at end of year
|
(43.7
|
)
|
(49.2
|
)
|
(55.6
|
)
|
|||||
|
Class B common stock
|
|
|
|
||||||||
|
Balance at beginning of year
|
(0.6
|
)
|
(0.6
|
)
|
(0.6
|
)
|
|||||
|
Issuance of restricted stock and other
|
—
|
|
—
|
|
—
|
|
|||||
|
Balance at end of year
|
(0.6
|
)
|
(0.6
|
)
|
(0.6
|
)
|
|||||
|
Paid-in Capital
|
|
|
|
||||||||
|
Balance at beginning of year
|
24.9
|
|
26.0
|
|
27.1
|
|
|||||
|
Issuance of restricted stock and other
|
0.5
|
|
(1.1
|
)
|
(1.1
|
)
|
|||||
|
Balance at end of year
|
25.4
|
|
24.9
|
|
26.0
|
|
|||||
|
Earnings Invested in the Business
|
|
|
|
||||||||
|
Balance at beginning of year
|
767.4
|
|
751.3
|
|
700.0
|
|
|||||
|
Net earnings
|
53.8
|
|
23.7
|
|
58.9
|
|
|||||
|
Dividends
|
(7.7
|
)
|
(7.6
|
)
|
(7.6
|
)
|
|||||
|
Balance at end of year
|
813.5
|
|
767.4
|
|
751.3
|
|
|||||
|
Accumulated Other Comprehensive Income
|
|
|
|
||||||||
|
Balance at beginning of year
|
51.1
|
|
61.4
|
|
35.4
|
|
|||||
|
Other comprehensive income (loss), net of tax
|
9.6
|
|
(10.3
|
)
|
26.0
|
|
|||||
|
Balance at end of year
|
60.7
|
|
51.1
|
|
61.4
|
|
|||||
|
Stockholders’ Equity at end of year
|
$
|
895.4
|
|
$
|
833.7
|
|
$
|
822.6
|
|
||
|
(1)
|
Fiscal year included 53 weeks.
|
See accompanying Notes to Consolidated Financial Statements.
52
KELLY SERVICES, INC. AND SUBSIDIARIES
|
|
2015
(1)
|
2014
|
2013
|
||||||||
|
|
(In millions of dollars)
|
||||||||||
|
Cash flows from operating activities:
|
|
|
|
||||||||
|
Net earnings
|
$
|
53.8
|
|
$
|
23.7
|
|
$
|
58.9
|
|
||
|
Noncash adjustments:
|
|
|
|
||||||||
|
Impairment of assets
|
—
|
|
—
|
|
1.7
|
|
|||||
|
Depreciation and amortization
|
22.3
|
|
21.7
|
|
20.4
|
|
|||||
|
Provision for bad debts
|
3.7
|
|
5.3
|
|
2.0
|
|
|||||
|
Stock-based compensation
|
6.1
|
|
5.3
|
|
3.8
|
|
|||||
|
Deferred income taxes
|
(11.8
|
)
|
(26.8
|
)
|
(31.3
|
)
|
|||||
|
Other, net
|
(4.7
|
)
|
(2.2
|
)
|
0.6
|
|
|||||
|
Changes in operating assets and liabilities
|
(45.9
|
)
|
(97.0
|
)
|
59.2
|
|
|||||
|
Net cash from (used in) operating activities
|
23.5
|
|
(70.0
|
)
|
115.3
|
|
|||||
|
Cash flows from investing activities:
|
|
|
|
||||||||
|
Capital expenditures
|
(16.9
|
)
|
(21.7
|
)
|
(20.0
|
)
|
|||||
|
Investment in equity affiliate
|
(0.5
|
)
|
(5.7
|
)
|
—
|
|
|||||
|
Other investing activities
|
(0.2
|
)
|
0.2
|
|
(0.8
|
)
|
|||||
|
Net cash used in investing activities
|
(17.6
|
)
|
(27.2
|
)
|
(20.8
|
)
|
|||||
|
Cash flows from financing activities:
|
|
|
|
||||||||
|
Net change in short-term borrowings
|
(34.7
|
)
|
63.9
|
|
(35.8
|
)
|
|||||
|
Dividend payments
|
(7.7
|
)
|
(7.6
|
)
|
(7.6
|
)
|
|||||
|
Other financing activities
|
0.2
|
|
0.3
|
|
(0.3
|
)
|
|||||
|
Net cash (used in) from financing activities
|
(42.2
|
)
|
56.6
|
|
(43.7
|
)
|
|||||
|
Effect of exchange rates on cash and equivalents
|
(4.6
|
)
|
(2.0
|
)
|
(1.4
|
)
|
|||||
|
Net change in cash and equivalents
|
(40.9
|
)
|
(42.6
|
)
|
49.4
|
|
|||||
|
Cash and equivalents at beginning of year
|
83.1
|
|
125.7
|
|
76.3
|
|
|||||
|
Cash and equivalents at end of year
|
$
|
42.2
|
|
$
|
83.1
|
|
$
|
125.7
|
|
||
|
(1)
|
Fiscal year included 53 weeks.
|
See accompanying Notes to Consolidated Financial Statements.
53
KELLY SERVICES, INC. AND SUBSIDIARIES
NOTES TO CONSOLIDATED FINANCIAL STATEMENTS
1. Summary of Significant Accounting Policies
Nature of Operations
Kelly Services, Inc. is a global workforce solutions provider operating throughout the world.
Fiscal Year
The Company’s fiscal year ends on the Sunday nearest to December 31. The three most recent years ended on
January 3, 2016
(
2015
, which contained 53 weeks),
December 28, 2014
(
2014
, which contained 52 weeks) and
December 29, 2013
(
2013
, which contained 52 weeks). The Company’s operations in Brazil are accounted for on a one-month lag. The Company’s equity investment in TS Kelly Workforce Solutions is accounted for on a one-quarter lag (see Investment in Equity Affiliate footnote). Any material transactions in the intervening period are disclosed or accounted for in the current reporting period. Period costs included in selling, general and administrative (“SG&A”) expenses are recorded on a calendar-year basis.
Principles of Consolidation
The consolidated financial statements include the accounts and operations of the Company and its wholly owned subsidiaries. Certain prior period amounts have been reclassified to conform to the current presentation. All intercompany accounts and transactions have been eliminated.
Available-For-Sale Investment
The Company’s available-for-sale investment, as further described in the Fair Value Measurements footnote, is carried at fair value with the unrealized gains or losses, net of tax, included as a component of accumulated other comprehensive income (loss) in stockholders’ equity. Realized losses and declines in value below cost judged to be other-than-temporary, if any, are included as a component of asset impairments expense in the consolidated statement of earnings. The fair value of the available-for-sale investment is based on quoted market prices.
Foreign Currency Translation
All of the Company’s international subsidiaries use their local currency as their functional currency. Revenue and expense accounts of foreign subsidiaries are translated to U.S. dollars at average exchange rates, while assets and liabilities are translated to U.S. dollars at year-end exchange rates. Resulting translation adjustments, net of tax, where applicable, are reported as accumulated foreign currency translation adjustments in stockholders’ equity and are recorded as a component of accumulated other comprehensive income.
Revenue Recognition
Revenue from services is recognized as services are provided by the temporary or contract employees. Revenue from permanent placement services is recognized at the time the permanent placement candidate begins full-time employment. Revenue from other fee-based services is recognized when the services are provided. Revenues from sales of services and the related direct costs are recorded in accordance with the accounting guidance on reporting revenue gross as a principal versus net as an agent. When we act as an agent, we report the revenues on a net basis. Provisions for sales allowances (billing adjustments related to errors, service issues and compromises on billing disputes), based on historical experience, are recognized at the time the related sale is recognized as a reduction in revenue from services.
Allowance for Uncollectible Accounts Receivable
The Company records an allowance for uncollectible accounts receivable based on historical loss experience, customer payment patterns and current economic trends. The reserve for sales allowances, as discussed above, is also included in the allowance for uncollectible accounts receivable. The Company reviews the adequacy of the allowance for uncollectible accounts receivable on a quarterly basis and, if necessary, increases or decreases the balance by recording a charge or credit to SG&A expenses for the portion of the adjustment relating to uncollectible accounts receivable, and a charge or credit to revenue from services for the portion of the adjustment relating to sales allowances.
Cost of Services
Cost of services are those costs directly associated with the earning of revenue. The primary examples of these types of costs are temporary employee wages, along with associated payroll taxes, temporary employee benefits, such as service bonus and holiday pay, and workers’ compensation costs. These costs differ fundamentally from SG&A expenses in that they arise specifically from the action of providing our services to customers whereas SG&A costs are incurred regardless of whether or not we place temporary employees with our customers.
Advertising Expenses
Advertising expenses, which are expensed as incurred and are included in SG&A expenses, were
$7.6 million
in
2015
,
$9.7 million
in
2014
and
$8.9 million
in
2013
.
Use of Estimates
The preparation of financial statements in conformity with generally accepted accounting principles requires management to make estimates and assumptions that affect the reported amounts in the consolidated financial statements and accompanying notes. Estimates are used for, but not limited to, the accounting for the allowance for uncollectible accounts receivable, workers’ compensation, goodwill and long-lived asset impairment, litigation costs and income taxes. Actual results could differ materially from those estimates.
Cash and Equivalents
Cash and equivalents are stated at fair value. The Company considers securities with original maturities of three months or less to be cash and equivalents.
54
KELLY SERVICES, INC. AND SUBSIDIARIES
NOTES TO CONSOLIDATED FINANCIAL STATEMENTS (continued)
Property and Equipment
Property and equipment are stated at cost and are depreciated on a straight-line basis over their estimated useful lives. Cost and estimated useful lives of property and equipment by function are as follows:
|
Category
|
2015
|
2014
|
Life
|
|||||||||
|
|
(In millions of dollars)
|
|
|
|
||||||||
|
Land
|
$
|
3.8
|
|
$
|
3.8
|
|
|
—
|
|
|||
|
Work in process
|
2.5
|
|
6.9
|
|
|
—
|
|
|||||
|
Buildings and improvements
|
60.2
|
|
59.7
|
|
15
|
to
|
45 years
|
|||||
|
Computer hardware and software
|
229.5
|
|
221.7
|
|
3
|
to
|
12 years
|
|||||
|
Equipment, furniture and fixtures
|
34.0
|
|
34.1
|
|
|
5
|
years
|
|||||
|
Leasehold improvements
|
31.8
|
|
33.8
|
|
The lesser of the life of the lease or 5 years.
|
|||||||
|
Total property and equipment
|
$
|
361.8
|
|
$
|
360.0
|
|
|
|||||
The Company capitalizes external costs and internal payroll costs directly incurred in the development of software for internal use as required by the Internal-Use Software Subtopic of the Financial Accounting Standards Board (“FASB”) Accounting Standards Codification (“ASC”). Work in process represents capitalized costs for internal use software not yet in service. Depreciation expense was
$21.4 million
for
2015
,
$20.3 million
for
2014
and
$18.4 million
for
2013
.
Operating Leases
The Company recognizes rent expense on a straight-line basis over the lease term. This includes the impact of both scheduled rent increases and free or reduced rents (commonly referred to as “rent holidays”). The Company records allowances provided by landlords for leasehold improvements as deferred rent in the consolidated balance sheet and as operating cash flows in the consolidated statements of cash flows.
Goodwill and Other Intangible Assets
Goodwill represents the excess of the purchase price over the fair value of net assets acquired. Purchased intangible assets with definite lives are recorded at estimated fair value at the date of acquisition and are amortized over their respective useful lives (from
3
to
15
years) on a straight-line basis or, if appropriate, on an accelerated basis commensurate with the related cash flows.
Impairment of Long-Lived Assets, Goodwill and Intangible Assets
The Company evaluates long-lived assets and intangible assets with definite lives for impairment whenever events or changes in circumstances indicate that the carrying amount of an asset may not be recoverable. When estimated undiscounted future cash flows will not be sufficient to recover the asset group’s carrying amount, in which the long-lived asset being tested for impairment resides, the asset is written down to its estimated fair value. Assets to be disposed of by sale, if any, are reported at the lower of the carrying amount or estimated fair value less cost to sell.
We test goodwill for impairment at the reporting unit level annually and whenever events or circumstances make it more likely than not that an impairment may have occurred. We have determined that our reporting units are the same as our operating and reportable segments based on our organizational structure and the financial information that is provided to and reviewed by the chief operating decision makers (“CODM”). We may use a qualitative assessment for one or more reporting units for the annual goodwill impairment test if we have determined that it is more likely than not that the fair value of the reporting unit(s) is more than their carrying value.
For reporting units where the qualitative assessment is not used, goodwill is tested for impairment using a two-step process. In the first step, the estimated fair value of a reporting unit is compared to its carrying value. If the estimated fair value of a reporting unit exceeds the carrying value of the net assets assigned to a reporting unit, goodwill is not considered impaired and no further testing is required.
If the carrying value of the net assets assigned to a reporting unit exceeds the estimated fair value of a reporting unit, a second step of the impairment test is performed in order to determine the implied fair value of a reporting unit’s goodwill. If the carrying value of a reporting unit’s goodwill exceeds its implied fair value, goodwill is deemed impaired and is written down to the extent of the difference.
Accounts Payable
Included in accounts payable are outstanding checks in excess of funds on deposit. Such amounts totaled
$4.4 million
and
$28.7 million
at year-end
2015
and
2014
, respectively.
55
KELLY SERVICES, INC. AND SUBSIDIARIES
NOTES TO CONSOLIDATED FINANCIAL STATEMENTS (continued)
Accrued Payroll and Related Taxes
Included in accrued payroll and related taxes are outstanding checks in excess of funds on deposit. Such amounts totaled
$4.9 million
and
$6.7 million
at year-end
2015
and
2014
, respectively. Payroll taxes for temporary employees are recognized proportionately to direct wages for interim periods based on expected full-year amounts.
Income Taxes
The Company accounts for income taxes using the liability method. Under this method, deferred tax assets and liabilities are recognized for the expected tax consequences of temporary differences between the tax bases of assets and liabilities and their reported amounts. Valuation allowances are provided against deferred tax assets when it is more likely than not that some portion or all of the deferred tax asset will not be realized.
The U.S. work opportunity credit is allowed for wages earned by employees in certain targeted groups. The actual amount of creditable wages in a particular period is estimated, since the credit is only available once an employee reaches a minimum employment period and the employee’s inclusion in a targeted group is certified by the applicable state. As these events often occur after the period the wages are earned, judgment is required in determining the amount of work opportunity credits accrued for in each period. We evaluate the accrual regularly throughout the year and make adjustments as needed.
Uncertain tax positions that are taken or expected to be taken in a tax return are recognized in the financial statements when it is more likely than not (i.e., a likelihood of more than fifty percent) that the position would be sustained upon examination by tax authorities that have full knowledge of all relevant information. A recognized tax position is then measured at the largest amount of benefit that is greater than fifty percent likely of being realized upon ultimate settlement.
Interest and penalties related to income taxes are accounted for as income tax expense.
Stock-Based Compensation
The Company may grant restricted stock awards and units (collectively, “restricted stock”), stock options (both incentive and nonqualified), stock appreciation rights and performance awards to key employees associated with the Company’s Class A stock. The Company utilizes the market price on the date of grant as the fair value for restricted stock and the market price on the date of grant less the present value of the expected dividends not received during the vesting period for performance awards. The Company also estimates a fair value of performance awards related to relative total shareholder return using a Monte Carlo simulation model. The Company estimates the fair value of stock option awards on the date of grant using an option-pricing model. The value of awards that are ultimately expected to vest is recognized as expense over the requisite service periods in SG&A expense in the Company’s consolidated statements of earnings.
Earnings Per Share
Restricted stock that entitle their holders to receive nonforfeitable dividends before vesting are considered participating securities and, therefore, are included in the calculation of earnings per share using the two-class method. The two-class method is an earnings allocation formula that determines earnings per share for each class of common stock and participating security according to dividends declared and participation rights in undistributed earnings. Under this method, earnings from continuing operations (or net earnings) is reduced by the amount of dividends declared, and the remaining undistributed earnings is allocated to common stock and participating securities based on the proportion of each class’s weighted average shares outstanding to the total weighted average shares outstanding. The calculation of diluted earnings per share includes the effect of potential common shares outstanding in the average weighted shares outstanding.
Workers’ Compensation
The Company establishes accruals for workers’ compensation claims utilizing actuarial methods to estimate the undiscounted future cash payments that will be made to satisfy the claims. The estimates are based both on historical experience as well as current legal, economic and regulatory factors. When claims exceed the applicable loss limit or self-insured retention and realization of recovery of the claim from existing insurance policies is deemed probable, the Company records a receivable from the insurance company for the excess amount. The receivable is included in prepaid expenses and other current assets and other assets in the consolidated balance sheet at year end. The Company regularly updates its estimates, and the ultimate cost of these claims may be greater than or less than the established accrual.
2. Fair Value Measurements
Trade accounts receivable, accounts payable, accrued liabilities, accrued payroll and related taxes and short-term borrowings approximate their fair values due to the short-term maturities of these assets and liabilities.
Assets Measured at Fair Value on a Recurring Basis
The following tables present the assets carried at fair value as of year-end
2015
and
2014
on the consolidated balance sheet by fair value hierarchy level, as described below.
Level 1 measurements consist of unadjusted quoted prices in active markets for identical assets or liabilities. Level 2 measurements include quoted prices in markets that are not active or model inputs that are observable either directly or indirectly for substantially the full term of the asset or liability. Level 3 measurements include significant unobservable inputs.
56
KELLY SERVICES, INC. AND SUBSIDIARIES
NOTES TO CONSOLIDATED FINANCIAL STATEMENTS (continued)
|
|
Fair Value Measurements on a Recurring Basis
As of Year-End 2015 |
|||||||||||||||
|
Description
|
Total
|
Level 1
|
Level 2
|
Level 3
|
||||||||||||
|
|
(In millions of dollars)
|
|||||||||||||||
|
Money market funds
|
$
|
3.7
|
|
$
|
3.7
|
|
$
|
—
|
|
$
|
—
|
|
||||
|
Available-for-sale investment
|
142.3
|
|
142.3
|
|
—
|
|
—
|
|
||||||||
|
Total assets at fair value
|
$
|
146.0
|
|
$
|
146.0
|
|
$
|
—
|
|
$
|
—
|
|
||||
|
|
Fair Value Measurements on a Recurring Basis
As of Year-End 2014 |
|||||||||||||||
|
Description
|
Total
|
Level 1
|
Level 2
|
Level 3
|
||||||||||||
|
|
(In millions of dollars)
|
|||||||||||||||
|
Money market funds
|
$
|
3.3
|
|
$
|
3.3
|
|
$
|
—
|
|
$
|
—
|
|
||||
|
Available-for-sale investment
|
97.9
|
|
97.9
|
|
—
|
|
—
|
|
||||||||
|
Total assets at fair value
|
$
|
101.2
|
|
$
|
101.2
|
|
$
|
—
|
|
$
|
—
|
|
||||
Money market funds as of year-end
2015
and
2014
represent investments in money market accounts, all of which are restricted as to use and are included in other assets on the consolidated balance sheet as of year-end
2015
and
2014
. The valuations were based on quoted market prices of those accounts as of the respective period end.
Available-for-sale investment represents the Company’s investment in Temp Holdings Co., Ltd. (“Temp Holdings”) and is included in other assets on the consolidated balance sheet. The valuation is based on the quoted market price of Temp Holdings stock on the Tokyo Stock Exchange as of the period end. The unrealized gain, net of tax, of
$28.6 million
for the year ended
2015
and
$11.5 million
for the year ended
2014
was recorded in other comprehensive income, as well as in accumulated other comprehensive income, a component of stockholders’ equity. The cost of this yen-denominated investment, which fluctuates based on foreign exchange rates, was
$17.2 million
at year-end
2015
and
2014
.
Assets Measured at Fair Value on a Nonrecurring Basis
We completed our annual impairment test for all reporting units in the fourth quarter for the fiscal years ended
2015
and
2014
and determined that goodwill was not impaired.
In
2015
and
2014
, we elected to complete a step one quantitative test for all of our reporting units with goodwill. For both years, the estimated fair value of each reporting unit tested exceeded its related carrying value. As a result of these qualitative assessments, we determined it was more likely than not that the fair value of each of the reporting units was more than its carrying value.
During 2013, a triggering event for the evaluation of certain long-lived assets for impairment occurred as the Company made the decision to exit the executive search business operating in an asset group within Germany that was associated with the OCG business segment. Based on the Company’s estimates as of the 2013 second quarter end, a
$1.7 million
reduction in the carrying value of OCG intangible assets was recorded. The resulting expense was recorded in the asset impairments line on the consolidated statement of earnings.
3. Restructuring
On September 15, 2014, the Board of Directors of the Company approved a management simplification restructuring plan (“Plan”) that was subsequently communicated to Kelly personnel in October 2014. The Plan was completed during the fourth quarter of 2014. In addition to the Plan, in 2014, restructuring costs were incurred related primarily to exiting the staffing business in Sweden, exiting branches in Australia and consolidating back office functions in Australia and New Zealand. These were contract termination costs which were recorded in the EMEA and APAC regions in the segment results.
Restructuring costs incurred in 2014 totaled
$12.0 million
. There were
no
restructuring costs incurred in 2015.
57
KELLY SERVICES, INC. AND SUBSIDIARIES
NOTES TO CONSOLIDATED FINANCIAL STATEMENTS (continued)
A summary of our global restructuring balance sheet accrual, primarily included in accrued payroll and related taxes, is detailed below (in millions of dollars).
|
Balance as of year-end 2013
|
$
|
—
|
|
|
Additions charged to corporate under the Plan
|
9.9
|
|
|
|
Additions charged to EMEA and APAC operations
|
2.1
|
|
|
|
Reductions for cash payments related to all restructuring activities
|
(5.1
|
)
|
|
|
Balance as of year-end 2014
|
6.9
|
|
|
|
Reductions for cash payments related to all restructuring activities
|
(6.4
|
)
|
|
|
Balance as of year-end 2015
|
$
|
0.5
|
|
The remaining balance of
$0.5 million
as of year-end
2015
primarily represents severance costs and the majority is expected to be paid in the first quarter of 2016.
No
additional charges are expected to be incurred related to the Plan or to activities in Sweden, Australia and New Zealand.
4. Investment in Equity Affiliate
We have a
49%
ownership interest in TS Kelly Workforce Solutions (“TS Kelly”). The operating results of our interest in TS Kelly are accounted for on a one-quarter lag under the equity method and are recorded in other expense, net in the consolidated statement of earnings (see Other Expense, Net footnote).
The total investment in TS Kelly was
$9.4 million
as of year-end
2015
and
$9.6 million
as of year-end
2014
. In 2015, we made cash contributions to TS Kelly totaling
$0.5 million
. In 2014, we made net cash contributions and loans to TS Kelly totaling
$5.7 million
, which includes
$4.8 million
for the acquisition of a China-based staffing company. In 2013, we made a loan to TS Kelly of
$1.4 million
, which was subsequently capitalized in 2014. The amount due to or due from TS Kelly was immaterial as of year-end
2015
and
2014
.
58
KELLY SERVICES, INC. AND SUBSIDIARIES
NOTES TO CONSOLIDATED FINANCIAL STATEMENTS (continued)
5. Goodwill
There were
no
changes in the net carrying amount of goodwill for the fiscal year
2015
as shown in the table below.
|
|
As of Year-End 2014
|
|
As of Year-End 2015
|
||||||||||||||||||||
|
|
Goodwill,
Gross
|
Accumulated Impairment Losses
|
Adjustments
to
Goodwill
|
Goodwill,
Gross
|
Accumulated
Impairment
Losses
|
Goodwill,
Net
|
|||||||||||||||||
|
|
(In millions of dollars)
|
||||||||||||||||||||||
|
Americas
|
|
|
|
|
|
|
|||||||||||||||||
|
Americas Commercial
|
$
|
40.0
|
|
$
|
(16.4
|
)
|
$
|
—
|
|
$
|
40.0
|
|
$
|
(16.4
|
)
|
$
|
23.6
|
|
|||||
|
Americas PT
|
37.9
|
|
—
|
|
—
|
|
37.9
|
|
—
|
|
37.9
|
|
|||||||||||
|
Total Americas
|
77.9
|
|
(16.4
|
)
|
—
|
|
77.9
|
|
(16.4
|
)
|
61.5
|
|
|||||||||||
|
EMEA
|
|
|
|
|
|
|
|||||||||||||||||
|
EMEA Commercial
|
50.4
|
|
(50.4
|
)
|
—
|
|
50.4
|
|
(50.4
|
)
|
—
|
|
|||||||||||
|
EMEA PT
|
22.0
|
|
(22.0
|
)
|
—
|
|
22.0
|
|
(22.0
|
)
|
—
|
|
|||||||||||
|
Total EMEA
|
72.4
|
|
(72.4
|
)
|
—
|
|
72.4
|
|
(72.4
|
)
|
—
|
|
|||||||||||
|
APAC
|
|
|
|
|
|
|
|||||||||||||||||
|
APAC Commercial
|
12.1
|
|
(12.1
|
)
|
—
|
|
12.1
|
|
(12.1
|
)
|
—
|
|
|||||||||||
|
APAC PT
|
1.4
|
|
—
|
|
—
|
|
1.4
|
|
—
|
|
1.4
|
|
|||||||||||
|
Total APAC
|
13.5
|
|
(12.1
|
)
|
—
|
|
13.5
|
|
(12.1
|
)
|
1.4
|
|
|||||||||||
|
OCG
|
27.4
|
|
—
|
|
—
|
|
27.4
|
|
—
|
|
27.4
|
|
|||||||||||
|
Consolidated Total
|
$
|
191.2
|
|
$
|
(100.9
|
)
|
$
|
—
|
|
$
|
191.2
|
|
$
|
(100.9
|
)
|
$
|
90.3
|
|
|||||
59
KELLY SERVICES, INC. AND SUBSIDIARIES
NOTES TO CONSOLIDATED FINANCIAL STATEMENTS (continued)
The changes in the net carrying amount of goodwill for the fiscal year
2014
are included in the table below. Effective with the first quarter of 2014, the project-based legal services business in the Americas PT segment was reclassified to the OCG segment. Accordingly, the related portion of Americas PT goodwill was reclassified to OCG during the first quarter of 2014.
|
|
As of Year-End 2013
|
|
As of Year-End 2014
|
||||||||||||||||||||
|
|
Goodwill,
Gross
|
Accumulated Impairment
Losses
|
Adjustments
to
Goodwill
|
Goodwill,
Gross
|
Accumulated
Impairment
Losses
|
Goodwill,
Net
|
|||||||||||||||||
|
|
(In millions of dollars)
|
||||||||||||||||||||||
|
Americas
|
|
|
|
|
|
|
|||||||||||||||||
|
Americas Commercial
|
$
|
40.0
|
|
$
|
(16.4
|
)
|
$
|
—
|
|
$
|
40.0
|
|
$
|
(16.4
|
)
|
$
|
23.6
|
|
|||||
|
Americas PT
|
39.2
|
|
—
|
|
(1.3
|
)
|
37.9
|
|
—
|
|
37.9
|
|
|||||||||||
|
Total Americas
|
79.2
|
|
(16.4
|
)
|
(1.3
|
)
|
77.9
|
|
(16.4
|
)
|
61.5
|
|
|||||||||||
|
EMEA
|
|
|
|
|
|
|
|||||||||||||||||
|
EMEA Commercial
|
50.4
|
|
(50.4
|
)
|
—
|
|
50.4
|
|
(50.4
|
)
|
—
|
|
|||||||||||
|
EMEA PT
|
22.0
|
|
(22.0
|
)
|
—
|
|
22.0
|
|
(22.0
|
)
|
—
|
|
|||||||||||
|
Total EMEA
|
72.4
|
|
(72.4
|
)
|
—
|
|
72.4
|
|
(72.4
|
)
|
—
|
|
|||||||||||
|
APAC
|
|
|
|
|
|
|
|||||||||||||||||
|
APAC Commercial
|
12.1
|
|
(12.1
|
)
|
—
|
|
12.1
|
|
(12.1
|
)
|
—
|
|
|||||||||||
|
APAC PT
|
1.4
|
|
—
|
|
—
|
|
1.4
|
|
—
|
|
1.4
|
|
|||||||||||
|
Total APAC
|
13.5
|
|
(12.1
|
)
|
—
|
|
13.5
|
|
(12.1
|
)
|
1.4
|
|
|||||||||||
|
OCG
|
26.1
|
|
—
|
|
1.3
|
|
27.4
|
|
—
|
|
27.4
|
|
|||||||||||
|
Consolidated Total
|
$
|
191.2
|
|
$
|
(100.9
|
)
|
$
|
—
|
|
$
|
191.2
|
|
$
|
(100.9
|
)
|
$
|
90.3
|
|
|||||
6. Other Assets
Included in other assets are the following:
|
2015
|
2014
|
||||||
|
|
(In millions of dollars)
|
||||||
|
Deferred compensation plan (see Retirement Benefits footnote)
|
$
|
148.2
|
|
$
|
149.0
|
|
|
|
Available-for-sale investment (see Fair Value Measurements footnote)
|
142.3
|
|
97.9
|
|
|||
|
Wage credit receivable
|
19.9
|
|
13.6
|
|
|||
|
Investment in equity affiliate (see Investment in Equity Affiliate footnote)
|
9.4
|
|
9.6
|
|
|||
|
Workers' compensation receivable
|
8.2
|
|
11.5
|
|
|||
|
Intangibles, net of accumulated amortization of $17.2 million in 2015 and $17.8 million in 2014
|
1.3
|
|
2.7
|
|
|||
|
Other
|
14.7
|
|
15.8
|
|
|||
|
Other assets
|
$
|
344.0
|
|
$
|
300.1
|
|
|
Intangible amortization expense, which is included in SG&A expenses, was
$0.9 million
,
$1.4 million
and
$2.0 million
in
2015
,
2014
and
2013
, respectively. Wage credit receivable is related to a tax law to enhance the competitiveness of businesses in France. Workers’ compensation receivable represents receivables from the insurance company for U.S. workers’ compensation claims in excess of the applicable loss limits.
60
KELLY SERVICES, INC. AND SUBSIDIARIES
NOTES TO CONSOLIDATED FINANCIAL STATEMENTS (continued)
7. Debt
The Company ha
s a
$200.0 million
revolving credit facility (the “Facility”) with a termination date of December 11, 2018. The Facility allows for borrowings in various currencies and is available to be used to fund working capital, acquisitions, and general corporate needs.
At year-end
2015
, there were
no
borrowings under the Facility and a remaining capacity of
$200.0 million
. At year-end
2014
, borrowings under the Facility were
$0.4 million
with an interest rate of
3.75%
, and the remaining borrowing capacity was
$199.6 million
. To maintain availability of the funds, we pay a facility fee on the full amount of the Facility, regardless of usage. The facility fee varies based on the Company’s leverage ratio as defined in the agreement. The Facility had a facility fee of
20 basis points
at year-end
2015
and
25 basis points
at year-end
2014
. The Facility’s financial covenants and restrictions are described below, all of which were met at year-end
2015
:
|
•
|
We must maintain a certain minimum ratio of earnings before interest, taxes, depreciation, amortization and certain cash and non-cash charges that are non-recurring in nature (“EBITDA”) to interest expense (“Interest Coverage Ratio”) as of the end of any fiscal quarter.
|
|
•
|
We must maintain a certain maximum ratio of total indebtedness to the sum of net worth and total indebtedness at all times.
|
|
•
|
Dividends, stock buybacks and similar transactions are limited to certain maximum amounts.
|
|
•
|
We must adhere to other operating restrictions relating to the conduct of business, such as certain limitations on asset sales and the type and scope of investments.
|
The Company has a Receivables Purchase Agreement with Kelly Receivables Funding, LLC, a wholly owned bankruptcy remote special purpose subsidiary of the Company (the “Receivables Entity”), related to its
$150 million
,
three
-year, securitization facility (“Securitization Facility”). The Receivables Purchase Agreement will terminate December 9, 2016, unless terminated earlier pursuant to its terms.
Under the Securitization Facility, the Company will sell certain trade receivables and related rights (“Receivables”), on a revolving basis, to the Receivables Entity. The Receivables Entity may from time to time sell an undivided variable percentage ownership interest in the Receivables. The Securitization Facility also allows for the issuance of standby letters of credit (“SBLC”). The Securitization Facility contains a cross-default clause that could result in termination if defaults occur under our other loan agreements. The Securitization Facility also contains certain restrictions based on the performance of the Receivables.
As of year-end
2015
, the Securitization Facility carried
$50.0 million
of short-term borrowings at a rate of
0.82%
, SBLCs of
$49.0 million
related to workers’ compensation at a rate of
0.40%
and a remaining capacity of
$51.0 million
. As of year-end
2014
, the Securitization Facility carried
$88.0 million
of short-term borrowings at a rate of
0.57%
, SBLCs of
$54.5 million
related to workers’ compensation at a rate of
0.40%
and a remaining capacity of
$7.5 million
. The rates above for short-term borrowings include the LIBOR interest rate and a utilization rate on the amount of our borrowings. The rates for the SBLCs represent a utilization rate on the outstanding amount of the SBLCs. In addition, we pay a facility fee of
40 basis points
on the full amount of the Securitization Facility, regardless of usage.
The Receivables Entity’s sole business consists of the purchase or acceptance through capital contributions of trade accounts receivable and related rights from the Company. As described above, the Receivables Entity may retransfer these receivables or grant a security interest in those receivables under the terms and conditions of the Receivables Purchase Agreement. The Receivables Entity is a separate legal entity with its own creditors who would be entitled, if it were ever liquidated, to be satisfied out of its assets prior to any assets or value in the Receivables Entity becoming available to its equity holders. The assets of the Receivables Entity are not available to pay creditors of the Company or any of its other subsidiaries. The assets and liabilities of the Receivables Entity are included in the consolidated financial statements of the Company.
The Company had total unsecured, uncommitted short-term local credit facilities of
$16.3 million
as of year-end
2015
. Borrowings under these lines totaled
$5.5 million
and
$3.5 million
at year-end
2015
and
2014
, respectively. The interest rate for these borrowings was
2.75%
at year-end
2015
and
2.50%
at year-end
2014
.
61
KELLY SERVICES, INC. AND SUBSIDIARIES
NOTES TO CONSOLIDATED FINANCIAL STATEMENTS (continued)
8. Retirement Benefits
The Company provides a qualified defined contribution plan covering substantially all U.S.-based full-time employees, except officers and certain other employees. The plan offers a savings feature with Company matching contributions. Assets of this plan are held by an independent trustee for the sole benefit of participating employees.
A nonqualified plan is provided for officers and certain other employees. This plan includes provisions for salary deferrals and Company matching contributions.
Effective January 1, 2015, the Board of Directors approved amendments to the qualified and unqualified defined contribution plans to increase Company matching contributions and eliminate the discretionary contributions.
In addition to the plans above, the Company also provides a qualified plan and a nonqualified plan to certain U.S.-based temporary employees.
The liability for the nonqualified plans was
$150.3 million
and
$147.3 million
as of year-end
2015
and
2014
, respectively, and is included in current accrued payroll and related taxes and noncurrent accrued retirement benefits. The cost of participants’ earnings or loss on this liability, which were included in SG&A expenses, were a loss of
$1.6 million
in
2015
, earnings of
$7.6 million
in
2014
and earnings of
$15.7 million
in
2013
. In connection with the administration of these plans, the Company has purchased company-owned variable universal life insurance policies insuring the lives of certain officers and key employees. The cash surrender value of these policies, which is based primarily on investments in mutual funds and can only be used for payment of the Company’s obligations related to the non-qualified deferred compensation plan noted above, was
$148.2 million
and
$149.0 million
at year-end
2015
and
2014
, respectively. The cash surrender value of these insurance policies is included in other assets. Tax-free earnings on these assets, which were included in SG&A expenses, were
$0.3 million
in
2015
,
$7.3 million
in
2014
and
$17.4 million
in
2013
.
The net expense for retirement benefits for the qualified and nonqualified plans, including Company matching and discretionary contributions for full-time employees, totaled
$5.7 million
in
2015
,
$6.1 million
in
2014
and
$6.2 million
in
2013
. The expense related to retirement plan contributions for temporary employees, which is included in cost of services, is reimbursed by our customers.
In addition, the Company also has several defined benefit pension plans in locations outside of the United States. The total projected benefit obligation, assets and unfunded liability for these plans as of year-end
2015
were
$11.5 million
,
$7.3 million
and
$4.2 million
, respectively. The total projected benefit obligation, assets and unfunded liability for these plans as of year-end
2014
were
$14.8 million
,
$9.5 million
and
$5.3 million
, respectively. Total pension expense for these plans was
$0.3 million
,
$0.9 million
and
$0.7 million
in
2015
,
2014
and
2013
, respectively. Pension contributions and the amount of accumulated other comprehensive income expected to be recognized in
2016
are not significant.
9. Stockholders’ Equity
Common Stock
The authorized capital stock of the Company is
100,000,000
shares of Class A common stock and
10,000,000
shares of Class B common stock. Class A shares have no voting rights and are not convertible. Class B shares have voting rights and are convertible by the holder into Class A shares on a share-for-share basis at any time. Both classes of stock have identical rights in the event of liquidation.
Class A shares and Class B shares are both entitled to receive dividends, subject to the limitation that no cash dividend on the Class B shares may be declared unless the Board of Directors declares an equal or larger cash dividend on the Class A shares. As a result, a cash dividend may be declared on the Class A shares without declaring a cash dividend on the Class B shares.
The Company made dividend payments totaling
$7.7 million
in 2015 and
$7.6 million
in
2014
and
2013
.
62
KELLY SERVICES, INC. AND SUBSIDIARIES
NOTES TO CONSOLIDATED FINANCIAL STATEMENTS (continued)
Accumulated Other Comprehensive Income
The changes in accumulated other comprehensive income by component, net of tax, during
2015
and
2014
are included in the table below. Amounts in parentheses indicate debits.
|
Foreign
Currency Translation Adjustments |
Unrealized
Gains and Losses on Investment |
Pension
Liability Adjustments |
Total
|
||||||||||||
|
(In millions of dollars)
|
|||||||||||||||
|
Balance at year-end 2014
|
$
|
(3.0
|
)
|
$
|
56.3
|
|
$
|
(2.2
|
)
|
$
|
51.1
|
|
|||
|
Other comprehensive income (loss) before reclassifications
|
(19.4
|
)
|
28.6
|
|
0.5
|
|
9.7
|
|
|||||||
|
Amounts reclassified from accumulated other comprehensive income
|
(0.2
|
)
|
(1)
|
—
|
|
0.1
|
|
(2)
|
(0.1
|
)
|
|||||
|
Net current-period other comprehensive income
|
(19.6
|
)
|
28.6
|
|
0.6
|
|
9.6
|
|
|||||||
|
Balance at year-end 2015
|
$
|
(22.6
|
)
|
$
|
84.9
|
|
$
|
(1.6
|
)
|
$
|
60.7
|
|
|||
|
|
Foreign
Currency Translation Adjustments |
|
Unrealized
Gains and Losses on Investment |
|
Pension
Liability Adjustments |
|
Total
|
||||||||
|
|
(In millions of dollars)
|
||||||||||||||
|
Balance at year-end 2013
|
$
|
18.1
|
|
|
$
|
44.8
|
|
|
$
|
(1.5
|
)
|
$
|
61.4
|
|
|
|
Other comprehensive income (loss) before reclassifications
|
(20.2
|
)
|
11.5
|
|
(0.8
|
)
|
|
(9.5
|
)
|
||||||
|
Amounts reclassified from accumulated other comprehensive income
|
(0.9
|
)
|
(1)
|
—
|
|
|
0.1
|
|
(2)
|
(0.8
|
)
|
||||
|
Net current-period other comprehensive income
|
(21.1
|
)
|
11.5
|
|
|
(0.7
|
)
|
|
(10.3
|
)
|
|||||
|
Balance at year-end 2014
|
$
|
(3.0
|
)
|
$
|
56.3
|
|
$
|
(2.2
|
)
|
$
|
51.1
|
|
|||
|
(1)
|
Amount was recorded in the other expense, net line item in the consolidated statement of earnings.
|
|
(2)
|
Amount was recorded in the SG&A expenses line item in the consolidated statement of earnings.
|
63
KELLY SERVICES, INC. AND SUBSIDIARIES
NOTES TO CONSOLIDATED FINANCIAL STATEMENTS (continued)
10. Earnings Per Share
The reconciliation of basic earnings per share on common stock for the year-end
2015
,
2014
and
2013
follows (in millions of dollars except per share data).
|
|
2015
|
2014
|
2013
|
||||||||
|
Net earnings
|
$
|
53.8
|
|
$
|
23.7
|
|
$
|
58.9
|
|
||
|
Less: Earnings allocated to participating securities
|
(1.4
|
)
|
(0.7
|
)
|
(1.5
|
)
|
|||||
|
Net earnings available to common shareholders
|
$
|
52.4
|
|
$
|
23.0
|
|
$
|
57.4
|
|
||
|
Basic earnings per share on common stock:
|
$
|
1.39
|
|
$
|
0.61
|
|
$
|
1.54
|
|
||
|
Diluted earnings per share on common stock:
|
$
|
1.39
|
|
$
|
0.61
|
|
$
|
1.54
|
|
||
|
Average common shares outstanding (millions)
|
|
|
|
||||||||
|
Basic
|
37.8
|
|
37.5
|
|
37.3
|
|
|||||
|
Diluted
|
37.9
|
|
37.5
|
|
37.3
|
|
|||||
Due to the fact that there were no significant potentially dilutive common shares outstanding during the period, the computations of basic and diluted earnings per share on common stock are the same for
2015
,
2014
and
2013
. Stock options excluded from the computation of diluted earnings per share due to their anti-dilutive effect for
2015
were not significant. Stock options representing
0.1 million
and
0.3 million
shares for
2014
and
2013
, respectively, were excluded from the computation of diluted earnings per share due to their anti-dilutive effect.
We have presented earnings per share for our two classes of common stock on a combined basis. This presentation is consistent with the earnings per share computations that result for each class of common stock utilizing the two-class method as described in ASC Topic 260, “Earnings Per Share”. The two-class method is an earnings allocation formula which determines earnings per share for each class of common stock according to the dividends declared (or accumulated) and participation rights in the undistributed earnings.
In applying the two class method, we have determined that the undistributed earnings should be allocated to each class on a pro rata basis after consideration of all of the participation rights of the Class B shares (including voting and conversion rights) and our history of paying dividends equally to each class of common stock on a per share basis.
The Company’s Restated Certificate of Incorporation allows the Board of Directors to declare a cash dividend to Class A shares without declaring equal dividends to the Class B shares. Class B shares’ voting and conversion rights, however, effectively allow the Class B shares to participate in dividends equally with Class A shares on a per share basis.
The Class B shares are the only shares with voting rights. The Class B shareholders are therefore able to exercise voting control with respect to all matters requiring stockholder approval, including the election of or removal of directors. The Board of Directors has historically declared and the Company historically has paid equal per share dividends on both the Class A and Class B shares. Each class has participated equally in all dividends declared since 1987.
In addition, Class B shares are convertible, at the option of the holder, into Class A shares on a one for one basis. As a result, Class B shares can participate equally in any dividends declared on the Class A shares by exercising their conversion rights.
11. Stock-Based Compensation
Under the Equity Incentive Plan, amended and restated February 12, 2015 and approved by the stockholders of the Company on May 6, 2015 (the “EIP”), the Company may grant stock options (both incentive and nonqualified), stock appreciation rights, restricted stock and performance awards to key employees associated with the Company’s Class A stock. The EIP provides that the maximum number of shares available for grants is
15 percent
of the outstanding Class A stock, adjusted for EIP activity over the preceding
five
years. Shares available for future grants at year-end
2015
under the EIP were
2,738,086
. The Company issues shares out of treasury stock to satisfy stock-based awards. The Company presently has no intent to repurchase additional shares for the purpose of satisfying stock-based awards.
The Company recognized stock-based compensation cost of
$7.9 million
in
2015
,
$7.6 million
in
2014
and
$6.0 million
in
2013
, as well as related tax benefits of
$3.0 million
in
2015
,
$2.9 million
in
2014
and
$2.3 million
in
2013
.
64
KELLY SERVICES, INC. AND SUBSIDIARIES
NOTES TO CONSOLIDATED FINANCIAL STATEMENTS (continued)
Restricted Stock
Restricted stock, which typically vests over
4
years, is issued to certain key employees and is subject to forfeiture until the end of an established restriction period. The Company utilizes the market price of its Class A stock on the date of grant as the fair value of restricted stock and expenses the fair value on a straight-line basis over the vesting period.
A summary of the status of nonvested restricted stock under the EIP as of year-end
2015
and changes during this period is presented as follows:
|
|
Restricted
Stock
|
Weighted
Average
Grant Date
Fair Value
|
||||
|
Nonvested at year-end 2014
|
1,192,550
|
|
$
|
16.47
|
|
|
|
Granted
|
320,357
|
|
15.85
|
|
||
|
Vested
|
(361,475
|
)
|
16.31
|
|
||
|
Forfeited
|
(265,550
|
)
|
16.52
|
|
||
|
Nonvested at year-end 2015
|
885,882
|
|
$
|
16.30
|
|
|
As of year-end
2015
, unrecognized compensation cost related to unvested restricted stock totaled
$12.0 million
. The weighted average period over which this cost is expected to be recognized is approximately
two
years. The weighted average grant date fair value per share of restricted stock granted during
2015
,
2014
and
2013
was
$15.85
,
$15.63
and
$19.74
, respectively. The total fair value of restricted stock, which vested during
2015
,
2014
and
2013
, was
$5.4 million
,
$7.1 million
and
$6.5 million
, respectively.
Performance Shares
During 2015, the Company granted performance awards associated with the Company’s Class A stock to certain senior officers. The payment of performance shares, which will be satisfied with the issuance of shares out of treasury stock, is contingent upon the achievement of specific performance goals over a stated period of time. For the 2015 performance share grant (“2015 grant”), the total target number of performance shares granted is
375,000
, and the maximum number of performance shares that may be earned is
750,000
, which assumes
200%
of the target shares originally granted. Target shares of
250,000
may be earned upon the achievement of two financial goals (“financial measure performance shares”) and target shares of
125,000
may be earned based on the Company’s total shareholder return (“TSR”) relative to the S&P SmallCap 600 Index (“TSR performance shares”). No dividends are paid on these performance shares.
The financial measure performance shares, which have a weighted average grant date fair value of
$16.31
, have a
one
-year performance measure through fiscal 2015 and vest after the completion of an additional
two
-year service period. Based upon the level of achievement of specific financial performance goals for the 2015 grant, participants had the ability to receive up to
200%
of the target number of shares originally granted. On February 17, 2016, the Compensation Committee approved the actual performance achievement of the financial measure performance shares for the 2015 grant. Actual performance resulted in participants achieving
115%
of target, or
287,896
shares for the financial measure performance awards on a combined basis. These shares will cliff-vest after the approval of the Compensation Committee, which will be no later than March 15, 2018, if not forfeited by the recipient. The total nonvested shares related to financial measure performance awards at year-end 2015 is
287,896
.
TSR performance shares have a
three
-year performance measure with vesting at the end of the performance period. These shares have an estimated fair value of
$16.01
, which was computed using a Monte Carlo simulation model incorporating assumptions for inputs of expected stock price volatility, dividend yield and risk-free interest rate. If earned, TSR performance shares will be awarded and fully vest after the approval of the Compensation Committee, which will be no later than March 15, 2018, if not forfeited by the recipient. The total nonvested shares at maximum level (
200%
) related to TSR performance awards at year-end 2015 is
250,000
.
As of year-end 2015, unrecognized compensation cost related to unvested financial measure performance shares and TSR performance shares totaled
$3.3 million
and
$1.4 million
, respectively. The weighted average period over which the costs are expected to be recognized is approximately
two
years.
65
KELLY SERVICES, INC. AND SUBSIDIARIES
NOTES TO CONSOLIDATED FINANCIAL STATEMENTS (continued)
Stock Options
Under the terms of the EIP, stock options may not be granted at prices less than the fair value of the Company’s Class A stock on the date of grant, nor for a term exceeding
10
years, and typically vest over
3
years. The Company expenses the fair value of stock option grants on a straight-line basis over the vesting period.
No
stock options were granted in
2015
,
2014
and
2013
.
A summary of the status of stock option grants under the EIP as of year-end
2015
and changes during this period is presented as follows:
|
|
Options
|
Weighted
Average
Exercise
Price
|
Weighted
Average
Remaining
Contractual
Term (Years)
|
Aggregate
Intrinsic
Value
|
||||||||
|
Outstanding at year-end 2014
|
33,000
|
|
$
|
27.37
|
|
|
|
|
||||
|
Granted
|
—
|
|
—
|
|
|
|
|
|||||
|
Exercised
|
—
|
|
—
|
|
|
|
|
|||||
|
Forfeited
|
—
|
|
—
|
|
|
|
|
|||||
|
Expired
|
(21,000
|
)
|
27.45
|
|
|
|
|
|||||
|
Outstanding at year-end 2015
|
12,000
|
|
$
|
27.24
|
|
0.35
|
$
|
—
|
|
|||
|
Options exercisable at year-end 2015
|
12,000
|
|
$
|
27.24
|
|
0.35
|
$
|
—
|
|
|||
The table above represents
12,000
of non-employee director shares outstanding at year-end
2015
.
As of year-end
2015
, there was
no
unrecognized compensation cost related to unvested stock options.
No
stock options were exercised in
2015
,
2014
and
2013
.
Windfall tax benefits, which were included in the “Other financing activities” component of net cash from financing activities in the consolidated statements of cash flows, totaled
$0.2 million
in
2015
,
$0.4 million
for
2014
and
$0.5 million
for
2013
.
12. Other Expense, Net
Included in other expense, net are the following:
|
|
2015
|
2014
|
2013
|
||||||||
|
|
(In millions of dollars)
|
||||||||||
|
Interest income
|
$
|
0.3
|
|
$
|
0.5
|
|
$
|
0.4
|
|
||
|
Interest expense
|
(3.8
|
)
|
(3.0
|
)
|
(2.8
|
)
|
|||||
|
Dividend income
|
0.9
|
|
0.7
|
|
0.6
|
|
|||||
|
Foreign exchange losses
|
(0.9
|
)
|
(1.0
|
)
|
(1.5
|
)
|
|||||
|
Net loss on equity investment (see Investment in Equity Affiliate footnote)
|
(0.7
|
)
|
(2.5
|
)
|
(1.3
|
)
|
|||||
|
Other
|
—
|
|
—
|
|
0.1
|
|
|||||
|
Other expense, net
|
$
|
(4.2
|
)
|
$
|
(5.3
|
)
|
$
|
(4.5
|
)
|
||
Dividend income includes dividends earned on the Company’s investment in Temp Holdings (see Fair Value Measurements footnote).
66
KELLY SERVICES, INC. AND SUBSIDIARIES
NOTES TO CONSOLIDATED FINANCIAL STATEMENTS (continued)
13. Income Taxes
Earnings before taxes for the years
2015
,
2014
and
2013
were taxed under the following jurisdictions:
|
|
2015
|
2014
|
2013
|
||||||||
|
|
(In millions of dollars)
|
||||||||||
|
Domestic
|
$
|
28.9
|
|
$
|
5.9
|
|
$
|
35.1
|
|
||
|
Foreign
|
33.6
|
|
10.7
|
|
13.7
|
|
|||||
|
Total
|
$
|
62.5
|
|
$
|
16.6
|
|
$
|
48.8
|
|
||
The provision for income taxes was as follows:
|
|
2015
|
2014
|
2013
|
||||||||
|
|
(In millions of dollars)
|
||||||||||
|
Current tax expense:
|
|
|
|
||||||||
|
U.S. federal
|
$
|
8.3
|
|
$
|
5.6
|
|
$
|
7.3
|
|
||
|
U.S. state and local
|
1.4
|
|
1.4
|
|
3.5
|
|
|||||
|
Foreign
|
10.8
|
|
12.7
|
|
10.4
|
|
|||||
|
Total current
|
20.5
|
|
19.7
|
|
21.2
|
|
|||||
|
Deferred tax expense:
|
|
|
|
||||||||
|
U.S. federal
|
(10.6
|
)
|
(22.0
|
)
|
(26.9
|
)
|
|||||
|
U.S. state and local
|
0.8
|
|
(0.4
|
)
|
(1.6
|
)
|
|||||
|
Foreign
|
(2.0
|
)
|
(4.4
|
)
|
(2.8
|
)
|
|||||
|
Total deferred
|
(11.8
|
)
|
(26.8
|
)
|
(31.3
|
)
|
|||||
|
Total provision
|
$
|
8.7
|
|
$
|
(7.1
|
)
|
$
|
(10.1
|
)
|
||
Deferred taxes are comprised of the following:
|
|
2015
|
2014
|
|||||
|
|
(In millions of dollars)
|
||||||
|
Depreciation and amortization
|
$
|
(14.3
|
)
|
$
|
(14.4
|
)
|
|
|
Employee compensation and benefit plans
|
70.6
|
|
70.4
|
|
|||
|
Workers’ compensation
|
21.4
|
|
21.6
|
|
|||
|
Unrealized gain on securities
|
(36.7
|
)
|
(23.7
|
)
|
|||
|
Loss carryforwards
|
40.6
|
|
47.2
|
|
|||
|
Credit carryforwards
|
113.4
|
|
103.0
|
|
|||
|
Other, net
|
8.1
|
|
11.0
|
|
|||
|
Valuation allowance
|
(50.9
|
)
|
(58.5
|
)
|
|||
|
Net deferred tax assets
|
$
|
152.2
|
|
$
|
156.6
|
|
|
The deferred tax balance is classified in the consolidated balance sheet as:
|
|
2015
|
2014
|
|||||
|
|
(In millions of dollars)
|
||||||
|
Current assets, deferred tax
|
$
|
—
|
|
$
|
34.4
|
|
|
|
Noncurrent deferred tax asset
|
189.3
|
|
146.3
|
|
|||
|
Current liabilities, income and other taxes
|
—
|
|
(0.4
|
)
|
|||
|
Noncurrent liabilities, other long-term liabilities
|
(37.1
|
)
|
(23.7
|
)
|
|||
|
|
$
|
152.2
|
|
$
|
156.6
|
|
|
As a result of early adopting ASU 2015-17 on a prospective basis, as of the 2015 year end, we reclassified our net current deferred tax asset to a net noncurrent deferred tax asset and our net current deferred tax liability to a net noncurrent deferred tax liability.
67
KELLY SERVICES, INC. AND SUBSIDIARIES
NOTES TO CONSOLIDATED FINANCIAL STATEMENTS (continued)
The differences between income taxes from continuing operations for financial reporting purposes and the U.S. statutory rate of
35%
are as follows:
|
|
2015
|
2014
|
2013
|
||||||||
|
|
(In millions of dollars)
|
||||||||||
|
Income tax based on statutory rate
|
$
|
21.9
|
|
$
|
5.8
|
|
$
|
17.1
|
|
||
|
State income taxes, net of federal benefit
|
1.3
|
|
0.7
|
|
1.2
|
|
|||||
|
General business credits
|
(17.9
|
)
|
(17.5
|
)
|
(26.2
|
)
|
|||||
|
Life insurance cash surrender value
|
0.3
|
|
(2.2
|
)
|
(5.8
|
)
|
|||||
|
Foreign items
|
(2.3
|
)
|
(0.2
|
)
|
0.3
|
|
|||||
|
Foreign business taxes
|
3.7
|
|
4.2
|
|
3.9
|
|
|||||
|
Foreign tax law change
|
(0.7
|
)
|
(2.2
|
)
|
(4.6
|
)
|
|||||
|
Non-deductible expenses
|
2.3
|
|
2.1
|
|
1.6
|
|
|||||
|
Change in deferred tax realizability
|
—
|
|
2.2
|
|
2.8
|
|
|||||
|
Other, net
|
0.1
|
|
—
|
|
(0.4
|
)
|
|||||
|
Total
|
$
|
8.7
|
|
$
|
(7.1
|
)
|
$
|
(10.1
|
)
|
||
General business credits primarily represent U.S. work opportunity credits. In 2012, the work opportunity credit was available only for veterans and pre-2012 hires. The full credit was retroactively reinstated on January 2, 2013, resulting in the inclusion of
$9.3 million
of tax benefits during 2013 that would have been recognized in 2012 if the law had been in effect. Foreign items include foreign income tax rate differences, foreign tax credits and deductions, and foreign non-deductible expenses and non-taxable income. Foreign business taxes include the French business tax and other taxes based on revenue less certain expenses and are classified as income taxes under ASC Topic 740 (“ASC 740”), Income Taxes.
The Company has U.S. general business credit carryforwards of
$111.6 million
which will expire from 2031 to 2035, foreign tax credit carryforwards of $
1.7 million
that expire from 2022 to 2024 and $
0.2 million
of state credit carryforwards that expire from 2016 to 2035, or have no expiration. The net tax effect of state and foreign loss carryforwards at year-end
2015
totaled
$40.6 million
, which expire as follows (in millions of dollars):
|
Year
|
Amount
|
|||
|
2016-2018
|
$
|
2.3
|
|
|
|
2019-2021
|
1.9
|
|
||
|
2022-2025
|
0.4
|
|
||
|
2026-2029
|
0.1
|
|
||
|
No expiration
|
35.9
|
|
||
|
Total
|
$
|
40.6
|
|
|
The Company has established a valuation allowance for loss carryforwards and future deductible items in certain foreign jurisdictions, and for U.S. foreign tax credit carryforwards. The valuation allowance is determined in accordance with the provisions of ASC 740, which requires an assessment of both negative and positive evidence when measuring the need for a valuation allowance. The Company’s recent losses in these foreign jurisdictions, and its recent lack of adequate U.S. foreign source income to fully utilize foreign tax credit carryforwards, represented sufficient negative evidence to require a valuation allowance under ASC 740. The Company intends to maintain a valuation allowance until sufficient positive evidence exists to support realization of the foreign deferred tax assets.
Provision has not been made for U.S. or additional foreign income taxes on an estimated
$119.8 million
of undistributed earnings which are permanently reinvested. If these earnings were to be repatriated, the Company would be subject to U.S. income taxes and foreign withholding taxes, adjusted for foreign tax credits. Determination of the amount of any unrecognized deferred income tax liability related to these undistributed earnings is not practicable due to the complexities associated with this hypothetical calculation.
68
KELLY SERVICES, INC. AND SUBSIDIARIES
NOTES TO CONSOLIDATED FINANCIAL STATEMENTS (continued)
A reconciliation of the beginning and ending amount of unrecognized tax benefits is as follows:
|
|
2015
|
2014
|
2013
|
||||||||
|
|
(In millions of dollars)
|
||||||||||
|
Balance at beginning of the year
|
$
|
2.4
|
|
$
|
2.8
|
|
$
|
2.9
|
|
||
|
Additions for prior years’ tax positions
|
0.1
|
|
—
|
|
—
|
|
|||||
|
Reductions for prior years’ tax positions
|
(0.7
|
)
|
(0.4
|
)
|
(0.1
|
)
|
|||||
|
Additions for settlements
|
—
|
|
—
|
|
—
|
|
|||||
|
Reductions for settlements
|
—
|
|
—
|
|
—
|
|
|||||
|
Reductions for expiration of statutes
|
(0.1
|
)
|
—
|
|
—
|
|
|||||
|
Balance at end of the year
|
$
|
1.7
|
|
$
|
2.4
|
|
$
|
2.8
|
|
||
If the
$1.7 million
in
2015
,
$2.4 million
in
2014
and
$2.8 million
in
2013
of unrecognized tax benefits were recognized, they would have a favorable effect of
$1.1 million
in
2015
,
$1.5 million
in
2014
and
$1.8 million
in
2013
on income tax expense.
The Company recognizes both interest and penalties as part of the income tax provision. The Company recognized a benefit of
$0.2 million
in
2015
, expense of
$0.1 million
in 2014 and expense of
$0.1 million
in
2013
for interest and penalties. Accrued interest and penalties were
$0.2 million
at year-end
2015
and
$0.4 million
at year-end
2014
.
The Company files income tax returns in the U.S. and in various states and foreign countries. The tax periods open to examination by the major taxing jurisdictions to which the Company is subject include the U.S. for fiscal years 2012 through
2015
, Australia for fiscal years 2011 through 2015, Canada for fiscal years 2008 through
2015
, France for fiscal years 2013 through
2015
, Mexico for fiscal years 2010 through
2015
, Portugal for fiscal years 2012 through 2015, Singapore for fiscal years 2011 through 2015, Switzerland for fiscal years 2006 through
2015
, and United Kingdom for fiscal years 2012 through
2015
.
The Company and its subsidiaries have various income tax returns in the process of examination. The unrecognized tax benefit and related interest and penalty balances include approximately
$0.5 million
for
2015
, related to tax positions which are reasonably possible to change within the next twelve months due to income tax audits, settlements and statute expirations.
14. Supplemental Cash Flow Information
Changes in operating assets and liabilities, as disclosed in the statements of cash flows, for the fiscal years
2015
,
2014
and
2013
, respectively, were as follows:
|
|
2015
|
2014
|
2013
|
||||||||
|
|
(In millions of dollars)
|
||||||||||
|
Increase in trade accounts receivable
|
$
|
(64.2
|
)
|
$
|
(155.4
|
)
|
$
|
(14.6
|
)
|
||
|
Increase in prepaid expenses and other assets
|
(5.2
|
)
|
(14.7
|
)
|
(11.8
|
)
|
|||||
|
Increase in accounts payable and accrued liabilities
|
50.9
|
|
36.4
|
|
43.8
|
|
|||||
|
(Decrease) increase in accrued payroll and related taxes
|
(23.7
|
)
|
28.5
|
|
39.2
|
|
|||||
|
Decrease in accrued insurance
|
(4.2
|
)
|
(2.7
|
)
|
(2.9
|
)
|
|||||
|
Increase in income and other taxes
|
0.5
|
|
10.9
|
|
5.5
|
|
|||||
|
Total changes in operating assets and liabilities
|
$
|
(45.9
|
)
|
$
|
(97.0
|
)
|
$
|
59.2
|
|
||
The Company paid interest of
$2.7 million
,
$1.6 million
and
$2.0 million
in
2015
,
2014
and
2013
, respectively. The Company paid income taxes of
$23.5 million
in
2015
,
$10.9 million
in
2014
and
$16.9 million
in
2013
.
Non-cash capital expenditures totaled
$1.8 million
,
$1.4 million
and
$1.1 million
in 2015, 2014 and 2013, respectively.
During 2013, the Company determined that both cash and equivalents and accrued payroll and related taxes were understated by
$4.8 million
as of the 2012 year end. The Company determined that the impact of this error on the consolidated balance sheets and consolidated statements of cash flows was not material. As a result of correcting the error in 2013, changes in
69
operating assets and liabilities and net cash from operating activities are both overstated by
$4.8 million
in the consolidated statements of cash flows for 2013. Additionally, in 2013, a cash payment of
$1.4 million
to TS Kelly was improperly classified in operating activities in the consolidated statements of cash flows, resulting in the understatement of operating activities and overstatement of investing activities in the consolidated statements of cash flows for 2013.
15. Commitments
The Company conducts its branch-based operations primarily from leased facilities. The following is a schedule by fiscal year of future minimum commitments under operating leases as of year-end
2015
(in millions of dollars):
|
Fiscal year:
|
|
||
|
2016
|
$
|
32.4
|
|
|
2017
|
22.0
|
|
|
|
2018
|
14.6
|
|
|
|
2019
|
8.1
|
|
|
|
2020
|
4.2
|
|
|
|
Later years
|
1.7
|
|
|
|
|
|
||
|
Total
|
$
|
83.0
|
|
Lease expense for fiscal
2015
,
2014
and
2013
amounted to
$37.5 million
,
$43.5 million
and
$45.6 million
, respectively.
In addition to operating lease agreements, the Company has entered into noncancelable purchase obligations totaling
$40.6 million
. These obligations relate primarily to voice and data communications services and online tools which the Company expects to utilize generally within the next
two
fiscal years, in the ordinary course of business. The Company has no material unrecorded commitments, losses, contingencies or guarantees associated with any related parties or unconsolidated entities. See the Debt and Retirement Benefits footnotes for commitments related to debt and pension obligations.
16. Contingencies
The Company is continuously engaged in litigation arising in the ordinary course of its business, such as matters alleging employment discrimination, alleging wage and hour violations or enforcing the restrictive covenants in the Company’s employment agreements. While there is no expectation that any of these matters will have a material adverse effect on the Company’s results of operations, financial position or cash flows, litigation is always subject to inherent uncertainty and the Company is not able to reasonably predict if any matter will be resolved in a manner that is materially adverse to the Company. At year-end
2015
and
2014
, the gross accrual for litigation costs amounted to
$9.9 million
and
$5.7 million
, respectively, which are included in accounts payable and accrued liabilities in the consolidated balance sheet.
17. Segment Disclosures
The Company’s segments are based on the organizational structure for which financial results are regularly evaluated by the Company’s CODM (the Company’s Chief Executive Officer and Chief Operating Officer) to determine resource allocation and assess performance. The Company’s
seven
reporting segments are: (1) Americas Commercial, (2) Americas Professional and Technical (“Americas PT”), (3) Europe, Middle East and Africa Commercial (“EMEA Commercial”), (4) Europe, Middle East and Africa Professional and Technical (“EMEA PT”), (5) Asia Pacific Commercial (“APAC Commercial”), (6) Asia Pacific Professional and Technical (“APAC PT”) and (7) Outsourcing and Consulting Group (“OCG”).
70
KELLY SERVICES, INC. AND SUBSIDIARIES
NOTES TO CONSOLIDATED FINANCIAL STATEMENTS (continued)
The Commercial business segments within the Americas, EMEA and APAC regions represent traditional office services, contact-center staffing, marketing, electronic assembly, light industrial and, in the Americas, substitute teachers. The PT segments encompass a wide range of highly skilled temporary employees, including scientists, financial professionals, attorneys, engineers, IT specialists and healthcare workers. OCG includes recruitment process outsourcing (“RPO”), contingent workforce outsourcing (“CWO”), business process outsourcing (“BPO”), payroll process outsourcing (“PPO”), executive placement and career transition/outplacement services. Corporate expenses that directly support the operating units have been allocated to the Americas, EMEA and APAC regions and OCG based on a work effort, volume, or in the absence of a readily available measurement process, proportionately based on revenue from services.
The Company regularly assesses its organizational structure, product/service offerings and information evaluated by the CODM to determine whether any changes have occurred that would impact its segment reporting structure.
The following tables present information about the reported revenue from services and gross profit of the Company by segment, along with a reconciliation to consolidated earnings from operations before taxes, for
2015
,
2014
and
2013
. Asset information by reportable segment is not presented, since the Company does not produce such information internally nor does it use such data to manage its business.
|
|
2015
|
2014
|
2013
|
||||||||
|
|
(In millions of dollars)
|
||||||||||
|
Revenue from Services:
|
|
|
|
||||||||
|
Americas Commercial
|
$
|
2,604.3
|
|
$
|
2,609.6
|
|
$
|
2,545.6
|
|
||
|
Americas PT
|
971.9
|
|
956.0
|
|
967.8
|
|
|||||
|
Total Americas Commercial and PT
|
3,576.2
|
|
3,565.6
|
|
3,513.4
|
|
|||||
|
EMEA Commercial
|
773.5
|
|
894.7
|
|
877.5
|
|
|||||
|
EMEA PT
|
171.5
|
|
190.3
|
|
179.7
|
|
|||||
|
Total EMEA Commercial and PT
|
945.0
|
|
1,085.0
|
|
1,057.2
|
|
|||||
|
APAC Commercial
|
347.2
|
|
351.8
|
|
344.1
|
|
|||||
|
APAC PT
|
40.5
|
|
40.4
|
|
38.6
|
|
|||||
|
Total APAC Commercial and PT
|
387.7
|
|
392.2
|
|
382.7
|
|
|||||
|
OCG
|
673.8
|
|
586.8
|
|
509.5
|
|
|||||
|
Less: Intersegment revenue
|
(64.5
|
)
|
(66.9
|
)
|
(49.7
|
)
|
|||||
|
Consolidated Total
|
$
|
5,518.2
|
|
$
|
5,562.7
|
|
$
|
5,413.1
|
|
||
71
KELLY SERVICES, INC. AND SUBSIDIARIES
NOTES TO CONSOLIDATED FINANCIAL STATEMENTS (continued)
|
|
2015
|
2014
|
2013
|
||||||||
|
|
(In millions of dollars)
|
||||||||||
|
Earnings from Operations:
|
|
|
|
||||||||
|
Americas Commercial gross profit
|
$
|
400.3
|
|
$
|
379.6
|
|
$
|
370.2
|
|
||
|
Americas PT gross profit
|
165.0
|
|
155.9
|
|
155.1
|
|
|||||
|
Americas Region gross profit
|
565.3
|
|
535.5
|
|
525.3
|
|
|||||
|
Americas Region SG&A expenses
|
(456.6
|
)
|
(446.8
|
)
|
(419.8
|
)
|
|||||
|
Americas Region Earnings from Operations
|
108.7
|
|
88.7
|
|
105.5
|
|
|||||
|
EMEA Commercial gross profit
|
106.6
|
|
130.6
|
|
133.6
|
|
|||||
|
EMEA PT gross profit
|
36.6
|
|
42.9
|
|
42.6
|
|
|||||
|
EMEA Region gross profit
|
143.2
|
|
173.5
|
|
176.2
|
|
|||||
|
EMEA Region SG&A expenses
|
(129.2
|
)
|
(161.4
|
)
|
(164.7
|
)
|
|||||
|
EMEA Region Earnings from Operations
|
14.0
|
|
12.1
|
|
11.5
|
|
|||||
|
APAC Commercial gross profit
|
45.3
|
|
47.5
|
|
49.3
|
|
|||||
|
APAC PT gross profit
|
10.5
|
|
12.7
|
|
14.0
|
|
|||||
|
APAC Region gross profit
|
55.8
|
|
60.2
|
|
63.3
|
|
|||||
|
APAC Region SG&A expenses
|
(46.7
|
)
|
(57.7
|
)
|
(60.5
|
)
|
|||||
|
APAC Region Earnings from Operations
|
9.1
|
|
2.5
|
|
2.8
|
|
|||||
|
OCG gross profit
|
160.6
|
|
143.6
|
|
128.2
|
|
|||||
|
OCG SG&A expenses
|
(132.1
|
)
|
(127.3
|
)
|
(111.5
|
)
|
|||||
|
OCG asset impairments
|
—
|
|
—
|
|
(1.7
|
)
|
|||||
|
OCG Earnings from Operations
|
28.5
|
|
16.3
|
|
15.0
|
|
|||||
|
Less: Intersegment gross profit
|
(4.6
|
)
|
(4.4
|
)
|
(3.5
|
)
|
|||||
|
Less: Intersegment SG&A expenses
|
4.6
|
|
4.4
|
|
3.5
|
|
|||||
|
Net Intersegment Activity
|
—
|
|
—
|
|
—
|
|
|||||
|
Corporate
|
(93.6
|
)
|
(97.7
|
)
|
(81.5
|
)
|
|||||
|
Consolidated Total
|
66.7
|
|
21.9
|
|
53.3
|
|
|||||
|
Other Expense, Net
|
4.2
|
|
5.3
|
|
4.5
|
|
|||||
|
Earnings From Operations Before Taxes
|
$
|
62.5
|
|
$
|
16.6
|
|
$
|
48.8
|
|
||
A summary of revenue from services by geographic area for
2015
,
2014
and
2013
follows:
|
|
2015
|
2014
|
2013
|
||||||||
|
|
(In millions of dollars)
|
||||||||||
|
Revenue From Services:
|
|
|
|
||||||||
|
Domestic
|
$
|
3,705.2
|
|
$
|
3,535.8
|
|
$
|
3,419.9
|
|
||
|
International
|
1,813.0
|
|
2,026.9
|
|
1,993.2
|
|
|||||
|
Total
|
$
|
5,518.2
|
|
$
|
5,562.7
|
|
$
|
5,413.1
|
|
||
Foreign revenue is based on the country in which the legal subsidiary is domiciled. No single foreign country’s revenue represented more than
10%
of the consolidated revenues of the Company. No single customer represented more than
10%
of the consolidated revenues of the Company.
72
KELLY SERVICES, INC. AND SUBSIDIARIES
NOTES TO CONSOLIDATED FINANCIAL STATEMENTS (continued)
A summary of long-lived assets information by geographic area as of year-end
2015
and
2014
follows:
|
|
2015
|
2014
|
|||||
|
|
(In millions of dollars)
|
||||||
|
Long-Lived Assets:
|
|
|
|||||
|
Domestic
|
$
|
75.8
|
|
$
|
77.5
|
|
|
|
International
|
13.1
|
|
15.5
|
|
|||
|
Total
|
$
|
88.9
|
|
$
|
93.0
|
|
|
Long-lived assets include primarily property and equipment. No single foreign country’s long-lived assets represented more than
10%
of the consolidated long-lived assets of the Company.
18. New Accounting Pronouncements
In May 2014, the Financial Accounting Standards Board (“FASB”) issued new revenue recognition guidance under Accounting Standards Update (“ASU”) 2014-09 that will supersede the existing revenue recognition guidance under U.S. Generally Accepted Accounting Principles. The new standard focuses on creating a single source of revenue guidance for revenue arising from contracts with customers for all industries. The objective of the new standard is for companies to recognize revenue when it transfers the promised goods or services to its customers at an amount that represents what the company expects to be entitled to in exchange for those goods or services. In July 2015, the FASB deferred the effective date by one year. This ASU will now be effective for annual periods, and interim periods within those annual periods, beginning on or after December 15, 2017. Early adoption is permitted, but not before the original effective date of December 15, 2016. We are currently evaluating the impact of the new guidance on our consolidated financial statements and related disclosures.
In August 2014, the FASB issued ASU 2014-15 requiring management to evaluate whether there are conditions or events, considered in the aggregate, that raise substantial doubt about the entity’s ability to continue as a going concern, which is currently performed by the external auditors. Management will be required to perform this assessment for both interim and annual reporting periods and must make certain disclosures if it concludes that substantial doubt exists. This ASU is effective for annual periods, and interim periods within those annual periods, beginning on or after December 15, 2016. The adoption of this guidance is not expected to have a material effect on our financial statements.
In April 2015, the FASB issued ASU 2015-03 amending current guidance for debt issuance costs. The new guidance requires debt issuance costs to be presented as a deduction from the carrying amount of the related debt liability rather than as an asset. In August 2015, ASU 2015-15 was issued to further clarify that line-of-credit arrangements may be presented as an asset and amortized over the term of the line-of-credit arrangement. These ASUs are effective for annual periods, and interim periods within those annual periods, beginning on or after December 15, 2015 and early adoption is permitted. The new guidance will be applied retrospectively to all prior periods presented. The adoption of this guidance is not expected to have a material effect on our financial statements.
In November 2015, the FASB issued ASU 2015-17 which simplifies the presentation of deferred income taxes. The amendment requires that deferred tax assets and liabilities must all be classified as noncurrent. This ASU is effective for annual periods, and interim periods within those annual periods, beginning after December 15, 2016. We have elected to early adopt this standard effective January 3, 2016 on a prospective basis. The adoption of this standard resulted in a reclassification of our net current deferred tax asset to a net noncurrent deferred tax asset and our net current deferred tax liability to a net noncurrent deferred tax liability.
In January 2016, the FASB issued ASU 2016-01 amending the current guidance for how entities measure certain equity investments, the accounting for financial liabilities under the fair value option, and the presentation and disclosure requirements relating to financial instruments. The new guidance requires entities to use fair value measurement for equity investments in unconsolidated entities, excluding equity method investments, and to recognize the changes in fair value in net income at the end of each reporting period. Under the new standard, for any financial liabilities in which the fair value option has been elected, the changes in fair value due to instrument-specific credit risk must be recognized separately in other comprehensive income. Presentation and disclosure requirements under the new guidance require public business entities to use the exit price when measuring the fair value of financial instruments measured at amortized cost. In addition, financial assets and liabilities must now be presented separately in the notes to the financial statements and grouped by measurement category and form of financial asset. This ASU is effective for annual periods, and interim periods within those annual periods, beginning after December 15, 2017. Early adoption is only permitted for the financial liability provision. We are currently evaluating the impact of the new guidance on our consolidated financial statements and related disclosures.
73
Management has evaluated other recently issued accounting pronouncements and does not believe that any of these pronouncements will have a significant impact on our consolidated financial statements and related disclosures.
19. Related Party Transactions
Terence E. Adderley, the Executive Chairman and Chairman of the Board of our board of directors, and certain trusts with respect to which he acts as trustee or co-trustee, control approximately
93%
of the outstanding shares of Kelly Class B common stock, which is the only class of our common stock entitled to voting rights. Other than compensation relative to his services as executive chairmen of the Company, there were no material transactions between the Company and Terence E. Adderley in
2015
or
2014
.
20. Subsequent Event
The Company is a party to a pending nationwide class action lawsuit entitled Hillson et.al. v Kelly Services. The suit alleges that current and former temporary employees of Kelly Services are entitled to monetary damages for violation of the Fair Credit Reporting Act requirement that the notice and disclosure form provided to employees for purposes of conducting a background screening be a standalone document. On January 16, 2016, Kelly and plaintiffs agreed to settle the case. The parties still must agree to the settlement structure and secure court approval of the settlement. In light of amounts previously expensed and anticipated recoveries from third parties, Kelly recorded an accrual in the fourth quarter of
$4.1 million
, in accounts payable and accrued liabilities in the consolidated balance sheet, to reflect the expected cost of the tentative settlement.
21. Selected Quarterly Financial Data (unaudited)
|
|
Fiscal Year 2015
|
||||||||||||||||||
|
|
First
Quarter |
Second
Quarter |
Third
Quarter |
Fourth
Quarter (1) |
Year
|
||||||||||||||
|
|
(In millions of dollars except per share data)
|
||||||||||||||||||
|
Revenue from services
|
$
|
1,320.6
|
|
$
|
1,385.0
|
|
$
|
1,351.0
|
|
$
|
1,461.6
|
|
$
|
5,518.2
|
|
||||
|
Gross profit
|
220.3
|
|
222.3
|
|
228.2
|
|
249.5
|
|
920.3
|
|
|||||||||
|
SG&A expenses
|
208.2
|
|
210.8
|
|
211.6
|
|
223.0
|
|
853.6
|
|
|||||||||
|
Net earnings
|
3.7
|
|
6.8
|
|
9.1
|
|
34.2
|
|
53.8
|
|
|||||||||
|
Basic earnings per share
(2)
|
0.10
|
|
0.18
|
|
0.23
|
|
0.88
|
|
1.39
|
|
|||||||||
|
Diluted earnings per share
(2)
|
0.10
|
|
0.18
|
|
0.23
|
|
0.88
|
|
1.39
|
|
|||||||||
|
Dividends per share
|
0.05
|
|
0.05
|
|
0.05
|
|
0.05
|
|
0.20
|
|
|||||||||
|
|
Fiscal Year 2014
|
||||||||||||||||||
|
|
First
Quarter |
Second
Quarter |
Third
Quarter |
Fourth
Quarter |
Year
|
||||||||||||||
|
|
(In millions of dollars except per share data)
|
||||||||||||||||||
|
Revenue from services
|
$
|
1,330.8
|
|
$
|
1,410.5
|
|
$
|
1,396.4
|
|
$
|
1,425.0
|
|
$
|
5,562.7
|
|
||||
|
Gross profit
|
222.3
|
|
228.1
|
|
225.4
|
|
232.6
|
|
908.4
|
|
|||||||||
|
SG&A expenses
|
216.0
|
|
222.2
|
|
218.3
|
|
230.0
|
|
886.5
|
|
|||||||||
|
Restructuring charges included in SG&A expenses
|
—
|
|
1.8
|
|
4.0
|
|
6.2
|
|
12.0
|
|
|||||||||
|
Net earnings
|
2.5
|
|
2.8
|
|
1.4
|
|
17.0
|
|
23.7
|
|
|||||||||
|
Basic earnings per share
(2)
|
0.07
|
|
0.07
|
|
0.03
|
|
0.44
|
|
0.61
|
|
|||||||||
|
Diluted earnings per share
(2)
|
0.07
|
|
0.07
|
|
0.03
|
|
0.44
|
|
0.61
|
|
|||||||||
|
Dividends per share
|
0.05
|
|
0.05
|
|
0.05
|
|
0.05
|
|
0.20
|
|
|||||||||
|
(1)
|
Fourth Quarter 2015 included 14 weeks.
|
|
(2)
|
Earnings per share amounts for each quarter are required to be computed independently and may not equal the amounts computed for the total year.
|
74
KELLY SERVICES, INC. AND SUBSIDIARIES
SCHEDULE II - VALUATION RESERVES
(In millions of dollars)
|
|
|
Additions
|
|
|
|
|
|||||||||||||
|
|
Balance at beginning of year
|
Charged to costs and expenses
|
Charged to other accounts
|
|
Currency exchange effects
|
Deductions from reserves
|
Balance at end of year
|
||||||||||||
|
Description
|
|
|
|
|
|
|
|
||||||||||||
|
Fiscal year ended January 3, 2016
|
|
|
|
|
|
|
|
||||||||||||
|
Reserve deducted in the balance sheet from the assets to which it applies -
|
|
|
|
|
|
|
|
||||||||||||
|
Allowance for doubtful accounts
|
$
|
10.7
|
|
3.7
|
|
—
|
|
|
(0.5
|
)
|
(3.4
|
)
|
$
|
10.5
|
|
||||
|
Deferred tax assets valuation allowance
|
$
|
58.5
|
|
2.0
|
|
—
|
|
|
(5.3
|
)
|
(4.3
|
)
|
$
|
50.9
|
|
||||
|
Fiscal year ended December 28, 2014
|
|
|
|
|
|
|
|
||||||||||||
|
Reserve deducted in the balance sheet from the assets to which it applies -
|
|
|
|
|
|
|
|
||||||||||||
|
Allowance for doubtful accounts
|
$
|
9.9
|
|
4.8
|
|
0.5
|
|
(1)
|
(1.9
|
)
|
(2.6
|
)
|
$
|
10.7
|
|
||||
|
Deferred tax assets valuation allowance
|
$
|
56.3
|
|
7.5
|
|
—
|
|
(2.7
|
)
|
(2.6
|
)
|
$
|
58.5
|
|
|||||
|
Fiscal year ended December 29, 2013
|
|
|
|
|
|
|
|
||||||||||||
|
Reserve deducted in the balance sheet from the assets to which it applies -
|
|
|
|
|
|
|
|
||||||||||||
|
Allowance for doubtful accounts
|
$
|
10.4
|
|
2.5
|
|
(0.5
|
)
|
(1)
|
—
|
|
(2.5
|
)
|
$
|
9.9
|
|
||||
|
Deferred tax assets valuation allowance
|
$
|
58.4
|
|
8.7
|
|
—
|
|
|
(1.1
|
)
|
(9.7
|
)
|
$
|
56.3
|
|
||||
|
(1)
|
Adjustment to provision for sales allowances charged to revenue from services.
|
75
|
INDEX TO EXHIBITS
REQUIRED BY ITEM 601
REGULATIONS S-K
|
|
|
|
|
|
Exhibit No.
|
Description
|
|
|
|
|
3.1
|
Restated Certificate of Incorporation, effective May 6, 2009 (Reference is made to Exhibit 3.1 to the Form 10-Q filed with the Commission on May 7, 2014, which is incorporated herein by reference).
|
|
|
|
|
3.2
|
By-laws, effective May 6, 2009 (Reference is made to Exhibit 3.2 to the Form 10-Q filed with the Commission on May 7, 2014, which is incorporated herein by reference).
|
|
|
|
|
10.1*
|
Kelly Services, Inc. Short-Term Incentive Plan, as amended and restated February 12, 2015 (Reference is made to Exhibit 10.1 to the Form 10-Q filed with the Commission on August 5, 2015, which is incorporated herein by reference).
|
|
|
|
|
10.2*
|
Kelly Services, Inc. Equity Incentive Plan, as amended and restated February 12, 2015 (Reference is made to Exhibit 10.2 to the Form 10-Q filed with the Commission on August 5, 2015, which is incorporated herein by reference).
|
|
|
|
|
10.3*
|
Kelly Services, Inc. Executive Severance Plan dated April 4, 2006, as amended November 8, 2007 (Reference is made to Exhibit 10.3 to the Form 10-Q filed with the Commission on November 7, 2012, which is incorporated herein by reference).
|
|
|
|
|
10.4*
|
Kelly Services, Inc. Non-Employee Directors Stock Option Plan (Reference is made to Exhibit 10.4 to the Form 10-Q filed with the Commission on May 11, 2011, which is incorporated herein by reference).
|
|
|
|
|
10.5*
|
Kelly Services, Inc. 2008 Non-Employee Directors Stock Plan (Reference is made to Exhibit 10.5 to the Form 10-K filed with the Commission on February 14, 2013, which is incorporated herein by reference).
|
|
|
|
|
10.6
|
Amended and restated five-year, secured, revolving credit agreement, dated March 31, 2011 (Reference is made to Exhibit 10.6 to the Form 8-K filed with the Commission on April 6, 2011, which is incorporated herein by reference).
|
|
|
|
|
10.7*
|
Kelly Services, Inc. Performance Incentive Plan, as amended and restated on March 29, 1996 and April 14, 2000 (Reference is made to Exhibit 10 to the Form 10-Q for the quarterly period ended April 1, 2001, filed with the Commission on May 14, 2001, which is incorporated herein by reference).
|
|
|
|
|
10.8*
|
Form of Amendment to Performance Incentive Plan (Reference is made to Exhibit 10.1 to the Form 8-K filed with the Commission on November 9, 2006, which is incorporated herein by reference).
|
|
|
|
|
10.12*
|
Kelly Services, Inc. 2008 Management Retirement Plan – Post 2004 (Reference is made to Exhibit 10.12 to the Form 10-Q filed with the Commission on November 7, 2012, which is incorporated herein by reference).
|
76
|
|
INDEX TO EXHIBITS
REQUIRED BY ITEM 601,
REGULATION S-K (continued)
|
|
|
|
|
Exhibit No.
|
Description
|
|
10.13*
|
First Amendment to the Kelly Services, Inc. 2008 Management Retirement Plan (Reference is made to Exhibit 10.13 to the Form 10-Q filed with the Commission on November 7, 2012, which is incorporated herein by reference).
|
|
|
|
|
10.14
|
Pledge and Security Agreement, dated September 28, 2009 (Reference is made to Exhibit 10.14 to the Form 8-K filed with the Commission on September 29, 2009, which is incorporated herein by reference).
|
|
|
|
|
10.15
|
Receivables Purchase Agreement, dated December 4, 2009 (Reference is made to Exhibit 10.17 to the Form 8-K filed with the Commission on December 9, 2009, which is incorporated herein by reference).
|
|
|
|
|
10.16
|
Receivables Purchase Agreement Amendment No. 2 (Reference is made to Exhibit 10.16 to the Form 8-K filed with the Commission on April 6, 2011, which is incorporated herein by reference).
|
|
|
|
|
10.17
|
Receivables Purchase Agreement Amendment No. 3 (Reference is made to Exhibit 10.17 to the Form 10-Q filed with the Commission on November 6, 2013, which is incorporated herein by reference).
|
|
|
|
|
10.18
|
First Amendment to Amended and Restated Credit Agreement, dated December 11, 2013 (Reference is made to Exhibit 10.18 to the Form 8-K filed with the Commission on December 13, 2013, which is incorporated herein by reference).
|
|
|
|
|
10.19
|
Annex A to First Amendment to Amended and Restated Credit Agreement, dated December 11, 2013 (Reference is made to Exhibit 10.19 to the Form 8-K filed with the Commission on December 13, 2013, which is incorporated herein by reference).
|
|
|
|
|
10.20
|
Receivables Purchase Agreement Amendment No. 4, dated December 11, 2013 (Reference is made to Exhibit 10.20 to the Form 8-K filed with the Commission on December 13, 2013, which is incorporate herein by reference).
|
|
10.21*
|
Amendment to Kelly Services, Inc. 2008 Management Retirement Plan. (Reference is made to Exhibit 10.21 to the Form 8-K filed with the commission on August 11, 2014, which is incorporated herein by reference.)
|
|
|
|
|
14
|
Code of Business Conduct and Ethics, adopted August 3, 2015.
|
|
|
|
|
21
|
Subsidiaries of Registrant.
|
|
|
|
|
23
|
Consent of Independent Registered Public Accounting Firm.
|
|
|
|
|
24
|
Power of Attorney.
|
77
|
|
INDEX TO EXHIBITS
REQUIRED BY ITEM 601,
REGULATION S-K (continued)
|
|
|
|
|
Exhibit No.
|
Description
|
|
31.1
|
Certification Pursuant to Rule 13a-14(a)/15d-14(a) of the Securities Exchange Act, as amended.
|
|
|
|
|
31.2
|
Certification Pursuant to Rule 13a-14(a)/15d-14(a) of the Securities Exchange Act, as amended.
|
|
|
|
|
32.1
|
Certification Pursuant to 18 U.S.C. Section 1350, as Adopted Pursuant to Section 906 of the Sarbanes-Oxley Act of 2002.
|
|
|
|
|
32.2
|
Certification Pursuant to 18 U.S.C. Section 1350, as Adopted Pursuant to Section 906 of the Sarbanes-Oxley Act of 2002.
|
|
|
|
|
101.INS
|
XBRL Instance Document
|
|
|
|
|
101.SCH
|
XBRL Taxonomy Extension Schema Document
|
|
|
|
|
101.CAL
|
XBRL Taxonomy Extension Calculation Linkbase Document
|
|
|
|
|
101.DEF
|
XBRL Taxonomy Extension Definition Linkbase Document
|
|
101.LAB
|
XBRL Taxonomy Extension Label Linkbase Document
|
|
|
|
|
101.PRE
|
XBRL Taxonomy Extension Presentation Linkbase Document
|
* Indicates a management contract or compensatory plan or arrangement.
78
TABLE OF CONTENTS
Part IItem 1. BusinessItem 1A. Risk FactorsItem 1B. Unresolved Staff CommentsItem 2. PropertiesItem 3. Legal ProceedingsItem 4. Mine Safety DisclosuresPart IIItem 5. Market For The Registrant S Common Equity, Related Stockholder Matters and Issuer Purchases Of Equity SecuritiesItem 6. Selected Financial DataItem 7. Management S Discussion and Analysis Of Financial Condition and Results Of OperationsItem 7A. Quantitative and Qualitative Disclosures About Market RiskItem 8. Financial Statements and Supplementary DataItem 9. Changes in and Disagreements with Accountants on Accounting and Financial DisclosureItem 9A. Controls and ProceduresItem 9B. Other InformationPart IIIItem 10. Executive Officers Of The RegistrantItem 12. Securities Authorized For Issuance Under Equity Compensation PlansPart IVItem 15. Exhibits, Financial Statement Schedules